UNITED STATES
SECURITIES AND EXCHANGE COMMISSION
Washington, D.C. 20549
FORM
For the fiscal year ended
or
Commission file number
(Exact Name of Registrant as Specified in Its Charter)
(State or Other Jurisdiction of Incorporation or Organization) |
(I.R.S. Employer Identification No.) |
|
|
(Address of Principal Executive Offices) |
(Zip Code) |
Registrant’s Telephone Number, Including Area Code: (
Securities registered pursuant to Section 12(b) of the Act:
Title of each class |
|
Trading Symbol(s) |
|
Name of each exchange on which registered |
$0.001 per share |
|
|
Securities registered pursuant to Section 12(g) of the Act:
None
Indicate by check mark if the registrant is a well-known seasoned issuer, as defined in Rule 405 of the Securities Act.
Indicate by check mark if the registrant is not required to file reports pursuant to Section 13 or Section 15(d) of the Act. Yes ☐
Indicate by check mark whether the registrant (1) has filed all reports required to be filed by Section 13 or 15(d) of the Securities Exchange Act of 1934 during the preceding 12 months (or for such shorter period that the registrant was required to file such reports), and (2) has been subject to such filing requirements for the past 90 days.
Indicate by check mark whether the registrant has submitted electronically every Interactive Data File required to be submitted pursuant to Rule 405 of Regulation S-T (§232.405 of this chapter) during the preceding 12 months (or for such shorter period that the registrant was required to submit such files).
Indicate by check mark whether the registrant is a large accelerated filer, an accelerated filer, a non-accelerated filer, a smaller reporting company or an emerging growth company. See the definitions of “large accelerated filer,” “accelerated filer,” “smaller reporting company” and “emerging growth company” in Rule 12b-2 of the Exchange Act.
☒ |
Accelerated filer: |
☐ |
Non-accelerated filer: |
☐ |
Smaller reporting company: |
||
Emerging growth company: |
|
|
|
|
|
|
If an emerging growth company, indicate by check mark if the registrant has elected not to use the extended transition period for complying with any new or revised financial accounting standards provided pursuant to Section 13(a) of the Exchange Act. ☐
Indicate by check mark whether the registrant has filed a report on and attestation to its management’s assessment of the effectiveness of its internal control over financial reporting under Section 404(b) of the Sarbanes-Oxley Act (15 U.S.C. 7262(b)) by the registered public accounting firm that prepared or issued its audit report.
If securities are registered pursuant to Section 12(b) of the Act, indicate by check mark whether the financial statements of the registrant included in the filing reflect the correction of an error to previously issued financial statements.
Indicate by check mark whether any of those error corrections are restatements that required a recovery analysis of incentive-based compensation received by any of the registrant’s executive officers during the relevant recovery period pursuant to § 240.10D-1(b).
Indicate by check mark whether the registrant is a shell company (as defined in Rule 12b-2 of the Act). Yes ☐ No
As of June 30, 2023, the aggregate market value of the common stock of the registrant held by non-affiliates of the registrant was approximately $
As of February 28, 2024, there were
Documents incorporated by reference:
|
GOLDMAN SACHS BDC, INC. Index to Annual Report on Form 10-K for Year Ended December 31, 2023
|
|
|
INDEX |
PAGE |
|
3 |
|
|
5 |
|
ITEM 1. |
5 |
|
ITEM 1A. |
29 |
|
ITEM 1B. |
61 |
|
ITEM 1C. |
61 |
|
ITEM 2. |
62 |
|
ITEM 3. |
63 |
|
ITEM 4. |
63 |
|
|
|
|
|
64 |
|
ITEM 5. |
64 |
|
ITEM 6. |
67 |
|
ITEM 7. |
Management’s Discussion and Analysis of Financial Condition and Results of Operations |
68 |
ITEM 7A. |
81 |
|
ITEM 8. |
82 |
|
ITEM 9. |
Changes in and Disagreements with Accountants on Accounting and Financial Disclosure |
139 |
ITEM 9A. |
139 |
|
ITEM 9B. |
139 |
|
ITEM 9C. |
Disclosure Regarding Foreign Jurisdictions that Prevent Inspections |
139 |
|
|
|
|
140 |
|
ITEM 10. |
140 |
|
ITEM 11. |
140 |
|
ITEM 12. |
Security Ownership of Certain Beneficial Owners and Management and Related Stockholder Matters |
140 |
ITEM 13. |
Certain Relationships and Related Transactions, and Director Independence |
140 |
ITEM 14. |
140 |
|
|
|
|
|
141 |
|
ITEM 15. |
141 |
|
ITEM 16. |
145 |
|
|
|
|
146 |
||
2
CAUTIONARY STATEMENT REGARDING FORWARD-LOOKING STATEMENTS
This report contains forward-looking statements that involve substantial risks and uncertainties. You can identify these statements by the use of forward-looking terminology such as “may,” “will,” “should,” “expect,” “anticipate,” “project,” “target,” “estimate,” “intend,” “continue” or “believe” or the negatives of, or other variations on, these terms or comparable terminology. You should read statements that contain these words carefully because they discuss our plans, strategies, prospects and expectations concerning our business, operating results, financial condition and other similar matters. We believe that it is important to communicate our future expectations to our investors. Our forward-looking statements include information in this report regarding general domestic and global economic conditions, our future financing plans, our ability to operate as a business development company (“BDC”) and the expected performance of, and the yield on, our portfolio companies. There may be events in the future, however, that we are not able to predict accurately or control. The factors listed under “Risk Factors” in this annual report on Form 10-K, as well as any cautionary language in this report, provide examples of risks, uncertainties and events that may cause our actual results to differ materially from the expectations we describe in our forward-looking statements. The occurrence of the events described in these risk factors and elsewhere in this report could have a material adverse effect on our business, results of operations and financial position. Any forward-looking statement made by us in this report speaks only as of the date of this report. Factors or events that could cause our actual results to differ from our forward-looking statements may emerge from time to time, and it is not possible for us to predict all of them. We undertake no obligation to update or revise publicly any forward-looking statements, whether as a result of new information, future events or otherwise, except as required by law. You are advised to consult any additional disclosures that we may make directly to you or through reports that we have filed or in the future may file with the U.S. Securities and Exchange Commission (the “SEC”), including annual reports on Form 10-K, registration statements on Form N-2, quarterly reports on Form 10-Q and current reports on Form 8-K. The safe harbor provisions of Section 21E of the Securities Exchange Act of 1934, as amended (the “Exchange Act”), which preclude civil liability for certain forward-looking statements, do not apply to the forward-looking statements in this annual report on Form 10-K because we are an investment company. The following factors are among those that may cause actual results to differ materially from our forward-looking statements:
3
4
PART I.
Unless indicated otherwise in this annual report on Form 10-K or the context so requires, references to “Company,” “we,” “us,” and “our,” mean Goldman Sachs BDC, Inc., together with its consolidated subsidiaries, or, for periods prior to our conversion from a Delaware limited liability company to a Delaware corporation (the “Conversion”), Goldman Sachs Liberty Harbor Capital, LLC. The terms “GSAM,” “Goldman Sachs Asset Management,” our “Adviser” or our “Investment Adviser” refer to Goldman Sachs Asset Management, L.P., a Delaware limited partnership. The term “GS Group Inc.” refers to The Goldman Sachs Group, Inc. “GS & Co.” refers to Goldman Sachs & Co. LLC and its predecessors. The term “Goldman Sachs” refers to GS Group Inc., together with GS & Co., GSAM and its other subsidiaries and affiliates. Goldman Sachs advises clients in many markets and transactions and purchases, sells, holds and recommends a broad array of investments for its own accounts and for the accounts of clients and of its personnel, through client accounts and the relationships and products it sponsors, manages and advises (such Goldman Sachs or other client accounts (including us, Goldman Sachs Private Middle Market Credit LLC, Goldman Sachs Private Middle Market Credit II LLC, Goldman Sachs Middle Market Lending Corp. II, Phillip Street Middle Market Lending Fund LLC and Goldman Sachs Private Credit Corp.), relationships and products, collectively, the “Accounts”).
ITEM 1. BUSINESS
The Company
We are a specialty finance company focused on lending to middle-market companies. We are a closed-end management investment company that has elected to be regulated as a BDC under the Investment Company Act of 1940, as amended (the “Investment Company Act”). In addition, we have elected to be treated as a RIC, and we expect to qualify annually for tax treatment as a RIC, commencing with our taxable year ended December 31, 2013. From our formation in 2012 through December 31, 2023, we originated approximately $7.33 billion in aggregate principal amount of debt and equity investments prior to any subsequent exits and repayments. We seek to generate current income and, to a lesser extent, capital appreciation primarily through direct originations of secured debt, including first lien, unitranche, including last-out portions of such loans, and second lien debt, and unsecured debt, including mezzanine debt, as well as through select equity investments.
“Unitranche” loans are first lien loans that may extend deeper in a borrower’s capital structure than traditional first lien debt and may provide for a waterfall of cash flow priority between different lenders in such loan. In a number of instances, we may find another lender to provide the “first-out” portion of a unitranche loan while we retain the “last-out” portion of such loan, in which case, the “first-out” portion of the loan would generally receive priority with respect to the payment of principal, interest and any other amounts due thereunder as compared to the “last-out” portion that we would continue to hold. In exchange for taking greater risk of loss, the “last-out” portion generally earns a higher interest rate than the “first-out” portion of the loan. We use the term “mezzanine” to refer to debt that ranks senior in right of payment only to a borrower’s equity securities and ranks junior in right of payment to all of such borrower’s other indebtedness. We may make multiple investments in the same portfolio company.
We may also originate “covenant-lite” loans, which are loans with fewer financial maintenance covenants than other obligations, or no financial maintenance covenants. Such covenant-lite loans may not include terms that allow the lender to monitor the performance of the borrower or to declare a default if certain criteria are breached. These flexible covenants (or the absence of covenants) could permit borrowers to experience a significant downturn in their results of operations without triggering any default that would permit holders of their debt (such as us) to accelerate indebtedness or negotiate terms and pricing. In the event of default, covenant-lite loans may recover less value than traditional loans as the lender may not have the opportunity to negotiate with the borrower prior to such default.
We invest primarily in U.S. middle-market companies, which we believe are underserved by traditional providers of capital such as banks and the public debt markets. In this report, we generally use the term “middle market companies” to refer to companies with between $5 million and $200 million of annual earnings before interest expense, income tax expense, depreciation and amortization (“EBITDA”) excluding certain one-time, and non-recurring items that are outside the operations of these companies. However, we may from time to time invest in larger or smaller companies. We generate revenues primarily through receipt of interest income from the investments we hold. In addition, we may generate income from various loan origination and other fees, dividends on direct equity investments and capital gains on the sales of investments. Fees received from portfolio companies (directors’ fees, consulting fees, administrative fees, tax advisory fees and other similar compensation) are paid to us, unless, to the extent required by applicable law or exemptive relief therefrom, we only receive our allocable portion of such fees when invested in the same portfolio company as another client account managed by our Investment Adviser (including collectively with us, the Accounts). The companies in which we invest use our capital for a variety of purposes, including to support organic growth, fund acquisitions, make capital investments or refinance indebtedness.
Available Information
We file with or submit to the SEC periodic and current reports, proxy statements and other information meeting the informational requirements of the Exchange Act. We maintain a website at www.GoldmanSachsBDC.com and make all of our annual, quarterly and current reports, proxy statements and other publicly filed information available, free of charge, on or through our website. Information contained on our website is not incorporated by reference into this annual report on Form 10-K, and you should not consider information contained on our website to be
5
part of this annual report on Form 10-K or any other report we file with the SEC. You may also obtain such information by contacting us, in writing at: 71 South Wacker Drive, Chicago, Illinois 60606, or by telephone (collect) at (312) 655-4419. The SEC maintains an Internet site at http://www.sec.gov that contains reports, proxy and information statements and other information filed electronically by us with the SEC. Copies of these reports, proxy and information statements and other information may be obtained by electronic request at the following e-mail address: publicinfo@sec.gov.
Investment Strategy
Our origination strategy focuses on leading the negotiation and structuring of the loans or securities in which we invest and holding the investments in our portfolio to maturity. In many cases we are the sole investor in the loan or security in our portfolio. Where there are multiple investors, we generally seek to control or obtain significant influence over the rights of investors in the loan or security. We generally seek to make investments that have maturities between three and ten years and range in size between $10 million and $75 million, although we may make larger or smaller investments on occasion.
Investment Portfolio
Our portfolio (excluding our investment in a money market fund, if any, managed by an affiliate of GS Group Inc.) consisted of the following:
|
|
December 31, 2023 |
|
|||||
|
|
Amortized |
|
|
Fair |
|
||
|
|
(in millions) |
|
|||||
First Lien/Senior Secured Debt |
|
$ |
3,209.94 |
|
|
$ |
3,107.47 |
|
First Lien/Last-Out Unitranche |
|
|
148.07 |
|
|
|
144.74 |
|
Second Lien/Senior Secured Debt |
|
|
84.62 |
|
|
|
66.56 |
|
Unsecured Debt |
|
|
27.93 |
|
|
|
27.31 |
|
Preferred Stock |
|
|
44.20 |
|
|
|
37.30 |
|
Common Stock |
|
|
57.18 |
|
|
|
30.70 |
|
Warrants |
|
|
1.85 |
|
|
|
0.25 |
|
Total Investments |
|
$ |
3,573.79 |
|
|
$ |
3,414.33 |
|
As of December 31, 2023, our portfolio consisted of 414 investments in 144 portfolio companies across 38 different industries. The largest industries in our portfolio, based on fair value as of December 31, 2023, were Software, Health Care Providers & Services, Professional Services and Financial Services, which represented 17.4%, 12.4%, 9.9% and 9.7%, respectively, of our portfolio at fair value. The geographic composition of our portfolio at fair value as of December 31, 2023 was primarily United States 95.1%, Canada 3.6%, United Kingdom 1.2% and Germany 0.1%.
The weighted average yield by asset type of our total portfolio (excluding investments in money market funds, if any), at amortized cost and fair value, was as follows:
|
|
December 31, 2023 |
|
|||||
|
|
Amortized |
|
|
Fair |
|
||
Weighted Average Yield(1) |
|
|
|
|
|
|
||
First Lien/Senior Secured Debt(2) |
|
|
12.1 |
% |
|
|
13.5 |
% |
First Lien/Last-Out Unitranche(2) (3) |
|
|
13.1 |
|
|
|
14.4 |
|
Second Lien/Senior Secured Debt(2) |
|
|
9.2 |
|
|
|
11.4 |
|
Unsecured Debt(2) |
|
|
15.4 |
|
|
|
15.7 |
|
Preferred Stock(4) |
|
|
— |
|
|
|
— |
|
Common Stock(4) |
|
|
— |
|
|
|
— |
|
Warrants(4) |
|
|
— |
|
|
|
— |
|
Total Portfolio |
|
|
11.8 |
% |
|
|
13.2 |
% |
6
The following table presents certain selected information regarding our investment portfolio (excluding investments in money market funds, if any)
|
|
December 31, 2023 |
|
|
Number of portfolio companies |
|
|
144 |
|
Percentage of performing debt bearing a floating rate(1) |
|
|
99.9 |
% |
Percentage of performing debt bearing a fixed rate(1)(2) |
|
|
0.1 |
% |
Weighted average yield on debt and income producing investments, at amortized cost(3) |
|
|
12.6 |
% |
Weighted average yield on debt and income producing investments, at fair value(3) |
|
|
13.8 |
% |
Weighted average leverage (net debt/EBITDA)(4) |
|
6.1x |
|
|
Weighted average interest coverage(4) |
|
1.5x |
|
|
Median EBITDA(4) |
$ |
53.98 million |
|
|
(1) |
Measured on a fair value basis. Excludes investments, if any, placed on non-accrual. |
(2) |
Includes income producing preferred stock investments. |
(3) |
Computed based on (a) the annual actual interest rate or yield earned plus amortization of fees and discounts on the performing debt and other income producing investments as of the reporting date, divided by (b) the total performing debt and other income producing investments (excluding investments on non-accrual). Excludes the Purchase Discount and amortization related to the Merger. |
(4) |
For a particular portfolio company, we calculate the level of contractual indebtedness net of cash (“net debt”) owed by the portfolio company and compare that amount to measures of cash flow available to service the net debt. To calculate net debt, we include debt that is both senior and pari passu to the tranche of debt owned by us but exclude debt that is legally and contractually subordinated in ranking to the debt owned by us. We believe this calculation method assists in describing the risk of our portfolio investments, as it takes into consideration contractual rights of repayment of the tranche of debt owned by us relative to other senior and junior creditors of a portfolio company. We typically calculate cash flow available for debt service at a portfolio company by taking EBITDA for the trailing twelve-month period. Weighted average net debt to EBITDA is weighted based on the fair value of our debt investments and excluding investments where net debt to EBITDA may not be the appropriate measure of credit risk, such as cash collateralized loans and investments that are underwritten and covenanted based on recurring revenue. For a particular portfolio company, we also calculate the level of contractual interest expense owed by the portfolio company, and compare that amount to EBITDA (“interest coverage ratio”). We believe this calculation method assists in describing the risk of our portfolio investments, as it takes into consideration contractual interest obligations of the portfolio company. Weighted average interest coverage is weighted based on the fair value of our performing debt investments, excluding investments where interest coverage may not be the appropriate measure of credit risk, such as cash collateralized loans and investments that are underwritten and covenanted based on recurring revenue. Median EBITDA is based on our debt investments, excluding investments where net debt to EBITDA may not be the appropriate measure of credit risk, such as cash collateralized loans and investments that are underwritten and covenanted based on recurring revenue. Portfolio company statistics are derived from the most recently available financial statements of each portfolio company as of the reported end date. Statistics of the portfolio companies have not been independently verified by us and may reflect a normalized or adjusted amount. As of December 31, 2023, investments where net debt to EBITDA may not be the appropriate measure of credit risk represented 42.9% of total debt investments. |
Corporate Structure
We were formed as a private fund in September 2012 and commenced operations in November 2012, using seed capital contributions we received from GS Group Inc. In March 2013, we elected to be treated as a BDC. We have elected to be treated as a RIC, and we expect to qualify annually for tax treatment as a RIC, commencing with our taxable year ended December 31, 2013. On March 18, 2015, our common stock began trading on the New York Stock Exchange (“NYSE”) under the symbol “GSBD”. As of December 31, 2023, GS Group Inc. owned 5.9% of our common stock.
Our Investment Adviser
GSAM serves as our Investment Adviser and has been registered as an investment adviser with the SEC since 1990. Subject to the supervision of our board of directors (the “Board of Directors” or the “Board”), a majority of which is made up of independent directors (including an independent Chairperson), GSAM manages our day-to-day operations and provides us with investment advisory and management services and certain administrative services. GSAM is a subsidiary of GS Group Inc., a bank holding company (“BHC”) and a financial holding company (“FHC”), regulated by the board of governors of the federal reserve system (the “Federal Reserve”). GS Group Inc. is a leading global financial institution that delivers a broad range of financial services to a large and diversified client base that includes corporations, financial institutions, governments and individuals. GS Group Inc. is the general partner and owner of GSAM.
The Goldman Sachs Asset Management Private Credit Team
The Goldman Sachs Asset Management Private Credit Team is dedicated to the direct origination investment strategy of the Company and other Accounts that share a similar investment strategy with us. The Goldman Sachs Asset Management Private Credit Team is comprised of approximately 160 investment professionals across nine cities and four continents as of December 31, 2023. Within the Goldman Sachs Asset Management Private Credit Team, approximately 74 private credit investment professionals across five offices in the Americas led by Alex Chi and David Miller, our Co-Chief Executive Officers and Co-Presidents, oversee and lead our day-to-day portfolio management. The Goldman Sachs Asset Management Private Credit Team is responsible for identifying investment opportunities, conducting research and due diligence on prospective investments, and negotiating, structuring, monitoring, and servicing our investments. In addition, the Investment
7
Adviser and Goldman Sachs have risk management, legal, accounting, tax, information technology and compliance personnel, among other personnel, who provide services to us. We benefit from the expertise provided by these personnel in our operations.
The Goldman Sachs Asset Management Private Credit Team utilizes a bottom-up, fundamental research approach to lending. The managing directors of this team had an average industry experience of over 18 years coupled with an average tenure at Goldman Sachs of over 12 years as of December 31, 2023.
Investment Committee
All investment decisions are made by the investment committee of the Goldman Sachs Asset Management Private Credit Team that focuses on regulated fund investments (the “BDC Investment Committee”). The BDC Investment Committee currently consists of the following members: Justin Betzen, Alex Chi, David Miller, James Reynolds, Kevin Sterling and Greg Watts, along with members from Goldman Sachs’ Compliance, Legal, Tax and Controllers groups. The BDC Investment Committee is responsible for approving all of our investments. The BDC Investment Committee also monitors investments in our portfolio and approves all asset dispositions. We expect to benefit from the extensive and varied relevant experience of the investment professionals serving on the BDC Investment Committee, which includes expertise in privately originated and publicly traded leveraged credit, stressed and distressed debt, bankruptcy, mergers and acquisitions and private equity. The size, membership, authority and voting rights of members of the BDC Investment Committee are subject to change from time to time without prior notice.
The purpose of our BDC Investment Committee is to evaluate and approve, as deemed appropriate, all investments by our Investment Adviser. Our BDC Investment Committee process is intended to bring the diverse experience and perspectives of our BDC Investment Committee’s members to the analysis and consideration of every investment. Our BDC Investment Committee also serves to provide investment consistency and adherence to our Investment Adviser’s investment philosophies and policies. Our BDC Investment Committee also determines appropriate investment sizing and suggests ongoing monitoring requirements.
Investments
We seek to create a portfolio that includes primarily direct originations of secured debt, including first lien, unitranche, including last-out portions of such loans, and second lien debt, and unsecured debt, including mezzanine debt, as well as through select equity investments. We expect to make investments through both primary originations and open-market secondary purchases. We currently do not limit our focus to any specific industry. If we are successful in achieving our investment objective, we believe that we will be able to provide our stockholders with consistent dividend distributions and attractive risk adjusted total returns.
As of December 31, 2023, our portfolio (which term does not include our investments in money market funds, if any) on a fair value basis, was comprised of approximately 97.2% secured debt investments (95.3% in first lien debt (including 4.2% in first lien/last-out unitranche loans) and 1.9% in second lien debt), 0.8% in unsecured debt investments, 1.1% in preferred stock, 0.9% in common stock and 0.0% in warrants. We expect that our portfolio will continue to include secured debt, including first lien, unitranche, including last-out portions of such loans, and second lien debt, unsecured debt (including mezzanine debt) and, to a lesser extent, equities. In addition to investments in U.S. middle-market companies, we may invest a portion of our capital in opportunistic investments, such as in large U.S. companies, foreign companies, stressed or distressed debt, structured products or private equity. Such investments are intended to enhance our risk adjusted returns to stockholders, and the proportion of these types of investments will change over time given our views on, among other things, the economic and credit environment in which we are operating, although these types of investments generally will constitute less than 30% of our total assets.
In the future, we may also securitize a portion of our investments in any or all of our assets. We expect that our primary use of funds will be to make investments in portfolio companies, distribute cash to holders of our common stock and pay our operating expenses, including debt service to the extent we borrow or issue senior securities to fund our investments.
In certain circumstances, we can make negotiated co-investments pursuant to an exemptive order from the SEC permitting us to do so. On November 16, 2022, the SEC granted to the Investment Adviser, the BDCs advised by the Investment Adviser and certain other affiliated applicants exemptive relief on which we expect to rely to co-invest alongside certain other Accounts, which may include proprietary accounts of Goldman Sachs, in a manner consistent with our investment objectives and strategies, certain Board-established criteria, the conditions of such exemptive relief and other pertinent factors (the “Relief”). Additionally, if our Investment Adviser forms other funds in the future, we may co-invest alongside such other affiliates, subject to compliance with the Relief, applicable regulations and regulatory guidance, as well as applicable allocation procedures. As a result of the Relief, there could be significant overlap in our investment portfolio and the investment portfolios of other Accounts, including, in some cases, proprietary accounts of Goldman Sachs.
In addition, we have filed an application to amend the Relief to permit us to participate in follow-on investments in our existing portfolio companies with certain affiliates covered by the Relief if such affiliates, that are not BDCs or registered investment companies, did not have an investment in such existing portfolio company. There can be no assurance if and when we will receive the amended exemptive order.
8
Investment Criteria
We are committed to a value-oriented philosophy implemented by our Investment Adviser, which manages our portfolio and seeks to minimize the risk of capital loss without foregoing the potential for capital appreciation. We have identified several criteria, discussed below, that GSAM believes are important in identifying and investing in prospective portfolio companies.
These criteria provide general guidelines for our investment decisions. However, not all of these criteria will be met by each prospective portfolio company in which we choose to invest. Generally, we seek to use our experience and access to market information to identify investment candidates and to structure investments quickly and effectively.
Our due diligence typically includes, but is not limited to: (i) review of historical and prospective financial information; (ii) review of the capital structure; (iii) analysis of the business and industry in which the company operates; (iv) on-site visits; (v) interviews with management, employees, customers and vendors of the potential portfolio company; (vi) review of loan documents; (vii) background checks; and (viii) research relating to the portfolio company’s management, industry, markets, products and services and competitors.
The Investment Adviser may integrate environmental, social and governance (“ESG”) risk considerations within its process for originating loans to U.S. middle market companies, investing directly in middle market credit obligations and related instruments. As part of its due diligence process, the Investment Adviser may consider, alongside other relevant factors, ESG risks, events or conditions that have or could have a material negative impact on the operating and performance metrics of these borrowers in the portfolio. Depending on the circumstances, examples of ESG risks can include physical environmental risks, climate change transition risks, supply chain disruptions, improper labor practices, lack of board diversity and corruption. The Investment Adviser may utilize proprietary research to assess ESG risks that are relevant to our investment.
Upon the completion of due diligence and a decision to proceed with an investment in a company, the team leading the investment presents the investment opportunity to our BDC Investment Committee. This committee determines whether to pursue the potential investment. All new investments are required to be reviewed by the BDC Investment Committee. The members of the BDC Investment Committee are employees of our Investment Adviser and they do not receive separate compensation from us or our Investment Adviser for serving on the BDC Investment Committee. Additional due diligence with respect to any investment may be conducted on our behalf (and at our expense) by attorneys prior to the closing of the investment, as well as other outside advisers, as appropriate.
9
Investment Structure
Once we determine that a prospective portfolio company is suitable for investment, we work with the management of that company and its other capital providers, including senior, junior and equity capital providers, to structure an investment. We negotiate among these parties and use creative and flexible approaches to structure our investment relative to the other capital in the portfolio company’s capital structure.
We expect our secured debt to have terms of approximately three to ten years. We generally obtain security interests in the assets of our portfolio companies that will serve as collateral in support of the repayment of this debt. This collateral may take the form of first or second priority liens on the assets of a portfolio company.
We use the term “mezzanine” to refer to debt that ranks senior only to a borrower’s equity securities and ranks junior in right of payment to all of such borrower’s other indebtedness. Mezzanine debt typically has interest-only payments in the early years, payable in cash or in-kind, with amortization of principal deferred to the later years of the mezzanine debt. In some cases, we may enter into mezzanine debt that, by its terms, converts into equity (or is issued along with warrants for equity) or additional debt securities or defers payments of interest for the first few years after our investment. Typically, our mezzanine debt investments have maturities of three to ten years.
We also invest in unitranche loans, which are loans that combine features of first-lien, second-lien and mezzanine debt, generally in a first-lien position. In a number of instances, we may find another lender to provide the “first-out” portion of such loan and retain the “last-out” portion of such loan, in which case, the “first-out” portion of the loan would generally receive priority with respect to payment of principal, interest and other amounts due thereunder over the “last-out” portion that we would continue to hold.
In the case of our secured debt and unsecured debt, including mezzanine debt investments, we seek to tailor the terms of the investments to the facts and circumstances of the transactions and the prospective portfolio companies, negotiating a structure that protects our rights and manages our risk while creating incentives for the portfolio companies to achieve their business plan and improve their profitability. For example, in addition to seeking a senior position in the capital structure of our portfolio companies, we seek to limit the downside potential of our investments by (i) requiring a total return on our investments (including both interest and potential equity appreciation) that compensates us for credit risk; (ii) incorporating “put” rights and call protection into the investment structure; and (iii) negotiating covenants in connection with our investments that afford our portfolio companies as much flexibility in managing their businesses as possible, consistent with preservation of our capital. Such restrictions may include affirmative and negative covenants, default penalties, lien protection, change of control provisions and board rights, including either observation or participation rights. Our investments may include equity features, such as direct investments in the equity or convertible securities of portfolio companies or warrants or options to buy a minority interest in a portfolio company. Any warrants we may receive with our debt securities generally require only a nominal cost to exercise, so as a portfolio company appreciates in value, we may achieve additional investment return from these equity investments. We may structure the warrants to provide provisions protecting our rights as a minority-interest holder, as well as puts, or rights to sell such securities back to the company, upon the occurrence of specified events. In many cases, we may also obtain registration rights in connection with these equity investments, which may include demand and “piggyback” registration rights.
We expect to hold most of our investments to maturity or repayment but may sell certain investments earlier if a liquidity event takes place, such as the sale or refinancing of a portfolio company. We also may turn over our investments to better position the portfolio as market conditions change.
Allocation of Investment Opportunities
Our investment objectives and investment strategies are similar to those of other Accounts, and an investment opportunity appropriate for us may also be appropriate for such other Accounts (which may include proprietary accounts of Goldman Sachs). This creates potential conflicts in allocating investment opportunities among us and such other Accounts, particularly in circumstances where the availability of such investment opportunities is limited, where the liquidity of such investment opportunities is limited or where co-investments by us and such other Accounts are not permitted under applicable law.
To address these and other potential conflicts, a selection of which are outlined below, the Investment Adviser has developed allocation policies and procedures that provide that personnel of the Investment Adviser making portfolio decisions for Accounts will make purchase and sale decisions and allocate investment opportunities among Accounts consistent with its fiduciary obligations. To the extent permitted by applicable law, these policies and procedures may result in the pro rata allocation of limited opportunities across eligible Accounts managed by a particular portfolio management team, but in many other cases, the allocations may reflect numerous other factors as described below. There will be cases where certain Accounts receive an allocation of an investment opportunity when we do not, and vice versa.
In some cases, due to information barriers that may be in place, other Accounts may compete with us for specific investment opportunities without being aware that we are competing against each other. Goldman Sachs has a conflicts system in place, in addition to these information barriers to identify potential conflicts early in the process and determine if an allocation decision needs to be made. If the conflicts system detects a potential conflict with respect to a particular investment opportunity, such investment opportunity will be assessed to determine whether it must be allocated to, or prohibited from being allocated to, a particular Account.
10
Personnel of the Investment Adviser involved in decision-making for Accounts may make allocation-related decisions in accordance with the Investment Adviser’s allocation policies and procedures for us and for other Accounts by reference to one or more factors, including but not limited to: the strategy, objectives, guidelines and restrictions (including legal and regulatory restrictions) of potentially in-scope Accounts, as well as those Accounts’ current portfolios and investment horizons; strategic fit and other portfolio management considerations, including different desired levels of investment for different strategies; the expected future capacity of the potentially in-scope Accounts; cash and liquidity considerations; and the availability of other appropriate investment opportunities. The Investment Adviser may also consider reputational matters and other factors. The application of these considerations may cause differences in the portfolios and performance of different Accounts that have similar strategies. In addition, in some cases the Investment Adviser may make investment recommendations to Accounts where the Accounts make the investment independently of the Investment Adviser, which may result in a reduction in the availability of the investment opportunity for other Accounts (including us), irrespective of the Investment Adviser’s policies regarding allocation of investments. Additional information about the Investment Adviser’s allocation policies is set forth in Item 6 (“Performance-Based Fees and Side-by-Side Management—Side-By-Side Management of Advisory Accounts; Allocation of Opportunities”) of the Investment Adviser’s Form ADV.
The Investment Adviser, including the Goldman Sachs Asset Management Private Credit Team, may develop and implement new trading strategies or seek to participate in new investment opportunities and strategies. These opportunities and strategies may not be employed in all Accounts even if the opportunity or strategy is consistent with the objectives of such Accounts.
During periods of unusual market conditions, the Investment Adviser may deviate from its normal trade allocation practices. For example, this may occur with respect to the management of unlevered and/or long-only Accounts that are typically managed on a side-by-side basis with levered and/or long-short Accounts.
We may or may not receive opportunities referred by Goldman Sachs businesses and affiliates, but in no event do we have any rights with respect to such opportunities. Subject to applicable law, including the Investment Company Act, such opportunities or any portion thereof may be offered to other Accounts, Goldman Sachs, certain of our investors, or such other persons or entities as determined by Goldman Sachs in its sole discretion. We will have no rights and will not receive any compensation related to such opportunities. Certain of such opportunities may be referred to us by employees or other personnel of Goldman Sachs, or by third parties. If we invest in any such opportunities, Goldman Sachs, may be entitled, to the extent permitted by applicable law, including the limitations set forth in Section 57(k) of the Investment Company Act, to receive compensation from us or from the borrowers in connection with such investments. Any compensation we pay in connection with such referrals will be an operating expense and will accordingly be borne by us (and will not serve to offset any Management Fee (as defined below) or Incentive Fee (as defined below) payable to the Investment Adviser).
In connection with certain of our investments, the Investment Adviser may determine that the appropriate amount to allocate to us and other Accounts may be less than the full amount of the investment opportunity, due to considerations related to, among other things, diversification, portfolio management, leverage management, investment profile, risk tolerance or other exposure guidelines or limitations, cash flow or other considerations. In such situations, “excess amounts” that can be allocated may be offered to other persons or entities. Subject to applicable law, such opportunities may be structured as an investment alongside us or as a purchase of a portion of the investment from us (through a syndication, participation or otherwise).
In all cases, subject to applicable law, the Investment Adviser has broad discretion in determining to whom and in what relative amounts to offer such opportunities, and factors the Investment Adviser may take into account, in its sole discretion, include whether such potential recipient is able to assist or provide a benefit to us in connection with the potential transaction or otherwise, whether the Investment Adviser believes the potential recipient is able to execute a transaction quickly, whether the potential recipient is expected to provide expertise or other advantages in connection with a particular investment, whether the Investment Adviser is aware of such potential recipient’s expertise or interest in these types of opportunities generally or in a subset of such opportunities or, the potential recipient’s target investment sizing. Recipients of these opportunities may, in accordance with applicable law, include one or more of our investors, one or more investors in other funds managed by the Goldman Sachs Asset Management Private Credit Team, clients or potential clients of Goldman Sachs, or funds or Accounts established for any such persons. These opportunities may give rise to potential conflicts of interest. These opportunities will be offered to the recipients thereof on such terms as the Investment Adviser determines in its sole discretion, subject to applicable law, including on a no-fee basis or at prices higher or lower than those paid by us. As a result of these and other reasons, returns with respect to an opportunity may exceed investors’ returns with respect to our investment in the same opportunity.
Transactions with affiliates. We are prohibited under the Investment Company Act from participating in certain transactions with our affiliates without the prior approval of our independent directors (the “Independent Directors”) and, in some cases, of the SEC. Any person that owns, directly or indirectly, five percent or more of our outstanding voting securities will be an affiliate of the Company for purposes of the Investment Company Act, and we are generally prohibited from buying or selling any assets from or to, or entering into certain “joint” transactions (which could include investments in the same portfolio company) with such affiliates, absent the prior approval of the Independent Directors. The Investment Adviser and its affiliates, including persons that control, or are under common control with, the Company or the Investment Adviser, are also considered to be our affiliates under the Investment Company Act, and we are generally prohibited from buying or selling any assets from or to, or entering into “joint” transactions with, such affiliates without exemptive relief from the SEC.
11
Co-Investments Alongside Goldman Sachs and Other Accounts, and the Relief. Subject to applicable law, we may invest alongside Goldman Sachs and other Accounts. The staff of the SEC has issued no-action relief permitting us to purchase a single class of privately placed securities alongside Goldman Sachs and other Accounts, provided that the Investment Adviser negotiates no term other than price and certain other conditions are met. In certain circumstances, we and such other Accounts (which may include proprietary accounts of Goldman Sachs) can make negotiated co-investments pursuant to an exemptive order from the SEC permitting us to do so. On November 16, 2022, the SEC granted the Relief to the Investment Adviser, the BDCs advised by the Investment Adviser, and certain other affiliated applicants. Additionally, if the Investment Adviser forms other funds in the future, we may co-invest alongside such other affiliates, subject to compliance with the Relief, applicable regulations and regulatory guidance, as well as applicable allocation procedures. Any such co-investments are subject to certain conditions, including that co-investments are made in a manner consistent with our investment objectives and strategies, certain Board-established criteria, and the other applicable conditions of the Relief. Under the terms of the Relief, a “required majority” (as defined in Section 57(o) of the Investment Company Act) of our Independent Directors must reach certain conclusions in connection with a co-investment transaction, including that: (i) the terms of the proposed transaction are reasonable and fair to us and our stockholders and do not involve overreaching in respect of us or our stockholders on the part of any person concerned; and (ii) the transaction is consistent with the interests of our stockholders and is consistent with our then-current investment objectives and strategies.
In addition, we have filed an application to amend the Relief to permit us to participate in follow-on investments in our existing portfolio companies with certain affiliates covered by the Relief if such affiliates, that are not BDCs or registered investment companies, did not have an investment in such existing portfolio company. There can be no assurance if and when we will receive the amended exemptive order.
As a result of the Relief, there could be significant overlap in our investment portfolio and the investment portfolios of other Accounts, including, in some cases, proprietary accounts of Goldman Sachs.
If the Investment Adviser identifies an investment and we are unable to rely on the Relief for that particular opportunity, the Investment Adviser will be required to determine which Accounts should make the investment at the potential exclusion of other Accounts. In such circumstances, the Investment Adviser will adhere to its investment allocation policy in order to determine the Account to which to allocate investment opportunities. Accordingly, it is possible that we may not be given the opportunity to participate in investments made by other Accounts.
We may invest alongside other Accounts advised by the Investment Adviser and its affiliates in certain circumstances where doing so is consistent with applicable law and SEC staff guidance and interpretations. For example, we may invest alongside such Accounts consistent with guidance promulgated by the staff of the SEC permitting us and such other Accounts to purchase interests in a single class of privately placed securities so long as certain conditions are met, including that the Investment Adviser, acting on our behalf and on behalf of its other clients, negotiates no term other than price. We may also invest alongside the Investment Adviser’s other clients as otherwise permissible under SEC staff guidance and interpretations, applicable regulations and the allocation policy of the Investment Adviser.
For a further explanation of the allocation of opportunities and other conflicts and the risks related thereto, please see “Item 1A. Risk Factors— Our Business and Structure—Potential conflicts of interest with other businesses of Goldman Sachs could impact our investment returns.”
Expenses are generally allocated to Accounts (including to us) based on whose behalf the expenses are incurred. Where we and one or more other Accounts participate in a particular investment or collectively incur other expenses, the Investment Adviser generally allocates investment-related and other expenses in a manner the Investment Adviser determines to be fair and equitable, which may be pro rata or on a different basis.
We and other Accounts may contract for and incur expenses in connection with certain services provided by third parties, including valuation agents, rating agencies, attorneys, accountants and other professional service providers, while other Accounts that did not contract for such services may not incur such expenses even though they directly or indirectly receive benefit from such services. For example, the work of valuation firms retained by the Company at the request of the Board benefit certain Accounts that invest in the same assets as the Company, but because such other Accounts did not request such services, they are not allocated any costs associated therewith. While it is generally expected that the Accounts requesting third-party services will bear the full expense associated therewith, GSAM may in its sole discretion determine to bear the portion of such expenses that would be allocable to the non-requesting Accounts had such Accounts requested the services.
12
Market Opportunity
The Goldman Sachs Asset Management Private Credit Team believes there is an attractive investment opportunity to invest in U.S. middle-market companies. Specifically:
1 As of year-end December 2023 according to the National Center for the Middle Market, which defined middle market as companies with annual revenue of $10 million—$1 billion. See http://www.middlemarketcenter.org. These websites are not incorporated by reference into this annual report on Form 10-K and you should not consider information contained on these websites to be part of this annual report on Form 10-K or any other report we file with the SEC.
13
Competitive Advantages
GS Group Inc. is a leading global financial institution that provides a broad range of financial services to a substantial and diversified client base, including companies and high-net-worth individuals, among others. The firm is headquartered in New York, and maintains offices across the United States and in all major financial centers around the world. Goldman Sachs, with approximately $2.5 trillion in firmwide assets under supervision as of December 31, 2023, provides investment management services to a diverse set of clients worldwide, including private institutions, public entities and individuals.
Within GSAM, the Goldman Sachs Asset Management Private Credit Team is the primary center for private credit investing. Since 1996, Goldman Sachs Asset Management Private Credit and its predecessors have invested over $180 billion, leveraging Goldman Sachs Asset Management Private Credit’s deep expertise and long-standing relationships with financial sponsors, companies, investors, entrepreneurs and financial intermediaries globally. Goldman Sachs Asset Management Private Credit invests across senior credit, mezzanine, hybrid capital and asset finance strategies and has significant experience investing in debt instruments across industries, geographic regions, economic cycles and financing structures.
Our investment strategy is consistent with that of the broader Goldman Sachs Asset Management Private Credit platform, with a focus on capital preservation and capital appreciation and includes:
14
Operating and Regulatory Structure
We have elected to be treated as a BDC under the Investment Company Act. As a BDC, we are generally prohibited from acquiring assets other than qualifying assets unless, after giving effect to any acquisition, at least 70% of our total assets are qualifying assets. Qualifying assets generally include securities of eligible portfolio companies, cash, cash equivalents, U.S. government securities and high-quality debt instruments maturing in one year or less from the time of investment. Under the rules of the Investment Company Act, “eligible portfolio companies” include (i) private U.S. operating companies, (ii) public U.S. operating companies whose securities are not listed on a national securities exchange (e.g., the NYSE) or registered under the Exchange Act, and (iii) public U.S. operating companies having a market capitalization of less than $250 million. Public U.S. operating companies whose securities are quoted on the over-the-counter bulletin board and through OTC Markets are not listed on a national securities exchange and therefore are eligible portfolio companies.
We have elected to be treated as a RIC, and we expect to qualify annually for tax treatment as a RIC, commencing with our taxable year ended December 31, 2013. As a RIC, we generally will not be required to pay corporate-level U.S. federal income taxes on any net ordinary income or capital gains that we timely distribute to our stockholders as dividends if we meet certain source of income, distribution and asset diversification requirements. We intend to timely distribute to our stockholders substantially all of our annual taxable income for each year, except that we may retain certain net capital gains for reinvestment and we may choose to carry forward taxable income for distribution in the following year and pay any applicable tax. In addition, the distributions we pay to our stockholders in a year may exceed our net ordinary income and capital gains for that year and, accordingly, a portion of such distributions may constitute a return of capital for U.S. federal income tax purposes. See “Item 5. Market for Registrant’s Common Equity, Related Stockholder Matters and Issuer Purchases of Equity Securities—Price Range of Common Stock and Distributions.”
Ongoing Relationships with Portfolio Companies
Monitoring
Our Investment Adviser monitors our portfolio companies on an ongoing basis. It monitors the financial trends of each portfolio company to determine if they are meeting their respective business plans and to assess the appropriate course of action for each company. Our Investment Adviser has several methods of evaluating and monitoring the performance and fair value of our investments, which may include the following:
As part of the monitoring process, our Investment Adviser also employs an investment rating system to categorize our investments. In addition to various risk management and monitoring tools, the Investment Adviser grades the credit risk of all investments on a scale of 1 to 4 no less frequently than quarterly. This system is intended primarily to reflect the underlying risk of a portfolio investment relative to our initial cost basis in respect of such portfolio investment (i.e., at the time of origination or acquisition), although it may also take into account under certain circumstances the performance of the portfolio company’s business, the collateral coverage of the investment and other relevant factors. The grading system is as follows:
15
Our Investment Adviser grades the investments in our portfolio at least quarterly, and it is possible that the grade of a portfolio investment may be reduced or increased over time. For investments graded 3 or 4, the Investment Adviser enhances its level of scrutiny over the monitoring of such portfolio company.
Managerial Assistance
As a BDC, we must offer, and must provide upon request, significant managerial assistance to certain of our eligible portfolio companies within the meaning of Section 55 of the Investment Company Act. This assistance could involve, among other things, monitoring the operations of our portfolio companies, participating in board and management meetings, consulting with and advising officers of portfolio companies and providing other organizational and financial guidance. Our Investment Adviser or an affiliate thereof may provide such managerial assistance on our behalf to portfolio companies that request such assistance. We may receive fees for these services. See “—Managerial Assistance to Portfolio Companies.”
Competition
Our primary competitors provide financing to middle-market companies and include other BDCs, commercial and investment banks, commercial financing companies, collateralized loan obligations (“CLOs”), private funds, including hedge funds, and, to the extent they provide an alternative form of financing, private equity funds. Some of our existing and potential competitors are substantially larger and have considerably greater financial, technical and marketing resources than we do. For example, some competitors may have a lower cost of funds and access to funding sources that are not available to us.
In addition, some of our competitors may have higher risk tolerances or different risk assessments, which could allow them to consider a wider variety of investments and establish more relationships than us. Furthermore, many of our competitors are not subject to the regulatory restrictions that the Investment Company Act imposes on us as a BDC.
While we expect to use the industry information of GSAM’s investment professionals to which we have access to assess investment risks and determine appropriate pricing for our investments in portfolio companies, we do not seek to compete primarily based on the interest rates we offer and GSAM believes that some of our competitors may make loans with interest rates that are comparable to or lower than the rates we offer. Rather, we compete with our competitors based on our reputation in the market, our existing investment platform, the seasoned investment professionals of our Investment Adviser, our experience and focus on middle-market companies, our disciplined investment philosophy, our extensive industry focus and relationships and our flexible transaction structuring.
Staffing
We do not currently have any employees. Our day-to-day operations are managed by our Investment Adviser. Our Investment Adviser has hired and expects to continue to hire professionals with skills applicable to our business plan, including experience in middle-market investing, leveraged finance and capital markets.
Properties
We do not own any real estate or other properties materially important to our operations. Our principal executive offices are located at 200 West Street, New York, New York 10282. We believe that our office facilities are suitable and adequate for our business as it is contemplated to be conducted.
16
Legal Proceedings
We and our Investment Adviser are not currently subject to any material legal proceedings, although we may, from time to time, be involved in litigation arising out of operations in the normal course of business or otherwise.
Our Administrator
Pursuant to our Administration Agreement, our administrator is responsible for providing various accounting and administrative services to us. Our administrator is entitled to fees as described in “—Administration Agreement.” To the extent that our administrator outsources any of its functions, the administrator will pay any compensation associated with such functions. See “—Administration Agreement.”
Dividend Reinvestment Plan
We have a voluntary dividend reinvestment plan (the “DRIP”) that provides for automatic reinvestment of all cash distributions declared by our Board of Directors unless a stockholder elects to “opt out” of the plan. As a result, if our Board of Directors declares a cash distribution, then the stockholders who have not “opted out” of the DRIP will have their cash distributions automatically reinvested in additional shares of common stock, rather than receiving the cash distribution. Due to regulatory considerations, GS Group Inc. has opted out of the DRIP, and GS & Co. has opted out of the DRIP in respect of any shares of our common stock acquired through a 10b5-1 plan. For further details, see Note 9 “Net Assets” to our consolidated financial statements included in this report.
All correspondence concerning the plan should be directed to the plan agent at Computershare Trust Company, N.A, P.O. Box 43078, Providence, RI 02940-3078, with overnight correspondence being directed to the plan agent at Computershare Trust Company, N.A, 150 Royall St., Suite 101, Canton, MA 02021; by calling 855-807-2742; or through the plan agent’s website at www.computershare.com/investor. Participants who hold their shares through a broker or other nominee should direct correspondence or questions concerning the DRIP to their broker or nominee.
Management Agreements
Investment Management Agreement
We have entered into an investment management agreement (as amended and restated as of June 15, 2018, the “Investment Management Agreement”) with the Investment Adviser, pursuant to which the Investment Adviser manages our investment program and related activities.
Management Services
Pursuant to the terms of our Investment Management Agreement, GSAM, subject to the overall supervision of our Board of Directors, manages our day-to-day investment-related operations and provides investment management services to us.
Subject to compliance with applicable law and published SEC guidance, nothing contained in the Investment Management Agreement in any way precludes, restricts or limits the activities of our Investment Adviser or any of its respective subsidiaries or affiliated parties. See “Item 1A. Risk Factors—Our Business and Structure—Our Investment Adviser, its principals, investment professionals and employees and the members of its BDC Investment Committee have certain conflicts of interest.”
Management Fee
We pay the Investment Adviser a management fee (the “Management Fee”), which accrues and is payable quarterly in arrears. The Management Fee is calculated at an annual rate of 1.00% (0.25% per quarter), in each case, of the average value of our gross assets (excluding cash or cash equivalents (such as investments in money market funds) but including assets purchased with borrowed amounts) at the end of each of the two most recently completed calendar quarters. The Management Fee for any partial quarter will be appropriately prorated based on the actual number of days elapsed relative to the total number of days in such calendar quarter. The Investment Adviser waives a portion of its management fee payable by the Company in an amount equal to the management fees it earns as an investment adviser for any affiliated money market funds in which the Company invests.
For the years ended December 31, 2023 and 2022, Management Fees amounted to $35.47 million and $36.00 million and the Investment Adviser has voluntarily agreed to waive $0.00 and $0.34 million of Management Fees. As of December 31, 2023, $8.71 million remained payable.
Incentive Fee
The incentive fee (the “Incentive Fee”) payable to our Investment Adviser consists of two components that are determined independent of each other, with the result that one component may be payable even if the other is not.
17
A portion of the Incentive Fee is based on our income and a portion is based on our capital gains, each as described below. Our Investment Adviser is entitled to receive the Incentive Fee based on income from us if our Ordinary Income (as defined below) exceeds a quarterly “hurdle rate” of 1.75%. For this purpose, the hurdle is computed by reference to our net asset value (“NAV”) and does not take into account changes in the market price of our common stock.
Beginning with the calendar quarter that commenced on January 1, 2015, the Incentive Fee based on income is determined and paid quarterly in arrears at the end of each calendar quarter by reference to our aggregate net investment income, as adjusted as described below, from the calendar quarter then ending and the eleven preceding calendar quarters (such period, the “Trailing Twelve Quarters”). The Incentive Fee based on capital gains is determined and paid annually in arrears at the end of each calendar year by reference to an Annual Period (as defined below).
The hurdle amount for the Incentive Fee based on income is determined on a quarterly basis and is equal to 1.75% multiplied by our NAV at the beginning of each applicable calendar quarter comprising the relevant Trailing Twelve Quarters. The hurdle amount is calculated after making appropriate adjustments for subscriptions (which includes all issuances by us of shares of our common stock, including issuances pursuant to our DRIP) and distributions that occurred during the relevant Trailing Twelve Quarters. The Incentive Fee for any partial period will be appropriately prorated.
i. Quarterly Incentive Fee Based on Income
For the portion of the Incentive Fee based on income, we pay our Investment Adviser a quarterly Incentive Fee based on the amount by which (A) aggregate net investment income (“Ordinary Income”) in respect of the relevant Trailing Twelve Quarters exceeds (B) the hurdle amount for such Trailing Twelve Quarters. The amount of the excess of (A) over (B) described in this paragraph for such Trailing Twelve Quarters is referred to as the “Excess Income Amount.” Ordinary Income is net of all fees and expenses, including the Management Fee but excluding any Incentive Fee.
The Incentive Fee based on income for each quarter is determined as follows:
18
The amount of the Incentive Fee based on income that is paid to our Investment Adviser for a particular quarter is equal to the excess of the Incentive Fee so calculated minus the aggregate Incentive Fees based on income that were paid in respect of the first eleven calendar quarters (or the portion thereof) included in the relevant Trailing Twelve Quarters but not in excess of the Incentive Fee Cap (as described below).
The Incentive Fee based on income that is paid to our Investment Adviser for a particular quarter is subject to a cap (the “Incentive Fee Cap”). The Incentive Fee Cap for any quarter is an amount equal to (a) 20% of the Cumulative Net Return (as defined below) during the relevant Trailing Twelve Quarters minus (b) the aggregate Incentive Fees based on income that were paid in respect of the first eleven calendar quarters (or the portion thereof) included in the relevant Trailing Twelve Quarters.
“Cumulative Net Return” means (x) the Ordinary Income in respect of the relevant Trailing Twelve Quarters minus (y) any Net Capital Loss (as defined below), if any, in respect of the relevant Trailing Twelve Quarters. If, in any quarter, the Incentive Fee Cap is zero or a negative value, we will pay no Incentive Fee based on income to our Investment Adviser for such quarter. If, in any quarter, the Incentive Fee Cap for such quarter is a positive value but is less than the Incentive Fee based on income that is payable to our Investment Adviser for such quarter (before giving effect to the Incentive Fee Cap) calculated as described above, we will pay an Incentive Fee based on income to our Investment Adviser equal to the Incentive Fee Cap for such quarter. If, in any quarter, the Incentive Fee Cap for such quarter is equal to or greater than the Incentive Fee based on income that is payable to our Investment Adviser for such quarter (before giving effect to the Incentive Fee Cap) calculated as described above, we will pay an Incentive Fee based on income to our Investment Adviser equal to the Incentive Fee calculated as described above for such quarter without regard to the Incentive Fee Cap.
“Net Capital Loss” in respect of a particular period means the difference, if positive, between (i) aggregate capital losses, whether realized or unrealized, in such period and (ii) aggregate capital gains, whether realized or unrealized, in such period.
The following is a graphical representation of the calculation of the Incentive Fee based on income:
Incentive Fee based on Income
Percentage of Ordinary Income comprising the Incentive Fee based on Income
(expressed as an annualized rate(1) of return on the value of net assets as of the beginning
of each of the quarters included in the Trailing Twelve Quarters)
19
For the years ended December 31, 2023 and 2022, Incentive Fees based on income amounted to $49.42 million and $12.02 million and the Investment Adviser has voluntarily agreed to waive $1.99 million and $11.38 million of Incentive Fees for the years ended December 31, 2023 and 2022. As of December 31, 2023, $13.04 million remained payable.
ii. Annual Incentive Fee Based on Capital Gains
The portion of the Incentive Fee based on capital gains is calculated on an annual basis. For the period beginning on January 1 of each calendar year and ending on December 31 of the calendar year or, in the case of our first and last year, the appropriate portion thereof (each, an “Annual Period”), we pay our Investment Adviser an Incentive Fee equal to (A) 20% of the difference, if positive, of the sum of our aggregate realized capital gains, if any, computed net of our aggregate realized capital losses, if any, and our aggregate unrealized capital depreciation, in each case from April 1, 2013 until the end of such Annual Period minus (B) the cumulative amount of Incentive Fees based on capital gains previously paid to our Investment Adviser from April 1, 2013. For the avoidance of doubt, unrealized capital appreciation is excluded from the calculation in clause (A), above.
We accrue, but not pay, a portion of the Incentive Fee based on capital gains with respect to net unrealized appreciation. Under generally accepted accounting principles in the United States of America (“GAAP”), we are required to accrue an Incentive Fee based on capital gains that includes net realized capital gains and losses and net unrealized capital appreciation and depreciation on investments held at the end of each period. In calculating the accrual for the Incentive Fee based on capital gains, we consider the cumulative aggregate unrealized capital appreciation in the calculation, since an Incentive Fee based on capital gains would be payable if such unrealized capital appreciation were realized, even though such unrealized capital appreciation is not permitted to be considered in calculating the fee actually payable under the Investment Management Agreement. This accrual is calculated using the aggregate cumulative realized capital gains and losses and aggregate cumulative unrealized capital appreciation or depreciation. If such amount is positive at the end of a period, then we record a capital gains incentive fee equal to 20% of such amount, minus the aggregate amount of actual Incentive Fees based on capital gains paid in all prior periods. If such amount is negative, then there is no accrual for such period. There can be no assurance that such unrealized capital appreciation will be realized in the future. For the avoidance of doubt, the Incentive Fee examples below reflect the calculation of the Incentive Fee payable under the Investment Management Agreement rather than accruals of the Incentive Fee as required by GAAP.
For the years ended December 31, 2023 and December 31, 2022, we did not accrue any Incentive Fees based on capital gains.
Example of Calculation of the Incentive Fee based on Income Assumptions
Assumptions(1)
20
Determination of Incentive Fee Based on Income
In Quarter 1, the Ordinary Income of $6.0 million exceeds the Hurdle Amount of $1.75 million and the Catch-up Amount of $2.1875 million. There are no Net Capital Losses. As a result, an Incentive Fee based on income of $1.2 million ((100% of $437,500) + (20% of $3,812,500)) is payable to our Investment Adviser for Quarter 1.
In Quarter 2, the Ordinary Income of $1.5 million does not exceed the Hurdle Amount of $1.75 million, but the aggregate Ordinary Income for the Trailing Twelve Quarters of $7.5 million exceeds the aggregate Hurdle Amount for the Trailing Twelve Quarters of $3.5 million and the aggregate Catch-up Amount for the Trailing Twelve Quarters of $4.375 million. There are no Net Capital Losses. As a result, an Incentive Fee based on income of $300,000 ($1.5 million ((100% of $875,000) + (20% of 3,125,000)) minus $1.2 million paid in Quarter 1) is payable to our Investment Adviser for Quarter 2.
In Quarter 3, the aggregate Ordinary Income of the Trailing Twelve Quarters of $9.5 million exceeds the aggregate Hurdle Amount for the Trailing Twelve Quarters of $5.25 million and the aggregate Catch-up Amount for the Trailing Twelve Quarters of $6.5625 million. However, there is an aggregate Net Capital Loss of ($4.0) million for the Trailing Twelve Quarters. As a result, the Incentive Fee Cap would apply. The Incentive Fee Cap equals $(400,000), calculated as follows: (20% x ($9.5 million minus $4.0 million)) minus $1.5 million paid in Quarters 1 and 2. Because the Incentive Fee Cap is a negative value, there is no Incentive Fee based on income payable to our Investment Adviser for Quarter 3.
In Quarter 4, the aggregate Ordinary Income of the Trailing Twelve Quarters of $13.0 million exceeds the aggregate Hurdle Amount for the Trailing Twelve Quarters of $7.0 million and the aggregate Catch-up Amount for the Trailing Twelve Quarters of $8.75 million. The calculation of the Incentive Fee based on income would be $1.1 million ($2.6 million (100% of $1.75 million) + (20% of $4.25 million) minus $1.5 million paid in Quarters 1 and 2). However, there is an aggregate Net Capital Loss of ($1.0) million for the Trailing Twelve Quarters. As a result, the Incentive Fee Cap would apply. The Incentive Fee Cap equals $900,000 calculated as follows: (20% x ($13.0 million minus $1.0 million)) minus $1.5 million. Because the Incentive Fee Cap is positive but less than the Incentive Fee based on income of $1.1 million calculated prior to applying the Incentive Fee Cap, an Incentive Fee based on income of $900,000 is payable to our Investment Adviser for Quarter 4.
Examples of Calculation of Incentive Fee based on Capital Gains
Assumptions
21
Determination of Incentive Fee Based on Capital Gains
The Incentive Fee based on capital gains, if any, would be:
The portion of the Incentive Fee based on capital gains equals (A) 20% of the difference, if positive, of the sum of our aggregate realized capital gains, if any, computed net of our aggregate realized capital losses, if any, and our aggregate unrealized capital depreciation, if any, in each case from April 1, 2013 until the end of the applicable Annual Period minus (B) the cumulative amount of Incentive Fees based on capital gains previously paid to our Investment Adviser from April 1, 2013.
Therefore, using the assumptions above, the Incentive Fee based on capital gains equals (A) 20% x ($10.0 million—$5.0 million) minus (B) $0. Therefore, the Incentive Fee based on capital gains equals $1.0 million.
The Incentive Fee based on capital gains equals (A) 20% x ($15.0 million—$1.0 million) minus (B) $1.0 million.
Therefore, the Incentive Fee based on capital gains equals $1.8 million.
The Incentive Fee based on capital gains equals (x) (A) 20% x ($15.0 million—$0 million) minus (B) $2.8 million.
Therefore, the Incentive Fee based on capital gains equals $200,000.
Board Approval of the Investment Management Agreement
Our Board of Directors determined at an in-person meeting held on August 2, 2023, to approve the continuation of the Investment Management Agreement. In its consideration of the renewal of the Investment Management Agreement, the Board of Directors focused on information it had received relating to, among other things: (i) the nature, quality and extent of the advisory and other services provided to us by the Investment Adviser; (ii) the contractual terms of the Investment Management Agreement, including the structure of the Management Fee imposed on gross assets (excluding cash) and the Incentive Fee imposed on net investment income and capital gains; (iii) comparative data with respect to the advisory fees and other expenses paid by other externally managed BDCs with similar investment objectives and strategies; (iv) information about the services performed and the personnel performing such services under the Investment Management Agreement; (v) comparative data with respect to our investment performance and the performance of other BDCs with comparable investment objectives and strategies; (vi) the Investment Adviser’s revenues and pre-tax profit margins with respect to its management of us; (vii) any existing and potential benefits to the Investment Adviser or its affiliates from its relationship with us; (viii) other potential benefits to us as a result of our relationship with the Investment Adviser; and (ix) such other matters as the Board of Directors determined were relevant to their consideration of the Investment Management Agreement.
In connection with their consideration of the renewal of the Investment Management Agreement, our Board of Directors gave weight to each of the factors described above, but did not identify any one particular factor as controlling their decision. After deliberation and consideration of all of the information provided, including the factors described above, the Board of Directors concluded, in the exercise of their business judgment, that the management fees paid by us were reasonable in light of the services provided to us by the Investment Adviser, the Investment Adviser’s costs, and our current and reasonably foreseeable asset levels. The Board of Directors unanimously concluded that the Investment Adviser’s continued management likely would benefit us and our stockholders and that the Investment Management Agreement should be approved and continued with respect to us until August 31, 2024.
For the year ended December 31, 2023, we paid our Investment Adviser a total of $70.22 million in fees, which consisted of $35.83 million in Management Fees and $34.39 million in Incentive Fees. For the year ended December 31, 2022, we paid our Investment Adviser a total of $36.37 million in fees, which consisted of $34.96 million in Management Fees and $1.41 million in Incentive Fees.
22
Duration and Termination
The Investment Management Agreement will remain in full force and effect for successive annual periods, but only so long as such continuance is specifically approved at least annually by (a) the vote of a majority of our Independent Directors and (b) by a vote of a majority of our Board of Directors or of a majority of our outstanding voting securities, as defined in the Investment Company Act. The Investment Management Agreement may, on 60 days’ written notice to the other party, be terminated in its entirety at any time without the payment of any penalty, by our Board of Directors, by vote of a majority of our outstanding voting stock or by our Investment Adviser. The Investment Management Agreement shall automatically terminate in the event of its assignment. See “Item 1A. Risk Factors—Competition—We are dependent upon management personnel of our Investment Adviser for our future success.”
Limited Liability of our Investment Adviser
The Investment Management Agreement provides that our Investment Adviser shall not be liable for any error of judgment or mistake of law or for any loss suffered by us in connection with the matters to which the Investment Management Agreement relates, except a loss resulting from our Investment Adviser’s willful misfeasance, bad faith or gross negligence in the performance of its duties or from reckless disregard by our Investment Adviser of its obligations and duties under the Investment Management Agreement. Any person, even though also employed by our Investment Adviser, who may be or become an employee of and paid by us will be deemed, when acting within the scope of such employment, to be acting in such employment solely for us and not as our Investment Adviser’s employee or agent. These protections may lead our Investment Adviser to act in a riskier manner when acting on our behalf than it would when acting for its own account. See “Item 1A. Risk Factors—Our Business and Structure—Our Investment Adviser will be paid the Management Fee even if the value of your investment declines and our Investment Adviser’s Incentive Fee may create incentives for it to make certain kinds of investments.”
Organization of our Investment Adviser
Our Investment Adviser is registered as an investment adviser under the Investment Advisers Act of 1940, as amended (the “Advisers Act”). The principal executive offices of our Investment Adviser are located at 200 West Street, New York, New York 10282.
Expenses
Our Investment Adviser pays all costs incurred by it in connection with the performance of its duties under the Investment Management Agreement. Our Investment Adviser pays the compensation and expenses of all its personnel and makes available, without expense to us, the services of such of its partners, officers and employees as may duly be elected as our officers or directors, subject to their individual consent to serve and to any limitations imposed by law. Our Investment Adviser is not required to pay any of our expenses other than those specifically allocated to it, including as set forth below. In particular, but without limiting the generality of the foregoing, our Investment Adviser is not required to pay: (i) our operational and organizational expenses; (ii) fees and expenses, including travel expenses, incurred by our Investment Adviser or payable to third parties related to our investments, including, among others, professional fees (including the fees and expenses of consultants and experts) and fees and expenses from evaluating, monitoring, researching and performing due diligence on investments and prospective investments; (iii) interest payable on debt, if any, incurred to finance our investments; (iv) fees and expenses incurred by us in connection with membership in investment company organizations; (v) brokers’ commissions; (vi) fees and expenses associated with calculating our NAV (including the costs and expenses of any independent valuation firm); (vii) legal, auditing or accounting expenses; (viii) taxes or governmental fees; (ix) the fees and expenses of our administrator, transfer agent or sub-transfer agent; (x) the cost of preparing stock certificates or any other expenses, including clerical expenses of issue, redemption or repurchase of our shares; (xi) the expenses of and fees for registering or qualifying our shares for sale and of maintaining our registration and registering us as a broker or a dealer; (xii) the fees and expenses of our directors who are not affiliated with our Investment Adviser; (xiii) the cost of preparing and distributing reports, proxy statements and notices to our stockholders, the SEC and other regulatory authorities; (xiv) costs of holding stockholder meetings; (xv) listing fees; (xvi) the fees or disbursements of custodians of our assets, including expenses incurred in the performance of any obligations enumerated by our certificate of incorporation or bylaws insofar as they govern agreements with any such custodian; (xvii) insurance premiums; or (xviii) costs incurred in connection with any claim, litigation, arbitration, mediation, government investigation or dispute in connection with our business and the amount of any judgment or settlement paid in connection therewith, or the enforcement of our rights against any person and indemnification or contribution expenses payable by us to any person and other extraordinary expenses not incurred in the ordinary course of our business. Our Investment Adviser is not required to pay expenses of activities which are primarily intended to result in sales of our shares, including, all costs and expenses associated with the preparation and distribution of any offering memorandum, subscription agreements, registration statements, prospectuses or stockholder application forms.
Our Investment Adviser may impose a voluntary cap on the amount of expenses that will be borne by us on a monthly or annual basis. Any such expense cap may be increased, decreased, waived or eliminated at any time at our Investment Adviser’s sole discretion.
To the extent that expenses to be borne by us pursuant to the Investment Management Agreement are paid by our Investment Adviser, we will reimburse our Investment Adviser for such expenses, provided, however, that our Investment Adviser may elect, from time to time and in its sole discretion, to bear certain of our expenses set forth above, including organizational and other expenses.
23
Transfer Agent
Computershare Trust Company, N.A. serves as our transfer agent (the “Transfer Agent”), dividend agent and registrar.
Administration Agreement
Pursuant to the Administration Agreement with State Street Bank and Trust Company, our administrator, our administrator is responsible for providing various accounting and administrative services to us. The Administration Agreement provides that the administrator is not liable to us for any damages or other losses arising out of the performance of its services thereunder except under certain circumstances, and contains provisions for the indemnification of the administrator by us against liabilities to other parties arising in connection with the performance of its services to us. We pay the administrator fees for its services as we determine are commercially reasonable in our sole discretion. We also reimburse the administrator for all reasonable expenses. To the extent that our administrator outsources any of its functions, the administrator pays any compensation associated with such functions. We are not obligated to retain our administrator. The Administration Agreement may be terminated by either party without penalty upon 30 days’ written notice to the other party. The terms of any administration agreement that we may enter with any subsequent administrator may differ materially from the terms of the Administration Agreement with State Street Bank and Trust Company in effect prior to such retention, including providing for a fee structure that results in us, directly or indirectly, bearing higher fees for similar services and other terms that are potentially less advantageous to us. Our stockholders will not be entitled to receive prior notice of the engagement of an alternate administrator or of the terms of any agreement that is entered into with such administrator.
License Agreement
We are party to a license agreement with an affiliate of Goldman Sachs pursuant to which we have been granted a non-exclusive, royalty-free license to use the “Goldman Sachs” name. Under this agreement, we do not have a right to use the Goldman Sachs name if GSAM or another affiliate of Goldman Sachs is not our Investment Adviser or if our continued use of such license results in a violation of applicable law, results in a regulatory burden or has adverse regulatory consequences. Other than with respect to this limited license, we have no legal right to the “Goldman Sachs” name.
Regulation
We have elected to be treated as a BDC under the Investment Company Act. As with other companies regulated by the Investment Company Act, a BDC must adhere to certain substantive regulatory requirements. The Investment Company Act contains prohibitions and restrictions relating to transactions between BDCs and their affiliates (including any investment advisers or sub-advisers), principal underwriters and affiliates of those affiliates or underwriters and requires that a majority of the directors be persons other than “interested persons,” as that term is defined in the Investment Company Act. In addition, the Investment Company Act provides that we may not change the nature of our business so as to cease to be, or to withdraw our election as, a BDC unless approved by a majority of our outstanding voting securities. A majority of the outstanding voting securities of a company is defined under the Investment Company Act as the vote: (i) of 67% or more of the voting securities present at such meeting, if the holders of more than 50% of the outstanding voting securities of such company are present or represented by proxy, or (ii) of more than 50% of the outstanding voting securities of such company, whichever is less.
Any issuance of preferred stock must comply with the requirements of the Investment Company Act. The Investment Company Act requires, among other things, that (1) immediately after issuance and before any dividend or other distribution is made with respect to our common stock and before any purchase of common stock is made, such preferred stock together with all other senior securities must not exceed an amount equal to 50% of our total assets after deducting the amount of such dividend, distribution or purchase price, as the case may be, and (2) the holders of shares of preferred stock, if any are issued, must be entitled as a class to elect two directors at all times and to elect a majority of the directors if dividends on such preferred stock are in arrears by two full years or more. Certain other matters under the Investment Company Act require a separate class vote of the holders of any issued and outstanding preferred stock. For example, holders of preferred stock would be entitled to vote separately as a class from the holders of common stock on a proposal involving a plan of reorganization adversely affecting such securities.
We may invest up to 100% of our assets in securities acquired directly from issuers in privately negotiated transactions. With respect to such securities, we may, for the purpose of public resale, be deemed a “principal underwriter” as that term is defined under the Securities Act of 1933, as amended (the “Securities Act”). We may purchase or otherwise receive warrants, which offer an opportunity (not a requirement) to purchase common stock of a portfolio company in connection with an acquisition financing or other investments. Similarly, we may acquire rights that obligate an issuer of acquired securities or their affiliates to repurchase the securities at certain times, under certain circumstances. We do not intend to acquire securities issued by any investment company whereby our investment would exceed the limits imposed by the Investment Company Act. Under these limits, we generally cannot (1) acquire more than 3% of the total outstanding voting stock of any registered investment company, (2) invest more than 5% of the value of our total assets in the securities of one registered investment company or (3) invest more than 10% of the value of our total assets in the securities of registered investment companies in general. These limitations do not apply where we acquire interests in a money market fund as long as we do not pay a sales charge or service fee in connection with the purchase. With respect to the portion of our portfolio invested in securities issued by investment companies, it should be noted that such
24
investments might subject our stockholders to additional expenses. None of our policies described above are fundamental and each such policy may be changed without stockholder approval, subject to any limitations imposed by the Investment Company Act.
Private funds that are excluded from the definition of “investment company” pursuant to either Section 3(c)(1) or 3(c)(7) of the Investment Company Act are also subject to certain of the limits under the Investment Company Act noted above. Specifically, such private funds may not acquire directly or through a controlled entity more than 3% of our total outstanding voting stock (measured at the time of the acquisition). Investment companies registered under the Investment Company Act are also subject to the restriction as well as other limitations under the Investment Company Act that would restrict the amount that they are able to invest in our securities. As a result, certain investors would be required to hold a smaller position in our shares than if they were not subject to such restrictions.
Qualifying Assets
Under the Investment Company Act, a BDC may not acquire any asset other than assets of the type listed in Section 55(a) of the Investment Company Act, which are referred to as “qualifying assets,” unless, at the time the acquisition is made, qualifying assets (not including certain assets specified in the Investment Company Act) represent at least 70% of such BDC's total assets. The principal categories of qualifying assets relevant to our proposed business are the following:
(1) Securities purchased in transactions not involving any public offering from the issuer of such securities, which issuer (subject to certain exceptions) is an eligible portfolio company, or from any person who is, or has been during the preceding thirteen months, an affiliated person of an eligible portfolio company, or from any other person, subject to such rules and regulations as may be prescribed by the SEC. An eligible portfolio company is defined in the Investment Company Act as any issuer that:
(2) Securities of any eligible portfolio company that we control.
(3) Securities purchased in a private transaction from a U.S. issuer that is not an investment company or from an affiliated person of the issuer, or in transactions incident thereto, if the issuer is in bankruptcy and subject to reorganization or if the issuer, immediately prior to the purchase of its securities, was unable to meet its obligations as they came due without material assistance other than conventional lending or financing arrangements.
(4) Securities of an eligible portfolio company purchased from any person in a private transaction if there is no ready market for such securities and we already own at least 60% of the outstanding equity of the eligible portfolio company.
(5) Securities received in exchange for or distributed on or with respect to securities described in (1) through (4) above, or pursuant to the exercise of options, warrants or rights relating to such securities.
(6) Cash, cash equivalents, U.S. government securities or high-quality debt securities maturing in one year or less from the time of investment.
Managerial Assistance to Portfolio Companies
A BDC must be organized and have its principal place of business in the United States and must be operated for the purpose of making investments in the types of securities described in (1), (2) or (3) above under “Qualifying Assets.” However, in order to count portfolio securities as qualifying assets for the purpose of the 70% test, the BDC must also either control the issuer of the securities or offer to make available to the issuer of the securities (other than small and solvent companies described above) significant managerial assistance; except that, where the BDC purchases such securities in conjunction with one or more other persons acting together, one of the other persons in the group may make
25
available such managerial assistance (as long as the BDC does not make available significant managerial assistance solely in this fashion). Making available significant managerial assistance means, among other things, any arrangement whereby the BDC, through its directors, officers or employees, offers to provide, and, if accepted, does so provide, significant guidance and counsel concerning the management, operations or business objectives and policies of a portfolio company.
Temporary Investments
As a BDC, pending investment in other types of “qualifying assets,” as described above, our investments may consist of cash, cash equivalents, U.S. government securities or high-quality debt securities maturing in one year or less from the time of investment, which we refer to, collectively, as temporary investments, so that 70% of our assets are qualifying assets. We may invest in U.S. Treasury bills or in repurchase agreements, provided that such agreements are fully collateralized by cash or securities issued by the U.S. government or its agencies. A repurchase agreement involves the purchase by an investor, such as us, of a specified security and the simultaneous agreement by the seller to repurchase it at an agreed-upon future date and at a price which is greater than the purchase price by an amount that reflects an agreed-upon interest rate. There is no percentage restriction on the proportion of our assets that may be invested in such repurchase agreements. However, if more than 25% of our total assets constitute repurchase agreements from a single counterparty, we would generally not meet the asset diversification requirements necessary to qualify as a RIC. Thus, we do not intend to enter into repurchase agreements with a single counterparty in excess of this limit. Our Investment Adviser will monitor the creditworthiness of the counterparties with which we enter into repurchase agreement transactions.
Indebtedness and Senior Securities
As a BDC, we are permitted, under specified conditions, to issue multiple classes of indebtedness and one class of shares of stock senior to our common stock if our asset coverage ratio, as defined under the Investment Company Act, is at least equal to 200%, or 150% if certain requirements are met, immediately after each such issuance. The Small Business Credit Availability Act modified the applicable provisions of the Investment Company Act to reduce the required asset coverage ratio applicable to BDCs to 150%, subject to certain approval and disclosure requirements. On June 15, 2018, our stockholders approved the application of the reduced asset coverage requirements in Section 61(a)(2) of the Investment Company Act to us. As a result of this approval, we are now permitted to borrow amounts such that our asset coverage ratio, as defined in the Investment Company Act, is at least 150% after such borrowing (if certain requirements are met), rather than 200%, as previously required. In addition, except in limited circumstances, while any indebtedness and senior securities remain outstanding, we must make provisions to prohibit any distribution to our stockholders or the repurchase of such securities or stock unless we meet the applicable asset coverage ratios at the time of the distribution or repurchase. We may also borrow amounts up to 5% of the value of our total assets for temporary or emergency purposes without regard to asset coverage. A loan is presumed to be made for temporary purposes if it is repaid within 60 days and is not extended or renewed; otherwise, it is presumed to not be for temporary purposes. For a discussion of the risks associated with leverage, see “Item 1A. Risk Factors—Our Business and Structure—Regulations governing our operation as a BDC affect our ability to, and the way in which we, raise additional capital. These constraints may hinder our Investment Adviser’s ability to take advantage of attractive investment opportunities and to achieve our investment objective.”
Code of Ethics
We have adopted a Code of Ethics pursuant to Rule 17j-1 under the Investment Company Act and we have also approved our Investment Adviser’s Code of Ethics that it adopted in accordance with Rule 17j-1 and Rule 204A-1 under the Advisers Act. These Codes of Ethics establish, among other things, procedures for personal investments and restrict certain personal securities transactions, including transactions in securities that are held by us. Personnel subject to each code may invest in securities for their personal investment accounts, so long as such investments are made in accordance with the code’s requirements. The Codes of Ethics are available on the EDGAR Database on the SEC’s Internet site at http://www.sec.gov. Copies may also be obtained by electronic request to publicinfo@sec.gov.
Proxy Voting Policies and Procedures
We have delegated the voting of portfolio securities to our Investment Adviser. For client accounts for which our Investment Adviser has voting discretion, our Investment Adviser has adopted policies and procedures (the “Proxy Voting Policy”) for the voting of proxies. Under the Proxy Voting Policy, our Investment Adviser’s guiding principles in performing proxy voting are to make decisions that favor proposals that tend to maximize a company’s stockholder value and are not influenced by conflicts of interest. To implement these guiding principles for investments in publicly traded equities, our Investment Adviser has developed customized proxy voting guidelines (the “Guidelines”) that it generally applies when voting on behalf of client accounts. These Guidelines address a wide variety of individual topics, including, among other matters, stockholder voting rights, anti-takeover defenses, board structures, the election of directors, executive and director compensation, reorganizations, mergers, issues of corporate social responsibility and various stockholder proposals.
The Proxy Voting Policy, including the Guidelines, is reviewed periodically to assure that it continues to be consistent with our Investment Adviser’s guiding principles. The Guidelines embody the positions and factors our Investment Adviser generally considers important in casting proxy votes.
26
Our Investment Adviser has retained a third-party proxy voting service (the “Proxy Service”), currently Institutional Shareholder Services, to assist in the implementation and administration of certain proxy voting-related functions including operational, recordkeeping, and reporting services. The Proxy Service also prepares a written analysis and recommendation (a “Recommendation”) of each proxy vote that reflects the Proxy Service’s application of the Guidelines to particular proxy issues. While it is our Investment Adviser’s policy generally to follow the Guidelines and Recommendations from the Proxy Service, our Investment Adviser’s portfolio management teams (the “Portfolio Management Teams”) may, on certain proxy votes, seek approval to diverge from the Guidelines or a Recommendation by following an “override” process. Such decisions are subject to a review and approval process, including a determination that the decision is not influenced by any conflict of interest. A Portfolio Management Team that receives approval through the override process to cast a proxy vote that diverges from the Guidelines and/or a Recommendation may vote differently than other Portfolio Management Teams that did not seek to override the vote. In forming their views on particular matters, the Portfolio Management Teams are also permitted to consider applicable regional rules and practices, including codes of conduct and other guides, regarding proxy voting, in addition to the Guidelines and Recommendations. Our Investment Adviser may hire other service providers to replace or supplement the Proxy Service with respect to any of the services our Investment Adviser currently receives from the Proxy Service.
From time to time, our Investment Adviser may face regulatory, compliance, legal or logistical limits with respect to voting securities that it may purchase or hold for client accounts, which can affect our Investment Adviser’s ability to vote such proxies, as well as the desirability of voting such proxies. Among other limits, federal, state and foreign regulatory restrictions or company specific ownership limits, as well as legal matters related to consolidated groups, may restrict the total percentage of an issuer’s voting securities that our Investment Adviser can hold for clients and the nature of our Investment Adviser’s voting in such securities. Our Investment Adviser’s ability to vote proxies may also be affected by, among other things: (i) late receipt of meeting notices; (ii) requirements to vote proxies in person; (iii) restrictions on a foreigner’s ability to exercise votes; (iv) potential difficulties in translating the proxy; (v) requirements to provide local agents with unrestricted powers of attorney to facilitate voting instructions; and (vi) requirements that investors who exercise their voting rights surrender the right to dispose of their holdings for some specified period in proximity to the stockholder meeting.
Our Investment Adviser conducts periodic due diligence meetings with the Proxy Service which include a review of the Proxy Service’s general organizational structure, new developments with respect to research and technology, workflow improvements and internal due diligence with respect to conflicts of interest.
Our Investment Adviser has adopted policies and procedures designed to prevent conflicts of interest from influencing its proxy voting decisions that our Investment Adviser makes on behalf of a client account and to help assure that such decisions are made in accordance with our Investment Adviser’s fiduciary obligations to its clients. These policies and procedures include our Investment Adviser’s use of the Guidelines and Recommendations from the Proxy Service, the override approval process previously discussed, and the establishment of information barriers between our Investment Adviser and other Goldman Sachs’ businesses. Notwithstanding such proxy voting policies and procedures, actual proxy voting decision of our Investment Adviser may have the effect of benefitting the interest of other clients or businesses of other divisions or units of Goldman Sachs and/or its affiliates, provided that our Investment Adviser believes such voting decisions to be in accordance with its fiduciary obligations.
Voting decisions with respect to fixed income securities and the securities of privately held issuers generally will be made by our Investment Adviser based on its assessment of the particular transactions or other matters at issue.
Information regarding how we vote proxies relating to portfolio securities is available upon request by writing to Goldman Sachs BDC, Inc., Attention: Austin Neri, Investor Relations, 200 West Street, New York, New York 10282.
Privacy Principles
The following information is provided to help investors understand what personal information we collect, how we protect that information and why, in certain cases, we may share information with select other parties.
We generally will not receive any nonpublic personal information relating to stockholders who purchase our common stock. We may collect nonpublic personal information regarding our existing investors from sources such as subscription agreements, investor questionnaires and other forms; individual investors’ account histories; and correspondence between us and individual investors. We may share information that we collect regarding an investor with our affiliates and the employees of such affiliates for everyday business purposes, for example, to service the investor’s accounts and, unless an investor opts out, provide the investor with information about other products and services offered by us or our affiliates that may be of interest to the investor. In addition, we may disclose information that we collect regarding investors to third parties who are not affiliated with us (i) as authorized by our investors in investor subscription agreements or our organizational documents; (ii) as required by applicable law or in connection with a properly authorized legal or regulatory investigation, subpoena or summons, or to respond to judicial process or government regulatory authorities having property jurisdiction; (iii) as required to fulfill investor instructions; or (iv) as otherwise permitted by applicable law to perform support services for investor accounts or process investor transactions with us or our affiliates.
27
Any party not affiliated with us that receives nonpublic personal information relating to investors from us is required to adhere to confidentiality agreements and to maintain appropriate safeguards to protect investor information. Additionally, for officers, employees and agents of ours and our affiliates, access to such information is restricted to those who need such access to provide services to us and investors. We maintain physical, electronic and procedural safeguards to seek to guard investor nonpublic personal information. For a discussion of the risks associated with cyber incidents, see “Item 1A—Risk Factors—Operational—Cybersecurity risks and cyber incidents may adversely affect our business or the business of our portfolio companies by causing a disruption to our operations or the operations of our portfolio companies, a compromise or corruption of our confidential information or the confidential information of our portfolio companies and/or damage to our business relationships or the business relationships of our portfolio companies, all of which could negatively impact the business, financial condition and operating results of us or our portfolio companies.”
Other
As a BDC, the SEC will periodically examine us for compliance with the Investment Company Act.
We are required to provide and maintain a bond issued by a reputable fidelity insurance company, in order to protect against larceny and embezzlement, covering each of our officers and employees, who may singly, or jointly with others, have access to our securities or funds. Furthermore, as a BDC, we are prohibited from protecting any director, officer, investment adviser or underwriter against any liability to us or our stockholders arising from willful misfeasance, bad faith, gross negligence or reckless disregard of the duties involved in the conduct of such person’s office.
We and our Investment Adviser are each required to adopt and implement written policies and procedures reasonably designed to prevent violation of the federal securities laws, review these policies and procedures annually for their adequacy and the effectiveness of their implementation and designate a chief compliance officer to be responsible for administering the policies and procedures.
Compliance with the Sarbanes-Oxley Act
The Sarbanes-Oxley Act of 2002, as amended (the “Sarbanes-Oxley Act”), imposes a wide variety of regulatory requirements on publicly held companies and their insiders. Many of these requirements affect us. For example:
The Sarbanes-Oxley Act requires us to review our policies and procedures to determine whether we comply with the Sarbanes-Oxley Act and the regulations promulgated thereunder. We will continue to monitor our compliance with all future regulations that are adopted under the Sarbanes-Oxley Act and will take actions necessary to ensure that we are in compliance therewith.
Compliance with Listing Requirements
Our common stock is listed on the NYSE under the symbol “GSBD.” As a listed company on the NYSE, we are subject to various listing standards including corporate governance listing standards. We believe we are in compliance with these rules.
Compliance with the Bank Holding Company Act
As a BHC and FHC, the activities of GS Group Inc. and its affiliates are subject to certain restrictions imposed by the Bank Holding Company Act of 1956, as amended (the “BHCA”), and related regulations. BHCs and FHCs are subject to supervision and regulation by the Federal Reserve. Because GS Group Inc. may be deemed to “control” us within the meaning of the BHCA, restrictions under the BHCA could apply to us as well. Accordingly, the BHCA and other applicable banking laws, rules, regulations and guidelines, and their interpretation and administration by the appropriate regulatory agencies, including the Federal Reserve, may restrict our investments, transactions and operations and may restrict the transactions and relationships between our Investment Adviser, GS Group Inc. and their affiliates, on the one hand, and us on the other hand. For example, the BHCA regulations applicable to GS Group Inc. and us may, among other things, restrict our ability to make certain investments or the size of certain investments, impose a maximum holding period on some or all of our investments and restrict our and our Investment Adviser’s ability to participate in the management and operations of the companies in which we invest. In addition, certain
28
BHCA regulations may require aggregation of the positions owned, held or controlled by related entities. Thus, in certain circumstances, positions held by GS Group Inc. and its affiliates (including our Investment Adviser) for client and proprietary accounts may need to be aggregated with positions held by us. In this case, where BHCA regulations impose a cap on the amount of a position that may be held, Goldman Sachs may utilize available capacity to make investments for its proprietary accounts or for the accounts of other clients, which may require us to limit and/or liquidate certain investments. Additionally, Goldman Sachs may in the future, in its sole discretion and without notice to investors, engage in activities impacting us and/or our Investment Adviser in order to comply with the BHCA or other legal requirements applicable to, or reduce or eliminate the impact or applicability of any bank regulatory or other restrictions on, Goldman Sachs, us or other funds and accounts managed by our Investment Adviser and its affiliates. In addition, Goldman Sachs may cease in the future to qualify as a FHC, which may subject us to additional restrictions. Moreover, there can be no assurance that the bank regulatory requirements applicable to Goldman Sachs and us, or the interpretation thereof, will not change, or that any such change will not have a material adverse effect on us. See “Item 1A. Risk Factors—Legal and Regulatory—Our activities may be limited as a result of potentially being deemed to be controlled by GS Group Inc., a bank holding company.”
ITEM 1A. RISK FACTORS
Investing in our securities involves certain risks relating to our structure and investment objective. You should carefully consider these risk factors, together with all of the other information included in this report, before you decide whether to make an investment in our securities. The risks set forth below are not the only risks we face, and we may face other risks that we have not yet identified, which we do not currently deem material or which are not yet predictable. If any of the following risks occur, our business, financial condition and results of operations could be materially adversely affected. In such case, our NAV and the trading price of our securities could decline, and you may lose all or part of your investment.
Summary Risk Factors
Investing in our securities involves a high degree of risk. The following is a summary of certain of the principal risks that should be carefully considered before investing in our securities:
29
30
Market Developments and General Business Environment
The capital markets may experience periods of disruption and instability. Such market conditions may have materially and adversely affected debt and equity capital markets, which may have a negative impact on our business and operations.
From time to time, capital markets may experience periods of disruption and instability. For example, over the past few years, the U.S. capital markets experienced disruption as evidenced by volatility in global stock markets as a result of, among other things, the COVID-19 pandemic, social and political tensions in the United States and around the world, the fluctuating price of commodities, such as oil, and Russia’s military invasion of Ukraine. Despite remedial actions of the U.S. federal government and foreign governments, these events contributed to worsening general economic conditions that materially and adversely impacted broader financial and credit markets and reduced the availability of debt and equity capital for the market as a whole. These and any other unfavorable economic conditions could increase our funding costs and/or limit our access to the capital markets.
Significant changes or volatility in the capital markets may negatively affect the valuations of our investments. While most of our investments are not publicly traded, applicable accounting standards require us to assume as part of our valuation process that our investments are sold in a principal market to market participants (even if we plan to hold an investment to maturity). Significant changes in the capital markets may also affect the pace of our investment activity and the potential for liquidity events involving our investments. Our valuations, and particularly valuations of private investments and private companies, are inherently uncertain, fluctuate over short periods of time and are often based on estimates, comparisons and qualitative evaluations of private information that may not reflect the full impact of market disruptions and measures taken in response thereto. Any public health emergency, including an outbreak of existing or new epidemic diseases, or the threat thereof, and the resulting financial and economic market uncertainty could have a significant adverse impact on us and the fair value of our investments and our portfolio companies.
Disruptions in economic activity, such as those caused by the COVID-19 pandemic, Russia’s military invasion of Ukraine, the escalated conflict in the Middle East and terrorism or threats of terrorism, have limited and could continue to limit our investment originations, limit our ability to grow, increase our funding costs and have a material negative impact on our and our portfolio companies’ operating results and the fair values of our debt and equity investments. Additionally, the disruption in economic activity caused by the COVID-19 pandemic and Russia’s military invasion of Ukraine has had, and may continue to have, a negative effect on the potential for liquidity events involving our investments. The illiquidity of our investments may make it difficult for us to sell such investments to access capital, if required. As a result, we could realize significantly less than the value at which we have recorded our investments if we were required to sell them to increase our liquidity. An inability on our part to raise incremental capital, and any required sale of all or a portion of our investments as a result, could have a material adverse effect on our business, financial condition or results of operations.
Current market conditions may make it difficult to raise equity capital, extend the maturity of or refinance our existing indebtedness or obtain new indebtedness with similar terms and any failure to do so could have a material adverse effect on our business. In addition, market conditions, including inflation, have adversely impacted, and could in the future have further negative impacts on the operations of certain of our portfolio companies. If the financial results of middle-market companies, like those in which we invest, experience deterioration, it could ultimately lead to difficulty in meeting debt service requirements and an increase in defaults. Further deterioration in market conditions may further depress the outlook for those companies. The debt capital available to us in the future, if available at all, may bear a higher interest rate and may be available only on terms and conditions less favorable than those of our existing debt. If we are unable to raise new debt or refinance our existing debt, then our equity investors will not benefit from the potential for increased returns on equity resulting from leverage, and we may be unable to make new commitments or to fund existing commitments to our portfolio companies. Any inability to extend the maturity of or refinance our existing debt, or to obtain new debt, could have a material adverse effect on our business, financial condition or results of operations.
31
Political, social and economic uncertainty, including uncertainty related to the COVID-19 pandemic and Russia’s military invasion of Ukraine, create and exacerbate risks.
Social, political, economic and other conditions and events in the United States, the United Kingdom, the European Union, the Middle East and China (such as natural disasters, epidemics and pandemics, terrorism, military conflicts and social unrest) may occur that create uncertainty and have significant impacts on issuers, industries, governments and other systems, including the financial markets, to which companies and their investments are exposed.
The uncertainties caused by these conditions and events could result in or coincide with, among other things: increased volatility in the financial markets for securities, derivatives, loans, credit and currency; a decrease in the reliability of market prices and difficulty in valuing assets (including portfolio company assets); greater fluctuations in spreads on debt investments and currency exchange rates; increased risk of default (by both government and private obligors and issuers); changes to governmental regulation and supervision of the loan, securities, derivatives and currency markets and market participants; limitations on the activities of investors in the financial markets; and substantial, and in some periods extremely high, rates of inflation, which can last many years and have substantial negative effects on credit and securities markets.
While financial markets have rebounded from the significant declines that occurred early in the pandemic and global economic conditions generally improved since 2021, certain of the circumstances that arose or became more pronounced after the onset of the COVID-19 pandemic and subsequent geopolitical events have persisted, including (i) relatively weak consumer confidence; (ii) ongoing heightened credit risk with regard to certain industries, including, at times, oil and gas, gaming and lodging and airlines and (iii) higher cyber security, information security and operational risks.
Depending on any lasting effects of the pandemic on consumer and corporate confidence, the conditions noted above could continue for an extended period and other adverse developments may occur or reoccur, including (i) the decline in value and performance of us and our portfolio companies, (ii) the ability of our borrowers to continue to meet loan covenants or repay loans provided by us on a timely basis or at all, which may require us to restructure our investments or write down the value of our investments, (iii) our ability to comply with the covenants and other terms of our debt obligations and to repay such obligations, on a timely basis or at all, (iv) our ability to comply with certain regulatory requirements, such as asset coverage requirements under the Investment Company Act, (v) our ability to maintain our distributions at their current level or to pay them at all, or (vi) our ability to source, manage and divest investments and achieve our investment objectives, all of which could result in significant losses to us. We will also be negatively affected if the operations and effectiveness of any of our portfolio companies (or any of the key personnel or service providers of the foregoing) is compromised or if necessary or beneficial systems and processes are disrupted. The U.S. economy, as well as most other major economies, may experience economic recession, and we anticipate our businesses could be materially and adversely affected by a prolonged recession in the United States and other major global markets. See “—The capital markets may experience periods of disruption and instability. Such market conditions may have materially and adversely affected debt and equity capital markets, which may have a negative impact on our business and operations.”
Disruptions in the capital markets, including disruptions resulting from inflation, the uncertain interest rate environment, Russia’s military invasion of Ukraine and the escalated conflict in the Middle East, have increased the spread between the yields realized on risk-free and higher risk securities, resulting in illiquidity in parts of the capital markets, significant write-offs in the financial sector and re-pricing of credit risk in the broadly syndicated market. These and future market disruptions and/or illiquidity can be expected to have an adverse effect on our business, financial condition, results of operations and cash flows. Unfavorable economic conditions also would be expected to increase our funding costs, limit our access to the capital markets or result in a decision by lenders not to extend credit to us. These events could limit our investment originations, limit our ability to grow and have a material negative impact on our and our portfolio companies’ operating results and the fair values of our debt and equity investments.
In addition, fiscal and monetary actions taken by the United States and non-U.S. government and regulatory authorities could have a material adverse impact on our business. To the extent uncertainty regarding the U.S. or global economy negatively impacts consumer confidence and consumer credit factors, our business, financial condition and results of operations could be adversely affected. Moreover, Federal Reserve policy, including with respect to certain interest rates, along with the general policies of the current Presidential administration, may also adversely affect the value, volatility and liquidity of dividend- and interest-paying securities. These conditions, government actions and future developments may cause interest rates and borrowing costs to rise, which may adversely affect our ability to access debt financing on favorable terms and may increase the interest costs of our borrowers, hampering their ability to repay us. Continued or future adverse economic conditions could have a material adverse effect on our business, financial condition and results of operations.
If key economic indicators, such as the unemployment rate or inflation, do not progress at a rate consistent with the Federal Reserve’s objectives, the target range for the federal funds rate may increase and cause interest rates and borrowing costs to rise, which may negatively impact our ability to access the debt markets on favorable terms and may also increase the costs of our borrowers, hampering their ability to repay us.
Legislation may be adopted that could significantly affect the regulation of U.S. financial markets. Areas subject to potential change, amendment or repeal include the Dodd-Frank Wall Street Reform and Consumer Protection Act (the “Dodd-Frank Act”) and the authority of the Federal Reserve and the Financial Stability Oversight Council. These or other regulatory changes could result in greater competition from
32
banks and other lenders with which we compete for lending and other investment opportunities. The United States may also potentially withdraw from or renegotiate various trade agreements and take other actions that would change current trade policies of the United States. We cannot predict which, if any, of these actions will be taken or, if taken, their effect on the financial stability of the United States. Such actions could have a material adverse effect on our business, financial condition and results of operations.
In addition, Russia’s invasion of Ukraine in February 2022 and corresponding events have had, and could continue to have, severe adverse effects on regional and global economic markets. Following Russia’s actions, various governments, including the governments of the United States, United Kingdom and the European Union, have issued broad-ranging economic sanctions against Russia, including, among other actions, a prohibition on doing business with certain Russian companies, large financial institutions, officials and oligarchs; a prohibition on new investment in Russia; a prohibition on the provision of certain services to Russia; new export controls and import bans; the implementation of a price cap policy for Russian-origin oil and petroleum products; the removal of selected Russian banks from the Society for Worldwide Interbank Financial Telecommunications, the electronic banking network that connects banks globally; and restrictive measures to prevent the Russian Central Bank from undermining the impact of the sanctions. Private companies have also implemented restrictions that severely limit, and in some cases, reverse or cancel, business transactions in or involving certain individuals and/or businesses connected to or associated with Russia and/or Belarus. Further, some private companies have moved to divest of Russia-based subsidiaries and assets. The duration of hostilities and the vast array of sanctions and related events (including retaliatory measures imposed by Russia, cyber incidents and espionage) cannot be predicted. Those events present material uncertainty and risk with respect to markets globally, which pose potential adverse risks to us and the performance of our investments and operations. Any such market disruptions could affect our portfolio companies’ operations and, as a result, could have a material adverse effect on our business, financial condition and results of operations.
Legal and Regulatory
Our operation as a BDC imposes numerous constraints on us and significantly reduces our operating flexibility. In addition, if we fail to maintain our status as a BDC, we might be regulated as a registered closed-end investment company, which would subject us to additional regulatory restrictions.
The Investment Company Act imposes numerous constraints on the operations of BDCs. For example, BDCs generally are required to invest at least 70% of their total assets primarily in securities of qualifying U.S. private companies or thinly traded public companies, cash, cash equivalents, U.S. government securities and other high-quality debt investments that mature in one year or less from the time of investment. These constraints may hinder our Investment Adviser’s ability to take advantage of attractive investment opportunities and to achieve our investment objective. Furthermore, any failure to comply with the requirements imposed on BDCs by the Investment Company Act could cause the SEC to bring an enforcement action against us and/or expose us to claims of private litigants.
We may be precluded from investing in what our Investment Adviser believes are attractive investments if such investments are not qualifying assets for purposes of the Investment Company Act. If we do not invest a sufficient portion of our assets in qualifying assets, we will be prohibited from making any additional investment that is not a qualifying asset and could be forced to forgo attractive investment opportunities. Similarly, these rules could prevent us from making follow-on investments in existing portfolio companies (which could result in the dilution of our position).
If we fail to maintain our status as a BDC, we might be regulated as a closed-end investment company that is required to register under the Investment Company Act. This would subject us to additional regulatory restrictions and significantly decrease our operating flexibility. In addition, any such failure could cause us to lose our RIC status or cause an event of default under any outstanding indebtedness we might have, which could have a material adverse effect on our business, financial condition or results of operations.
We will be subject to U.S. federal income tax at corporate rates (and any applicable U.S. state and local taxes) on all of our income if we are unable to maintain our qualification for tax treatment as a RIC, which would have a material adverse effect on our financial performance.
Although we have elected to be treated as a RIC, and we intend to qualify for tax treatment as a RIC annually, we cannot assure stockholders that we will be able to do so. To maintain RIC status and be relieved of U.S. federal income taxes on income and gains distributed to our stockholders, we must meet the annual distribution, source-of-income and quarterly-asset diversification requirements described below.
33
If we fail to maintain our qualification for tax treatment as a RIC for any reason, and we do not qualify for certain relief provisions under the Code, we would be subject to U.S. federal income tax at corporate rates (and any applicable U.S. state and local taxes). In this event, the resulting taxes and any resulting penalties could substantially reduce our net assets, the amount of our income available for distribution and the amount of our distributions to our stockholders, which would have a material adverse effect on our financial performance.
Regulations governing our operations as a BDC affect our ability to, and the way in which we, raise additional capital. These constraints may hinder our Investment Adviser’s ability to take advantage of attractive investment opportunities and to achieve our investment objective.
Regulations governing our operation as a BDC affect our ability to raise additional capital, and the ways in which we can do so. Raising additional capital may expose us to risks, including the typical risks associated with leverage, and may result in dilution to our current stockholders. The Investment Company Act limits our ability to borrow amounts or issue debt securities or preferred stock, which we refer to collectively as “senior securities,” to amounts such that our asset coverage ratio, as defined under the Investment Company Act, equals at least 150% immediately after such borrowing or issuance if certain requirements are met, rather than 200%, as previously required and as described below. Consequently, if the value of our assets declines, we may be required to sell a portion of our investments and, depending on the nature of our leverage, repay a portion of our indebtedness at a time when this may be disadvantageous to us and, as a result, our stockholders. The Small Business Credit Availability Act modified the applicable provisions of the Investment Company Act to reduce the required asset coverage ratio applicable to BDCs to 150%, subject to certain approval and disclosure requirements. Under this legislation, BDCs are able to increase their leverage capacity if stockholders approve a proposal to do so. At our 2018 annual meeting of stockholders held on June 15, 2018, our stockholders approved the proposal to apply the modified asset coverage requirements in Section 61(a)(2) of the Investment Company Act to us.
We are generally not able to issue and sell our common stock at a price per share below NAV per share. We may, however, sell our common stock, or warrants, options or rights to acquire our common stock, at a price below the then-current NAV per share of our common stock (i) with the consent of a majority of our common stockholders (and a majority of our common stockholders who are not affiliates of ours), and (ii) if, among other things, a majority of our Independent Directors and a majority of our directors who have no financial interest in the transaction determine that a sale is in the best interests of us and our stockholders. If our common stock trades at a discount to NAV, this restriction could adversely affect our ability to raise capital.
We incur significant costs as a result of being subject to the reporting requirements under the Exchange Act.
We incur legal, accounting and other expenses, including costs associated with the periodic reporting requirements applicable to a company whose securities are registered under the Exchange Act, as well as additional corporate governance requirements, including requirements under the Sarbanes-Oxley Act, and other rules implemented by the SEC. These requirements may place a strain on our systems and resources. The Exchange Act requires that we file annual, quarterly and current reports with respect to our business and financial condition. The Sarbanes-Oxley Act requires that we maintain effective disclosure controls and procedures and internal control over financial reporting, which requires significant resources and management oversight. See “Item 1. Business—Compliance with the Sarbanes-Oxley Act.” We have implemented procedures, processes, policies and practices for the purpose of addressing the standards and requirements applicable to public companies. These activities may divert management’s attention from other business concerns, which could have a material adverse effect on our business, financial condition, results of operations and cash flows. We have incurred, and expect to continue to incur, significant annual expenses related to these steps and directors’ and officers’ liability insurance, director fees, reporting requirements of the SEC, transfer agent fees, additional administrative expenses payable to our administrator to compensate it for hiring additional accounting, legal and administrative personnel, increased auditing and legal fees and similar expenses associated with being subject to these reporting requirements.
34
Efforts to comply with Section 404 of the Sarbanes-Oxley Act involve significant expenditures, and noncompliance with Section 404 of the Sarbanes-Oxley Act may adversely affect us and the market price of our securities.
We are subject to the Sarbanes-Oxley Act, and the related rules and regulations promulgated by the SEC. Under current SEC rules, we are required to report on internal control over financial reporting pursuant to Section 404 of the Sarbanes-Oxley Act and regulations of the SEC thereunder, and our independent registered public accounting firm must audit this report. We are required to review on an annual basis our internal control over financial reporting, and on a quarterly and annual basis to evaluate and disclose changes in our internal control over financial reporting.
As a result, we incur additional expenses that may negatively impact our financial performance and our ability to make distributions. This process also may result in a diversion of management’s time and attention. We cannot be certain as to the timing of completion of any evaluation, testing and remediation actions or the impact of the same on our operations, and we may not be able to ensure that the process is effective or that our internal control over financial reporting is or will be effective in a timely manner. In the event that we are unable to maintain or achieve compliance with Section 404 of the Sarbanes-Oxley Act and related rules, we and the market price of our common stock would be adversely affected.
Changes in laws or regulations governing our operations or the operations of our portfolio companies, changes in the interpretation thereof or newly enacted laws or regulations, or any failure by us or our portfolio companies to comply with these laws or regulations, could require changes to certain of our or our portfolio companies’ business practices, negatively impact our or our portfolio companies’ operations, cash flows or financial condition, impose additional costs on us or our portfolio companies or otherwise adversely affect our business or the business of our portfolio companies.
We and our portfolio companies are subject to regulation at the local, state, federal and, in some cases, foreign levels. These laws and regulations, as well as their interpretation, are likely to change from time to time, and new laws and regulations may be enacted. Accordingly, any change in these laws or regulations, changes in their interpretation, or newly enacted laws or regulations, or any failure by us or our portfolio companies to comply with these laws or regulations, could require changes to certain of our or our portfolio companies’ business practices, negatively impact our or our portfolio companies’ operations, cash flows or financial condition, impose additional costs on us or our portfolio companies or otherwise adversely affect our business or the business of our portfolio companies. In addition to the legal, tax and regulatory changes that are expected to occur, there may be unanticipated changes and uncertainty regarding any such changes. The legal, tax and regulatory environment for BDCs, investment advisers and the instruments that they utilize (including derivative instruments) is continuously evolving. In addition, there is significant uncertainty regarding certain legislation and the regulations that have been adopted (and future regulations that will need to be adopted pursuant to such legislation) and, consequently, the full impact that such legislation will ultimately have on us and the markets in which we trade and invest is not fully known. Such uncertainty and any resulting confusion may itself be detrimental to the efficient functioning of the markets and the success of certain investment strategies.
Legislative and regulatory proposals directed at the financial services industry that are proposed, pending, or might be proposed in the future in the U.S. Congress may negatively impact the operations, cash flows or financial condition of us and our portfolio companies, impose additional costs on us and our portfolio companies, intensify the regulatory supervision of us and our portfolio companies or otherwise adversely affect our business or the business of our portfolio companies.
Over the last several years, there also has been an increase in regulatory attention to the extension of credit outside of the traditional banking sector, raising the possibility that some portion of the non-bank financial sector will be subject to new regulation. While it cannot be known at this time whether any such regulation will be implemented or what form it would take, increased regulation of non-bank credit extension would negatively impact our operations, cash flows or financial condition, impose additional costs on us, intensify the regulatory supervision of us or otherwise adversely affect our business.
We may be materially affected by market, economic and political conditions globally and in the jurisdictions and sectors in which we invest or operate, including economic outlook, factors affecting interest rates, the availability of credit, currency exchange rates and trade barriers. Recent populist and anti-globalization movements, particularly in the United States, may result in material changes in economic trade and immigration policies, all of which could lead to significant disruption of global markets and could have adverse consequences for our investments.
We cannot predict how new tax legislation will affect us, our investments, or our stockholders, and any such legislation could adversely affect our business.
Legislative or other actions relating to taxes could have a negative effect on us. The rules dealing with U.S. federal income taxation are constantly under review by persons involved in the legislative process and by the Internal Revenue Service and the U.S. Treasury Department. The likelihood of any new legislation being enacted is uncertain, but new legislation and any U.S. Treasury regulations, administrative interpretations or court decisions interpreting such legislation could significantly and negatively affect our ability to qualify for tax treatment as a RIC or the U.S. federal income tax consequences to us and our stockholders of such qualification and could have other adverse
35
consequences. Stockholders are urged to consult with their tax advisor regarding tax legislative, regulatory, or administrative developments and proposals and their potential effect on an investment in our common stock.
Our ability to enter into transactions with our affiliates is restricted.
As a BDC, we are prohibited under the Investment Company Act from knowingly participating in certain transactions with our affiliates without the prior approval of a majority of our Independent Directors who have no financial interest in the transaction, or in some cases, the prior approval of the SEC. For example, any person that owns, directly or indirectly, 5% or more of our outstanding voting securities is deemed our affiliate for purposes of the Investment Company Act. If this is the only reason such person is our affiliate, we are generally prohibited from buying any asset from or selling any asset (other than our capital stock) to, such affiliate, absent the prior approval of such directors. The Investment Company Act also prohibits “joint” transactions with an affiliate, which could include joint investments in the same portfolio company, without approval of our Independent Directors or in some cases the prior approval of the SEC. Moreover, except in certain limited circumstances, we are prohibited from buying any asset from or selling any asset to a holder of more than 25% of our voting securities, absent prior approval of the SEC. The analysis of whether a particular transaction constitutes a joint transaction requires a review of the relevant facts and circumstances then existing.
In certain circumstances, we and other Accounts (which may include proprietary accounts of Goldman Sachs) can make negotiated co-investments pursuant to an exemptive order from the SEC permitting us to do so. On November 16, 2022, the SEC granted the Relief to the Investment Adviser, the BDCs advised by the Investment Adviser and certain other affiliated applicants. Additionally, if our Investment Adviser forms other funds in the future, we may co-invest alongside such other affiliates, subject to compliance with the Relief, applicable regulations and regulatory guidance, as well as applicable allocation procedures. As a result of the Relief, there could be significant overlap in our investment portfolio and the investment portfolios of other Accounts, including, in some cases, proprietary accounts of Goldman Sachs.
In addition, we have filed an application to amend the Relief to permit us to participate in follow-on investments in our existing portfolio companies with certain affiliates covered by the Relief if such affiliates, that are not BDCs or registered investment companies, did not have an investment in such existing portfolio company. There can be no assurance if and when we will receive the amended exemptive order.
Our activities may be limited as a result of potentially being deemed to be controlled by GS Group Inc., a bank holding company.
GS Group Inc. is a BHC under the BHCA and therefore subject to supervision and regulation by the Federal Reserve. In addition, GS Group Inc. is a FHC under the BHCA, which is a status available to BHCs that meet certain criteria. FHCs may engage in a broader range of activities than BHCs that are not FHCs. However, the activities of FHCs and their affiliates remain subject to certain restrictions imposed by the BHCA and related regulations. Because GS Group Inc. may be deemed to “control” us within the meaning of the BHCA, these restrictions could apply to us as well. Accordingly, the BHCA and other applicable banking laws, rules, regulations and guidelines, and their interpretation and administration by the appropriate regulatory agencies, including the Federal Reserve, may restrict our investments, transactions and operations and may restrict the transactions and relationships between our Investment Adviser, GS Group Inc. and their respective affiliates, on the one hand, and us, on the other hand. For example, the BHCA regulations applicable to GS Group Inc. and to us may restrict our ability to make certain investments or the size of certain investments, impose a maximum holding period on some or all of our investments and restrict our and our Investment Adviser’s ability to participate in the management and operations of the companies in which we invest. In addition, certain BHCA regulations may require aggregation of the positions owned, held or controlled by related entities. Thus, in certain circumstances, positions held by GS Group Inc. and its affiliates (including our Investment Adviser) for client and proprietary accounts may need to be aggregated with positions held by us. In this case, where BHCA regulations impose a cap on the amount of a position that may be held, GS Group Inc. may utilize available capacity to make investments for its proprietary accounts or for the accounts of other clients, which may require us to limit and/or liquidate certain investments.
These restrictions may materially adversely affect us by affecting our Investment Adviser’s ability to pursue certain strategies within our investment program or trade in certain securities. In addition, GS Group Inc. may cease in the future to qualify as an FHC, which may subject us to additional restrictions. Moreover, we can offer no assurance that the bank regulatory requirements applicable to GS Group Inc. and us, or the interpretation thereof, will not change, or that any such change will not have a material adverse effect on us.
GS Group Inc. may in the future, in its sole discretion and without notice to investors, engage in activities impacting us and/or our Investment Adviser in order to comply with the BHCA or other legal requirements applicable to, or reduce or eliminate the impact or applicability of any bank regulations or other restrictions on, GS Group Inc., us or other accounts managed by our Investment Adviser and its affiliates. GS Group Inc. may seek to accomplish this result by causing Goldman Sachs Asset Management to resign as our Investment Adviser, voting for changes to our Board of Directors, causing Goldman Sachs personnel to resign from our Board of Directors, reducing the amount of GS Group Inc.’s investment in us (if any), revoking our right to use the Goldman Sachs name or any combination of the foregoing, or by such other means as it determines in its sole discretion. Any replacement investment adviser appointed by us may be unaffiliated with Goldman Sachs.
36
CFTC rules may have a negative impact on us and our Investment Adviser.
The CFTC and the SEC have issued final rules establishing that certain swap transactions are subject to CFTC regulation. Engaging in such swap or other commodity interest transactions such as futures contracts or options on futures contracts may cause us to fall within the definition of “commodity pool” under the Commodity Exchange Act of 1936, as amended, and related CFTC regulations. Our Investment Adviser has claimed relief from CFTC registration and regulation as a commodity pool operator pursuant to CFTC Rule 4.5 with respect to our operations, with the result that we will be limited in our ability to use futures contracts or options on futures contracts or engage in swap transactions. Specifically, CFTC Rule 4.5 imposes strict limitations on using such derivatives other than for hedging purposes, whereby the use of derivatives not used solely for hedging purposes is generally limited to situations where (i) the aggregate initial margin and premiums required to establish such positions does not exceed five percent of the liquidation value of our portfolio, after taking into account unrealized profits and unrealized losses on any such contracts it has entered into; or (ii) the aggregate net notional value of such derivatives does not exceed 100% of the liquidation value of our portfolio. Moreover, we anticipate entering into transactions involving such derivatives to a very limited extent solely for hedging purposes or otherwise within the limitations of CFTC Rule 4.5.
Our ability to enter into transactions involving derivatives and financial commitment transactions may be limited.
Rule 18f-4 under the Investment Company Act includes limitations on the ability of a BDC (or a registered investment company) to use derivatives and other transactions that create future payment or delivery obligations (including reverse repurchase agreements and similar financing transactions). Under the rule, BDCs that make significant use of derivatives are subject to a value-at-risk leverage limit, a derivatives risk management program, testing requirements, and requirements related to board reporting. These requirements apply unless the BDC qualifies as a “limited derivatives user,” as defined in Rule 18f-4. Under the rule, a BDC may enter into an unfunded commitment agreement that is not a derivatives transaction, such as an agreement to provide financing to a portfolio company, if the BDC has, among other things, a reasonable belief, at the time it enters into such an agreement, that it will have sufficient cash and cash equivalents to meet its obligations with respect to all of its unfunded commitment agreements, in each case as it becomes due. Under Rule 18f-4, when we trade reverse repurchase agreements or similar financing transactions, including certain tender option bonds, we need to aggregate the amount of indebtedness associated with the reverse repurchase agreements or similar financing transactions with the aggregate amount of any other senior securities representing indebtedness (e.g., bank borrowings, if applicable) when calculating our asset coverage ratio. We currently operate as a “limited derivatives user” and these requirements may limit our ability to use derivatives and/or enter into certain other financial contracts.
Certain investors are limited in their ability to make significant investments in us.
Private funds that are excluded from the definition of “investment company” either pursuant to Section 3(c)(1) or 3(c)(7) of the Investment Company Act and certain other unregistered investment companies are restricted from acquiring directly or through a controlled entity more than 3% of our total outstanding voting stock other than in accordance with the Investment Company Act (measured at the time of the acquisition, including through conversion of convertible securities). Investment companies registered under the Investment Company Act and BDCs are also subject to this restriction as well as other regulatory limitations that restrict the amount that they are able to invest in our securities. As a result, certain investors may be precluded from acquiring additional shares at a time that they might desire to do so.
Competition
We depend upon management personnel of our Investment Adviser for our future success.
We do not have any employees. We depend on the experience, diligence, skill and network of business contacts of Goldman Sachs Asset Management Private Credit together with other investment professionals that our Investment Adviser currently retains or may subsequently retain, to identify, evaluate, negotiate, structure, close, monitor and manage our investments. Our future success will depend to a significant extent on the continued service and coordination of our Investment Adviser’s senior investment professionals. The departure of any of our Investment Adviser’s key personnel, including members of the BDC Investment Committee, or of a significant number of the investment professionals of our Investment Adviser, could have a material adverse effect on our business, financial condition or results of operations. In addition, we cannot assure stockholders that our Investment Adviser will remain our investment adviser or that we will continue to have access to our Investment Adviser or its investment professionals. See “—Our Business and Structure—Our Investment Adviser can resign on 60 days’ notice. We may not be able to find a suitable replacement within that time, resulting in a disruption in our operations that could adversely affect our financial condition, business and results of operations.”
We operate in a highly competitive market for investment opportunities.
A number of entities, including the Accounts and other entities, compete with us to make the types of investments that we make. We compete with other BDCs, commercial and investment banks, commercial financing companies, collateralized loan obligations (“CLOs”), private funds, including hedge funds, and, to the extent they provide an alternative form of financing, private equity funds. Many of our competitors are more experienced, substantially larger and have considerably greater financial, technical and marketing resources than we do. Some competitors may have a lower cost of funds, perpetual fund lives, and/or access to funding sources that are not available to us. In addition, some of our competitors may have higher risk tolerances or different risk assessments, which could allow them to consider a wider variety of investments and establish
37
more relationships than us. Certain of our competitors are not subject to the regulatory restrictions that the Investment Company Act imposes on us as a BDC and that the Code imposes on us as a RIC. Additionally, an investment opportunity may be appropriate for one or more of us and other Accounts or any other entities managed by our Investment Adviser, and co-investment may not be possible. In such circumstances, the Investment Adviser will adhere to its investment allocation policy in order to determine the Accounts to which to allocate investment opportunities. Also, as a result of this competition, we may not be able to secure attractive investment opportunities from time to time.
We do not seek to compete primarily based on the interest rates we offer, and the Investment Adviser believes that some of our competitors may make loans with interest rates that are comparable to or lower than the rates we offer. Rather, we believe our competitive strengths include: (i) the positioning of Goldman Sachs Asset Management Private Credit within Goldman Sachs, given its associated relationship, sourcing and expertise advantages; (ii) Goldman Sachs Asset Management Private Credit’s experience and breadth as an investor; (iii) Goldman Sachs Asset Management Private Credit’s experienced team and history of investment performance; (iv) Goldman Sachs Asset Management Private Credit’s depth, breadth and duration of relationships with financial sponsors, companies, borrowers and other industry participants; and (v) the alignment of interest between the Company and the Goldman Sachs private credit platform through side-by-side investments alongside institutional and retail-focused private credit Accounts, which may include proprietary accounts of Goldman Sachs. For a further discussion of our competitive strengths, see “Item 1. Business—Competitive Advantages.”
We may lose investment opportunities if we do not match our competitors’ pricing, terms and structure. If we match our competitors’ pricing, terms and structure, we may experience decreased net interest income and increased risk of credit loss. As a result of operating in such a competitive environment, we may make investments that are on less favorable terms than what we may have originally anticipated, which may impact our return on these investments. We cannot assure investors that the competitive pressures we face will not have a material adverse effect on our business, financial condition and results of operations.
Operational
We are dependent on information systems, and systems failures, as well as operating failures, could significantly disrupt our business, which may, in turn, negatively affect our liquidity, financial condition or results of operations.
Our business is dependent on our Investment Adviser’s and third parties’ communications and information systems. Any failure or interruption of those systems, including as a result of the termination of the Investment Management Agreement or an agreement with any third-party service providers, could cause delays or other problems in our activities. Our financial, accounting, data processing, backup or other operating systems and facilities may fail to operate properly or become disabled or damaged as a result of a number of factors including events that are wholly or partially beyond our control and adversely affect our business. There could be:
In addition to our dependence on information systems, poor operating performance by our service providers could adversely impact us.
These events, in turn, could have a material adverse effect on our operating results and negatively affect the market price of our securities and our ability to pay distributions to our stockholders.
38
Cybersecurity risks and cyber incidents may adversely affect our business or the business of our portfolio companies by causing a disruption to our operations or the operations of our portfolio companies, a compromise or corruption of our confidential information or the confidential information of our portfolio companies and/or damage to our business relationships or the business relationships of our portfolio companies, all of which could negatively impact the business, financial condition and operating results of us or our portfolio companies.
Cybersecurity risks and cyber incidents have been occurring globally at a more frequent and severe level, and will likely continue to increase in frequency in the future. The occurrence of a disaster, such as a cyber incident against us, any of our portfolio companies, or against a third-party that has access to our data or networks, a natural catastrophe, an industrial accident, failure of our disaster recovery systems, or consequential employee error, could have an adverse effect on our ability to communicate or conduct business, negatively impacting our operations and financial condition. This adverse effect can become particularly acute if those events affect our electronic data processing, transmission, storage, and retrieval systems, or impact the availability, integrity, or confidentiality of our data.
We and our portfolio companies depend heavily upon computer systems to perform necessary business functions. Despite the implementation of a variety of security measures, computer systems, networks, and data, like those of other companies, could be subject to cyber incidents and unauthorized access, use, alteration, or destruction, such as from physical and electronic break-ins or unauthorized tampering. If one or more of these events occurs, it could potentially jeopardize the confidential, proprietary, and other information processed, stored in, and transmitted through our computer systems and networks, or otherwise cause interruptions or malfunctions in our operations, which could result in financial losses, litigation, regulatory penalties, client dissatisfaction or loss, reputational damage, and increased costs associated with mitigation of damages and remediation.
Third-party service providers with which we do business may also be sources of cybersecurity or other technological risk. We outsource certain functions and these relationships allow for the storage and processing of our information, as well as client, counterparty, employee, and borrower information. While we engage in actions to reduce our exposure resulting from outsourcing, ongoing threats may result in unauthorized access, loss, exposure, destruction, or other cybersecurity incidents that adversely affects our data, resulting in increased costs and other consequences as described above.
Moreover, the increased use of mobile and cloud technologies due to the proliferation of remote work resulting from the COVID-19 pandemic could heighten these and other operational risks as certain aspects of the security of such technologies may be complex and unpredictable. Reliance on mobile or cloud technology or any failure by mobile technology and cloud service providers to adequately safeguard their systems and prevent cyber incidents could disrupt our operations, the operations of a portfolio company or the operations of our or their service providers and result in misappropriation, corruption or loss of personal, confidential or proprietary information or the inability to conduct ordinary business operations. In addition, there is a risk that encryption and other protective measures may be circumvented, particularly to the extent that new computing technologies increase the speed and computing power available. Extended periods of remote working, whether by us, our portfolio companies, or our service providers, could strain technology resources, introduce operational risks and otherwise heighten the risks described above. Remote working environments may be less secure and more susceptible to hacking attacks, including phishing and social engineering attempts. Accordingly, the risks described above, are heightened under the current conditions.
Goldman Sachs and these third-party service providers have implemented processes, procedures and internal controls to help mitigate cybersecurity risks and cyber intrusions, but these measures, as well as our increased awareness of the nature and extent of a risk of a cyber incident, do not guarantee that a cyber incident will not occur and/or that our financial results, operations or confidential information will not be negatively impacted by such an incident.
In addition, cybersecurity has become a top priority for lawmakers and regulators around the world, and some jurisdictions have proposed or enacted laws requiring companies to notify regulators, individuals and the general investing public of data security breaches involving certain types of personal data, including the SEC, which, on July 26, 2023, adopted amendments requiring the public disclosure of certain cybersecurity breaches. Compliance with such laws and regulations may result in cost increases due to system changes and the development of new administrative processes. If we or our Investment Adviser or certain of its affiliates, fail to comply with the relevant and increasing laws and regulations, we could suffer financial losses, a disruption of our businesses, liability to investors, regulatory intervention or reputational damage.
Our Business and Structure
Our Investment Adviser, its principals, investment professionals and employees and the members of its BDC Investment Committee may have certain conflicts of interest.
Our Investment Adviser, its principals, affiliates, investment professionals and employees, the members of its BDC Investment Committee and our officers and directors serve and may serve in the future as investment advisers, officers, directors, principals of, or in other capacities with respect to, public or private entities (including other BDCs and other investment funds) that operate in the same or a related line of business as us. Certain of these individuals could have obligations to investors in other Accounts, the fulfillment of which is not in our best interests or the best interests of our stockholders and we expect that investment opportunities will satisfy the investment criteria for both us and such other
39
Accounts. In addition, Goldman Sachs Asset Management and its affiliates also manage other accounts, and expect to manage other vehicles or accounts in the future, that have investment mandates that are similar, in whole or in part, to ours and, accordingly, may invest in asset classes similar to those targeted by us. As a result, the Investment Adviser and/or its affiliates may face conflicts in allocating investment opportunities between us and such other entities. The fact that our investment advisory fees may be lower than those of certain other funds advised by Goldman Sachs Asset Management could result in this conflict of interest affecting us adversely relative to such other funds.
Our business and the businesses of our portfolio companies are dependent on bank relationships and recent concerns associated with the banking system may adversely impact us.
The financial markets recently experienced volatility in connection with concerns that some banks, especially small and regional banks and banks with exposure to commercial real estate, may have significant investment-related losses that might make it difficult to fund demands to withdraw deposits and other liquidity needs. Although the federal government announced measures to assist certain banks and protect depositors, some banks had already been impacted and others may be adversely impacted, by such volatility. Our business and the businesses of our portfolio companies are dependent on bank relationships. We continue to monitor the financial health of these relationships. Any further strain on the banking system may adversely impact the business, financial condition and results of operations of us and our portfolio companies.
Subject to applicable law, we may invest alongside Goldman Sachs and other Accounts.
As a result of the Relief, there could be significant overlap in our investment portfolio and the investment portfolios of other Accounts, including, in some cases, proprietary accounts of Goldman Sachs. In such circumstances, the Investment Adviser will adhere to its investment allocation policy in order to determine the Accounts to which to allocate investment opportunities. If we are unable to rely on the Relief for a particular opportunity, when our Investment Adviser identifies certain investments, it will be required to determine which Accounts should make the investment at the potential exclusion of other Accounts. Accordingly, it is possible that we may not be given the opportunity to participate in investments made by other Accounts. See “—Legal and Regulatory—Our ability to enter into transactions with our affiliates is restricted.”
Goldman Sachs’ financial and other interests may incentivize our Investment Adviser to favor other Accounts.
Our Investment Adviser receives performance-based compensation in respect of its investment management activities on our behalf, which rewards our Investment Adviser for positive performance of our investment portfolio. As a result, our Investment Adviser may make investments for us that present a greater potential for return but also a greater risk of loss or that are more speculative than would be the case in the absence of performance-based compensation. In addition, the Investment Adviser may simultaneously manage other Accounts for which the Investment Adviser may be entitled to receive greater fees or other compensation (as a percentage of performance or otherwise) than it receives in respect of us. In addition, subject to applicable law, Goldman Sachs may invest in other Accounts, and such investments may constitute all or substantial percentages of such other Accounts’ outstanding equity interests. Therefore, the Investment Adviser may have an incentive to favor such other Accounts over us. To address these types of conflicts, the Investment Adviser has adopted policies and procedures under which investment opportunities will be allocated in a manner that it believes is consistent with its obligations as an investment adviser. However, the amount, timing, structuring or terms of an investment by us may differ from, and performance may be different from, the investments and performance of other Accounts.
Our financial condition and results of operations depend on our Investment Adviser’s ability to manage our future growth effectively.
Our ability to achieve our investment objective depends on our Investment Adviser’s ability to identify, invest in and monitor companies that meet our investment criteria. Accomplishing this result on a cost-effective basis is largely a function of the structuring of our investment process and the ability of our Investment Adviser to provide competent, attentive and efficient services to us. Our executive officers and the members of the BDC Investment Committee have substantial responsibilities in connection with their roles at our Investment Adviser, with the Accounts, as well as responsibilities under the Investment Management Agreement. We may also be called upon to provide significant managerial assistance to certain of our portfolio companies. These demands on their time, which will increase as the number of investments grow, may distract them or slow the rate of investment. In order to grow, our Investment Adviser may need to hire, train, supervise, manage and retain new employees. However, we cannot assure investors that they will be able to do so effectively. Any failure to manage our future growth effectively could have a material adverse effect on our business, financial condition and results of operations.
Our ability to grow depends on our access to adequate capital.
If we do not have adequate capital available for investment, our performance could be adversely affected. In addition, we elected to be treated as a RIC, and we expect to qualify annually for tax treatment as a RIC, commencing with our taxable year ended December 31, 2013. To maintain our qualification for tax treatment as a RIC, among other requirements, we are required to timely distribute to our stockholders at least 90% of our investment company taxable income (determined without regard to the dividends paid deduction), which is generally our net ordinary income plus the excess of realized net short-term capital gains over realized net long-term capital losses, if any, for each taxable year. Consequently, such distributions will not be available to fund new investments. We expect to use debt financing and issue additional securities to fund our growth, if any. Unfavorable economic or capital market conditions may increase our funding costs, limit our access to the capital
40
markets or result in a decision by lenders not to extend credit to us. An inability to successfully access the capital markets could limit our ability to grow our business and fully execute our business strategy and could decrease our earnings, if any. We may pursue growth through acquisitions or strategic investments in new businesses. Completion and timing of any such acquisitions or strategic investments may be subject to a number of contingencies and risks. We can offer no assurance that the integration of an acquired business will be successful or that an acquired business will prove to be profitable or sustainable.
We borrow money, which may magnify the potential for gain or loss and may increase the risk of investing in us.
As part of our business strategy, we may borrow from and issue senior debt securities to banks, insurance companies and other lenders or investors. Holders of these senior securities or other credit facilities will have claims on our assets that are superior to the claims of our common stockholders. If the value of our assets decreases, leveraging would cause NAV to decline more sharply than it otherwise would have if we did not employ leverage. Similarly, any decrease in our income would cause net income to decline more sharply than it would have had we not borrowed. Such a decline could negatively affect our ability to make distributions to our common stockholders. In addition, we would have to service any additional debt that we incur, including interest expense on debt and dividends on preferred stock that we may issue, as well as the fees and costs related to the entry into or amendments to debt facilities. These expenses (which may be higher than the expenses on our current borrowings due to the rising interest rate environment) would decrease net investment income, and our ability to pay such expenses will depend largely on our financial performance and will be subject to prevailing economic conditions and competitive pressures. Moreover, leverage will increase the Management Fee payable to our Investment Adviser, which is based on our gross assets, including those assets acquired through the use of leverage but excluding cash and cash equivalents. Additionally, we will be able to incur additional leverage if we are able to obtain exemptive relief from the SEC to exclude the debt of any small business investment company (“SBIC”) subsidiary we may form in the future from the leverage requirements otherwise applicable to BDCs. We have not yet applied to the Small Business Administration for approval to form a SBIC and may decide not to do so. We can offer no assurances as to whether or when we may form a SBIC subsidiary.
In addition to having claims on our assets that are superior to the claims of our common stockholders, any obligations to the lenders may be secured by a first priority security interest in our portfolio of investments and cash. In the case of a liquidation event, those lenders would receive proceeds to the extent of their security interest before any distributions are made to our stockholders. Furthermore, our senior secured revolving credit agreement with Truist Bank (formerly known as SunTrust Bank), as administrative agent, and Bank of America, N.A., as syndication agent (as amended, the “Revolving Credit Facility”) imposes, and any credit agreement or other debt financing agreement into which we may enter may impose, financial and operating covenants that restrict our investment activities (including restrictions on industry concentrations), remedies on default and similar matters. In connection with any future borrowings, our lenders may also require us to pledge assets.
In addition, we may be unable to obtain our desired leverage, which would, in turn, affect a stockholder’s return on investment.
The following table illustrates the effect of leverage on returns from an investment in our common stock assuming various annual returns on our portfolio, net of expenses. The calculations in the table below are hypothetical, and actual returns may be higher or lower than those appearing in the table below.
Assumed Return on Our Portfolio (Net of Expenses) |
|
|
(10.00 |
)% |
|
|
(5.00 |
)% |
|
|
0.00 |
% |
|
|
5.00 |
% |
|
|
10.00 |
% |
Corresponding Return to Common Stockholder (1) |
|
|
(28.10 |
)% |
|
|
(17.09 |
)% |
|
|
(6.07 |
)% |
|
|
4.94 |
% |
|
|
15.95 |
% |
(1) |
Based on (i) $3,528.27 million in total assets including debt issuance costs as of December 31, 2023, (ii) $1,832.24 million in outstanding indebtedness as of December 31, 2023, (iii) $1,601.83 million in net assets as of December 31, 2023 and (iv) an annualized average interest rate on our indebtedness, as of December 31, 2023, excluding fees (such as fees on undrawn amounts and amortization of financing costs) of 5.31%. |
Our Investment Adviser will be paid the Management Fee even if the value of an investment in the Company declines and our Investment Adviser’s Incentive Fee may create incentives for it to make certain kinds of investments.
The Management Fee is payable even in the event the value of a stockholder’s investment declines.
The Investment Adviser receives substantial fees from us in return for its services, and these fees could influence the advice provided to us. The Management Fee is calculated as a percentage of the average value of our gross assets including borrowed funds (excluding cash or cash equivalents) at the end of the prior two completed calendar quarters. Accordingly, the Management Fee is payable regardless of whether the value of our gross assets and/or an investment in the Company has decreased during the then-current quarter and creates an incentive for the Investment Adviser to incur leverage.
The Incentive Fee payable by us to our Investment Adviser may create an incentive for our Investment Adviser to make investments on our behalf that are risky or more speculative than would be the case in the absence of such a compensation arrangement and also to incur leverage, which will tend to enhance returns where our portfolio has positive returns. Our Investment Adviser receives the Incentive Fee based, in part,
41
upon capital gains realized on our investments. As a result, our Investment Adviser may have an incentive to invest more in companies whose securities are likely to yield capital gains, as compared to income-producing securities. Such a practice could result in our investing in more speculative securities than would otherwise be the case, which could result in higher investment losses, particularly during cyclical economic downturns.
The Incentive Fee payable by us to our Investment Adviser also may create an incentive for our Investment Adviser to invest on our behalf in instruments that have a deferred interest feature. Under these investments, we accrue the interest over the life of the investment but do not receive the cash income from the investment until the end of the term. Our net investment income used to calculate the income portion of our Incentive Fee, however, includes accrued interest. Thus, a portion of this Incentive Fee is based on income that we have not yet received in cash. This risk could be increased because our Investment Adviser is not obligated to reimburse us for any Incentive Fees received even if we subsequently incur losses or never receive in cash the accrued income (including accrued income with respect to original issue discount (“OID”), payment-in-kind (“PIK”) interest and zero-coupon securities).
If we increase leverage, the management fees payable to our Investment Adviser will be higher than if we did not use leverage, irrespective of the return on the incremental assets. In addition, as leverage generally would magnify positive returns, if any, on our portfolio, as noted above, the use of leverage may cause our net investment income to exceed the quarterly hurdle rate for the Incentive Fee on income payable to our Investment Adviser at a lower average return on our portfolio.
The Incentive Fee based on income takes into account our past performance.
The Incentive Fee based on income will be determined and paid quarterly in arrears at the end of each calendar quarter by reference to our aggregate net investment income, as adjusted, from the Trailing Twelve Quarters. The effect of calculating the Incentive Fee using reference to the Trailing Twelve Quarters is that, in certain limited circumstances, an Incentive Fee based on income will be payable to our Investment Adviser although our net income for such quarter did not exceed the hurdle rate or the Incentive Fee will be higher than it would have been if calculated based on our performance for the applicable quarter without taking into account the Trailing Twelve Quarters. For example, if we experience a net loss for any particular quarter, an Incentive Fee may still be paid to our Investment Adviser if such net loss is less than the net loss for the most recent quarter that preceded the Trailing Twelve Quarters. In such circumstances, our Investment Adviser would be entitled to an Incentive Fee whereas it would not have been entitled to an Incentive Fee if calculated solely on the basis of our performance for the applicable quarter.
Potential conflicts of interest with other businesses of Goldman Sachs could impact our investment returns.
There are significant potential conflicts of interest that could negatively impact our investment returns. A number of these potential conflicts of interest with affiliates of our Investment Adviser and GS Group Inc. are discussed in more detail elsewhere in this report.
GS Group Inc. is a publicly held FHC and a leading global financial institution that provides investment banking, securities, and investment management services to a diversified client base, including companies and high-net-worth individuals, among others. As such, it acts as an investor, investment banker, research provider, investment manager, financier, adviser, market maker, trader, prime broker, derivatives dealer, lender, counterparty, agent and principal. In those and other capacities, Goldman Sachs and its affiliates advise clients in all markets and transactions and purchase, sell, hold and recommend a broad array of investments, including securities, derivatives, loans, commodities, currencies, credit default swaps, indices, baskets and other financial instruments and products for its own accounts or for the accounts of their customers, and have other direct and indirect interests, in the global fixed income, currency, commodity, equity, bank loans and other markets in which we invest or may invest. Such additional businesses and interests will likely give rise to potential conflicts of interest and may restrict the way we operate our business. For example, (1) we may not be able to conduct transactions relating to investments in portfolio companies because our Investment Adviser is not permitted to obtain or use material nonpublic information in effecting purchases and sales in public securities transactions for us or (2) Goldman Sachs, the clients it advises, and its personnel may engage (or consider engaging) in commercial arrangements or transactions with us (subject to any limitations under the law), and/or may compete for commercial arrangements or transactions in the same types of companies, assets, securities or other assets or instruments as us. Transactions by, advice to and activities of such accounts (including potentially Goldman Sachs acting on a proprietary basis), may involve the same or related companies, securities or other assets or instruments as those in which we invest and may negatively affect us (including our ability to engage in a transaction or other activities) or the prices or terms at which our transactions or other activities may be effected. For example, Goldman Sachs may be engaged to provide advice to an account that is considering entering into a transaction with us, and Goldman Sachs may advise the account not to pursue the transaction with us, or otherwise in connection with a potential transaction provide advice to the account that would be adverse to us. See “—Our Investment Adviser, its principals, investment professionals and employees and the members of its BDC Investment Committee may have certain conflicts of interest” and “—Legal and Regulatory—Our ability to enter into transactions with our affiliates is restricted.”
In addition, subject to applicable law, GS & Co. may, to the extent permitted by applicable law, including the limitations set forth in Section 57(k) of the Investment Company Act, receive compensation from us or from the borrowers if we make any investments based on opportunities that such employees or personnel of GS & Co. have referred to us. Such compensation might incentivize GS & Co. or its employees or personnel to refer opportunities or to recommend investments that might otherwise be unsuitable for us. Further, any such compensation paid by us, or
42
paid by the borrower (to which we would otherwise have been entitled) in connection with such investments, may negatively impact our returns. Furthermore, Goldman Sachs is currently, and in the future expects to be, raising capital for new public and private investment vehicles that have, or when formed will have, the primary purpose of directly originating senior secured corporate credit. These investment vehicles, as well as existing investment vehicles (including other Accounts), will compete with us for investments. Although our Investment Adviser and its affiliates will endeavor to allocate investment opportunities among its clients, including us, in a fair and equitable manner and consistent with applicable allocation procedures, it is expected that, in the future, we may not be given the opportunity to participate in investments made by other Accounts or that we may participate in such investments to a lesser extent due to participation by such other Accounts.
In addition, Goldman Sachs or another investment account or vehicle managed or controlled by Goldman Sachs or another client of the Investment Adviser may hold securities, loans or other instruments of a portfolio company in a different class or a different part of the capital structure than securities, loans or other instruments of such portfolio company held by us. As a result, Goldman Sachs or such other investment account or vehicle or such other client of the Investment Adviser may pursue or enforce rights or activities, or refrain from pursuing or enforcing rights or activities, on behalf of its own account, that could have an adverse effect on us. In addition, to the extent Goldman Sachs has invested in a portfolio company for its own account, Goldman Sachs may limit the transactions engaged in by us with respect to such portfolio company or issuer for reputational, legal, regulatory or other reasons.
Stockholders should note the matters discussed in “—Legal and Regulatory—Our ability to enter into transactions with our affiliates is restricted.”
Goldman Sachs has influence, and may continue to exert influence, over our management and affairs and over most votes requiring stockholder approval.
GS Group Inc. has owned a significant portion of our common stock since the inception of our operations. As of December 31, 2023, GS Group Inc. owned 5.9% of our outstanding common stock. GS & Co., a wholly owned subsidiary of GS Group Inc., has acquired shares of our common stock pursuant to a 10b5-1 plan, and may in the future acquire additional shares of our common stock in the open market, but GS & Co. will limit its collective ownership with GS Group Inc. to below 25.0% of our outstanding common stock. Therefore, GS Group Inc. is able to exert, and may be able to continue to exert, influence over our management and policies and have significant voting influence on most votes requiring stockholder approval. This concentration of ownership may also have the effect of delaying, preventing or deterring a change of control of us, could deprive our stockholders of an opportunity to receive a premium for their common stock as part of a sale of us and might ultimately affect the market price of our common stock. Our Investment Adviser has the authority to vote securities held by GS Group Inc., including on matters that may present a conflict of interest between our Investment Adviser and other stockholders.
Our Board of Directors may change our investment objective, operating policies and strategies without prior notice or stockholder approval.
Our Board of Directors has the authority to modify or waive certain of our operating policies and strategies without prior notice (except as required by the Investment Company Act or other applicable laws) and without stockholder approval. However, absent stockholder approval, we may not change the nature of our business so as to cease to be, or withdraw our election as, a BDC. We cannot predict the effect any changes to our current operating policies and strategies would have on our business, operating results and market price of our securities. Nevertheless, the effects may adversely affect our business and impact our ability to make distributions or make payments with respect to our indebtedness.
Our Investment Adviser can resign on 60 days’ notice. We may not be able to find a suitable replacement within that time, resulting in a disruption in our operations that could adversely affect our financial condition, business and results of operations.
Our Investment Adviser has the right, under the Investment Management Agreement, to resign at any time upon 60 days’ written notice, regardless of whether we have found a replacement. If our Investment Adviser resigns, we may not be able to find a new external investment adviser or hire internal management with similar expertise and ability to provide the same or equivalent services on acceptable terms within 60 days, or at all. If we are unable to do so quickly, our operations are likely to experience a disruption, our financial condition, business and results of operations as well as our ability to pay distributions are likely to be adversely affected, and the market price of our securities may decline.
Our Investment Adviser’s responsibilities and its liability to us are limited under the Investment Management Agreement, which may lead our Investment Adviser to act in a riskier manner on our behalf than it would when acting for its own account.
Our Investment Adviser has not assumed any responsibility to us other than to render the services described in the Investment Management Agreement, and it will not be responsible for any action of our Board of Directors in declining to follow our Investment Adviser’s advice or recommendations. Pursuant to the Investment Management Agreement, our Investment Adviser and its directors, members, stockholders, partners, officers, employees or controlling persons will not be liable to us for its acts under the Investment Management Agreement, absent willful misfeasance, bad faith or gross negligence in the performance of its duties, or by reason of its reckless disregard of its obligations and duties under the Investment Management Agreement. These protections may lead our Investment Adviser to act in a riskier manner when acting on our behalf than it would when acting for its own account. See “—Our Investment Adviser will be paid the Management Fee even if the value
43
of an investment in the Company declines and our Investment Adviser’s Incentive Fee may create incentives for it to make certain kinds of investments.”
We may experience fluctuations in our quarterly results.
We could experience fluctuations in our quarterly operating results due to a number of factors, including interest rates payable on debt investments we make, default rates on such investments, the level of our expenses, variations in and the timing of the recognition of realized and unrealized gains or losses, the degree to which we encounter competition in certain markets and general economic conditions. As a result of these factors, results for any period should not be relied upon as being indicative of performance in future periods or the full fiscal year.
We are subject to risks related to corporate social responsibility.
Our business faces increasing public scrutiny related to ESG activities, which are increasingly considered to contribute to the long-term sustainability of a company’s performance. A variety of organizations measure the performance of companies on ESG topics, and the results of these assessments are widely publicized. In addition, investment in funds that specialize in companies that perform well in such assessments are increasingly popular, and major institutional investors have publicly emphasized the importance of such ESG measures to their investment decisions.
Our brand and reputation may be negatively impacted if we fail to act responsibly (or are perceived to have failed to act responsibly) in a number of areas, such as considering ESG factors in our investment processes. Adverse incidents with respect to ESG activities could impact the value of our brand and our relationships with investors, which could adversely affect our business and results of operations.
At the same time, there are various approaches to responsible investing activities and divergent views on the consideration of ESG topics. These differing views increase the risk that any action or lack thereof with respect to our Investment Adviser’s consideration of responsible investing or ESG-related practices will be perceived negatively. “Anti-ESG” sentiment has gained momentum across the U.S., with several states having enacted or proposed “anti-ESG” policies, legislation or issued related legal opinions. If investors subject to such legislation view our responsible investing or ESG practices as being in contradiction of such “anti-ESG” policies, legislation or legal opinions, such investors may not invest in us. Further, asset managers have been subject to recent scrutiny related to ESG-focused industry working groups, initiatives and associations, including organizations advancing action to address climate change or climate-related risk. Such scrutiny could expose the Investment Adviser to the risk of antitrust investigations or challenges by federal authorities, result in reputational harm and discourage certain investors from investing in us. In addition, some groups and state attorneys general have asserted that the U.S. Supreme Court’s decision striking down race-based affirmative action in higher education in June 2023 should be analogized to private employment matters and private contract matters. Several new cases alleging discrimination based on similar arguments have been filed since that decision, with scrutiny of certain corporate diversity, equity and inclusion practices increasing. If the Investment Adviser does not successfully manage expectations across these varied interests, it could erode trust, impact our and their reputation, and constrain our investment and fundraising opportunities.
Additionally, new state-level, federal and international regulatory initiatives related to ESG could adversely affect our business. The SEC has proposed rules that, in addition to other matters, would establish a framework for reporting of climate-related risks. There is also a risk that a significant reorientation in the market following the implementation of these and further measures could be adverse to our portfolio companies if they are perceived to be less valuable as a consequence of, for example, their carbon footprint or “greenwashing” (i.e., the holding out of a product as having green or sustainable characteristics where this is not, in fact, the case). We are, and our portfolio companies may be, or could in the future become subject to the risk that similar measures might be introduced in other jurisdictions in the future. At this time, there is uncertainty regarding the scope of such proposals or when they would become effective (if at all). Compliance with any new laws or regulations increases our regulatory burden and could make compliance more difficult and expensive, affect the manner in which we or our portfolio companies conduct our businesses and adversely affect our profitability.
The effect of global climate change may impact the operations of our portfolio companies.
There may be evidence of global climate change. Climate change creates physical and financial risk and some of our portfolio companies may be adversely affected by climate change. For example, the needs of customers of energy companies vary with weather conditions, primarily temperature and humidity. To the extent weather conditions are affected by climate change, energy use could increase or decrease depending on the duration and magnitude of any changes. Increases in the cost of energy could adversely affect the cost of operations of our portfolio companies if the use of energy products or services is material to their business. A decrease in energy use due to weather changes may affect the financial condition of some of our portfolio companies through, for example, decreased revenues. Extreme weather conditions in general require more system backup, adding to costs, and can contribute to increased system stresses, including service interruptions.
44
Our Investments
Our investments are very risky and highly speculative.
We invest primarily through direct originations of secured debt, including first lien, unitranche, and last-out portions of such loans; second-lien debt; unsecured debt, including mezzanine debt; and select equity investments. The securities in which we invest typically are not rated by any rating agency, and if they were rated, they would be below investment grade (rated lower than “Baa3” by Moody’s Investors Service, Inc. and lower than “BBB-” by Fitch Ratings or Standard & Poor’s Ratings Services). These securities, which may be referred to as “junk bonds,” “high yield bonds” or “leveraged loans,” have predominantly speculative characteristics with respect to the issuer’s capacity to pay interest and repay principal.
In addition, we may also originate “covenant-lite” loans, which are loans with fewer financial maintenance covenants than other obligations, or no financial maintenance covenants. Such covenant-lite loans may not include terms that allow the lender to monitor the performance of the borrower or to declare a default if certain criteria are breached. These flexible covenants (or the absence of covenants) could permit borrowers to experience a significant downturn in their results of operations without triggering any default that would permit holders of their debt (such as the Company) to accelerate indebtedness or negotiate terms and pricing. Accordingly, to the extent we invest in “covenant-lite” loans, we may have fewer rights against a borrower and may have a greater risk of loss on such investments as compared to investments in or exposure to loans with financial maintenance covenants. Therefore, our investments may result in an above-average amount of risk and volatility or loss of principal. We also may invest in other assets, including U.S. government securities and structured securities. These investments entail additional risks that could adversely affect our investment returns.
Secured Debt. When we make a secured debt investment, we generally take a security interest in the available assets of the portfolio company, including the equity interests of any subsidiaries, which we expect to help mitigate the risk that we will not be repaid. However, there is a risk that the collateral securing our debt investment may decrease in value over time, may be difficult to sell in a timely manner, may be difficult to appraise and may fluctuate in value based upon the success of the business and market conditions, including as a result of the inability of the portfolio company to raise additional capital. In some circumstances, our lien could be subordinated to claims of other creditors, such as trade creditors. In addition, deterioration in a portfolio company’s financial condition and prospects, including its inability to raise additional capital, may be accompanied by deterioration in the value of the collateral for the debt investment. Consequently, the fact that our debt is secured does not guarantee that we will receive principal and interest payments according to the debt investment’s terms, or at all, or that we will be able to collect on the loan, in full or at all, should we enforce our remedies.
Unsecured Debt, including Mezzanine Debt. Our unsecured debt investments, including mezzanine debt investments, generally will be subordinated to senior debt in the event of an insolvency. This may result in an above average amount of risk and loss of principal.
Revolving Credit Facilities. From time to time, we may acquire or originate revolving credit facilities in connection with our investments in other assets, which may result in our holding unemployed funds, negatively impacting our returns.
Equity Investments. When we invest in secured debt or unsecured debt, including mezzanine debt, we may acquire equity securities from the company in which we make the investment. In addition, we may invest in the equity securities of portfolio companies independent of any debt investment. Our goal is ultimately to dispose of such equity interests and realize gains upon our disposition of such interests. However, the equity interests we hold may not appreciate in value and, in fact, may decline in value. Accordingly, we may not be able to realize gains from our equity interests, and any gains that we do realize on the disposition of any equity interests may not be sufficient to offset any other losses we experience.
Investing in middle-market companies involves a number of significant risks.
Investing in middle-market companies involves a number of significant risks, including:
45
We have exposure to credit risk and other risks related to credit investments.
Our investments are subject to liquidity, market value, credit, interest rate and certain other risks. In addition, we cannot assure you that the Investment Adviser will correctly evaluate the nature and magnitude of the various factors that could affect the value and return of our investments. These risks could be exacerbated to the extent that the portfolio is concentrated in one or more particular types of investments or industry sectors or regions.
Prices of our investments may be volatile and may fluctuate as a result of a variety of factors that are inherently difficult to predict, including changes in interest rates, prevailing credit spreads, general economic conditions, financial market conditions, domestic and international economic or political events, developments or trends in any particular industry, and the financial condition of the issuers or obligors of the investments. Investments that become non-performing, or defaulted loans or securities may become subject to a workout negotiation or restructuring. This may entail a substantial reduction in the interest rate, a substantial write-down of principal, and a substantial change in the terms, conditions and covenants of these investments. To the extent that defaulted investments are sold, it is unlikely that the sale proceeds will be equal to the amount of unpaid principal and interest thereon. In addition, we may incur additional expenses to the extent we are required to seek recovery upon a default or to participate in the restructuring of a non-performing or defaulted investment. We can offer no assurance as to the levels of defaults and/or recoveries that may be experienced on the investments.
Secured investments may also be subject to the risk that the security interests granted by the portfolio company obligors in the underlying collateral are not properly or fully perfected in favor of lenders (or their agents). Compounding these risks, the collateral securing the secured investments may be subject to casualty, impairment or devaluation risks.
Portfolio companies may also be permitted to issue additional indebtedness that would increase the overall leverage and fixed charges to which the portfolio companies are subject. Such additional indebtedness could have structural or contractual priority, either as to specific assets or generally, over the ranking of the investments held by us or could rank on a parity or seniority basis with respect to our investments. In the event of any default, restructuring or insolvency event of a portfolio company, we could be subordinated to, or be required to share on a ratable basis with, any recoveries in favor of the holders of such other or additional indebtedness. Our recoveries may be impaired as a result of the rights of holders of other indebtedness under any intercreditor agreement governing the relative rights of the indebtedness.
Our debt investments may also have no amortization and limited interim repayment requirements, which may increase the risk that a portfolio company will not be able to repay or refinance the debt investment when it comes due at its final stated maturity.
Inflation may adversely affect the business, results of operations and financial condition of our portfolio companies.
Certain of our portfolio companies may be impacted by inflation. Although the U.S. inflation rate has decreased in the fourth quarter of 2023, it remains well above historical levels over the past several decades. Inflationary pressures in the past few years increased the costs of labor, energy and raw materials and adversely affected consumer spending, economic growth and our portfolio companies’ operations. Certain of our portfolio companies may be in industries that have been, or may be, affected by inflation. If such portfolio companies are unable to pass any increases in their costs along to their customers, it could adversely affect their results and impact their ability to pay interest and principal on our loans. In addition, any projected future decreases in our portfolio companies’ operating results due to inflation could adversely impact the fair value of those investments. Any decreases in the fair value of our investments could result in unrealized losses and therefore reduce our net assets resulting from operations.
While the United States and other developed economies have experienced higher-than-normal inflation rates in the past few years, it remains uncertain whether elevated inflation will continue or have a significant effect on the U.S. economy or other economies. Inflation may affect our investments adversely in a number of ways, including those noted above. During periods of rising inflation, interest and dividend rates of
46
any instruments we or our portfolio companies may have issued could increase, which would tend to reduce returns to our investors. Inflationary expectations or periods of rising inflation could also be accompanied by the rising prices of commodities that are critical to the operation of portfolio companies as noted above. Portfolio companies may have fixed income streams and, therefore, be unable to pay their debts when they become due. The market value of such investments may decline in value in times of higher inflation rates. Some of our portfolio investments may have income linked to inflation through contractual rights or other means. However, as inflation may affect both income and expenses, any increase in income may not be sufficient to cover increases in expenses. Governmental efforts to curb inflation, such as recent increases to short-term interest rates by central banks, including the Federal Reserve, often have negative effects on the level of economic activity and may increase the risk that the economy enters a recession. In an attempt to stabilize inflation, certain countries have imposed wage and price controls at times. Past governmental efforts to curb inflation have also involved more drastic economic measures that have had a materially adverse effect on the level of economic activity in the countries where such measures were employed. We can offer no assurance that continued inflation in the United States and/or other economies will not become a serious problem in the future and have a material adverse impact on us.
We are exposed to risks associated with changes in interest rates.
Debt investments that we make may be based on floating rates, such as SOFR (as defined below), the Euro Interbank Offered Rate, the Federal Funds Rate or the Prime Rate. General interest rate fluctuations may have a substantial negative impact on our investments, the value of our securities and our rate of return on invested capital. Historically, the London Inter-Bank Offered Rate (“LIBOR”) was the basic rate of interest used in lending transactions between banks on the London interbank market and was widely used as a reference for setting the interest rate on loans globally. In July 2017, the Financial Conduct Authority announced its intention to cease sustaining the LIBOR by the end of 2021, and as of June 30, 2023, ceased to publish all remaining USD LIBOR settings. Recently the ICE Benchmark Administration further announced that it will publish “synthetic” USD LIBOR rates until September 2024. It is not yet known how synthetic LIBOR will be incorporated into credit facilities, if at all.
In April 2018, the Federal Reserve Bank of New York began publishing its alternative rate, the Secured Overnight Financing Rate (“SOFR”). The Bank of England followed suit in April 2018 by publishing its proposed alternative rate, the Sterling Overnight Index Average (“SONIA”). Each of SOFR and SONIA significantly differ from LIBOR in how each rate is calculated and potentially in the actual rate as well. Since January 1, 2022, our new investments are generally indexed to SOFR. As of December 31, 2023, we have transitioned our investments and our Revolving Credit Facility to SOFR or to alternative risk-free reference rates. We expect that, going forward, our new USD-denominated investments will be indexed to SOFR, absent a significant market shift away from such rate as an accepted benchmark.
A reduction in the interest rates on new investments relative to interest rates on current investments could also have an adverse impact on our net interest income. However, an increase in interest rates could decrease the value of any investments we hold which earn fixed interest rates, including subordinated loans, senior and junior secured and unsecured debt securities and loans and high yield bonds, and also could increase our interest expense, thereby decreasing our net income (as more fully described below). Also, an increase in interest rates available to investors could make an investment in our common stock less attractive if we are not able to increase our dividend rate, which could reduce the value of our common stock.
In addition, in 2022 and 2023, the Federal Reserve raised short-term interest rates but has recently indicated that it may cease further increases to interest rates or may decrease interest rates. However, there can be no assurance that the Federal Reserve will not make additional upwards adjustments to the federal funds rate in the future to mitigate inflationary pressures. Changing interest rates may have unpredictable effects on markets, may result in heightened market volatility and may detract from our performance to the extent we are exposed to such interest rates and/or volatility. In periods of rising interest rates, to the extent we borrow money subject to a floating interest rate, our cost of funds would increase, which could reduce our net investment income. Similarly, rising interest rates could also reduce the yield on our investments if such increases on our borrowings exceed any rise in the rate that our investments yield (including any floating rate investments or investments subject to specified minimum interest rates (such as a SOFR floor)).
If general interest rates rise, there is a risk that the portfolio companies in which we hold floating rate securities or loans will be unable to pay escalating interest amounts, which could result in a default under their notes or loan documents with us. Rising interest rates could also cause portfolio companies to shift cash from other productive uses to the payment of interest, which may have a material adverse effect on their business and operations and could, over time, lead to increased defaults. In addition, rising interest rates may increase pressure on us to provide fixed rate loans to our portfolio companies, which could adversely affect our net investment income, as increases in our cost of borrowed funds would not be accompanied by increased interest income from such fixed-rate investments.
If general interest rates were to decline, borrowers may refinance their loans at lower interest rates, which could shorten the average life of the loans and reduce the associated returns on the investment, as well as require our Investment Adviser to incur management time and expense to re-deploy such proceeds, including on terms that may not be as favorable as our existing investments.
A change in the general level of interest rates can be expected to lead to a change in the interest rates we receive on many of our debt investments. Accordingly, a change in the interest rate could make it easier for us to meet or exceed the performance threshold in the Investment Management
47
Agreement and may result in a substantial increase in the amount of incentive fees payable to our Investment Adviser with respect to the portion of the Incentive Fee based on income.
Many of our portfolio securities do not have a readily available market price, and we value these securities at fair value as determined in good faith in accordance with the Investment Company Act, which valuation is inherently subjective and may not reflect what we may actually realize for the sale of the investment.
The majority of our investments are, and are expected to continue to be, in debt instruments that do not have readily ascertainable market prices. The fair value of assets that are not publicly traded or whose market prices are not readily available are determined in good faith under procedures adopted by the Investment Adviser, as the valuation designee. As the valuation designee, the Investment Adviser is primarily responsible for the valuation of our assets, subject to the oversight of the Board, in accordance with Rule 2a-5 under the Investment Company Act. As the valuation designee, the Investment Adviser utilizes the services of independent third-party valuation firms (“Independent Valuation Advisors”) engaged by us in determining the fair value of a portion of the securities in our portfolio. Investment professionals from our Investment Adviser also recommend portfolio company valuations using sources and/or proprietary models depending on the availability of information on our assets and the type of asset being valued, all in accordance with our valuation policy. The participation of our Investment Adviser in our valuation process could result in a conflict of interest, as the Management Fee is based in part on our gross assets and also because our Investment Adviser is receiving a performance-based Incentive Fee.
In addition, the Investment Adviser may value an identical asset differently than Goldman Sachs, another division or unit within Goldman Sachs, or another Account values the asset, including because Goldman Sachs, or such other division, or unit, or Account has information or uses valuation techniques and models that it does not share with, or that are different from those of the Investment Adviser or from us. These valuation differences for the same asset can result in significant differences in the treatment of such asset by the Investment Adviser, Goldman Sachs, and other divisions or units of Goldman Sachs, and/or among Accounts (for example, with respect to an asset that is a loan, there can be differences when it is determined that such loan is deemed to be on nonaccrual status and/or in default). See “—Potential conflicts of interest with other businesses of Goldman Sachs could impact our investment returns.”
Because fair valuations, and particularly fair valuations of private securities and private companies, are inherently uncertain, may fluctuate over short periods of time and are often based to a large extent on estimates, comparisons and qualitative evaluations of private information, it may be more difficult for investors to value accurately our investments and could lead to undervaluation or overvaluation of our common stock. In addition, the valuation of these types of securities may result in substantial write-downs and earnings volatility.
Rule 2a-5 under the Investment Company Act establishes a regulatory framework for determining fair value in good faith for purposes of the Investment Company Act and permits boards, subject to board oversight and certain other conditions, to designate certain parties to perform the fair value determinations. In accordance with this rule and as discussed above, our Board of Directors has designated our Investment Adviser as the valuation designee primarily responsible for the valuation of our assets, subject to the oversight of the Board of Directors, and we are in compliance with Rule 2a-5.
Our NAV as of a particular date may be materially greater than or less than the value that would be realized if our assets were to be liquidated as of such date. For example, if we were required to sell a certain asset or all or a substantial portion of our assets on a particular date, the actual price that we would realize upon the disposition of such asset or assets could be materially less than the value of such asset or assets as reflected in our NAV. Volatile market conditions could also cause reduced liquidity in the market for certain assets, which could result in liquidation values that are materially less than the values of such assets as reflected in our NAV.
The lack of liquidity in our investments may adversely affect our business.
Various restrictions render our investments relatively illiquid, which may adversely affect our business. As we generally make investments in private companies, substantially all of these investments are subject to legal and other restrictions on resale or are otherwise less liquid than publicly traded securities. Our Investment Adviser is not permitted to obtain or use material non-public information in effecting purchases and sales in public securities transactions for us, which could create an additional limitation on the liquidity of our investments. The illiquidity of our investments may make it difficult for us to sell such investments if the need arises. Therefore, if we are required to or desire to liquidate all or a portion of our portfolio quickly, we could realize significantly less than the value at which we have recorded our investments or could be unable to dispose of our investments in a timely manner or at such times as we deem advisable.
Our portfolio may be focused in a limited number of portfolio companies, which will subject us to a risk of significant loss if any of these companies defaults on its obligations under any of its debt instruments or if there is a downturn in a particular industry.
We are classified as a non-diversified investment company within the meaning of the Investment Company Act, which means that we are not limited by the Investment Company Act with respect to the proportion of our assets that we may invest in securities of a single issuer, excluding limitations on investments in certain other financial and investment companies. To the extent that we assume large positions in the securities of a small number of issuers or industries, our NAV may fluctuate to a greater extent than that of a diversified investment company as a result of changes in the financial condition or the market’s assessment of the issuer. We may also be more susceptible to any single economic or
48
regulatory occurrence than a diversified investment company. In addition, the aggregate returns we realize may be significantly adversely affected if a small number of investments perform poorly or if we need to write down the value of any one investment. Additionally, a downturn in any particular industry in which we are invested could significantly affect our aggregate returns. Further, any industry in which we are meaningfully concentrated at any given time could be subject to significant risks that could adversely impact our aggregate returns.
For example, as of December 31, 2023, Health Care Providers & Services, together with Health Care Technology and Health Care Equipment & Supplies, represented 23.2% of our portfolio at fair value. Our investments in Health Care Providers & Services, Health Care Technology and Health Care Equipment & Supplies are subject to substantial risks, including, but not limited to, the risk that the laws and regulations governing the business of health care companies, and interpretations thereof, may change frequently. Current or future laws and regulations could force our portfolio companies engaged in health care, to change their policies related to how they operate, restrict revenue, change costs, change reserve levels and change business practices. In addition, as of December 31, 2023, Software represented 17.4% of our portfolio at fair value. Our investments in Software are subject to substantial risks, including, but not limited to, intense competition, changing technology, shifting user needs, frequent introductions of new products and services, competitors in different industries and ranging from large established companies to emerging startups, decreasing average selling prices of products and services resulting from rapid technological changes, cybersecurity risks and cyber incidents and various legal and regulatory risks.
We may not be in a position to exercise control over our portfolio companies or to prevent decisions by management of our portfolio companies that could decrease the value of our investments.
We do not generally hold controlling equity positions in our portfolio companies. While we are obligated as a BDC to offer to make managerial assistance available to our portfolio companies, we can offer no assurance that management personnel of our portfolio companies will accept or rely on such assistance. To the extent that we do not hold a controlling equity interest in a portfolio company, we are subject to the risk that such portfolio company may make business decisions with which we disagree, and the stockholders and management of such portfolio company may take risks or otherwise act in ways that are adverse to our interests. Due to the lack of liquidity for the debt and equity investments that we typically hold in our portfolio companies, we may not be able to dispose of our investments in the event we disagree with the actions of a portfolio company and may therefore suffer a decrease in the value of our investments.
In addition, we may not be in a position to control any portfolio company by investing in its debt securities. As a result, we are subject to the risk that a portfolio company in which we invest may make business decisions with which we disagree and the management of such company, as representatives of the holders of their common equity, may take risks or otherwise act in ways that do not serve our interests as debt investors.
We may be subject to risks associated with subordinated debt.
We may acquire and/or originate junior lien or subordinated debt investments. If a borrower defaults on a junior lien or subordinated loan or on debt senior in right of payment or as to the proceeds of collateral to our debt investment, or in the event of the bankruptcy of a borrower, the debt investment will be satisfied only after, in the case of junior lien debt, the proceeds of collateral are applied to repay senior lien debt or, in the case of subordinated debt, the senior debt is repaid in full. Under the terms of typical intercreditor or subordination agreements, senior creditors may be able to block the exercise of remedies or the acceleration of the subordinated debt or the exercise by holders of junior lien or subordinated debt of other rights they may have as creditors or in respect of collateral. Accordingly, we may not be able to take the steps necessary or sufficient to protect our investments in a timely manner or at all. In addition, junior lien or subordinated debt may not always be protected by financial covenants or limitations upon additional indebtedness, may have limited liquidity and may not be rated by a credit rating agency. If a borrower declares bankruptcy, we may not have full or any recourse to the assets of the borrower, or the assets of the borrower may not be sufficient to satisfy the loan. Further, the Investment Adviser’s ability to amend the terms of our loans, assign its loans, accept prepayments, exercise its remedies and control decisions made in bankruptcy proceedings may be limited by intercreditor arrangements. In addition, the risks associated with junior lien or subordinated debt include a greater possibility that adverse changes in the financial condition of the obligor or in general economic conditions (including a sustained period of rising interest rates or an economic downturn) may adversely affect the borrower’s ability to pay principal and interest on its debt. Many obligors on junior lien or subordinated loan securities are highly leveraged, and specific developments affecting such obligors, including reduced cash flow from operations or the inability to refinance debt at maturity, may also adversely affect such obligors’ ability to meet debt service obligations. The level of risk associated with investments in subordinated debt increases if such investments are debt of distressed or below investment grade issuers. Default rates for junior lien or subordinated debt securities have historically been higher than has been the case for investment grade securities.
We may be subject to risks associated with unsecured debt.
We may invest in unsecured indebtedness in portfolio companies where a significant portion of such companies’ senior or junior lien indebtedness may be secured. In such situations, our ability to influence such portfolio company’s affairs, especially during periods of financial distress or following an insolvency, is likely to be substantially less than that of senior or junior lien creditors.
49
We may be subject to risks arising from revolving credit facilities.
We acquire or originate revolving credit facilities from time to time in connection with our investments in other assets, including term loans. A revolving credit facility is a line of credit in which the borrower pays the lender a commitment fee during a commitment period and is then allowed to draw from the line of credit from time to time until the end of such commitment period. The borrower of a revolving credit facility is typically permitted to draw thereunder for any reason, including to fund its operational requirements, to make acquisitions or to reserve cash, so long as certain customary conditions are met. Outstanding drawdowns under such revolving credit facilities can therefore fluctuate on a day-to-day basis, which may generate operational and other costs for us. If the borrower of a revolving credit facility draws down on the facility, we would be obligated to fund the amounts due.
We can offer no assurance that a borrower of a revolving credit facility will fully draw down its available credit thereunder, and in many cases a borrower with sufficient liquidity may forego drawing down its available credit thereunder in favor of obtaining other liquidity sources. As a result, we are likely to hold unemployed funds, and investments in revolving credit facilities may therefore adversely affect our returns.
We may be subject to risks arising from purchases of secondary debt.
We may invest in secondary loans and secondary debt securities. We are unlikely to be able to negotiate the terms of secondary debt as part of its acquisition and, as a result, these investments likely will not include some of the covenants and protections we may generally seek. Even if such covenants and protections are included in the investments, the terms of the investments may provide portfolio companies substantial flexibility in determining compliance with such covenants. In addition, the terms on which secondary debt is traded may represent a combination of the general state of the market for such investments and either favorable or unfavorable assessments of particular investments by the sellers thereof.
We may be subject to risks arising from assignments and participations.
We may acquire investments directly (by way of assignment) or indirectly (by way of participation). As described in more detail below, holders of participation interests are subject to additional risks not applicable to a holder of a direct interest in a debt obligation.
The purchaser of an assignment of a debt obligation typically succeeds to all the rights and obligations of the selling institution and becomes a party to the applicable documentation relating to the debt obligation. In contrast, participations acquired by us in a portion of a debt obligation held by a seller typically result in a contractual relationship only with such seller, not with the obligor. We would have the right to receive payments of principal, interest and any fees to which it is entitled under the participation only from the seller and only upon receipt by the seller of such payments from the obligor. In purchasing a participation, we generally will have neither the right to enforce compliance by the obligor with the terms of the documentation relating to the debt obligation nor any rights of set-off against the obligor, and we may not directly benefit from the collateral supporting the debt obligation in which it has purchased the participation. As a result, we will assume the credit risk of both the obligor and the seller, which will remain the legal owner of record of the applicable debt obligation. In the event of the insolvency of the seller, we may be treated as a general creditor of the seller in respect of the participation, may not benefit from any set-off exercised by the seller against the obligor and may be subject to any set-off exercised by the obligor against the seller. In addition, we may purchase a participation from a seller that does not itself retain any portion of the applicable debt obligation and, therefore, may have limited interest in monitoring the terms of the documentation relating to such debt obligation and the continuing creditworthiness of the borrower.
In addition, when we hold a participation in a debt obligation, we may not have the right to vote to waive enforcement of any default by an obligor. Sellers commonly reserve the right to administer the debt obligations sold by them as they see fit and to amend the documentation relating to such debt obligations in all respects. A seller may have interests different from ours, and the seller might not consider our interests when taking actions with respect to the debt obligation underlying the participation. In addition, some participation agreements that provide voting rights to the participant further provide that if the participant does not vote in favor of amendments, modifications or waivers to the documentation relating to the debt obligation, the seller may repurchase such participation at par. Assignments and participations are typically sold strictly without recourse to the seller thereof, and the seller will generally make no representations or warranties about the underlying debt obligation, the borrowers, the documentation relating to the debt obligations or any collateral securing the debt obligations.
We may have difficulty sourcing investment opportunities.
We cannot assure investors that we will be able to identify a sufficient number of suitable investment opportunities to allow us to deploy the capital available to us. Privately negotiated investments in loans and illiquid securities of private companies require substantial due diligence and structuring, and we cannot assure investors that we will achieve our anticipated investment pace. Our Investment Adviser will select our investments, and our stockholders will have no input with respect to such investment decisions. These factors increase the uncertainty, and thus the risk, of investing in our common stock. To the extent we are unable to deploy all investments, our investment income and, in turn, our results of operations, will likely be materially adversely affected.
50
Our failure or inability to make follow-on investments in our portfolio companies could impair the value of our portfolio.
Following an initial investment in a portfolio company, we may make additional investments in that portfolio company as “follow-on” investments, in order to:
We may elect not to, or be unable to, make follow-on investments or may lack sufficient funds to make those investments.
We will have the discretion to make any follow-on investments, subject to the availability of capital resources and applicable law. The failure to make, or inability to make, follow-on investments may, in some circumstances, jeopardize the continued viability of a portfolio company and our initial investment, or may result in a missed opportunity for us to increase our participation in a successful operation. Even if we have sufficient capital to make a desired follow-on investment, we may elect not to make a follow-on investment because we may not want to increase our concentration of risk, because we prefer other opportunities or because we are inhibited by compliance with BDC requirements, including the conditions of the Relief, compliance with covenants contained in the agreements governing our indebtedness or compliance with the requirements for maintenance of our qualification for tax treatment as a RIC.
Our portfolio companies may prepay loans, which may reduce stated yields in the future if the capital returned cannot be invested in transactions with equal or greater expected yields.
Certain of the loans we make are prepayable at any time, with some prepayable at no premium to par. We cannot predict when such loans may be prepaid. Whether a loan is prepaid will depend both on the continued positive performance of the portfolio company and the existence of favorable financing market conditions that permit such portfolio company to replace existing financing with less expensive capital. In periods of rising interest rates, the risk of prepayment of floating rate loans may increase if other financing sources are available. As market conditions change frequently, it is unknown when, and if, this may be possible for each portfolio company. In the case of some of these loans, having the loan prepaid early may reduce the achievable yield for us in the future below the current yield disclosed for our portfolio if the capital returned cannot be invested in transactions with equal or greater expected yields.
Investments in common and preferred equity securities, many of which are illiquid with no readily available market, involve a substantial degree of risk.
Although common stock has historically generated higher average total returns than fixed income securities over the long term, common stock also has experienced significantly more volatility in those returns. Our equity investments may fail to appreciate and may decline in value or become worthless, and our ability to recover our investment will depend on our portfolio company’s success. Investments in equity securities involve a number of significant risks, including:
Even if the portfolio company is successful, our ability to realize the value of our investment may depend on the occurrence of a liquidity event, such as a public offering or the sale of the portfolio company. It is likely to take a significant amount of time before a liquidity event occurs or we can otherwise sell our investment. In addition, the equity securities we receive or invest in may be subject to restrictions on resale during periods in which it could be advantageous to sell them.
There are special risks associated with investing in preferred securities, including:
51
Additionally, when we invest in debt securities, we may acquire warrants or other equity securities as well. Our goal is ultimately to dispose of such equity interests and realize gains upon our disposition of such interests. However, the equity interests we receive may not appreciate in value and, in fact, may decline in value. Accordingly, we may not be able to realize gains from our equity interests and any gains that we do realize on the disposition of any equity interests may not be sufficient to offset any other losses we experience.
We may invest, to the extent permitted by law, in the equity securities of investment funds that are operating pursuant to certain exceptions to the Investment Company Act. To the extent we so invest, we will bear our ratable share of any such company’s expenses, including management and performance fees. We will also remain obligated to pay the Management Fee and Incentive Fee to our Investment Adviser with respect to the assets invested in the securities and instruments of such companies. With respect to each of these investments, each of our common stockholders will bear his or her share of the Management Fee and Incentive Fee due to our Investment Adviser as well as indirectly bearing the management and performance fees and other expenses of any such investment funds or advisers.
By originating loans to companies that are experiencing significant financial or business difficulties, we may be exposed to distressed lending risks.
As part of our lending activities, we may originate loans to companies that are experiencing significant financial or business difficulties, including companies involved in bankruptcy or other reorganization and liquidation proceedings. Although the terms of such financing may result in significant financial returns to us, they involve a substantial degree of risk. The level of analytical sophistication, both financial and legal, necessary for successful financing to companies experiencing significant business and financial difficulties is unusually high. There is no assurance that we will correctly evaluate the value of the assets collateralizing our loans or the prospects for a successful reorganization or similar action. In any reorganization or liquidation proceeding relating to a company that we fund, we may lose all or part of the amounts advanced to the borrower or may be required to accept collateral with a value less than the amount of the loan advanced by us to the borrower.
We may be exposed to special risks associated with bankruptcy cases.
Many of the events within a bankruptcy case are adversarial and often beyond the control of the creditors. While creditors generally are afforded an opportunity to object to significant actions, we can offer no assurance that a bankruptcy court would not approve actions that may be contrary to our interests. Furthermore, there are instances where creditors can lose their ranking and priority if they are considered to have taken over management of a borrower.
The reorganization of a company can involve substantial legal, professional and administrative costs to a lender and the borrower; it is subject to unpredictable and lengthy delays; and during the process a company’s competitive position may erode, key management may depart and a company may not be able to invest its capital adequately. In some cases, the debtor company may not be able to reorganize and may be required to liquidate assets. The debt of companies in financial reorganization will, in most cases, not pay current interest, may not accrue interest during reorganization and may be adversely affected by an erosion of the issuer’s fundamental value.
In addition, lenders can be subject to lender liability claims for actions taken by them where they become too involved in the borrower’s business or exercise control over the borrower. For example, we could become subject to a lender’s liability claim, if a borrower requests significant managerial assistance from us and we provide such assistance as contemplated by the Investment Company Act.
Declines in market prices and liquidity in the corporate debt markets can result in significant net unrealized depreciation of our portfolio, which in turn would affect our results of operations.
As a BDC, we are required to carry our investments at market value or, if no market value is ascertainable, at fair value as determined in good faith under procedures adopted by Goldman Sachs Asset Management, as valuation designee. We may take into account the following types of factors, if relevant, in determining the fair value of our investments: the enterprise value of a portfolio company (the entire value of the portfolio company to a market participant, including the sum of the values of debt and equity securities used to capitalize the enterprise at a point in time), the nature and realizable value of any collateral, the portfolio company’s ability to make payments and its earnings and discounted cash flow (taking into consideration current market interest rates and credit spreads), the markets in which the portfolio company does business, a comparison of the portfolio company’s securities to similar publicly traded securities and other relevant factors. When an external event such as a purchase transaction, public offering or subsequent equity sale occurs, we use the pricing indicated by the external event to corroborate our valuation. While most of our investments are not publicly traded, applicable accounting standards require us to assume as part of our valuation process that our investments are sold in a principal market to market participants (even if we plan on holding an investment through
52
its maturity). As a result, volatility in the capital markets can also adversely affect our investment valuations. Decreases in the market values or fair values of our investments are recorded as unrealized depreciation. The effect of all of these factors on our portfolio can reduce our NAV by increasing net unrealized depreciation in our portfolio. Depending on market conditions, we could incur substantial realized losses and may suffer unrealized losses, which could have a material adverse impact on our business, financial condition and results of operations.
Economic recessions or downturns could impair our portfolio companies and harm our operating results.
Our portfolio companies may be susceptible to economic downturns or recessions and may be unable to repay our loans during these periods. Therefore, during these periods our non-performing assets may increase and the value of our portfolio may decrease if we are required to write down the values of our investments. Adverse economic conditions may also decrease the value of collateral securing some of our loans and the value of our equity investments. Economic slowdowns or recessions could lead to financial losses in our portfolio and a decrease in revenues, net income and assets. Unfavorable economic conditions also could increase our funding costs, limit our access to the capital markets or result in a decision by lenders not to extend credit to us. These events could prevent us from increasing investments and harm our operating results.
A portfolio company’s failure to satisfy financial or operating covenants imposed by us or other lenders could lead to defaults and, potentially, acceleration of the time when the loans are due and foreclosure on the portfolio company’s assets representing collateral for its obligations. This could trigger cross defaults under other agreements and jeopardize our portfolio company’s ability to meet its obligations under the debt that we hold and the value of any equity securities we own.
In addition, we may originate “covenant-lite” loans, which are loans with fewer financial maintenance covenants than other obligations, or no financial maintenance covenants. Such covenant-lite loans may not include terms that allow the lender to monitor the performance of the borrower or to declare a default if certain criteria are breached. These flexible covenants (or the absence of covenants) could permit borrowers to experience a significant downturn in their results of operations without triggering any default that would permit holders of their debt (such as the Company) to accelerate indebtedness or negotiate terms and pricing. Accordingly, to the extent we invest in “covenant-lite” loans, we may have fewer rights against a borrower and may have a greater risk of loss on such investments as compared to investments in or exposure to loans with financial maintenance covenants. Therefore, our investments may result in an above-average amount of risk and volatility or loss of principal.
Our portfolio companies may have incurred or issued, or may in the future incur or issue, debt or equity securities that rank equally with, or senior to, our investments in such companies, which could have an adverse effect on us in any liquidation of the portfolio company.
Our portfolio companies may have, or may be permitted to incur, other debt, or issue other equity securities that rank equally with, or senior to, our investments. By their terms, such instruments may provide that the holders are entitled to receive payment of dividends, interest or principal on or before the dates on which we are entitled to receive payments in respect of our investments. These debt instruments would usually prohibit the portfolio companies from paying interest on or repaying our investments in the event and during the continuance of a default under such debt. Also, in the event of insolvency, liquidation, dissolution, reorganization or bankruptcy of a portfolio company, holders of securities ranking senior to our investment in that portfolio company typically are entitled to receive payment in full before we receive any distribution in respect of our investment. After repaying such holders, the portfolio company may not have any remaining assets to use for repaying its obligation to us. In the case of securities ranking equally with our investments, we would have to share on an equal basis any distributions with other security holders in the event of an insolvency, liquidation, dissolution, reorganization or bankruptcy of the relevant portfolio company.
Additionally, certain loans that we make to portfolio companies may be secured on a second priority basis by the same collateral securing senior secured debt, which will be secured on a first priority basis. The first priority liens on the collateral will secure the portfolio company’s obligations under any outstanding senior debt and may secure certain other future debt that may be permitted to be incurred by the portfolio company under the agreements governing the loans. The holders of obligations secured by the first priority liens on the collateral will generally control the liquidation of and be entitled to receive proceeds from any realization of the collateral to repay their obligations in full before us. In addition, the value of the collateral in the event of liquidation will depend on market and economic conditions, the availability of buyers and other factors. We can offer no assurance that the proceeds, if any, from the sale or sales of all of the collateral would be sufficient to satisfy the loan obligations secured by the second priority liens after payment in full of all obligations secured by the first priority liens. If such proceeds are not sufficient to repay amounts outstanding under the loan obligations secured by the second priority liens, then we, to the extent not repaid from the proceeds of the sale of the collateral, will only have an unsecured claim against the portfolio company’s remaining assets, if any.
The rights we may have with respect to the collateral securing any junior priority loans we make to our portfolio companies may also be limited pursuant to the terms of one or more intercreditor agreements that we enter into with the holders of senior debt. Under such an intercreditor agreement, at any time that senior obligations are outstanding, we may forfeit certain rights with respect to the collateral to the holders of the senior obligations. These rights may include the right to commence enforcement proceedings against the collateral, the right to control the conduct of such enforcement proceedings, the right to approve amendments to collateral documents, the right to release liens on the collateral and the right to waive past defaults under collateral documents. We may not have the ability to control or direct such actions, even if our rights
53
as junior lenders are adversely affected. In addition, a bankruptcy court may choose not to enforce an intercreditor agreement or other arrangement with creditors. Similar risks to the foregoing may apply where we hold the last-out piece of a unitranche loan.
We may also make unsecured loans to portfolio companies, meaning that such loans will not benefit from any interest in collateral of such portfolio companies. Liens on such portfolio companies’ collateral, if any, will secure the portfolio company’s obligations under its outstanding secured debt and may secure certain future debt that is permitted to be incurred by the portfolio company under its secured loan agreements. The holders of obligations secured by such liens will generally control the liquidation of, and be entitled to receive proceeds from, any realization of such collateral to repay their obligations in full before us. In addition, the value of such collateral in the event of liquidation will depend on market and economic conditions, the availability of buyers and other factors. We can offer no assurance that the proceeds, if any, from sales of such collateral would be sufficient to satisfy our unsecured loan obligations after payment in full of all secured loan obligations. If such proceeds were not sufficient to repay the outstanding secured loan obligations, then the unsecured claims would rank equally with the unpaid portion of such secured creditors’ claims against the portfolio company’s remaining assets, if any.
Our portfolio companies may be highly leveraged.
Some of our portfolio companies may be highly leveraged, which may have adverse consequences to these portfolio companies and to us as an investor. These portfolio companies may be subject to restrictive financial and operating covenants and the leverage may impair these portfolio companies’ ability to finance their future operations and capital needs. As a result, these companies’ flexibility to respond to changing business and economic conditions and to take advantage of business opportunities may be limited. Further, a leveraged company’s income and net assets will tend to increase or decrease at a greater rate than if borrowed money were not used.
Our investments in non-U.S. companies may involve significant risks in addition to the risks inherent in U.S. investments.
Our investment strategy contemplates potential investments in securities of non-U.S. companies to the extent permissible under the Investment Company Act. Investing in non-U.S. companies may expose us to additional risks not typically associated with investing in U.S. companies. These risks include changes in exchange control regulations, political and social instability, expropriation, imposition of non-U.S. taxes (potentially at confiscatory levels), less liquid markets, less available information than is generally the case in the United States, higher transaction costs, less government supervision of exchanges, brokers and issuers, less developed bankruptcy laws, difficulty in enforcing contractual obligations, lack of uniform accounting and auditing standards and greater price volatility. These risks are likely to be more pronounced for investments in companies located in emerging markets and particularly for middle-market companies in these economies.
Although most of our investments are denominated in USD, our investments that are denominated in a non-USD currency will be subject to the risk that the value of a particular currency will change in relation to the USD. Among the factors that may affect currency values are trade balances, the level of short-term interest rates, differences in relative values of similar assets in different currencies, long-term opportunities for investment and capital appreciation and political developments. We may employ hedging techniques to minimize these risks, but we cannot assure investors that such strategies will be effective or without risk to us.
We may expose ourselves to risks if we engage in hedging transactions.
Subject to applicable provisions of the Investment Company Act, the regulations promulgated thereunder, and applicable CFTC regulations, we may enter into hedging transactions in a manner consistent with SEC guidance, which may expose us to risks associated with such transactions. Such hedging may utilize instruments such as forward contracts, currency options and interest rate swaps, caps, collars and floors to seek to hedge against fluctuations in the relative values of our portfolio positions from changes in currency exchange rates and market interest rates. Use of these hedging instruments may include counter-party credit risk. To the extent we have non-U.S. investments, particularly non-USD-denominated investments, our hedging costs will increase.
Hedging against a decline in the values of our portfolio positions does not eliminate the possibility of fluctuations in the values of such positions or prevent losses if the values of such positions decline. However, such hedging can establish other positions designed to gain from those same developments, thereby offsetting the decline in the value of such portfolio positions. Such hedging transactions may also limit the opportunity for gain if the values of the underlying portfolio positions should increase. Moreover, it may not be possible to hedge against an exchange rate or interest rate fluctuation that is so generally anticipated that we are not able to enter into a hedging transaction at an acceptable price.
The success of any hedging transactions we may enter into will depend on our ability to correctly predict movements in currencies and interest rates. Therefore, while we may enter into such transactions to seek to reduce currency exchange rate and interest rate risks, unanticipated changes in currency exchange rates or interest rates may result in poorer overall investment performance than if we had not engaged in any such hedging transactions. In addition, the degree of correlation between price movements of the instruments used in a hedging strategy and price movements in the portfolio positions being hedged may vary. Moreover, for a variety of reasons, we may not seek to (or be able to) establish a perfect correlation between such hedging instruments and the portfolio holdings being hedged. Any such imperfect correlation may prevent us from achieving the intended hedge and expose us to risk of loss. In addition, it may not be possible to hedge fully or perfectly against currency fluctuations affecting the value of securities denominated in non-U.S. currencies because the value of those securities is likely to fluctuate as a result of factors not related to currency fluctuations. Income derived from hedging transactions also is generally not eligible to be
54
distributed to non-U.S. stockholders free from withholding taxes. Changes to the regulations applicable to the financial instruments we use to accomplish our hedging strategy could impair the effectiveness of that strategy. See also “—Our Investments—We are exposed to risks associated with changes in interest rates.”
We may form one or more CLOs, which may subject us to certain structured financing risks.
To the extent permissible under risk retention rules adopted pursuant to Section 941 of the Dodd-Frank Act and applicable provisions of the Investment Company Act, to finance investments, we may securitize certain of our investments, including through the formation of one or more CLOs, while retaining all or most of the exposure to the performance of these investments. This would involve contributing a pool of assets to a special purpose entity, and selling debt interests in such entity on a non-recourse or limited-recourse basis to purchasers. Any interest in any such CLO held by us may be considered a “non-qualifying asset” for purposes of Section 55 of the Investment Company Act.
If we create a CLO, we will depend on distributions from the CLO’s assets out of its earnings and cash flows to enable us to make distributions to our stockholders. The ability of a CLO to make distributions will be subject to various limitations, including the terms and covenants of the debt it issues. For example, tests (based on interest coverage or other financial ratios or other criteria) may restrict our ability, as holder of a CLO’s equity interests, to receive cash flow from these investments. There is no assurance any such performance tests will be satisfied. Also, a CLO may take actions that delay distributions in order to preserve ratings and to keep the cost of present and future financings lower or the CLO may be obligated to retain cash or other assets to satisfy over-collateralization requirements commonly provided for holders of the CLO’s debt. As a result, there may be a lag, which could be significant, between the repayment or other realization on a loan or other assets in, and the distribution of cash out of, a CLO, or cash flow may be completely restricted for the life of the CLO. If we do not receive cash flow from any such CLO that is necessary to satisfy the Annual Distribution Requirement for maintaining our qualification for tax treatment as a RIC, and we are unable to obtain cash from other sources necessary to satisfy this requirement, we could fail to maintain our qualification for tax treatment as a RIC, which would have a material adverse effect on our financial performance.
In addition, a decline in the credit quality of loans in a CLO due to poor operating results of the relevant borrower, declines in the value of loan collateral or increases in defaults, among other things, may force a CLO to sell certain assets at a loss, reducing their earnings and, in turn, cash potentially available for distribution to us for distribution to our stockholders.
To the extent that any losses are incurred by the CLO in respect of any collateral, such losses will be borne first by us as owner of equity interests. Finally, any equity interests that we retain in a CLO will not be secured by the assets of the CLO and we will rank behind all creditors of the CLO.
Our Securities
Investing in our securities involves an above-average degree of risk.
The investments we make in accordance with our investment objective may result in a higher amount of risk than alternative investment options and volatility or loss of principal. Our investments in portfolio companies may be highly speculative and aggressive. Therefore, an investment in our securities may not be suitable for an investor with a lower risk tolerance.
The market price of our securities may fluctuate significantly.
The market price and liquidity of the market for our securities may be significantly affected by numerous factors, some of which are beyond our control and may not be directly related to our operating performance. These factors include:
55
In the past, following periods of volatility in the market price of a company’s securities, securities class action litigation has often been brought against that company. If our stock price fluctuates significantly, we may be the target of securities litigation in the future. Securities litigation could result in substantial costs and divert management’s attention and resources from our business.
Shares of closed-end investment companies, including BDCs, frequently trade at a discount to their NAV per share.
We cannot predict the prices at which our common stock will trade. Shares of closed-end investment companies, including BDCs, frequently trade at a discount from their NAV and our common stock may also be discounted in the market. This characteristic of closed-end investment companies is separate and distinct from the risk that our NAV per share of common stock may decline. We cannot predict whether our common stock will trade at, above or below NAV. In addition, if our common stock trades below its NAV, we will generally not be able to sell additional shares of our common stock to the public at its market price without first obtaining the approval of a majority of our stockholders (including a majority of our unaffiliated stockholders) and our Independent Directors for such issuance.
Sales of substantial amounts of our common stock in the public market may have a material adverse effect on the market price of our common stock.
Sales of substantial amounts of our common stock, the availability of such common stock for sale or the perception that such sales could occur could materially adversely affect the prevailing market price for our common stock. Both the sale of a substantial amount of our securities and the perception that such sales could occur could impair our ability to raise additional capital through the sale of equity securities should we desire to do so. Additionally, as an owner of approximately 5.9% of our common stock as of December 31, 2023, GS Group Inc. is a significant stockholder that may decide to sell a substantial amount of its common stock, subject to applicable securities laws, and such a sale would exacerbate the effects described above.
Our stockholders will experience dilution in their ownership percentage if they opt out of our DRIP.
We have adopted the DRIP pursuant to which we automatically reinvest all cash distributions declared by the Board of Directors on behalf of investors who do not elect to receive their distributions in cash. As a result, if the Board of Directors declares a cash distribution, then our stockholders who have not opted out of our DRIP will have their cash distributions automatically reinvested in additional shares of our common stock, rather than receiving the cash distribution. See “Item 5. Market for Registrant’s Common Equity, Related Stockholder Matters and Issuer Purchases of Equity Securities—Price Range of Common Stock and Distributions” and “Item 1. Business—Dividend Reinvestment Plan” for a description of our distribution policy and obligations.
If, on the payment date for any distribution, the most recently computed NAV per share is equal to or less than the closing market price plus estimated per share fees (which include any applicable brokerage commissions the plan agent is required to pay), the plan agent will invest the distribution amount in newly issued shares on behalf of the participants. The number of newly issued shares to be credited to a participant’s account will be determined by dividing the dollar amount of the distribution by the most recently computed NAV per share provided that, if the NAV is less than or equal to 95% of the then current market price per share, the dollar amount of the distribution will be divided by 95% of the market price on the payment date. Accordingly, participants in the DRIP may receive a greater number of shares of our common stock than the number of shares associated with the market price of our common stock, resulting in dilution for other stockholders. Stockholders that opt out of our DRIP will experience dilution in their ownership percentage of our common stock over time. See “Item 1. Business—Dividend Reinvestment Plan.”
56
Our stockholders that do not opt out of our DRIP should generally expect to have current tax liabilities without receiving cash to pay such liabilities.
Under our DRIP, if we declare a cash distribution, our stockholders who have not elected to “opt out” will have their cash distributions automatically reinvested in additional shares of our common stock, rather than receiving the cash distributions. Stockholders who receive distributions in the form of shares of our common stock generally are subject to the same U.S. federal, state and local tax consequences as stockholders who elect to receive their distributions in cash. However, because their distributions will be reinvested, those stockholders will not receive cash with which to pay any applicable taxes on such reinvested distributions. As a result, stockholders that have not opted out of our DRIP may have to use funds from other sources to pay any tax liabilities imposed upon them based on the value of the common stock received. See “Item 1. Business—Dividend Reinvestment Plan.”
We may in the future determine to issue preferred stock, which could adversely affect the market value of our common stock.
The issuance of shares of preferred stock with dividend or conversion rights, liquidation preferences or other economic terms favorable to the holders of preferred stock could adversely affect the market price for our common stock by making an investment in the common stock less attractive. In addition, the dividends on any preferred stock we issue must be cumulative. Payment of dividends and repayment of the liquidation preference of preferred stock must take preference over any distributions or other payments to our common stockholders, and holders of preferred stock are not subject to any of our expenses or losses and are not entitled to participate in any income or appreciation in excess of their stated preference (other than convertible preferred stock that converts into common stock). In addition, under the Investment Company Act, participating preferred stock and preferred stock constitutes a “senior security” for purposes of the 150% asset coverage test. See “—Regulations governing our operations as a BDC affect our ability to, and the way in which we, raise additional capital. These constraints may hinder our Investment Adviser’s ability to take advantage of attractive investment opportunities and to achieve our investment objective.”
Certain provisions of our certificate of incorporation and bylaws and the Delaware General Corporation Law (“DGCL”), as well as other aspects of our structure, including the substantial ownership interest of GS Group Inc., could deter takeover attempts and have an adverse impact on the price of our common stock.
Our certificate of incorporation and bylaws, as well as the DGCL, contain provisions that may have the effect of discouraging a third party from making an acquisition proposal for us. Among other things, our certificate of incorporation and bylaws:
We have provisions comparable to those of Section 203 of the DGCL (other than with respect to GS Group Inc. and its affiliates and certain of its or their direct or indirect transferees and any group as to which such persons are a party). These provisions generally prohibit us from engaging in mergers, business combinations and certain other types of transactions with “interested stockholders” (generally defined as persons or entities that beneficially own 15% or more of our voting stock), other than the exempt parties as described above, for a period of three years following the date the person became an interested stockholder unless, prior to such stockholder becoming an interested stockholder, our Board of Directors has approved the “business combination” that would otherwise be restricted or the transaction that resulted in the interested stockholder becoming an interested stockholder or the subsequent transaction with the interested stockholder has been approved by our Board of Directors and 66 2/3% of our outstanding voting stock (other than voting stock owned by the interested stockholder). Such provisions may discourage third parties from trying to acquire control of us and increase the difficulty of consummating such an offer.
57
These anti-takeover provisions may inhibit a change of control in circumstances that could give the holders of our common stock the opportunity to realize a premium over the market price for the common stock. In addition, certain aspects of our structure, including the substantial ownership interest of GS Group Inc., may have the effect of discouraging a third party from making an acquisition proposal for us.
We may not be able to pay distributions to holders of our common stock or preferred stock, our distributions to holders of our common stock or preferred stock may not grow over time, and a portion of our distributions to holders of our common stock or preferred stock may be a return of capital for U.S. federal income tax purposes.
We intend to pay quarterly distributions to our stockholders out of assets legally available for distribution. We cannot assure you that we will achieve investment results that will allow us to make a specified level of cash distributions or year-to-year increases in cash distributions. If we are unable to satisfy the asset coverage test applicable to us as a BDC, or if we violate certain covenants under our Revolving Credit Facility and other debt financing agreements, our ability to pay distributions to our stockholders could be limited. All distributions will be paid at the discretion of our Board of Directors and will depend on our earnings, financial condition, maintenance of our qualification for RIC tax treatment, compliance with applicable BDC regulations, compliance with covenants under our Revolving Credit Facility and other debt financing agreements, if any, and such other factors as our Board of Directors may deem relevant from time to time.
The distributions we pay to our stockholders in a year may exceed our net ordinary income and capital gains for that year and, accordingly, a portion of such distributions may constitute a return of capital for U.S. federal income tax purposes that would reduce a stockholder’s adjusted tax basis in its shares of our common stock or preferred stock and correspondingly increase such stockholder’s gain, or reduce such stockholder’s loss, on disposition of such shares. Distributions in excess of a stockholder’s adjusted tax basis in its shares of our common stock or preferred stock will generally constitute capital gains to such stockholder.
Stockholders who periodically receive the payment of a distribution from a RIC consisting of a return of capital for U.S. federal income tax purposes may be under the impression that they are receiving a distribution of the RIC’s net ordinary income or capital gains when they are not. Accordingly, stockholders should read carefully any written disclosure accompanying a distribution from us and the information about the specific tax characteristics of our distributions provided to stockholders after the end of each calendar year, and should not assume that the source of any distribution is our net ordinary income or capital gains.
The tax treatment of a non-U.S. stockholder in its jurisdiction of tax residence will depend entirely on the laws of such jurisdiction, and may vary considerably from jurisdiction to jurisdiction.
Depending on (i) the laws of such non-U.S. stockholder’s jurisdiction of tax residence, (ii) how we, the investments and/or any other investment vehicles through which we directly or indirectly invest are treated in such jurisdiction, and (iii) the activities of any such entities, an investment in us could result in such non-U.S. stockholder recognizing adverse tax consequences in its jurisdiction of tax residence, including (a) with respect to any generally required or additional tax filings and/or additional disclosure required in such filings in relation to the treatment for tax purposes in the relevant jurisdiction of an interest in us, the investments and/or any other investment vehicles through which we directly or indirectly invest and/or of distributions from such entities and any uncertainties arising in that respect (such entities not being established under the laws of the relevant jurisdiction), (b) the possibility of taxable income significantly in excess of cash distributed to a non-U.S. stockholder, and possibly in excess of our actual economic income, (c) the possibilities of losing deductions or the ability to utilize tax basis and of sums invested being returned in the form of taxable income or gains, and (d) the possibility of being subject to tax at unfavorable tax rates. A non-U.S. stockholder may also be subject to restrictions on the use of its share of our deductions and losses in its jurisdiction of tax residence. Each prospective investor is urged to consult its own tax advisors with respect to the tax and tax filing consequences, if any, in its jurisdiction of tax residence of an investment in us, as well as any other jurisdiction in which such prospective investor is subject to taxation.
We may have difficulty paying our required distributions if we recognize taxable income before or without receiving cash representing such income.
For U.S. federal income tax purposes, we will include in our taxable income certain amounts that we have not yet received in cash, such as OID, which may occur if we receive warrants in connection with the origination of a loan or possibly in other circumstances or contracted PIK interest, which generally represents contractual interest added to the loan balance and due at the end of the loan term. Such OID, which could be significant relative to our overall investment assets, and increases in loan balances as a result of PIK interest will be included in our taxable income before we receive any corresponding cash payments. We also may be required to include in our taxable income certain other amounts that we have not yet received or will not receive in cash, such as accruals on a contingent payment debt instrument, accruals of interest income and/or OID on defaulted debt, or deferred loan origination fees that are paid after origination of the loan or are paid in non-cash compensation such as warrants or stock. Moreover, we generally will be required to take certain amounts into income no later than the time such amounts are reflected on our financial statements. The credit risk associated with the collectability of deferred payments may be increased as and when a portfolio company increases the amount of interest on which it is deferring cash payment through deferred interest features. Our investments with a deferred interest feature may represent a higher credit risk than loans for which interest must be paid in full in cash on a regular basis. For example, even if the accounting conditions for income accrual are met, the borrower could still default when our actual collection is scheduled to occur upon maturity of the obligation.
58
Because in certain cases we may recognize taxable income before or without receiving cash representing such income, we may have difficulty making distributions to our stockholders that will be sufficient to enable us to meet the Annual Distribution Requirement necessary for us to maintain our qualification for tax treatment as a RIC. Accordingly, we may need to sell some of our assets at times and/or at prices that we would not consider advantageous, we may need to raise additional equity or debt capital, or we may need to forego new investment opportunities or otherwise take actions that are disadvantageous to our business (or be unable to take actions that are advantageous to our business) to enable us to make distributions to our stockholders that will be sufficient to enable us to meet the Annual Distribution Requirement. If we are unable to obtain cash in the amount required for us to make, or if we are restricted from making, sufficient distributions to our stockholders to meet the Annual Distribution Requirement, we may fail to qualify for the U.S. federal income tax benefits allowable to RICs and, thus, become subject to a corporate-level U.S. federal income tax (and any applicable U.S. state and local taxes).
Our stockholders may receive shares of our common stock or preferred stock as distributions, which could result in adverse tax consequences to them.
In order to satisfy the Annual Distribution Requirement applicable to RICs, we will have the ability to declare a large portion of a distribution in shares of our common stock or preferred stock instead of in cash. We are not subject to restrictions on the circumstances in which we may declare a portion of a distribution in shares of our stock but would generally anticipate doing so only in unusual situations, such as, for example, if we do not have sufficient cash to meet our RIC distribution requirements under the Code. Generally, were we to declare such a distribution, we would allow stockholders to elect payment in cash and/or shares of our stock of equivalent value. Under published IRS guidance, the entire distribution by a publicly offered RIC will generally be treated as a taxable distribution for U.S. federal income tax purposes, and count towards our RIC distribution requirements under the Code, if certain conditions are satisfied. Among other things, the aggregate amount of cash available to be distributed to all stockholders is required to be at least 20% of the aggregate declared distribution. If too many stockholders elect to receive cash, the cash available for distribution is required to be allocated among the stockholders electing to receive cash (with the balance of the distribution paid in stock) under a formula provided in the applicable IRS guidance. The number of shares of our stock distributed would thus depend on the applicable percentage limitation on cash available for distribution, the stockholders’ individual elections to receive cash or stock, and the value of the shares of our stock. Each stockholder generally would be treated as having received a taxable distribution (including for purposes of the withholding tax rules applicable to a Non-U.S. stockholder) on the date the distribution is received in an amount equal to the cash that such stockholder would have received if the entire distribution had been paid in cash, even if the stockholder received all or most of the distribution in shares of our common stock or preferred stock. We currently do not intend to pay distributions in shares of our common stock or preferred stock, but we can offer no assurance that we will not do so in the future.
If we are not treated as a “publicly offered regulated investment company,” as defined in the Code, U.S. stockholders that are individuals, trusts or estates will be taxed as though they received a distribution of some of our expenses.
During the period when we have elected to be treated as a RIC, we expect to be treated as a “publicly offered regulated investment company” (within the meaning of Section 67 of the Code) as a result of either (i) shares of our common stock being held by at least 500 persons at all times during a taxable year or (ii) shares of our common stock being treated as regularly traded on an established securities market. However, we cannot assure investors that we will be treated as a publicly offered regulated investment company for all years. If we are not treated as a publicly offered regulated investment company for any calendar year, each U.S. stockholder that is an individual, trust or estate will be treated as having received a dividend from us in the amount of such U.S. stockholder’s allocable share of the management and incentive fees paid to our Investment Adviser and certain of our other expenses for the calendar year, and these fees and expenses will be treated as miscellaneous itemized deductions of such U.S. stockholder. Miscellaneous itemized deductions of a U.S. stockholder that is an individual, trust or estate are disallowed for tax years beginning before January 1, 2026 and thereafter generally are (i) deductible by such U.S. stockholders only to the extent that the aggregate of such U.S. stockholder’s miscellaneous itemized deductions exceeds 2% of such U.S. stockholder’s adjusted gross income for U.S. federal income tax purposes, (ii) not deductible for purposes of the alternative minimum tax and (iii) subject to the overall limitation on itemized deductions under the Code.
Non-U.S. stockholders may be subject to withholding of U.S. federal income tax on dividends we pay.
Distributions of our “investment company taxable income” to a non-U.S. stockholder that are not effectively connected with the non-U.S. stockholder’s conduct of a trade or business within the United States will generally be subject to withholding of U.S. federal income tax at a 30% rate (or lower rate provided by an applicable income tax treaty) to the extent paid out of our current or accumulated earnings and profits.
Certain properly reported distributions are generally exempt from withholding of U.S. federal income tax where they are paid in respect of our (i) “qualified net interest income” (generally, our U.S.-source interest income, other than certain contingent interest and interest from obligations of a corporation or partnership in which we or the non-U.S. stockholder are at least a 10% stockholder, reduced by expenses that are allocable to such income) or (ii) “qualified short-term capital gains” (generally, the excess of our net short-term capital gain over our net long-term capital loss for such taxable year), and certain other requirements are satisfied.
NO ASSURANCE CAN BE GIVEN AS TO WHETHER ANY OF OUR DISTRIBUTIONS WILL BE ELIGIBLE FOR THIS EXEMPTION FROM WITHHOLDING OF U.S. FEDERAL INCOME TAX. IN PARTICULAR, THIS EXEMPTION WILL NOT APPLY TO OUR
59
DISTRIBUTIONS PAID IN RESPECT OF OUR NON-U.S. SOURCE INTEREST INCOME OR OUR DIVIDEND INCOME (OR ANY OTHER TYPE OF INCOME OTHER THAN GENERALLY OUR NON-CONTINGENT U.S. SOURCE INTEREST INCOME RECEIVED FROM UNRELATED OBLIGORS AND OUR QUALIFIED SHORT-TERM CAPITAL GAINS). IN THE CASE OF OUR COMMON STOCK OR PREFERRED STOCK HELD THROUGH AN INTERMEDIARY, THE INTERMEDIARY MAY WITHHOLD U.S. FEDERAL INCOME TAX EVEN IF WE REPORT THE PAYMENT AS QUALIFIED NET INTEREST INCOME OR QUALIFIED SHORT-TERM CAPITAL GAIN.
Purchases of our common stock pursuant to any 10b5-1 plan or otherwise may result in the price of our common stock being higher than the price that otherwise might exist in the open market.
We are authorized to purchase up to $75.00 million of shares of our common stock if the stock trades below the most recently announced NAV per share (including any updates, corrections or adjustments publicly announced by us to any previously announced NAV per share), subject to certain limitations, commencing on a date to be determined by one or more of our officers. Any such purchases will be conducted in accordance with applicable securities laws. Whether purchases will be made under any 10b5-1 plan we may adopt or otherwise and how much will be purchased at any time is uncertain, dependent on prevailing market prices and trading volumes, all of which we cannot predict. These activities may have the effect of maintaining the market price of our common stock or retarding a decline in the market price of the common stock, and, as a result, the price of our common stock may be higher than the price that otherwise might exist in the open market.
Purchases of our common stock by us under any 10b5-1 plan or otherwise may result in dilution to our NAV per share.
We are authorized to repurchase shares of common stock when the market price per share is below the most recently reported NAV per share (including any updates, corrections or adjustments publicly announced by us to any previously announced NAV per share), including under any 10b5-1 plan we may adopt, commencing on a date to be determined by one or more of our officers. Because purchases may be made beginning at any price below our most recently reported NAV per share, if our NAV per share decreases after the date as of which NAV per share was last reported, such purchases may result in dilution to our NAV per share. This dilution would occur because we would repurchase shares at a price above the then-current NAV per share, which would cause a proportionately smaller increase in our stockholders’ interest in our earnings and assets and their voting interest in us than the decrease in our assets resulting from such repurchase. As a result of any such dilution, our market price per share may decline. The actual dilutive effect will depend on the number of shares of common stock that could be so repurchased, the price and the timing of any repurchases.
To the extent OID and PIK interest constitute a portion of our income, we will be exposed to typical risks associated with such income being required to be included in taxable and accounting income prior to receipt of cash representing such income.
Our investments may include OID instruments and PIK, interest arrangements, which represents contractual interest added to a loan balance and due at the end of such loan’s term. To the extent OID or PIK interest constitute a portion of our income, we are exposed to typical risks associated with such income being required to be included in taxable and accounting income prior to receipt of cash, including the following:
In addition, investments in PIK and OID instruments may provide certain benefits to the Investment Adviser, including increasing management fees and incentive fees prior to the receipt of cash with respect to accrued interest payments.
Terms relating to redemption may materially adversely affect an investor’s return on any debt securities that we may issue.
If our noteholders’ debt securities are redeemable at our option, we may choose to redeem debt securities at times when prevailing interest rates are lower than the interest rate paid on such debt securities. In addition, if our noteholders’ debt securities are subject to mandatory redemption, we may be required to redeem such debt securities also at times when prevailing interest rates are lower than the interest rate paid on such debt
60
securities. In this circumstance, a noteholder may not be able to reinvest the redemption proceeds in a comparable security at an effective interest rate as high as the debt securities being redeemed.
Our credit ratings may not reflect all risks of an investment in our debt securities.
Our credit ratings are an assessment by third parties of our ability to pay our obligations. Consequently, real or anticipated changes in our credit ratings will generally affect the market value of our debt securities. Our credit ratings, however, may not reflect the potential impact of risks related to market conditions generally or other factors discussed above on the market value of or trading market for the publicly issued debt securities.
Holders of any preferred stock we might issue would have the right to elect members of the board of directors and class voting rights on certain matters.
Holders of any preferred stock we might issue, voting separately as a single class, would have the right to elect two members of the board of directors at all times and in the event dividends become two full years in arrears, would have the right to elect a majority of the directors until such arrearage is completely eliminated. In addition, preferred stockholders have class voting rights on certain matters, including changes in fundamental investment restrictions and conversion to open-end status, and accordingly can veto any such changes. Restrictions imposed on the declarations and payment of dividends or other distributions to the holders of our common stock and preferred stock, both by the Investment Company Act and by requirements imposed by rating agencies or the terms of our credit facilities, might impair our ability to maintain our qualification for tax treatment as a RIC. While we would intend to redeem our preferred stock to the extent necessary to enable us to distribute our income as required to maintain our qualification for tax treatment as a RIC, there can be no assurance that such actions could be effected in time to meet the tax requirements.
There is a risk that investors in our equity securities may not receive distributions or that our distributions may not grow over time and that investors in our debt securities may not receive all of the interest income to which they are entitled.
We intend to make distributions on a quarterly basis to our stockholders out of assets legally available for distribution. We cannot assure you that we will achieve investment results that will allow us to make a specified level of cash distributions or year-to-year increases in cash distributions. In addition, due to the asset coverage test applicable to us as a BDC, we may in the future be limited in our ability to make distributions. Also, our Revolving Credit Facility may limit our ability to declare dividends if we default under certain provisions or fail to satisfy certain other conditions. If we do not distribute a certain percentage of our income annually, we will suffer adverse tax consequences, including possible loss of the tax benefits available to us as a RIC. In addition, in accordance with U.S. generally accepted accounting principles and tax rules, we include in income certain amounts that we have not yet received in cash, such as contractual PIK interest, which represents contractual interest added to the loan balance that becomes due at the end of the loan term, or the accrual of original issue or market discount. Since we may recognize income before or without receiving cash representing such income, we may have difficulty meeting the requirement to distribute at least 90% of our investment company taxable income to obtain tax benefits as a RIC.
We will be subject to a 4% nondeductible federal excise tax on certain undistributed income for a calendar year unless we distribute in a timely manner an amount at least equal to the sum of (1) 98% of our ordinary income (taking into account certain deferrals and elections) for the calendar year, (2) 98.2% of our capital gain net income for the one-year period ending October 31 in that calendar year and (3) any income recognized, but not distributed, in preceding years. We will not be subject to excise taxes on amounts on which we are required to pay corporate income taxes (such as retained net capital gains).
Finally, if more stockholders opt to receive cash distributions rather than participate in our DRIP, we may be forced to liquidate some of our investments and raise cash in order to make cash distribution payments.
ITEM 1B. UNRESOLVED STAFF COMMENTS
None.
ITEM 1C. CYBERSECURITY
Cyber Risk Management and Strategy
As a part of the overall risk management system for the Company, processes are in place to assess, identify and manage material risks from cybersecurity threats. The Investment Adviser manages the Company’s day-to-day operations and has implemented a cybersecurity policy that applies to the Company and its operations. With respect to cybersecurity, the Company and the Investment Adviser rely on the systems of Goldman Sachs, its third-party service providers and the Company’s service providers.
Goldman Sachs’ cybersecurity risk management processes are integrated into its overall risk management processes. Goldman Sachs has established an Information Security and Cybersecurity Program (the “Cybersecurity Program”), administered by Technology Risk within its
61
Engineering organization, and overseen by its chief information security officer. This program is designed to identify, assess, document and mitigate threats, establish and evaluate compliance with information security mandates, adopt and apply our security control framework, and prevent, detect and respond to security incidents. The Cybersecurity Program is periodically reviewed and modified to respond to changing threats and conditions. A dedicated Operational Risk team, which reports to the chief risk officer of Goldman Sachs, provides oversight and challenge of the Cybersecurity Program, independent of Technology Risk, and assesses the operating effectiveness of the program against industry standard frameworks and risk appetite-approved operational risk limits and thresholds.
Goldman Sachs’ process for managing cybersecurity risk includes the critical components of its risk management framework, as well as the following:
In conjunction with third-party vendors and consultants, Goldman Sachs performs risk assessments to gauge the performance of the Cybersecurity Program, to estimate its risk profile and to assess compliance with relevant regulatory requirements. Goldman Sachs performs periodic assessments of control efficacy through its internal risk and control self-assessment process, as well as a variety of external technical assessments, including external penetration tests and “red team” engagements where third parties test its defenses. The results of these risk assessments, together with control performance findings, are used to establish priorities, allocate resources, and identify and improve controls. Goldman Sachs uses third parties, such as outside forensics firms, to augment its cyber incident response capabilities. Goldman Sachs and its third-party service providers have a vendor management program that documents a risk-based framework for managing third-party vendor relationships (including those of the Company). Information security risk management is built into our vendor management process, which covers vendor selection, onboarding, performance monitoring and risk management.
Cyber Risk Governance
The Board provides strategic oversight on cybersecurity matters generally, including oversight of material risks associated with cybersecurity threats. The Board receives periodic reports and updates from Goldman Sachs which generally include the overall state of the Cybersecurity Program, the current cybersecurity threat landscape, material risks from cybersecurity threats, cybersecurity incidents, risk management policies and/or risk assessment initiatives.
Assessment of Cybersecurity Risk
The potential impact of risks from cybersecurity threats are assessed on an ongoing basis, and how such risks could materially affect the Company’s business strategy, operational results, and financial condition are evaluated. However, despite these efforts, we cannot eliminate all cybersecurity risks or provide assurance that we have not had occurrences of undetected cybersecurity incidents. During the reporting period, the Company did not identify any risks from cybersecurity threats, including as a result of previous cybersecurity incidents, that the Company believes materially affected, or are reasonably likely to materially affect, the Company, including its business strategy, operational results, and financial condition.
ITEM 2. PROPERTIES
62
We maintain our principal executive office at 200 West Street, New York, New York 10282. We do not own any real estate.
ITEM 3. LEGAL PROCEEDINGS
From time to time, we may be a party to certain legal proceedings, including proceedings relating to the enforcement of our rights under loans to or other contracts with our portfolio companies. We are not currently subject to any material legal proceedings, nor, to our knowledge, is any material legal proceeding threatened against us.
ITEM 4. MINE SAFETY DISCLOSURES
Not applicable.
63
PART II.
ITEM 5. MARKET FOR REGISTRANT’S COMMON EQUITY, RELATED STOCKHOLDER MATTERS AND ISSUER PURCHASES OF EQUITY SECURITIES
Price Range of Common Stock and Distributions
Our common stock is traded on the NYSE under the symbol “GSBD.” Our common stock has historically traded at prices both above and below our NAV per share. It is not possible to predict whether our common stock will trade at, above or below NAV in the future. See “Item 1A. Risk Factors—Our Securities.”
The following table sets forth, for each fiscal quarter for the fiscal years ended December 31, 2023, 2022 and 2021, the NAV per share of our common stock, the range of high and low closing sales prices of our common stock, the closing sales price as a premium (discount) to NAV and the dividends or distributions declared by us. On February 27, 2024, the last reported closing sales price of our common stock on the NYSE was $
|
|
|
|
Closing Sales Price |
|
|
|
|
|
|
|
|
|
|
|
|||||||||
|
NAV(1) |
|
|
High |
|
|
Low |
|
|
Premium or (Discount) of High Sales Price to NAV(2) |
|
|
Premium or (Discount) of |
|
|
Declared Distribution(3) |
|
|
||||||
For the Year Ended December 31, 2023 |
|
|
|
|
|
|
|
|
|
|
|
|
|
|
|
|
|
|
||||||
Fourth Quarter |
$ |
|
|
$ |
|
|
$ |
|
|
|
% |
|
|
( |
)% |
|
$ |
0.45 |
|
|
||||
Third Quarter |
$ |
|
|
$ |
|
|
$ |
|
|
|
% |
|
|
( |
)% |
|
$ |
0.45 |
|
|
||||
Second Quarter |
$ |
|
|
$ |
|
|
$ |
|
|
|
( |
)% |
|
|
( |
)% |
|
$ |
0.45 |
|
|
|||
First Quarter |
$ |
|
|
$ |
|
|
$ |
|
|
|
% |
|
|
( |
)% |
|
$ |
0.45 |
|
|
||||
For the Year Ended December 31, 2022 |
|
|
|
|
|
|
|
|
|
|
|
|
|
|
|
|
|
|
||||||
Fourth Quarter |
$ |
|
|
$ |
|
|
$ |
|
|
|
% |
|
|
( |
)% |
|
$ |
0.45 |
|
|
||||
Third Quarter |
$ |
|
|
$ |
|
|
$ |
|
|
|
% |
|
|
( |
)% |
|
$ |
0.45 |
|
|
||||
Second Quarter |
$ |
|
|
$ |
|
|
$ |
|
|
|
% |
|
|
% |
|
$ |
0.45 |
|
|
|||||
First Quarter |
$ |
|
|
$ |
|
|
$ |
|
|
|
% |
|
|
% |
|
$ |
0.45 |
|
|
|||||
For the Year Ended December 31, 2021 |
|
|
|
|
|
|
|
|
|
|
|
|
|
|
|
|
|
|
||||||
Fourth Quarter |
$ |
|
|
$ |
|
|
$ |
|
|
|
% |
|
|
% |
|
$ |
0.45 |
|
|
|||||
Third Quarter |
$ |
|
|
$ |
|
|
$ |
|
|
|
% |
|
|
% |
|
$ |
0.45 |
|
|
|||||
Second Quarter |
$ |
|
|
$ |
|
|
$ |
|
|
|
% |
|
|
% |
|
$ |
0.45 |
|
|
|||||
First Quarter |
$ |
|
|
$ |
|
|
$ |
|
|
|
% |
|
|
% |
|
$ |
0.45 |
|
|
|||||
We have elected to be treated as a RIC, and we expect to qualify annually for tax treatment as a RIC, commencing with our taxable year ended December 31, 2013. We intend to continue to pay quarterly distributions to our stockholders out of assets legally available for distribution. Future quarterly distributions, if any, will be determined by our Board of Directors. All future distributions will be subject to lawfully available funds therefor, and no assurance can be given that we will be able to declare such distributions in future periods.
Please refer to “Item 8. Consolidated Financial Statements and Supplementary Data—Note 2 Significant Accounting Policies—Distributions” for further information regarding the tax treatment of our distributions and the tax consequences of our retention of net capital gains. See also “Item 1A. Risk Factors—Our Securities—We may not be able to pay distributions to holders of our common stock or preferred stock, distributions to holders of our common stock or preferred stock may not grow over time and a portion of our distributions to holders of our common stock or preferred stock may be a return of capital for U.S. federal income tax purposes.”
Unless our stockholders elect to receive their distributions in cash, we intend to make such distributions in additional shares of our common stock under our DRIP. See “Item 1. Business—Dividend Reinvestment Plan.”
64
The following table summarizes the distributions declared on shares of our common stock and shares distributed pursuant to the DRIP to stockholders who had not opted out of the DRIP:
Date Declared |
|
Record Date |
|
Payment Date |
|
Amount Per Share |
|
|
Shares |
|
|
||
For the Year Ended December 31, 2023 |
|
|
|
|
|
|
|
|
|
||||
February 22, 2023 |
|
March 31, 2023 |
|
April 27, 2023 |
|
$ |
0.45 |
|
|
|
101,249 |
|
* |
May 3, 2023 |
|
June 30, 2023 |
|
July 27, 2023 |
|
$ |
0.45 |
|
|
|
100,381 |
|
|
August 2, 2023 |
|
September 30, 2023 |
|
October 27, 2023 |
|
$ |
0.45 |
|
|
|
128,366 |
|
* |
November 1, 2023 |
|
December 29, 2023 |
|
January 26, 2024 |
|
$ |
0.45 |
|
|
|
119,186 |
|
|
For the Year Ended December 31, 2022 |
|
|
|
|
|
|
|
|
|
||||
February 23, 2022 |
|
March 31, 2022 |
|
April 27, 2022 |
|
$ |
0.45 |
|
|
|
65,180 |
|
|
May 3, 2022 |
|
June 30, 2022 |
|
July 27, 2022 |
|
$ |
0.45 |
|
|
|
86,741 |
|
|
August 3, 2022 |
|
September 30, 2022 |
|
October 27, 2022 |
|
$ |
0.45 |
|
(1) |
|
98,756 |
|
* |
November 2, 2022 |
|
December 30, 2022 |
|
January 27, 2023 |
|
$ |
0.45 |
|
|
|
112,555 |
|
|
* In accordance with the Company’s DRIP, shares were purchased in the open market.
(1) $0.29 is considered capital gain distribution.
Holders
As of February 28, 2024, there were approximately 8 holders of record of our common stock (including Cede & Co.).
Issuer and Affiliate Purchases of Equity Securities
None.
Stock Performance Graph
This graph compares the stockholder return on our common stock from March 31, 2018 to December 31, 2023 with that of the Standard & Poor’s BDC Index and the Standard & Poor’s 500 Stock Index. This graph assumes that on March 31, 2018, $100 was invested in our common stock, the Standard & Poor’s BDC Index and the Standard & Poor’s 500 Stock Index. The graph also assumes the reinvestment of all cash dividends prior to any tax effect. The graph and other information furnished under this Part II Item 5 of this annual report on Form 10-K shall not be deemed to be “soliciting material” or to be “filed” with the SEC or subject to Regulation 14A or 14C under, or to the liabilities of Section 18 of, the Exchange Act. The stock price performance included in the below graph is not necessarily indicative of future stock performance.
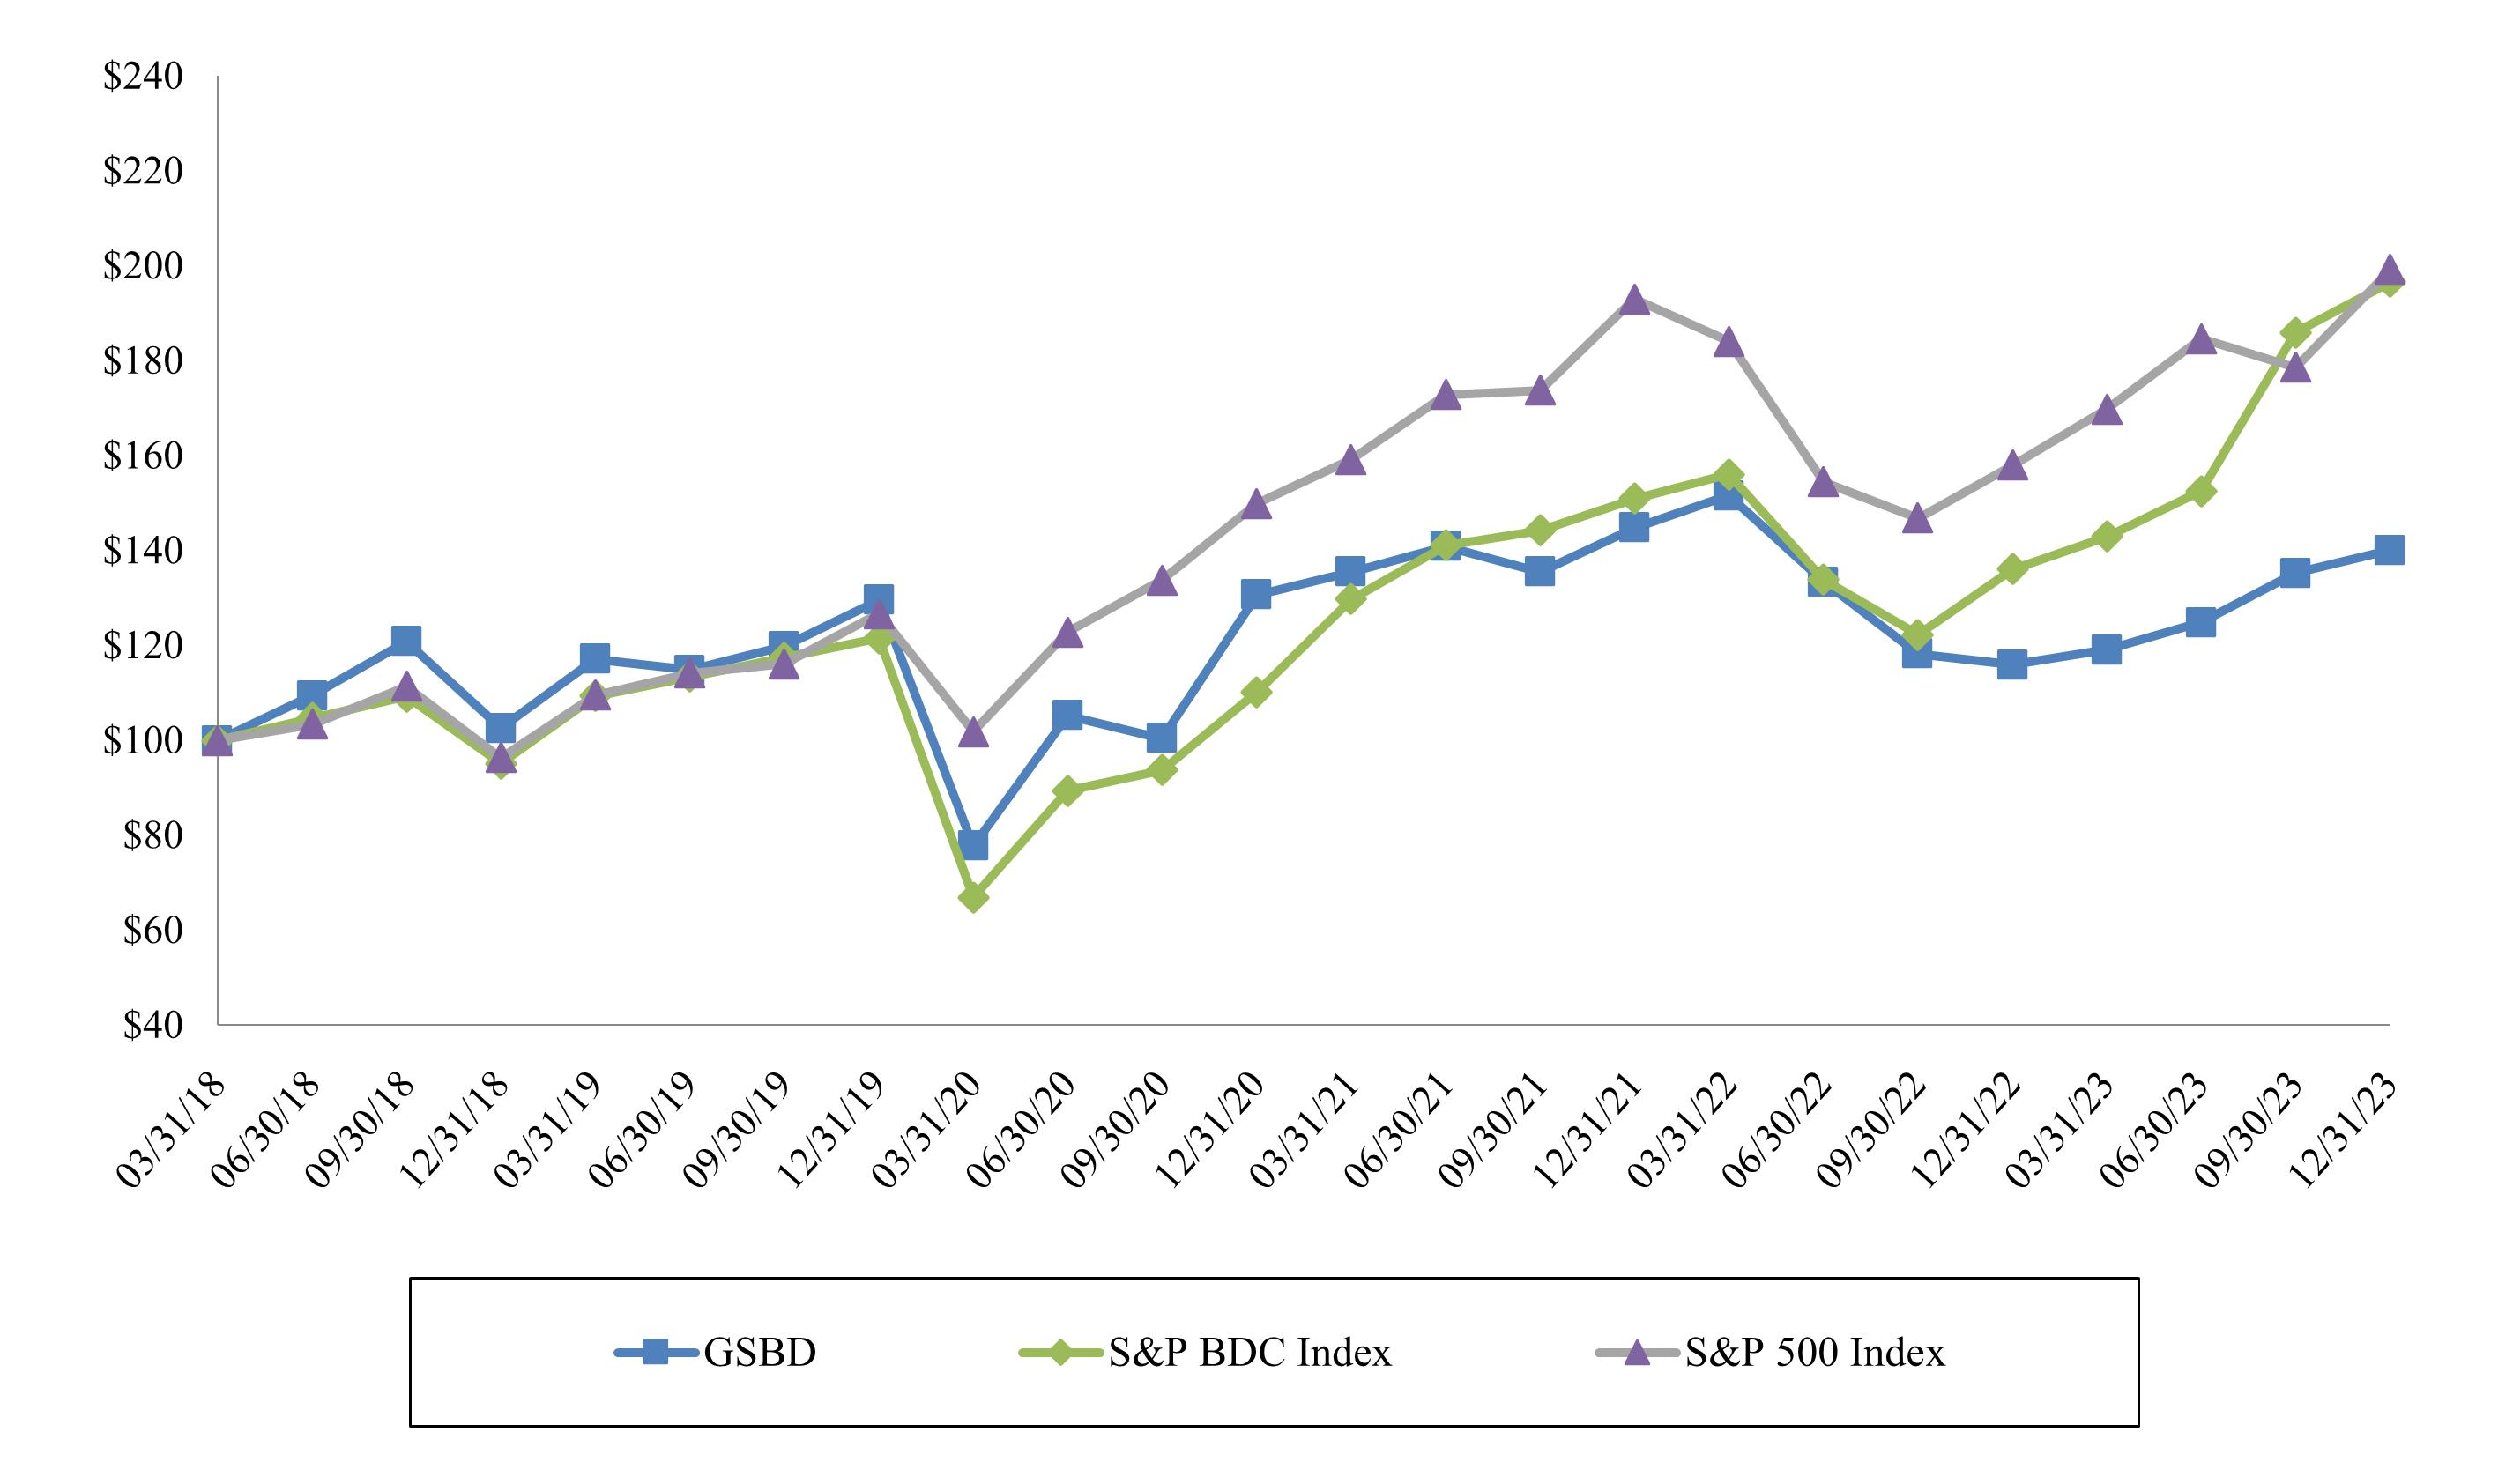
65
Fees and Expenses
The following table is intended to assist you in understanding the fees and expenses that an investor in our common stock will bear, directly or indirectly, based on the assumptions set forth below. We caution you that some of the percentages indicated in the table below are estimates and may vary. Except where the context suggests otherwise, whenever this Form 10-K contains a reference to our fees or expenses, we will pay such fees and expenses out of our net assets and, consequently, stockholders will indirectly bear such fees or expenses as investors in us.
Stockholder transaction expenses (as a percentage of offering price): |
|
|
|
Sales load (as a percentage of offering price) |
None(1) |
|
|
Offering expenses (as a percentage of offering price) |
None(1) |
|
|
Dividend reinvestment plan expenses(3) |
None(2) |
|
|
Total stockholder transaction expenses (as a percentage of offering price) |
None |
|
|
Annual expenses (as a percentage of net assets attributable to common stock):(4) |
|
|
|
Base management fees(5) |
|
% |
|
Incentive fees(6) |
|
% |
|
Interest payments on borrowed funds(7) |
|
% |
|
Other expenses(8) |
|
% |
|
Total annual expenses |
|
% |
|
Although not reflected above, the Investment Adviser expects to continue to waive a portion of its management fee payable by us in an amount equal to any management fees it earns as an investment adviser for any affiliated money market funds in which we invest.
Example
The following example demonstrates the projected dollar amount of total cumulative expenses that would be incurred over various periods with respect to a hypothetical investment in our common stock. In calculating the following expense amounts, we have assumed that our annual operating expenses remain at the levels set forth in the table above, except for the Incentive Fee based on income. Transaction expenses are not included in the following example.
|
1 year |
|
3 years |
|
5 years |
|
10 years |
|
||||
You would pay the following expenses on a $1,000 common stock investment, assuming a 5% annual return (none of which is subject to the Incentive Fee based on capital gains) |
|
|
|
|
|
|
|
|
||||
You would pay the following expenses on a $1,000 common stock investment, assuming a 5% annual return resulting entirely from net realized capital gains (all of which is subject to the Incentive Fee based on capital gains) |
|
109 |
|
|
311 |
|
|
492 |
|
|
867 |
|
The foregoing table is to assist you in understanding the various costs and expenses that an investor in our common stock will bear directly or indirectly. While the example assumes, as required by the SEC, a 5% annual return, our performance will vary and may result in a return greater or less than 5%. The Incentive Fee under our Investment Management Agreement, which, assuming a 5% annual return, would either not be payable or would have an insignificant impact on the expense amounts shown above, is not included in the example. The example assumes reinvestment of all distributions at NAV. In addition, while the example assumes reinvestment of all dividends and distributions at
66
NAV, under certain circumstances, reinvestment of dividends and other distributions under our DRIP may occur at a price per share that differs from NAV. See “Item 1. Business—Dividend Reinvestment Plan.”
This example and the expenses in the table above should not be considered a representation of our future expenses, and actual expenses (including the cost of debt, if any, and other expenses) may be greater or less than those shown.
Senior Securities
Information about our senior securities is shown in the following tables as of the end of the last ten fiscal years. The report of our independent registered public accounting firm, PricewaterhouseCoopers LLP, as of December 31, 2023, is included within “Item 8. Consolidated Financial Statements and Supplementary Data."
Class and Year |
|
Total Amount Outstanding Exclusive of Treasury Securities(1) |
|
|
Asset Coverage |
|
|
Involuntary Liquidating |
|
Average Market |
||
Revolving Credit Facility |
|
(in millions) |
|
|
|
|
|
|
|
|
||
December 31, 2023 |
|
$ |
|
|
$ |
|
|
— |
|
N/A |
||
December 31, 2022 |
|
$ |
|
|
$ |
|
|
— |
|
N/A |
||
December 31, 2021 |
|
$ |
|
|
$ |
|
|
— |
|
N/A |
||
December 31, 2020 |
|
$ |
|
|
$ |
|
|
— |
|
N/A |
||
December 31, 2019 |
|
$ |
|
|
$ |
|
|
— |
|
N/A |
||
December 31, 2018 |
|
$ |
|
|
$ |
|
|
— |
|
N/A |
||
December 31, 2017 |
|
$ |
|
|
$ |
|
|
— |
|
N/A |
||
December 31, 2016 |
|
$ |
|
|
$ |
|
|
— |
|
N/A |
||
December 31, 2015 |
|
$ |
|
|
$ |
|
|
— |
|
N/A |
||
December 31, 2014 |
|
$ |
|
|
$ |
|
|
— |
|
N/A |
||
Convertible Notes due 2022(5) |
|
|
|
|
|
|
|
|
|
|
||
December 31, 2023 |
|
$ |
— |
|
|
N/A |
|
|
— |
|
N/A |
|
December 31, 2022 |
|
$ |
— |
|
|
N/A |
|
|
— |
|
N/A |
|
December 31, 2021 |
|
$ |
|
|
$ |
|
|
— |
|
N/A |
||
December 31, 2020 |
|
$ |
|
|
$ |
|
|
— |
|
N/A |
||
December 31, 2019 |
|
$ |
|
|
$ |
|
|
— |
|
N/A |
||
December 31, 2018 |
|
$ |
|
|
$ |
|
|
— |
|
N/A |
||
December 31, 2017 |
|
$ |
|
|
$ |
|
|
— |
|
N/A |
||
December 31, 2016 |
|
$ |
|
|
$ |
|
|
— |
|
N/A |
||
Unsecured Notes due 2025 |
|
|
|
|
|
|
|
|
|
|
||
December 31, 2023 |
|
$ |
|
|
$ |
|
|
— |
|
N/A |
||
December 31, 2022 |
|
$ |
|
|
$ |
|
|
— |
|
N/A |
||
December 31, 2021 |
|
$ |
|
|
$ |
|
|
— |
|
N/A |
||
December 31, 2020 |
|
$ |
|
|
$ |
|
|
— |
|
N/A |
||
Unsecured Notes due 2026 |
|
|
|
|
|
|
|
|
|
|
||
December 31, 2023 |
|
$ |
|
|
$ |
|
|
— |
|
N/A |
||
December 31, 2022 |
|
$ |
|
|
$ |
|
|
— |
|
N/A |
||
December 31, 2021 |
|
$ |
|
|
$ |
|
|
— |
|
N/A |
||
December 31, 2020 |
|
$ |
|
|
$ |
|
|
— |
|
N/A |
||
Foreign Currency Forward Contracts(6) |
|
|
|
|
|
|
|
|
|
|
||
December 31, 2023 |
|
$ |
|
|
$ |
|
|
— |
|
N/A |
||
December 31, 2022 |
|
$ |
|
|
$ |
|
|
— |
|
N/A |
||
December 31, 2021 |
|
$ |
|
|
$ |
|
|
— |
|
N/A |
||
December 31, 2020 |
|
$ |
|
|
$ |
|
|
— |
|
N/A |
||
December 31, 2019 |
|
$ |
|
|
$ |
|
|
— |
|
N/A |
||
December 31, 2018 |
|
$ |
|
|
$ |
|
|
— |
|
N/A |
||
ITEM 6. [RESERVED]
67
ITEM 7. MANAGEMENT’S DISCUSSION AND ANALYSIS OF FINANCIAL CONDITION AND RESULTS OF OPERATIONS
The following discussion and other parts of this report contain forward-looking information that involves risks and uncertainties. References to “we,” “us,” “our,” and the “Company,” mean Goldman Sachs BDC, Inc. or Goldman Sachs BDC, Inc., together with its consolidated subsidiaries, as the context may require. The terms “GSAM,” “Goldman Sachs Asset Management,” our “Adviser” or our “Investment Adviser” refer to Goldman Sachs Asset Management, L.P., a Delaware limited partnership. The term “GS Group Inc.” refers to The Goldman Sachs Group, Inc. “GS & Co.” refers to Goldman Sachs & Co. LLC and its predecessors. The term “Goldman Sachs” refers to GS Group Inc., together with GS & Co., GSAM and its other subsidiaries and affiliates. The discussion and analysis contained in this section refer to our financial condition, results of operations and cash flows. The information contained in this section should be read in conjunction with the consolidated financial statements and notes thereto appearing elsewhere in this report. Please see “Cautionary Statement Regarding Forward-Looking Statements” for a discussion of the uncertainties, risks and assumptions associated with this discussion and analysis. Our actual results could differ materially from those anticipated by such forward-looking information due to factors discussed under “Cautionary Statement Regarding Forward-Looking Statements” appearing elsewhere in this report.
OVERVIEW
We are a specialty finance company focused on lending to middle-market companies. We are a closed-end management investment company that has elected to be regulated as a business development company (“BDC”) under the Investment Company Act. In addition, we have elected to be treated as a regulated investment company (“RIC”), and we expect to qualify annually for tax treatment as a RIC under Subchapter M of the Internal Revenue Code of 1986, as amended (the “Code”), commencing with our taxable year ended December 31, 2013. From our formation in 2012 through December 31, 2023, we originated approximately $7.33 billion in aggregate principal amount of debt and equity investments prior to any subsequent exits and repayments. We seek to generate current income and, to a lesser extent, capital appreciation primarily through direct originations of secured debt, including first lien, unitranche debt, including last-out portions of such loans, and second lien debt, and unsecured debt, including mezzanine debt, as well as through select equity investments.
“Unitranche” loans are first lien loans that extend deeper in a borrower’s capital structure than traditional first lien debt and may provide for a waterfall of cash flow priority between different lenders in such loan. In a number of instances, we may find another lender to provide the “first-out” portion of a unitranche loan while we retain the “last-out” portion of such loan, in which case, the “first-out” portion of the loan would generally receive priority with respect to the payment of principal, interest and any other amounts due thereunder as compared to the “last-out” portion that we would continue to hold. In exchange for taking greater risk of loss, the “last-out” portion generally earns a higher interest rate than the “first-out” portion of the loan. We use the term “mezzanine” to refer to debt that ranks senior in right of payment only to a borrower’s equity securities and ranks junior in right of payment to all of such borrower’s other indebtedness. We may make multiple investments in the same portfolio company.
We may also originate “covenant-lite” loans, which are loans with fewer financial maintenance covenants than other obligations, or no financial maintenance covenants. Such covenant-lite loans may not include terms that allow the lender to monitor the performance of the borrower or to declare a default if certain criteria are breached. These flexible covenants (or the absence of covenants) could permit borrowers to experience a significant downturn in their results of operations without triggering any default that would permit holders of their debt (such as us) to accelerate indebtedness or negotiate terms and pricing. In the event of default, covenant-lite loans may recover less value than traditional loans as the lender may not have an opportunity to negotiate with the borrower prior to such default.
We invest primarily in U.S. middle-market companies, which we believe are underserved by traditional providers of capital such as banks and the public debt markets. In this report, we generally use the term “middle market companies” to refer to companies with between $5 million and $200 million of annual earnings before interest expense, income tax expense, depreciation and amortization (“EBITDA”) excluding certain one-time, and non-recurring items that are outside the operations of these companies. However, we may from time to time invest in larger or smaller companies. We generate revenues primarily through receipt of interest income from the investments we hold. In addition, we may generate income from various loan origination and other fees, dividends on direct equity investments and capital gains on the sales of investments. Fees received from portfolio companies (directors’ fees, consulting fees, administrative fees, tax advisory fees and other similar compensation) are paid to us, unless, to the extent required by applicable law or exemptive relief therefrom, we only receive our allocable portion of such fees when invested in the same portfolio company as another client account managed by our Investment Adviser (collectively with us, the “Accounts”). The companies in which we invest use our capital for a variety of purposes, including to support organic growth, fund acquisitions, make capital investments or refinance indebtedness.
Our origination strategy focuses on leading the negotiation and structuring of the loans or securities in which we invest and holding the investments in our portfolio to maturity. In many cases, we are the sole investor in the loan or security in our portfolio. Where there are multiple investors, we generally seek to control or obtain significant influence over the rights of investors in the loan or security. We generally seek to make investments that have maturities between three and ten years and range in size between $10 million and $75 million, although we may make larger or smaller investments on occasion.
For a discussion of the competitive landscape we face, please see “Item 1A. Risk Factors—Competition—We operate in a highly competitive market for investment opportunities” and “Item 1. Business—Competitive Advantages.”
68
Replacement of Interbank Offered Rates (IBORs) Including the London Interbank Offered Rate (“LIBOR”):
On July 1, 2023, the publication of all LIBOR settings as representative rates ceased. The Financial Conduct Authority has allowed the publication and use of synthetic rates for certain U.S. dollar (“USD”) LIBOR settings in legal USD LIBOR-based contracts through September 2024. Since January 1, 2022, our new investments have generally been indexed to SOFR. As of December 31, 2023, we have facilitated an orderly transition of our investments and our Revolving Credit Facility (as defined below) to SOFR or to alternative risk-free reference rates.
KEY COMPONENTS OF OPERATIONS
Investments
Our level of investment activity can and does vary substantially from period to period depending on many factors, including the amount of debt and equity capital available to middle-market companies, the level of merger and acquisition activity for such companies, the general economic environment, the amount of capital we have available to us and the competitive environment for the type of investments we make.
As a BDC, we may not acquire any assets other than “qualifying assets” specified in the Investment Company Act, unless, at the time the acquisition is made, at least 70% of our total assets are qualifying assets (with certain limited exceptions). Qualifying assets include investments in “eligible portfolio companies.” Pursuant to rules adopted by the Securities and Exchange Commission (the “SEC”), “eligible portfolio companies” include certain companies that do not have any securities listed on a national securities exchange and public companies whose securities are listed on a national securities exchange but whose market capitalization is less than $250 million.
Revenues
We generate revenues in the form of interest income on debt investments and, to a lesser extent, capital gains and distributions, if any, on equity securities that we may acquire in portfolio companies. Some of our investments may provide for deferred interest payments or payment-in-kind (“PIK”) income. The principal amount of the debt investments and any accrued but unpaid interest generally becomes due at the maturity date.
We generate revenues primarily through receipt of interest income from the investments we hold. In addition, we may generate revenue in the form of commitment, origination, structuring, syndication, exit fees or diligence fees, fees for providing managerial assistance and consulting fees. Portfolio company fees (directors’ fees, consulting fees, administrative fees, tax advisory fees and other similar compensation) will be paid to us, unless, to the extent required by applicable law or exemptive relief, if any, therefrom, we receive our allocable portion of such fees when invested in the same portfolio company as other Accounts, which other Accounts could receive their allocable portion of such fee. We do not expect to receive material fee income as it is not our principal investment strategy. We record contractual prepayment premiums on loans and debt securities as interest income.
Dividend income on preferred equity investments is recorded on an accrual basis to the extent that such amounts are payable by the portfolio company and are expected to be collected. Dividend income on common equity investments is recorded on the record date for private portfolio companies and on the ex-dividend date for publicly traded portfolio companies. Interest and dividend income are presented net of withholding tax, if any.
Expenses
Our primary operating expenses include the payment of the management fee (the “Management Fee”) and the incentive fee (the “Incentive Fee”) to our Investment Adviser, legal and professional fees, interest and other debt expenses and other operating and overhead related expenses. The Management Fee and Incentive Fee compensate our Investment Adviser for its work in identifying, evaluating, negotiating, closing and monitoring our investments. We bear all other expenses of our operations and transactions in accordance with the investment management agreement (the “Investment Management Agreement”) and administration agreement (the “Administration Agreement”), including:
69
We expect our general and administrative expenses to be relatively stable or decline as a percentage of total assets during periods of asset growth and to increase during periods of asset declines. Costs relating to future offerings of securities would be incremental.
Leverage
Our senior secured revolving credit agreement (as amended, the “Revolving Credit Facility”) with Truist Bank, as administrative agent, and Bank of America, N.A., as syndication agent, our 3.75% Notes due 2025 (the “2025 Notes”), and our 2.875% Notes due 2026 (the “2026 Notes”) allow us to borrow money and lever our investment portfolio, subject to the limitations of the Investment Company Act, with the objective of increasing our yield. This is known as “leverage” and could increase or decrease returns to our stockholders. The use of leverage involves significant risks. We are permitted to borrow amounts such that our asset coverage ratio, as defined in the Investment Company Act, is at least 150% after such borrowing (if certain requirements are met).
Certain trading practices and investments, such as reverse repurchase agreements, may be considered borrowings or involve leverage and thus may be subject to Investment Company Act restrictions. Short-term credits necessary for the settlement of securities transactions and arrangements with respect to securities lending will not be considered borrowings for these purposes. Practices and investments that may involve leverage but are not considered borrowings are not subject to the Investment Company Act’s asset coverage requirement. The amount of leverage that we employ will depend on the assessment by our Investment Adviser and our board of directors (the "Board of Directors" or the “Board”) of market conditions and other factors at the time of any proposed borrowing.
PORTFOLIO AND INVESTMENT ACTIVITY
Our portfolio (excluding investments in money market funds, if any) consisted of the following:
|
|
As of |
|
||||||||||||
|
|
December 31, 2023 |
|
December 31, 2022 |
|
||||||||||
|
|
Amortized |
|
|
Fair |
|
Amortized |
|
|
Fair |
|
||||
|
|
(in millions) |
|
(in millions) |
|
||||||||||
First Lien/Senior Secured Debt |
|
$ |
3,209.94 |
|
|
$ |
3,107.47 |
|
$ |
3,174.53 |
|
|
$ |
3,129.55 |
|
First Lien/Last-Out Unitranche |
|
|
148.07 |
|
|
|
144.74 |
|
|
120.25 |
|
|
|
116.23 |
|
Second Lien/Senior Secured Debt |
|
|
84.62 |
|
|
|
66.56 |
|
|
255.35 |
|
|
|
174.33 |
|
Unsecured Debt |
|
|
27.93 |
|
|
|
27.31 |
|
|
8.79 |
|
|
|
7.63 |
|
Preferred Stock |
|
|
44.20 |
|
|
|
37.30 |
|
|
48.26 |
|
|
|
42.38 |
|
Common Stock |
|
|
57.18 |
|
|
|
30.70 |
|
|
82.01 |
|
|
|
35.49 |
|
Warrants |
|
|
1.85 |
|
|
|
0.25 |
|
|
1.85 |
|
|
|
0.61 |
|
Total Investments |
|
$ |
3,573.79 |
|
|
$ |
3,414.33 |
|
$ |
3,691.04 |
|
|
$ |
3,506.22 |
|
70
The weighted average yield by asset type of our total portfolio (excluding investments in money market funds, if any), at amortized cost and fair value, was as follows:
|
|
As of |
|
|||||||||||||
|
|
December 31, 2023 |
|
|
December 31, 2022 |
|
||||||||||
|
|
Amortized |
|
|
Fair |
|
|
Amortized |
|
|
Fair |
|
||||
Weighted Average Yield(1) |
|
|
|
|
|
|
|
|
|
|
|
|
||||
First Lien/Senior Secured Debt(2) |
|
|
12.1 |
% |
|
|
13.5 |
% |
|
|
11.4 |
% |
|
|
11.9 |
% |
First Lien/Last-Out Unitranche(2) (3) |
|
|
13.1 |
|
|
|
14.4 |
|
|
|
12.5 |
|
|
|
15.2 |
|
Second Lien/Senior Secured Debt(2) |
|
|
9.2 |
|
|
|
11.4 |
|
|
|
10.8 |
|
|
|
18.9 |
|
Unsecured Debt(2) |
|
|
15.4 |
|
|
|
15.7 |
|
|
|
14.4 |
|
|
|
16.7 |
|
Preferred Stock(4) |
|
|
— |
|
|
|
— |
|
|
|
— |
|
|
|
— |
|
Common Stock(4) |
|
|
— |
|
|
|
— |
|
|
|
— |
|
|
|
— |
|
Warrants(4) |
|
|
— |
|
|
|
— |
|
|
|
— |
|
|
|
— |
|
Total Portfolio |
|
|
11.8 |
% |
|
|
13.2 |
% |
|
|
11.0 |
% |
|
|
12.1 |
% |
As of December 31, 2023, the total portfolio weighted average yield measured at amortized cost and fair value was 11.8% and 13.2%, as compared to 11.0% and 12.1% as of December 31, 2022. The increase in the weighted average yield at fair value was primarily driven by the rising interest rates. Within First Lien/Senior Secured Debt, the increase in weighted average yield at fair value was also driven by financial underperformance of certain investments. Within Second Lien/Senior Secured Debt, the decrease in weighted average yield at cost and fair value was primarily driven by the recapitalization of our investment in Zep Inc. Within Unsecured Debt, the increase in weighted average yield at cost and the decrease in weighted average yield at fair value were primarily driven by the recapitalization of our investment in Wine.com.
The following table presents certain selected information regarding our investment portfolio (excluding investments in money market funds, if any):
|
|
As of |
|
||||||
|
|
December 31, 2023 |
|
|
December 31, 2022 |
|
|||
Number of portfolio companies |
|
|
144 |
|
|
|
|
134 |
|
Percentage of performing debt bearing a floating rate(1) |
|
|
99.9 |
% |
|
|
|
99.2 |
% |
Percentage of performing debt bearing a fixed rate(1)(2) |
|
|
0.1 |
% |
|
|
|
0.8 |
% |
Weighted average yield on debt and income producing investments, at amortized cost(3) |
|
|
12.6 |
% |
|
|
|
11.7 |
% |
Weighted average yield on debt and income producing investments, at fair value(3) |
|
|
13.8 |
% |
|
|
|
12.5 |
% |
Weighted average leverage (net debt/EBITDA)(4) |
|
6.1x |
|
|
|
6.1x |
|
||
Weighted average interest coverage(4) |
|
1.5x |
|
|
|
1.6x |
|
||
Median EBITDA(4) |
$ |
53.98 million |
|
|
$ |
49.62 million |
|
||
For a particular portfolio company, we also calculate the level of contractual interest expense owed by the portfolio company and compare that amount to EBITDA (“interest coverage ratio”). We believe this calculation method assists in describing the risk of our portfolio investments, as it takes into consideration contractual interest obligations of the portfolio company. Weighted average interest coverage is weighted based on the fair value of our performing debt investments, excluding investments where interest coverage may not be the appropriate measure of credit risk, such as cash collateralized loans and investments that are underwritten and covenanted based on recurring revenue.
Median EBITDA is based on our debt investments, excluding investments where net debt to EBITDA may not be the appropriate measure of credit risk, such as cash collateralized loans and investments that are underwritten and covenanted based on recurring revenue.
71
Portfolio company statistics are derived from the most recently available financial statements of each portfolio company as of the reported end date. Statistics of the portfolio companies have not been independently verified by us and may reflect a normalized or adjusted amount. As of December 31, 2023 and December 31, 2022, investments where net debt to EBITDA may not be the appropriate measure of credit risk represented 42.9% and 41.8% of total debt investments.
Our Investment Adviser monitors the financial trends of each portfolio company on an ongoing basis to determine if it is meeting its respective business plan and to assess the appropriate course of action for each portfolio company. Our Investment Adviser has several methods of evaluating and monitoring the performance and fair value of our investments, which may include: (i) assessment of success in adhering to the portfolio company’s business plan and compliance with covenants; (ii) periodic or regular contact with portfolio company management and, if appropriate, the financial or strategic sponsor to discuss financial position, requirements and accomplishments; (iii) comparisons to our other portfolio companies in the industry, if any; (iv) attendance at and participation in Board meetings or presentations by portfolio companies; and (v) review of monthly and quarterly financial statements and financial projections of portfolio companies.
As part of the monitoring process, our Investment Adviser also employs an investment rating system to categorize our investments. In addition to various risk management and monitoring tools, our Investment Adviser grades the credit risk of all investments on a scale of 1 to 4 no less frequently than quarterly. This system is intended primarily to reflect the underlying risk of a portfolio investment relative to our initial cost basis in respect of such portfolio investment (e.g., at the time of origination or acquisition), although it may also take into account under certain circumstances the performance of the portfolio company’s business, the collateral coverage of the investment and other relevant factors. The grading system for our investments is as follows:
Our Investment Adviser grades the investments in our portfolio at least quarterly and it is possible that the grade of a portfolio investment may be reduced or increased over time. For investments graded 3 or 4, our Investment Adviser enhances its level of scrutiny over the monitoring of such portfolio company. The following table shows the composition of our portfolio on the 1 to 4 grading scale:
|
|
As of |
|
|||||||||||||
|
|
December 31, 2023 |
|
|
December 31, 2022 |
|
||||||||||
Investment Performance Rating |
|
Fair Value |
|
|
Percentage |
|
|
Fair Value |
|
|
Percentage |
|
||||
|
|
(in millions) |
|
|
|
|
|
(in millions) |
|
|
|
|
||||
Grade 1 |
|
$ |
46.81 |
|
|
|
1.4 |
% |
|
$ |
— |
|
|
|
— |
% |
Grade 2 |
|
|
3,014.62 |
|
|
|
88.2 |
|
|
|
3,402.96 |
|
|
|
97.1 |
|
Grade 3 |
|
|
272.01 |
|
|
|
8.0 |
|
|
|
91.55 |
|
|
|
2.6 |
|
Grade 4 |
|
|
80.89 |
|
|
|
2.4 |
|
|
|
11.71 |
|
|
|
0.3 |
|
Total Investments |
|
$ |
3,414.33 |
|
|
|
100.0 |
% |
|
$ |
3,506.22 |
|
|
|
100.0 |
% |
The increase in investments with a grade 1 investment performance rating was driven by investments with an aggregate fair value of $46.81 million being upgraded from grade 2 due to potential exits. The increase in investments with a grade 4 investment performance rating was primarily driven by investments with an aggregate fair value of $73.60 million being downgraded from grade 2 and grade 3 due to financial underperformance, partially offset by the exit of investments with an aggregate fair value of $7.92 million. The increase in investments with a grade 3 investment performance rating was primarily driven by investments with an aggregate fair value of $160.85 million being downgraded from grade 2 due to financial underperformance, partially offset by the exit of an investment with a fair value of $8.47 million.
72
The following table shows the amortized cost of our performing and non-accrual investments:
|
|
As of |
|
|||||||||||||
|
|
December 31, 2023 |
|
|
December 31, 2022 |
|
||||||||||
|
|
Amortized |
|
|
Percentage |
|
|
Amortized |
|
|
Percentage |
|
||||
|
|
(in millions) |
|
|
|
|
|
(in millions) |
|
|
|
|
||||
Performing |
|
$ |
3,437.55 |
|
|
|
96.2 |
% |
|
$ |
3,613.76 |
|
|
|
97.9 |
% |
Non-accrual |
|
|
136.24 |
|
|
|
3.8 |
|
|
|
77.28 |
|
|
|
2.1 |
|
Total Investments |
|
$ |
3,573.79 |
|
|
|
100.0 |
% |
|
$ |
3,691.04 |
|
|
|
100.0 |
% |
Investments are placed on non-accrual status when it is probable that principal, interest or dividends will not be collected according to the contractual terms. Accrued interest or dividends generally are reversed when an investment is placed on non-accrual status. Interest or dividend payments received on non-accrual investments may be recognized as income or applied to principal depending upon management’s judgment. Non-accrual investments are restored to accrual status when past due principal and interest or dividends are paid and, in management’s judgment, principal and interest or dividend payments are likely to remain current. We may make exceptions to this treatment if the loan has sufficient collateral value and is in the process of collection.
The following table shows our investment activity by investment type(1):
|
|
For the Years Ended December 31, |
|
|||||
|
|
2023 |
|
|
2022 |
|
||
|
|
($ in millions) |
|
|||||
Amount of investments committed at cost: |
|
|
|
|
|
|
||
First Lien/Senior Secured Debt |
|
$ |
383.57 |
|
|
$ |
700.85 |
|
First Lien/Last-Out Unitranche |
|
|
39.57 |
|
|
|
39.64 |
|
Second Lien/Senior Secured Debt |
|
|
— |
|
|
|
3.00 |
|
Unsecured Debt |
|
|
— |
|
|
|
6.06 |
|
Common Stock |
|
|
— |
|
|
|
2.60 |
|
Total |
|
$ |
423.14 |
|
|
$ |
752.15 |
|
Proceeds from investments sold or repaid: |
|
|
|
|
|
|
||
First Lien/Senior Secured Debt |
|
$ |
356.88 |
|
|
$ |
521.68 |
|
First Lien/Last-Out Unitranche |
|
|
0.41 |
|
|
|
61.30 |
|
Second Lien/Senior Secured Debt |
|
|
147.77 |
|
|
|
29.20 |
|
Preferred Stock |
|
|
7.08 |
|
|
|
— |
|
Common Stock |
|
|
7.05 |
|
|
|
— |
|
Total |
|
$ |
519.19 |
|
|
$ |
612.18 |
|
Net increase (decrease) in portfolio |
|
$ |
(96.05 |
) |
|
$ |
139.97 |
|
Number of new portfolio companies with new investment commitments |
|
|
27 |
|
|
|
20 |
|
Total new investment commitment amount in new portfolio companies |
|
$ |
206.92 |
|
|
$ |
433.62 |
|
Average new investment commitment amount in new portfolio companies |
|
$ |
7.66 |
|
|
$ |
21.68 |
|
Number of existing portfolio companies with new investment commitments |
|
|
13 |
|
|
|
29 |
|
Total new investment commitment amount in existing portfolio companies |
|
$ |
216.22 |
|
|
$ |
318.53 |
|
Weighted average remaining term for new investment commitments (in years)(2) |
|
|
5.0 |
|
|
|
5.0 |
|
Percentage of new debt investment commitments at cost for floating interest rates |
|
|
100.0 |
% |
|
|
98.1 |
% |
Percentage of new debt investment commitments at cost for fixed interest rates(3) |
|
—% |
|
|
|
1.9 |
% |
|
Weighted average yield on new debt and income producing investment commitments(4) |
|
|
12.2 |
% |
|
|
8.8 |
% |
Weighted average yield on new investment commitments(5) |
|
|
12.2 |
% |
|
|
8.7 |
% |
Weighted average yield on debt and income producing investments sold or repaid(6) |
|
|
12.2 |
% |
|
|
8.5 |
% |
Weighted average yield on investments sold or repaid(7) |
|
|
11.9 |
% |
|
|
7.6 |
% |
73
RESULTS OF OPERATIONS
The comparison for the years ended December 31, 2022 and 2021 can be found in Item 7. Management's Discussion and Analysis of Financial Condition and Results of Operations in our Form 10-K for the fiscal year ended December 31, 2022.
Our operating results were as follows:
|
|
For the Years Ended December 31, |
|
|||||
|
|
2023 |
|
|
2022 |
|
||
|
|
($ in millions) |
|
|||||
Total investment income |
|
$ |
454.91 |
|
|
$ |
357.45 |
|
Net expenses |
|
|
202.83 |
|
|
|
124.43 |
|
Net investment income before taxes |
|
|
252.08 |
|
|
|
233.02 |
|
Income tax expense, including excise tax |
|
|
4.84 |
|
|
|
4.45 |
|
Net investment income after taxes |
|
|
247.24 |
|
|
|
228.57 |
|
Net realized gain (loss) on investments |
|
|
(71.78 |
) |
|
|
(18.96 |
) |
Net unrealized appreciation (depreciation) on investments |
|
|
25.36 |
|
|
|
(155.48 |
) |
Net realized and unrealized gain (losses) on forward contracts, translations and other transactions |
|
|
(4.31 |
) |
|
|
1.11 |
|
Net realized and unrealized gains (losses) |
|
|
(50.73 |
) |
|
|
(173.33 |
) |
Income tax (provision) benefit for realized and unrealized gains |
|
|
(0.64 |
) |
|
|
(0.24 |
) |
Net increase in net assets from operations |
|
$ |
195.87 |
|
|
$ |
55.00 |
|
Net increase in net assets from operations can vary from period to period as a result of various factors, including acquisitions, the level of new investment commitments, the recognition of realized gains and losses and changes in unrealized appreciation and depreciation in the investment portfolio.
On October 12, 2020, we completed our Merger with GS MMLC. The Merger was accounted for as an asset acquisition in accordance with ASC 805-50, Business Combinations — Related Issues. The consideration paid to GS MMLC’s stockholders was less than the aggregate fair values of the assets acquired and liabilities assumed, which resulted in a purchase discount (the “Purchase Discount”). The Purchase Discount was allocated to the cost of GS MMLC investments acquired by us on a pro-rata basis based on their relative fair values as of the closing date. Immediately following the Merger with GS MMLC, we marked the investments to their respective fair values and, as a result, the Purchase Discount allocated to the cost basis of the investments acquired was immediately recognized as unrealized appreciation on our Consolidated Statement of Operations. The Purchase Discount allocated to the loan investments acquired will amortize over the life of each respective loan through interest income with a corresponding adjustment recorded as unrealized depreciation on such loans acquired through their ultimate disposition. The Purchase Discount allocated to equity investments acquired will not amortize over the life of such investments through interest income and, assuming no subsequent change to the fair value of the equity investments acquired and disposition of such equity investments at fair value, we will recognize a realized gain with a corresponding reversal of the unrealized appreciation on disposition of such equity investments acquired.
As a supplement to our financial results reported in accordance with generally accepted accounting principles in the United States of America (“GAAP”), we have provided, as detailed below, certain non-GAAP financial measures to our operating results that exclude the aforementioned Purchase Discount and the ongoing amortization thereof, as determined in accordance with GAAP. The non-GAAP financial measures include (i) Adjusted net investment income after taxes; and (ii) Adjusted net realized and unrealized gains (losses). We believe that the adjustment to exclude the full effect of the Purchase Discount is meaningful because it is a measure that we and investors use to assess our financial condition and results of operations. Although these non-GAAP financial measures are intended to enhance investors’ understanding of our business and performance, these non-GAAP financial measures should not be considered an alternative to GAAP. The aforementioned non-GAAP financial measures may not be comparable to similar non-GAAP financial measures used by other companies.
|
|
For the Years Ended December 31, |
|
|||||
|
|
2023 |
|
|
2022 |
|
||
|
|
($ in millions) |
|
|||||
Net investment income after taxes |
|
$ |
247.24 |
|
|
$ |
228.57 |
|
Less: Purchase Discount amortization |
|
|
6.66 |
|
|
|
13.47 |
|
Adjusted net investment income after taxes |
|
$ |
240.58 |
|
|
$ |
215.10 |
|
|
|
|
|
|
|
|
||
Net realized and unrealized gains (losses) |
|
$ |
(50.73 |
) |
|
$ |
(173.33 |
) |
Less: Net change in unrealized appreciation (depreciation) due to the Purchase Discount |
|
|
(7.20 |
) |
|
|
(13.47 |
) |
Less: Realized gain (loss) due to the Purchase Discount |
|
|
0.54 |
|
|
|
— |
|
Adjusted net realized and unrealized gains (losses) |
|
$ |
(44.07 |
) |
|
$ |
(159.86 |
) |
74
Investment Income
Our investment income was as follows:
|
|
For the Years Ended December 31, |
|
|||||
|
|
2023 |
|
|
2022 |
|
||
|
|
($ in millions) |
|
|||||
Interest |
|
$ |
416.99 |
|
|
$ |
330.89 |
|
Payment-in-kind income |
|
|
33.87 |
|
|
|
21.22 |
|
Other income |
|
|
3.14 |
|
|
|
4.96 |
|
Dividend income |
|
|
0.91 |
|
|
|
0.38 |
|
Total Investment Income |
|
$ |
454.91 |
|
|
$ |
357.45 |
|
In the table above:
Expenses
Our expenses were as follows:
|
|
For the Years Ended December 31, |
|
|||||
|
|
2023 |
|
|
2022 |
|
||
|
|
($ in millions) |
|
|||||
Interest and other debt expenses |
|
$ |
111.30 |
|
|
$ |
79.46 |
|
Incentive fees |
|
|
49.42 |
|
|
|
12.02 |
|
Management fees |
|
|
35.47 |
|
|
|
36.00 |
|
Professional fees |
|
|
3.54 |
|
|
|
3.47 |
|
Directors’ fees |
|
|
0.82 |
|
|
|
0.83 |
|
Other general and administrative expenses |
|
|
4.27 |
|
|
|
4.37 |
|
Total Expenses |
|
$ |
204.82 |
|
|
$ |
136.15 |
|
Fee waivers |
|
|
(1.99 |
) |
|
|
(11.72 |
) |
Net Expenses |
|
$ |
202.83 |
|
|
$ |
124.43 |
|
In the table above:
Net Realized Gains (Losses) and Net Change in Unrealized Appreciation (Depreciation) on Investments
The realized gains and losses on fully exited and partially exited portfolio companies consisted of the following:
|
|
For the Years Ended December 31, |
|
|||||
|
|
2023 |
|
|
2022 |
|
||
|
|
($ in millions) |
|
|||||
Yasso, Inc. |
|
$ |
5.01 |
|
|
$ |
— |
|
Other, net |
|
|
(2.93 |
) |
|
|
(0.01 |
) |
Convene 237 Park Avenue, LLC (dba Convene) |
|
|
— |
|
|
|
(4.54 |
) |
Ansira Partners, Inc. |
|
|
(5.33 |
) |
|
|
— |
|
IHS Intermediate Inc. (dba Interactive Health Solutions) |
|
|
(9.90 |
) |
|
|
— |
|
Bolttech Mannings, Inc. |
|
|
(22.37 |
) |
|
|
(14.41 |
) |
National Spine and Pain Centers, LLC |
|
|
(36.26 |
) |
|
|
— |
|
Net realized gain (loss) on investments |
|
$ |
(71.78 |
) |
|
$ |
(18.96 |
) |
75
For the year ended December 31, 2023, net realized losses were primarily driven by the exit of our investments in two portfolio companies. In February 2023, we fully exited our second lien debt investment and common stock investment in National Spine and Pain Centers, LLC, which resulted in a realized loss of $36.26 million. In December 2023, we fully exited our common stock investment in Bolttech Mannings, Inc., which resulted in a realized loss of $22.37 million.
For the year ended December 31, 2022, net realized losses were primarily driven by the exit of our investments in two portfolio companies. In December 2022, we fully exited our second lien debt investment in Bolttech Mannings, Inc., which resulted in a realized loss of $14.41 million. In April 2022, we fully exited our first lien debt investments in Convene 237 Park Avenue, LLC (dba Convene), which resulted in a realized loss of $4.54 million.
Any changes in fair value are recorded as a change in unrealized appreciation (depreciation) on investments. For further details on the valuation process, refer to Note 2 “Significant Accounting Policies—Investments” in our consolidated financial statements. Net change in unrealized appreciation (depreciation) on investments consisted of the following:
|
|
For the Years Ended December 31, |
|
|||||
|
|
2023 |
|
|
2022 |
|
||
|
|
($ in millions) |
|
|||||
Unrealized appreciation |
|
$ |
112.63 |
|
|
$ |
16.56 |
|
Unrealized depreciation |
|
|
(87.27 |
) |
|
|
(172.04 |
) |
Net Change in Unrealized Appreciation (Depreciation) on Investments |
|
$ |
25.36 |
|
|
$ |
(155.48 |
) |
The net change in unrealized appreciation (depreciation) on investments consisted of the following:
|
|
For the Year Ended |
|
|
Portfolio Company: |
|
($ in millions) |
|
|
National Spine and Pain Centers, LLC |
|
$ |
36.26 |
|
Bolttech Mannings, Inc. |
|
|
22.37 |
|
Zep Inc. |
|
|
16.83 |
|
IHS Intermediate Inc. (dba Interactive Health Solutions) |
|
|
9.90 |
|
CloudBees, Inc. |
|
|
2.39 |
|
Lithium Technologies, Inc. |
|
|
(3.21 |
) |
Wine.com, LLC |
|
|
(7.42 |
) |
Other, net(1) |
|
|
(9.89 |
) |
Thrasio, LLC |
|
|
(12.26 |
) |
Sweep Purchaser LLC |
|
|
(12.53 |
) |
Zodiac Intermediate, LLC (dba Zipari) |
|
|
(17.08 |
) |
Total |
|
$ |
25.36 |
|
Net change in unrealized appreciation (depreciation) in our investments for the year ended December 31, 2023 was primarily driven by the reversal of unrealized depreciation in connection with the aforementioned exit of our investments in National Spine and Pain Centers, LLC and Bolttech Mannings, Inc., and by the reversal of the unrealized depreciation in connection with the recapitalization of our second lien debt investment in Zep Inc. The appreciation was partially offset by the financial underperformance of Zodiac Intermediate, LLC (dba Zipari), Sweep Purchaser LLC and Thrasio, LLC.
76
|
|
For the Year Ended |
|
|
Portfolio Company: |
|
($ in millions) |
|
|
Convene 237 Park Avenue, LLC (dba Convene) |
|
$ |
8.93 |
|
ATX Parent Holdings, LLC - Class A Units |
|
|
3.08 |
|
Iracore International Holdings, Inc. |
|
|
1.04 |
|
Broadway Parent, LLC |
|
|
0.71 |
|
Yasso, Inc. |
|
|
0.62 |
|
Animal Supply Intermediate, LLC |
|
|
(6.94 |
) |
Bolttech Mannings, Inc. |
|
|
(7.37 |
) |
Wine.com, LLC |
|
|
(8.86 |
) |
Zep Inc. |
|
|
(19.70 |
) |
National Spine and Pain Centers, LLC |
|
|
(36.48 |
) |
Other, net(1) |
|
|
(90.51 |
) |
Total |
|
$ |
(155.48 |
) |
Net change in unrealized appreciation (depreciation) in our investments for the year ended December 31, 2022 was primarily driven by the increase in market volatility and widening credit spreads and the financial underperformance of National Spine and Pain Centers, LLC and Zep Inc.
FINANCIAL CONDITION, LIQUIDITY AND CAPITAL RESOURCES
The primary use of existing funds and any funds raised in the future is expected to be for our investments in portfolio companies, cash distributions to our stockholders or for other general corporate purposes, including paying for operating expenses or debt service to the extent we borrow or issue senior securities.
We expect to generate cash primarily from the net proceeds of any future offerings of securities, future borrowings and cash flows from operations. To the extent we determine that additional capital would allow us to take advantage of additional investment opportunities, if the market for debt financing presents attractively priced debt financing opportunities, or if our Board of Directors otherwise determines that leveraging our portfolio would be in our best interest and the best interests of our stockholders, we may enter into credit facilities in addition to our existing credit facilities, as discussed below, or issue other senior securities. We would expect any such credit facilities may be secured by certain of our assets and may contain advance rates based upon pledged collateral. The pricing and other terms of any such facilities would depend upon market conditions when we enter into any such facilities as well as the performance of our business, among other factors. As a BDC, with certain limited exceptions, we are only permitted to borrow amounts such that our asset coverage ratio, as defined in the Investment Company Act, is at least 150% after such borrowing (if certain requirements are met). See “—Key Components of Operations—Leverage.” As of December 31, 2023 and December 31, 2022, our asset coverage ratio based on the aggregate amount outstanding of our senior securities was 187% and 174%. We may also refinance or repay any of our indebtedness at any time based on our financial condition and market conditions.
We may enter into investment commitments through signed commitment letters that may ultimately become investment transactions in the future. We regularly evaluate and carefully consider our unfunded commitments using GSAM’s proprietary risk management framework for the purpose of planning our capital resources and ongoing liquidity, including our financial leverage.
Equity Issuances
We may from time to time issue and sell shares of our common stock through public or at-the-market ("ATM”) offerings. On May 26, 2022, we entered into (i) an equity distribution agreement by and among us, GSAM and Truist Securities, Inc. (“Truist”) and (ii) an equity distribution agreement by and among us, GSAM and SMBC Nikko Securities America, Inc (“SMBC”). The equity distribution agreements with Truist and SMBC described in the preceding sentence are collectively referred to herein as the “2022 Equity Distribution Agreements.” On and effective August 1, 2023, we terminated the 2022 Equity Distribution Agreements in accordance with their respective terms.
On November 15, 2023, we entered into an equity distribution agreement (the “2023 Equity Distribution Agreement”) by and among us, GSAM and Truist.
For further details regarding the 2022 Equity Distribution Agreements and the 2023 Equity Distribution Agreement, see Note 9 “Net Assets—Equity Issuances—At-the-market (“ATM”) Offering” to our consolidated financial statements included in this report.
On March 9, 2023, we completed a follow-on offering (the "March Offering") under our shelf registration statement, issuing 6,500,000 shares of our common stock at a price to the underwriters of $15.09 per share. Net of offering and underwriting costs, we received cash proceeds of $97.58 million.
For further details, see Note 9 “Net Assets—Equity Issuances—Follow-on Offering” to our consolidated financial statements included in this report.
77
Common Stock Repurchase Plan
In November 2021, our Board of Directors approved and authorized a common stock repurchase plan (the “2022 10b5-1 Plan”), which provided for us to repurchase up to $75.00 million of shares of our common stock if our common stock trades below the most recently announced quarter-end NAV per share, subject to certain limitations. The 2022 10b5-1 Plan became effective on August 17, 2022, commenced on September 16, 2022 and expired on August 17, 2023. The 2022 10b5-1 Plan was temporarily suspended in accordance with its terms in connection with the March Offering on March 1, 2023 and remained suspended until its termination on August 17, 2023. For the year ended December 31, 2023, we did not repurchase any of our common stock pursuant to the 2022 10b5-1 Plan or otherwise.
For further details, see Note 3 “Significant Agreements and Related Party Transactions” to our consolidated financial statements included in this report.
Dividend Reinvestment Plan
We have a voluntary dividend reinvestment plan (the “DRIP”) that provides for automatic reinvestment of all cash distributions declared by our Board of Directors unless a stockholder elects to “opt out” of the plan. As a result, if our Board of Directors declares a cash distribution, then the stockholders who have not “opted out” of the DRIP will have their cash distributions automatically reinvested in additional shares of common stock, rather than receiving the cash distribution. Due to regulatory considerations, GS Group Inc. has opted out of the DRIP, and GS & Co. had also opted out of the DRIP in respect of any shares of our common stock acquired through the 2022 10b5-1 Plan.
For further details, see Note 9 “Net Assets” to our consolidated financial statements included in this report.
All correspondence concerning the plan should be directed to the plan agent at Computershare Trust Company, N.A., P.O. Box 43078, Providence, RI 02940-3078, with overnight correspondence being directed to the plan agent at Computershare Trust Company, N.A., 150 Royall St., Suite 101, Canton, MA 02021; by calling 855-807-2742; or through the plan agent’s website at www.computershare.com/investor. Participants who hold their shares through a broker or other nominee should direct correspondence or questions concerning the DRIP to their broker or nominee.
Contractual Obligations
We have entered into certain contracts under which we have future commitments. Payments under the Investment Management Agreement, pursuant to which GSAM has agreed to serve as our Investment Adviser, are equal to (1) a percentage of value of our average gross assets and (2) a two-part Incentive Fee. Under the Administration Agreement, pursuant to which State Street Bank and Trust Company has agreed to furnish us with the administrative services necessary to conduct our day-to-day operations, we pay our administrator such fees as may be agreed between us and our administrator that we determine are commercially reasonable in our sole discretion. Either party or the stockholders, by a vote of a majority of our outstanding voting securities, may terminate the Investment Management Agreement without penalty on at least 60 days’ written notice to the other party. Either party may terminate the Administration Agreement without penalty upon at least 30 days’ written notice to the other party. The following table shows our contractual obligations as of December 31, 2023:
|
|
Payments Due by Period (in millions) |
|
|||||||||||||||||
|
|
Total |
|
|
Less Than |
|
|
1 – 3 Years |
|
|
3 – 5 Years |
|
|
More Than |
|
|||||
2025 Notes |
|
$ |
360.00 |
|
|
$ |
— |
|
|
$ |
360.00 |
|
|
$ |
— |
|
|
$ |
— |
|
2026 Notes |
|
$ |
500.00 |
|
|
$ |
— |
|
|
$ |
500.00 |
|
|
$ |
— |
|
|
$ |
— |
|
Revolving Credit Facility(1) |
|
$ |
972.24 |
|
|
$ |
— |
|
|
$ |
— |
|
|
$ |
972.24 |
|
|
$ |
— |
|
Revolving Credit Facility
On September 19, 2013, we entered into a senior secured revolving credit agreement (as amended, the “Revolving Credit Facility”) with various lenders. Truist Bank serves as administrative agent and Bank of America, N.A. serves as syndication agent under the Revolving Credit Facility.
The aggregate committed borrowing amount under the Revolving Credit Facility is $1,695.00 million. The Revolving Credit Facility includes an uncommitted accordion feature that allows us, under certain circumstances, to increase the borrowing capacity of the Revolving Credit Facility to up to $2,542.50 million. We amended and restated the Revolving Credit Facility on numerous occasions between October 3, 2014 and October 18, 2023.
78
Borrowings denominated in USD, including amounts drawn in respect of letters of credit, bear interest (at the Company’s election) of either (i) Term SOFR plus a margin of either (x) 2.00%, (y) 1.875% (subject to maintenance of certain long-term corporate debt ratings) or (z) 1.75% (subject to certain gross borrowing base conditions), in each case, plus an additional 0.10% credit adjustment spread or (ii) an alternative base rate, which is the highest of (i) the Prime Rate in effect on such day, (ii) the Federal Funds Effective Rate for such day plus 1/2 of 1.00% and (iii) the rate per annum equal to (x) the greater of (A) Term SOFR for an interest period of one (1) month and (B) zero plus (y) 1.00%, plus a margin of either (x) 1.00%, (y) 0.875% (subject to maintenance of certain long-term corporate debt ratings) or (z) 0.75% (subject to certain gross borrowing base conditions). Borrowings denominated in non-USD bear interest of the applicable term benchmark rate or daily simple SONIA plus a margin of either 2.00%, 1.875% or 1.75% (subject to the conditions applicable to borrowings denominated in USD that bear interest based on the applicable term benchmark rate or daily simple SONIA) plus, in the case of borrowings denominated in Pound Sterling (GBP) only, an additional 0.1193% credit adjustment spread. With respect to borrowings denominated in USD, we may elect either Term SOFR, or an alternative base rate at the time of borrowing, and such borrowings may be converted from one benchmark to another at any time, subject to certain conditions. Interest is payable in arrears on the applicable interest payment date as specified therein. We pay a fee of 0.375% per annum on committed but undrawn amounts under the Revolving Credit Facility, payable quarterly in arrears. Any amounts borrowed under the Revolving Credit Facility with respect to certain lenders which hold approximately 87% of total lending commitments, will mature, and all accrued and unpaid interest will be due and payable, on October 18, 2028. Any amounts borrowed under the Revolving Credit Facility with respect to remaining lenders will mature, and all accrued and unpaid interest will be due and payable, on May 5, 2027.
For further details, see Note 6 “Debt — Revolving Credit Facility” to our consolidated financial statements included in this report.
Convertible Notes
On October 3, 2016, we closed an offering of $
2025 Notes
On February 10, 2020, we closed an offering of $
2026 Notes
On November 24, 2020, we closed an offering of $
79
Off-Balance Sheet Arrangements
We may become a party to investment commitments and to financial instruments with off-balance sheet risk in the normal course of our business to fund investments and to meet the financial needs of our portfolio companies. These instruments may include commitments to extend credit and involve, to varying degrees, elements of liquidity and credit risk in excess of the amount recognized in the balance sheet. As of December 31, 2023, we believed that we had adequate financial resources to satisfy our unfunded commitments. Our unfunded commitments to provide funds to portfolio companies were as follows:
|
|
As of |
|
|||||
|
|
December 31, |
|
|
December 31, |
|
||
|
|
(in millions) |
|
|||||
Unfunded Commitments |
|
|
|
|
|
|
||
First Lien/Senior Secured Debt |
|
$ |
289.20 |
|
|
$ |
364.53 |
|
First Lien/Last-Out Unitranche |
|
|
18.32 |
|
|
|
6.52 |
|
Total |
|
$ |
307.52 |
|
|
$ |
371.05 |
|
HEDGING
Subject to applicable provisions of the Investment Company Act and applicable CFTC regulations, we may enter into hedging transactions in a manner consistent with SEC guidance. To the extent that any of our loans are denominated in a currency other than U.S. dollars, we may enter into currency hedging contracts to reduce our exposure to fluctuations in currency exchange rates. We may also enter into interest rate hedging agreements. Such hedging activities, which will be subject to compliance with applicable legal requirements, may include the use of futures, options, swaps and forward contracts. Costs incurred in entering into such contracts or in settling them, if any, will be borne by us. Our Investment Adviser has claimed no-action relief from CFTC registration and regulation as a commodity pool operator pursuant to a CFTC Rule 4.5 with respect to our operations, with the result that we will be limited in our ability to use futures contracts or options on futures contracts or engage in swap transactions. Specifically, CFTC Rule 4.5 imposes strict limitations on using such derivatives other than for hedging purposes, whereby the use of derivatives not used solely for hedging purposes is generally limited to situations where (i) the aggregate initial margin and premiums required to establish such positions does not exceed five percent of the liquidation value of our portfolio, after taking into account unrealized profits and unrealized losses on any such contracts it has entered into; or (ii) the aggregate net notional value of such derivatives does not exceed 100% of the liquidation value of our portfolio. Moreover, we anticipate entering into transactions involving such derivatives to a very limited extent solely for hedging purposes or otherwise within the limitations of CFTC Rule 4.5.
Rule 18f-4 under the Investment Company Act includes limitations on the ability of a BDC (or a RIC) to use derivatives and other transactions that create future payment or delivery obligations (including reverse repurchase agreements and similar financing transactions). Under the rule, BDCs that make significant use of derivatives are subject to a value-at-risk leverage limit, a derivatives risk management program, testing requirements and requirements related to board reporting. These requirements apply unless the BDC qualifies as a “limited derivatives user,” as defined in Rule 18f-4. Under the rule, a BDC may enter into an unfunded commitment agreement that is not a derivatives transaction, such as an agreement to provide financing to a portfolio company, if the BDC has, among other things, a reasonable belief, at the time it enters into such an agreement, that it will have sufficient cash and cash equivalents to meet its obligations with respect to all of its unfunded commitment agreements, in each case as it becomes due. Under Rule 18f-4, when we trade reverse repurchase agreements or similar financing transactions, including certain tender option bonds, we need to aggregate the amount of any other senior securities representing indebtedness (e.g., bank borrowings, if applicable) when calculating our asset coverage ratio. We currently operate as a “limited derivatives user” and these requirements may limit our ability to use derivatives and/or enter into certain other financial contracts.
CRITICAL ACCOUNTING POLICIES
Our discussion and analysis of our financial condition and results of operations are based upon our consolidated financial statements, which have been prepared in accordance with GAAP. The preparation of these consolidated financial statements requires management to make estimates and assumptions that affect the reported amounts of assets, liabilities, revenues and expenses. Changes in the economic environment, financial markets and any other parameters used in determining such estimates could cause actual results to differ materially.
For a description of our critical accounting policies, see Note 2 “Significant Accounting Policies” to our consolidated financial statements included in this report. We consider the most significant accounting policies to be those related to our Investments, Revenue Recognition, Non-Accrual Investments, Distributions, and Income Taxes.
RECENT DEVELOPMENTS
On February 21, 2024, our Board of Directors declared a quarterly distribution of $0.45 per share payable on April 26, 2024 to holders of record as of March 28, 2024.
80
ITEM 7A. QUANTITATIVE AND QUALITATIVE DISCLOSURES ABOUT MARKET RISK
We are subject to financial market risks, most significantly changes in interest rates. Interest rate sensitivity refers to the change in our earnings that may result from changes in the level of interest rates. Because we expect to fund a portion of our investments with borrowings, our net investment income is expected to be affected by the difference between the rate at which we invest and the rate at which we borrow. As a result, we can offer no assurance that a significant change in market interest rates will not have a material adverse effect on our net investment income.
As of December 31, 2023 and December 31, 2022, on a fair value basis, approximately 0.1% and 0.8% of our performing debt investments bore interest at a fixed rate (including income producing preferred stock investments), and approximately 99.9% and 99.2% of our performing debt investments bore interest at a floating rate. Our borrowings under our Revolving Credit Facility bear interest at a floating rate and our 2025 Notes and 2026 Notes bear interest at a fixed rate.
We regularly measure our exposure to interest rate risk. We assess interest rate risk and manage our interest rate exposure on an ongoing basis by comparing our interest rate sensitive assets to our interest rate sensitive liabilities.
Based on our December 31, 2023 Consolidated Statements of Assets and Liabilities, the following table shows the annual impact on net income of base rate changes in interest rates (considering interest rate floors for variable rate instruments) assuming no changes in our investment and borrowing structure:
As of December 31, 2023 |
|
Interest |
|
|
Interest |
|
|
Net |
|
|||
($ in millions) |
|
|
|
|
|
|
|
|
|
|||
Up 300 basis points |
|
$ |
81.40 |
|
|
$ |
(27.89 |
) |
|
$ |
53.51 |
|
Up 200 basis points |
|
|
54.26 |
|
|
|
(18.59 |
) |
|
|
35.67 |
|
Up 100 basis points |
|
|
27.13 |
|
|
|
(9.30 |
) |
|
|
17.83 |
|
Up 75 basis points |
|
|
20.35 |
|
|
|
(6.97 |
) |
|
|
13.38 |
|
Up 50 basis points |
|
|
13.57 |
|
|
|
(4.65 |
) |
|
|
8.92 |
|
Up 25 basis points |
|
|
6.78 |
|
|
|
(2.32 |
) |
|
|
4.46 |
|
Down 25 basis points |
|
|
(6.78 |
) |
|
|
2.32 |
|
|
|
(4.46 |
) |
Down 50 basis points |
|
|
(13.57 |
) |
|
|
4.65 |
|
|
|
(8.92 |
) |
Down 75 basis points |
|
|
(20.35 |
) |
|
|
6.97 |
|
|
|
(13.38 |
) |
Down 100 basis points |
|
|
(27.13 |
) |
|
|
9.30 |
|
|
|
(17.83 |
) |
Down 200 basis points |
|
|
(54.26 |
) |
|
|
18.59 |
|
|
|
(35.67 |
) |
Down 300 basis points |
|
|
(81.40 |
) |
|
|
27.89 |
|
|
|
(53.51 |
) |
We may, in the future, hedge against interest rate fluctuations by using standard hedging instruments such as futures, options and forward contracts subject to the requirements of the Investment Company Act, applicable CFTC regulations and in a manner consistent with SEC guidance. While hedging activities may insulate us against adverse changes in interest rates, they may also limit our ability to participate in benefits of lower interest rates with respect to our portfolio of investments with fixed interest rates.
Although the current outlook is uncertain, heightened inflation may persist in the near to medium-term, particularly in the United States, with the possibility that monetary policy may tighten in response. Persistent inflationary pressures may affect our portfolio companies’ profit margins.
81
ITEM 8. CONSOLIDATED FINANCIAL STATEMENTS AND SUPPLEMENTARY DATA
GOLDMAN SACHS BDC, INC.
INDEX TO CONSOLIDATED FINANCIAL STATEMENTS
|
Page |
Report of Independent Registered Public Accounting Firm (PCAOB ID |
83 |
85 |
|
86 |
|
87 |
|
88 |
|
89 |
|
111 |
82
Report of Independent Registered Public Accounting Firm
To the Board of Directors and Stockholders of Goldman Sachs BDC, Inc.
Opinions on the Financial Statements and Internal Control over Financial Reporting
We have audited the accompanying consolidated statements of assets and liabilities, including the consolidated schedules of investments, of Goldman Sachs BDC, Inc. and its subsidiaries (the “Company”) as of December 31, 2023 and 2022, and the related consolidated statements of operations, changes in net assets and cash flows for each of the three years in the period ended December 31, 2023, including the related notes (collectively referred to as the “consolidated financial statements”). We also have audited the Company's internal control over financial reporting as of December 31, 2023, based on criteria established in Internal Control - Integrated Framework (2013) issued by the Committee of Sponsoring Organizations of the Treadway Commission (COSO).
In our opinion, the consolidated financial statements referred to above present fairly, in all material respects, the financial position of the Company as of December 31, 2023 and 2022, and the results of its operations, changes in its net assets and its cash flows for each of the three years in the period ended December 31, 2023 in conformity with accounting principles generally accepted in the United States of America. Also in our opinion, the Company maintained, in all material respects, effective internal control over financial reporting as of December 31, 2023, based on criteria established in Internal Control - Integrated Framework (2013) issued by the COSO.
We have also previously audited, in accordance with the standards of the Public Company Accounting Oversight Board (United States), the consolidated statements of assets and liabilities, including the consolidated schedules of investments, of the Company as of December 31, 2021, 2020, 2019, 2018, 2017, 2016, 2015 and 2014, and the related consolidated statements of operations, changes in net assets and cash flows for each of the years ended December 31, 2014 through 2020 (none of which are presented herein), and we expressed unqualified opinions on those consolidated financial statements. In our opinion, the information set forth in the Senior Securities table of the Company for each of the ten years in the period ended December 31, 2023 is fairly stated, in all material respects, in relation to the consolidated financial statements from which it has been derived.
Basis for Opinions
The Company's management is responsible for these consolidated financial statements, for maintaining effective internal control over financial reporting, and for its assessment of the effectiveness of internal control over financial reporting, included in Management’s Report on Internal Control over Financial Reporting appearing under Item 9A. Our responsibility is to express opinions on the Company’s consolidated financial statements and on the Company's internal control over financial reporting based on our audits. We are a public accounting firm registered with the Public Company Accounting Oversight Board (United States) (PCAOB) and are required to be independent with respect to the Company in accordance with the U.S. federal securities laws and the applicable rules and regulations of the Securities and Exchange Commission and the PCAOB.
We conducted our audits in accordance with the standards of the PCAOB. Those standards require that we plan and perform the audits to obtain reasonable assurance about whether the consolidated financial statements are free of material misstatement, whether due to error or fraud, and whether effective internal control over financial reporting was maintained in all material respects.
Our audits of the consolidated financial statements included performing procedures to assess the risks of material misstatement of the consolidated financial statements, whether due to error or fraud, and performing procedures that respond to those risks. Such procedures included examining, on a test basis, evidence regarding the amounts and disclosures in the consolidated financial statements. Our audits also included evaluating the accounting principles used and significant estimates made by management, as well as evaluating the overall presentation of the consolidated financial statements. Our procedures included confirmation of securities owned as of December 31, 2023 and 2022 by correspondence with the custodian, agent banks, portfolio company investees and transfer agent; when replies were not received, we performed other auditing procedures. Our audit of internal control over financial reporting included obtaining an understanding of internal control over financial reporting, assessing the risk that a material weakness exists, and testing and evaluating the design and operating effectiveness of internal control based on the assessed risk. Our audits also included performing such other procedures as we considered necessary in the circumstances. We believe that our audits provide a reasonable basis for our opinions.
Definition and Limitations of Internal Control over Financial Reporting
A company’s internal control over financial reporting is a process designed to provide reasonable assurance regarding the reliability of financial reporting and the preparation of financial statements for external purposes in accordance with generally accepted accounting principles. A company’s internal control over financial reporting includes those policies and procedures that (i) pertain to the maintenance of records that, in reasonable detail, accurately and fairly reflect the transactions and dispositions of the assets of the company; (ii) provide reasonable assurance that transactions are recorded as necessary to permit preparation of financial statements in accordance with generally accepted accounting principles, and that receipts and expenditures of the company are being made only in accordance with authorizations of management and
83
directors of the company; and (iii) provide reasonable assurance regarding prevention or timely detection of unauthorized acquisition, use, or disposition of the company’s assets that could have a material effect on the financial statements.
Because of its inherent limitations, internal control over financial reporting may not prevent or detect misstatements. Also, projections of any evaluation of effectiveness to future periods are subject to the risk that controls may become inadequate because of changes in conditions, or that the degree of compliance with the policies or procedures may deteriorate.
Critical Audit Matters
The critical audit matter communicated below is a matter arising from the current period audit of the consolidated financial statements that was communicated or required to be communicated to the audit committee and that (i) relates to accounts or disclosures that are material to the consolidated financial statements and (ii) involved our especially challenging, subjective, or complex judgments. The communication of critical audit matters does not alter in any way our opinion on the consolidated financial statements, taken as a whole, and we are not, by communicating the critical audit matter below, providing a separate opinion on the critical audit matter or on the accounts or disclosures to which it relates.
Valuation of Certain Level 3 Debt Investments Developed Using Significant Unobservable Inputs Utilized in the Income Approach
As described in Note 5 to the consolidated financial statements, the Company held $3,344 million of total level 3 investments at fair value as of December 31, 2023, with debt investments representing approximately 98% of this total. For $2,938 million or 89.7% of those level 3 debt investments, the fair values were determined by management using the income approach. The significant unobservable inputs used in the income approach are the discount rate or market yield used to discount the estimated future cash flows expected to be received from the underlying investment. Included in the consideration and selection of discount rates or market yields is risk of default, rating of the investment, call provisions and comparable company investments.
The principal considerations for our determination that performing procedures relating to the valuation of certain level 3 debt investments developed using significant unobservable inputs utilized in the income approach is a critical audit matter are the significant judgment and estimation by management to determine the fair value of these investments due to the development of the discount rate or market yield. This in turn led to a high degree of auditor judgment, subjectivity and effort to perform procedures and to evaluate the audit evidence obtained related to the valuation of certain level 3 debt investments. In addition, the audit effort involved the use of professionals with specialized skill and knowledge to assist in performing these procedures and evaluating the audit evidence obtained.
Addressing the matter involved performing procedures and evaluating audit evidence in connection with forming our overall opinion on the consolidated financial statements. These procedures included testing the effectiveness of controls relating to the valuation of certain level 3 debt investments, including controls over the development of significant unobservable inputs used in the income approach, related to the discount rate or market yield. These procedures also included, among others, either (i) testing management’s process for determining the fair value estimate, which included evaluating the appropriateness of the discounted cash flow technique; testing the completeness, accuracy, and relevance of the underlying data used in the technique; and evaluating the significant unobservable inputs used by management, related to the discount rate or market yield, by considering the consistency of the unobservable inputs with external market and industry data and evidence obtained in other areas of the audit; or (ii) the involvement of professionals with specialized skill and knowledge to assist in developing an independent fair value estimate range for certain level 3 debt investments and comparison of management’s estimate to the independently developed range of fair value estimates. Developing the independent range involved developing independent significant unobservable inputs for the discount rate or market yield in order to evaluate the reasonableness of management’s fair value estimate of these certain level 3 debt investments using a range of available market information.
/s/
February 28, 2024
We have served as the auditor of one or more investment companies in the Goldman Sachs Business Development Companies group since 2012.
84
PART I. FINANCIAL INFORMATION
ITEM 1. FINANCIAL STATEMENTS
Goldman Sachs BDC, Inc.
Consolidated Statements of Assets and Liabilities
(in thousands, except share and per share amounts)
|
|
December 31, 2023 |
|
|
December 31, 2022 |
|
||
Assets |
|
|
|
|
|
|
||
Investments, at fair value |
|
|
|
|
|
|
||
Non-controlled/non-affiliated investments (cost of $ |
|
$ |
|
|
$ |
|
||
Non-controlled affiliated investments (cost of $ |
|
|
|
|
|
|
||
Controlled affiliated investments (cost of $ |
|
|
— |
|
|
|
— |
|
Total investments, at fair value (cost of $ |
|
$ |
|
|
$ |
|
||
Cash |
|
|
|
|
|
|
||
Interest and dividends receivable |
|
|
|
|
|
|
||
Deferred financing costs |
|
|
|
|
|
|
||
Other assets |
|
|
|
|
|
|
||
Total assets |
|
$ |
|
|
$ |
|
||
Liabilities |
|
|
|
|
|
|
||
Debt (net of debt issuance costs of $ |
|
$ |
|
|
$ |
|
||
Interest and other debt expenses payable |
|
|
|
|
|
|
||
Management fees payable |
|
|
|
|
|
|
||
Incentive fees payable |
|
|
|
|
|
— |
|
|
Distribution payable |
|
|
|
|
|
|
||
Unrealized depreciation on foreign currency forward contracts |
|
|
|
|
|
|
||
Accrued expenses and other liabilities |
|
|
|
|
|
|
||
Total liabilities |
|
$ |
|
|
$ |
|
||
|
|
|
|
|
|
|||
Net assets |
|
|
|
|
|
|
||
Preferred stock, par value $ |
|
$ |
|
|
$ |
|
||
Common stock, par value $ |
|
|
|
|
|
|
||
Paid-in capital in excess of par |
|
|
|
|
|
|
||
Distributable earnings (loss) |
|
|
( |
) |
|
|
( |
) |
Allocated income tax expense |
|
|
( |
) |
|
|
( |
) |
Total net assets |
|
$ |
|
|
$ |
|
||
Total liabilities and net assets |
|
$ |
|
|
$ |
|
||
Net asset value per share |
|
$ |
|
|
$ |
|
||
The accompanying notes are an integral part of these consolidated financial statements.
85
Goldman Sachs BDC, Inc.
Consolidated Statements of Operations
(in thousands, except share and per share amounts)
|
|
For the Years Ended December 31, |
|
|||||||||
|
|
2023 |
|
|
2022 |
|
|
2021 |
|
|||
Investment income: |
|
|
|
|
|
|
|
|
|
|||
From non-controlled/non-affiliated investments: |
|
|
|
|
|
|
|
|
|
|||
Interest income |
|
$ |
|
|
$ |
|
|
$ |
|
|||
Payment-in-kind income |
|
|
|
|
|
|
|
|
|
|||
Other income |
|
|
|
|
|
|
|
|
|
|||
From non-controlled affiliated investments: |
|
|
|
|
|
|
|
|
|
|||
Dividend income |
|
|
|
|
|
|
|
|
|
|||
Interest income |
|
|
|
|
|
|
|
|
|
|||
Payment-in-kind income |
|
|
|
|
|
|
|
|
|
|||
Other income |
|
|
|
|
|
|
|
|
— |
|
||
From controlled affiliated investments: |
|
|
|
|
|
|
|
|
|
|||
Payment-in-kind income |
|
|
— |
|
|
|
|
|
|
|
||
Interest income |
|
|
— |
|
|
|
|
|
|
|
||
Total investment income |
|
$ |
|
|
$ |
|
|
$ |
|
|||
Expenses: |
|
|
|
|
|
|
|
|
|
|||
Interest and other debt expenses |
|
$ |
|
|
$ |
|
|
$ |
|
|||
Incentive fees |
|
|
|
|
|
|
|
|
|
|||
Management fees |
|
|
|
|
|
|
|
|
|
|||
Professional fees |
|
|
|
|
|
|
|
|
|
|||
Directors’ fees |
|
|
|
|
|
|
|
|
|
|||
Other general and administrative expenses |
|
|
|
|
|
|
|
|
|
|||
Total expenses |
|
$ |
|
|
$ |
|
|
$ |
|
|||
Fee waivers |
|
$ |
( |
) |
|
$ |
( |
) |
|
|
( |
) |
Net expenses |
|
$ |
|
|
$ |
|
|
$ |
|
|||
Net investment income before taxes |
|
$ |
|
|
$ |
|
|
$ |
|
|||
Income tax expense, including excise tax |
|
$ |
|
|
$ |
|
|
$ |
|
|||
Net investment income after taxes |
|
$ |
|
|
$ |
|
|
$ |
|
|||
Net realized and unrealized gains (losses) on investment transactions: |
|
|
|
|
|
|
|
|
|
|||
Net realized gain (loss) from: |
|
|
|
|
|
|
|
|
|
|||
Non-controlled/non-affiliated investments |
|
$ |
( |
) |
|
$ |
( |
) |
|
$ |
|
|
Non-controlled affiliated investments |
|
|
— |
|
|
|
— |
|
|
|
|
|
Controlled affiliated investments |
|
|
( |
) |
|
|
( |
) |
|
|
— |
|
Foreign currency forward contracts |
|
|
— |
|
|
|
|
|
|
( |
) |
|
Foreign currency and other transactions |
|
|
|
|
|
( |
) |
|
|
|
||
Net change in unrealized appreciation (depreciation) from: |
|
|
|
|
|
|
|
|
|
|||
Non-controlled/non-affiliated investments |
|
|
|
|
|
( |
) |
|
|
( |
) |
|
Non-controlled affiliated investments |
|
|
( |
) |
|
|
( |
) |
|
|
( |
) |
Controlled affiliated investments |
|
|
|
|
|
( |
) |
|
|
( |
) |
|
Foreign currency forward contracts |
|
|
( |
) |
|
|
( |
) |
|
|
|
|
Foreign currency translations and other transactions |
|
|
( |
) |
|
|
|
|
|
|
||
Net realized and unrealized gains (losses) |
|
$ |
( |
) |
|
$ |
( |
) |
|
$ |
( |
) |
(Provision) benefit for taxes on realized gain/loss on investments |
|
$ |
( |
) |
|
$ |
— |
|
|
$ |
|
|
(Provision) benefit for taxes on unrealized appreciation/depreciation on investments |
|
|
|
|
|
( |
) |
|
|
( |
) |
|
Net increase (decrease) in net assets from operations |
|
$ |
|
|
$ |
|
|
$ |
|
|||
Weighted average shares outstanding |
|
|
|
|
|
|
|
|
|
|||
Basic and diluted net investment income per share |
|
$ |
|
|
$ |
|
|
$ |
|
|||
Basic and diluted earnings (loss) per share |
|
$ |
|
|
$ |
|
|
$ |
|
|||
The accompanying notes are an integral part of these consolidated financial statements.
86
Goldman Sachs BDC, Inc.
Consolidated Statements of Changes in Net Assets
(in thousands, except share and per share amounts)
|
|
For the Years Ended December 31, |
|
|
|||||||||
|
|
2023 |
|
|
2022 |
|
|
2021 |
|
|
|||
Net assets at beginning of period |
|
$ |
|
|
$ |
|
|
$ |
|
|
|||
Increase (decrease) in net assets from operations: |
|
|
|
|
|
|
|
|
|
|
|||
Net investment income |
|
$ |
|
|
$ |
|
|
$ |
|
|
|||
Net realized gain (loss) |
|
|
( |
) |
|
|
( |
) |
|
|
|
|
|
Net change in unrealized appreciation (depreciation) |
|
|
|
|
|
( |
) |
|
|
( |
) |
|
|
(Provision) benefit for taxes on realized gain/loss on investments |
|
|
( |
) |
|
|
— |
|
|
|
|
|
|
(Provision) benefit for taxes on unrealized appreciation/depreciation on investments |
|
|
|
|
|
( |
) |
|
|
( |
) |
|
|
Net increase (decrease) in net assets from operations |
|
$ |
|
|
$ |
|
|
$ |
|
|
|||
Distributions to stockholders from: |
|
|
|
|
|
|
|
|
|
|
|||
Distributable earnings |
|
$ |
( |
) |
|
$ |
( |
) |
|
$ |
( |
) |
|
Total distributions to stockholders |
|
$ |
( |
) |
|
$ |
( |
) |
|
$ |
( |
) |
|
Capital transactions: |
|
|
|
|
|
|
|
|
|
|
|||
Issuance of common stock (net of offering and underwriting costs) |
|
$ |
|
|
$ |
|
|
$ |
— |
|
|
||
Reinvestment of stockholder distributions |
|
|
|
|
|
|
|
|
|
|
|||
Net increase in net assets from capital transactions |
|
$ |
|
|
$ |
|
|
$ |
|
|
|||
Total increase (decrease) in net assets |
|
$ |
|
|
$ |
( |
) |
|
$ |
( |
) |
|
|
Net assets at end of period |
|
$ |
|
|
$ |
|
|
$ |
|
|
|||
Distributions per share |
|
$ |
|
|
$ |
|
|
$ |
|
|
|||
The accompanying notes are an integral part of these consolidated financial statements.
87
Goldman Sachs BDC, Inc.
Consolidated Statements of Cash Flows
(in thousands, except share and per share amounts)
|
|
For the Years Ended December 31, |
|
|||||||||
|
|
2023 |
|
|
2022 |
|
|
2021 |
|
|||
Cash flows from operating activities: |
|
|
|
|
|
|
|
|
|
|||
Net increase in net assets from operations: |
|
$ |
|
|
$ |
|
|
$ |
|
|||
Adjustments to reconcile net increase (decrease) in net assets from operations to net cash provided by (used for) operating activities: |
|
|
|
|
|
|
|
|
|
|||
Purchases of investments |
|
|
( |
) |
|
|
( |
) |
|
|
( |
) |
Payment-in-kind interest capitalized |
|
|
( |
) |
|
|
( |
) |
|
|
( |
) |
Proceeds from sales of investments and principal repayments |
|
|
|
|
|
|
|
|
|
|||
Net realized (gain) loss |
|
|
|
|
|
|
|
|
( |
) |
||
Net change in unrealized (appreciation) depreciation on investments |
|
|
( |
) |
|
|
|
|
|
|
||
Net change in unrealized (appreciation) depreciation on foreign currency forward contracts and transactions |
|
|
|
|
|
|
|
|
( |
) |
||
Amortization of premium and accretion of discount, net |
|
|
( |
) |
|
|
( |
) |
|
|
( |
) |
Amortization of deferred financing and debt issuance costs |
|
|
|
|
|
|
|
|
|
|||
Amortization of original issue discount on convertible notes |
|
|
— |
|
|
|
|
|
|
|
||
Change in operating assets and liabilities: |
|
|
|
|
|
|
|
|
|
|||
(Increase) decrease in receivable for investments sold |
|
|
— |
|
|
|
— |
|
|
|
|
|
(Increase) decrease in interest and dividends receivable |
|
|
( |
) |
|
|
( |
) |
|
|
( |
) |
(Increase) decrease in other assets |
|
|
( |
) |
|
|
|
|
|
( |
) |
|
Increase (decrease) in interest and other debt expenses payable |
|
|
|
|
|
( |
) |
|
|
|
||
Increase (decrease) in management fees payable |
|
|
( |
) |
|
|
|
|
|
|
||
Increase (decrease) in incentive fees payable |
|
|
|
|
|
( |
) |
|
|
( |
) |
|
Increase (decrease) in accrued expenses and other liabilities |
|
|
|
|
|
|
|
|
( |
) |
||
Net cash provided by (used for) operating activities |
|
$ |
|
|
$ |
|
|
$ |
( |
) |
||
Cash flows from financing activities: |
|
|
|
|
|
|
|
|
|
|||
Proceeds from issuance of common stock (net of underwriting costs) |
|
$ |
|
|
$ |
|
|
$ |
— |
|
||
Offering costs paid |
|
|
( |
) |
|
|
( |
) |
|
|
— |
|
Distributions paid |
|
|
( |
) |
|
|
( |
) |
|
|
( |
) |
Deferred financing and debt issuance costs paid |
|
|
( |
) |
|
|
( |
) |
|
|
( |
) |
Borrowings on debt |
|
|
|
|
|
|
|
|
|
|||
Repayments of debt |
|
|
( |
) |
|
|
( |
) |
|
|
( |
) |
Net cash provided by (used for) financing activities |
|
$ |
( |
) |
|
$ |
( |
) |
|
$ |
|
|
Net increase (decrease) in cash |
|
$ |
|
|
$ |
|
|
|
|
|||
Effect of foreign exchange rate changes on cash and cash equivalents |
|
|
|
|
|
|
|
|
( |
) |
||
Cash, beginning of period |
|
|
|
|
|
|
|
|
|
|||
Cash, end of period |
|
$ |
|
|
$ |
|
|
$ |
|
|||
Supplemental and non-cash activities |
|
|
|
|
|
|
|
|
|
|||
Interest expense paid |
|
$ |
|
|
$ |
|
|
$ |
|
|||
Accrued but unpaid excise tax expense |
|
$ |
|
|
$ |
|
|
$ |
|
|||
Accrued but unpaid distributions |
|
$ |
|
|
$ |
|
|
$ |
|
|||
Reinvestment of stockholder distributions |
|
$ |
|
|
$ |
|
|
$ |
|
|||
Exchange of investments |
|
$ |
|
|
$ |
|
|
$ |
|
|||
The accompanying notes are an integral part of these consolidated financial statements.
88
Goldman Sachs BDC, Inc.
Consolidated Schedule of Investments as of December 31, 2023
(in thousands, except share and per share amounts)
Investment (1)(5) |
Industry(2) |
Interest |
Reference Rate |
Maturity |
|
Par(4) |
|
Cost |
|
Fair |
|
Footnotes |
|||
Debt Investments - |
|
|
|
|
|
|
|
|
|
|
|
|
|||
Canada - |
|
|
|
|
|
|
|
|
|
|
|
|
|||
1st Lien/Senior Secured Debt - |
|
|
|
|
|
|
|
|
|
|
|
|
|||
Trader Corporation |
Automobiles |
C + |
CAD |
|
|
$ |
|
$ |
|
(6) (7) (8) |
|||||
Trader Corporation |
Automobiles |
|
C + |
CAD |
|
|
|
— |
|
|
— |
|
(6) (7) (8) (9) |
||
Recochem, Inc |
Chemicals |
C + |
|
|
|
|
|
|
|
(6) (7) |
|||||
Recochem, Inc |
Chemicals |
C + |
CAD |
|
|
|
|
|
|
(6) (7) |
|||||
Recochem, Inc |
Chemicals |
|
C + |
CAD |
|
|
|
( |
) |
|
( |
) |
(6) (7) (9) |
||
Recochem, Inc |
Chemicals |
|
C + |
CAD |
|
|
|
( |
) |
|
( |
) |
(6) (7) (9) |
||
ATX Networks Corp. |
Communications Equipment |
S + |
|
|
|
|
|
|
|
(6) (8) (10) |
|||||
Prophix Software Inc. (dba Pound Bidco) |
Financial Services |
S + |
|
|
|
|
|
|
|
(6) (7) (8) |
|||||
Prophix Software Inc. (dba Pound Bidco) |
Financial Services |
S + |
|
|
|
|
|
|
|
(6) (7) (8) |
|||||
Prophix Software Inc. (dba Pound Bidco) |
Financial Services |
S + |
|
|
|
|
|
|
|
(6) (7) (8) |
|||||
Prophix Software Inc. (dba Pound Bidco) |
Financial Services |
|
S + |
|
|
|
|
( |
) |
|
( |
) |
(6) (7) (8) (9) |
||
Prophix Software Inc. (dba Pound Bidco) |
Financial Services |
|
S + |
|
|
|
|
— |
|
|
( |
) |
(6) (7) (8) (9) |
||
1272775 B.C. LTD. (dba Everest Clinical Research) |
Professional Services |
S + |
|
|
|
|
|
|
|
(6) (7) (8) |
|||||
1272775 B.C. LTD. (dba Everest Clinical Research) |
Professional Services |
|
P + |
|
|
|
|
( |
) |
|
( |
) |
(6) (7) (8) (9) |
||
Everest Clinical Research Corporation |
Professional Services |
S + |
|
|
|
|
|
|
|
(6) (7) (8) |
|||||
Rodeo Buyer Company (dba Absorb Software) |
Professional Services |
S + |
|
|
|
|
|
|
|
(6) (7) (8) |
|||||
Rodeo Buyer Company (dba Absorb Software) |
Professional Services |
|
S + |
|
|
|
|
( |
) |
|
( |
) |
(6) (7) (8) (9) |
||
iWave Information Systems, Inc. |
Software |
S + |
|
|
|
|
|
|
|
(6) (7) (8) |
|||||
iWave Information Systems, Inc. |
Software |
|
S + |
|
|
|
|
( |
) |
|
( |
) |
(6) (7) (8) (9) |
||
Total 1st Lien/Senior Secured Debt |
|
|
|
|
|
|
|
|
|
|
|
|
|||
1st Lien/Last-Out Unitranche (11) - |
|
|
|
|
|
|
|
|
|
|
|
|
|||
Doxim, Inc. |
Financial Services |
S + |
|
$ |
|
$ |
|
$ |
|
(7) (8) |
|||||
Doxim, Inc. |
Financial Services |
S + |
|
|
|
|
|
|
|
(7) (8) |
|||||
Doxim, Inc. |
Financial Services |
S + |
|
|
|
|
|
|
|
(7) (8) |
|||||
Doxim, Inc. |
Financial Services |
S + |
|
|
|
|
|
|
|
(7) (8) |
|||||
Total 1st Lien/Last-Out Unitranche |
|
|
|
|
|
|
|
|
|
|
|
|
|||
Unsecured Debt - |
|
|
|
|
|
|
|
|
|
|
|
|
|||
ATX Networks Corp. |
Communications Equipment |
|
$ |
|
$ |
|
$ |
|
(6) (8) (10) |
||||||
Total Unsecured Debt |
|
|
|
|
|
|
|
|
|
|
|
|
|||
Total Canada |
|
|
|
|
|
|
|
$ |
|
$ |
|
|
|||
Germany - |
|
|
|
|
|
|
|
|
|
|
|
|
|||
1st Lien/Senior Secured Debt - |
|
|
|
|
|
|
|
|
|
|
|
|
|||
Kawa Solar Holdings Limited |
Construction & Engineering |
|
|
|
$ |
|
$ |
|
$ |
|
(6) (8) (10) (12) |
||||
Kawa Solar Holdings Limited |
Construction & Engineering |
|
|
|
|
|
|
|
|
— |
|
(6) (8) (10) (12) |
|||
Total 1st Lien/Senior Secured Debt |
|
|
|
|
|
|
|
|
|
|
|
|
|||
Total Germany |
|
|
|
|
|
|
|
$ |
|
$ |
|
|
|||
Singapore - |
|
|
|
|
|
|
|
|
|
|
|
|
|||
Unsecured Debt - |
|
|
|
|
|
|
|
|
|
|
|
|
|||
Conergy Asia & ME Pte. LTD. |
Construction & Engineering |
|
|
|
$ |
|
$ |
|
$ |
— |
|
(6) (8) (10) (12) |
|||
Total Unsecured Debt |
|
|
|
|
|
|
|
|
|
|
— |
|
|
||
Total Singapore |
|
|
|
|
|
|
|
$ |
|
$ |
— |
|
|
||
The accompanying notes are an integral part of these consolidated financial statements.
89
Goldman Sachs BDC, Inc.
Consolidated Schedule of Investments as of December 31, 2023 (continued)
(in thousands, except share and per share amounts)
Investment (1)(5) |
Industry(2) |
Interest |
Reference Rate |
Maturity |
|
Par(4) |
|
Cost |
|
Fair |
|
Footnotes |
|||
United Kingdom - |
|
|
|
|
|
|
|
|
|
|
|
|
|||
1st Lien/Senior Secured Debt - |
|
|
|
|
|
|
|
|
|
|
|
|
|||
Clearcourse Partnership Acquireco Finance Limited |
IT Services |
SN + |
GBP |
|
|
$ |
|
$ |
|
(6) (7) (8) |
|||||
Clearcourse Partnership Acquireco Finance Limited |
IT Services |
SN + |
GBP |
|
|
|
|
|
|
(6) (7) (8) (9) |
|||||
Bigchange Group Limited |
Software |
SN + |
GBP |
|
|
|
|
|
|
(6) (7) (8) |
|||||
Bigchange Group Limited |
Software |
SN + |
GBP |
|
|
|
|
|
|
(6) (7) (8) |
|||||
Bigchange Group Limited |
Software |
|
SN + |
GBP |
|
|
|
( |
) |
|
( |
) |
(6) (7) (8) (9) |
||
Total 1st Lien/Senior Secured Debt |
|
|
|
|
|
|
|
|
|
|
|
|
|||
Total United Kingdom |
|
|
|
|
|
|
|
$ |
|
$ |
|
|
|||
United States - |
|
|
|
|
|
|
|
|
|
|
|
|
|||
1st Lien/Senior Secured Debt - |
|
|
|
|
|
|
|
|
|
|
|
|
|||
Frontgrade Technologies Holdings Inc. |
Aerospace & Defense |
S + |
|
$ |
|
$ |
|
$ |
|
(7) (8) |
|||||
Frontgrade Technologies Holdings Inc. |
Aerospace & Defense |
S + |
|
|
|
|
|
|
|
(7) (8) |
|||||
Frontgrade Technologies Holdings Inc. |
Aerospace & Defense |
|
S + |
0 |
|
|
|
|
( |
) |
|
( |
) |
(7) (8) (9) |
|
Thrasio, LLC |
Broadline Retail |
|
S + |
|
|
|
|
|
|
|
(7) (8) (13) |
||||
Acuity Specialty Products, Inc. (dba Zep Inc.) |
Chemicals |
S + |
|
|
|
|
|
|
|
(7) (8) |
|||||
Elemica Parent, Inc. |
Chemicals |
S + |
|
|
|
|
|
|
|
(7) (8) |
|||||
Elemica Parent, Inc. |
Chemicals |
S + |
|
|
|
|
|
|
|
(7) (8) |
|||||
Elemica Parent, Inc. |
Chemicals |
S + |
|
|
|
|
|
|
|
(7) (8) |
|||||
Elemica Parent, Inc. |
Chemicals |
S + |
|
|
|
|
|
|
|
(7) (8) |
|||||
Elemica Parent, Inc. |
Chemicals |
S + |
|
|
|
|
|
|
|
(7) (8) |
|||||
Formulations Parent Corporation (dba Chase Corp) |
Chemicals |
S + |
|
|
|
|
|
|
|
(7) |
|||||
Formulations Parent Corporation (dba Chase Corp) |
Chemicals |
|
S + |
|
|
|
|
( |
) |
|
( |
) |
(7) (9) |
||
3SI Security Systems, Inc. |
Commercial Services & Supplies |
S + |
|
|
|
|
|
|
|
(8) |
|||||
3SI Security Systems, Inc. |
Commercial Services & Supplies |
S + |
|
|
|
|
|
|
|
(8) |
|||||
ASM Buyer, Inc. |
Commercial Services & Supplies |
|
S + |
|
|
|
|
— |
|
|
— |
|
(7) (9) |
||
ASM Buyer, Inc. |
Commercial Services & Supplies |
|
S + |
|
|
|
|
— |
|
|
— |
|
(7) (9) |
||
ASM Buyer, Inc. |
Commercial Services & Supplies |
|
S + |
|
|
|
|
— |
|
|
— |
|
(7) (9) |
||
Halo Branded Solutions, Inc. |
Commercial Services & Supplies |
S + |
|
|
|
|
|
|
|
|
|||||
Superior Environmental Solutions |
Commercial Services & Supplies |
S + |
|
|
|
|
|
|
|
(7) (8) |
|||||
Superior Environmental Solutions |
Commercial Services & Supplies |
S + |
|
|
|
|
|
|
|
(7) (8) (9) |
|||||
Superior Environmental Solutions |
Commercial Services & Supplies |
|
S + |
|
|
|
|
( |
) |
|
( |
) |
(7) (8) (9) |
||
Sweep Purchaser LLC |
Commercial Services & Supplies |
S + |
|
|
|
|
|
|
|
(7) (8) |
|||||
Sweep Purchaser LLC |
Commercial Services & Supplies |
S + |
|
|
|
|
|
|
|
(7) (8) |
|||||
Sweep Purchaser LLC |
Commercial Services & Supplies |
S + |
|
|
|
|
|
|
|
(7) (8) |
|||||
Sweep Purchaser LLC |
Commercial Services & Supplies |
S + |
|
|
|
|
|
|
|
(7) (8) |
|||||
Sweep Purchaser LLC |
Commercial Services & Supplies |
S + |
|
|
|
|
|
|
|
(7) (8) (9) |
|||||
UP Acquisition Corp. (dba Unified Power) |
Commercial Services & Supplies |
S + |
|
|
|
|
|
|
|
(7) |
|||||
UP Acquisition Corp. (dba Unified Power) |
Commercial Services & Supplies |
|
S + |
|
|
|
|
( |
) |
|
( |
) |
(7) (9) |
||
VRC Companies, LLC (dba Vital Records Control) |
Commercial Services & Supplies |
S + |
|
|
|
|
|
|
|
(7) (8) |
|||||
VRC Companies, LLC (dba Vital Records Control) |
Commercial Services & Supplies |
|
P + |
|
|
|
|
( |
) |
|
( |
) |
(7) (8) (9) |
||
Superman Holdings, LLC (dba Foundation Software) |
Construction & Engineering |
S + |
|
|
|
|
|
|
|
(7) (8) |
|||||
Superman Holdings, LLC (dba Foundation Software) |
Construction & Engineering |
S + |
|
|
|
|
|
|
|
(7) (8) |
|||||
Superman Holdings, LLC (dba Foundation Software) |
Construction & Engineering |
S + |
|
|
|
|
|
|
|
(7) (8) |
|||||
Superman Holdings, LLC (dba Foundation Software) |
Construction & Engineering |
|
S + |
|
|
|
|
( |
) |
|
( |
) |
(7) (8) (9) |
||
Superman Holdings, LLC (dba Foundation Software) |
Construction & Engineering |
|
S + |
|
|
|
|
( |
) |
|
( |
) |
(7) (8) (9) |
||
Blast Bidco Inc. (dba Bazooka Candy Brands) |
Consumer Staples Distribution & Retail |
S + |
|
|
|
|
|
|
|
(7) |
|||||
The accompanying notes are an integral part of these consolidated financial statements.
90
Goldman Sachs BDC, Inc.
Consolidated Schedule of Investments as of December 31, 2023 (continued)
(in thousands, except share and per share amounts)
Investment (1)(5) |
Industry(2) |
Interest |
Reference Rate |
Maturity |
|
Par(4) |
|
Cost |
|
Fair |
|
Footnotes |
|||
Blast Bidco Inc. (dba Bazooka Candy Brands) |
Consumer Staples Distribution & Retail |
|
S + |
|
$ |
|
$ |
( |
) |
$ |
( |
) |
(7) (9) |
||
A Place For Mom, Inc. |
Diversified Consumer Services |
S + |
|
|
|
|
|
|
|
|
|||||
Assembly Intermediate LLC |
Diversified Consumer Services |
S + |
|
|
|
|
|
|
|
(7) (8) |
|||||
Assembly Intermediate LLC |
Diversified Consumer Services |
S + |
|
|
|
|
|
|
|
(7) (8) (9) |
|||||
Assembly Intermediate LLC |
Diversified Consumer Services |
|
S + |
|
|
|
|
( |
) |
|
( |
) |
(7) (8) (9) |
||
CorePower Yoga LLC |
Diversified Consumer Services |
S + |
|
|
|
|
|
|
|
(7) (8) |
|||||
CorePower Yoga LLC |
Diversified Consumer Services |
|
S + |
|
|
|
|
( |
) |
|
( |
) |
(7) (8) (9) |
||
CST Buyer Company (dba Intoxalock) |
Diversified Consumer Services |
S + |
|
|
|
|
|
|
|
(7) (8) |
|||||
CST Buyer Company (dba Intoxalock) |
Diversified Consumer Services |
S + |
|
|
|
|
|
|
|
(7) (8) (9) |
|||||
Helios Buyer, Inc. (dba Heartland) |
Diversified Consumer Services |
S + |
|
|
|
|
|
|
|
(7) (8) |
|||||
Helios Buyer, Inc. (dba Heartland) |
Diversified Consumer Services |
S + |
|
|
|
|
|
|
|
(7) (8) |
|||||
Helios Buyer, Inc. (dba Heartland) |
Diversified Consumer Services |
S + |
|
|
|
|
|
|
|
(7) (8) |
|||||
Helios Buyer, Inc. (dba Heartland) |
Diversified Consumer Services |
|
S + |
|
|
|
|
( |
) |
|
( |
) |
(7) (8) (9) |
||
Southeast Mechanical, LLC (dba. SEM Holdings, LLC) |
Diversified Consumer Services |
S + |
|
|
|
|
|
|
|
(7) (8) (10) |
|||||
Southeast Mechanical, LLC (dba. SEM Holdings, LLC) |
Diversified Consumer Services |
S + |
|
|
|
|
|
|
|
(7) (8) (9) (10) |
|||||
Southeast Mechanical, LLC (dba. SEM Holdings, LLC) |
Diversified Consumer Services |
|
S + |
0 |
|
|
|
|
( |
) |
|
( |
) |
(7) (8) (9) (10) |
|
Spotless Brands, LLC |
Diversified Consumer Services |
S + |
|
|
|
|
|
|
|
(7) (8) |
|||||
Spotless Brands, LLC |
Diversified Consumer Services |
S + |
|
|
|
|
|
|
|
(7) (8) |
|||||
VASA Fitness Buyer, Inc. |
Diversified Consumer Services |
S + |
|
|
|
|
|
|
|
(7) (8) |
|||||
VASA Fitness Buyer, Inc. |
Diversified Consumer Services |
|
S + |
|
|
|
|
( |
) |
|
( |
) |
(7) (8) (9) |
||
VASA Fitness Buyer, Inc. |
Diversified Consumer Services |
|
S + |
|
|
|
|
( |
) |
|
( |
) |
(7) (8) (9) |
||
Whitewater Holding Company LLC |
Diversified Consumer Services |
S + |
|
|
|
|
|
|
|
(7) (8) |
|||||
Whitewater Holding Company LLC |
Diversified Consumer Services |
S + |
|
|
|
|
|
|
|
(7) (8) |
|||||
Whitewater Holding Company LLC |
Diversified Consumer Services |
S + |
|
|
|
|
|
|
|
(7) (8) |
|||||
Whitewater Holding Company LLC |
Diversified Consumer Services |
S + |
|
|
|
|
|
|
|
(7) (8) (9) |
|||||
Whitewater Holding Company LLC |
Diversified Consumer Services |
S + |
|
|
|
|
|
|
|
(7) (8) (9) |
|||||
Iracore International Holdings, Inc. |
Energy Equipment & Services |
S + |
|
|
|
|
|
|
|
(8) (10) |
|||||
Checkmate Finance Merger Sub, LLC |
Entertainment |
S + |
|
|
|
|
|
|
|
(7) (8) |
|||||
Checkmate Finance Merger Sub, LLC |
Entertainment |
|
S + |
|
|
|
|
( |
) |
|
( |
) |
(7) (8) (9) |
||
Picture Head Midco LLC |
Entertainment |
S + |
|
|
|
|
|
|
|
(7) (8) (14) |
|||||
Admiral Buyer, Inc. (dba Fidelity Payment Services) |
Financial Services |
S + |
|
|
|
|
|
|
|
(7) (8) |
|||||
Admiral Buyer, Inc. (dba Fidelity Payment Services) |
Financial Services |
|
S + |
|
|
|
|
( |
) |
|
( |
) |
(7) (8) (9) |
||
Admiral Buyer, Inc. (dba Fidelity Payment Services) |
Financial Services |
|
S + |
|
|
|
|
( |
) |
|
( |
) |
(7) (8) (9) |
||
Aria Systems, Inc. |
Financial Services |
S + |
|
|
|
|
|
|
|
(7) (8) |
|||||
BSI3 Menu Buyer, Inc (dba Kydia) |
Financial Services |
S + |
|
|
|
|
|
|
|
(7) (8) |
|||||
BSI3 Menu Buyer, Inc (dba Kydia) |
Financial Services |
|
S + |
|
|
|
|
— |
|
|
( |
) |
(7) (8) (9) |
||
Computer Services, Inc. |
Financial Services |
S + |
|
|
|
|
|
|
|
(7) (8) |
|||||
Coretrust Purchasing Group LLC |
Financial Services |
S + |
|
|
|
|
|
|
|
(7) (8) |
|||||
Coretrust Purchasing Group LLC |
Financial Services |
|
S + |
|
|
|
|
( |
) |
|
( |
) |
(7) (8) (9) |
||
Coretrust Purchasing Group LLC |
Financial Services |
|
S + |
|
|
|
|
( |
) |
|
( |
) |
(7) (8) (9) |
||
Fullsteam Operations LLC |
Financial Services |
S + |
|
|
|
|
|
|
|
(7) |
|||||
Fullsteam Operations LLC |
Financial Services |
S + |
|
|
|
|
|
|
|
(7) (9) |
|||||
Fullsteam Operations LLC |
Financial Services |
|
S + |
|
|
|
|
( |
) |
|
( |
) |
(7) (9) |
||
Fullsteam Operations LLC |
Financial Services |
|
S + |
|
|
|
|
( |
) |
|
( |
) |
(7) (9) |
||
GS AcquisitionCo, Inc. (dba Insightsoftware) |
Financial Services |
S + |
|
|
|
|
|
|
|
(7) |
|||||
GS AcquisitionCo, Inc. (dba Insightsoftware) |
Financial Services |
|
S + |
|
|
|
|
( |
) |
|
( |
) |
(7) (9) |
||
MerchantWise Solutions, LLC (dba HungerRush) |
Financial Services |
S + |
|
|
|
|
|
|
|
(7) (8) |
|||||
MerchantWise Solutions, LLC (dba HungerRush) |
Financial Services |
S + |
|
|
|
|
|
|
|
(7) (8) (9) |
|||||
The accompanying notes are an integral part of these consolidated financial statements.
91
Goldman Sachs BDC, Inc.
Consolidated Schedule of Investments as of December 31, 2023 (continued)
(in thousands, except share and per share amounts)
Investment (1)(5) |
Industry(2) |
Interest |
Reference Rate |
Maturity |
|
Par(4) |
|
Cost |
|
Fair |
|
Footnotes |
|||
MerchantWise Solutions, LLC (dba HungerRush) |
Financial Services |
S + |
|
$ |
|
$ |
|
$ |
|
(7) (8) (9) |
|||||
StarCompliance Intermediate, LLC |
Financial Services |
S + |
|
|
|
|
|
|
|
(7) (8) |
|||||
StarCompliance Intermediate, LLC |
Financial Services |
S + |
|
|
|
|
|
|
|
(7) (8) |
|||||
StarCompliance Intermediate, LLC |
Financial Services |
S + |
|
|
|
|
|
|
|
(7) (8) (9) |
|||||
Eptam Plastics, Ltd. |
Health Care Equipment & Supplies |
S + |
|
|
|
|
|
|
|
(7) (8) |
|||||
Eptam Plastics, Ltd. |
Health Care Equipment & Supplies |
S + |
|
|
|
|
|
|
|
(7) (8) |
|||||
Eptam Plastics, Ltd. |
Health Care Equipment & Supplies |
S + |
|
|
|
|
|
|
|
(7) (8) |
|||||
Eptam Plastics, Ltd. |
Health Care Equipment & Supplies |
S + |
|
|
|
|
|
|
|
(7) (8) |
|||||
Eptam Plastics, Ltd. |
Health Care Equipment & Supplies |
S + |
|
|
|
|
|
|
|
(7) (8) |
|||||
Riverpoint Medical, LLC |
Health Care Equipment & Supplies |
S + |
|
|
|
|
|
|
|
(7) (8) |
|||||
Riverpoint Medical, LLC |
Health Care Equipment & Supplies |
S + |
|
|
|
|
|
|
|
(7) (8) |
|||||
Riverpoint Medical, LLC |
Health Care Equipment & Supplies |
S + |
|
|
|
|
|
|
|
(7) (8) (9) |
|||||
Viant Medical Holdings, Inc. |
Health Care Equipment & Supplies |
S + |
|
|
|
|
|
|
|
(7) |
|||||
Argos Health Holdings, Inc |
Health Care Providers & Services |
S + |
|
|
|
|
|
|
|
(7) (8) |
|||||
Bayside Opco, LLC (dba Pro-PT) |
Health Care Providers & Services |
S + |
|
|
|
|
|
|
|
(8) |
|||||
Bayside Opco, LLC (dba Pro-PT) |
Health Care Providers & Services |
|
S + |
|
|
|
|
|
|
|
(8) (13) |
||||
Bayside Opco, LLC (dba Pro-PT) |
Health Care Providers & Services |
|
S + |
|
|
|
|
— |
|
|
|
(8) (9) |
|||
Capitol Imaging Acquisition Corp. |
Health Care Providers & Services |
S + |
|
|
|
|
|
|
|
(7) (8) |
|||||
Capitol Imaging Acquisition Corp. |
Health Care Providers & Services |
S + |
|
|
|
|
|
|
|
(7) (8) |
|||||
Capitol Imaging Acquisition Corp. |
Health Care Providers & Services |
|
S + |
|
|
|
|
( |
) |
|
( |
) |
(7) (8) (9) |
||
CFS Management, LLC (dba Center for Sight Management) |
Health Care Providers & Services |
S + |
|
|
|
|
|
|
|
(7) (8) |
|||||
CFS Management, LLC (dba Center for Sight Management) |
Health Care Providers & Services |
S + |
|
|
|
|
|
|
|
(7) (8) |
|||||
CFS Management, LLC (dba Center for Sight Management) |
Health Care Providers & Services |
S + |
|
|
|
|
|
|
|
(7) (8) |
|||||
Coding Solutions Acquisition, Inc. |
Health Care Providers & Services |
S + |
|
|
|
|
|
|
|
(7) (8) |
|||||
Coding Solutions Acquisition, Inc. |
Health Care Providers & Services |
S + |
|
|
|
|
|
|
|
(7) (8) |
|||||
Coding Solutions Acquisition, Inc. |
Health Care Providers & Services |
S + |
|
|
|
|
|
|
|
(7) (8) |
|||||
Coding Solutions Acquisition, Inc. |
Health Care Providers & Services |
S + |
|
|
|
|
|
|
|
(7) (8) (9) |
|||||
Coding Solutions Acquisition, Inc. |
Health Care Providers & Services |
|
S + |
|
|
|
|
( |
) |
|
( |
) |
(7) (8) (9) |
||
CORA Health Holdings Corp |
Health Care Providers & Services |
S + |
|
|
|
|
|
|
|
(7) (8) |
|||||
CORA Health Holdings Corp |
Health Care Providers & Services |
S + |
|
|
|
|
|
|
|
(7) (8) |
|||||
DECA Dental Holdings LLC |
Health Care Providers & Services |
S + |
|
|
|
|
|
|
|
(7) (8) |
|||||
DECA Dental Holdings LLC |
Health Care Providers & Services |
S + |
|
|
|
|
|
|
|
(7) (8) |
|||||
DECA Dental Holdings LLC |
Health Care Providers & Services |
S + |
|
|
|
|
|
|
|
(7) (8) (9) |
|||||
Highfive Dental Holdco, LLC |
Health Care Providers & Services |
S + |
|
|
|
|
|
|
|
(7) (8) |
|||||
The accompanying notes are an integral part of these consolidated financial statements.
92
Goldman Sachs BDC, Inc.
Consolidated Schedule of Investments as of December 31, 2023 (continued)
(in thousands, except share and per share amounts)
Investment (1)(5) |
Industry(2) |
Interest |
Reference Rate |
Maturity |
|
Par(4) |
|
Cost |
|
Fair |
|
Footnotes |
|||
Highfive Dental Holdco, LLC |
Health Care Providers & Services |
|
S + |
|
$ |
|
$ |
( |
) |
$ |
( |
) |
(7) (8) (9) |
||
Highfive Dental Holdco, LLC |
Health Care Providers & Services |
|
S + |
|
|
|
|
( |
) |
|
( |
) |
(7) (8) (9) |
||
Honor HN Buyer, Inc |
Health Care Providers & Services |
S + |
|
|
|
|
|
|
|
(7) (8) |
|||||
Honor HN Buyer, Inc |
Health Care Providers & Services |
S + |
|
|
|
|
|
|
|
(7) (8) |
|||||
Honor HN Buyer, Inc |
Health Care Providers & Services |
S + |
|
|
|
|
|
|
|
(7) (8) (9) |
|||||
Honor HN Buyer, Inc |
Health Care Providers & Services |
P + |
|
|
|
|
|
|
|
(7) (8) (9) |
|||||
LCG Vardiman Black, LLC (dba Specialty Dental Brands) |
Health Care Providers & Services |
|
S + |
|
|
|
|
|
|
|
(7) (8) (13) |
||||
Millstone Medical Outsourcing, LLC |
Health Care Providers & Services |
S + |
|
|
|
|
|
|
|
(7) (8) |
|||||
Millstone Medical Outsourcing, LLC |
Health Care Providers & Services |
|
S + |
|
|
|
|
( |
) |
|
( |
) |
(7) (8) (9) |
||
One GI LLC |
Health Care Providers & Services |
S + |
|
|
|
|
|
|
|
(7) (8) |
|||||
One GI LLC |
Health Care Providers & Services |
S + |
|
|
|
|
|
|
|
(7) (8) |
|||||
One GI LLC |
Health Care Providers & Services |
S + |
|
|
|
|
|
|
|
(7) (8) |
|||||
One GI LLC |
Health Care Providers & Services |
S + |
|
|
|
|
|
|
|
(7) (8) |
|||||
One GI LLC |
Health Care Providers & Services |
|
S + |
|
|
|
|
( |
) |
|
( |
) |
(7) (8) (9) |
||
Premier Care Dental Management, LLC |
Health Care Providers & Services |
S + |
|
|
|
|
|
|
|
(7) (8) |
|||||
Premier Care Dental Management, LLC |
Health Care Providers & Services |
S + |
|
|
|
|
|
|
|
(7) (8) |
|||||
Premier Care Dental Management, LLC |
Health Care Providers & Services |
S + |
|
|
|
|
|
|
|
(7) (8) (9) |
|||||
Premier Imaging, LLC (dba Lucid Health) |
Health Care Providers & Services |
S + |
|
|
|
|
|
|
|
(7) (8) |
|||||
Premier Imaging, LLC (dba Lucid Health) |
Health Care Providers & Services |
S + |
|
|
|
|
|
|
|
(7) (8) |
|||||
Premier Imaging, LLC (dba Lucid Health) |
Health Care Providers & Services |
S + |
|
|
|
|
|
|
|
(7) (8) |
|||||
Premier Imaging, LLC (dba Lucid Health) |
Health Care Providers & Services |
S + |
|
|
|
|
|
|
|
(7) (8) |
|||||
Purfoods, LLC |
Health Care Providers & Services |
S + |
|
|
|
|
|
|
|
(7) (8) |
|||||
Purfoods, LLC |
Health Care Providers & Services |
S + |
|
|
|
|
|
|
|
(7) (8) |
|||||
SpendMend, LLC |
Health Care Providers & Services |
S + |
|
|
|
|
|
|
|
(7) (8) |
|||||
SpendMend, LLC |
Health Care Providers & Services |
S + |
|
|
|
|
|
|
|
(7) (8) (9) |
|||||
SpendMend, LLC |
Health Care Providers & Services |
S + |
|
|
|
|
|
|
|
(7) (8) (9) |
|||||
The Center for Orthopedic and Research Excellence, Inc. (dba HOPCo) |
Health Care Providers & Services |
S + |
|
|
|
|
|
|
|
(7) (8) |
|||||
The Center for Orthopedic and Research Excellence, Inc. (dba HOPCo) |
Health Care Providers & Services |
S + |
|
|
|
|
|
|
|
(7) (8) |
|||||
The Center for Orthopedic and Research Excellence, Inc. (dba HOPCo) |
Health Care Providers & Services |
S + |
|
|
|
|
|
|
|
(7) (8) |
|||||
The accompanying notes are an integral part of these consolidated financial statements.
93
Goldman Sachs BDC, Inc.
Consolidated Schedule of Investments as of December 31, 2023 (continued)
(in thousands, except share and per share amounts)
Investment (1)(5) |
Industry(2) |
Interest |
Reference Rate |
Maturity |
|
Par(4) |
|
Cost |
|
Fair |
|
Footnotes |
|||
The Center for Orthopedic and Research Excellence, Inc. (dba HOPCo) |
Health Care Providers & Services |
S + |
|
$ |
|
$ |
|
$ |
|
(7) (8) |
|||||
The Center for Orthopedic and Research Excellence, Inc. (dba HOPCo) |
Health Care Providers & Services |
P + |
|
|
|
|
|
|
( |
) |
(7) (8) (9) |
||||
Total Vision LLC |
Health Care Providers & Services |
S + |
|
|
|
|
|
|
|
(7) (8) |
|||||
Total Vision LLC |
Health Care Providers & Services |
S + |
|
|
|
|
|
|
|
(7) (8) (9) |
|||||
Total Vision LLC |
Health Care Providers & Services |
S + |
|
|
|
|
|
|
|
(7) (8) |
|||||
Total Vision LLC |
Health Care Providers & Services |
S + |
|
|
|
|
|
|
|
(7) (8) |
|||||
Total Vision LLC |
Health Care Providers & Services |
|
S + |
|
|
|
|
( |
) |
|
( |
) |
(7) (8) (9) |
||
USN Opco LLC (dba Global Nephrology Solutions) |
Health Care Providers & Services |
S + |
|
|
|
|
|
|
|
(7) (8) |
|||||
USN Opco LLC (dba Global Nephrology Solutions) |
Health Care Providers & Services |
S + |
|
|
|
|
|
|
|
(7) (8) |
|||||
USN Opco LLC (dba Global Nephrology Solutions) |
Health Care Providers & Services |
S + |
|
|
|
|
|
|
|
(7) (8) |
|||||
USN Opco LLC (dba Global Nephrology Solutions) |
Health Care Providers & Services |
S + |
|
|
|
|
|
|
|
(7) (8) (9) |
|||||
Businessolver.com, Inc. |
Health Care Technology |
S + |
|
|
|
|
|
|
|
(7) (8) |
|||||
Businessolver.com, Inc. |
Health Care Technology |
S + |
|
|
|
|
|
|
|
(7) (8) (9) |
|||||
ESO Solutions, Inc |
Health Care Technology |
S + |
|
|
|
|
|
|
|
(7) (8) |
|||||
ESO Solutions, Inc |
Health Care Technology |
S + |
|
|
|
|
|
|
|
(7) (8) (9) |
|||||
Experity, Inc. |
Health Care Technology |
S + |
|
|
|
|
|
|
|
(7) (8) |
|||||
Experity, Inc. |
Health Care Technology |
|
S + |
|
|
|
|
— |
|
|
( |
) |
(7) (8) (9) |
||
GHA Buyer Inc. (dba Cedar Gate) |
Health Care Technology |
S + |
|
|
|
|
|
|
|
(7) (8) |
|||||
GHA Buyer Inc. (dba Cedar Gate) |
Health Care Technology |
S + |
|
|
|
|
|
|
|
(7) (8) |
|||||
GHA Buyer Inc. (dba Cedar Gate) |
Health Care Technology |
S + |
|
|
|
|
|
|
|
(7) (8) |
|||||
GHA Buyer Inc. (dba Cedar Gate) |
Health Care Technology |
|
S + |
|
|
|
|
( |
) |
|
( |
) |
(7) (8) (9) |
||
HealthEdge Software, Inc. |
Health Care Technology |
S + |
|
|
|
|
|
|
|
(7) (8) |
|||||
HealthEdge Software, Inc. |
Health Care Technology |
S + |
|
|
|
|
|
|
|
(7) (8) |
|||||
HealthEdge Software, Inc. |
Health Care Technology |
|
S + |
|
|
|
|
( |
) |
|
( |
) |
(7) (8) (9) |
||
Intelligent Medical Objects, Inc. |
Health Care Technology |
S + |
|
|
|
|
|
|
|
(7) (8) |
|||||
Intelligent Medical Objects, Inc. |
Health Care Technology |
S + |
|
|
|
|
|
|
|
(7) (8) (9) |
|||||
Intelligent Medical Objects, Inc. |
Health Care Technology |
S + |
|
|
|
|
|
|
|
(7) (8) (9) |
|||||
MedeAnalytics, Inc. |
Health Care Technology |
|
|
|
|
|
|
|
|
(7) (8) (10) (13) |
|||||
PDDS Holdco, Inc. (dba Planet DDS) |
Health Care Technology |
S + |
|
|
|
|
|
|
|
(7) (8) |
|||||
PDDS Holdco, Inc. (dba Planet DDS) |
Health Care Technology |
S + |
|
|
|
|
|
|
|
(7) (8) (9) |
|||||
PDDS Holdco, Inc. (dba Planet DDS) |
Health Care Technology |
S + |
|
|
|
|
|
|
|
(7) (8) |
|||||
The accompanying notes are an integral part of these consolidated financial statements.
94
Goldman Sachs BDC, Inc.
Consolidated Schedule of Investments as of December 31, 2023 (continued)
(in thousands, except share and per share amounts)
Investment (1)(5) |
Industry(2) |
Interest |
Reference Rate |
Maturity |
|
Par(4) |
|
Cost |
|
Fair |
|
Footnotes |
|||
PDDS Holdco, Inc. (dba Planet DDS) |
Health Care Technology |
S + |
|
$ |
|
$ |
|
$ |
|
(7) (8) (9) |
|||||
PlanSource Holdings, Inc. |
Health Care Technology |
S + |
|
|
|
|
|
|
|
(7) (8) |
|||||
PlanSource Holdings, Inc. |
Health Care Technology |
S + |
|
|
|
|
|
|
|
(7) (8) |
|||||
PlanSource Holdings, Inc. |
Health Care Technology |
S + |
|
|
|
|
|
|
|
(7) (8) |
|||||
PlanSource Holdings, Inc. |
Health Care Technology |
|
S + |
|
|
|
|
( |
) |
|
( |
) |
(7) (8) (9) |
||
WebPT, Inc. |
Health Care Technology |
S + |
|
|
|
|
|
|
|
(7) (8) |
|||||
WebPT, Inc. |
Health Care Technology |
S + |
|
|
|
|
|
|
|
(7) (8) |
|||||
WebPT, Inc. |
Health Care Technology |
S + |
|
|
|
|
|
|
|
(7) (8) (9) |
|||||
WebPT, Inc. |
Health Care Technology |
S + |
|
|
|
|
|
|
|
(7) (8) (9) |
|||||
Zodiac Intermediate, LLC (dba Zipari) |
Health Care Technology |
|
S + |
|
|
|
|
|
|
|
(7) (8) (13) |
||||
Zodiac Intermediate, LLC (dba Zipari) |
Health Care Technology |
|
S + |
|
|
|
|
|
|
|
(7) (8) (13) |
||||
HS4 AcquisitionCo, Inc. (dba HotSchedules & Fourth) |
Hotels, Restaurants & Leisure |
S + |
|
|
|
|
|
|
|
(7) (8) |
|||||
HS4 AcquisitionCo, Inc. (dba HotSchedules & Fourth) |
Hotels, Restaurants & Leisure |
S + |
|
|
|
|
|
|
|
(7) (8) (9) |
|||||
Hollander Intermediate LLC (dba Bedding Acquisition, LLC) |
Household Products |
S + |
|
|
|
|
|
|
|
(7) (8) |
|||||
Volt Bidco, Inc. (dba Power Factors) |
Independent Power and Renewable Electricity Producers |
S + |
|
|
|
|
|
|
|
(7) (8) (9) |
|||||
Volt Bidco, Inc. (dba Power Factors) |
Independent Power and Renewable Electricity Producers |
S + |
|
|
|
|
|
|
|
(7) (8) |
|||||
Volt Bidco, Inc. (dba Power Factors) |
Independent Power and Renewable Electricity Producers |
S + |
|
|
|
|
|
|
|
(7) (8) |
|||||
Volt Bidco, Inc. (dba Power Factors) |
Independent Power and Renewable Electricity Producers |
S + |
|
|
|
|
|
|
|
(7) (8) (9) |
|||||
AQ Sunshine, Inc. (dba Relation Insurance) |
Insurance |
S + |
|
|
|
|
|
|
|
(7) |
|||||
AQ Sunshine, Inc. (dba Relation Insurance) |
Insurance |
S + |
|
|
|
|
|
|
|
(7) |
|||||
AQ Sunshine, Inc. (dba Relation Insurance) |
Insurance |
S + |
|
|
|
|
|
|
|
(7) |
|||||
AQ Sunshine, Inc. (dba Relation Insurance) |
Insurance |
S + |
|
|
|
|
|
|
|
(7) |
|||||
AQ Sunshine, Inc. (dba Relation Insurance) |
Insurance |
S + |
|
|
|
|
|
|
|
(7) |
|||||
AQ Sunshine, Inc. (dba Relation Insurance) |
Insurance |
|
S + |
|
|
|
|
( |
) |
|
( |
) |
(7) (9) |
||
AQ Sunshine, Inc. (dba Relation Insurance) |
Insurance |
|
S + |
|
|
|
|
( |
) |
|
( |
) |
(7) (9) |
||
Sunstar Insurance Group, LLC |
Insurance |
S + |
|
|
|
|
|
|
|
(7) (8) |
|||||
Sunstar Insurance Group, LLC |
Insurance |
S + |
|
|
|
|
|
|
|
(7) (8) |
|||||
Sunstar Insurance Group, LLC |
Insurance |
S + |
|
|
|
|
|
|
|
(7) (8) (9) |
|||||
Sunstar Insurance Group, LLC |
Insurance |
S + |
|
|
|
|
|
|
|
(7) (8) |
|||||
The accompanying notes are an integral part of these consolidated financial statements.
95
Goldman Sachs BDC, Inc.
Consolidated Schedule of Investments as of December 31, 2023 (continued)
(in thousands, except share and per share amounts)
Investment (1)(5) |
Industry(2) |
Interest |
Reference Rate |
Maturity |
|
Par(4) |
|
Cost |
|
Fair |
|
Footnotes |
|||
Sunstar Insurance Group, LLC |
Insurance |
S + |
|
$ |
|
$ |
|
$ |
|
(7) (8) (9) |
|||||
Lithium Technologies, Inc. |
Interactive Media & Services |
S + |
|
|
|
|
|
|
|
(7) (8) |
|||||
SPay, Inc. (dba Stack Sports) |
Interactive Media & Services |
S + |
|
|
|
|
|
|
|
(7) (8) (14) |
|||||
SPay, Inc. (dba Stack Sports) |
Interactive Media & Services |
S + |
|
|
|
|
|
|
|
(7) (8) |
|||||
SPay, Inc. (dba Stack Sports) |
Interactive Media & Services |
S + |
|
|
|
|
|
|
|
(7) (8) (14) |
|||||
GPS Phoenix Buyer, Inc. (dba Guidepoint) |
IT Services |
S + |
|
|
|
|
|
|
|
(7) |
|||||
GPS Phoenix Buyer, Inc. (dba Guidepoint) |
IT Services |
|
S + |
|
|
|
|
( |
) |
|
( |
) |
(7) (9) |
||
GPS Phoenix Buyer, Inc. (dba Guidepoint) |
IT Services |
|
S + |
|
|
|
|
( |
) |
|
( |
) |
(7) (9) |
||
Kaseya Inc. |
IT Services |
S + |
|
|
|
|
|
|
|
(7) (8) |
|||||
Kaseya Inc. |
IT Services |
S + |
|
|
|
|
|
|
|
(7) (8) (9) |
|||||
Kaseya Inc. |
IT Services |
S + |
|
|
|
|
|
|
|
(7) (8) (9) |
|||||
Wellness AcquisitionCo, Inc. (dba SPINS) |
IT Services |
S + |
|
|
|
|
|
|
|
(7) (8) |
|||||
Wellness AcquisitionCo, Inc. (dba SPINS) |
IT Services |
|
S + |
|
|
|
|
( |
) |
|
( |
) |
(7) (8) (9) |
||
Wellness AcquisitionCo, Inc. (dba SPINS) |
IT Services |
|
S + |
|
|
|
|
( |
) |
|
( |
) |
(7) (8) (9) |
||
WSO2, Inc. |
IT Services |
S + |
|
|
|
|
|
|
|
(7) (8) |
|||||
Xactly Corporation |
IT Services |
S + |
|
|
|
|
|
|
|
(7) (8) |
|||||
Xactly Corporation |
IT Services |
|
S + |
|
|
|
|
( |
) |
|
( |
) |
(7) (8) (9) |
||
Circustrix Holdings, LLC (dba SkyZone) |
Leisure Products |
S + |
|
|
|
|
|
|
|
(7) (8) |
|||||
Circustrix Holdings, LLC (dba SkyZone) |
Leisure Products |
|
S + |
|
|
|
|
( |
) |
|
( |
) |
(7) (8) (9) |
||
Circustrix Holdings, LLC (dba SkyZone) |
Leisure Products |
|
S + |
|
|
|
|
( |
) |
|
( |
) |
(7) (8) (9) |
||
Recorded Books Inc. (dba RBMedia) |
Media |
S + |
|
|
|
|
|
|
|
(7) (8) |
|||||
Recorded Books Inc. (dba RBMedia) |
Media |
|
S + |
|
|
|
|
( |
) |
|
( |
) |
(7) (8) (9) |
||
LS Clinical Services Holdings, Inc (dba CATO) |
Pharmaceuticals |
S + |
|
|
|
|
|
|
|
(7) (8) |
|||||
LS Clinical Services Holdings, Inc (dba CATO) |
Pharmaceuticals |
S + |
|
|
|
|
|
|
|
(7) (8) (9) |
|||||
Amspec Parent, LLC |
Professional Services |
S + |
|
|
|
|
|
|
|
(7) |
|||||
Amspec Parent, LLC |
Professional Services |
|
S + |
|
|
|
|
( |
) |
|
( |
) |
(7) (9) |
||
Amspec Parent, LLC |
Professional Services |
|
S + |
|
|
|
|
( |
) |
|
( |
) |
(7) (9) |
||
Bullhorn, Inc. |
Professional Services |
S + |
|
|
|
|
|
|
|
(7) (8) |
|||||
Bullhorn, Inc. |
Professional Services |
S + |
|
|
|
|
|
|
|
(7) (8) |
|||||
Bullhorn, Inc. |
Professional Services |
S + |
|
|
|
|
|
|
|
(7) (8) |
|||||
Bullhorn, Inc. |
Professional Services |
S + |
|
|
|
|
|
|
|
(7) (8) |
|||||
Bullhorn, Inc. |
Professional Services |
S + |
|
|
|
|
|
|
|
(7) (8) |
|||||
Bullhorn, Inc. |
Professional Services |
|
S + |
|
|
|
|
( |
) |
|
( |
) |
(7) (8) (9) |
||
Chronicle Bidco Inc. (dba Lexitas) |
Professional Services |
S + |
|
|
|
|
|
|
|
(7) (8) |
|||||
Chronicle Bidco Inc. (dba Lexitas) |
Professional Services |
S + |
|
|
|
|
|
|
|
(7) (8) (9) |
|||||
Diligent Corporation |
Professional Services |
E + |
|
€ |
|
|
|
|
|
(7) (8) |
|||||
Diligent Corporation |
Professional Services |
S + |
|
|
|
|
|
|
|
(7) (8) |
|||||
Diligent Corporation |
Professional Services |
S + |
|
|
|
|
|
|
|
(7) (8) (9) |
|||||
iCIMS, Inc. |
Professional Services |
S + |
|
|
|
|
|
|
|
(7) (8) |
|||||
iCIMS, Inc. |
Professional Services |
S + |
|
|
|
|
|
|
|
(7) (8) (9) |
|||||
iCIMS, Inc. |
Professional Services |
|
S + |
|
|
|
|
— |
|
|
( |
) |
(7) (8) (9) |
||
NFM & J, L.P. (dba the Facilities Group) |
Professional Services |
S + |
|
|
|
|
|
|
|
(7) (8) |
|||||
The accompanying notes are an integral part of these consolidated financial statements.
96
Goldman Sachs BDC, Inc.
Consolidated Schedule of Investments as of December 31, 2023 (continued)
(in thousands, except share and per share amounts)
Investment (1)(5) |
Industry(2) |
Interest |
Reference Rate |
Maturity |
|
Par(4) |
|
Cost |
|
Fair |
|
Footnotes |
|||
NFM & J, L.P. (dba the Facilities Group) |
Professional Services |
S + |
|
$ |
|
$ |
|
$ |
|
(7) (8) |
|||||
NFM & J, L.P. (dba the Facilities Group) |
Professional Services |
|
S + |
|
|
|
|
( |
) |
|
( |
) |
(7) (8) (9) |
||
Pluralsight, Inc |
Professional Services |
S + |
|
|
|
|
|
|
|
(7) (8) |
|||||
Pluralsight, Inc |
Professional Services |
S + |
|
|
|
|
|
|
|
(7) (8) (9) |
|||||
HowlCO LLC (dba Lone Wolf) |
Real Estate Mgmt. & Development |
S + |
|
|
|
|
|
|
|
(6) (7) (8) |
|||||
HowlCO LLC (dba Lone Wolf) |
Real Estate Mgmt. & Development |
S + |
|
|
|
|
|
|
|
(6) (7) (8) |
|||||
HowlCO LLC (dba Lone Wolf) |
Real Estate Mgmt. & Development |
S + |
|
|
|
|
|
|
|
(6) (7) (8) |
|||||
MRI Software LLC |
Real Estate Mgmt. & Development |
S + |
|
|
|
|
|
|
|
|
|||||
MRI Software LLC |
Real Estate Mgmt. & Development |
S + |
|
|
|
|
|
|
|
|
|||||
MRI Software LLC |
Real Estate Mgmt. & Development |
|
S + |
|
|
|
|
( |
) |
|
( |
) |
(9) |
||
Zarya Intermediate, LLC (dba iOFFICE) |
Real Estate Mgmt. & Development |
S + |
|
|
|
|
|
|
|
(7) (8) |
|||||
Zarya Intermediate, LLC (dba iOFFICE) |
Real Estate Mgmt. & Development |
S + |
|
|
|
|
|
|
|
(7) (8) (9) |
|||||
Abacus Data Holdings, Inc. (dba Clutch Intermediate Holdings) |
Software |
S + |
|
|
|
|
|
|
|
(7) (8) |
|||||
Abacus Data Holdings, Inc. (dba Clutch Intermediate Holdings) |
Software |
S + |
|
|
|
|
|
|
|
(7) (8) |
|||||
Abacus Data Holdings, Inc. (dba Clutch Intermediate Holdings) |
Software |
S + |
|
|
|
|
|
|
|
(7) (8) (9) |
|||||
Acquia, Inc. |
Software |
S + |
|
|
|
|
|
|
|
(7) (8) |
|||||
Acquia, Inc. |
Software |
S + |
|
|
|
|
|
|
|
(7) (8) (9) |
|||||
Acquia, Inc. |
Software |
|
S + |
|
|
|
|
— |
|
|
— |
|
(7) (8) (9) |
||
AQ Helios Buyer, Inc. (dba SurePoint) |
Software |
S + |
|
|
|
|
|
|
|
(7) (8) |
|||||
AQ Helios Buyer, Inc. (dba SurePoint) |
Software |
S + |
|
|
|
|
|
|
|
(7) (8) |
|||||
AQ Helios Buyer, Inc. (dba SurePoint) |
Software |
S + |
|
|
|
|
|
|
|
(7) (8) (9) |
|||||
AQ Helios Buyer, Inc. (dba SurePoint) |
Software |
S + |
|
|
|
|
|
|
|
(7) (8) |
|||||
AQ Helios Buyer, Inc. (dba SurePoint) |
Software |
S + |
|
|
|
|
|
|
|
(7) (8) (9) |
|||||
Arrow Buyer, Inc. (dba Archer Technologies) |
Software |
S + |
|
|
|
|
|
|
|
(7) (8) |
|||||
Arrow Buyer, Inc. (dba Archer Technologies) |
Software |
|
S + |
|
|
|
|
( |
) |
|
( |
) |
(7) (8) (9) |
||
CivicPlus LLC |
Software |
S + |
|
|
|
|
|
|
|
(7) (8) |
|||||
CivicPlus LLC |
Software |
S + |
|
|
|
|
|
|
|
(7) (8) |
|||||
CivicPlus LLC |
Software |
S + |
|
|
|
|
|
|
|
(7) (8) |
|||||
CivicPlus LLC |
Software |
S + |
|
|
|
|
|
|
|
(7) (8) (9) |
|||||
CloudBees, Inc. |
Software |
S + |
|
|
|
|
|
|
|
(7) (8) |
|||||
CloudBees, Inc. |
Software |
S + |
|
|
|
|
|
|
|
(7) (8) |
|||||
Crewline Buyer, Inc. (dba New Relic) |
Software |
S + |
|
|
|
|
|
|
|
(7) |
|||||
Crewline Buyer, Inc. (dba New Relic) |
Software |
|
S + |
|
|
|
|
( |
) |
|
( |
) |
(7) (9) |
||
Gainsight, Inc. |
Software |
S + |
|
|
|
|
|
|
|
(7) (8) |
|||||
Gainsight, Inc. |
Software |
S + |
|
|
|
|
|
|
|
(7) (8) (9) |
|||||
GovDelivery Holdings, LLC (dba Granicus, Inc.) |
Software |
S + |
|
|
|
|
|
|
|
(7) (8) |
|||||
GovDelivery Holdings, LLC (dba Granicus, Inc.) |
Software |
S + |
|
|
|
|
|
|
|
(7) (8) |
|||||
GovDelivery Holdings, LLC (dba Granicus, Inc.) |
Software |
S + |
|
|
|
|
|
|
|
(7) (8) (9) |
|||||
Governmentjobs.com, Inc. (dba NeoGov) |
Software |
|
S + |
|
|
|
|
( |
) |
|
( |
) |
(7) (8) (9) |
||
Governmentjobs.com, Inc. (dba NeoGov) |
Software |
S + |
|
|
|
|
|
|
|
(7) (8) |
|||||
Governmentjobs.com, Inc. (dba NeoGov) |
Software |
S + |
|
|
|
|
|
|
|
(7) (8) |
|||||
Governmentjobs.com, Inc. (dba NeoGov) |
Software |
|
S + |
|
|
|
|
( |
) |
|
( |
) |
(7) (8) (9) |
||
NAVEX TopCo, Inc. |
Software |
S + |
|
|
|
|
|
|
|
(7) |
|||||
NAVEX TopCo, Inc. |
Software |
|
S + |
|
|
|
|
( |
) |
|
( |
) |
(7) (9) |
||
Ncontracts, LLC |
Software |
S + |
|
|
|
|
|
|
|
(7) |
|||||
Ncontracts, LLC |
Software |
|
S + |
|
|
|
|
( |
) |
|
( |
) |
(7) (9) |
||
The accompanying notes are an integral part of these consolidated financial statements.
97
Goldman Sachs BDC, Inc.
Consolidated Schedule of Investments as of December 31, 2023 (continued)
(in thousands, except share and per share amounts)
Investment (1)(5) |
Industry(2) |
Interest |
Reference Rate |
Maturity |
Par(4) |
|
Cost |
|
Fair |
|
Footnotes |
|||
Ncontracts, LLC |
Software |
|
S + |
$ |
|
$ |
( |
) |
$ |
( |
) |
(7) (9) |
||
Onyx CenterSource, Inc. |
Software |
S + |
|
|
|
|
|
|
(7) |
|||||
Onyx CenterSource, Inc. |
Software |
S + |
|
|
|
|
|
|
(7) (9) |
|||||
Pioneer Buyer I, LLC |
Software |
S + |
|
|
|
|
|
|
(7) (8) |
|||||
Pioneer Buyer I, LLC |
Software |
|
S + |
|
|
|
( |
) |
|
( |
) |
(7) (8) (9) |
||
Rubrik, Inc. |
Software |
S + |
|
|
|
|
|
|
(7) (8) |
|||||
Rubrik, Inc. |
Software |
S + |
|
|
|
|
|
|
(7) (8) (9) |
|||||
Singlewire Software, LLC |
Software |
S + |
|
|
|
|
|
|
(7) (8) |
|||||
Singlewire Software, LLC |
Software |
|
S + |
|
|
|
( |
) |
|
( |
) |
(7) (8) (9) |
||
Smarsh, Inc. |
Software |
S + |
|
|
|
|
|
|
(8) |
|||||
Smarsh, Inc. |
Software |
S + |
|
|
|
|
|
|
(8) (9) |
|||||
Smarsh, Inc. |
Software |
|
S + |
|
|
|
( |
) |
|
( |
) |
(8) (9) |
||
Sundance Group Holdings, Inc. (dba NetDocuments) |
Software |
S + |
|
|
|
|
|
|
(7) (8) |
|||||
Sundance Group Holdings, Inc. (dba NetDocuments) |
Software |
S + |
|
|
|
|
|
|
(7) (8) |
|||||
Sundance Group Holdings, Inc. (dba NetDocuments) |
Software |
S + |
|
|
|
|
|
|
(7) (8) (9) |
|||||
WorkForce Software, LLC |
Software |
S + |
|
|
|
|
|
|
(7) (8) |
|||||
WorkForce Software, LLC |
Software |
S + |
|
|
|
|
|
|
(7) (8) |
|||||
WorkForce Software, LLC |
Software |
S + |
|
|
|
|
|
|
(7) (8) |
|||||
WorkForce Software, LLC |
Software |
|
S + |
|
|
|
( |
) |
|
( |
) |
(7) (8) (9) |
||
Badger Sportswear, Inc. |
Textiles, Apparel & Luxury Goods |
S + |
|
|
|
|
|
|
(8) |
|||||
Ortholite, LLC |
Textiles, Apparel & Luxury Goods |
S + |
|
|
|
|
|
|
(7) (8) |
|||||
Harrington Industrial Plastics, LLC |
Trading Companies & Distributors |
S + |
|
|
|
|
|
|
(7) |
|||||
Harrington Industrial Plastics, LLC |
Trading Companies & Distributors |
S + |
|
|
|
|
|
|
(7) (9) |
|||||
PT Intermediate Holdings III, LLC (dba Parts Town) |
Trading Companies & Distributors |
S + |
|
|
|
|
|
|
(7) |
|||||
PT Intermediate Holdings III, LLC (dba Parts Town) |
Trading Companies & Distributors |
S + |
|
|
|
|
|
|
(7) |
|||||
PT Intermediate Holdings III, LLC (dba Parts Town) |
Trading Companies & Distributors |
S + |
|
|
|
|
|
|
(7) |
|||||
PT Intermediate Holdings III, LLC (dba Parts Town) |
Trading Companies & Distributors |
S + |
|
|
|
|
|
|
(7) |
|||||
Internet Truckstop Group, LLC (dba Truckstop) |
Transportation Infrastructure |
S + |
|
|
|
|
|
|
(7) (8) |
|||||
Internet Truckstop Group, LLC (dba Truckstop) |
Transportation Infrastructure |
|
S + |
|
|
|
( |
) |
|
( |
) |
(7) (8) (9) |
||
Total 1st Lien/Senior Secured Debt |
|
|
|
|
|
|
|
|
|
|
|
|||
1st Lien/Last-Out Unitranche (11) - |
|
|
|
|
|
|
|
|
|
|
|
|||
Doxim, Inc. |
Financial Services |
S + |
$ |
|
$ |
|
$ |
|
(7) (8) |
|||||
Doxim, Inc. |
Financial Services |
S + |
|
|
|
|
|
|
(7) (8) |
|||||
EDB Parent, LLC (dba Enterprise DB) |
Software |
S + |
|
|
|
|
|
|
(7) (8) |
|||||
EDB Parent, LLC (dba Enterprise DB) |
Software |
S + |
|
|
|
|
|
|
(7) (8) (9) |
|||||
EIP Consolidated, LLC (dba Everest Infrastructure) |
Wireless Telecommunication Services |
|
S + |
|
|
|
( |
) |
|
( |
) |
(7) (9) |
||
EIP Consolidated, LLC (dba Everest Infrastructure) |
Wireless Telecommunication Services |
S + |
|
|
|
|
|
|
(7) |
|||||
K2 Towers III, LLC |
Wireless Telecommunication Services |
S + |
|
|
|
|
|
|
(7) (9) |
|||||
Skyway Towers Intermediate LLC |
Wireless Telecommunication Services |
S + |
|
|
|
|
|
|
(7) |
|||||
Skyway Towers Intermediate LLC |
Wireless Telecommunication Services |
|
S + |
|
|
|
( |
) |
|
( |
) |
(7) (9) |
||
Thor FinanceCo LLC (dba Harmoni Towers) |
Wireless Telecommunication Services |
S + |
|
|
|
|
|
|
(7) (8) |
|||||
Thor FinanceCo LLC (dba Harmoni Towers) |
Wireless Telecommunication Services |
|
S + |
|
|
|
( |
) |
|
( |
) |
(7) (8) (9) |
||
Towerco IV Holdings, LLC |
Wireless Telecommunication Services |
S + |
|
|
|
|
|
|
(7) (8) (9) |
|||||
Total 1st Lien/Last-Out Unitranche |
|
|
|
|
|
|
|
|
|
|
|
|||
The accompanying notes are an integral part of these consolidated financial statements.
98
Goldman Sachs BDC, Inc.
Consolidated Schedule of Investments as of December 31, 2023 (continued)
(in thousands, except share and per share amounts)
Investment (1)(5) |
Industry(2) |
Interest |
Reference Rate |
Maturity |
Par(4) |
|
Cost |
|
Fair |
|
Footnotes |
|||
2nd Lien/Senior Secured Debt - |
|
|
|
|
|
|
|
|
|
|
|
|||
MPI Products LLC |
Automobile Components |
|
|
$ |
|
$ |
— |
|
$ |
— |
|
(8) (12) |
||
MPI Engineered Technologies, LLC |
Automobile Components |
|
|
|
|
|
|
|
(8) (13) |
|||||
Wine.com, LLC |
Beverages |
S + |
|
|
|
|
|
|
(7) (8) (14) |
|||||
Chase Industries, Inc. (dba Senneca Holdings) |
Building Products |
|
|
|
|
|
|
|
(7) (8) (13) |
|||||
Chase Industries, Inc. (dba Senneca Holdings) |
Building Products |
|
|
|
|
|
— |
|
|
— |
|
(7) (8) (12) |
||
Animal Supply Intermediate, LLC |
Distributors |
|
|
|
|
|
|
— |
|
(8) (10) (13) |
||||
Genesis Acquisition Co. (dba ProCare Software) |
Financial Services |
S + |
|
|
|
|
|
|
(7) (8) |
|||||
Genesis Acquisition Co. (dba ProCare Software) |
Financial Services |
S + |
|
|
|
|
|
|
(7) (8) |
|||||
Genesis Acquisition Co. (dba ProCare Software) |
Financial Services |
S + |
|
|
|
|
|
|
(7) (8) |
|||||
Genesis Acquisition Co. (dba ProCare Software) |
Financial Services |
S + |
|
|
|
|
|
|
(7) (8) |
|||||
Total 2nd Lien/Senior Secured Debt |
|
|
|
|
|
|
|
|
|
|
|
|||
Unsecured Debt - |
|
|
|
|
|
|
|
|
|
|
|
|||
Wine.com, Inc. |
Beverages |
S + |
$ |
|
$ |
|
$ |
|
(7) (8) |
|||||
Wine.com, Inc. |
Beverages |
|
S + |
|
|
|
|
|
|
(7) (8) (13) |
||||
Wine.com, Inc. |
Beverages |
|
S + |
|
|
|
— |
|
|
— |
|
(7) (8) (13) |
||
Bayside Opco, LLC (dba Pro-PT) |
Health Care Providers & Services |
|
S + |
|
|
|
|
|
|
(8) (13) |
||||
CivicPlus LLC |
Software |
S + |
|
|
|
|
|
|
(7) (8) |
|||||
Total Unsecured Debt |
|
|
|
|
|
|
|
|
|
|
|
|||
Total United States |
|
|
|
|
|
|
$ |
|
$ |
|
|
|||
Total Debt Investments |
|
|
|
|
|
|
$ |
|
$ |
|
|
|||
The accompanying notes are an integral part of these consolidated financial statements.
99
Goldman Sachs BDC, Inc.
Consolidated Schedule of Investments as of December 31, 2023 (continued)
(in thousands, except share and per share amounts)
Investment (1)(5) |
Industry(2) |
Interest |
Initial |
Shares(4) |
|
Cost |
|
Fair |
|
Footnotes |
|||
Equity Securities - |
|
|
|
|
|
|
|
|
|
|
|||
Canada - |
|
|
|
|
|
|
|
|
|
|
|||
Common Stock - |
|
|
|
|
|
|
|
|
|
|
|||
Prairie Provident Resources, Inc. |
Oil, Gas & Consumable Fuels |
|
|
|
|
$ |
|
$ |
|
(6) (12) |
|||
Total Common Stock |
|
|
|
|
|
|
|
|
|
|
|||
Total Canada |
|
|
|
|
|
$ |
|
$ |
|
|
|||
Germany - |
|
|
|
|
|
|
|
|
|
|
|||
Common Stock - |
|
|
|
|
|
|
|
|
|
|
|||
Kawa Solar Holdings Limited |
Construction & Engineering |
|
|
|
$ |
— |
|
$ |
— |
|
(6) (8) (10) (12) |
||
Total Common Stock |
|
|
|
|
|
|
— |
|
|
— |
|
|
|
Preferred Stock - |
|
|
|
|
|
|
|
|
|
|
|||
Kawa Solar Holdings Limited |
Construction & Engineering |
|
|
$ |
|
$ |
— |
|
(6) (8) (10) (13) |
||||
Total Preferred Stock |
|
|
|
|
|
|
|
|
— |
|
|
||
Total Germany |
|
|
|
|
|
$ |
|
$ |
— |
|
|
||
Singapore - |
|
|
|
|
|
|
|
|
|
|
|||
Common Stock - |
|
|
|
|
|
|
|
|
|
|
|||
Conergy Asia & ME Pte. LTD. |
Construction & Engineering |
|
|
|
$ |
|
$ |
— |
|
(6) (8) (10) (12) |
|||
Total Common Stock |
|
|
|
|
|
|
|
|
— |
|
|
||
Total Singapore |
|
|
|
|
|
$ |
|
$ |
— |
|
|
||
United States - |
|
|
|
|
|
|
|
|
|
|
|||
Common Stock - |
|
|
|
|
|
|
|
|
|
|
|||
Elah Holdings, Inc. |
Capital Markets |
|
|
|
$ |
|
$ |
|
(7) (8) (10) (12) |
||||
ATX Parent Holdings, LLC - Class A Units |
Communications Equipment |
|
|
|
|
|
|
|
(6) (8) (10) (12) |
||||
Foundation Software - Class B |
Construction & Engineering |
|
|
|
|
— |
|
|
|
(7) (8) (12) |
|||
Animal Supply Holdings, LLC |
Distributors |
|
|
|
|
|
|
— |
|
(8) (10) (12) |
|||
Animal Supply Holdings, LLC |
Distributors |
|
|
|
|
|
|
— |
|
(8) (10) (12) |
|||
Southeast Mechanical, LLC (dba. SEM Holdings, LLC) |
Diversified Consumer Services |
|
|
|
|
|
|
|
(7) (8) (10) (12) |
||||
Whitewater Holding Company LLC |
Diversified Consumer Services |
|
|
|
|
|
|
|
(7) (8) (12) |
||||
Iracore International Holdings, Inc. |
Energy Equipment & Services |
|
|
|
|
|
|
|
(8) (10) (12) |
||||
Country Fresh Holding Company Inc. |
Food Products |
|
|
|
|
|
|
— |
|
(7) (8) (12) |
|||
Collaborative Imaging Holdco, LLC (dba Texas Radiology Associates) - Class B |
Health Care Providers & Services |
|
|
|
|
|
|
|
(7) (8) (10) |
||||
Collaborative Imaging Holdco, LLC (dba Texas Radiology Associates) - Performance Units |
Health Care Providers & Services |
|
|
|
|
|
|
|
(6) (7) (8) (10) |
||||
PPT Management Holdings, LLC (dba Pro-PT) |
Health Care Providers & Services |
|
|
|
|
— |
|
|
— |
|
(8) (12) |
||
Total Vision LLC |
Health Care Providers & Services |
|
|
|
|
|
|
|
(7) (8) (12) |
||||
MedeAnalytics, Inc. |
Health Care Technology |
|
|
|
|
— |
|
|
— |
|
(7) (8) (10) (12) |
||
Volt Bidco, Inc. (dba Power Factors) |
Independent Power and Renewable Electricity Producers |
|
|
|
|
|
|
|
(7) (8) (12) |
||||
Abacus Data Holdings, Inc. (dba Clutch Intermediate Holdings) |
Software |
|
|
|
|
|
|
|
(7) (8) (12) |
||||
Total Common Stock |
|
|
|
|
|
|
|
|
|
|
|||
Preferred Stock - |
|
|
|
|
|
|
|
|
|
|
|||
Wine.com, LLC |
Beverages |
|
|
|
$ |
|
$ |
— |
|
(7) (8) (12) |
|||
Wine.com, LLC |
Beverages |
|
|
|
|
|
|
— |
|
(7) (8) (12) |
|||
Foundation Software |
Construction & Engineering |
|
|
|
|
|
|
|
(7) (8) (12) |
||||
MedeAnalytics, Inc. |
Health Care Technology |
|
|
— |
|
|
— |
|
|
— |
|
(7) (8) (10) (12) (16) |
|
WSO2, Inc. |
IT Services |
|
|
|
|
|
|
|
(7) (8) (12) |
||||
CloudBees, Inc. |
Software |
|
|
|
|
|
|
|
(7) (8) (12) |
||||
Governmentjobs.com, Inc. (dba NeoGov) |
Software |
|
|
|
|
|
|
|
(7) (8) (12) |
||||
Total Preferred Stock |
|
|
|
|
|
|
|
|
|
|
|||
|
|
|
|
|
|
|
|
|
|
|
|||
The accompanying notes are an integral part of these consolidated financial statements.
100
Goldman Sachs BDC, Inc.
Consolidated Schedule of Investments as of December 31, 2023 (continued)
(in thousands, except share and per share amounts)
Investment (1)(5) |
Industry(2) |
Interest |
Initial |
Shares(4) |
|
Cost |
|
Fair |
|
Footnotes |
|||
Warrants - |
|
|
|
|
|
|
|
|
|
|
|||
KDOR Holdings Inc. (dba Senneca Holdings) |
Building Products |
|
|
|
$ |
— |
|
$ |
— |
|
(7) (8) (12) |
||
KDOR Holdings Inc. (dba Senneca Holdings) |
Building Products |
|
|
|
|
— |
|
|
— |
|
(7) (8) (12) |
||
KDOR Holdings Inc. (dba Senneca Holdings) |
Building Products |
|
|
|
|
— |
|
|
— |
|
(7) (8) (12) |
||
CloudBees, Inc. |
Software |
|
|
|
|
|
|
|
(7) (8) (12) |
||||
Total Warrants |
|
|
|
|
|
|
|
|
|
|
|||
Total United States |
|
|
|
|
|
$ |
|
$ |
|
|
|||
Total Equity Securities |
|
|
|
|
|
$ |
|
$ |
|
|
|||
Total Investments - |
|
|
|
|
|
$ |
|
$ |
|
|
|||
PIK – Payment-In-Kind
ADDITIONAL INFORMATION
Foreign currency forward contracts
Counterparty |
Currency Purchased |
Currency Sold |
Settlement |
Unrealized |
|
|
Bank of America, N.A. |
USD |
GBP |
$ |
( |
) |
|
Bank of America, N.A. |
USD |
Euro |
|
( |
) |
|
Bank of America, N.A. |
USD |
GBP |
|
( |
) |
|
|
|
|
|
$ |
( |
) |
The accompanying notes are an integral part of these consolidated financial statements.
101
Goldman Sachs BDC, Inc.
Consolidated Schedule of Investments as of December 31, 2022
(in thousands, except share and per share amounts)
Investment *# |
Industry |
Interest |
Reference Rate |
Maturity |
|
Par |
|
Cost |
|
Fair |
|
Footnotes |
|||
1st Lien/Senior Secured Debt - |
|
|
|
|
|
|
|
|
|
|
|
|
|||
1272775 B.C. LTD. (dba Everest Clinical Research) |
Professional Services |
S + |
$ |
|
|
$ |
|
$ |
|
(1) (2) (3) |
|||||
1272775 B.C. LTD. (dba Everest Clinical Research) |
Professional Services |
P + |
|
|
|
|
|
|
|
(1) (2) (3) (4) |
|||||
1272775 B.C. LTD. (dba Everest Clinical Research) |
Professional Services |
CDN P + |
CAD |
|
|
|
|
|
|
(1) (2) (3) |
|||||
3SI Security Systems, Inc. |
Commercial Services & Supplies |
L + |
|
|
|
|
|
|
|
(3) |
|||||
3SI Security Systems, Inc. |
Commercial Services & Supplies |
L + |
|
|
|
|
|
|
|
(3) |
|||||
A Place For Mom, Inc. |
Diversified Consumer Services |
L + |
|
|
|
|
|
|
|
|
|||||
Abacus Data Holdings, Inc. (dba Clutch Intermediate Holdings) |
Software |
L + |
|
|
|
|
|
|
|
(2) (3) |
|||||
Abacus Data Holdings, Inc. (dba Clutch Intermediate Holdings) |
Software |
L + |
|
|
|
|
|
|
|
(2) (3) (4) |
|||||
Abacus Data Holdings, Inc. (dba Clutch Intermediate Holdings) |
Software |
L + |
|
|
|
|
|
|
|
(2) (3) (4) |
|||||
Acquia, Inc. |
Software |
L + |
|
|
|
|
|
|
|
(2) (3) |
|||||
Acquia, Inc. |
Software |
L + |
|
|
|
|
|
|
|
(2) (3) (4) |
|||||
Admiral Buyer, Inc. (dba Fidelity Payment Services) |
Financial Services |
S + |
|
|
|
|
|
|
|
(2) (3) |
|||||
Admiral Buyer, Inc. (dba Fidelity Payment Services) |
Financial Services |
|
S + |
|
|
|
|
( |
) |
|
( |
) |
(2) (3) (4) |
||
Admiral Buyer, Inc. (dba Fidelity Payment Services) |
Financial Services |
|
S + |
|
|
|
|
( |
) |
|
( |
) |
(2) (3) (4) |
||
Ansira Partners, Inc. |
Professional Services |
|
L + |
|
|
|
|
|
|
|
(5) |
||||
Ansira Partners, Inc. |
Professional Services |
|
L + |
|
|
|
|
|
|
|
(5) |
||||
Ansira Partners, Inc. |
Professional Services |
S + |
|
|
|
|
|
|
|
(2) (4) (6) |
|||||
Apptio, Inc. |
IT Services |
L + |
|
|
|
|
|
|
|
(2) (3) |
|||||
Apptio, Inc. |
IT Services |
L + |
|
|
|
|
|
|
|
(2) (3) (4) |
|||||
AQ Helios Buyer, Inc. (dba SurePoint) |
Software |
S + |
|
|
|
|
|
|
|
(2) (3) |
|||||
AQ Helios Buyer, Inc. (dba SurePoint) |
Software |
S + |
|
|
|
|
|
|
|
(2) (3) |
|||||
AQ Helios Buyer, Inc. (dba SurePoint) |
Software |
S + |
|
|
|
|
|
|
|
(2) (3) (4) |
|||||
AQ Helios Buyer, Inc. (dba SurePoint) |
Software |
|
S + |
|
|
|
|
( |
) |
|
( |
) |
(2) (3) (4) |
||
Argos Health Holdings, Inc |
Health Care Providers & Services |
L + |
|
|
|
|
|
|
|
(2) (3) |
|||||
Aria Systems, Inc. |
Financial Services |
S + |
|
|
|
|
|
|
|
(2) (3) |
|||||
Assembly Intermediate LLC |
Diversified Consumer Services |
L + |
|
|
|
|
|
|
|
(2) (3) |
|||||
Assembly Intermediate LLC |
Diversified Consumer Services |
L + |
|
|
|
|
|
|
|
(2) (3) (4) |
|||||
Assembly Intermediate LLC |
Diversified Consumer Services |
L + |
|
|
|
|
|
|
|
(2) (3) (4) |
|||||
ATX Networks Corp. |
Communications Equipment |
L + |
|
|
|
|
|
|
|
^ (1) (3) |
|||||
Badger Sportswear, Inc. |
Textiles, Apparel & Luxury Goods |
L + |
|
|
|
|
|
|
|
|
|||||
Bigchange Group Limited |
Software |
SN + |
GBP |
|
|
|
|
|
|
(1) (2) (3) |
|||||
Bigchange Group Limited |
Software |
SN + |
GBP |
|
|
|
|
|
|
(1) (2) (3) (4) |
|||||
Bigchange Group Limited |
Software |
|
SN + |
GBP |
|
|
|
( |
) |
|
( |
) |
(1) (2) (3) (4) |
||
Broadway Technology, LLC |
Financial Services |
S + |
|
|
|
|
|
|
|
(2) (3) |
|||||
Broadway Technology, LLC |
Financial Services |
|
S + |
|
|
|
|
( |
) |
|
( |
) |
(2) (3) (4) |
||
BSI3 Menu Buyer, Inc (dba Kydia) |
Financial Services |
S + |
|
|
|
|
|
|
|
(2) (3) |
|||||
BSI3 Menu Buyer, Inc (dba Kydia) |
Financial Services |
|
S + |
|
|
|
|
( |
) |
|
( |
) |
(2) (3) (4) |
||
Bullhorn, Inc. |
Professional Services |
L + |
|
|
|
|
|
|
|
(2) (3) |
|||||
Bullhorn, Inc. |
Professional Services |
L + |
|
|
|
|
|
|
|
(2) (3) |
|||||
Bullhorn, Inc. |
Professional Services |
L + |
|
|
|
|
|
|
|
(2) (3) |
|||||
Bullhorn, Inc. |
Professional Services |
L + |
|
|
|
|
|
|
|
(2) (3) (4) |
|||||
Bullhorn, Inc. |
Professional Services |
L + |
|
|
|
|
|
|
|
(2) (3) |
|||||
Bullhorn, Inc. |
Professional Services |
L + |
|
|
|
|
|
|
|
(2) (3) |
|||||
Businessolver.com, Inc. |
Health Care Technology |
L + |
|
|
|
|
|
|
|
(2) (3) |
|||||
Businessolver.com, Inc. |
Health Care Technology |
L + |
|
|
|
|
|
|
|
(2) (3) (4) |
|||||
Capitol Imaging Acquisition Corp. |
Health Care Providers & Services |
S + |
|
|
|
|
|
|
|
(2) (3) |
|||||
Capitol Imaging Acquisition Corp. |
Health Care Providers & Services |
S + |
|
|
|
|
|
|
|
(2) (3) |
|||||
Capitol Imaging Acquisition Corp. |
Health Care Providers & Services |
P + |
|
|
|
|
|
|
|
(2) (3) (4) |
|||||
CFS Management, LLC (dba Center for Sight Management) |
Health Care Providers & Services |
S + |
|
|
|
|
|
|
|
(2) (3) |
|||||
CFS Management, LLC (dba Center for Sight Management) |
Health Care Providers & Services |
S + |
|
|
|
|
|
|
|
(2) (3) |
|||||
The accompanying notes are an integral part of these consolidated financial statements.
102
Goldman Sachs BDC, Inc.
Consolidated Schedule of Investments as of December 31, 2022 (continued)
(in thousands, except share and per share amounts)
Investment *# |
Industry |
Interest |
Reference Rate |
Maturity |
|
Par |
|
Cost |
|
Fair |
|
Footnotes |
|||
CFS Management, LLC (dba Center for Sight Management) |
Health Care Providers & Services |
S + |
$ |
|
|
$ |
|
$ |
|
(2) (3) |
|||||
Checkmate Finance Merger Sub, LLC |
Entertainment |
L + |
|
|
|
|
|
|
|
(2) (3) |
|||||
Checkmate Finance Merger Sub, LLC |
Entertainment |
|
L + |
|
|
|
|
( |
) |
|
( |
) |
(2) (3) (4) |
||
Chronicle Bidco Inc. (dba Lexitas) |
Professional Services |
S + |
|
|
|
|
|
|
|
(2) (3) |
|||||
Chronicle Bidco Inc. (dba Lexitas) |
Professional Services |
|
S + |
|
|
|
|
( |
) |
|
( |
) |
(2) (3) (4) |
||
CivicPlus LLC |
Software |
L + |
|
|
|
|
|
|
|
(2) (3) |
|||||
CivicPlus LLC |
Software |
L + |
|
|
|
|
|
|
|
(2) (3) |
|||||
CivicPlus LLC |
Software |
L + |
|
|
|
|
|
|
|
(2) (3) |
|||||
CivicPlus LLC |
Software |
|
L + |
|
|
|
|
( |
) |
|
( |
) |
(2) (3) (4) |
||
Clearcourse Partnership Acquireco Finance Limited |
IT Services |
SN + |
GBP |
|
|
|
|
|
|
(1) (2) (3) |
|||||
Clearcourse Partnership Acquireco Finance Limited |
IT Services |
SN + |
GBP |
|
|
|
|
|
|
(1) (2) (3) (4) |
|||||
CloudBees, Inc. |
Software |
L + |
|
|
|
|
|
|
|
(2) (3) |
|||||
CloudBees, Inc. |
Software |
L + |
|
|
|
|
|
|
|
(2) (3) (4) |
|||||
Coding Solutions Acquisition, Inc. |
Health Care Providers & Services |
S + |
|
|
|
|
|
|
|
(2) (3) |
|||||
Coding Solutions Acquisition, Inc. |
Health Care Providers & Services |
S + |
|
|
|
|
|
|
|
(2) (3) (4) |
|||||
Coding Solutions Acquisition, Inc. |
Health Care Providers & Services |
|
S + |
|
|
|
|
( |
) |
|
( |
) |
(2) (3) (4) |
||
Computer Services, Inc. |
Financial Services |
S + |
|
|
|
|
|
|
|
(2) |
|||||
CORA Health Holdings Corp |
Health Care Providers & Services |
L + |
|
|
|
|
|
|
|
(2) (3) |
|||||
CORA Health Holdings Corp |
Health Care Providers & Services |
L + |
|
|
|
|
|
|
( |
) |
(2) (3) (4) |
||||
CorePower Yoga LLC |
Diversified Consumer Services |
L + |
|
|
|
|
|
|
|
(2) (3) |
|||||
CorePower Yoga LLC |
Diversified Consumer Services |
L + |
|
|
|
|
|
|
|
(2) (3) (4) |
|||||
Coretrust Purchasing Group LLC |
Financial Services |
S + |
|
|
|
|
|
|
|
(2) (3) |
|||||
Coretrust Purchasing Group LLC |
Financial Services |
|
S + |
|
|
|
|
( |
) |
|
( |
) |
(2) (3) (4) |
||
Coretrust Purchasing Group LLC |
Financial Services |
|
S + |
|
|
|
|
( |
) |
|
( |
) |
(2) (3) (4) |
||
CST Buyer Company (dba Intoxalock) |
Diversified Consumer Services |
S + |
|
|
|
|
|
|
|
(2) |
|||||
CST Buyer Company (dba Intoxalock) |
Diversified Consumer Services |
S + |
|
|
|
|
|
|
|
(2) (4) |
|||||
DECA Dental Holdings LLC |
Health Care Providers & Services |
L + |
|
|
|
|
|
|
|
(2) (3) |
|||||
DECA Dental Holdings LLC |
Health Care Providers & Services |
L + |
|
|
|
|
|
|
|
(2) (3) (4) |
|||||
DECA Dental Holdings LLC |
Health Care Providers & Services |
L + |
|
|
|
|
|
|
|
(2) (3) (4) |
|||||
Diligent Corporation |
Professional Services |
L + |
€ |
|
|
|
|
|
|
(2) (3) |
|||||
Diligent Corporation |
Professional Services |
L + |
|
|
|
|
|
|
|
(2) (3) |
|||||
Diligent Corporation |
Professional Services |
L + |
|
|
|
|
|
|
|
(2) (3) (4) |
|||||
Elemica Parent, Inc. |
Chemicals |
L + |
|
|
|
|
|
|
|
(2) (3) |
|||||
Elemica Parent, Inc. |
Chemicals |
S + |
|
|
|
|
|
|
|
(2) (3) |
|||||
Elemica Parent, Inc. |
Chemicals |
S + |
|
|
|
|
|
|
|
(2) (3) |
|||||
Elemica Parent, Inc. |
Chemicals |
S + |
|
|
|
|
|
|
|
(2) (3) |
|||||
Elemica Parent, Inc. |
Chemicals |
S + |
|
|
|
|
|
|
|
(2) (3) |
|||||
Eptam Plastics, Ltd. |
Health Care Equipment & Supplies |
S + |
|
|
|
|
|
|
|
(2) (3) |
|||||
Eptam Plastics, Ltd. |
Health Care Equipment & Supplies |
S + |
|
|
|
|
|
|
|
(2) (3) |
|||||
Eptam Plastics, Ltd. |
Health Care Equipment & Supplies |
S + |
|
|
|
|
|
|
|
(2) (3) |
|||||
Eptam Plastics, Ltd. |
Health Care Equipment & Supplies |
S + |
|
|
|
|
|
|
|
(2) (3) |
|||||
Eptam Plastics, Ltd. |
Health Care Equipment & Supplies |
S + |
|
|
|
|
|
|
|
(2) (3) (4) |
|||||
ESO Solutions, Inc |
Health Care Technology |
S + |
|
|
|
|
|
|
|
(2) (3) |
|||||
ESO Solutions, Inc |
Health Care Technology |
|
S + |
|
|
|
|
( |
) |
|
( |
) |
(2) (3) (4) |
||
Everest Clinical Research Corporation |
Professional Services |
S + |
|
|
|
|
|
|
|
(1) (2) (3) |
|||||
Experity, Inc. |
Health Care Technology |
L + |
|
|
|
|
|
|
|
(2) (3) |
|||||
Experity, Inc. |
Health Care Technology |
|
L + |
|
|
|
|
— |
|
|
( |
) |
(2) (3) (4) |
||
Fullsteam Operations LLC |
Financial Services |
L + |
|
|
|
|
|
|
|
(2) (3) |
|||||
Fullsteam Operations LLC |
Financial Services |
L + |
|
|
|
|
|
|
|
(2) (3) |
|||||
Fullsteam Operations LLC |
Financial Services |
L + |
|
|
|
|
|
|
|
(2) (3) (4) |
|||||
The accompanying notes are an integral part of these consolidated financial statements.
103
Goldman Sachs BDC, Inc.
Consolidated Schedule of Investments as of December 31, 2022 (continued)
(in thousands, except share and per share amounts)
Investment *# |
Industry |
Interest |
Reference Rate |
Maturity |
|
Par |
|
Cost |
|
Fair |
|
Footnotes |
|||
Fullsteam Operations LLC |
Financial Services |
|
L + |
$ |
|
|
$ |
( |
) |
$ |
( |
) |
(2) (3) (4) |
||
Gainsight, Inc. |
Software |
L + |
|
|
|
|
|
|
|
(2) (3) |
|||||
Gainsight, Inc. |
Software |
|
L + |
|
|
|
|
( |
) |
|
( |
) |
(2) (3) (4) |
||
GHA Buyer Inc. (dba Cedar Gate) |
Health Care Technology |
S + |
|
|
|
|
|
|
|
(2) (3) |
|||||
GHA Buyer Inc. (dba Cedar Gate) |
Health Care Technology |
S + |
|
|
|
|
|
|
|
(2) (3) |
|||||
GHA Buyer Inc. (dba Cedar Gate) |
Health Care Technology |
S + |
|
|
|
|
|
|
|
(2) (3) |
|||||
GHA Buyer Inc. (dba Cedar Gate) |
Health Care Technology |
|
S + |
|
|
|
|
( |
) |
|
( |
) |
(2) (3) (4) |
||
GovDelivery Holdings, LLC (dba Granicus, Inc.) |
Software |
L + |
|
|
|
|
|
|
|
(2) |
|||||
GovDelivery Holdings, LLC (dba Granicus, Inc.) |
Software |
L + |
|
|
|
|
|
|
|
(2) |
|||||
GovDelivery Holdings, LLC (dba Granicus, Inc.) |
Software |
L + |
|
|
|
|
|
|
|
(2) (4) |
|||||
Governmentjobs.com, Inc. (dba NeoGov) |
Software |
L + |
|
|
|
|
|
|
|
(2) (3) |
|||||
Governmentjobs.com, Inc. (dba NeoGov) |
Software |
|
L + |
|
|
|
|
( |
) |
|
( |
) |
(2) (3) (4) |
||
Governmentjobs.com, Inc. (dba NeoGov) |
Software |
|
L + |
|
|
|
|
( |
) |
|
( |
) |
(2) (3) (4) |
||
GS AcquisitionCo, Inc. (dba Insightsoftware) |
Financial Services |
L + |
|
|
|
|
|
|
|
(2) |
|||||
GS AcquisitionCo, Inc. (dba Insightsoftware) |
Financial Services |
|
L + |
|
|
|
|
( |
) |
|
( |
) |
(2) (4) |
||
Halo Branded Solutions, Inc. |
Commercial Services & Supplies |
L + |
|
|
|
|
|
|
|
|
|||||
HealthEdge Software, Inc. |
Health Care Technology |
L + |
|
|
|
|
|
|
|
(2) (3) |
|||||
HealthEdge Software, Inc. |
Health Care Technology |
L + |
|
|
|
|
|
|
|
(2) (3) |
|||||
HealthEdge Software, Inc. |
Health Care Technology |
|
L + |
|
|
|
|
( |
) |
|
( |
) |
(2) (3) (4) |
||
HealthEdge Software, Inc. |
Health Care Technology |
|
L + |
|
|
|
|
( |
) |
|
( |
) |
(2) (3) (4) |
||
Helios Buyer, Inc. (dba Heartland) |
Diversified Consumer Services |
L + |
|
|
|
|
|
|
|
(2) (3) |
|||||
Helios Buyer, Inc. (dba Heartland) |
Diversified Consumer Services |
L + |
|
|
|
|
|
|
|
(2) (3) |
|||||
Helios Buyer, Inc. (dba Heartland) |
Diversified Consumer Services |
L + |
|
|
|
|
|
|
|
(2) (3) |
|||||
Helios Buyer, Inc. (dba Heartland) |
Diversified Consumer Services |
|
L + |
|
|
|
|
( |
) |
|
( |
) |
(2) (3) (4) |
||
Hollander Intermediate LLC (dba Bedding Acquisition, LLC) |
Household Products |
S + |
|
|
|
|
|
|
|
(2) (3) |
|||||
Honor HN Buyer, Inc |
Health Care Providers & Services |
S + |
|
|
|
|
|
|
|
(2) (3) |
|||||
Honor HN Buyer, Inc |
Health Care Providers & Services |
S + |
|
|
|
|
|
|
|
(2) (3) (4) |
|||||
Honor HN Buyer, Inc |
Health Care Providers & Services |
|
S + |
|
|
|
|
( |
) |
|
( |
) |
(2) (3) (4) |
||
Honor HN Buyer, Inc |
Health Care Providers & Services |
|
S + |
|
|
|
|
( |
) |
|
( |
) |
(2) (3) (4) |
||
HowlCO LLC (dba Lone Wolf) |
Real Estate Mgmt. & Development |
L + |
|
|
|
|
|
|
|
(1) (2) (3) |
|||||
HowlCO LLC (dba Lone Wolf) |
Real Estate Mgmt. & Development |
L + |
|
|
|
|
|
|
|
(1) (2) (3) |
|||||
HowlCO LLC (dba Lone Wolf) |
Real Estate Mgmt. & Development |
L + |
|
|
|
|
|
|
|
(1) (2) (3) |
|||||
HS4 AcquisitionCo, Inc. (dba HotSchedules & Fourth) |
Hotels, Restaurants & Leisure |
L + |
|
|
|
|
|
|
|
(2) (3) |
|||||
HS4 AcquisitionCo, Inc. (dba HotSchedules & Fourth) |
Hotels, Restaurants & Leisure |
L + |
|
|
|
|
|
|
|
(2) (3) (4) |
|||||
HumanState Limited (dba PayProp) |
Diversified Consumer Services |
SN + |
GBP |
|
|
|
|
|
|
(1) (2) |
|||||
HumanState Limited (dba PayProp) |
Diversified Consumer Services |
|
SN + |
GBP |
|
|
|
( |
) |
|
( |
) |
(1) (2) (4) |
||
HumanState Limited (dba PayProp) |
Diversified Consumer Services |
|
SN + |
GBP |
|
|
|
( |
) |
|
( |
) |
(1) (2) (4) |
||
iCIMS, Inc. |
Professional Services |
S + |
|
|
|
|
|
|
|
(2) (3) |
|||||
iCIMS, Inc. |
Professional Services |
|
S + |
|
|
|
|
( |
) |
|
( |
) |
(2) (3) (4) |
||
iCIMS, Inc. |
Professional Services |
|
S + |
|
|
|
|
— |
|
|
( |
) |
(2) (3) (4) |
||
Intelligent Medical Objects, Inc. |
Health Care Technology |
S + |
|
|
|
|
|
|
|
(2) (3) |
|||||
Intelligent Medical Objects, Inc. |
Health Care Technology |
S + |
|
|
|
|
|
|
|
(2) (3) (4) |
|||||
Intelligent Medical Objects, Inc. |
Health Care Technology |
|
S + |
|
|
|
|
( |
) |
|
( |
) |
(2) (3) (4) |
||
Internet Truckstop Group, LLC (dba Truckstop) |
Transportation Infrastructure |
L + |
|
|
|
|
|
|
|
(2) (3) |
|||||
Internet Truckstop Group, LLC (dba Truckstop) |
Transportation Infrastructure |
|
L + |
|
|
|
|
( |
) |
|
( |
) |
(2) (3) (4) |
||
Iracore International Holdings, Inc. |
Energy Equipment & Services |
L + |
|
|
|
|
|
|
|
^ (3) |
|||||
iWave Information Systems, Inc. |
Software |
S + |
|
|
|
|
|
|
|
(1) (2) |
|||||
iWave Information Systems, Inc. |
Software |
|
S + |
|
|
|
|
( |
) |
|
( |
) |
(1) (2) (4) |
||
Jill Acquisition LLC (dba J. Jill) |
Specialty Retail |
L + |
|
|
|
|
|
|
|
|
|||||
Kaseya Inc. |
IT Services |
S + |
|
|
|
|
|
|
|
(2) (3) |
|||||
The accompanying notes are an integral part of these consolidated financial statements.
104
Goldman Sachs BDC, Inc.
Consolidated Schedule of Investments as of December 31, 2022 (continued)
(in thousands, except share and per share amounts)
Investment *# |
Industry |
Interest |
Reference Rate |
Maturity |
Par |
|
Cost |
|
Fair |
|
Footnotes |
|||
Kaseya Inc. |
IT Services |
|
S + |
$ |
|
$ |
( |
) |
$ |
( |
) |
(2) (3) (4) |
||
Kaseya Inc. |
IT Services |
|
S + |
|
|
|
( |
) |
|
( |
) |
(2) (3) (4) |
||
Kawa Solar Holdings Limited |
Construction & Engineering |
|
|
|
|
|
|
|
|
^ (1) (3) (7) |
||||
Kawa Solar Holdings Limited |
Construction & Engineering |
|
|
|
|
|
|
|
— |
|
^ (1) (3) (7) |
|||
LCG Vardiman Black, LLC (dba Specialty Dental Brands) |
Health Care Providers & Services |
S + |
|
|
|
|
|
|
(2) (3) (4) |
|||||
Lithium Technologies, Inc. |
Interactive Media & Services |
S + |
|
|
|
|
|
|
(2) (3) |
|||||
Lithium Technologies, Inc. |
Interactive Media & Services |
S + |
|
|
|
|
|
|
(2) (3) (4) |
|||||
LS Clinical Services Holdings, Inc (dba CATO) |
Pharmaceuticals |
L + |
|
|
|
|
|
|
(2) (3) |
|||||
LS Clinical Services Holdings, Inc (dba CATO) |
Pharmaceuticals |
L + |
|
|
|
|
|
|
(2) (3) |
|||||
MedeAnalytics, Inc. |
Health Care Technology |
|
S + |
|
|
|
|
|
|
(2) (3) (5) |
||||
MerchantWise Solutions, LLC (dba HungerRush) |
Financial Services |
S + |
|
|
|
|
|
|
(2) (3) |
|||||
MerchantWise Solutions, LLC (dba HungerRush) |
Financial Services |
S + |
|
|
|
|
|
|
(2) (3) (4) |
|||||
MerchantWise Solutions, LLC (dba HungerRush) |
Financial Services |
|
S + |
|
|
|
( |
) |
|
( |
) |
(2) (3) (4) |
||
Millstone Medical Outsourcing, LLC |
Health Care Providers & Services |
S + |
|
|
|
|
|
|
(2) (3) |
|||||
Millstone Medical Outsourcing, LLC |
Health Care Providers & Services |
P + |
|
|
|
|
|
|
(2) (3) (4) |
|||||
MRI Software LLC |
Real Estate Mgmt. & Development |
L + |
|
|
|
|
|
|
|
|||||
MRI Software LLC |
Real Estate Mgmt. & Development |
L + |
|
|
|
|
|
|
|
|||||
MRI Software LLC |
Real Estate Mgmt. & Development |
|
L + |
|
|
|
( |
) |
|
( |
) |
(4) |
||
NFM & J, L.P. (dba the Facilities Group) |
Professional Services |
L + |
|
|
|
|
|
|
(2) (3) |
|||||
NFM & J, L.P. (dba the Facilities Group) |
Professional Services |
L + |
|
|
|
|
|
|
(2) (3) (4) |
|||||
NFM & J, L.P. (dba the Facilities Group) |
Professional Services |
|
L + |
|
|
|
( |
) |
|
( |
) |
(2) (3) (4) |
||
One GI LLC |
Health Care Providers & Services |
L + |
|
|
|
|
|
|
(2) (3) |
|||||
One GI LLC |
Health Care Providers & Services |
L + |
|
|
|
|
|
|
(2) (3) |
|||||
One GI LLC |
Health Care Providers & Services |
L + |
|
|
|
|
|
|
(2) (3) |
|||||
One GI LLC |
Health Care Providers & Services |
L + |
|
|
|
|
|
|
(2) (3) (4) |
|||||
One GI LLC |
Health Care Providers & Services |
|
L + |
|
|
|
( |
) |
|
( |
) |
(2) (3) (4) |
||
Output Services Group, Inc. |
Diversified Consumer Services |
S + |
|
|
|
|
|
|
|
|||||
PDDS Holdco, Inc. (dba Planet DDS) |
Health Care Technology |
S + |
|
|
|
|
|
|
(2) (3) |
|||||
PDDS Holdco, Inc. (dba Planet DDS) |
Health Care Technology |
S + |
|
|
|
|
|
|
(2) (3) |
|||||
PDDS Holdco, Inc. (dba Planet DDS) |
Health Care Technology |
S + |
|
|
|
|
|
|
(2) (3) (4) |
|||||
PDDS Holdco, Inc. (dba Planet DDS) |
Health Care Technology |
|
S + |
|
|
|
( |
) |
|
( |
) |
(2) (3) (4) |
||
PDDS Holdco, Inc. (dba Planet DDS) |
Health Care Technology |
|
S + |
|
|
|
( |
) |
|
( |
) |
(2) (3) (4) |
||
Picture Head Midco LLC |
Entertainment |
S + |
|
|
|
|
|
|
(2) (3) |
|||||
Pioneer Buyer I, LLC |
Software |
L + |
|
|
|
|
|
|
(2) (3) |
|||||
Pioneer Buyer I, LLC |
Software |
|
L + |
|
|
|
( |
) |
|
( |
) |
(2) (3) (4) |
||
PlanSource Holdings, Inc. |
Health Care Technology |
L + |
|
|
|
|
|
|
(2) (3) |
|||||
PlanSource Holdings, Inc. |
Health Care Technology |
L + |
|
|
|
|
|
|
(2) (3) |
|||||
PlanSource Holdings, Inc. |
Health Care Technology |
L + |
|
|
|
|
|
|
(2) (3) |
|||||
PlanSource Holdings, Inc. |
Health Care Technology |
|
L + |
|
|
|
( |
) |
|
( |
) |
(2) (3) (4) |
||
Pluralsight, Inc |
Professional Services |
L + |
|
|
|
|
|
|
(2) (3) |
|||||
Pluralsight, Inc |
Professional Services |
L + |
|
|
|
|
|
|
(2) (3) (4) |
|||||
PPT Management Holdings, LLC. |
Health Care Providers & Services |
|
L + |
|
|
|
|
|
|
(3) (5) |
||||
PPT Management Holdings, LLC. |
Health Care Providers & Services |
|
L + |
|
|
|
— |
|
|
( |
) |
(3) (4) |
||
Premier Care Dental Management, LLC |
Health Care Providers & Services |
L + |
|
|
|
|
|
|
(2) (3) |
|||||
Premier Care Dental Management, LLC |
Health Care Providers & Services |
L + |
|
|
|
|
|
|
(2) (3) (4) |
|||||
Premier Care Dental Management, LLC |
Health Care Providers & Services |
L + |
|
|
|
|
|
|
(2) (3) (4) |
|||||
Premier Imaging, LLC (dba Lucid Health) |
Health Care Providers & Services |
L + |
|
|
|
|
|
|
(2) (3) |
|||||
Premier Imaging, LLC (dba Lucid Health) |
Health Care Providers & Services |
L + |
|
|
|
|
|
|
(2) (3) |
|||||
Premier Imaging, LLC (dba Lucid Health) |
Health Care Providers & Services |
L + |
|
|
|
|
|
|
(2) (3) |
|||||
Premier Imaging, LLC (dba Lucid Health) |
Health Care Providers & Services |
L + |
|
|
|
|
|
|
(2) (3) (4) |
|||||
The accompanying notes are an integral part of these consolidated financial statements.
105
Goldman Sachs BDC, Inc.
Consolidated Schedule of Investments as of December 31, 2022 (continued)
(in thousands, except share and per share amounts)
Investment *# |
Industry |
Interest |
Reference Rate |
Maturity |
Par |
|
Cost |
|
Fair |
|
Footnotes |
|||
Project Eagle Holdings, LLC (dba Exostar) |
Aerospace & Defense |
L + |
$ |
|
$ |
|
$ |
|
(2) (3) |
|||||
Project Eagle Holdings, LLC (dba Exostar) |
Aerospace & Defense |
|
L + |
|
|
|
( |
) |
|
( |
) |
(2) (3) (4) |
||
Prophix Software Inc. (dba Pound Bidco) |
Financial Services |
L + |
|
|
|
|
|
|
(1) (2) (3) |
|||||
Prophix Software Inc. (dba Pound Bidco) |
Financial Services |
L + |
|
|
|
|
|
|
(1) (2) (3) |
|||||
Prophix Software Inc. (dba Pound Bidco) |
Financial Services |
|
L + |
|
|
|
( |
) |
|
( |
) |
(1) (2) (3) (4) |
||
PT Intermediate Holdings III, LLC (dba Parts Town) |
Trading Companies & Distributors |
L + |
|
|
|
|
|
|
(2) |
|||||
PT Intermediate Holdings III, LLC (dba Parts Town) |
Trading Companies & Distributors |
L + |
|
|
|
|
|
|
(2) |
|||||
PT Intermediate Holdings III, LLC (dba Parts Town) |
Trading Companies & Distributors |
L + |
|
|
|
|
|
|
(2) |
|||||
PT Intermediate Holdings III, LLC (dba Parts Town) |
Trading Companies & Distributors |
L + |
|
|
|
|
|
|
(2) |
|||||
Purfoods, LLC |
Health Care Providers & Services |
L + |
|
|
|
|
|
|
(2) (3) |
|||||
Purfoods, LLC |
Health Care Providers & Services |
L + |
|
|
|
|
|
|
(2) (3) |
|||||
Qualawash Holdings, LLC |
Commercial Services & Supplies |
L + |
|
|
|
|
|
|
(2) (3) |
|||||
Qualawash Holdings, LLC |
Commercial Services & Supplies |
L + |
|
|
|
|
|
|
(2) (3) (4) |
|||||
Qualawash Holdings, LLC |
Commercial Services & Supplies |
|
L + |
|
|
|
( |
) |
|
( |
) |
(2) (3) (4) |
||
Riverpoint Medical, LLC |
Health Care Equipment & Supplies |
S + |
|
|
|
|
|
|
(2) (3) |
|||||
Riverpoint Medical, LLC |
Health Care Equipment & Supplies |
S + |
|
|
|
|
|
|
(2) (3) |
|||||
Riverpoint Medical, LLC |
Health Care Equipment & Supplies |
|
S + |
|
|
|
( |
) |
|
( |
) |
(2) (3) (4) |
||
Rodeo Buyer Company (dba Absorb Software) |
Professional Services |
L + |
|
|
|
|
|
|
(1) (2) (3) |
|||||
Rodeo Buyer Company (dba Absorb Software) |
Professional Services |
L + |
|
|
|
|
|
|
(1) (2) (3) (4) |
|||||
Rubrik, Inc. |
Software |
S + |
|
|
|
|
|
|
(2) (3) |
|||||
Rubrik, Inc. |
Software |
S + |
|
|
|
|
|
|
(2) (3) (4) |
|||||
Smarsh, Inc. |
Software |
S + |
|
|
|
|
|
|
(3) |
|||||
Smarsh, Inc. |
Software |
S + |
|
|
|
|
|
|
(3) (4) |
|||||
Smarsh, Inc. |
Software |
|
S + |
|
|
|
( |
) |
|
( |
) |
(3) (4) |
||
Southeast Mechanical, LLC (dba. SEM Holdings, LLC) |
Diversified Consumer Services |
S + |
|
|
|
|
|
|
^ (2) (3) |
|||||
Southeast Mechanical, LLC (dba. SEM Holdings, LLC) |
Diversified Consumer Services |
|
S + |
|
|
|
( |
) |
|
( |
) |
^ (2) (3) (4) |
||
Southeast Mechanical, LLC (dba. SEM Holdings, LLC) |
Diversified Consumer Services |
|
S + |
|
|
|
( |
) |
|
( |
) |
^ (2) (3) (4) |
||
SPay, Inc. (dba Stack Sports) |
Interactive Media & Services |
L + |
|
|
|
|
|
|
(2) (3) |
|||||
SPay, Inc. (dba Stack Sports) |
Interactive Media & Services |
L + |
|
|
|
|
|
|
(2) (3) |
|||||
SPay, Inc. (dba Stack Sports) |
Interactive Media & Services |
L + |
|
|
|
|
|
|
(2) (3) |
|||||
SpendMend, LLC |
Health Care Providers & Services |
S + |
|
|
|
|
|
|
(2) (3) |
|||||
SpendMend, LLC |
Health Care Providers & Services |
S + |
|
|
|
|
|
|
(2) (3) (4) |
|||||
SpendMend, LLC |
Health Care Providers & Services |
S + |
|
|
|
|
|
|
(2) (3) (4) |
|||||
Spotless Brands, LLC |
Diversified Consumer Services |
S + |
|
|
|
|
|
|
(2) |
|||||
Spotless Brands, LLC |
Diversified Consumer Services |
|
S + |
|
|
|
— |
|
|
( |
) |
(2) (4) |
||
StarCompliance Intermediate, LLC |
Financial Services |
L + |
|
|
|
|
|
|
(2) (3) |
|||||
StarCompliance Intermediate, LLC |
Financial Services |
L + |
|
|
|
|
|
|
(2) (3) |
|||||
StarCompliance Intermediate, LLC |
Financial Services |
L + |
|
|
|
|
|
|
(2) (3) (4) |
|||||
Sundance Group Holdings, Inc. (dba NetDocuments) |
Software |
S + |
|
|
|
|
|
|
(2) (3) |
|||||
Sundance Group Holdings, Inc. (dba NetDocuments) |
Software |
S + |
|
|
|
|
|
|
(2) (3) |
|||||
Sundance Group Holdings, Inc. (dba NetDocuments) |
Software |
|
S + |
|
|
|
( |
) |
|
( |
) |
(2) (3) (4) |
||
Sunstar Insurance Group, LLC |
Insurance |
S + |
|
|
|
|
|
|
(2) (3) (4) |
|||||
Sunstar Insurance Group, LLC |
Insurance |
S + |
|
|
|
|
|
|
(2) (3) |
|||||
Sunstar Insurance Group, LLC |
Insurance |
S + |
|
|
|
|
|
|
(2) (3) |
|||||
Sunstar Insurance Group, LLC |
Insurance |
|
S + |
|
|
|
( |
) |
|
( |
) |
(2) (3) (4) |
||
Sunstar Insurance Group, LLC |
Insurance |
|
S + |
|
|
|
( |
) |
|
( |
) |
(2) (3) (4) |
||
Superman Holdings, LLC (dba Foundation Software) |
Construction & Engineering |
L + |
|
|
|
|
|
|
(2) (3) |
|||||
The accompanying notes are an integral part of these consolidated financial statements.
106
Goldman Sachs BDC, Inc.
Consolidated Schedule of Investments as of December 31, 2022 (continued)
(in thousands, except share and per share amounts)
Investment *# |
Industry |
Interest |
Reference Rate |
Maturity |
|
Par |
|
Cost |
|
Fair |
|
Footnotes |
|||
Superman Holdings, LLC (dba Foundation Software) |
Construction & Engineering |
L + |
$ |
|
|
$ |
|
$ |
|
(2) (3) |
|||||
Superman Holdings, LLC (dba Foundation Software) |
Construction & Engineering |
|
L + |
|
|
|
|
( |
) |
|
( |
) |
(2) (3) (4) |
||
Sweep Purchaser LLC |
Commercial Services & Supplies |
L + |
|
|
|
|
|
|
|
(2) (3) |
|||||
Sweep Purchaser LLC |
Commercial Services & Supplies |
L + |
|
|
|
|
|
|
|
(2) (3) |
|||||
Sweep Purchaser LLC |
Commercial Services & Supplies |
L + |
|
|
|
|
|
|
|
(2) (3) |
|||||
Sweep Purchaser LLC |
Commercial Services & Supplies |
L + |
|
|
|
|
|
|
|
(2) (3) |
|||||
Sweep Purchaser LLC |
Commercial Services & Supplies |
L + |
|
|
|
|
|
|
|
(2) (3) (4) |
|||||
Syntellis Performance Solutions, LLC (dba Axiom) |
Health Care Technology |
S + |
|
|
|
|
|
|
|
(2) (3) |
|||||
Syntellis Performance Solutions, LLC (dba Axiom) |
Health Care Technology |
S + |
|
|
|
|
|
|
|
(2) (3) |
|||||
The Center for Orthopedic and Research Excellence, Inc. (dba HOPCo) |
Health Care Providers & Services |
S + |
|
|
|
|
|
|
|
(2) (3) |
|||||
The Center for Orthopedic and Research Excellence, Inc. (dba HOPCo) |
Health Care Providers & Services |
S + |
|
|
|
|
|
|
|
(2) (3) |
|||||
The Center for Orthopedic and Research Excellence, Inc. (dba HOPCo) |
Health Care Providers & Services |
S + |
|
|
|
|
|
|
|
(2) (3) |
|||||
The Center for Orthopedic and Research Excellence, Inc. (dba HOPCo) |
Health Care Providers & Services |
S + |
|
|
|
|
|
|
|
(2) (3) (4) |
|||||
The Center for Orthopedic and Research Excellence, Inc. (dba HOPCo) |
Health Care Providers & Services |
S + |
|
|
|
|
|
|
|
(2) (3) (4) |
|||||
Thrasio, LLC |
Broadline Retail |
L + |
|
|
|
|
|
|
|
(2) (3) |
|||||
Thrasio, LLC |
Broadline Retail |
|
L + |
|
|
|
|
( |
) |
|
( |
) |
(2) (3) (4) |
||
Total Vision LLC |
Health Care Providers & Services |
S + |
|
|
|
|
|
|
|
(2) (3) |
|||||
Total Vision LLC |
Health Care Providers & Services |
S + |
|
|
|
|
|
|
|
(2) (3) |
|||||
Total Vision LLC |
Health Care Providers & Services |
S + |
|
|
|
|
|
|
|
(2) (3) |
|||||
Total Vision LLC |
Health Care Providers & Services |
S + |
|
|
|
|
|
|
|
(2) (3) (4) |
|||||
Total Vision LLC |
Health Care Providers & Services |
|
S + |
|
|
|
|
( |
) |
|
( |
) |
(2) (3) (4) |
||
Trader Corporation |
Automobiles |
C + |
CAD |
|
|
|
|
|
|
(2) |
|||||
Trader Corporation |
Automobiles |
|
C + |
CAD |
|
|
|
— |
|
|
- |
|
(2) (4) |
||
Tronair Parent Inc. |
Air Freight & Logistics |
L + |
|
|
|
|
|
|
|
|
|||||
USN Opco LLC (dba Global Nephrology Solutions) |
Health Care Providers & Services |
S + |
|
|
|
|
|
|
|
(2) (3) |
|||||
USN Opco LLC (dba Global Nephrology Solutions) |
Health Care Providers & Services |
S + |
|
|
|
|
|
|
|
(2) (3) |
|||||
USN Opco LLC (dba Global Nephrology Solutions) |
Health Care Providers & Services |
S + |
|
|
|
|
|
|
|
(2) (3) (4) |
|||||
USN Opco LLC (dba Global Nephrology Solutions) |
Health Care Providers & Services |
S + |
|
|
|
|
|
|
|
(2) (3) (4) |
|||||
Viant Medical Holdings, Inc. |
Health Care Equipment & Supplies |
L + |
|
|
|
|
|
|
|
(2) |
|||||
Volt Bidco, Inc. (dba Power Factors) |
Independent Power and Renewable Electricity Producers |
S + |
|
|
|
|
|
|
|
(2) (3) |
|||||
Volt Bidco, Inc. (dba Power Factors) |
Independent Power and Renewable Electricity Producers |
S + |
|
|
|
|
|
|
|
(2) (3) (4) |
|||||
Volt Bidco, Inc. (dba Power Factors) |
Independent Power and Renewable Electricity Producers |
|
S + |
|
|
|
|
( |
) |
|
( |
) |
(2) (3) (4) |
||
VRC Companies, LLC (dba Vital Records Control) |
Commercial Services & Supplies |
L + |
|
|
|
|
|
|
|
(2) (3) |
|||||
VRC Companies, LLC (dba Vital Records Control) |
Commercial Services & Supplies |
|
P + |
|
|
|
|
( |
) |
|
( |
) |
(2) (3) (4) |
||
WebPT, Inc. |
Health Care Technology |
L + |
|
|
|
|
|
|
|
(2) (3) |
|||||
WebPT, Inc. |
Health Care Technology |
L + |
|
|
|
|
|
|
|
(2) (3) |
|||||
WebPT, Inc. |
Health Care Technology |
L + |
|
|
|
|
|
|
|
(2) (3) (4) |
|||||
WebPT, Inc. |
Health Care Technology |
|
L + |
|
|
|
|
( |
) |
|
( |
) |
(2) (3) (4) |
||
Wellness AcquisitionCo, Inc. (dba SPINS) |
IT Services |
L + |
|
|
|
|
|
|
|
(2) (3) |
|||||
Wellness AcquisitionCo, Inc. (dba SPINS) |
IT Services |
|
L + |
|
|
|
|
( |
) |
|
( |
) |
(2) (3) (4) |
||
Wellness AcquisitionCo, Inc. (dba SPINS) |
IT Services |
|
L + |
|
|
|
|
( |
) |
|
( |
) |
(2) (3) (4) |
||
Whitewater Holding Company LLC |
Diversified Consumer Services |
L + |
|
|
|
|
|
|
|
(2) (3) |
|||||
Whitewater Holding Company LLC |
Diversified Consumer Services |
L + |
|
|
|
|
|
|
|
(2) (3) |
|||||
Whitewater Holding Company LLC |
Diversified Consumer Services |
L + |
|
|
|
|
|
|
|
(2) (3) |
|||||
Whitewater Holding Company LLC |
Diversified Consumer Services |
L + |
|
|
|
|
|
|
|
(2) (3) (4) |
|||||
Whitewater Holding Company LLC |
Diversified Consumer Services |
L + |
|
|
|
|
|
|
|
(2) (3) (4) |
|||||
Wine.com, LLC |
Beverages |
L + |
|
|
|
|
|
|
|
(2) (3) |
|||||
The accompanying notes are an integral part of these consolidated financial statements.
107
Goldman Sachs BDC, Inc.
Consolidated Schedule of Investments as of December 31, 2022 (continued)
(in thousands, except share and per share amounts)
Investment *# |
Industry |
Interest |
Reference Rate |
Maturity |
Par |
|
Cost |
|
Fair |
|
Footnotes |
|||
Wine.com, LLC |
Beverages |
$ |
|
$ |
|
$ |
|
(2) (3) (6) |
||||||
Wine.com, LLC |
Beverages |
L + |
|
|
|
|
|
|
(2) (3) |
|||||
Wine.com, LLC |
Beverages |
|
|
|
|
|
|
(2) (3) (4) (6) |
||||||
WorkForce Software, LLC |
Software |
L + |
|
|
|
|
|
|
(2) (3) |
|||||
WorkForce Software, LLC |
Software |
L + |
|
|
|
|
|
|
(2) (3) |
|||||
WorkForce Software, LLC |
Software |
L + |
|
|
|
|
|
|
(2) (3) |
|||||
WorkForce Software, LLC |
Software |
L + |
|
|
|
|
|
|
(2) (3) (4) |
|||||
WSO2, Inc. |
IT Services |
L + |
|
|
|
|
|
|
(2) (3) |
|||||
Xactly Corporation |
IT Services |
L + |
|
|
|
|
|
|
(2) (3) |
|||||
Xactly Corporation |
IT Services |
L + |
|
|
|
|
|
|
(2) (3) |
|||||
Zarya Intermediate, LLC (dba iOFFICE) |
Real Estate Mgmt. & Development |
S + |
|
|
|
|
|
|
(2) (3) |
|||||
Zarya Intermediate, LLC (dba iOFFICE) |
Real Estate Mgmt. & Development |
|
S + |
|
|
|
— |
|
|
( |
) |
(2) (3) (4) |
||
Zodiac Intermediate, LLC (dba Zipari) |
Health Care Technology |
L + |
|
|
|
|
|
|
(2) (3) |
|||||
Zodiac Intermediate, LLC (dba Zipari) |
Health Care Technology |
L + |
|
|
|
|
|
|
(2) (3) |
|||||
Total 1st Lien/Senior Secured Debt |
|
|
|
|
|
|
|
|
|
|
|
|||
1st Lien/Last-Out Unitranche (8) - |
|
|
|
|
|
|
|
|
|
|
|
|||
Doxim, Inc. |
Financial Services |
S + |
$ |
|
$ |
|
$ |
|
(2) (3) |
|||||
Doxim, Inc. |
Financial Services |
S + |
|
|
|
|
|
|
(2) (3) |
|||||
Doxim, Inc. |
Financial Services |
S + |
|
|
|
|
|
|
(2) (3) |
|||||
Doxim, Inc. |
Financial Services |
L + |
|
|
|
|
|
|
(2) (3) |
|||||
Doxim, Inc. |
Financial Services |
L + |
|
|
|
|
|
|
(2) (3) |
|||||
Doxim, Inc. |
Financial Services |
L + |
|
|
|
|
|
|
(2) (3) |
|||||
EDB Parent, LLC (dba Enterprise DB) |
Software |
S + |
|
|
|
|
|
|
(2) (3) |
|||||
EDB Parent, LLC (dba Enterprise DB) |
Software |
S + |
|
|
|
|
|
|
(2) (3) (4) |
|||||
Total 1st Lien/Last-Out Unitranche |
|
|
|
|
|
|
|
|
|
|
|
|||
2nd Lien/Senior Secured Debt - |
|
|
|
|
|
|
|
|
||||||
Animal Supply Intermediate, LLC |
Distributors |
|
$ |
|
$ |
|
$ |
— |
|
^ (3) (5) |
||||
Chase Industries, Inc. (dba Senneca Holdings) |
Building Products |
|
|
|
|
|
|
|
(2) (3) (5) |
|||||
Chase Industries, Inc. (dba Senneca Holdings) |
Building Products |
|
|
|
|
|
— |
|
|
— |
|
(2) (3) (7) |
||
Genesis Acquisition Co. (dba ProCare Software) |
Financial Services |
L + |
|
|
|
|
|
|
(2) (3) |
|||||
Genesis Acquisition Co. (dba ProCare Software) |
Financial Services |
L + |
|
|
|
|
|
|
(2) (3) |
|||||
Genesis Acquisition Co. (dba ProCare Software) |
Financial Services |
L + |
|
|
|
|
|
|
(2) (3) |
|||||
Genesis Acquisition Co. (dba ProCare Software) |
Financial Services |
L + |
|
|
|
|
|
|
(2) (3) |
|||||
IHS Intermediate Inc. (dba Interactive Health Solutions) |
Health Care Providers & Services |
|
L + |
|
|
|
|
|
— |
|
(3) (5) (9) |
|||
MPI Engineered Technologies, LLC |
Automobile Components |
|
|
|
|
|
|
(3) |
||||||
MPI Products LLC |
Automobile Components |
|
|
|
|
|
— |
|
|
— |
|
(3) (7) |
||
National Spine and Pain Centers, LLC |
Health Care Providers & Services |
|
L + |
|
|
|
|
|
— |
|
(2) (3) (5) |
|||
Odyssey Logistics & Technology Corporation |
Road & Rail |
L + |
|
|
|
|
|
|
(2) |
|||||
Spectrum Plastics Group, Inc. |
Containers & Packaging |
L + |
|
|
|
|
|
|
(2) |
|||||
YI, LLC (dba Young Innovations) |
Health Care Equipment & Supplies |
L + |
|
|
|
|
|
|
(2) (3) |
|||||
Zep Inc. |
Chemicals |
L + |
|
|
|
|
|
|
(2) |
|||||
Total 2nd Lien/Senior Secured Debt |
|
|
|
|
|
|
|
|
|
|
|
|||
Unsecured Debt - |
|
|
|
|
|
|
|
|
||||||
ATX Networks Corp. |
Communications Equipment |
$ |
|
$ |
|
$ |
|
^ (1) (3) |
||||||
CivicPlus LLC |
Software |
S + |
|
|
|
|
|
|
(2) (3) |
|||||
Conergy Asia & ME Pte. LTD. |
Construction & Engineering |
|
|
|
|
|
|
|
— |
|
^ (1) (3) (7) |
|||
Total Unsecured Debt |
|
|
|
|
|
|
|
|
|
|
|
|||
The accompanying notes are an integral part of these consolidated financial statements.
108
Goldman Sachs BDC, Inc.
Consolidated Schedule of Investments as of December 31, 2022 (continued)
(in thousands, except share and per share amounts)
Investment *# |
Industry |
Interest |
Initial |
Par/Shares |
|
Cost |
|
Fair |
|
Footnotes |
|||
Preferred Stock - |
|
|
|
|
|
|
|
|
|
|
|||
Broadway Parent, LLC |
Financial Services |
|
|
|
$ |
|
$ |
|
(2) (3) (7) |
||||
CloudBees, Inc. |
Software |
|
|
|
|
|
|
|
(2) (3) (7) |
||||
Foundation Software |
Construction & Engineering |
|
|
|
|
|
|
|
(2) (3) (7) |
||||
Governmentjobs.com, Inc. (dba NeoGov) |
Software |
|
|
|
|
|
|
|
(2) (3) (7) |
||||
Kawa Solar Holdings Limited |
Construction & Engineering |
|
|
|
|
|
— |
|
^ (1) (3) (5) |
||||
MedeAnalytics, Inc. |
Health Care Technology |
|
|
|
|
|
|
— |
|
(2) (3) (7) |
|||
Wine.com, LLC |
Beverages |
|
|
|
|
|
|
|
(2) (3) (7) |
||||
Wine.com, LLC |
Beverages |
|
|
|
|
|
|
|
(2) (3) (7) |
||||
WSO2, Inc. |
IT Services |
|
|
|
|
|
|
|
(2) (3) (7) |
||||
Total Preferred Stock |
|
|
|
|
|
|
|
|
|
|
|||
Common Stock - |
|
|
|
|
|
|
|
||||||
Abacus Data Holdings, Inc. (dba Clutch Intermediate Holdings) |
Software |
|
|
|
$ |
|
$ |
|
(2) (3) (7) |
||||
Animal Supply Holdings, LLC |
Distributors |
|
|
|
|
|
|
— |
|
^ (3) (7) |
|||
Animal Supply Holdings, LLC |
Distributors |
|
|
|
|
|
|
— |
|
^ (3) (7) |
|||
ATX Parent Holdings, LLC - Class A Units |
Communications Equipment |
|
|
|
|
|
|
|
^ (1) (3) (7) |
||||
Bolttech Mannings, Inc. |
Commercial Services & Supplies |
|
|
|
|
|
|
— |
|
^^ (3) (7) |
|||
Collaborative Imaging Holdco, LLC (dba Texas Radiology Associates) - Class B |
Health Care Providers & Services |
|
|
|
|
|
|
|
^ (2) (3) |
||||
Collaborative Imaging Holdco, LLC (dba Texas Radiology Associates) - Performance Units |
Health Care Providers & Services |
|
|
|
|
|
|
|
^ (1) (2) (3) |
||||
Conergy Asia & ME Pte. LTD. |
Construction & Engineering |
|
|
|
|
|
|
— |
|
^ (1) (3) (7) |
|||
Country Fresh Holding Company Inc. |
Food Products |
|
|
|
|
|
|
— |
|
(2) (3) (7) |
|||
Elah Holdings, Inc. |
Capital Markets |
|
|
|
|
|
|
|
^ (2) (3) (7) |
||||
Exostar LLC - Class B |
Aerospace & Defense |
|
|
|
|
— |
|
|
|
(2) (3) (7) |
|||
Foundation Software - Class B |
Construction & Engineering |
|
|
|
|
— |
|
|
|
(2) (3) (7) |
|||
Iracore International Holdings, Inc. |
Energy Equipment & Services |
|
|
|
|
|
|
|
^ (3) (7) |
||||
Jill Acquisition LLC (dba J. Jill) |
Specialty Retail |
|
|
|
|
|
|
|
(7) |
||||
Kawa Solar Holdings Limited |
Construction & Engineering |
|
|
|
|
— |
|
|
— |
|
^ (1) (3) (7) |
||
National Spine and Pain Centers, LLC |
Health Care Providers & Services |
|
|
|
|
|
|
— |
|
(2) (3) (7) |
|||
Prairie Provident Resources, Inc. |
Oil, Gas & Consumable Fuels |
|
|
|
|
|
|
|
|
(1) (7) |
|||
Southeast Mechanical, LLC (dba. SEM Holdings, LLC) |
Diversified Consumer Services |
|
|
|
|
|
|
|
^ (2) (3) (7) |
||||
Total Vision LLC |
Health Care Providers & Services |
|
|
|
|
|
|
|
(2) (3) (7) |
||||
Volt Bidco, Inc. (dba Power Factors) |
Independent Power and Renewable Electricity Producers |
|
|
|
|
|
|
|
(2) (3) (7) |
||||
Whitewater Holding Company LLC |
Diversified Consumer Services |
|
|
|
|
|
|
|
(2) (3) (7) |
||||
Yasso, Inc. |
Food Products |
|
|
|
|
|
|
|
(2) (3) (7) |
||||
Total Common Stock |
|
|
|
|
|
|
|
|
|
|
|||
Warrants - |
|
|
|
|
|
|
|
||||||
CloudBees, Inc. |
Software |
|
|
|
$ |
|
$ |
|
(2) (3) (7) |
||||
KDOR Holdings Inc. (dba Senneca Holdings) |
Building Products |
|
|
|
|
— |
|
|
— |
|
(2) (3) (7) |
||
KDOR Holdings Inc. (dba Senneca Holdings) |
Building Products |
|
|
|
|
— |
|
|
— |
|
(2) (3) (7) |
||
KDOR Holdings Inc. (dba Senneca Holdings) |
Building Products |
|
|
|
|
— |
|
|
— |
|
(2) (3) (7) |
||
Total Warrants |
|
|
|
|
|
|
|
|
|
|
|||
Total Investments - |
|
|
$ |
|
$ |
|
|
||||||
The accompanying notes are an integral part of these consolidated financial statements.
109
Goldman Sachs BDC, Inc.
Consolidated Schedule of Investments as of December 31, 2022 (continued)
(in thousands, except share and per share amounts)
*
(+)
(++)
#
^
^^
^^^
(1)
(2)
(3)
(4)
(5)
(6)
(7)
(8)
(9)
(10)
PIK – Payment-In-Kind
ADDITIONAL INFORMATION
Foreign currency forward contracts
Counterparty |
Currency Purchased |
Currency Sold |
Settlement |
Unrealized |
|
|
Bank of America, N.A. |
USD |
Euro |
$ |
( |
) |
|
Bank of America, N.A. |
USD |
GBP |
|
( |
) |
|
Bank of America, N.A. |
USD |
GBP |
|
— |
|
|
|
|
|
|
$ |
( |
) |
The accompanying notes are an integral part of these consolidated financial statements.
110
Goldman Sachs BDC, Inc.
Notes to the Consolidated Financial Statements
(in thousands, except share and per share amounts)
Goldman Sachs BDC, Inc. (the “Company,” which term refers to either Goldman Sachs BDC, Inc. or Goldman Sachs BDC, Inc. together with its consolidated subsidiaries, as the context may require) was initially established as Goldman Sachs Liberty Harbor Capital, LLC, a single member Delaware limited liability company (“SMLLC”), on September 26, 2012 and commenced operations on November 15, 2012 with The Goldman Sachs Group, Inc. (“GS Group Inc.”) as its sole member. On March 29, 2013, the Company elected to be regulated as a business development company (“BDC”) under the Investment Company Act. Effective April 1, 2013, the Company converted from a SMLLC to a Delaware corporation. In addition, the Company has elected to be treated as a regulated investment company (“RIC”) under Subchapter M of the Internal Revenue Code of 1986, as amended (the “Code”), commencing with its taxable year ended December 31, 2013.
The Company’s investment objective is to generate current income and, to a lesser extent, capital appreciation primarily through direct originations of secured debt, including first lien debt, unitranche debt, including last-out portions of such loans, and second lien debt, and unsecured debt, including mezzanine debt, as well as through select equity investments.
Goldman Sachs Asset Management, L.P. (“GSAM”), a Delaware limited partnership and an affiliate of Goldman Sachs & Co. LLC (including its predecessors, “GS & Co.”), is the investment adviser (the “Investment Adviser”) of the Company. The term “Goldman Sachs” refers to GS Group Inc., together with GS & Co., GSAM and its other subsidiaries.
On March 23, 2015, the Company completed its initial public offering and the Company’s common stock began trading on the New York Stock Exchange under the symbol “GSBD.”
The Company has formed wholly owned subsidiaries, which are structured as Delaware limited liability companies, to hold certain equity or equity-like investments in portfolio companies.
The Merger with Goldman Sachs Middle Market Lending Corp.
On
Basis of Presentation
The Company’s functional currency is U.S. dollars (“USD”) and these consolidated financial statements have been prepared in that currency. The accompanying consolidated financial statements have been prepared in accordance with accounting principles generally accepted in the United States of America (“GAAP”) and pursuant to Regulation S-X. This requires the Company to make certain estimates and assumptions that may affect the amounts reported in the consolidated financial statements and accompanying notes. These consolidated financial statements reflect normal and recurring adjustments that in the opinion of the Company are necessary for the fair statement of the results for the periods presented. Actual results may differ from the estimates and assumptions included in the consolidated financial statements.
Certain prior period information has been reclassified to conform to the current period presentation. The reclassification has no effect on the Company’s consolidated financial position or the consolidated results of operations as previously reported.
As an investment company, the Company applies the accounting and reporting guidance in Accounting Standards Codification (“ASC”) Topic 946, Financial Services – Investment Companies (“ASC 946”) issued by the Financial Accounting Standards Board (“FASB”).
Basis of Consolidation
As provided under ASC 946, the Company will not consolidate its investment in a company other than an investment company subsidiary or a controlled operating company whose business consists of providing services to the Company. Accordingly, the Company consolidated the financial position and results of operations of its wholly owned subsidiaries, BDC Blocker I, LLC, GSBD Blocker II, LLC, GSBD Wine I, LLC, GSBD Blocker III, LLC, GSBD Blocker IV, LLC, GSBD Blocker V, LLC, MMLC Blocker I, LLC, MMLC Blocker II, LLC, MMLC Wine I, LLC, and MMLC Blocker III, LLC. All significant intercompany transactions and balances have been eliminated in consolidation.
111
Revenue Recognition
The Company records its investment transactions on a trade date basis, which is the date when the Company assumes the risks for gains and losses related to that instrument. Realized gains and losses are based on the specific identification method.
Interest income, adjusted for amortization of premium and accretion of discount, is recorded on an accrual basis. Discounts and premiums to par value on investments purchased are accreted and amortized into interest income over the life of the respective investment using the effective interest method. Loan origination fees, original issue discount (“OID”) and market discounts or premiums are capitalized and amortized into interest income using the effective interest method or straight-line method, as applicable. Exit fees that are receivable upon repayment of a loan or debt security are amortized into interest income over the life of the respective investment.
|
|
For the Years Ended December 31, |
|
|||||||||
|
|
2023 |
|
|
2022 |
|
|
2021 |
|
|||
Prepayment premiums |
|
$ |
|
|
$ |
|
|
$ |
|
|||
Accelerated amortization of upfront loan origination fees and unamortized discounts |
|
$ |
|
|
$ |
|
|
$ |
|
|||
Fees received from portfolio companies (directors’ fees, consulting fees, administrative fees, tax advisory fees and other similar compensation) are paid to the Company, unless, to the extent required by applicable law or exemptive relief, if any, therefrom, the Company only receives its allocable portion of such fees when invested in the same portfolio company as another account managed by the Investment Adviser.
Dividend income on preferred equity investments is recorded on an accrual basis to the extent that such amounts are payable by the portfolio company and are expected to be collected. Dividend income on common equity investments is recorded on the record date for private portfolio companies and on the ex-dividend date for publicly traded portfolio companies. Interest and dividend income are presented net of withholding tax, if any.
Certain investments may have contractual payment-in-kind (“PIK”) interest or dividends. PIK represents accrued interest or accumulated dividends that are added to the principal amount or shares (if equity) of the investment on the respective interest or dividend payment dates rather than being paid in cash and generally becomes due at maturity or upon the investment being called by the issuer. PIK is recorded as interest or dividend income, as applicable. If at any point the Company believes PIK is not expected to be realized, the investment generating PIK will be placed on non-accrual status. When a PIK investment is placed on non-accrual status, the accrued, uncapitalized interest or dividends are generally reversed through interest or dividend income.
Certain structuring fees, amendment fees, syndication fees and commitment fees are recorded as other income when earned. Administrative agent fees received by the Company are recorded as other income when the services are rendered over time.
Acquisition Accounting
On October 12, 2020, the Company completed the Merger with GS MMLC pursuant to the Merger Agreement, dated as of June 11, 2020. The Merger was accounted for as an asset acquisition in accordance with ASC 805-50, Business Combinations—Related Issues. The consideration paid to GS MMLC’s stockholders was less than the aggregate fair values of the assets acquired and liabilities assumed, which resulted in a purchase discount (the “Purchase Discount”). The Purchase Discount was allocated to the cost of GS MMLC investments acquired by the Company on a pro-rata basis based on their relative fair values as of the closing date. Immediately following the Merger with GS MMLC, the investments were marked to their respective fair values and, as a result, the Purchase Discount allocated to the cost basis of the investments acquired was immediately recognized as unrealized appreciation on the Consolidated Statement of Operations. The Purchase Discount allocated to the loan investments acquired is amortized over the life of each respective loan through interest income with a corresponding adjustment recorded as unrealized depreciation on such loans acquired through their ultimate disposition. Amortization income of the Purchase Discount for the year ended December 31, 2023, 2022 and 2021, was $
112
Non-Accrual Investments
Investments are placed on non-accrual status when it is probable that principal, interest or dividends will not be collected according to contractual terms. Accrued interest or dividends generally are reversed when an investment is placed on non-accrual status. Interest or dividend payments received on non-accrual investments may be recognized as income or applied to principal depending upon management’s judgment. Non-accrual investments are restored to accrual status when past due principal and interest or dividends are paid and, in management’s judgment, principal and interest or dividend payments are likely to remain current. The Company may make exceptions to this treatment if an investment has sufficient collateral value and is in the process of collection. As of December 31, 2023, the Company had certain investments held in ten portfolio companies on non-accrual status, which represented
Investments
The Company carries its investments in accordance with ASC Topic 820, Fair Value Measurements and Disclosures (“ASC 820”), issued by the FASB, which defines fair value, establishes a framework for measuring fair value and requires disclosures about fair value measurements. Fair value is generally based on quoted market prices provided by independent price sources. In the absence of quoted market prices, investments are measured at fair value as determined by the Investment Adviser, as the valuation designee ("Valuation Designee") designated by the board of directors of the Company (the “Board of Directors” or the “Board”), pursuant to Rule 2a-5 under the Investment Company Act.
Due to the inherent uncertainties of valuation, certain estimated fair values may differ significantly from the values that would have been realized had a ready market for these investments existed, and these differences could be material. See Note 5 “Fair Value Measurement.”
The Company generally invests in illiquid securities, including debt and equity investments, of middle-market companies. The Board of Directors has designated to the Investment Adviser day-to-day responsibilities for implementing and maintaining internal controls and procedures related to the valuation of the Company’s portfolio investments. Under valuation procedures approved by the Board of Directors and adopted by the Valuation Designee, market quotations are generally used to assess the value of the investments for which market quotations are readily available (as defined in Rule 2a-5). The Investment Adviser obtains these market quotations from independent pricing sources. If market quotations are not readily available, the Investment Adviser prices securities at the bid prices obtained from at least two brokers or dealers, if available; otherwise, the Investment Adviser obtains prices from a principal market maker or a primary market dealer. To assess the continuing appropriateness of pricing sources and methodologies, the Investment Adviser regularly performs price verification procedures and issues challenges as necessary to independent pricing sources or brokers, and any differences are reviewed in accordance with the valuation procedures. If the Valuation Designee believes any such market quotation does not reflect the fair value of an investment, it may independently value such investment in accordance with valuation procedures for investments for which market quotations are not readily available.
With respect to investments for which market quotations are not readily available, or for which market quotations are deemed not reflective of the fair value, the valuation procedures approved by the Board of Directors and adopted by the Valuation Designee, contemplate a multi-step valuation process conducted by the Investment Adviser each quarter and more frequently as needed. As the Valuation Designee, the Investment Adviser is primarily responsible for the valuation of the Company’s assets, subject to the oversight of the Board of Directors, as described below:
113
Money Market Funds
Investments in money market funds are valued at NAV per share and are considered cash equivalents for the purposes of the management fee paid to the Investment Adviser. See Note 3 “Significant Agreements and Related Party Transactions.”
Cash
Cash consists of deposits held at a custodian bank. As of December 31, 2023 and December 31, 2022, the Company held an aggregate cash balance of $
Foreign Currency Translation
Amounts denominated in foreign currencies are translated into USD on the following basis: (i) investments and other assets and liabilities denominated in foreign currencies are translated into USD based upon currency exchange rates effective on the last business day of the period; and (ii) purchases and sales of investments, borrowings and repayments of such borrowings, income, and expenses denominated in foreign currencies are translated into USD based upon currency exchange rates prevailing on the transaction dates.
The Company does not isolate the portion of the results of operations resulting from changes in foreign exchange rates on investments from fluctuations arising from changes in market prices of securities held. Such fluctuations are included within the net realized and unrealized gains or losses on investments. Fluctuations arising from the translation of non-investment assets and liabilities, if any, are included with the net change in unrealized gains (losses) on foreign currency translations on the Consolidated Statements of Operations.
Foreign securities and currency translations may involve certain considerations and risks not typically associated with investing in U.S. companies and U.S. government securities. These risks include, but are not limited to, currency fluctuations and revaluations and future adverse political, social and economic developments, which could cause investments in foreign markets to be less liquid and prices to be more volatile than those of comparable U.S. companies or U.S. government securities.
114
Derivatives
The Company may enter into foreign currency forward contracts to reduce the Company’s exposure to foreign currency exchange rate fluctuations in the value of foreign currencies. In a foreign currency forward contract, the Company agrees to receive or deliver a fixed quantity of one currency for another, at a pre-determined price at a future date. Forward foreign currency contracts are marked-to-market at the applicable forward rate. Unrealized appreciation (depreciation) on foreign currency forward contracts is recorded on the Consolidated Statements of Assets and Liabilities by counterparty on a net basis, not taking into account collateral posted which is recorded separately, if applicable. Notional amounts of foreign currency forward contract assets and liabilities are presented separately on the Consolidated Schedules of Investments. Purchases and settlements of foreign currency forward contracts having the same settlement date and counterparty are generally settled net and any realized gains or losses are recognized on the settlement date. The Company does not utilize hedge accounting and as such, the Company recognizes its derivatives at fair value, and records changes in the net unrealized appreciation (depreciation) on foreign currency forward contracts in the Consolidated Statements of Operations.
Income Taxes
The Company recognizes tax positions in its consolidated financial statements only when it is more likely than not that the position will be sustained upon examination by the relevant taxing authority based on the technical merits of the position. A position that meets this standard is measured at the largest amount of benefit that will more likely than not be realized upon settlement. The Company reports any interest expense related to income tax matters in income tax expense and any income tax penalties under expenses in the Consolidated Statements of Operations.
The Company’s tax positions have been reviewed based on applicable statutes of limitation for tax assessments, which may vary by jurisdiction, and based on such review, the Company has concluded that no additional provision for income tax is required in the consolidated financial statements. The Company is subject to potential examination by certain taxing authorities in various jurisdictions. The Company’s tax positions are subject to ongoing interpretation of laws and regulations by taxing authorities.
The Company has elected to be treated as a RIC commencing with its taxable year ended December 31, 2013. So long as the Company maintains its status as a RIC, it will generally not be required to pay corporate-level U.S. federal income tax on any ordinary income or capital gains that it distributes at least annually to its stockholders as dividends. As a result, any U.S. federal income tax liability related to income earned and distributed by the Company represents obligations of the Company’s stockholders and will not be reflected in the consolidated financial statements of the Company.
To maintain its tax treatment as a RIC, the Company must meet specified source-of-income and asset diversification requirements and timely distribute to its stockholders for each taxable year at least 90% of its investment company taxable income (generally, its net ordinary income plus the excess of its realized net short-term capital gains over realized net long-term capital losses, determined without regard to the dividends paid deduction). In order for the Company not to be subject to U.S. federal excise taxes, it must distribute annually an amount at least equal to the sum of (i) 98% of its net ordinary income (taking into account certain deferrals and elections) for the calendar year, (ii) 98.2% of its capital gains in excess of capital losses for the one-year period ending on October 31 of the calendar year and (iii) any net ordinary income and capital gains in excess of capital losses for preceding years that were not distributed during such years. The Company, at its discretion, may carry forward taxable income in excess of calendar year dividends and pay a 4% nondeductible U.S. federal excise tax on this income. If the Company chooses to do so, this generally would increase expenses and reduce the amount available to be distributed to stockholders. The Company will accrue excise tax on estimated undistributed taxable income as required. For the years ended December 31, 2023, 2022 and 2021 the Company accrued excise taxes of $
Certain of the Company’s consolidated subsidiaries are subject to U.S. federal and state corporate-level income taxes. Income tax expense, if any, is included under the income category for which it applies in the Consolidated Statements of Operations.
115
Distributions
Distributions from net investment income and net realized capital gains are determined in accordance with U.S. federal income tax regulations, which may differ from those amounts determined in accordance with GAAP. The Company may pay distributions in excess of its taxable net investment income. This excess would be a tax-free return of capital in the period and reduce the stockholder’s tax basis in its shares. These book/tax differences are either temporary or permanent in nature. To the extent these differences are permanent, they are charged or credited to paid-in capital in excess of par or distributable earnings, as appropriate, in the period that the differences arise. Temporary and permanent differences are primarily attributable to differences in the tax treatment of certain loans and the tax characterization of income and non-deductible expenses. These differences are generally determined in conjunction with the preparation of the Company’s annual RIC tax return. Distributions to common stockholders are recorded on the ex-dividend date. The amount to be paid out as a distribution is determined by the Board of Directors each quarter and is generally based upon the earnings estimated by the Investment Adviser. The Company may pay distributions to its stockholders in a year in excess of its net ordinary income and capital gains for that year and, accordingly, a portion of such distributions may constitute a return of capital for U.S. federal income tax purposes. The Company intends to timely distribute to its stockholders substantially all of its annual taxable income for each year, except that the Company may retain certain net capital gains for reinvestment and, depending upon the level of the Company’s taxable income earned in a year, the Company may choose to carry forward taxable income for distribution in the following year and pay any applicable tax. The specific tax characteristics of the Company’s distributions will be reported to stockholders after the end of the calendar year. All distributions will be subject to available funds, and no assurance can be given that the Company will be able to declare such distributions in future periods.
The Company has a voluntary dividend reinvestment plan (the “DRIP”) that provides for the automatic reinvestment of all cash distributions declared by the Board of Directors unless a stockholder elects to “opt out” of the plan. As a result, if the Board of Directors declares a cash distribution, then the stockholders who have not “opted out” of the DRIP will have their cash distributions automatically reinvested in additional shares of common stock, rather than receiving the cash distribution. If the distribution is subject to withholding tax as described above, only the net after-tax amount will be reinvested in additional shares. Stockholders who receive distributions in the form of shares of common stock will generally be subject to the same U.S. federal, state and local tax consequences as if they received cash distributions and, for this purpose, stockholders receiving distributions in the form of stock will generally be treated as receiving distributions equal to the fair market value of the stock received through the plan; however, since their cash distributions will be reinvested, those stockholders will not receive cash with which to pay any applicable taxes. Due to regulatory considerations, GS Group Inc. has opted out of the DRIP, and GS & Co. had also opted out of the DRIP in respect of shares of the Company’s common stock acquired through the 2022 10b5-1 Plan (as defined below).
Deferred Financing and Debt Issuance Costs
Deferred financing and debt issuance costs consist of fees and expenses paid in connection with the closing of and amendments to the Company’s borrowings. The aforementioned costs are amortized using the straight-line method over each instrument’s term. Deferred financing costs related to a revolving credit facility are presented separately as an asset on the Company’s Consolidated Statements of Assets and Liabilities. Deferred debt issuance costs related to any notes are presented net against the outstanding debt balance on the Consolidated Statements of Assets and Liabilities.
Offering Costs
Offering costs consist of fees and expenses incurred in connection with equity offerings. Offering costs are charged against the proceeds from equity offerings when proceeds are received.
New Accounting Pronouncements
In November 2023, the FASB issued Accounting Standard Update (“ASU”) No. 2023-07, “Improvements to Reportable Segment Disclosures.” This ASU requires enhanced disclosures about significant segment expenses. In addition, the ASU requires specific disclosures related to the title and position of the individual (or the name of the group or committee) identified as the Chief Operating Decision Maker (“CODM”); and an explanation of how the CODM uses the reported measures of segment profit or loss in assessing segment performance and deciding how to allocate resources. The ASU is effective for fiscal years beginning after December 15, 2023, and interim periods within fiscal years beginning after December 15, 2024, under a retrospective approach. The Company is assessing the impact of the new ASU on its consolidated financial statements.
In December 2023, the FASB issued ASU No. 2023-09, “Improvements to Income Tax Disclosures.” This ASU requires additional disaggregation of income taxes paid, specific rate reconciliation categories, and disaggregation within those categories if a defined quantitative threshold is met. The ASU is effective for annual periods beginning after December 15, 2024. The Company is assessing the impact of the new ASU on its consolidated financial statements.
116
Investment Management Agreement
The Company entered into an investment management agreement (the “Investment Management Agreement”) with the Investment Adviser, pursuant to which the Investment Adviser manages the Company’s investment program and related activities.
Management Fee
The Company pays the Investment Adviser a management fee (the “Management Fee”), accrued and payable quarterly in arrears. The Management Fee is calculated at an annual rate of
For the years ended December 31, 2023, 2022 and 2021, Management Fees amounted to $
Incentive Fee
The incentive fee (the “Incentive Fee”) consists of
A portion of the Incentive Fee is based on income and a portion is based on capital gains, each as described below. The Investment Adviser is entitled to receive the Incentive Fee based on income if Ordinary Income (as defined below) exceeds a quarterly “hurdle rate” of
The Incentive Fee based on income is determined and paid quarterly in arrears at the end of each calendar quarter by reference to the Company’s aggregate net investment income, as adjusted as described below, from the calendar quarter then ending and the eleven preceding calendar quarters (such period the “Trailing Twelve Quarters”). The Incentive Fee based on capital gains is determined and paid annually in arrears at the end of each calendar year by reference to an “Annual Period,” which means the period beginning on January 1 of each calendar year and ending on December 31 of such calendar year or, in the case of the first and last year, the appropriate portion thereof.
The hurdle amount for the Incentive Fee based on income is determined on a quarterly basis and is equal to
i. Quarterly Incentive Fee Based on Income
For the portion of the Incentive Fee based on income, the Company pays the Investment Adviser a quarterly Incentive Fee based on the amount by which (A) aggregate net investment income (“Ordinary Income”) in respect of the relevant Trailing Twelve Quarters exceeds (B) the hurdle amount for such Trailing Twelve Quarters. The amount of the excess of (A) over (B) described in this paragraph for such Trailing Twelve Quarters is referred to as the “Excess Income Amount.” Ordinary Income is net of all fees and expenses, including the Management Fee but excluding any Incentive Fee.
The Incentive Fee based on income for each quarter is determined as follows:
117
The amount of the Incentive Fee based on income that is paid to the Investment Adviser for a particular quarter equals the excess of the Incentive Fee so calculated minus the aggregate Incentive Fees based on income that were paid in respect of the first eleven calendar quarters (or the portion thereof) included in the relevant Trailing Twelve Quarters but not in excess of the Incentive Fee Cap (as described below).
The Incentive Fee based on income that is paid to the Investment Adviser for a particular quarter is subject to a cap (the “Incentive Fee Cap”). The Incentive Fee Cap for any quarter is an amount equal to (a)
“Cumulative Net Return” means (x) the Ordinary Income in respect of the relevant Trailing Twelve Quarters minus (y) any Net Capital Loss, if any, in respect of the relevant Trailing Twelve Quarters. If, in any quarter, the Incentive Fee Cap is zero or a negative value, the Company pays no Incentive Fee based on income to the Investment Adviser for such quarter. If, in any quarter, the Incentive Fee Cap for such quarter is a positive value but is less than the Incentive Fee based on income that is payable to the Investment Adviser for such quarter (before giving effect to the Incentive Fee Cap) calculated as described above, the Company pays an Incentive Fee based on income to the Investment Adviser equal to the Incentive Fee Cap for such quarter. If, in any quarter, the Incentive Fee Cap for such quarter is equal to or greater than the Incentive Fee based on income that is payable to the Investment Adviser for such quarter (before giving effect to the Incentive Fee Cap) calculated as described above, the Company pays an Incentive Fee based on income to the Investment Adviser equal to the Incentive Fee calculated as described above for such quarter without regard to the Incentive Fee Cap.
“Net Capital Loss” in respect of a particular period means the difference, if positive, between (i) aggregate capital losses, whether realized or unrealized, in such period and (ii) aggregate capital gains, whether realized or unrealized, in such period.
For the years ended December 31, 2023, 2022 and 2021, Incentive Fees based on income amounted to $
In connection with the Merger, GSAM agreed to waive a portion of its Incentive Fee based on income to the extent incurred, for a period of nine quarters, commencing with the quarter ended December 31, 2019 and through and including the quarter ending December 31, 2021, otherwise payable by the Company under the Investment Management Agreement by and between the Company and GSAM, as applicable, for each such quarter in an amount sufficient to ensure that the Company’s net investment income per weighted share outstanding for such quarter is at least $
ii. Annual Incentive Fee Based on Capital Gains
The portion of the Incentive Fee based on capital gains is calculated on an annual basis. For each Annual Period, the Company pays the Investment Adviser an amount equal to (A)
The Company accrues, but does not pay, a portion of the Incentive Fee based on capital gains with respect to net unrealized appreciation. Under GAAP, the Company is required to accrue an Incentive Fee based on capital gains that includes net realized capital gains and losses and net unrealized capital appreciation and depreciation on investments held at the end of each period. In calculating the accrual for the Incentive Fee based on capital gains, the Company considers the cumulative aggregate unrealized capital appreciation in the calculation, since an Incentive Fee based on capital gains would be payable if such unrealized capital appreciation were realized, even though such unrealized capital appreciation is not permitted to be considered in calculating the fee payable under the Investment Management Agreement. This accrual is calculated using the aggregate cumulative net realized capital gains and losses and aggregate cumulative net unrealized capital appreciation and depreciation. If such amount is positive at the end of a period, then the Company records a capital gains incentive fee equal to
For the years ended December 31, 2023, 2022 and 2021, the Company did
Administration and Custodian Fees
The Company has entered into an administration agreement with State Street Bank and Trust Company (the “Administrator”) under which the Administrator provides various accounting and administrative services to the Company. The Company pays the Administrator fees for its services as it determines to be commercially reasonable in its sole discretion. The Company also reimburses the Administrator for all reasonable expenses. To the extent that the Administrator outsources any of its functions, the Administrator pays any compensation associated with such functions. The Administrator also serves as the Company’s custodian (the “Custodian”).
For the years ended December 31, 2023, 2022 and 2021, the Company incurred expenses for services provided by the Administrator and the Custodian of $
118
Transfer Agent Fees
The Company has entered into a transfer agency and services agreement pursuant to which Computershare Trust Company, N.A. serves as the Company’s transfer agent (the “Transfer Agent”), dividend agent and registrar. For the years ended December 31, 2023, 2022 and 2021, the Company incurred expenses for services provided by the Transfer Agent of $
Common Stock Repurchase Plans
In November 2021, the Board of Directors approved and authorized a 10b5-1 stock repurchase plan (the "2022 10b5-1 Plan"), which provided for the Company to repurchase up to $
Under the 2022 10b5-1 Plan, no purchases were permitted to be made if such purchases would cause the Company’s Debt/Equity Ratio to exceed the lower of (a)
Any repurchase by the Company of its common stock under any 10b5-1 plan or otherwise may result in the price of the Company’s common stock being higher than the price that otherwise might exist in the open market. For the year ended December 31, 2023, the Company did not repurchase any of its common stock pursuant to the 2022 10b5-1 Plan or otherwise.
Affiliates
GS Group Inc. owned
|
|
Beginning Fair Value Balance |
|
|
Gross |
|
|
Gross |
|
|
Net Realized |
|
|
Net Change in |
|
|
Ending Fair Value Balance |
|
|
Dividend, |
|
|||||||
For the Year Ended December 31, 2023 |
|
|
|
|
|
|
|
|
|
|
|
|
|
|
|
|
|
|
|
|||||||||
Controlled Affiliates |
|
|
|
|
|
|
|
|
|
|
|
|
|
|
|
|
|
|
|
|
|
|||||||
Bolttech Mannings, Inc. |
|
$ |
— |
|
|
$ |
— |
|
|
$ |
— |
|
|
$ |
( |
) |
|
$ |
|
|
$ |
— |
|
|
$ |
— |
|
|
Total Controlled Affiliates |
|
$ |
— |
|
|
$ |
— |
|
|
$ |
— |
|
|
$ |
( |
) |
|
$ |
|
|
$ |
— |
|
|
$ |
— |
|
|
Non-Controlled Affiliates |
|
|
|
|
|
|
|
|
|
|
|
|
|
|
|
|
|
|
|
|
|
|||||||
Goldman Sachs Financial Square Government Fund |
|
$ |
— |
|
|
$ |
|
|
$ |
( |
) |
|
$ |
— |
|
|
$ |
— |
|
|
$ |
— |
|
|
$ |
|
||
Animal Supply Holdings, LLC |
|
|
— |
|
|
|
— |
|
|
|
— |
|
|
|
— |
|
|
|
— |
|
|
|
— |
|
|
|
— |
|
ATX Networks Corp. |
|
|
|
|
|
|
|
|
( |
) |
|
|
— |
|
|
|
( |
) |
|
|
|
|
|
|
||||
Collaborative Imaging, LLC (dba Texas Radiology Associates) |
|
|
|
|
|
— |
|
|
|
— |
|
|
|
— |
|
|
|
( |
) |
|
|
|
|
|
|
|||
Conergy Asia & ME Pte. LTD |
|
|
— |
|
|
|
— |
|
|
|
— |
|
|
|
— |
|
|
|
— |
|
|
|
— |
|
|
|
— |
|
Elah Holdings, Inc. |
|
|
|
|
|
— |
|
|
|
— |
|
|
|
— |
|
|
|
— |
|
|
|
|
|
|
— |
|
||
Iracore International Holdings, Inc. |
|
|
|
|
|
— |
|
|
|
— |
|
|
|
— |
|
|
|
|
|
|
|
|
|
|
||||
Kawa Solar Holdings Limited |
|
|
|
|
|
— |
|
|
|
— |
|
|
|
— |
|
|
|
( |
) |
|
|
|
|
|
— |
|
||
MedeAnalytics, Inc. |
|
|
— |
|
|
|
|
|
|
— |
|
|
|
— |
|
|
|
|
|
|
|
|
|
— |
|
|||
Southeast Mechanical, LLC (dba. SEM Holdings, LLC) |
|
|
|
|
|
|
|
|
( |
) |
|
|
— |
|
|
|
|
|
|
|
|
|
|
|||||
Total Non-Controlled Affiliates |
|
$ |
|
|
$ |
|
|
$ |
( |
) |
|
$ |
— |
|
|
$ |
( |
) |
|
$ |
|
|
$ |
|
||||
Total Affiliates |
|
$ |
|
|
$ |
|
|
$ |
( |
) |
|
$ |
( |
) |
|
$ |
|
|
$ |
|
|
$ |
|
|||||
119
|
|
Beginning Fair Value Balance |
|
|
Gross |
|
|
Gross |
|
|
Net Realized |
|
|
Net Change in |
|
|
Ending Fair Value Balance |
|
|
Dividend, |
|
|||||||
For the Year Ended December 31, 2022 |
|
|
|
|
|
|
|
|
|
|
|
|
|
|||||||||||||||
Controlled Affiliates |
|
|
|
|
|
|
|
|
|
|
|
|
|
|
|
|
|
|
|
|
|
|||||||
Bolttech Mannings, Inc. |
|
$ |
|
|
$ |
|
|
$ |
( |
) |
|
$ |
( |
) |
|
$ |
( |
) |
|
$ |
— |
|
|
$ |
|
|||
Total Controlled Affiliates |
|
$ |
|
|
$ |
|
|
$ |
( |
) |
|
$ |
( |
) |
|
$ |
( |
) |
|
$ |
— |
|
|
$ |
|
|||
Non-Controlled Affiliates |
|
|
|
|
|
|
|
|
|
|
|
|
|
|
|
|
|
|
|
|
|
|||||||
Goldman Sachs Financial Square Government Fund |
|
$ |
— |
|
|
$ |
|
|
$ |
( |
) |
|
$ |
— |
|
|
$ |
— |
|
|
$ |
— |
|
|
$ |
|
||
Animal Supply Holdings, LLC |
|
|
|
|
|
|
|
|
— |
|
|
|
— |
|
|
|
( |
) |
|
|
— |
|
|
|
|
|||
ATX Networks Corp. |
|
|
|
|
|
|
|
|
( |
) |
|
|
— |
|
|
|
|
|
|
|
|
|
|
|||||
Collaborative Imaging, LLC (dba Texas Radiology Associates) |
|
|
|
|
|
— |
|
|
|
— |
|
|
|
— |
|
|
|
( |
) |
|
|
|
|
|
|
|||
Conergy Asia & ME Pte. LTD |
|
|
|
|
|
— |
|
|
|
— |
|
|
|
— |
|
|
|
( |
) |
|
|
— |
|
|
|
— |
|
|
Elah Holdings, Inc. |
|
|
|
|
|
— |
|
|
|
— |
|
|
|
— |
|
|
|
— |
|
|
|
|
|
|
— |
|
||
Iracore International Holdings, Inc. |
|
|
|
|
|
— |
|
|
|
— |
|
|
|
— |
|
|
|
|
|
|
|
|
|
|
||||
Kawa Solar Holdings Limited |
|
|
|
|
|
— |
|
|
|
— |
|
|
|
— |
|
|
|
( |
) |
|
|
|
|
|
— |
|
||
Southeast Mechanical, LLC (dba. SEM Holdings, LLC) |
|
|
— |
|
|
|
|
|
|
( |
) |
|
|
— |
|
|
|
|
|
|
|
|
|
|
||||
Total Non-Controlled Affiliates |
|
$ |
|
|
$ |
|
|
$ |
( |
) |
|
$ |
— |
|
|
$ |
( |
) |
|
$ |
|
|
$ |
|
||||
Total Affiliates |
|
$ |
|
|
$ |
|
|
$ |
( |
) |
|
$ |
( |
) |
|
$ |
( |
) |
|
$ |
|
|
$ |
|
||||
Due to Affiliates
The Investment Adviser pays certain general and administrative expenses on behalf of the Company in the ordinary course of business. As of December 31, 2023 and December 31, 2022, there were $
Co-investment Activity
In certain circumstances, the Company can make negotiated co-investments pursuant to an exemptive order from the SEC permitting it to do so. On November 16, 2022, the SEC granted to the Investment Adviser, the BDCs advised by the Investment Adviser and certain other affiliated applicants exemptive relief on which the Company expects to rely to co-invest alongside certain other client accounts managed by the Investment Adviser (collectively with the Company, the “Accounts”), which may include proprietary accounts of Goldman Sachs, in a manner consistent with the Company's investment objectives and strategies, certain Board-established criteria, the conditions of such exemptive relief and other pertinent factors (the “Relief”). Additionally, if the Investment Adviser forms other funds in the future, the Company may co-invest alongside such other affiliates, subject to compliance with the Relief, applicable regulations and regulatory guidance, as well as applicable allocation procedures. As a result of the Relief, there could be significant overlap in the Company’s investment portfolio and the investment portfolios of other Accounts, including, in some cases, proprietary accounts of Goldman Sachs. The Goldman Sachs Asset Management Private Credit Team is composed of investment professionals dedicated to the Company’s investment strategy and to other funds that share a similar investment strategy with the Company. The Goldman Sachs Asset Management Private Credit Team is responsible for identifying investment opportunities, conducting research and due diligence on prospective investments, negotiating and structuring the Company’s investments and monitoring and servicing the Company’s investments. The team works together with investment professionals who are primarily focused on investment strategies in syndicated, liquid credit. Under the terms of the Relief, a “required majority” (as defined in Section 57(o) of the Investment Company Act) of the Company’s independent directors must make certain conclusions in connection with a co-investment transaction, including that (1) the terms of the proposed transaction are reasonable and fair to the Company and the Company’s stockholders and do not involve overreaching in respect of the Company or its stockholders on the part of any person concerned, and (2) the transaction is consistent with the interests of the Company’s stockholders and is consistent with the then-current investment objectives and strategies of the Company.
In addition, the Company has filed an application to amend the Relief to permit the Company to participate in follow-on investments in the Company's existing portfolio companies with certain affiliates covered by the Relief if such affiliates, that are not BDCs or registered investment companies, did not have an investment in such existing portfolio company. There can be no assurance if and when the Company will receive the amended exemptive order.
120
The Company’s investments (excluding investments in money market funds, if any) consisted of the following:
|
|
December 31, 2023 |
|
December 31, 2022 |
|
||||||||||
Investment Type |
|
Cost |
|
|
Fair Value |
|
Cost |
|
|
Fair Value |
|
||||
1st Lien/Senior Secured Debt |
|
$ |
|
|
$ |
|
$ |
|
|
$ |
|
||||
1st Lien/Last-Out Unitranche |
|
|
|
|
|
|
|
|
|
|
|
||||
2nd Lien/Senior Secured Debt |
|
|
|
|
|
|
|
|
|
|
|
||||
Unsecured Debt |
|
|
|
|
|
|
|
|
|
|
|
||||
Preferred Stock |
|
|
|
|
|
|
|
|
|
|
|
||||
Common Stock |
|
|
|
|
|
|
|
|
|
|
|
||||
Warrants |
|
|
|
|
|
|
|
|
|
|
|
||||
Total |
|
$ |
|
|
$ |
|
$ |
|
|
$ |
|
||||
The industry composition of the Company’s investments as a percentage of fair value and net assets was as follows:
|
|
December 31, 2023 |
|
|
December 31, 2022 |
|
|
||||||||||
Industry |
|
Fair Value |
|
|
Net Assets |
|
|
Fair Value |
|
|
Net Assets |
|
|
||||
Software |
|
|
% |
|
|
% |
|
|
% |
|
|
% |
|
||||
Health Care Providers & Services |
|
|
|
|
|
|
|
|
|
|
|
|
|
||||
Professional Services |
|
|
|
|
|
|
|
|
|
|
|
|
|
||||
Financial Services |
|
|
|
|
|
|
|
|
|
|
|
|
|
||||
Health Care Technology |
|
|
|
|
|
|
|
|
|
|
|
|
|
||||
Diversified Consumer Services |
|
|
|
|
|
|
|
|
|
|
|
|
|
||||
IT Services |
|
|
|
|
|
|
|
|
|
|
|
|
|
||||
Real Estate Mgmt. & Development |
|
|
|
|
|
|
|
|
|
|
|
|
|
||||
Interactive Media & Services |
|
|
|
|
|
|
|
|
|
|
|
|
|
||||
Commercial Services & Supplies |
|
|
|
|
|
|
|
|
|
|
|
|
|
||||
Health Care Equipment & Supplies |
|
|
|
|
|
|
|
|
|
|
|
|
|
||||
Chemicals |
|
|
|
|
|
|
|
|
|
|
|
|
|
||||
Entertainment |
|
|
|
|
|
|
|
|
|
|
|
|
|
||||
Hotels, Restaurants & Leisure |
|
|
|
|
|
|
|
|
|
|
|
|
|
||||
Transportation Infrastructure |
|
|
|
|
|
|
|
|
|
|
|
|
|
||||
Trading Companies & Distributors |
|
|
|
|
|
|
|
|
|
|
|
|
|
||||
Independent Power and Renewable Electricity Producers |
|
|
|
|
|
|
|
|
|
|
|
|
|
||||
Insurance |
|
|
|
|
|
|
|
|
|
|
|
|
|
||||
Construction & Engineering |
|
|
|
|
|
|
|
|
|
|
|
|
|
||||
Household Products |
|
|
|
|
|
|
|
|
|
|
|
|
|
||||
Beverages |
|
|
|
|
|
|
|
|
|
|
|
|
|
||||
Wireless Telecommunication Services |
|
|
|
|
|
|
|
|
— |
|
|
|
— |
|
|
||
Broadline Retail |
|
|
|
|
|
|
|
|
|
|
|
|
|
||||
Automobile Components |
|
|
|
|
|
|
|
|
|
|
|
|
|
||||
Pharmaceuticals |
|
|
|
|
|
|
|
|
|
|
|
|
|
||||
Textiles, Apparel & Luxury Goods |
|
|
|
|
|
|
|
|
|
|
|
|
|
||||
Energy Equipment & Services |
|
|
|
|
|
|
|
|
|
|
|
|
|
||||
Media |
|
|
|
|
|
|
|
|
— |
|
|
|
— |
|
|
||
Communications Equipment |
|
|
|
|
|
|
|
|
|
|
|
|
|
||||
Capital Markets |
|
|
|
|
|
|
|
|
|
|
|
|
|
||||
Consumer Staples Distribution & Retail |
|
|
|
|
|
|
|
|
— |
|
|
|
— |
|
|
||
Leisure Products |
|
|
|
|
|
|
|
|
— |
|
|
|
— |
|
|
||
Building Products |
|
|
|
|
|
|
|
|
— |
|
(1) |
|
|
|
|||
Aerospace & Defense |
|
|
|
|
|
|
|
|
|
|
|
|
|
||||
Automobiles(1) |
|
|
— |
|
|
|
— |
|
|
|
— |
|
|
|
— |
|
|
Oil, Gas & Consumable Fuels(1) |
|
|
— |
|
|
|
— |
|
|
|
— |
|
|
|
— |
|
|
Food Products |
|
|
— |
|
(1) |
|
— |
|
(1) |
|
|
|
|
|
|
||
Distributors(1) |
|
|
— |
|
|
|
— |
|
|
|
— |
|
|
|
— |
|
|
Road & Rail |
|
|
— |
|
|
|
— |
|
|
|
|
|
|
|
|
||
Containers & Packaging |
|
|
— |
|
|
|
— |
|
|
|
|
|
|
|
|
||
Specialty Retail |
|
|
— |
|
|
|
— |
|
|
|
|
|
|
|
|
||
Air Freight & Logistics |
|
|
— |
|
|
|
— |
|
|
|
|
|
|
|
|
||
Total |
|
|
% |
|
|
% |
|
|
% |
|
|
% |
|
||||
121
The geographic composition of the Company’s investments at fair value was as follows:
Geographic |
|
December 31, |
|
|
December 31, |
|
|
||
United States |
|
|
% |
|
|
% |
|
||
Canada |
|
|
|
|
|
|
|
||
United Kingdom |
|
|
|
|
|
|
|
||
Germany |
|
|
|
|
|
— |
|
(1) |
|
Singapore (1) |
|
|
— |
|
|
|
— |
|
|
Total |
|
|
% |
|
|
% |
|
||
The fair value of a financial instrument is the amount that would be received to sell an asset or would be paid to transfer a liability in an orderly transaction between market participants at the measurement date (i.e., the exit price).
The fair value hierarchy under ASC 820 prioritizes the inputs to valuation techniques used to measure fair value. The hierarchy gives the highest priority to unadjusted quoted prices in active markets for identical assets or liabilities (Level 1 measurements) and the lowest priority to unobservable inputs (Level 3 measurements). The levels used for classifying investments are not necessarily an indication of the risk associated with investing in these securities. The three levels of the fair value hierarchy are as follows:
Basis of Fair Value Measurement
Level 1 – Inputs to the valuation methodology are quoted prices available in active markets for identical instruments as of the reporting date. The types of financial instruments included in Level 1 include unrestricted securities, including equities and derivatives, listed in active markets.
Level 2 – Inputs to the valuation methodology are other than quoted prices in active markets, which are either directly or indirectly observable as of the reporting date. The types of financial instruments in this category include less liquid and restricted securities listed in active markets, securities traded in other than active markets, government and agency securities and certain over-the-counter derivatives where the fair value is based on observable inputs.
Level 3 – Inputs to the valuation methodology are unobservable and significant to overall fair value measurement. The inputs into the determination of fair value require significant management judgment or estimation. Financial instruments that are included in this category include investments in privately held entities and certain over-the-counter derivatives where the fair value is based on unobservable inputs.
122
A financial instrument’s level within the fair value hierarchy is based on the lowest level of any input that is significant to the fair value measurement. Note 2 “Significant Accounting Policies” should be read in conjunction with the information outlined below.
The table below presents the valuation techniques and the nature of significant inputs generally used in determining the fair value of Level 2 and Level 3 Instruments.
Level 2 Instruments |
|
Valuation Techniques and Significant Inputs |
Equity and Fixed Income |
|
The types of instruments that trade in markets that are not considered to be active but are valued based on quoted market prices, broker or dealer quotations or alternative pricing sources with reasonable levels of price transparency include commercial paper, most government agency obligations, most corporate debt securities, certain mortgage-backed securities, certain bank loans, less liquid publicly listed equities, certain state and municipal obligations, certain money market instruments and certain loan commitments.
Valuations of Level 2 Equity and Fixed Income instruments can be verified to quoted prices, broker or dealer quotations or alternative pricing sources with reasonable levels of price transparency. Consideration is given to the nature of the quotations (e.g. indicative or firm) and the relationship of recent market activity to the prices provided from alternative pricing sources. |
|
|
|
Derivative Contracts |
|
Over-the-counter (“OTC”) derivatives (both centrally cleared and bilateral) are valued using market transactions and other market evidence whenever possible, including market-based inputs to models, calibration to market-clearing transactions, broker or dealer quotations, or other alternative pricing sources with reasonable levels of price transparency. Where models are used, the selection of a particular model to value an OTC derivative depends upon the contractual terms of, and specific risks inherent in, the instrument, as well as the availability of pricing information in the market. The Company generally uses similar models to value similar instruments. Valuation models require a variety of inputs, including contractual terms, market prices, yield curves, credit curves, measures of volatility, voluntary and involuntary prepayment rates, loss severity rates and correlations of such inputs. For OTC derivatives that trade in liquid markets, model inputs can generally be verified and model selection does not involve significant management judgment. OTC derivatives are classified within Level 2 of the fair value hierarchy when significant inputs are corroborated by market evidence. |
Level 3 Instruments |
|
Valuation Techniques and Significant Inputs |
Bank Loans, Corporate Debt, and Other Debt Obligations |
|
Valuations are generally based on discounted cash flow techniques, for which the significant inputs are the amount and timing of expected future cash flows, market yields and recovery assumptions. The significant inputs are generally determined based on relative value analyses, which incorporate comparisons both to credit default swaps that reference the same underlying credit risk and to other debt instruments for the same issuer for which observable prices or broker quotes are available. Other valuation methodologies are used as appropriate including market comparables, transactions in similar instruments and recovery/liquidation analysis. |
|
|
|
Equity |
|
Recent third-party investments or pending transactions are considered to be the best evidence for any change in fair value. When these are not available, the following valuation methodologies are used, as appropriate and available (i) Transactions in similar instruments; (ii) Discounted cash flow techniques; (iii) Third party appraisals; and (iv) Industry multiples and public comparables. Evidence includes recent or pending reorganizations (for example, merger proposals, tender offers and debt restructurings) and significant changes in financial metrics, including (i) Current financial performance as compared to projected performance; (ii) Capitalization rates and multiples; and (iii) Market yields implied by transactions of similar or related assets. |
123
Level 3 Instruments |
|
Fair Value(1)(2) |
|
Valuation Techniques(3) |
Significant Unobservable |
Range of Significant |
Weighted |
|
As of December 31, 2023 |
|
|
|
|
|
|
|
|
Bank Loans, Corporate Debt, and Other Debt Obligations |
||||||||
1st Lien/Senior Secured Debt |
|
$ |
|
Discounted cash flows |
Discount Rate |
|||
|
|
$ |
|
Comparable multiples |
EV/EBITDA(6) |
— |
||
|
|
$ |
|
Collateral analysis |
Recovery Rate |
— |
||
|
|
$ |
|
Comparable multiples |
EV/Revenue |
|||
1st Lien/Last-Out Unitranche |
|
$ |
|
Discounted cash flows |
Discount Rate |
|||
2nd Lien/Senior Secured Debt |
|
$ |
|
Discounted cash flows |
Discount Rate |
|||
|
|
$ |
|
Comparable multiples |
EV/EBITDA(6) |
— |
||
|
|
$ |
|
Comparable multiples |
EV/Revenue |
— |
||
Unsecured Debt |
|
$ |
|
Discounted cash flows |
Discount Rate |
|||
|
|
$ |
|
Comparable multiples |
EV/EBITDA(6) |
— |
||
|
|
$ |
|
Comparable multiples |
EV/Revenue |
— |
||
Equity |
||||||||
Preferred Stock |
|
$ |
|
Comparable multiples |
EV/EBITDA(6) |
|||
|
|
$ |
|
Comparable multiples |
EV/Revenue |
|||
Common Stock |
|
$ |
|
Discounted cash flows |
Discount Rate |
|||
|
|
$ |
|
Comparable multiples |
EV/EBITDA(6) |
|||
|
|
$ |
|
Comparable multiples |
EV/Revenue |
— |
||
Warrants |
|
$ |
|
Comparable multiples |
EV/Revenue |
— |
||
As of December 31, 2022 |
|
|
|
|
|
|
|
|
Bank Loans, Corporate Debt, and Other Debt Obligations |
||||||||
1st Lien/Senior Secured Debt |
|
$ |
|
Discounted cash flows |
Discount Rate |
|||
|
|
$ |
|
Collateral analysis |
Recovery Rate |
— |
||
|
|
$ |
|
Comparable multiples |
EV/EBITDA(6) |
— |
||
|
|
$ |
|
Comparable multiples |
EV/Revenue |
— |
||
1st Lien/Last-Out Unitranche |
|
$ |
|
Discounted cash flows |
Discount Rate |
|||
2nd Lien/Senior Secured Debt |
|
$ |
|
Discounted cash flows |
Discount Rate |
|||
|
|
$ |
|
Comparable multiples |
EV/EBITDA(6) |
— |
||
Unsecured Debt |
|
$ |
|
Discounted cash flows |
Discount Rate |
|||
Equity |
||||||||
Preferred Stock |
|
$ |
|
Comparable multiples |
EV/EBITDA(6) |
|||
|
|
$ |
|
Comparable multiples |
EV/Revenue |
|||
Common Stock |
|
$ |
|
Discounted cash flows |
Discount Rate |
|||
|
|
$ |
|
Comparable multiples |
EV/EBITDA(6) |
|||
|
|
$ |
|
Comparable multiples |
EV/Revenue |
|||
Warrants |
|
$ |
|
Comparable multiples |
EV/Revenue |
— |
||
124
As noted above, the income and market approaches were used in the determination of fair value of certain Level 3 assets as of December 31, 2023 and December 31, 2022. The significant unobservable inputs used in the income approach are the discount rate or market yield used to discount the estimated future cash flows expected to be received from the underlying investment, which include both future principal and interest payments. An increase in the discount rate or market yield would result in a decrease in the fair value. Included in the consideration and selection of discount rates or market yields is risk of default, rating of the investment, call provisions and comparable company investments. The significant unobservable inputs used in the market approach are based on market comparable transactions and market multiples of publicly traded comparable companies. Increases or decreases in market comparable transactions or market multiples would result in an increase or decrease, in the fair value.
The following is a summary of the Company’s assets categorized within the fair value hierarchy:
|
|
December 31, 2023 |
|
|
December 31, 2022 |
|
||||||||||||||||||||||||||
Assets |
|
Level 1 |
|
|
Level 2 |
|
|
Level 3 |
|
|
Total |
|
|
Level 1 |
|
|
Level 2 |
|
|
Level 3 |
|
|
Total |
|
||||||||
1st Lien/Senior Secured Debt |
|
$ |
— |
|
|
$ |
|
|
$ |
|
|
$ |
|
|
$ |
— |
|
|
$ |
|
|
$ |
|
|
$ |
|
||||||
1st Lien/Last-Out Unitranche |
|
|
— |
|
|
|
— |
|
|
|
|
|
|
|
|
|
— |
|
|
|
— |
|
|
|
|
|
|
|
||||
2nd Lien/Senior Secured Debt |
|
|
— |
|
|
|
— |
|
|
|
|
|
|
|
|
|
— |
|
|
|
|
|
|
|
|
|
|
|||||
Unsecured Debt |
|
|
— |
|
|
|
— |
|
|
|
|
|
|
|
|
|
— |
|
|
|
— |
|
|
|
|
|
|
|
||||
Preferred Stock |
|
|
— |
|
|
|
— |
|
|
|
|
|
|
|
|
|
— |
|
|
|
— |
|
|
|
|
|
|
|
||||
Common Stock |
|
|
|
|
|
— |
|
|
|
|
|
|
|
|
|
|
|
|
— |
|
|
|
|
|
|
|
||||||
Warrants |
|
|
— |
|
|
|
— |
|
|
|
|
|
|
|
|
|
— |
|
|
|
— |
|
|
|
|
|
|
|
||||
Total Assets |
|
$ |
|
|
$ |
|
|
$ |
|
|
$ |
|
|
$ |
|
|
$ |
|
|
$ |
|
|
$ |
|
||||||||
Unrealized appreciation (depreciation) on foreign currency forward contracts |
|
$ |
— |
|
|
$ |
( |
) |
|
$ |
— |
|
|
$ |
( |
) |
|
$ |
— |
|
|
$ |
( |
) |
|
$ |
— |
|
|
$ |
( |
) |
The below table presents a summary of changes in fair value of Level 3 assets by investment type:
|
|
Beginning Balance |
|
|
Purchases |
|
|
Net |
|
|
Net Change in |
|
|
Sales and |
|
|
Net |
|
|
Transfers |
|
|
Transfers |
|
|
Ending |
|
|
|
|
||||||||||
For the Year Ended December 31, 2023 |
|
|
|
|
|
|
|
|
|
|
|
|
|
|
|
|
|
|
|
|||||||||||||||||||||
1st Lien/Senior Secured Debt |
|
$ |
|
|
$ |
|
|
$ |
( |
) |
|
$ |
( |
) |
|
$ |
( |
) |
|
$ |
|
|
$ |
|
|
$ |
( |
) |
|
$ |
|
|
$ |
( |
) |
|||||
1st Lien/Last-Out Unitranche |
|
|
|
|
|
|
|
|
— |
|
|
|
|
|
|
( |
) |
|
|
|
|
|
— |
|
|
|
— |
|
|
|
|
|
|
|
||||||
2nd Lien/Senior Secured Debt |
|
|
|
|
|
|
|
|
( |
) |
|
|
|
|
|
( |
) |
|
|
|
|
|
— |
|
|
|
— |
|
|
|
|
|
|
|
||||||
Unsecured Debt |
|
|
|
|
|
|
|
|
— |
|
|
|
|
|
|
— |
|
|
|
( |
) |
|
|
— |
|
|
|
— |
|
|
|
|
|
|
|
|||||
Preferred Stock |
|
|
|
|
|
— |
|
|
|
|
|
|
( |
) |
|
|
( |
) |
|
|
— |
|
|
|
— |
|
|
|
— |
|
|
|
|
|
|
|
||||
Common Stock |
|
|
|
|
|
— |
|
|
|
( |
) |
|
|
|
|
|
( |
) |
|
|
— |
|
|
|
— |
|
|
|
— |
|
|
|
|
|
|
( |
) |
|||
Warrants |
|
|
|
|
|
— |
|
|
|
— |
|
|
|
( |
) |
|
|
— |
|
|
|
— |
|
|
|
— |
|
|
|
— |
|
|
|
|
|
|
( |
) |
||
Total Assets |
|
$ |
|
|
$ |
|
|
$ |
( |
) |
|
$ |
|
|
$ |
( |
) |
|
$ |
|
|
$ |
|
|
$ |
( |
) |
|
$ |
|
|
$ |
( |
) |
||||||
For the Year Ended December 31, 2022 |
|
|
|
|
|
|
|
|
|
|
|
|
|
|
|
|
|
|
|
|||||||||||||||||||||
1st Lien/Senior Secured Debt |
|
$ |
|
|
$ |
|
|
$ |
( |
) |
|
$ |
( |
) |
|
$ |
( |
) |
|
$ |
|
|
$ |
|
|
$ |
— |
|
|
$ |
|
|
$ |
( |
) |
|||||
1st Lien/Last-Out Unitranche |
|
|
|
|
|
|
|
|
— |
|
|
|
( |
) |
|
|
( |
) |
|
|
|
|
|
— |
|
|
|
— |
|
|
|
|
|
|
( |
) |
||||
2nd Lien/Senior Secured Debt |
|
|
|
|
|
|
|
|
( |
) |
|
|
( |
) |
|
|
( |
) |
|
|
|
|
|
— |
|
|
|
— |
|
|
|
|
|
|
( |
) |
||||
Unsecured Debt |
|
|
|
|
|
|
|
|
— |
|
|
|
( |
) |
|
|
— |
|
|
|
|
|
|
— |
|
|
|
— |
|
|
|
|
|
|
( |
) |
||||
Preferred Stock |
|
|
|
|
|
— |
|
|
|
— |
|
|
|
( |
) |
|
|
— |
|
|
|
— |
|
|
|
— |
|
|
|
— |
|
|
|
|
|
|
( |
) |
||
Common Stock |
|
|
|
|
|
|
|
|
|
|
|
( |
) |
|
|
( |
) |
|
|
— |
|
|
|
— |
|
|
|
— |
|
|
|
|
|
|
( |
) |
||||
Warrants |
|
|
|
|
|
— |
|
|
|
— |
|
|
|
( |
) |
|
|
— |
|
|
|
— |
|
|
|
— |
|
|
|
— |
|
|
|
|
|
|
( |
) |
||
Total Assets |
|
$ |
|
|
$ |
|
|
$ |
( |
) |
|
$ |
( |
) |
|
$ |
( |
) |
|
$ |
|
|
$ |
|
|
$ |
— |
|
|
$ |
|
|
$ |
( |
) |
|||||
125
Debt Not Carried at Fair Value
Fair value is estimated by discounting remaining payments using applicable current market rates, which take into account changes in the Company’s marketplace credit ratings, or market quotes, if available.
|
|
|
|
As of |
|
|||||
|
|
Level |
|
December 31, 2023 |
|
|
December 31, 2022 |
|
||
Revolving Credit Facility |
|
3 |
|
$ |
|
|
$ |
|
||
2025 Notes |
|
2 |
|
$ |
|
|
$ |
|
||
2026 Notes |
|
2 |
|
$ |
|
|
$ |
|
||
The Company is permitted to borrow amounts such that its asset coverage ratio, as defined in the
The Company’s outstanding debt was as follows:
|
|
As of |
|
|||||||||||||||||||||
|
|
December 31, 2023 |
|
|
December 31, 2022 |
|
||||||||||||||||||
|
|
Aggregate |
|
|
Amount |
|
|
Carrying |
|
|
Aggregate |
|
|
Amount |
|
|
Carrying |
|
||||||
Revolving Credit Facility(2) |
|
$ |
|
|
$ |
|
|
$ |
|
|
$ |
|
|
$ |
|
|
$ |
|
||||||
2025 Notes |
|
|
|
|
|
— |
|
|
|
|
|
|
|
|
|
— |
|
|
|
|
||||
2026 Notes |
|
|
|
|
|
— |
|
|
|
|
|
|
|
|
|
— |
|
|
|
|
||||
Total Debt |
|
$ |
|
|
$ |
|
|
$ |
|
|
$ |
|
|
$ |
|
|
$ |
|
||||||
The combined weighted average interest rate of the aggregate borrowings outstanding for the year ended December 31, 2023 and the year ended December 31, 2022 was
126
Revolving Credit Facility
On September 19, 2013, the Company entered into a senior secured revolving credit agreement (as amended, the “Revolving Credit Facility”) with various lenders. Truist Bank serves as administrative agent and Bank of America, N.A. serves as syndication agent under the Revolving Credit Facility. The Company has amended and restated the Revolving Credit Facility on numerous occasions between October 3, 2014 and October 18, 2023.
The aggregate committed borrowing amount under the Revolving Credit Facility is $
The Revolving Credit Facility may be guaranteed by certain of the Company’s domestic subsidiaries, including any that are formed or acquired by the Company in the future. Proceeds from borrowings may be used for general corporate purposes, including the funding of portfolio investments.
The Company’s obligations to the lenders under the Revolving Credit Facility are secured by a first priority security interest in substantially all of the Company’s portfolio of investments and cash, with certain exceptions. The Revolving Credit Facility contains certain covenants, including: (i) maintaining a minimum stockholder’s equity of $
Costs of $
The below table presents the summary information of the Revolving Credit Facility:
|
|
For the Years Ended December 31, |
|
|||||||||
|
|
2023 |
|
|
2022 |
|
|
2021 |
|
|||
Borrowing interest expense |
|
$ |
|
|
$ |
|
|
$ |
|
|||
Facility fees |
|
|
|
|
|
|
|
|
|
|||
Amortization of financing costs |
|
|
|
|
|
|
|
|
|
|||
Total |
|
$ |
|
|
$ |
|
|
$ |
|
|||
Weighted average interest rate |
|
|
% |
|
|
% |
|
|
% |
|||
Average outstanding balance |
|
$ |
|
|
$ |
|
|
$ |
|
|||
127
Convertible Notes
On October 3, 2016, the Company closed an offering of $
The below table presents the components of interest and other debt expenses related to the Convertible Notes:
|
|
For the Years Ended December 31, |
|
|||||||||
|
|
2023 |
|
|
2022 |
|
|
2021 |
|
|||
Borrowing interest expense |
|
$ |
— |
|
|
$ |
|
|
$ |
|
||
Accretion of OID |
|
|
— |
|
|
|
|
|
|
|
||
Amortization of debt issuance costs |
|
|
— |
|
|
|
|
|
|
|
||
Total |
|
$ |
— |
|
|
$ |
|
|
$ |
|
||
2025 Notes
On February 10, 2020, the Company closed an offering of $
The below table presents the components of the carrying value of the 2025 Notes:
|
|
December 31, |
|
|
December 31, |
|
||
Principal amount of debt |
|
$ |
|
|
$ |
|
||
Unamortized debt issuance costs |
|
|
|
|
|
|
||
Carrying Value |
|
$ |
|
|
$ |
|
||
The below table presents the components of interest and other debt expenses related to the 2025 Notes:
|
|
For the Years Ended December 31, |
|
|||||||||
|
|
2023 |
|
|
2022 |
|
|
2021 |
|
|||
Borrowing interest expense |
|
$ |
|
|
$ |
|
|
$ |
|
|||
Amortization of debt issuance costs |
|
|
|
|
|
|
|
|
|
|||
Total |
|
$ |
|
|
$ |
|
|
$ |
|
|||
2026 Notes
On November 24, 2020, the Company closed an offering of $
The below table presents the components of the carrying value of the 2026 Notes:
|
|
December 31, |
|
|
December 31, |
|
||
Principal amount of debt |
|
$ |
|
|
$ |
|
||
Unamortized debt issuance costs |
|
|
|
|
|
|
||
Carrying Value |
|
$ |
|
|
$ |
|
||
The below table presents the components of interest and other debt expenses related to the 2026 Notes:
128
|
|
For the Years Ended December 31, |
|
|||||||||
|
|
2023 |
|
|
2022 |
|
|
2021 |
|
|||
Borrowing interest expense |
|
$ |
|
|
$ |
|
|
$ |
|
|||
Amortization of debt issuance costs |
|
|
|
|
|
|
|
|
|
|||
Total |
|
$ |
|
|
$ |
|
|
$ |
|
|||
The Company enters into foreign currency forward contracts from time to time to help mitigate the impact that an adverse change in foreign exchange rates would have on the value of the Company’s investments denominated in foreign currencies.
In order to better define its contractual rights and to secure rights that will help the Company mitigate its counterparty risk, the Company may enter into an International Swaps and Derivatives Association, Inc. Master Agreement (“ISDA Master Agreement”) or a similar agreement with its derivative counterparties. An ISDA Master Agreement is a bilateral agreement between the Company and a counterparty that governs OTC derivatives, including foreign currency forward contracts, and typically contains, among other things, collateral posting terms and netting provisions in the event of a default and/or termination event. The provisions of the ISDA Master Agreement typically permit a single net payment in the event of a default (close-out netting) or similar event, including the bankruptcy or insolvency of the counterparty.
For financial reporting purposes, cash collateral that has been pledged to cover obligations of the Company and cash collateral received from the counterparty, if any, is included on the Consolidated Statements of Assets and Liabilities as other assets. The Company minimizes counterparty credit risk by only entering into agreements with counterparties that they believe to be in good standing and by monitoring the financial stability of those counterparties.
For the years ended December 31, 2023 and 2022, the Company’s average USD notional exposure to foreign currency forward contracts was $
The Company’s net exposure to foreign currency forward contracts that are subject to ISDA Master Agreements or similar agreements presented on the Consolidated Statements of Assets and Liabilities, all of which are with Bank of America, N.A., was as follows:
|
|
December 31, 2023 |
|
|
December 31, 2022 |
|
||
Gross Amount of Assets |
|
$ |
|
|
$ |
— |
|
|
Gross Amount of Liabilities |
|
|
( |
) |
|
|
( |
) |
Net Amount of Assets or (Liabilities) |
|
$ |
( |
) |
|
$ |
( |
) |
Collateral (Received) Pledged (1) |
|
|
|
|
|
|
||
Net Amounts (2) |
|
$ |
( |
) |
|
$ |
( |
) |
The effect of transactions in derivative instruments on the Consolidated Statements of Operations was as follows:
|
|
For the Years Ended December 31, |
|
|||||||||
|
|
2023 |
|
|
2022 |
|
|
2021 |
|
|||
Net realized gain (loss) on foreign currency forward contracts |
|
$ |
— |
|
|
$ |
|
|
$ |
( |
) |
|
Net change in unrealized appreciation (depreciation) on foreign currency forward contracts |
|
|
( |
) |
|
|
( |
) |
|
|
|
|
Total net realized and unrealized gains (losses) on foreign currency forward contracts |
|
$ |
( |
) |
|
$ |
( |
) |
|
$ |
|
|
129
Commitments
The Company may enter into investment commitments through executed credit agreements or commitment letters. In many circumstances for executed commitment letters, borrower acceptance and final terms are subject to transaction-related contingencies. As of December 31, 2023, the Company believed that it had adequate financial resources to satisfy its unfunded commitments.
|
|
Unfunded Commitment Balances(1) |
|
|||||
|
|
December 31, 2023 |
|
|
December 31, 2022 |
|
||
1st Lien/Senior Secured Debt |
|
|
|
|
|
|
||
1272775 B.C. LTD. (dba Everest Clinical Research) |
|
$ |
|
|
$ |
|
||
Abacus Data Holdings, Inc. (dba Clutch Intermediate Holdings) |
|
|
|
|
|
|
||
Acquia, Inc. |
|
|
|
|
|
|
||
Admiral Buyer, Inc. (dba Fidelity Payment Services) |
|
|
|
|
|
|
||
Amspec Parent, LLC |
|
|
|
|
|
— |
|
|
AQ Helios Buyer, Inc. (dba SurePoint) |
|
|
|
|
|
|
||
AQ Sunshine, Inc. (dba Relation Insurance) |
|
|
|
|
|
— |
|
|
Arrow Buyer, Inc. (dba Archer Technologies) |
|
|
|
|
|
— |
|
|
ASM Buyer, Inc. |
|
|
|
|
|
— |
|
|
Assembly Intermediate LLC |
|
|
|
|
|
|
||
Bayside Opco, LLC (dba Pro-PT) |
|
|
|
|
|
— |
|
|
Bigchange Group Limited |
|
|
|
|
|
|
||
Blast Bidco Inc. (dba Bazooka Candy Brands) |
|
|
|
|
|
— |
|
|
BSI3 Menu Buyer, Inc (dba Kydia) |
|
|
|
|
|
|
||
Bullhorn, Inc. |
|
|
|
|
|
|
||
Businessolver.com, Inc. |
|
|
|
|
|
|
||
Capitol Imaging Acquisition Corp. |
|
|
|
|
|
|
||
Checkmate Finance Merger Sub, LLC |
|
|
|
|
|
|
||
Chronicle Bidco Inc. (dba Lexitas) |
|
|
|
|
|
|
||
Circustrix Holdings, LLC (dba SkyZone) |
|
|
|
|
|
— |
|
|
CivicPlus LLC |
|
|
|
|
|
|
||
Clearcourse Partnership Acquireco Finance Limited |
|
|
|
|
|
|
||
Coding Solutions Acquisition, Inc. |
|
|
|
|
|
|
||
CorePower Yoga LLC |
|
|
|
|
|
|
||
Coretrust Purchasing Group LLC |
|
|
|
|
|
|
||
Crewline Buyer, Inc. (dba New Relic) |
|
|
|
|
|
— |
|
|
CST Buyer Company (dba Intoxalock) |
|
|
|
|
|
|
||
DECA Dental Holdings LLC |
|
|
|
|
|
|
||
Diligent Corporation |
|
|
|
|
|
|
||
ESO Solutions, Inc |
|
|
|
|
|
|
||
Experity, Inc. |
|
|
|
|
|
|
||
Formulations Parent Corporation (dba Chase Corp) |
|
|
|
|
|
— |
|
|
Frontgrade Technologies Holdings Inc. |
|
|
|
|
|
— |
|
|
Fullsteam Operations LLC |
|
|
|
|
|
|
||
Gainsight, Inc. |
|
|
|
|
|
|
||
GHA Buyer Inc. (dba Cedar Gate) |
|
|
|
|
|
|
||
GovDelivery Holdings, LLC (dba Granicus, Inc.) |
|
|
|
|
|
|
||
Governmentjobs.com, Inc. (dba NeoGov) |
|
|
|
|
|
|
||
GPS Phoenix Buyer, Inc. (dba Guidepoint) |
|
|
|
|
|
— |
|
|
GS AcquisitionCo, Inc. (dba Insightsoftware) |
|
|
|
|
|
|
||
Harrington Industrial Plastics, LLC |
|
|
|
|
|
— |
|
|
HealthEdge Software, Inc. |
|
|
|
|
|
|
||
Helios Buyer, Inc. (dba Heartland) |
|
|
|
|
|
|
||
Highfive Dental Holdco, LLC |
|
|
|
|
|
— |
|
|
Honor HN Buyer, Inc |
|
|
|
|
|
|
||
HS4 AcquisitionCo, Inc. (dba HotSchedules & Fourth) |
|
|
|
|
|
|
||
iCIMS, Inc. |
|
|
|
|
|
|
||
Intelligent Medical Objects, Inc. |
|
|
|
|
|
|
||
Internet Truckstop Group, LLC (dba Truckstop) |
|
|
|
|
|
|
||
iWave Information Systems, Inc. |
|
|
|
|
|
|
||
130
|
|
Unfunded Commitment Balances(1) |
|
|||||
|
|
December 31, 2023 |
|
|
December 31, 2022 |
|
||
Kaseya Inc. |
|
$ |
|
|
$ |
|
||
LS Clinical Services Holdings, Inc (dba CATO) |
|
|
|
|
|
— |
|
|
MerchantWise Solutions, LLC (dba HungerRush) |
|
|
|
|
|
|
||
Millstone Medical Outsourcing, LLC |
|
|
|
|
|
|
||
MRI Software LLC |
|
|
|
|
|
|
||
NAVEX TopCo, Inc. |
|
|
|
|
|
— |
|
|
Ncontracts, LLC |
|
|
|
|
|
— |
|
|
NFM & J, L.P. (dba the Facilities Group) |
|
|
|
|
|
|
||
One GI LLC |
|
|
|
|
|
|
||
Onyx CenterSource, Inc. |
|
|
|
|
|
— |
|
|
PDDS Holdco, Inc. (dba Planet DDS) |
|
|
|
|
|
|
||
Pioneer Buyer I, LLC |
|
|
|
|
|
|
||
PlanSource Holdings, Inc. |
|
|
|
|
|
|
||
Pluralsight, Inc |
|
|
|
|
|
|
||
Premier Care Dental Management, LLC |
|
|
|
|
|
|
||
Prophix Software Inc. (dba Pound Bidco) |
|
|
|
|
|
|
||
Recochem, Inc |
|
|
|
|
|
— |
|
|
Recorded Books Inc. (dba RBMedia) |
|
|
|
|
|
— |
|
|
Riverpoint Medical, LLC |
|
|
|
|
|
|
||
Rodeo Buyer Company (dba Absorb Software) |
|
|
|
|
|
|
||
Rubrik, Inc. |
|
|
|
|
|
|
||
Singlewire Software, LLC |
|
|
|
|
|
— |
|
|
Smarsh, Inc. |
|
|
|
|
|
|
||
Southeast Mechanical, LLC (dba. SEM Holdings, LLC) |
|
|
|
|
|
|
||
SpendMend, LLC |
|
|
|
|
|
|
||
StarCompliance Intermediate, LLC |
|
|
|
|
|
|
||
Sundance Group Holdings, Inc. (dba NetDocuments) |
|
|
|
|
|
|
||
Sunstar Insurance Group, LLC |
|
|
|
|
|
|
||
Superior Environmental Solutions |
|
|
|
|
|
— |
|
|
Superman Holdings, LLC (dba Foundation Software) |
|
|
|
|
|
|
||
Sweep Purchaser LLC |
|
|
|
|
|
|
||
The Center for Orthopedic and Research Excellence, Inc. (dba HOPCo) |
|
|
|
|
|
|
||
Total Vision LLC |
|
|
|
|
|
|
||
Trader Corporation |
|
|
|
|
|
|
||
UP Acquisition Corp. (dba Unified Power) |
|
|
|
|
|
— |
|
|
USN Opco LLC (dba Global Nephrology Solutions) |
|
|
|
|
|
|
||
VASA Fitness Buyer, Inc. |
|
|
|
|
|
— |
|
|
Volt Bidco, Inc. (dba Power Factors) |
|
|
|
|
|
|
||
VRC Companies, LLC (dba Vital Records Control) |
|
|
|
|
|
|
||
WebPT, Inc. |
|
|
|
|
|
|
||
Wellness AcquisitionCo, Inc. (dba SPINS) |
|
|
|
|
|
|
||
Whitewater Holding Company LLC |
|
|
|
|
|
|
||
WorkForce Software, LLC |
|
|
|
|
|
|
||
Xactly Corporation |
|
|
|
|
|
— |
|
|
Zarya Intermediate, LLC (dba iOFFICE) |
|
|
|
|
|
|
||
Ansira Partners, Inc. |
|
|
— |
|
|
|
|
|
Apptio, Inc. |
|
|
— |
|
|
|
|
|
Broadway Technology, LLC |
|
|
— |
|
|
|
|
|
CloudBees, Inc. |
|
|
— |
|
|
|
|
|
CORA Health Holdings Corp |
|
|
— |
|
|
|
|
|
Eptam Plastics, Ltd. |
|
|
— |
|
|
|
|
|
HumanState Limited (dba PayProp) |
|
|
— |
|
|
|
|
|
LCG Vardiman Black, LLC (dba Specialty Dental Brands) |
|
|
— |
|
|
|
|
|
Lithium Technologies, Inc. |
|
|
— |
|
|
|
|
|
PPT Management Holdings, LLC. |
|
|
— |
|
|
|
|
|
Premier Imaging, LLC (dba Lucid Health) |
|
|
— |
|
|
|
|
|
Project Eagle Holdings, LLC (dba Exostar) |
|
|
— |
|
|
|
|
|
Qualawash Holdings, LLC |
|
|
— |
|
|
|
|
|
Spotless Brands, LLC |
|
|
— |
|
|
|
|
|
Thrasio, LLC |
|
|
— |
|
|
|
|
|
Wine.com, LLC |
|
|
— |
|
|
|
|
|
Total 1st Lien/Senior Secured Debt |
|
$ |
|
|
$ |
|
||
131
|
|
Unfunded Commitment Balances(1) |
|
|||||
|
|
December 31, 2023 |
|
|
December 31, 2022 |
|
||
1st Lien/Last-Out Unitranche |
|
|
|
|
|
|
||
EDB Parent, LLC (dba Enterprise DB) |
|
$ |
|
|
$ |
|
||
EIP Consolidated, LLC (dba Everest Infrastructure) |
|
|
|
|
|
— |
|
|
K2 Towers III, LLC |
|
|
|
|
|
— |
|
|
Skyway Towers Intermediate LLC |
|
|
|
|
|
— |
|
|
Thor FinanceCo LLC (dba Harmoni Towers) |
|
|
|
|
|
— |
|
|
Towerco IV Holdings, LLC |
|
|
|
|
|
— |
|
|
Total 1st Lien/Last-Out Unitranche |
|
$ |
|
|
$ |
|
||
Total |
|
$ |
|
|
$ |
|
||
Contingencies
In the normal course of business, the Company enters into contracts that provide a variety of general indemnifications. Any exposure to the Company under these arrangements could involve future claims that may be made against the Company. Currently, no such claims exist or are expected to arise and, accordingly, the Company has not accrued any liability in connection with such indemnifications.
Equity Issuances
At-the-market (“ATM”) Offering
The Company may from time to time issue and sell shares of its common stock through public or ATM offerings.
On May 26, 2022, the Company entered into (i) an equity distribution agreement by and among the Company, GSAM and Truist Securities, Inc. (“Truist”) and (ii) an equity distribution agreement by and among the Company, GSAM and SMBC Nikko Securities America, Inc. (“SMBC”). The equity distribution agreements with Truist and SMBC described in the preceding sentence are collectively referred to herein as the “2022 Equity Distribution Agreements.” On and effective August 1, 2023, the Company terminated the 2022 Equity Distribution Agreements in accordance with their respective terms.
The 2022 Equity Distribution Agreements provided that the Company could, from time to time, issue and sell shares of its common stock, par value $
On November 15, 2023, the Company entered into an equity distribution agreement (the “2023 Equity Distribution Agreement”) by and among the Company, GSAM and Truist.
The 2023 Equity Distribution Agreement provides that the Company may, from time to time, issue and sell shares of its common stock, par value $
132
For the year ended December 31, 2023, there were
For the year ended December 31, 2022, the Company issued and sold the following shares of common stock through ATM offerings:
|
For the Years Ended December 31, |
|
|
|
2022 |
|
|
Gross Proceeds |
$ |
|
|
Underwriting/Offering Expenses |
|
( |
) |
Net Proceeds |
$ |
|
|
Number of Shares Issued |
|
|
|
Average Sales Price per Share |
$ |
|
|
Follow-on Offering
On March 9, 2023, the Company completed a follow-on offering (the "March Offering") under its shelf registration statement, issuing
Distributions
The Company has adopted a DRIP that provides for the automatic reinvestment of all cash distributions declared by the Board of Directors unless a stockholder elects to “opt out” of the DRIP. As a result, if the Board of Directors declares a cash distribution, then the stockholders who have not “opted out” of the DRIP will have their cash distributions automatically reinvested in additional shares of common stock, rather than receiving the cash distribution. The shares distributed by the Transfer Agent in the Company’s DRIP are either through (i) newly issued shares or (ii) acquired by the Transfer Agent through the purchase of outstanding shares on the open market. If, on the payment date for any distribution, the most recently computed NAV per share as of the DRIP is equal to or less than the closing market price plus estimated per share fees, the Transfer Agent will invest the distribution amount in newly issued shares. Otherwise, the Transfer Agent will invest the dividend amount in shares acquired by purchasing shares on the open market.
Date Declared |
|
Record Date |
|
Payment Date |
|
Amount Per Share |
|
|
Shares |
|
|
||
For the Year Ended December 31, 2023 |
|
|
|
|
|
|
|
|
|
||||
|
|
|
$ |
|
|
|
|
* |
|||||
|
|
|
$ |
|
|
|
|
|
|||||
|
|
|
$ |
|
|
|
|
* |
|||||
|
|
|
$ |
|
|
|
|
|
|||||
For the Year Ended December 31, 2022 |
|
|
|
|
|
|
|
|
|
||||
|
|
|
$ |
|
|
|
|
|
|||||
|
|
|
$ |
|
|
|
|
|
|||||
|
|
|
$ |
|
(1) |
|
|
* |
|||||
|
|
|
$ |
|
|
|
|
|
|||||
For the Year Ended December 31, 2021 |
|
|
|
|
|
|
|
|
|
||||
|
|
|
$ |
|
|
|
|
|
|||||
|
|
|
$ |
|
|
|
|
|
|||||
|
|
|
$ |
|
|
|
|
|
|||||
|
|
|
$ |
|
|
|
|
|
|||||
|
|
|
$ |
|
|
|
|
|
|||||
|
|
|
$ |
|
|
|
|
|
|||||
|
|
|
$ |
|
|
|
|
|
|||||
*
(1)
133
The following information sets forth the computation of basic and diluted earnings per share:
|
|
For the Years Ended December 31, |
|
|||||||||
|
|
2023 |
|
|
2022 |
|
|
2021 |
|
|||
Net increase (decrease) in net assets from operations |
|
$ |
|
|
$ |
|
|
$ |
|
|||
Weighted average shares outstanding |
|
|
|
|
|
|
|
|
|
|||
Basic and diluted earnings (loss) per share |
|
$ |
|
|
$ |
|
|
$ |
|
|||
11. TAX INFORMATION
The tax character of distributions was as follows:
|
|
For the Years Ended December 31, |
|
|||||||||
|
|
2023 |
|
|
2022 |
|
|
2021 |
|
|||
Distributions paid from: |
|
|
|
|
|
|
|
|
|
|||
Ordinary Income |
|
$ |
|
|
$ |
|
|
$ |
|
|||
Net Long-Term Capital Gains |
|
|
— |
|
|
|
|
|
|
— |
|
|
Total Taxable Distributions |
|
$ |
|
|
$ |
|
|
$ |
|
|||
The components of Accumulated Earnings (Losses) on a tax basis were as follows:
|
|
December 31, 2023 |
|
|
December 31, 2022 |
|
|
December 31, 2021 |
|
|||
Undistributed Ordinary Income—net |
|
$ |
|
|
$ |
|
|
$ |
|
|||
Undistributed Long-Term Capital Gains |
|
|
— |
|
|
|
— |
|
|
|
|
|
Total Undistributed Earnings |
|
$ |
|
|
$ |
|
|
$ |
|
|||
Capital Loss Carryforward (1): |
|
|
|
|
|
|
|
|
|
|||
Perpetual Long-Term |
|
$ |
( |
) |
|
$ |
( |
) |
|
$ |
( |
) |
Perpetual Short-Term |
|
|
( |
) |
|
|
( |
) |
|
|
( |
) |
Total capital loss carryforwards |
|
$ |
( |
) |
|
$ |
( |
) |
|
$ |
( |
) |
Timing Differences (Organizational Costs, Post-October Capital Loss Deferral and Late Year Ordinary Loss Deferral) |
|
|
( |
) |
|
|
( |
) |
|
|
( |
) |
Unrealized Earnings (Losses)—net |
|
|
( |
) |
|
|
( |
) |
|
|
( |
) |
Total Accumulated Earnings (Losses)—net |
|
$ |
( |
) |
|
$ |
( |
) |
|
$ |
( |
) |
The Company's ability to utilize its capital loss carryforwards is subject to an annual limitation under section 382 of the Code.
The Company’s aggregate unrealized appreciation and depreciation on investments based on cost for U.S. federal income tax purposes were as follows:
|
|
December 31, 2023 |
|
|
December 31, 2022 |
|
|
December 31, 2021 |
|
|||
Tax cost |
|
$ |
|
|
$ |
|
|
$ |
|
|||
Gross unrealized appreciation |
|
|
|
|
|
|
|
|
|
|||
Gross unrealized depreciation |
|
|
( |
) |
|
|
( |
) |
|
|
( |
) |
Net unrealized investment appreciation (depreciation) on investments |
|
$ |
( |
) |
|
$ |
( |
) |
|
$ |
( |
) |
The difference between GAAP-basis and tax basis unrealized gains (losses) is attributable primarily to wash sales, net mark to market gains (losses) on foreign currency contracts, and differences in the tax treatment of underlying fund investments, partnership investments and material modification of debt securities.
In order to present certain components of the Company’s capital accounts on a tax-basis, certain reclassifications have been recorded to the Company’s accounts. These reclassifications have no impact on the net asset value of the Company and result primarily from certain non-deductible expenses, and differences in the tax treatment of underlying fund investments. For the years ended December 31, 2023, 2022 and 2021, the Company reclassified $
134
The following reconciles net increase in net assets resulting from operations to taxable income:
|
|
For the Years Ended December 31, |
|
|||||||||
|
|
2023 |
|
|
2022 |
|
|
2021 |
|
|||
Net increase in net assets resulting from operations |
|
$ |
|
|
$ |
|
|
$ |
|
|||
Adjustments: |
|
|
|
|
|
|
|
|
|
|||
Net unrealized loss (gain) on investments and foreign currency forward contracts and translations |
|
|
( |
) |
|
|
|
|
|
|
||
Income not currently taxable |
|
|
( |
) |
|
|
( |
) |
|
|
( |
) |
Income for tax but not book |
|
|
|
|
|
|
|
|
|
|||
Expenses not currently deductible |
|
|
|
|
|
|
|
|
|
|||
Expenses for tax but not for book |
|
|
( |
) |
|
|
( |
) |
|
|
( |
) |
Realized gain(loss) differences |
|
|
( |
) |
|
|
( |
) |
|
|
( |
) |
Taxable income net of capital loss carryforward |
|
$ |
|
|
$ |
|
|
$ |
|
|||
Capital loss carryforward |
|
|
|
|
|
|
|
|
|
|||
Taxable income (1) |
|
$ |
|
|
$ |
|
|
$ |
|
|||
ASC Topic 740, “Accounting for Uncertainty in Income Taxes” (“ASC 740”) provides guidance on the accounting for and disclosure of uncertainty in tax position. ASC 740 requires the evaluation of tax positions taken or expected to be taken in the course of preparing the Company’s tax returns to determine whether the tax positions are “more-likely-than-not” of being sustained by the applicable tax authority. Tax positions deemed to meet the more-likely-than-not threshold are recorded as a tax benefit or expense in the current year. Based on its analysis of its tax position for all open tax years (the current and prior years, as applicable), the Company has concluded that it does not have any uncertain tax positions that met the recognition or measurement criteria of ASC 740. Such open tax years remain subject to examination and adjustment by tax authorities.
135
12. FINANCIAL HIGHLIGHTS
The below tables present the schedule of financial highlights of the Company:
|
|
For the Years Ended December 31, |
|
|
|||||||||||||||||
|
|
2023 |
|
|
2022 |
|
|
2021 |
|
|
2020 |
|
|
2019 |
|
|
|||||
Per Share Data:(1) |
|
|
|
|
|||||||||||||||||
NAV, beginning of period |
|
$ |
|
|
$ |
|
|
$ |
|
|
$ |
|
|
$ |
|
|
|||||
Net investment income |
|
|
|
|
|
|
|
|
|
|
|
|
|
|
|
|
|||||
Net realized and unrealized gains (losses)(2) |
|
|
( |
) |
|
|
( |
) |
(4) |
|
( |
) |
|
|
( |
) |
|
|
( |
) |
|
Income tax provision, realized and unrealized gains |
|
|
( |
) |
|
|
— |
|
(3) |
|
— |
|
(3) |
|
— |
|
(3) |
|
— |
|
(3) |
Net increase in net assets from operations |
|
|
|
|
|
|
|
|
|
|
|
|
|
|
|
|
|||||
Issuance of common stock in connection with the Merger |
|
|
— |
|
|
|
— |
|
|
|
— |
|
|
|
( |
) |
|
|
— |
|
|
Issuance of common stock, net of underwriting and offering costs |
|
|
|
|
|
|
(4) |
|
— |
|
|
|
— |
|
|
|
— |
|
|
||
Distributions declared |
|
|
( |
) |
|
|
( |
) |
|
|
( |
) |
|
|
( |
) |
|
|
( |
) |
|
Total increase (decrease) in net assets |
|
|
|
|
|
( |
) |
|
|
( |
) |
|
|
( |
) |
|
|
( |
) |
|
|
NAV, end of period |
|
$ |
|
|
$ |
|
|
$ |
|
|
$ |
|
|
$ |
|
|
|||||
Market price, end of period |
|
$ |
|
|
$ |
|
|
$ |
|
|
$ |
|
|
$ |
|
|
|||||
Shares outstanding, end of period |
|
|
|
|
|
|
|
|
|
|
|
|
|
|
|
|
|||||
Weighted average shares outstanding |
|
|
|
|
|
|
|
|
|
|
|
|
|
|
|
|
|||||
Total return based on NAV(5) |
|
|
% |
|
|
% |
|
|
% |
|
|
% |
|
|
% |
|
|||||
Total return based on market value(6) |
|
|
% |
|
|
( |
)% |
|
|
% |
|
|
% |
|
|
% |
|
||||
Supplemental Data/Ratio: |
|
|
|
|
|
|
|
|
|
|
|
|
|
|
|
|
|||||
Net assets, end of period |
|
$ |
|
|
$ |
|
|
$ |
|
|
$ |
|
|
$ |
|
|
|||||
Ratio of net expenses to average net assets |
|
|
% |
|
|
% |
|
|
% |
|
|
% |
|
|
% |
|
|||||
Ratio of net expenses before voluntary waivers to average net assets |
|
|
% |
|
|
% |
|
|
% |
|
|
% |
|
|
— |
% |
|
||||
Ratio of net expenses (without incentive fees and interest and other debt expenses) to average net assets |
|
|
% |
|
|
% |
|
|
% |
|
|
% |
|
|
% |
|
|||||
Ratio of interest and other debt expenses to average net assets |
|
|
% |
|
|
% |
|
|
% |
|
|
% |
|
|
% |
|
|||||
Ratio of net incentive fees to average net assets |
|
|
% |
|
|
% |
|
|
% |
|
|
% |
|
|
% |
|
|||||
Ratio of total expenses to average net assets |
|
|
% |
|
|
% |
|
|
% |
|
|
% |
|
|
% |
|
|||||
Ratio of net investment income to average net assets |
|
|
% |
|
|
% |
|
|
% |
|
|
% |
|
|
% |
|
|||||
Portfolio turnover |
|
|
% |
|
|
% |
|
|
% |
|
|
% |
|
|
% |
|
|||||
136
|
|
For the Years Ended December 31, |
|
|||||||||||||||||
|
|
2018 |
|
|
2017 |
|
|
2016 |
|
|
2015 |
|
|
2014 |
|
|||||
Per Share Data:(1) |
|
|
|
|||||||||||||||||
NAV, beginning of period |
|
$ |
|
|
$ |
|
|
$ |
|
|
$ |
|
|
$ |
|
|||||
Net investment income |
|
|
|
|
|
|
|
|
|
|
|
|
|
|
|
|||||
Net realized and unrealized gains (losses)(2) |
|
|
( |
) |
|
|
( |
) |
|
|
( |
) |
|
|
( |
) |
|
|
( |
) |
Income tax provision, realized and unrealized gains |
|
|
( |
) |
|
|
— |
|
|
|
— |
|
|
|
— |
|
|
|
— |
|
Net increase in net assets from operations |
|
|
|
|
|
|
|
|
|
|
|
|
|
|
|
|||||
Issuance of common stock, net of underwriting and offering costs |
|
|
— |
|
|
|
|
|
|
— |
|
|
|
( |
) |
|
|
— |
|
|
Equity component of convertible notes |
|
|
|
|
|
— |
|
|
|
|
|
|
— |
|
|
|
— |
|
||
Distributions declared from net investment income(3) |
|
|
( |
) |
|
|
( |
) |
|
|
( |
) |
|
|
( |
) |
|
|
( |
) |
Distributions declared from net realized gains(3) |
|
|
— |
|
|
|
— |
|
|
– |
|
|
|
( |
) |
|
|
( |
) |
|
Total increase (decrease) in net assets |
|
|
( |
) |
|
|
( |
) |
|
|
( |
) |
|
|
( |
) |
|
|
( |
) |
NAV, end of period |
|
$ |
|
|
$ |
|
|
$ |
|
|
$ |
|
|
$ |
|
|||||
Market price, end of period |
|
$ |
|
|
$ |
|
|
$ |
|
|
$ |
|
|
N.A. |
|
|||||
Shares outstanding, end of period |
|
|
|
|
|
|
|
|
|
|
|
|
|
|
|
|||||
Weighted average shares outstanding |
|
|
|
|
|
|
|
|
|
|
|
|
|
|
|
|||||
Total return based on NAV(4) |
|
|
% |
|
|
% |
|
|
% |
|
|
% |
|
|
% |
|||||
Total return based on market value(5) |
|
|
( |
)% |
|
|
% |
|
|
% |
|
|
% |
|
N.A. |
|
||||
Supplemental Data/Ratio: |
|
|
|
|
|
|
|
|
|
|
|
|
|
|
|
|||||
Net assets, end of period |
|
$ |
|
|
$ |
|
|
$ |
|
|
$ |
|
|
$ |
|
|||||
Ratio of net expenses to average net assets |
|
|
% |
|
|
% |
|
|
% |
|
|
% |
|
|
% |
|||||
Ratio of net expenses (without incentive fees and interest and other debt expenses) to average net assets |
|
|
% |
|
|
% |
|
|
% |
|
|
% |
|
|
% |
|||||
Ratio of interest and other debt expenses to average net assets |
|
|
% |
|
|
% |
|
|
% |
|
|
% |
|
|
% |
|||||
Ratio of net incentive fees to average net assets |
|
|
% |
|
|
% |
|
|
% |
|
|
% |
|
|
% |
|||||
Ratio of total expenses to average net assets |
|
|
% |
|
|
% |
|
|
% |
|
|
% |
|
|
% |
|||||
Ratio of net investment income to average net assets |
|
|
% |
|
|
% |
|
|
% |
|
|
% |
|
|
% |
|||||
Portfolio turnover |
|
|
% |
|
|
% |
|
|
% |
|
|
% |
|
|
% |
|||||
137
13. SUBSEQUENT EVENTS
Subsequent events after the date of the Consolidated Statements of Assets and Liabilities have been evaluated through the date the audited consolidated financial statements were issued. Other than the item discussed below, the Company has concluded that there is no impact requiring adjustment or disclosure in the consolidated financial statements.
On
Goldman Sachs BDC, Inc. — Tax Information (unaudited)
During the year ended December 31, 2023, the Company designated
During the year ended December 31, 2023, the Company designated
138
ITEM 9. CHANGES IN AND DISAGREEMENTS WITH ACCOUNTANTS ON ACCOUNTING AND FINANCIAL DISCLOSURE
None.
ITEM 9A. CONTROLS AND PROCEDURES
Evaluation of Disclosure Controls and Procedures. As of the end of the period covered by this report, our management carried out an evaluation, under the supervision and with the participation of our Co-Chief Executive Officers and Chief Financial Officer, of the effectiveness of the design and operation of our disclosure controls and procedures (as defined in Rules 13a-15(e) and 15d-15(e) under the Exchange Act). Based on that evaluation, our Co-Chief Executive Officers and Chief Financial Officer have concluded that our disclosure controls and procedures were effective as of December 31, 2023. In designing and evaluating our disclosure controls and procedures, management recognizes that any controls and procedures, no matter how well designed and operated, can provide only reasonable assurance of achieving their objectives, and management necessarily applies its judgment in evaluating the benefits of possible controls and procedures relative to their costs.
Changes in Internal Control over Financial Reporting. There have been no changes in our internal control over financial reporting that occurred during our most recently completed fiscal quarter ended December 31, 2023 that have materially affected, or are reasonably likely to materially affect, our internal control over financial reporting.
Management’s Report on Internal Control over Financial Reporting. Our management is responsible for establishing and maintaining adequate internal control over financial reporting (as defined in Rules 13a-15(f) and 15d-15(f) of the Exchange Act). Under the supervision and with the participation of management, including the Co-Chief Executive Officers and Chief Financial Officer, we conducted an evaluation of the effectiveness of our internal control over financial reporting based on the criteria established in Internal Control—Integrated Framework (2013) issued by the Committee of Sponsoring Organizations of the Treadway Commission. Based on our evaluation, management concluded that our internal control over financial reporting was effective as of December 31, 2023.
Because of its inherent limitations, internal control over financial reporting may not prevent or detect misstatements. Also, projections of any evaluation of effectiveness to future periods are subject to the risk that controls may become inadequate because of changes in conditions, or that the degree of compliance with the policies or procedures may deteriorate.
The effectiveness of our internal control over financial reporting as of December 31, 2023 has been audited by PricewaterhouseCoopers LLP, an independent registered public accounting firm, as stated in their report which appears herein.
ITEM 9B. OTHER INFORMATION
ITEM 9C. DISCLOSURE REGARDING FOREIGN JURISDICTIONS THAT PREVENT INSPECTIONS
Not applicable.
139
PART III.
ITEM 10. DIRECTORS, EXECUTIVE OFFICERS AND CORPORATE GOVERNANCE
The information required by Item 10 is hereby incorporated by reference from our definitive Proxy Statement relating to our 2024 Annual Meeting of Stockholders, to be filed with the SEC within 120 days following the end of our fiscal year.
ITEM 11. EXECUTIVE COMPENSATION.
The information required by Item 11 is hereby incorporated by reference from our definitive Proxy Statement relating to our 2024 Annual Meeting of Stockholders, to be filed with the SEC within 120 days following the end of our fiscal year.
ITEM 12. SECURITY OWNERSHIP OF CERTAIN BENEFICIAL OWNERS AND MANAGEMENT AND RELATED STOCKHOLDER MATTERS
The information required by Item 12 is hereby incorporated by reference from our definitive Proxy Statement relating to our 2024 Annual Meeting of Stockholders, to be filed with the SEC within 120 days following the end of our fiscal year.
ITEM 13. CERTAIN RELATIONSHIPS AND RELATED TRANSACTIONS, AND DIRECTOR INDEPENDENCE
The information required by Item 13 is hereby incorporated by reference from our definitive Proxy Statement relating to our 2024 Annual Meeting of Stockholders, to be filed with the SEC within 120 days following the end of our fiscal year.
ITEM 14. PRINCIPAL ACCOUNTING FEES AND SERVICES
The information required by Item 14 is hereby incorporated by reference from our definitive Proxy Statement relating to our 2024 Annual Meeting of Stockholders, to be filed with the SEC within 120 days following the end of our fiscal year.
140
PART IV.
ITEM 15. EXHIBITS, FINANCIAL STATEMENT SCHEDULES
The following documents are filed as part of this Annual Report on Form 10-K:
141
EXHIBIT NO. |
EXHIBITS |
||
|
|
|
|
2.1 |
|
||
|
|
|
|
3.1 |
|
||
|
|
||
3.2 |
|
||
|
|
|
|
4.1 |
|
||
|
|
|
|
4.2 |
|
||
|
|
|
|
4.3 |
|
||
|
|
|
|
4.4 |
|
||
|
|
|
|
4.5 |
|
||
|
|
|
|
4.6 |
|
||
|
|
|
|
10.1 |
|
||
|
|
|
|
10.2 |
|
||
|
|
|
|
10.3 |
|
||
|
|
|
|
10.4 |
|
||
|
|
|
|
10.5 |
|
||
142
|
|
|
10.6 |
|
|
|
|
|
10.7 |
|
|
|
|
|
10.8 |
|
|
|
|
|
10.9 |
|
|
|
|
|
10.10 |
|
|
|
|
|
10.11 |
|
|
|
|
|
10.12 |
|
|
|
|
|
10.13 |
|
|
|
|
|
10.14 |
|
|
|
|
|
10.15 |
|
|
|
|
|
10.16 |
|
|
|
|
|
143
10.17 |
|
|
|
|
|
10.18 |
|
|
|
|
|
10.19 |
|
|
|
|
|
10.20 |
|
|
|
|
|
10.21 |
|
|
|
|
|
14.1 |
|
|
|
|
|
14.2 |
|
|
|
|
|
23.1* |
|
|
|
|
|
24.1* |
|
|
|
|
|
31.1* |
|
|
|
|
|
31.2* |
|
|
|
|
|
31.3* |
|
|
|
|
|
32.1* |
|
|
|
|
|
32.2* |
|
|
|
|
|
32.3* |
|
|
|
|
|
97.1* |
|
|
|
|
|
101.INS* |
|
Inline XBRL Instance Document - the instance document does not appear in the Interactive Data File because XBRL tags are embedded within the Inline XBRL document |
|
|
|
101.SCH* |
|
Inline XBRL Taxonomy Extension Schema With Embedded Linkbase Documents |
|
|
|
104* |
|
Cover Page Interactive Data File (embedded within the Inline XBRL document) |
* Filed herewith.
144
ITEM 16. FORM 10-K SUMMARY
None.
145
SIGNATURES
Pursuant to the requirements of Section 13 or 15(d) of the Securities Exchange Act of 1934, the registrant has duly caused this report to be signed on its behalf by the undersigned, thereunto duly authorized.
|
|
GOLDMAN SACHS BDC, INC. |
|
|
|
|
|
Date: February 28, 2024 |
|
|
/s/ Alex Chi |
|
|
|
Name: Alex Chi |
|
|
|
Title: Co-Chief Executive Officer and Co-President |
|
|
|
(Co-Principal Executive Officer) |
|
|
|
|
Date: February 28, 2024 |
|
|
/s/ David Miller |
|
|
|
Name: David Miller |
|
|
|
Title: Co-Chief Executive Officer and Co-President |
|
|
|
(Co-Principal Executive Officer) |
|
|
|
|
Each person whose signature appears below constitutes and appoints Alex Chi, David Miller, Stanley Matuszewski and Caroline Kraus, and each of them, such person’s true and lawful attorney-in-fact and agent, with full power of substitution and revocation, for such person and in such person’s name, place and stead, in any and all capacities, to sign one or more Annual Reports on Form 10-K for the fiscal year ended December 31, 2023, and any and all amendments thereto, and to file same with all exhibits thereto, and other documents in connection therewith, with the Securities and Exchange Commission, granting unto said attorneys-in-fact and agents, and each of them, full power and authority to do and perform each and every act and thing requisite and necessary to be done in connection therewith, as fully to all intents and purposes as such person might or could do in person, hereby ratifying and confirming all that said attorneys-in-fact and agents and each of them, or their or his substitute or substitutes, may lawfully do or cause to be done by virtue hereof.
Pursuant to the requirements of the Securities Exchange Act of 1934, this report has been signed below by the following persons on behalf of the registrant and in the capacities indicated on February 28, 2024.
Signature
|
Title
|
/s/ Alex Chi Alex Chi |
Co-Chief Executive Officer and Co-President (Co-Principal Executive Officer) |
|
|
|
|
/s/ David Miller |
Co-Chief Executive Officer and Co-President (Co-Principal Executive Officer) |
David Miller |
|
|
|
|
|
/s/ Stanley Matuszewski |
Chief Financial Officer and Treasurer (Principal Financial Officer) |
Stanley Matuszewski |
|
|
|
/s/ John Lanza |
Principal Accounting Officer |
John Lanza |
|
|
|
/s/ Timothy J. Leach |
Chairperson of the Board of Directors |
Timothy J. Leach |
|
|
|
/s/ Jaime Ardila Jaime Ardila |
Director |
|
|
|
|
/s/ Carlos E. Evans Carlos E. Evans |
Director |
|
|
|
|
/s/ Ross J. Kari Ross J. Kari |
Director |
|
|
/s/ Richard A. Mark Richard A. Mark |
Director |
|
|
/s/ Susan B. McGee Susan B. McGee |
Director |
|
|
/s/ Katherine Uniacke Katherine Uniacke |
Director |
146