UNITED STATES
SECURITIES AND EXCHANGE COMMISSION
WASHINGTON, DC 20549
________________________________________________
FORM 10-Q
________________________________________________
(Mark One)
| QUARTERLY REPORT PURSUANT TO SECTION 13 OR 15(d) OF THE SECURITIES EXCHANGE ACT OF 1934 | |||||
For the quarterly period ended March 31, 2024
OR
| TRANSITION REPORT PURSUANT TO SECTION 13 OR 15(d) OF THE SECURITIES EXCHANGE ACT OF 1934 | |||||
For the transition period from ______ to ______
Commission File Number: 001-38636
________________________________________________
(Exact Name of Registrant as Specified in its Charter)
________________________________________________
| (State or other jurisdiction of incorporation or organization) | (I.R.S. Employer Identification No.) | ||||
| (Address of principal executive offices) | (Zip Code) | ||||
+41 21 695 30 00
(Registrant’s telephone number, including area code)
Securities registered pursuant to Section 12(b) of the Act:
| Title of each class | Trading Symbol(s) | Name of each exchange on which registered | ||||||
Indicate by check mark whether the registrant (1) has filed all reports required to be filed by Section 13 or 15(d) of the Securities Exchange Act of 1934 during the preceding 12 months (or for such shorter period that the registrant was required to file such reports), and (2) has been subject to such filing requirements for the past 90 days. Yes ☒ No ☐
Indicate by check mark whether the registrant has submitted electronically every Interactive Data File required to be submitted pursuant to Rule 405 of Regulation S-T (§ 232.405 of this chapter) during the preceding 12 months (or for such shorter period that the registrant was required to submit such files). Yes ☒ No ☐
Indicate by check mark whether the registrant is a large accelerated filer, an accelerated filer, a non-accelerated filer, a smaller reporting company, or an emerging growth company. See the definitions of “large accelerated filer,” “accelerated filer,” “smaller reporting company,” and “emerging growth company” in Rule 12b-2 of the Exchange Act.
| ☒ | Accelerated filer | ☐ | ||||||||||||||||||
| Non-accelerated filer | ☐ | Smaller reporting company | ||||||||||||||||||
| Emerging growth company | ||||||||||||||||||||
If an emerging growth company, indicate by check mark if the registrant has elected not to use the extended transition period for complying with any new or revised financial accounting standards provided pursuant to Section 13(a) of the Exchange Act. ☐
Indicate by check mark whether the registrant is a shell company (as defined in Rule 12b-2 of the Exchange Act). Yes ☐ No ☒
Indicate by check mark whether the registrant has filed all documents and reports required to be filed by Sections 12, 13 or 15(d) of the Securities Exchange Act of 1934 subsequent to the distribution of securities under a plan confirmed by a court. Yes ☒ No ☐
As of April 19, 2024, the registrant had 225,990,207 shares of Common Stock, $0.001 par value per share, outstanding.
Table of Contents
| Page | ||||||||
1
PART I—FINANCIAL INFORMATION
Item 1. Financial Statements
GARRETT MOTION INC.
CONSOLIDATED INTERIM STATEMENTS OF OPERATIONS
(Unaudited)
Three Months Ended March 31, | |||||||||||
| 2024 | 2023 | ||||||||||
| (Dollars in millions, except per share amounts) | |||||||||||
Net sales (Note 3) | $ | $ | |||||||||
| Cost of goods sold | |||||||||||
| Gross profit | |||||||||||
| Selling, general and administrative expenses | |||||||||||
| Other expense, net | |||||||||||
| Interest expense | |||||||||||
| Non-operating income | ( | ( | |||||||||
| Income before taxes | |||||||||||
Tax expense (Note 5) | |||||||||||
| Net income | |||||||||||
Less: preferred stock dividends (Note 15) | ( | ||||||||||
| Net income available for distribution | $ | $ | |||||||||
Earnings per common share | |||||||||||
| Basic | $ | $ | |||||||||
| Diluted | |||||||||||
| Weighted average common shares outstanding | |||||||||||
| Basic | |||||||||||
| Diluted | |||||||||||
The Notes to the Consolidated Interim Financial Statements are an integral part of this statement.
2
GARRETT MOTION INC.
CONSOLIDATED INTERIM STATEMENTS OF COMPREHENSIVE INCOME
(Unaudited)
Three Months Ended March 31, | |||||||||||
| 2024 | 2023 | ||||||||||
| (Dollars in millions) | |||||||||||
| Net income | $ | $ | |||||||||
| Foreign exchange translation adjustment | |||||||||||
| Defined benefit pension plan adjustment, net of tax | |||||||||||
Changes in fair value of effective cash flow hedges, net of tax (Note 16) | ( | ||||||||||
Changes in fair value of net investment hedges, net of tax (Note 16) | ( | ||||||||||
| Total other comprehensive income (loss), net of tax | ( | ||||||||||
| Comprehensive income | $ | $ | |||||||||
The Notes to the Consolidated Interim Financial Statements are an integral part of this statement.
3
GARRETT MOTION INC.
CONSOLIDATED INTERIM BALANCE SHEETS
(Unaudited)
| March 31, 2024 | December 31, 2023 | ||||||||||
| (Dollars in millions) | |||||||||||
| ASSETS | |||||||||||
| Current assets: | |||||||||||
| Cash and cash equivalents | $ | $ | |||||||||
| Restricted cash | |||||||||||
Accounts, notes and other receivables – net (Note 6) | |||||||||||
Inventories – net (Note 8) | |||||||||||
| Other current assets | |||||||||||
| Total current assets | |||||||||||
| Investments and long-term receivables | |||||||||||
| Property, plant and equipment – net | |||||||||||
| Goodwill | |||||||||||
| Deferred income taxes | |||||||||||
Other assets (Note 9) | |||||||||||
| Total assets | $ | $ | |||||||||
| LIABILITIES | |||||||||||
| Current liabilities: | |||||||||||
| Accounts payable | $ | $ | |||||||||
Current maturities of long-term debt (Note 14) | |||||||||||
Accrued liabilities (Note 11) | |||||||||||
| Total current liabilities | |||||||||||
Long-term debt (Note 14) | |||||||||||
| Deferred income taxes | |||||||||||
Other liabilities (Note 12) | |||||||||||
| Total liabilities | $ | $ | |||||||||
COMMITMENTS AND CONTINGENCIES (Note 20) | |||||||||||
| EQUITY (DEFICIT) | |||||||||||
Common Stock, par value $ | |||||||||||
| Additional paid–in capital | |||||||||||
Retained deficit | ( | ( | |||||||||
Accumulated other comprehensive income (loss) (Note 17) | ( | ||||||||||
Treasury Stock, at cost; | ( | ||||||||||
| Total deficit | ( | ( | |||||||||
| Total liabilities and deficit | $ | $ | |||||||||
The Notes to the Consolidated Interim Financial Statements are an integral part of this statement.
4
GARRETT MOTION INC.
CONSOLIDATED INTERIM STATEMENTS OF CASH FLOWS
(Unaudited)
Three Months Ended March 31, | |||||||||||
| 2024 | 2023 | ||||||||||
| (Dollars in millions) | |||||||||||
| Cash flows from operating activities: | |||||||||||
Net income | $ | $ | |||||||||
Adjustments to reconcile net income to net cash provided by operating activities | |||||||||||
| Deferred income taxes | |||||||||||
| Depreciation | |||||||||||
| Amortization of deferred issuance costs | |||||||||||
| Foreign exchange loss (gain) | ( | ||||||||||
| Stock compensation expense | |||||||||||
| Unrealized (gain) loss on derivatives | ( | ||||||||||
| Other | |||||||||||
| Changes in assets and liabilities: | |||||||||||
| Accounts, notes and other receivables | ( | ||||||||||
| Inventories | ( | ( | |||||||||
| Other assets | ( | ( | |||||||||
| Accounts payable | |||||||||||
| Accrued liabilities | |||||||||||
| Other liabilities | ( | ||||||||||
Net cash provided by operating activities | $ | $ | |||||||||
| Cash flows from investing activities: | |||||||||||
| Expenditures for property, plant and equipment | ( | ( | |||||||||
Proceeds from cross-currency swap contracts | |||||||||||
Net cash used for investing activities | $ | ( | $ | ( | |||||||
| Cash flows from financing activities: | |||||||||||
| Payments of long-term debt | ( | ( | |||||||||
| Repurchases of Common Stock | ( | ||||||||||
| Payments for preference dividends | ( | ||||||||||
| Other | ( | ||||||||||
Net cash used for financing activities | $ | ( | $ | ( | |||||||
| Effect of foreign exchange rate changes on cash, cash equivalents and restricted cash | ( | ||||||||||
Net (decrease) increase in cash, cash equivalents and restricted cash | ( | ||||||||||
| Cash, cash equivalents and restricted cash at beginning of the period | |||||||||||
| Cash, cash equivalents and restricted cash at end of the period | $ | $ | |||||||||
| Supplemental cash flow disclosure: | |||||||||||
| Income taxes paid (net of refunds) | $ | $ | |||||||||
| Interest paid | |||||||||||
The Notes to the Consolidated Interim Financial Statements are an integral part of this statement
5
GARRETT MOTION INC.
CONSOLIDATED INTERIM STATEMENTS OF EQUITY (DEFICIT)
(Unaudited)
| Series A Preferred Stock | Common Stock | Treasury Stock | Additional Paid-in Capital | Retained Deficit | Accumulated Other Comprehensive (Loss)/Income | Total Deficit | ||||||||||||||||||||||||||||||||||||||||||||||||||
| Shares | Amount | Shares | Amount | Shares | Amount | |||||||||||||||||||||||||||||||||||||||||||||||||||
| (in millions) | ||||||||||||||||||||||||||||||||||||||||||||||||||||||||
Balance at December 31, 2023 | $ | $ | $ | $ | $ | ( | $ | ( | $ | ( | ||||||||||||||||||||||||||||||||||||||||||||||
| Net income | — | — | — | — | — | — | — | — | ||||||||||||||||||||||||||||||||||||||||||||||||
| Share repurchases | — | — | ( | — | ( | — | — | — | ( | |||||||||||||||||||||||||||||||||||||||||||||||
| Excise tax on share repurchases | — | — | — | — | — | ( | — | — | — | ( | ||||||||||||||||||||||||||||||||||||||||||||||
| Shares issued under stock plan, net of shares withheld for employee taxes | — | — | — | ( | — | — | — | ( | ||||||||||||||||||||||||||||||||||||||||||||||||
| Other comprehensive income, net of tax | — | — | — | — | — | — | — | — | ||||||||||||||||||||||||||||||||||||||||||||||||
| Stock-based compensation | — | — | — | — | — | — | — | — | ||||||||||||||||||||||||||||||||||||||||||||||||
| Balance at March 31, 2024 | $ | $ | $ | ( | $ | $ | ( | $ | $ | ( | ||||||||||||||||||||||||||||||||||||||||||||||
| Series A Preferred Stock | Common Stock | Treasury Stock | Additional Paid-in Capital | Retained Deficit | Accumulated Other Comprehensive Income | Total Deficit | ||||||||||||||||||||||||||||||||||||||||||||||||||
| Shares | Amount | Shares | Amount | Shares | Amount | |||||||||||||||||||||||||||||||||||||||||||||||||||
| (in millions) | ||||||||||||||||||||||||||||||||||||||||||||||||||||||||
Balance at December 31, 2022 | $ | $ | $ | $ | $ | ( | $ | $ | ( | |||||||||||||||||||||||||||||||||||||||||||||||
| Net income | — | — | — | — | — | — | — | — | ||||||||||||||||||||||||||||||||||||||||||||||||
| Other comprehensive loss, net of tax | — | — | — | — | — | — | — | — | ( | ( | ||||||||||||||||||||||||||||||||||||||||||||||
| Dividends | — | — | — | — | — | — | — | ( | — | ( | ||||||||||||||||||||||||||||||||||||||||||||||
| Stock-based compensation | — | — | — | — | — | — | — | — | ||||||||||||||||||||||||||||||||||||||||||||||||
Balance at March 31, 2023 | $ | $ | $ | $ | $ | ( | $ | $ | ( | |||||||||||||||||||||||||||||||||||||||||||||||
The Notes to the Consolidated Interim Financial Statements are an integral part of this statement.
6
GARRETT MOTION INC.
NOTES TO CONSOLIDATED INTERIM FINANCIAL STATEMENTS
(Unaudited)
(Dollars in millions, except per share amounts)
Note 1. Background and Basis of Presentation
Background
Garrett Motion Inc. (the “Company” or “Garrett”), is a cutting-edge technology leader delivering differentiated solutions for emission reduction and energy efficiency. We design, manufacture, and sell highly engineered turbocharging, air and fluid compression, and high-speed electric motor technologies to original equipment manufacturers (“OEMs”) and distributors within the mobility and industrial space. We have significant expertise in delivering products at scale for internal combustion engines using gasoline, diesel, natural gas, and hydrogen, as well as for zero emission technologies using hydrogen fuel cell systems, both for mobility and industrial use. As our customers continue to progress on electrification, we are applying our technological pillars to develop highly engineered E-Powertrain and E-Cooling compressor products to support their ambition. These products are key enablers for fuel economy, energy efficiency, thermal management, and compliance with emissions standards and overall greenhouse gas and other emission reduction targets.
Basis of Presentation
The accompanying unaudited Consolidated Interim Financial Statements have been prepared in accordance with the rules and regulations of the Securities and Exchange Commission applicable to interim financial statements. While these statements reflect all normal recurring adjustments that are, in the opinion of management, necessary for fair presentation of the results of the interim period, they do not include all of the information and footnotes required by United States generally accepted accounting principles (“GAAP”) for complete financial statements. The unaudited Consolidated Interim Financial Statements should therefore be read in conjunction with the Consolidated Financial Statements and accompanying notes for the year ended December 31, 2023 included in our Annual Report on Form 10-K, as filed with the Securities and Exchange Commission on February 15, 2024 (our “2023 Form 10-K”). The results of operations and cash flows for the three months ended March 31, 2024 should not necessarily be taken as indicative of the entire year. All amounts presented are in millions, except per share amounts.
We report our quarterly financial information using a calendar convention: the first, second and third quarters are consistently reported as ending on March 31, June 30 and September 30. It has been our practice to establish actual quarterly closing dates using a predetermined fiscal calendar, which requires our businesses to close their books on a Saturday to minimize the potentially disruptive effects of quarterly closing on our business processes. For differences in actual closing dates that are material to year-over-year comparisons of quarterly or year-to-date results, such differences have been adjusted for the three months ended March 31, 2024. Our actual closing dates for the three months ended March 31, 2024 and 2023 were March 30, 2024 and April 1, 2023, respectively.
We evaluate segment reporting in accordance with ASC 280, Segment Reporting. We concluded that Garrett operates in a single operating segment and a single reportable segment based on the operating results available and evaluated regularly by the chief operating decision maker (“CODM”), which is our Chief Executive Officer, to make decisions about resource allocation and performance assessment. The CODM makes operational performance assessments and resource allocation decisions on a consolidated basis, inclusive of all of the Company’s products across channels and geographies.
The preparation of the financial statements in conformity with GAAP requires management to make estimates that affect the reported amounts of assets and liabilities and disclosure of contingent assets and liabilities at the date of the financial statements and the reported amounts of revenues and expenses during the reporting period. Management bases these estimates on assumptions that it believes to be reasonable under the circumstances. Actual results could differ from the original estimates, requiring adjustments to these balances in future periods.
Note 2. Summary of Significant Accounting Policies
The accounting policies of the Company are set forth in Note 3 to the Consolidated Financial Statements for the year ended December 31, 2023 included in our 2023 Form 10-K.
7
Accounting Standards Issued But Not Yet Adopted
In November 2023, the Financial Accounting Standards Board ("FASB") issued accounting standards update ("ASU") 2023-07, Segment Reporting (Topic 280): Improvements to Reportable Segment Disclosures. The amendments in this update require companies with a single reportable segment to provide all existing segment disclosures, as well as requires incremental segment information to be disclosed. The guidance is effective for fiscal years beginning after December 15, 2023 on a retrospective basis, and interim periods within fiscal years beginning after December 15, 2024. The Company is currently evaluating the guidance to determine the impact on its disclosures.
In December 2023, the FASB issued ASU 2023-09, Income Taxes (Topic 740): Improvements to Income Tax Disclosures. The amendments in this update increase the transparency around income tax information through improvements to disclosures primarily related to the rate reconciliation and income taxes paid information. The guidance is effective for fiscal years beginning after December 15, 2024 on a prospective basis. Early adoption is permitted. The Company is currently evaluating the guidance to determine the impact on its disclosures.
There are no other recently issued, but not yet adopted, accounting pronouncements which are expected to have a material impact on the Company's Consolidated Interim Financial Statements and related disclosures.
Note 3. Revenue Recognition and Contracts with Customers
Disaggregated Revenue
Net sales by region (determined based on country of shipment) and channel are as follows:
Three Months Ended March 31, 2024 | Three Months Ended March 31, 2023 | ||||||||||||||||||||||||||||||||||||||||||||||
| OEM | Aftermarket | Other | Total | OEM | Aftermarket | Other | Total | ||||||||||||||||||||||||||||||||||||||||
| (Dollars in millions) | |||||||||||||||||||||||||||||||||||||||||||||||
| United States | $ | $ | $ | $ | $ | $ | $ | $ | |||||||||||||||||||||||||||||||||||||||
| Europe | |||||||||||||||||||||||||||||||||||||||||||||||
| Asia | |||||||||||||||||||||||||||||||||||||||||||||||
| Other | |||||||||||||||||||||||||||||||||||||||||||||||
| $ | $ | $ | $ | $ | $ | $ | $ | ||||||||||||||||||||||||||||||||||||||||
Contract Balances
The following table summarizes our contract assets and liabilities balances:
| 2024 | 2023 | ||||||||||
| (Dollars in millions) | |||||||||||
| Contract assets—January 1 | $ | $ | |||||||||
Contract assets—March 31 | |||||||||||
| Change in contract assets—Increase/(Decrease) | $ | $ | |||||||||
| Contract liabilities—January 1 | $ | ( | $ | ( | |||||||
Contract liabilities—March 31 | ( | ( | |||||||||
| Change in contract liabilities—Decrease/(Increase) | $ | $ | ( | ||||||||
Note 4. Research, Development & Engineering
Garrett conducts research, development and engineering (“RD&E”) activities, which consist primarily of the development of new products and product applications. RD&E costs are charged to expense as incurred unless the Company has a contractual guarantee for reimbursement from the customer. Customer reimbursements are netted against gross RD&E expenditures as they are considered a recovery of cost. Such costs are included in Cost of goods sold as follows:
8
Three Months Ended March 31, | |||||||||||
| 2024 | 2023 | ||||||||||
| (Dollars in millions) | |||||||||||
| Research and development costs | $ | $ | |||||||||
Engineering-related expenses, net of customer (reimbursements) (1) | ( | ||||||||||
| $ | $ | ||||||||||
(1) Engineering-related expenses include customer reimbursements of $8 million and $11 million for the three months ended March 31, 2024 and 2023, respectively.
Note 5. Income Taxes
Three Months Ended March 31, | |||||||||||
| 2024 | 2023 | ||||||||||
| (Dollars in millions) | |||||||||||
| Tax expense | $ | $ | |||||||||
| Effective tax rate | % | % | |||||||||
The effective tax rates for the three months ended March 31, 2024 and 2023 were 18.5 % and 25.0 %, respectively. The change in the effective tax rate for the three months ended March 31, 2024 compared to the prior period is primarily related to reversal of tax reserves and lower U.S. taxes on international operations, partially offset by increased withholding taxes.
Note 6. Accounts, Notes and Other Receivables—Net
| March 31, 2024 | December 31, 2023 | ||||||||||
(Dollars in millions) | |||||||||||
Trade receivables | $ | $ | |||||||||
Notes receivable | |||||||||||
Other receivables | |||||||||||
Less—Allowance for expected credit losses | ( | ( | |||||||||
| $ | $ | ||||||||||
Trade receivables include $48 million and $38 million of unbilled customer contract asset balances as of March 31, 2024 and December 31, 2023, respectively. These amounts are billed in accordance with the terms of customer contracts to which they relate. See Note 3, Revenue Recognition and Contracts with Customers.
Notes receivable is related to guaranteed bank notes without recourse that the Company receives in settlement of accounts receivables, primarily in the Asia Pacific region. See Note 7, Factoring and Notes Receivable for further information.
9
Note 7. Factoring and Notes Receivable
The Company enters into arrangements with financial institutions to sell eligible trade receivables. The receivables are sold without recourse and the Company accounts for these arrangements as true sales. The Company also receives guaranteed bank notes without recourse, in settlement of accounts receivables, primarily in the Asia Pacific region. The Company can hold the bank notes until maturity, exchange them with suppliers to settle liabilities, or sell them to third-party financial institutions in exchange for cash. Bank notes sold to third-party financial institutions without recourse are likewise accounted for as true sales.
| Three Months Ended March 31, | |||||||||||
| 2024 | 2023 | ||||||||||
| (Dollars in millions) | |||||||||||
| Eligible receivables sold without recourse | $ | $ | |||||||||
| Guaranteed bank notes sold without recourse | |||||||||||
The expenses related to the sale of trade receivables and guaranteed bank notes are recognized within Other expense, net in the Consolidated Interim Statements of Operations, and were immaterial for the three months ended March 31, 2024 and 2023.
| March 31, 2024 | December 31, 2023 | ||||||||||
| (Dollars in millions) | |||||||||||
| Receivables sold but not yet collected by the bank from the customer | $ | $ | |||||||||
| Guaranteed bank notes sold but not yet collected by the bank from the customer | |||||||||||
As of March 31, 2024 and December 31, 2023, the Company had no guaranteed bank notes pledged as collateral.
Note 8. Inventories—Net
| March 31, 2024 | December 31, 2023 | ||||||||||
| (Dollars in millions) | |||||||||||
| Raw materials | $ | $ | |||||||||
| Work in process | |||||||||||
| Finished products | |||||||||||
| Less—Reserves | ( | ( | |||||||||
| $ | $ | ||||||||||
10
Note 9. Other Assets
| March 31, 2024 | December 31, 2023 | ||||||||||
| (Dollars in millions) | |||||||||||
| Advanced discounts to customers, non-current | $ | $ | |||||||||
(Note 13) | |||||||||||
| Income tax receivable | |||||||||||
| Pension and other employee related | |||||||||||
| Derivatives designated as net investment hedges | |||||||||||
| Designated and undesignated derivatives | |||||||||||
| Other | |||||||||||
| $ | $ | ||||||||||
Note 10. Supplier Financing
The Company has supplier financing arrangements with two third-party financial institutions under which certain suppliers may factor their receivables from Garrett. The Company also enters into arrangements with banking institutions to issue bankers acceptance drafts in settlement of accounts payables, primarily in the Asia Pacific region. The bankers acceptance drafts, or guaranteed bank notes, have a contractual maturity of six months or less, and may be held by suppliers until maturity, transferred to their suppliers, or discounted with financial institutions in exchange for cash. The supplier financing obligations and guaranteed bank notes outstanding are recorded within Accounts payable in our Consolidated Interim Balance Sheet.
| March 31, 2024 | December 31, 2023 | ||||||||||
| (Dollars in millions) | |||||||||||
| Supplier financing obligations outstanding with financial institutions | $ | $ | |||||||||
| Guaranteed bank notes outstanding | |||||||||||
Note 11. Accrued Liabilities
| March 31, 2024 | December 31, 2023 | ||||||||||
| (Dollars in millions) | |||||||||||
| Customer pricing reserve | $ | $ | |||||||||
| Compensation, benefit and other employee related | |||||||||||
| Repositioning | |||||||||||
Product warranties and performance guarantees - short-term (Note 20) | |||||||||||
| Income and other taxes | |||||||||||
Customer advances and deferred income (1) | |||||||||||
| Accrued interest | |||||||||||
(Note 13) | |||||||||||
| Accrued freight | |||||||||||
| Designated and undesignated derivatives | |||||||||||
Other (primarily operating expenses) (2) | |||||||||||
(1)Customer advances and deferred income include $10 million and $9 million of contract liabilities as of March 31, 2024 and December 31, 2023, respectively. See Note 3, Revenue Recognition and Contracts with Customers.
11
(2)Includes $3 million and $5 million of environmental liabilities as of March 31, 2024 and December 31, 2023, respectively.
The Company accrues repositioning costs related to projects to optimize its product costs and right-size our organizational structure. Expenses related to the repositioning accruals are included in Cost of goods sold and Selling, general and administrative expenses in our Consolidated Interim Statements of Operations.
| Severance Costs | Other Costs | Total | |||||||||||||||
| (Dollars in millions) | |||||||||||||||||
Balance at December 31, 2023 | $ | $ | $ | ||||||||||||||
| Charges | |||||||||||||||||
| Usage—cash | ( | ( | |||||||||||||||
Balance at March 31, 2024 | $ | $ | $ | ||||||||||||||
| Severance Costs | Other Costs | Total | |||||||||||||||
| (Dollars in millions) | |||||||||||||||||
Balance at December 31, 2022 | $ | $ | $ | ||||||||||||||
| Charges | |||||||||||||||||
| Usage—cash | ( | ( | |||||||||||||||
| Non-cash asset write-offs | ( | ( | |||||||||||||||
Balance at March 31, 2023 | $ | $ | $ | ||||||||||||||
Note 12. Other Liabilities
| March 31, 2024 | December 31, 2023 | ||||||||||
| (Dollars in millions) | |||||||||||
| Income taxes | $ | $ | |||||||||
| Designated and undesignated derivatives | |||||||||||
| Pension and other employee related | |||||||||||
(Note 13) | |||||||||||
| Advanced discounts from suppliers | |||||||||||
Product warranties and performance guarantees – long-term (Note 20) | |||||||||||
| Environmental remediation – long term | |||||||||||
| Long-term accounts payable | |||||||||||
| Other | |||||||||||
Note 13. Leases
We have operating leases that primarily consist of real estate, machinery and equipment. Our leases have remaining lease terms of up to 15 years, some of which include options to extend the leases for up to two years , and some of which include options to terminate the leases within the year.
The components of lease expense are as follows:
Three Months Ended March 31, | |||||||||||
| 2024 | 2023 | ||||||||||
| (Dollars in millions) | |||||||||||
| Operating lease cost | $ | $ | |||||||||
12
Supplemental cash flow information related to operating leases is as follows:
Three Months Ended March 31, | |||||||||||
| 2024 | 2023 | ||||||||||
| (Dollars in millions) | |||||||||||
Cash paid for amounts included in the measurement of lease liabilities: | |||||||||||
Operating cash outflows from operating leases | $ | $ | |||||||||
Right-of-use assets obtained in exchange for lease obligations: | |||||||||||
| Operating leases | |||||||||||
Supplemental balance sheet information related to operating leases is as follows:
| March 31, 2024 | December 31, 2023 | ||||||||||
| (Dollars in millions) | |||||||||||
| $ | $ | ||||||||||
| March 31, 2024 | December 31, 2023 | ||||||||||
| Weighted-average remaining lease term (in years) | |||||||||||
| Weighted-average discount rate | % | % | |||||||||
Maturities of operating lease liabilities as of March 31, 2024 were as follows:
| (Dollars in millions) | |||||
| 2024 | $ | ||||
| 2025 | |||||
| 2026 | |||||
| 2027 | |||||
| 2028 | |||||
| Thereafter | |||||
| Total lease payments | |||||
| Less imputed interest | ( | ||||
| $ | |||||
Note 14. Long-term Debt and Credit Agreements
Long Term Debt
On April 30, 2021, the Company entered into a credit agreement (as amended from time to time, the "Credit Agreement") with JPMorgan Chase Bank, N.A. as administrative agent. The Credit Agreement provides for the following long-term senior secured financing (collectively, the "Term Loan Facilities"):
•2021 Dollar Term Facility: a seven-year secured first-lien U.S. Dollar term loan facility for $715 million;
•2023 Dollar Term Facility: a five-year secured first-lien U.S. Dollar term loan facility for $500 million; and
•Euro Term Facility: a seven-year secured first-lien Euro term loan facility for €450 million.
13
The principal outstanding and carrying amounts of our long-term debt as of March 31, 2024 and December 31, 2023 are as follows:
| Due | Interest Rate | March 31, 2024 | December 31, 2023 | ||||||||||||||||||||
| 2021 Dollar Term Facility | 4/30/2028 | SOFR plus | $ | $ | |||||||||||||||||||
| 2023 Dollar Term Facility | 4/30/2028 | SOFR plus | |||||||||||||||||||||
| Euro Term Facility | 4/30/2028 | EURIBOR plus | |||||||||||||||||||||
| Other | |||||||||||||||||||||||
| Total principal outstanding | |||||||||||||||||||||||
| Less: unamortized deferred financing costs | ( | ( | |||||||||||||||||||||
| Less: current portion of long-term debt | ( | ( | |||||||||||||||||||||
| Total long-term debt | $ | $ | |||||||||||||||||||||
Revolving Facility and Letters of Credit
The Credit Agreement also provides for a senior secured first-lien revolving credit facility providing for multi-currency revolving loans (the “Revolving Facility”). The Revolving Facility matures on April 30, 2028 and has a maximum borrowing amount available of $570 million.
Under the Revolving Facility, the Company may use up to $125 million for the issuance of letters of credit to its subsidiaries. Letters of credit are available for issuance under the Credit Agreement on terms and conditions customary for financings of this kind, which issuances reduce availability under the Revolving Facility. As of March 31, 2024, the Company had no loans outstanding under the Revolving Facility, no outstanding letters of credit, and available borrowing capacity of $570 million.
Separate from the Revolving Facility, the Company has a bilateral letter of credit facility in the amount of $15 million, which matures on April 30, 2026. As of March 31, 2024, the Company had $12 million utilized and $3 million of remaining available capacity under such facility.
Interest Rate and Fees
The 2021 Dollar Term Facility is subject to an interest rate, at our option, of either (a) an alternate base rate (“ABR”) (which shall not be less than 1.50 %) or (b) an adjusted SOFR rate (“SOFR”) (which shall not be less than 0.50 %), in each case, plus an applicable margin equal to 3.51 % in the case of SOFR loans and 2.25 % in the case of ABR loans. The Euro Term Facility is subject to an interest rate equal to an adjusted EURIBOR rate (which shall not be less than zero ) plus an applicable margin equal to 3.50 %. Interest payments with respect to the 2021 Dollar and Euro Term Facilities are required either on a quarterly basis (for ABR loans) or at the end of each interest period (for SOFR and EURIBOR loans) or, if the duration of the applicable interest period exceeds three months, then every three months .
The 2023 Dollar Term Facility will bear interest, at the Term Borrowers’ election, at a rate per annum equal to (i) SOFR (subject to a 0.50 % floor) plus the applicable margin or (ii) the base rate plus the applicable margin. The applicable margin for loans under the 2023 Dollar Term Facility is 4.50 % for SOFR loans and 3.50 % for base rate loans.
The Revolving Facility is subject to an interest rate comprised of an applicable benchmark rate as provided under the Credit Agreement (which shall not be less than 1.00 % if such benchmark is the ABR rate and not less than 0.00 % in the case of other applicable benchmark rates) that is selected based on the currency in which borrowings are outstanding thereunder, in each case, plus an applicable margin, that may vary based on our leverage ratio.
In addition to paying interest on outstanding borrowings under the Revolving Facility, we are also required to pay a quarterly commitment fee based on the average daily unused portion of the Revolving Facility during such quarter, which is determined by our leverage ratio and ranges from 0.25 % to 0.50 % per annum.
Prepayments
The Credit Agreement contains certain mandatory prepayment provisions in the event that we incur certain types of indebtedness, receive net cash proceeds from certain non-ordinary course asset sales or other dispositions of property, or have excess cash flow (calculated on an annual basis with the required prepayment equal to 50 %, 25 % or 0 % of such
14
excess cash flow, subject to compliance with certain leverage ratios), in each case subject to terms and conditions customary for financings of this kind.
Certain Covenants
The Credit Agreement contains certain affirmative and negative covenants customary for financings of this type. The Revolving Facility also contains a financial covenant requiring the maintenance of a consolidated total leverage ratio of not greater than 4.7 times as of the end of each fiscal quarter if, on the last day of any such fiscal quarter, the aggregate amount of loans and letters of credit (excluding backstopped or cash collateralized letters of credit and other letters of credit with an aggregate face amount not exceeding $30 million) outstanding under the Revolving Facility exceeds 35 % of the aggregate commitments in effect thereunder on such date. As of March 31, 2024, the Company was in compliance with all covenants.
Note 15. Equity
Preferred Stock
On April 12, 2023 the Company entered into separate definitive agreements with each of Centerbridge Partners, L.P. and funds managed by Oaktree Capital Management, L.P. to effect a series of integrated transactions (collectively the “Transaction”) designed to increase the attractiveness of the Company to investors, including by simplifying the Company’s capital structure by converting all outstanding Series A Preferred Stock into a single class of Common Stock, subject to certain conditions.
On June 6, 2023, the Company completed all steps of the Transaction and with no remaining shares of Series A Preferred Stock outstanding as of the date. Please refer to Note 21, Equity, to the Consolidated Financial Statements for the year ended December 31, 2023 included in our 2023 Form 10-K.
Treasury Stock
Treasury stock represents shares of the Company's Common Stock that have been issued and subsequently repurchased by the Company or withheld to satisfy withholding tax obligations in connection with equity award vestings, and that have not been retired or cancelled. The Company accounts for treasury stock under the cost method and includes treasury stock as a component of Equity (Deficit) on the Consolidated Interim Balance Sheet. The Company accounts for the reissuance of treasury stock using the average cost method. The Company did not reissue or retire any shares of treasury stock during the three months ended March 31, 2024.
Share Repurchase Program
Note 16. Financial Instruments and Fair Value Measures
Our credit, market and foreign currency risk management policies are described in Note 19, Financial Instruments and Fair Value Measures, to the Consolidated Financial Statements for the year ended December 31, 2023 included in our 2023 Form 10-K. As of March 31, 2024 and December 31, 2023, we had contracts with aggregate gross notional amounts of $969 million and $1,171 million, respectively, to hedge foreign currencies, principally the U.S. Dollar, Swiss Franc, British Pound, Euro, Chinese Yuan, Japanese Yen, Mexican Peso, New Romanian Leu, Czech Koruna, Australian Dollar and Korean Won.
Fair Value of Financial Instruments
The FASB’s accounting guidance defines fair value as the price that would be received to sell an asset or paid to transfer a liability in an orderly transaction between market participants at the measurement date (exit price). Financial and
15
nonfinancial assets and liabilities are classified in their entirety based on the lowest level of input that is significant to the fair value measurement. The following table sets forth the Company’s financial assets and liabilities that were accounted for at fair value on a recurring basis as of March 31, 2024 and December 31, 2023:
| Fair Value | ||||||||||||||||||||||||||||||||||||||
| Notional Amounts | Assets | Liabilities | ||||||||||||||||||||||||||||||||||||
| March 31, 2024 | December 31, 2023 | March 31, 2024 | December 31, 2023 | March 31, 2024 | December 31, 2023 | |||||||||||||||||||||||||||||||||
| Designated instruments: | ||||||||||||||||||||||||||||||||||||||
| Designated forward currency exchange contracts | $ | $ | $ | $ | (a) | $ | $ | (c) | ||||||||||||||||||||||||||||||
| Designated cross-currency swaps | (b) | (d) | ||||||||||||||||||||||||||||||||||||
| Designated interest-rate swaps | ||||||||||||||||||||||||||||||||||||||
| Total designated instruments | ||||||||||||||||||||||||||||||||||||||
| Undesignated instruments: | ||||||||||||||||||||||||||||||||||||||
| Undesignated interest rate swaps | (b) | (d) | ||||||||||||||||||||||||||||||||||||
| Undesignated forward currency exchange contracts | (a) | (c) | ||||||||||||||||||||||||||||||||||||
| Total undesignated instruments | ||||||||||||||||||||||||||||||||||||||
| Total designated and undesignated instruments | $ | $ | $ | $ | $ | $ | ||||||||||||||||||||||||||||||||
(a) Recorded within Other current assets
(b) Recorded within Other assets
(c) Recorded within Accrued liabilities
(d) Recorded within Other liabilities
Cash Flow Hedges
During 2023, the Company entered into float-to-fixed interest rate swap contracts with an aggregate notional amount of $200 million and maturities in July 2024 and October 2024. Changes in the fair value of the interest rate swap contracts are recorded in Accumulated Other Comprehensive Income ("AOCI") and will be reclassified to Interest expense in the Consolidated Interim Statement of Operations upon maturity.
The Company also has outstanding forward currency exchange contracts with maturities up to 18 months and an aggregate notional amount of $419 million and $456 million as of March 31, 2024 and December 31, 2023, respectively. These forward currency exchange contracts have been designated as cash flow hedges to mitigate foreign currency exposures primarily on our inventory purchases and manufacturing costs. The gains and losses on the forward currency exchange contracts are recorded in AOCI and reclassified to Cost of goods sold in the Consolidated Interim Statement of Operations when the underlying transactions are recognized in earnings.
In order to mitigate interest rate and foreign currency risk on its 2023 Dollar Term Facility, the Company has an outstanding float-to-fixed cross-currency swap contract comprised of an amortizing swap with an aggregate notional amount of €280 million ($300 million) and notional exchanges in June 2026, June 2027 and June 2028. Changes in the fair value of the cross-currency swap contract are recognized in AOCI and reclassified to Non-operating income in the Consolidated Statement of Operations, based upon changes in the spot rate remeasurement of the underlying debt. The net interest settlements on the cross-currency swap contract are recorded in Interest expense in the Consolidated Interim Statements of Operations.
All of the Company's cash flow hedges are assessed as highly effective. For the three months ended March 31, 2024 and 2023, the Company recorded a gain of $3 million, net of tax, and a loss of $3 million, net of tax, respectively, in Other comprehensive income.
Net Investment Hedges
16
The Company has designated float-to-float cross-currency swaps with an aggregate notional amount of €615 million ($715 million) as net investment hedges of its Euro-denominated operations. The fair values of the net investment hedges were net assets of $56 million and $37 million as of March 31, 2024 and December 31, 2023, respectively. Our Consolidated Interim Statements of Comprehensive Income include Changes in fair value of net investment hedges, net of tax, of a $19 million gain and a $5 million loss for the three months ended March 31, 2024 and 2023, respectively. No ineffectiveness has been recorded on the net investment hedges.
Non-Designated Derivatives
As of March 31, 2024 and December 31, 2023, the Company has outstanding float-to-fixed interest rate swap contracts with an aggregate notional amount of €830 895 million and $917 million, respectively) and maturities of April 2024, July 2024, October 2024, April 2025, April 2026, April 2027 and April 2028. Changes in the fair value of the undesignated interest rate swap contracts are recorded in Interest expense in the Consolidated Interim Statements of Operations.
The Company also has outstanding forward currency exchange contracts with maturities generally up to 3 months and an aggregate notional amount of $550 million and $715 million as of March 31, 2024 and December 31, 2023, respectively. These derivatives are not designated as hedging instruments and are adjusted to fair value through Non-operating income in the Consolidated Interim Statements of Operations.
Fair Value Measurement
The foreign currency exchange, interest rate swap and cross-currency swap contracts are valued using market observable inputs. As such, these derivative instruments are classified within Level 2. The assumptions used in measuring the fair value of the cross-currency swap are considered Level 2 inputs, which are based upon market-observable interest rate curves, cross-currency basis curves, credit default swap curves, and foreign exchange rates.
The carrying value of Cash, cash equivalents and restricted cash, Account receivables and Notes and Other receivables contained in the Consolidated Interim Balance Sheet approximates fair value.
The following table sets forth the Company’s financial assets and liabilities that were not carried at fair value:
March 31, 2024 | December 31, 2023 | ||||||||||||||||||||||
| Carrying Value | Fair Value | Carrying Value | Fair Value | ||||||||||||||||||||
| (Dollars in millions) | |||||||||||||||||||||||
Term Loan Facilities | $ | $ | $ | $ | |||||||||||||||||||
The Company determined the fair value of certain of its long-term debt and related current maturities utilizing transactions in the listed markets for similar liabilities. As such, the fair value of the long-term debt and related current maturities is considered Level 2.
17
Note 17. Accumulated Other Comprehensive Income
The changes in AOCI by component are set forth below:
| Three Months Ended March 31, | |||||||||||
| 2024 | 2023 | ||||||||||
| (Dollars in millions) | |||||||||||
| Foreign Exchange Translation Adjustment | |||||||||||
| Balance at beginning of period | $ | ( | $ | ( | |||||||
| Other comprehensive income (loss) before reclassifications | |||||||||||
| Balance at end of period | ( | ( | |||||||||
| Pension Adjustments | |||||||||||
| Balance at beginning of period | ( | ( | |||||||||
Other comprehensive income (loss) before reclassifications (1) | |||||||||||
| Balance at end of period | ( | ( | |||||||||
| Changes in Fair Value of Effective Cash Flow Hedges | |||||||||||
| Balance at beginning of period | ( | ||||||||||
Other comprehensive income (loss) before reclassifications (2) | |||||||||||
| Amounts reclassified from AOCI, net | ( | ( | |||||||||
| Balance at end of period | |||||||||||
| Changes in Fair Value of Net Investment Hedges | |||||||||||
| Balance at beginning of period | |||||||||||
Other comprehensive income (loss) before reclassifications, net (3) | ( | ||||||||||
| Balance at end of period | |||||||||||
| Accumulated other comprehensive income, end of period | $ | $ | |||||||||
(1) There were no income tax effects for the three months ended March 31, 2024.
(2) Net of tax expense (benefit) of $4 million and $0 million for the three months ended March 31, 2024 and 2023, respectively.
(3) Net of tax expense (benefit) of $4 million and $(3 ) million for the three months ended March 31, 2024 and 2023, respectively.
Reclassifications from AOCI to income were as follows:
| Three Months Ended March 31, | |||||||||||
| 2024 | 2023 | ||||||||||
| (Dollars in millions) | |||||||||||
| Changes in Fair Value of Effective Cash Flow Hedges | |||||||||||
| Reclassification forward currency exchange contracts to Cost of goods sold | $ | ( | $ | ( | |||||||
| Reclassification cross-currency swaps to Interest expense | ( | ||||||||||
| Reclassification cross-currency swaps to Non-operating income | ( | ||||||||||
| Tax effect on reclassification to income | |||||||||||
| Amounts reclassified from AOCI, net | $ | ( | $ | ( | |||||||
18
Note 18. Earnings Per Share
For the three months ended March 31, 2024, basic earnings per share ("EPS") is computed using the weighted-average number of common shares outstanding during the period.
For the three months ended March 31, 2023, basic earnings per share was calculated using the two-class method as our Series A Preferred Stock, which was considered a participating security prior to its conversion into Common Stock and cancellation pursuant to the Transaction. The two-class method requires an allocation of earnings to all securities that participate in dividends with common shares, such as our Series A Preferred Stock, to the extent that each security may share in the entity’s earnings. Basic earnings per share are then calculated by dividing undistributed earnings allocated to common stock by the weighted average number of common shares outstanding for the period.
Diluted earnings per share for the three months ended March 31, 2024 is calculated based on the weighted-average number of common shares outstanding for the period plus the dilutive effect of common stock equivalents using the treasury stock method. Diluted earnings per share for the three months ended March 31, 2023 is calculated using the more dilutive of the two-class or if-converted methods. The two-class method uses net income available to common shareholders and assumes conversion of all potential shares other than the participating securities. The if-converted method uses net income and assumes conversion of all potential shares including the participating securities.
The details of the EPS calculations for the three months ended March 31, 2024 and 2023 are as follows:
| Three Months Ended March 31, | |||||||||||
| 2024 | 2023 | ||||||||||
| (Dollars in millions except per share) | |||||||||||
Basic earnings per share: | |||||||||||
| Net income | $ | $ | |||||||||
| Less: preferred stock dividend | ( | ||||||||||
Net income available for distribution | |||||||||||
| Less: earnings allocated to participating securities | ( | ||||||||||
Net income available to common shareholders | $ | $ | |||||||||
| Weighted average common shares outstanding - Basic | |||||||||||
| EPS – Basic | $ | $ | |||||||||
Diluted earnings per share: | |||||||||||
Method used: | Two-class | ||||||||||
| Weighted average common shares outstanding - Basic | |||||||||||
Dilutive effect of unvested RSUs and other contingently issuable shares | |||||||||||
| Weighted average common shares outstanding – Diluted | |||||||||||
| EPS – Diluted | $ | $ | |||||||||
Note 19. Related Party Transactions
We contract with Trane Technologies ("Trane") for the occasional purchase of goods and services. Trane is considered a related party as Mr. Paul Camuti, a director on our Board of Directors since February 9, 2024, serves as an executive officer of Trane. Our payments under the agreements with Trane for the three months ended March 31, 2024, as well as any liabilities due to Trane as of March 31, 2024, were immaterial. For the three months ended March 31, 2023, Trane was not considered a related party.
19
Note 20. Commitments and Contingencies
Securities Litigation
In 2020, various securities class action complaints were filed against Garrett Motion Inc. and certain current and former Garrett officers and directors in the United States District Court for the Southern District of New York asserting claims under Section 10(b) and 20(a) of the Securities Exchange Act of 1934, as amended, for alleged securities fraud and control person liability. In March 2022, the trial court dismissed with prejudice the claims against certain of the defendants, and in March 2023, the trial court dismissed with prejudice all remaining claims. In April 2023, the plaintiffs appealed the trial court’s decision to the United States Court of Appeals for the Second Circuit, and in April 2024 the Second Circuit affirmed dismissal of the claims. Management did not believe an adverse outcome in this matter was probable, and therefore no accrual has been recorded.
Brazilian Tax Matter
In September 2020, the Brazilian tax authorities issued an infraction notice against Garrett Motion Industria Automotiva Brasil Ltda, challenging the use of certain tax credits (“Befiex Credits”) between January 2017 and February 2020. The infraction notice results in a loss contingency that may or may not ultimately be incurred by the Company. The estimated total amount of the contingency as of March 31, 2024 was $39 million including penalties and interest. The Company believes, based on management’s assessment and the advice of external legal counsel, that it has meritorious arguments in connection with the infraction notice and any liability for the infraction notice is currently not probable. Accordingly, no accrual is required at this time.
Warranties and Guarantees
In the normal course of business, we issue product warranties and product performance guarantees. We accrue for the estimated cost of product warranties and performance guarantees based on contract terms and historical experience at the time of sale to the customer. Adjustments to initial obligations for warranties and guarantees are made as changes to the obligations become reasonably estimable. Product warranties and product performance guarantees are included in Accrued liabilities and Other liabilities. The following table summarizes information concerning our recorded obligations for product warranties and product performance guarantees.
| Three Months Ended March 31, | |||||||||||
| 2024 | 2023 | ||||||||||
(Dollars in millions) | |||||||||||
| Warranty and product performance guarantees at beginning of period | $ | $ | |||||||||
Accruals for warranties/guarantees issued during the period | |||||||||||
Settlement of warranty/guarantee claims | ( | ( | |||||||||
| Foreign currency translation | ( | ||||||||||
Warranty and product performance guarantees at end of period | $ | $ | |||||||||
Other Commitments and Contingencies
We are subject to other lawsuits, investigations and disputes arising out of the conduct of our business, including matters relating to commercial transactions, government contracts, product liability, prior acquisitions and divestitures, employee benefit plans, intellectual property and environmental, health and safety matters. We recognize a liability for any contingency that is probable of occurring and reasonably estimable. We continually assess the likelihood of adverse judgments of outcomes in these matters, as well as potential ranges of possible losses (taking into consideration any insurance recoveries), based on a careful analysis of each matter with the assistance of outside legal counsel and, if applicable, other experts.
Note 21. Pension Benefits
We sponsor several funded U.S. and non-U.S. defined benefit pension plans. Significant plans outside the U.S. are in Switzerland and Ireland. Other pension plans outside the U.S. are not material to the Company, either individually or in the aggregate.
20
Our general funding policy for qualified defined benefit pension plans is to contribute amounts at least sufficient to satisfy regulatory funding standards. We are not required to make any contributions to our U.S. pension plan in 2024. We expect to make contributions of cash and/or marketable securities of approximately $7 million to our non-U.S. pension plans to satisfy regulatory funding standards in 2024, of which $1 million has been contributed as of March 31, 2024.
Net periodic benefit costs for our significant defined benefit plans include the following components:
| Three Months Ended March 31, | |||||||||||||||||||||||
| U.S. Plans | Non-U.S. Plan | ||||||||||||||||||||||
| 2024 | 2023 | 2024 | 2023 | ||||||||||||||||||||
| (Dollars in millions) | |||||||||||||||||||||||
| Service cost | $ | $ | $ | $ | |||||||||||||||||||
| Interest cost | |||||||||||||||||||||||
| Expected return on plan assets | ( | ( | ( | ( | |||||||||||||||||||
| Amortization of prior service (credit) | |||||||||||||||||||||||
| Total | $ | $ | $ | $ | |||||||||||||||||||
For both our U.S. and non-U.S. defined benefit pension plans, we estimate the service and interest cost components of net periodic benefit (income) cost by utilizing a full yield curve approach in the estimation of these cost components by applying the specific spot rates along the yield curve used in the determination of the pension benefit obligation to their underlying projected cash flows. This approach provides a more precise measurement of service and interest costs by improving the correlation between projected cash flows and their corresponding spot rates.
Note 22. Subsequent Events
On April 3, 2024, the Company divested its equity interest in an unconsolidated joint venture for approximately $58 million, subject to customary debt and working capital adjustments, with cash consideration received on divestiture date of $46 million. The carrying value of the equity method investment amounted to $21 million as of March 31, 2024, and is included in Investments and long-term receivables on the Consolidated Interim Balance Sheet.
On April 10, 2024, the Company made an early debt repayment of $100 million on its 2023 Dollar Term Facility.
21
Item 2. Management’s Discussion and Analysis of Financial Condition and Results of Operations
The following discussion and analysis of our financial condition and results of operations, which we refer to as our “MD&A,” should be read in conjunction with our Consolidated Interim Financial Statements and related notes appearing elsewhere in this Quarterly Report on Form 10-Q as well as the audited annual Consolidated Financial Statements for the year ended December 31, 2023, included in our 2023 Form 10-K. Some of the information contained in this MD&A or set forth elsewhere in this Quarterly Report on Form 10-Q, including information with respect to our plans and strategy for our business, includes forward-looking statements that involve risks and uncertainties. As a result of many important factors, including those set forth in the “Risk Factors” section of our 2023 Form 10-K and this Quarterly Report on Form 10-Q, our actual results could differ materially from the results described in, or implied, by these forward-looking statements.
The following MD&A is intended to help you understand the results of operations and financial condition of Garrett Motion Inc. for the three months ended March 31, 2024.
Executive Summary
During the first quarter of 2024, the industry continued to experience supply chain challenges where ripple effects from disruptions in the global supply chain have impacted our OEM customers and altered the volume of customer orders received. In response, we flexed our variable cost structure to successfully achieve efficiencies on productivity and drive operational performance. Our agility enabled us to achieve Net income of $66 million and Adjusted EBITDA of $151 million for the quarter.
We continue to grow our turbocharging business and build momentum with our zero emission technologies. In particular, during the quarter, we launched a commercial vehicle application with natural gas for heavy duty trucks in China and won two awards for power generation turbos. We also won two series production awards for our differentiated fuel cell compressor applications and saw our E-powertrain application installed and undergoing vehicle testing with a global OEM.
For the three months ended March 31, 2024, we repurchased $109 million of Common Stock in connection with our share repurchase program, with $241 million remaining under the share repurchase program.
On April 3, 2024, we divested our equity interest in an unconsolidated joint venture for approximately $58 million, subject to customary debt and working capital adjustments, with cash consideration received on divestiture date of $46 million.
On April 10, 2024, we made an early debt repayment of $100 million on our 2023 Dollar Term Facility.
Disaggregated Revenue
The following tables show our revenues by geographic region and product line for the three months ended March 31, 2024 and 2023, respectively.
By Region
Three Months Ended March 31, | |||||||||||||||||||||||
| 2024 | 2023 | ||||||||||||||||||||||
(Dollars in millions) | |||||||||||||||||||||||
United States | $ | 178 | 19% | $ | 173 | 18% | |||||||||||||||||
Europe | 469 | 51% | 497 | 51% | |||||||||||||||||||
Asia | 252 | 28% | 282 | 29% | |||||||||||||||||||
Other | 16 | 2% | 18 | 2% | |||||||||||||||||||
Total | $ | 915 | $ | 970 | |||||||||||||||||||
22
By Product Line
Three Months Ended March 31, | |||||||||||||||||||||||
| 2024 | 2023 | ||||||||||||||||||||||
(Dollars in millions) | |||||||||||||||||||||||
| Diesel | $ | 241 | 26% | $ | 262 | 27% | |||||||||||||||||
| Gas | 388 | 42% | 403 | 42% | |||||||||||||||||||
| Commercial Vehicle | 161 | 18% | 183 | 19% | |||||||||||||||||||
| Aftermarket | 112 | 12% | 110 | 11% | |||||||||||||||||||
| Other | 13 | 2% | 12 | 1% | |||||||||||||||||||
| Total | $ | 915 | $ | 970 | |||||||||||||||||||
Results of Operations for the Three Months Ended March 31, 2024
Net Sales
Three Months Ended March 31, | |||||||||||
| 2024 | 2023 | ||||||||||
| (Dollars in millions) | |||||||||||
| Net sales | $ | 915 | $ | 970 | |||||||
| % change compared with prior period | (5.7) | % | |||||||||
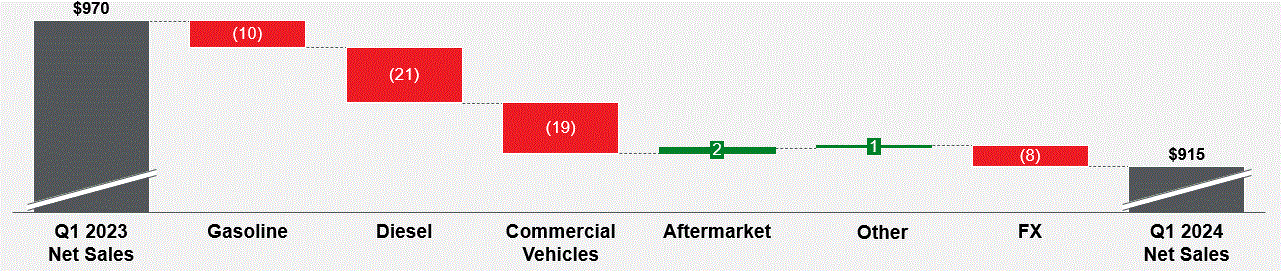
For the three months ended March 31, 2024, net sales decreased compared to prior year by $55 million or 6%, including an unfavorable impact of $8 million or 1% due to foreign currency translation driven by lower Chinese yuan-to-US dollar exchange rates, partially offset by higher Euro-to-US dollar exchange rates. Net sales decreased mainly due to lower volumes in gasoline, diesel and commercial vehicle applications, partially offset by demand for replacement parts on aftermarket sales. Net sales further decreased due to pricing decreases, net of inflation pass-through, driven by commodity deflation.
Gasoline product sales decreased by $15 million or 4% (including an unfavorable impact of $5 million or 2% due to foreign currency translation), primarily driven by soft demand in Asia and North America. The decrease was partially offset by program ramp-ups in Europe and India.
Diesel product sales decreased by $21 million or 8% (including an unfavorable impact of $21 million or 8% due to foreign currency translation), primarily driven by demand softness by OEMs in Europe and partially offset by resilient sales in light commercial vehicle applications in North America.
Commercial vehicle sales decreased by $22 million or 12% (including an unfavorable impact of $3 million or 1% due to foreign currency translation), primarily driven by soft demand in Europe and Asia in the construction industry, partially offset by higher demand in the heavy duty pick-up segment in North America and sustained demand in China linked to the start of production of compressed natural gas programs.
Aftermarket sales increased by $2 million or 2% (including a favorable impact of $2 million or 2% due to foreign currency translation), primarily due to favorable aftermarket conditions and demand for replacement parts in North America, China and Brazil, partially offset by softer sales in Southeast Asia and Australia.
23
Cost of Goods Sold and Gross Profit
Three Months Ended March 31, | |||||||||||
| 2024 | 2023 | ||||||||||
| (Dollars in millions) | |||||||||||
| Cost of goods sold | $ | 743 | $ | 781 | |||||||
| % change compared with prior period | (4.9) | % | |||||||||
| Gross profit percentage | 18.8 | % | 19.5 | % | |||||||
| Cost of Goods Sold | Gross Profit | ||||||||||
| (Dollars in millions) | |||||||||||
Cost of Goods Sold / Gross Profit for the three months ended March 31, 2023 | $ | 781 | $ | 189 | |||||||
| Increase/(decrease) due to: | |||||||||||
| Volume | (29) | (12) | |||||||||
| Product mix | 16 | (11) | |||||||||
| Price, net of inflation pass-through | — | (16) | |||||||||
| Commodity, transportation & energy inflation | (17) | 17 | |||||||||
| Productivity, net | (10) | 15 | |||||||||
| Research & development | 2 | (2) | |||||||||
| Foreign exchange rate impacts | — | (8) | |||||||||
Cost of Goods Sold / Gross Profit for the three months ended March 31, 2024 | $ | 743 | $ | 172 | |||||||
For the three months ended March 31, 2024, cost of goods sold decreased by $38 million primarily driven by $29 million of lower sales volumes, $17 million of commodity, transportation and energy deflation and $10 million of productivity, net of labor inflation and repositioning costs. These decreases were partially offset by $16 million from unfavorable product mix and $2 million of higher R&D costs, reflecting Garrett's continued investment in new technologies.
Gross profit decreased by $17 million, primarily driven by $12 million from lower sales, $16 million from lower pricing net of inflation recoveries, $11 million from unfavorable product mix and $2 million from higher R&D costs as discussed above. These decreases were partially offset by $15 million of higher productivity, net of labor inflation and repositioning costs, and $17 million of commodity, transportation and energy deflation. Foreign currency impacts also contributed to a $8 million decrease in gross profit.
Selling, General and Administrative Expenses
Three Months Ended March 31, | |||||||||||
| 2024 | 2023 | ||||||||||
| (Dollars in millions) | |||||||||||
| Selling, general and administrative expense | $ | 64 | $ | 56 | |||||||
| % of sales | 7.0 | % | 5.8 | % | |||||||
Selling, general and administrative (“SG&A”) expenses for the three months ended March 31, 2024 increased by $8 million compared with the prior year primarily driven by $4 million of higher stock-based compensation expenses. SG&A expenses also increased due to $1 million of labor inflation impacts, $2 million of additional professional services costs and $1 million of unfavorable foreign exchange impacts.
24
Interest Expense
Three Months Ended March 31, | |||||||||||
| 2024 | 2023 | ||||||||||
| (Dollars in millions) | |||||||||||
| Interest expense | $ | 31 | $ | 27 | |||||||
For the three months ended March 31, 2024, interest expense increased by $4 million compared to the prior year, primarily driven by $18 million of additional interest expense from the 2023 Dollar Term Facility and higher interest rates. This increase in interest expense was partially offset by $6 million of higher gains on our interest derivatives in the current year. In addition, there were no marked-to-market remeasurement losses recorded during the three months ended March 31, 2024 on our undesignated interest rate swap contracts, in comparison to $7 million of marked-to-market remeasurement losses in the prior year.
Non-operating income
Three Months Ended March 31, | |||||||||||
| 2024 | 2023 | ||||||||||
| (Dollars in millions) | |||||||||||
| Non-operating income | $ | (5) | $ | (3) | |||||||
For the three months ended March 31, 2024, non-operating income amounted to $5 million versus $3 million in the prior year. The higher non-operating income was primarily due to an increase in foreign exchange transactional gains.
Tax Expense
Three Months Ended March 31, | |||||||||||
| 2024 | 2023 | ||||||||||
| (Dollars in millions) | |||||||||||
| Tax expense | $ | 15 | $ | 27 | |||||||
| Effective tax rate | 18.5 | % | 25.0 | % | |||||||
The effective tax rates for the three months ended March 31, 2024 and 2023 were 18.5% and 25.0%, respectively. The change in the effective tax rate for the three months ended March 31, 2024 compared to the prior period is primarily related to reversal of tax reserves and lower U.S. taxes on international operations, partially offset by increased withholding taxes.
In January 2019, the Organization for Economic Co-operation and Development (“OECD”) announced further work in continuation of its Base Erosion and Profit Shifting project, focusing on two “pillars.” Pillar One provides a framework for the reallocation of certain residual profits of multinational enterprises to market jurisdictions where goods or services are used or consumed. Pillar Two consists of two interrelated rules referred to as Global Anti-Base Erosion (“GloBE”) Rules, which operate to impose a minimum tax rate of 15% calculated on a jurisdictional basis. On December 20, 2021, the OECD published GloBE model rules and released multiple rounds of commentary on those rules over the subsequent months. More than 135 OECD member countries have agreed to the key parameters of the model rules, which allow those OECD member countries to begin implementing the GloBE rules in a manner consistent with the agreement reached. The rules were adopted by a number of countries in 2023, with an effective date for fiscal years beginning after December 31, 2023.
We do not expect that Pillar One will have an impact on our operations or effective tax rate. Based on currently enacted legislation, we do not expect Pillar Two to have a material impact to our 2024 effective tax rate. However, further enactment of legislation by countries in which we do business could have an impact on our 2024 effective tax rate.
The effective tax rate can vary from quarter to quarter due to changes in the Company’s global mix of earnings, the resolution of income tax audits, changes in tax laws (including updated guidance on U.S. tax reform), deductions related to employee share-based payments, internal restructurings, and pension mark-to-market adjustments.
25
Net Income
Three Months Ended March 31, | |||||||||||
| 2024 | 2023 | ||||||||||
| (Dollars in millions) | |||||||||||
| Net income | $ | 66 | $ | 81 | |||||||
| Net income margin | 7.2 | % | 8.4 | % | |||||||
Net income for the three months ended March 31, 2024 decreased by $15 million compared with the prior year, primarily due to $17 million of decreased gross profit, $8 million of higher SG&A expenses and $4 million of higher interest expense, partially offset by $12 million of lower tax expense, as discussed above.
Non-GAAP Measures
It is management’s intent to provide non-GAAP financial information to supplement the understanding of our business operations and performance, and it should be considered by the reader in addition to, but not instead of, the financial statements prepared in accordance with GAAP. Each non-GAAP financial measure is presented along with the most directly comparable GAAP measure so as not to imply that more emphasis should be placed on the non-GAAP measure. The non-GAAP financial information presented may be determined or calculated differently by other companies and may not be comparable to other similarly titled measures used by other companies. Additionally, the non-GAAP financial measures have limitations as analytical tools and should not be considered in isolation or as a substitute for an analysis of the Company’s operating results as reported under GAAP.
EBITDA and Adjusted EBITDA
We evaluate performance on the basis of EBITDA and Adjusted EBITDA. We define “EBITDA” as our net income calculated in accordance with U.S. GAAP, plus the sum of interest expense net of interest income, tax expense and depreciation. We define “Adjusted EBITDA” as EBITDA, plus the sum of stock compensation expense, repositioning costs, discounting costs on factoring, other non-operating income, capital structure transformation expenses, net reorganization items and loss on extinguishment of debt (if any). We believe that EBITDA and Adjusted EBITDA are important indicators of operating performance and provide useful information for investors because:
•EBITDA and Adjusted EBITDA exclude the effects of income taxes, as well as the effects of financing and investing activities by eliminating the effects of interest and depreciation expenses and therefore more closely measure our operational performance; and
•certain adjustment items, while periodically affecting our results, may vary significantly from period to period and have disproportionate effect in a given period, which affects the comparability of our results.
In addition, our management may use Adjusted EBITDA in setting performance incentive targets to align performance measurement with operational performance.
The following table reconciles Net income under GAAP to EBITDA and Adjusted EBITDA:
26
Three Months Ended March 31, | |||||||||||
| 2024 | 2023 | ||||||||||
| (Dollars in millions) | |||||||||||
| Net income | $ | 66 | $ | 81 | |||||||
Interest expense, net of interest income (1) | 29 | 27 | |||||||||
| Tax expense | 15 | 27 | |||||||||
| Depreciation | 22 | 21 | |||||||||
| EBITDA | 132 | 156 | |||||||||
Stock compensation expense (2) | 8 | 3 | |||||||||
Repositioning costs (3) | 11 | 7 | |||||||||
Discounting costs on factoring | 1 | 1 | |||||||||
Other non-operating income (4) | (1) | (1) | |||||||||
Capital structure transformation expenses (5) | — | 2 | |||||||||
| Adjusted EBITDA | $ | 151 | $ | 168 | |||||||
(1)Reflects interest income of $2 million and $0 million for the three months ended March 31, 2024 and 2023, respectively.
(2)Stock compensation expense includes only non-cash expenses.
(3)Repositioning costs includes severance costs related to restructuring projects to improve future productivity.
(4)Reflects the non-service component of net periodic pension income.
(5)Reflects the third-party incremental costs that were directly attributable to the transformation of the Company's capital structure through the partial repurchase and subsequent conversion of the remaining outstanding Series A Preferred Stock into a single class of common stock in June 2023.
Adjusted EBITDA for the Three Months Ended March 31, 2024
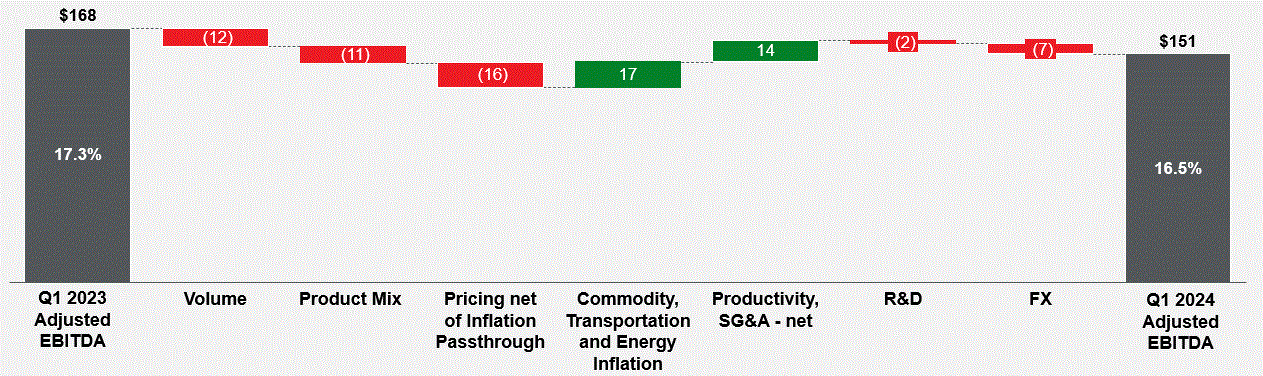
For the three months ended March 31, 2024, net income decreased by $15 million versus the prior year as discussed above within Results of Operations for Three Months Ended March 31, 2024.
Adjusted EBITDA decreased by $17 million compared to the prior year, mainly due to lower volumes across product lines, unfavorable product mix, pricing net of inflation pass-through, as well as unfavorable foreign exchange impacts. These decreases were partially offset by strong operational performance through productivity, net of labor inflation and repositioning costs, and commodity, transportation and energy deflation.
During the three months ended March 31, 2024, we saw demand softness for gasoline, diesel and commercial vehicle applications, partially offset by favorable demand in aftermarket for replacement parts in North America, China and Brazil. Net sales also decreased due to pricing decreases, net of inflation pass-through, driven by commodity deflation.
27
The increased productivity from our ability to flex our variable cost structure was partially offset by year-over-year labor inflation.
R&D expenses increased $2 million which reflects our continued investment in new technologies, increased hiring to accelerate growth in the zero emission technologies.
Losses in foreign currency from translational, transactional and hedging effects in the three months ended March 31, 2024, primarily driven by a lower Chinese yuan-to-US dollar exchange rates and partially offset by higher Euro-to-US dollar exchange rates versus the prior year period, also accounted for a $7 million decrease in Adjusted EBITDA.
Liquidity and Capital Resources
Overview
| March 31, 2024 | December 31, 2023 | ||||||||||
| (Dollars in millions) | |||||||||||
| Cash and cash equivalents | $ | 196 | $ | 259 | |||||||
| Restricted cash | 1 | 1 | |||||||||
| Revolving Facility - available borrowing capacity | 570 | 570 | |||||||||
| Revolving Facility - borrowings or letters of credit outstanding | — | — | |||||||||
| Term Loan Facilities - principal outstanding | 1,682 | 1,696 | |||||||||
| Bilateral letter of credit facility - available capacity | 3 | 3 | |||||||||
| Bilateral letter of credit facility - utilized capacity | 12 | 12 | |||||||||
During the three months ended March 31, 2024, we repaid $2 million on our 2021 Dollar Term Facility. On April 10, 2024, we made an early debt repayment of $100 million on our 2023 Dollar Term Facility.
We employ several means to manage our liquidity, and our sources of financing include cash flows from operations, cash and cash equivalents, our Term Loan Facilities, and Revolving Facility. We expect to continue investing in our facilities as we expand our manufacturing capacity for new product launches and invest in new technologies and strategic growth opportunities, in particular in the electrification of drivetrains. We believe the combination of expected cash flows, the term loan borrowings, and the Revolving Facility being committed until 2028, will provide us with adequate liquidity to support the Company's operations.
Share Repurchase Program
On February 13, 2024, the Board of Directors authorized a $350 million share repurchase program valid until December 31, 2024, providing for the purchase of shares of Common Stock. As of March 31, 2024, the Company had repurchased $109 million of Common Stock, with $241 million remaining under the share repurchase program. The Company may repurchase shares from time to time under the program through various methods, including in open market transactions, block trades, privately negotiated transactions, and otherwise. The timing, as well as the number and value of shares repurchased under the program, will depend on a variety of factors. The Company is not obligated to purchase any shares under the repurchase program, and the program may be suspended, modified, or discontinued at any time without prior notice. For more information, see Item 2. Unregistered Sales of Equity Securities and Use of Proceeds.
28
Cash Flow Summary for the Three Months Ended March 31, 2024
Three Months Ended March 31, | |||||||||||
| 2024 | 2023 | ||||||||||
| (Dollars in millions) | |||||||||||
| Cash provided by (used for): | |||||||||||
| Operating activities | $ | 84 | $ | 92 | |||||||
| Investing activities | (28) | (8) | |||||||||
| Financing activities | (112) | (44) | |||||||||
| Effect of exchange rate changes on cash and restricted cash | (7) | 4 | |||||||||
Net (decrease) increase in cash, cash equivalents and restricted cash | $ | (63) | $ | 44 | |||||||
Cash provided by operating activities decreased by $8 million for the three months ended March 31, 2024 versus the prior year. The decrease was primarily driven by a decrease of $31 million in net income, excluding the effects of non-cash items, as well as $11 million of unfavorable impacts from changes in other assets and liabilities. These decreases were partially offset by $34 million of favorable impacts from working capital changes.
Cash used for investing activities increased by $20 million for the three months ended March 31, 2024 versus the prior year, mainly due to $24 million of increased expenditures for property, plant and equipment driven by the timing of the capital expenditures. This was partially offset by $4 million of proceeds received in the current year on our cross currency swap contracts which have been designated as net investment hedges of our Euro-denominated operations.
Cash used for financing activities increased by $68 million for the three months ended March 31, 2024 compared with the prior year. The increased use of cash for financing activities was primarily driven by $107 million of cash paid for share repurchases in 2024, partially offset by $42 million of payments made in the prior year related to dividends declared on our Series A Preferred Stock.
Off-Balance Sheet Arrangements
We do not engage in any off-balance sheet financial arrangements that have or are reasonably likely to have a material current or future effect on our financial condition, changes in financial condition, revenues or expenses, results of operations, liquidity, capital expenditures, or capital resources.
Critical Accounting Policies
The preparation of our Consolidated Interim Financial Statements in accordance with generally accepted accounting principles is based on the selection and application of accounting policies that require us to make significant estimates and assumptions about the effects of matters that are inherently uncertain. Actual results could differ from our estimates and assumptions, and any such differences could be material to our financial statements. Our critical accounting policies are summarized in the “Management’s Discussion and Analysis of Financial Condition and Results of Operations” section of our 2023 Form 10-K.
Recent Accounting Pronouncements
See Note 2, Summary of Significant Accounting Policies of the Notes to the Consolidated Interim Financial Statements for further discussion of recent accounting pronouncements.
Special Note Regarding Forward-Looking Statements
This Quarterly Report on Form 10-Q contains forward-looking statements. We intend such forward-looking statements to be covered by the safe harbor provisions for forward-looking statements contained in Section 27A of the Securities Act of 1933, as amended (the “Securities Act”) and Section 21E of the Securities Exchange Act of 1934, as amended (the “Exchange Act”). All statements other than statements of historical fact contained in this Quarterly Report on Form 10-Q, including without limitation statements regarding the following, are forward-looking statements: statements regarding our future results of operations and financial position, expectations regarding the growth of the turbocharger and
29
electric vehicle markets and other industry trends, the sufficiency of our liquidity and capital resources, anticipated impacts of changes in legislation and government policy relating to taxation or otherwise, anticipated sources and uses of cash, anticipated investments in our business, our business strategy, pending litigation, anticipated interest expense, and the plans and objectives of management for future operations and capital expenditures are forward-looking statements. These statements involve known and unknown risks, uncertainties and other important factors that may cause our actual results, performance or achievements to be materially different from any future results, performance or achievements expressed or implied by the forward-looking statements. In some cases, you can identify forward-looking statements by terms such as “may,” “will,” “should,” “expect,” “plan,” “anticipate,” “could,” “intend,” “target,” “project,” “contemplate,” “believe,” “estimate,” “predict,” “potential,” or “continue” or the negative of these terms or other similar expressions. The forward-looking statements in this Quarterly Report on Form 10-Q are only predictions. We have based these forward-looking statements largely on our current expectations and projections about future events and financial trends that we believe may affect our business, financial condition and results of operations. These forward-looking statements speak only as of the date of this Quarterly Report on Form 10-Q and are subject to a number of important factors that could cause actual results to differ materially from those in the forward-looking statements, including:
•increases in the costs and availability of raw materials, components, energy and transportation and our ability to offset inflation;
•sales to major customers as well as a network of independent dealers to manage the distribution of our products, and we could be adversely impacted by the loss of any of our such major customers or dealers, changes in their requirements for our products or changes in their financial condition.
•the negotiating positions of our customers and our ability to negotiate favorable pricing terms;
•risks associated with changes in the automotive industry and our inability, or a perception that we are unable, to respond appropriately to such changes, our financial condition and results of operations could be adversely impacted;
•risks associated with any program launch difficulties and inaccuracies in estimates of volumes of awarded business;
•changes in the automotive industry and economic or competitive conditions;
•risks related to economic, political, regulatory and foreign exchange;
•geopolitical conditions, catastrophic events and pandemics;
•risks related to international operations and our investment in foreign markets;
•risks of increased scrutiny from customers, investors, regulators and others regarding sustainability/ESG practices, as well as the climate-related risks we may face, each of which could expose us to liabilities, including reputational harm, impact demand for our products, lead to increased costs and have other adverse effects on our business, supply chain and results of operations;
•risks associated with joint venture partnerships and joint development projects;
•any failure to protect our intellectual property or allegations that we have infringed the intellectual property of others, and our ability to license necessary intellectual property from third parties;
•work stoppages, other disruptions or the need to relocate any of our facilities;
•inability to recruit and retain qualified personnel;
•any failure to increase productivity or successfully execute repositioning projects or manage our workforce;
•potential material losses and costs as a result of any warranty claims and product liability actions brought against us;
30
•the commencement of any lawsuits, investigations and disputes arising out of our current and historical businesses, and the consequences thereof;
•potential material environmental liabilities and hazards;
•risks of changes in the effective tax rates;
•the effects of any deterioration on industry, economic or financial conditions on our ability to access the capital markets on favorable terms;
•quality control and creditworthiness of the suppliers on which we rely;
•risks for system or service failures, including cyber or other security incidents, each of which could disrupt business operations, result in loss of critical and confidential information and adversely impact our reputation and results of operations; and
•the other factors described under the caption “Risk Factors” in our 2023 Form 10-K, as updated in this Quarterly Report on Form 10-Q, and our other filings with the SEC.
You should read this Quarterly Report on Form 10-Q and the documents that we reference herein completely and with the understanding that our actual future results may be materially different from what we expect. We qualify all of our forward-looking statements by these cautionary statements. Except as required by applicable law, we do not plan to publicly update or revise any forward-looking statements contained herein, whether as a result of any new information, future events, changed circumstances or otherwise.
Item 3. Quantitative and Qualitative Disclosures About Market Risk
As of March 31, 2024, the net fair value of all financial instruments with exposure to currency risk was a $60 million asset. The potential loss or gain in fair value for such financial instruments from a hypothetical 10% adverse or favorable change in quoted currency exchange rates would be $152 million and $(161) million, respectively, at March 31, 2024 exchange rates. The model assumes a parallel shift in currency exchange rates; however, currency exchange rates rarely move in the same direction. The assumption that currency exchange rates change in a parallel fashion may overstate the impact of changing currency exchange rates on assets and liabilities denominated in currencies other than the U.S. dollar.
There have been no other material changes to the Company’s quantitative and qualitative disclosures about interest rate or commodity price risks as disclosed in Part II, Item 7A, Quantitative and Qualitative Disclosures About Market Risks, in our 2023 Form 10-K.
Item 4. Controls and Procedures
In designing and evaluating our disclosure controls and procedures, management recognizes that any controls and procedures, no matter how well designed and operated, can provide only reasonable assurance of achieving the desired control objectives. In addition, the design of disclosure controls and procedures must reflect the fact that there are resource constraints and that management is required to apply judgment in evaluating the benefits of possible controls and procedures relative to their costs.
Our management, with the participation of our Chief Executive Officer and Chief Financial Officer, conducted an evaluation of our disclosure controls and procedures, as such term is defined under Rule 13a-15(e) promulgated under the Exchange Act. Based on management’s evaluation, our Chief Executive Officer and Chief Financial Officer concluded that our disclosure controls and procedures were effective at the reasonable assurance level as of March 31, 2024.
There were no changes in our internal control over financial reporting (as defined in Rules 13a-15(f) and 15d-15(f) under the Exchange Act) that occurred during the quarter ended March 31, 2024 that have materially affected, or are reasonably likely to materially affect, our internal control over financial reporting.
31
PART II—OTHER INFORMATION
Item 1. Legal Proceedings
We are involved in various lawsuits, claims and proceedings incident to the operation of our businesses, including those pertaining to product liability, product safety, environmental, safety and health, intellectual property, employment, commercial and contractual matters and various other matters. Although the outcome of any such lawsuit, claim or proceeding cannot be predicted with certainty and some may be disposed of unfavorably to us, we do not currently believe that such lawsuits, claims or proceedings will have a material adverse effect on our financial position, results of operations or cash flows. We accrue for potential liabilities in a manner consistent with accounting principles generally accepted in the United States. Accordingly, we accrue for a liability when it is probable that a liability has been incurred and the amount of the liability is reasonably estimable.
For additional information regarding our legal proceedings, see the discussion under Note 20, Commitments and Contingencies of the Notes to the Consolidated Interim Financial Statements, which is incorporated by reference into this Part II, Item 1.
Item 1A. Risk Factors
There have been no material changes to the risks described under "Risk Factors” in our 2023 Form 10-K. In addition to the other information set forth in this Quarterly Report on Form 10-Q, you should carefully consider the factors discussed under “Risk Factors” in our 2023 Form 10-K. These factors could materially adversely affect our business, financial condition, or results of operations, and could cause our actual results to differ materially from our historical results or the results contemplated by any forward-looking statements contained in this report.
Item 2. Unregistered Sales of Equity Securities and Use of Proceeds
On February 13, 2024, the Board of Directors authorized a $350 million share repurchase program valid until December 31, 2024, providing for the purchase of shares of Common Stock. The Company may repurchase shares from time to time under the program through various methods, including in open market transactions, block trades, privately negotiated transactions, and otherwise. The timing, as well as the number and value of shares repurchased under the program, will depend on a variety of factors. The Company is not obligated to purchase any shares under the repurchase program, and the program may be suspended, modified, or discontinued at any time without prior notice. The following table summarizes our share repurchase activity for the three months ended March 31, 2024 and additional information regarding our share repurchase program:
| Period | Total Number of Common Shares Purchased (1) | Average Price Paid per Share | Total Number of Shares Purchased as Part of Publicly Announced Plan or Program | Approximate Dollar Value of Shares that May Yet Be Purchased Under the Plan or Program | ||||||||||||||||||||||
| January 1, 2024 - January 31, 2024 | — | $ | — | — | $ | — | ||||||||||||||||||||
| February 1, 2024 - February 29, 2024 | 251,682 | 9.53 | 251,682 | 347,601,764 | ||||||||||||||||||||||
| March 1, 2024 - March 31, 2024 | 11,688,835 | 9.11 | 11,688,835 | 241,138,639 | ||||||||||||||||||||||
| Total | 11,940,517 | $ | 9.12 | 11,940,517 | $ | 241,138,639 | ||||||||||||||||||||
(1) Excludes shares withheld to satisfy tax withholding obligations in connection with equity award vestings.
Other than the repurchases reflected in the table above, there were no purchases of equity securities by the issuer or affiliated purchasers during the quarter ended March 31, 2024.
Item 3. Defaults Upon Senior Securities
Not applicable.
Item 4. Mine Safety Disclosures
32
Not applicable.
Item 5. Other Information
Trading Agreements
During the three months ended March 31, 2024, no director or Section 16 officer of the Company adopted terminated
33
Item 6. Exhibits
| Incorporated by Reference | |||||||||||||||||||||||||||||||||||||||||
Exhibit Number | Description | Form | File No. | Exhibit | Filing Date | Filed/ Furnished Herewith | |||||||||||||||||||||||||||||||||||
| 3.1 | 8-K | 001-38636 | 3.1 | 04/30/2021 | |||||||||||||||||||||||||||||||||||||
| 3.2 | DEF14C | 001-38636 | Appendix B-1 | 05/15/2023 | |||||||||||||||||||||||||||||||||||||
| 3.3 | 10-Q | 001-38636 | 3.4 | 07/27/2023 | |||||||||||||||||||||||||||||||||||||
| 3.4 | 10-Q | 001-38636 | 3.5 | 07/27/2023 | |||||||||||||||||||||||||||||||||||||
| 3.5 | 8-K | 001-38636 | 3.1 | 12/07/2023 | |||||||||||||||||||||||||||||||||||||
| 31.1 | * | ||||||||||||||||||||||||||||||||||||||||
| 31.2 | * | ||||||||||||||||||||||||||||||||||||||||
| 32.1 | ** | ||||||||||||||||||||||||||||||||||||||||
| 32.2 | ** | ||||||||||||||||||||||||||||||||||||||||
| 101.INS | Inline XBRL Instance Document - the instance document does not appear in the Interactive Data File because its XBRL tags are embedded within the Inline XBRL document | * | |||||||||||||||||||||||||||||||||||||||
| 101.SCH | Inline XBRL Taxonomy Extension Schema Document | * | |||||||||||||||||||||||||||||||||||||||
| 101.CAL | Inline XBRL Taxonomy Extension Calculation Linkbase Document | * | |||||||||||||||||||||||||||||||||||||||
| 101.DEF | Inline XBRL Taxonomy Extension Definition Linkbase Document | * | |||||||||||||||||||||||||||||||||||||||
| 101.LAB | Inline XBRL Taxonomy Extension Label Linkbase Document | * | |||||||||||||||||||||||||||||||||||||||
| 101.PRE | Inline XBRL Taxonomy Extension Presentation Linkbase Document | ||||||||||||||||||||||||||||||||||||||||
| 104 | Cover Page Interactive Data File (formatted as Inline XBRL and contained in Exhibit 101) | * | |||||||||||||||||||||||||||||||||||||||
| * | Filed herewith. | ||||
| ** | Furnished herewith. | ||||
34
SIGNATURES
Pursuant to the requirements of the Securities Exchange Act of 1934, the registrant has duly caused this report to be signed on its behalf by the undersigned thereunto duly authorized.
| Garrett Motion Inc. | ||||||||
Date: April 25, 2024 | By: | /s/ Olivier Rabiller | ||||||
| Olivier Rabiller | ||||||||
| President and Chief Executive Officer | ||||||||
Date: April 25, 2024 | By: | /s/ Sean Deason | ||||||
| Sean Deason | ||||||||
| Senior Vice President and Chief Financial Officer | ||||||||
35