UNITED STATES
SECURITIES AND EXCHANGE COMMISSION
Washington, D.C. 20549
FORM 10-Q
| QUARTERLY REPORT PURSUANT TO SECTION 13 OR 15(d) OF THE SECURITIES EXCHANGE ACT OF 1934 | |||||
For the quarterly period ended March 31, 2024
or
| TRANSITION REPORT PURSUANT TO SECTION 13 OR 15(d) OF THE SECURITIES EXCHANGE ACT OF 1934 | |||||
For the transition period from _______to_______
Commission File Number 001-03492
(Exact name of registrant as specified in its charter)
| (State or other jurisdiction of incorporation or organization) | (I.R.S. Employer Identification No.) | ||||
| (Address of principal executive offices) | (Zip Code) | ||||||||||
(281 ) 871-2699
(Registrant's telephone number, including area code)
Securities registered pursuant to Section 12(b) of the Act:
| Title of each class | Trading Symbol | Name of each exchange on which registered | ||||||
Indicate by check mark whether the registrant (1) has filed all reports required to be filed by Section 13 or 15(d) of the Securities Exchange Act of 1934 during the preceding 12 months (or for such shorter period that the registrant was required to file such reports), and (2) has been subject to such filing requirements for the past 90 days. ☒ Yes ☐ No
Indicate by check mark whether the registrant has submitted electronically every Interactive Data File required to be submitted pursuant to Rule 405 of Regulation S-T (§232.405 of this chapter) during the preceding 12 months (or for such shorter period that the registrant was required to submit such files). ☒ Yes ☐ No
Indicate by check mark whether the registrant is a large accelerated filer, an accelerated filer, a non-accelerated filer, a smaller reporting company, or an emerging growth company. See the definitions of “large accelerated filer,” “accelerated filer,” “smaller reporting company,” and “emerging growth company” in Rule 12b-2 of the Exchange Act.
| ☒ | Accelerated Filer | ☐ | ||||||||||||
| Non-accelerated Filer | ☐ | Smaller Reporting Company | ||||||||||||
| Emerging Growth Company | ||||||||||||||
If an emerging growth company, indicate by check mark if the registrant has elected not to use the extended transition period for complying with any new or revised financial accounting standards provided pursuant to Section 13(a) of the Exchange Act. ☐
Indicate by check mark whether the registrant is a shell company (as defined in Rule 12b-2 of the Exchange Act).
As of April 17, 2024, there were 885,301,252 shares of Halliburton Company common stock, $2.50 par value per share, outstanding.
HALLIBURTON COMPANY
Index
| Page No. | ||||||||
PART I. FINANCIAL INFORMATION
Item 1. Financial Statements
HALLIBURTON COMPANY
Condensed Consolidated Statements of Operations
(Unaudited)
| Three Months Ended March 31 | |||||||||||
| Millions of dollars and shares except per share data | 2024 | 2023 | |||||||||
| Revenue: | |||||||||||
| Services | $ | $ | |||||||||
| Product sales | |||||||||||
| Total revenue | |||||||||||
| Operating costs and expenses: | |||||||||||
| Cost of services | |||||||||||
| Cost of sales | |||||||||||
| General and administrative | |||||||||||
| SAP S4 upgrade expense | |||||||||||
| Total operating costs and expenses | |||||||||||
| Operating income | |||||||||||
Interest expense, net of interest income of $ | ( | ( | |||||||||
| Other, net | ( | ( | |||||||||
| Income before income taxes | |||||||||||
| Income tax provision | ( | ( | |||||||||
| Net income | $ | $ | |||||||||
| Net income attributable to noncontrolling interest | ( | ( | |||||||||
| Net income attributable to company | $ | $ | |||||||||
| Basic and diluted net income per share | $ | $ | |||||||||
| Basic weighted average common shares outstanding | |||||||||||
| Diluted weighted average common shares outstanding | |||||||||||
| See notes to condensed consolidated financial statements. | |||||||||||
HAL Q1 2024 FORM 10-Q | 1
HALLIBURTON COMPANY
Condensed Consolidated Statements of Comprehensive Income
(Unaudited)
| Three Months Ended March 31 | |||||||||||
| Millions of dollars | 2024 | 2023 | |||||||||
| Net income | $ | $ | |||||||||
| Other comprehensive income, net of income taxes | |||||||||||
| Comprehensive income | $ | $ | |||||||||
| Comprehensive income attributable to noncontrolling interest | ( | ( | |||||||||
| Comprehensive income attributable to company shareholders | $ | $ | |||||||||
| See notes to condensed consolidated financial statements. | |||||||||||
HAL Q1 2024 FORM 10-Q | 2
HALLIBURTON COMPANY
Condensed Consolidated Balance Sheets
(Unaudited)
| Millions of dollars and shares except per share data | March 31, 2024 | December 31, 2023 | |||||||||
| Assets | |||||||||||
| Current assets: | |||||||||||
| Cash and equivalents | $ | $ | |||||||||
Receivables (net of allowances for credit losses of $ | |||||||||||
| Inventories | |||||||||||
| Other current assets | |||||||||||
| Total current assets | |||||||||||
Property, plant, and equipment (net of accumulated depreciation of $ | |||||||||||
| Goodwill | |||||||||||
| Deferred income taxes | |||||||||||
| Operating lease right-of-use assets | |||||||||||
| Other assets | |||||||||||
| Total assets | $ | $ | |||||||||
| Liabilities and Shareholders’ Equity | |||||||||||
| Current liabilities: | |||||||||||
| Accounts payable | $ | $ | |||||||||
| Accrued employee compensation and benefits | |||||||||||
| Income tax payable | |||||||||||
| Taxes other than income | |||||||||||
| Current portion of operating lease liabilities | |||||||||||
| Other current liabilities | |||||||||||
| Total current liabilities | |||||||||||
| Long-term debt | |||||||||||
| Operating lease liabilities | |||||||||||
| Employee compensation and benefits | |||||||||||
| Other liabilities | |||||||||||
| Total liabilities | |||||||||||
| Shareholders’ equity: | |||||||||||
Common stock, par value $ | |||||||||||
| Paid-in capital in excess of par value | |||||||||||
| Accumulated other comprehensive loss | ( | ( | |||||||||
| Retained earnings | |||||||||||
Treasury stock, at cost ( | ( | ( | |||||||||
| Company shareholders’ equity | |||||||||||
| Noncontrolling interest in consolidated subsidiaries | |||||||||||
| Total shareholders’ equity | |||||||||||
| Total liabilities and shareholders’ equity | $ | $ | |||||||||
| See notes to condensed consolidated financial statements. | |||||||||||
HAL Q1 2024 FORM 10-Q | 3
HALLIBURTON COMPANY
Condensed Consolidated Statements of Cash Flows
(Unaudited)
| Three Months Ended March 31 | |||||||||||
| Millions of dollars | 2024 | 2023 | |||||||||
| Cash flows from operating activities: | |||||||||||
| Net income | $ | $ | |||||||||
| Adjustments to reconcile net income to cash flows from operating activities: | |||||||||||
| Depreciation, depletion, and amortization | |||||||||||
| Changes in assets and liabilities: | |||||||||||
| Receivables | ( | ( | |||||||||
| Accounts payable | ( | ||||||||||
| Inventories | ( | ( | |||||||||
| Other operating activities | ( | ( | |||||||||
| Total cash flows provided by operating activities | |||||||||||
| Cash flows from investing activities: | |||||||||||
| Capital expenditures | ( | ( | |||||||||
| Proceeds from sales of property, plant, and equipment | |||||||||||
| Other investing activities | ( | ( | |||||||||
| Total cash flows used in investing activities | ( | ( | |||||||||
| Cash flows from financing activities: | |||||||||||
| Stock repurchase program | ( | ( | |||||||||
| Dividends to shareholders | ( | ( | |||||||||
| Other financing activities | ( | ( | |||||||||
| Total cash flows used in financing activities | ( | ( | |||||||||
| Effect of exchange rate changes on cash | ( | ( | |||||||||
| Decrease in cash and equivalents | ( | ( | |||||||||
| Cash and equivalents at beginning of period | |||||||||||
| Cash and equivalents at end of period | $ | $ | |||||||||
| Supplemental disclosure of cash flow information: | |||||||||||
| Cash payments during the period for: | |||||||||||
| Interest | $ | $ | |||||||||
| Income taxes | $ | $ | |||||||||
| See notes to condensed consolidated financial statements. | |||||||||||
HAL Q1 2024 FORM 10-Q | 4
| Part I. Item 1 | Notes to Condensed Consolidated Financial Statements | |||||
HALLIBURTON COMPANY
Notes to Condensed Consolidated Financial Statements
(Unaudited)
Note 1. Basis of Presentation
The accompanying unaudited condensed consolidated financial statements were prepared using United States generally accepted accounting principles (GAAP) for interim financial information and the instructions to Form 10-Q and Regulation S-X. Accordingly, these financial statements do not include all information or notes required by U.S. GAAP for annual financial statements and should be read together with our 2023 Annual Report on Form 10-K.
Our accounting policies are in accordance with U.S. GAAP. The preparation of financial statements in conformity with these accounting principles requires us to make estimates and assumptions that affect:
•the reported amounts of assets and liabilities and disclosure of contingent assets and liabilities at the date of the financial statements; and
•the reported amounts of revenue and expenses during the reporting period.
Ultimate results could differ from our estimates.
In our opinion, the condensed consolidated financial statements included herein contain all adjustments necessary to present fairly our financial position as of March 31, 2024 and the results of our operations for the three months ended March 31, 2024 and 2023, and our cash flows for the three months ended March 31, 2024 and 2023. Such adjustments are of a normal recurring nature. In addition, certain reclassifications of prior period balances have been made to conform to the current period presentation.
The results of our operations for the three months ended March 31, 2024 may not be indicative of results for the full year.
Note 2. Business Segment Information
We operate under two divisions, which form the basis for the two operating segments we report: the Completion and Production segment and the Drilling and Evaluation segment. Our equity in earnings and losses of unconsolidated affiliates that are accounted for using the equity method of accounting are included within cost of services and cost of sales on our statements of operations, which is part of operating income of the applicable segment.
HAL Q1 2024 FORM 10-Q | 5
| Part I. Item 1 | Notes to Condensed Consolidated Financial Statements | |||||
The following table presents information on our business segments.
| Three Months Ended March 31 | |||||||||||
| Millions of dollars | 2024 | 2023 | |||||||||
| Revenue: | |||||||||||
| Completion and Production | $ | $ | |||||||||
| Drilling and Evaluation | |||||||||||
| Total revenue | $ | $ | |||||||||
| Operating income: | |||||||||||
| Completion and Production | $ | $ | |||||||||
| Drilling and Evaluation | |||||||||||
| Total operations | |||||||||||
| Corporate and other (a) | ( | ( | |||||||||
| SAP S4 upgrade expense | ( | ||||||||||
| Total operating income | $ | $ | |||||||||
| Interest expense, net of interest income | ( | ( | |||||||||
| Other, net (b) | ( | ( | |||||||||
| Income before income taxes | $ | $ | |||||||||
| (a) | Includes certain expenses not attributable to a business segment, such as costs related to support functions, corporate executives, and operating lease assets, and also includes amortization expense associated with intangible assets recorded as a result of acquisitions. | ||||||||||
| (b) | During the three months ended March 31, 2024, Halliburton incurred a charge of $ | ||||||||||
Note 3. Revenue
Revenue is recognized based on the transfer of control or our customers' ability to benefit from our services and products in an amount that reflects the consideration we expect to receive in exchange for those services and products. Most of our service and product contracts are short-term in nature. In recognizing revenue for our services and products, we determine the transaction price of purchase orders or contracts with our customers, which may consist of fixed and variable consideration. We also assess our customers' ability and intention to pay, which is based on a variety of factors, including our historical payment experience with, and the financial condition of, our customers. Payment terms and conditions vary by contract type, although terms generally include a requirement of payment within 20 to 60 days. Other judgments involved in recognizing revenue include an assessment of progress towards completion of performance obligations for certain long-term contracts, which involve estimating total costs to determine our progress towards contract completion and calculating the corresponding amount of revenue to recognize.
Disaggregation of revenue
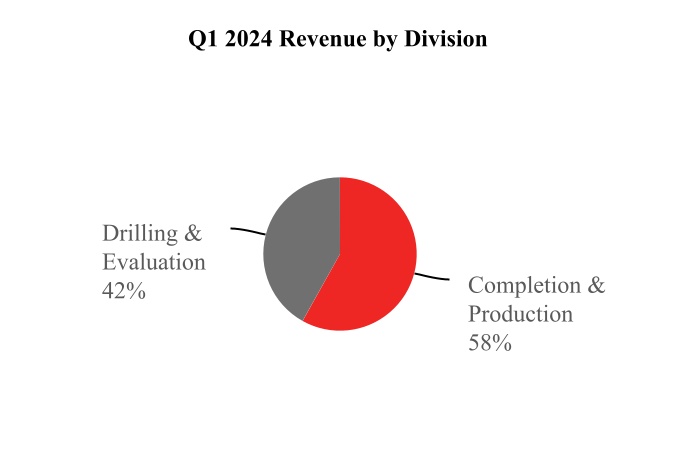
We disaggregate revenue from contracts with customers into types of services or products, consistent with our two reportable segments, in addition to geographical area. Based on the location of services provided and products sold, 42 % and 47 % of our consolidated revenue was from the United States for the three months ended March 31, 2024 and 2023, respectively. No other country accounted for more than 10% of our revenue for those periods.
HAL Q1 2024 FORM 10-Q | 6
| Part I. Item 1 | Notes to Condensed Consolidated Financial Statements | |||||
The following table presents information on our disaggregated revenue.
| Three Months Ended March 31 | ||||||||
| Millions of dollars | 2024 | 2023 | ||||||
| Revenue by segment: | ||||||||
| Completion and Production | $ | $ | ||||||
| Drilling and Evaluation | ||||||||
| Total revenue | $ | $ | ||||||
| Revenue by geographic region: | ||||||||
| North America | $ | $ | ||||||
| Latin America | ||||||||
| Europe/Africa/CIS | ||||||||
| Middle East/Asia | ||||||||
| Total revenue | $ | $ | ||||||
Contract balances
We perform our obligations under contracts with our customers by transferring services and products in exchange for consideration. The timing of our performance often differs from the timing of our customer’s payment, which results in the recognition of receivables and deferred revenue. Deferred revenue represents advance consideration received from customers for contracts where revenue is recognized on future performance of service. Deferred revenue, as well as revenue recognized during the period relating to amounts included as deferred revenue at the beginning of the period, was not material to our condensed consolidated financial statements.
Transaction price allocated to remaining performance obligations
Remaining performance obligations represent firm contracts for which work has not been performed and future revenue recognition is expected. We have elected the practical expedient permitting the exclusion of disclosing remaining performance obligations for contracts that have an original expected duration of one year or less. We have some long-term contracts related to software and integrated project management services such as lump sum turnkey contracts. For software contracts, revenue is generally recognized over the duration of the contract period when the software is considered to be a right to access our intellectual property. For lump sum turnkey projects, we recognize revenue over time using an input method, which requires us to exercise judgment. Revenue allocated to remaining performance obligations for these long-term contracts is not material.
Receivables
As of March 31, 2024, 32 % of our net trade receivables were from customers in the United States and 10 % were from customers in Mexico. As of December 31, 2023, 33 % of our net trade receivables were from customers in the United States and 9 % were from customers in Mexico. Receivables from our primary customer in Mexico accounted for approximately 8 % and 6 % of our total receivables as of March 31, 2024 and December 31, 2023, respectively. While we have experienced payment delays from our primary customer in Mexico, the amounts are not in dispute and we have not historically had, and we do not expect, any material write-offs due to collectability of receivables from this customer. No 10
We have risk of delayed customer payments and payment defaults associated with customer liquidity issues. We routinely monitor the financial stability of our customers and employ an extensive process to evaluate the collectability of outstanding receivables. This process, which involves judgment and estimates, includes analysis of our customers’ historical time to pay, financial condition and various financial metrics, debt structure, credit ratings, and production profile, as well as political and economic factors in countries of operations and other customer-specific factors.
HAL Q1 2024 FORM 10-Q | 7
| Part I. Item 1 | Notes to Condensed Consolidated Financial Statements | |||||
Note 4. Inventories
Inventories consisted of the following:
| Millions of dollars | March 31, 2024 | December 31, 2023 | ||||||
| Finished products and parts | $ | $ | ||||||
| Raw materials and supplies | ||||||||
| Work in process | ||||||||
| Total inventories | $ | $ | ||||||
Note 5. Accounts Payable
Effective January 1, 2023, we adopted new supplier finance program disclosure requirements contained in guidance issued by the Financial Accounting Standards Board (ASU 2022-04, “Disclosure of Supplier Finance Program Obligations”). The standards update also includes a prospective annual requirement to disclose a rollforward of the amount of the obligations during the annual reporting period. We will include the rollforward disclosure in our Annual Report on Form 10-K for the year ending December 31, 2024, as required.
We have agreements with third parties that allow our participating suppliers to finance payment obligations from us with designated third-party financial institutions who act as our paying agent. We have generally extended our payment terms with suppliers to 90 days. A participating supplier may request a participating financial institution to finance one or more of our payment obligations to such supplier prior to the scheduled due date thereof at a discounted price. We are not required to provide collateral to the financial institutions.
Our obligations to participating suppliers, including amounts due and scheduled payment dates, are not impacted by the suppliers’ decisions to finance amounts due under these financing arrangements. Our outstanding payment obligations under these agreements were $325 million as of March 31, 2024, and $322 million as of December 31, 2023, and are included in accounts payable on the condensed consolidated balance sheets.
Note 6. Income Taxes
During the three months ended March 31, 2024, we recorded a total income tax provision of $178 million on a pre-tax income of $787 million, resulting in an effective tax rate of 22.6 % for the quarter. During the three months ended March 31, 2023, we recorded a total income tax provision of $174 million on a pre-tax income of $829 million, resulting in an effective tax rate of 21.0 % for the quarter.
Our tax returns are subject to review by the taxing authorities in the jurisdictions where we file tax returns. In most cases we are no longer subject to examination by tax authorities for years before 2012. The only significant operating jurisdiction that has tax filings under review or subject to examination by the tax authorities is the United States. The United States federal income tax filings for tax years 2016 through 2023 are currently under review or remain open for review by the IRS.
As of March 31, 2024, the primary unresolved issue for the IRS audit for 2016 relates to the classification of the $3.5 billion ordinary deduction that we claimed for the termination fee we paid to Baker Hughes in the second quarter of 2016 for which we received a Notice of Proposed Adjustment (NOPA) from the IRS on September 28, 2023. We regularly assess the likelihood of adverse outcomes resulting from tax examinations to determine the adequacy of our tax reserves, and we believe our income tax reserves are appropriately provided for all open tax years. We do not expect a final resolution of this issue in the next 12 months.
Based on the information currently available, we do not anticipate a significant increase or decrease to our tax contingencies within the next twelve months.
HAL Q1 2024 FORM 10-Q | 8
| Part I. Item 1 | Notes to Condensed Consolidated Financial Statements | |||||
Note 7. Shareholders’ Equity
The following tables summarize our shareholders’ equity activity for the three months ended March 31, 2024 and March 31, 2023, respectively:
| Millions of dollars | Common Stock | Paid-in Capital in Excess of Par Value | Treasury Stock | Retained Earnings | Accumulated Other Comprehensive Income (Loss) | Noncontrolling Interest in Consolidated Subsidiaries | Total | |||||||||||||||||||
| Balance at December 31, 2023 | $ | $ | $ | ( | $ | $ | ( | $ | $ | |||||||||||||||||
| Comprehensive income (loss): | ||||||||||||||||||||||||||
| Net income | ||||||||||||||||||||||||||
| Other comprehensive income (loss) | ( | |||||||||||||||||||||||||
Cash dividends ($ | ( | ( | ||||||||||||||||||||||||
| Stock repurchase program | ( | ( | ||||||||||||||||||||||||
| Stock plans (a) | ( | ( | ( | |||||||||||||||||||||||
| Other | ||||||||||||||||||||||||||
| Balance at March 31, 2024 | $ | $ | $ | ( | $ | $ | ( | $ | $ | |||||||||||||||||
| (a) | In the first quarter of 2024, we issued common stock from treasury shares for stock options exercised, restricted stock grants, performance shares under our performance unit program, and purchases under our employee stock purchase plan. As a result, additional paid in capital was reduced to zero, which resulted in a reduction of retained earnings by $ | |||||||||||||||||||||||||
| Millions of dollars | Common Stock | Paid-in Capital in Excess of Par Value | Treasury Stock | Retained Earnings | Accumulated Other Comprehensive Income (Loss) | Noncontrolling Interest in Consolidated Subsidiaries | Total | |||||||||||||||||||
| Balance at December 31, 2022 | $ | $ | $ | ( | $ | $ | ( | $ | $ | |||||||||||||||||
| Comprehensive income (loss): | ||||||||||||||||||||||||||
| Net income | ||||||||||||||||||||||||||
| Other comprehensive income | ||||||||||||||||||||||||||
Cash dividends ($ | ( | ( | ||||||||||||||||||||||||
| Stock repurchase program | ( | ( | ||||||||||||||||||||||||
| Stock plans (a) | ( | ( | ||||||||||||||||||||||||
| Other | ( | ( | ||||||||||||||||||||||||
| Balance at March 31, 2023 | $ | $ | $ | ( | $ | $ | ( | $ | $ | |||||||||||||||||
| (a) | In the first quarter of 2023, we issued common stock from treasury shares for stock options exercised, restricted stock grants, performance shares under our performance unit program, and purchases under our employee stock purchase plan. As a result, additional paid in capital was reduced to zero, which resulted in a reduction of retained earnings by $ | |||||||||||||||||||||||||
Our Board of Directors has authorized a program to repurchase our common stock from time to time. We repurchased 7.0 million shares of our common stock under the program during the three months ended March 31, 2024 for approximately $250 million. Approximately $3.8 billion remained authorized for repurchases as of March 31, 2024. From the inception of this program in February of 2006 through March 31, 2024, we repurchased approximately 260 million shares of our common stock for a total cost of approximately $10.3 billion. We repurchased 2.9 million shares of our common stock under the program during the three months ended March 31, 2023 for approximately $100 million.
HAL Q1 2024 FORM 10-Q | 9
| Part I. Item 1 | Notes to Condensed Consolidated Financial Statements | |||||
Accumulated other comprehensive loss consisted of the following:
| Millions of dollars | March 31, 2024 | December 31, 2023 | |||||||||
| Cumulative translation adjustments | $ | ( | $ | ( | |||||||
| Defined benefit and other postretirement liability adjustments | ( | ( | |||||||||
| Other | ( | ( | |||||||||
| Total accumulated other comprehensive loss | $ | ( | $ | ( | |||||||
Note 8. Commitments and Contingencies
The Company is subject to various legal or governmental proceedings, claims or investigations, including personal injury, property damage, environmental, intellectual property, commercial, tax, and other matters arising in the ordinary course of business, the resolution of which, in the opinion of management, will not have a material adverse effect on our consolidated results of operations or consolidated financial position. There is inherent risk in any legal or governmental proceeding, claim or investigation, and no assurance can be given as to the outcome of these proceedings.
Guarantee arrangements
In the normal course of business, we have agreements with financial institutions under which approximately $2.6 billion of letters of credit, bank guarantees, or surety bonds were outstanding as of March 31, 2024. Some of the outstanding letters of credit have triggering events that would entitle a bank to require cash collateralization; however, none of these triggering events have occurred. As of March 31, 2024, we had no material off-balance sheet liabilities and were not required to make any material cash distributions to our unconsolidated subsidiaries.
Note 9. Income per Share
Basic income or loss per share is based on the weighted average number of common shares outstanding during the period. Diluted income per share includes additional common shares that would have been outstanding if potential common shares with a dilutive effect had been issued. Antidilutive securities represent potentially dilutive securities which are excluded from the computation of diluted income or loss per share as their impact was antidilutive.
A reconciliation of the number of shares used for the basic and diluted income per share computations is as follows:
| Three Months Ended March 31 | ||||||||
| Millions of shares | 2024 | 2023 | ||||||
| Basic weighted average common shares outstanding | ||||||||
| Dilutive effect of awards granted under our stock incentive plans | ||||||||
| Diluted weighted average common shares outstanding | ||||||||
| Antidilutive shares: | ||||||||
| Options with exercise price greater than the average market price | ||||||||
| Total antidilutive shares | ||||||||
HAL Q1 2024 FORM 10-Q | 10
| Part I. Item 1 | Notes to Condensed Consolidated Financial Statements | |||||
Note 10. Fair Value of Financial Instruments
The carrying amount of cash and equivalents, receivables, and accounts payable, as reflected in the condensed consolidated balance sheets, approximates fair value due to the short maturities of these instruments.
The carrying amount and fair value of our total debt is as follows:
| March 31, 2024 | December 31, 2023 | ||||||||||||||||||||||||||||
| Millions of dollars | Level 1 | Level 2 | Total fair value | Carrying value | Level 1 | Level 2 | Total fair value | Carrying value | |||||||||||||||||||||
| Total debt | $ | $ | $ | $ | $ | $ | $ | $ | |||||||||||||||||||||
In the first three months of 2024, the fair value of our total debt decreased as a result of higher bond yields.
Our debt categorized within level 1 on the fair value hierarchy is calculated using quoted prices in active markets for identical liabilities with transactions occurring on the last two days of period-end. Our debt categorized within level 2 on the fair value hierarchy is calculated using significant observable inputs for similar liabilities where estimated values are determined from observable data points on our other bonds and on other similarly rated corporate debt or from observable data points of transactions occurring prior to two days from period-end and adjusting for changes in market conditions. Differences between the periods presented in our level 1 and level 2 classification of our long-term debt relate to the timing of when third party market transactions on our debt are executed. We have no
HAL Q1 2024 FORM 10-Q | 11
| Part I. Item 2 | Executive Overview | ||||||||
Item 2. Management's Discussion and Analysis of Financial Condition and Results of Operations
Management's Discussion and Analysis of Financial Condition and Results of Operations (MD&A) should be read in conjunction with the condensed consolidated financial statements included in “Item 1. Financial Statements” contained herein.
EXECUTIVE OVERVIEW
Organization
We are one of the world's largest providers of products and services to the energy industry. We help our customers maximize asset value throughout the lifecycle of the reservoir from locating hydrocarbons and managing geological data, to drilling and formation evaluation, well construction and completion, and optimizing production throughout the life of the asset. Activity levels within our operations are significantly impacted by spending on upstream exploration, development, and production programs by major, national, and independent oil and natural gas companies. We report our results under two segments, the Completion and Production segment and the Drilling and Evaluation segment.
•Completion and Production delivers cementing, stimulation, specialty chemicals, intervention, pressure control, artificial lift, and completion products and services. The segment consists of Artificial Lift, Cementing, Completion Tools, Multi-Chem, Pipeline and Process Services, Production Enhancement, and Production Solutions.
•Drilling and Evaluation provides field and reservoir modeling, drilling, fluids, evaluation, and precise wellbore placement solutions that enable customers to model, measure, drill, and optimize their well construction activities. The segment consists of Baroid, Drill Bits and Services, Halliburton Project Management, Landmark Software and Services, Sperry Drilling, Testing and Subsea, and Wireline and Perforating.
The business operations of our segments are organized around four primary geographic regions: North America, Latin America, Europe/Africa/CIS, and Middle East/Asia. We have manufacturing operations in various locations, the most significant of which are in the United States, Malaysia, Singapore, and the United Kingdom. With approximately 49,000 employees, we operate in more than 70 countries around the world, and our corporate headquarters is in Houston, Texas.
Our value proposition is to collaborate and engineer solutions to maximize asset value for our customers. We work to achieve strong cash flows and returns for our shareholders by delivering technology and services that improve efficiency, increase recovery, and maximize production for our customers. Our strategic priorities are to:
- International: Allocate our capital to the highest return opportunities and increase our international growth in both onshore and offshore markets.
- North America: Maximize value by, among other things, utilizing our premium low-emissions Zeus electric fracturing systems, as well as automated and intelligent fracturing technologies, to drive higher margins through better pricing and increased efficiency.
- Digital: Continue to drive differentiation and efficiencies through the deployment and integration of digital and automation technologies, both internally and for our customers.
- Capital efficiency: Maintain our capital expenditures at approximately 6% of revenue while focusing on technological advancements and process changes that reduce our manufacturing and maintenance costs and improve how we move equipment and respond to market opportunities.
- Shareholder returns: Return over 50% of annual free cash flow to shareholders through dividends and share repurchases.
- Sustainability and energy mix transition: Continue to:
• Leverage the participants in Halliburton Labs to gain insight into developing value chains in the energy mix transition;
• Develop and deploy solutions to help lower the carbon intensity of our customers' businesses;
• Develop technologies and solutions to lower our emissions; and
• Participate in carbon capture, utilization, and storage, hydrogen, and geothermal projects globally.
HAL Q1 2024 FORM 10-Q | 12
| Part I. Item 2 | Executive Overview | ||||||||
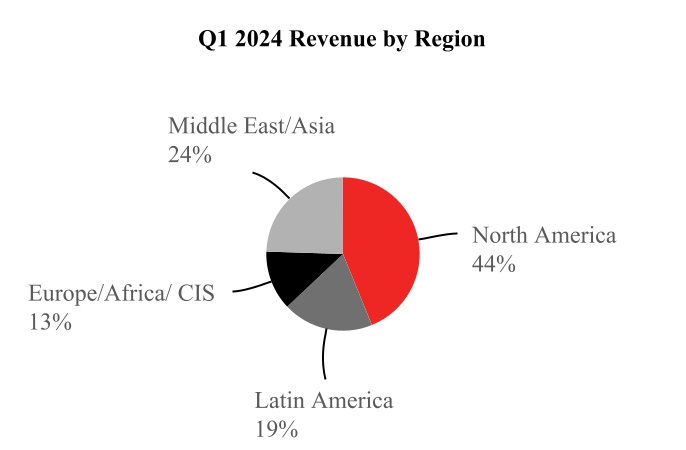
The following charts depict the revenue split between our two operating segments and our four primary geographic regions for the three months ended March 31, 2024.
Market conditions
Oil prices strengthened in the first quarter of 2024 as strong demand and OPEC+ production cuts tightened the oil market. While easing inflationary pressures have reduced macroeconomic uncertainty, geopolitical unrest in the Middle East and the Russia-Ukraine conflict continue to be major sources of volatility for the oil and natural gas markets.
In the U.S., in the first quarter of 2024 natural gas producers responded to lower prices by reducing rig count in natural gas basins even as oil focused basins saw an increase in active rigs. The international rig count continued steady growth in the first quarter of 2024 largely driven by the Middle East/Asia and Africa.
Globally, we continue to be impacted by extended supply chain lead times for the supply of select raw materials. We monitor market trends and work to mitigate cost impacts through economies of scale in global procurement, technology modifications, and efficient sourcing practices. Also, while we have been impacted by inflationary cost increases, primarily related to chemicals, cement, and logistics costs, we generally try to pass much of those increases on to our customers and we believe we have effective solutions to minimize their operational impact.
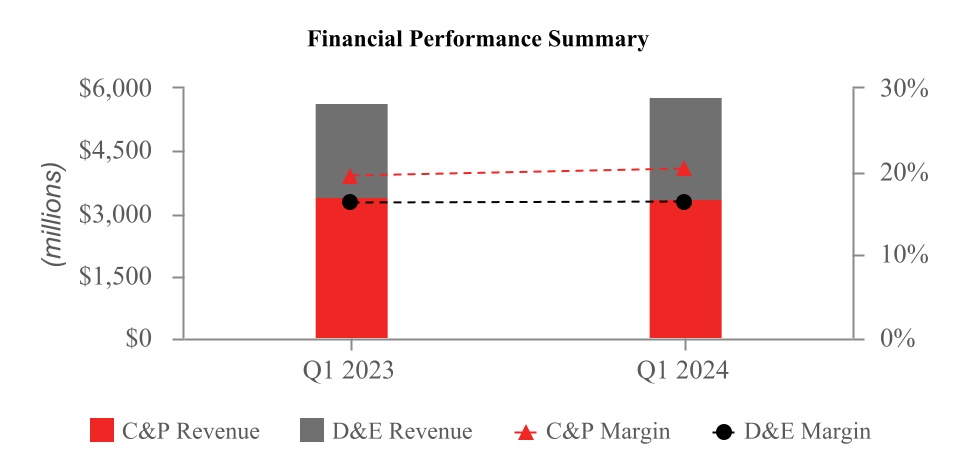
Financial results
The following graph illustrates our revenue and operating margins for each operating segment for the first quarter of 2023 and 2024.
HAL Q1 2024 FORM 10-Q | 13
| Part I. Item 2 | Executive Overview | ||||||||
During the first quarter of 2024, we generated total company revenue of $5.8 billion, a 2% increase as compared to the first quarter of 2023. We recorded operating income of $987 million in the first quarter of 2024, flat when compared to the first quarter of 2023. Our Completion and Production segment revenue was down slightly in the first quarter of 2024 as compared to the first quarter of 2023. Reduced pressure pumping services in U.S. land were offset by improved completion tool sales in the Western Hemisphere and Europe/Africa, increased stimulation activity in Latin America, higher cementing activity internationally, and increased artificial lift activity in North America. Operating income increased due to completion tool product sales and activity and pricing in artificial lift and cementing services. Our Drilling and Evaluation segment revenue increased 7% in the first quarter of 2024 as compared to the first quarter of 2023, primarily due to higher drilling-related services in the Middle East and North America, improved activity in multiple product service lines in Latin America, and higher fluid service in Europe. Partially offsetting these improvements were lower project management activity in the Middle East/Asia, reduced wireline activity in North America, lower drilling services in Europe/Africa, and decreased fluid services in Asia.
Our North America revenue decreased 8% in the first quarter of 2024, as compared to the first quarter of 2023, driven by lower pressure pumping services in U.S. land along with lower wireline activity throughout the region. Partially offsetting these declines were improved completion tool sales, higher pressure pumping services, and improved drilling-related services in the Gulf of Mexico, along with higher artificial lift activity and increased drilling services in U.S. land.
Internationally, revenue increased 12% in the first quarter of 2024, as compared to the first quarter of 2023, largely driven by improved activity in multiple product service lines in Latin America, increased drilling services in the Middle East, higher fluid services in Europe and the Middle East, and improved cementing services in all regions. Partially offsetting these improvements were lower project management activity in the Middle East/Asia and reduced fluid services in Asia. The international average rig count increased 5% in the first quarter of 2024 as compared to the first quarter of 2023.
Our operating performance and liquidity are described in more detail in “Liquidity and Capital Resources” and “Business Environment and Results of Operations.”
Sustainability and Energy Mix Transition
In 2021, we announced our target to achieve a 40% reduction in our Scope 1 and 2 emissions by 2035 from the 2018 baseline. At the same time, we support our customers in their emissions reduction efforts by continuously developing and deploying goods and services that are accretive to their goals as well as ours. As the energy mix transition unfolds, we seek to apply our expertise and resources in growth sectors adjacent to our traditional oilfield services space, including carbon capture, utilization, and storage, hydrogen, and geothermal. Finally, we will continue to focus on accelerating the success of clean tech start-ups via Halliburton Labs, which also allows us to participate in the energy mix transition at relatively low risk by investing our expertise, resources, and team without a significant outlay of capital while we learn where we can strategically engage new markets. As of March 31, 2024, Halliburton Labs had 32 participating companies and alumni.
HAL Q1 2024 FORM 10-Q | 14
| Part I. Item 2 | Liquidity and Capital Resources | ||||||||
LIQUIDITY AND CAPITAL RESOURCES
As of March 31, 2024, we had $1.9 billion of cash and equivalents, compared to $2.3 billion of cash and equivalents at December 31, 2023.
Significant sources and uses of cash during the first three months of 2024
Sources of cash:
•Cash flows from operating activities were $487 million. Working capital, which consists of receivables, inventories, and accounts payable, had a negative impact of $341 million, primarily due to increased receivables.
Uses of cash:
•Capital expenditures were $330 million.
•We repurchased 7.0 million shares of our common stock for $250 million.
•We paid $151 million of dividends to our shareholders.
Future sources and uses of cash
We manufacture most of our own equipment, which provides us with some flexibility to increase or decrease our capital expenditures based on market conditions. We currently expect capital spending for 2024 to be approximately 6% of revenue. We believe this level of spend will allow us to invest in our key strategic technologies, including the construction and deployment of our Zeus electric fracturing systems in North America, our iStar Intelligent Drilling and Logging Platform, and our iCruise Intelligent Rotary Steerable System. We will continue to maintain capital discipline and monitor the rapidly changing market dynamics, and we may adjust our capital spend accordingly.
While we maintain focus on liquidity and debt reduction, we are also focused on providing cash returns to our shareholders. Our quarterly dividend rate is $0.17 per common share, or approximately $151 million. In 2023, our Board approved a capital return framework with a goal of returning at least 50% of our annual free cash flow to shareholders through dividends and share repurchases and we expect our returns to shareholders will be in line with our capital return framework for 2024.
We may utilize share repurchases as part of our capital return framework. Our Board of Directors has authorized a program to repurchase our common stock from time to time. We repurchased 7.0 million shares of common stock during the first quarter of 2024 under this program. Approximately $3.8 billion remained authorized for repurchases as of March 31, 2024 and may be used for open market and other share purchases.
During 2023, we began our migration to SAP S4, which we expect to complete by the end of 2025. During the three months ended March 31, 2024, we incurred $34 million in expense on our SAP S4 migration. The total project investment is estimated to cost approximately $250 million, of which we have incurred $85 million to date. We believe the new system will provide important efficiency benefits, cost savings, enhanced visibility to our operations, and advanced analytics that will benefit us and our customers.
Other factors affecting liquidity
Financial position in current market. As of March 31, 2024, we had $1.9 billion of cash and equivalents and $3.5 billion of available committed bank credit under a revolving credit facility with an expiration date of April 27, 2027. We believe we have a manageable debt maturity profile, with approximately $472 million coming due beginning in 2025 through 2027. Furthermore, we have no financial covenants or material adverse change provisions in our bank agreements, and our debt maturities extend over a long period of time. We believe our cash on hand, cash flows generated from operations, and our available credit facility will provide sufficient liquidity to address the challenges and opportunities of the current market and our expected global cash needs, including capital expenditures, working capital investments, shareholder returns, if any, and debt repurchases, if any, and scheduled interest and principal payments.
Guarantee agreements. In the normal course of business, we have agreements with financial institutions under which approximately $2.6 billion of letters of credit, bank guarantees, or surety bonds were outstanding as of March 31, 2024. Some of the outstanding letters of credit have triggering events that would entitle a bank to require cash collateralization; however, none of these triggering events have occurred. As of March 31, 2024, we had no material off-balance sheet liabilities and were not required to make any material cash distributions to our unconsolidated subsidiaries.
HAL Q1 2024 FORM 10-Q | 15
| Part I. Item 2 | Liquidity and Capital Resources | ||||||||
During the fourth quarter of 2023, we entered into a credit default swap (“CDS”) with a third-party financial institution. The notional amount of the CDS, which was $279 million at the end of March 2024, will reduce on a monthly basis over its remaining 23-month term.
Credit ratings. Our credit ratings with Standard & Poor’s (S&P) remain BBB+ for our long-term debt and A-2 for our short-term debt, with an upgrade to positive outlook from stable outlook during the fourth quarter of 2023. Our credit ratings with Moody's Investors Service (Moody's) remain A3 for our long-term debt and P-2 for our short-term debt, with a stable outlook.
Customer receivables. In line with industry practice, we bill our customers for our services in arrears and are, therefore, subject to our customers delaying or failing to pay our invoices. In weak economic environments, we may experience increased delays and failures to pay our invoices due to, among other reasons, a reduction in our customers’ cash flow from operations and their access to the credit markets, as well as unsettled political conditions.
Receivables from our primary customer in Mexico accounted for approximately 8% of our total receivables as of March 31, 2024. While we have experienced payment delays from our primary customer in Mexico, the amounts are not in dispute and we have not historically had, and we do not expect, any material write-offs due to collectability of receivables from this customer.
HAL Q1 2024 FORM 10-Q | 16
| Part I. Item 2 | Business Environment and Results of Operations | ||||||||
BUSINESS ENVIRONMENT AND RESULTS OF OPERATIONS
We operate in more than 70 countries throughout the world to provide a comprehensive range of services and products to the energy industry. Our revenue is generated from the sale of services and products to major, national, and independent oil and natural gas companies worldwide. The industry we serve is highly competitive with many substantial competitors in each segment of our business. During the first three months ended of 2024, based on the location of the services provided and products sold, 42% of our consolidated revenue was from the United States, compared to 47% of our consolidated revenue from the United States in the first three months of 2023. No other country accounted for more than 10% of our revenue for those periods.
Activity within our business segments is significantly impacted by spending on upstream exploration, development, and production programs by our customers. Also impacting our activity is the status of the global economy, which impacts oil and natural gas consumption.
Some of the more significant determinants of current and future spending levels of our customers are oil and natural gas prices and our customers' expectations about future prices, global oil supply and demand, completions intensity, the world economy, the availability of capital, government regulation, and global stability, which together drive worldwide drilling and completions activity. Additionally, during 2024, we generally expect that many of our customers in North America will continue their strategy of operating within their cash flows and generating returns rather than prioritizing production growth. Lower oil and natural gas prices usually translate into lower exploration and production budgets and lower rig count, while the opposite is usually true for higher oil and natural gas prices. Our financial performance is therefore significantly affected by oil and natural gas prices and worldwide rig activity, which are summarized in the tables below.
The table below shows the average prices for West Texas Intermediate (WTI) crude oil, United Kingdom Brent crude oil, and Henry Hub natural gas.
| Three Months Ended March 31 | Year Ended December 31 | |||||||||||||
| 2024 | 2023 | 2023 | ||||||||||||
Oil price - WTI (1) | $ | 77.55 | $ | 76.08 | $ | 77.64 | ||||||||
Oil price - Brent (1) | 83.00 | 81.17 | 82.47 | |||||||||||
Natural gas price - Henry Hub (2) | 2.13 | 2.65 | 2.54 | |||||||||||
| (1) | Oil price measured in dollars per barrel. | |||||||||||||
| (2) | Natural gas price measured in dollars per million British thermal units (Btu), or MMBtu. | |||||||||||||
The historical average rig counts based on the weekly Baker Hughes rig count data were as follows:
| Three Months Ended March 31 | Year Ended December 31 | ||||||||||
| 2024 | 2023 | 2023 | |||||||||
| U.S. Land | 602 | 744 | 669 | ||||||||
| U.S. Offshore | 21 | 16 | 18 | ||||||||
| Canada | 208 | 221 | 177 | ||||||||
| North America | 831 | 981 | 864 | ||||||||
| International | 965 | 915 | 948 | ||||||||
| Worldwide total | 1,796 | 1,896 | 1,812 | ||||||||
HAL Q1 2024 FORM 10-Q | 17
| Part I. Item 2 | Business Environment and Results of Operations | ||||||||
Business outlook
As we look into the rest of 2024, we remain positive on the oil and natural gas markets, and continue to see strength across our portfolio. We expect strong oil and natural gas demand growth for the rest of 2024 as concerns about a potential economic slowdown ease. We believe long term demand growth will be driven by economic expansion, energy security concerns, and population growth. Oil and natural gas continues to demonstrate its critical role in the global economy in meeting this long term demand, and necessitates sustained capital investment in existing and new sources of production. To meet this growing demand, production will be needed from conventional, unconventional, deep-water, shallow-water, and short and long-cycle projects. Capital discipline by major oil and natural gas producers continues to underpin a more durable and less volatile upstream spending cycle versus prior cycles.
We expect upstream investment to remain strong for the rest of 2024 and for the foreseeable future, and that demand for our products and services will grow accordingly. We expect our North America business to remain flat year-on-year despite lower natural gas prices and our international business to deliver low double digit year-on-year growth.
HAL Q1 2024 FORM 10-Q | 18
Part I. Item 2 | Results of Operations in 2024 Compared to 2023 (QTD) | |||||
RESULTS OF OPERATIONS IN 2024 COMPARED TO 2023
Three Months Ended March 31, 2024 Compared with Three Months Ended March 31, 2023
| Three Months Ended March 31 | Favorable | Percentage | ||||||||||||
| Millions of dollars | 2024 | 2023 | (Unfavorable) | Change | ||||||||||
| Revenue: | ||||||||||||||
| By operating segment: | ||||||||||||||
| Completion and Production | $ | 3,373 | $ | 3,409 | $ | (36) | (1) | % | ||||||
| Drilling and Evaluation | 2,431 | 2,268 | 163 | 7 | ||||||||||
| Total revenue | $ | 5,804 | $ | 5,677 | $ | 127 | 2 | % | ||||||
| By geographic region: | ||||||||||||||
| North America | $ | 2,546 | $ | 2,765 | $ | (219) | (8) | % | ||||||
| Latin America | 1,108 | 915 | 193 | 21 | ||||||||||
| Europe/Africa/CIS | 729 | 662 | 67 | 10 | ||||||||||
| Middle East/Asia | 1,421 | 1,335 | 86 | 6 | ||||||||||
| Total revenue | $ | 5,804 | $ | 5,677 | $ | 127 | 2 | % | ||||||
| Operating income: | ||||||||||||||
| By operating segment: | ||||||||||||||
| Completion and Production | $ | 688 | $ | 666 | $ | 22 | 3 | % | ||||||
| Drilling and Evaluation | 398 | 369 | 29 | 8 | ||||||||||
| Total operations | 1,086 | 1,035 | 51 | 5 | ||||||||||
| Corporate and other | (65) | (58) | (7) | (12) | % | |||||||||
| SAP S4 upgrade expense | (34) | — | (34) | n/m | ||||||||||
| Total operating income | $ | 987 | $ | 977 | $ | 10 | 1 | % | ||||||
| n/m = not meaningful | ||||||||||||||
Operating Segments
Completion and Production
Completion and Production revenue in the first quarter of 2024 was $3.4 billion, down slightly when compared to the first quarter of 2023. Operating income in the first quarter of 2024 was $688 million, an increase of $22 million, or 3%, when compared to the first quarter of 2023. These results were primarily driven by reduced pressure pumping services in U.S. land. Partially offsetting this decline were higher completion tool sales in the Western Hemisphere and Europe/Africa, improved stimulation activity in Latin America, increased cementing activity internationally, and higher artificial lift activity in North America. Operating income increased due to completion tool product sales and activity and pricing in artificial lift and cementing services.
Drilling and Evaluation
Drilling and Evaluation revenue in the first quarter of 2024 was $2.4 billion, an increase of $163 million, or 7%, when compared to the first quarter of 2023. Operating income in the first quarter of 2024 was $398 million, an increase of $29 million, or 8%, when compared to the first quarter of 2023. These results were driven by higher drilling-related services in the Middle East and North America, improved activity in multiple product service lines in Latin America, and higher fluid services in Europe. Partially offsetting these improvements were lower project management activity in the Middle East/Asia, reduced wireline activity in North America, reduced drilling services in Europe/Africa, and lower fluid services in Asia.
HAL Q1 2024 FORM 10-Q | 19
Part I. Item 2 | Results of Operations in 2024 Compared to 2023 (QTD) | |||||
Geographic Regions
North America
North America revenue in the first quarter of 2024 was $2.5 billion, an 8% decrease compared to the first quarter of 2023. This decline was primarily driven by lower pressure pumping services in U.S. land along with lower wireline activity throughout the region. Partially offsetting these declines were improved completion tool sales, higher pressure pumping services, and improved drilling-related services in the Gulf of Mexico along with higher artificial lift activity in U.S. land.
Latin America
Latin America revenue in the first quarter of 2024 was $1.1 billion, a 21% increase compared to the first quarter of 2023, due to higher drilling-related services and increased software sales in Mexico, improved pressure pumping services and fluid services in Argentina, and increased activity in multiple product service lines in Brazil and Ecuador. Partially offsetting these improvements was lower fluid services in Brazil and the Caribbean.
Europe/Africa/CIS
Europe/Africa/CIS revenue in the first quarter of 2024 was $729 million, a 10% increase compared to the first quarter of 2023. This increase was primarily driven by higher completion tool sales in the region and improved fluid services in Norway and the Caspian Area. Partially offsetting these improvements was lower drilling services in the region.
Middle East/Asia
Middle East/Asia revenue in the first quarter of 2024 was $1.4 billion, a 6% increase compared to the first quarter of 2023, resulting from improved activity in multiple product service lines in Kuwait, Saudi Arabia, and Oman. Partially offsetting these improvements were decreased project management activity in India and Saudi Arabia and lower fluid services in Asia.
Other Operating Items
SAP S4 Upgrade Expense. During 2023 we began our migration to SAP S4, which we expect to complete by the end of 2025. During the first quarter of 2024, we recognized $34 million of expense on our SAP S4 migration.
Nonoperating Items
Argentina Impairment on Investment. In 2022 and 2023, we executed a series of loans to a third party and received notes that are to be repaid in US dollars upon maturity or earlier if certain conditions are met. During the three months ended March 31, 2024, we recorded a loss of $38 million due to the fair value decrease in one of the notes, resulting from the deterioration in the outlook of the debtor’s liquidity and financial projections.
Egypt Currency Impact. During the quarter ended March 31, 2024, the Egyptian pound devalued by approximately 35% relative to the US dollar. Consequently, we incurred a loss of $38 million for the three months ended March 31, 2024 due to the devaluation of the currency in Egypt.
Income Tax Provision. During the three months ended March 31, 2024, we recorded a total income tax provision of $178 million on a pre-tax income of $787 million, resulting in an effective tax rate of 22.6% for the quarter. During the three months ended March 31, 2023, we recorded a total income tax provision of $174 million on a pre-tax income of $829 million, resulting in an effective tax rate of 21.0% for the quarter.
Pillar Two. The Organization for Economic Co-operation and Development enacted model rules for a new global minimum tax framework, also known as Pillar Two, and certain governments globally have enacted, or are in the process of enacting, legislation considering these model rules. These rules did not have a material impact on our taxes for the three months ended March 31, 2024.
HAL Q1 2024 FORM 10-Q | 20
Part I. Item 2 | Results of Operations in 2024 Compared to 2023 (QTD) | |||||
Internal Revenue Service Notice of Proposed Adjustment. We are subject to taxes in the United States and in numerous jurisdictions where we operate or where our subsidiaries are organized. Our tax returns are routinely subject to examination by the taxing authorities in the jurisdictions where we file tax returns. In most cases we are no longer subject to examination by tax authorities for years before 2012. The only significant operating jurisdiction that has tax filings under review or subject to examination by the tax authorities is the United States. Our United States federal income tax filings for tax years 2016 through 2023, including carry back of 2016 net operating losses to 2014, are currently under review or remain open for review by the Internal Revenue Service (the IRS).
On September 28, 2023, we received a NOPA from the IRS covering our 2016 U.S. tax return. The NOPA proposed an adjustment to reclassify approximately 95% of the $3.5 billion termination fee paid to Baker Hughes in 2016 from an ordinary expense deduction to a capital loss. The termination fee was paid to Baker Hughes under the merger agreement after antitrust regulators in multiple jurisdictions failed to approve our proposed merger. It is common commercial practice to include a termination fee in a merger agreement to compensate the target for damages incurred when the acquisition does not go forward. The IRS’s long-understood position at the time of the payment had been to treat such payments as an ordinary and necessary business expense. We strongly disagree with the proposed adjustment on both a factual and legal basis, and we plan to vigorously contest it.
We expect that resolving this dispute will take substantial time. In December 2023, we initiated the IRS administrative appeals process, which may take more than 12 months to complete. Failing a resolution through that process, the matter would ultimately be resolved by the United States federal courts.
We regularly assess the likelihood of adverse outcomes resulting from tax examinations to determine the adequacy of our tax reserves, and we believe our income tax reserves are appropriately provided for all open tax years. We cannot assure you that the matter will be determined in our favor or against us, and if the matter is ultimately determined unfavorably to us, it could have a material adverse impact on our results of operations and cash flows. Based on tax attributes currently available, we estimate that, should the IRS's position prevail through its appellate process and subsequent litigation, the proposed adjustment could result in cash taxes due of approximately $650 million (plus interest thereon in the case of amounts due for previous tax years). Our estimates are calculated under current tax law and on the bases of our assumptions regarding taxable income and loss and other tax attributes over the relevant period, which law could change and which assumptions could and likely will differ materially from actual results. In any event, no payment of any additional tax is currently required, nor do we anticipate that the proposed adjustment would materially and adversely impact our ability to meet our expected uses of cash, including future capital expenditures, working capital investments, and scheduled debt repayments, or our ability to return cash to shareholders, even if a final determination of the matter is reached that is adverse to us.
HAL Q1 2024 FORM 10-Q | 21
| Part I. Item 2 | Forward-Looking Information | ||||||||
FORWARD-LOOKING INFORMATION
The Private Securities Litigation Reform Act of 1995 provides safe harbor provisions for forward-looking information. Forward-looking information is based on projections and estimates, not historical information. Some statements in this Form 10-Q are forward-looking and use words like “may,” “may not,” “believe,” “do not believe,” “plan,” “estimate,” “intend,” “expect,” “do not expect,” “anticipate,” “do not anticipate,” “should,” “likely,” and other expressions. We may also provide oral or written forward-looking information in our statements and other materials we release to the public. Forward-looking information involves risk and uncertainties and reflects our best judgment based on current information. Our results of operations can be affected by inaccurate assumptions we make or by known or unknown risks and uncertainties. In addition, other factors may affect the accuracy of our forward-looking information. As a result, no forward-looking information can be guaranteed. Actual events and the results of our operations may vary materially.
We do not assume any responsibility to publicly update any of our forward-looking statements regardless of whether factors change as a result of new information, future events, or for any other reason. You should review any additional disclosures we make in our press releases and Forms 10-K, 10-Q, and 8-K filed with or furnished to the SEC. We also suggest that you listen to our quarterly earnings release conference calls with financial analysts.
Item 3. Quantitative and Qualitative Disclosures About Market Risk
For quantitative and qualitative disclosures about market risk, see Part II, Item 7(a), “Quantitative and Qualitative Disclosures About Market Risk,” in our 2023 Annual Report on Form 10-K. Our exposure to market risk has not changed materially since December 31, 2023.
Item 4. Controls and Procedures
In accordance with the Securities Exchange Act of 1934 Rules 13a-15 and 15d-15, we carried out an evaluation, under the supervision and with the participation of management, including our Chief Executive Officer and Chief Financial Officer, of the effectiveness of our disclosure controls and procedures as of the end of the period covered by this report. Based on that evaluation, our Chief Executive Officer and Chief Financial Officer concluded that our disclosure controls and procedures were effective as of March 31, 2024 to provide reasonable assurance that information required to be disclosed in our reports filed or submitted under the Exchange Act is recorded, processed, summarized, and reported within the time periods specified in the Securities and Exchange Commission’s rules and forms. Our disclosure controls and procedures include controls and procedures designed to ensure that information required to be disclosed in reports filed or submitted under the Exchange Act is accumulated and communicated to our management, including our Chief Executive Officer and Chief Financial Officer, as appropriate, to allow timely decisions regarding required disclosure.
There has been no change in our internal control over financial reporting that occurred during the quarter ended March 31, 2024 that has materially affected, or is reasonably likely to materially affect, our internal control over financial reporting.
HAL Q1 2024 FORM 10-Q | 22
| Part II. Item 1 | Legal Proceedings | ||||||||
PART II. OTHER INFORMATION
Item 1. Legal Proceedings
Information related to Item 1. Legal Proceedings is included in Note 8 to the condensed consolidated financial statements.
Item 1(a). Risk Factors
The statements in this section describe the known material risks to our business and should be considered carefully. As of March 31, 2024, there have been no material changes in risk factors previously disclosed in our Annual Report on Form 10-K for the fiscal year ended December 31, 2023.
HAL Q1 2024 FORM 10-Q | 23
| Part II. Item 2 | Unregistered Sales of Equity Securities and Use of Proceeds | |||||
Item 2. Unregistered Sales of Equity Securities and Use of Proceeds
Following is a summary of our repurchases of our common stock during the three months ended March 31, 2024.
| Period | Total Number of Shares Purchased (a) | Average Price Paid per Share | Total Number of Shares Purchased as Part of Publicly Announced Plans or Programs (b) | Maximum Number (or Approximate Dollar Value) of Shares that may yet be Purchased Under the Program (b) | |||||||||||||
| January 1 - 31 | 1,669,960 | $35.28 | 1,391,900 | $4,001,151,528 | |||||||||||||
| February 1 - 29 | 3,082,441 | $34.94 | 3,029,255 | $3,895,397,337 | |||||||||||||
| March 1 - 31 | 3,361,040 | $36.45 | 2,585,280 | $3,800,012,853 | |||||||||||||
| Total | 8,113,441 | $35.64 | 7,006,435 | ||||||||||||||
| (a) | Of the 8,113,441 shares purchased during the three-month period ended March 31, 2024, 1,107,006 were acquired from employees in connection with the settlement of income tax and related benefit withholding obligations arising from vesting in restricted stock grants. These shares were not part of a publicly announced program to repurchase common stock. | ||||||||||||||||
| (b) | Our Board of Directors has authorized a program to repurchase our common stock from time to time. Approximately $3.8 billion remained authorized for repurchases as of March 31, 2024. From the inception of this program in February of 2006 through March 31, 2024, we repurchased approximately 260 million shares of our common stock for a total cost of approximately $10.3 billion. | ||||||||||||||||
Item 3. Defaults Upon Senior Securities
None.
Item 4. Mine Safety Disclosures
Our barite and bentonite mining operations, in support of our fluid services business, are subject to regulation by the U.S. Mine Safety and Health Administration under the Federal Mine Safety and Health Act of 1977. Information concerning mine safety violations or other regulatory matters required by section 1503(a) of the Dodd-Frank Wall Street Reform and Consumer Protection Act and Item 104 of Regulation S-K (17 CFR 229.104) is included in Exhibit 95 to this quarterly report.
HAL Q1 2024 FORM 10-Q | 24
| Part II. Item 5 | Other Information | ||||||||
Item 5. Other Information
During the three months ended March 31, 2024, the following officers of the Company adopted or terminated a “Rule 10b5-1 trading arrangement” or “non-Rule 10b5-1 trading arrangement,” as each term is defined in Item 408 of Regulation S-K, and no trading arrangements were adopted or terminated by directors of the Company.
| Reporting Officer | Title | Reporting Action | Plan Start Date | Plan End Date | Aggregated Shares Covered | Intended to Satisfy Rule 10b5-1? | ||||||||||||||
| Yes | ||||||||||||||||||||
| Yes | ||||||||||||||||||||
| Yes | ||||||||||||||||||||
| Yes | ||||||||||||||||||||
| Yes | ||||||||||||||||||||
| Yes | ||||||||||||||||||||
| Yes | ||||||||||||||||||||
| Yes | ||||||||||||||||||||
| Yes | ||||||||||||||||||||
HAL Q1 2024 FORM 10-Q | 25
| Part II. Item 6 | Exhibits | ||||||||
Item 6. Exhibits
| * | 31.1 | |||||||
| * | 31.2 | |||||||
| ** | 32.1 | |||||||
| ** | 32.2 | |||||||
| * | 95 | |||||||
| * | 101.INS | XBRL Instance Document - the instance document does not appear in the Interactive Data File because its XBRL tags are embedded within the Inline XBRL document | ||||||
| * | 101.SCH | XBRL Taxonomy Extension Schema Document | ||||||
| * | 101.CAL | XBRL Taxonomy Extension Calculation Linkbase Document | ||||||
| * | 101.LAB | XBRL Taxonomy Extension Label Linkbase Document | ||||||
| * | 101.PRE | XBRL Taxonomy Extension Presentation Linkbase Document | ||||||
| * | 101.DEF | XBRL Taxonomy Extension Definition Linkbase Document | ||||||
| * | 104 | Cover Page Interactive Data File - the cover page interactive data file does not appear in the Interactive Data File because its XBRL tags are embedded within the Inline XBRL document | ||||||
| * | Filed with this Form 10-Q. | |||||||
| ** | Furnished with this Form 10-Q. | |||||||
HAL Q1 2024 FORM 10-Q | 26
SIGNATURES
Pursuant to the requirement of the Securities Exchange Act of 1934, the registrant has duly caused this report to be signed on its behalf by the undersigned thereunto duly authorized.
HALLIBURTON COMPANY
| /s/ Eric J. Carre | /s/ Charles E. Geer, Jr. | ||||
| Eric J. Carre | Charles E. Geer, Jr. | ||||
| Executive Vice President and | Senior Vice President and | ||||
| Chief Financial Officer | Chief Accounting Officer | ||||
Date: April 24, 2024
HAL Q1 2024 FORM 10-Q | 27