UNITED STATES
SECURITIES AND EXCHANGE COMMISSION
WASHINGTON, D.C. 20549
FORM | ||
For the fiscal year ended December 31 , 2023
or
For the transition period from __________ to __________
Commission File Number 000-29480
| (Exact name of registrant as specified in its charter) | ||
| (State or other jurisdiction of incorporation or organization) | (I.R.S. Employer Identification No.) | |||||||||||||
| (Address of principal executive offices) | (Zip Code) | |||||||||||||
(360 ) 943-1500
(Registrant’s telephone number, including area code)
Securities registered pursuant to Section 12(b) of the Act:
| Title of each class | Trading Symbol(s) | Name of each exchange on which registered | ||||||
Securities registered pursuant to Section 12(g) of the Act:
None
Indicate by check mark if the registrant is a well-known seasoned issuer, as defined in Rule 405 of the Securities Act.
Indicate by check mark if the registrant is not required to file reports pursuant to Section 13 or Section 15(d) of the Act.
Yes ☐ No ☒
Indicate by check mark whether the registrant (1) has filed all reports required to be filed by Section 13 or 15(d) of the Securities Exchange Act of 1934 during the preceding 12 months (or for such shorter period that the registrant was required to file such reports), and (2) has been subject to such filing requirements for the past 90 days.
Indicate by check mark whether the registrant has submitted electronically every Interactive Data File required to be submitted pursuant to Rule 405 of Regulation S-T (§232.405 of this chapter) during the preceding 12 months (or for such shorter period that the registrant was required to submit such files).
Indicate by check mark whether the registrant is a large accelerated filer, an accelerated filer, a non-accelerated filer, smaller reporting company, or an emerging growth company. See the definitions of "large accelerated filer", "accelerated filer", "smaller reporting company," and "emerging growth company" in Rule 12b-2 of the Exchange Act
Large accelerated filer | ☐ | ☒ | |||||||||
Non-accelerated filer | ☐ | Smaller reporting company | |||||||||
Emerging growth company | |||||||||||
If an emerging growth company, indicate by check mark if the registrant has elected not to use the extended transition period for complying with any new or revised financial accounting standards pursuant to Section 13(a) of the Exchange Act. ☐
Indicate by check mark whether the registrant has filed a report on and attestation to its management's assessment of the effectiveness of its internal control over financial reporting under Section 404(b) of the Sarbanes-Oxley Act (15 U.S.C 7262(b)) by the registered public accounting firm that prepared or issued its audit report. ☒
If securities are registered pursuant to Section 12(b) of the Act, indicate by check mark whether the financial statements of the registrant included in the filing reflect the correction of an error to previously issued financial statements. ☐
Indicate by check mark whether any of those error corrections are restatements that required a recovery analysis of incentive-based compensation received by any of the registrant’s executive officers during the relevant recovery period pursuant to §240.10D-1(b). ☐
Indicate by check mark whether the registrant is a shell company (as defined in Rule 12b-2 of the Exchange Act).
Yes ☐ No ☒
The aggregate market value of the voting and non-voting common equity held by non-affiliates of the registrant as of June 30, 2023, based on the closing price of its common stock on such date, on the NASDAQ Global Select Market, of $16.17 per share, and 34,542,512 shares held by non-affiliates was $558,552,419 . The registrant had 34,906,233 shares of common stock outstanding as of February 19, 2024.
DOCUMENTS INCORPORATED BY REFERENCE
Portions of the registrant’s definitive Proxy Statement for the 2024 Annual Meeting of Shareholders are incorporated by reference into Part III of this Annual Report on Form 10-K where indicated. The 2024 Proxy Statement will be filed with the U.S. Securities and Exchange Commission within 120 days after the end of the fiscal year to which this report relates.
HERITAGE FINANCIAL CORPORATION AND SUBSIDIARIES
FORM 10-K
December 31, 2023
TABLE OF CONTENTS
| Page | |||||||||||
| ITEM 1. | |||||||||||
| ITEM 1A. | |||||||||||
| ITEM 1B. | |||||||||||
ITEM 1C | |||||||||||
| ITEM 2. | PROPERTIES | ||||||||||
| ITEM 3. | |||||||||||
| ITEM 4. | |||||||||||
| ITEM 5. | |||||||||||
| ITEM 6. | |||||||||||
| ITEM 7. | |||||||||||
| ITEM 7A. | |||||||||||
| ITEM 8. | |||||||||||
REPORT OF INDEPENDENT REGISTERED PUBLIC ACCOUNTING FIRM (PCAOB ID: | |||||||||||
2
| NOTE 1. | |||||||||||
| NOTE 2. | |||||||||||
| NOTE 3. | |||||||||||
| NOTE 4. | |||||||||||
NOTE 5. | |||||||||||
NOTE 6. | |||||||||||
NOTE 7. | |||||||||||
NOTE 8. | |||||||||||
NOTE 9. | |||||||||||
NOTE 10. | |||||||||||
NOTE 11. | |||||||||||
NOTE 12. | |||||||||||
NOTE 13. | |||||||||||
NOTE 14. | |||||||||||
NOTE 15. | |||||||||||
NOTE 16. | |||||||||||
NOTE 17. | |||||||||||
NOTE 18. | |||||||||||
NOTE 19. | |||||||||||
NOTE 20. | |||||||||||
NOTE 21. | |||||||||||
| ITEM 9. | |||||||||||
| ITEM 9A. | |||||||||||
| ITEM 9B. | |||||||||||
| ITEM 9C. | |||||||||||
| ITEM 10. | |||||||||||
| ITEM 11. | |||||||||||
| ITEM 12. | |||||||||||
| ITEM 13. | |||||||||||
| ITEM 14. | |||||||||||
| ITEM 15. | |||||||||||
| ITEM 16. | |||||||||||
3
Glossary of Acronyms, Abbreviations, and Terms
The acronyms, abbreviations, and terms listed below are used in various sections of this Annual Report on Form 10-K. As used throughout this report, the terms “we,” “our,” or “us” refer to Heritage Financial Corporation and its consolidated subsidiaries, unless the context otherwise requires.
| ACL | Allowance for credit losses | ||||
| AOCI | Accumulated other comprehensive income (loss), net | ||||
| ASC | Accounting Standards Codification | ||||
| ASU | Accounting Standards Update | ||||
| Bank | Heritage Bank | ||||
| BOLI | Bank owned life insurance | ||||
| BTFP | Bank Term Funding Program | ||||
| CECL | Current Expected Credit Loss | ||||
| CMO | Collateralized Mortgage Obligation | ||||
| Company | Heritage Financial Corporation | ||||
| CRE | Commercial real estate | ||||
| DEI | Diversity, Equity, and Inclusion | ||||
| DFI | Division of Banks of the Washington State Department of Financial Institutions | ||||
| Economic Growth Act | Economic Growth, Regulatory Relief and Consumer Protection Act | ||||
| Equity Plan | Heritage Financial Corporation 2023 Omnibus Equity Plan | ||||
| Exchange Act | Securities Exchange Act of 1934, as amended | ||||
| FASB | Financial Accounting Standards Board | ||||
| FDIC | Federal Deposit Insurance Corporation | ||||
| Federal Reserve | Board of Governors of the Federal Reserve System | ||||
FRB | Federal Reserve Bank of San Francisco | ||||
| FHLB | Federal Home Loan Bank of Des Moines | ||||
| FOMC | Federal Open Market Committee within the Federal Reserve System | ||||
| Form 10-K | Company's Annual Report on Form 10-K | ||||
| GAAP | U.S. Generally Accepted Accounting Principles | ||||
| LIBOR | London Interbank Offering Rate | ||||
| LIHTC | Low-Income Housing Tax Credit | ||||
| NMTC | New Market Tax Credit | ||||
| MBS | Mortgage-backed security | ||||
| OCC | Office of the Comptroller of the Currency | ||||
| PCD | Purchased Credit Deteriorated; loans purchased with evidence of credit deterioration since origination for which it is probable that not all contractually required payments will be collected; accounted for under FASB ASC 326 | ||||
| Plan | Heritage Financial Corporation 401(k) Profit Sharing Plan and Trust | ||||
| Proxy Statement | Definitive proxy statement for the annual meeting of shareholders to be held on May 6, 2024 | ||||
| Related Party | Certain directors, executive officers and their affiliates | ||||
| ROU | Right-of-Use | ||||
| SBA | Small Business Administration | ||||
| SEC | Securities and Exchange Commission | ||||
| SM | Special Mention | ||||
| SOFR | Secured Overnight Financing Rate | ||||
| SS | Substandard | ||||
| TDR | Troubled debt restructured | ||||
| Unfunded Commitments | Off-balance sheet credit exposures such as loan commitments, standby letters of credit, financial guarantees, and other similar instruments | ||||
| USDA | United States Department of Agriculture | ||||
4
CAUTIONARY NOTE REGARDING FORWARD LOOKING STATEMENTS
This Form 10-K may contain forward-looking statements within the meaning of the Private Securities Litigation Reform Act of 1995. Forward-looking statements are not statements of historical fact, are based on certain assumptions and often include the words “believes,” “expects,” “anticipates,” “estimates,” “forecasts,” “intends,” “plans,” “targets,” “potentially,” “probably,” “projects,” “outlook” or similar expressions or future or conditional verbs such as “may,” “will,” “should,” “would” and “could.” These statements relate to our financial condition, results of operations, beliefs, plans, objectives, goals, expectations, assumptions and statements about future performance or business. The Company cautions readers not to place undue reliance on any forward-looking statements. Moreover, you should treat these statements as speaking only as of the date they are made and based only on information then actually known to the Company. The Company does not undertake and specifically disclaims any obligation to revise any forward-looking statements to reflect the occurrence of anticipated or unanticipated events or circumstances after the date of such statements whether as a result of new information, future events or otherwise. These forward-looking statements are subject to known and unknown risks, uncertainties and other factors that could cause our actual results for future periods to differ materially from those expressed in any forward-looking statements by, or on behalf of, us, and could negatively affect the Company’s operating results and stock price performance. These risks include, but are not limited to:
•potential adverse impacts to economic conditions nationally or in our local market areas, other markets where the Company has lending relationships, or to other aspects of the Company’s business operations or financial markets, including, without limitation, as a result of employment levels, labor shortages and the effects of inflation, a potential recession or slowed economic growth;
•changes in the interest rate environment, including the past increases in the Federal Reserve benchmark rate and duration at which such increased interest rate levels are maintained, which could adversely affect our revenues and expenses, the value of assets and obligations, and the availability and cost of capital and liquidity;
•the credit risks of lending activities, including changes in the level and trend of loan delinquencies and write-offs and changes in our ACL on loans and provision for credit losses on loans that may be affected by deterioration in the housing and CRE markets, which may lead to increased losses and nonperforming assets in our loan portfolio, and may result in our ACL on loans no longer being adequate to cover actual losses, and require us to increase our ACL on loans;
•the impact of continuing elevated inflation and the current and future monetary policies of the Federal Reserve in response thereto;
•changes in the levels of general interest rates, and the relative differences between short-term and long-term interest rates, deposit interest rates, our net interest margin and funding sources;
•the impact of repricing and competitors' pricing initiatives on loan and deposit products;
•fluctuations in the demand for loans, the number of unsold homes and other properties and fluctuations in real estate values in our market areas;
•results of examinations of us by the bank regulators, including the possibility that any such regulatory authority may, among other things, initiate an enforcement action against the Company or our bank subsidiary which could require us to increase our ACL on loans, write-down assets, change our regulatory capital position, affect our ability to borrow funds or maintain or increase deposits, or impose additional requirements on us, any of which could affect our ability to continue our growth through mergers, acquisitions or similar transactions and adversely affect our liquidity and earnings;
•legislative or regulatory changes that adversely affect our business, including changes in banking, securities and tax law, in regulatory policies and principles, or the interpretation of regulatory capital or other rules;
•our ability to attract and retain deposits;
•liquidity issues, including our ability to borrow funds or raise additional capital, if necessary;
•our ability to control operating costs and expenses;
•effects of critical accounting policies and judgments, including the use of estimates in determining fair value of certain of our assets, which estimates may prove to be incorrect and result in significant declines in valuation;
•the effectiveness of our risk management framework;
•staffing fluctuations in response to product demand or the implementation of corporate strategies that affect our workforce and potential associated charges;
•our ability to keep pace with the rate of technological advances;
•disruptions, security breaches, or other adverse events, failures or interruptions in, or attacks on, our information technology systems or on the third-party vendors who perform several of our critical processing functions;
•our ability to retain key members of our senior management team;
•costs and effects of litigation, including settlements and judgments;
•our ability to implement our business strategies and manage our growth;
•our ability to successfully integrate any assets, liabilities, customers, systems, and management personnel we may acquire into our operations and our ability to realize related revenue synergies and cost savings within expected time frames or at all, and any goodwill charges related thereto and costs or difficulties relating to integration matters, including but not limited to customer and employee retention, which might be greater than expected;
•future goodwill impairment due to changes in our business, market conditions, or other factors;
•changes arising from acquiring assets or expanding into new geographic markets, products, or services;
•increased competitive pressures among financial service companies;
•changes in consumer spending, borrowing and savings habits;
•the availability of resources to address changes in laws, rules, or regulations or to respond to regulatory actions;
•our ability to pay dividends on our common stock;
•the quality and composition of our securities portfolio and the impact of any adverse changes in the securities markets, including on market liquidity;
•inability of key third-party providers to perform their obligations to us;
5
•changes in accounting policies and practices, as may be adopted by the financial institution regulatory agencies or the FASB, including additional guidance and interpretation on accounting issues and details of the implementation of new accounting methods;
•the impact of bank failures or adverse developments at other banks and the related negative press about the banking industry in general on investor and depositor sentiment;
•the effects of climate change, severe weather events, natural disasters, pandemics, epidemics and other public health crises, acts of war or terrorism, and other external events on our business;
•other economic, competitive, governmental, regulatory, and technological factors affecting our operations, pricing, products and services; and
•other risks described elsewhere in this Form 10-K and in our other reports filed with or furnished to the SEC, which are available on our website at www.heritagebanknw.com and on the SEC's website at www.sec.gov.
PART I
ITEM 1. BUSINESS
Overview
Heritage Financial Corporation is a bank holding company that was incorporated in the State of Washington in August 1997. We are primarily engaged in the business of planning, directing, and coordinating the business activities of our wholly owned subsidiary and single reportable segment, Heritage Bank.
Heritage Bank is headquartered in Olympia, Washington and conducts business from its 50 branch offices located throughout Washington State, the greater Portland, Oregon area, Eugene, Oregon and Boise, Idaho as of December 31, 2023. The deposits of the Bank are insured by the FDIC.
Our business consists primarily of commercial lending and deposit relationships with small and medium-sized businesses and their owners in our market areas and attracting deposits from the general public. We also make real estate construction and land development loans, consumer loans and residential real estate loans for sale or investment purposes on residential properties located primarily in our market.
Business Strategy
We are committed to being the leading commercial community bank in the Pacific Northwest by continuously improving customer satisfaction, employee empowerment, community investment and shareholder value. Our commitment defines our relationships, sets expectations for our actions and directs decision-making in these four fundamental areas. We will seek to achieve our business goals through the following strategies:
Expand geographically as opportunities present themselves. We are committed to continuing the controlled expansion of our franchise through strategic acquisitions designed to increase our market share and enhance franchise value. We believe that consolidation across the community bank landscape will continue to take place and further believe that, with our capital and liquidity positions, our approach to credit management, and our extensive acquisition experience, we are well-positioned to take advantage of acquisitions or other business opportunities in our market areas. In markets where we wish to enter or expand our business, we will also consider opening de novo branches, typically in conjunction with hiring commercial lending and deposit teams. In the past, we have successfully integrated acquired institutions and opened de novo branches. We will continue to be disciplined and opportunistic as it pertains to future acquisitions and de novo branching, focusing on the Pacific Northwest markets we know and understand.
Focus on asset quality. A strong credit culture is a high priority for us. We have a well-developed credit approval structure that has enabled us to maintain a standard of asset quality that we believe has moderate and manageable risk while at the same time allowing us to achieve our lending objectives. We will continue to focus on loan types and markets that we know well and where we have a historical record of success. We focus on loan relationships that are well-diversified in both size and industry types. With respect to commercial business lending, which is our predominant lending activity, we view ourselves as cash-flow lenders obtaining additional support from realistic collateral values, personal guarantees and other secondary sources of repayment. We have a problem loan resolution process that is focused on quick detection and implementing feasible solutions and subject our loans to periodic internal loan reviews.
Maintain a strong balance sheet. In addition to our focus on underwriting, we believe the strength of our balance sheet provides us with the flexibility to manage through a variety of scenarios including additional growth-related activities. As of December 31, 2023, our liquidity position was $225.0 million in cash and cash equivalents and $1.87 billion in total investment securities. See also "Item 7. Management's Discussion and Analysis of Financial Condition and Results of Operations — Liquidity and Capital Resources" of this Form 10-K. As of December 31, 2023, the regulatory capital ratios of the Bank were in excess of the levels required for “well-capitalized” status, and our consolidated common equity tier 1 capital ratio, leverage ratio, Tier 1 capital ratio, and total capital ratio were 12.9%, 10.0%, 13.3% and 14.1%, respectively.
Focused deposit growth. Our strategic focus is to continuously grow deposits with emphasis on total relationship banking with our business and retail customers. We continue to seek to increase our market share in the communities we serve by providing exceptional customer service, focusing on relationship development with local businesses and strategic branch expansion. Our primary focus is to maintain a high level of non-maturity deposits to internally fund our loan growth with a low reliance on maturity (certificate) deposits. At December 31, 2023, our non-maturity deposits were 87.6% of our total deposits. Our technology-based products, including online personal financial management, business cash management and business remote deposit products enable us to compete effectively with banks of all sizes. Our retail and commercial management teams
6
are well-seasoned and have strong ties to the communities we serve with a strong focus on relationship building and customer service.
Emphasize business relationships with a focus on commercial lending. We will continue to market primarily commercial business loans and the deposit balances that accompany these relationships. Our seasoned lending staff has extensive knowledge and can add value through a focused advisory role that we believe strengthens our customer relationships and develops loyalty. We currently have and will seek to maintain a diversified portfolio of lending relationships without significant concentrations in any industry.
Recruit and retain highly competent personnel to execute our strategies. Our compensation and staff development programs are aligned with our strategies to grow our loans and non-maturity deposits while maintaining our focus on asset quality. Our incentive systems are designed to achieve balanced, high quality asset growth while maintaining appropriate mechanisms to reduce or eliminate incentive payments when appropriate. Our equity compensation programs and retirement benefits are designed to build and encourage employee ownership at all levels of the Company and we align employee performance objectives with corporate growth strategies and shareholder value. We have a strong corporate culture, which is supported by our commitment to internal development and promotion from within as well as the retention of management and officers in key roles.
There have been no material changes to our business strategy during the years ended December 31, 2023 and 2022.
History
The Bank was established in 1927 as a federally-chartered mutual savings bank. In 1992, the Bank converted to a state-chartered mutual savings bank under the name Heritage Savings Bank. Through the mutual holding company reorganization of the Bank and the subsequent conversion of the mutual holding company, the Bank became a stock savings bank and a wholly-owned subsidiary of the Company effective August 1997. Effective September 1, 2004, Heritage Savings Bank switched its charter from a state-chartered savings bank to a state-chartered commercial bank and changed its legal name from Heritage Savings Bank to Heritage Bank. The following table lists major combinations completed by the Company:
| Type of Combination | Date of Combination | Acquired Holding Company Name | Acquired Bank Name | Total Assets Acquired (in millions) | ||||||||||||||||||||||
| Acquisition | June 1998 | North Pacific Bancorporation | North Pacific Bank | $ | 85 | |||||||||||||||||||||
| Acquisition | March 1999 | Washington Independent Bancshares, Inc. | Central Valley Bank | 61 | ||||||||||||||||||||||
| Acquisition | June 2006 | Western Washington Bancorporation | Washington State Bank, N.A. | 57 | ||||||||||||||||||||||
| FDIC Assisted Purchase | August 2010 | n/a | Cowlitz Bank | 345 | ||||||||||||||||||||||
| FDIC Assisted Purchase | November 2010 | n/a | Pierce Commercial Bank | 211 | ||||||||||||||||||||||
| Acquisition | January 2013 | n/a | Northwest Commercial Bank | 65 | ||||||||||||||||||||||
| Acquisition | July 2013 | Valley Community Bancshares, Inc. | Valley Bank | 237 | ||||||||||||||||||||||
| Merger | May 2014 | Washington Banking Company | Whidbey Island Bank | 1,657 | ||||||||||||||||||||||
| Acquisition | January 2018 | Puget Sound Bancorp, Inc. | Puget Sound Bank | 571 | ||||||||||||||||||||||
| Acquisition | July 2018 | Premier Commercial Bancorp | Premier Community Bank | 387 | ||||||||||||||||||||||
Description of Business
Retail Banking
We offer a full range of products and services to customers for personal and business banking needs designed to attract both short-term and long-term deposits. Deposits are our primary source of funds. Our personal and business banking customers have the option of selecting from a variety of accounts. The major categories of deposit accounts that we offer are described below. These accounts, with the exception of noninterest demand accounts, generally earn interest at rates established by management based on competitive market factors and management’s desire to increase or decrease certain types or maturities of deposits.
Noninterest Demand Deposits. Deposits are noninterest bearing and may be charged service fees based on activity and balances.
Interest Bearing Demand Deposits. Deposits are interest bearing and may be charged service fees based on activity and balances. Interest bearing demand deposits pay interest, but require a higher minimum balance to avoid service charges.
Money Market Accounts. Deposits pay an interest rate that is tiered depending on the balance maintained in the account. Minimum opening balances vary.
Savings Accounts. Deposits are interest bearing provided that a minimum balance is maintained to avoid service charges.
Certificate of Deposit Accounts. Deposits require a minimum deposit of $2,500 and have maturities ranging from three months to five years. Jumbo certificate of deposit accounts are offered in amounts of $100,000 or more for terms of seven days to one year.
7
Our personal checking accounts feature an array of benefits and options, including online banking, online statements, mobile banking with mobile deposit, VISA debit cards and access to more than 40,000 surcharge free Automated Teller Machines through the MoneyPass network.
We also offer investment advice through a Wealth Management department that provides objective advice from trusted advisers.
Lending Activities
Our lending activities are conducted through the Bank. While our focus is on commercial business lending, we also originate real estate construction and land development loans, residential real estate and consumer loans. Our loans are originated under policies that are reviewed and approved annually by our Board of Directors. In addition, we have established internal lending guidelines that are updated as needed. These policies and guidelines address underwriting standards, structure and rate considerations, and compliance with laws, regulations and internal lending limits. We conduct post-approval reviews on selected loans and routinely perform internal loan reviews of our loan portfolio to confirm credit quality, proper documentation and compliance with laws and regulations. Loan repayments are considered one of the primary sources of funding for the Company.
Commercial Business Lending
At December 31, 2023 we had $3.37 billion, or 77.8% of our loans receivable, in commercial business loans. We offer different types of commercial business loans, including lines of credit, term equipment financing and term owner-occupied and non-owner occupied commercial real estate loans. We also originate loans that are guaranteed by the U.S. SBA, for which the Bank is a “preferred lender,” the U.S. Department of Agriculture and the Federal Agricultural Mortgage Corporation. Before extending credit to a business, we review and analyze the borrower’s management ability, financial history, including cash flow of the borrower and all guarantors, and the liquidation value of the collateral. Emphasis is placed on having a comprehensive understanding of the borrower’s global cash flow and performing necessary financial due diligence.
We originate commercial real estate loans within our primary market areas with a preference for loans secured by owner-occupied properties. Our underwriting standards require that non-owner occupied and owner-occupied commercial real estate loans not exceed 75% and 80%, respectively, of the lower of appraised value at origination or cost of the underlying collateral. Cash flow debt coverage covenant requirements typically range from 1.15 times to 1.25 times, depending on the type of property. Actual debt service coverage is usually higher than required covenant thresholds, as loan sizing requires sensitized coverage using an "underwriting" interest rate that is higher than the note rate.
Commercial real estate loans typically involve a greater degree of risk than residential real estate loans. Payments on loans secured by commercial real estate properties are dependent on successful operation and management of the properties and repayment of these loans may be affected by adverse conditions in the real estate market or the economy. We seek to minimize these risks by determining the financial condition of the borrower and any tenants, the quality and value of the collateral, and the management of the property securing the loan. We also generally obtain personal guarantees from the owners of the collateral after a thorough review of personal financial statements. In addition, we reviewed over 70% of our commercial real estate loan portfolio during the year ended December 31, 2023 for various performance related criteria and stress-test loans for potential changes in interest rates, occupancy and collateral values.
The Company may enter into non-hedging interest rate swap contracts with commercial customers to accommodate their business needs. For additional information, see Note (7) Derivative Financial Instruments of the Notes to Consolidated Financial Statements included in Item 8. Financial Statements And Supplementary Data.
Residential Real Estate Loans, Originations and Sales
At December 31, 2023, residential real estate loans totaled $375.3 million, or 8.7% of our loans receivable. The majority of our residential real estate loans are secured by single-family residences located in our primary market areas. Our underwriting standards require that residential real estate loans generally are owner-occupied and do not exceed 80% of the lower of appraised value at origination or cost of the underlying collateral. Terms typically range from 15 to 30 years. As part of our asset/liability management strategy, we may also sell originated residential real estate loans in the secondary market with no recourse and servicing released. In January 2024, we ceased the origination of residential real estate loans for the purpose of sales on the secondary market.
Real Estate Construction and Land Development
At December 31, 2023, we had $414.4 million, or 9.5% of our loans receivable, in real estate construction and land development loans, including residential construction loans and commercial and multifamily construction loans.
We originate residential construction loans for the construction of single-family custom homes where the homeowner is the borrower. We also provide financing to builders for the construction of pre-sold homes and speculative residential property. Because of the higher risks present in the residential construction industry, our lending to builders is limited to those who have demonstrated a favorable record of performance and who are building in markets that management understands. We further endeavor to limit our construction lending risk through adherence to strict underwriting guidelines and procedures. Speculative construction loans are short term in nature and have a variable rate of interest. We require builders to have tangible equity in each construction project; have prompt and thorough documentation of all draw requests; and we inspect the project prior to paying any draw requests.
Commercial and multifamily construction loans also have a higher risk because of the construction element and lease-up, if not pre-leased. As a result, this type of construction loan is made only to strong borrowers with sufficient equity into the
8
project and additional resources they can draw on if needed. The Company performs due diligence to gain comfort that the experience of the general contractor is sufficient to finish the project on budget and on time. Project feasibility is also important and our lenders ensure the project is economically viable. Commercial and multifamily construction loans are monitored through cost reviews, regulatory-compliant appraisals, sufficient equity, engineering inspections and controlled disbursements.
Consumer
At December 31, 2023, we had $171.4 million, or 4.0% of our loans receivable, in consumer loans. We originate consumer loans and lines of credit that are both secured and unsecured. During the three months ended March 31, 2020, we ceased indirect auto and recreational vehicle loan originations, which are classified as consumer loans within loans receivable. These indirect consumer loans are secured by new and used automobile and recreational vehicles and were originated indirectly by established and well-known dealers located in our market areas. In addition, the indirect loans purchased were made to only prime borrowers. At December 31, 2023, we had $32.3 million, or 0.7% of our loans receivable, in indirect consumer loans remaining which is a decrease of $30.5 million or 48.6% from $62.9 million as of December 31, 2022.
See also, Item 1A. Risk Factors—Risks Related to Our Lending Activities.
Supervision and Regulation
We are subject to extensive regulation, and supervision under federal law and the laws of Washington State, which are both primarily intended to protect depositors and the FDIC, and not shareholders. Additionally, the Consumer Financial Protection Bureau is responsible for the implementation of the federal financial consumer protection and fair lending laws and regulations and has authority to impose new requirements.
Any change in applicable laws, regulations, or regulatory policies may have a material effect on our business, operations, and prospects. We cannot predict the nature or the extent of the effects on our business and earnings that any fiscal or monetary policies or new Federal or State laws may have in the future.
The following is a summary discussion of certain laws and regulations applicable to the Company and the Bank which is qualified in its entirety by reference to the actual laws and regulations.
Heritage Financial Corporation
As a bank holding company registered with the Federal Reserve, we are subject to comprehensive regulation and supervision by the Federal Reserve under the Bank Holding Company Act of 1956, as amended, and the regulations of the Federal Reserve. This regulation and supervision is generally intended to ensure that we limit our activities to those allowed by law and that we operate in a safe and sound manner without endangering the financial health of the Bank. We are required to file annual and periodic reports with the Federal Reserve and provide additional information as the Federal Reserve may require. The Federal Reserve may examine us, and any of our subsidiaries, and assess us for the cost of such examination.
The Federal Reserve has extensive enforcement authority over bank holding companies, including, among other things, the ability to assess civil money penalties, to issue cease and desist or removal orders, or require that a holding company divest subsidiaries (including its bank subsidiary). In general, enforcement actions may be initiated for violations of laws and regulations and unsafe or unsound practices. The Federal Reserve may also order termination of non-banking activities by non-banking subsidiaries of bank holding companies, or divestiture of ownership and control of a non-banking subsidiary by a bank holding company. Some violations may also result in criminal penalties.
Federal Reserve policy provides that a bank holding company is required to serve as a source of financial and managerial strength to its subsidiary banks. A bank holding company’s failure to meet its obligation to serve as a source of strength by providing financial assistance to a subsidiary bank in financial distress is generally considered by the Federal Reserve to be an unsafe and unsound banking practice or a violation of the Federal Reserve’s regulations or both.
As a bank holding company, we are required to obtain the prior approval of the Federal Reserve to acquire all, or substantially all, of the assets of any other bank or bank holding company. Prior Federal Reserve approval is required for any bank holding company to acquire direct or indirect ownership or control of any voting securities of any bank or bank holding company if, after such acquisition, the acquiring bank holding company would, directly or indirectly, own or control more than 5% of any class of voting shares of the bank or bank holding company. In addition to the approval of the Federal Reserve, prior approval may for such acquisitions also be necessary from other agencies including the FDIC, DFI and agencies that regulate the target. In July 2021, President Biden issued an Executive Order on Promoting Competition in the American Economy. Among other initiatives, the Executive Order encouraged federal banking agencies to review their current merger oversight practices and adopt a plan for revitalization of such practices. There are many steps that must be taken by the agencies before any formal changes to the framework for evaluating bank mergers can be finalized and the prospects for such action are uncertain at this time.
Under the prompt corrective action provisions of the Federal Deposit Insurance Act, a bank holding company with an undercapitalized subsidiary bank must guarantee, within limitations, the capital restoration plan that is required to be implemented for its undercapitalized subsidiary bank. If an undercapitalized subsidiary bank fails to file an acceptable capital restoration plan or fails to implement an accepted plan, the Federal Reserve may, among other restrictions, prohibit the bank holding company or its undercapitalized subsidiary bank from paying any dividend or making any other form of capital distribution without the prior approval of the Federal Reserve. Federal Reserve policy also provides that a bank holding company may pay cash dividends only to the extent that the company’s net income for the past year is sufficient to cover both the cash dividend and a rate of earnings retention that is consistent with the company’s capital needs, asset quality and overall financial condition.
9
Bank regulations also require bank holding companies and banks to maintain minimum capital ratios and a capital conservation buffer. For additional information, see “Capital Adequacy” below. In addition, under Washington corporate law, a company generally may not pay dividends if, after that payment, the company would not be able to pay its liabilities as they become due in the usual course of business or its total assets would be less than its total liabilities.
Any subsidiaries which we may control are considered “affiliates” of the Company within the meaning of the Federal Reserve Act, and transactions between affiliates are subject to numerous restrictions. With some exceptions, we and our subsidiaries are prohibited from tying the provision of various products or services, such as extensions of credit, to other products or services offered by us, or our affiliates.
The stock of the Company is registered with the SEC under the Exchange Act. As such, the Company is subject to the information, proxy solicitation, insider trading restrictions and other requirements of the SEC under the Exchange Act.
Heritage Bank
The Bank is a Washington state-chartered commercial bank, the deposits of which are insured by the FDIC, and is subject to regulation by the FDIC and the DFI.
Applicable Federal and State statutes and regulations which govern a bank’s operations relate to minimum capital requirements, required reserves against deposits, investments, loans, legal lending limits, mergers and consolidation, borrowings, issuance of securities, payment of dividends, establishment of branches, privacy, anti-money laundering and other aspects of its operations, among other things. The DFI and the FDIC also have authority to prohibit banks under their supervision from engaging in what they consider to be unsafe and unsound practices.
The Bank is required to file periodic reports with the FDIC and is subject to periodic examinations and evaluations by the FDIC and the DFI. Based upon these evaluations, the regulators may revalue the assets of an institution and require that it establish specific reserves to compensate for the differences between the determined value and the book value of such assets. These examinations must be conducted at least every 12 months.
The Bank pays dividends to the Company. The FDIC and the DFI also have the general authority to restrict capital distributions by the Bank, including dividends paid by the Bank to the Company. Such restrictions are generally tied to the Bank’s capital levels after giving effect to such distributions. Our long-term ability to pay dividends to our stockholders is based primarily upon the ability of the Bank to make capital distributions to the Company. So long as the Bank remains “well-capitalized” after each capital distribution, and operates in a safe and sound manner, it is management's belief that the banking regulators will continue to allow the Bank to distribute its earnings to the Company, although no assurance can be given in this regard.
Capital Adequacy
The Federal Reserve and FDIC have issued substantially similar risk-based and leverage capital regulations applicable to bank holding companies and banks, respectively. In addition, these regulatory agencies may from time to time require that a bank holding company or bank maintain capital above the minimum levels, based on its financial condition or actual or anticipated growth. These regulations implement the regulatory capital reforms required by the Dodd-Frank Act and the Basel III requirements, a comprehensive capital framework and rules for U.S. banking organizations approved by the Federal Reserve Board and the FDIC in 2013.
Under these capital regulations, the minimum capital ratios are: (1) a common equity Tier 1 capital ratio of 4.5% of risk-weighted assets; (2) a leverage ratio (the ratio of Tier 1 capital to average total adjusted assets) of 4.0%; (3) a Tier 1 capital ratio of 6.0% of risk-weighted assets; and (4) a total capital ratio of 8.0% of risk-weighted assets. Common equity Tier 1 generally consists of common stock; retained earnings; AOCI unless an institution elects to exclude AOCI from regulatory capital; and certain minority interests; all subject to applicable regulatory adjustments and deductions. Tier 1 capital generally consists of common equity Tier 1 and noncumulative perpetual preferred stock. Tier 2 capital generally consists of other preferred stock and subordinated debt meeting certain conditions plus an amount of the allowance for credit losses up to 1.25% of risk-weighted assets. Total capital is the sum of Tier 1 and Tier 2 capital.
The Economic Growth, Regulatory Relief and Consumer Protection Act (“EGRRCPA”), enacted in May 2018, required the federal banking agencies, including the FDIC, to establish for institutions with assets of less than $10 billion a “community bank leverage ratio” or “CBLR” of between 8 to 10%. Institutions with capital meeting or exceeding the ratio and otherwise complying with the specified requirements (including off-balance sheet exposures of 25% or less of total assets and trading assets and liabilities of 5% or less of total assets) and electing the alternative framework are considered to comply with the applicable regulatory capital requirements, including the risk-based requirements. The CBLR was established at 9% Tier 1 capital to total average assets, effective January 1, 2020. A qualifying institution may opt in and out of the community bank leverage ratio framework on its quarterly call report. An institution that temporarily ceases to meet any qualifying criteria is provided with a two-quarter grace period to again achieve compliance. Failure to meet the qualifying criteria within the grace period or maintain a leverage ratio of 8% or greater requires the institution to comply with the generally applicable capital requirements. The Bank has not elected to use the CBLR framework as of December 31, 2023.
In addition to the minimum common equity Tier 1, Tier 1, leverage ratio and total capital ratios, the Company and the Bank must maintain a capital conservation buffer consisting of additional common equity Tier 1 capital greater than 2.5% above the required minimum risk-based capital levels in order to avoid limitations on paying dividends, repurchasing shares, and paying discretionary bonuses. To be considered "well capitalized," a bank holding company must have, on a consolidated basis, a Tier 1 risk-based capital ratio of 6.0% or greater and a total risk-based capital ratio of 10.0% or greater and must not be subject to an individual order, directive or agreement under which the Federal Reserve requires it to maintain a specific capital level. To be considered “well capitalized,” a depository institution must have a common equity Tier 1 capital ratio of at least 6.5%, a leverage
10
ratio of at least 5%, a Tier 1 risk-based capital ratio of at least 8%, a total risk-based capital ratio of at least 10% and not be subject to an individualized order, directive or agreement under which its primary federal banking regulator requires it to maintain a specific capital level.
The Company’s and the Bank's required and actual capital levels as of December 31, 2023 are listed in Note (20) Regulatory Capital Requirements of the Notes to Consolidated Financial Statements included in Item 8. Financial Statements And Supplementary Data.
Prompt Corrective Action
Federal statutes establish a supervisory framework for FDIC-insured institutions based on five capital categories: well capitalized, adequately capitalized, undercapitalized, significantly undercapitalized and critically undercapitalized. An institution’s category depends upon where its capital levels are in relation to relevant capital measures. The well capitalized category is described in the Capital Adequacy section above. An institution that is not well capitalized is subject to certain restrictions on brokered deposits, including restrictions on the rates it can offer on its deposits. To be considered adequately capitalized, an institution must have the minimum capital ratios described in the Capital Adequacy section above. Any institution which is neither well capitalized nor adequately capitalized is considered undercapitalized.
Undercapitalized institutions are subject to certain prompt corrective action requirements, regulatory controls and restrictions which become more extensive as an institution becomes more severely undercapitalized. Failure by a bank to comply with applicable capital requirements would result in progressively more severe restrictions on its activities and lead to enforcement actions, including, but not limited to, the issuance of a capital directive to ensure the maintenance of required capital levels and, ultimately, the appointment of the FDIC as receiver or conservator. Banking regulators will take prompt corrective action with respect to depository institutions that do not meet minimum capital requirements. Additionally, approval of any regulatory application filed for their review may be dependent on compliance with capital requirements.
As of December 31, 2023, the Company and the Bank met all minimum capital requirements and the most recent regulatory notifications categorized the Bank as well capitalized under the regulatory framework for prompt corrective action. See Note (20) Regulatory Capital Requirements of the Notes to Consolidated Financial Statements included in Item 8. Financial Statements And Supplementary Data.
Commercial Real Estate Transactions
The federal banking agencies have issued guidance on sound risk management practices for concentrations in commercial real estate lending. The particular focus is on exposure to commercial real estate loans that are dependent on the cash flow from the real estate held as collateral and that are likely to be sensitive to conditions in the commercial real estate market (as opposed to real estate collateral held as a secondary source of repayment or as an abundance of caution). The purpose of the guidance is not to limit a bank’s commercial real estate lending but to guide banks in developing risk management practices and maintaining capital levels commensurate with the level and nature of real estate concentrations. A bank that has experienced rapid growth in commercial real estate lending, has notable exposure to a specific type of commercial real estate loan, or is approaching or exceeding the following supervisory criteria may be identified for further supervisory analysis with respect to real estate concentration risk: total loans for construction, land development, and other land represent 100% or more of the bank’s total capital; or total commercial real estate loans (as defined in the guidance) greater than 300% of the Bank’s total capital and an increase in the bank’s commercial real estate portfolio of 50% or more during the prior 36 months.
The guidance provides that the strength of an institution’s lending and risk management practices with respect to such concentrations will be considered in supervisory guidance on evaluation of capital adequacy. As of December 31, 2023, the Bank’s aggregate recorded loan balances for construction, land development and land loans were 53% of regulatory capital. In addition, at December 31, 2023, the Bank’s loans on commercial real estate, as defined by the FDIC, were 271% of regulatory capital.
Deposit Insurance and Other FDIC Programs
The deposits of the Bank are insured up to $250,000 per separately insured category by the Deposit Insurance Fund, which is administered by the FDIC. The FDIC is an independent federal agency that insures the deposits, up to applicable limits, of depository institutions. As insurer of the Bank's deposits, the FDIC has supervisory and enforcement authority over the Bank and this insurance is backed by the full faith and credit of the United States government. As insurer, the FDIC imposes deposit insurance assessments and is authorized to conduct examinations of and to require reporting by institutions insured by the FDIC. It also may prohibit any FDIC-insured institution from engaging in any activity determined by regulation or order to pose a serious risk to the institution and the Deposit Insurance Fund. The FDIC also has the authority to initiate enforcement actions and may terminate the deposit insurance if it determines that an institution has engaged in unsafe or unsound practices or is in an unsafe or unsound condition.
Deposit insurance assessments are based on the average consolidated total assets less tangible equity capital of a financial institution. In addition, the Dodd-Frank Act set the minimum designated reserve ratio of the Deposit Insurance Fund at 1.35%, required the FDIC to set a target for the ratio each year, and eliminated the requirement that the FDIC pay dividends to insured depository institutions when the ratio exceeds certain thresholds. The FDIC set the target ratio at 2.0% and adopted a plan to achieve that target ratio. Currently, total base assessment rates range from 1.5 to 40 basis points on an annualized basis, subject to certain adjustments. Under current regulations, the ranges of assessment rates are scheduled to decrease as the ratio increases in increments above 2.0%. No institution may pay a dividend if it is in default on its deposit insurance assessment.
In October 2022, the FDIC finalized a rule that will increase the initial base deposit insurance assessment rates by 2 basis points, beginning with the first quarterly assessment period of 2023 (January 1, 2023 through March 31, 2023). The FDIC,
11
as required under the Federal Deposit Insurance Act, established a plan in September 2020 to restore the Deposit Insurance Fund reserve ratio to meet or exceed the statutory minimum of 1.35 percent within eight years. This plan did not include an increase in the deposit insurance assessment rate. Based on the FDIC’s recent projections, however, the FDIC determined that the Deposit Insurance Fund reserve ratio is at risk of not reaching the statutory minimum by the statutory deadline of September 30, 2028 without increasing the deposit insurance assessment rates. The increased assessment would improve the likelihood that the Deposit Insurance Fund reserve ratio would reach the required minimum by the statutory deadline, consistent with the FDIC’s Amended Restoration Plan. The FDIC also concurrently maintained the Designated Reserve Ratio (“DDR”) for the Deposit Insurance Fund at 2 percent for 2023. The new assessment rate schedules will remain in effect unless and until the reserve ratio meets or exceeds 2 percent in order to support growth in the Deposit Insurance Fund in progressing toward the FDIC’s long-term goal of a 2 percent DRR. Progressively lower assessment rate schedules will take effect when the reserve ratio reaches 2 percent, and again when it reaches 2.5 percent. The revised assessment rate schedule will remain in effect unless and until the reserve ratio meets or exceeds 2 percent, absent further action by the FDIC.
In November 2023, the FDIC issued a Final Rule on Special Assessment Pursuant to Systemic Risk Determination to implement a special assessment to recover the loss to the Deposit Insurance Fund (DIF) associated with protecting uninsured depositors following the closures of Silicon Valley Bank and Signature Bank. The assessment base for the special assessment is equal to an insured depository institution’s (IDI’s) estimated uninsured deposits reported as of December 31, 2022, adjusted to exclude the first $5 billion. The Company did not have more than $5 billion in uninsured deposits as of December 31, 2022 and therefore is not subject to this special assessment.
Bank Secrecy Act / Anti-Money Laundering Laws
The Bank is subject to the Bank Secrecy Act and other anti-money laundering laws and regulations, including the USA PATRIOT Act of 2001. These laws and regulations require the Bank to implement policies, procedures, and controls to detect, prevent, and report money laundering and terrorist financing and to verify the identity of their customers. Violations of these requirements can result in substantial civil and criminal sanctions. In addition, provisions of the USA PATRIOT Act require the federal financial institution regulatory agencies to consider the effectiveness of a financial institution's anti-money laundering activities when reviewing mergers and acquisitions.
Privacy Standards and Cybersecurity
The Bank is subject to federal regulations implementing the privacy protection provisions of the Gramm-Leach-Bliley Financial Services Modernization Act of 1999. These regulations require the Bank to disclose its privacy policy, including informing consumers of their information sharing practices and informing consumers of their rights to opt out of certain practices. In addition, on November 18, 2021, the federal banking agencies announced the adoption of a final rule providing for new notification requirements for banking organizations and their service providers for significant cybersecurity incidents. Specifically, the new rule requires a banking organization to notify its primary federal regulator as soon as possible, and no later than 36 hours after, the banking organization determines that a “computer-security incident” rising to the level of a “notification incident” has occurred. Notification is required for incidents that have materially affected or are reasonably likely to materially affect the viability of a banking organization’s operations, its ability to deliver banking products and services, or the stability of the financial sector. Service providers are required under the rule to notify affected banking organization customers as soon as possible when the provider determines that it has experienced a computer-security incident that has materially affected or is reasonably likely to materially affect the banking organization’s customers for four or more hours.
Further, on July 26, 2023, the SEC adopted final rules that require public companies to promptly disclose material cybersecurity incidents in a Current Report on Form 8-K (“Form 8-K”) and detailed information regarding their cybersecurity risk management and governance on an annual basis in an Annual Report on Form 10-K (Form 10-K”). Companies will be required to report on Form 8-K any cybersecurity incident they determine to be material within four business days of making that determination. See Item 1C. Cybersecurity for annual disclosures.
Other Regulatory Developments
Community Reinvestment Act. On October 24, 2023, the federal banking agencies, including the FDIC issued a final rule designed to strengthen and modernize regulations implementing the Community Reinvestment Act (CRA). The changes are designed to encourage banks to expand access to credit, investment and banking services in low and moderate income communities, adapt to changes in the banking industry including mobile and internet banking, provide greater clarity and consistency in the application of the CRA regulations and tailor CRA evaluations and data collection to bank size and type. The Bank cannot predict the impact the changes the new CRA rule will have on its operations at this time.
Website Access to Company Reports
We post publicly available reports required to be filed with the SEC on our website, www.hf-wa.com, as soon as reasonably practicable after filing such reports. The required reports are available free of charge through our website.
Code of Ethics
We have adopted a Code of Ethics that applies to our principal officers. We have posted the text of our Code of Ethics at www.hf-wa.com in the section titled Overview: Governance Documents. Any significant changes or waivers of the Code of Ethics will be publicly disclosed to shareholders.
Competition
We compete for loans and deposits with other commercial banks, credit unions, mortgage bankers, and other providers of financial services, including finance companies, online-only banks, mutual funds, insurance companies, and more recently
12
with financial technology companies that rely on technology to provide financial services. Many of our competitors have substantially greater resources than we do. Particularly in times of high or rising interest rates, we also face significant competition for investors’ funds from short-term money market securities and other corporate and government securities.
We compete for loans principally through the range and quality of the services we provide, interest rates and loan fees, and robust delivery channels for our products and services. We actively solicit deposit-related clients and compete for deposits by offering depositors high touch service on a variety of savings accounts, checking accounts, cash management and other services.
Human Capital
Our Culture and Our People
The Company's success depends on the success of its people, and we are dedicated to fostering employee empowerment through robust human capital and talent management. Our strong culture, built upon a clear mission and values, unites employees at all levels of the Company towards a common goal, enabling them to reach their full potential.
Diversity, Equity, Inclusion (“DEI”)
We recognize and appreciate the importance of creating an environment where all employees feel valued, included, and empowered to do their best work. Recognizing the unique perspectives each employee brings, we value their contributions to making us the leading commercial community bank in the Pacific Northwest.
To advance DEI, we have a comprehensive plan, a DEI Officer certified by the National Diversity Council (“NDC”), and a dedicated Diversity Council. The Diversity Council, comprising diverse employees collaborating closely with senior leaders, ensures DEI initiatives align with our strategic goals. Both our Chief Executive Officer and Executive Vice President Chief Human Resources Officer serve as executive sponsors to the Diversity Council. The Diversity Council plays a crucial role in driving organizational change and prioritizing diversity, equity, and inclusion.
Our executive management team and Board of Directors have undergone instructor-led, customized DEI training. All employees receive ongoing diversity training. In 2023, the NDC recognized our community outreach and corporate social responsibility efforts, rating us among the best companies for diversity.
The objectives of the Company's DEI plan include:
•Workforce Diversity: Recruit from a diverse, qualified group of potential applicants to secure a high-performing workforce drawn from all segments of the communities we serve.
•Workplace Inclusion: Promote a culture that encourages collaboration, flexibility, and fairness to enable individuals to contribute to their full potential.
•Sustainability: Develop structures and strategies to equip leaders with the ability to manage diversity, be accountable, measure results, refine approaches on the basis of such data and foster a culture of inclusion.
In 2023, we strengthened the integration of DEI goals into our hiring practices. Our recruiting team achieved certification as “Diversity and Inclusion Recruiters” after completing the Advanced Internet Recruitment Strategies (“AIRS”) program. We also introduced "Interview and Selection" training during 2023 to address and mitigate unconscious bias in hiring decisions. This initiative resulted in an enhanced diversity representation across the organization, with 37% of new hires in 2023 coming from Underrepresented Minority Groups (“URG”), compared to 31% in 2022.
Additionally, the Company enlisted an external consultant in 2023 to provide inclusive leadership training to its managers. This training, offering insights into diversity, inclusion, and identity, has been incorporated into the mandatory curriculum for new managers. All employees receive quarterly "Inclusion Insights" training, and "Lunch & Learn" sessions are open to all, encouraging ongoing discussions on these crucial topics.
Demographics
As of December 31, 2023, the Company employed 764 full-time and 35 part-time employees across Washington, Oregon, and Idaho. The Company also had six employees who were working remotely in other states. No employees are represented by a collective bargaining agreement. During 2023, we hired 145 regular full-time and part-time employees. Voluntary workforce turnover (rolling 12-month attrition) was 16.6%, compared to 19.4% in 2022. Our average overall tenure was 7.1 years. The average tenure of management was 9.9 years.
The following tables illustrate workforce demographics by job group (Note: “Director” refers to director-level management positions within the organization, not the Board of Directors) as of December 31, 2023:
Organizational Level | Female (%) | Male (%) | ||||||||||||
Individual Contributor | 70.13 | % | 29.87 | % | ||||||||||
Manager | 75.00 | 25.00 | ||||||||||||
Director | 50.00 | 50.00 | ||||||||||||
Executive | 22.22 | 77.78 | ||||||||||||
Total Workforce | 69.94 | % | 30.06 | % | ||||||||||
13
Organizational Level | Underrepresented Groups (%) | White (%) | ||||||||||||
| Individual Contributor | 28.69 | % | 28.7 | % | 71.31 | % | ||||||||
| Manager | 23.26 | 23.3 | 76.74 | |||||||||||
| Director | 7.14 | 7.1 | 92.86 | |||||||||||
| Executive | — | — | 100.00 | |||||||||||
| Total Workforce | 26.46 | % | 26.5 | 73.54 | % | |||||||||
Communication and Listening
The Company strives to maintain an environment of open communication, facilitating access to senior management through initiatives like quarterly virtual “All Banker Calls,” monthly updates for Company leaders, and orientation sessions led by the Chief Executive Officer and the President/COO for new hires. To further enhance our “listening culture,” we utilize a survey platform to allow employees to share feedback directly with leadership, including an annual employee engagement survey and periodic pulse surveys. Survey results, shared with employees, executive leadership and the Board, guide actions at both the corporate and departmental levels. In recognition of our commitment to employee engagement, the Company earned a spot among the top 100 Best Places to Work in Washington and Oregon by the Puget Sound and Portland Business Journals based on the 2023 employee engagement survey.
Our commitment to open communication extends to providing employees with avenues for confidential and anonymous reporting. We offer a whistleblower hotline/website, enabling employees to report financial and workplace concerns to key leadership, including the Board Chair, Audit Committee Chair, Chief Executive Officer, Chief Operations Officer, Chief Risk Officer and Chief Human Resources Officer. Additionally, our Company intranet hosts an "Idea Bank," allowing employees to submit new ideas or recommendations directly to executive management.
Talent Development and Succession
Developing employees for future growth and professional development is a vital corporate activity crucial to our long-term success. The Company views its employees as our most important assets, which makes training and professional development a worthy investment. We offer an array of learning opportunities through virtual and in-house courses via “Heritage Bank University.” Additionally, we sponsor courses from external providers such as Blanchard, Risk Management Association, Archbright, Jennifer Brown Consulting, Washington Bankers Association, Oregon Bankers Association, and the Pacific Coast Banking School.
We offer situational leadership training for leaders that focuses on communication and employee engagement and endorse coaching using the tools from this program. All employees are required to complete an extensive series of quarterly digital training courses focused on bank regulatory compliance, ethics, workplace safety, security, fraud awareness and prevention and other interpersonal or leadership topics. An interactive leadership roadmap is available to assist future leaders in their career development. Heritage Bank University has been recognized as a “Champion of Learning” by The Association for Talent Development for its commitment to employee learning.
In 2023, the Company launched an online succession planning tool to further identify next-generation leaders and establish development plans for these individuals. Over time, we expect this process to increase generational representation across all levels, including leadership positions. As of December 31, 2023, the Company’s generational representation consisted of 20% Baby Boomers, 39% Gen X-ers, 33% Millennials, and 8% Gen Z-ers. Management and the Board review leadership succession annually.
Recognition and appreciation
We host “Celebrate Great,” an active internal peer recognition platform enabling managers and employees to express appreciation and recognize their co-workers and teams. Throughout 2023, more than 6,000 e-cards were posted on Celebrate Great, with 44 individuals or teams receiving “Bravo” awards and seven employees receiving “Standing Ovation” awards for their exceptional work. The Company celebrates employees achieving milestone anniversaries or upon retirement with a personalized yearbook and special gift.
Compensation, Benefits and Pay Equity
Offering competitive compensation and benefit programs is critical to attracting and retaining top talent in our highly competitive market areas. Employees are generally eligible for a base pay review at least once a year or upon promotion or transfer. Our hiring practices prioritize pay transparency, with job postings disclosing the pay range minimum and maximum, as well as the benefits package, and we refrain from requesting salary history from job applicants. We collaborate with a third-party consultant annually to evaluate hiring, promotion, and other pay practices to ensure continued equity and fairness.
Incentive plan goals and results are aligned with strategic Company objectives and are approved by the Board Compensation Committee. Further alignment is achieved by having similar corporate performance metrics cascade through most executive, management, and employee annual incentive plans.
Employees working a minimum of 20 hours per week are eligible for most benefit plans, including a 401(k) Plan with an employer matching contribution, medical, dental and vision insurance, life and long-term disability insurance, public transit passes, paid parking, and paid time off. Further, full-time employees enjoy up to 11 paid holidays each year and receive an
14
annual floating holiday to be used at their discretion. Employees also accrue up to 12 days of paid sick time per year for personal use or to care for a family member. Both full-time and part-time employees accrue vacation time ranging from two and five weeks, dependent on factors such as position and tenure.
Employee Wellness and Wellbeing
Our corporate culture places a strong emphasis on the wellbeing of our employees, recognizing its pivotal role in cultivating a vibrant and productive workforce. To support holistic wellbeing, we offer a range of resources.
Through our Employee Assistance Program, employees receive counseling and referral services to address challenges both at work and at home. This includes mental health counseling, financial planning, basic legal advice, and dependent/elder care referrals, all at no cost to them or their household members. Additional wellness benefits are available through the Company's medical insurance plans. Moreover, enrolled members can take advantage of mental health apps, weight loss and fitness programs, smoking cessation programs, and various online resources, all provided at no extra cost.
To alleviate workplace stress and burnout, the Company hosts a "no meetings week" at the start of each quarter. This dedicated time allows managers and employees to engage in purposeful planning, catch up on tasks, and reduce stress. By incorporating these breaks, employees can participate in strategic planning, creative thinking, and collaborative efforts without the constraints of scheduled meetings, ultimately contributing to a more innovative and healthier work environment.
Community Involvement
As a community bank, we are committed to supporting the communities where we operate, and we actively encourage and support our employees to do the same. In 2022, the Company implemented an annual volunteer event, during which the Bank closes for half a day, providing employees with a paid opportunity to volunteer in teams at various community organizations within our operating footprint. Our 2023 volunteer day event involved over 600 employees volunteering approximately 1,770 hours to more than 50 organizations in Washington, Oregon, and Idaho. To further facilitate community involvement, employees receive a minimum of eight additional hours of paid time off each year specifically to use for volunteer activities of their choice.
Heritage Bank also participated in a 2023 EcoChallenge, where 28 teams of employees engaged in friendly competition by undertaking environmentally sustainable actions and practices. Challenges involved activities such as reducing waste, conserving energy, and adopting eco-friendly lifestyle habits. The collective efforts of the EcoChallenge resulted in 9,673 actions, contributing to a heightened awareness of environmental responsibility, fostering a sense of community engagement, and reinforcing a shared commitment to sustainability.
Executive Officers
The following table sets forth information with respect to executive officers of the Company at December 31, 2023:
| Name | Age as of December 31, 2023 | Position | Has Served the Company or Bank Since | |||||||||||||||||
| Jeffrey J. Deuel | 65 | President and Chief Executive Officer of Heritage Financial Corporation and Chief Executive Officer of Heritage Bank | 2010 | |||||||||||||||||
| Bryan D. McDonald | 52 | Executive Vice President of Heritage Financial Corporation and President and Chief Operating Officer of Heritage Bank | 2014 | |||||||||||||||||
| Donald J. Hinson | 62 | Executive Vice President and Chief Financial Officer of Heritage Financial Corporation and Heritage Bank | 2005 | |||||||||||||||||
Tony W. Chalfant | 62 | Executive Vice President and Chief Credit Officer of Heritage Financial Corporation and Heritage Bank | 2018 | |||||||||||||||||
Matthew T. Ray | 52 | Executive Vice President and Chief Lending Officer of Heritage Bank | 2010 | |||||||||||||||||
The business experience of each executive officer is set forth below.
Jeffrey J. Deuel is the President and Chief Executive Officer of the Company and Chief Executive Officer of the Bank. Mr. Deuel was promoted to President and Chief Executive Officer of the Bank and President of the Company effective July 2018 and then promoted to President and Chief Executive Officer of the Company effective July 2019. Mr. Deuel was promoted to President and Chief Operating Officer of the Bank and Executive Vice President of the Company in September 2012. In November 2010, Mr. Deuel was named Executive Vice President and Chief Operating Officer of the Bank and Executive Vice President of the Company. Mr. Deuel joined the Bank in February 2010 as Executive Vice President. Prior to joining the Company and the Bank, Mr. Deuel held the position of Executive Vice President Commercial Operations with JPMorgan Chase, formerly Washington Mutual. Prior to joining Washington Mutual, Mr. Deuel was based in Philadelphia where he worked for Bank United, First Union Bank, CoreStates Bank, and First Pennsylvania Bank. During his career Mr. Deuel held a variety of leadership positions in commercial banking including lending, credit administration, portfolio management, retail, corporate strategies, and support services. He earned his Bachelor’s degree at Gettysburg College.
15
Bryan D. McDonald is an Executive Vice President of the Company and the President and Chief Operating Officer of the Bank. Mr. McDonald joined the Bank as an Executive Vice President and Chief Lending Officer in connection with the Company’s acquisition of Washington Banking Company and its wholly owned banking subsidiary, Whidbey Island Bank, effective May 1, 2014. Mr. McDonald was promoted to Executive Vice President of the Company and Executive Vice President and Chief Operating Officer of the Bank effective July 1, 2018 and then promoted to President and Chief Operating Officer of the Bank effective July 1, 2021. Previously, Mr. McDonald held the position of President and Chief Executive Officer of Whidbey Island Bank from January 2012 to May 2014. He joined Whidbey Island Bank in 2006 as Commercial Banking Manager and was promoted to Chief Operating Officer in 2010. Mr. McDonald has extensive managerial experience in various sales, credit, operations, commercial banking and residential real estate areas. Before joining the team at Whidbey Island Bank, he was Snohomish and King County Business Group Manager where he was responsible for developing all aspects of Peoples Bank's commercial banking operation in King and Snohomish counties. Mr. McDonald is on the Washington Bankers Association Board and the American Bankers Association Government Relations Council. Mr. McDonald holds a Bachelor's degree in Management and a Master's degree in Business Administration from Washington State University. He is also a graduate of the Pacific Coast Banking School.
Donald J. Hinson serves as Executive Vice President and Chief Financial Officer of the Company and the Bank, positions he has held since September 2012. From 2007 to 2012, he was Senior Vice President and Chief Financial Officer of the Company and the Bank. Mr. Hinson joined the Company and the Bank in 2005 as Vice President and Controller. Prior to that, he served in the banking audit practice of local and national accounting firms of Knight, Vale and Gregory and RSM McGladrey from 1994 to 2005. Mr. Hinson holds a Bachelor's degree in Accounting from Central Washington University and a Bachelor's degree in Psychology from Western Washington University.
Tony W. Chalfant became Executive Vice President and Chief Credit Officer of the Company and the Bank in July 2020. Previously, Mr. Chalfant held the title of Senior Vice President and Deputy Chief Credit Officer of the Bank since July 2019. Prior to that, he served as a Regional Credit Officer since January 2018 when the Bank acquired Puget Sound Bank. Mr. Chalfant served as the Chief Credit Officer for Puget Sound Bank for 13 years. Prior to joining Puget Sound Bank, Mr. Chalfant held commercial lending and leadership positions with U.S. Bank for 11 years. Mr. Chalfant started his career with the U.S. Office of Comptroller of the Currency, working there for eight years. Mr. Chalfant obtained his Bachelor's degree in Finance and Economics from Washington State University and is a graduate of the Pacific Coast Banking School.
Matthew T. Ray is the Executive Vice President and Chief Lending Officer of the Bank. Mr. Ray joined the Bank in 2010 and was most recently promoted to his current position of Executive Vice President and Chief Lending Officer in January 2023. Previously, Mr. Ray held the title of Senior Vice President and Market President of the Bank from January 2018 to December 2022. Since joining the Bank, he has held leadership positions as the commercial banking team leader, regional manager and market president. In addition, he has led the consumer, mortgage, SBA and small business lending divisions. Mr. Ray has more than 25 years of experience in sales, credit, operations, commercial banking and residential real estate. He holds a Bachelor's degree in Business Administration-Finance from Northwestern College and is also a graduate of Pacific Coast Banking School. He currently serves on the Board of Directors for Chinook Enterprises.
ITEM 1A. RISK FACTORS
We assume and manage a certain degree of risk in order to conduct our business strategy. In addition to the risk factors described below, other risks and uncertainties not specifically mentioned, or that are currently known to, or deemed to be immaterial by management, also may materially and adversely affect our financial condition, results of operations and/or cash flows. Before making an investment decision, you should carefully consider the risks described below together with all of the other information included in this Form 10-K and our other filings with the SEC. If any of the circumstances described in the following risk factors actually occur to a significant degree, the value of our common stock could decline, and you could lose all or part of your investment. This Form 10-K is qualified in its entirety by these risk factors.
Risks Related to our Lending Activities
Repayment of our commercial business loans, consisting of commercial and industrial loans as well as owner-occupied and non-owner occupied commercial real estate loans, is often dependent on the cash flows of the borrower, which may be unpredictable, and the collateral securing these loans may fluctuate in value.
We offer a variety of commercial business loans across various industries such as real estate, healthcare, accommodation and food services, retail trade and construction. Our primary loan offerings comprise lines of credit, term equipment financing, and term real estate loans. Additionally, we facilitate loans guaranteed by the SBA, holding the designation of a “preferred lender” by the SBA. Commercial business lending involves distinct risks compared to residential real estate lending. Our commercial business loans are primarily made based on our assessment of the cash flow of the borrower and secondarily on the underlying collateral provided by the borrower. The unpredictability of a borrower's cash flow and the potential fluctuations in collateral values underscore the inherent risks in these loans. While our commercial business loans are often collateralized by equipment, inventory, accounts receivable or other business assets, the liquidation of collateral in the event of default is often an insufficient source of repayment because accounts receivable may be uncollectible and inventories may be obsolete or of limited use, among other things. Accordingly, the repayment of commercial business loans primarily relies on the borrower’s cash flow and creditworthiness, supplemented by the underlying collateral.
At December 31, 2023, our commercial business loans totaled $3.37 billion, or 77.8% of our total loan portfolio, of which $4.5 million, or 0.1% of commercial business loans were classified as nonaccrual. Within commercial business loans, agricultural
16
loans totaled $65.7 million, or 1.5% of our total loan portfolio and 1.9% of our commercial business loans at December 31, 2023 of which $825,000, or 1.3% of agricultural loans were classified as nonaccrual loans.
Our portfolio encompasses owner and non-owner occupied commercial real estate loans, including multifamily residential real estate loans. These loans often involve higher principal amounts compared to other loan types, and their repayment may be contingent on factors beyond our or our borrowers' control.
We originate commercial real estate loans for individuals and businesses, which are secured by commercial properties. These loans typically involve higher principal amounts than other types of loans and repayment is dependent upon income generated, or expected to be generated, by the property securing the loan in amounts sufficient to cover operating expenses and debt service, which may be adversely affected by changes in the economy or local market conditions. For example, if the project's cash flow diminishes due to unobtained or unrenewed leases, the borrower’s capacity to repay the loan could be impaired. Additionally, many of these loans have adjustable rates and reprice periodically. A significant increase in rates could increase the payment amount and could impact the borrower’s ability to repay the loan.
Commercial real estate lending also exposes us to greater credit risk than loans secured by residential real estate. Typically, the collateral securing these loans is not as easily liquidated as residential properties. In addition, many of our commercial real estate loans are not fully amortizing and contain large balloon payments upon maturity. Such balloon payments may require the borrower to either sell or refinance the underlying property, potentially elevating the risk of default or non-payment. If we foreclose on a commercial real estate loan, our holding period for the collateral typically is longer compared to residential real estate loans due to fewer potential purchasers. Additionally, commercial real estate loans generally have relatively large balances to single borrowers or related groups of borrowers, magnifying the impact of any errors in judgment regarding their collectability. Consequently, resulting charge-offs per loan may be larger than those incurred with our residential or consumer loan portfolios.
As of December 31, 2023, our owner and non-owner occupied commercial real estate loans totaled $2.66 billion, or 61.2% of our total loan portfolio, of which $205,000 were classified as nonaccrual.
Our real estate construction and land development loans are based upon estimates of costs and net operating income and the related value associated with the completed project. These estimates may be inaccurate.
Construction lending involves additional risks when compared with permanent commercial and residential real estate lending because funds are advanced upon the collateral for the project based on an estimate of costs to produce a future project value at completion. Estimating construction costs, the project's market value upon completion, and the impact of regulatory changes on real property involve inherent uncertainties. Accurately evaluating the total funds required for a project and the resulting loan-to-value ratio upon completion is challenging. Unforeseen changes in demand or higher building costs may significantly deviate from initial estimates. This type of lending also typically involves large loan principal amounts and may be concentrated among a limited number of builders. A downturn in the housing or the real estate market could increase delinquencies, defaults and foreclosures, significantly impairing the value of our collateral and our ability to sell it upon foreclosure. Further, some borrowers have multiple loans outstanding with us, exposing us to higher risk if one credit relationship encounters adverse developments. .
Construction loans often involve the disbursement of funds with repayment substantially dependent on the success of the ultimate project and the ability of the borrower to sell or lease the property or obtain permanent take-out financing, rather than the ability of the borrower or guarantor to repay principal and interest. If our appraisal of the value of a completed project proves to be overstated, we may have inadequate security for the repayment of the loan upon completion of construction of the project and may incur a loss. Because construction loans require active monitoring of the building process, including cost comparisons and on-site inspections, these loans are more difficult and more costly to monitor. Increases in market rates of interest can significantly impact construction loans, escalating end-purchasers' borrowing costs and potentially hindering project financing or reducing overall demand for the project. Moreover, properties under construction are often difficult to sell and typically must be completed to be successfully sold, complicating the resolution of problematic construction loans. This may require us to advance additional funds and/or contract with another builder to complete construction and assume the market risk of selling the project at a future market price, which may or may not enable us to fully recover unpaid loan funds and associated construction and liquidation costs. In the case of speculative construction loans, there is added risk associated with identifying an end-tenant or end-purchaser for the finished project. Land development loans also pose additional risk because of the lack of income being produced by the property and potentially illiquid nature of the collateral. These risks can be significantly impacted by supply and demand conditions.
As of December 31, 2023, our real estate construction and land development loans totaled $414.4 million, or 9.5% of our total loan portfolio, of which $78.6 million, or 1.8% of our total loan portfolio, were residential construction and $335.8 million, or 7.7% of our total loan portfolio, were commercial and multifamily construction. All of these loans were performing in accordance with their repayment terms as of December 31, 2023.
Our ACL on loans may prove to be insufficient to absorb losses in our loan portfolio.
Lending money is a substantial part of our business. Every loan carries a certain risk that it will not be repaid in accordance with its terms or that any underlying collateral will not be sufficient to assure repayment. This risk is affected by, among other things:
•the cash flow of the borrower, guarantors and/or the project being financed;
•the changes and uncertainties as to the future value of the collateral, in the case of a collateralized loan;
•the character and creditworthiness of a particular borrower or guarantor;
17
•changes in economic and industry conditions; and
•the duration of the loan.
The ACL on loans is a valuation account that is deducted from the amortized cost of loans receivable to present the net amount expected to be collected. Loans are charged-off through the ACL on loans when management believes the uncollectibility of a loan balance is considered probable. Subsequent recoveries, if any, are recorded to the ACL on loans. The Company records the changes in the ACL on loans through earnings as a "Provision for (reversal of) credit losses" on the Consolidated Statements of Income.
The determination of the appropriate level of ACL on loans inherently involves a high degree of subjectivity and requires us to make significant estimates of current credit risks and future trends, all of which may undergo material changes. If our estimates are incorrect, the ACL on loans may not be sufficient to cover expected losses in our loan portfolio, resulting in the need for increases in our ACL on loans through the provision for credit losses. Management also recognizes that significant new growth in loan segments and new loan products can result in loans segments comprised of unseasoned loans that may not perform in a historical or projected manner and will increase the risk that our ACL on loans may be insufficient to absorb losses without significant additional provisions.
Deterioration in economic conditions affecting borrowers, new information regarding existing loans, identification of additional problem loans and other factors, both within and outside of our control, may require an increase in the ACL on loans. If current conditions in the housing and real estate markets weaken, we expect we will experience increased delinquencies and credit losses. Bank regulatory agencies also periodically review our ACL on loans and may require an increase in the provision for credit losses or the recognition of further loan charge-offs, based on their judgments about information available to them at the time of their examination. In addition, if charge-offs in future periods exceed the ACL on loans, we will need additional provisions to increase the ACL on loans. Any increases in the allowance for credit losses will result in a decrease in net income and, most likely, capital, and may have a material negative effect on our financial condition and results of operations.
Risks Related to our Business Strategy
Our strategy of pursuing acquisitions and de novo branching exposes us to financial and operational risks that could adversely affect us.
As part of our business strategy, we seek to supplement our organic growth by acquiring other financial institutions or their businesses to achieve our strategic objectives and bolster earnings. However, this strategy entails several risks:
•Acquired banks or businesses might carry unforeseen asset quality issues or contingent liabilities. If these exceed our estimates, it could significantly impact our financial condition and operational results;
•There is a risk of higher-than-anticipated deposit attrition following an acquisition, potentially affecting our funding base;
•The acquisition process may divert our management's time and attention, impacting day-to-day operations and strategic initiatives;
•Acquired entities might have known or unknown regulatory compliance deficiencies, exposing us to associated risks;
•Market conditions can influence acquisition prices. Difficulty in making acceptable-priced acquisitions in specific markets could affect our growth strategy;
•The integration of systems, procedures, and personnel from acquired entities into our company is complex and time-consuming. It can disrupt the acquired business and its customer base, potentially leading to customer and employee losses if not managed effectively;
•Financing acquisitions using borrowed funds will increase our leverage and diminish our liquidity. Raising additional capital to finance acquisition could dilute existing shareholders’ interests;
•Sustaining our historical growth rate may be difficult due to market constraints and/or acquisition complexities. We have completed eight acquisitions from 2006 through 2018, which has enhanced our growth rate over the years;
•While our acquisitions and branching activities are expected to boost net income, they might also increase general and administrative expenses initially, potentially affecting our efficiency ratios. Successful integration is crucial for achieving expected efficiencies. If we are unsuccessful in our integration process, this may not occur, and our acquisitions or branching activities may not be accretive to earnings in the short or long-term;
•When acquisition costs exceed the fair value of the net assets acquired, goodwill is recorded. Any future impairment of goodwill could adversely affect our financial condition. See, the risk factor titled “We may experience future goodwill impairment, which could reduce our earnings” below; and
•Acquired loans are recorded at fair value, which may differ from their outstanding balance. Changes in yields and replacement of high-yielding loans can impact our net interest margins and interest income over time.
Our financial condition and results of operations could be negatively affected if we fail to execute our growth strategy or manage our growth effectively.
Our intention is to supplement our growth through selective acquisitions of financial institutions, including branch expansions, and other growth opportunities. However, there is no guarantee that we will identify suitable opportunities or effectively negotiate and finance these activities. Even if undertaken, the success of such undertakings cannot be assured.
Our growth initiatives may require us to recruit experienced personnel to assist in such initiatives, which will increase our compensation costs. In addition, the failure to identify and retain such personnel would place significant limitations on our ability to successfully execute our growth strategy. To the extent we expand our lending beyond our current market areas, we could also incur additional risk related to those new market areas. We may not be able to expand our market presence in our existing market areas or successfully enter new markets.
18
Inability to execute our acquisition-focused growth plan might adversely affect various aspects of our business, including finances, operations, reputation, and growth prospects. While we believe in the strength of our executive management and internal systems to manage growth, there can be no assurance that suitable growth opportunities will be available or that we will successfully manage our growth.
Risks Related to Economic Conditions
The current economic condition in the market areas we serve may adversely impact our earnings and could increase the credit risk associated with our loan portfolio.
Substantially all of our loans are to businesses and individuals in the states of Washington, Oregon and Idaho. A return of recessionary conditions or adverse economic conditions in the primary market areas of the Pacific Northwest in which we operate could reduce our rate of growth, affect our customers' ability to repay loans and have a material adverse effect on our business, financial condition, and results of operations. General economic conditions, including inflation, unemployment and money supply fluctuations, also may adversely affect our profitability. Weakness in the global economy and global supply chain issues have adversely affected many businesses operating in our markets that are dependent upon international trade. Changes in agreements or relationships between the United States and other countries may also affect these businesses.
A deterioration in economic conditions in our market areas of the Pacific Northwest as a result of inflation, a recession, or other factors could result in the following consequences, any of which could have a materially adverse impact on our business, financial condition and results of operations:
•Loan delinquencies, problem assets and foreclosures may increase;
•We may increase our ACL on loans and provision for credit losses;
•The sale of foreclosed assets may be slow;
•Demand for our products and services may decline, possibly resulting in a decrease in our total loans;
•Collateral for loans made may decline further in value, exposing us to increased risk of loss on existing loans;
•The net worth and liquidity of loan guarantors may decline, impairing their ability to honor commitments to us; and
•The amount of our deposits may decrease and the composition of our deposits may be adversely affected.
A decline in local economic conditions may have a greater effect on our earnings and capital than on the earnings and capital of larger financial institutions whose real estate loans are geographically diverse. Many of the loans in our portfolio are secured by real estate. Deterioration in the real estate markets where collateral for a loan is located could negatively affect the borrower’s ability to repay the loan and the value of the collateral securing the loan. Real estate values are affected by various other factors, including changes in general or regional economic conditions, governmental rules or policies and natural disasters such as earthquakes and flooding. If we are required to liquidate a significant amount of collateral during a period of reduced real estate values, our financial condition and profitability could be adversely affected.
External economic factors, such as changes in monetary policy and inflation and deflation, may have an adverse effect on our business, financial condition and results of operations.
Our financial condition and results of operations are affected by credit policies of monetary authorities, particularly the Board of Governors of the Federal Reserve System, or the Federal Reserve. Actions by monetary and fiscal authorities, including the Federal Reserve, could lead to inflation, deflation, or other economic phenomena that could adversely affect our financial performance. Inflation has risen sharply since the end of 2021 and throughout 2022 at levels not seen for over 40 years. Inflationary pressures, while easing recently, remained elevated throughout the first half of 2023. Small to medium-sized businesses may be impacted more during periods of high inflation as they are not able to leverage economics of scale to mitigate cost pressures compared to larger businesses. Consequently, the ability of our business clients to repay their loans may deteriorate quickly, which would adversely impact our results of operations and financial condition. Furthermore, a prolonged period of inflation could cause wages and other costs to the Company to increase, which could adversely affect our results of operations and financial condition. Virtually all our assets and liabilities are monetary in nature. As a result, interest rates tend to have a more significant impact on our performance than general levels of inflation or deflation. Interest rates do not necessarily move in the same direction or by the same magnitude as the prices of goods and services.
Risks Related to Market and Interest Rate Changes
Fluctuating interest rates can adversely affect our profitability.
Our profitability is dependent primarily upon net interest income, which is the difference (or “spread”) between the interest earned on loans, investment securities and other interest earning assets and the interest paid on deposits, borrowings, and other interest bearing liabilities. Because of the differences in maturities and repricing characteristics of our interest earning assets and interest bearing liabilities, changes in interest rates do not produce equivalent changes in interest income earned on interest earning assets and interest paid on interest bearing liabilities.
We principally manage interest rate risk by managing our volume and mix of our earning assets and funding liabilities. Changes in monetary policy, including changes in interest rates, could influence not only the interest we receive on loans and investment securities and the amount of interest we pay on deposits and borrowings, but these changes could also affect (i) our ability to originate and/or sell loans and obtain deposits, (ii) the fair value of our financial assets and liabilities, which could negatively impact shareholders’ equity, and our ability to realize gains from the sale of such assets, (iii) our ability to obtain and retain deposits in competition with other available investment alternatives, (iv) the ability of our borrowers to repay adjustable or variable rate loans, and (v) the average duration of our investment securities portfolio and other interest earning assets. If the interest rates paid on deposits and other borrowings increase at a faster rate than the interest rates received on loans and other investments, our net interest income, and therefore earnings, could be adversely affected. Earnings could also be adversely
19
affected if interest rates decrease as assets tend to reprice more quickly than liabilities. In a changing interest rate environment, we may not be able to manage this risk effectively. If we are unable to manage interest rate risk effectively, our business, financial condition and results of operations could be materially affected.
Interest rates are highly sensitive to many factors that are beyond our control, including general and forecasted economic conditions reflected in the rates offered along the yield curve and the FHLB's fixed-rate advance index, and policies of various governmental and regulatory agencies and, particularly the Federal Reserve. During the year ended December 31, 2023, in response to inflation, the FOMC of the Federal Reserve has increased the target range for the federal funds rate by 100 basis points to a range of 5.25% to 5.50% as of December 31, 2023 compared to a range of 0.00% to 0.25% at December 31, 2021 with the intention of controlling inflation without creating a recession. If the FOMC further increases the targeted federal funds rate, overall interest rates will likely rise, which may negatively impact both the housing market, by reducing refinancing activity and new home purchases, and the U.S. economy.
As is the case with many financial institutions, we have focused on growing core deposits—deposits with no or low interest rates and no specified maturity—which has been challenging over the past couple years. In a rising interest rate environment, retaining these deposits could result in higher funding costs. If the rates paid on deposits and other borrowings increase faster than the rates earned on loans and investments, our net interest income and earnings could be adversely affected. Conversely, if we do not adjust our deposit interest rates to remain competitive with other banks or alternative investment options, we might experience a decrease in deposits, potentially leading to either reduced earning assets or higher borrowings. Both scenarios could potentially cause a decline in earnings.
Changes in interest rates also affect the value of our available for sale investment securities portfolio. Generally, the fair value of fixed-rate investment securities fluctuates inversely with changes in interest rates. Unrealized gains and losses on investment securities available for sale are reported as a separate component of equity, net of tax. Decreases in the fair value of investment securities available for sale resulting from increases in interest rates could have an adverse effect on stockholders’ equity. Stockholders' equity, specifically AOCI, is increased or decreased by the amount of change in the estimated fair value of our securities available for sale, net of deferred income taxes. Increases in interest rates generally decrease the fair value of securities available for sale, which adversely impacts stockholders' equity. The Company could recognize an impairment loss for any security that has declined in fair value below its amortized cost basis if management has the intent to sell the security or if it is more likely than not it will be required to sell the security before recovery of its amortized cost basis.
Although management believes it has implemented effective asset and liability management strategies to reduce the potential effects of changes in interest rates on our results of operations, any substantial, unexpected or prolonged change in market interest rates could have a material adverse effect on our financial condition and results of operations. Also, our interest rate risk modeling techniques and assumptions likely may not fully predict or capture the impact of actual interest rate changes on our balance sheet. For further discussion of how changes in interest rates could impact us and additional information about our interest rate risk management, see Item 7A. Quantitative and Qualitative Disclosures About Market Risk.
Changes in the valuation of our investment securities portfolio could hurt our profits and reduce capital levels.
Factors beyond our control can significantly influence the fair value of investment securities in our portfolio and can cause potential adverse changes to the fair value of these investment securities, potentially reducing AOCI and/or earnings. These factors include, but are not limited to, rating agency actions in respect of the securities, defaults by, or other adverse events affecting the issuer or with respect to the underlying securities, and changes in market interest rates and continued instability in the capital markets. Our investment securities portfolio is evaluated for estimated credit losses and an ACL on investment securities, as appropriate, is recorded as a contra asset on the financial statement of condition and a provision for credit loss on investment securities through earnings. There can be no assurance that the declines in market value will not result in credit losses, which would lead to accounting charges that could have a material adverse effect on our net income and capital levels.
Risks Related to Laws and Regulations
Non-compliance with the USA PATRIOT Act, Bank Secrecy Act, or other laws and regulations could result in fines or sanctions and limit our ability to get regulatory approval of acquisitions.
The USA PATRIOT and Bank Secrecy Acts require financial institutions to develop programs to prevent financial institutions from being used for money laundering and terrorist activities. If such activities are detected, financial institutions are obligated to file suspicious activity reports with the U.S. Treasury’s Office of Financial Crimes Enforcement Network. These rules require financial institutions to establish procedures for identifying and verifying the identity of customers seeking to open new financial accounts. Failure to comply with these regulations could result in fines or sanctions and limit our ability to get regulatory approval of acquisitions. While we have developed policies and procedures designed to assist in compliance with these laws and regulations, no assurance can be given that these policies and procedures will be effective in preventing violations of these laws and regulations. Failure to maintain and implement adequate programs to combat money laundering and terrorist financing could also have serious reputational consequences for us and could have a material adverse effect on our business, financial condition, results of operations and growth prospects.
Monetary policies and regulations of the Federal Reserve could adversely affect our business, financial condition and results of operations.
In addition to being affected by general economic conditions, our earnings and growth are affected by the policies of the Federal Reserve. An important function of the Federal Reserve is to regulate the money supply and credit conditions. Among the instruments used by the Federal Reserve to implement these objectives are open market purchases and sales of U.S.
20
government securities, adjustments of the discount rate and changes in banks’ reserve requirements against bank deposits. These instruments are used in varying combinations to influence overall economic growth and the distribution of credit, bank loans, investments and deposits. Their use also affects interest rates charged on loans or paid on deposits.
The monetary policies and regulations of the Federal Reserve have had a significant effect on the operating results of financial institutions in the past and are expected to continue to do so in the future. The effects of such policies upon our business, financial condition and results of operations cannot be predicted.
Climate change and related legislative and regulatory initiatives may materially affect the Company’s business and results of operations.
The potential effects of climate change are creating a heightened level of concern for the state of the environment. As a result, the global business community has increased its political and social awareness surrounding the issue, and the United States has entered into international agreements in an attempt to reduce global temperatures, such as reentering the Paris Agreement. Further, the U.S. Congress, state legislatures and federal and state regulatory agencies continue to propose initiatives to supplement the global effort to combat climate change. Similar and even more expansive initiatives are expected under the current administration, including potentially increasing supervisory expectations with respect to banks’ risk management practices, accounting for the effects of climate change in stress testing scenarios and systemic risk assessments, revising expectations for credit portfolio concentrations based on climate-related factors and encouraging investment by banks in climate-related initiatives and lending to communities disproportionately impacted by the effects of climate change.
The lack of empirical data surrounding the credit and other financial risks posed by climate change render it difficult, or even impossible, to predict how specifically climate change may impact our financial condition and results of operations; however, the physical effects of climate change may also directly impact us. Specifically, the occurrence of unpredictable and more frequent weather disasters may adversely impact the real property, and/or the value of the real property, securing the loans in our portfolios. Additionally, if insurance obtained by our borrowers is insufficient to cover any losses sustained to the collateral, or if insurance coverage is otherwise unavailable to our borrowers, the collateral securing our loans may be negatively impacted by climate change, natural disasters and related events, which could impact our financial condition and results of operations. Further, the effects of climate change may negatively impact regional and local economic activity, which could lead to an adverse effect on our customers and impact the communities in which we operate. Overall, climate change, its effects and the resulting unknown impact could have a material adverse effect on our financial condition and results of operations.
Risks Related to Cybersecurity, Third-Parties and Technology
We rely on third party services and products to provide key components of our technology and banking product business infrastructure.
We rely on third party services to provide products and services in support of day-to-day operations. Due to the nature of the outsourced services, some portions of our technology offerings, computing environments, architecture, and infrastructure, and banking operational processes are exposed to vendor service risks. Risks include failure to contractually perform, fraud, errors, delays, omissions, failure to comply with regulatory and/or or legal requirements; and failure to ensure security and availability and integrity of service and/or accuracy of the provided service. The bank’s regulatory agencies require financial institutions to ensure risks associated with outsourced providers and services are appropriately identified, assessed, controlled, and continuously monitored to ensure risk is appropriately managed. Disruptions or failures in the physical infrastructure or operating systems that support our business and customers, or cyber-attacks or security breaches of the networks, systems or devices that our customers use to access our products and services could result in: client attrition; regulatory fines, penalties or intervention; reputational damage; reimbursement or other compensation costs and/or additional compliance costs, any of which could materially adversely affect our results of operations or financial condition.
We are subject to certain risks in connection with our use of technology.
Our security measures may not be sufficient to mitigate the risk of a cyber-attack. Technology architecture, infrastructure, and information systems and platforms are essential to conduct our business. Systems to manage our customer relationships, our core operating systems, our general ledger,and virtually all other aspects of our business rely on the secure processing, storage, and transmission of confidential and private information in our computing environments. Although we take every protective measure and endeavor to ensure the security of our computing environments and the data within the environments, systems, software and networks may be vulnerable to breaches, fraudulent or unauthorized access, denial or degradation of service, misuse of information, viruses, malicious code and malware and/or ransomware cybercrime incidents. If one or more of these events occur, systems, software and/or network availability, and integrity could be compromised resulting in the loss of the Company’s and/or customers’ confidential and private information. In the event of a security incident, significant additional resources may be expended to modify our protective measures or to investigate and remediate vulnerabilities or other exposures and we may be subject to litigation and financial losses that are either not insured against or not fully covered through any insurance maintained by us.
Security breaches in our internet banking activities could further expose us to possible liability and damage our reputation. Increases in criminal activity levels and sophistication, advances in computer capabilities, new vulnerabilities in third-party technologies (including browsers and operating systems) or other developments could result in a compromise or breach of the technology, processes and/or controls that we use to prevent fraudulent transactions and to protect data about us, our clients and underlying transactions. Any compromise of our security could deter customers from using our internet banking services that involve the transmission of confidential information. Although we have developed and continue to invest in systems and processes that are designed to detect and prevent security breaches and cyber-attacks and periodically test our security, these precautions may not protect our systems from compromises or breaches of our security measures and could result in losses to us or our customers, our loss of business and/or customers, damage to our reputation, incurrence of additional expenses,
21
disruption to our business, our inability to grow our online services or other businesses, additional regulatory scrutiny or penalties or our exposure to civil litigation and possible financial liability, any of which could have a material adverse effect on our business, financial condition and results of operations.
Our security measures may not protect us from system failures or interruptions. We have established policies and procedures to identify threats and vulnerabilities and prevent or limit the impact of system breaches, failures, and interruptions. In addition, we outsource certain aspects of our data processing and other operational functions to certain third-party providers. While the Company selects third-party vendors carefully, it does not control their actions. If our third-party providers encounter difficulties, including those resulting from breakdowns or other disruptions in communication services provided by a vendor, failure of a vendor to handle current or higher transaction volumes, cyber-attacks and security breaches or if we otherwise have difficulty in communicating with them, our ability to adequately process and account for transactions could be affected and to deliver products and services to our customers and otherwise conduct business operations could be adversely impacted. Replacing these third-party vendors could also entail significant delay and expense. Threats to information security also exist in the processing of customer information through various other vendors and their personnel. We cannot ensure that such breaches, failures or interruptions will not occur or, if they do occur, that they will be adequately addressed by us or the third parties on which we rely.
Further, while we believe we maintain adequate insurance to cover these risks, our insurance coverage may not cover all losses resulting from breaches, system failures or other disruptions. The occurrence of any systems failure or interruption could damage our reputation and result in a loss of customers and business, could subject us to additional regulatory scrutiny or could expose us to legal liability. Any of these occurrences could have a material adverse effect on our business, financial condition, and results of operations.
We are subject to certain risks in connection with our data management or aggregation.
We are reliant on our ability to manage data and our ability to aggregate data in an accurate and timely manner to ensure effective risk reporting and management. Our ability to manage data and aggregate data may be limited by the effectiveness of our policies, programs, processes, and practices that govern how data is acquired, validated, stored, protected and processed. While we continuously update our policies, programs, processes, and practices, many of our data management and aggregation processes are manual and subject to human error or system failure. Failure to manage data effectively and to aggregate data in an accurate and timely manner may limit our ability to manage current and emerging risks, as well as to manage changing business needs.
Our business may be adversely affected by an increasing prevalence of fraud and other financial crimes.
We are susceptible to fraudulent activity that may be committed against us or our customers which may result in financial losses or increased costs to us or our customers, disclosure or misuse of our information or our customer’s information, misappropriation of assets, privacy breaches against our customers, litigation or damage to our reputation. Such fraudulent activity may take many forms, including check fraud, electronic fraud, wire fraud, phishing, social engineering, and other dishonest acts. Nationally, reported incidents of fraud and other financial crimes have increased. We have also experienced losses due to apparent fraud and other financial crimes, although such losses have been relatively insignificant to date. While we have policies and procedures designed to prevent such losses, there can be no assurance that such losses will not occur.
The financial services market is undergoing rapid technological changes, and if we are unable to stay current with those changes, we may not be able to effectively compete.
The financial services industry is experiencing rapid technological changes with frequent introductions of new technology-driven products and services. Effective use of technology increases efficiency and enables financial institutions to better serve customers and to reduce costs. Many of our competitors have substantially greater resources to invest in technological improvements than we do. Our future success will depend, to some degree, upon our ability to address the needs of our customers by using technology to provide products and services that will satisfy customer demands for convenience, as well as create additional efficiencies in our operations. We may not be able to effectively implement new technology-driven products or services or be successful in marketing these products and services. Additionally, the implementation of technological changes and upgrades to maintain current systems and integrate new ones may cause service interruptions, transaction processing errors and system conversion delays and may cause us to fail to comply with applicable laws. There can be no assurance that we will be able to successfully manage the risks associated with increased dependency on technology.
Risks Related to Accounting Matters
New or changing tax, accounting, and regulatory rules and interpretations could significantly impact strategic initiatives, results of operations, cash flows, and financial condition.
The financial services industry is extensively regulated. Federal and state banking regulations are designed primarily to protect the deposit insurance funds and consumers, not to benefit our stockholders. These regulations, along with the currently existing tax, accounting, securities, insurance and monetary laws, regulations, rules, standards, policies and interpretations control the methods by which financial institutions conduct business, implement strategic initiatives and tax compliance and govern financial reporting and disclosures. These laws, regulations, rules, standards, policies and interpretations are constantly evolving and may change significantly over time. Any new regulations or legislation, change in existing regulation or oversight, whether a change in regulatory policy or a change in a regulator's interpretation of a law or regulation, could have a material impact on our operations, increase our costs of regulatory compliance and of doing business and adversely affect our profitability. Regulatory authorities also have extensive discretion in connection with their supervisory and enforcement activities, including the imposition of restrictions on the operation of an institution, the classification of assets by the institution and adequacy of an
22
institution's ACL. These bank regulators also have the ability to impose conditions in the approval of merger and acquisition transactions.
We may experience goodwill impairment, which could reduce our earnings.
Accounting standards require that we use the purchase method of accounting for acquisitions and business combinations. Under purchase accounting, if the purchase price of an acquired company exceeds the fair value of its net assets, the excess is carried on the acquirer’s balance sheet as goodwill. In accordance with GAAP, we assess our goodwill for impairment annually, or more frequently if specific events suggest potential impairment. This evaluation incorporates various quantitative factors, such as the quoted price of our common stock, market prices of common stock of other banking organizations, common stock trading multiples, discounted cash flows and data from comparable acquisitions. Additionally, we may perform a qualitative assessment that considers macroeconomic conditions, industry and market conditions, cost or margin factors, and financial performance. Assessing the fair value of goodwill involves considerable judgment. If our judgment was incorrect, or if events or circumstances change, and an impairment of goodwill was deemed to exist, we would be required to write down our goodwill resulting in a charge against income, which could materially adversely affect our results of operations and financial condition. We performed our annual impairment assessment for goodwill as of December 31, 2023, and concluded there was no impairment.
The Company’s reported financial results depend on management’s selection of accounting methods and certain assumptions and estimates, which, if incorrect, could cause unexpected losses in the future.
The Company’s accounting policies and methods are fundamental to how the Company records and reports its financial condition and results of operations. The Company’s management must exercise judgment in selecting and applying many of these accounting policies and methods so they comply with generally accepted accounting principles and reflect management’s judgment regarding the most appropriate manner to report the Company’s financial condition and results of operations. In some cases, management must select the accounting policy or method to apply from two or more alternatives, any of which might be reasonable under the circumstances, yet might result in the Company’s reporting materially different results than would have been reported under a different alternative.
Certain accounting policies are critical to presenting the Company’s financial condition and results of operations. They require management to make difficult, subjective or complex judgments about matters that are uncertain. Materially different amounts could be reported under different conditions or using different assumptions or estimates. These critical accounting policies include the ACL on loans, investments and unfunded commitments, and goodwill. Because of the uncertainty of estimates involved in these matters, the Company may be required to do one or more of the following: significantly increase the ACL and/or sustain credit losses that are significantly higher than the reserve provided, or recognize significant losses on the impairment of goodwill. For more information, refer to “Critical Accounting Estimates” included in Item 7. Management’s Discussion and Analysis of Financial Condition and Results of Operations of this Form 10-K.
Other Risks Related to Our Business
Managing reputational risk is important to attracting and maintaining customers, investors and employees.
Threats to our reputation can come from many sources, including adverse sentiment about financial institutions generally, unethical practices, employee misconduct, failure to deliver minimum standards of service or quality, compliance deficiencies and questionable or fraudulent activities of our customers. We have policies and procedures in place to protect our reputation and promote ethical conduct, but these policies and procedures may not be fully effective. Negative publicity regarding our business, employees, or customers, with or without merit, may result in the loss of customers, investors and employees; costly litigation; a decline in revenues and increased governmental regulation.
Ineffective liquidity management could adversely affect our financial results and condition.
Liquidity is essential to our business. We rely on several sources to meet our potential liquidity demands. Our primary sources of liquidity are increases in deposit accounts, cash flows from loan payments and our securities portfolio. Borrowings also provide us with a source of funds to meet liquidity demands. An inability to raise funds through deposits, borrowings, the sale of loans or investment securities and other sources could have a substantial negative effect on our liquidity. We rely on customer deposits and borrowings from the FHLB and certain other wholesale funding sources to fund our operations. Deposit flows and the prepayment of loans and mortgage-related investment securities are strongly influenced by such external factors as the direction of interest rates, whether actual or perceived, and the competition for deposits and loans in the markets we serve. Further, changes to the FHLB's underwriting guidelines for wholesale borrowings or lending policies may limit or restrict our ability to borrow and could therefore have a significant adverse impact on our liquidity. Although we have historically been able to replace maturing deposits and borrowings if desired, we may not be able to replace such funds in the future if, among other things, our financial condition, the financial condition of the FHLB or market conditions change. Factors that could detrimentally impact our access to liquidity sources include a decrease in the level of our business activity as a result of a downturn in the markets in which our loans and deposits are concentrated, negative operating results, or adverse regulatory action against us. Our ability to borrow could also be impaired by factors that are not specific to us, such as a disruption in the financial markets or negative views and expectations about the prospects for the financial services industry or deterioration in credit markets. Any decline in available funding in amounts adequate to finance our activities or on terms which are acceptable could adversely impact our ability to originate loans, invest in securities, meet our expenses, or fulfill obligations such as repaying our borrowings or meeting deposit withdrawal demands, any of which could, in turn, have a material adverse effect on our business, financial condition and results of operations.
23
Additionally, collateralized public funds are bank deposits of state and local municipalities. These deposits are required to be secured by certain investment grade securities to ensure repayment, which on the one hand tends to reduce our contingent liquidity risk by making these funds somewhat less credit sensitive, but on the other hand reduces standby liquidity by restricting the potential liquidity of the pledged collateral. Although these funds historically have been a relatively stable source of funds for us, availability depends on the individual municipality's fiscal policies and cash flow needs. See "Item 7. Management's Discussion and Analysis of Financial Condition and Results of Operations — Liquidity and Capital Resources" of this Form 10-K.
If our enterprise risk management framework is not effective at mitigating risk and loss to us, we could suffer unexpected losses and our results of operations could be materially adversely affected.
Our enterprise risk management framework seeks to achieve an appropriate balance between risk and return, which is critical to optimizing stockholder value. We have established processes and procedures intended to identify, measure, monitor, report, analyze and control the types of risk to which we are subject. These risks include liquidity risk; credit risk; market risk; interest rate risk; operational risk; information technology and cybersecurity risk; legal and compliance risk; and reputational risk, among others. We also maintain a compliance program to identify, measure, assess and report on our adherence to applicable laws, policies and procedures. While we assess and improve these programs on an ongoing basis, there can be no assurance that our risk management or compliance programs, along with other related controls, will effectively mitigate all risk and limit losses in our business. As with any risk management framework, there are inherent limitations to our risk management strategies as there may exist, or develop in the future, risks that we have not appropriately anticipated or identified. If our risk management framework proves ineffective, we could suffer unexpected losses and our business, financial condition and results of operations could be materially adversely affected.
We are dependent on key personnel and the loss of one or more of those key personnel may materially and adversely affect our prospects.
Competition for qualified employees and personnel in the banking industry is intense and there are a limited number of qualified persons with knowledge of, and experience in, the community banking industry where we conduct our business. The process of recruiting personnel with the combination of skills and attributes required to carry out our strategies is often lengthy. Our success depends to a significant degree upon our ability to attract and retain qualified management, loan origination, finance, administrative, marketing and technical personnel and upon the continued contributions of our management and personnel. In particular, our success has been and continues to be highly dependent upon the abilities of key executives, including our Chief Executive Officer, Jeffrey J. Deuel, and certain other employees. The loss of key personnel could adversely affect our ability to successfully conduct our business.
Increasing scrutiny and evolving expectations from customers, regulators, investors, and other stakeholders with respect to our environmental, social and governance practices may impose additional costs on us or expose us to new or additional risks.
Companies are facing increasing scrutiny from customers, regulators, investors, and other stakeholders related to their environmental, social and governance (“ESG”) practices and disclosure. Investor advocacy groups, investment funds and influential investors are also increasingly focused on these practices, especially as they relate to the environment, health and safety, diversity, labor conditions and human rights. Increased ESG related compliance costs could result in increases to our overall operational costs. Failure to adapt to or comply with regulatory requirements or investor or stakeholder expectations and standards could negatively impact our reputation, ability to do business with certain partners, and our stock price. New government regulations could also result in new or more stringent forms of ESG oversight and expanding mandatory and voluntary reporting, diligence, and disclosure.
Risk Related to Holding Our Common Stock
Our growth or future losses may require us to raise additional capital in the future, but that capital may not be available when it is needed or the cost of that capital may be very high; further, the resulting dilution of our equity may adversely affect the market price of our common stock.
We are required by federal and state regulatory authorities to maintain adequate levels of capital to support our operations. At some point, we may need to raise additional capital to support our growth or replenish future losses. Our ability to raise additional capital, if needed, will depend on conditions in the capital markets at that time, which are outside our control, and on our financial condition and performance. Accordingly, we cannot make assurances we will be able to raise additional capital, if needed, on terms that are acceptable to us or at all. If we cannot raise additional capital when needed, our ability to further expand our operations through internal growth and acquisitions could be materially impaired and our financial condition and liquidity could be materially and adversely affected.
In addition, any additional capital we obtain may dilute the interests of existing holders of our common stock. Further, if we are unable to raise additional capital when required by our bank regulators, we may be subject to adverse regulatory action.
We rely on dividends from the Bank for substantially all our revenue at the holding company level.
We are an entity separate and distinct from our subsidiary, the Bank, and derive substantially all our revenue at the holding company level in the form of dividends from that subsidiary. Accordingly, we are, and will be, dependent upon dividends from the Bank to pay the principal of and interest on our indebtedness, to satisfy our other cash needs and to pay dividends on our common stock. The Bank's ability to pay dividends is subject to its ability to earn net income and to meet certain regulatory requirements. In the event the Bank is unable to pay dividends to us, we may not be able to pay dividends on our common stock. Also, our right to participate in a distribution of assets upon a subsidiary's liquidation or reorganization is subject to the prior claims of the subsidiary's creditors.
24
ITEM 1B. UNRESOLVED STAFF COMMENTS
The Company has no unresolved staff comments from the SEC as it relates to the Company's financial information as reported in the Form 10-K.
ITEM 1C. CYBERSECURITY
Risk Management and Strategy
Enterprise Risk Management and Technology Risk Management. Within the Company's Enterprise Risk Management program, Technology Risk Management plays a pivotal role in overseeing the organization's risk posture, specifically focusing on the assessment of information and cybersecurity risks. Evaluated risks are subject to rigorous controls, ensuring both design and operational effectiveness and adherence to regulatory requirements. In instances where a risk is identified as inadequately controlled, prompt remediation measures are implemented to reduce the risk to an acceptable level.
Identification of risks is a multifaceted process, encompassing diverse activities such as management self-disclosure, monitoring of regulatory and interagency authorities, engagement with professional and industry forums, internal and external audits, collaboration with third-party professional services, policy reviews and walkthroughs, adherence to best practice frameworks, leveraging subject matter expertise and industry experience, and maintaining a collaborative relationship with third-party service providers/vendors. The Technology Risk Management practice operates as a continuous model assessment, utilizing information gathered daily, weekly, monthly, and annually to provide insights into the state of controlled risk within the organization. Security testing and assurance activities may be outsourced to independent audit and security firms based on factors such as resource capacity, subject matter expertise, regulatory requirements, and the prevailing rate and condition of risk.
Daily operational activities are in place to ensure the achievement and implementation of security requirements, including the management of security architecture, monitoring for potential security events or incidents, and the reporting and response to detected threats in our technology environments. The Information and Cyber Security Policy and Program establish policies and standards required to be implemented in support of these practices and processes. Additionally, we maintain a compliant and comprehensive Security Incident Response Plan, incorporating accessible resources such as insurance providers, digital and cyber forensic experts, law enforcement, along with documentation of regulatory notification. Our practices are interdependent with service providers/vendors, and we collaborate appropriately with these partners on notification and investigation processes to ensure complete visibility into security risks and events.
As of the reporting period, the Company has not experienced any material cybersecurity events or incidents. Although third-party service providers have encountered cybersecurity events or incidents, these occurrences have not resulted in a material impact on our systems, computing environments, customers, or data.
Governance
Board Oversight: The Company’s Board of Directors ("Board") provides active oversight of cybersecurity threats in accordance with the Board-approved Information and Cyber Security Policy and Program. These policies and programs aim to achieve a controlled risk environment while meeting regulatory, legislative, and compliance requirements, including but not limited to the Gramm-Leach-Bliley Act (GLBA), Health Insurance Portability and Accountability Act (HIPAA), Information Technology Sarbanes-Oxley Act (IT SOX) Compliance, and Payment Card Industry Data Security Standard (PCI-DSS) Compliance.
Direct oversight of cybersecurity risks is delegated to the Board's Risk and Technology Committee. The Committee meets at least quarterly and receives reports detailing current risks, the maturity and functioning of associated processes and controls, and emerging or anticipated risks and threats. Additionally, the Risk and Technology Committee Chair provides a verbal summarized report to the full Board. All Committee reports are available to the full Board for review. In the event of critical matters arising between scheduled meetings, the Chief Risk Officer promptly notifies the Board and Risk and Technology Committee.
To further ensure independence and effectiveness, the Board has delegated authority for the conduct of the cybersecurity program, including the referenced reports, to the Technology Risk Management Director. This position fulfills the role and responsibilities of a Chief Information Security Officer and reports to the Chief Risk Officer who in turn reports independently to the Chair of the Board's Risk and Technology Committee. Additional layers of oversight are integrated into the program through the Director of Internal Audit, who conducts independent audits of critical information technology and cybersecurity activities. The results of these audits are reported to the Board's Audit and Finance Committee, providing an extra layer of assurance and accountability. The Director of Internal Audit reports independently to the Chair of the Board's Audit and Finance Committee.
Management's Role in Assessing and Managing Cybersecurity Risks. Management's role in assessing and managing material risks from cybersecurity threats is integral to the Company's governance framework. The Board-approved Information and Cyber Security Policy and Program outline specific roles and responsibilities delegated to management and the Enterprise Risk Management program, which includes Technology Risk Management.
The Technology Risk Management Director, a seasoned information and cyber security expert with significant experience in financial institutions, oversees Technology Risk Management. This expert conducts comprehensive assessments of cybersecurity risks inherent in the industry and the Company's business activities, evaluating controls implemented to address identified risks.
25
The Technology Risk Management Director is responsible for maintaining the Company's information and cyber security risk management framework. This framework establishes standards and processes for the continuous assessment of material cybersecurity risks, covering identification, measurement, mitigation activities, monitoring, and reporting of the risk posture at any given time. Additionally, the Director ensures oversight and compliance with the Security Incident Response Plan, providing guidance during security incidents, whether within the Company or involving service provider/vendor engagements.
The Company’s information technology department, including a dedicated security operations group, plays a crucial role in implementing practices aligned with the Information and Cyber Security Policy and Program requirements. Responsibilities include the maintenance and monitoring of systems, network(s), and application access and error logs, identification of unauthorized access attempts, adherence to access controls standards, configuration management, and the implementation of controls to mitigate risks related to information availability, integrity, and confidentiality.
Business activities, products, and services are managed by experts in their respective fields, with employees receiving training to detect and prevent material cybersecurity threats. Business leaders are expected to understand specific threats within their areas of responsibility and adhere to established processes and standards to control such threats.
To facilitate a transparent and collaborative approach to managing cybersecurity risk, an executive management level committee has been established. Chaired by the Chief Risk Officer and administered by the Technology and Risk Management Director, the committee ensures continual awareness of the information and cybersecurity risk posture, emerging threats, known threat actors, and vulnerabilities. Its purpose is to foster a security culture within the Company through active participation in planning and managing threat and security risk activities.
All committee activities are reported to the Board's Risk and Technology Committee through committee minutes and formal activity reports provided by the Technology and Risk Management Director.
ITEM 2. PROPERTIES
The main office of the Company and the Bank is located in downtown Olympia, Washington. In addition, the Company has two administrative office locations in Tacoma and Burlington Washington and one, which is currently held for sale, in Lynnwood, Washington. The Bank's branch network at December 31, 2023 was comprised of 50 branches located throughout Washington, Oregon and Idaho. The Company leases 24 properties and owns 29 properties at December 31, 2023. In the opinion of management, all properties are adequately covered by insurance, are in good state of repair and are adequate to meet our present and immediately foreseeable needs.
ITEM 3. LEGAL PROCEEDINGS
Neither the Company nor the Bank, is a party to any material pending legal proceedings other than ordinary routine litigation incidental to our businesses.
ITEM 4. MINE SAFETY DISCLOSURES
Not applicable
PART II
ITEM 5. MARKET FOR THE REGISTRANT'S COMMON EQUITY, RELATED STOCKHOLDER MATTERS AND ISSUER PURCHASES OF EQUITY SECURITIES
Market Information
Our common stock is traded on the NASDAQ Global Select Market under the symbol HFWA.
Holders
At December 31, 2023, we had approximately 1,097 shareholders of record (not including the number of persons or entities holding stock in nominee or street name through various brokerage firms).
The Company has historically paid cash dividends to its common shareholders. On January 24, 2024, the Company’s Board of Directors declared a regular quarterly dividend of $0.23 per common share payable on February 22, 2024 to shareholders of record on February 8, 2024. Payments of future cash dividends, if any, will be at the discretion of our Board of Directors considering various factors, including our business, operating results and financial condition, capital requirements, current and anticipated cash needs, plans for expansion, any legal or contractual limitation on our ability to pay dividends and other relevant factors. No assurances can be given that any dividends will be paid or that, if paid, will not be reduced or eliminated in future periods. Dividends on common stock from the Company depend substantially upon receipt of dividends from the Bank, which is the Company’s predominant source of income. Management's projections show an expectation that cash dividends will continue for the foreseeable future.
26
Purchases of Equity Securities by the Issuer and Affiliated Purchasers
The following table sets forth information about the Company’s purchases of its outstanding common stock during the quarter ended December 31, 2023:
| Period | Total Number of Shares Purchased (1) | Average Price Paid Per Share (1) | Total number of shares purchased as part of publicly announced plans or programs | Maximum number of shares that may yet be purchased under the plans or programs (2) | |||||||||||||||||||
| October 1, 2023—October 31, 2023 | — | — | — | 307,790 | |||||||||||||||||||
| November 1, 2023— November 30, 2023 | — | — | — | 307,790 | |||||||||||||||||||
| December 1, 2023—December 31, 2023 | 1,225 | 20.65 | — | 307,790 | |||||||||||||||||||
| Total | 1,225 | $ | 20.65 | — | 307,790 | ||||||||||||||||||
(1) Of the common shares repurchased by the Company between October 1, 2023 and December 31, 2023, all shares represented the cancellation of stock to pay withholding taxes on vested restricted stock awards or units.
(2) On March 12, 2020 the Company's Board of Directors announced the repurchase of up to 5% of the Company's outstanding common shares, or 1,799,054 shares, under the twelfth stock repurchase plan. The repurchase program does not have a set expiration date and will expire upon repurchase of the full amount of authorized shares, unless terminated sooner by the Board of Directors. The repurchase program may be suspended or discontinued at any time by the Company’s Board of Directors.
Equity Compensation Plan Information.
The equity compensation plan information presented under subparagraph (d) in Part III, Item 12 of this Form 10-K is incorporated herein by reference.
Performance Graph
The following graph shows the five-year comparison of the total return to shareholders of the Company’s common stock as compared to the NASDAQ Composite Index and the S&P U.S. SmallCap Banks Index during the five-year period beginning December 31, 2018 and ending December 31, 2023. Total return includes appreciation or depreciation in market value of the Company’s common stock as well as actual cash and stock dividends paid to common shareholders. The NASDAQ Composite Index is a broad equity market index comprised of all domestic and international common stocks listed on the Nasdaq Stock Market. The S&P U.S. SmallCap Banks Index is comparative peer index comprised of banks and related holding companies within the same market capitalization range as the Company. The graph assumes the value of the investment in Company’s common stock and each index was $100 on December 31, 2018, and all dividends were reinvested.
.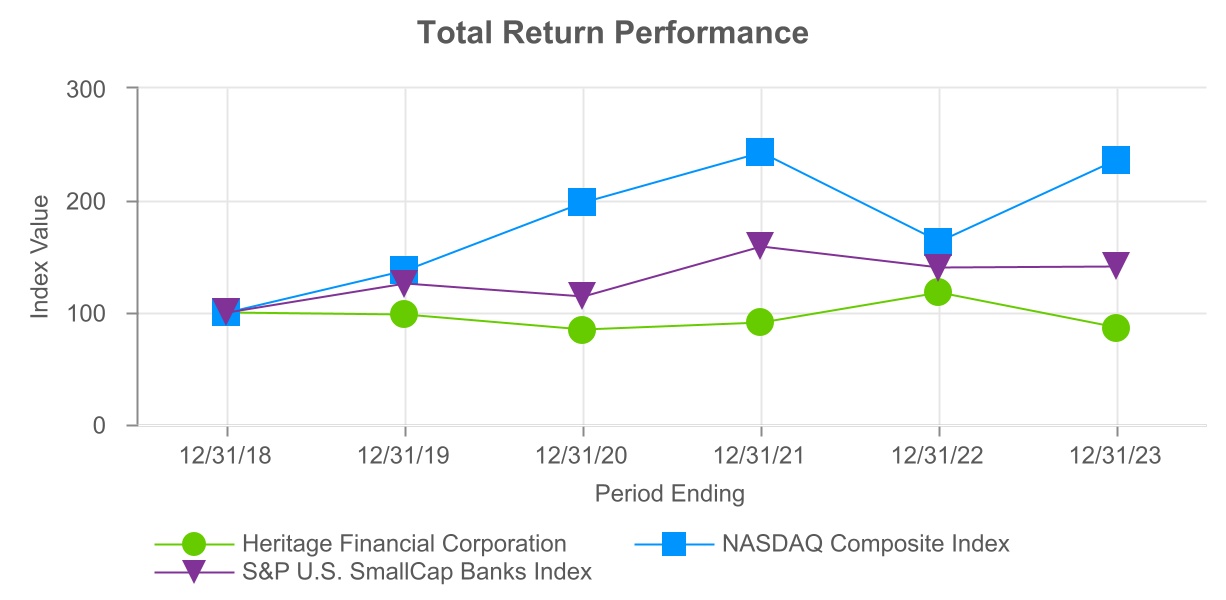
| Years Ended December 31, | |||||||||||||||||||||||||||||||||||
| Index | 2018 | 2019 | 2020 | 2021 | 2022 | 2023 | |||||||||||||||||||||||||||||
| Heritage Financial Corporation | $ | 100 | $ | 97.98 | $ | 84.20 | $ | 90.83 | $ | 117.47 | $ | 85.89 | |||||||||||||||||||||||
| NASDAQ Composite Index | 100 | 136.69 | 198.10 | 242.03 | 163.28 | 236.17 | |||||||||||||||||||||||||||||
| S&P U.S. SmallCap Banks Index | 100 | 125.46 | 113.94 | 158.62 | 139.85 | 140.55 | |||||||||||||||||||||||||||||
*Information for the graph was provided by S&P Global Market Intelligence.
27
ITEM 6. [RESERVED]
ITEM 7. MANAGEMENT'S DISCUSSION AND ANALYSIS OF FINANCIAL CONDITION AND RESULTS OF OPERATIONS
The following is a discussion and analysis of our financial condition and results of operations and should be read in conjunction with our financial statements and notes thereto included in Item 8 of this report. In addition to historical information, this discussion contains forward‑looking statements that involve risks, uncertainties and assumptions that could cause actual results to differ materially from management’s expectations. Factors that could cause such differences are discussed in the sections entitled “Cautionary Note Regarding Forward Looking Statements” and “Risk Factors.” The Company assumes no obligation to update any of these forward‑looking statements.
Management’s discussion focuses on 2023 results compared to 2022. For a discussion of 2022 results compared to 2021, refer to “Management’s Discussion and Analysis of Financial Condition and Results of Operations” in Part II, Item 7 of the Company’s Form 10-K for the fiscal year ended December 31, 2022, filed with the SEC on February 24, 2023.
Overview
Heritage Financial Corporation is a bank holding company which primarily engages in the business activities of our wholly-owned financial institution subsidiary, Heritage Bank. We provide financial services to our local communities with an ongoing strategic focus on our commercial banking relationships, market expansion and asset quality. The Company’s business activities generally are limited to passive investment activities and oversight of its investment in the Bank. Accordingly, the information set forth in this report relates primarily to the Bank’s operations.
Our business consists primarily of commercial lending and deposit relationships with small to medium sized businesses and their owners in our market areas and attracting deposits from the general public. We also originate real estate construction and land development loans, residential real estate loans and consumer loans, primarily in our markets.
Our core profitability depends primarily on our net interest income. Net interest income is the difference between interest income, which is the income that we earn on interest earning assets, comprised primarily of loans and investment securities, and interest expense, which is the amount we pay on our interest bearing liabilities, consisting primarily of deposits and borrowings. Management manages the repricing characteristics of the Company's interest earning assets and interest bearing liabilities to protect net interest income from changes in market interest rates and changes in the shape of the yield curve. Like most financial institutions, our net interest income is significantly affected by general and local economic conditions, particularly changes in market interest rates, including recently significant changes as a result of inflation, and by governmental policies and actions of regulatory agencies. Net interest income is additionally affected by changes in the volume and mix of interest earning assets, interest earned on these assets, the volume and mix of interest bearing liabilities and interest paid on these liabilities.
Our net income is affected by many factors, including the provision for credit losses on loans. The provision for credit losses on loans is dependent on changes in the loan portfolio and management’s assessment of the collectability of the loan portfolio as well as prevailing economic and market conditions. Management believes that the ACL on loans reflects the appropriate amount to provide for current expected credit losses in our loan portfolio based on the CECL methodology.
Net income is also affected by noninterest income and noninterest expense. Noninterest income primarily consists of service charges and other fees, card revenue and other income. Noninterest expense consists primarily of compensation and employee benefits, occupancy and equipment, data processing and professional services. Compensation and employee benefits consist primarily of the salaries and wages paid to our employees, payroll taxes, expenses for retirement and other employee benefits. Occupancy and equipment expenses are the fixed and variable costs of buildings and equipment and consists primarily of lease expenses, depreciation charges, maintenance and utilities. Data processing consists primarily of processing and network services related to the Bank’s core operating system, including the account processing system, electronic payments processing of products and services, internet and mobile banking channels and software-as-a-service providers. Professional services consist primarily of third-party service providers such as auditors, consultants and lawyers.
Results of operations may also be significantly affected by general and local economic and competitive conditions, changes in accounting, tax and regulatory rules, governmental policies and actions of regulatory authorities, including changes resulting from inflation and the governmental actions taken to address these issues. Net income is also impacted by growth of operations through organic growth or acquisitions.
Results of Operations
Net income was $61.8 million, or $1.75 per diluted common share, for the year ended December 31, 2023 down from $81.9 million, or $2.31 per diluted common share, for the year ended December 31, 2022. Net income decreased $20.1 million, or 24.6%, compared to December 31, 2022 due to losses on sales of investment securities of $12.2 million largely as a result of investment portfolio repositioning, an increase in noninterest expense of $15.7 million including an $8.0 million increase in compensation and employee benefits, and an increase in the provision for credit losses of $5.7 million resulting from a provision for credit losses of $4.3 million for the year ended December 31, 2023 compared to a reversal of the provision for credit losses of
28
$1.4 million during 2022. These decreases were partially offset by an increase in net interest income of $5.8 million and a decrease in income tax expense of $6.4 million.
Net Interest Income and Margin Overview
One of the Company's key sources of earnings is net interest income. There are several factors that affect net interest income, including, but not limited to, the volume, pricing, mix and maturity of interest earning assets and interest bearing liabilities; the volume of noninterest earning assets, noninterest bearing demand deposits, other noninterest bearing liabilities and stockholders' equity; market interest rate fluctuations; and asset quality.
Market rates impact the results of the Company's net interest income, including the significant increases in the federal funds target rate by the Federal Reserve in response to inflation during 2022 and 2023. The following table provides the federal funds target rate history and changes since December 31, 2021:
| Change Date | Rate (%) | Rate Change (%) | ||||||||||||
| December 31, 2021 | 0.00% - 0.25% | N/A | ||||||||||||
| March 17, 2022 | 0.25% - 0.50% | 0.25 | % | |||||||||||
| May 5, 2022 | 0.75% - 1.00% | 0.50 | % | |||||||||||
| June 16, 2022 | 1.50% - 1.75% | 0.75 | % | |||||||||||
| July 28, 2022 | 2.25% - 2.50% | 0.75 | % | |||||||||||
| September 22, 2022 | 3.00% - 3.25% | 0.75 | % | |||||||||||
| November 3, 2022 | 3.75% - 4.00% | 0.75 | % | |||||||||||
| December 15, 2022 | 4.25% - 4.50% | 0.50 | % | |||||||||||
| February 2, 2023 | 4.50% - 4.75% | 0.25 | % | |||||||||||
| March 23, 2023 | 4.75% - 5.00% | 0.25 | % | |||||||||||
| May 4, 2023 | 5.00% - 5.25% | 0.25 | % | |||||||||||
| July 27, 2023 | 5.25% - 5.50% | 0.25 | % | |||||||||||
Average Balances, Yields and Rates Paid
The following table provides relevant net interest income information for the periods indicated:
| Year Ended December 31, | |||||||||||||||||||||||||||||||||||||||||||||||||||||
| 2023 | 2022 | 2021 | |||||||||||||||||||||||||||||||||||||||||||||||||||
Average Balance(1) | Interest Earned/ Paid | Average Yield/ Rate | Average Balance(1) | Interest Earned/ Paid | Average Yield/ Rate | Average Balance(1) | Interest Earned/ Paid | Average Yield/ Rate | |||||||||||||||||||||||||||||||||||||||||||||
| (Dollars in thousands) | |||||||||||||||||||||||||||||||||||||||||||||||||||||
| Interest Earning Assets: | |||||||||||||||||||||||||||||||||||||||||||||||||||||
Loans receivable, net (2)(3) | $ | 4,155,722 | $ | 217,284 | 5.23 | % | $ | 3,852,604 | $ | 174,275 | 4.52 | % | $ | 4,181,464 | $ | 189,832 | 4.54 | % | |||||||||||||||||||||||||||||||||||
| Taxable securities | 1,937,603 | 58,509 | 3.02 | 1,646,058 | 40,627 | 2.47 | 846,892 | 17,492 | 2.07 | ||||||||||||||||||||||||||||||||||||||||||||
Nontaxable securities (3) | 63,051 | 1,854 | 2.94 | 135,004 | 3,488 | 2.58 | 158,968 | 3,899 | 2.45 | ||||||||||||||||||||||||||||||||||||||||||||
| Interest earning deposits | 129,807 | 6,818 | 5.25 | 913,374 | 9,067 | 0.99 | 1,193,724 | 1,608 | 0.13 | ||||||||||||||||||||||||||||||||||||||||||||
| Total interest earning assets | 6,286,183 | 284,465 | 4.53 | % | 6,547,040 | 227,457 | 3.47 | % | 6,381,048 | 212,831 | 3.34 | % | |||||||||||||||||||||||||||||||||||||||||
| Noninterest earning assets | 853,841 | 774,415 | 745,202 | ||||||||||||||||||||||||||||||||||||||||||||||||||
| Total assets | $ | 7,140,024 | $ | 7,321,455 | $ | 7,126,250 | |||||||||||||||||||||||||||||||||||||||||||||||
| Interest Bearing Liabilities: | |||||||||||||||||||||||||||||||||||||||||||||||||||||
| Certificates of Deposit | $ | 491,653 | $ | 14,554 | 2.96 | % | $ | 313,712 | $ | 1,407 | 0.45 | % | $ | 372,279 | $ | 1,811 | 0.49 | % | |||||||||||||||||||||||||||||||||||
| Savings accounts | 543,096 | 701 | 0.13 | 646,565 | 381 | 0.06 | 598,492 | 367 | 0.06 | ||||||||||||||||||||||||||||||||||||||||||||
| Interest bearing demand and money market accounts | 2,771,981 | 24,095 | 0.87 | 3,036,031 | 4,984 | 0.16 | 2,862,504 | 3,982 | 0.14 | ||||||||||||||||||||||||||||||||||||||||||||
| Total interest bearing deposits | 3,806,730 | 39,350 | 1.03 | 3,996,308 | 6,772 | 0.17 | 3,833,275 | 6,160 | 0.16 | ||||||||||||||||||||||||||||||||||||||||||||
| Junior subordinated debentures | 21,615 | 2,074 | 9.60 | 21,322 | 1,156 | 5.42 | 21,025 | 742 | 3.53 | ||||||||||||||||||||||||||||||||||||||||||||
29
| Year Ended December 31, | |||||||||||||||||||||||||||||||||||||||||||||||||||||
| 2023 | 2022 | 2021 | |||||||||||||||||||||||||||||||||||||||||||||||||||
Average Balance(1) | Interest Earned/ Paid | Average Yield/ Rate | Average Balance(1) | Interest Earned/ Paid | Average Yield/ Rate | Average Balance(1) | Interest Earned/ Paid | Average Yield/ Rate | |||||||||||||||||||||||||||||||||||||||||||||
| (Dollars in thousands) | |||||||||||||||||||||||||||||||||||||||||||||||||||||
| Securities sold under agreement to repurchase | 32,976 | 153 | 0.46 | 46,209 | 138 | 0.30 | 45,655 | 140 | 0.31 | ||||||||||||||||||||||||||||||||||||||||||||
| Borrowings | 369,665 | 17,733 | 4.80 | 137 | 6 | 4.38 | — | — | — | ||||||||||||||||||||||||||||||||||||||||||||
| Total interest bearing liabilities | 4,230,986 | 59,310 | 1.40 | % | 4,063,976 | 8,072 | 0.20 | % | 3,899,955 | 7,042 | 0.18 | % | |||||||||||||||||||||||||||||||||||||||||
| Noninterest bearing demand deposits | 1,899,317 | 2,326,178 | 2,269,921 | ||||||||||||||||||||||||||||||||||||||||||||||||||
| Other noninterest bearing liabilities | 191,679 | 119,359 | 114,307 | ||||||||||||||||||||||||||||||||||||||||||||||||||
| Stockholders’ equity | 818,042 | 811,942 | 842,067 | ||||||||||||||||||||||||||||||||||||||||||||||||||
| Total liabilities and stock-holders’ equity | $ | 7,140,024 | $ | 7,321,455 | $ | 7,126,250 | |||||||||||||||||||||||||||||||||||||||||||||||
| Net interest income and spread | $ | 225,155 | 3.13 | % | $ | 219,385 | 3.27 | % | $ | 205,789 | 3.16 | % | |||||||||||||||||||||||||||||||||||||||||
| Net interest margin | 3.58 | % | 3.35 | % | 3.23 | % | |||||||||||||||||||||||||||||||||||||||||||||||
(1) Average balances are calculated using daily balances.
(2) Average loans receivable, net includes loans held for sale and loans classified as nonaccrual, which carry a zero yield. Interest earned on loans receivable, net includes the amortization of net deferred loan fees of $3.3 million, $7.4 million and $28.4 million for the years ended December 31, 2023, 2022, and 2021, respectively.
(3) Yields on tax-exempt loans and securities have not been stated on a tax-equivalent basis.
The following tables provide the changes in net interest income for the periods indicated due to changes in average asset and liability balances (volume), changes in average yields/rates (rate) and changes attributable to the combined effect of volume and rates allocated proportionately to the absolute value of changes due to volume and changes due to rates:
2023 Compared to 2022 | |||||||||||||||||||||||
Increase (Decrease) Due to changes in | |||||||||||||||||||||||
| Volume | Yield/Rate | Total | % Change | ||||||||||||||||||||
| (Dollars in thousands) | |||||||||||||||||||||||
| Interest Earning Assets: | |||||||||||||||||||||||
| Loans receivable, net | $ | 14,429 | $ | 28,580 | $ | 43,009 | 24.7 | % | |||||||||||||||
| Taxable securities | 7,907 | 9,975 | 17,882 | 44.0 | |||||||||||||||||||
| Nontaxable securities | (2,063) | 429 | (1,634) | (46.8) | |||||||||||||||||||
| Interest earning deposits | (13,339) | 11,090 | (2,249) | (24.8) | |||||||||||||||||||
| Total interest income | 6,934 | 50,074 | 57,008 | 25.1 | |||||||||||||||||||
| Interest Bearing Liabilities: | |||||||||||||||||||||||
| Certificates of deposit | 1,209 | 11,938 | 13,147 | 934.4 | |||||||||||||||||||
| Savings accounts | (70) | 390 | 320 | 84.0 | |||||||||||||||||||
| Interest bearing demand and money market accounts | (470) | 19,581 | 19,111 | 383.4 | |||||||||||||||||||
| Total interest bearing deposits | 669 | 31,909 | 32,578 | 481.1 | |||||||||||||||||||
| Junior subordinated debentures | 16 | 902 | 918 | 79.4 | |||||||||||||||||||
| Securities sold under agreement to repurchase | (46) | 61 | 15 | 10.9 | |||||||||||||||||||
| Borrowings | 17,727 | — | 17,727 | 100.0 | |||||||||||||||||||
| Total interest expense | 18,366 | 32,872 | 51,238 | 634.8 | |||||||||||||||||||
| Net interest income | $ | (11,432) | $ | 17,202 | $ | 5,770 | 2.6 | % | |||||||||||||||
2022 Compared to 2021 | |||||||||||||||||||||||
Increase (Decrease) Due to changes in | |||||||||||||||||||||||
| Volume | Yield/Rate | $ | % | ||||||||||||||||||||
| (Dollars in thousands) | |||||||||||||||||||||||
| Interest Earning Assets: | |||||||||||||||||||||||
| Loans receivable, net | $ | (14,878) | $ | (679) | $ | (15,557) | (8.2) | % | |||||||||||||||
| Taxable securities | 19,174 | 3,961 | 23,135 | 132.3 | |||||||||||||||||||
30
2022 Compared to 2021 | |||||||||||||||||||||||
Increase (Decrease) Due to changes in | |||||||||||||||||||||||
| Volume | Yield/Rate | $ | % | ||||||||||||||||||||
| Nontaxable securities | (611) | 200 | (411) | (10.5) | |||||||||||||||||||
| Interest earning deposits | (464) | 7,923 | 7,459 | 463.9 | |||||||||||||||||||
| Total interest income | 3,221 | 11,405 | 14,626 | 6.9 | |||||||||||||||||||
| Interest Bearing Liabilities: | |||||||||||||||||||||||
| Certificates of deposit | (270) | (134) | (404) | (22.3) | |||||||||||||||||||
| Savings accounts | 28 | (14) | 14 | 3.8 | |||||||||||||||||||
| Interest bearing demand and money market accounts | 252 | 750 | 1,002 | 25.2 | |||||||||||||||||||
| Total interest bearing deposits | 10 | 602 | 612 | 9.9 | |||||||||||||||||||
| Junior subordinated debentures | 11 | 403 | 414 | 55.8 | |||||||||||||||||||
| Securities sold under agreement to repurchase | 2 | (4) | (2) | (1.4) | |||||||||||||||||||
| Borrowings | 6 | — | 6 | 100.0 | |||||||||||||||||||
| Total interest expense | 29 | 1,001 | 1,030 | 14.6 | |||||||||||||||||||
| Net interest income | $ | 3,192 | $ | 10,404 | $ | 13,596 | 6.6 | % | |||||||||||||||
Total interest income increased $57.0 million, or 25.1%, to $284.5 million for the year ended December 31, 2023 compared to $227.5 million for the year ended December 31, 2022. The increase was primarily due to a 106 basis point increase in the yield on interest earning assets to 4.53% for the year ended December 31, 2023, compared to 3.47% for the year ended December 31, 2022 following increases in market interest rates.
Total interest expense increased $51.2 million, or 634.8%, to $59.3 million for the year ended December 31, 2023 compared to $8.1 million for the year ended December 31, 2022 due primarily to increased costs of interest bearing deposits resulting from competitive rate pressures as well as customers transferring balances from non-maturity deposits to higher rate certificates of deposits and an increase in borrowings. Total cost of interest bearing liabilities increased 120 basis points to 1.40% for the year ended December 31, 2023, compared to 0.20% for the year ended December 31, 2022.
The net interest margin increased 23 basis points to 3.58% for the year ended December 31, 2023 compared to 3.35% for the year ended December 31, 2022. The increase in net interest margin was due primarily to increases in average yields on total interest earning assets as a result of increases in market interest rates. This was partially offset by increases in the average cost of interest bearing liabilities as a result of upward market pressure related to deposit rates and an increase in borrowings.
Provision for Credit Losses Overview
The aggregate of the provision for credit losses on loans and the provision for credit losses on unfunded commitments is presented on the Consolidated Statements of Income as the "Provision for (reversal of) credit losses." The ACL on unfunded commitments is included on the Consolidated Statements of Financial Condition within "Accrued expenses and other liabilities."
The following table presents the provision for (reversal of) credit losses for the periods indicated:
| Year Ended December 31, | Change | ||||||||||||||||||||||
| 2023 | 2022 | $ | % | ||||||||||||||||||||
| (Dollars in thousands) | |||||||||||||||||||||||
| Provision for (reversal of) credit losses on loans | $ | 4,736 | $ | (563) | $ | 5,299 | (941.2) | % | |||||||||||||||
| (Reversal of) provision for credit losses on unfunded commitments | (456) | (863) | 407 | (47.2) | |||||||||||||||||||
| Provision for (reversal of) credit losses | $ | 4,280 | $ | (1,426) | $ | 5,706 | (400.1) | % | |||||||||||||||
The provision for credit losses on loans recognized during the year ended December 31, 2023 was due primarily to growth in balances of collectively evaluated loans. The ACL on loans to Loans receivable increased to 1.11% as December 31, 2023, compared to 1.06% at December 31, 2022 due to changes in the loan mix as loan growth occurred in segments requiring a higher calculated reserve as a percentage of loans including real estate construction and land development loans. The reversal of provision for credit losses on unfunded commitments recognized during the year ended December 31, 2023 was due primarily to an increase in utilization rates on lines of credit and a decrease in the unfunded exposure on construction loans.
31
Noninterest Income Overview
The following table presents the change in the key components of noninterest income for the periods indicated:
| Year Ended December 31, | Change | ||||||||||||||||||||||
| 2023 | 2022 | $ | % | ||||||||||||||||||||
| (Dollars in thousands) | |||||||||||||||||||||||
| Service charges and other fees | $ | 10,966 | $ | 10,390 | $ | 576 | 5.5 | % | |||||||||||||||
| Card revenue | 8,340 | 8,885 | (545) | (6.1) | |||||||||||||||||||
Loss on sale of investment securities, net | (12,231) | (256) | (11,975) | 4,677.7 | |||||||||||||||||||
| Gain on sale of loans, net | 343 | 633 | (290) | (45.8) | |||||||||||||||||||
| Interest rate swap fees | 230 | 402 | (172) | (42.8) | |||||||||||||||||||
| Bank owned life insurance income | 2,934 | 3,747 | (813) | (21.7) | |||||||||||||||||||
| Gain on sale of other assets, net | 2 | 469 | (467) | (99.6) | |||||||||||||||||||
| Other income | 8,079 | 5,321 | 2,758 | 51.8 | |||||||||||||||||||
| Total noninterest income | $ | 18,663 | $ | 29,591 | $ | (10,928) | (36.9) | % | |||||||||||||||
Noninterest income decreased $10.9 million, or 36.9%, during the year ended December 31, 2023 compared to the same period in 2022. This decline was primarily driven by a pre-tax loss of $12.2 million incurred on the sale of investment securities available for sale during the year ended December 31, 2023. The loss on the sale of investment securities was a consequence of strategically repositioning the investment portfolio, involving the sale of $219.7 million in investment securities, with the aim of enhancing future earnings. Card revenue declined due to lower deposit transaction volumes. Bank owned life insurance income decreased due to the recognition of a death benefit of $1.0 million during the year ended December 31, 2022 which was not repeated during 2023, and gain on sale of other assets, net declined due to gain on sale of branches held for sale recognized during the year ended December 31, 2022 as a result of branch consolidations. These decreases were partially offset by an increase in other income primarily due to a one-time sale of Visa Inc. Class B common stock of $1.6 million and a $610,000 gain on sale of the Ellensburg branch during the year ended December 31, 2023. Service charges also increased due primarily to an increase in service charge income on commercial deposit accounts.
Noninterest Expense Overview
The following table presents changes in the key components of noninterest expense for the periods indicated:
| Year Ended December 31, | Change | ||||||||||||||||||||||
| 2023 | 2022 | $ | % | ||||||||||||||||||||
| (Dollars in thousands) | |||||||||||||||||||||||
| Compensation and employee benefits | $ | 100,083 | $ | 92,092 | $ | 7,991 | 8.7 | % | |||||||||||||||
| Occupancy and equipment | 19,156 | 17,465 | 1,691 | 9.7 | |||||||||||||||||||
| Data processing | 18,071 | 16,800 | 1,271 | 7.6 | |||||||||||||||||||
| Marketing | 1,930 | 1,643 | 287 | 17.5 | |||||||||||||||||||
| Professional services | 4,227 | 2,497 | 1,730 | 69.3 | |||||||||||||||||||
| State/municipal business and use tax | 4,059 | 3,634 | 425 | 11.7 | |||||||||||||||||||
| Federal deposit insurance premium | 3,312 | 2,015 | 1,297 | 64.4 | |||||||||||||||||||
| Amortization of intangible assets | 2,434 | 2,750 | (316) | (11.5) | |||||||||||||||||||
| Other expense | 13,351 | 12,070 | 1,281 | 10.6 | |||||||||||||||||||
| Total noninterest expense | $ | 166,623 | $ | 150,966 | $ | 15,657 | 10.4 | % | |||||||||||||||
Noninterest expense increased $15.7 million, or 10.4%, during the year ended December 31, 2023 compared to the same period in 2022 due primarily to an $8.0 million increase in compensation and employee benefits resulting from a 4.2% increase in the average number of full-time equivalent employees, which included the addition of commercial and relationship banking teams in Boise, Idaho in the first quarter of 2023 and Eugene, Oregon in the second quarter of 2022. as well as an increase in salaries and wages due to upward market pressure. Occupancy and equipment expense increased due to our expansion into Eugene, Oregon and Boise, Idaho. Data processing costs increased due to increased cost of service contracts, expansion of digital services offerings and a $320,000 accrual for the early termination of a technology-related contract. Professional services increased due primarily to a $1.5 million expense related to renewal of the core vendor contract during the fourth quarter of 2023. Federal deposit insurance premiums increased due to the increase in the assessment rate starting in January 2023. Other expense increased due to an increase in customer deposit loss expense and employee related expenses, which included additional expenses related to calling efforts for the newly added teams, as well as a general increase in operating costs.
32
Income Tax Expense Overview
The following table presents the income tax expense and related metrics and the change for the periods indicated:
Year Ended December 31, | 2023 Compared to 2022 Change | ||||||||||||||||||||||||||||
| 2023 | 2022 | 2021 | $ | % | |||||||||||||||||||||||||
| (Dollars in thousands) | |||||||||||||||||||||||||||||
| Income before income taxes | $ | 72,915 | $ | 99,436 | $ | 120,507 | $ | (26,521) | (26.7) | % | |||||||||||||||||||
| Income tax expense | $ | 11,160 | $ | 17,561 | $ | 22,472 | $ | (6,401) | (36.5) | % | |||||||||||||||||||
| Effective income tax rate | 15.3 | % | 17.7 | % | 18.6 | % | (2.4) | % | (13.6) | % | |||||||||||||||||||
Income tax expense and the effective income tax rate both decreased due primarily to lower pre-tax income, which increased the impact of favorable permanent tax items such as tax-exempt investments, investments in bank owned life insurance and tax credits.
Financial Condition Overview
The table below provides a comparison of the changes in the Company's financial condition for the periods indicated:
| Change | |||||||||||||||||||||||
| December 31, 2023 | December 31, 2022 | $ | % | ||||||||||||||||||||
| (Dollars in thousands) | |||||||||||||||||||||||
| Assets | |||||||||||||||||||||||
| Cash and cash equivalents | $ | 224,973 | $ | 103,590 | $ | 121,383 | 117.2 | % | |||||||||||||||
| Investment securities available for sale, at fair value, net | 1,134,353 | 1,331,443 | (197,090) | (14.8) | |||||||||||||||||||
| Investment securities held to maturity, at amortized cost, net | 739,442 | 766,396 | (26,954) | (3.5) | |||||||||||||||||||
| Loans receivable, net | 4,287,628 | 4,007,872 | 279,756 | 7.0 | |||||||||||||||||||
| Premises and equipment, net | 74,899 | 76,930 | (2,031) | (2.6) | |||||||||||||||||||
| Federal Home Loan Bank stock, at cost | 4,186 | 8,916 | (4,730) | (53.1) | |||||||||||||||||||
| Bank owned life insurance | 125,655 | 122,059 | 3,596 | 2.9 | |||||||||||||||||||
| Accrued interest receivable | 19,518 | 18,547 | 971 | 5.2 | |||||||||||||||||||
| Prepaid expenses and other assets | 318,571 | 296,181 | 22,390 | 7.6 | |||||||||||||||||||
| Other intangible assets, net | 4,793 | 7,227 | (2,434) | (33.7) | |||||||||||||||||||
| Goodwill | 240,939 | 240,939 | — | — | |||||||||||||||||||
| Total assets | $ | 7,174,957 | $ | 6,980,100 | $ | 194,857 | 2.8 | % | |||||||||||||||
| Liabilities and Stockholders' Equity | |||||||||||||||||||||||
| Deposits | $ | 5,599,872 | $ | 5,907,420 | $ | (307,548) | (5.2) | % | |||||||||||||||
| Deposits held for sale | — | 17,420 | $ | (17,420) | (100.0) | ||||||||||||||||||
| Total deposits | 5,599,872 | 5,924,840 | $ | (324,968) | (5.5) | ||||||||||||||||||
| Borrowings | 500,000 | — | 500,000 | 100.0 | |||||||||||||||||||
| Junior subordinated debentures | 21,765 | 21,473 | 292 | 1.4 | |||||||||||||||||||
| Securities sold under agreement to repurchase | — | 46,597 | (46,597) | (100.0) | |||||||||||||||||||
| Accrued expenses and other liabilities | 200,059 | 189,297 | 10,762 | 5.7 | |||||||||||||||||||
| Total liabilities | 6,321,696 | 6,182,207 | 139,489 | 2.3 | |||||||||||||||||||
| Common stock | 549,748 | 552,397 | (2,649) | (0.5) | |||||||||||||||||||
| Retained earnings | 375,989 | 345,346 | 30,643 | 8.9 | |||||||||||||||||||
| Accumulated other comprehensive loss, net | (72,476) | (99,850) | 27,374 | (27.4) | |||||||||||||||||||
| Total stockholders' equity | 853,261 | 797,893 | 55,368 | 6.9 | |||||||||||||||||||
| Total liabilities and stockholders' equity | $ | 7,174,957 | $ | 6,980,100 | $ | 194,857 | 2.8 | % | |||||||||||||||
Total assets increased due primarily to an increase in loans receivable and cash and cash equivalents offset partially by a decrease in investment securities. Total liabilities and stockholders' equity increased due primarily to an increase in borrowings offset partially by a decrease in deposits. The changes are discussed in more detail in the sections below.
33
Investment Activities Overview
Our investment policy is established by the Company's Board of Directors and monitored by the Risk Committee of the Board of Directors. It is designed primarily to provide and maintain liquidity, generate a favorable return on investments without incurring undue interest rate and credit risk, and complements the Company's lending activities. The policy permits investment in various types of liquid assets permissible under applicable regulations. Investment in non-investment grade bonds and stripped mortgage-backed securities is not permitted under the policy.
The following table provides information regarding our investment securities at the dates indicated:
| December 31, 2023 | December 31, 2022 | Change | |||||||||||||||||||||||||||||||||
| Balance | % of Total | Balance | % of Total | $ | % | ||||||||||||||||||||||||||||||
| (Dollars in thousands) | |||||||||||||||||||||||||||||||||||
| Investment securities available for sale, at fair value: | |||||||||||||||||||||||||||||||||||
| U.S. government and agency securities | $ | 13,750 | 0.7 | % | $ | 63,859 | 3.0 | % | $ | (50,109) | (78.5) | % | |||||||||||||||||||||||
| Municipal securities | 79,525 | 4.2 | 153,026 | 7.3 | (73,501) | (48.0) | |||||||||||||||||||||||||||||
Residential CMO and MBS(1) | 512,049 | 27.3 | 424,386 | 20.2 | 87,663 | 20.7 | |||||||||||||||||||||||||||||
Commercial CMO and MBS(1) | 504,258 | 27.0 | 664,421 | 31.8 | (160,163) | (24.1) | |||||||||||||||||||||||||||||
| Corporate obligations | 7,613 | 0.4 | 3,834 | 0.2 | 3,779 | 98.6 | |||||||||||||||||||||||||||||
| Other asset-backed securities | 17,158 | 0.9 | 21,917 | 1.0 | (4,759) | (21.7) | |||||||||||||||||||||||||||||
| Total | 1,134,353 | 60.5 | 1,331,443 | 63.5 | (197,090) | (14.8) | |||||||||||||||||||||||||||||
| Investment securities held to maturity, at amortized cost: | |||||||||||||||||||||||||||||||||||
| U.S. government and agency securities | $ | 151,075 | 8.1 | % | $ | 150,936 | 7.2 | % | $ | 139 | 0.1 | ||||||||||||||||||||||||
Residential CMO and MBS(1) | 267,204 | 14.3 | 290,318 | 13.8 | (23,114) | (8.0) | |||||||||||||||||||||||||||||
Commercial CMO and MBS(1) | 321,163 | 17.1 | 325,142 | 15.5 | (3,979) | (1.2) | |||||||||||||||||||||||||||||
| Total | 739,442 | 39.5 | 766,396 | 36.5 | (26,954) | (3.5) | |||||||||||||||||||||||||||||
| Total investment securities | $ | 1,873,795 | 100.0 | % | $ | 2,097,839 | 100.0 | % | $ | (224,044) | (10.7) | % | |||||||||||||||||||||||
(1) U.S. government agency and government-sponsored enterprise CMO and MBS obligations.
Total investment securities decreased due to sales of investment securities available for sale and maturities and repayments, offset partially by purchases of investment securities available for sale. Total losses on sale of $12.2 million were recognized during the year ended December 31, 2023
During the year ended December 31, 2023, the Company incurred a pre-tax loss of $12.2 million on the sale of investment securities available for sale due to the strategic repositioning of its investment portfolio. The Company sold $219.7 million in investment securities with an estimated weighted average book yield of 2.42% and purchased $178.4 million of investment securities with an estimated weighted average book yield of 5.77%.
The following table provides the weighted average yield at December 31, 2023 calculated based upon the fair values of our investment securities available for sale and held to maturity, and excluding any income tax benefits of tax-exempt bonds:
| In one year or less | After one year through five years | After five years through ten years | After ten years | Total | |||||||||||||||||||||||||||||||||||||||||||||||||||||||
| Fair Value | Yield | Fair Value | Yield | Fair Value | Yield | Fair Value | Yield | Fair Value | Yield | ||||||||||||||||||||||||||||||||||||||||||||||||||
| (Dollars in thousands) | |||||||||||||||||||||||||||||||||||||||||||||||||||||||||||
| Investment securities available for sale: | |||||||||||||||||||||||||||||||||||||||||||||||||||||||||||
| U.S. government and agency securities | $ | — | — | % | $ | 1,067 | 3.01 | % | $ | 6,107 | 2.67 | % | $ | 6,576 | 2.32 | % | $ | 13,750 | 2.51 | % | |||||||||||||||||||||||||||||||||||||||
| Municipal securities | 3,744 | 2.85 | 1,490 | 4.37 | 22,611 | 3.20 | 51,680 | 2.75 | 79,525 | 2.90 | |||||||||||||||||||||||||||||||||||||||||||||||||
Residential CMO and MBS(1) | 9 | 2.97 | 1,200 | 2.96 | 61,017 | 3.44 | 449,823 | 3.46 | 512,049 | 3.45 | |||||||||||||||||||||||||||||||||||||||||||||||||
Commercial CMO and MBS(1) | 31,829 | 2.19 | 324,439 | 3.07 | 133,046 | 2.73 | 14,944 | 5.49 | 504,258 | 3.00 | |||||||||||||||||||||||||||||||||||||||||||||||||
| Corporate obligations | — | — | — | — | 7,613 | 7.60 | — | — | 7,613 | 7.60 | |||||||||||||||||||||||||||||||||||||||||||||||||
| Other asset-backed securities | 263 | 2.78 | 2,126 | 2.54 | 3,090 | 6.99 | 11,679 | 6.62 | 17,158 | 6.11 | |||||||||||||||||||||||||||||||||||||||||||||||||
| Total | $ | 35,845 | 2.26 | % | $ | 330,322 | 3.07 | % | $ | 233,484 | 3.16 | % | $ | 534,702 | 3.49 | % | $ | 1,134,353 | 3.27 | % | |||||||||||||||||||||||||||||||||||||||
34
| In one year or less | After one year through five years | After five years through ten years | After ten years | Total | |||||||||||||||||||||||||||||||||||||||||||||||||||||||
| Fair Value | Yield | Fair Value | Yield | Fair Value | Yield | Fair Value | Yield | Fair Value | Yield | ||||||||||||||||||||||||||||||||||||||||||||||||||
| (Dollars in thousands) | |||||||||||||||||||||||||||||||||||||||||||||||||||||||||||
| Investment securities held to maturity: | |||||||||||||||||||||||||||||||||||||||||||||||||||||||||||
| U.S. government and agency securities | $ | — | — | % | $ | — | — | % | $ | 78,570 | 2.08 | % | $ | 44,804 | 2.13 | % | $ | 123,374 | 2.09 | % | |||||||||||||||||||||||||||||||||||||||
Residential CMO and MBS(1) | — | — | — | — | 41,753 | 3.30 | 211,350 | 4.02 | 253,103 | 3.90 | |||||||||||||||||||||||||||||||||||||||||||||||||
Commercial CMO and MBS(1) | — | — | 123,169 | 3.16 | 145,206 | 1.76 | 17,598 | 3.47 | 285,973 | 2.44 | |||||||||||||||||||||||||||||||||||||||||||||||||
| Total | $ | — | — | % | $ | 123,169 | 3.16 | % | $ | 265,529 | 2.08 | % | $ | 273,752 | 3.62 | % | $ | 662,450 | 2.90 | % | |||||||||||||||||||||||||||||||||||||||
(1) U.S. government agency and government-sponsored enterprise CMO and MBS obligations.
Loan Portfolio Overview
Changes by loan type
The Company originates a wide variety of loans with a focus on commercial business loans. In addition to originating loans, the Company may also acquire loans through pool purchases, participation purchases and syndicated loan purchases. The following table provides information about our loan portfolio by type of loan at the dates indicated:
| December 31, 2023 | December 31, 2022 | Change | |||||||||||||||||||||||||||||||||
| Amortized Cost | % of Loans Receivable | Amortized Cost | % of Loans Receivable | $ | % | ||||||||||||||||||||||||||||||
| (Dollars in thousands) | |||||||||||||||||||||||||||||||||||
| Commercial business: | |||||||||||||||||||||||||||||||||||
| Commercial and industrial | $ | 718,291 | 16.6 | % | $ | 693,568 | 17.1 | % | $ | 24,723 | 3.6 | % | |||||||||||||||||||||||
| Owner-occupied CRE | 958,620 | 22.1 | 937,040 | 23.1 | 21,580 | 2.3 | |||||||||||||||||||||||||||||
| Non-owner occupied CRE | 1,697,574 | 39.1 | 1,586,632 | 39.2 | 110,942 | 7.0 | |||||||||||||||||||||||||||||
| Total commercial business | 3,374,485 | 77.8 | 3,217,240 | 79.4 | 157,245 | 4.9 | |||||||||||||||||||||||||||||
Residential real estate | 375,342 | 8.7 | 343,631 | 8.5 | 31,711 | 9.2 | |||||||||||||||||||||||||||||
| Real estate construction and land development: | |||||||||||||||||||||||||||||||||||
| Residential | 78,610 | 1.8 | 80,074 | 2.0 | (1,464) | (1.8) | |||||||||||||||||||||||||||||
| Commercial and multifamily | 335,819 | 7.7 | 214,038 | 5.3 | 121,781 | 56.9 | |||||||||||||||||||||||||||||
| Total real estate construction and land development | 414,429 | 9.5 | 294,112 | 7.3 | 120,317 | 40.9 | |||||||||||||||||||||||||||||
| Consumer | 171,371 | 4.0 | 195,875 | 4.8 | (24,504) | (12.5) | |||||||||||||||||||||||||||||
| Total | $ | 4,335,627 | 100.0 | % | $ | 4,050,858 | 100.0 | % | $ | 284,769 | 7.0 | % | |||||||||||||||||||||||
Loans receivable increased due primarily to increased loan demand and a decline in loan prepayments as compared to the prior year, as well as an increase in advances on lines of credit. This increase was offset partially by a decrease in consumer loans due primarily to repayments totaling $30.5 million in indirect consumer loans as the Company ceased indirect consumer loan originations in 2020.
Owner-occupied CRE and non-owner occupied CRE loans increased $132.5 million to $2.66 billion at December 31, 2023, compared to $2.52 billion at December 31, 2022. The following table provides information about owner occupied CRE and non-owner occupied CRE loans by collateral type at the dates indicated:
| December 31, 2023 | December 31, 2022 | Change | |||||||||||||||||||||||||||||||||
| Amortized Cost | % of CRE Loans | Amortized Cost | % of CRE Loans | $ | % | ||||||||||||||||||||||||||||||
| (Dollars in thousands) | |||||||||||||||||||||||||||||||||||
| Owner occupied and non-owner occupied CRE loans by collateral type: | |||||||||||||||||||||||||||||||||||
| Office | $ | 555,822 | 20.9 | % | $ | 579,762 | 22.9 | % | $ | (23,940) | (4.1) | % | |||||||||||||||||||||||
| Industrial | 418,651 | 15.8 | 366,947 | 14.6 | 51,704 | 14.1 | |||||||||||||||||||||||||||||
| Retail store / shopping center | 285,926 | 10.8 | 291,799 | 11.6 | (5,873) | (2.0) | |||||||||||||||||||||||||||||
| Multi-family | 305,499 | 11.5 | 256,661 | 10.2 | 48,838 | 19.0 | |||||||||||||||||||||||||||||
| Mini-storage | 171,778 | 6.5 | 148,580 | 5.9 | 23,198 | 15.6 | |||||||||||||||||||||||||||||
35
| December 31, 2023 | December 31, 2022 | Change | |||||||||||||||||||||||||||||||||
| Amortized Cost | % of CRE Loans | Amortized Cost | % of CRE Loans | $ | % | ||||||||||||||||||||||||||||||
| (Dollars in thousands) | |||||||||||||||||||||||||||||||||||
| Mixed use property | 154,674 | 5.8 | 154,793 | 6.1 | (119) | (0.1) | |||||||||||||||||||||||||||||
| Warehouse | 149,176 | 5.6 | 147,443 | 5.8 | 1,733 | 1.2 | |||||||||||||||||||||||||||||
| Motel / hotel | 142,172 | 5.4 | 129,352 | 5.1 | 12,820 | 9.9 | |||||||||||||||||||||||||||||
| Single purpose | 123,344 | 4.6 | 112,924 | 4.5 | 10,420 | 9.2 | |||||||||||||||||||||||||||||
| Recreational / school | 67,791 | 2.6 | 70,565 | 2.8 | (2,774) | (3.9) | |||||||||||||||||||||||||||||
| Other | 281,361 | 10.5 | 264,846 | 10.5 | 16,515 | 6.2 | |||||||||||||||||||||||||||||
| Total | $ | 2,656,194 | 100.0 | % | $ | 2,523,672 | 100.0 | % | $ | 132,522 | 5.3 | % | |||||||||||||||||||||||
Office loans represented the largest segment of owner-occupied and non-owner occupied CRE loans totaling $555.8 million, or 20.9% of the total owner-occupied CRE and non-owner occupied CRE, at December 31, 2023. Of this total, $277.4 million, or 49.9%, were owner-occupied CRE loans. Owner-occupied CRE loans have a lower risk profile as there is less tenant rollover risk and generally have guarantees from the company occupying the space as well as the owners of the company. The average individual loan balance of owner-occupied CRE and non-owner occupied CRE was $1.2 million at December 31, 2023.
Commercial and multifamily construction loans increased $121.8 million or 56.9% due to new loan originations and advances on outstanding loans. New commitments for commercial and multifamily construction loans were $246.6 million during the year ended December 31, 2023.
Composition of loans receivable by contractual maturity and interest type
The following table presents the amortized cost of the loan portfolio by segment and contractual maturity at December 31, 2023:
| In one year or less | After one year through five years | After five years through 15 years | After 15 years | Total | |||||||||||||||||||||||||
| (Dollars in thousands) | |||||||||||||||||||||||||||||
| Commercial business: | |||||||||||||||||||||||||||||
| Commercial and industrial | $ | 282,665 | $ | 244,539 | $ | 186,764 | $ | 4,323 | $ | 718,291 | |||||||||||||||||||
| Owner-occupied CRE | 161,406 | 361,050 | 396,254 | 39,910 | 958,620 | ||||||||||||||||||||||||
| Non-owner occupied CRE | 367,147 | 737,167 | 575,713 | 17,547 | 1,697,574 | ||||||||||||||||||||||||
| Total commercial business | 811,218 | 1,342,756 | 1,158,731 | 61,780 | 3,374,485 | ||||||||||||||||||||||||
Residential real estate | 6,717 | 23,989 | 78,331 | 266,305 | 375,342 | ||||||||||||||||||||||||
| Real estate construction and land development: | |||||||||||||||||||||||||||||
| Residential | 54,189 | 10,738 | 3,563 | 10,120 | 78,610 | ||||||||||||||||||||||||
| Commercial and multifamily | 133,331 | 128,284 | 57,370 | 16,834 | 335,819 | ||||||||||||||||||||||||
| Total real estate construction and land development | 187,520 | 139,022 | 60,933 | 26,954 | 414,429 | ||||||||||||||||||||||||
| Consumer | 135,048 | 32,787 | 2,688 | 848 | 171,371 | ||||||||||||||||||||||||
| Total | $ | 1,140,503 | $ | 1,538,554 | $ | 1,300,683 | $ | 355,887 | $ | 4,335,627 | |||||||||||||||||||
The following table presents the amortized cost of the loan portfolio by segment and interest rate type that are due after one year at December 31, 2023:
Have predetermined interest rates(1) | Have floating or adjustable interest rates(1) | Total | |||||||||||||||
| (Dollars in thousands) | |||||||||||||||||
| Commercial business: | |||||||||||||||||
| Commercial and industrial | $ | 344,692 | $ | 90,934 | $ | 435,626 | |||||||||||
| Owner-occupied CRE | 497,698 | 299,516 | 797,214 | ||||||||||||||
| Non-owner occupied CRE | 825,514 | 504,913 | 1,330,427 | ||||||||||||||
| Total commercial business | 1,667,904 | 895,363 | 2,563,267 | ||||||||||||||
Residential real estate | 324,088 | 44,537 | 368,625 | ||||||||||||||
36
Have predetermined interest rates(1) | Have floating or adjustable interest rates(1) | Total | |||||||||||||||
| (Dollars in thousands) | |||||||||||||||||
| Real estate construction and land development: | |||||||||||||||||
| Residential | 18,503 | 5,918 | 24,421 | ||||||||||||||
| Commercial and multifamily | 182,135 | 20,353 | 202,488 | ||||||||||||||
| Total real estate construction and land development | 200,638 | 26,271 | 226,909 | ||||||||||||||
| Consumer | 36,203 | 120 | 36,323 | ||||||||||||||
| Total | $ | 2,228,833 | $ | 966,291 | $ | 3,195,124 | |||||||||||
(1) Includes $281.8 million of commercial business loans with floating or adjustable interest rates in which the Company entered into non-hedge interest rate swap contracts with the borrower and a third-party. Under these derivative contract arrangements, the Company effectively earns a variable rate of interest based on the one-month SOFR plus a margin, except for interest rate swap contracts on construction loans that earn fixed rates until the end of the construction period and the variable rate swap becomes effective.
Loans classified as nonaccrual and performing modified loans and nonperforming assets
The following table provides information about our nonaccrual loans, performing modified loans and nonperforming assets for the dates indicated:
| Change | |||||||||||||||||||||||
| December 31, 2023 | December 31, 2022 | $ | % | ||||||||||||||||||||
| (Dollars in thousands) | |||||||||||||||||||||||
Nonaccrual loans:(1) | |||||||||||||||||||||||
| Commercial business | $ | 4,468 | $ | 5,869 | $ | (1,401) | (23.9) | % | |||||||||||||||
| Real estate construction and land development | — | 37 | (37) | (100.0) | |||||||||||||||||||
| Total nonaccrual loans | 4,468 | 5,906 | (1,438) | (24.3) | |||||||||||||||||||
| Accruing loans past due 90 days or more | $ | 1,293 | $ | 1,615 | (322) | (19.9) | % | ||||||||||||||||
Total nonperforming loans | 5,761 | 7,521 | $ | (1,760) | (23.4) | % | |||||||||||||||||
| Other real estate owned | — | — | — | — | |||||||||||||||||||
| Total nonperforming assets | $ | 5,761 | $ | 7,521 | $ | (1,760) | (23.4) | % | |||||||||||||||
| Credit quality ratios: | |||||||||||||||||||||||
| Nonaccrual loans to loans receivable | 0.10 | % | 0.15 | % | |||||||||||||||||||
| Nonperforming loans to loans receivable | 0.13 | 0.19 | |||||||||||||||||||||
| Nonperforming assets to total assets | 0.08 | 0.11 | |||||||||||||||||||||
Modified loans:(2) | |||||||||||||||||||||||
| Commercial business | $ | 19,969 | |||||||||||||||||||||
| Residential real estate | — | ||||||||||||||||||||||
| Real estate construction and land development | 9,643 | ||||||||||||||||||||||
| Consumer | 41 | ||||||||||||||||||||||
| Total performing modified loans | $ | 29,653 | |||||||||||||||||||||
(1) At December 31, 2023 and December 31, 2022, $3.2 million, and $1.5 million, respectively, of nonaccrual loans were guaranteed by government agencies.
(2) The Company adopted ASU 2022-02 on a prospective basis January 1, 2023.
The following table provides the changes in nonaccrual loans during the periods indicated:
| Year Ended December 31, | Change | ||||||||||||||||||||||
| 2023 | 2022 | $ | % | ||||||||||||||||||||
| (Dollars in thousands) | |||||||||||||||||||||||
| Balance, beginning of period | $ | 5,906 | $ | 23,754 | $ | (17,848) | (75.1) | % | |||||||||||||||
| Additions | 3,057 | 1,325 | 1,732 | 130.7 | |||||||||||||||||||
37
| Year Ended December 31, | Change | ||||||||||||||||||||||
| 2023 | 2022 | $ | % | ||||||||||||||||||||
| (Dollars in thousands) | |||||||||||||||||||||||
| Net principal payments, sales and transfers to accruing status | (1,508) | (14,612) | 13,104 | (89.7) | |||||||||||||||||||
| Payoffs | (2,987) | (4,390) | 1,403 | (32.0) | |||||||||||||||||||
| Charge-offs | — | (171) | 171 | (100.0) | |||||||||||||||||||
| Balance, end of period | $ | 4,468 | $ | 5,906 | $ | (1,438) | (24.3) | % | |||||||||||||||
Nonaccrual loans decreased $1.4 million, or 24.3%, due primarily to ongoing collection efforts including the payoff of a commercial business loan for $1.6 million which also included a recovery of $1.1 million. Additions to nonaccrual loans consisted primarily of a $2.1 million commercial and industrial loan which is 100% government guaranteed.
Allowance for Credit Losses on Loans Overview
The following table provides information regarding changes in our ACL on loans for the years indicated:
| At or For the Years Ended December 31, | |||||||||||||||||
| 2023 | 2022 | 2021 | |||||||||||||||
| (Dollars in thousands) | |||||||||||||||||
| ACL on loans at the beginning of the period | $ | 42,986 | $ | 42,361 | $ | 70,185 | |||||||||||
| Charge-offs: | |||||||||||||||||
| Commercial business | (719) | (316) | (1,276) | ||||||||||||||
Residential real estate | — | (30) | — | ||||||||||||||
| Real estate construction and land development | — | — | (1) | ||||||||||||||
| Consumer | (586) | (547) | (669) | ||||||||||||||
| Total charge-offs | (1,305) | (893) | (1,946) | ||||||||||||||
| Recoveries: | |||||||||||||||||
| Commercial business | 1,372 | 929 | 816 | ||||||||||||||
Residential real estate | — | 3 | — | ||||||||||||||
| Real estate construction and land development | — | 384 | 32 | ||||||||||||||
| Consumer | 210 | 765 | 572 | ||||||||||||||
| Total recoveries | 1,582 | 2,081 | 1,420 | ||||||||||||||
| Net recoveries (charge-offs) | 277 | 1,188 | (526) | ||||||||||||||
| Provision for (reversal of) credit losses on loans | 4,736 | (563) | (27,298) | ||||||||||||||
| ACL on loans at the end of period | $ | 47,999 | $ | 42,986 | $ | 42,361 | |||||||||||
| Credit quality ratios: | |||||||||||||||||
| ACL on loans to: | |||||||||||||||||
| Loans receivable | 1.11 | % | 1.06 | % | 1.11 | % | |||||||||||
| Nonaccrual loans | 1074.28 | 727.84 | 178.33 | ||||||||||||||
Nonaccrual loans to loans receivable | 0.10 | 0.15 | 0.62 | ||||||||||||||
Balances at the end of the period: | |||||||||||||||||
Loans receivable | $ | 4,335,627 | $ | 4,050,858 | $ | 3,815,662 | |||||||||||
Nonaccrual loans | 4,468 | 5,906 | 23,754 | ||||||||||||||
Average balances outstanding during the period:(1) | |||||||||||||||||
| Commercial business | $ | 3,289,564 | $ | 3,188,238 | $ | 3,540,728 | |||||||||||
| Residential real estate | 369,297 | 250,780 | 123,875 | ||||||||||||||
| Real estate construction and land development | 362,919 | 242,528 | 301,532 | ||||||||||||||
38
| At or For the Years Ended December 31, | |||||||||||||||||
| 2023 | 2022 | 2021 | |||||||||||||||
| (Dollars in thousands) | |||||||||||||||||
| Consumer | 179,454 | 212,306 | 271,834 | ||||||||||||||
| Total | $ | 4,201,234 | $ | 3,893,852 | $ | 4,237,969 | |||||||||||
| Net (recoveries) charge-offs during the period to average balances outstanding during the period: | |||||||||||||||||
| 2023 | 2022 | 2021 | |||||||||||||||
| Commercial business | (0.02) | % | (0.02) | % | 0.01 | % | |||||||||||
| Residential real estate | — | 0.01 | — | ||||||||||||||
| Real estate construction and land development | — | (0.16) | (0.01) | ||||||||||||||
| Consumer | 0.21 | (0.10) | 0.04 | ||||||||||||||
| Total | (0.01) | % | (0.03) | % | 0.01 | % | |||||||||||
(1) Average balances exclude the ACL on loans and loans held for sale, but include loans classified as nonaccrual.
The provision for credit losses on loans of $4.7 million recognized during the year ended December 31, 2023 was due primarily to growth in balances of collectively evaluated loans. The ACL on loans to Loans receivable increased to 1.11% as December 31, 2023, compared to 1.06% at December 31, 2022 due to changes in the loan mix as loan growth occurred in segments requiring a higher calculated reserve as a percentage of loans including real estate construction and land development loans.
The following table presents the ACL on loans by loan portfolio segment at the indicated dates:
| December 31, 2023 | December 31, 2022 | Change | |||||||||||||||||||||||||||||||||
| ACL on loans | Percent of Total (1) | ACL on loans | Percent of Total (1) | $ | % | ||||||||||||||||||||||||||||||
| (Dollars in thousands) | |||||||||||||||||||||||||||||||||||
| Commercial business | $ | 31,303 | 77.8 | % | $ | 30,718 | 79.4 | % | $ | 585 | 1.9 | % | |||||||||||||||||||||||
| Residential real estate | 3,473 | 8.7 | 2,872 | 8.5 | 601 | 20.9 | |||||||||||||||||||||||||||||
| Real estate construction and land development | 10,876 | 9.5 | 7,063 | 7.3 | 3,813 | 54.0 | |||||||||||||||||||||||||||||
| Consumer | 2,347 | 4.0 | 2,333 | 4.8 | 14 | 0.6 | |||||||||||||||||||||||||||||
| Total ACL on loans | $ | 47,999 | 100.0 | % | $ | 42,986 | 100.0 | % | $ | 5,013 | 11.7 | % | |||||||||||||||||||||||
(1) Represents the percent of loans receivable by loan category to loans receivable.
Deposits Overview
The following table summarizes the Company's deposits at the dates indicated:
| December 31, 2023 | December 31, 2022 | Change | |||||||||||||||||||||||||||||||||
Balance (1) | % of Total | Balance(1) | % of Total | $ | % | ||||||||||||||||||||||||||||||
| (Dollars in thousands) | |||||||||||||||||||||||||||||||||||
| Noninterest demand deposits | $ | 1,715,847 | 30.7 | % | $ | 2,099,464 | 35.5 | % | $ | (383,617) | (18.3) | % | |||||||||||||||||||||||
| Interest bearing demand deposits | 1,608,745 | 28.7 | 1,830,727 | 30.9 | (221,982) | (12.1) | |||||||||||||||||||||||||||||
| Money market accounts | 1,094,351 | 19.5 | 1,063,243 | 17.9 | 31,108 | 2.9 | |||||||||||||||||||||||||||||
| Savings accounts | 487,956 | 8.7 | 623,833 | 10.5 | (135,877) | (21.8) | |||||||||||||||||||||||||||||
| Total non-maturity deposits | 4,906,899 | 87.6 | 5,617,267 | 94.8 | (710,368) | (12.6) | |||||||||||||||||||||||||||||
| Certificates of deposit | 692,973 | 12.4 | 307,573 | 5.2 | 385,400 | 125.3 | |||||||||||||||||||||||||||||
| Total deposits | $ | 5,599,872 | 100.0 | % | $ | 5,924,840 | 100.0 | % | $ | (324,968) | (5.5) | % | |||||||||||||||||||||||
(1) Deposit balances at December 31, 2022 include deposits held for sale of $17.4 million, respectively.
Total deposits decreased $325.0 million, or 5.5%, to $5.60 billion at December 31, 2023, compared to $5.92 billion at December 31, 2022 due primarily to competitive rate pressures and interest rate sensitive clients moving a portion of their non-operating deposits to higher yielding accounts. Certificate of deposits increased due to increasing rates which attracted customers to this deposit type as well as the addition of $115.0 million in brokered deposits.
The Company entered into a purchase and sale agreement with a third party to sell and transfer certain assets, deposits and other liabilities of its branch in Ellensburg, WA in September 2022. During the three months ended September 30, 2023,
39
$13.8 million in deposits were sold as part of the closing of the Ellensburg branch sale, which included $13.6 million of non-maturity deposits. At December 31, 2022, $17.4 million in deposits were classified as held for sale.
Total deposits include uninsured deposits of approximately $2.10 billion and $2.37 billion at December 31, 2023 and 2022, respectively, calculated in accordance with FDIC guidelines. Uninsured deposits included $256.5 million fully collateralized deposits as of December 31, 2023, The Bank does not hold any foreign deposits.
The following table provides the estimated uninsured portion of certificates of deposit that are in excess of the FDIC insurance limit, by remaining time until maturity at December 31, 2023, by account, with a maturity of:
| (Dollars in thousands) | |||||
| Three months or less | $ | 121,833 | |||
| Over three months through six months | 46,294 | ||||
| Over six months through twelve months | 75,392 | ||||
| Over twelve months | 2,679 | ||||
| Total | $ | 246,198 | |||
Stockholders' Equity Overview
The Company’s stockholders' equity to assets ratio was 11.9% and 11.4% at December 31, 2023 and December 31, 2022. The following table provides the changes to stockholders' equity during the periods indicated:
| Year Ended December 31, | Change | ||||||||||||||||||||||
| 2023 | 2022 | $ | % | ||||||||||||||||||||
| (Dollars in thousands) | |||||||||||||||||||||||
| Balance, beginning of period | $ | 797,893 | $ | 854,432 | $ | (56,539) | (6.6) | % | |||||||||||||||
| Net income | 61,755 | 81,875 | (20,120) | (24.6) | |||||||||||||||||||
| Dividends declared | (31,112) | (29,767) | (1,345) | 4.5 | |||||||||||||||||||
Other comprehensive income (loss), net of tax | 27,374 | (109,246) | 136,620 | (125.1) | |||||||||||||||||||
| Common stock repurchased | (6,974) | (3,196) | (3,778) | 118.2 | |||||||||||||||||||
| Stock-based compensation expense | 4,325 | 3,795 | 530 | 14.0 | |||||||||||||||||||
| Balance, end of period | $ | 853,261 | $ | 797,893 | $ | 55,368 | 6.9 | % | |||||||||||||||
Stockholder's equity increased due primarily to net income and an increase in AOCI as a result of a decrease in other comprehensive income (loss), net of tax, which positively impacted the fair value of our investment securities available for sale. AOCI has no effect on our regulatory capital ratios as the Company opted to exclude it from our common equity tier 1 capital. Cash dividends and stock repurchases partially offset the increase in stockholders' equity during the year ended December 31, 2023.
The Company repurchased 330,424 and 100,090 shares of its common stock under the Company's stock repurchase plan during the years ended December 31, 2023 and December 31, 2022, respectively. The Company also repurchased 32,792 and 26,944 shares which represented the cancellation of stock to pay withholding taxes on vested restricted stock awards or units during the years ended December 31, 2023 and December 31, 2022, respectively
Liquidity and Capital Resources
Liquidity refers to the Company’s ability to provide funds at an acceptable cost to meet loan demand and deposit withdrawals, as well as contingency plans to meet unanticipated funding needs or loss of funding sources. These objectives can be met from either our assets or liabilities.
Asset liquidity sources consist of the repayments and maturities of loans, sales of loans, maturities of investment securities and sales of investment securities available for sale. These activities are generally included as investing activities in the Consolidated Statements of Cash Flows. Net cash used by investing activities was $93.4 million during the year ended December 31, 2023. Net increases in loan balances from both loan originations and purchases used $280.7 million of cash, while investment securities sales and maturities, net of purchases provided $246.2 million in cash.
Liquidity may also be affected by liabilities as a result of changes in deposits and borrowings. These activities are included in financing activities in the Consolidated Statements of Cash Flows. During the year ended December 31, 2023, financing activities provided $105.3 million of funds resulting primarily from an increase in short-term borrowings of $500.0 million offset partially by declines of $310.3 million in deposits and $46.6 million in securities sold under agreements to repurchase, and $30.8 million in dividend payments. The decline in deposits consisted of a decrease in non-maturity deposits of $710.4 million, offset partially by an increase in certificates of deposit of $385.4 million due primarily to competitive rate pressures and interest rate sensitive clients moving a portion of their non-operating deposits to higher yielding accounts including certificates of deposit. The decrease in total deposits during 2023 was industry wide. No assurance can be given as to future trends; however,
40
historically, we have been able to retain and increase our deposits. We had FRB advances of $500.0 million at December 31, 2023, which were obtained through the Bank Term Funding Program ("BTFP") and mature during 2024 and are discussed in Note 11 of the Consolidated Financial Statements.
At December 31, 2023, we had outstanding loan commitments of $1.27 billion, primarily relating to undisbursed loans in process and unused credit lines as discussed in Note 19 of the Consolidated Financial Statements. Loan commitments represent potential growth in the loan portfolio and lending activities. The current level of commitments is proportionally consistent with our historical experience and does not represent a departure from traditional operations. For the year ended December 31, 2023, we have $21.5 million of purchase obligations under contracts with our key vendors to provide services, mainly information technology related contracts. In addition, for the year ended December 31, 2023, we have $28.2 million of commitments under operating lease agreements.
We maintain sufficient cash and cash equivalents and investment securities to meet short-term liquidity needs and we also actively monitor our long-term liquidity position to ensure the availability of capital resources for contractual obligations, strategic loan growth objectives and to fund operations. Our funding strategy has been to acquire non-maturity deposits from our retail accounts, acquire noninterest bearing demand deposits from our commercial customers and use our borrowing availability to fund growth in assets. We may also acquire brokered deposits when the cost of funds is advantageous compared to other funding sources. Borrowings may be used on a short-term basis to compensate for reductions in other sources of funds (such as deposit inflows at less than projected levels). Borrowings may also be used on a longer-term basis to support expanded lending activities and match the maturity of repricing intervals of assets. While maturities and scheduled amortization of loans are a predictable source of funds, deposit flows and loan prepayments are greatly influenced by the level of interest rates, economic conditions and competition so we adhere to internal management targets assigned to the loan to deposit ratio, liquidity ratio, net short-term non-core funding ratio and non-core liabilities to total assets ratio to ensure an appropriate liquidity position.
We maintain credit facilities with the FHLB, which provide for advances that in the aggregate would equal the lesser of 45% of the Bank’s assets or adjusted qualifying collateral (subject to a sufficient level of ownership of FHLB stock). At December 31, 2023, under these credit facilities based on pledged loan collateral, the Bank had $1.42 billion of available credit capacity. We had no funds borrowed from the FHLB at December 31, 2023 or 2022. In addition, the Bank has access to the FRB Discount Window and BTFP. Under these programs, based on pledged investment collateral, the Bank had available lines of credit of approximately $819.5 million as of December 31, 2023, subject to amount of pledged collateral. We had $500.0 million in borrowings from the FRB's BTFP at December 31, 2023, as discussed previously, and none at December 31, 2022. At December 31, 2023, the Bank also had uncommitted federal funds line of credit agreements with other financial institutions totaling $145.0 million. No balances were outstanding under these agreements as of December 31, 2023 or 2022. Availability of lines is subject to federal funds balances available for loan and continued borrower eligibility. These lines are intended to support short-term liquidity needs and the agreements may restrict consecutive day usage. Management believes it has adequate resources and funding potential to meet our foreseeable liquidity requirements.
The Company pays dividends to our shareholders and the primary source of the Company's liquidity is cash obtained from dividends from the Bank to the Company. We expect to continue our current practice of paying quarterly cash dividends on our common stock subject to our Board of Directors’ discretion to modify or terminate this practice at any time and for any reason without prior notice. Our current quarterly common stock dividend rate is $0.23 per share, as approved by our Board of Directors. We believe this dividend rate per share enables us to balance our multiple objectives of managing and investing in the Bank and returning a substantial portion of our cash to our shareholders. Assuming continued payment during 2024 at this rate of $0.23 per share, our average total dividend paid each quarter would be approximately $8.0 million based on the number of our current outstanding shares (which assumes no increases or decreases in the number of shares).
From time to time, our Board of Directors has authorized stock repurchase plans. In general, stock repurchase plans allow us to proactively manage our capital position and return excess capital to shareholders. Shares purchased under such plans may also provide us with shares of common stock necessary to satisfy obligations related to stock compensation awards. The Company's current stock repurchase program authorizes us to repurchase up to 1,799,054 shares of Company common stock, of which 307,790 shares remained available for future repurchases as of December 31, 2023. The actual timing, number and value of shares repurchased under the stock repurchase program will depend on a number of factors, including constraints specified pursuant to any trading plan that may be adopted in accordance with Rule 10b5-1 of the SEC, price, general business and market conditions, and alternative investment opportunities. See “Market for Registrant’s Common Equity, Related Stockholder Matters and Issuer Purchases of Equity Securities” contained in Item 5, Part II of this Form 10-K for additional information relating to stock repurchases.
Management believes the capital sources are adequate to meet all reasonably foreseeable short-term and intermediate-term cash requirements.
Critical Accounting Estimates
Critical accounting estimates are those estimates made in accordance with generally accepted accounting principles that involve a significant level of estimation uncertainty and have had or are reasonably likely to have a material impact on the
41
financial condition or results of operations of the registrant. The Company considers its critical accounting estimates to be as follows:
ACL on Loans
Management's estimate of the ACL on loans relies on the identification, stratification and separate estimates of loss for loans individually evaluated for loss and loans collectively evaluated for loss. The estimate of loss for loans collectively evaluated for loss particularly involves a significant level of estimation uncertainty due to its complexity and quantity of inputs including: management's determination of baseline loss rate multipliers based on a third-party forecast of economic conditions, an estimate of the reasonable and supportable forecast period, an estimate of the baseline loss rate lookback period, an estimate of the reversion period from the reasonable and supportable forecast period to the baseline loss rate, and an estimate of the prepayment rate and related lookback period. Additionally, management considers other qualitative risk factors to further adjust the estimated ACL on loans through a qualitative allowance.
Management's estimates for these inputs are based on past events and current conditions, are inherently subjective, and are susceptible to significant revision as more information becomes available. While management utilizes its best judgment and information available to recognize credit losses on loans, future additions to the allowance may be necessary based on declines in local and national economic conditions. In addition, various regulatory agencies, as an integral part of their examination process, periodically review the Company’s ACL on loans. Such agencies may require the Company to make adjustments to the allowance based on their judgments about information available to them at the time of their examinations. Unanticipated changes in any of these inputs could have a significant impact on our financial condition and results of operations.
For additional information regarding the ACL on loans, its relation to the provision for credit losses, its risk related to asset quality and lending activity, see Item 1A. Risk Factors—Our ACL on loans may prove to be insufficient to absorb losses in our loan portfolio as well as Note (1) Description of Business, Basis of Presentation, Significant Accounting Policies and Recently Issued Accounting Pronouncements and Note (4) Allowance for Credit Losses on Loans of the Notes to Consolidated Financial Statements included in Item 8. Financial Statements And Supplementary Data.
ACL on Unfunded Commitments
The allowance methodology for unfunded commitments is similar to the ACL on loans, but additionally includes considerations of the current utilization of the commitment, an estimate of the future utilization, an estimate of utilization of construction loans prior to completion and an estimate of construction loan advance rates as determined appropriate by historical commitment utilization and the Company's estimates of future utilization given current economic forecasts. Unanticipated changes in loss rates estimated in the ACL on loans, as utilized in the methodology for the ACL on unfunded commitments, or the expected utilization of unfunded commitments could have a significant impact on our financial condition and results of operations.
For additional information regarding the ACL on unfunded commitments, see Note (1) Description of Business, Basis of Presentation, Significant Accounting Policies and Recently Issued Accounting Pronouncements and Note (19) Commitments and Contingencies of the Notes to Consolidated Financial Statements included in Item 8. Financial Statements And Supplementary Data.
Goodwill
Due to a sustained decline in stock price during the three months ended June 30, 2023, the Company determined a triggering event occurred and consequently performed a quantitative assessment of goodwill as of May 31, 2023. We estimated the fair value of the reporting unit by weighting results from the market approach and the income approach. Significant assumptions inherent in the valuation methodologies for goodwill were employed and included, but were not limited to, prospective financial information, growth rates, terminal value, discount rates, and comparable multiples from publicly traded companies in our industry. Based on this quantitative test, we determined that the fair value of the reporting unit more likely than not exceeded the carrying value.
The Company performed its annual goodwill impairment test during the fourth quarter of 2023 and determined that no material adverse changes had occurred since the quantitative assessment was performed as of May 31, 2023, and that it is more likely than not that the fair value of the reporting unit exceeded the carrying value, such that the Company's goodwill was not considered impaired for the year ended December 31, 2023. Changes in the economic environment, operations of the reporting unit or other adverse events, could result in future impairment charges which could have a material adverse impact on the Company’s operating results.
For additional information regarding goodwill, see Note (1) Description of Business, Basis of Presentation, Significant Accounting Policies and Recently Issued Accounting Pronouncements and Note (6) Goodwill and Other Intangible Assets of the Notes to Consolidated Financial Statements included in Item 8. Financial Statements And Supplementary Data.
ITEM 7A. QUANTITATIVE AND QUALITATIVE DISCLOSURES ABOUT MARKET RISK
Market risk represents the risk of loss due to changes in market values of assets and liabilities. We incur market risk in the normal course of business through our exposure to market interest rates, equity prices and credit spreads. Our primary market risk is interest rate risk, which is the risk of loss of net interest income or net interest margin resulting from changes in market interest rates. Interest rate risk results primarily from the traditional banking activities in which the Company engages, such as gathering deposits and extending loans. Many factors, including economic and financial conditions, movements in
42
interest rates and consumer preferences, affect the difference between the interest earned on our assets and the interest paid on our liabilities.
Our Asset/Liability Management Committee is responsible for developing, monitoring and reviewing asset/liability processes, interest rate risk exposures, strategies and tactics and reporting to the Board of Directors' Risk and Technology Committee. It is the responsibility of the Board of Directors to establish policies and interest rate limits and approve these policies and interest rate limits annually. It is the responsibility of management to execute the approved policies, develop and implement risk management strategies and to report to the Board of Directors on a regular basis. We maintain an asset/liability management policy that provides guidelines for controlling exposure to interest rate risk. The policy guidelines direct management to assess the impact of changes in interest rates upon both earnings and capital. These guidelines establish limits for interest rate risk sensitivity.
Net interest income simulation
We use an income simulation model as the primary tool to assess the direction and magnitude of changes in net interest income resulting from changes in interest rates. Modeling the sensitivity of net interest income is highly dependent on numerous assumptions incorporated into the modeling process. Key assumptions in the model include prepayment speeds on loans and investment securities, repricing betas on non-maturity deposits, and repricing on investment securities, loans, and borrowings. In order to measure the interest rate risk sensitivity as of December 31, 2023, this simulation model uses a “static balance sheet” assumption, meaning the size and mix of the balance sheet remains the same as maturing cash flows from assets and liabilities are reinvested into the same categories at the current level of interest rates. The simulation also assumes an instantaneous and sustained uniform change in market interest rates at all maturities.
The following table summarizes the estimated effect on net interest income over a 12 month period measured against a flat rate (no interest rate change) scenario for the periods indicated:
| December 31, 2023 | December 31, 2022 | ||||||||||||||||||||||
$ Change in Net Interest Income | % Change in Net Interest Income | $ Change in Net Interest Income | % Change in Net Interest Income | ||||||||||||||||||||
Change in Interest Rates (Basis Points) | (Dollars in thousands) | ||||||||||||||||||||||
+200(shock) | $ | 1,438 | 0.6 | % | $ | 8,181 | 3.2 | % | |||||||||||||||
+100(shock) | 1,644 | 0.7 | 5,113 | 2.0 | |||||||||||||||||||
+0(flat) | — | — | — | — | |||||||||||||||||||
-100(shock) | 1,861 | 0.8 | (5,433) | (2.1) | |||||||||||||||||||
-200(shock) | 1,549 | 0.7 | (16,840) | (6.6) | |||||||||||||||||||
The Company’s balance sheet sensitivity to changes in market rates is somewhat neutral, meaning results are similar in the rates up and down scenarios over a twelve month time horizon. The Company is less asset sensitive than in the prior year due primarily to a decrease in interest earning deposits that reprice daily.
The simulation results noted above do not incorporate any management actions that might moderate the negative consequences of interest rate deviations. In addition, the simulation results noted above contain various assumptions such as a static balance sheet, and the rate that deposit interest rates change as market interest rates change. Therefore, they do not reflect likely actual results, but serve as estimates of interest rate risk.
As with any method of measuring interest rate risk, certain shortcomings are inherent in the method of analysis presented in the preceding table. For example, although certain of the Company’s assets and liabilities may have similar maturities or repricing time frames, they may react in different degrees to changes in market interest rates. In addition, the interest rates on certain of the Company’s asset and liability categories may precede, or lag behind, changes in market interest rates. Also, the actual rates of prepayments on loans and investments could vary significantly from the assumptions utilized in deriving the results as presented in the preceding tables. Further, a change in U.S. Treasury rates accompanied by a change in the shape of the treasury yield curve could result in different estimations from those presented herein. Accordingly, the results in the preceding table should not be relied upon as indicative of actual results in the event of changing market interest rates.
43
ITEM 8. FINANCIAL STATEMENTS AND SUPPLEMENTARY DATA
REPORT OF INDEPENDENT REGISTERED PUBLIC ACCOUNTING FIRM
Shareholders and the Board of Directors of Heritage Financial Corporation
Olympia, Washington
Opinions on the Financial Statements and Internal Control over Financial Reporting
We have audited the accompanying Consolidated Statements of Financial Condition of Heritage Financial Corporation and Subsidiaries (the "Company") as of December 31, 2023 and 2022, the related Consolidated Statements of Income, Comprehensive Income (Loss), Stockholders’ Equity, and Cash Flows, for each of the years in the three-year period ended December 31, 2023, and the related notes (collectively referred to as the "financial statements"). We also have audited the Company’s internal control over financial reporting as of December 31, 2023, based on criteria established in the 2013 Internal Control – Integrated Framework issued by the Committee of Sponsoring Organizations of the Treadway Commission (“COSO”).
In our opinion, the financial statements referred to above present fairly, in all material respects, the financial position of the Company as of December 31, 2023 and 2022, and the results of its operations and its cash flows for each of the years in the three-year period ended December 31, 2023 in conformity with accounting principles generally accepted in the United States of America. Also in our opinion, the Company maintained, in all material respects, effective internal control over financial reporting as of December 31,2023, based on criteria established in the 2013 Internal Control – Integrated Framework issued by COSO.
Basis for Opinions
The Company’s management is responsible for these financial statements, for maintaining effective internal control over financial reporting, and for its assessment of the effectiveness of internal control over financial reporting, included in the accompanying Management’s Report on Internal Control over Financial Reporting. Our responsibility is to express an opinion on the Company’s financial statements and an opinion on the Company’s internal control over financial reporting based on our audits. We are a public accounting firm registered with the Public Company Accounting Oversight Board (United States) ("PCAOB") and are required to be independent with respect to the Company in accordance with the U.S. federal securities laws and the applicable rules and regulations of the Securities and Exchange Commission and the PCAOB.
We conducted our audits in accordance with the standards of the PCAOB. Those standards require that we plan and perform the audits to obtain reasonable assurance about whether the financial statements are free of material misstatement, whether due to error or fraud, and whether effective internal control over financial reporting was maintained in all material respects.
Our audits of the financial statements included performing procedures to assess the risks of material misstatement of the financial statements, whether due to error or fraud, and performing procedures that respond to those risks. Such procedures included examining, on a test basis, evidence regarding the amounts and disclosures in the financial statements. Our audits also included evaluating the accounting principles used and significant estimates made by management, as well as evaluating the overall presentation of the financial statements. Our audit of internal control over financial reporting included obtaining an understanding of internal control over financial reporting, assessing the risk that a material weakness exists, and testing and evaluating the design and operating effectiveness of internal control based on the assessed risk. Our audits also included performing such other procedures as we considered necessary in the circumstances. We believe that our audits provide a reasonable basis for our opinions.
Definition and Limitations of Internal Control Over Financial Reporting
A company’s internal control over financial reporting is a process designed to provide reasonable assurance regarding the reliability of financial reporting and the preparation of financial statements for external purposes in accordance with generally accepted accounting principles. A company’s internal control over financial reporting includes those policies and procedures that (1) pertain to the maintenance of records that, in reasonable detail, accurately and fairly reflect the transactions and dispositions of the assets of the company; (2) provide reasonable assurance that transactions are recorded as necessary to permit preparation of financial statements in accordance with generally accepted accounting principles, and that receipts and expenditures of the company are being made only in accordance with authorizations of management and directors of the company; and (3) provide reasonable assurance regarding prevention or timely detection of unauthorized acquisition, use, or disposition of the company’s assets that could have a material effect on the financial statements.
Because of its inherent limitations, internal control over financial reporting may not prevent or detect misstatements. Also, projections of any evaluation of effectiveness to future periods are subject to the risk that controls may become inadequate because of changes in conditions, or that the degree of compliance with the policies or procedures may deteriorate.
Critical Audit Matter
The critical audit matter communicated below is a matter arising from the current period audit of the financial statements that was communicated or required to be communicated to the audit committee and that: (1) relates to accounts or disclosures that are material to the financial statements and (2) involved our especially challenging, subjective, or complex judgments. The
44
communication of the critical audit matter does not alter in any way our opinion on the financial statements, taken as a whole, and we are not, by communicating the critical audit matter below, providing a separate opinion on the critical audit matter or on the accounts or disclosures to which it relates.
Allowance for Credit Losses on Loans – Qualitative Allowance
As described in Note 1, “Description of Business, Basis of Presentation, Significant Accounting Policies and Recently Issued Accounting Pronouncements” and Note 4, “Allowance for Credit Losses (“ACL”) on Loans” to the consolidated financial statements, the Company’s consolidated allowance for credit losses on loans was $48.0 million at December 31, 2023 and provision for credit losses on loans was $4.7 million for the year then ended. The evaluation of ACL on loans is inherently subjective as it requires estimates that are susceptible to significant revision as more information becomes available. While management utilizes its best judgment and information available to recognize estimated losses on loans, future additions to the allowance may be necessary based on further declines in local and national economic conditions.
The Company primarily uses a historic loss, open pool credit loss methodology to calculate the ACL on loans, which the Company has applied to identified loan segments with similar risk characteristics. The allowance for collectively evaluated loans is comprised of the baseline loss allowance, the macroeconomic allowance, and the qualitative allowance. The baseline loss allowance begins with the baseline loss rates calculated using average quarterly historical loss information for an economic cycle. The baseline loss rates are applied to each loan's estimated cash flows over the life of the loan under the remaining life method to determine the baseline loss estimate for each loan. The Company uses macroeconomic scenarios from an independent third party. These scenarios are based on past events, current conditions, the likelihood of future events occurring and include consideration of the forecasted direction of the economic and business environment and its likely impact on the estimated allowance as compared to the historical losses over the reasonable and supportable time frame. Management also considers other qualitative risk factors to further adjust the estimated ACL on loans through a qualitative allowance. These adjustments are subjectively selected by management and are based primarily on established macroeconomic factors to estimate risk.
The subjective nature of the qualitative risk factor adjustments requires significant judgment by management both in the selection of qualitative factors to apply, if any, and the magnitude of the adjustment once selected. The audit procedures over the qualitative allowance utilized in management’s methodology involved especially challenging and subjective auditor judgment. Therefore, we identified auditing the ACL qualitative allowance as a critical audit matter.
Our audit procedures to address this critical audit matter primarily included the following:
•Tested the operating effectiveness of controls over application of the qualitative factors, including:
◦The Company’s ACL committee’s review and approval of the qualitative risk factor adjustments used to derive the qualitative allowance for the ACL on loans, and the relevance and reliability of the data used therein.
◦Management’s controls over the completeness and accuracy of the data utilized in the qualitative allowance for the ACL on loans.
•Substantively tested management’s application of the macroeconomic sensitive model and related factors including:
◦Evaluated the reasonableness of management’s judgments used in the determination of the qualitative risk factor adjustments by loan segment and the resulting allocation to the qualitative allowance for the ACL on loans.
◦Evaluated the reliability and relevance of data used as a basis for the qualitative risk factor adjustments.
◦Tested the completeness and accuracy of the data utilized in management’s ACL methodology to derive the qualitative allowance for the ACL on loans.
/s/ Crowe LLP
We have served as the Company's auditor since 2012.
February 27, 2024
45
HERITAGE FINANCIAL CORPORATION AND SUBSIDIARIES
CONSOLIDATED STATEMENTS OF FINANCIAL CONDITION
(Dollars in thousands, except share data)
| December 31, 2023 | December 31, 2022 | ||||||||||
| ASSETS | |||||||||||
| Cash on hand and in banks | $ | $ | |||||||||
| Interest earning deposits | |||||||||||
| Cash and cash equivalents | |||||||||||
Investment securities available for sale, at fair value, net (amortized cost of $ | |||||||||||
Investment securities held to maturity, at amortized cost, net (fair value of $ | |||||||||||
| Total investment securities | |||||||||||
| Loans receivable | |||||||||||
| Allowance for credit losses on loans | ( | ( | |||||||||
| Loans receivable, net | |||||||||||
| Premises and equipment, net | |||||||||||
| Federal Home Loan Bank stock, at cost | |||||||||||
| Bank owned life insurance | |||||||||||
| Accrued interest receivable | |||||||||||
| Prepaid expenses and other assets | |||||||||||
| Other intangible assets, net | |||||||||||
| Goodwill | |||||||||||
| Total assets | $ | $ | |||||||||
| LIABILITIES AND STOCKHOLDERS' EQUITY | |||||||||||
Deposits | $ | $ | |||||||||
| Deposits held for sale | |||||||||||
| Total deposits | |||||||||||
| Borrowings | |||||||||||
| Junior subordinated debentures | |||||||||||
| Securities sold under agreement to repurchase | |||||||||||
| Accrued expenses and other liabilities | |||||||||||
| Total liabilities | |||||||||||
Commitments and contingencies (Note 19) | |||||||||||
| Stockholders’ equity: | |||||||||||
Preferred stock, no par value, | |||||||||||
Common stock, no par value, | |||||||||||
| Retained earnings | |||||||||||
| Accumulated other comprehensive loss, net | ( | ( | |||||||||
| Total stockholders’ equity | |||||||||||
| Total liabilities and stockholders’ equity | $ | $ | |||||||||
See accompanying Notes to Consolidated Financial Statements.
46
HERITAGE FINANCIAL CORPORATION AND SUBSIDIARIES
CONSOLIDATED STATEMENTS OF INCOME
(Dollars in thousands, except shares and per share data)
| Year Ended December 31, | |||||||||||||||||
| 2023 | 2022 | 2021 | |||||||||||||||
| INTEREST INCOME: | |||||||||||||||||
| Interest and fees on loans | $ | $ | $ | ||||||||||||||
| Taxable interest on investment securities | |||||||||||||||||
| Nontaxable interest on investment securities | |||||||||||||||||
| Interest on interest earning deposits | |||||||||||||||||
| Total interest income | |||||||||||||||||
| INTEREST EXPENSE: | |||||||||||||||||
| Deposits | |||||||||||||||||
| Junior subordinated debentures | |||||||||||||||||
| Securities sold under agreement to repurchase | |||||||||||||||||
| Borrowings | |||||||||||||||||
| Total interest expense | |||||||||||||||||
| Net interest income | |||||||||||||||||
| Provision for (reversal of) credit losses | ( | ( | |||||||||||||||
| Net interest income after provision for (reversal of) credit losses | |||||||||||||||||
| NONINTEREST INCOME: | |||||||||||||||||
| Service charges and other fees | |||||||||||||||||
| Card revenue | |||||||||||||||||
| (Loss) gain on sale of investment securities, net | ( | ( | |||||||||||||||
| Gain on sale of loans, net | |||||||||||||||||
| Interest rate swap fees | |||||||||||||||||
| Bank owned life insurance income | |||||||||||||||||
| Gain on sale of other assets, net | |||||||||||||||||
| Other income | |||||||||||||||||
| Total noninterest income | |||||||||||||||||
| NONINTEREST EXPENSE: | |||||||||||||||||
| Compensation and employee benefits | |||||||||||||||||
| Occupancy and equipment | |||||||||||||||||
| Data processing | |||||||||||||||||
| Marketing | |||||||||||||||||
| Professional services | |||||||||||||||||
| State/municipal business and use taxes | |||||||||||||||||
| Federal deposit insurance premium | |||||||||||||||||
| Amortization of intangible assets | |||||||||||||||||
| Other expense | |||||||||||||||||
| Total noninterest expense | |||||||||||||||||
| Income before income taxes | |||||||||||||||||
| Income tax expense | |||||||||||||||||
| Net income | $ | $ | $ | ||||||||||||||
| Basic earnings per share | $ | $ | $ | ||||||||||||||
| Diluted earnings per share | $ | $ | $ | ||||||||||||||
| Dividends declared per share | $ | $ | $ | ||||||||||||||
| Average number of basic shares outstanding | |||||||||||||||||
| Average number of diluted shares outstanding | |||||||||||||||||
See accompanying Notes to Consolidated Financial Statements.
47
HERITAGE FINANCIAL CORPORATION AND SUBSIDIARIES
CONSOLIDATED STATEMENTS OF COMPREHENSIVE INCOME (LOSS)
(Dollars in thousands)
| Year Ended December 31, | |||||||||||||||||
| 2023 | 2022 | 2021 | |||||||||||||||
| Net income | $ | $ | $ | ||||||||||||||
Change in fair value of investment securities available for sale, net of tax of $ | ( | ( | |||||||||||||||
Amortization of net unrealized gain for the reclassification of investment securities available for sale to held to maturity, net of tax of $( | ( | ( | ( | ||||||||||||||
Reclassification adjustment for net loss (gain) from sale of investment securities available for sale included in income, net of tax benefit (expense) of $ | ( | ||||||||||||||||
| Other comprehensive income (loss) | ( | ( | |||||||||||||||
| Comprehensive income (loss) | $ | $ | ( | $ | |||||||||||||
See accompanying Notes to Consolidated Financial Statements.
48
HERITAGE FINANCIAL CORPORATION AND SUBSIDIARIES
CONSOLIDATED STATEMENTS OF STOCKHOLDERS' EQUITY
(Dollars in thousands, except shares and per share data)
| Year Ended December 31, 2023 | |||||||||||||||||||||||||||||
| Number of common shares | Common stock | Retained earnings | AOCI | Total stockholders’ equity | |||||||||||||||||||||||||
| Balance at December 31, 2022 | $ | $ | $ | ( | $ | ||||||||||||||||||||||||
| Restricted stock units vested | |||||||||||||||||||||||||||||
| Stock-based compensation expense | |||||||||||||||||||||||||||||
| Common stock repurchased | ( | ( | ( | ||||||||||||||||||||||||||
| Net income | |||||||||||||||||||||||||||||
| Other comprehensive income, net of tax | |||||||||||||||||||||||||||||
Cash dividends declared on common stock ($ | ( | ( | |||||||||||||||||||||||||||
| Balance at December 31, 2023 | $ | $ | $ | ( | $ | ||||||||||||||||||||||||
| Year Ended December 31, 2022 | |||||||||||||||||||||||||||||
| Number of common shares | Common stock | Retained earnings | AOCI | Total stockholders’ equity | |||||||||||||||||||||||||
| Balance at December 31, 2021 | $ | $ | $ | $ | |||||||||||||||||||||||||
| Restricted stock units vested | |||||||||||||||||||||||||||||
| Stock-based compensation expense | |||||||||||||||||||||||||||||
| Common stock repurchased | ( | ( | ( | ||||||||||||||||||||||||||
| Net income | |||||||||||||||||||||||||||||
| Other comprehensive loss, net of tax | ( | ( | |||||||||||||||||||||||||||
Cash dividends declared on common stock ($ | ( | ( | |||||||||||||||||||||||||||
| Balance at December 31, 2022 | $ | $ | $ | ( | $ | ||||||||||||||||||||||||
Year Ended December 31, 2021 | |||||||||||||||||||||||||||||
| Number of common shares | Common stock | Retained earnings | AOCI | Total stockholders’ equity | |||||||||||||||||||||||||
| Balance at December 31, 2020 | $ | $ | $ | ||||||||||||||||||||||||||
| Restricted stock units vested | |||||||||||||||||||||||||||||
| Stock-based compensation expense | |||||||||||||||||||||||||||||
| Common stock repurchased | ( | ( | ( | ||||||||||||||||||||||||||
| Net income | |||||||||||||||||||||||||||||
| Other comprehensive loss, net of tax | ( | ( | |||||||||||||||||||||||||||
Cash dividends declared on common stock ($ | ( | ( | |||||||||||||||||||||||||||
| December 31, 2021 | $ | $ | $ | $ | |||||||||||||||||||||||||
See accompanying Notes to Consolidated Financial Statements.
49
HERITAGE FINANCIAL CORPORATION AND SUBSIDIARIES
CONSOLIDATED STATEMENTS OF CASH FLOWS
(Dollars in thousands)
| Year Ended December 31, | |||||||||||||||||
| 2023 | 2022 | 2021 | |||||||||||||||
| Cash flows from operating activities: | |||||||||||||||||
| Net income | $ | $ | $ | ||||||||||||||
| Adjustments to reconcile net income to net cash provided by operating activities: | |||||||||||||||||
| Depreciation, amortization and accretion | ( | ||||||||||||||||
| Provision for (reversal of) credit losses | ( | ( | |||||||||||||||
| Stock-based compensation expense | |||||||||||||||||
| Amortization of intangible assets | |||||||||||||||||
| Origination of mortgage loans held for sale | ( | ( | ( | ||||||||||||||
| Proceeds from sale of mortgage loans held for sale | |||||||||||||||||
| Bank owned life insurance income | ( | ( | ( | ||||||||||||||
| Valuation adjustment on interest rate swaps | ( | ( | |||||||||||||||
| Gain on sale of mortgage loans held for sale, net | ( | ( | ( | ||||||||||||||
| Loss (gain) on sale of investment securities, net | ( | ||||||||||||||||
Gain on sale of premises and equipment | ( | ( | |||||||||||||||
| Gain on sale of branch including related deposits, net | ( | ||||||||||||||||
| Other | |||||||||||||||||
| Net cash provided by operating activities | |||||||||||||||||
| Cash flows from investing activities: | |||||||||||||||||
| Loan originations and purchases, net of payments | ( | ( | |||||||||||||||
| Maturities and repayments of investment securities available for sale | |||||||||||||||||
| Maturities and repayments of investment securities held to maturity | |||||||||||||||||
| Purchase of investment securities available for sale | ( | ( | ( | ||||||||||||||
| Purchase of investment securities held to maturity | ( | ( | |||||||||||||||
| Proceeds from sales of investment securities available for sale | |||||||||||||||||
| Purchase of premises and equipment | ( | ( | ( | ||||||||||||||
| Proceeds from sales of assets held for sale | |||||||||||||||||
| Proceeds from redemption of Federal Home Loan Bank stock | |||||||||||||||||
| Purchases of Federal Home Loan Bank stock | ( | ( | ( | ||||||||||||||
| Proceeds from sales of premises and equipment | |||||||||||||||||
| Purchases of bank owned life insurance | ( | ( | ( | ||||||||||||||
| Proceeds from bank owned life insurance death benefit | |||||||||||||||||
| Cash received from return of NMTC equity method investment | |||||||||||||||||
| Capital contributions to tax credit partnerships | ( | ( | ( | ||||||||||||||
Net cash paid related to branch divestiture | ( | ||||||||||||||||
| Net cash (used) provided by investing activities | ( | ( | |||||||||||||||
| Cash flows from financing activities: | |||||||||||||||||
| Net (decrease) increase in deposits | ( | ( | |||||||||||||||
| Proceeds from borrowings | |||||||||||||||||
| Repayment of borrowings | ( | ( | |||||||||||||||
| Common stock cash dividends paid | ( | ( | ( | ||||||||||||||
| Net (decrease) increase in securities sold under agreement to repurchase | ( | ( | |||||||||||||||
| Repurchase of common stock | ( | ( | ( | ||||||||||||||
| Net cash provided (used) by financing activities | ( | ||||||||||||||||
| Net increase (decrease) in cash and cash equivalents | ( | ||||||||||||||||
50
| Year Ended December 31, | |||||||||||||||||
| 2023 | 2022 | 2021 | |||||||||||||||
| Cash and cash equivalents at beginning of period | |||||||||||||||||
| Cash and cash equivalents at end of period | $ | $ | $ | ||||||||||||||
| Supplemental disclosures of cash flow information: | |||||||||||||||||
| Cash paid for interest | $ | $ | $ | ||||||||||||||
| Cash paid for income taxes, net of refunds | |||||||||||||||||
| Supplemental non-cash disclosures of cash flow information: | |||||||||||||||||
| Transfer of investment securities available for sale to held to maturity | |||||||||||||||||
| Investment in LIHTC partnerships and related funding commitment | |||||||||||||||||
| Loans received from return of NMTC equity method investment | |||||||||||||||||
| ROU assets obtained in exchange for new operating lease liabilities | |||||||||||||||||
| Transfers of premises and equipment classified as held for sale to prepaid expenses and other assets from premises and equipment, net | |||||||||||||||||
Transfer of bank owned life insurance to prepaid expenses and other assets due to death benefit accrued, but not received | |||||||||||||||||
| Transfer of deposits to deposits held for sale | |||||||||||||||||
See accompanying Notes to Consolidated Financial Statements.
51
HERITAGE FINANCIAL CORPORATION AND SUBSIDIARIES
NOTES TO CONSOLIDATED FINANCIAL STATEMENTS
For the Years Ended December 31, 2023, 2022 and 2021
(1)Description of Business, Basis of Presentation, Significant Accounting Policies and Recently Issued Accounting Pronouncements
(a) Description of Business
The Company is primarily engaged in the business of planning, directing and coordinating the business activities of its wholly-owned subsidiary, the Bank. The Bank is headquartered in Olympia, Washington and conducts business from its 50 branch offices located throughout Washington State, the greater Portland, Oregon area, Eugene, Oregon, and Boise, Idaho. The Bank’s business consists primarily of commercial lending and deposit relationships with small and medium-sized businesses and their owners in its market areas and attracting deposits from the general public. The Bank also makes real estate construction and land development loans, consumer loans and originates first mortgage loans on residential properties primarily located in its market areas. The Bank's deposits are insured by the FDIC.
(b) Basis of Presentation
The accompanying audited Consolidated Financial Statements have been prepared in accordance with GAAP for annual financial information and pursuant to the rules and regulations of the SEC. To prepare the audited Consolidated Financial Statements in conformity with GAAP, management makes estimates and assumptions based on available information. These estimates and assumptions affect the amounts reported in the financial statements and the disclosures provided. Management believes that the judgments, estimates, and assumptions used in the preparation of the Consolidated Financial Statements are appropriate based on the facts and circumstances at the time. Actual results, however, could differ significantly from those estimates. Material estimates that are particularly susceptible to significant change relate to management's estimate of the ACL on investment securities, management's estimate of the ACL on loans, management's estimate of the ACL on unfunded commitments, management's evaluation of goodwill impairment and management's estimate of the fair value of financial instruments.
The accompanying Consolidated Financial Statements include the accounts of the Company and its wholly-owned subsidiary, the Bank. All significant intercompany balances and transactions among the Company and the Bank have been eliminated in consolidation.
Certain prior year amounts in the Consolidated Statements of Income have been reclassified to conform to the current year’s presentation. Reclassifications had no effect on the prior year's net income or stockholders’ equity.
(c) Significant Accounting Policies
Cash and Cash Equivalents
Cash and cash equivalents include cash on hand and in banks and interest earning deposits due substantially from the Federal Reserve Bank. Cash equivalents have a maturity of 90 days or less at the time of purchase.
Investment Securities
Investment securities for which the Company has the positive intent and ability to hold to maturity are classified as held to maturity and are carried at amortized cost. Investment securities held primarily for the purpose of selling in the near term are classified as trading securities and are reported at fair value, with unrealized gains and losses included in income. Investment securities not classified as held to maturity or trading are classified as available for sale and are reported at fair value with unrealized gains and losses, net of income taxes, as a separate component of other comprehensive income. The Company determines the appropriate classification of investment securities at the time of purchase and reassesses the classification at each reporting date. Any subsequent reassessment of classification and transfer of investment securities available for sale to held to maturity are completed at the amortized cost basis plus or minus the amount of any remaining unrealized holding gain or loss reported in AOCI of the individual investment securities available for sale. The unrealized holding gain or loss at the date of the transfer continues to be recognized in AOCI, but that gain or loss is amortized over the remaining life of the security using the interest method. When the Company acquires another entity, all investment securities are recorded at fair value and classified as available for sale at the acquisition date.
Realized gains and losses on sales of investment securities are recorded on the trade date in "(Loss) gain on sale of investment securities, net" on the Consolidated Statements of Income and determined using the specific identification method. Premiums and discounts on investment securities available for sale and held to maturity are amortized or accreted into income using the interest method. An investment security available for sale or held to maturity is placed on nonaccrual status at the time any principal or payments become more than 90 days delinquent and classified as past due after 30 days of nonpayment. Interest accrued, but not received for an investment security classified as nonaccrual is reversed against interest income during the period that the investment security is placed on nonaccrual status.
ACL on Investment Securities Available for Sale
Management evaluates the need for an ACL on investment securities available for sale on at least a quarterly basis, and more frequently when economic or market conditions warrant such an evaluation. For investment securities available for sale in an unrealized loss position, the Company first assesses whether it intends to sell or it is more likely than not that it will be required to sell the security before the recovery of its amortized cost basis. If either of the criteria regarding intent or requirement
52
to sell is met, the security’s amortized cost basis is written down to fair value through a provision for credit loss against income. For investment securities available for sale that do not meet the aforementioned criteria, the Company evaluates whether the decline in fair value has resulted from credit losses or other factors. In making this assessment, management considers the extent to which fair value is less than amortized cost, any changes to the rating of the security by a rating agency and adverse conditions specifically related to the security, among other factors. The credit loss is defined as the difference between the present value of the cash flows expected to be collected and the amortized cost basis. If the present value of cash flows expected to be collected is less than the amortized cost basis, a credit loss exists and an ACL on investment securities available for sale is recorded for the credit loss, limited by the amount that the fair value is less than the amortized cost basis. Any unrealized decline in fair value that has not been recorded through an ACL on investment securities available for sale is recognized in other comprehensive income (loss).
Accrued interest receivable on investment securities available for sale is excluded from the estimate of expected credit losses. Changes in the ACL on investment securities available for sale are recorded as provision for credit losses expense. Losses are charged against the ACL when management believes the uncollectibility of an investment security available for sale is confirmed or when either of the criteria regarding intent or requirement to sell is met.
ACL on Investment Securities Held to Maturity
The Company measures expected credit losses on investment securities held to maturity on a pooled, collective basis by major investment security type with similar risk characteristics. A historical lifetime probability of default and severity of loss in the event of default is derived or obtained from external sources and adjusted for the expected effects of reasonable and supportable forecasts over the expected lives of the investment securities on those historical credit losses. Expected credit losses on investment securities in the held to maturity portfolio that do not share similar risk characteristics with any of the pools are individually measured based on net realizable value, or the difference between the discounted value of the expected future cash flows, based on the original effective interest rate, and the recorded amortized cost basis of the investment securities.
Accrued interest receivable on investment securities held to maturity is excluded from the estimate of expected credit losses. Changes in the ACL on investment securities held to maturity are recorded as provision for credit losses expense. Losses are charged against the ACL when management believes the uncollectibility of an investment security held to maturity is confirmed.
Loans Held for Sale
Loans Receivable
Loans receivable includes loans originated, indirect loans purchased by the Company and loans acquired in business combinations that management has the intent and ability to hold for the foreseeable future or until maturity or payoff and is reported at amortized cost. Amortized cost is the outstanding principal balance, net of purchased premiums and discounts and net deferred loan origination fees and costs. Interest on loans is calculated using the interest method based on the daily balance of the principal amount outstanding and is credited to interest income as earned. Accrued interest receivable for loans receivable is reported within "Accrued interest receivable" on the Consolidated Statements of Financial Condition. The Company's policies for loans receivable generally do not differ by loan segments or classes unless specified in the following policies.
Acquired Loans:
Acquired loans are recorded at their fair value at acquisition date net of an ACL on loans expected to be incurred over the life of the loan. The initial ACL on acquired loans is determined using the same methodology as originated loans. For non-PCD loans, the initial ACL on loans is recorded through earnings as a provision for credit losses. For PCD loans, the initial ACL is incorporated into the calculation of the fair value of net assets acquired on the merger date and the net of the PCD loan purchase price and the initial ACL becomes the initial amortized cost basis. The difference between the initial amortized cost basis and the par value of PCD loans is the noncredit discount or premium for PCD loans. The noncredit discount or premium for PCD loans and both the noncredit and credit discount or premium for non-PCD loans are accreted through the "Interest and fees on loans" line item on the Consolidated Statements of Income over the life of the loan using the interest method for non-revolving credits or the straight-line method, which approximates the effective interest method, for revolving credits. Any unrecognized discount or premium for a purchased loan that is subsequently repaid in full is recognized immediately into income. Subsequent changes to the ACL on loans for acquired loans are recorded through earnings as a provision for credit losses.
Delinquent Loans:
Loans are considered past due or delinquent when principal or interest payments are past due 30 days or more. Delinquent loans generally remain on accrual status between 30 days and 89 days past due.
Nonaccrual and Charged-off Loans:
Loans for which the accrual of interest has been discontinued are designated as nonaccrual loans. The accrual of interest is generally discontinued at the time the loan is 90 days delinquent unless the credit is well secured and in the process of collection. Loans are placed on nonaccrual at an earlier date if collection of the contractual principal or interest is doubtful. All interest accrued, but not collected, on loans deemed nonaccrual during the period is reversed against interest income in that period. Interest payments received on nonaccrual loans are generally accounted for on the cost-recovery method whereby the
53
interest payment is applied to the principal balances. Loans may be returned to accrual status when improvements in credit quality eliminate the doubt as to the full collectability of both interest and principal and a period of sustained performance has occurred.
Loans are generally charged off to their net realizable value if collection of the contractual principal or interest as scheduled in the loan agreement is doubtful. Consumer loans are typically charged off no later than 90 days past due.
Deferred Loan Origination Fees and Costs
Direct loan origination fees and costs on originated loans and premiums and discounts on acquired loans are deferred and subsequently amortized or accreted as a yield adjustment over the expected life of the loan without prepayment considerations utilizing the interest method, except revolving loans for which the straight-line method is used. When a loan is paid off prior to maturity, the remaining net deferred balance is immediately recognized into interest income. In the event loans are sold, the unamortized net deferred balance is recognized as a component of the gain or loss on the sale of loans.
ACL on Loans
The ACL on loans is a valuation account that is deducted from the amortized cost of loans receivable to present the net amount expected to be collected. Loans are debited against the ACL on loans when management believes the uncollectibility of a loan balance is confirmed and subsequent recoveries, if any, are credited to the ACL on loans. The Company records the changes in the ACL on loans through earnings as a "Provision for (reversal of) credit losses" on the Consolidated Statements of Income.
Management has adopted a historic loss, open pool CECL methodology to calculate the ACL on loans. Under this methodology, loans are either collectively evaluated if they share similar risk characteristics, including performing modified loans, or individually evaluated if they do not share similar risk characteristics, including nonaccrual loans.
The allowance for individually evaluated loans is calculated using either the collateral value method, which considers the likely source of repayment as the value of the collateral less estimated costs to sell, or the net present value method, which considers the contractual principal and interest terms and estimated cash flows available from the borrower to satisfy the debt. Nonaccrual modified loans are individually evaluated for credit loss except if the original interest rate is used to discount the expected cash flows, not the rate specified in the restructuring.
The allowance for collectively evaluated loans is comprised of the baseline loss allowance, the macroeconomic allowance and the qualitative allowance. The baseline loss allowance begins with the baseline loss rates calculated using the Company's average quarterly historical loss information for an economic cycle. The Company evaluates the historical period on a quarterly basis with the assumption that economic cycles have historically lasted between 10 and 15 years. The baseline loss rates are applied to each loan's estimated cash flows over the life of the loan under the remaining life method to determine the baseline loss estimate for each loan. Estimated cash flows consider the principal and interest in accordance with the contractual term of the loan and estimated prepayments. Contractual cash flows are based on the amortized cost and are adjusted for balances guaranteed by governmental entities, such as SBA or USDA, resulting in the unguaranteed amortized cost. The contractual term excludes expected extensions, renewals and modifications unless the extension or renewal options are included in the original or modified contract at the reporting date and are not unconditionally cancellable by the Company. Prepayments are established for each segment based on historical averages for the segment, which management believes is an accurate representation of future prepayment activity. Management reviews the adequacy of the prepayment assumption on a quarterly basis.
The macroeconomic allowance includes consideration of the forecasted direction of the economic and business environment and its likely impact on the estimated allowance as compared to the historical losses over the reasonable and supportable time frame. The Company uses macroeconomic scenarios from an independent third party. These scenarios are based on past events, current conditions, the likelihood of future events occurring and include consideration of the forecasted direction of the economic and business environment and its likely impact on the estimated allowance as compared to the historical losses over the reasonable and supportable time frame. Economic forecast models for the current period are uploaded to the model, which targets certain forecasted macroeconomic factors, such as unemployment rate, gross domestic product, housing price index, commercial real estate price index, and certain rate and market indices. Macroeconomic factor multipliers are determined through regression analysis and applied to loss rates for each segment of loans with similar risk characteristics. Each of the forecasted segment balances is impacted by a mix of these macroeconomic factors. Further, each of the macroeconomic factors is utilized differently by segment, including the application of lagged factors and various transformations such as percent change year over year. A macroeconomic sensitive model is developed for each segment given the current and forecasted conditions and a macroeconomic multiplier is calculated for each forecast period considering the forecasted losses as compared to the long-term average actual losses of the dataset. The impact of those macroeconomic factors on each segment, both positive or negative, using the reasonable and supportable period, are added to the calculated baseline loss allowance. After the reasonable and supportable period, forecasted loss rates revert to historical baseline loss levels over the predetermined reversion period on a straight-lined basis.
At September 30, 2023, the Company upgraded its model used to calculate the ACL for collectively evaluated loans. This upgraded version involves modifications to the macroeconomic variables for each loan segment. Changes were based on regression testing, assessing the macroeconomic variable relationships to expected results and adjusting the lookback period from 1991 to 2000 for improved data relevance. The most significant changes to macroeconomic variables were in the commercial and industrial and commercial real estate segments. The commercial and industrial segment had previously used unemployment as a macroeconomic variable which was removed and replaced with a market index, rate index and real estate price index. The commercial real estate segment had previously used gross domestic product as a macroeconomic variable
54
which was removed and replaced with a housing price index. Additionally, a new segment for home equity lines of credit was introduced in this version. The overall impact on the ACL for collectively evaluated loans, before applying qualitative adjustments, was not considered to be material.
The Company’s ACL model also includes adjustments for qualitative factors, where appropriate. Since historical information (such as historical net losses and economic cycles) may not always, by themselves, provide a sufficient basis for determining future expected credit losses, the Company periodically considers the need for qualitative adjustments to the ACL. Qualitative adjustments may be related to and include, but not be limited to, factors such as: (i) management’s assessment of economic forecasts used in the model and how those forecasts align with management’s overall evaluation of current and expected economic conditions, (ii) organization specific risks such as credit concentrations, collateral specific risks, regulatory risks, and external factors that may ultimately impact credit quality, (iii) potential model limitations such as those identified through back-testing, underwriting changes, acquisition of new portfolios and changes in portfolio segmentation, and (iv) management’s overall assessment of the adequacy of the ACL, including an assessment of model data inputs used to determine the ACL.
As of December 31, 2023, qualitative adjustments primarily related to certain segments of the loan portfolio deemed by management to be of a higher-risk profile where management believes the quantitative component of the Company’s ACL model may not have fully captured the associated impact to the ACL. Qualitative adjustments also related to heightened uncertainty as to future macroeconomic conditions and the related impact on certain loan segments. Management reviews the need for an appropriate level of qualitative adjustments on a quarterly basis, and as such, the amount and allocation of qualitative adjustments may change in future periods.
In general, management's estimate of the ACL on loans uses relevant available information, from internal and external sources, relating to past events, current conditions, and reasonable and supportable forecasts. The evaluation of ACL on loans is inherently subjective as it requires estimates that are susceptible to significant revision as more information becomes available. While management utilizes its best judgment and information available to recognize estimated losses on loans, future additions to the allowance may be necessary based on further declines in local and national economic conditions. In addition, various regulatory agencies, as an integral part of their examination process, periodically review the Company’s ACL on loans. Such agencies may require the Company to adjust the allowance based on their judgments about information available to them at the time of their examinations. The Company believes the ACL on loans is appropriate given all the above considerations.
ACL on Unfunded Commitments
The Company estimates expected credit losses on unfunded, off-balance sheet commitments over the contractual period in which the Company is exposed to credit risk from a contractual obligation to extend credit, unless the obligation is unconditionally cancellable by the Company.
The allowance methodology for unfunded commitments is similar to the ACL on loans, but additionally includes considerations of the current utilization of the commitment and an estimate of the future utilization as determined appropriate by historical commitment utilization and the Company's estimates of future utilization given current economic forecasts.
The ACL for unfunded commitments is recorded in "Accrued expenses and other liabilities" on the Consolidated Statements of Financial Condition and changes are recognized through earnings in the "Provision for (reversal of) credit losses" on the Consolidated Statements of Income
ACL on Accrued Interest Receivable
Accrued interest receivable on investment securities and loans receivable are excluded from their estimates of credit losses. Additionally, no allowance has been established for accrued interest receivable on investment securities and loans receivable as interest accrued, but not received, is reversed timely in accordance with the policies stated above.
Provision for (reversal of) Credit Losses
The provision for credit losses as presented in the Consolidated Statements of Income includes the provision for credit losses on loans, the provision for credit losses on unfunded commitments and the provision for credit losses on investment securities.
Mortgage Banking Operations
The Company originates and sells certain residential real estate loans on a servicing-released basis. The Company recognizes a gain or loss on sale to the extent that the sale proceeds of the loan sold differs from the net book value at the time of sale. Income from residential real estate loans brokered to other lenders is recognized into income on date of loan closing.
Commitments to fund residential real estate loans and commitments to subsequently sell residential real estate loans are made during the period between the taking of the loan application and the closing of the loan. The timing of making these commitments is dependent upon the timing of the borrower’s election to lock-in the mortgage interest rate and fees prior to loan closing. The Company enters into forward commitments for the future delivery of residential real estate loans when interest rate locks are entered into in order to hedge the interest rate risk resulting from its commitments to fund the loans. These sale commitments are typically made on a best-efforts basis whereby the Company is only obligated to sell the loan if the loan is approved and closed by the Company. Commitments to fund residential real estate loans to be sold into the secondary market and forward commitments for the future delivery of these loans are accounted for as free-standing derivatives, however, the fair values of these freestanding derivatives were not significant at December 31, 2023 or December 31, 2022. In January 2024, we ceased the origination of residential real estate loans for the purpose of sales on the secondary market.
55
Commercial Loan Sales, Servicing, and Commercial Servicing Asset
The Company, on a limited basis, sells the guaranteed portion of SBA and USDA loans, with servicing retained, for cash proceeds and records a related servicing asset. The Company does not sell loans with servicing retained unless it retains a participating interest. A servicing asset is recorded at fair value upon sale which is estimated by discounting estimated net future cash flows from servicing using discount rates that approximate current market rates and using estimated prepayment rates. Subsequent to initial recognition, all classes of servicing rights are carried at the lower of amortized cost or fair value and are amortized in proportion to and over the period of the estimated net servicing income. The servicing asset is reported within "Prepaid expenses and other assets" on the Consolidated Statements of Financial Condition.
For purposes of evaluating and measuring impairment, the fair value of servicing rights is measured using a discounted estimated net future cash flow model as described above at least annually. Impairment is determined by stratifying rights into groupings based on predominant risk characteristics including investor type, loan type and maturity and recognized through a valuation allowance for an individual stratum to the extent fair value is less than the carrying amount. If the Company later determines all or a portion of the impairment no longer exists for a particular stratum, a reduction of the allowance may be recorded as an increase to income. Changes in valuation allowances are reported in "Other income" on the Consolidated Statements of Income.
In connection with the loan sales, the Company typically makes representations and warranties about the underlying loans conforming to specified guidelines. If the underlying loans do not conform to the specifications, the Company may have an obligation to repurchase the loans or indemnify the purchaser against any loss. The Company believes the potential for material loss under these arrangements was remote at December 31, 2023 and December 31, 2022.
Servicing fee income is recorded for fees earned for servicing loans and reported in "Other income" on the Consolidated Statements of Income. The fees are based on a contractual percentage of the outstanding principal and are recorded as income when earned. The amortization of mortgage servicing rights is netted against servicing fee income. Late fees and ancillary fees related to loan servicing were not material for the years ended December 31, 2023, 2022, and 2021.
A premium over the adjusted carrying value is received upon the sale of the guaranteed portion of an SBA or USDA loan. The Company's investment in an SBA or USDA loan is allocated among the sold and retained portions of the loan based on the relative fair value of each portion at the time of loan origination, adjusted for payments and other activities. Because the portion retained does not carry an SBA or USDA guarantee, part of the gain recognized on the sold portion of the loan is deferred and amortized as a yield enhancement on the retained portion in order to obtain a market equivalent yield. The balance of the deferred gain was immaterial at December 31, 2023 and December 31, 2022.
Other Real Estate Owned
Other real estate owned is recorded at the estimated fair value (less the costs to sell) at the date of acquisition, not to exceed net realizable value, and any resulting write-down is charged against the ACL on loans. Physical possession of residential real estate property collateralizing a consumer mortgage loan occurs when legal title is obtained upon completion of foreclosure or when the borrower conveys all interest in the properly to satisfy the loan through completion of a deed in lieu of foreclosure or similar legal agreement.
After acquisition, all costs incurred in maintaining the property are expensed except for costs relating to the development and improvement of the property which are capitalized to the extent of the property’s net realizable value. If the estimated realizable value of the other real estate owned property declines after the acquisition date, the valuation adjustment is charged to "Other real estate owned, net" on the Consolidated Statements of Income.
Premises and Equipment
Premises and equipment, including leasehold improvements, are stated at cost less accumulated depreciation. Depreciation is computed using the straight-line method over the estimated useful lives of the assets or the lease period, whichever is shorter. The estimated useful lives used to compute depreciation and amortization for buildings and building improvements, including lease improvements, is 15 to 39 years; and for furniture, fixtures and equipment is to seven years . The Company reviews premises and equipment, including leasehold improvements, for impairment whenever events or changes in the circumstances indicate that the undiscounted cash flows for the property are less than its carrying value. If identified, an impairment loss is recognized through a charge to earnings based on the fair value of the property.
Bank Owned Life Insurance
The Company's BOLI policies insure the lives of certain current or former Company officers and name the Company as beneficiary. Noninterest income is generated tax-free (subject to certain limitations) from the increase in the policies' underlying investments made by the insurance company. The Company records BOLI at the cash surrender value adjusted for other charges or other amounts due that are probable at settlement.
Other Intangible Assets
Other intangible assets represent core deposit intangibles acquired in business combinations. The fair value of the core deposit intangible stemming from any given business combination is based on the present value of the expected cost savings attributable to the core deposit funding, relative to an alternative source of funding. The core deposit intangibles are amortized on an accelerated basis following a pattern of the economic benefits of the core deposit intangible over an estimated useful life of the deposit relationships acquired. The Company evaluates such identifiable intangibles for impairment annually or more frequently if an indication of impairment exists.
56
Goodwill
The Company’s goodwill represents the excess of the purchase price over the fair value of net assets acquired in certain mergers and acquisitions. Goodwill is assigned to the Bank and is evaluated for impairment at the Bank level (single reporting unit) on an annual basis or more frequently if an indication of impairment exists between the annual tests.
For the goodwill impairment assessment, the Company either assesses qualitative factors to determine whether the existence of events or circumstances leads to a determination that it is more-likely-than-not the fair value of the reporting unit is less than its carrying value and a quantitative test is needed or opts to bypass the qualitative analysis and performs a quantitative analysis only. The quantitative analysis requires the Company to make assumptions and judgments regarding the fair value of the reporting unit. If the implied fair value of goodwill is less than the recorded goodwill, an impairment charge would be recorded for the difference.
Income Taxes
The Company and the Bank file a United States consolidated federal income tax return and an Oregon and Idaho State income tax return. Income tax expense is the total of the current year income tax due or refundable and the change in deferred tax assets and liabilities. Deferred tax assets and liabilities are recognized for the future tax consequences attributable to differences between the carrying amounts of existing assets and liabilities and their respective tax bases. Deferred tax assets and liabilities are measured using enacted tax rates applicable to taxable income in the periods in which those temporary differences are expected to be recovered or settled. The effect on deferred tax assets and liabilities of a change in tax rate is recognized in income in the period that includes the enactment date. A valuation allowance, if needed, reduces deferred tax assets to the amounts expected to be realized. Deferred tax assets are reported in "Prepaid expenses and other assets" on the Consolidated Statements of Financial Condition.
We hold equity investments in certain structures which deliver tax benefits, including LIHTC funds and a Solar Tax Credit investment (“STC”). For those LIHTC investments that qualify for application of the proportional amortization method, we apply such method. Under the proportional amortization method, such investment is amortized in proportion to the allocation of tax benefits received in each period, and the investment amortization and the tax benefits are presented on a net basis within “Income tax expense” on our Consolidated Statements of Income.
A tax position is recognized as a benefit only if it is "more likely than not" that the tax position would be sustained in a tax examination, with a tax examination being presumed to occur. The amount recognized is the largest amount of tax benefit that is greater than 50% likely of being realized on examination. For tax positions not meeting the “more likely than not” test, no tax benefit is recorded.
The Company’s policy is to recognize interest and penalties on unrecognized tax benefits in "Income tax expense" in the Consolidated Statements of Income as the amounts are generally insignificant each year.
Operating Leases
The Company has only identified leases classified as operating leases. Operating leases are recorded as ROU assets and ROU liabilities within "Prepaid expenses and other assets" and "Accrued expenses and other liabilities", respectively, in the Consolidated Statements of Financial Condition. ROU assets represent the Company's right to use an underlying asset for the lease term and ROU liabilities represent the Company's obligation to make lease payments arising from the lease. Operating lease ROU assets and ROU liabilities are recognized at the lease agreement commencement date based on the present value of lease payments over the lease term. The lease term incorporates options to extend the lease when it is reasonably certain that the Company will exercise that option. As the Company's leases typically do not provide an implicit rate; the Company uses its incremental borrowing rate based on the information available at the operating lease commencement date in determining the present value of lease payments. The operating lease ROU asset is further reduced by any lease pre-payments made and lease incentives. The leases may contain various provisions for increases in rental rates based either on changes in the published Consumer Price Index or a predetermined escalation schedule and such variable lease payments are recognized as lease expense as they are incurred. The majority of the Company's leases include variable lease payments such as real estate taxes, maintenance, insurance and other similar costs in addition to the base rent. Lease expense for lease payments is recognized on a straight-line basis over the lease term.
The Company does not separate non-lease components from lease components and excludes operating leases with a term of twelve months or less from being capitalized as ROU assets and ROU liabilities. The Company follows a policy to capitalize lease agreements with total contractual lease payments of $25,000 or more. The Company does not account for any leases at a portfolio level.
Stock-Based Compensation
The Company maintains a number of stock-based incentive programs, which are discussed in more detail in Note (16) Stock-Based Compensation. Compensation cost is recognized for stock options, restricted stock awards and restricted stock units issued to employees and directors based on the fair value of these awards at the date of grant. Compensation cost is generally recognized over the requisite service period, generally defined as the vesting period, on a straight-line basis. Compensation cost for restricted stock units with market-based vesting is recognized over the service period to the extent the restricted stock units are expected to vest. Forfeitures are recognized as they occur.
The market price of the Company’s common stock at the date of grant is used to determine the fair value of the restricted stock awards and restricted stock units. The fair value of stock options granted is estimated based on the date of grant using the Black-Scholes-Merton option pricing model. Certain restricted stock unit grants are subject to performance-based
57
vesting as well as other approved vesting conditions and cliff-vest based on those conditions, and the fair value is estimated using a Monte Carlo simulation pricing model. The assumptions used in the Monte Carlo simulation pricing model include the expected term based on the valuation date and the remaining contractual term of the award; the risk-free interest rate based on the U.S. Treasury curve at the valuation date of the award; the expected dividend yield based on expected dividends being payable to the holders; and the expected stock price volatility over the expected term based on the historical volatility over the equivalent historical term.
Tax Credit Investments
The Company has equity investments in LIHTC partnerships, which are indirect federal subsidies that finance low-income housing projects. As a limited liability investor in these partnerships, the Company receives tax benefits in the form of tax deductions from partnership operating losses and federal income tax credits. The federal income tax credits are earned over a 10-year period as a result of the investment properties meeting certain criteria and are subject to recapture for noncompliance with such criteria over a 15-year period. The Company accounts for the LIHTCs under the proportional amortization method and amortizes the initial cost of the investment in proportion to the tax credits and other tax benefits received and recognizes the net investment performance on the Consolidated Statements of Income as a component of "Income tax expense". The Company reports the carrying value of the equity investments in the unconsolidated LIHTCs as Prepaid expenses and other assets and the unfunded contingent commitments related to the equity investments as Accrued expenses and other liabilities on the Company’s Statements of Financial Condition. The maximum exposure to loss in the LIHTCs is the amount of equity invested and credit extended by the Company. Loans to these entities are underwritten in substantially the same manner as other loans and are secured. The Company has evaluated the variable interests held by the Company in each LIHTC investment and determined the Company does not have controlling financial interests in such investments and is not the primary beneficiary.
The Company has an equity investment in a solar tax credit investment. As a limited liability investor in this partnership, the Company receives tax benefits in the form of tax deductions from partnership operating losses and federal income tax credits. The Company accounts for the solar tax credits under the deferral method where the tax credit is recognized over the useful life of the asset on the Consolidated Statements of Income as a component of "Income tax expense". The Company has evaluated the variable interest held by the Company and determined that the Company does not have controlling financial interests in such investment and is not the primary beneficiary.
Through May 2021, the Company held $25.0 million of qualified equity investments in three certified development entities eligible to receive NMTC. The NMTC program provides federal tax incentives to investors to make investments in distressed communities and promotes economic improvements through the development of successful businesses in these communities. The NMTC is available to investors over a seven-year period and is subject to recapture if certain events occur during such period. The Company is required to fund 85 % of a tranche by a predetermined deadline to claim the entire tax credit. The Company funded its tranche before the deadline. The Company dissolved the NMTC investment during the year ended December 31, 2021 after gross tax credits related to the Company's certified development entities totaling $9.8 million were utilized during the seven year period ending December 31, 2020. Prior to dissolution, the Company accounted for its NMTC on the equity method and reported the investment balance in "Prepaid expenses and other assets" on the Consolidated Statements of Financial Condition and the related investment income was recognized in "Other income" on the Consolidated Statements of Income.
Deferred Compensation Plans
The Company has a Deferred Compensation Plan and has entered into similar arrangements with certain executive officers. Under the Deferred Compensation Plan, participants are permitted to elect to defer compensation and the Company has the discretion to make additional contributions to the Deferred Compensation Plan on behalf of any participant based on a number of factors. Such discretionary contributions are generally approved by the Compensation Committee of the Company's Board of Directors. The notional account balances of participants under the Deferred Compensation Plan earn interest on an annual basis. The applicable interest rate is the Moody’s Seasoned Aaa Corporate Bond Yield as of January 1 of each year. Generally, a participant’s account is payable upon the earliest of the participant’s separation from service with the Company, the participant’s death or disability, or a specified date that is elected by the participant in accordance with applicable rules of the Internal Revenue Code, as amended.
Additionally, in conjunction with the Company's merger with Premier Commercial Bancorp in 2018, the Company assumed a Salary Continuation Plan. The Salary Continuation Plan is an unfunded non-qualified deferred compensation plan for select former Premier Commercial executive officers, some of which are current Company officers. Under the Salary Continuation Plan, the Company will pay each participant, or their beneficiary, specified amounts over specified periods beginning with the individual's termination of service due to retirement subject to early termination provisions.
The Company’s obligation to make payments under the Deferred Compensation Plan and the Salary Continuation Plan is a general obligation of the Company and is to be paid from the Company’s general assets. As such, participants are general unsecured creditors of the Company with respect to their participation under both plans. The Company records a liability within "Accrued expenses and other liabilities" on the Consolidated Statements of Financial Condition and records the expense as "Compensation and employee benefits" on the Consolidated Statements of Income in a systematic and rational manner. Since the amounts earned under the Deferred Compensation Plan are generally based on the Company’s annual performance, the Company records deferred compensation expense each year for an amount calculated based on that year’s financial performance.
58
Earnings per Share
The two-class method is used in the calculation of basic and diluted earnings per common share. Basic earnings per common share is net income allocated to common shareholders divided by the weighted average number of common shares outstanding during the period. All outstanding unvested share-based payment awards that contain rights to nonforfeitable dividends are considered participating securities for this calculation. Dividends and undistributed earnings allocated to participating securities are excluded from net income allocated to common shareholders and participating securities are excluded from weighted average common shares outstanding. Diluted earnings per common share is calculated using the treasury stock method and includes the dilutive effect of additional potential common shares issuable under stock options. Earnings and dividends per share are restated for all stock splits and stock dividends through the date of issuance of the financial statements.
Derivative Financial Instruments
The Company utilizes interest rate swap derivative contracts to facilitate the needs of its commercial customers whereby it enters into an interest rate swap with a customer while at the same time entering into an offsetting interest rate swap with another financial institution. In connection with each swap transaction, the Company agrees to pay interest to the customer on a notional amount at a variable interest rate and receive interest from the customer on a similar notional amount at a fixed interest rate. At the same time, the Company agrees to pay another financial institution the same fixed interest rate on the same notional amount and receive the same variable interest rate on the same notional amount. The transaction allows the Company’s customer to effectively convert a variable rate loan to a fixed rate and the Company recognizes immediate income based upon the difference in the bid/ask spread of the underlying transactions with its customers and the third-party. Because the Company acts as an intermediary for its customer, changes in the fair value of the underlying derivative contracts for the most part offset each other and do not significantly impact the Company’s results of operations. These interest rate swaps are not designated as hedging instruments.
The Company is exposed to credit-related losses in the event of nonperformance by the counterparty to these agreements. Credit risk for derivatives with the customer is controlled through the credit approval process, amount limits, and monitoring procedures and is concentrated within our primary market areas. Credit risk for derivatives with third-parties is concentrated among four well-known broker dealers.
Fee income related to interest rate swap derivative contract transactions is recorded in "Interest rate swap fees" on the Consolidated Statements of Income. The fair value of derivative positions outstanding is included in "Prepaid expenses and other assets" and "Accrued expenses and other liabilities" in the Consolidated Statements of Financial Condition. The gains and losses due to changes in fair value and all cash flows are included in "Other income" in the Consolidated Statements of Income, but typically net to zero based on the identical back-to-back interest rate swaps unless a credit valuation adjustment is recorded to appropriately reflect nonperformance risk in the fair value measurement. Various factors impact changes in the credit valuation adjustments over time, including changes in the risk ratings of the parties to the contracts, as well as changes in market rates and volatilities, which affect the total expected exposure of the derivative instruments.
Advertising Expenses
Advertising costs are expensed as incurred. Costs related to production of advertising are considered incurred when the advertising is first used.
Operating Segments
While the Company’s chief decision-makers monitor the revenue streams of the various products and services, operations are managed and financial performance is evaluated on a Company-wide basis as operating results for all segments are similar. Accordingly, all the financial service operations are considered by management to be aggregated in one reportable operating segment.
Revenue from Contracts with Customers
The Company's revenues are primarily composed of interest income on financial instruments, such as loans and investment securities. The Company's revenue derived from contracts with customers are generally presented in "Service charges and other fees" and "Other income" on the Consolidated Statement of Income and includes the following:
•Service Charges on Deposit Accounts: The Company earns fees from its deposit customers from a variety of deposit products and services. Non-transaction based fees such as account maintenance fees and monthly statement fees are considered to be provided to the customer under a day-to-day contract with ongoing renewals. Revenues for these non-transaction fees are earned over the course of a month, representing the period over which the Company satisfies the performance obligation. Transaction-based fees such as non-sufficient fund charges, stop payment charges and wire fees are recognized at the time the transaction is executed as the contract duration does not extend beyond the service performed.
•Wealth Management: The Company earns fees from contracts with customers for fiduciary and brokerage activities. Revenues are generally recognized monthly and are generally based on a percentage of the customer’s assets under management or based on investment or insurance solutions that are implemented for the customer.
•Merchant Processing Services and Debit and Credit Card Fees: The Company earns fees from cardholder transactions conducted through third-party payment network providers which consist of (i) interchange fees earned from the payment network as a debit card issuer, (ii) referral fee income, and (iii) ongoing merchant fees earned for referring customers to the payment processing provider. These fees are recognized when the transaction occurs, but may settle on a daily or monthly basis.
59
(d) Recently Issued or Adopted Accounting Pronouncements
FASB ASU 2020-04, Reference Rate Reform (Topic 848), as amended by ASU 2021-01, and ASU 2022-06 was issued in March 2020 and provides optional guidance for a limited period of time to ease the potential burden in accounting for (or recognizing the effects of) reference rate reform on financial reporting. The amendments in this ASU are effective for all entities as of March 12, 2020. In December 2022, FASB amended this ASU and deferred the sunset date of Topic 848 from December 31, 2022, to December 31, 2024. The amendments are elective, apply to all entities, and provide optional expedients and exceptions for applying GAAP to contracts, hedging relationships, and other transactions affected by reference rate reform if certain criteria are met. Effective January 25, 2021, the Company adhered to the Interbank Offered Rate Fallbacks Protocol as published by the International Swaps and Derivatives Association, Inc. and recommended by the Alternative Reference Rates Committee. The majority of the Company’s instruments indexed to LIBOR were transferred to another index during the year ended December 31, 2023. The remaining instruments including loans and investments are either in the process of transition or will transition to a new index at the next repricing date.
FASB ASU 2022-02, Financial Instruments - Credit Losses (Topic 326): Troubled Debt Restructurings and Vintage Disclosures, was issued in March 2022. The ASU eliminates the accounting guidance for TDR loans by creditors while enhancing disclosure requirements for certain loan refinancings and restructurings by creditors when a borrower is experiencing financial difficulty. Specifically, rather than applying the recognition and measurement guidance for TDRs, the entity will apply the loan refinancing and restructuring guidance to determine whether a modification or other form of restructuring results in a new loan or continuation of an existing loan. Additionally, the ASU requires public business entities to disclose current-period gross write-offs by year of origination for financing receivables and net investments in leases. These amendments are effective for fiscal years beginning after December 15, 2022, including interim periods within those fiscal years. Early adoption is permitted in any interim period if an entity has adopted ASU 2016-13 and such election may be made individually to adopt the guidance related to TDRs, including related disclosures, and the presentation of gross write-offs in the vintage disclosure. This update requires prospective transition for the disclosures related to loan restructurings for borrowers experiencing financial difficulty and the presentation of gross write-offs in the vintage disclosures. The guidance related to the recognition and measurement of TDRs may be adopted on a prospective or modified retrospective transition method.
The Company adopted ASU 2022-02 on a prospective basis January 1, 2023. The Company elected at the date of adoption to account for existing TDR loans as of December 31, 2022 under the Company's TDR accounting policy which is disclosed in the 2022 Annual Form 10-K. All loan modifications post adoption are accounted for under the loan modification guidance in ASC 310-20. The adoption of this ASU did not have a material impact on business operations or the Consolidated Statements of Financial Condition.
FASB ASU 2023-02, Investments - Equity Method and Joint Ventures (Topic 323): Accounting for Investments in Tax Credit Structures Using the Proportional Amortization Method (a consensus of the Emerging Issues Task Force), was issued in February 2023. The amendments in this ASU permit companies to elect to account for their tax equity investments, regardless of the tax credit program from which the income tax credits are received, using the proportional amortization method, if certain conditions are met. Under the proportional amortization method, an entity amortizes the initial cost of the investment in proportion to the income tax credits and other income tax benefits received and recognizes the net amortization and income tax credits and other income tax benefits in the statement of operations as a component of income tax expense (benefit). The amendments also require that a reporting entity disclose certain information in annual and interim reporting periods that enable investors to understand the investments that generate income tax credits and other income tax benefits from a tax credit program. The ASU is effective for fiscal years, and interim periods within those fiscal years, beginning after December 15, 2023, with early adoption permitted. The amendments in the ASU can be applied either on a modified retrospective or a retrospective basis. The Company does not expect the adoption of this ASU to have a material impact on its business operations or Consolidated Statements of Financial Condition.
FASB ASU 2023-09, Income Taxes (Topic 740): Improvements to Income Tax Disclosures, was issued in December 2023. The amendments in this ASU requires a public business entity to disclose, on an annual basis, a tabular rate reconciliation using both percentages and currency amounts, broken out into specified categories with certain reconciling items further broken out by nature and jurisdiction to the extent those items exceed a specified threshold. In addition, all entities are required to disclose income taxes paid, net of refunds received disaggregated by federal, state/local, and foreign and by jurisdiction if the amount is at least 5% of total income tax payments, net of refunds received. The new standard is effective for annual periods beginning after December 15, 2024, with early adoption permitted. An entity may apply the amendments in this ASU prospectively by providing the revised disclosures for the period ending December 31, 2025 and continuing to provide the pre-ASU disclosures for the prior periods, or may apply the amendments retrospectively by providing the revised disclosures for all period presented. The Company expects this ASU to only impact its disclosure requirements and does not expect the adoption of this ASU to have a material impact on its business operations or Consolidated Statements of Financial Condition.
(2)Investment Securities
The Company’s investment policy is designed primarily to provide and maintain liquidity, generate a favorable return on assets without incurring undue interest rate and credit risk and complement the Company’s lending activities.
During 2021, the Company transferred, at fair value, $244.8 million of U.S. government and agency securities from the available for sale classification to the held to maturity classification. The net unrealized after tax gain remained in AOCI and is amortized over the remaining life of the securities, offsetting the related amortization of discount or premium on the transferred securities. No gains or losses were recognized at the time of the transfer.
60
There were no
(a) Investment Securities by Classification, Type and Maturity
The following tables present the amortized cost and fair value of investment securities and the corresponding amounts of gross unrealized and unrecognized gains and losses, including the corresponding amounts of gross unrealized gains and losses on investment securities available for sale recognized in AOCI, at the dates indicated:
| December 31, 2023 | |||||||||||||||||||||||
| Amortized Cost | Gross Unrealized Gains | Gross Unrealized Losses | Fair Value | ||||||||||||||||||||
| (Dollars in thousands) | |||||||||||||||||||||||
| Investment securities available for sale: | |||||||||||||||||||||||
| U.S. government and agency securities | $ | $ | $ | ( | $ | ||||||||||||||||||
| Municipal securities | ( | ||||||||||||||||||||||
Residential CMO and MBS(1) | ( | ||||||||||||||||||||||
Commercial CMO and MBS(1) | ( | ||||||||||||||||||||||
| Corporate obligations | ( | ||||||||||||||||||||||
| Other asset-backed securities | ( | ||||||||||||||||||||||
| Total | $ | $ | $ | ( | $ | ||||||||||||||||||
(1) U.S. government agency and government-sponsored enterprise CMO and MBS.
| December 31, 2023 | |||||||||||||||||||||||
| Amortized Cost | Gross Unrecognized Gains | Gross Unrecognized Losses | Fair Value | ||||||||||||||||||||
(Dollars in thousands) | |||||||||||||||||||||||
| Investment securities held to maturity: | |||||||||||||||||||||||
| U.S. government and agency securities | $ | $ | $ | ( | $ | ||||||||||||||||||
Residential CMO and MBS(1) | ( | ||||||||||||||||||||||
Commercial CMO and MBS(1) | ( | ||||||||||||||||||||||
| Total | $ | $ | $ | ( | $ | ||||||||||||||||||
(1) U.S. government agency and government-sponsored enterprise CMO and MBS.
| December 31, 2022 | |||||||||||||||||||||||
| Amortized Cost | Gross Unrealized Gains | Gross Unrealized Losses | Fair Value | ||||||||||||||||||||
| (Dollars in thousands) | |||||||||||||||||||||||
| Investment securities available for sale: | |||||||||||||||||||||||
| U.S. government and agency securities | $ | $ | $ | ( | $ | ||||||||||||||||||
| Municipal securities | ( | ||||||||||||||||||||||
Residential CMO and MBS(1) | ( | ||||||||||||||||||||||
Commercial CMO and MBS(1) | ( | ||||||||||||||||||||||
| Corporate obligations | ( | ||||||||||||||||||||||
| Other asset-backed securities | ( | ||||||||||||||||||||||
| Total | $ | $ | $ | ( | $ | ||||||||||||||||||
61
| December 31, 2022 | |||||||||||||||||||||||
| Amortized Cost | Gross Unrecognized Gains | Gross Unrecognized Losses | Fair Value | ||||||||||||||||||||
(Dollars in thousands) | |||||||||||||||||||||||
| Investment securities held to maturity: | |||||||||||||||||||||||
| U.S. government and agency securities | $ | $ | $ | ( | $ | ||||||||||||||||||
Residential CMO and MBS(1) | ( | ||||||||||||||||||||||
Commercial CMO and MBS(1) | ( | ||||||||||||||||||||||
| Total | $ | $ | $ | ( | $ | ||||||||||||||||||
(1) U.S. government agency and government-sponsored enterprise CMO and MBS.
The following table presents the amortized cost and fair value of investment securities by contractual maturity at the date indicated. Actual maturities may differ from contractual maturities because certain borrowers have the right to call or prepay obligations with or without call or prepayment penalties.
| December 31, 2023 | |||||||||||||||||||||||
| Securities Available for Sale | Securities Held to Maturity | ||||||||||||||||||||||
| Amortized Cost | Fair Value | Amortized Cost | Fair Value | ||||||||||||||||||||
| (Dollars in thousands) | |||||||||||||||||||||||
| Due in one year or less | $ | $ | $ | $ | |||||||||||||||||||
| Due after one year through five years | |||||||||||||||||||||||
| Due after five years through ten years | |||||||||||||||||||||||
| Due after ten years | |||||||||||||||||||||||
| Total investment securities due at a single maturity date | |||||||||||||||||||||||
MBS(1) | |||||||||||||||||||||||
| Total investment securities | $ | $ | $ | $ | |||||||||||||||||||
(1) MBS, which have prepayment provisions, are not assigned to maturity categories due to fluctuations in their payment speed.
There were no
(b) Unrealized Losses on Investment Securities Available for Sale
The following tables present the gross unrealized losses and fair value of the Company’s investment securities available for sale for which an ACL on investment securities available for sale has not been recorded, aggregated by investment category and length of time the individual securities have been in a continuous unrealized loss position at the dates indicated:
| December 31, 2023 | |||||||||||||||||||||||||||||||||||
| Less than 12 Months | 12 Months or Longer | Total | |||||||||||||||||||||||||||||||||
| Fair Value | Unrealized Losses | Fair Value | Unrealized Losses | Fair Value | Unrealized Losses | ||||||||||||||||||||||||||||||
| (Dollars in thousands) | |||||||||||||||||||||||||||||||||||
| U.S. government and agency securities | $ | $ | $ | $ | ( | $ | $ | ( | |||||||||||||||||||||||||||
| Municipal securities | ( | ( | ( | ||||||||||||||||||||||||||||||||
Residential CMO and MBS(1) | ( | ( | |||||||||||||||||||||||||||||||||
Commercial CMO and MBS(1) | ( | ( | ( | ||||||||||||||||||||||||||||||||
| Corporate obligations | ( | ( | ( | ||||||||||||||||||||||||||||||||
| Other asset-backed securities | ( | ( | ( | ||||||||||||||||||||||||||||||||
| Total | $ | $ | ( | $ | $ | ( | $ | $ | ( | ||||||||||||||||||||||||||
(1) U.S. government agency and government-sponsored enterprise CMO and MBS.
62
| December 31, 2022 | |||||||||||||||||||||||||||||||||||
| Less than 12 Months | 12 Months or Longer | Total | |||||||||||||||||||||||||||||||||
| Fair Value | Unrealized Losses | Fair Value | Unrealized Losses | Fair Value | Unrealized Losses | ||||||||||||||||||||||||||||||
| (Dollars in thousands) | |||||||||||||||||||||||||||||||||||
| U.S. government and agency securities | $ | $ | ( | $ | $ | ( | $ | $ | ( | ||||||||||||||||||||||||||
| Municipal securities | $ | $ | ( | $ | $ | ( | ( | ||||||||||||||||||||||||||||
Residential CMO and MBS(1) | ( | ( | ( | ||||||||||||||||||||||||||||||||
Commercial CMO and MBS(1) | ( | ( | ( | ||||||||||||||||||||||||||||||||
| Corporate obligations | ( | ( | |||||||||||||||||||||||||||||||||
| Other asset-backed securities | ( | ( | ( | ||||||||||||||||||||||||||||||||
| Total | $ | $ | ( | $ | $ | ( | $ | $ | ( | ||||||||||||||||||||||||||
(1) U.S. government agency and government-sponsored enterprise CMO and MBS.
(c) ACL on Investment Securities
The Company evaluated investment securities available for sale as of December 31, 2023 and December 31, 2022 and determined that any declines in fair value were attributable to changes in interest rates relative to where these investments fall within the yield curve and individual characteristics. Management monitors published credit ratings for adverse changes for all rated investment securities and none of these securities had a below investment grade credit rating as of both December 31, 2023 and December 31, 2022. In addition, the Company does not intend to sell these securities nor does the Company consider it more likely than not that it will be required to sell these securities before the recovery of the amortized cost basis, which may be upon maturity. Therefore, no
The Company also evaluated investment securities held to maturity for current expected credit losses as of December 31, 2023 and December 31, 2022. There were no no
(d) Realized Gains and Losses
The following table presents the gross realized gains and losses on the sale of investment securities available for sale determined using the specific identification method for the dates indicated:
| Year ended December 31, | |||||||||||||||||
| 2023 | 2022 | 2021 | |||||||||||||||
| (Dollars in thousands) | |||||||||||||||||
| Gross realized gains | $ | $ | $ | ||||||||||||||
| Gross realized losses | ( | ( | |||||||||||||||
| Net realized gains/(losses) | $ | ( | $ | ( | $ | ||||||||||||
(e) Pledged Securities
The following table summarizes the amortized cost and fair value of investment securities that were pledged as collateral for the following obligations at the dates indicated:
| December 31, 2023 | December 31, 2022 | ||||||||||||||||||||||
| Amortized Cost | Fair Value | Amortized Cost | Fair Value | ||||||||||||||||||||
| (Dollars in thousands) | |||||||||||||||||||||||
| State and local governments public deposits | $ | $ | $ | $ | |||||||||||||||||||
| FRB | |||||||||||||||||||||||
| Securities sold under agreement to repurchase | |||||||||||||||||||||||
| Other securities pledged | |||||||||||||||||||||||
| Total | $ | $ | $ | $ | |||||||||||||||||||
63
(f) Accrued Interest Receivable
Accrued interest receivable excluded from the amortized cost of investment securities available for sale totaled $3.8 million and $4.8 million at December 31, 2023 and December 31, 2022, respectively. Accrued interest receivable excluded from the amortized cost on investment securities held to maturity totaled $2.3 million and $2.4 million at December 31, 2023 and December 31, 2022, respectively.
(G) Non-Marketable Securities
At December 31, 2022, as a member bank of Visa U.S.A., we held 6,549 shares of Visa Inc. Class B common stock. These shares had a carrying value of zero and were restricted from resale to non-member banks of Visa U.S.A. until their conversion into Class A (voting) shares upon the termination of Visa Inc.'s Covered Litigation escrow account. During the year ended December 31, 2023, the Company sold all shares of Visa Inc. Class B common stock and recognized a $1.6 million gain which is included in "Other income" on the Consolidated Statements of Income.
(3)Loans Receivable
The Company originates loans in the ordinary course of business and has also acquired loans through mergers and acquisitions. Accrued interest receivable was excluded from disclosures presenting the Company's amortized cost of loans receivable as it was deemed insignificant. In addition to originating loans, the Company may also purchase loans through pool purchases, participation purchases and syndicated loan purchases.
(a) Loan Origination/Risk Management
The Company categorizes the individual loans in the total loan portfolio into four segments: commercial business; residential real estate; real estate construction and land development; and consumer. Within these segments are classes of loans for which management monitors and assesses credit risk in the loan portfolios.
The Company has certain lending policies and guidelines in place that are designed to maximize loan income within an acceptable level of risk. Management reviews and approves these policies and guidelines on a regular basis. A reporting system supplements the review process by providing management with frequent reports related to loan production, loan quality, concentrations of credit, loan delinquencies and nonperforming and criticized loans. The Company also conducts internal loan reviews and validates the credit risk assessment on a periodic basis and presents the results of these reviews to management. The loan review process complements and reinforces the risk identification and assessment decisions made by loan officers and credit personnel.
The amortized cost of loans receivable, net of ACL on loans consisted of the following portfolio segments and classes at the dates indicated:
| December 31, 2023 | December 31, 2022 | ||||||||||
| (Dollars in thousands) | |||||||||||
| Commercial business: | |||||||||||
| Commercial and industrial | $ | $ | |||||||||
| Owner-occupied CRE | |||||||||||
| Non-owner occupied CRE | |||||||||||
| Total commercial business | |||||||||||
Residential real estate | |||||||||||
| Real estate construction and land development: | |||||||||||
Residential | |||||||||||
Commercial and multifamily | |||||||||||
| Total real estate construction and land development | |||||||||||
| Consumer | |||||||||||
| Loans receivable | |||||||||||
| ACL on loans | ( | ( | |||||||||
| Loans receivable, net | $ | $ | |||||||||
| Balances included in the amortized cost of loans receivable: | |||||||||||
| Unamortized net discount on acquired loans | $ | ( | $ | ( | |||||||
| Unamortized net deferred fee | $ | ( | $ | ( | |||||||
64
A discussion of the risk characteristics of each loan portfolio segment is as follows:
Commercial Business:
Commercial and industrial. Commercial and industrial loans are primarily made based on the identified cash flows of the borrower and secondarily on the underlying collateral provided by the borrower. The cash flows of borrowers, however, may not be as expected and the collateral securing these loans may fluctuate in value. Most commercial and industrial loans are secured by the assets being financed or other business assets such as accounts receivable or inventory and may include a personal guarantee; however, some short-term loans may be made on an unsecured basis. In the case of loans secured by accounts receivable, the availability of funds for the repayment of these loans may be substantially dependent on the ability of the borrower to collect amounts due from its customers. Commercial and industrial loans carry more risk than other loans because the borrowers’ cash flow is less predictable and in the event of a default the amount of loss is potentially greater and more difficult to quantify because the value of the collateral securing these loans may fluctuate, may be uncollectible or may be obsolete or of limited use, among other things.
Owner-occupied and non-owner occupied CRE. The Company originates CRE loans primarily within its primary market areas. These loans are subject to underwriting standards and processes similar to commercial and industrial loans in that these loans are viewed primarily as cash flow loans and secondarily as loans secured by real estate properties. CRE lending typically involves higher loan principal amounts and payments on loans and repayment is dependent on successful operation and management of the properties. The value of the real estate securing these loans can be adversely affected by conditions in the real estate market or the economy. There is some common risk characteristics with owner-occupied CRE loans and non-owner occupied CRE loans. However, owner-occupied CRE loans are generally considered to have a slightly lower risk profile as we typically have the guarantee of the owner-occupant and can underwrite risk using the complete financial information on the entity that occupies the property.
Residential Real Estate:
The majority of the Company’s residential real estate loans are secured by one-to-four family residences located in its primary market areas. The Company’s underwriting standards require that residential real estate loans maintained in the portfolio generally are owner-occupied and do not exceed 80 % of the lower of appraised value at origination or cost of the underlying collateral. Terms of maturity typically range from 15 to 30 years. The Company sells a portion of originated residential real estate loans in the secondary market. In addition to originating residential real estate loans, the Company began purchasing pools of residential real estate loans during the year ended 2022. All purchased loans adhere to the Company's underwriting standards.
Real Estate Construction and Land Development:
The Company originates construction loans for residential and for commercial and multifamily properties. The residential construction loans generally include construction of custom single-family homes whereby the homeowner is the borrower. The Company also provides financing to builders for the construction of pre-sold residential homes and, in selected cases, to builders for the construction of speculative single-family residential property. Construction loans are typically short-term in nature and priced with variable rates of interest. Construction loans may also be originated as a construction-to-permanent financing loan whereby upon completion of the construction phase, the loan is automatically converted to a permanent term loan. Construction lending can involve a higher level of risk than other types of lending because funds are advanced partially based upon the value of the project, which is uncertain prior to the project’s completion. Because of the uncertainties inherent in estimating construction costs as well as the market value of a completed project and the effects of governmental regulation of real property, the Company’s estimates with regard to the total funds required to complete a project and the related loan-to-value ratio may vary from actual results. As a result, construction loans often involve the disbursement of substantial funds with repayment dependent, in part, on the success of the ultimate project and the ability of the borrower to sell or lease the property or refinance the indebtedness. If the Company’s estimate of the value of a project at completion proves to be overstated, it may have inadequate security for repayment of the loan and may incur a loss if the borrower does not repay the loan. Sources of repayment for these types of loans may be pre-committed permanent loans from approved long-term lenders, sales of developed property or an interim loan commitment from the Company until permanent financing is obtained. These loans are closely monitored by on-site inspections and are considered to have higher risks than other real estate loans due to their ultimate repayment being dependent upon successful completion of the construction project, market interest rate changes, government regulation of real property, general economic conditions and the availability of long-term financing.
Consumer:
The Company originates consumer loans and lines of credit that are both secured and unsecured. The underwriting process for these loans ensures a qualifying primary and secondary source of repayment. Underwriting standards for home equity loans are significantly influenced by statutory requirements, which include, but are not limited to, a maximum loan-to-value percentage of 80 %, collection remedies, the number of such loans a borrower can have at one time and documentation requirements. To monitor and manage consumer loan risk, policies and procedures are developed and modified, as needed. The majority of consumer loans are for relatively small amounts disbursed among many individual borrowers which reduces the overall credit risk for this segment. To further reduce the risk, trend reports are reviewed by management on a regular basis.
The Company also purchased indirect consumer loans. These indirect consumer loans were made by well-known dealers located in our market areas to prime borrowers and secured by new and used automobile and recreational vehicles. The Company ceased indirect consumer loan originations in March 2020.
65
(b) Concentrations of Credit
Most of the Company’s lending activity occurs within its primary market areas which are concentrated along the I-5 corridor from Whatcom County, Washington to Lane County, Oregon, as well as Yakima County in Washington and Ada County in Idaho. Additionally, the Company's loan portfolio is concentrated in commercial business loans, which include commercial and industrial, owner-occupied and nonowner-occupied CRE, and real estate construction and land development loans which include commercial and multifamily real estate construction and land development loans. Commercial business loans and commercial and multifamily real estate construction and land development loans are generally considered as having a more inherent risk of default than residential real estate loans or other consumer loans. Also, the loan balance per borrower is typically larger than that for residential real estate loans and consumer loans, implying higher potential losses on an individual loan basis.
(c) Credit Quality Indicators
As part of the on-going monitoring of the credit quality of the Company’s loan portfolio, management tracks certain credit quality indicators including trends related to (i) the risk grade of the loans, (ii) the level of classified loans, (iii) net charge-offs, (iv) nonperforming loans, (v) past due status, and (vi) the general economic conditions of the United States of America, and specifically the states of Washington and Oregon. The Company utilizes a risk grading matrix to assign a risk grade to each of its loans. Loans are graded on a scale of 1 to 10. A description of the general characteristics of the risk grades is as follows:
•Grades 1 to 5: These grades are considered “Pass” and include loans with negligible to above average, but acceptable, risk. These borrowers generally have strong to acceptable capital levels and consistent earnings and debt service capacity. Loans with the higher grades within the “Pass” category may include borrowers who are experiencing unusual operating difficulties, but have acceptable payment performance to date. Increased monitoring of financial information and/or collateral may be appropriate. Loans with this grade show no immediate loss exposure.
•Grade 6: This grade includes "Watch" loans. The grade is intended to be utilized on a temporary basis for pass grade borrowers where a potentially significant risk-modifying action is anticipated in the near term and are considered Pass grade for reporting purposes.
•Grade 7: This grade includes "Special Mention" ("SM") loans and is intended to highlight loans deemed by management to have some elevated risks that deserve management's close attention. Loans with this grade show signs of deteriorating profits and capital and the borrower might not be strong enough to sustain a major setback. The borrower is typically higher than normally leveraged and outside support might be modest and likely illiquid. The loan is at risk of further credit decline unless active measures are taken to correct the situation.
•Grade 8: This grade includes “Substandard” ("SS") loans in accordance with regulatory guidelines, which the Company has determined have a high credit risk. These loans also have well-defined weaknesses and are characterized by the distinct possibility that the Company will sustain some loss if the deficiencies are not corrected. The borrower may have shown serious negative trends in financial ratios and performance. Such loans may be dependent upon collateral liquidation, a secondary source of repayment or an event outside of the normal course of business.
•Grade 9: This grade includes “Doubtful” loans in accordance with regulatory guidelines and the Company has determined these loans to have excessive credit risk. Such loans are placed on nonaccrual status and may be dependent upon collateral having a value that is difficult to determine or upon some near-term event which lacks certainty. Additionally, these loans generally have been partially charged off for the amount considered uncollectible.
•Grade 10: This grade includes “Loss” loans in accordance with regulatory guidelines and the Company has determined these loans have the highest risk of loss. Such loans are charged off or charged down when payment is acknowledged to be uncertain or when the timing or value of payments cannot be determined.
Numerical loan grades for loans are established at the origination of the loan. Changes to loan grades are considered at the time new information about the performance of a loan becomes available, including the receipt of updated financial information from the borrower, results of annual term loan reviews and scheduled loan reviews. For consumer loans, the Company follows the FDIC’s Uniform Retail Credit Classification and Account Management Policy for subsequent classification in the event of payment delinquencies or default. Typically, an individual loan grade will not be changed from the prior period unless there is a specific indication of credit deterioration or improvement. Credit deterioration is evidenced by delinquency, direct communications with the borrower or other borrower information that becomes known to management. Credit improvements are evidenced by known facts regarding the borrower or the collateral property.
Loan grades relate to the likelihood of losses in that the higher the grade, the greater the loss potential. Loans with a pass grade may have some estimated inherent losses, but to a lesser extent than the other loan grades. The SM loan grade is transitory in that the Company is waiting on additional information to determine the likelihood and extent of any potential loss. The likelihood of loss for SM graded loans, however, is greater than Watch graded loans because there has been measurable credit deterioration. Loans with a SS grade have further credit deterioration and include both accrual loans and nonaccrual loans. For Doubtful and Loss graded loans, the Company is almost certain of the losses and the outstanding principal balances are generally charged off to the realizable value. There were no loans graded Doubtful or Loss as of December 31, 2023 and 2022.
66
The following tables present the amortized cost of loans receivable by risk grade and origination year, and the gross charge-offs by loan class and origination year, at the dates indicated. The Company adopted the vintage disclosure requirements of ASU 2022-02 prospectively as described in Note 1 beginning January 1, 2023.
| December 31, 2023 | Revolving Loans | Revolving Loans Converted(1) | Loans Receivable | ||||||||||||||||||||||||||||||||||||||||||||||||||
| Term Loans Amortized Cost Basis by Origination Year | |||||||||||||||||||||||||||||||||||||||||||||||||||||
| 2023 | 2022 | 2021 | 2020 | 2019 | Prior | ||||||||||||||||||||||||||||||||||||||||||||||||
| (Dollars in thousands) | |||||||||||||||||||||||||||||||||||||||||||||||||||||
| Commercial business: | |||||||||||||||||||||||||||||||||||||||||||||||||||||
| Commercial and industrial | |||||||||||||||||||||||||||||||||||||||||||||||||||||
| Pass | $ | $ | $ | $ | $ | $ | $ | $ | $ | ||||||||||||||||||||||||||||||||||||||||||||
| SM | |||||||||||||||||||||||||||||||||||||||||||||||||||||
| SS | |||||||||||||||||||||||||||||||||||||||||||||||||||||
| Total | |||||||||||||||||||||||||||||||||||||||||||||||||||||
| Owner-occupied CRE | |||||||||||||||||||||||||||||||||||||||||||||||||||||
| Pass | |||||||||||||||||||||||||||||||||||||||||||||||||||||
| SM | |||||||||||||||||||||||||||||||||||||||||||||||||||||
| SS | |||||||||||||||||||||||||||||||||||||||||||||||||||||
| Total | |||||||||||||||||||||||||||||||||||||||||||||||||||||
| Non-owner occupied CRE | |||||||||||||||||||||||||||||||||||||||||||||||||||||
| Pass | |||||||||||||||||||||||||||||||||||||||||||||||||||||
| SM | |||||||||||||||||||||||||||||||||||||||||||||||||||||
| SS | |||||||||||||||||||||||||||||||||||||||||||||||||||||
| Total | |||||||||||||||||||||||||||||||||||||||||||||||||||||
| Total commercial business | |||||||||||||||||||||||||||||||||||||||||||||||||||||
| Pass | |||||||||||||||||||||||||||||||||||||||||||||||||||||
| SM | |||||||||||||||||||||||||||||||||||||||||||||||||||||
| SS | |||||||||||||||||||||||||||||||||||||||||||||||||||||
| Total | |||||||||||||||||||||||||||||||||||||||||||||||||||||
| Commercial business gross charge-offs | |||||||||||||||||||||||||||||||||||||||||||||||||||||
| Current period | |||||||||||||||||||||||||||||||||||||||||||||||||||||
Residential real estate | |||||||||||||||||||||||||||||||||||||||||||||||||||||
| Pass | |||||||||||||||||||||||||||||||||||||||||||||||||||||
| SS | |||||||||||||||||||||||||||||||||||||||||||||||||||||
| Total | |||||||||||||||||||||||||||||||||||||||||||||||||||||
| Real estate construction and land development: | |||||||||||||||||||||||||||||||||||||||||||||||||||||
Residential | |||||||||||||||||||||||||||||||||||||||||||||||||||||
| Pass | |||||||||||||||||||||||||||||||||||||||||||||||||||||
| SM | |||||||||||||||||||||||||||||||||||||||||||||||||||||
| SS | |||||||||||||||||||||||||||||||||||||||||||||||||||||
| Total | |||||||||||||||||||||||||||||||||||||||||||||||||||||
Commercial and multifamily | |||||||||||||||||||||||||||||||||||||||||||||||||||||
| Pass | |||||||||||||||||||||||||||||||||||||||||||||||||||||
| SM | |||||||||||||||||||||||||||||||||||||||||||||||||||||
| Total | |||||||||||||||||||||||||||||||||||||||||||||||||||||
| Total real estate construction and land development | |||||||||||||||||||||||||||||||||||||||||||||||||||||
| Pass | |||||||||||||||||||||||||||||||||||||||||||||||||||||
| SM | |||||||||||||||||||||||||||||||||||||||||||||||||||||
| SS | |||||||||||||||||||||||||||||||||||||||||||||||||||||
| Total | |||||||||||||||||||||||||||||||||||||||||||||||||||||
67
| December 31, 2023 | Revolving Loans | Revolving Loans Converted(1) | Loans Receivable | ||||||||||||||||||||||||||||||||||||||||||||||||||
| Term Loans Amortized Cost Basis by Origination Year | |||||||||||||||||||||||||||||||||||||||||||||||||||||
| 2023 | 2022 | 2021 | 2020 | 2019 | Prior | ||||||||||||||||||||||||||||||||||||||||||||||||
| Consumer | |||||||||||||||||||||||||||||||||||||||||||||||||||||
| Pass | |||||||||||||||||||||||||||||||||||||||||||||||||||||
| SS | |||||||||||||||||||||||||||||||||||||||||||||||||||||
| Total | |||||||||||||||||||||||||||||||||||||||||||||||||||||
| Consumer gross charge-offs: | |||||||||||||||||||||||||||||||||||||||||||||||||||||
| Current period | |||||||||||||||||||||||||||||||||||||||||||||||||||||
| Loans receivable | |||||||||||||||||||||||||||||||||||||||||||||||||||||
| Pass | |||||||||||||||||||||||||||||||||||||||||||||||||||||
| SM | |||||||||||||||||||||||||||||||||||||||||||||||||||||
| SS | |||||||||||||||||||||||||||||||||||||||||||||||||||||
| Total | $ | $ | $ | $ | $ | $ | $ | $ | $ | ||||||||||||||||||||||||||||||||||||||||||||
| Gross charge-offs: | |||||||||||||||||||||||||||||||||||||||||||||||||||||
Total | $ | $ | $ | $ | $ | $ | $ | $ | $ | ||||||||||||||||||||||||||||||||||||||||||||
(1) Represents the loans receivable balance at December 31, 2023 which was converted from a revolving loan to a non-revolving amortizing loan during the year ended December 31, 2023.
| December 31, 2022 | Revolving Loans | Revolving Loans Converted(1) | Loans Receivable | ||||||||||||||||||||||||||||||||||||||||||||||||||
| Term Loans Amortized Cost Basis by Origination Year | |||||||||||||||||||||||||||||||||||||||||||||||||||||
| 2022 | 2021 | 2020 | 2019 | 2018 | Prior | ||||||||||||||||||||||||||||||||||||||||||||||||
| (Dollars in thousands) | |||||||||||||||||||||||||||||||||||||||||||||||||||||
| Commercial business: | |||||||||||||||||||||||||||||||||||||||||||||||||||||
| Commercial and industrial | |||||||||||||||||||||||||||||||||||||||||||||||||||||
| Pass | $ | $ | $ | $ | $ | $ | $ | $ | $ | ||||||||||||||||||||||||||||||||||||||||||||
| SM | |||||||||||||||||||||||||||||||||||||||||||||||||||||
| SS | |||||||||||||||||||||||||||||||||||||||||||||||||||||
| Total | |||||||||||||||||||||||||||||||||||||||||||||||||||||
| Owner-occupied CRE | |||||||||||||||||||||||||||||||||||||||||||||||||||||
| Pass | |||||||||||||||||||||||||||||||||||||||||||||||||||||
| SM | |||||||||||||||||||||||||||||||||||||||||||||||||||||
| SS | |||||||||||||||||||||||||||||||||||||||||||||||||||||
| Total | |||||||||||||||||||||||||||||||||||||||||||||||||||||
| Non-owner-occupied CRE | |||||||||||||||||||||||||||||||||||||||||||||||||||||
| Pass | |||||||||||||||||||||||||||||||||||||||||||||||||||||
| SM | |||||||||||||||||||||||||||||||||||||||||||||||||||||
| SS | |||||||||||||||||||||||||||||||||||||||||||||||||||||
| Total | |||||||||||||||||||||||||||||||||||||||||||||||||||||
| Total commercial business | |||||||||||||||||||||||||||||||||||||||||||||||||||||
| Pass | |||||||||||||||||||||||||||||||||||||||||||||||||||||
| SM | |||||||||||||||||||||||||||||||||||||||||||||||||||||
| SS | |||||||||||||||||||||||||||||||||||||||||||||||||||||
| Total | |||||||||||||||||||||||||||||||||||||||||||||||||||||
68
| December 31, 2022 | Revolving Loans | Revolving Loans Converted(1) | Loans Receivable | ||||||||||||||||||||||||||||||||||||||||||||||||||
| Term Loans Amortized Cost Basis by Origination Year | |||||||||||||||||||||||||||||||||||||||||||||||||||||
| 2022 | 2021 | 2020 | 2019 | 2018 | Prior | ||||||||||||||||||||||||||||||||||||||||||||||||
| Residential real estate | |||||||||||||||||||||||||||||||||||||||||||||||||||||
| Pass | |||||||||||||||||||||||||||||||||||||||||||||||||||||
| SS | |||||||||||||||||||||||||||||||||||||||||||||||||||||
| Total | |||||||||||||||||||||||||||||||||||||||||||||||||||||
| Real estate construction and land development: | |||||||||||||||||||||||||||||||||||||||||||||||||||||
| Residential | |||||||||||||||||||||||||||||||||||||||||||||||||||||
| Pass | |||||||||||||||||||||||||||||||||||||||||||||||||||||
Commercial and multifamily | |||||||||||||||||||||||||||||||||||||||||||||||||||||
| Pass | |||||||||||||||||||||||||||||||||||||||||||||||||||||
| SM | |||||||||||||||||||||||||||||||||||||||||||||||||||||
| SS | |||||||||||||||||||||||||||||||||||||||||||||||||||||
| Total | |||||||||||||||||||||||||||||||||||||||||||||||||||||
| Total real estate construction and land development | |||||||||||||||||||||||||||||||||||||||||||||||||||||
| Pass | |||||||||||||||||||||||||||||||||||||||||||||||||||||
| SM | |||||||||||||||||||||||||||||||||||||||||||||||||||||
| SS | |||||||||||||||||||||||||||||||||||||||||||||||||||||
| Total | |||||||||||||||||||||||||||||||||||||||||||||||||||||
| Consumer | |||||||||||||||||||||||||||||||||||||||||||||||||||||
| Pass | |||||||||||||||||||||||||||||||||||||||||||||||||||||
| SS | |||||||||||||||||||||||||||||||||||||||||||||||||||||
| Total | |||||||||||||||||||||||||||||||||||||||||||||||||||||
| Loans receivable | |||||||||||||||||||||||||||||||||||||||||||||||||||||
| Pass | |||||||||||||||||||||||||||||||||||||||||||||||||||||
| SM | |||||||||||||||||||||||||||||||||||||||||||||||||||||
| SS | |||||||||||||||||||||||||||||||||||||||||||||||||||||
| Total | $ | $ | $ | $ | $ | $ | $ | $ | $ | ||||||||||||||||||||||||||||||||||||||||||||
(1) Represents the loans receivable balance at December 31, 2022 which was converted from a revolving loan to a non-revolving amortizing loan during the year ended December 31, 2022
(d) Nonaccrual Loans
The following tables present the amortized cost of nonaccrual loans at the dates indicated:
| December 31, 2023 | |||||||||||||||||
| Nonaccrual without ACL | Nonaccrual with ACL | Total Nonaccrual | |||||||||||||||
| (Dollars in thousands) | |||||||||||||||||
| Commercial business: | |||||||||||||||||
| Commercial and industrial | $ | $ | $ | ||||||||||||||
| Owner-occupied CRE | |||||||||||||||||
| Total commercial business | |||||||||||||||||
| Total | $ | $ | $ | ||||||||||||||
| December 31, 2022 | |||||||||||||||||
| Nonaccrual without ACL | Nonaccrual with ACL | Total Nonaccrual | |||||||||||||||
| (Dollars in thousands) | |||||||||||||||||
| Commercial business: | |||||||||||||||||
| Commercial and industrial | $ | $ | $ | ||||||||||||||
69
| December 31, 2022 | |||||||||||||||||
| Nonaccrual without ACL | Nonaccrual with ACL | Total Nonaccrual | |||||||||||||||
| (Dollars in thousands) | |||||||||||||||||
| Owner-occupied CRE | |||||||||||||||||
| Total commercial business | |||||||||||||||||
| Real estate construction and land development: | |||||||||||||||||
Commercial and multifamily | |||||||||||||||||
| Total | $ | $ | $ | ||||||||||||||
The following table presents the reversal of interest income on loans due to the write-off of accrued interest receivable upon the initial classification of loans as nonaccrual loans and the interest income recognized due to payment in full or sale of previously classified nonaccrual loans during the following periods:
| Year Ended December 31, 2023 | Year Ended December 31, 2022 | ||||||||||||||||||||||
| Interest Income Reversed | Interest Income Recognized | Interest Income Reversed | Interest Income Recognized | ||||||||||||||||||||
| (Dollars in thousands) | |||||||||||||||||||||||
| Commercial business: | |||||||||||||||||||||||
| Commercial and industrial | $ | ( | $ | $ | ( | $ | |||||||||||||||||
| Owner-occupied CRE | |||||||||||||||||||||||
| Non-owner occupied CRE | |||||||||||||||||||||||
| Total commercial business | ( | ( | |||||||||||||||||||||
Residential real estate | |||||||||||||||||||||||
| Real estate construction and land development: | |||||||||||||||||||||||
Commercial and multifamily | ( | ||||||||||||||||||||||
| Consumer | |||||||||||||||||||||||
| Total | $ | ( | $ | $ | ( | $ | |||||||||||||||||
For the year ended December 31, 2023 and 2022, no
(e) Past due loans
The Company performs an aging analysis of past due loans using policies consistent with regulatory reporting requirements with categories of 30-89 days past due and 90 or more days past due. The following tables present the amortized cost of past due loans at the dates indicated:
| December 31, 2023 | |||||||||||||||||||||||||||||
| 30-89 Days | 90 Days or Greater | Total Past Due | Current | Loans Receivable | |||||||||||||||||||||||||
| (Dollars in thousands) | |||||||||||||||||||||||||||||
| Commercial business: | |||||||||||||||||||||||||||||
| Commercial and industrial | $ | $ | $ | $ | $ | ||||||||||||||||||||||||
| Owner-occupied CRE | |||||||||||||||||||||||||||||
| Non-owner occupied CRE | |||||||||||||||||||||||||||||
| Total commercial business | |||||||||||||||||||||||||||||
Residential real estate | |||||||||||||||||||||||||||||
| Real estate construction and land development: | |||||||||||||||||||||||||||||
Residential | |||||||||||||||||||||||||||||
Commercial and multifamily | |||||||||||||||||||||||||||||
| Total real estate construction and land development | |||||||||||||||||||||||||||||
| Consumer | |||||||||||||||||||||||||||||
| Total | $ | $ | $ | $ | $ | ||||||||||||||||||||||||
70
| December 31, 2022 | |||||||||||||||||||||||||||||
| 30-89 Days | 90 Days or Greater | Total Past Due | Current | Loans Receivable | |||||||||||||||||||||||||
| (Dollars in thousands) | |||||||||||||||||||||||||||||
| Commercial business: | |||||||||||||||||||||||||||||
| Commercial and industrial | $ | $ | $ | $ | $ | ||||||||||||||||||||||||
| Owner-occupied CRE | |||||||||||||||||||||||||||||
| Non-owner occupied CRE | |||||||||||||||||||||||||||||
| Total commercial business | |||||||||||||||||||||||||||||
Residential real estate | |||||||||||||||||||||||||||||
| Real estate construction and land development: | |||||||||||||||||||||||||||||
Residential | |||||||||||||||||||||||||||||
Commercial and multifamily | |||||||||||||||||||||||||||||
| Total real estate construction and land development | |||||||||||||||||||||||||||||
| Consumer | |||||||||||||||||||||||||||||
| Total | $ | $ | $ | $ | $ | ||||||||||||||||||||||||
Loans 90 days or more past due and still accruing interest were $1.3 million and $1.6 million as of December 31, 2023 and December 31, 2022, respectively.
(f) Collateral-dependent Loans
The following tables present the type of collateral securing loans individually evaluated for credit losses and for which the repayment was expected to be provided substantially through the operation or sale of the collateral at the dates indicated, with balances representing the amortized cost of the loan classified by the primary collateral category of each loan if multiple collateral sources secure the loan:
| December 31, 2023 | |||||||||||||||||||||||||||||
| CRE | Farmland | Residential Real Estate | Equipment | Total | |||||||||||||||||||||||||
| (Dollars in thousands) | |||||||||||||||||||||||||||||
| Commercial business: | |||||||||||||||||||||||||||||
| Commercial and industrial | $ | $ | $ | $ | $ | ||||||||||||||||||||||||
| Owner-occupied CRE | |||||||||||||||||||||||||||||
| Total commercial business | |||||||||||||||||||||||||||||
| Total | $ | $ | $ | $ | $ | ||||||||||||||||||||||||
December 31, 2022 | |||||||||||||||||||||||
| CRE | Farmland | Residential Real Estate | Total | ||||||||||||||||||||
| (Dollars in thousands) | |||||||||||||||||||||||
| Commercial business: | |||||||||||||||||||||||
| Commercial and industrial | $ | $ | $ | $ | |||||||||||||||||||
| Owner-occupied CRE | |||||||||||||||||||||||
| Total commercial business | |||||||||||||||||||||||
| Total | $ | $ | $ | $ | |||||||||||||||||||
There have been no significant changes to the collateral securing loans individually evaluated for credit losses and for which repayment was expected to be provided substantially through the operation or sale of the collateral during the year ended December 31, 2023, except changes due to additions or removals of loans in this classification.
(g) Modification of Loans
In January 2023, the Company adopted ASU 2022-02, “Financial Instruments - Credit Losses (Topic 326): Troubled Debt Restructurings and Vintage Disclosures” (“ASU 2022-02”), which eliminated the accounting guidance for TDRs while enhancing disclosure requirements for certain loan refinancing and restructurings by creditors when a borrower is experiencing financial difficulty. This guidance was applied on a prospective basis.
71
Modifications of loans to borrowers experiencing financial difficulty may include interest rate reductions, principal or interest forgiveness, term extensions, and other actions intended to minimize economic loss and to avoid foreclosure or repossession of collateral.
The following table presents loan modifications by type of modification at amortized cost that were modified as a result of experiencing both financial difficulty and modified during the period indicated:
| Year Ended December 31, 2023 | |||||||||||||||||||||||
| Term Extension | Term Extension & Int. Rate Reduction | Total Modified Loans | % of Modified Loans to Loans Receivable, net | ||||||||||||||||||||
| (Dollars in thousands) | |||||||||||||||||||||||
| Commercial business: | |||||||||||||||||||||||
| Commercial and industrial | $ | $ | $ | % | |||||||||||||||||||
| Owner-occupied CRE | $ | ||||||||||||||||||||||
| Non-owner occupied CRE | |||||||||||||||||||||||
| Total commercial business | |||||||||||||||||||||||
| Real estate construction and land development: | |||||||||||||||||||||||
Residential | |||||||||||||||||||||||
Commercial and multifamily | |||||||||||||||||||||||
| Total real estate construction and land development | |||||||||||||||||||||||
| Consumer | |||||||||||||||||||||||
| Total | $ | $ | $ | % | |||||||||||||||||||
The following tables present the financial effect of the loan modifications presented in the preceding table during the periods indicated:
| Year Ended December 31, 2023 | |||||||||||
| Weighted Average % of Interest Rate Reductions | Weighted Average Years of Term Extensions | ||||||||||
| Commercial business: | |||||||||||
| Commercial and industrial | % | ||||||||||
| Owner-occupied CRE | % | ||||||||||
| Non-owner occupied CRE | |||||||||||
| Total commercial business | |||||||||||
| Real estate construction and land development: | |||||||||||
Commercial and multifamily | |||||||||||
| Consumer | |||||||||||
| Total | % | ||||||||||
There were no
There were no loans to borrowers experiencing financial difficulty that had a payment default within the year ended December 31, 2023 that were modified in the twelve months prior to that default.
There were $6.6 million in commitments to lend additional funds to borrowers experiencing financial difficulty whose terms have been modified during the year ended December 31, 2023 through either principal forgiveness, interest rate reduction, term extension, or other than insignificant payment delay.
(h) Related Party Loans
In the ordinary course of business, the Company has granted loans to certain directors, executive officers and their affiliates. The following table presents the activity in related party loans during the periods indicated:
| Year Ended December 31, | |||||||||||||||||
| 2023 | 2022 | 2021 | |||||||||||||||
| (Dollars in thousands) | |||||||||||||||||
| Balance outstanding at the beginning of year | $ | $ | $ | ||||||||||||||
| Principal additions | |||||||||||||||||
72
| Principal reductions | ( | ( | ( | ||||||||||||||
| Balance outstanding at the end of year | $ | $ | $ | ||||||||||||||
All related party loans were performing in accordance with the underlying loan agreements as of December 31, 2023 and December 31, 2022. The Company had $113,000 and $5,000 of unfunded commitments to related parties as of December 31, 2023 and December 31, 2022.
(i) Commercial Loan Sales, Servicing, and Commercial Servicing Asset
The following table presents the details of loans serviced for others at the dates indicated:
| December 31, 2023 | December 31, 2022 | ||||||||||
| (Dollars in thousands) | |||||||||||
| Loans serviced for others with participating interest, gross loan balance | $ | $ | |||||||||
Loans serviced for others with participating interest, participation balance owned by Company (1) | |||||||||||
(1) Included in the balance of "Loans receivable" on the Consolidated Statements of Financial Condition.
The Company recognized $135,000 , $217,000 and $320,000 of servicing income for the years ended December 31, 2023, 2022 and 2021, respectively.
The Company's servicing asset at December 31, 2023 and December 31, 2022 was $128,000 and $192,000 , respectively. There was no
(j) Accrued interest receivable on loans receivable
Accrued interest receivable on loans receivable totaled $13.3 million and $11.3 million at December 31, 2023 and December 31, 2022, respectively and is excluded from the calculation of the ACL on loans as interest accrued , but not received, is reversed timely.
(4)Allowance for Credit Losses on Loans
During the year ended December 31, 2023, the ACL on loans increased $5.0 million, or 11.7 %, due primarily to a provision for credit losses on loans of $4.7 million. The provision for credit losses on loans recognized during the year ended December 31, 2023 was due primarily to growth in balances of collectively evaluated loans. The ACL on loans to Loans receivable increased to 1.11% as December 31, 2023, compared to 1.06% at December 31, 2022 due to changes in the loan mix as loan growth occurred in segments requiring a higher calculated reserve as a percentage of loans including real estate construction and land development loans.
The following tables detail the activity in the ACL on loans by segment and class for the periods indicated:
| Year Ended December 31, 2023 | |||||||||||||||||||||||||||||
| Beginning Balance | Charge-offs | Recoveries | Provision for (Reversal of) Credit Losses | Ending Balance | |||||||||||||||||||||||||
| (Dollars in thousands) | |||||||||||||||||||||||||||||
| Commercial business: | |||||||||||||||||||||||||||||
| Commercial and industrial | $ | $ | ( | $ | $ | ( | $ | ||||||||||||||||||||||
| Owner-occupied CRE | |||||||||||||||||||||||||||||
| Non-owner occupied CRE | |||||||||||||||||||||||||||||
| Total commercial business | ( | ( | |||||||||||||||||||||||||||
Residential real estate | |||||||||||||||||||||||||||||
| Real estate construction and land development: | |||||||||||||||||||||||||||||
Residential | ( | ||||||||||||||||||||||||||||
Commercial and multifamily | |||||||||||||||||||||||||||||
| Total real estate construction and land development | |||||||||||||||||||||||||||||
| Consumer | ( | ||||||||||||||||||||||||||||
| Total | $ | $ | ( | $ | $ | $ | |||||||||||||||||||||||
73
| Year Ended December 31, 2022 | |||||||||||||||||||||||||||||
| Beginning Balance | Charge-offs | Recoveries | (Reversal of) Provision for Credit Losses | Ending Balance | |||||||||||||||||||||||||
| (Dollars in thousands) | |||||||||||||||||||||||||||||
| Commercial business: | |||||||||||||||||||||||||||||
| Commercial and industrial | $ | $ | ( | $ | $ | ( | $ | ||||||||||||||||||||||
| Owner-occupied CRE | ( | ||||||||||||||||||||||||||||
| Non-owner occupied CRE | |||||||||||||||||||||||||||||
| Total commercial business | ( | ( | |||||||||||||||||||||||||||
| Residential real estate | ( | ||||||||||||||||||||||||||||
| Real estate construction and land development: | |||||||||||||||||||||||||||||
Residential | |||||||||||||||||||||||||||||
Commercial and multifamily | |||||||||||||||||||||||||||||
| Total real estate construction and land development | |||||||||||||||||||||||||||||
| Consumer | ( | ( | |||||||||||||||||||||||||||
| Total | $ | $ | ( | $ | $ | ( | $ | ||||||||||||||||||||||
| Year Ended December 31, 2021 | |||||||||||||||||||||||||||||
| Beginning Balance | Charge-offs | Recoveries | (Reversal of) Provision for Credit Losses | Ending Balance | |||||||||||||||||||||||||
| (Dollars in thousands) | |||||||||||||||||||||||||||||
| Commercial business: | |||||||||||||||||||||||||||||
| Commercial and industrial | $ | $ | ( | $ | $ | ( | $ | ||||||||||||||||||||||
| Owner-occupied CRE | ( | ( | |||||||||||||||||||||||||||
| Non-owner occupied CRE | ( | ||||||||||||||||||||||||||||
| Total commercial business | ( | ( | |||||||||||||||||||||||||||
| Residential real estate | ( | ||||||||||||||||||||||||||||
| Real estate construction and land development: | |||||||||||||||||||||||||||||
Residential | ( | ||||||||||||||||||||||||||||
Commercial and multifamily | ( | ( | |||||||||||||||||||||||||||
| Total real estate construction and land development | ( | ( | |||||||||||||||||||||||||||
| Consumer | ( | ( | |||||||||||||||||||||||||||
| Total | $ | $ | ( | $ | $ | ( | $ | ||||||||||||||||||||||
The following table details the activity in the ACL on unfunded commitments during the periods indicated:
| Year Ended December 31, | |||||||||||||||||
| 2023 | 2022 | 2021 | |||||||||||||||
| (Dollars in thousands) | |||||||||||||||||
| Balance, beginning of period | $ | $ | $ | ||||||||||||||
Reversal of credit losses on unfunded commitments | ( | ( | ( | ||||||||||||||
| Balance, end of period | $ | $ | $ | ||||||||||||||
74
(5)Premises and Equipment
The following table presents a summary of premises and equipment at the dates indicated:
| December 31, 2023 | December 31, 2022 | ||||||||||
| (Dollars in thousands) | |||||||||||
| Land | $ | $ | |||||||||
| Buildings and building improvements | |||||||||||
| Furniture, fixtures and equipment | |||||||||||
| Total premises and equipment | |||||||||||
| Less: Accumulated depreciation | ( | ( | |||||||||
| Premises and equipment, net | $ | $ | |||||||||
Total depreciation expense on premises and equipment was $6.3 million, $5.4 million and $5.3 million for the years ended December 31, 2023, 2022 and 2021, respectively.
(6)Goodwill and Other Intangible Assets
(a) Goodwill
The Company’s goodwill represents the excess of the purchase price over the fair value of net assets acquired in the following mergers: Premier Commercial Bancorp and Puget Sound Bancorp in 2018; Washington Banking Company in 2014; Valley Community Bancshares in 2013; Western Washington Bancorp in 2006 and North Pacific Bank in 1998. The Company’s goodwill is assigned to the Bank and is evaluated for impairment at the Bank level (reporting unit). There were no
Due to a sustained decline in stock price during the three months ended June 30, 2023, the Company determined a triggering event occurred and consequently performed a quantitative assessment of goodwill as of May 31, 2023. We estimated the fair value of the reporting unit by weighting results from the market approach and the income approach. Significant assumptions inherent in the valuation methodologies for goodwill were employed and included, but were not limited to, prospective financial information, growth rates, terminal value, discount rates, and comparable multiples from publicly traded companies in our industry. Based on this quantitative test, we determined that the fair value of the reporting unit more likely than not exceeded the carrying value.
At December 31, 2023, the Company determined that goodwill was not considered impaired as no material adverse changes had occurred since the quantitative assessment performed as of May 31, 2023 and the fair value of the reporting unit still exceeded the carrying value. Similarly, no goodwill impairment charges were recorded for the years ended December 31, 2022 and 2021.
(b) Other Intangible Assets
Other intangible assets represent core deposit intangible acquired in business combinations with estimated useful lives of ten years . There were no
The following table presents the changes in carrying value of other intangible assets at the dates indicated:
| December 31, 2023 | December 31, 2022 | ||||||||||
| (Dollars in thousands) | |||||||||||
Gross Carrying Value | $ | ||||||||||
Accumulated amortization | ( | ( | |||||||||
Net carrying value | $ | $ | |||||||||
The following table presents the estimated aggregate amortization of other intangible assets at the dates indicated:
| December 31, 2023 | |||||
| Estimated amortization expense | |||||
| 2024 | $ | ||||
| 2025 | |||||
| 2026 | |||||
| 2027 | |||||
| Total | $ | ||||
75
(7)Derivative Financial Instruments
The following table presents the notional amounts and estimated fair values of derivatives at the dates indicated:
| December 31, 2023 | December 31, 2022 | ||||||||||||||||||||||
| Notional Amounts | Estimated Fair Value | Notional Amounts | Estimated Fair Value | ||||||||||||||||||||
| (Dollars in thousands) | |||||||||||||||||||||||
| Non-hedging interest rate derivatives: | |||||||||||||||||||||||
Interest rate swap asset (1) | $ | $ | $ | $ | |||||||||||||||||||
Interest rate swap liability (1) | ( | ( | |||||||||||||||||||||
(1) The estimated fair value of derivatives with customers was $(22.5 ) million and $(30.1 ) million as of December 31, 2023 and December 31, 2022, respectively. The estimated fair value of derivatives with third-parties was $22.5 million and $30.1 million as of December 31, 2023 and December 31, 2022, respectively.
Generally, the gains and losses of the interest rate derivatives offset each other due to the back-to-back nature of the contracts. However, the settlement values of the Company's net derivative assets with customers had no change as of December 31, 2023, and increased $66,000 , and $355,000 as of December 31, 2022, and December 31, 2021, respectively, due to the change in the credit valuation adjustment.
(8)Deposits
The following table summarizes the Company's deposits at the dates indicated:
December 31, | |||||||||||
| 2023 | 2022 | ||||||||||
| Amount | Amount | ||||||||||
| (Dollars in thousands) | |||||||||||
| Noninterest demand deposits | $ | $ | |||||||||
| Interest bearing demand deposits | |||||||||||
| Money market accounts | |||||||||||
| Savings accounts | |||||||||||
| Certificates of deposit | |||||||||||
| Total deposits | $ | $ | |||||||||
Deposit accounts overdrawn and reclassified to loans receivable were $293,000 and $317,000 as of December 31, 2023 and December 31, 2022, respectively. Accrued interest payable on deposits was $250,000 and $70,000 as of December 31, 2023 and December 31, 2022, respectively and is included in "Accrued expenses and other liabilities" in the Consolidated Statements of Financial Condition.
Scheduled maturities of certificates of deposit for years after December 31, 2023 are as follows, in thousands:
| 2024 | $ | ||||
| 2025 | |||||
| 2026 | |||||
| 2027 | |||||
| 2028 | |||||
| Thereafter | |||||
| Total | $ | ||||
Certificates of deposit issued in denominations equal to or in excess of $250,000 totaled $375.9 million and $103.7 million as of December 31, 2023 and December 31, 2022, respectively.
Deposits received from related parties as of December 31, 2023 and December 31, 2022 totaled $4.2 million and $6.8 million, respectively.
(9)Junior Subordinated Debentures
As part of the acquisition of Washington Banking Company on May 1, 2014, the Company assumed trust preferred securities and junior subordinated debentures with a total fair value of $18.9 million at the merger date. At December 31, 2023 and December 31, 2022, the balance of the junior subordinated debentures, net of unaccreted discount, was $21.8 million and $21.5 million, respectively.
76
Washington Banking Master Trust, a Delaware statutory business trust, was a wholly owned subsidiary of the Washington Banking Company created for the exclusive purposes of issuing and selling capital securities and utilizing sale proceeds to acquire junior subordinated debentures issued by the Washington Banking Company. During 2007, the Trust issued $25.0 million of trust preferred securities with a 30 -year maturity, callable after the fifth year. The trust preferred securities have a quarterly adjustable rate based upon the three-month SOFR plus 1.56 %. On the merger date, the Company acquired the Trust, which retained the Washington Banking Master Trust name, and assumed the performance and observance of the covenants under the indenture related to the trust preferred securities.
The adjustable rate of the trust preferred securities at December 31, 2023 and December 31, 2022 was 7.23 % and 6.33 %, respectively.
The junior subordinated debentures are the sole assets of the Trust and payments under the junior subordinated debentures are the sole revenues of the Trust. All the common securities of the Trust are owned by the Company. The Company has fully and unconditionally guaranteed the capital securities along with all obligations of the Trust under the trust agreements. For financial reporting purposes, the Company's investment in the Master Trust is accounted for under the equity method and is included in "Prepaid expenses and other assets" on the Consolidated Statements of Financial Condition. The junior subordinated debentures issued and guaranteed by the Company and held by the Master Trust are reflected as "Junior subordinated debentures" on the Consolidated Statements of Financial Condition. As of December 31, 2023, the junior subordinated debentures qualified as tier 1 capital of the Parent Company under the FRB's capital adequacy guidelines.
(10)Securities Sold Under Agreement to Repurchase
The Company has utilized securities sold under agreement to repurchase with one day maturities as a supplement to funding sources in the past. Securities sold under agreement to repurchase were secured by pledged investment securities. Under the securities sold under agreement to repurchase, the Company was required to maintain an aggregate market value of securities pledged greater than the balance of the securities sold under agreement to repurchase. The Company was required to pledge additional securities to cover any declines below the balance of the securities sold under agreement to repurchase. The Company discontinued utilizing these instruments during the year ended December 31, 2023.
The following table presents the balance of the Company's securities sold under agreement to repurchase obligations by class of collateral pledged at the date indicated:
| December 31, 2023 | December 31, 2022 | ||||||||||
| (Dollars in thousands) | |||||||||||
| Commercial CMO and MBS | $ | $ | |||||||||
| Total | $ | $ | |||||||||
(11)Other Borrowings
(a) FHLB
The FHLB functions as a member-owned cooperative providing credit for member financial institutions. Advances are made pursuant to several different programs. Each credit program has its own interest rate and range of maturities. Limitations on the amount of advances are based on a percentage of the Bank's assets or on the FHLB’s assessment of the institution’s creditworthiness. At December 31, 2023, the Bank maintained a credit facility with the FHLB with available borrowing capacity of $1.42 billion. At December 31, 2023 and December 31, 2022 the Bank had no
Advances from the FHLB may be collateralized by FHLB stock owned by the Bank, deposits at the FHLB, certain commercial and residential real estate loans, investment securities or other assets. In accordance with the pledge agreement, the Company must maintain unencumbered collateral in an amount equal to varying percentages ranging from 100 % to 160 % of outstanding advances depending on the type of collateral.
(b) FRB
The Bank maintains a credit facility with the FRB through both the Discount Window and BTFP with available borrowing capacity of $819.5 million as of December 31, 2023. The Bank had $500.0 million in BTFP borrowings outstanding at December 31, 2023. The BTFP offers loans of up to one year in length to institutions pledging eligible investment securities. The advance rate on the collateral is at par value. The average rate on borrowings from the BTFP was 4.74 %. The Bank had no FRB borrowings outstanding at December 31, 2022. All advances are currently secured by investment securities. Any advances on the credit facility would be secured by either investment securities or certain types of the Bank's loans receivable.
(c) Federal Funds Purchased
The Bank maintains advance lines with four correspondent banks to purchase federal funds totaling $145.0 million as of December 31, 2023. The lines generally mature annually or renewed annually. As of December 31, 2023 and December 31, 2022, there were no
77
(d) Related Party Borrowings
The Company did no
(12)Leases
The Company's noncancelable operating lease agreements relate to certain banking offices, back-office operational facilities, office equipment and sublease agreements. The majority of the leases contain renewal options and provisions for increases in rental rates based on an agreed upon index or predetermined escalation schedule. As of December 31, 2023 and December 31, 2022, the Company’s operating lease ROU asset was $23.6 million and $22.7 million, respectively, and is included in "" on the Consolidated Statements of Financial Condition. The related operating lease ROU liability was $25.5 million and $24.4 million, respectively and is included in "" on the Consolidated Statements of Financial Condition. In addition, the Company has one operating sublease agreement in which the Company is the intermediate lessor. The operating sublease is for five years with rental increases on a predetermined escalation schedule with a projected future cash flow of $1.7 million. The Company does not have any leases designated as finance leases.
The table below summarizes the information about our leases during the periods or at period end presented:
| Year Ended December 31, | |||||||||||
| 2023 | 2022 | ||||||||||
| (Dollars in thousands) | |||||||||||
| Operating lease cost | $ | $ | |||||||||
| Short-term lease cost | |||||||||||
| Variable lease cost | |||||||||||
| Sublease income | ( | ( | |||||||||
| Total net lease cost during the period | $ | $ | |||||||||
| Operating cash used for amounts included in the measurement of lease liabilities during the period | $ | $ | |||||||||
| ROU assets obtained in exchange for lease liabilities during the period | |||||||||||
| Weighted average remaining lease term of operating leases, in years, at period end | |||||||||||
| Weighted average discount rate of operating leases, at period end | % | % | |||||||||
The following table presents the lease payment obligations as of December 31, 2023 as outlined in the Company’s lease agreements for each of the next five years and thereafter, in thousands:
| 2024 | $ | ||||
| 2025 | |||||
| 2026 | |||||
| 2027 | |||||
| 2028 | |||||
| Thereafter | |||||
| Total lease payments | |||||
| Implied interest | ( | ||||
| ROU liability | $ | ||||
(13)Employee Benefit Plans
(a) 401(k) Plan
The Company provides its eligible employees with a Plan, including funding certain Plan costs as incurred. All employees may participate in the Plan commencing with the first of the month following the start of employment or concurrent to their hire date if starting the first of the month. Participants may contribute a portion of their salary, which is matched by the Company at 50 %, not to be greater than 3 % of eligible compensation, up to Internal Revenue Service limits. All participants are 100 % vested in all accounts at all times. Employer matching contributions for the years ended December 31, 2023, 2022 and 2021 were $1.9 million, $1.8 million and $1.7 million, respectively.
78
The Plan may make profit sharing and discretionary contributions which are completely discretionary. Participants are eligible for profit sharing contributions upon credit of 1,000 hours of service during the plan year, the attainment of 18 years of age and employment on the last day of the year. Employees are 100 % vested in profit sharing contributions at all times. For the years ended December 31, 2023, 2022 and 2021, the Company made no
(b) Employment Agreements
The Company has entered into contracts with certain senior officers that provide benefits under certain conditions following termination without cause or following a change in control of the Company.
(c) Deferred Compensation Plan
The Company has a Deferred Compensation Plan which provides its directors and select executive officers with the opportunity to defer current compensation. The Company records a liability within "Accrued expenses and other liabilities" on the Consolidated Statements of Financial Condition and records the expense as "Compensation and employee benefits" on the Consolidated Statements of Income. The expense incurred for the deferred compensation for the years ended December 31, 2023, 2022, and 2021 was $409,000 , $882,000 , and $713,000 . As a result, the Company recorded a deferred compensation liability of $4.5 million and $4.3 million at December 31, 2023 and 2022.
(d) Salary Continuation Plan
In conjunction with the Company's merger with Premier Commercial Bancorp in 2018, the Company assumed an unfunded deferred compensation plan for select former Premier Commercial executive officers, some of which are current Company officers. The following table presents a summary of the changes in the salary continuation plan during the periods indicated:
| Year Ended December 31, | |||||||||||||||||
| 2023 | 2022 | 2021 | |||||||||||||||
| (Dollars in thousands) | |||||||||||||||||
| Obligation, at the beginning of the year | $ | $ | $ | ||||||||||||||
| Benefits paid | ( | ( | ( | ||||||||||||||
| Expenses incurred | |||||||||||||||||
| Obligation, at the end of the year | $ | $ | $ | ||||||||||||||
(14)Stockholders’ Equity
(a) Earnings Per Common Share
The following table illustrates the calculation of weighted average shares used for earnings per common share computations for the periods indicated:
| Year Ended December 31, | |||||||||||||||||
| 2023 | 2022 | 2021 | |||||||||||||||
| (Dollars in thousands, except shares) | |||||||||||||||||
| Net income allocated to common shareholders | $ | $ | $ | ||||||||||||||
| Basic: | |||||||||||||||||
| Weighted average common shares outstanding | |||||||||||||||||
| Diluted: | |||||||||||||||||
| Basic weighted average common shares outstanding | |||||||||||||||||
Effect of potentially dilutive common shares(1) | |||||||||||||||||
| Total diluted weighted average common shares outstanding | |||||||||||||||||
Potentially dilutive shares that were excluded from the computation of diluted earnings per share because to do so would be anti-dilutive(2) | |||||||||||||||||
(1) Represents the effect of the vesting of restricted stock units.
(2) Anti-dilution occurs when the unrecognized compensation cost per share of a restricted stock unit exceeds the market price of the Company’s stock.
(b) Dividends
The timing and amount of cash dividends paid on the Company's common stock depends on the Company’s earnings, capital requirements, financial condition and other relevant factors. Dividends on common stock from the Company depend substantially upon receipt of dividends from the Bank, which is the Company’s predominant source of income.
79
The following table summarizes the dividend activity during the most recent three year period:
| Declared | Cash Dividend per Share | Record Date | Paid Date | |||||||||||||||||
| $ | ||||||||||||||||||||
| $ | ||||||||||||||||||||
| $ | ||||||||||||||||||||
| $ | ||||||||||||||||||||
| $ | ||||||||||||||||||||
| $ | ||||||||||||||||||||
| $ | ||||||||||||||||||||
| $ | ||||||||||||||||||||
| $ | ||||||||||||||||||||
| $ | ||||||||||||||||||||
| $ | ||||||||||||||||||||
| $ | ||||||||||||||||||||
The FDIC and the Washington State Department of Financial Institutions, Division of Banks have the authority under their supervisory powers to prohibit the payment of dividends by the Bank to the Company. Additionally, current guidance from the Federal Reserve provides, among other things, that dividends per share on the Company’s common stock generally should not exceed earnings per share, measured over the previous four fiscal quarters. Current regulations allow the Company and the Bank to pay dividends on their common stock if the Company’s or the Bank’s regulatory capital would not be reduced below the statutory capital requirements set by the Federal Reserve and the FDIC.
(c) Stock Repurchase Program
The Company has implemented stock repurchase programs since March 1999. On March 12, 2020, the Company's Board of Directors authorized the repurchase of up to 5 % of the Company's outstanding common shares, or 1,799,054 shares, under the twelfth stock repurchase plan. The number, timing and price of shares repurchased under the twelfth stock repurchase plan will depend on business and market conditions and other factors, including opportunities to deploy the Company's capital.
The following table provides total repurchased shares and average share prices under the repurchase plan for the periods indicated:
| Year Ended December 31, | |||||||||||||||||||||||
| 2023 | 2022 | 2021 | Plan Total(1) | ||||||||||||||||||||
| Twelfth Stock Repurchase Plan | |||||||||||||||||||||||
| Repurchased shares | |||||||||||||||||||||||
| Stock repurchase average share price | $ | $ | $ | $ | |||||||||||||||||||
(1)Represents total shares repurchased and average price per share paid during the duration of the repurchase plan.
In addition to the stock repurchases under a stock repurchase plan, the Company repurchases shares to pay withholding taxes on the vesting of restricted stock units. The following table provides total shares repurchased to pay withholding taxes during the periods indicated:
| Year Ended December 31, | |||||||||||||||||
| 2023 | 2022 | 2021 | |||||||||||||||
| Repurchased shares to pay withholding taxes | 10 | ||||||||||||||||
| Stock repurchase to pay withholding taxes average share price | $ | $ | $ | ||||||||||||||
(15)Fair Value Measurements
Fair value is the price that would be received to sell an asset or paid to transfer a liability (exit price) in the principal or most advantageous market for the asset or liability in an orderly transaction between market participants at the measurement date. There are three levels of inputs that may be used to measure fair values:
Level 1: Valuations for assets and liabilities traded in active exchange markets, or interest in open-end mutual funds that allow the Company to sell its ownership interest back to the fund at net asset value on a daily basis. Valuations are obtained from readily available pricing sources for market transactions involving identical assets, liabilities, or funds.
Level 2: Valuations for assets and liabilities traded in less active dealer or broker markets, such as quoted prices for similar assets or liabilities, quoted prices in markets that are not active, or valuations using methodologies with observable inputs.
Level 3: Valuations for assets and liabilities that are derived from other valuation methodologies, such as option pricing models,
80
discounted cash flow models and similar techniques using unobservable inputs, and not based on market exchange, dealer, or broker traded transactions. Level 3 valuations incorporate certain assumptions and projections in determining the fair value assigned to such assets or liabilities.
(a) Recurring and Nonrecurring Basis
The Company used the following methods and significant assumptions to measure the fair value of certain assets on a recurring and nonrecurring basis:
Investment Securities:
The fair values of all investment securities are based upon the assumptions that market participants would use in pricing the security. If available, fair values of investment securities are determined by quoted market prices (Level 1). For investment securities where quoted market prices are not available, fair values are calculated based on market prices on similar securities (Level 2). For investment securities where quoted prices or market prices of similar securities are not available, fair values are calculated by using observable and unobservable inputs such as discounted cash flows or other market indicators (Level 3). Investment security valuations are obtained from third-party pricing services.
Collateral-Dependent Loans:
Collateral-dependent loans are identified for the calculation of the ACL on loans. The fair value used to measure credit loss for this type of loan is commonly based on recent real estate appraisals which are generally obtained at least every 18 months or earlier if there are changes to risk characteristics of the underlying loan. These appraisals may utilize a single valuation approach or a combination of approaches including comparable sales and the income approach. Adjustments are routinely made in the appraisal process by independent appraisers to adjust for differences between the comparable sales and income data available. The Company also incorporates an estimate of cost to sell the collateral when the sale is probable. Such adjustments may be significant and result in a Level 3 classification of the inputs for determining fair value. Non-real estate collateral may be valued using an appraisal, net book value based on the borrower’s financial statements or aging reports, adjusted or discounted based on management’s historical knowledge, changes in market conditions from the time of the valuation and management’s expertise and knowledge of the customer and customer’s business (Level 3). Individually evaluated loans are analyzed for credit loss on a quarterly basis and the ACL on loans is adjusted as required based on the results.
Appraisals on collateral-dependent loans are performed by certified general appraisers for commercial properties or certified residential appraisers for residential properties whose qualifications and licenses have been reviewed and verified by the Company. Once received, the Company's internal appraisal department reviews and approves the assumptions and approaches utilized in the appraisal as well as the resulting fair value in comparison with independent data sources such as recent market data or industry-wide statistics.
Derivative Financial Instruments:
The Company obtains broker or dealer quotes to value its interest rate derivative contracts, which use valuation models using observable market data as of the measurement date (Level 2), and incorporates credit valuation adjustments to reflect nonperformance risk in the measurement of fair value (Level 3). Although the Company has determined that the majority of the inputs used to value its interest rate swap derivatives fall within Level 2 of the fair value hierarchy, the credit valuation adjustments associated with its derivatives utilize Level 3 inputs, such as borrower risk ratings, to evaluate the likelihood of default by itself and its counterparties. As of December 31, 2023 and December 31, 2022, the Company assessed the significance of the impact of the credit valuation adjustment on the overall valuation of its interest rate swap derivatives and determined the credit valuation adjustment was not significant to the overall valuation of its interest rate swap derivatives. As a result, the Company has classified its interest rate swap derivative valuations in Level 2 of the fair value hierarchy.
Recurring Basis
The following tables summarize the balances of assets and liabilities measured at fair value on a recurring basis at the dates indicated:
| December 31, 2023 | |||||||||||||||||||||||
| Total | Level 1 | Level 2 | Level 3 | ||||||||||||||||||||
| (Dollars in thousands) | |||||||||||||||||||||||
| Assets | |||||||||||||||||||||||
| Investment securities available for sale: | |||||||||||||||||||||||
| U.S. government and agency securities | $ | $ | $ | $ | |||||||||||||||||||
| Municipal securities | |||||||||||||||||||||||
Residential CMO and MBS(1) | |||||||||||||||||||||||
Commercial CMO and MBS(1) | |||||||||||||||||||||||
| Corporate obligations | |||||||||||||||||||||||
| Other asset-backed securities | |||||||||||||||||||||||
| Total investment securities available for sale | |||||||||||||||||||||||
| Equity security | |||||||||||||||||||||||
81
| December 31, 2023 | |||||||||||||||||||||||
| Total | Level 1 | Level 2 | Level 3 | ||||||||||||||||||||
| (Dollars in thousands) | |||||||||||||||||||||||
| Derivative assets - interest rate swaps | |||||||||||||||||||||||
| Liabilities | |||||||||||||||||||||||
| Derivative liabilities - interest rate swaps | $ | $ | $ | $ | |||||||||||||||||||
(1) U.S. government agency and government-sponsored enterprise CMO and MBS.
| December 31, 2022 | |||||||||||||||||||||||
| Total | Level 1 | Level 2 | Level 3 | ||||||||||||||||||||
| (Dollars in thousands) | |||||||||||||||||||||||
| Assets | |||||||||||||||||||||||
| Investment securities available for sale: | |||||||||||||||||||||||
| U.S. government and agency securities | $ | $ | $ | $ | |||||||||||||||||||
| Municipal securities | |||||||||||||||||||||||
Residential CMO and MBS(1) | |||||||||||||||||||||||
Commercial CMO and MBS(1) | |||||||||||||||||||||||
| Corporate obligations | |||||||||||||||||||||||
| Other asset-backed securities | |||||||||||||||||||||||
| Total investment securities available for sale | |||||||||||||||||||||||
| Equity security | |||||||||||||||||||||||
| Derivative assets - interest rate swaps | |||||||||||||||||||||||
| Liabilities | |||||||||||||||||||||||
| Derivative liabilities - interest rate swaps | $ | $ | $ | $ | |||||||||||||||||||
(1) U.S. government agency and government-sponsored enterprise CMO and MBS.
Nonrecurring Basis
The Company may be required to measure certain financial assets and liabilities at fair value on a nonrecurring basis. These adjustments to fair value usually result from application of lower-of-cost-or-market accounting or write-downs of individual assets. The following tables presents assets measured at fair value on a nonrecurring basis at the dates indicated:
| Fair Value at December 31, 2023 | |||||||||||||||||||||||
| Total | Level 1 | Level 2 | Level 3 | ||||||||||||||||||||
| Collateral-dependent loans: | |||||||||||||||||||||||
| Commercial business: | |||||||||||||||||||||||
| Owner-occupied CRE | $ | $ | $ | $ | |||||||||||||||||||
| Total assets measured at fair value on a nonrecurring basis | $ | $ | $ | $ | |||||||||||||||||||
| Fair Value at December 31, 2022 | |||||||||||||||||||||||
| Total | Level 1 | Level 2 | Level 3 | ||||||||||||||||||||
| Collateral-dependent loans: | |||||||||||||||||||||||
| Commercial business: | |||||||||||||||||||||||
| Owner-occupied CRE | $ | $ | $ | $ | |||||||||||||||||||
| Total assets measured at fair value on a nonrecurring basis | $ | $ | $ | $ | |||||||||||||||||||
82
The following tables present quantitative information about Level 3 fair value measurements for financial instruments measured at fair value on a non-recurring basis at the dates indicated:
| December 31, 2023 | |||||||||||||||||||||||||||||
| Fair Value | Valuation Technique(s) | Unobservable Input(s) | Range of Inputs | Weighted Average(1) | |||||||||||||||||||||||||
| (Dollars in thousands) | |||||||||||||||||||||||||||||
| Collateral-dependent loans | $ | Market approach | Adjustments to reflect current conditions and selling costs | ||||||||||||||||||||||||||
(1) Weighted by net discount to net appraisal fair value
| December 31, 2022 | |||||||||||||||||||||||||||||
| Fair Value | Valuation Technique(s) | Unobservable Input(s) | Range of Inputs | Weighted Average(1) | |||||||||||||||||||||||||
| (Dollars in thousands) | |||||||||||||||||||||||||||||
| Collateral-dependent loans | $ | Market approach | Adjustments to reflect current conditions and selling costs | ||||||||||||||||||||||||||
(b) Fair Value of Financial Instruments
Broadly traded markets do not exist for most of the Company’s financial instruments; therefore, the fair value calculations attempt to incorporate the effect of current market conditions at a specific time. These determinations are subjective in nature, involve uncertainties and matters of significant judgment and do not include tax ramifications; therefore, the results cannot be determined with precision, substantiated by comparison to independent markets and may not be realized in an actual sale or immediate settlement of the instruments. There may be inherent weaknesses in any calculation technique and changes in the underlying assumptions used, including discount rates and estimates of future cash flows, could significantly affect the results. For all these reasons, the aggregation of the fair value calculations presented herein do not represent, and should not be construed to represent, the underlying value of the Company.
The following tables present the carrying value amount of the Company’s financial instruments and their corresponding estimated fair values at the dates indicated:
| December 31, 2023 | |||||||||||||||||||||||||||||
| Carrying Value | Fair Value | Fair Value Measurements Using: | |||||||||||||||||||||||||||
| Level 1 | Level 2 | Level 3 | |||||||||||||||||||||||||||
| (Dollars in thousands) | |||||||||||||||||||||||||||||
| Financial Assets: | |||||||||||||||||||||||||||||
| Cash and cash equivalents | $ | $ | $ | $ | $ | ||||||||||||||||||||||||
| Investment securities available for sale | |||||||||||||||||||||||||||||
| Investment securities held to maturity | |||||||||||||||||||||||||||||
| Loans receivable, net | |||||||||||||||||||||||||||||
| Accrued interest receivable | |||||||||||||||||||||||||||||
| Derivative assets - interest rate swaps | |||||||||||||||||||||||||||||
| Equity security | |||||||||||||||||||||||||||||
| Financial Liabilities: | |||||||||||||||||||||||||||||
| Non-maturity deposits | $ | $ | $ | $ | $ | ||||||||||||||||||||||||
| Certificates of deposit | |||||||||||||||||||||||||||||
| Borrowings | |||||||||||||||||||||||||||||
| Junior subordinated debentures | |||||||||||||||||||||||||||||
| Accrued interest payable | |||||||||||||||||||||||||||||
| Derivative liabilities - interest rate swaps | |||||||||||||||||||||||||||||
83
| December 31, 2022 | |||||||||||||||||||||||||||||
| Carrying Value | Fair Value | Fair Value Measurements Using: | |||||||||||||||||||||||||||
| Level 1 | Level 2 | Level 3 | |||||||||||||||||||||||||||
| (Dollars in thousands) | |||||||||||||||||||||||||||||
| Financial Assets: | |||||||||||||||||||||||||||||
| Cash and cash equivalents | $ | $ | $ | $ | $ | ||||||||||||||||||||||||
| Investment securities available for sale | |||||||||||||||||||||||||||||
| Investment securities held to maturity | |||||||||||||||||||||||||||||
| Loans receivable, net | |||||||||||||||||||||||||||||
| Accrued interest receivable | |||||||||||||||||||||||||||||
| Derivative assets - interest rate swaps | |||||||||||||||||||||||||||||
| Equity security | |||||||||||||||||||||||||||||
| Financial Liabilities: | |||||||||||||||||||||||||||||
| Non-maturity deposits | $ | $ | $ | $ | $ | ||||||||||||||||||||||||
| Certificates of deposit | |||||||||||||||||||||||||||||
| Securities sold under agreement to repurchase | |||||||||||||||||||||||||||||
| Junior subordinated debentures | |||||||||||||||||||||||||||||
| Accrued interest payable | |||||||||||||||||||||||||||||
| Derivative liabilities - interest rate swaps | |||||||||||||||||||||||||||||
(16)Stock-Based Compensation
On May 3, 2023, based upon the recommendation of the Compensation Committee, the Company's shareholders approved the Heritage Financial Corporation 2023 Omnibus Equity Plan, or "Equity Plan", that provides for the issuance of 1,250,000 shares of the Company's common stock in the form of various types of stock-based compensation. As of December 31, 2023, there were 1,200,714 shares available for future issuance under the Equity Plan. The Equity Plan replaces the Heritage Financial Corporation 2014 Omnibus Equity Plan (the "2014 Plan"). All remaining shares available for future issuance under the 2014 Plan were terminated upon approval of the Equity Plan. All shares issued under the 2014 Plan remain outstanding and are governed by the 2014 Plan.
(a) Restricted Stock Units
Restricted stock units generally vest ratably over three years , participate in dividends and are subject to service conditions in accordance with each award agreement.
Performance-based restricted stock units have a three-year cliff vesting schedule, participate in dividends and are additionally subject to performance-based vesting. The conditions of the grants allow for an actual payout ranging between no payout and 150 % of target. The payout level is calculated based on the percentile level of the market condition, which includes the ratio of the Company's total shareholder return and the ratio of the Company's return on average assets and return on tangible common equity over the performance period in relation to the performance of these metrics of a predetermined peer group. The fair value of each performance-based restricted stock unit, inclusive of the market condition, was determined using a Monte Carlo simulation and will be recognized over the vesting period. The Monte-Carlo simulation model uses the same input assumptions as the Black-Scholes model; however, it also further incorporates into the fair value determination the possibility the market condition may not be satisfied. Compensation costs related to these awards are recognized regardless of whether the market condition is satisfied, provided the requisite service has been provided.
The Company used the following assumptions to estimate the fair value of performance-based restricted share units granted for the periods indicated:
| Year Ended December 31, | |||||||||||||||||
| 2023 | 2022 | 2021 | |||||||||||||||
| Shares issued | |||||||||||||||||
| Expected Term in Years | |||||||||||||||||
| Weighted-Average Risk Free Interest Rate | % | % | % | ||||||||||||||
| Weighted Average Fair Value | |||||||||||||||||
| Range of peer company volatilities | |||||||||||||||||
| Company volatility | % | % | % | ||||||||||||||
84
Expected volatilities in the model were estimated using a historical period consistent with the performance period of approximately three years . The risk-free interest rate was based on the United States Treasury rate for a term commensurate with the expected life of the grant.
For the years ended December 31, 2023, 2022 and 2021, the Company recognized compensation expense related to restricted stock units of $4.3 million, $3.8 million, and $3.7 million respectively, and a related tax benefit of $949,000 , $833,000 , and $802,000 , respectively. As of December 31, 2023, the total unrecognized compensation expense related to non-vested restricted stock units was $6.8 million and the related weighted-average period over which the compensation expense is expected to be recognized was approximately 2.1 years. The vesting date fair value of the restricted stock units that vested during the years ended December 31, 2023, 2022 and 2021 was $3.5 million, $3.3 million and $3.6 million, respectively.
The following table summarizes the unit activity for the periods indicated:
| Units | Weighted-Average Grant Date Fair Value | ||||||||||
Nonvested at December 31, 2020 | $ | ||||||||||
| Granted | |||||||||||
| Vested | ( | ||||||||||
| Forfeited | ( | ||||||||||
Nonvested at December 31, 2021 | |||||||||||
| Granted | |||||||||||
| Vested | ( | ||||||||||
| Forfeited | ( | ||||||||||
Nonvested at December 31, 2022 | |||||||||||
| Granted | |||||||||||
| Vested | ( | ||||||||||
| Forfeited | ( | ||||||||||
Nonvested at December 31, 2023 | $ | ||||||||||
(17)Cash Restriction
The Company had no cash restrictions at December 31, 2023 and December 31, 2022.
(18)Income Taxes
Income tax expense is substantially due to Federal income taxes as the provision for the state of Oregon income taxes is insignificant and the state of Washington does not charge an income tax in lieu of a business and occupation tax. Income tax expense consisted of the following for the periods indicated:
| Year Ended December 31, | |||||||||||||||||
| 2023 | 2022 | 2021 | |||||||||||||||
| (Dollars in thousands) | |||||||||||||||||
| Current tax expense | $ | $ | $ | ||||||||||||||
| Deferred tax expense (benefit) | ( | ||||||||||||||||
| Income tax expense | $ | $ | $ | ||||||||||||||
The effective tax rate was 15.3 % for the December 31, 2023 compared to an effective tax rate of 17.7 % and 18.6 % for the years ended December 31, 2022 and 2021, respectively. The decrease in the effective tax rate during the year ended December 31, 2023 was due primarily to the change in income before income taxes earned between the periods, including a decrease in annual pre-tax income for the year ended December 31, 2023 which increased the impact of favorable permanent tax items such as tax-exempt investments, investments in bank owned life insurance and low-income housing and solar tax credits.
85
The following table presents the reconciliation of income taxes computed at the Federal statutory income tax rate of 21 % to the actual effective rate for the periods indicated:
| Year Ended December 31, | |||||||||||||||||
| 2023 | 2022 | 2021 | |||||||||||||||
| (Dollars in thousands) | |||||||||||||||||
| Income tax expense at Federal statutory rate | $ | $ | $ | ||||||||||||||
| State tax, net of Federal tax benefit | |||||||||||||||||
| Tax-exempt instruments | ( | ( | ( | ||||||||||||||
Federal tax credits and other benefits (1) | ( | ( | ( | ||||||||||||||
| Effects of BOLI | ( | ( | ( | ||||||||||||||
| Other, net | |||||||||||||||||
| Income tax expense | $ | $ | $ | ||||||||||||||
(1) Federal tax credits are provided for under the NMTC, Solar Tax Credits and LIHTC programs as described in Note (1) Description of Business, Basis of Presentation, Significant Accounting Policies and Recently Issued Accounting Pronouncements.
The following table presents major components of the deferred income tax asset (liability) resulting from differences between financial reporting and tax basis at the dates indicated:
| December 31, 2023 | December 31, 2022 | ||||||||||
| (Dollars in thousands) | |||||||||||
| Deferred tax assets: | |||||||||||
| Allowance for credit losses | $ | $ | |||||||||
| Accrued compensation | |||||||||||
| Stock compensation | |||||||||||
| Market discount on acquired loans | |||||||||||
| Foregone interest on nonaccrual loans | |||||||||||
| Net operating loss carryforward acquired | |||||||||||
| ROU lease liability | |||||||||||
| Net unrealized losses on investment securities | |||||||||||
Tax Credit Carryforward | |||||||||||
| Other deferred tax assets | |||||||||||
| Total deferred tax assets | |||||||||||
| Deferred tax liabilities: | |||||||||||
| Deferred loan fees, net | ( | ( | |||||||||
| Premises and equipment | ( | ( | |||||||||
| FHLB stock | ( | ( | |||||||||
| Goodwill and other intangible assets | ( | ( | |||||||||
| Junior subordinated debentures | ( | ( | |||||||||
| ROU lease asset | ( | ( | |||||||||
| Other deferred tax liabilities | ( | ( | |||||||||
| Total deferred tax liabilities | ( | ( | |||||||||
| Deferred tax asset, net | $ | $ | |||||||||
In assessing the realizability of deferred tax assets, management considers whether it is more likely than not that some portion or all of the deferred tax assets will not be realized. A valuation allowance is required to be recognized for the portion of the deferred tax asset that will not be realized. The ultimate realization of deferred tax assets is dependent upon the generation of future taxable income during the periods in which those temporary differences become deductible. As of December 31, 2023, based upon the level of historical taxable income and projections for future taxable income over the periods in which the deferred tax assets are deductible, management expects to realize the benefits of these deductible differences.
At December 31, 2023 and December 31, 2022, the Company had a net operating loss carryforward of $691,000 and $789,000 , respectively, that does not expire. The Company is limited to the amount of the net operating loss carryforward that it can deduct each year under Section 382 of the Internal Revenue Code. Due to sufficient earnings history and other positive evidence, management has no
86
Due to sufficient earnings history and other positive evidence, management has not recorded a valuation allowance on the tax credit carryforward as of December 31, 2023.
As of December 31, 2023 and December 31, 2022, the Company had an insignificant amount of unrecognized tax benefits, none of which would materially affect its effective tax rate if recognized. The Company does not anticipate that the amount of unrecognized tax benefits will significantly increase or decrease in the next 12 months. The amount of interest and penalties accrued as of December 31, 2023 and December 31, 2022 and recognized during the years ended December 31, 2023, 2022 and 2021 were immaterial.
The Company has qualified under provisions of the Internal Revenue Code to compute income taxes after deductions of additions to the bad debt reserves when it was registered as a Savings Bank. At December 31, 2023, the Company had a taxable temporary difference of approximately $2.8 million that arose before 1988 (base-year amount). In accordance with FASB ASC 740, an estimated deferred tax liability of $588,000 has not been recognized for the temporary difference. Management does not expect this temporary difference to reverse in the foreseeable future.
The Company and its Bank subsidiary file a United States consolidated federal income tax return, Oregon State and local income tax returns, and Idaho State tax return. The tax years subject to examination by the Internal Revenue Service are the years ended December 31, 2023, 2022, 2021 and 2020.
(19)Commitments and Contingencies
(a) Commitments to Extend Credit
In the ordinary course of business, the Company may enter into various types of transactions that include commitments to extend credit that are not included in its Consolidated Financial Statements. The Company applies the same credit standards to these commitments as it uses in all its lending activities and has included these commitments in its lending risk evaluations. The majority of the commitments presented below are variable rate. Loan commitments can be either revolving or non-revolving. The Company’s exposure to credit and market risk under commitments to extend credit is represented by the amount of these commitments.
The following table presents outstanding commitments to extend credit, including letters of credit, at the dates indicated:
| December 31, 2023 | December 31, 2022 | ||||||||||
| (Dollars in thousands) | |||||||||||
| Commercial business: | |||||||||||
| Commercial and industrial | $ | $ | |||||||||
| Owner-occupied CRE | |||||||||||
| Non-owner occupied CRE | |||||||||||
| Total commercial business | |||||||||||
| Real estate construction and land development: | |||||||||||
| Residential | |||||||||||
Commercial and multifamily | |||||||||||
| Total real estate construction and land development | |||||||||||
| Consumer | |||||||||||
| Total outstanding commitments | $ | $ | |||||||||
(b) Variable Interests - LIHTC Investments
The carrying values of investments in unconsolidated LIHTCs were $206.8 million and $191.3 million as of December 31, 2023 and December 31, 2022, respectively. During the years ended December 31, 2023, 2022 and 2021 the Company recognized tax benefits of $19.6 million, $12.9 million and $11.4 million, respectively, and proportional amortization of $20.9 million, $10.9 million and $9.7 million, respectively.
Total unfunded contingent commitments related to the Company’s LIHTC investments totaled $107.9 million and $109.2 million at December 31, 2023 and December 31, 2022, respectively. The Company expects to fund LIHTC commitments totaling $29.5 million during the year ending December 31, 2024 and $62.6 million during the year ending December 31, 2025, with the remaining commitments of $15.9 million to be funded by December 31, 2041. There were no
(c) Variable Interests - NMTC Investments
The Company dissolved the NMTC investment during the year ended December 31, 2021 after gross tax credits related to the Company's certified development entities totaling $9.8 million were utilized during the seven year period ended December 31, 2020. The equity method balance of the NMTC investment was $25.2 million at December 31, 2020. The Company recognized related investment income of $247,000 during the year ended December 31, 2021.
87
(20)Regulatory Capital Requirements
The Company is a bank holding company under the supervision of the Federal Reserve Bank. Bank holding companies are subject to capital adequacy requirements of the Federal Reserve under the Bank Holding Company Act of 1956, as amended, and the regulations of the Federal Reserve. The Bank is a federally insured institution and thereby is subject to the capital requirements established by the FDIC. The Federal Reserve capital requirements generally parallel the FDIC requirements. Failure to meet minimum capital requirements can initiate certain mandatory, and possibly additional discretionary, actions by regulators that, if undertaken, could have a direct material effect on the Consolidated Financial Statements and operations. Management believes as of December 31, 2023, the Company and the Bank meet all capital adequacy requirements to which they are subject.
As of December 31, 2023 and December 31, 2022, the most recent regulatory notifications categorized the Bank as well-capitalized under the regulatory framework for prompt corrective action. There are no conditions or events since that notification that management believes have changed the Bank's categories. The following table presents the actual capital ratios of the Company and the Bank at the dates indicated:
| Company | Heritage Bank | ||||||||||||||||||||||
| December 31, 2023 | December 31, 2022 | December 31, 2023 | December 31, 2022 | ||||||||||||||||||||
| Common equity Tier 1 capital ratio | % | % | % | % | |||||||||||||||||||
| Leverage ratio | |||||||||||||||||||||||
| Tier 1 capital ratio | |||||||||||||||||||||||
| Total capital ratio | |||||||||||||||||||||||
| Capital conservation buffer | |||||||||||||||||||||||
As of December 31, 2023 and 2022, the capital measures reflect the revised CECL capital transition provisions adopted by the Federal Reserve and the FDIC that allowed the Bank the option to delay for two years until December 31, 2021 an estimate of CECL’s effect on regulatory capital, relative to the incurred loss methodology’s effect on regulatory capital, followed by a three-year transition period.
(21)Heritage Financial Corporation (Parent Company Only)
Following are the condensed financial statements of the Parent Company.
HERITAGE FINANCIAL CORPORATION
(PARENT COMPANY ONLY)
Condensed Statements of Financial Condition
| December 31, 2023 | December 31, 2022 | ||||||||||
| (Dollars in thousands) | |||||||||||
| ASSETS | |||||||||||
| Cash and cash equivalents | $ | $ | |||||||||
| Investment in subsidiary bank | |||||||||||
| Other assets | |||||||||||
| Total assets | $ | $ | |||||||||
| LIABILITIES AND STOCKHOLDERS’ EQUITY | |||||||||||
| Junior subordinated debentures | $ | $ | |||||||||
| Other liabilities | |||||||||||
| Total stockholders’ equity | |||||||||||
| Total liabilities and stockholders’ equity | $ | $ | |||||||||
88
HERITAGE FINANCIAL CORPORATION
(PARENT COMPANY ONLY)
Condensed Statements of Income
| Year Ended December 31, | |||||||||||||||||
| 2023 | 2022 | 2021 | |||||||||||||||
| (Dollars in thousands) | |||||||||||||||||
| INTEREST INCOME: | |||||||||||||||||
| Interest on interest earning deposits | $ | $ | $ | ||||||||||||||
| INTEREST EXPENSE: | |||||||||||||||||
| Junior subordinated debentures | |||||||||||||||||
| Net interest expense | ( | ( | ( | ||||||||||||||
| NONINTEREST INCOME: | |||||||||||||||||
| Dividends from subsidiary bank | |||||||||||||||||
| Equity in undistributed income of subsidiary bank | |||||||||||||||||
| Other income | |||||||||||||||||
| Total noninterest income | |||||||||||||||||
| NONINTEREST EXPENSE: | |||||||||||||||||
| Professional services | |||||||||||||||||
| Other expense | |||||||||||||||||
| Total noninterest expense | |||||||||||||||||
| Income before income taxes | |||||||||||||||||
| Income tax benefit | ( | ( | ( | ||||||||||||||
| Net income | $ | $ | $ | ||||||||||||||
HERITAGE FINANCIAL CORPORATION
(PARENT COMPANY ONLY)
Condensed Statements of Cash Flows
| Year Ended December 31, | |||||||||||||||||
| 2023 | 2022 | 2021 | |||||||||||||||
| (Dollars in thousands) | |||||||||||||||||
| Cash flows from operating activities: | |||||||||||||||||
| Net income | $ | $ | $ | ||||||||||||||
| Adjustments to reconcile net income to net cash provided by operating activities: | |||||||||||||||||
| Equity in undistributed income of subsidiary bank | ( | ( | ( | ||||||||||||||
| Stock-based compensation expense | |||||||||||||||||
| Net change in other assets and other liabilities | ( | ( | |||||||||||||||
| Net cash provided by operating activities | |||||||||||||||||
| Cash flows from financing activities: | |||||||||||||||||
| Common stock cash dividends paid | ( | ( | ( | ||||||||||||||
| Repurchase of common stock | ( | ( | ( | ||||||||||||||
| Net cash used in financing activities | ( | ( | ( | ||||||||||||||
| Net (decrease) increase in cash and cash equivalents | ( | ||||||||||||||||
| Cash and cash equivalents at the beginning of year | |||||||||||||||||
| Cash and cash equivalents at the end of year | $ | $ | $ | ||||||||||||||
89
ITEM 9. CHANGES IN AND DISAGREEMENTS WITH ACCOUNTANTS ON ACCOUNTING AND FINANCIAL DISCLOSURE
None
ITEM 9A. CONTROLS AND PROCEDURES
Disclosure Controls and Procedures
Our disclosure controls and procedures are designed to ensure that information the Company must disclose in its reports filed or submitted under the Exchange Act, is recorded, processed, summarized, and reported on a timely basis. Our management has evaluated, with the participation and under the supervision of our Chief Executive Officer and Chief Financial Officer, the effectiveness of our disclosure controls and procedures (as defined in Rules 13a-15(e) and 15d-15(e) of the Exchange Act) as of the end of the period covered by this report. Based on this evaluation, our Chief Executive Officer and Chief Financial Officer have concluded that, as of such date, the Company’s disclosure controls and procedures are effective in ensuring that information relating to the Company, including its consolidated subsidiaries, required to be disclosed in reports that it files under the Exchange Act is (1) recorded, processed, summarized and reported within the time periods specified in the SEC’s rules and forms, and (2) accumulated and communicated to our management, including our Chief Executive Officer and Chief Financial Officer, as appropriate to allow timely decisions regarding required disclosure.
Internal Control Over Financial Reporting
(a) Management’s report on internal control over financial reporting
The Company’s management is responsible for establishing and maintaining adequate internal control over financial reporting. The Company’s internal control system is designed to provide reasonable assurance to our management and the Board of Directors regarding the preparation and fair presentation of published financial statements. Nonetheless, all internal control systems, no matter how well designed, have inherent limitations. Even systems determined to be effective as of a particular date can provide only reasonable assurance with respect to financial statement preparation and presentation and may not eliminate the need for restatements.
The Company’s management assessed the effectiveness of the Company’s internal control over financial reporting as of December 31, 2023. In making this assessment, management used the criteria set forth by the Committee of Sponsoring Organizations of the Treadway Commission in the 2013 Internal Control—Integrated Framework. Based on our assessment, we believe that, as of December 31, 2023, the Company’s internal control over financial reporting is effective based on these criteria.
Crowe LLP, an independent registered public accounting firm, has audited the effectiveness of our internal control over financial reporting as of December 31, 2023, and their report is included in Item 8. Financial Statements And Supplementary Data.
(b) Attestation report of the registered public accounting firm.
See Item 8. Financial Statements And Supplementary Data.
(c) Changes in internal control over financial reporting.
There were no significant changes in the Company’s internal control over financial reporting during the fourth quarter of the period covered by this Form 10-K that materially affected, or are reasonably likely to materially affect, the Company’s internal control over financial reporting.
ITEM 9B. OTHER INFORMATION
(a) None
(b) During the three months ended December 31, 2023, there were no Rule 10b5‑1 trading arrangements (as defined in Item 408(a) of Regulation S-K) or non-Rule 10b5-1 trading arrangements (as defined in Item 408(c) of Regulation S-K) adopted or terminated by any director or officer (as defined in Rule 16a‑1(f) under the Exchange Act)
ITEM 9C. DISCLOSURE REGARDING FOREIGN JURISDICTIONS THAT PREVENT INSPECTIONS
Not applicable
PART III
ITEM 10. DIRECTORS, EXECUTIVE OFFICERS AND CORPORATE GOVERNANCE
Information concerning directors of the registrant is incorporated by reference to the section entitled “Proposal 1 - Election of Directors” of our Proxy Statement.
For information regarding the executive officers of the Company, see Item 1. Business—Executive Officers.
The required information with respect to compliance with Section 16(a) of the Exchange Act, “Delinquent Section 16(a) Reports” was not incorporated in the Proxy Statement as disclosure was not required.
90
The Company has adopted a written Code of Ethics that applies to our directors, officers and employees. The Code of Ethics can be accessed electronically by visiting the Company’s website at www.hf-wa.com in the section titled Overview: Governance Documents. Any changes to or waiver of our Code of Ethics will be posted on that website.
There have been no material changes to the procedures by which stockholders may recommend nominees to our Board of Directors since last disclosed to stockholders.
The Audit and Finance Committee is composed of independent directors, in accordance with the requirements for companies listed on The Nasdaq Stock Market ("Nasdaq") and applicable SEC rules for audit committee members. The members of the Audit and Finance Committee are Brian S. Charneski (Chair), Deborah J. Gavin, Trevor D. Dryer, and Jeffery S. Lyon, each of whom is deemed independent, as independence for audit committee members is defined in the listing standards of The Nasdaq Stock Market ("Nasdaq") and applicable SEC rules, have been determined by the Board to be “audit committee financial experts,” as defined by the SEC.
ITEM 11. EXECUTIVE COMPENSATION
Information concerning executive and director compensation and certain matters regarding participation in the Company’s Compensation Committee required by this item is incorporated by reference to the headings “Executive Compensation,” “Director Compensation,” “Report of the Compensation Committee,” and "CEO Pay Ratio" of the Proxy Statement.
ITEM 12. SECURITY OWNERSHIP OF CERTAIN BENEFICIAL OWNERS AND MANAGEMENT AND RELATED STOCKHOLDER MATTERS
Information concerning security ownership of certain beneficial owners and management is incorporated by reference to the section entitled “Security Ownership of Certain Beneficial Owners and Management” of the Proxy Statement.
The Company is not aware of any arrangements, including any pledge by any person of securities of the Company, the operation of which may at a subsequent date result in a change in control of the Company.
The following table summarizes the activity within the Company’s stock-based compensation plans as of December 31, 2023, all of which have been approved by shareholders:
| Plan Category | Number of securities to be issued upon vesting of restricted stock units | Weighted average exercise price of outstanding restricted stock units (1) | Number of securities remaining available for future issuance under the equity compensation plan (2) | ||||||||||||||
Equity compensation plans, all of which have been approved by security holders | 407,888 | — | 1,200,714 | ||||||||||||||
(1) Represents shares that are issuable pursuant to awards of restricted stock units for which there is no applicable exercise price.
(2) All of the securities remaining available for future issuance under the equity compensation plan are available for issuance for stock awards.
ITEM 13. CERTAIN RELATIONSHIP AND RELATED TRANSACTIONS, AND DIRECTOR INDEPENDENCE
Information concerning certain relationships and related transactions is incorporated by reference to the sections entitled “Meetings and Committees of the Board of Directors" and "Corporate Governance” of the Proxy Statement.
ITEM 14. PRINCIPAL ACCOUNTANT FEES AND SERVICES
Information concerning principal accountant fees and services is incorporated by reference to the section entitled “Proposal 3 - Ratification of the Appointment of Independent Registered Public Accounting Firm” in the Proxy Statement.
PART IV
ITEM 15. EXHIBITS AND FINANCIAL STATEMENT SCHEDULES
(a) The following documents are filed as a part of this report:
(1) Financial Statements: The Consolidated Financial Statements are included in Part II. Item 8. Financial Statements And Supplementary Data.
(2) Financial Statements Schedules: All schedules are omitted because they are not required or applicable, or the required information is shown in the Consolidated Financial Statements or Notes.
(3) Exhibits: Included in schedule below.
| Incorporated by Reference | ||||||||||||||||||||||||||
91
Exhibit No. | Description of Exhibit | Form | Exhibit | Filing Date/Period End Date | ||||||||||||||||||||||
| 3.1 | 8-K | 3.1(B) | 05/18/2010 | |||||||||||||||||||||||
| 3.2 | S-14A | - | 03/18/2011 | |||||||||||||||||||||||
| 3.3 | 8-K | 3.3 | 06/30/2020 | |||||||||||||||||||||||
| 4.1 | Form of Certificate of Company's Common Stock (3) | S-1/A | - | 10/29/1997 | ||||||||||||||||||||||
| 4.2 | ||||||||||||||||||||||||||
| 10.1* | 10-K | 10.5 | 03/09/2017 | |||||||||||||||||||||||
10.2* | 8-K | 99.2 | 02/01/2017 | |||||||||||||||||||||||
10.3* | DEF 14A | 0 | 06/11/2014 | |||||||||||||||||||||||
10.4* | 8-K | 99.4 | 02/01/2017 | |||||||||||||||||||||||
10.5* | 8-K | 99.3 | 02/01/2017 | |||||||||||||||||||||||
10.6* | DEF 14A | 4.4 | 03/22/2023 | |||||||||||||||||||||||
10.7* | S-8 | 4.5 | 05/08/2023 | |||||||||||||||||||||||
10.8* | S-8 | 4.6 | 05/08/2023 | |||||||||||||||||||||||
10.9* | 8-K | 10.1 | 07/01/2019 | |||||||||||||||||||||||
10.10* | 8-K | 10.6 | 09/07/2012 | |||||||||||||||||||||||
10.11* | 8-K | 10.2 | 12/22/2016 | |||||||||||||||||||||||
10.12* | 10-Q | 10.15 | 11/06/2019 | |||||||||||||||||||||||
10.13* | 10-Q | 10.40 | 11/08/2022 | |||||||||||||||||||||||
10.14* | 10-Q | 10.22 | 11/06/2019 | |||||||||||||||||||||||
10.15* | 8-K | 10.7 | 09/07/2012 | |||||||||||||||||||||||
10.16* | 8-K | 10.3 | 12/22/2016 | |||||||||||||||||||||||
10.17* | 10-Q | 10.16 | 11/06/2019 | |||||||||||||||||||||||
10.18* | 10-Q | 10.41 | 11/08/2022 | |||||||||||||||||||||||
10.19* | 10-Q | 10.33 | 11/06/2019 | |||||||||||||||||||||||
10.20* | 10-K | 10.16 | 03/11/2015 | |||||||||||||||||||||||
10.21* | 8-K | 10.4 | 12/22/2016 | |||||||||||||||||||||||
10.22* | 10-Q | 10.27 | 11/06/2019 | |||||||||||||||||||||||
10.23* | 10-Q | 10.42 | 11/08/2022 | |||||||||||||||||||||||
10.24* | 8-K | 10.1 | 07/06/2021 | |||||||||||||||||||||||
10.25* | ||||||||||||||||||||||||||
10.26* | 10-Q | 10.17 | 08/06/2015 | |||||||||||||||||||||||
92
10.27* | 10-Q | 10.34 | 05/09/2019 | |||||||||||||||||||||||
10.28* | 8-K | 10.1 | 06/30/2020 | |||||||||||||||||||||||
10.29* | 8-K | 10.3 | 06/30/2020 | |||||||||||||||||||||||
10.30* | 8-K | 10.43 | 11/08/2022 | |||||||||||||||||||||||
10.31* | 10-Q | 10.34 | 05/05/2021 | |||||||||||||||||||||||
| 14.0 | Code of Ethics and Conduct Policy (2) | |||||||||||||||||||||||||
| 21.0 | ||||||||||||||||||||||||||
| 23.0 | ||||||||||||||||||||||||||
| 24.0 | ||||||||||||||||||||||||||
| 31.1 | ||||||||||||||||||||||||||
| 31.2 | ||||||||||||||||||||||||||
| 32.1 | ||||||||||||||||||||||||||
| 97.0 | ||||||||||||||||||||||||||
| 101.INS | XBRL Instance Document (1) | |||||||||||||||||||||||||
| 101.SCH | XBRL Taxonomy Extension Schema Document (1) | |||||||||||||||||||||||||
| 101.CAL | XBRL Taxonomy Extension Calculation Linkbase Document (1) | |||||||||||||||||||||||||
| 101.DEF | XBRL Taxonomy Extension Definition Linkbase Document (1) | |||||||||||||||||||||||||
| 101.LAB | XBRL Taxonomy Extension Label Linkbase Document (1) | |||||||||||||||||||||||||
| 101.PRE | XBRL Taxonomy Extension Presentation Linkbase Document (1) | |||||||||||||||||||||||||
| 104 | Cover Page Interactive Data File, formatted in Inline XBRL and included in Exhibit 101 | |||||||||||||||||||||||||
*Indicates management contract or compensatory plan or arrangement.
(1) Filed herewith.
(2) Registrant elects to satisfy Regulation S-K §229.406(c) by posting its Code of Ethics on its website at www.hf-wa.com in the section titled Overview: Governance Documents.
(3) Exhibit not previously filed in electronic format.
ITEM 16. FORM 10-K SUMMARY
None.
SIGNATURES
Pursuant to the requirements of Section 13 or 15(d) of the Securities Exchange Act of 1934, the registrant has duly caused this report to be signed on its behalf by the undersigned, thereunto duly authorized, on February 27, 2024.
| HERITAGE FINANCIAL CORPORATION | ||||||||
| (Registrant) | ||||||||
| /S/ JEFFREY J. DEUEL | ||||||||
| Jeffrey J. Deuel | ||||||||
| President and Chief Executive Officer | ||||||||
93
Pursuant to the requirements of the Securities Exchange Act of 1934, this report has been signed below by the following persons on behalf of the registrant and in the capacities indicated on February 27, 2024.
| Principal Executive Officer: | ||||||||
| /S/ JEFFREY J. DEUEL | ||||||||
| Jeffrey J. Deuel | ||||||||
| President and Chief Executive Officer | ||||||||
| Principal Financial Officer: | ||||||||
| /S/ DONALD J. HINSON | ||||||||
| Donald J. Hinson | ||||||||
| Executive Vice President and Chief Financial Officer | ||||||||
| Jeffrey J. Deuel, pursuant to a power of attorney that is being filed with the Form 10-K, has signed this report as attorney in fact for the following directors who constitute a majority of the Board of Directors. | ||||||||
| Brian S. Charneski | ||||||||
| Trevor D. Dryer | ||||||||
| Kimberly T. Ellwanger | ||||||||
| Deborah J. Gavin | ||||||||
| Gail B. Giacobbe | ||||||||
| Jeffrey S. Lyon | ||||||||
| Frederick B. Rivera | ||||||||
| Brian L. Vance | ||||||||
| Ann Watson | ||||||||
| /S/ JEFFREY J. DEUEL | ||||||||
| Jeffrey J. Deuel | ||||||||
| Attorney-in-Fact | ||||||||
| February 27, 2024 | ||||||||
94