UNITED STATES
SECURITIES AND EXCHANGE COMMISSION
Washington, D.C. 20549
FORM
(Mark One)
OR
For the fiscal year ended
OR
OR
Date of event requiring this shell company report ________________
For the transition period from ________________ to ________________
Commission file number:
(Exact name of Registrant as specified in its charter)
Not Applicable
(Translation of Registrant’s name into English)
(Jurisdiction of incorporation or organization)
, REPUBLIC OF CHINA
(Address of principal executive offices)
Chief Financial Officer
Telephone: +886-
E-mail:
Facsimile:
(Name, Telephone, E-mail and/or Facsimile number and Address of Company Contact Person)
Securities registered or to be registered pursuant to Section 12(b) of the Act:
Title of each class | Trading Symbol | Name of each exchange on which registered |
The | ||
* Not for trading, but only in connection with the listing on the NASDAQ Global Select Market, Inc. of American Depositary Shares representing such Ordinary Shares.
Securities registered or to be registered pursuant to Section 12(g) of the Act: None
Securities for which there is a reporting obligation pursuant to Section 15(d) of the Act: None
Indicate the number of outstanding shares of each of the issuer’s classes of capital or common stock as of the close of the period covered by the annual report.
Indicate by check mark if the registrant is a well-known seasoned issuer, as defined in Rule 405 of the Securities Act. ⌧
If this report is an annual or transition report, indicate by check mark if the registrant is not required to file reports pursuant to Section 13 or 15(d) of the Securities Exchange Act of 1934. ☐ Yes ⌧
Indicate by check mark whether the registrant (1) has filed all reports required to be filed by Section 13 or 15(d) of the Securities Exchange Act of 1934 during the preceding 12 months (or for such shorter period that the registrant was required to file such reports), and (2) has been subject to such filing requirements for the past 90 days. ⌧
Indicate by check mark whether the registrant has submitted electronically every Interactive Data File required to be submitted pursuant to Rule 405 of Regulation S-T (§232.405 of this chapter) during the preceding 12 months (or for such shorter period that the registrant was required to submit such files). ⌧
Indicate by check mark whether the registrant is a large accelerated filer, an accelerated filer, a non-accelerated filer, or an emerging growth company. See definition of “large accelerated filer,” “accelerated filer,” and “emerging growth company” in Rule 12b-2 of the Exchange Act. (Check one):
☒ | Accelerated filer | ☐ | Non-accelerated filer | ☐ | |
Emerging growth company | |||||
If an emerging growth company that prepares its financial statements in accordance with U.S. GAAP, indicate by check mark if the registrant has elected not to use the extended transition period for complying with any new or revised financial accounting standards† provided pursuant to Section 13(a) of the Exchange Act. ☐
† The term “new or revised financial accounting standard” refers to any update issued by the Financial Accounting Standards Board to its Accounting Standards Codification after April 5, 2012.
Indicate by check mark whether the registrant has filed a report on and attestation to its management’s assessment of the effectiveness of its internal control over financial reporting under Section 404(b) of the Sarbanes-Oxley Act (15 U.S.C. 7262(b)) by the registered public accounting firm that prepared or issued its audit report.☒
If securities are registered pursuant to Section 12(b) of the Act, indicate by check mark whether the financial statements of the registrant included in the filing reflect the correction of an error to previously issued financial statements.
Indicate by check mark whether any of those error corrections are restatements that required a recovery analysis of incentive- based compensation received by any of the registrant's executive officers during the relevant recovery period pursuant to §240.10D-1(b).☐
Indicate by check mark which basis of accounting the registrant has used to prepare the financial statements included in this filing:
U.S. GAAP ☐ | Other ☐ | |
by the International Accounting Standards Board ⌧ |
If “Other” has been checked in response to the previous question, indicate by check mark which financial statement item the registrant has elected to follow. ☐ Item 17 ☐ Item 18
If this is an annual report, indicate by check mark whether the registrant is a shell company (as defined in Rule 12b-2 of the Exchange Act).
TABLE OF CONTENTS
| Page |
| |
4 | |
4 | |
7 | |
ITEM 1. IDENTITY OF DIRECTORS, SENIOR MANAGEMENT AND ADVISERS | 7 |
7 | |
7 | |
7 | |
7 | |
7 | |
7 | |
22 | |
22 | |
23 | |
54 | |
55 | |
55 | |
55 | |
55 | |
67 | |
70 | |
70 | |
73 | |
73 | |
73 | |
75 | |
76 | |
78 | |
81 | |
6.F. Disclosure of a registrant's action to recover erroneously awarded compensation | 81 |
81 | |
81 | |
82 | |
83 | |
83 | |
8.A. Consolidated Statements and Other Financial Information | 83 |
84 | |
84 | |
84 | |
85 | |
85 | |
85 | |
85 | |
85 |
2
3
SPECIAL NOTE REGARDING FORWARD-LOOKING STATEMENTS
This annual report on Form 20-F contains “forward-looking statements” within the meaning of Section 27A of the Securities Act of 1933, as amended (the “Securities Act”), and Section 21E of the Securities Exchange Act of 1934, as amended (the “Exchange Act”), that involve significant risks and uncertainties. Although these forward-looking statements, which may include statements regarding our future results of operations, financial condition, or business prospects, are based on our own information and information from other sources we believe to be reliable, you should not place undue reliance on these forward-looking statements, which apply only as of the date of this annual report. The words “anticipate,” “believe,” “expect,” “intend,” “plan,” “estimate” and similar expressions, as they relate to us, are intended to identify a number of these forward-looking statements. Our actual results of operations, financial condition or business prospects may differ materially from those expressed or implied in these forward-looking statements for a variety of reasons, including, among other things and not limited to, our anticipated growth strategies, our and our customers’ future business developments, results of operations and financial condition, our ability to develop new products, the future growth and pricing trend of the display driver markets, the future growth of end-use applications that use flat panel displays, particularly TFT-LCD panels, development of alternative flat panel display technologies, market acceptance and competitiveness of the driver and non-driver products developed by us, our ability to protect intellectual property, changes in customer relations and preference, shortage in supply of key components, our ability to collect accounts receivable and manage inventory, changes in economic and financial market conditions, and other factors. For a discussion of these risks and other factors, please see “Item 3.D. Key Information—Risk Factors.”
CERTAIN CONVENTIONS
Unless otherwise indicated, all translations from U.S. dollars to NT dollars in this annual report were made at a rate of $1.00 to NT$30.62, the exchange rates set forth in the H.10 weekly statistical release of the Federal Reserve System of the United States (the “Federal Reserve Board”) on December 29, 2023. No representation is made that the NT dollar amounts referred to herein could have been or could be converted into U.S. dollars at any particular rate or at all. On March 29, 2024, the noon buying rate was $1.00 to NT$31.93.
Unless otherwise indicated, in this annual report,
“ADSs” refers to our American depositary shares, each of which represents two ordinary shares;
“ADRs” refers to the American depositary receipts that evidence our ADSs;
“AIoT” refers to Artificial Intelligence & Internet of Things;
“AMOLED” refers to active matrix organic light-emitting diode;
“AR” refers to the augmented reality;
“ASIC” refers to application specific integrated circuit;
“a-Si” refers to amorphous silicon;
“CMOS” refers to complementary metal oxide semiconductor;
“end-point AI” is the practice of running applications and storing data on devices located at the edge of a network. The aim is to reduce latency and network bandwidth by performing processing and storage functions locally on the device. This approach can improve the performance, reliability, and security of applications and data.
“head-mounted-display” refers to a display device, worn on the head or as part of a helmet, that has a small display optic in front of one or each;
“Himax Taiwan” refers to Himax Technologies Limited, our wholly owned subsidiary in Taiwan and our predecessor;
“IC” refers to integrated circuit;
4
“IFRS” refers to The International Financial Reporting Standards as issued by the International Accounting Standards Board;
“IGZO” refers to indium gallium zinc oxide;
“Innolux” refers to Innolux Corporation, its predecessor and consolidated subsidiaries, unless the context otherwise requires;
“large-sized panels” refers to panels that are typically above ten inches in diagonal measurement; All sizes of TV, monitor and notebook displays are identified as large.
“LCoS” refers to liquid crystal on silicon;
“LED” refers to light-emitting diode;
“LTPS” refers to low temperature poly silicon;
“MEMS” refers to micro-electro mechanical systems;
“OLED” refers to organic light-emitting diode;
“Panel Manufacturer” refers to panel manufacturers of either TFT-LCD or OLED panels, as well as those that produce both types collectively;
“PRC” or “China” for purposes of this annual report refers to the People’s Republic of China, excluding the special administrative regions of Hong Kong and Macau;
“processed tape” refers to polyimide tape plated with copper foil that has a circuit formed within it, which is used in tape-automated bonding packaging;
“ROC” or “Taiwan” refers to the island of Taiwan and other areas under the effective control of the Republic of China;
“RSUs” refers to restricted share units;
“semiconductor manufacturing service providers” refers to third-party wafer fabrication foundries, gold bumping houses, and assembly and testing houses;
“shares” or “ordinary shares” refer to our ordinary shares, par value $0.3 per share;
“SLiM” refers to Structured Light Imaging Module, which is Himax homegrown structured light-based 3D sensing total solution;
“small and medium-sized panels” refers to panels that are typically around ten inches or less in diagonal measurement. All sizes of smartphone, automotive and tablet displays are identified as small and medium;
“Structured Light” refers to a 3D infrared structure light projector, which is composed of a laser light source, a collimated lens and a diffractive optics element (DOE);
“TDDI” refers to touch display driver integrated circuit for advanced in cell touch display;
“TFT-LCD” refers to thin film transistor liquid crystal display that may adopt a-Si, IGZO or LTPS technologies;
“ToF” refers to a time-of-flight (ToF) 3D camera works by illuminating the scene with a modulated light source, and observing the reflected light;
5
“Ultralow power WiseEye smart image sensing” refers to Company’s WiseEyeTM AI image sensing solution which includes Himax’s proprietary computer vision AI processor, ultralow power Always-On CMOS image sensor and CNN-based AI algorithms – all equipped with ultralow power design;
“VGA” refers to Video Graphics Array;
“VR” refers to the virtual reality;
“wafer level optics” or “WLO” are optical products manufactured using semiconductor process on wafers;
“we”, “us”, “our company”, “our”, “the Company” and “Himax” refers to Himax Technologies, Inc., its predecessor entities and subsidiaries;
“WiseEye AI Processor” refers to a Himax AI processor designed with power-efficient and multi-level power schemes for real-time motion detection, object detection and image processing, providing AI developers with possibilities of high performance and ultralow power. WiseEye1 is the first generation of WiseEye AI processor, where WiseEye2 is the second generation one.
All references to “New Taiwan dollars”, “NT dollars” and “NT$” are to the legal currency of the ROC; and
All references to “dollars”, “U.S. dollars” and “$” are to the legal currency of the United States.
On August 10, 2009, we effected: (i) a stock split in the form of a stock dividend of 5,999 ordinary shares for each ordinary share held by shareholders of record, followed by a consolidation of every 3,000 ordinary shares into one ordinary share; (ii) a change of the par value of our ordinary shares from $0.0001 each to $0.3 each; and (iii) a change in our ADS ratio from one ADS representing one ordinary share to one ADS representing two ordinary shares. See “Item 7.A. Major Shareholders and Related Party Transactions—Major Shareholders” for more information. Unless otherwise indicated, all shares, per share and share equity data in this annual report have been retroactively adjusted to reflect the effect of the stock split and the change in par value for all periods presented.
6
PART I
ITEM 1. IDENTITY OF DIRECTORS, SENIOR MANAGEMENT AND ADVISERS
Not applicable.
ITEM 2. OFFER STATISTICS AND EXPECTED TIMETABLE
Not applicable.
ITEM 3. KEY INFORMATION
3.A. [Reserved]
3.B. Capitalization and Indebtedness
Not applicable.
3.C. Reason for the Offer and Use of Proceeds
Not applicable.
3.D. Risk Factors
Risks Relating to Our Financial Condition and Business
Our suppliers may have increasing bargaining power as a result of industry consolidation, which could result in an increase in our average unit cost and a decrease in our profit margin.
There may be industry consolidation among our suppliers. Merger and acquisition activities will likely increase the size and market power of the relevant suppliers and reduce the number of suppliers we could use under a simpler supplier chain. Therefore, suppliers could be in a better position to bargain for higher prices, longer contract terms, higher deposit and/or higher contract breach penalties for their services and products, which could result in an increase in our average unit cost and/or penalty expenses. If we are unable to transfer any increase in average unit cost to our customers, our gross margin and results of operations could be adversely affected.
We derive the majority of our net revenues from sales to the TFT-LCD and OLED panel industry, which is highly cyclical and subject to price fluctuations. Such cyclicality and price fluctuations could negatively impact our business or results of operations.
In 2022 and 2023, 86.8% and 85.1% of our revenues, respectively, were attributable to display drivers that were incorporated into TFT-LCD and OLED panels. We expect to continue to substantially depend on sales to the TFT-LCD and OLED panel industry for the foreseeable future. The TFT-LCD and OLED panel industry is intensely competitive and is vulnerable to cyclical market conditions. The average selling prices of TFT-LCD and OLED panels generally decline with time as a result of, among other factors, drop in demand for end products that incorporate TFT LCD and OLED panels, new capacity ramp-up or factory utilization improvement, technological advancements and cost reduction with the exception of the new high end and high-resolution products.
The merger of certain of our major customers could result in an increase in their bargaining power and therefore subject us to additional downward pricing pressure. We cannot assure you that in such periods in which we experience significant downward pricing pressure, we could sufficiently reduce costs to completely offset the loss of revenues. In addition, a severe and prolonged industry downturn could also result in higher risks to the collectability of our accounts receivable, the marketability and valuation of inventories, the impairment of our long-term non-financial assets, which consist of property, plant and equipment and intangible assets, and the stability of our supply chain. As a result, the cyclicality of the TFT-LCD and OLED panel industry could adversely affect our revenues, cost of revenues and results of operations.
7
Our strategy of expanding our product offerings to non-driver products may not be successful.
We have devoted, and intend to continue to devote, financial and management resources to non-driver products’ development, manufacturing and marketing to further diversify our product portfolio and improve gross margin as non-driver products may have higher gross margin than our driver products. Our non-driver technologies cover Timing controller (TCON), LCoS microdisplay, CMOS image sensor, wafer level optics (“WLO”), 3D sensing and ultralow power WiseEye smart image sensing, etc.
We offer TCON for large sized TV and monitor displays, automotive display and AMOLED panels. For our LCoS technology, at present our main focus areas for LCoS business are AR goggle devices, projectors and head-up-displays (HUD) for automotive. For CMOS image sensor business, in addition to the current shipment for human vision applications, including notebook, multimedia and smart home cameras, we also extend the sensor business in machine vision application for the broad AI market. Our AoS CMOS image sensor is designed with proprietary architectures, readout, and pixel, where the corresponding algorithms are integrated to contribute the always-on feature that consumes only several micro watts to enable people detection, eyeball tracking and many other features. On 3D sensing business, we focus on Structured Light and ToF 3D module solution and 3D decoder ASIC key component, aiming at emerging markets such as facial recognition-based e-payment, business access control, biomedical inspection device, 3D naked-eye display, eye-tracking, and hand gesture control applications. For our ultralow power WiseEye smart image sensing business, we focus on providing leading end-point AI solutions, in both total solution and discrete key component, to meet diversified customer and application needs. Himax’s ultralow power WiseEye smart image sensing solution integrates in-house AoS sensor, ultralow power AI processor and CNN-based AI algorithm from in house or third-party algorithm partners. Our WiseEye AI solution had already been adopted by one global leading notebook vendor and went into mass production from early 2022. We also see growing adoption of our WiseEye technology in a broad range of applications, covering shared bike parking, automotive, door lock, battery-powered surveillance camera, panoramic video conferencing, and medical capsule endoscope among others. Some of these applications already commenced production since 2022. As we focus on scaling adoption in this relatively untapped market, we also collaborate closely with numerous AI ecosystem partners and communities as well as system integration companies to make our AI solution more diverse and accessible. Progress has been made in areas such as notebook, smart city / home / office, surveillance, healthcare, smart agriculture and smart retail. Himax is more committed than ever to strengthening the Company’s WiseEye product roadmap and retaining the leadership position in ultralow power AI processor and image sensor for end-point AI applications.
Developing and commercializing each of our non-driver products requires a significant amount of management, engineering and monetary resources. For example, we have established certain in-house facilities for key manufacturing processes of our non-driver products including LCoS microdisplay, WLO and 3D sensing. Numerous uncertainties exist in developing new products and we cannot assure you that we will be able to develop our non-driver products successfully. We may underestimate the amount of capital, personnel and other resources required to develop and commercialize our non-driver products. We may also overestimate the market potential of the end products that are utilizing or will utilize our non-driver products. The failure or delay in the development, production or commercialization of any of our non-driver products, the occurrence of any product defects or design flaws, or the low market acceptance of or demand for either of our products or the end devices using our products may adversely affect the impairment of our long-term non-financial assets, which consist of property, plant and equipment and intangible assets, for non-driver products, our results of operations and growth prospects. The lower capacity utilization rate of our factories will negatively affect our gross margin and our results of operations. Moreover, we will be subject to higher ramp-up expenses in the early stage of mass production of our non-driver products.
The concentration of our revenues and accounts receivable and the extension of payment terms for certain of our customers exposes us to increased credit risk and could harm our operating results and cash flows.
In 2023, Customer A and its affiliates accounted for 28.7% of our revenues. Our two largest customers together accounted for over 39% of our revenues in 2023. See “Item 5.A. Operating Results—Description of Certain Statements of Profit or Loss Line Items—Revenues” for our revenues description. Our results of operations and financial condition would be significantly linked to the success and purchase policy of any such customer. As of December 31, 2023, our accounts receivable from Customer A and its affiliates were $67.1 million, which represented approximately 28.5% of our accounts receivable, net. The concentration of our accounts receivable exposes us to increased credit risk. Moreover, we have at times agreed to extend the payment terms for certain of our customers. As a result, any loss of or a sharp reduction in any such customer’s sales, a default by any such customer, a prolonged delay in the payment of accounts receivable or the extension of payment terms for our customers could adversely affect our cash flow, liquidity and operating results.
8
Our customers may experience a decline in profitability or may not be profitable at all, which could adversely affect our results of operations and financial condition.
Panel Manufacturers, including our customers, experience significant pressure on prices and profit margins, due largely to growing industry capacity and fluctuations in demand for TFT-LCD and OLED panels. Some panel manufacturers have greater access to capital or greater production, research and development, intellectual property, marketing or other resources than our customers, who may not be able to compete and sustain their market positions. Further, our customers’ business performance may fluctuate significantly due to a number of factors, many of which are beyond their control, including and not limited to: (1) consumer demand and the general economic conditions, such as recent geopolitical tensions relating to invasion of Ukraine by Russia and China city lockdowns due to Covid mandates; (2) the cyclical nature of the TFT-LCD and OLED industry in average selling price fluctuations, as well as its downstream industries; (3) the speed at which Panel Manufacturers expand production capacity; (4) brand companies’ continued needs for original equipment manufacturing services provided by Panel Manufacturers; (5) access to raw materials, components, equipment and utilities on a timely and economical basis; (6) technological changes; (7) the rescheduling and cancellation of large orders; (8) access to funding on satisfactory terms; and (9) fluctuations in the currencies of TFT-LCD and OLED panels exporting countries against the U.S. dollar.
We depend on sales of display drivers used in TFT-LCD and OLED panels, and the limited potential for further growth in both the market size of display drivers and the market share of our display drivers or the absence of continued market acceptance of our display drivers could limit our growth in revenues or harm our business.
In 2022 and 2023, 86.8% and 85.1% of our revenues, respectively, were from the sale of display drivers used for large, small and medium-sized applications, and we expect to continue to derive a substantial portion of our revenues from these or related products. As the display driver industry is relatively mature, there may be limited potential for the overall display drivers market to grow and for us to further grow our market share and revenues.
Failure to grow our unit shipments for display drivers, coupled with a general decline in the average selling prices, could adversely and materially affect our results of operations. See also “—Risks Relating to Our Industry—The average selling prices of our products could decrease rapidly, which may negatively impact our revenues and operating results”. Therefore, the continued market acceptance of our display drivers is critical to our future success. Failure to grow or maintain our revenues generated from the sales of display drivers could adversely and materially affect our results of operations and financial condition.
We face risks related to public health epidemics, including the novel coronavirus outbreaks.
Our financial condition and results of operations may be adversely affected if a public health epidemic, such as the global Covid-19 pandemic, interferes with our ability, or that of our employees, suppliers, customers and other business partners to fulfill our and their respective responsibilities and obligations related to the conduct of our business. The outbreak of Covid-19 has caused significant disruption not only to the financial markets but also to global supply chains, which can substantially depress global business activities, restrict access to capital and result in a long-term economic downturn that would negatively affect our operating results.
Extra export licenses may be needed for certain product or technology for certain customers. These licenses are regulated by Export Administration Regulations (EAR) which are administered by the U.S. Department of Commerce’s Bureau of Industry and Security (BIS).
Our business is subject to various international laws and legal requirements from the U.S. Export Administration Regulations and other jurisdictions’ applicable executive orders in packaging, product content, labor and import/export regulations, etc. These laws, regulations and orders are complex, may change frequently and with limited notice, have generally become more rigorous and have intensified under the current U.S. administration, especially in recent geopolitical tensions with China. We may be required to incur significant expense to comply with, or to remedy violations of, these regulations. In addition, if our customers fail to comply with these regulations or our customers are sanctioned, or added to the Entity List of EAR by BIS, we may be required to suspend sales to these customers, which could damage our reputation and materially and adversely impact our results of operations. If our foundry, tape, assembly and testing suppliers fail to comply with these regulations or our suppliers are sanctioned or added to the Entity List of EAR by BIS, we may suspend their services and have to obtain alternative services in a timely manner. Considering the amount of time, it usually takes to qualify assembly and testing houses, we may experience significant delays in product shipments. Any problems that we may encounter with the delivery, quality or cost of our products could damage our reputation and result in a loss of customers and orders. Moreover, the scarcity and importance of services may necessitate us making investments in foundry, tape, assembly and testing service providers in order to secure capacity, which would require us to substantially increase our capital outlays and possibly raise additional capital, which may not be available to us on satisfactory terms, if at all.
9
Technological innovation may reduce the number of display drivers typically required for each panel, thereby reducing the number of display drivers we are able to sell per panel. If such a reduction in demand is not offset by the general growth of the industry, our market share or average selling prices, or our revenues may decline.
In order to reduce costs, Panel Manufacturers generally seek to have display drivers with higher channel counts and new panel designs to reduce the number of display drivers required for each panel. We have been developing such innovative and cost-effective display driver solutions in order to grow our market share, attract additional customers, increase our average selling prices and capture new design wins. However, we cannot assure you that we will successfully achieve these goals. If we fail to do so and the number of display drivers typically required per panel decreases thereby reducing our unit shipments, our revenues may decline. Panel Manufacturers have developed several panel designs to reduce the usage of display drivers, including gate in panel, or GIP, amorphous silicon gate, or ASG, or simply gateless designs, which integrate the gate driver function onto the glass and eliminate the need for gate drivers, as well as dual gate and triple gate panel designs, which would largely reduce the usage of source drivers. If such designs or technologies become widely adopted, demand for our display drivers may decrease significantly, which would adversely and materially affect our results of operations. The strategic relationships between certain of our competitors and their customers and the development of in-house capabilities by Panel Manufacturers may limit our ability to expand our customer base and our growth prospects.
Certain of our competitors have established or may establish strategic or strong relationships with Panel Manufacturers that are also our existing or potential customers. Marketing our display drivers to such Panel Manufacturers that have established relationships with our competitors may be difficult. Moreover, several Panel Manufacturers have in-house design capabilities and therefore may not need to source semiconductor products from us. If our customers successfully develop in-house capabilities to design and develop semiconductors that can substitute for our products, they would likely reduce or stop purchasing our products. To sell new products, we will likely need to target new market segments and new customers with whom we do not have current relationships, which may require different strategies and may present difficulties that we have not encountered before. Failure to broaden our customer base and attract new customers may limit our growth prospects.
As OLED offers brighter color, near-perfect-black, less power consumption and is thinner and lighter than TFT-LCD, it gradually penetrates the mid to high-end TFT-LCD market, especially the smartphone market. OLED display and related DDICs have been dominated by Korean companies. The marketplace is increasing utilization of the OLED display for smartphone and other electronics areas, including notebook, tablet, TV and automotive due to expanded OLED capacity. We continue to gear up for the AMOLED driver IC development in partnership with major Chinese and Korean panel makers. For tablet, we are seeing adoptions on the rise for premium models that adopt advanced OLED display, of which Himax offers both DDIC and TCON and has commenced production to certain leading brands. For automotive OLED display, we continue to win project awards for our flexible AMOLED driver, TCON, and touch controller IC with both conventional car makers and EV/NEV vendors. Finally, we are making good progress with leading panel houses for the development of OLED display drivers for smartphone, TV and notebook applications. However, we could not assure you of the success of our AMOLED driver IC as we are unable to penetrate into the mass volume existing Korean and China supplier chain and/or find new OLED panel manufactures to design-wins our solutions into. OLED process maturity for the new manufactures and the possible specification change due to the immaturity of the OLED will also be a hurdle to our AMOLED driver share gain and success.
Himax’s solution for AMOLED includes driver ICs, TCON and touch controller ICs in automotive and tablet PC. In addition, there are multiple AMOLED projects under development jointly with worldwide leading panel makers for other applications, including smart phones, TV, notebook PCs and many others. The growth momentum in AMOLED solution is promising, but the risk of high dependency on limited customer base amid current macro uncertainty might result in fluctuation in sales performance.
We depend primarily on third-party foundries to manufacture our wafers, and any failure to obtain sufficient foundry capacity or loss of any of the foundries we use could significantly delay our ability to ship our products, causing us to lose revenues and damage our customer relationships.
Access to foundry capacity is crucial to our business because we do not manufacture our own wafers, instead relying primarily on third-party foundries. The ability of a foundry to manufacture our semiconductor products is limited by its available capacity. Access to capacity is especially important due to the limited availability of the high-voltage CMOS process technology required for the manufacture of wafers used in display drivers. If the primary third-party foundries that we rely upon are not able to meet our required capacity, or if our business relationships with these foundries are adversely affected, we would not be able to obtain the required capacity to meet increasing demand for our products. We may have to seek alternative foundries, which may not be available on commercially reasonable terms, or which may expose us to qualifying-new-foundry risks, as further discussed below.
10
We use several foundries for different semiconductor products, and certain of our products are manufactured at only one of these foundries. If any one of the foundries is unable to provide the required capacity to us, or does not deliver in a timely manner, or the quality or pricing terms are not acceptable to us, or any of the foundries experience financial difficulties or insolvency risks due to the impact of the global economic turmoil or any company-specific reasons or otherwise, if their operations are damaged or if there is any other disruption, directly or indirectly, of their foundry operations and we cannot qualify an alternative foundry in a timely manner, we could experience significant delays in receiving the product being manufactured by that foundry or incur additional costs to obtain substitutes, or interruption in our supply of the affected products. If we choose to use a new foundry or process technology for a particular semiconductor product, it will take us several quarters to qualify the new foundry or process before we can begin shipping. If we cannot qualify a new foundry in a timely manner, we may experience and incur damages as above mentioned and harm our customer relationships.
As a result of outsourcing the manufacturing of our wafers, we face several significant risks, including: (1) failure to secure manufacturing capacity, or being able to obtain required capacity only at higher costs; (2) risks of our proprietary information leaking to our competitors through the foundries we use; (3) limited control of delivery schedules, quality assurance and control, manufacturing yields and wafer costs; (4) the unavailability of, or potential delays in obtaining access to, key process technologies; and (5) financial risks of certain of our foundry suppliers.
To manufacture our display drivers used in TFT-LCD and OLED panels, we require foundries with high-voltage CMOS manufacturing process capacity. As a result, our dependence on high-voltage CMOS foundries presents the following, additional risks: (1) potential capacity constraints faced by the limited number of high-voltage CMOS foundries and the lack of investment in new and existing high-voltage CMOS foundries; (2) difficulty in attaining consistently high manufacturing yields from high-voltage CMOS foundries; (3) delay and time required to qualify and ramp up production at new high-voltage CMOS foundries; and (4) price increases.
As a result, we may be required to use foundries with which we have no established relationships, which could expose us to potentially unfavorable pricing, unsatisfactory quality or insufficient capacity allocation. Moreover, the scarcity of high-voltage foundry capacity may necessitate us making investments in foundries in order to secure capacity, which would require us to substantially increase our capital outlays and possibly raise additional capital, which may not be available to us on satisfactory terms, if at all.
11
We generally do not enter long - term agreements with our foundry partners that guarantee production capacity, prices, lead times, or delivery schedules. However, since 2020, due to the pandemic lockdown, the work-from-home and learn-from-home new lifestyles triggered increasing demands for display and display drivers related products. The surging demand in display drivers caused the severe foundry capacity shortage, while the industry has no major expansion plan especially on the mature nodes we are primarily anchored to. To address the potential foundry capacity shortage worldwide, we had entered into strategic agreements with our foundry partners in order to secure capacity to fulfill our business needs. Under these strategic agreements, we are committed to purchasing a specific volume at fixed or variable prices. However, for both pricing agreements, there can be no assurance that these prices provided in the strategic agreements with our foundry partners will always remain competitive during the contract term. For example, in the event that the global semiconductor market changes due to foundry capacity expansion and/or shrunken customer demand, the fixed prices we agree to pay our foundry partners may become significantly higher than the then prevailing market price. The situation could materially adversely impact our pricing strategies, competitive position, profitability and results of operation. We may also be subject to contractual penalties if we are unable to purchase the committed volume from our foundry partners. In addition, since these strategic agreements with our foundry partners typically require us to make prepayments or refundable deposits to such foundry partners, our cash flow, liquidity and financial condition could be adversely affected.
Our inability to secure sufficient capacity from any of our third-party tape, assembly and testing houses at reasonable and competitive prices could disrupt our shipments, harm our customer relationships and reduce our sales.
Access to third-party tape, assembly and testing capacity is critical to our business because we do not have in-house tape, assembly and testing capabilities for commercial production and instead rely on third-party service providers. Access to these services is especially important to our business because display drivers require specialized tape, assembly and testing services. A limited number of third-party tape, assembly and testing houses tape, assemble and test substantially all of our current products. Therefore, suppliers could be in a better position to bargain for higher prices, longer contract terms, higher deposit and/or higher contract breach penalties for their services and products, which could result in an increase in our average unit cost and/or penalty expenses. If the primary tape, assembly and testing service providers that we rely upon are not able to meet our requirements in price, quality, and service, or if our business relationships with these service providers were adversely affected, we would not be able to obtain the required capacity and would have to seek alternative providers, which may not be available on commercially reasonable terms, or at all. As a result, we do not directly control our product delivery schedules, tape, assembly and testing costs, and quality assurance and control. If any of these third-party tape, assembly and testing houses experiences capacity constraints, financial difficulties, suffers any damage to its facilities or if there is any disruption of its assembly and testing capacity, we may not be able to obtain alternative assembly and testing services in a timely manner. Because of the amount of time, we usually take to qualify assembly and testing houses, we may experience significant delays in product shipments if we are required to find alternative sources. Any problems that we may encounter with the delivery, quality or cost of our products could damage our reputation and result in a loss of customers and orders. Moreover, the scarcity and importance of tape, assembly and testing services may necessitate us making investments in tape, assembly and testing service providers in order to secure capacity, which would require us to substantially increase our capital outlays and possibly raise additional capital, which may not be available to us on satisfactory terms, if at all.
Shortages of key components for our customers’ products could decrease demand for our products.
Shortages of components and other materials that are critical to the design and manufacture of our customers’ products may limit our sales. These components and other materials include, but are not limited to, color filters, backlight modules, polarizers, printed circuit boards and glass substrates. In the past, companies that use our products in their production have experienced delays in the availability of key components from other suppliers. In addition, component manufacturers may not be able to increase or maintain their component supply because of labor shortage in China or otherwise and may shut down certain of their capacity from time to time because of weak demand, which may increase the instability of timely delivery and the risk of shortage of components. Such shortages of components and other materials critical to the design and manufacture of our customers’ products may cause a slowdown in demand for our products, resulting in a decrease in our sales and adversely affecting our results of operations. In addition, as a result of uncertain demand conditions, our customers may hesitate to build inventory on hand and tend to release orders on short notice.
12
We rely on the services of our key personnel, and if we are unable to retain our current key personnel and hire additional personnel, our ability to design, develop and successfully market our products could be harmed.
We rely upon the continued service and performance of a relatively small number of key personnel, including Jordan Wu, our president and chief executive officer, and Dr. Biing-Seng Wu, our chairman, and certain engineering, technical and senior management personnel, in particular, who are critical to our corporate management, business operation strategy, operation execution, future technological and product innovations. Competition for these personnel is intense in the semiconductor industry in Taiwan. Moreover, our future success depends on the expansion of our senior management team and the retention of key employees. Any of our key employees could leave our company with little or no prior notice in applicable jurisdictions and could then work with a competitor. In addition, we do not have “key person” life insurance policies covering any of our employees. The loss of any key personnel or our inability to attract or retain qualified personnel, whether engineers or others, could delay the development and introduction of new products and would have a material adverse effect on our ability to sell our products and may impact our overall business and growth. We may also incur increased operating expenses and be required to divert the attention of other senior executives away from their original duties to recruiting replacements for key personnel.
If we fail to forecast customer demand accurately, we may have excess or insufficient inventory, which may increase our operating costs and harm our business.
The lead time required by the semiconductor manufacturing service providers is typically longer than the lead time that our customers provide for delivery of our products to them. To ensure availability of our products for our customers, we will typically ask our semiconductor manufacturing service providers to start manufacturing our products based on forecasts provided by our customers in advance of receiving their purchase orders. However, these forecasts are not binding purchase commitments, and we do not recognize revenues until they are delivered to customers. Moreover, for the convenience of our customers, we may agree to ship our inventory to warehouses located near our customers, so that our products can be delivered to customers more quickly. In such cases, we will not recognize revenues until the control over a product is given to our customers based on the shipping terms. Hence, we incur inventory and manufacturing costs in advance of anticipated revenues.
The anticipated demand for our products may not materialize; therefore, manufacturing based on customer forecasts exposes us to risks such as high inventory carrying costs, increased product obsolescence, erosion of the products’ market value as well as penalties incurred from unfulfillment of committed orders from capacity agreements with the Company’s foundries and backend suppliers. If we overestimate demand for our products or if purchase orders are cancelled or shipments delayed, we may incur charges from agreements entered with foundries and backend suppliers for securing capacity, excess inventory that we cannot sell, or may have to sell at low profit margins or even at a loss, which would harm our financial results. Conversely, if we underestimate demand, we may not have sufficient inventory and may lose market share and damage customer relationships, which also could harm our business. These inventory risks are exacerbated by the high level of customization of our products, which limits our ability to sell excess inventory to other customers, which could eventually lead to write-down of these excess inventories.
If we do not achieve additional design wins in the future, our ability to grow will be limited.
Our future success depends on our customers designing our products into their products. To achieve design wins, we must design and deliver cost-effective, innovative, reliable and integrated products for our customers’ needs. A panel manufacturer may be reluctant to change its source of components due to the significant costs and time associated with qualifying a new supplier. A design win is not a binding commitment by a customer to purchase our products and may not result in large volume orders of our products. Rather, it is a decision by a customer to use our products in the design process of that customer’s products. Accordingly, our failure to successfully design, develop and introduce new products and product enhancements could harm our business, financial condition and results of operations.
13
Our products are complex and may require modifications to resolve undetected errors or failures in order for them to function with panels at the desired specifications, which could lead to higher costs, customer dispute, a loss of customers or a delay in market acceptance of our products.
Our products are highly complex and may contain undetected errors or failures. Our products must operate according to specifications with the other components used by our customers in their product manufacturing process. If our products are delivered with errors or defects, we could incur additional development, repair or replacement costs, and our credibility and the market acceptance of our products could be harmed along with possible liability indemnification for defective product, customer disputes and lawsuits against us or our customers.
Our highly integrated products are difficult to manufacture without defects. The existence of defects in our products could increase our costs, decrease our sales and damage our customer relationships and our reputation.
The manufacture of our products that incorporate mixed analog and digital signal processing and embedded memory technology is complex and it is difficult for semiconductor foundries to manufacture them completely without defects. Minor deviations in the manufacturing process could cause substantial reduction in yield and quality.
Defective products can be caused by design, defective materials or component parts, or manufacturing difficulties. Thus, quality problems can be identified only by analyzing and testing our display drivers in a system after they have been manufactured. Difficulties in achieving defect-free products due to the increasing complexity of display drivers and the panel system may result in an increase in our costs and expenses, and delays in the availability of our products. In addition, if the foundries that we use fail to deliver products of satisfactory quality in the volume and at the price required, we will be unable to meet our customers’ demand or to sell those products at an acceptable profit margin, which could adversely affect our sales and margins and damage our customer relationships and our reputation.
We may not have long-term purchase commitments from our customers, which may result in significant uncertainty and volatility with respect to our revenues and could materially and adversely affect our results of operations and financial condition.
We may not have long-term purchase commitments from our customers; our sales are made on the basis of individual purchase orders. Our customers may also cancel or defer purchase orders. Our customers’ purchase orders may vary significantly from period-to-period, and it is difficult to forecast future order quantities. In the event of a cancellation, postponement, or reduction of an order, we would likely not be able to reduce operating expenses sufficiently so as to minimize the impact of the lost revenues. Alternatively, subject to real ever-changing circumstances over the periods, we may have excess inventory that we cannot sell, which would harm our operating results. In addition, changes in our customers’ business may adversely affect the quantity of purchase orders that we receive by reducing or canceling their orders of our products, and/or requesting higher-than-usual price concessions. We cannot assure you that any of our customers will continue to place purchase orders with us in the future. We also cannot assure you that the volume of our customers’ purchase orders will be consistent with our expectations when we plan our expenditures. Our results of operations and financial condition may thus be materially and adversely affected. Additionally, purchase order unissued, cancelations or negative alternation by customers may lead to a reduction in future earnings or cash flows subject to each event.
Our corporate actions are substantially controlled by officers, directors and affiliated entities who may take actions that are not in, or may conflict with, our or our public shareholders’ interests.
As of March 31, 2024, Jordan Wu and Dr. Biing-Seng Wu (who are brothers) beneficially owned approximately 2.1% and 22.0% of our ordinary shares, respectively. For information relating to the beneficial ownership of our ordinary shares, see “Item 7.A. Major Shareholders and Related Party Transactions—Major Shareholders.” These shareholders, acting together, could exert substantial influence over matters requiring approval by our shareholders, including electing directors and approving mergers or other business combination transactions. This concentration of ownership may also discourage, delay or prevent a change in control of our company, which could deprive our shareholders of an opportunity to receive a premium for their shares as part of a sale of our company and might reduce the price of our ADSs. Actions may be taken even if they were opposed by our other shareholders.
14
Assertions against us by third parties for infringement of their intellectual property rights could result in significant costs and cause our operating results to suffer.
The semiconductor industry is characterized by vigorous protection and pursuit of intellectual property rights and positions, which results in protracted and expensive litigation for many companies. We have received, and expect to continue to receive, notices of infringement of third-party intellectual property rights. We may receive claims from various industry participants alleging infringement of their patents, trade secrets or other intellectual property rights in the future. Any lawsuit resulting from such allegations could subject us to significant liability for damages and invalidate our proprietary rights. These lawsuits, regardless of their success, would likely be time-consuming and expensive to resolve and would divert management time and attention. Any potential intellectual property litigation also could force us to do one or more of the following: (1) desist and stop selling products or using technology or manufacturing processes that contain the allegedly infringing intellectual property; (2) pay damages to the party claiming infringement; (3) attempt to obtain a license for the relevant intellectual property, which may not be available on commercially reasonable terms or at all; and (4) attempt to redesign those products that contain the allegedly infringing intellectual property with non-infringing intellectual property, which may not be possible.
The outcome of a dispute may result in our need to develop non-infringing technology or enter into royalty or licensing agreements. We have to undertake the contractual obligations, product liabilities and tort liabilities in applicable law jurisdictions, and we have agreed to indemnify certain customers for certain claims of infringement arising out of the sale of our products. Any intellectual property litigation could have a material adverse effect on our business, operating results or financial condition.
Our ability to compete will be harmed if we are unable to protect our intellectual property rights adequately.
We believe that the protection of our intellectual property rights is, and will continue to be, important to the success of our business. We rely primarily on a combination of patents, trademarks, trade secrets and copyright laws and contractual restrictions to protect our intellectual properties. These afford only limited protection. Despite our efforts to protect our proprietary rights, unauthorized parties may attempt to obtain, copy or use information that we regard as proprietary, such as product design and manufacturing process expertise. Our pending patent applications and any future applications may not result in issued patents or may not be sufficiently broad to protect our proprietary technologies. Moreover, policing any unauthorized use of our products is difficult and costly, and we cannot be certain that the measures which we have implemented will prevent misappropriation or unauthorized use of our technologies, particularly in foreign jurisdictions where the laws may not protect our proprietary rights as fully as the laws of the United States. Others may independently develop substantially equivalent intellectual properties or otherwise gain access to our trade secrets or intellectual properties. Our failure to protect our intellectual properties effectively could harm our business.
We may undertake acquisitions or investments to expand our business that may pose risks to our business and dilute the ownership of our existing shareholders, and we may not realize the anticipated benefits of these acquisitions or investments.
As part of our growth and product diversification strategy, we will continue to evaluate opportunities to acquire or invest in other businesses, intellectual property or technologies that would complement our current offerings, expand the breadth of markets we can address or enhance our technical capabilities. Acquisitions or investments that we have completed or potentially may make in the future entail a number of risks that could materially and adversely affect our business, operating and financial results, including: (1) problems integrating the acquired key employees, operations, technologies or products into our existing business and products; (2) diversion of management’s time and attention from our core business; (3) adverse effects of losses of the acquired target upon our financial condition and results of operations; (4) adverse effects on existing business relationships with customers; (5) the need for financial resources above our planned investment levels; (6) dilution of share ownership of current shareholders under share swap transactions; (7) risks associated with entering markets in which we lack experience; (8) potential write-offs of acquired assets; and (9) potential impairment charges related to the goodwill acquired.
We may also face challenges in international acquisitions, such as compliance with local law and regulation, limited access to target companies and cultural assimilation challenges. Our failure to address these risks successfully may have a material adverse effect on our financial condition and results of operations. Any such acquisition or investment may require a significant amount of capital investment, which would decrease the amount of cash available for working capital or capital expenditures. In addition, if we use our equity securities to pay for acquisitions, the value of our ADSs and the underlying ordinary shares may be diluted. If we borrow funds to finance acquisitions, such debt instruments may contain restrictive covenants that can, among other things, restrict us from distributing dividends.
15
System security risks, data protection breaches or unexpected system outages or failures could impact our business.
Our computer systems and networks are vulnerable to damage or interruption from earthquakes, fires, power loss, telecommunications failures, cyber-attacks, computer viruses or other malicious attempts. The reliability and safety of our information technology infrastructure / software, and the ability to continually expand and update technologies / software in response to dynamic changing needs and cybersecurity threats, are critical to our business. In recent years, there are increasing and evolving risks to cybersecurity and privacy, including criminal hackers, state-sponsored intrusions, industrial espionage, employee malfeasance and human / technological errors. All of the above could result in the loss of our intellectual property, the leak of commercially sensitive information, and the misappropriation of confidential information of our employees, customers and suppliers, and therefore could cause the interruption of our business. Failures to protect the privacy of employees, customers or suppliers’ confidential data against breaches of network security could result in the loss of existing or potential customers, other financial loss, and damage to our reputation. In addition, the operational cost and consequences against breaches and remedial measures could be significant. While we seek to annually review and assess our cybersecurity policies and procedures to ensure their adequacy and effectiveness, we still cannot guarantee that we will not be susceptible to new and emerging risks and attacks in the evolving landscape of cybersecurity threats. As of March 31, 2024, we are not aware of any material cyberattacks or incidents that had or would be expected to have a materially adverse effect on our business and operations, nor had we been involved in any legal proceedings or regulatory investigations related thereto.
Our data centers are subject to the risk of break-ins and sabotage. Our disaster recovery plan cannot account for all eventualities. Consequently, the occurrence of a natural disaster or other unanticipated problems at our data centers could result in loss of production capabilities and lengthy interruptions in our services and business. Some of our system services are based on public cloud services, which are also subject to interruption due to cloud service providers’ unexpected downtimes, cyberattacks or any type of failure, telecommunication failure and/or other unidentified problems while connecting to cloud. These cloud services interruptions could result in loss of production capabilities and lengthy interruptions in our services and business. Cloud cybersecurity breaches could result in adverse effects on our customers, employees, suppliers, reputation, and business.
Risks Relating to Our Industry
The average selling prices of our products could decrease rapidly, which may negatively impact our revenues and operating results.
The price of each semiconductor product typically declines over its product life cycle, reflecting product obsolescence, decreased demand as customers shift to more advanced products, decreased unit costs due to advanced designs or improved manufacturing yields, excess inventory destocking amidst low market demand, and increased competition as more semiconductor suppliers are able to offer similar products. We may experience substantial period-to-period fluctuations in future operating results if our average selling prices decline. We may reduce the average unit price of our products in response to competitive pricing pressures, new product introductions by us or our competitors, and other factors. We expect that these factors will create downward pressure on our average selling prices and operating results. If we are unable to offset any reductions in our average selling prices by increasing our sales volumes and corresponding production cost reductions, or if we fail to develop and introduce new products and enhancements on a timely basis, our revenues and operating results will suffer.
The semiconductor industry, in particular semiconductors used in flat panel displays, is highly competitive, and we cannot assure that we will be able to compete successfully against our competitors.
Increased competition in the semiconductor industry may result in pricing pressure, reduced profitability and loss of market share, any of which could seriously harm our revenues and results of operations. We continually face intense competition from fabless display driver companies and integrated device manufacturers. Some of our competitors have substantially greater financial and other resources to pursue engineering, manufacturing, marketing and distribution of their products. As a result, they may be able to respond more quickly to changing customer demands or devote greater resources to the development, promotion and sales of their products. Some of our competitors are affiliated with, or are subsidiaries of, our panel manufacturer customers. These relationships may also give our competitors significant advantages such as early access to product roadmaps and design-in priorities, which would allow them to respond more quickly to changing customer demands and achieve more design-wins than we can. We cannot assure you that we will be able to increase or maintain our revenues and market share or compete successfully against our competitors in the semiconductor industry.
16
Our business could be materially and adversely affected if we fail to anticipate changes in evolving industry standards, fail to achieve and maintain technological leadership in our industry or fail to develop and introduce new and enhanced products.
Our products are generally based on industry standards, which are continually evolving. The emergence of new industry standards could render our products or those of our customers unmarketable or obsolete and may require us to incur substantial unanticipated costs to comply with any such new standards. Our past sales and profitability have resulted, to a significant extent, from our ability to anticipate changes in technology and industry standards, and to develop and introduce new and enhanced products in a timely fashion. If we do not anticipate these changes in technologies and rapidly develop and introduce new and innovative technologies, we may not be able to provide advanced display semiconductors on competitive terms, and some of our customers may buy products from our competitors instead of from us. Our continued ability to adapt to such changes and anticipate future standards will be a significant factor in maintaining or improving our competitive position and our growth prospects. We cannot assure you that we will be able to anticipate evolving industry standards, successfully complete the design of our new products, have these products manufactured at acceptable manufacturing yields, or obtain significant purchase orders for these products to meet new standards or technologies. If we fail to anticipate changes in technology and to introduce new products that achieve market acceptance, our business and results of operations could be materially and adversely affected.
Risks Relating to Our Holding Company Structure
Our ability to receive dividends and other payments or funds from our subsidiaries may be restricted by commercial, statutory and legal restrictions, and thereby materially and adversely affect our ability to grow, fund investments, make acquisitions, pay dividends and otherwise fund and conduct our business.
We are a holding company and our assets consist mainly of our 100% ownership interest in Himax Taiwan. We receive cash from Himax Taiwan through intercompany borrowings. Himax Taiwan has not paid us cash dividends in the past. Nonetheless, dividends and interest on shareholder loans that we receive from our subsidiaries in Taiwan, if any, will be subject to withholding tax under ROC law. The ability of our subsidiaries to provide us with loans, pay dividends, repay any shareholder loans from us or make other distributions to us is restricted by, among other things, the availability of funds, the terms of various credit arrangements entered into by our subsidiaries, as well as statutory and other legal restrictions. Any limitation on dividend payments by our subsidiaries could materially and adversely affect our ability to grow, finance capital expenditures, make acquisitions, pay dividends, and otherwise fund and conduct our business.
Political, Geographical and Economic Risks
Climate change and natural disasters could adversely affect our business.
There is increasing concern that a gradual increase in global average temperatures due to increased concentration of carbon dioxide and other greenhouse gases in the atmosphere has, and will continue to, cause significant changes in weather patterns around the globe and an increase in the frequency and severity of natural disasters. Changes in weather patterns and an increased frequency, intensity and duration of extreme weather conditions could, among other things, impair our production capabilities, disrupt the operation of our supply chain, and impact our customers and their demand for our services. There are inherent climate-related risks regardless of where we conduct our business. Climate-change-related weather events could negatively impact any of our locations or the locations of our customers, and may cause us to experience project delays, financial losses and/or additional costs to resume operations, including increased insurance costs or loss of coverage, legal liability and reputational losses.
Climate change concerns have also led to international legislative and regulatory initiatives directed at limiting carbon dioxide and other greenhouse gas emissions. Proposed and existing efforts to address climate change by reducing greenhouse gas emissions could directly or indirectly affect our costs of compliance, including costs associated with changes to manufacturing processes or the procurement of raw materials used in manufacturing processes, increased capital expenditures to improve facilities and equipment, and higher compliance and energy costs to reduce emissions, as well as increased indirect costs resulting from our customers, suppliers or both incurring additional compliance costs that are passed on to us, which could harm our business and financial results by increasing our expenses or requiring us to alter our operations and product design activities.
17
In addition, climate change could cause certain natural disasters to occur more frequently or with greater intensity. Most of our operations, and the operations of many of our semiconductor manufacturing service providers, suppliers and customers are located in Taiwan, which is vulnerable to natural disasters, in particular, earthquakes and typhoons. Our principal foundries, tape and assembly and testing houses upon which we have relied to manufacture substantially all of our display drivers are located in Taiwan. As a result of this geographic concentration, disruption of operations at our facilities or the facilities of our semiconductor manufacturing service providers and suppliers for any reason, including work stoppages, power outages, water supply shortages, fire, typhoons, earthquakes or other natural disasters, could cause delays in production and shipments of our products. In addition, shortages or interruptions in electricity supply could further be exacerbated by changes in the energy policy of the government, such as to make Taiwan a nuclear-free country. Any delays or disruptions could result in our customers seeking to source products from our competitors. If such disruptions of operation occur at our customers’ facilities and our customers may be required to shut down temporarily or to substantially reduce the operations of their fabs, these events would seriously affect demand for our products.
Disruptions in Taiwan’s political environment could negatively affect our business and ADSs market price.
Our principal executive offices and a substantial amount of our assets are located in Taiwan, and a substantial portion of revenues is derived from operations in Taiwan. Our business, financial condition and results of operations and our ADSs market price may be affected by changes in ROC policies, taxation, inflation or interest rates, and by social instability and diplomatic issues that are outside of our control.
Taiwan has a unique international political status. Since 1949, Taiwan and the PRC have been separately governed. The government of the PRC claims that it is the sole government in China and that Taiwan is part of China. Although significant economic and cultural relations have been established during recent years between Taiwan and the PRC, the PRC government has refused to renounce the possibility that it may at some point use force to gain control over Taiwan. Furthermore, the PRC government adopted an anti-secession law relating to Taiwan. Relations between the ROC and the PRC governments have been strained in recent years for a variety of reasons, including the PRC government’s position on the “One China” policy and tensions concerning arms sales to Taiwan by the United States government. Any tension between the ROC and the PRC, or between the United States and the PRC, could materially and adversely affect our ADSs market prices.
A substantial portion of our sales are made to customers in the PRC, which may expose us to additional political, regulatory, and economic risks.
We have been increasingly selling our products to customers in the PRC. In 2022 and 2023, approximately 77.0% and 76.2% of our revenues, respectively, were from customers headquartered in the PRC. We expect to continue to increase our sales to customers in the PRC in the future. With regional customer concentration, we are particularly subject to economic and political events and other developments that affect our customers in the PRC.
The PRC economy differs from the economies of most developed countries in many respects, including the structure, level of government involvement, level of development, foreign exchange control and allocation of resources. The PRC economy has been transitioning from a planned economy to a more market-oriented economy and is growing rapidly. For the past two decades, the PRC government has implemented economic reform measures emphasizing utilization of market forces in the development of the economy and also adjusted its macroeconomic control policies from time to time. These policies have led and may continue to lead to changes in market conditions. Further, if new, US sanctions are imposed on China and any new tariffs, legislation and/or regulations are implemented, or if existing trade agreements are renegotiated or, in particular, if the U.S. government takes retaliatory trade actions due to recent U.S.-China trade tensions, such changes could have an adverse effect on our customers or suppliers in China. We cannot predict whether changes in the PRC’s political, economic and social conditions, laws, regulations and policies will have any adverse effect on our customers in the PRC. In addition, the interpretation of PRC laws and regulations involves uncertainties. We cannot assure you that changes in such laws and regulations, or in their interpretation and enforcement, will not have a material adverse effect on the businesses and operations of our customers in the PRC and consequently have a material adverse effect on our business and operations.
18
Fluctuations in exchange rates could result in foreign exchange losses and affect our results of operations.
Our functional and reporting currency is U.S. dollars. In 2023, more than 99% of our revenues and cost of revenues were denominated in U.S. dollars. However, we have foreign currency exposure and are primarily affected by fluctuations in exchange rates between the U.S. dollar and the NT dollar. This is because a majority portion of our employees and facilities are based in Taiwan and operating expenses are denominated in NT dollars and we maintain a portion of our cash in NT dollars for Taiwan working capital purposes. For example, in December 2023, approximately 70% of our operating expenses were denominated in NT dollars, with a small percentage denominated in Japanese Yen, Korean Won and Chinese Renminbi, and the majority of the remainder in U.S. dollars. As a result, any significant fluctuations to our disadvantage in exchange rate of U.S. dollars against such currencies, in particular a weakening of the U.S. dollar against the NT dollar, would have an adverse impact on our operating expenses as expressed in U.S. dollar and adversely affect our operating profit.
Changes in ROC tax laws would likely increase our tax expenditures and decrease our net income.
The Company is incorporated in the Cayman Islands, a tax-free country; accordingly, pretax income generated by the group parent company is not subject to local income tax. Substantially all of the Company's taxable income is derived from the operations in the ROC and we are exposed primarily to taxes levied by the ROC government. Any unfavorable changes of tax laws and regulations in this jurisdiction could increase our effective tax rate and have an adverse effect on our operating results. See “Item 5.A. Operating and Financial Reviews and Prospects -Operating Results-Tax Credits” for further discussion of significant tax regulation changes.
On July 12, 2016, the ROC Legislative Yuan passed the third reading of anti-avoidance to establish Article 43-3 Controlled Foreign Company (“CFC”) rules and Article 43-4 Place of Effective Management (“PEM”) rules of the Income Tax Act (“ITA”). Detailed introduction of the CFC and PEM rules are described as follows:
| (i) | A profit-seeking enterprise (“PSE”) that directly or indirectly owns affiliated enterprises in low-tax jurisdictions outside the territory of the ROC shall recognize and include its pro rata share of affiliated enterprises’ annual profits as investment income in its income tax return for the year. Subsequent actual dividends and distributions from such affiliated enterprises that were previously recognized as investment income will then not be subject to income taxation; any surplus to previously recognized investment income shall be included as taxable income in the allocated year. Low-tax jurisdictions are defined as countries where the PSE income tax rate is lower than 70% of the income tax rate of the PSE in the ROC (the statutory income tax rate is 20% from January 1, 2018) (Article 43-3 CFC rules); and |
| (ii) | A PSE is incorporated based on foreign legislation but its place of effective management (PEM) is maintained within the territory of the ROC, and the head office of such PSE will be determined to be within the territory of the ROC and profit-seeking enterprise income tax shall be levied in accordance with the ITA and relevant tax regulations. The aforementioned PEM refers to a place where substantive key management and commercial decisions of an entity’s business and its operations are made (Article 43-4 PEM rule). |
According to the legislative intent, the CFC and PEM rules, in principle, will not be put into force immediately, but will wait until the China-Taiwan Cross-Strait Tax Agreement is effectuated, the OECD’s Common Reporting and Due Diligence Standard (“CRS”) for the automatic exchange of information of financial accounts is widely implemented internationally, and the relevant bylaws of the CFC and PEM rules have been adequately enacted and properly advocated. The date of implementation will be determined by the Executive Yuan. On January 14, 2022, Executive Yuan had announced the relevant bylaws of the CFC would be implemented from January 1, 2023 and we expect that CFC would have no material impact to affect our operating profit.
Additionally, dividend payments made by us are not subject to withholding tax in the Cayman Islands. However, if the relevant bylaws of the PEM rules have been adequately enacted and properly advocated, we may be determined to be within the territory of the ROC and our income tax shall be levied in accordance with the Income Tax Act and relevant tax regulations. Therefore, dividend payments made by us would be subject to withholding tax in the ROC.
19
We may be affected by the Cayman Economic Substance Law
Pursuant to the International Tax Co-operation (Economic Substance) Act (2021 Revision) (as amended) of the Cayman Islands (the “ES Act”), a “relevant entity” is required to satisfy the economic substance test set out in the ES Act. A “relevant entity” includes an exempted company incorporated in the Cayman Islands as is our company. Based on the current interpretation of the ES Act, we believe that our company, Himax Technologies, Inc., is a pure equity holding company since it only holds equity participation in other entities and only earns dividends and capital gains.
Accordingly, for so long as our company is a “pure equity holding company”, it is only subject to the minimum substance requirements, which require us to (i) comply with all applicable filing requirements under the Companies Act (2021 Revision) of the Cayman Islands; and (ii) have adequate human resources and adequate premises in the Cayman Islands for holding and managing equity participations in other entities. However, there can be no assurance that we will not be subject to more requirements under the ES Act. Uncertainties over the interpretation and implementation of the ES Act may have an adverse impact on our business and operations.
Risks Relating to Our ADSs and Our Trading Market
The market price for our ADSs is volatile.
The market price for our ADSs is volatile and has ranged from a low of $5.22 to a high of $8.7 on the NASDAQ Global Select Market in 2023.
The market price is subject to wide fluctuations in response to various factors, including the following: (1) actual or anticipated fluctuations in our quarterly operating results; (2) changes in financial estimates by securities research analysts; (3) changes in the expectation of our product launch timing, forecast and estimates; (4) conditions in the TFT-LCD and OLED panel market; (5) changes in the economic performance or market valuations of other display semiconductor companies; (6) announcements by us or our competitors of new products, acquisitions, strategic partnerships, joint ventures or capital commitments; (7) the addition or departure of key personnel; (8) fluctuations in exchange rates between the U.S. dollar and the NT dollar; (9) litigation related to our intellectual property; and (10) the release of lock-up or other transfer restrictions on our outstanding ADSs or sales of additional ADSs.
In addition, the worldwide financial crisis, disruptions in business and manufacture due to sluggish demand, and global developments relating to Russia's invasion of Ukraine, global stock markets have experienced extreme price and volume fluctuations. This volatility has had a significant effect on the market prices of securities issued by many companies for reasons which may not be directly related to their operating performance, including but not limited to events such as tax-loss selling, mutual fund redemptions, hedge fund redemptions and margin calls. These market fluctuations may also materially and adversely affect the market price of our ADSs.
Future sales or perceived sales of securities by us, our executive officers, directors or major shareholders may hurt the price of our ADSs.
The market price of our ADSs could decline as a result of sales of ADSs or shares or the perception that these sales could occur. As of March 31, 2024, we had 349,448,102 outstanding shares and a significant number of our shares were beneficially owned by certain major shareholders such as our directors and executive officers. See “Item 7.A. Major Shareholders and Related Party Transactions—Major Shareholders.” If we, our executive officers, or directors or our shareholders sell ADSs or shares, the market price for our shares or ADSs could decline.
20
You may not have the same voting rights as the holders of our ordinary shares and may not receive voting materials sufficiently in advance to be able to exercise your right to vote.
Except as described in the deposit agreement, holders of our ADSs will not be able to exercise voting rights attaching to the shares evidenced by our ADSs on an individual basis. Holders of our ADSs will appoint the depositary or its nominee as their representative to exercise the voting rights attaching to the shares represented by the ADSs. In certain circumstances, the depositary shall refrain from voting and any voting instructions received from ADS holders shall lapse. Furthermore, in certain other circumstances, the depositary will give us a discretionary proxy to vote shares evidenced by ADSs. You may not receive voting materials sufficiently in advance to instruct the depositary to vote or persons who hold their ADSs through brokers, dealers or other third parties will not have the opportunity to exercise a right to vote.
You may not be able to participate in rights offerings and may experience dilution of your holdings as a result.
We may from time to time distribute rights to our shareholders, including rights to acquire our securities. Under the deposit agreement for the ADSs, the depositary will not offer those rights to ADS holders unless both the rights and the underlying securities to be distributed to ADS holders are either registered under the Securities Act, or exempt from registration under the Securities Act with respect to all holders of ADSs. We are under no obligation to file a registration statement with respect to any such rights or underlying securities or to endeavor to cause such a registration statement to be declared effective. In addition, we may not be able to take advantage of any exemptions from registration under the Securities Act. Accordingly, holders of our ADSs may be unable to participate in our rights offerings and may experience dilution in their holdings as a result.
You may be subject to limitations on transfer of your ADSs.
Your ADSs represented by the ADRs are transferable on the books of the depositary. However, the depositary may close its transfer books at any time or from time to time whenever it deems expedient in connection with the performance of its duties. In addition, the depositary may refuse to deliver, transfer or register transfers of ADSs generally when books or the books of the depositary are closed, or at any time if we or the depositary deem it necessary or advisable to do so because of any requirement of law, any government, governmental body, commission, or any securities exchange on which our ADSs or ordinary shares are listed, or under any provision of the deposit agreement or provisions of, or governing, the deposited securities or any meeting of our shareholders, or for any other reason.
Your ability to protect your rights through the United States federal courts may be limited, because we are incorporated under Cayman Islands law, conduct a substantial portion of our operations in Taiwan, and all of our directors and officers reside outside the United States.
We are incorporated in the Cayman Islands. However, a substantial portion of our operations is conducted in Taiwan through Himax Taiwan, our wholly owned subsidiary, and substantially all of our assets are located in Taiwan. All of our directors and officers reside outside the United States, and a substantial portion of the assets of those persons is located outside the United States. As a result, it may be difficult or impossible for you to bring an action against us or against these individuals in the United States in the event that you believe that your rights have been infringed under the securities laws or otherwise. Even if you are successful in bringing an action of this kind, the laws of the Cayman Islands and of Taiwan may render you unable to enforce a United States judgment against our assets or the assets of our directors and officers. There is no statutory recognition in the Cayman Islands of judgments obtained in the United States, although a final and conclusive judgment in the federal or state courts of the United States under which a sum of money is payable, other than a sum payable in respect of multiple damages, taxes, or other charges of a like nature or in respect of a fine or other penalty, may be subject to enforcement proceedings as debt in the courts of the Cayman Islands under the common law doctrine of obligation, provided that (a) such federal or state courts of the United States had proper jurisdiction over the parties subject to such judgment; (b) such federal or state courts of the United States did not contravene the rules of natural justice of the Cayman Islands; (c) such judgment was not obtained by fraud; (d) the enforcement of the judgment would not be contrary to the public policy of the Cayman Islands; (e) no new admissible evidence relevant to the action is submitted prior to the rendering of the judgment by the courts of the Cayman Islands; and (f) there is due compliance with the correct procedures under the laws of the Cayman Islands.
Therefore, our public shareholders may have more difficulty in protecting their interests through actions against our management, directors or major shareholders than shareholders of a corporation incorporated in a jurisdiction in the United States.
21
You may face difficulties in protecting your interests as a shareholder because judicial precedents regarding shareholders’ rights are more limited under Cayman Islands law than under U.S. law, and because Cayman Islands law generally provides less protection to shareholders than U.S. law.
Our corporate affairs are governed by memorandum and articles of association, the Companies Law, Cap. 22 (Law 3 of 1961, as consolidated and revised) of the Cayman Islands, or the Cayman Islands Companies Law, and the common law of the Cayman Islands. The rights of shareholders to take action against directors, actions by minority shareholders and the fiduciary responsibilities of our directors to us under Cayman Islands law are to a large extent governed by the common law of the Cayman Islands. The common law is derived in part from comparatively limited judicial precedent in the Cayman Islands as well as from English common law, which has persuasive, but not binding, authority on a court in the Cayman Islands. The rights of shareholders and the fiduciary responsibilities of directors under Cayman Islands law are not as clearly established as they would be under statutes or judicial precedent in some jurisdictions in the United States. In particular, the Cayman Islands have a less developed body of securities law than the United States.
ITEM 4. INFORMATION ON THE COMPANY
4.A. History and Development of the Company
Himax Taiwan, our predecessor, was incorporated on June 12, 2001 as a limited liability company under the laws of the ROC. On April 26, 2005, we established Himax Technologies Limited, an exempted company with limited liability under the Cayman Islands Companies Law, as a holding company to hold the shares of Himax Taiwan in connection with our reorganization and share exchange. On October 14, 2005, Himax Taiwan became our wholly owned subsidiary through a share exchange consummated pursuant to the ROC Business Mergers and Acquisitions Law through which we acquired all of the issued and outstanding shares of Himax Taiwan, and we issued ordinary shares to the shareholders of Himax Taiwan. Shareholders of Himax Taiwan received one of our ordinary shares in exchange for one Himax Taiwan common share. The share exchange was unanimously approved by shareholders of Himax Taiwan on June 10, 2005 with no dissenting shareholders and by the ROC Investment Commission on August 30, 2005 for our inbound investment in Taiwan, and on September 7, 2005 for our outbound investment outside of Taiwan. We effected this reorganization and share exchange to comply with ROC laws, which prohibit a Taiwan incorporated company not otherwise publicly listed in Taiwan from listing its shares on an overseas stock exchange. Our reorganization enables us to maintain our operations through our Taiwan subsidiary, Himax Taiwan, while allowing us to list our shares overseas through our holding company structure.
On September 26, 2005, we changed our name to “Himax Technologies, Inc.,” and on October 17, 2005, Himax Taiwan changed its name to “Himax Technologies Limited” upon the approval of shareholders of both companies and amendments to the respective constitutive documents. We effected the name exchange in order to maintain continuity of operations and marketing under the trade name “Himax Technologies, Inc.,” which had been previously used by Himax Taiwan.
Our ADSs have been listed on the NASDAQ Global Select Market since March 31, 2006. Our ordinary shares are not listed or publicly traded on any trading markets.
In February 2007, we completed the acquisition of Wisepal, currently known as Himax Semiconductor, Inc., a fabless semiconductor company focusing on the development of LTPS TFT-LCD drivers for small and medium-sized applications. This transaction strengthened our competitive position in the small and medium-sized product areas and further diversified our technology and product offerings. For management purpose, Himax Semiconductor Inc. was merged into Himax Taiwan on July 2, 2018.
In March 2007, we established Himax Imaging, Inc., which develops and markets CMOS image sensors with an initial focus on camera applications used in cell phones and notebook computers.
In July 2012, our subsidiary, Himax Display, completed the acquisition of Spatial Photonics, currently known as Himax Display (USA) Inc., a Delaware corporation engaged in the business of manufacturing and production of MEMS products.
In June 2018, we completed the acquisition of Emza Visual Sense Ltd., or Emza, which is dedicated to the development of visual sensors that include proprietary machine-vision algorithms and specific architectures that enable always-on visual sensing capabilities, achieving improvement in power consumption, price and form factor. On October 25, 2022, we disposed of 100% of our shareholdings in Emza to a third party.
From time to time, we have also made minority investments in various companies for strategic purposes in the ordinary course of business.
22
Our principal executive offices are located at No. 26, Zilian Road, Xinshi District, Tainan City 744092, Taiwan, Republic of China. Our telephone number at this address is +886-6-505-0880. Our registered office in the Cayman Islands is located at Cricket Square, Hutchins Drive, P.O. Box 2681, Grand Cayman KY1-1111, Cayman Islands. Our telephone number at this address is +1-345-945-3901. In addition, we have offices in Hsinchu and Taipei, Taiwan; Foshan, Fuqing, Ningbo, Beijing, Shanghai, Shenzhen, Suzhou, Wuhan, Hefei, Chengdu, Fuzhou, Nanjing, Chongqing, Xi’an and Xiamen, China; Tokyo, Japan; Asan-si and Bundang-gu, South Korea; Munich, Germany and Irvine and San Jose, California, Minneapolis, Minnesota and Detroit, Michigan, USA.
Investor inquiries should be directed to our Investor Relations department by email to hx_ir@himax.com.tw. The SEC maintains an Internet site that contains reports, proxy and information statements, and other information regarding issuers that file electronically with the SEC. The address of the SEC’s Internet site is http://www.sec.gov. Our website is www.himax.com.tw. The information contained on our website is not part of this annual report.
4.B. Business Overview
We are a leading global fabless semiconductor solution provider dedicated to display imaging processing technologies. Our display driver ICs and timing controllers have been adopted at scale across multiple industries worldwide including TVs, PC monitors, laptops, mobile phones, tablets, automotive, ePaper devices, industrial displays, among others. As the global market share leader in automotive display technology, we offer innovative and comprehensive automotive IC solutions, including traditional driver ICs, advanced in-cell Touch and Display Driver Integration (TDDI), Large Touch and Display Driver Integration (LTDI) and local dimming timing controllers (Local Dimming TCON), as well as and AMOLED solutions, including AMOLED drivers, TCONs and touch controller ICs. We are also a pioneer in tinyML visual-AI and optical technology related fields. Our industry-leading WiseEyeTM Smart Sensing technology which incorporates Himax proprietary ultralow power AI processor, always-on CMOS image sensor, and CNN-based AI algorithm has been widely deployed in consumer electronics and AioT related applications. While Himax optics technologies, such as wafer level optics (WLO), LCoS microdisplays and 3D sensing solutions, are critical for facilitating emerging AR/VR/metaverse technologies. Besides, Himax designs and provides touch controllers, AMOLED ICs, LED drivers, EPD drivers, power management ICs, and CMOS image sensors for diverse display application coverage.
Industry Background
We mainly operate in the flat panel display semiconductor industry. As the majority of our revenues derive from products that are critical components of flat panel displays, such as display drivers, timing controllers, power ICs and other semiconductor products, our industry is closely linked to the trends and developments of the flat panel display industry.
Flat Panel Display Semiconductors
Flat panel displays require different semiconductors depending upon the display technologies and the applications. Some of the most important ones include the following:
| ● | Display Driver. The display driver receives image data from the timing controller and delivers precise analog voltages or currents to create images on the display. The major application of display driver IC is used on TFT-LCDs. Other than display drivers for TFT-LCDs, we also offer display drivers for OLED and Electronic Paper (e-paper) Displays. OLED display is getting more and more popular in recent years, starting from high-end smartphone and TV applications towards tablet, notebook and automotive, while e-paper display mimics traditional paper sheet and holds static text and images indefinitely without electricity. Detailed display driver IC specification for LCD, OLED and e-paper are different due to panel characteristics. The two main types of display drivers for a display panel are gate drivers and source drivers. Gate drivers turn on the transistor within each pixel cell on the horizontal line on the panel for data input at each row. Source drivers receive image data from the timing controller and generate voltage that is applied to the liquid crystal within each pixel cell on the vertical line on the panel for data input at each column. The combination determines the colors generated by each pixel. Typically, multiple gate drivers and source drivers are installed separately on the panel. However, for certain small and medium-sized applications, gate drivers and source drivers are integrated into a single chip due to space and cost considerations. Large-sized panels typically have higher resolution and require more display drivers than small and medium-sized panels. In addition, TDDI IC integrates both display driver and in-cell touch functions and is usually adopted by small and medium sized display applications, whereas Timing Controller feature is also embedded in TDDI. |
23
| ● | Timing Controller. The timing controller receives image data and converts the format for the source drivers’ input. The timing controller also generates controlling signals for gate and source drivers. Typically, the timing controller is a discrete semiconductor in TFT-LCD, OLED and e-paper panels. For certain small and medium-sized applications, however, the timing controller may be integrated with display drivers. |
| ● | Operational Amplifier. An operational amplifier supplies the reference voltage to source drivers in order to make their output voltage uniform. |
| ● | Power IC. Power ICs include certain drivers, amplifiers, DC to DC converters and other semiconductors designed to enhance power management, such as voltage regulation, voltage boosting and battery management. |
| ● | Touch Controller IC. For touch screen applications, touch controller ICs enable touch interfaces, such as capacitive touch panels, to identify, qualify and track user’s contacts with precision and sensibility. For TFT LCD panels, the touch controller may be integrated with display drivers as an in - cell TDDI solution, commonly adopted in devices including smartphones, tablets, automotive displays, and notebooks. In contrast, OLED panels typically adopt a discrete touch controller to realize touch functionality. |
| ● | Others. Flat panel displays also require multiple general purposes semiconductors such as memory, power converters and inverters. |
Characteristics of the Display Driver Market
Although we operate in several distinct segments of the flat panel display semiconductor industry, our principal products are display drivers. Display drivers are critical components of flat panel displays. The display driver market has specific characteristics, including those discussed below.
Concentration of Panel Manufacturers
The global TFT-LCD panel industry consists of a small number of manufacturers, substantially all of which are based in Asia. In recent years, Korean TFT-LCD panel makers have gradually undergone restructurings to shift their technology and manufacture focus from TFT-LCD to OLED and TFT-LCD panel manufacturers, especially China-based manufacturers which have invested or are planning to invest heavily to establish, construct and ramp up additional fab capacity. The capital-intensive nature of the industry often results in TFT-LCD panel manufacturers operating at a high level of capacity utilization in order to reduce unit costs. This tends to create a temporary oversupply of panels, which reduces the average selling price of panels and puts pricing pressure on component companies including display driver companies. Moreover, the concentration of panel manufacturers permits major panel manufacturers to exert pricing pressure on display driver companies such as us. The small number of panel manufacturers exacerbates this situation as display driver companies, in addition to seeking to expand their customer base, must also focus on winning a larger percentage of such customers’ display driver requirements.
Customization Requirements
Each panel display has a unique pixel design to meet its particular requirements. To optimize the panel’s performance, display drivers have to be customized for each panel design. The most common customization requirement is for the display driver company to optimize the gamma curve of each display driver for each panel design. Display driver companies must work closely with their customers to develop semiconductors that meet their customers’ specific needs in order to optimize the performance of their products.
24
Mixed-Signal Design and High-Voltage CMOS Process Technology
Display drivers have specific design and manufacturing requirements that are not standard in the semiconductor industry. Some display drivers require mixed-signal design since they combine both analog and digital devices on a single semiconductor to process both analog signals and digital data. Manufacturing display drivers require high-voltage CMOS process technology operating typically at 4.5 to 24 volts for source drivers and 10 to 50 volts for gate drivers, levels of voltage which are not standard in the semiconductor industry. For display drivers, the driving voltage must be maintained under a very high degree of uniformity, which can be difficult to achieve using standard CMOS process technology. Moreover, manufacturing display drivers does not require very small-geometry semiconductor processes. Typically, the manufacturing process for large panel display drivers require geometries between 0.11 micron and 1 micron because the physical dimensions of a high-voltage device do not allow for the economical reduction in geometries below this range. We believe that there are a limited number of fabs with high-voltage CMOS process technology that are capable of high-volume manufacturing of display drivers.
Special Assembly and Testing Requirements
Manufacturing display drivers requires certain assembly and testing technologies and equipment that are not standard for other semiconductors and are offered by a limited number of providers. The assembly of display drivers typically uses either tape-automated bonding, also known as TAB, or chip-on-glass, also known as COG, technologies. Display drivers also require gold bumping, which is a process in which gold bumps are plated onto each wafer to connect the die and the processed tape, in the case of TAB packages, and the glass, in the case of COG packages. TAB may utilize tape carrier packages, also known as TCP, or chip on film, also known as COF. The type of assembly used depends on the panel manufacturer’s design, which is influenced by panel size and application and is typically determined by the panel manufacturers. Display drivers for large-sized applications typically require TAB package and, to a lesser extent, COG package types, whereas display drivers for smartphone, tablet and consumer electronics products typically require COG packages. The testing of display drivers also requires special testers that can support high-channel and high-voltage output semiconductors. Such testers are not standard in the semiconductor industry.
Supply Chain Management
The manufacturing of display drivers is complex and requires several manufacturing stages such as wafer fabrication, gold bumping, and assembly and testing, and the availability of materials such as the processed tape used in TAB packaging. We refer to these manufacturing stages and material requirements collectively as the “supply chain”. Panel manufacturers typically operate at high levels of capacity utilization and require a reliable supply of display drivers. A shortage of display drivers, or a disruption to this supply, may disrupt panel manufacturers’ operations. As a result, a company’s ability to deliver its products on a timely basis at the quality and quantity required is critical to satisfying its existing customers and winning new ones. Such supply chain management is particularly crucial to fabless display driver companies that do not have their own in-house manufacturing capacity. In the case of display drivers, supply chain management is further complicated by the high-voltage CMOS process technology and the special assembly and testing requirements that are not standard in the semiconductor industry. Access to this capacity also depends in part on display driver companies having received assurances of demand for their products since semiconductor manufacturing service providers require credible demand forecasts before allocating capacity among customers and investing to expand their capacity to support growth.
Need for Higher Level of Integration
The small form factor of smartphone, tablet, automotive and certain consumer electronics products restricts the space for components. Small and medium-sized panel applications typically require one or more source drivers, one or more gate drivers and one timing controller, which can be installed as separate semiconductors or as an integrated single-chip driver. Customers are increasingly demanding higher levels of integration in order to manufacture more compact panels, simplify the module assembly process and reduce unit costs. Display driver companies must be able to offer highly integrated chips that combine the source driver, gate driver and timing controller, as well as semiconductors such as memory, power circuit and image processors, into a single chip. Due to the size restrictions and stringent power consumption constraints of such display drivers, single-chip drivers are complex to design. For large-sized panel applications, integration is both more difficult to achieve and less important since size and weight are less of a priority. Lastly, as some of our TFT-LCD panel customers had turned to pure in-cell TDDI panel development for thinner display designs, we have developed a series of single chip touch display driver integrated circuit (TDDI) for advanced in-cell touch display panel.
25
Products and Solutions
We have several principal product lines:
| ● | Display drivers and timing controllers; |
| ● | Touch controller ICs; |
| ● | ASIC service; |
| ● | LCoS and MEMS products; |
| ● | Power ICs; |
| ● | CMOS image sensor products; |
| ● | Wafer level optics products; |
| ● | 3D sensing business; and |
| ● | Ultralow power WiseEye smart image sensing. |
Display Drivers and Timing Controllers
Display Driver Characteristics
Display drivers deliver precise analog voltages and currents that activate the pixels on panels. The following is a summary of certain display driver characteristics and their relationship to panel performance.
| ● | Resolution and Number of Channels. Resolution refers to the number of pixels per line multiplied by the number of lines, which determines the level of fine detail within an image displayed on a panel. For example, a color display screen with 1,024 x 768 pixels has 1,024 red columns, 1,024 green columns and 1,024 blue columns for a total of 3,072 columns and 768 rows. The red, green and blue columns are commonly referred to as “RGB.” Therefore, the display drivers need to drive 3,072 column outputs and 768 row outputs. The number of display drivers required for each panel depends on the resolution of the panel and the number of channels per display driver. For example, an XGA (1,024 x 768 pixels) panel requires eight 384-channel source drivers (1,024 x 3 = 384 x 8) and three 256-channel gate drivers (768 = 256 x 3), while a full HD (1,920 x 1,080 pixels) panel requires eight 720-channel source drivers and four 270-channel gate drivers. The number of display drivers required can be reduced by using drivers with a higher number of channels. For example, a full HD panel can have six 960-channel source drivers instead of eight 720-channel source drivers. Thus, using display drivers with a higher number of channels can reduce the number of display drivers required for each panel, although display drivers with a higher number of channels typically have higher unit costs. |
| ● | Color Depth. Color depth is the number of colors that can be displayed on a screen, which is determined by the number of shades of a color, also known as gray scale, that can be shown by the panel. For example, a 6-bit source driver is capable of generating 26 x 26 x 26 = 218, or 262K colors, and similarly, an 8-bit source driver is capable of generating 16 million colors. Typically, for TFT-LCD panels currently in commercial production, 262K, 16 million and 1 billion colors are supported by 6-bit, 8-bit and 10-bit source drivers, respectively. |
| ● | Operational Voltage. A display driver operates with two voltages: the input voltage (which enables it to receive signals from the timing controller) and the output voltage (which, in the case of source drivers, is applied to liquid crystals and, in the case of gate drivers, is used to switch on the TFT device). Source drivers typically operate at input voltages from 3.3 to 1.8 volts and output voltages ranging from 4.5 to 24 volts. Gate drivers typically operate at input voltages from 3.3 to 1.8 volts and output voltages ranging from 10 to 50 volts. Lower input voltage saves power and lowers electromagnetic interference, or EMI. Output voltage may be higher or lower depending on the characteristics of the liquid crystal (or diode), in the case of source drivers, or TFT device, in the case of gate drivers. |
26
| ● | Gamma Curve. The relationship between the light passing through a pixel and the voltage applied to it by the source driver is nonlinear and is referred to as the “gamma curve” of the source driver. Different panel design and manufacturing processes require source drivers with different gamma curves. Display drivers need to adjust the gamma curve to fit the pixel design. Due to the materials and processes used in manufacturing, panels may contain certain imperfections which can be corrected by the gamma curve of the source driver, a process which is generally known as “gamma correction.” For certain types of liquid crystal, the gamma curves for RGB cells are significantly different and thus need to be independently corrected. Some advanced display drivers feature three independent gamma curves for RGB cells. |
| ● | Driver Interface. Driver interface refers to the connection between the timing controller and display drivers. Display drivers increasingly require higher bandwidth interface technology to address the larger data volume necessary for video images. Panels used for higher data transmission applications, such as televisions, require more advanced interface technology. The principal types of interface technologies are transistor-to-transistor logic, or TTL, reduced swing differential signaling, or RSDS, mini-low voltage differential signaling, or mini-LVDS, and point-to-point high-speed interface. Among these, RSDS, mini-LVDS and point-to-point interface were developed as low power, low noise and low amplitude methods for high-speed data transmission using fewer copper wires and resulting in lower EMI. Moreover, there are some panel manufacturers developing their proprietary point-to-point interfaces, such as embedded panel interface, or EPI, USI-T, iSP, CEDS, CHPI, CSPI and CMPI. |
| ● | Package Type. The assembly of display drivers typically uses TAB and COG package types. COF and TCP are two types of TAB packages, of which COF packages have become predominantly used in recent years. Customers typically determine the package type required according to their specific mechanical and electrical considerations. In general, display drivers for small-sized panels mainly use COG package types, whereas display drivers for large-sized panels primarily use TAB package types and, to a lesser extent, COG package types. |
Large-Sized Applications
We provide source drivers, gate drivers, PMIC, P-gamma OP level shifter and timing controllers (TCON) for large-sized panels principally used in desktop monitors, notebook computers and televisions. Display drivers used in large-sized applications feature different key characteristics, depending on the end-use application. For example, the industry trend for large-sized applications is generally toward super high channel, low power consumption, low cost, thin and light form factor, touch function, higher data transmission rate and higher driving capabilities. Higher speed interface technologies are also key for 4Kx2K and 8Kx4K high-resolution TVs. Greater color depth, thermal solution, high data rate and high driving, are particularly important for advanced televisions and certain monitors.
Our large display driver IC business achieved several milestones since 2019. For example, we successfully added 12-inch fabs into the pool of our foundry capacity for our large display driver ICs to ease the capacity shortage of 8” foundry where the vast majority of large panel driver ICs are fabricated. On high-end TV, Himax outpaced peers to lead the mass production of customized high-speed point-to-point (P2P) transmission using embedded panel intra interface such as iSP, CHPI, USI-T, CMPI, CEDS and CSPI for 4K TVs and 8K TV. On gaming monitor, we have high frame rate and high driving driver to meet various resolutions needs and frame rates such as UHD 240Hz, QHD 360Hz, FHD 480Hz, etc. We also successfully developed low power consumption driver applied in low power monitor to satisfied Energy Star 8.0 and even Energy Star 9.0. Lastly, our P2P driver and TCON ICs with 13.3” FHD can meet Intel 1W project requirements.
We also made tremendous progress in TCON product lines in 2022. The UHD TV penetration rate is larger than 65% in 2022, and we developed competitive UHD TV TCON to seize this market. Himax UHD TV TCON has mass production at all major China LCD makers. We also provide gaming TCON for the new QHD 360Hz and UHD 240Hz gaming monitor and notebook. For high-end gaming requirement, we have developed eDP 8.1G TCON to increase bandwidth.
27
The table below sets forth the features of our products for large-sized applications:
Product |
| Features |
TFT-LCD Source Drivers |
| ● 384 to 1920 output channels ● 6-bit (262K colors), 8-bit (16 million colors) or 10-bit (1 billion colors) ● one gamma-type driver ● two gamma-type drivers to improve display quality ● three gamma-type drivers (RGB independent gamma curve to enhance color image) ● output driving voltage ranging from 7 up to 20V ● input logic voltage ranging from standard 3.3V to low power 1.8V and support half VDDA ● low power consumption and low EMI ● support COF and COG package types ● support TTL, RSDS, mini-LVDS (up to 460MHz), cascade modulated driver interface, or CMDI, point-to-point high speed interface (up to 4Gbps for 8K 120Hz) and customized interface technologies ● support dual gate and triple gate panel designs |
28
Product |
| Features |
TFT-LCD Gate Drivers |
| ● 192 to 1600 output channels ● output driving voltage ranging from 10 up to 40v ● input logic voltage ranging from standard 3.3V to low power 1.8V ● low power consumption ● support COF and COG package types ● support dual gate and triple gate panel designs |
Timing Controllers |
| ● product portfolio supports a wide range of resolutions, from VGA (640 x 480 pixels) to full HD, UHD and 8K4K (1,920 x 1,080 pixels, 1,920 x 1,200 pixels, 3840 x 2160 and 7680 x 4320) ● support mini-LVDS, point-to-point high speed interface and customized output interface technologies ● embedded overdrive function to improve response time ● support CABC and local dimming to save power and color engine to enhance color and sharpness ● support LVDS, eDP, MIPI and V-by-one input interface technologies ● support dual-gate, triple-gate, GOA (gate on array) and RGBW panel designs ● support amorphous silicon, IGZO and LTPS panel ● ASIC AMOLED Timing Controller ● ASIC uLED Timing Controller |
Programmable Gamma OP | ● 8 to 16 channel gamma buffer outputs ● channel VCOM buffer output ● Internal non-volatile memory ● 2 gamma bank selection, setting time < 3uS ● Analog power supply voltage: 9.0V to 20.0V ● Digital power supply voltage: 2.7V to 3.6V ● Peak current on gamma channels: 200mA ● Peak current on VCOM channel: 400mA ● Programmable VCOM limit ● 12C speed up to 1MHz |
Small and Medium -Sized Applications
Automotive Display Applications
We offer source drivers, gate drivers, timing controllers and integrated drivers for the fast-ramping automotive display applications, such as instrument cluster display (ICD), center stack display (CSD), head-up display (HUD), rear seat entertainment display (RSE), rearview mirror display and sideview mirror display.
29
The automotive display drivers can support various display resolutions to meet the customized needs of automotive display, including GIP panel and non-GIP panel, a-Si TFT panel and LTPS panel. Meanwhile, the automotive display drivers can support higher output driving voltage for higher contrast ratio and faster liquid crystal response in automotive display applications. The automotive Timing Controller can support Local Dimming function for the goal of higher contrast ratio and thermal reduction in automotive display applications. We launched the world’s first TDDI design for automotive displays technology which started shipping in 2019 with meaningful mass production shipment to industrial leading automotive panel house, Tier-1 and brands starting 2021.Himax is the market leader in automotive display driver business covering the entire spectrum of products and technologies, including the industry’s most comprehensive traditional DDIC product offerings as well as leading solutions for new technology areas such as TDDI, local dimming TCON, LTDI and AMOLED. Our automotive TDDI is broadly adopted by named Tier 1s and auto makers in their new launches of vehicles. Himax also have reached over 10 million units shipment accumulated in the third quarter of 2022, a milestone that demonstrates a robust growing trajectory moving forward. In 2023, Himax successfully supplied over 20 million units of automotive TDDI, and we are witnessing a continued expansion of TDDI design-wins across various segments. With the initiation of LTDI mass production in the third quarter of 2023, we are poised for further growth in our overall market share within the automotive display driver market. Our unwavering commitment to technological innovation sets us apart from our competitors, positioning us as leaders in the development of next-generation automotive display solutions. In addition, on TCON ICs for automotives, we also have embedded local dimming feature in TCON for TFT-LCD to support higher contrast instrument panels needed for drivers to read the content of the meter quickly. Additionally, several key panel makers have sought cooperation with Himax to develop AMOLED solutions for automotive applications. We have developed customized AMOLED ASICs, including traditional DDICs and TCONs, for some of these key panel makers, with some already in mass production since 2021. Furthermore, a series of AMOLED Touch Controller ICs for Automotive OLED displays are available, with multiple design wins secured from panel makers and OEMs across the board. Mass production is scheduled to begin in the second half of 2024. By combining these advancements, we can offer a comprehensive automotive AMOLED solution to our customers.
The following table summarizes the features of our products used in automotive display applications:
Product |
| Features |
|---|---|---|
TFT-LCD Source Drivers | ●642 to 1,920 output channels ●6-bit (262K colors), 8-bit (16.7 million colors) ●support RSDS, mini-LVDS, Point-to-Point interfaces ●output driving voltage ranging up to 15V ●support COG and COF package type | |
TFT-LCD Gate Drivers | ●100 to 1,600 output channels ●output driving voltage ranging up to 40V ●support COG and COF package type | |
TFT-LCD Integrated Drivers | ●highly integrated chip embedded with source driver, timing controller and power circuit ●support RGB, LVDS input interfaces ●support Single Gate, Dual Gate, Triple Gate panel structure ●support 2MUX, 3MUX, 4MUX, 6MUX LTPS panel structure ●support GIP panel (a-TFT GIP or LTPS GIP or IGZO GIP) and non-GIP panel ●support resolution up to 7680 RGBx810 with cascaded chips ●source driver output driving voltage ranging up to ±6.6V or 16V ●support Fail Detect Function, including CRC Function ●support Local Dimming Function ●support Telltale OSD function ●support COG and COF package type |
30
Product |
| Features |
|---|---|---|
Timing Controllers | ●support LVDS, eDP 1.2 input interface ●support mini-LVDS, Point-to-Point output interfaces ●support Single Gate, Dual Gate, Triple Gate panel structure ●support 2MUX, 3MUX, 6MUX LTPS panel structure ●support GIP panel (a-TFT GIP or LTPS GIP or IGZO GIP) and non-GIP panel ●support various resolutions up to 4K2K(ICD) or 8K1K(CID) ●support Local Dimming Function ●support Dual Cell Panel Structure Function ●support Fail Detect Function, including CRC Function ●support Over Driver & De-mura function ●support Telltale OSD function | |
TFT-LCD TDDI | ●highly integrated chip embedded with source driver, timing controller, touch controller and power circuit ●support LVDS input interfaces ●support Single Gate, Dual Gate, Triple Gate a-TFT panel structure ●support 2MUX, 3MUX, 4MUX and 6MUX LTPS panel structure ●support GIP panel (a-TFT GIP or LTPS GIP) and non-GIP panel ●support resolution up to 7680RBx900 with 4 chips cascaded ●source driver output driving voltage ranging up to ±6.6V ●support Fail Detect Function, including CRC Function ●support Telltale OSD function ●support Color Engine function ●support COG package type | |
TFT-LCD LTDI | ●Large-sized Touch and Display Integration solution ●support point-to-point iSP input interface ●support resolution up to 12K1K with multi-chip cascaded ●support COF and COG package types | |
OLED Drivers | ●High-voltage process ●High channel and high speed interface ●Embedded P-gamma OP ●IGZO/AMOLED Solution ●Low power solution ●Support up to 4K2K/8K4K resolution ●Customized ASICs | |
OLED TCONs | ●support high resolution up to 7.6Kx1K at 120Hz w/ VRR ●support eDP v1.4 1/2/4Lane 8.1Gbps, w/ DSC1.2a ●support 2-chip cascade ●passed AEC-Q100 Grade 2 |
Smartphone and Tablet Applications
We offer display drivers for small and medium-sized displays in smartphone and tablet applications that combine source driver, gate driver, timing controller, DC to DC circuits, and optional frame buffer into a single chip or cascades chips in various display technologies, such as TFT-LCD and OLED.
31
Smartphones and tablet have gained greater popularity among small and medium-sized display drivers and enjoyed high growth in recent years. This has also contributed to increased demand for larger size and higher resolution smartphone displays. In 2016, Himax developed a series of single chip touch display driver integrated circuit (TDDI) for advanced in-cell touch display panel. Himax started the shipments of in-cell TDDI for some smartphones in 2016 and extended TDDI solution to tablet application in 2017. In-cell TDDI, featuring thinner display, slimmer border, and better visual quality, has been getting popular, so we re-invented a new generation of TDDIs supporting COG and COF for 18:9 or wider aspect ratio with interlaced output pins, which makes the bottom border of the in-cell touch display even smaller to gain higher display to body ratio. Our FHD+ and HD+ TDDI successfully gained design-wins with a few leading Korean and Chinese smartphone brands and panel makers. We started small volume shipments in the first half of 2018 with accelerating volume starting in the second half of 2018 into 2019 and beyond. Starting in 2020, Himax extended our product offerings with high frame rate TDDI solution and has started shipping to top-tier smartphone OEMs.
A major development we are seeing in the marketplace is increased utilization of the OLED display for smartphone, smart watch, automotive and tablet. We are collaborating closely with leading panel makers across China and Korea for AMOLED product development in smartphone, tablet, automotive and other consumer electronics. In the first quarter of 2022, the Company’s flexible AMOLED driver and TCON for automotive display successfully ramped up for a customer’s flagship EV model, while in the second quarter of 2022, the Company commenced production of AMOLED TCON and Driver IC chipsets for tablet applications for a leading OEM for their 11-inch and 12.6-inch flagship models. Concurrently, the number of awarded projects in AMOLED for automotive and tables with worldwide named vendors is increasing. Himax continues its R&D efforts to upgrade new TCON and OLED DDIC solutions for tablet PC applications. We believe AMOLED solutions, including driver ICs and TCONs, will become one of the major growth engines for the Company moving forward.
On the other hand, the application of in-cell TDDI started to extend from mainstream smartphone to larger displays in 2018. Himax started to offer various new TDDI solutions for tablet, smart speakers, and even some infotainment displays in automobiles. The first tablet TDDI with WXGA resolution went into mass production in 2018 and also extended to leading smart speaker applications as well. In 2019, Himax announced a series of new driver and TDDIs for tablet application. The COF packaged driver IC solution enabled one leading tablet OEM to successfully launch a WQXGA resolution tablet with super slim bezel. We also added another new features to our TDDI that can support up to WUXGA and WQXGA resolution which has gained several design-wins from tablet OEMs across Korea and China in 2019. We also launched the first TDDI supporting active stylus function in tablets which commenced mass production and contributed to our tablet application business in early 2020. With the demand increase for bigger size display, higher resolution, and precise touch accuracy and stylus performance, Himax kept developing new tablet TDDIs to broaden the company’s product lineup to maintain our leading market position. We started mass production for the world’s first 12.4” WQXGA super high-resolution in-cell tablet PC with a leading end customer in 2021 and expanded collaborations with more brands into more models moving forward.
Tablet in-cell TDDI offers the benefits of lower cost and a simplified supply chain that represents an easier manufacturing process for panel makers. For consumers, it offers a lighter weight, slimmer and more stylish design as well as improved touch accuracy with added option for active stylus. Our active stylus in-cell technology is adopted in many launched tablet products. At present, we are the dominant supplier for literally all leading Android names. In 2020, tablet demand picked up significantly, fueled mainly by remote work and online learning demand due to the pandemic. TDDI for tablet application continues to broaden its market, representing a potential upside for Himax into 2023 and beyond.
32
The following table summarizes the features of our products for smartphone and tablet applications:
Product |
| Features |
|---|---|---|
TFT-LCD TDDI for smartphone and tablet | ●In-cell TDDI (Touch and Display Driver Integration) as a highly integrated single chip embedded with the source driver, gate driver, power circuit, timing controller and memory, touch sensor ADCs and microcontroller ●Mainstream smartphone single chip for HD+ (720RGB x Y pixels) or FHD+ (1080RGB x Y pixels) ●Mainstream tablet PC resolutions for WXGA (800RGB x Y) with single chip or WUXGA (1200RGB x Y), WQXGA (1600RGB x Y) with 2-chip cascaded ●Conventional 60Hz and up to 144Hz new high frame rate solutions ●Support MIPI interface and VESA DSC ●Support up to 16 million colors ●Support active stylus for tablet PC ●COG and COF solutions for super slim bottom border | |
TFT-LCD Tablet Display Drivers | ●highly integrated single chip embedded with the source driver, power circuit and timing controller ●suitable for a wide range of resolutions from WSVGA (600 x 1024), WXGA (800 x 1280), WUXGA (1200x1920) to WQXGA (1600 x 2560) ●support up to 16 million colors ●support RGB separated gamma adjustment ●support CABC ●support color enhancement features ●support MIPI interface ●touch display driver integrated circuit (TDDI) for advanced in-cell touch display ●supporting TDDI with active stylus ●COG and COF solutions for super slim bezel | |
AMOLED Solutions | ●Smartphone single chip with sub-pixel rendering, Demura-IPs for FHD+ resolution with up to 144Hz high frame rate ●Support MIPI interface and VESA DSC with 1 billion colors (10bit grayscale) ●TCON and Source driver IC for tablet with high resolution of 3.2Kx2K 144Hz with VRR ●customized ASICs |
Electronic Paper Display Applications
We offer display driver for the Electronic Paper Display (EPD) applications, Electronic Shelf Label (ESL) and Signage Display. The Electronic Paper Display (EPD) drivers can support various display resolutions to meet the customized needs of applications. We are collaborating with world-leading e-paper customers for certain ASIC projects on their next generation products. This consolidates our market presence in the emerging e-reading and e-signage segments from 2022 and onward.
33
The following table summarizes the features of our Electronic Paper Display (EPD) solutions:
Product |
| Features |
Electronic Paper Display (EPD) Source Drivers | ●Features 320 to 1296 output channels ●output driving voltage ranging from 15 up to 50v ●input logic voltage ranging from standard 3.3V to low power 1.8V ●low power consumption and low EMI ●support TTL, mini-LVDS cascade modulated driver interface, or MIPI high-speed interface and customized interface technologies ●support COF and COG package types | |
Electronic Paper Display (EPD) Gate Drivers | ●100 to 972 output channels ●output driving voltage ranging from 10 up to 50v ●input logic voltage ranging from standard 3.3V to low power 1.8V low power consumption ●support COF and COG package types | |
Electronic Paper Display (EPD) Timing Controller | ●Support MIPI 4 lane input interface ●Support TTL, mini-LVDS output interface ●Support maximum resolution 3840x2160 ●Use USB/SPI/I2C control interface ●Support LPDDR2 memory | |
Electronic Shelf Label (ESL) Integrated Drivers | ●Highly integrated chip embedded with source driver, timing controller and power circuit ●Source driver output driving voltage ranging up to 30V ●Support COG package types |
Touch Controller ICs
We offer touch controller solutions for capacitive touch panels. Our touch controller solutions are suitable for touch panels in electronic devices with TFT-LCD or OLED displays, such as smartphones, tablets, automotive displays, and notebooks. We commenced production of capacitive touch controller ICs for on-cell TFT-LCD displays with smartphone brand customer since 2011. Subsequently, we expanded our customer base to include more well-known smartphone and tablet brands. In 2015, we developed a series of TDDI products for Tier 1 and panel makers and commenced mass production for smartphone brands. Additionally, we began mass production of our TDDI for tablet and automotive displays in 2019. TDDI has gradually replaced on-cell touch controllers and discrete driver solutions, offering thinner displays, slimmer borders, and better visual quality, thus becoming the mainstream technology. We continue to expand our TDDI solutions to replace discrete DDICs and touch controller ICs in the TFT-LCD display market.
Since 2023, aligning with the market trend of OLED display proliferation, we embarked on developing AMOLED on-cell touch controllers tailored for tablets, notebooks, and automotive OLED displays. Our AMOLED on-cell capacitive touch controller boasts several innovations and merits. It is meticulously engineered, featuring an industry-leading touch signal-to-noise ratio exceeding 45 dB, making it the ideal solution to meet the demands of flexible OLED panels commonly required for automotive applications. It also offers improved sensitivity to challenging user conditions such as glove-wearing and wet finger operations, ensuring exceptional performance with display quality unaffected by touch-display interactions. Moreover, our touch controller not only supports multi-finger capacitive touch and is compatible with various types of OLED panels, but it can also cascade multiple chips to support displays larger than 20 inches. For consumer and IT applications, it boasts a 240Hz high touch report rate at 5-finger operating conditions, and its embedded micro-controller single-chip solution reduces costs for flexible products. To support the state-of-the-art active stylus feature of tablet and notebook touchscreens, our AMOLED touch controller integrates multiple active stylus protocols, such as USI, MPP, LPP, and HPP. Our AMOLED designs have garnered several design wins from leading customers and are set to commence production in 2024.
34
The following table summarizes the features of our touch controller products:
Product |
| Features |
AMOLED Capacitive Touch Controller | ●multi-finger (up to 10 fingers) capacitive touch for on-cell AMOLED ●high touch SNR > 45dB, effectively reducing display interference and offering better display quality ●high touch report rate: 240Hz @5 fingers ●support large size panel (>20 inches) ●supports multi-chip cascading without extra MCU ●integrate multiple active stylus protocols: USI, MPP, LPP and HPP ●low power consumption ●(automotive) support glove-wearing (up to 4 mm) and wet finger operations ●(automotive) CISPR25 Class-5 EMC qualified ●(automotive) support temperature range from -40 °C to 105 °C |
ASIC service
From 2012, we successfully completed several ASIC service projects for Japan top TV, Projector and HMD makers with advanced and high-performance customized video processing chips. All of these chips are implemented with our proprietary video process platform that includes our video process display IPs and high-speed transmission IPs. The process nodes adopted for these ASICs are usually 40nm, 55nm and even 28nm processes. From 2016, we also developed the depth sensing technology that aims 3D sensing and AR/VR markets.
The following table summarizes the features of our ASIC service:
Product |
| Features |
ASIC Service | ●Well-established ASIC development platform, based on our unique video processor and image processing technologies. ●offer a wide variety of video interface IPs, like LVDS, HDMI, DVI, V-by-one, Display port, MIPI, MHL, etc. ●built-in 8/32- bit microprocessor built-in video processing algorithm like super-high resolution, sun-light readable, MEMC, FRC, etc. ●built-in 3D feature technologies like 2D-to-3D, Glasses-free 3D, 3D multi-view, 3D visual protection, etc. ●support 4K x 2K/ 5K x 2K/ 8K x 4K display ●Depth sensing algorithm and hardware accelerator for 3D sensing and AR/VR applications |
LCoS and MEMS Products
Himax Display, our subsidiary, has contributed to our microdisplay products lines: Color-filter LCoS, Color-sequential LCoS, Front-Lit LCoS, Phase modulation LCoS and MEMS.
The latest development of Front-Lit LCoS enables an ultra-compact and extremely power-efficient optical engine by consolidating and integrating LED illumination system and the polarization beam splitter (PBS) into the micro display module itself. Front-Lit LCoS enables a much-simplified optical engine design and assembly process that could successfully lowered customers’ manufacturing time and costs.
Himax Display is one of the market leaders of the LCoS industry since 2012 with its whole product line patented. Himax Display has a mass production ready liquid crystal assembly line, which is unique in the industry with mass production shipping volume. We have produced and shipped over 3 million units from this ISO certified line. Our customers use our products in various applications such as pico-projector, communication, toy projector, AR glasses, and AR-HUD for automotive.
35
The merits of our technology feature in resolution, power consumption, size, cost, optical engine design, and image quality. Many of our industry-leading customers have demonstrated their state-of-the-art products, including pico-projector, holographic display, AR glasses and AR HUD system, with Himax LCoS technology inside at the 2020 CES with positive market feedbacks. Our technology leadership and proven manufacturing expertise have made us a preferred partner for customers in these emerging markets and their ongoing engineering projects in AR glasses and AR HUD for automotive applications. In May 2021, Himax Display revealed its proprietary LCoS 2.0 phase modulation technology, which enable features such as multi-focal plane images displaying along with less power consumption, lower cost and smaller form factor to enable holographic display applications for AR-HUD. In addition, phase modulation technology provides LiDAR for autonomous driving and Wavelength Selective Switch (“WSS”) for Wavelength-Division Multiplexing (“WDM”) optical communications networks. In May 2023, Himax Display unveiled the cutting-edge color sequential Front-lit LCoS for advanced AR glasses solutions at Display Week. It’s a new technology that features a lightweight, compact form factor and high brightness. Several tech giants in the industry have shifted their focus away from micro-LED to our Front-Lit LCoS for their AR goggles after seeing Company’s live demo at the event. This shift is demonstrative of our exceptional achievements in both performance and functionality, marked by breakthroughs not only in the luminance performance in full RGB color, but also in terms of superior optical efficiency, tiny form factor and ultra-lightweight design. These factors are critical and represent technological advancements that may meet rigorous requirements to support next generation see-through goggles.
We provide a rich products family for customers to choose for different applications, as each product has its own most important parameters to select and Himax Display provides choices to customers. The following table shows certain details of our products:
Product |
| Size and Resolution |
Color-Filter LCoS Microdisplays | ●0.28” (320x3x240 pixels) QVGA ●0.29” (800x3x480 pixels) WVGA ●0.35” (1280x3x720 pixels) HD ●Customized design | |
|
| |
Color-Sequential LCoS Microdisplays | ●0.22” (640 x 360 pixels) nHD ●0.37” (1366 x 768 pixels) WXGA ●0.37” (1920 x 1080 pixels) Full HD ●Customized design | |
| ||
Front-Lit Color Filter LCoS | ●0.22” (640 x 3x 360 pixels) nHD ●0.35” (1280 x3x 720 pixels) HD ●Customized design | |
Front-Lit Color Sequential LCoS | ●Low power and high efficiency ●Display diagonal : 0.243” ●Size(W*L*H) : 9*13.9*4 mm ●Volume: 0.5 c.c. ●Resolution: 1024x1024 ●Brightness: 110,000 nits (Typ.); 180,000 nits (Max.) ●LED Power : 300 mW (Typ.); 500 mW (Max.) | |
Phase Modulation LCoS | ●Selective phase range based on the required response time. ●Analog drive scheme with 120Hz refresh frame rate to reduces optical flicker and provides stable phase response over time. ●Customized design ●Operated in full phase modulation (0~2π) in visible range | |
| ||
MEMS | ● 0.55” (1280 x 800 pixels) WXGA |
36
Power ICs
Himax provides TFT-LCD television, monitor and notebooks power management solutions. The main products are Power Managements ICs (PMIC), Programmable Gamma OP ICs (PGOP) and Level Shifter ICs (LS). In recent years, PMIC/PGOP 2-in-1 and PMIC/PGOP/LS 3-in-1 PMIC have gradually become the mainstream solutions. Besides, Himax also provides power management solutions for OLED notebooks.
Power Management ICs
A power management IC integrates several power components to fulfill system power requirements. It may include step-up or step-down pulse width modulation, or PWM, DC-to-DC converters, low-dropout regulators, or LDO regulators, voltage detectors, operational amplifiers, p-gamma OP, level shifters, and/or other components. For panel module applications, a power management IC provides a reliable and precise voltage for source drivers, gate drivers, timing controllers, and panel cells. Moreover, its built-in over-temperature and over-current protections help prevent components from being damaged under certain abnormal conditions. As integrating an increasing number of components into a power management IC is likely to be a continuing trend, we believe power management ICs will continue to be critical components of a TFT-LCD and OLED panel module. The following table summarizes certain features of our power management IC products:
Product |
| Features |
Integrated Multi-Channel Power Solutions for TFT-LCD and OLED Notebooks | ●PMIC, PGOP 2-in-1 and Level Shifter ●2ch programmable gamma voltage inside ●PAVDD Synchronous Boost Converter ●NAVDD Synchronous Inverting Converter ●VGH / VGL Synchronous SIBO Converter ●3ch Vint OP for OLED Panel ●built-in power MOSFET ●step-up PWM converter ●charge pump regulator ●LDO regulator ●programmable voltage detector ●gate pulse modulator ●Vcom operational amplifier ●I2C programmable ●low frame rate control for power saving solution ●built in UVLO, UVP, OVP, SCP and OTP protection | |
Integrated Multi-Channel Power Solutions for Monitors | ●PMIC, PGOP and Level Shifter 3-in-1 ●built-in power MOSFET ●step-up PWM converter ●HV LDO regulator ●programmable voltage detector ●gate pulse modulator ●programmable Vcom voltage / Vcom operational amplifier ●programmable gamma voltage with operational amplifier ●built in UVLO, UVP, OVP, SCP and OTP protection | |
37
Integrated Multi-Channel Power Solutions for TVs | ●PMIC, PGOP 2-in-1 and Level Shifter ●built-in power MOSFET ●step-up PWM converter ●step-down PWM converter ●charge pump and buck-boost regulator ●HV LDO regulator ●programmable voltage detector ●gate pulse modulator ●Vcom operational amplifier ●I2C programmable ●programmable gamma voltage with operational amplifier ●built in UVLO, UVP, OVP, SCP and OTP protection |
Programmable Gamma OP ICs
It is a Programmable Gamma, DVR and VCOM IC. Each is controlled by a 10-bit digital analog converter (DAC). The user can easily select one of the two gamma curves to compensate for the display. The PGOP also includes a channel DVR, VCOM buffer and built-in 7-bit DAC. Support 128-step to adjust the VCOM output voltage by I2C control setting automatically.
Product |
| Features |
14 channel PGOP for dual gate GOA TFT-LCD | ● Programmable gamma buffer DVR and VCOM buffer ● 14 channel analog output gamma reference voltage ● 10-bit Gamma DAC resolution ● 2 Gamma bank register ● 2 Gamma bank NVM ● Built in output channel resister ● I2C interface |
Level shifter
TFT-LCD panel manufacturers have developed panel designs to reduce the usage of display drivers, like gateless designs, which integrate the gate driver function onto the glass but needed level shifter. All level shifter channels feature the same input circuitry and are compatible with the standard logic-level signals generated by timing controllers in typical applications. The level shifter converts the timing-controller (TCON) logic-level signals to the high-level signals needed by the GOA (gate on array) display. The output circuitry has been designed to achieve high rise and fall times when driving the capacitive loads typically encountered in TFT-LCD display applications.
Product |
| Features |
16- channel output level shifter for GOA TFT-LCD | ● Support 1 or 2 or 6 input and 4/6/8/10 clock channel output ● 2 channel STV ● 2 channel LC ● Reset and charge sharing function ● OTP/ SCP and OCP function by I2C or Resistor adjustment |
LED driver
A light-emitting diode (LED) is a semiconductor light source that is widely used in lighting, display and TFT LCD backlight nowadays. The advantages of LEDs as light sources are the small size, fast switching, low power consumption and long lifetime etc.
38
LED driver IC is designed to dim the LEDs with critical features such as high current accuracy, high current matching, short LED protection, open LED protection, over voltage protection, ghosting effect reduction and current sink leakage protection etc.
Product |
| Features |
NB backlight driver IC and local diming mini-LED backlight driver IC | ● ASIC by Customer Specification |
CMOS Image Sensor Products
The CMOS image sensor products are developed by our subsidiary, Himax Imaging. The products were designed firstly for camera-equipped mobile devices, such as mobile phones, tablets and notebook computers, with a focus on low light image and video quality. Although it seems relatively challenging for us to gain significant market share in conventional RGB camera, we do think there are various interesting and different applications in imaging. Based on the technologies and IP we developed, on top of legacy products for laptop and multimedia we have been supplying, our product lines have been expanded to cover three domains: ultralow power computer vision- Always-On Sensor (“AoS”), Near Infrared (“NIR”) sensor, and big pixel BSI sensors in automotive and surveillance. In 2019, we further prioritized our focus on ultralow power computer vision- Always-On Sensor (“AoS”) as the demand for battery-powered smart device with AI intelligent sensing is rapidly growing. Together with the technologies we already developed, such as Near Infrared (“NIR”) sensor, we can provide our customers the best integrated solutions for several specific domains.
In specific video applications such as battery-powered surveillance cameras, doorbell cameras, and door-lock cameras, customers require not just an ultralow power sensor for sensing or pre-rolling functions but also high-resolution video for end-users after an event occurs. Himax Imaging addresses these needs by providing a 1/3” 4MP sensor with a 1:1 aspect ratio. This sensor features a 2048x2048 resolution tailored for doorbell and door-lock cameras, delivering a broad Field of View (FOV) in both horizontal and vertical directions. This capability allows users to observe a visitor's entire body, even when they stand very close to the camera. Himax Imaging can offer a variety of these 2-in-1 sensors, combining high-resolution video capabilities with low-resolution ultralow power imaging for the surveillance market.
We’re dedicated to becoming one of the key players in the CMOS image sensor industry. We achieve this through ongoing investment in skilled human resources, optimizing our supply chain, and forging strategic technology advancements and partnerships.
The following table sets forth the features of our CMOS image sensor products:
Product |
| Features |
|---|---|---|
4MP UltraSense 2 NIR Sensor | ●1/3” format color type with high sensitivity BSI pixel ●4MP resolution with 1:1 aspect ratio with Staggered HDR function at 30 frames per second for doorbell application, ●Provide ultralow power mode to support pre-rolling function with Himax WiseEye1 AI processor ●4-lane MIPI CSI2 outputs RAW8/10 ●ES target at 2023 Q2 | |
FHD 1/7” 1080p UltraSense Color Image Sensor | ●1/7” format with high sensitivity BSI pixel ●1080p FHD resolution at 60 frames per second ●Support Always-on mode at 480x270 < 1mW @ 2fps and motion detection ●Support line-based staggered HDR ●2-lane MIPI CSI2 outputs ●Frame-Sync control for multiple camera system | |
39
Product |
| Features |
|---|---|---|
FHD 1/4” 1080p UltraSense Color Image Sensor | ●1/4” format with high sensitivity BSI pixel ●1080p FHD resolution at 30 frames per second ●Low power consumption ●Provide high NIR sensitivity and 4x4 RGB-IR option ●2-lane MIPI CSI2 and 10bit parallel DVP outputs ●Frame-Sync control for multiple camera system | |
HD 720p UltraSense 2 Color Image Sensor | ●1/9” format with high sensitivity BSI pixel ●720p HD resolution at 30 frames per second ●Low power consumption ●Support LED-sync for Microsoft Windows Hello ●1-lane MIPI CSI2 outputs RAW8/10 | |
HD 720p Ultra Low Power Color Image Sensor | ●1/11” format with high sensitivity BSI pixel ●720p HD resolution at 60 frames per second ●Ultra slim design to meet 2.2mm narrow bezel notebook computer ●Provide Ultralow Power mode <1mW for qqHD 3fps for human detection application ●Provide RGB for video and W-IR version for AoS + Windows Hello ●Support Motion Detection to save system power SPI and 1-lane MIPI CSI2 dual outputs for both detection and video | |
1.3MP ClearSense EDR Color Image Sensor embedded with image processor for Surveillance | ●1/4” format with ultra-high sensitivity ●ClearSense achieves higher dynamic range in color up to 84dB with on-chip tone mapping ●800p and 720p resolution at 30 frames per second ●Flexi engine automatically controls dynamic range, exposure, gain, and white balance to balance color fidelity and contrast ●Color processing pipeline including lens shading correction, defect correction, edge enhancement, color interpolation and correction, gamma control, and saturation/hue adjustment. ●Anti-blooming and dark sun cancellation ●Built-in low dropout regulator and power on reset ●10-bit parallel video data port supports RAW, YUV422, and RGB565/555/444 | |
1.2MP UltraSense 2 Color Image Sensor embedded with image processor for Automotive | ●1/4” format with ultra-high sensitivity ●Ultrasense 2 BSI pixel offers higher sensitivity for low light condition ●Operation up to 105ºC ●960p and 720p resolution at 30 frames per second ●Color processing pipeline including lens shading correction, defect correction, edge enhancement, color interpolation and correction, gamma control, and saturation/hue adjustment ●Dynamic Range Optimizer offers best dynamic range of video ●Anti-blooming and dark sun cancellation ●Built-in low dropout regulator and power on reset ●10-bit parallel video data port supports RAW, YUV422, and RGB565/555/444 |
40
Product |
| Features |
|---|---|---|
NTSC/PAL WVGA Color Image System on embedded with image processor for Automotive and Surveillance | ●High sensitivity, low noise VGA sensor operating up to 60FPS ●Visible and near infrared sensitivity ●Operation up to 105ºC ●Ultra-compact automotive package ●Advanced defect correction with built-in temperature sensor ●Embedded ISP with programmable automatic exposure and white balance ●Optical alignment pixel with crop and zoom to native resolution ●4Kb OTP for sensor initialization, module storage, and overlay setting ●Multi-color static overlay engine | |
QVGA Ultralow Power CMOS Color Image System for Machine Vision and Detection | ●High sensitivity, low noise 1/11” 320x320 image area ●Under 2.5mW at QVGA 30fps and 1mW at QQVGA 15fps ●Embedded auto-exposure and motion detection ●NeoPac and CSP package ●Parallel 8bits, 4bits and 1bit data output | |
VGA Ultralow Power CMOS Color Image System for Machine Vision and Detection | ●High sensitivity, low noise 1/6” 640x480 image area ●Operates approximately 7mA VGA 60FPS to 140µA in QVGA 2FPS mode ●Provide high accurate motion detection ●Pre-metered exposure provides well exposed first frame and after extended sleep (blanking) period ●Automatic wake and sleep operation with programmable event interrupt to host processor ●Parallel 8bits and 1-Lane MIPI CSI2 interface |
Wafer Level Optics Products
Wafer level optics are optical products manufactured using semiconductor process on wafers. This innovative approach enables wafer level optics to manufacture micro/nano optics structure and high temperature resistance, making the compatible Surface-Mount Technology or SMT reflow process possible. We offer entire optical solutions for customers who need compact and easy-to-handle optical products on their electronic devices.
Combining traditional optical lens design, precise mold control and semiconductor manufacturing expertise, our WLO lens with integrated waveguide, refractive optics and diffractive optical element (DOE) is one of the best solutions for next generation computational imaging module for 2D/3D illumination and 3D dot projector, which can be applied to 3D face recognition, 3D sensing, 3D reconstruction, and gesture control. Himax is a pioneer in high-precision diffraction optics technology with over 15 years of experience, having worked on very different designs over a variety of applications with some of the world’s most heavyweight tech names. With the innovative process and specific structure, our wafer level optics products provide small form factor and compact module size to be easily integrated into consumer products. The diffraction optics technology is now well adopted in 3D sensing, AR/VR devices, holographic display, automotive, biomedical inspection, optical communication, etc. We are seeing that DOE plays an even more decisive role for the next generation optical technology in light of its high-precision and lightweight characteristics.
Our WLO technology is also adapted to form microstructures such as lens array, DOE and lenticular lenses for advanced applications in digital and computational imaging fields. These technologies stand in a unique position to integral optical design, semiconductor manufacturing process, and compact packaging service, which are rarely covered by one single company. Deeply rooted in core wafer level optics technologies, we provide highly customized optical solutions and high-volume manufacturing to many Tier-1 customers such as structured lighted and ToF 3D sensing on mobile devices, AR/VR gadgets, automotive, biomedical devices and many other AIoT applications.
41
Our WLO business hit inflection in the middle of 2017 when we began mass shipment to an anchor customer. The overall 2018 shipment increased considerably year-over-year because of the customer’s large-scale adoption in more models. In 2019, we continued the strong shipment momentum from 2018 to fulfill an anchor customer’s higher demand with a significant year-over-year increase. We continued our shipment to an anchor customer for their legacy product and continue making progress on R&D projects with world-leading high-tech giants for ToF 3D sensing, AR/VR gadgets, automotive, biomedical devices and others, targeting their future generation products centered around our exceptional design know-how and mass production expertise in WLO technology. One illustration is our WLO technology being deployed by one VR player to empower 3D perception sensing for precise controller-free gesture recognition. We initialed volume production starting in second quarter of 2023.
The following table sets forth the features of our wafer level optics products:
Product |
| Features |
Refractive Optical Lens | ● for Micro Lens Array(MLA) illumination diffuser, lighting control, flux illumination lens, collimation lens, and compact size camera lens ● provide multi-layer solution including optical AR coating, IR-cutting filter coating, aspheric surface ● double-side manufacture process ● already in mass production | |
|
| |
Diffractive Optical Element (DOE) | ● computational imaging, flux illumination, dot projector for 3D sensing, 3D reconstruction, gesture and illumination control ● using WLO process to integral multi-layers DOE and refractive lens ● provide customized solution for specific application ● the smallest form factor and reflowable component ● eye safety detect circuit embedded | |
|
| |
Diffuser element for flood illumination and TOF | ● using WLO process to integral multi-layers DOE technology ● the smallest form factor and reflowable component ● eye safety detect circuit embedded | |
Near Infrared (NIR) Projector Module | ● dot projector module solution for computer vision, 3D sensing, 3D reconstruction, gesture and illumination control ● integral NIR Laser (830/850/940nm), optical system (refractive+ diffractive lens) and high precise active alignment assembly solution to provide the smallest form factor ● module design for smartphone and other mobile devices ● provide customized module solution for different application ● the smallest form factor and reflowable device ● including active eye safety solution (Class-1) | |
Flood illumination Module | ● provide customized solution for specific application integral NIR Laser (830/850/940nm), and high precise active alignment assembly solution ● module design for smartphone and other mobile devices ● the smallest form factor and reflowable device ● including active eye safety solution (Class-1) | |
3D Sensing Business
We continue to participate in most of the smartphone OEMs’ ongoing time-of-flight (ToF) 3D sensing projects. In 2018, our structured light-based 3D sensing total solution targeting Android smartphone’s front-facing application was unsuccessful due to the high hardware cost of 3D sensing, the long development lead time required to integrate it into the smartphone and the lack of killer applications which is limited to phone unlock and online payment. Instead of 3D sensing, most of the Android phone makers have chosen the lower cost fingerprint technology which can achieve similar phone unlock and online payment functions with somewhat compromised user experience.
42
As a leading provider of 3D sensing technology, Himax is also an active participant in smartphone OEMs’ design projects for new devices involving ToF technology. We are seeing increasing ToF adoption by smartphone makers for world-facing cameras to enable advanced photography, distance/dimension measurement and 3D depth information generation for AR. Unlike structured light 3D sensing where we provide total solution or just projector module or optics depending on customers’ needs, with ToF, we will only focus on transmitter module or optics component by leveraging our WLO related expertise. Leveraging on our WLO technology, we have provided our partners with spot projectors or optics components for their reference design.
3D sensing can have a wide range of applications beyond smartphone. We have started to explore business opportunities in various industries by leveraging our structured light 3D sensing total solution. Starting in 2021, we shipped small volume of business access control and biomedical inspection devices. To strengthen our offers in 3D sensing total solution, we have been collaborating closely mainly with two types of partners: those with industry-leading expertise in facial recognition algorithm and those offering application processors with strong AI capability.
Other than 3D sensing total solution, we also provide key component, including 3D decoder IC and 3D vision processors. Our proprietary 3D decoder IC can accelerate local image processing for face recognition and offer best-in-class security authentication, therefore it is particularly suitable for customers who wish to design their own structured light-based 3D sensing solution. It was already certified by the leading Chinese electronic payment standard with requirements of accurate data decoding, timely operation and strict privacy and now it’s well-adopted by many China e-payment solution providers. Our proprietary 3D decoder IC entered into volume production starting in 2020, followed by meaningful volume shipments into 2021 and 2022. In the light of increasing adoption of 3D sensing technologies in various aspect of our daily life, a series of next generation 3D vision processors is also under development to support a variety of state-of-the-art 3D sensing technologies in Time of Flight (”ToF”) and structured light, aiming to improve user experience when people interact with AR and VR applications.
Our critical 3D sensing Technologies includes the following:
Wafer Level Optics Products
WLO is one of the key technologies enabling 3D sensing, AR goggle devices, and many other applications. Levering on our exceptional design know-how and mass production experience in WLO technology, we are able to produce the world’s most compact optics required for 3D sensing, while also achieving superior performance and lower costs.
ASIC
One of the critical elements of our 3D sensing total solution is an ASIC for 3D depth map generation. We are able to develop the ASIC thanks to our unique in-house capability in developing video ASICs for customers. Equipped with the ASIC, our 3D sensing total solution can substantially reduce the power consumed while processing 3D sensing, enhance personal data security, accelerate the 3D depth map generation, and provide superior depth data output that matches with our optical component. We consider this unique capability as our competitive advantage. It has been and will continue to be one of our key drivers in the success of our 3D sensing total solution.
Active Alignment
With much experience in optical assembly for AR and VR devices, our factory has developed a system to do active alignment for tiny components. From the incoming quality check, assembly process, and testing, all steps are monitored and checked. The precision assembly capability gives us a very good foundation to do the optical assembly for DOE, WLO, and laser.
Laser Driver
Based on our expertise in projector, optics, and driver, we have designed a special Glass Broken Detection (“GBD”) mechanism on our projector. We also have a proprietary laser driver design that detect the connection of the GBD on the projector. When GBD connection is abnormal, which means glass was broken, the laser driver can cease the laser to prevent users from being exposed to higher power laser energy leaking from the broken glass.
43
The following table sets forth the features of our SLiM 3D sensing solutions:
Product |
| Features |
SLiM 3D sensing total solution | ● Dot projector: More than 33,000 invisible dots, the highest in the industry, projected onto object to build the most sophisticated 3D depth map among all structured light solutions ● Depth map accuracy: Error rate of < 0.5% within the entire operation range of 30cm-100cm ● Face recognition: Enabled by the most sophisticated 3D depth data to build unique facial map that can be used for instant unlock and secure online payment ● Indoor/outdoor sensitivity: Superior sensing capability even under total darkness or bright sunlight ● Eye safety: Certified for IEC 60825 Class 1, the international laser product standard which governs laser product safety under all conditions of normal use with naked eyes ● Glass broken detection: Patented glass broken detection mechanism in the dot projector whereby laser is shut down instantaneously in the event of broken glass in the projector ● Power consumption: Less than 400mW for projector, sensor and depth decoding combined, making it the lowest power consuming 3D sensing device by far among all structured light solutions ● Module size: the smallest structured light solution in the market, ideal for embedded and mobile device integration | |
HV-II 3D Decoder ASIC | ●Himax 3D Depth Processor with high depth accuracy ●Support up to HD resolution depth map for different applications ●2D & 3D auto-exposure control for projector and sensor ●Frame rate conversion for different application/capability of SOC ●Scaling engine for different application/capability of SOC ●Ambient light detection and removal ●Embedded Security Engine ●Power Management Engine for power shutdown ●MIPI CSI-2 / DPHY interface |
Ultralow power WiseEye Smart Image Sensing
The demand for always-on battery-powered smart devices with AI intelligent sensing is rapidly growing. By combining an ultralow power image sensor with a custom computer vision ASIC and machine-learning algorithms, Himax ultralow power WiseEye smart image sensing solution enriches connected edge devices with AI capability. The end-point AI system, which consumes only a few mW power consumptions, is leading the industry for the next-generation of battery operated, clever computer vision applications. The ultralow power WiseEye smart image sensing solution is being engaged in a variety of applications, such as notebook, home appliances, utility meter, automotive, door lock, battery-powered surveillance camera, panoramic video conferencing, and medical, just to name a few. Among Himax’s ultralow power WiseEye smart image sensing businesses, our WiseEye for notebook solution features human presence detection and on-looker detection, offering power saving and enhancing privacy and security for notebook users. In 2021, we were highly encouraged by our WiseEye solution being officially awarded by Dell, with a sizable purchase order, for a series of their new models. This represented a remarkable achievement and an illustration of the robustness of our AI solution. In 2023, we collaborated with the China smart door lock leader, DESMAN, marks a groundbreaking feature advancement in the door lock industry, as our ultralow power WiseEye AI, with remarkably low power consumption of just 1 mW, enables the world’s first smart door lock featuring uninterrupted surveillance with 24/7 real-time sentry monitoring while at the same time significantly extending battery life. Meanwhile, we continue to support the mass production of Dell’s notebook and other end-point AI applications, such as shared bike parking, video conference device, door lock and medical capsule endoscope and many others. We expect to see more design-wins awarded across a broad customer base and a high variety of applications leading to robust sales growth for this new high margin product line moving forward.
44
We are committed to strengthening our WiseEye product roadmap and retaining our leadership position in ultralow power AI processor and image sensor for end-point AI applications and debuted our next generation AI processor WiseEye2 at CES 2023. WiseEye2 offers 40% peak power saving and 30-fold inference speed, implying over 50 times power efficiency on a per inference basis compared to the first generation WiseEye1 processor which is already leading the industry among AI processors aiming for similar target markets. We are honored to report that WiseEye2 was awarded the "2023 Best AI Product Award" by EE Awards Asia, further elevating Himax's WiseEye AI prominence in the industry. WiseEye2 is pioneering a new standard in endpoint AI benchmarks, earning recognition for its outstanding AI inference capability, industry-leading ultralow power efficiency, and advanced security features. In the realm of context-aware AI, WiseEye2 facilitates high-precision detection with features such as face mesh, facial landmark, hand gesture, and human pose and skeleton, which expands the intuitive, user-friendly scope of interactive applications in real-life, all achieved with minimal power consumption. Moreover, WiseEye2 streamlines the system integration with a rich set of peripheral interfaces, effectively lowering the system cost for edge appliances by eliminating the need for costly, power-hungry discrete MCUs otherwise required to process various sensor data. Additionally, WiseEye2 boasts versatile sensor fusion capabilities, encompassing image, video, audio, vibration and thermal inputs. This enables sophisticated, integral and highly accurate detection with low latency, especially suitable in anomaly detection with timely warnings, making it an ideal solution for a range of industrial applications, notably in automated and unmanned factories.
The following table sets forth the features of our ultralow power WiseEye smart image sensing total solutions:
Product |
| Features |
WiseEyeTM AI total solution | ● The total solution incorporates Himax proprietary ultralow power WiseEye AI processor, always-on CMOS image sensor, and CNN-based computer vision AI algorithm, featuring tinyML AI in tiny form factor, ultralow power consumption, low latency, privacy protection and optimized cost. ● Total solution supports use of a variety of Himax CMOS image sensors. Uniquely designed for ultralow power Computer Vision applications with always on scanning as low as 100uW. ● WiseEye AI processor (WiseEye1 / WiseEye2) is a uniquely designed ultralow power computer vision processing silicon, targeting always on applications with a sub 1mW capabilities. WiseEye is especially suitable for resource-constrained and battery powered context-aware application, such as motion detection, human detection and face detection, face mesh, face landmark and gesture. ● Computer vision algorithm is based on tiny machine learning framework, which is trainable for desired use cases (human presence detection, attention detection and on-looker detection for notebook applications; occupancy detection, gesture recognition etc. for AIoT applications) on ultralow power and resource-constrained compute platform (CPU clock, internal memory) |
For the other business model, we provide key components, such as proprietary ultralow power WiseEye1 AI processor or Always-On CMOS image sensor (AoS). For our key component business model, we reinforced our go-to-market strategy by intensively participating in leading AI partners’ infrastructures and ecosystems and/or AI communities. The Company collaborates with world-leading edge-to-cloud service providers and system integration companies, such as Google TensorFlow, Microsoft Azure, Arm AI Partner Program, tinyML Foundation, Seeed Studio and many others, to enjoy the enormous network of these ecosystems partners and their numerous participants to drive further adoption on applications such as smart home/ office, healthcare, agriculture, retail and many other applications. Additionally, we continued our marketing efforts through joint webinars and other online activities with several well-known platform partners such as Edge Impulse, Digi-Key and SparkFun. We continue to receive inquiries from large corporations and individual developers alike with hundreds of evaluation boards and developments kits having been purchased online and distributed across the globe. We are very encouraged by the traction this relatively new product line has generated in a short amount of time and expect to see increasing sales contribution moving forward.
45
The following table sets forth the features of our WiseEye product lines:
Product | Features | |
WiseEye1 AI Processor | ● Ultralow power consumption: 40 uW/MHz ● Support image, voice trigger simultaneously to wake up system ● Optimized multi-layer power states for always-on applications ● Ready-for- use software package and Machine Learning Library, including device driver, SDK and embARC Machine Learning Inference Library to support Google TensorFlow Lite Micro framework ● ARC-EM9D 32-bit DSP: Frequency up to 400MHz, ● Memory: Up to 2MByte SRAM ● High performance pixel processing accelerator and JPEG codec ● Security Engine: Support secure boot, secure FW update, secure debug mode, Support AES 128bits, RSA 2048bits, Hash-256, TRNG, Secure key management ● Peripheral: 1/4/8-bit camera interface, I2C/SPI master/slave, UART, PWM, GPIO with 5 wake-up pins, 12-bit ADC with 4 channels, up to 1Msps, RTC Timer ● Also support image pre-rolling feature for better security offering. | |
WiseEye2 AI Processor | ● dual Arm Cortex-M55 CPU cores and an Arm Ethos-U55 micro NPU core are integrated to optimize the power consumption across various workloads ● memory: Up to 2MB SRAM, 512KB TCM ● supports weight compression to significantly reduce model size ● multi-layer power management architecture ● embedded DC/DC converter and LDO ● feature model quantization and pruning for AI model size is significantly reduction while retaining an impressive performance ● support Physical Unclonable Function (PUF), Cryptography and TrustZone security ● High performance pixel processing accelerator and JPEG codec ● Security Engine: Support secure boot, secure FW update, secure debug mode, Support AES 128bits, RSA 2048bits, Hash-256, TRNG, Secure key management ● Peripheral: MIPI CSI-2 RX/TX, 1/4/8-bit CPI, PDM/I2S/MIPI SoundWire, SPI/UART/PWM/GPIO/I2C/I3C, SD/SDIO ● Also support image pre-rolling feature for better security offering. | |
WiseEye Module | ● embedded WiseEye1 or WiseEye2 AI processors ● support HM01B0 (320x240) and HM0360 (640x480) CMOS image sensors ● small form factor (12.5mm x 17.0mm and 20.5mm*21.5mm) ● plug-and-play design which support various types of connectors, such as ZIF FPC 24pin and 45-pin golden finger (model dependent) ● rich sets of peripherals (UART/I2C/I2S/PDM/SPI/GPIO/MIPI) and JTAG for debug (model dependent) ● provide SDK, development tool and technical documentations ● support various pre-trained pre-loaded AI models |
46
Core Technologies and Know-How
Driving System Technology. Through our collaboration with Panel Manufacturers, we have developed extensive knowledge of circuit design, TFT-LCD/OLED driving systems, high-voltage CMOS processes and display systems, all of which are important to the design of high-performance TFT-LCD/OLED display drivers. Our engineers have in-depth knowledge of the driving system technology, which is the architecture for the interaction between the source driver, gate driver, timing controller and power systems as well as other passive components. We believe that our understanding of the entire driving system has strengthened our design capabilities. Our engineers are highly skilled in designing power efficient and compact display drivers that enhance the performance of TFT-LCD/OLED. We are leveraging our know-how of display drivers and driving system technology to develop display drivers for panels utilizing other technologies such as next generation OLED and electronic paper displays.
High-Voltage CMOS Circuit Design. Unlike most other semiconductors, TFT-LCD display drivers require a high output voltage of 3.3 to 50 volts. We have developed circuit design technologies using a high-voltage CMOS process that enables us to produce high-yield, reliable and compact drivers for high-volume applications. Moreover, our technologies enable us to keep the driving voltage at very high uniformity, which can be difficult to achieve when using standard CMOS process technology.
High-Bandwidth Interfaces. In addition to high-voltage circuit design, TFT-LCD display drivers require high bandwidth transmission for video signals. We have applied several high-speed interfaces, including transistor-transistor logic (“TTL”), Reduced Swing Differential Signaling (“RSDS”), mini low-voltage differential signaling (“LVDS”), dual-edge TTL (“DETTL”), turbo Reduced Swing Differential Signaling (“RSDS”), Mobile Industry Processor Interface (“MIPI”) and other customized interfaces in our display drivers. Moreover, we are developing additional driver interfaces for special applications with optimized speed, lower EMI and higher system stability.
Die Shrink and Low Power Technologies. Our engineers are highly skilled in employing their knowledge of driving technology and high-voltage CMOS circuit design to shrink the die size of our display drivers while leveraging their understanding of driving technology and panel characteristics to design display drivers with low power consumption. Die size is an important consideration for applications with size constraints. Smaller die size also reduces the cost of the chip. Lower power consumption is important for many portable devices such as notebook computers, smartphone, tablet and consumer electronics products.
WiseEye Smart Image Sensing Technologies. These technologies are composed by an AoS sensor, an edge AI ASIC processor and computer-vision AI algorithm, all operated in ultralow power mode. Our industrial first AoS CMOS image sensor features ultralow power and low latency back-illuminated solution for always on, intelligent visual sensing applications. With Himax’s exceptional low power know-how and ASIC implementation technologies, our WiseEye AI image processor featured different power domain and mode management schemes, together with advanced image processing hardwired accelerators to construct different operating modes in balancing processor performance and power consumptions. The seamless and proprietary interface between our AoS sensor and AI processor ensure the efficient and fast-response sensor data transmission and wake-up mechanism operating in ultralow power mode. The computer-vision AI algorithm, which benefits from high performance and low power AI processor and image data from sensor, can therefore enable AI features such as powerful human detection, occupancy detection and motion classification for various application needs.
LCoS Microdisplay Technologies. Compared to other microdisplay technologies, LCoS microdisplay offers smaller form factor, higher brightness, and less power consumption. Himax Display has own proficient engineering team to develop patented industry-only non-captive LCoS, front-lit waveguide, and module design, along with an in-house ISO certified manufacture line, all of which positions us at the forefronts of leading AR glasses and AR-HUD markets. The latest development of Front-Lit LCoS enables an ultra-compact and extremely power-efficient optical engine by consolidating and integrating LED illumination system into the micro display module itself and makes the patented technology ideal for AR headsets. Furthermore, Himax Display provided phase modulation LCoS 2.0 technologies to offer high-efficient, low power and multi-focal plane displaying features to fit for holographic displaying needs in numerous leading applications.
3D Technologies. Several technologies in Himax are integrated together to form our 3D solution. First, wafer level nanoimprinted technology is used to design and manufacture DOE and Waveguide. Then, our in-house capability on semiconductors enables us to design IC that particularly matches our optical component. Our expertise in precision assembly in optics also helps us to provide a more complete solution to our customers.
47
Customers
Our customers for display drivers are primarily Panel Manufacturers and mobile device module manufacturers, who in turn design and market their products to manufacturers of end-use products such as notebook computers, desktop monitors, televisions, smartphone, tablet, automotive and consumer electronics products. We may sell our products through agents or distributors for certain products or in certain regions. As of December 31, 2023, we sold our products to around 300 customers. Our ten largest customers together accounted for approximately 79.5%, 76.7% and 74.1% of our revenues in 2021, 2022 and 2023, respectively. In 2021, 2022 and 2023, our two largest customers accounted for 10% or more of our net revenue: customer A and its affiliates accounted for 32.1%, 32.3% and 28.7% of our revenues, respectively; and customer C accounted for 19.1%, 9.4% and 11.0%, respectively.
Certain of our customers provide us with a long-term (twelve-month) forecast plus three-month rolling non-binding forecasts and confirm orders about one month ahead of scheduled delivery. In general, purchase orders are not cancellable by either party, although from time to time we and our customers have agreed to amend the terms of such orders.
Sales and Marketing
We focus our sales and marketing strategy on establishing business and technology relationships principally with Panel Manufacturers, using LTPS and a-Si TFT-LCD, and OLED technologies, mobile display module and mobile device manufacturers for smartphone, tablet and automotive, and camera module houses in order to work closely with them on future semiconductor solutions that align with their product road maps. Our engineers collaborate with our customers’ engineers to create products that comply with their specifications and provide a high level of performance at competitive prices and also create customized features for end brand customers. Our end market is concentrated among a limited number of major Panel Manufacturers. We also market our products directly to TV, monitor, notebook and mobile, tablet and automotive device manufacturers so that our products can be qualified for their specifications and designed into their products. Furthermore, we extend our business development with system and ODM companies by using strategic ASIC business model to not only develop ASIC product based on customer specification but also jointly research and develop new technologies to meet customers' future product demand. Additionally, we form strategic partnership with Tier 1 customers for our LCoS microdisplays, 3D sensing and WiseEye smart image sensing to penetrate into the emerging market. We believe we need close alliance with our customers to build up ecosystem for new applications.
We primarily sell our products through our direct sales teams located in Taiwan, China, South Korea and Japan. We also have dedicated sales teams for certain of our most important current or prospective customers. We have offices in Tainan, Hsinchu, Taipei, Taiwan; and Shenzen and Suzhou, China. We have other sales and technical support offices in Hefei, Beijing, Shanghai, Fuzhou, Foshan, Fuqing, Ningbo, Wuhan, Nanjing, Chongqing, Chengdu, Xi’an and Xiamen, China; Tokyo, Japan; Asan-si and Bundang-gu, South Korea, Munich, Germany; and Irvine and San Jose, California, Minneapolis, Minnesota and Detroit, Michigan, USA, all in close proximity to our customers. For certain products or regions, we may sell our products through agents or distributors.
Our sales and marketing team possesses a high level of technical expertise and industry knowledge used to support a lengthy and complex sales process. This includes a highly trained team of product managers and field applications engineers. Our team is equipped with extensive strategic marketing experience and a strong capability to identify market trends. We also provide technical support and assistance to potential and existing customers in system/SoC architecture, designing, testing and qualifying display modules, camera modules and end application systems that incorporate our products and ASICs. We believe that the depth and quality of this design support are key to improving customers’ time-to-market and maintaining a high level of customer satisfaction.
Manufacturing
We operate primarily in a fabless business model that utilizes substantially third-party foundry and assembly and testing capabilities. We leverage our experience and engineering expertise to design high-performance semiconductors and rely on semiconductor manufacturing service providers for wafer fabrication, gold bumping, assembly and testing. We also rely largely on third-party suppliers of processed tape used in TAB packaging. We engage foundries with high-voltage CMOS process technology for our display drivers and engage assembly and testing houses that specialize in TAB and COG packages, thereby taking advantage of the economies of scale and the specialization of such semiconductor manufacturing service providers. Our primarily fabless model enables us to capture certain financial and operational benefits, including reduced manufacturing personnel, capital expenditures, fixed assets and fixed costs. It also gives us the flexibility to use the technology and service providers that are the most suitable for any given product. Despite our reliance on outsourcing for CP testing, we have made investments in internal capabilities for test program development, engineering testing, debugging capability and manufacturing support since 2022.
48
We operate a fab under Himax Display primarily for performing manufacturing processes for our LCoS microdisplays. Moreover, for better integration, we also established an in-house color filter facility under Himax Taiwan, which commenced shipments from 2010. The color filter line is a critical and unique process for our proprietary single-panel color LCoS microdisplays. An in-house color filter facility enhances the competitiveness of our LCoS products and creates value for our customers. In addition, we have established an in-house WLO facility under Himax Taiwan for the key process of our wafer level optics products, which started small-scale shipments from December 2009 and commenced mass shipment to anchor customer from 2017 onwards. We began construction of our new building, Fab 2, in March 2017, located nearby the current headquarters to house additional WLO capacity, the new active alignment equipment needed for our 3D sensing business and to provide extra office space. The construction of Fab 2 was completed in the first half of 2018.
Manufacturing Stages
The diagram below sets forth the various stages in manufacturing display drivers according to the two different types of assembly utilized: TAB or COG. The assembly type depends primarily on the application and design of the panel and is determined by our customers.
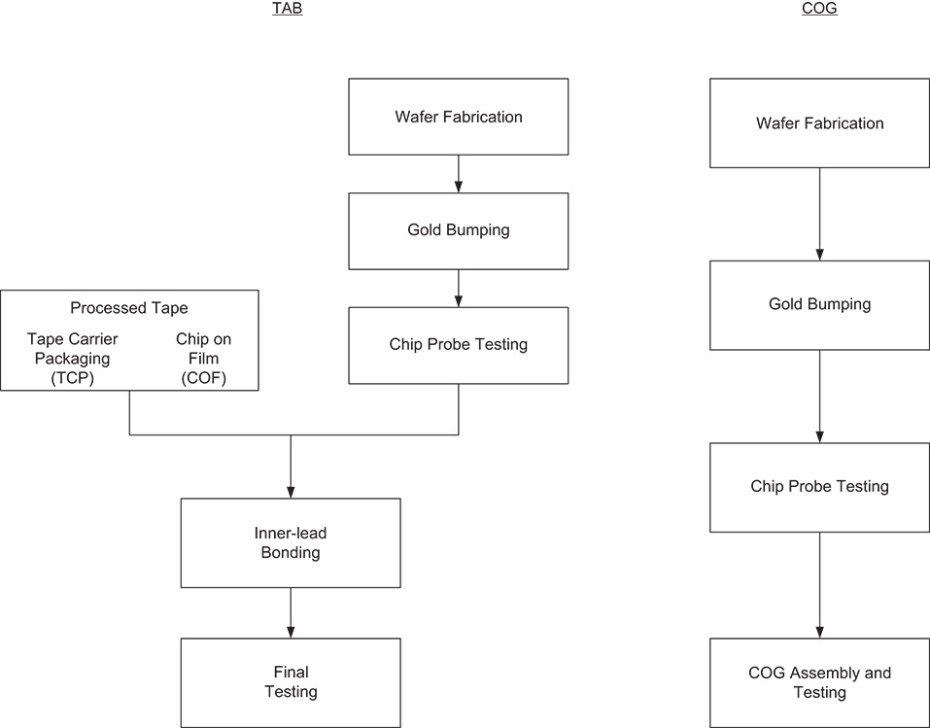
Wafer Fabrication: Based on our design, the foundry provides us with fabricated wafers. Each fabricated wafer contains many chips, each known as a die.
Gold Bumping: After the wafers are fabricated, they are delivered to gold bumping houses where gold bumps are plated on each wafer. The gold bumping process uses thin film metal deposition, photolithography and electrical plating technologies. The gold bumps are plated onto each wafer to connect the die to the processed tape, in the case of TAB package, or the glass, in the case of COG package.
49
Chip Probe Testing: Each die is electrically tested, or probed, for defects. Dies that fail this test are discarded.
Assembly and Testing: Our display drivers use two types of assembly technology: TAB or COG. Display drivers for large-sized applications typically require TAB package types and to a lesser extent COG package types, whereas display drivers for smartphone, tablet and consumer electronics products typically require COG package types.
TAB Assembly
We use two types of TAB technologies: TCP and COF. TCP and COF packages are both made of processed tape that is typically 35mm or 48mm wide, plated with copper foil and has a circuit formed within it. TCP and COF packages differ, however, in terms of their chip connections. With TCP packages, a hole is punched through the processed tape in the area of the chip, which is connected to a flying lead made of copper. By contrast, with COF packages, the lead is mounted directly on the processed tape and there is no flying lead. In recent years, COF packages have become predominantly used in TAB technology.
| ● | Inner-Lead Bonding: The TCP and COF assembly process involves grinding the bumped wafers into their required thickness and cutting the wafers into individual dies, or chips. An inner lead bonder machine connects the chip to the printed circuit processed tape and the package is sealed with resin at high temperatures. |
| ● | Final Testing: The assembled display drivers are tested to ensure that they meet performance specifications. Testing takes place on specialized equipment using software customized for each product. |
COG Assembly
COG assembly connects display drivers directly to LCD panels without the need for processed tape. COG assembly involves grinding the tested wafers into their required thickness and cutting the wafers into individual dies, or chips. Each individual die is picked and placed into a chip tray and is then visually or auto-inspected for defects. The dies are packed within a tray in an aluminum bag after completion of the inspection process.
Quality Assurance
We maintain a comprehensive quality assurance system. Using a variety of methods, from conducting rigorous simulations during the circuit design process to evaluating supplier performance at various stages of our products’ manufacturing process, we seek to bring about improvements and achieve customer satisfaction. In addition to monitoring customer satisfaction through regular reviews, we implement extensive supplier quality controls so that the products we outsource achieve our high standards. Prior to engaging a third party as our supplier, we perform a series of audits on their operations, and upon engagement, we hold frequent quality assurance meetings with our suppliers to evaluate such factors as product quality, production costs, technological sophistication and timely delivery.
In November 2002, we received ISO 9001 certification, which was renewed in March 2024 and will expire in March 2027. In February 2006, we received ISO 14001 certification, which was renewed in December 2023 and will expire in December 2026. In addition, in March 2007, we received IECQ QC 080000 certification, which was renewed in February 2022 and will expire in March 2025.
Environmental Management System and Safety and Health Management System
Himax follows closely the global environmental trends, including energy saving and waste reduction, in its daily operations. The Company is certified in accordance with ISO 14001, ISO 45001 and ISO 14064.
Himax is a leader in its sector when it comes to the environment and safety, operating under measures much more stringent than domestic regulations. The Company aims to grow sustainably, delivering economic, social and environmental benefits with its healthy employees.
Himax has also been tirelessly reducing impacts to the environment and improving safety in its operations, specifically targeting product design and waste handling.
50
Semiconductor Manufacturing Service Providers and Suppliers
Through our relationships with leading foundries, assembly, gold bumping and testing houses and processed tape suppliers, we believe we have established a supply chain that enables us to deliver high-quality products to our customers in a timely manner.
Access to semiconductor manufacturing service providers is critical as display drivers require high-voltage CMOS process technology and specialized assembly and testing services, all of which are different from industry standards. We have obtained our foundry services from TSMC, UMC, Vanguard, Macronix, Globalfoundries Singapore, PSMC, Nexchip and SKHYSI in the past few years. These are among a select number of semiconductor manufacturers that provide high-voltage CMOS process technology required for manufacturing display drivers. We engage assembly and testing houses that specialize in TAB and COG packages such as Chipbond, Chipmore International trading company Ltd., ChipMOS Technologies Inc., Nepes Corporation and King Yuan Electronics Co., Ltd, etc.
We plan to strengthen our relationships with our existing semiconductor manufacturing service providers and diversify our network of such service providers in order to ensure access to sufficient cost-competitive and high-quality manufacturing capacity. We are selective in our choice of semiconductor manufacturing service providers. It takes a substantial amount of time to qualify alternative foundries, gold bumping, assembly and testing houses for production. As a result, we expect that we will continue to rely on a limited number of semiconductor manufacturing service providers for a substantial portion of our manufacturing requirements in the near future.
The table below sets forth (in alphabetical order) our principal semiconductor manufacturing service providers and suppliers:
Wafer Fabrication |
| Gold Bumping |
Globalfoundries Singapore Pte., Ltd. | Chipbond Technology Corporation | |
Macronix International Co., Ltd. | Chipmore International Trading Company Ltd. | |
Nexchip Semiconductor Corporation | ChipMOS Technologies Inc. | |
Powerchip Semiconductor Manufacturing Corp. | LB Semicon, Inc. | |
SK hynix system ic | Union Semiconductor Co., Ltd. | |
Taiwan Semiconductor Manufacturing Company Limited | ||
United Microelectronics Corporation |
| |
Vanguard International Semiconductor Corporation |
|
Processed Tape for TAB Packaging |
| Assembly and Testing |
JMC Electronics Co., Ltd. | Ardentec Corporation | |
LG Innotek Co., Ltd. | Advanced Semiconductor Engineering Inc. | |
Stemco., Ltd. | Chipbond Technology Corporation | |
Chipbond Technology Corporation | Chipmore International Trading Company Ltd. | |
| ChipMOS Technologies Inc. | |
| Global Testing Corporation | |
| Greatek Electronics Inc. | |
| Jiangsu Changjiang Electronics Technology Co., Ltd. | |
| King Yuan Electronics Co., Ltd. | |
| Micro Silicon Electronics Corp. | |
| Nepes Corporation | |
| Taiwan IC Packaging Corporation | |
| LB Lusem Co., Ltd. | |
| Union Semiconductor Co., Ltd. |
51
Chip Probe Testing |
| |
Chipbond Technology Corporation | ||
Chipmore International Trading Company Ltd. | ||
ChipMOS Technologies Inc. | ||
Global Testing Corporation | ||
Greatek Electronics Inc. | ||
King Yuan Electronics Co., Ltd. | ||
Micro Silicon Electronics Corp. | ||
LB Semicon, Inc. | ||
Union Semiconductor Co., Ltd. | ||
YoungTek Electronics Corp. | ||
Intellectual Property
As of March 31, 2024, we held a total of 2,772 patents, including 1,182 in Taiwan, 916 in the United States, 560 in China, and 114 in other countries. The expiration dates of our patents range from 2024 to 2043. We also have a total of 48 pending patent applications in Taiwan, 112 in the United States and 238 in other jurisdictions, including the PRC, Japan, Korea, Israel and Europe. In addition, we have registered “Himax and logo” as trademarks in Taiwan, China, Europe, Singapore, Korea, Japan and the United States. “Omniwide Film and logo” as trademarks in China, Europe, Korea, Japan and the United States, “CMVT” as trademarks in Taiwan and China, as well as “WISEEYE” as trademark in Israel and the United States.
Competition
The market characteristics for our products are, in general, intensely competitive, characterized by continuous technological change, evolving industry standards, and declining average selling prices. We believe key factors that differentiate the competition in our industry include:
| ● | customer relations; |
| ● | product performance; |
| ● | design customization; |
| ● | development time / product release; |
| ● | product integration; |
| ● | technical services; |
| ● | manufacturing costs; |
| ● | supply chain management; |
| ● | timely delivery; |
| ● | economies of scale; and |
| ● | broad product portfolio. |
52
We continually face intense competition from fabless display driver companies, including Fitipower Integrated Technology, Inc., FocalTech Systems Co., Ltd., Novatek Microelectronics Corp., Raydium Semiconductor Corporation, Sitronix Technology Co., Ltd., Ilitek Corp., LX Semicon., ESWIN, Chipone, Newvision, Ribbon Display Japan, Hisilicon and Synaptics Incorporated. We also face competition from integrated device manufacturers, such as Rohm Co., Ltd.
Some of our competitors are affiliated or have established cross relationships with other Panel Manufacturers. Some have longer operating histories, or greater brand recognition, or significantly greater financial, manufacturing, technological, sales and marketing, human and other resources than we do. Additionally, we expect that as the flat panel semiconductor industry expands, more companies may enter and compete in our markets.
For In-cell TDDI, we compete with Novatek Microelectronics Cop., Synaptics Incorporated, FocalTech Systems Co., Ltd., ESWIN, Chipone, OmniVision and Ilitek Corp., etc.
For LCoS microdisplay products, we face competition from OmniVision, Syndiant, Kopin, and RAONTECH. We also compete with alternative microdisplay technology providers such as Texas Instruments with DLP, Sony with Micro OLED and Bosch with scanning mirror.
For power ICs, we face competition from Taiwan companies including Richtek Technology Corp., Global Mixed-mode Technology Inc., Novatek Microelectronics Corp., Fitipower Integrated Technology Inc. We also compete with worldwide suppliers such as Silergy Corp., and Rohm Co., Ltd.
For CMOS image sensor products, our focus is on machine vision. Competition in this space is primarily from OmniVision Technologies Inc., Galaxycore, Silicon Optronics, Inc (SOI), Pixart Imaging Inc. and Smartsens Technology (Shanghai) Co. LTD.
For wafer level optics products, we face competition primarily from Heptagon that was acquired by ams AG and certain new optical design houses from China, such as Angstrong Tech, Yuguang Science and Technology Development Co.
For 3D sensing, Himax is one of the few companies that can provide the one-stop solution though there are more companies attempting to jump into the game. ams AG and Orbbec will be the main competitors we face in the worldwide.
For ultralow power WiseEye smart image sensing, the main competition is Qualcomm with its “Glance” device. Few additional small size companies develop AI base edge devises, such as Lattice, Eta Computing, Nuvoton, Altek, etc. However, Himax is the only vendor who can offer a truly in-house vertically integrated solution comprise with all three building blocks required by customers: CMOS sensor, purposely designed MCU and the AI algorithm.
Insurance
We maintain insurance policies on our buildings, equipment and inventories covering property damage and damage due to, among other events, fires, typhoons, earthquakes and floods. We maintain these insurance policies on our facilities and on transit of inventories. Additionally, we maintain director and officer liability insurance. We do not have insurance for business interruptions, nor do we have key person insurance.
Environmental Matters
Himax is required to ensure its products are obligated to comply with valid regulations and governmental authorities’ regulatory directives in applicable jurisdictions relating to environmental protection regulations and subject to the topic of Environmental Protection. Additionally, Himax Taiwan maintains a CP tester facility, a color filter facility and a wafer level optics facility and Himax Display maintains a facility for our LCoS products. Himax IGI operates under the designated facility related for 3D mask production, where we have taken the necessary steps to obtain the appropriate permits and, to extents of Himax knowledge, believe that we are in compliance with the existing environmental laws and regulations in the Taiwan ROC and US jurisdiction applicable. In addition, we have entered into various agreements with certain customers whereby we have agreed to indemnify them, and in certain cases, their customers, for any claims made against them for hazardous material violations that are found in our products.
53
4.C. Organizational Structure
The following chart sets forth our corporate structure and ownership interest in each of our principal operating subsidiaries as of March 31, 2024.
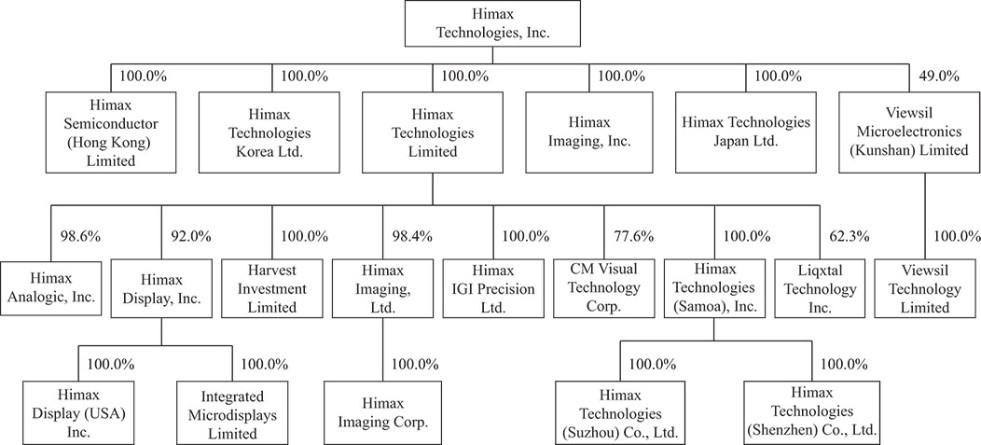
The following table sets forth summary information for our subsidiaries as of March 31, 2024.
|
|
| Percentage of |
| |||
| Jurisdiction of |
| Our Ownership | ||||
Subsidiary |
| Main Activities |
| Incorporation |
| Interest | |
Himax Technologies Limited |
| IC design and sales |
| ROC |
| 100.0 | % |
Himax Technologies Korea Ltd. |
| IC design and sales |
| South Korea |
| 100.0 | % |
Himax Technologies (Samoa), Inc. |
| Investments |
| Samoa |
| 100.0 | %(1) |
Himax Technologies (Suzhou) Co., Ltd. |
| Sales and technical support |
| PRC |
| 100.0 | %(2) |
Himax Technologies (Shenzhen) Co., Ltd. |
| Sales and technical support |
| PRC |
| 100.0 | %(2) |
Himax Display, Inc. |
| LCoS and MEMS design, manufacturing and sales |
| ROC |
| 92.0 | %(1) |
Integrated Microdisplays Limited |
| LCoS design |
| Hong Kong |
| 92.0 | %(3) |
Himax Display (USA) Inc. |
| LCoS and MEMS design, sales and technical support |
| Delaware, USA |
| 92.0 | %(3) |
Himax Analogic, Inc. |
| IC design and sales |
| ROC |
| 98.6 | %(1) |
Himax Imaging, Inc. |
| Investments |
| Cayman Islands |
| 100.0 | % |
Himax Imaging, Ltd. |
| IC design and sales |
| ROC |
| 98.4 | %(1) |
Himax Imaging Corp. |
| IC design |
| California, USA |
| 98.4 | %(4) |
Harvest Investment Limited |
| Investments |
| ROC |
| 100.0 | %(1) |
Himax Technologies Japan Ltd. |
| Sales |
| Japan |
| 100.0 | % |
Himax Semiconductor (Hong Kong) Limited |
| Investments |
| Hong Kong |
| 100.0 | % |
Liqxtal Technology Inc. |
| LC Lens design and sales |
| ROC |
| 62.3 | %(1) |
Himax IGI Precision Ltd. |
| 3D micro and nano structure mastering and prototype replication |
| Delaware, USA |
| 100.0 | %(1) |
CM Visual Technology Corp. (CMVT) |
| Omniwide film products design and sales |
| ROC |
| 77.6 | %(1) |
Viewsil Microelectronics (Kunshan) Limited | IC design and sales | PRC | 49.0 | % | |||
Viewsil Technology Limited | IC sales | British Virgin Islands | 49.0 | %(5) |
| (1) | Indirectly, through our 100.0% ownership of Himax Technologies Limited. |
| (2) | Indirectly, through our 100.0% ownership of Himax Technologies (Samoa), Inc. |
| (3) | Indirectly, through our 92.0% ownership of Himax Display, Inc. |
54
| (4) | Indirectly, through our 98.4% ownership of Himax Imaging, Ltd. |
| (5) | Indirectly, through our 49.0% ownership of Viewsil Microelectronics (Kunshan) Limited. |
4.D. Property, Plants and Equipment
Our corporate headquarters are located at a 22,172 square meter facility within the Tree Valley Industrial Park in Tainan, Taiwan. We began construction of our new building, Fab 2, in March 2017, located nearby the current headquarters. The newly completed building, located at a 42,619 square meter facility, houses additional WLO capacity, the new active alignment equipment needed for our 3D sensing business and provides extra office space. The facilities house our research and development, engineering, sales and marketing, operations and general administrative staff.
We also lease office space in Taipei and Hsinchu, Taiwan; Suzhou, Shenzhen, Foshan, Beijing, Shanghai, Ningbo, Wuhan, Hefei, Xiamen, Chongqing, Fuqing, China; Tokyo, Japan; Asan-si and Bundang-gu, South Korea; and Irvine and San Jose, California and Minneapolis, Minnesota, USA. The lease contracts may be renewed upon expiration.
We have established an in-house WLO facility under Himax Taiwan for the key process of our products. The facility occupies 1,171 square meters of floor space in a building leased from Innolux, which was already produced and shipped over 50 million optics to Tier-1 customer since 2010. However, the building lease was terminated early at the end of January 2024, and we relocated the WLO facility to our Fab 2. We have also expanded certain facilities for LCoS and WLO products to accommodate new customers and new applications located at our headquarters in Tainan, Taiwan. In addition, Himax Taiwan owns and operates a fab with 1,431 square meters of floor space in a building leased from Innolux in Tainan, where it established an in-house color filter facility that commenced shipments from 2010. The building lease was terminated early at the end of January 2024, and we relocated the color filter facility to our Fab 2. This in-house facility provides color filter for CMOS image sensor and LCoS products. The color filter line is a critical and unique process for our proprietary single-panel color LCoS microdisplays. An in-house color filter facility enhances the competitiveness of our color-filter LCoS microdisplays products and creates value for our customers. To build up test program development, engineering testing, debugging capability and manufacturing support, we have established under Himax Taiwan an in-house CP test facility from 2022.
ITEM 4A. UNRESOLVED STAFF COMMENTS
Not applicable.
ITEM 5. OPERATING AND FINANCIAL REVIEW AND PROSPECTS
The following discussion should be read in conjunction with our audited consolidated financial statements and their accompanying notes included elsewhere herein which are prepared in accordance with IFRS.
5.A. Operating Results
For discussion related to our financial condition, changes in financial condition, and the results of operations for 2022 compared to 2021, refer to “Part I, Item 5. Operating and Financial Review and Prospects,” in our Annual Report on Form 20-F for the fiscal year ended December 31, 2022, which was filed with the United States Securities and Exchange Commission on April 6, 2023.
55
Overview
We commenced operations through our predecessor, Himax Taiwan, in June 2001. We must, among other things, continue to expand and diversify our customer base, broaden our product portfolio, maintain our leading technology position, achieve additional design wins and manage our costs to partially mitigate declining average selling prices and any other market risks in order to maintain our profitability. Moreover, we must continue to address the challenges of being a growing technology company, including hiring and retaining managerial, engineering, operational and financial personnel and implementing and improving our existing administrative, financial and operations systems.
We operate primarily in a fabless business model that utilizes substantially third-party foundry and assembly and testing capabilities. We leverage our experience and engineering expertise to design high-performance semiconductors and rely largely on third-party semiconductor manufacturing service providers for wafer fabrication, gold bumping, assembly and testing with the exception of manufacturing of LCoS microdisplay, wafer level optics products and active alignment for 3D sensing, which we manufacture through our own factories. We are able to take advantage of the economies of scale and the specialization of our third-party semiconductor manufacturing service providers. Our primarily fabless model enables us to capture certain financial and operational benefits, including reduced manufacturing personnel, capital expenditures, fixed assets and fixed costs. It also gives us the flexibility to use the technology and service providers that are the most suitable for any given product. For LCoS microdisplay and wafer level optics products, our in-house factories enable us to protect our proprietary technologies and manufacturing expertise in the effort to further expand these businesses.
As our semiconductors are critical components of flat panel displays, our industry is closely linked to the trends and developments of the flat panel display industry. The majority of our revenues in 2023 were derived from sales of display drivers that were eventually incorporated into TFT-LCD and OLED panels. We expect display drivers for TFT-LCD and OLED panels to continue to be our primary products. The TFT-LCD and OLED panel industry is intensely competitive and is vulnerable to cyclical market conditions. The average selling prices of TFT-LCD and OLED panels could decline for numerous reasons, which could in turn result in downward pricing pressure on our products. See “Item 3.D. Key Information—Risk Factors—Risks Relating to Our Financial Condition and Business—We derive the majority of our net revenues from sales to the TFT-LCD and OLED panel industry, which is highly cyclical and subject to price fluctuations. Such cyclicality and price fluctuations could negatively impact our business or results of operations.” The revenue expansion of our non-driver products as well as TFT-LCD and AMOLED products trending toward high resolution and any other new product introduction help to mitigate these risks.
Factors Affecting Our Performance
Our business, financial position and results of operations, as well as the period-to-period comparability of our financial results, are significantly affected by a number of factors, some of which are beyond our control, including:
| ● | average selling prices; |
| ● | unit shipments; |
| ● | product mix; |
| ● | design wins; |
| ● | cost of revenues and cost reductions; |
| ● | supply chain management; |
| ● | share-based compensation expenses and cash awards; and |
| ● | tax credits. |
56
Average Selling Prices
Our performance is affected by the selling prices of each of our products. We price our products based on several factors, including manufacturing costs, life cycle stage of the product, competition, technical complexity of the product, size of the purchase order and our relationship with the customer. We typically are able to charge the highest price for a product when it is first introduced. Although from time to time we are able to raise our selling prices during times of supply constraints, our average selling prices typically decline over a product’s life cycle, which may be offset by changes in conditions in the semiconductor industry such as constraints in foundry capacity. For example, from 2020, the industry-wide tightening of foundry capacity has extended to backend facilities that include assembly and testing and appears to be a long-term phenomenon. Robust demand pushed foundry capacity constraints to a more severe level and rose higher material cost which in turn enabled higher average selling prices. However, decades-high inflation, rapidly rising interest rates in addition to the ongoing war and unexpected lockdowns from Covid-19 in China starting from the end of first quarter of 2022, brought widespread demand halt, resulting in sluggish demand across every aspect of our business, followed by sales declined and average selling price erosion. The general trend in the semiconductor industry is for the average selling prices of semiconductors to decline over a product’s life cycle due to competition, production efficiencies, emergence of substitutes and technological obsolescence. Our cost reduction efforts also contribute to this decline in average selling prices. See “—Cost of Revenues and Cost Reductions.”
Our average selling prices are affected by the size and bargaining power of our customers. As new China panel makers emerge in the marketplace and continue to expand their capacity, China panel makers’ bargaining power will increase accordingly, negatively impacting our average selling price. Our average selling prices are also affected by the packaging type our customers choose as well as the level of product integration. See “—Product Mix” below. Lastly, competition level affects our average selling prices as well. However, the impact of declining average selling prices on our profitability might be offset or mitigated to a certain extent by increased volume as lower prices may stimulate demand and thereby drive sales and TFT-LCD and OLED panel products trending toward higher resolution.
Unit Shipments
Our performance is also affected by the number of semiconductors we ship, or unit shipments. As our display drivers are critical components of flat panel displays, our unit shipments depend primarily on our customers’ panel shipments among other factors. Our unit shipments have grown since our inception primarily as a result of our increased market share with certain major customers and their increased shipments of panels. Our growth in unit shipments also reflected the demand for higher resolution panels which typically require more display drivers. However, the development of higher channel display drivers or new technologies, if successful, could potentially reduce the number of display drivers required for each panel while achieving the same resolution. If such technologies become commercially available, the market for our display drivers will be reduced and we could experience a decline in revenue and profit. Our unit shipments also depend on the capacity we can get from our foundry, assembly and testing house.
Product Mix
The proportion of our revenues that is generated from the sale of different product types, also referred to as product mix, also affects our average selling prices, revenues and profitability. Our display driver products vary depending on, among other things, the number of output channels, the level of integration and the package type. Variations in each of these specifications could affect the average selling prices of such products. For example, the trend for display drivers for use in large-sized panels is toward products with a higher number of channels, which typically command higher average selling prices than traditional products with a lower number of channels. However, panels that use higher-channel display drivers typically require fewer display drivers per panel. As a result, our profitability will be adversely affected to the extent that the decrease in the number of display drivers required for each panel is not offset by increased total unit shipments and/or higher average selling prices for display drivers with a higher number of channels. The level of integration of our display drivers also affects average selling prices, as more highly integrated chips typically have higher selling prices. Additionally, average selling prices are affected by changes in the package types used by our customers. For example, the chip-on-glass package type typically has lower material costs because no processed tape is required. Moreover, our different non-driver products vary in average selling prices and costs.
57
The proportion of non-driver business would also affect our financial position and results of operations. For the past few years, we have experienced operating losses from our non-driver business. This was partly due to low sales volume during these periods that led to insufficient revenue to fully cover expenses such as research and development and operating expenses. We expect, however, to ramp up the volume production and sales of our non-driver products in the future and generate positive operation income from such non-driver products. Typically, our non-driver products have higher gross margins as well as higher growth potential than our driver products, we expect the overall profit margin across our product platform to improve.
Design Wins
Achieving design wins is important to our business, and it affects our unit shipments. Design wins occur when a customer incorporates our products into their product designs. There are numerous opportunities for design wins, including, but not limited to, when panel manufacturers:
| ● | introduce new models to improve the cost and/or performance of their existing products or to expand their product portfolio; |
| ● | establish new fabs and seek to qualify existing or new component suppliers; and |
| ● | replace existing display driver companies due to cost or performance reasons. |
Design wins are not binding commitments by customers to purchase our products. However, we believe that achieving design wins is an important performance indicator. Our customers typically devote substantial time and resources to designing their products as well as qualifying their component suppliers and their products. Once our products have been designed into a system, the customer may be reluctant to change its component suppliers due to the significant costs and time associated with qualifying a new supplier or a replacement component. Therefore, we strive to work closely with current and prospective customers in order to anticipate their requirements and product roadmaps and achieve additional design wins.
Cost of Revenues and Cost Reductions
We strive to control our cost of revenues. Our cost of revenues as a percentage of total revenues in 2021, 2022 and 2023 was 51.6%, 59.5% and 72.1%, respectively. In 2023, as a percentage of Himax Taiwan’s total manufacturing costs, the cost of wafer fabrication was 50.5%, the cost of processed tape was 4.5%, the cost of assembly and testing was 44.3%, and overhead was 0.7%. Our cost of revenues may increase as a result of an increase in raw material prices, any failure to obtain sufficient foundry, assembly or testing capacity or any shortage of processed tape or failure to improve our manufacturing utilization rate or production yield. Meanwhile, the long-term capacity agreements carries the risk of substantial inventory write-downs and/or contractual penalties resulted from unfulfillment of committed volume in the event of decreased end customer demand. In second quarter of 2023, amidst strict muted market demand, we strategically terminated high-cost foundry capacity agreements, a one-time expense included in cost of revenues. As a result, our ability to manage our wafer fabrication costs, costs for processed tape, assembly and testing costs and our manufacturing utilization rate or production yield is critical to our performance. In addition, to mitigate declining average selling prices, we aim to reduce unit costs by, among other things:
| ● | improving product design (e.g., having smaller die size allows for a larger number of dies on each wafer, thereby reducing the cost of each die); |
| ● | improving manufacturing yields through our close collaboration with our semiconductor manufacturing service providers and in our in-house manufacturing facilities; and |
| ● | achieving better pricing from a diversified pool of semiconductor manufacturing service providers and suppliers, reflecting our ability to leverage our scale, volume requirements and close relationships as well as our strategy of sourcing from multiple service providers and suppliers. |
58
Supply Chain Management
Due to the competitive nature of the flat panel display industry and our customers’ need to maintain high capacity utilization in order to reduce unit costs per panel, any delays in the delivery of our products could significantly disrupt our customers’ operations. To deliver our products on a timely basis and meet the quality standards and technical specifications our customers require, we must have assurances of high-quality capacity from our semiconductor manufacturing service providers. We therefore strive to manage our supply chain by maintaining close relationships with our key semiconductor manufacturing service providers and strive to provide credible forecasts of capacity demand and seek for new manufacturing service providers in case of any manufacturer’s capacity shortage. Any disruption to our supply chain could adversely affect our performance and could result in a loss of customers as well as potentially damage our reputation.
Share-Based Compensation Expenses and Cash Awards
Our results of operations have been affected by, and we expect our results of operations to continue to be affected by, our share-based compensation expenses and cash awards, which consist of charges taken relating to grants of mainly RSUs as well as stock options, non-vested shares, and cash awards to employees.
Restricted Share Units (RSUs). We adopted two long-term incentive plans in October 2005 and September 2011, respectively, which permit the grant of options or RSUs to our employees and non-employees where each unit represents two ordinary shares. The actual awards will be determined by our compensation committee. The 2005 plan was terminated in October 2010. We recognized share-based compensation expenses regarding RSUs under the long-term incentive plan totaling $23.8 million, $20 million and $12.1 million in 2021, 2022 and 2023, respectively. Of the total share-based compensation expenses recognized, $23.2 million, $17.5 million and $9.5 million in 2021, 2022 and 2023, respectively, were settled in cash. We measure and recognize compensation expense for all share-based payments at fair value.
Set forth below is a summary of our historical share-based compensation plans for the years ended December 31, 2021, 2022 and 2023 as reflected in our consolidated financial statements. However, we did not grant RSUs in 2019 but granted stock options to employees instead.
We made grants of 676,273 RSUs to our employees on September 26, 2018. The vesting schedule for such RSU grants is as follows: 97.15% of the RSU grants vested immediately and were settled by cash in the amount of $3.8 million on the grant date, with the remainder vesting equally on each of September 30, 2019, 2020 and 2021, which will be settled by our ordinary shares, subject to certain forfeiture events.
We made grants of 1,402,714 RSUs to our employees on September 28, 2020. The vesting schedule for such RSU grants is as follows: 98.68% of the RSU grants vested immediately and were settled by cash in the amount of $4.8 million on the grant date, with the remainder vesting equally on each of September 30, 2021, 2022 and 2023, which will be settled by our ordinary shares, subject to certain forfeiture events.
We made grants of 2,604,545 RSUs to our employees on September 28, 2021. The vesting schedule for such RSU grants is as follows: 85.63% of the RSU grants vested immediately and were settled by cash in the amount of $23.2 million on the grant date, with the remainder vesting equally on each of September 30, 2022, 2023 and 2024, which will be settled by our ordinary shares, subject to certain forfeiture events.
We made grants of 3,987,509 RSUs to our employees on September 28, 2022. The vesting schedule for such RSU grants is as follows: 86.41% of the RSU grants vested immediately and were settled by cash in the amount of $17.5 million on the grant date, with the remainder vesting equally on each of September 30, 2023, 2024 and 2025, which will be settled by our ordinary shares, subject to certain forfeiture events.
We made grants of 1,710,607 RSUs to our employees on September 26, 2023. The vesting schedule for such RSU grants is as follows: 97.45% of the RSU grants vested immediately and were settled by cash in the amount of $9.5 million on the grant date, with the remainder vesting equally on each of September 30, 2024, 2025 and 2026, which will be settled by our ordinary shares, subject to certain forfeiture events.
59
The amount of share-based compensation expense with regard to the RSUs granted to our employees on September 26, 2018, September 28, 2020, September 28, 2021, September 28, 2022 and September 26, 2023 was $5.76 per ADS, $3.44 per ADS, $10.39 per ADS, $5.09 per ADS and $5.68 per ADS, respectively, which was based on the trading price of our ADSs on that day.
Employee stock options. We made grants of 2,226,690 units of stock option to purchase 2,226,690 units ADS to certain employees at an exercise price of $2.27 on September 30, 2019. The vesting schedule was that 50% of the options vest half year after the date of grant and 50% of the options vest one year after the date of grant. During 2020, 114,500 units, 39,000 units and 10,000 units of stock option to purchase 114,500 units, 39,000 units and 10,000 units ADS were grant to certain employees at an exercise price of $2.74, $3.9 and $3.35 on March 31, 2020, August 11, 2020 and September 25, 2020, respectively. The options granted in 2020 were fully vested on October 1, 2020. We recognized share-based compensation expenses regarding stock options under the long-term incentive plan totaling $0.7 million in 2020.
Cash Awards. We made grants annual bonus by cash payouts totaling $47.7 million, $19.3 million and $0.7 million to the Company’s employees among which $1.6 million, $1.0 million and $0.2 million was immediately vested on September 28, 2021, September 28, 2022 and September 26, 2023, respectively. The remainder will be equally vested at the first, second and third anniversaries of the grant date.
Tax Credits
Our results of operations have been affected by, and we expect our results of operations to continue to be affected by, tax credits available to us.
The Statute for Industrial Innovation entitles companies to tax credits for qualifying research and development expenses related to innovation activities but limits the amount of tax credit to only up to 15% of the total qualifying research and development expenditure for the current year, subject to a cap of 30% of the income tax payable for the current year. Moreover, any unused tax credits provided under the Statute for Industrial Innovation may not be carried forward.
Based on the amendments to the above, effective from January 1, 2016 to December 31, 2019, further extended to December 31, 2029, if companies choose to extend the tax credits to three years, the tax credit rate will be 10% of the total qualifying research and development expenditure for the current year and subject to a cap of 30% of the income tax payable for each year.
Description of Certain Statements of Profit or Loss Line Items
Revenues
Historically, we generated the majority of our revenues from sales of display drivers for large-sized applications and small and medium-sized applications. In addition, our product portfolio also includes timing controllers, operational amplifiers, LCoS microdisplay, power management ICs, CMOS image sensors, 3D sensing, ultralow power WiseEye smart image sensing, wafer level optics products and ASIC service.
The 2023 full year revenues totaled $945.4 million, representing a 21.3% decline compared to 2022. Persistent subdued global demand, coupled with looming recession concerns, presented significant challenges to our operations throughout 2023. These market dynamics adversely affected both demand and procurement processes of panel customers, particularly in the realm of consumer electronics.
60
The following table sets forth, for the periods indicated, our revenues by amount and our revenues as a percentage of revenues by each product line:
Year Ended December 31, | |||||||||||||||
2021 | 2022 |
| 2023 | ||||||||||||
|
| Percentage |
|
| Percentage |
| Percentage | ||||||||
of | of |
| of | ||||||||||||
| Amount |
| Revenues |
| Amount |
| Revenues |
| Amount |
| Revenues | ||||
(in thousands, except percentages) | |||||||||||||||
Display drivers for large-sized applications | $ | 397,905 |
| 25.7 | $ | 263,992 | 22.0 | $ | 175,666 | 18.6 | |||||
Display drivers for small and medium-sized applications |
| 963,537 |
| 62.3 |
| 778,946 | 64.8 | 629,174 | 66.5 | ||||||
Non-driver products(1) |
| 185,655 |
| 12.0 |
| 158,401 | 13.2 | 140,588 | 14.9 | ||||||
Total | $ | 1,547,097 |
| 100.0 | $ | 1,201,339 | 100.0 | $ | 945,428 | 100.0 | |||||
Note: (1) Includes, among other things, timing controllers, LCoS projector solutions, power management IC, CMOS image sensors, programmable gamma OP, wafer level optics (WLO) products, ultralow power WiseEye smart image sensing, NRE incomes, and ASIC service.
A limited number of customers account for substantially all our revenues. For example, Customer A and its affiliates accounted for 32.1%, 32.3% and 28.7% of our revenues in 2021, 2022 and 2023, respectively. Customer C accounted for 19.1%, 9.4% and 11.0% of our revenues in 2021, 2022 and 2023, respectively.
Year Ended December 31, | |||||||||||||||
2021 | 2022 |
| 2023 | ||||||||||||
|
| Percentage |
|
| Percentage |
| Percentage | ||||||||
of | of |
| of | ||||||||||||
| Amount |
| Revenues |
| Amount |
| Revenues |
| Amount |
| Revenues | ||||
(in thousands, except percentages) | |||||||||||||||
Customer A and its affiliates | $ | 497,083 |
| 32.1 | $ | 388,194 | 32.3 | $ | 271,351 | 28.7 | |||||
Customer C |
| 295,217 |
| 19.1 |
| 113,396 | 9.4 | 103,839 | 11.0 | ||||||
Others |
| 754,797 |
| 48.8 |
| 699,749 | 58.3 | 570,238 | 60.3 | ||||||
Total | $ | 1,547,097 |
| 100.0 | $ | 1,201,339 | 100.0 | $ | 945,428 | 100.0 | |||||
The global TFT-LCD and OLED panel market is highly concentrated, with only a limited number of TFT-LCD and OLED panel manufacturers producing TFT-LCD and OLED panels in high volumes. We sell panel display drivers to many of these panel manufacturers. Our revenues, therefore, will depend on our ability to capture an increasingly larger percentage of each panel manufacturer’s display driver requirements. The sales to panel makers in China have become a significant portion of our revenue due to the Chinese panel maker business expansion which started in 2011. We derive substantially all of our revenues from sales to Asia-based customers whose end products are sold worldwide. In 2021, 2022 and 2023, approximately 14.2%, 14.6% and 15.0% of our revenues, respectively, were from customers headquartered in Taiwan and approximately 81.5%, 77.0% and 76.2% of our revenues, respectively, were from customers headquartered in China. We believe that substantially all of our revenues will continue to be from customers located in Asia, where almost all of the panel manufacturers and mobile device module manufacturers are located. As a result of the regional customer concentration, we expect to continue to be subject to economic and political events and other developments that affect our customers in Asia. A substantial majority of our sales invoices are denominated in U.S. dollars.
Costs and Expenses
Our costs and expenses consist of cost of revenues, research and development expenses, general and administrative expenses, sales and marketing expenses, share-based compensation expenses and cash awards. Costs would be greatly affected by product mix.
Cost of Revenues
The principal items of our cost of revenues are:
| ● | cost of wafer fabrication; |
61
| ● | cost of processed tape used in TAB packaging; |
| ● | cost of gold bumping, assembly and testing; and |
| ● | other costs and expenses. |
We outsource the manufacturing of our semiconductors and semiconductor solutions to semiconductor manufacturing service providers. The costs of wafer fabrication, gold bumping, assembly and testing depend on the availability of capacity and demand for such services. The wafer fabrication industry, in particular, is highly cyclical, resulting in fluctuations in the price of processed wafers depending on the available foundry capacity and the demand for foundry services.
Research and Development Expenses
Research and development expenses consist primarily of research and development employee salaries, including related employee welfare costs, costs associated with prototype wafers, processed tape, masks, molding and tooling sets and depreciation on research and development equipment. We expect to continue increasing our spending on research and development in absolute dollar amounts in the future as we continue to increase our research and development headcount and associated costs to pursue additional product development opportunities. As a percentage of revenues, our research and development expenses in 2021, 2022 and 2023 were 9.8%, 14.6% and 18.1%, respectively.
General and Administrative Expenses
General and administrative expenses consist primarily of salaries of general and administrative employees, including related employee welfare costs, depreciation on buildings, office furniture and equipment and professional fees. We anticipate that our general and administrative expenses will increase in absolute dollar amounts as we expand our operations, hire additional administrative personnel and incur additional compliance costs required of a publicly listed company in the United States.
Sales and Marketing Expenses
Our sales and marketing expenses consist primarily of salaries of sales and marketing employees, including related employee welfare costs, travel expenses and product sample costs. We expect that our sales and marketing expenses will increase in absolute dollar amounts over the next several years. However, we believe that as we continue to achieve greater economies of scale and operating efficiencies, our sales and marketing expenses may decline over time as a percentage of our revenues.
Share-Based Compensation Expenses
Our share-based compensation expenses consist of various forms of share-based compensation that we have historically issued to our employees and consultants, as well as share-based compensation issued to employees, directors and service providers under our 2005 and 2011 long-term incentive plans. The 2005 plan was terminated in October 2010. We allocate such share-based compensation expenses to the applicable cost of revenues and expense categories as related services are performed. See note 20 to our consolidated financial statements. Under the long-term incentive plan, we granted RSUs on December 30, 2005 to our employees and directors and again on September 29, 2006, September 26, 2007, September 29, 2008, September 28, 2009, September 28, 2010, September 28, 2011, September 26, 2012, September 26, 2013, September 26, 2014, September 25, 2015, September 28, 2016, September 29, 2017, September 26, 2018, September 28, 2020, September 28, 2021, September 28, 2022 and September 26, 2023 to our employees. We did not grant RSUs in 2019 but granted stock options to employees instead. Share-based compensation expenses recorded regarding RSUs under the long-term incentive plan totaled $23.8 million, $20.0 million and $12.1 million in 2021, 2022 and 2023, respectively.
Cash Awards.
We made grants annual bonus by cash payouts totaling $47.7 million, $19.3 million and $0.7 million to the Company’s employees among which $1.6 million, $1.0 million and $0.2 million was immediately vested on September 28, 2021, September 28, 2022 and September 26, 2023, respectively. The remainder will be equally vested at the first, second and third anniversaries of the grant date.
62
Income Taxes
Since we and our direct and indirect subsidiaries are incorporated in different jurisdictions, we file separate income tax returns. Under the current laws of the Cayman Islands, we are not subject to income or capital gains tax. Additionally, dividend payments made by us are not subject to withholding tax in the Cayman Islands. However, if the relevant bylaws of the PEM rules have been adequately enacted and properly advocated, we may be determined to be within the territory of the ROC and our income tax shall be levied in accordance with the Income Tax Act and relevant tax regulations. Therefore, dividend payments made by us would be subject to withholding tax in the ROC. We recognize income taxes at the applicable statutory rates in accordance with the jurisdictions where our subsidiaries are located and as adjusted for certain items including accumulated losses carried forward, non-deductible expenses, research and development tax credits, as well as changes in our deferred tax assets and liabilities.
Critical Accounting Policies and Estimates
We believe the following critical accounting policies affect our more significant judgments and estimates used in the preparation of our consolidated financial statements in accordance with IFRS.
Inventory
Inventories are stated at the lower of cost and net realizable value, and we use judgment and estimate to determine the net realizable value of inventory at the end of each reporting period. Due to the rapid technological changes, we estimate the net realizable value of inventory for obsolescence and unmarketable items at the end of reporting period and then writes down the cost of inventories to net realizable value. The net realizable value of the inventory is mainly determined based on assumptions of future demand within a specific time horizon. The inventory write-downs in 2021, 2022 and 2023 were approximately $9.4 million, $22.2 million and $21.5 million, respectively, and were included in cost of revenues in our consolidated statements of profit or loss.
Impairment of Non-financial Assets other than Goodwill
We routinely review our non-financial assets at the reporting date to determine whether there is any indication of impairment. If any such indication exists, then the asset’s recoverable amount is estimated. The recoverable amount of an asset or cash-generating unit is the greater of its value in use and its fair value less costs to sell. In assessing value in use, the estimated future cash flows are discounted to their present value using a pre-tax discount rate that reflects current market assessments of the time value of money and the risks specific to the asset. However, due to the cyclical nature of our industry and changes in our business strategy, market requirements, or the needs of our customers, we may not always be in a position to accurately anticipate declines in the utility of our equipment or acquired technology until they occur. Although we have the recurring losses in non-Driver product segment, we remain positive on the long-term prospect of our non-Driver product segment, judging by the expanding customer list that covers some of the world’s biggest tech names, and the busy engineering activities going on with such customers. For the years ended December 31, 2021, 2022 and 2023, we did not recognize any impairment loss on non-financial assets.
Goodwill
We evaluate goodwill for impairment at least annually, or more frequently when there is an indication that the cash-generating unit (CGU) may be impaired. For the purpose of impairment testing, goodwill is allocated to each of the Company’s CGU or groups of CGU that are expected to benefit from the synergies of the combination. If the recoverable amount of a CGU is less than its carrying amount, the difference is allocated first to reduce the carrying amount of any goodwill allocated to such CGU and then to the other assets of the CGU pro rata based on the carrying amount of each asset in the CGU. Any impairment loss for goodwill is recognized directly in profit or loss. An impairment loss recognized for goodwill is not reversed in subsequent periods.
The recoverable amount is the higher of fair value less costs of disposal and value in use. The assessment of impairment of goodwill requires management to make subjective judgment to determine the identified CGU, allocate the goodwill to relevant CGU and estimate the recoverable amount of relevant CGU. In the process of estimating the recoverable amount of relevant CGU, management is required to make subjective judgments in determining the discounted rate, the terminal growth rate, the independent cash flows, useful lives, expected future revenue and expenses related to the CGU.
As of December 31, 2022 and 2023, goodwill in Driver IC CGU and WLO CGU was $26,846 thousand and $1,292 thousand, respectively. For the years ended December 31, 2021, 2022 and 2023, we did not recognize any impairment loss on goodwill.
63
Income Taxes
According to the ROC Income Tax Act, dividends distributed by a Taiwan company to its foreign shareholders are subject to ROC withholding tax, currently at the rate of 21% on the amount of the distribution in the case of cash dividends or on the par value of the ordinary shares in the case of stock dividends. The surtax rate for undistributed earnings is currently 5%. However, surtax paid on undistributed earnings can no longer be used to offset against the withholding tax imposed on the dividend distributed to foreign shareholders.
As of December 31, 2023, we have not provided for retained earnings tax on the undistributed earnings of approximately $1,307.4 million of our subsidiaries since we have specific plans to reinvest these earnings indefinitely. The undistributed earnings in our foreign subsidiaries are mainly from Himax Taiwan totaling approximately $1,305.9 million as of December 31, 2023. We intend to use accumulated and future earnings of Himax Taiwan to expand operations in Taiwan.
However, a deferred tax liability will be recognized when the Taiwanese company can no longer demonstrate that it plans to reinvest indefinitely these undistributed earnings. This amount becomes taxable when we execute other investments, share buybacks or shareholder dividends to be funded by cash distribution by our foreign subsidiaries. It is not practicable to estimate the amount of additional taxes that might be payable on such undistributed earnings.
We are a holding company located in the Cayman Islands and have paid dividends and repurchased outstanding shares. To fund such dividends and repurchases, in the past years, we have received cash from bank loans and from Himax Taiwan through intercompany borrowings instead of dividends distributed by Himax Taiwan.
As part of the process of preparing our consolidated financial statements, our management is required to estimate income taxes and tax bases of assets and liabilities for us and our subsidiaries. This process involves estimating current tax exposure together with assessing temporary differences resulting from differing treatments of items for tax and accounting purposes and the amount of tax credits and tax loss carry-forward. These differences result in deferred tax assets and liabilities, which are included in the consolidated statements of financial position. Management must then assess deferred tax assets at each reporting date and reduce to the extent that it is no longer probable that the related tax benefit will be realized; such reductions are reversed when the probability of future taxable profits improves.
Consolidated Results of Operations
The following table sets forth a summary of our consolidated statements of profit or loss as a percentage of revenues:
Year Ended December 31, | |||||||
| 2021 |
| 2022 |
| 2023 | ||
Revenues | 100.0 | % | 100.0 | % | 100.0 | % | |
Costs and expenses: |
| ||||||
Cost of revenues | 51.6 |
| 59.5 | 72.1 | |||
Research and development | 9.8 |
| 14.6 | 18.1 | |||
General and administrative | 1.9 |
| 2.4 | 2.7 | |||
Sales and marketing | 1.5 |
| 2.1 | 2.5 | |||
Total costs and expenses | 64.8 |
| 78.6 | 95.4 | |||
Operating income | 35.2 |
| 21.4 | 4.6 | |||
Non-operating income (loss) | — |
| 1.6 | 0.1 | |||
Income tax expense (benefit) | 7.2 |
| 3.4 | (0.5) | |||
Profit for the year | 28.0 |
| 19.6 | 5.2 | |||
Loss attributable to noncontrolling interests | 0.2 |
| 0.1 | 0.2 | |||
Profit attributable to Himax stockholders | 28.2 |
| 19.7 | 5.4 | |||
64
Year to Year Comparisons
| Year Ended December 31, | |||||||||||
|
|
| % Change | |||||||||
2021 | 2022 | 2023 | from 2022 | |||||||||
(in thousands, except for percentages) | ||||||||||||
Consolidated Statements of Profit or Loss Data: |
|
|
|
|
|
|
|
|
| |||
Revenues | $ | 1,547,097 | $ | 1,201,339 | $ | 945,428 |
| (21.3) | % | |||
Costs and expenses: |
|
|
|
|
|
|
|
|
| |||
Cost of revenues |
| 798,519 |
| 714,233 |
| 681,931 |
| (4.5) | % | |||
Research and development |
| 151,386 |
| 175,557 |
| 171,392 |
| (2.4) | % | |||
General and administrative |
| 29,281 |
| 28,503 |
| 25,037 |
| (12.2) | % | |||
Expected credit loss |
| (190) |
| — |
| — |
| — | ||||
Sales and marketing |
| 23,080 |
| 25,459 |
| 23,856 |
| (6.3) | % | |||
Total costs and expenses |
| 1,002,076 |
| 943,752 |
| 902,216 |
| (4.4) | % | |||
Operating income |
| 545,021 |
| 257,587 |
| 43,212 |
| (83.2) | % | |||
Non-operating income (loss) |
| (429) |
| 18,978 |
| 1,181 |
| (93.8) | % | |||
Income tax expense (benefit) . |
| 110,657 |
| 41,098 |
| (5,028) |
| (112.2) | % | |||
Profit for the year |
| 433,935 |
| 235,467 |
| 49,421 |
| (79.0) | % | |||
Loss attributable to noncontrolling interest |
| 2,961 |
| 1,515 |
| 1,195 |
| (21.1) | % | |||
Profit attributable to Himax stockholders | $ | 436,896 | $ | 236,982 | $ | 50,616 |
| (78.6) | % | |||
Year Ended December 31, 2023 Compared to Year Ended December 31, 2022
Revenues. Our revenues decreased by 21.3% to $945.4 million in 2023 compared to $1,201.3 million in 2022. All three main business sectors experienced a year-over-year decline due to persistent subdued global demand, looming recession concerns, and price erosion, a requisite part of the inventory offloading process, all presented challenges to our operations throughout 2023. These market dynamics adversely affected both the demand and procurement processes of panel customers, particularly in the realm of consumer electronics.
| ● | Large-sized Display Drivers. Revenues from display drivers for large-sized application decreased by 33.5% to $175.7 million in 2023 from $264.0 million in 2022. The decline was predominantly driven by the prevailing weak macroeconomic conditions that our customers across the board, from brands to panel houses, maintained their cautious approach with heightened procurement scrutiny on the backdrop of slowing end market sell-through. |
| ● | Small and Medium-sized Display Drivers. Revenues from small and medium-sized display drivers decreased by 19.2% to $629.2 million in 2023 from $778.9 million in 2022. The decrease was primarily a result of lackluster demand in the market. Soft consumer consumption, coupled with recession fears persists as a challenge to market demand and amplifies uncertainty in the tech industry. Sales of smartphones and tablets were particularly affected by these challenging conditions. Furthermore, our automotive sector sales declined due to intensified electric vehicle price competition, especially in the second quarter of 2023, prompting major Chinese automakers to cut production and implement strict cost-saving measures. Despite these challenges, our optimism in the automotive business remains strong, with automotive TDDI sales experiencing a remarkable surge of over 50% in 2023, underscoring the resilience and potential of our largest business segment. Our automotive TDDI business secured over 400 design-win projects, while our automotive LTDI product began production for Geely Auto's NEVs in the third quarter of 2023, all solidifying our leadership as additional projects set to commence production in the next 1 or 2 years. |
65
| ● | Non-Driver Products. Revenues from non-driver products decreased by 11.2% to $140.5 million in 2023 from $158.4 million in 2022. The decrease was mainly from the decline of TCON sales, hampered by decreased demand for both large display panels and OLED displays for tablet, but partially offset by the increase of WLO and CMOS image sensor. Despite the soft market sentiment, we are actively developing the next generation TCON IC for OLED tablets, notebooks, and automotive applications, aiming to diversify our offerings and strategically position ourselves for a resurgence in demand. In our automotive TCON business, our position remains unchallenged in local dimming TCON, as evidenced by growing validation and widespread deployment globally in both premium and mainstream new car models. We plan to roll out a series of TCON products for automotive to expand our offerings catering to the diverse needs of global customers. Local dimming technology has found increasing application in automotive displays, initially in high-end car models and gradually in mainstream vehicles, with emerging use cases in heads-up displays (HUD). |
Costs and Expenses. Costs and expenses decreased by 4.4% to $902.2 million in 2023 from $943.8 million in 2022. As a percentage of revenues, costs and expenses increased to 95.4% in 2023 compared to 78.6% in 2022.
| ● | Cost of Revenues. Cost of revenues decreased to $681.9 million in 2023 from $714.2 million in 2022, which was due primarily to a 3.1% decrease in unit shipments in 2023. As a percentage of revenues, cost of revenues increased to 72.1% in 2023 from 59.5% in 2022, mainly due to market price erosion on the backdrop of sluggish end market demand as well as cautious inventory management and rigorous procurement scrutiny by customers, particularly in the realm of consumer electronics. Aggressive destocking, strategic termination of certain high-cost foundry capacity agreements, and the write-down of unsold inventories due to market price declines have all contributed to higher costs of revenues. |
| ● | Research and Development. Research and development expenses decreased by 2.4% to $171.4 million in 2023 from $175.6 million in 2022. This decrease was primarily attributable to the lower vested portion of the annual bonus compensation awarded to employees in 2023 and preceding years, but partially offset by increased salaries and tape-out expenses. The increase in salary expense was due primarily to a larger headcount of research and development staff and higher average salaries, but partially offset by NT dollar depreciation against the US dollar as we pay the bulk of our employee salaries in NT dollars. |
| ● | General and Administrative. General and administrative expenses decreased by 12.2% to $25.0 million in 2023 from $28.5 million in 2022, primarily as a result of decreases in compensation awards to employees described in above Research and Development and professional fees. |
| ● | Sales and Marketing. Sales and marketing expenses decreased by 6.3% to $23.9 million in 2023 from $25.5 million in 2022. This decrease was primarily attributable to decrease in compensation awards to employees described in above Research and Development, but partially offset by increase in travelling expense. |
Non-Operating Income (loss). We had net non-operating income of $1.2 million in 2023 compared to $19.0 million in 2022. The decrease was primarily due to a gain from disposal of a subsidiary in 2022, decrease in foreign currency exchange gains and increase in finance costs but partially offset by an increase in interest income.
Income Tax Expense (benefit). Our income tax benefit increased to $5.0 million in 2023 from income tax expense of $41.1 million in 2022. Our effective income tax rate decreased to (11.3%) in 2023 from 14.9% in 2022. The decrease in our effective income tax rate was primarily attributable to the significant decrease in pre-tax profit, from $276.6 million in 2022 to $44.4 million in 2023 and income tax benefit for tax credit decreased to $9.9 million in 2023 from $15.6 million in 2022. Additionally, there was a combined recognized income tax benefit of $4.0 million in 2023 but income tax expense of $0.6 million in 2022, for changes in unrecognized tax benefits and variances resulting from prior years’ income.
Profit for the year. As a result of the foregoing, our profit was $49.4 million in 2023, versus $235.5 million in 2022, and profit attributable to Himax stockholders was $50.6 million in 2023, versus $237.0 million in 2022.
66
Segment Results
The following table sets forth the revenues and operating results for our reportable segments for the periods indicated:
Year Ended December 31, | |||||||||
| 2021 |
| 2022 |
| 2023 | ||||
(in thousands) | |||||||||
Segment Revenues |
|
|
|
| |||||
Driver IC | $ | 1,361,442 | $ | 1,042,938 | $ | 804,840 | |||
Non-Driver Products |
| 185,655 | 158,401 | 140,588 | |||||
Total | $ | 1,547,097 | $ | 1,201,339 | $ | 945,428 | |||
Year Ended December 31, | |||||||||
| 2021 |
| 2022 |
| 2023 | ||||
(in thousands) | |||||||||
Segment Operating Income (Loss) |
|
|
|
| |||||
Driver IC | $ | 551,943 | $ | 275,275 | $ | 75,282 | |||
Non-Driver Products | (6,922) | (17,688) | (32,070) | ||||||
Total | $ | 545,021 | $ | 257,587 | $ | 43,212 | |||
Driver IC Segment
Year Ended December 31, 2023 Compared to Year Ended December 31, 2022
Segment revenues. Our revenues from the Driver IC segment decreased by 22.8% to $804.8 million in 2023 from $1,042.9 million in 2022. The decline stemmed from reduced sales of display drivers for both large-sized and small and medium-sized sectors, driven by the prevailing weak macroeconomic conditions that adversely affected both the demand for and procurement processes of panel customers, especially within the consumer electronics sector.
Segment operating income. Operating income from the Driver IC segment decreased to $75.3 million in 2023 from $275.3 million in 2022. This decrease was primarily attributable to a decrease in revenues and lower gross margin, which was mainly attributable to pricing pressure, largely stemming from pricing pressure caused by the need to offload excess inventory levels amid challenging economic conditions.
Non-Driver Products Segment
Year Ended December 31, 2023 Compared to Year Ended December 31, 2022
Segment revenues. Our revenues from the Non-Driver Products segment decreased by 11.2% to $140.6 million in 2023 from $158.4 million in 2022. The year-over-year decrease was mainly from decline in TCON revenues, but partially offset by the increase of WLO and CMOS imaging sensor.
Segment operating loss. Operating loss from the Non-Driver Products segment increased to $32.1 million in 2023 from $17.7 million in 2022. The operating loss increases were attributable mainly to the decline in revenues and gross margin.
5.B. Liquidity and Capital Resources
We need cash primarily for technology advancement, capacity expansion, paying dividends and working capital. We have historically been able to meet our cash requirements through cash flow from operations and borrowings to pay dividends.
67
As of December 31, 2023, we had total current assets of $1,200.6 million, total current liabilities of $708.8 million and cash and cash equivalents of $191.7 million. As of December 31, 2023, we had short-term secured borrowings of $453.0 million with cash and time deposits of $453.0 million as collateral, and long-term unsecured borrowings of $40.5 million, of which $6.0 million was current portion. For enhancing the guaranty, our land, building and improvements of Fab 2 totaling $63.4 million were pledged as collateral for the long-term unsecured borrowings. As of December 31, 2023, we had total unused short-term credit lines of $206.5 million, of which $127.0 million belonging to the parent company, Himax Technologies, Inc., needs to be secured with an equal amount of cash and time deposits when borrowing money from banks. Further, we had unused long-term credit lines of $139.5 million. We believe that our existing short-term and long-term credit lines, together with cash generated from our operations, are sufficient to meet our liquidity needs. We expect to meet our present working capital requirements through cash flow from operations and bank borrowings from time to time.
The following table sets forth a summary of our cash flows for the periods indicated:
Year Ended December 31, | |||||||||
| 2021 |
| 2022 |
| 2023 | ||||
(in thousands) | |||||||||
Net cash provided by operating activities | $ | 388,276 | $ | 82,908 | $ | 152,841 | |||
Net cash provided by (used in) investing activities | (232,680) | 14,998 | (88,882) | ||||||
Net cash (used in) financing activities | (4,487) | (211,068) | (93,591) | ||||||
Net increase (decrease) in cash and cash equivalents | 151,086 | (114,443) | (29,832) | ||||||
Cash and cash equivalents at beginning of period | 184,938 | 336,024 | 221,581 | ||||||
Cash and cash equivalents at end of period | 336,024 | 221,581 | 191,749 | ||||||
Operating Activities. Net cash provided by operating activities in 2023 was $152.8 million compared to $82.9 million in 2022. This increase in net cash provided by operating activities in 2023 was mainly due to the substantial reduction in inventory across major product lines.
Investing Activities. Net cash used in investing activities in 2023 was $88.9 million compared to net cash provided by investing activities $15.0 million in 2022. This increase in net cash used in investing activities was due primarily to an increase of $50.8 million in refundable deposits made for securing foundry capacity, an increase of $20.9 million in net cash used in acquisitions of financial assets at amortized cost in 2023 compared to 2022 and an increase in cash used in acquisitions of property, plant and equipment of $11.6 million.
Financing Activities. Net cash used in financing activities in 2023 was $93.6 million compared to $211.1 million in 2022. This change was due primarily to decrease in distribution of cash dividends in 2023 and a decrease of guarantee deposits received from customers.
Our liquidity could be negatively impacted by a decrease in demand for our products that are subject to rapid technological change, among other factors, which could result in revenue variability in future periods. In addition, we have at times agreed to extend the payment terms for certain of our customers. The extension of payment terms for our customers could adversely affect our cash flow, liquidity and our operating results. Our subsidiaries’ ability to distribute dividends and other payments to us may be limited by ROC regulations. See “Risk Factors — Risks Related to Our Holding Company Structure — Our ability to receive dividends and other payments or funds from our subsidiaries may be restricted by commercial, statutory and legal restrictions, and thereby materially and adversely affect our ability to grow, fund investments, make acquisitions, pay dividends and otherwise fund and conduct our business.”
68
During the 2021 timeframe, we took steps to address the ongoing foundry capacity shortage worldwide by entering into strategic agreements with our foundry partners to secure the necessary capacity to meet our business requirements. Under these strategic agreements, we are committed to purchasing a specific volume at fixed prices or variable prices. Some of our customers, and even our indirect customers, are also entering into similar strategic agreements to secure their IC supplies with us. However, there can be no assurance that these prices provided in the strategic agreements with our foundry partners and our customers will always remain competitive during the contract term. For example, in the event that the global semiconductor market changes due to foundry capacity expansion and/or shrunken customer demand, the fixed prices we agree to pay our foundry partners may become significantly higher than the then prevailing market price. On the other hand, if there continues to be foundry capacity shortages and/or increases in customer demand, the fixed prices our customers agree to pay us may become significantly lower than the then prevailing market price. Any of those situations could materially adversely impact our pricing strategies, competitive position, profitability and results of operation. We may also be subject to contractual penalties if we are unable to purchase the committed volume from our foundry partners. However, after several quarters of aggressive destocking, our inventory has reached a comfortable level. In light of this, we strategically terminated certain high-cost foundry capacity agreements in the second quarter of 2023, prior to their expiration dates. This move aims to improve our cost structure for new wafer starts and maintain competitiveness. This, however, also has resulted in a significant one-time early termination expense incurred in the second quarter of 2023 and hit our gross margin. In addition, since these strategic agreements with our foundry partners typically require us to make prepayments or refundable deposits to such foundry partners, our cash flow, liquidity and financial condition could be adversely affected.
We have entered into several wafer fabrication or assembly and testing service arrangements or multi-year purchase agreements with suppliers. We may be obligated to make payments for purchase orders entered into pursuant to these arrangements. Our purchase obligations also include agreements to purchase goods or services, primarily inventory, that are enforceable and legally binding on us and that specify all significant terms, including fixed or minimum quantities to be purchased, fixed or variable price provisions, and the approximate timing of the transaction. Among all these purchase agreements, the longest termination term shall expire in 2028. Purchase obligations exclude agreements that are cancelable without penalty. Contractual obligations resulting from above purchase orders and agreements with known amounts approximate $1,415 million as of December 31, 2023. Of obligations under above purchase orders and agreements, $589 million is expected to be paid in the next 12 months.
Our capital expenditures were incurred primarily in connection with the purchase of property and equipment. Our capital expenditures totaled $7.6 million, $11.8 million and $23.4 million in 2021, 2022 and 2023, respectively. Capital expenditures of $23.4 million in 2023 was mainly for in-house testers for our IC design business as well as R&D related equipment.
The capex budget will be funded through our internal resources and banking facilities, if so needed. We will continue to make capital expenditures to meet the expected growth of our operations. We believe that our working capital and borrowings under our existing and future credit lines should be sufficient for our present requirements.
69
5.C. Research and Development
Our research and development efforts focus on improving and enhancing our core technologies and know-how relating to the semiconductor solutions we offer to the flat panel display industry. In particular, we have committed a significant portion of our resources to the research and development of non-driver products because we believe in the long-term business prospects of such products and are committed to continuing to diversify our product portfolio. Although a significant portion of the resources at our integrated circuit design center are invested in advanced research for future products, we continue to invest in improving the performance and reducing the costs of our existing products. Our application engineers, who provide on-system verification of semiconductors and product specifications, and field application engineers, who provide on-site engineering support at our customers’ offices or factories, work closely with Panel Manufacturers to co-develop display solutions for their electronic devices. In 2021, 2022 and 2023, we incurred research and development expenses of $151.4 million, $175.6 million and $171.4 million, respectively, representing 9.8%, 14.6% and 18.1% of our revenues, respectively.
5.D. Trend Information
In 2023, Himax confronted challenges arising from subdued global demand, cautious procurement practices, and stringent controls by panel makers and end customers, resulting in revenue decline and gross margin contraction. However, looking ahead to 2024 and beyond, we are poised for sustained growth, leveraging our automotive leadership, operational flexibility, and focus on high-value areas such as TCON, OLED, and AI. With these product lines boasting higher gross margins than our corporate average and some already securing market-leading positions, we are well positioned for the future. As the semiconductor supply chain gradually stabilizes and channel inventory returns to healthier levels, we anticipate a promising recovery ahead.
Large-sized Display Driver IC Sector
Looking towards the long-term horizon, Himax maintains a positive outlook on the prospects of our large display driver business. Supported by a diversified and comprehensive product portfolio, we possess the agility to swiftly allocate production towards sectors demonstrating demand, in close collaboration with our customers and suppliers. Our alliances with leading end customers in the TV, monitor, and notebook markets are instrumental in driving our focus towards higher-end displays. Recognizing the increasing demand for advanced displays and premium models, we offer cutting-edge driver ICs and TCONs, providing a seamless one-stop shopping experience for leading end customers across these markets. Moreover, we facilitate feature enhancements for our customers' next-generation products, encompassing high-speed interfaces, low power consumption, higher refresh rates, ultra-large-sized displays, high-aspect-ratio screens, and curved-view designs. These initiatives collectively establish a formidable barrier of entry, setting us apart from local competition in China.
Small and Medium-Sized Display Driver IC Sector
Himax remains the market share leader in display driver ICs for automotive and tablets. In the automotive market, we are deepening our working relationships with leading panel makers, Tier 1 players, and end customers across the globe. In 2024, we expect the automotive sector to continue as our single largest revenue contributor, representing over 40% of total sales. We maintain high optimism in our automotive business and market position due to our extensive product portfolio spanning mainstream LCD and emerging OLED technologies. Securing several hundreds of design wins in TDDI and local dimming TCON for automotive LCD displays, with most slated for mass production within the next two years, highlights our market dominance in the coming years. Additionally, our foray into automotive OLED displays, including DDIC, TCON, and the newly launched touch controller, strengthens our market share leadership by providing customers with integrated solutions.
Himax also offers high-speed P2P bridge and LTDI solutions, specially designed for displays typically larger than 30 inches or pillar-to-pillar displays. These solutions can cascade up to 30 chips in support of ultrahigh-resolution displays, offering high-precision touch sensitivity and creating a high entry barrier for potential competitors. Our industry-leading, cutting-edge automotive LTDI product started mass production for Geely Auto’s NEVs in the third quarter of 2023. We are also witnessing a prominent emerging trend of more customers opting for our TDDI or LTDI, coupled with our local dimming TCON, as their standard development platform for crafting new automotive displays of various sizes. This movement has drawn the interest of leading panel makers, Tier 1s, and car makers across the spectrum, acknowledging the benefits of our supreme bundle solution to accelerate their new panel development and elevate their product values. Given all the new demand for advanced automotive display technologies, we expect decent sales growth to continue for our automotive sector in 2024.
70
On the tablet market, Himax still has a leading position, especially on the non-iOS market, as market adoption of TDDI continues. For OLED panel for tablet, Himax offers both DDIC and TCON where we commenced mass production in the first quarter of 2022. Despite the soft demand environment, we are actively working on the next generation IC for OLED tablet, aiming to broaden our offering and better position us for when demand returns. Moreover, we are witnessing growing demand for LCD displays with higher frame rates, resolutions, screen sizes, and active stylus support, all of which align with our early mover advantage in the market. In the smartphone sector, we anticipate higher exposure once our smartphone AMOLED solution becomes available. As expected, our traditional discrete driver ICs for smartphones and tablets are being rapidly replaced by TDDI technology.
Himax is actively expanding our presence in the AMOLED market through strategic partnerships with leading panel makers in Korea and China. Our comprehensive AMOLED portfolio now includes the newly launched on-cell touch controllers, enabling us to offer solutions for various applications, including automotive, tablets, and notebooks, among others. Additionally, our flexible AMOLED driver and TCON for automotive display have successfully ramped up for a customer’s flagship EV model in the first quarter of 2022, with the number of awarded projects with worldwide conventional car makers and EV vendors on the rise. We anticipate that AMOLED driver ICs will soon become one of the major growth drivers for our business.
Non-Driver IC Sector
The non-driver category has been our most exciting growth area and a differentiator for the Company. We are devoted to the development, manufacturing and marketing of non-driver products to diversify our customer base and product portfolio to offer total solutions of timing controller, image processing and human interface related technologies in addition to our driver IC products.
In the timing controller sector, we are optimistic about the growth prospects, where we have successfully positioned ourselves for higher-end and higher value-added areas, including 4K/8K TV, gaming TV and monitors, low-power notebooks, in view of consumers’ pursuit of various new types of entertainment for film, television, and gaming, as well as automotive applications, particularly with the local dimming feature. With years of strenuous work on this high entry barrier technology, we have developed comprehensive local dimming TCON product offerings and have an unchallenged leading position, particularly in automotive areas, where we have secured over one hundred design-win projects from numerous Tier 1s and car makers, initially in high-end car models and gradually into mainstream vehicles. Local dimming technology not only enhances display contrast for better viewing under bright daylight but also provides effective power saving, critical for larger displays and EV models. Our latest local dimming TCON features advanced image enhancement with a wide color spectrum, ensuring exceptional visual quality supporting resolutions of up to 12Kx1K, and dynamic contrast enhancement tailored to real-time display content, all while adhering to power efficiency and stringent automotive safety standards. In 2024, we expect very strong annual growth for the automotive local dimming TCON business, backed by quickly expanding design wins as well as already secured design wins set to commence mass production within the next two years. Additionally, we commenced mass production of AMOLED TCON together with DDIC in automotive and tablet applications starting in early 2022, where the design wins with leading tablet and NEV customers continue to expand. Meanwhile, we are actively developing the next generation TCON IC for OLED tablets, notebooks, and automotive applications, aiming to diversify our offerings and strategically position ourselves for a resurgence in demand. We believe the TCON sector will be one of the driving forces for our non-driver business moving forward.
During 2016, our non-driver businesses experienced tremendous growth, primarily driven by the LCoS and WLO businesses due to shipments to one of our leading AR device customers. WLO shipments increased considerably year-over-year in 2018 because of the customer’s large-scale adoption in more models. In 2023, we continued to fulfill anchor customer’s demand for the legacy product, albeit at a much lower volume. The WLO technology continues to play an important role in shaping next generation optical applications. As an illustration, our WLO technology can be deployed to empower 3D perception sensing for precise controller-free gesture recognition in VR devices and commenced volume production of WLO technology to a leading North American customer starting in second quarter of 2023 for their new generation VR devices to enable 3D gesture control. Our exceptional optical design knowledge, together with our production proven nanoimprinting capabilities and mass manufacturing experience, allow us to deliver high-quality solutions to meet the requirements of the future generation optical applications across automotive, consumer, industrial, medical applications, AR/VR/ MR devices and many other applications.
71
Regarding ultralow power WiseEye smart image sensing, the demand for resource-constrained and battery-powered end point applications with AI intelligent sensing is rapidly growing. Our WiseEye AI solution is designed for a wide range of ultralow power use cases that aim to modernize legacy endpoint devices, which lack AI capability, with ultralow power computer vision AI. The AI solution is capable of processing data locally on the end device with just metadata output while avoiding the need to transport massive data to the cloud, thereby improving response time, saving bandwidth and power and, last but not least, enhancing data security. Our design-win with Dell for a series of new models that started in 2021 saw meaningful shipment in 2022. We continue to support the mass production of Dell’s notebook and other endpoint AI applications, such as shared bike parking, video conference device, smart door lock, smart agriculture, medical capsule endoscope among others. We are steadfast in our dedication to WiseEye, aiming to expand our ultralow-power AI solution across various end-point AI applications. Additionally, we are focused on advancing energy-efficient AI processors and image sensors for these applications to uphold our leading position in the field. We maintain our leading position in the field of AI with active collaborations across various ecosystem partners and system integration companies, aimed at addressing diverse application needs and expanding the market presence of WiseEye AI. As official partners of prominent AI platforms including Google TensorFlow Lite for Microcontrollers, Microsoft Azure, Arm AI Partner Program, and the tinyML Foundation, we leverage their extensive networks and participant base. We also provide development tools and robust AI models to streamline customer efforts and reduce costs for AI product introduction. Our WiseEye Modules, integrating Himax's low-power CMOS image sensors, WiseEye AI processors, and AI models from in-house or third-party sources, exemplify this approach, aiming to scale adoption in this relatively untapped market. These modules feature compact designs, high integration, and plug-and-play functionality, equipped with user-programmable AI models to facilitate seamless integration and lower development barriers and costs. This initiative is particularly suitable for early-stage market applications and Modules is accessible through online resellers such as DigiKey and other system integration partners. Collaborations with partners to introduce plug-and-play AI modules incorporating advanced no-code/low-code AI solutions further enhance our ability to meet diverse development needs. Our collaboration with Seeed Studio at CES 2024 on the Grove Vision AI Module V2, a battery-powered endpoint AI vision processing module, highlights our commitment to making AI technology easily accessible. Additionally, our marketing efforts include joint webinars/promotions with well-known platform partners and SI companies like Edge Impulse, Digi-Key, SparkFun, Seeed Studio, and hackster.io and many others, to broaden our reach and establish direct contacts with more AI developers.
Moving forward, we are more committed than ever to strengthening our WiseEye product roadmap and retaining our leadership position in ultralow power AI processor and image sensor for end-point AI applications. WiseEye2, our latest AI processor, has earned the prestigious "2023 Best AI Product Award" from EE Awards Asia, solidifying our leadership position in the industry. This achievement builds upon the success of our pioneering WiseEye1 AI processor where WiseEye2 goes beyond setting a new standard in endpoint AI with exceptional inference capability, ultralow power efficiency, and advanced security features. It excels in context-aware AI with precise detection capabilities such as face mesh, facial landmark, hand gesture, and human pose, all achieved with minimal power consumption, as well as simplifying system integration and lowers costs by offering a rich set of peripheral interfaces, eliminating the need for additional discrete MCUs. With versatile sensor fusion capabilities, WiseEye2 enables accurate detection across various inputs, making it ideal for various applications, including industrial. Collaboration with major CPU and AP SOC players are in progress, facilitating integration into next-generation smart notebooks, AI PCs, surveillance systems, and beyond. WiseEye business is in a good position to enjoy rapid growth for years to come and we believe it will serve as a multi-year structural growth driver for Himax.
On 3D sensing, we offer both total solutions and key components for our customers. Our 3D decoder IC accelerates local image processing for face recognition, ensuring advanced and secured security authentication, thereby has been certified by leading Chinese electronic payment standards, meeting requirements for accurate data decoding, timely operation, and strict privacy. It's widely adopted by many Chinese e-payment solution providers with significant shipments starting 2022. At CES 2024, we showcased a range of 3D depth sensing solutions tailored for various AR/VR applications. Our groundbreaking 3D naked-eye laptop is eye catching which features Himax's proprietary structured light vision AI module for advanced real-time 3D eye and hand gesture tracking. With eye tracking, the AI module accurately detects the viewer's eye position in a 3D coordinate system with minimal latency, as fast as 7 milliseconds. This allows the laptop display to dynamically adjust based on the viewer's perspective, delivering vibrant, glasses-free 3D visuals without causing dizziness. Additionally, the module supports hand gesture tracking for intuitive, controller-free laptop operation, enhancing human-machine interaction.
72
For CMOS image sensors business, we continue to provide CMOS image sensors for web camera and notebook. Our industry-first 2-in-1 CMOS image sensor that supports RGB mode for video conferencing and ultralow power AI mode for facial recognition has penetrated the laptop market for the most stylish super slim bezel designs. Given the rapid expansion of AI adoption across various industries, we have developed a range of ultralow-power Always-On CMOS image sensors specifically tailored for AI applications that require continuous sensing or monitoring, while maintaining minimal power consumption. We are receiving increasing feedback and seeing design adoptions from customers worldwide for a variety of markets, including surveillance, smart electric/water meters, drones, smart home/office solutions, medical devices, and various other appliances.
Lastly, we have committed years of R&D efforts to LCoS product. We continue to focus on AR goggle devices and AR HUD (head-up-displays) for automotive. Many of our industry-leading customers have demonstrated their state-of-the-art products with our technology embedded in, including AR glasses and LiDAR system. Our proprietary front-lit LCoS microdisplay covers LCoS microdisplay, lightguide, and front-lit LED. Our latest Color Sequential Front-Lit LCoS Microdisplay stands out with its unmatched brightness of up to 180,000 nits, setting new standards for microdisplay panel with vibrant RGB color displays. With superior optical power efficiency, compact design, and ultra-lightweight build, it emerges as the optimal choice for next-generation see-through AR devices, evidenced by several tech giants in the industry shifting their focus away from micro-LED to our Front-Lit LCoS for their AR goggles. Presently, we actively engage in follow-up engineering endeavors in collaboration with key industry players, anticipating significant opportunities on the horizon.
For more trend information, see “Item 5.A. Operating and Financial Review and Prospects—Operating Results.”
5.E. Critical Accounting Estimates
The preparation of the consolidated financial statements in conformity with IFRS requires management to make judgments, estimates and assumptions that affect the application of accounting policies and the reported amounts of assets, liabilities, income and expenses. Actual results may differ from these estimates.
Estimates and underlying assumptions are reviewed on an ongoing basis. Revisions to accounting estimates are recognized in the period in which the estimates are revised and in any future periods affected.
Note 4 to our audited consolidated financial statements contains a description that sets forth information about critical judgments, estimates and assumptions in applying accounting policies that have the most significant effect on the amounts recognized in the consolidated financial statements.
ITEM 6. DIRECTORS, SENIOR MANAGEMENT AND EMPLOYEES
6.A. Directors and Senior Management
Members of our board of directors may be elected by our directors or our shareholders. Our board of directors consists of five directors, three of whom are independent directors within the meaning of Rule 5605(a)(2) of the Nasdaq Rules. Other than Jordan Wu and Dr. Biing-Seng Wu, who are brothers, there are no family relationships between any of our directors and executive officers. The following table sets forth information regarding our directors and executive officers as of March 31, 2024. Unless otherwise indicated, the positions or titles indicated in the table below refer to Himax Technologies, Inc.
Directors and Executive Officers |
| Age |
| Position/Title |
Dr. Biing-Seng Wu | 66 | Chairman of the Board | ||
Jordan Wu | 63 | President, Chief Executive Officer and Director | ||
Dr. Yan-Kuin Su | 75 | Director | ||
Yuan-Chuan Horng | 72 | Director | ||
Dr. Liang-Gee Chen | 67 | Director | ||
Jessica Pan | 54 | Chief Financial Officer | ||
Hsien Chang Tsai | 53 | Vice President, Sales and Operations | ||
Eric Li | 60 | Chief IR/PR Officer and Spokesperson |
73
Directors
Dr. Biing-Seng Wu is the chairman of our board of directors. Prior to our reorganization in October 2005, Dr. Wu served as president, chief executive officer and a director of Himax Taiwan. Dr. Wu also served as the vice chairman of the board of directors of CMO prior to its merger with the predecessor of Innolux and TPO. Dr. Wu has been active in the TFT-LCD panel industry with profound experience and is a member of the boards of the Taiwan TFT-LCD Association and the Society for Information Display. Prior to joining CMO in 1998, Dr. Wu was senior director and plant director of Prime View International Co., Ltd., a TFT-LCD panel manufacturer, from 1993 to 1997, and a manager of Thin Film Technology Development at the Electronics Research & Service Organization/Industry Technology Research Institute, or ERSO/ITRI, of Taiwan. Dr. Wu holds a B.S. degree, an M.S. degree and a Ph.D. degree in electrical engineering from National Cheng Kung University. Dr. Wu is the brother of Mr. Jordan Wu, our president and chief executive officer.
Jordan Wu is our president, chief executive officer and director. Prior to our reorganization in October 2005, Mr. Wu served as the chairman of the board of directors of Himax Taiwan, a position which he held since April 2003. Prior to joining Himax Taiwan, Mr. Wu served as chief executive officer of TV Plus Technologies, Inc. and chief financial officer and executive director of DVN Holdings Ltd. in Hong Kong. Prior to that, he was an investment banker at Merrill Lynch (Asia Pacific) Limited, Barclays de Zoete Wedd (Asia) Limited and Baring Securities, based in Hong Kong and Taipei. Mr. Wu holds a B.S. degree in mechanical engineering from National Taiwan University and an M.B.A. degree from the University of Rochester. Mr. Wu is the brother of Dr. Biing-Seng Wu, our chairman.
Dr. Yan-Kuin Su is our director. He has retired from the president of Kun Shan University effective July 31, 2018 and also a professor in the Department of Electrical Engineering, National Cheng Kung University since 1983 and retired in 2011. Dr. Su currently also serves as the dean of Academy of Innovative Semiconductor and Sustainable Manufacturing at National Cheng Kung University, since August 2022. Dr. Su is devoted to the field of research in semiconductor engineering and devices, optoelectronic devices, and microwave device and integrated circuits. He is a life fellow of the Institute of Electrical and Electronics Engineers, or IEEE. Dr. Su holds a B.S. degree and an M.S. degree and a Ph.D. degree in Electrical Engineering from National Cheng Kung University.
Yuan-Chuan Horng is our director. Prior to our reorganization in October 2005, Mr. Horng served as a director of Himax Taiwan from August 2004 to October 2005. Mr. Horng retired from the position of the vice president of the Finance Division of China Steel Corporation, a TWSE-listed Corporation, effective November 30, 2016. During his 40 years of services with China Steel Corporation Group, Mr. Horng held various positions including general manager, assistant vice president and vice president in the Finance Divisions. Mr. Horng currently serves as an independent director of President Securities Corporation, listed on TWSE, since June 2018. Mr. Horng holds a B.A. degree in economics from Soochow University.
Dr. Liang-Gee Chen is our director. He now serves as Emeritus Professor of Department of Electrical Engineering, National Taiwan University. Dr. Chen holds a B.S. and M.S. and Ph.D. degree in Electrical Engineering from National Cheng Kung University. Dr. Chen has previous served several roles including as Minister of Ministry of Technology and Science, Deputy Minister of Ministry of Education, Executive Vice President for Academics and Research of NTU, Vice Dean Officer for College of Electrical Engineering and Computer Science of NTU, and President of National Applied Research Laboratories. Dr. Chen has thorough and extensive professional expertise and experience across the industry, government, and academia. He has devoted the Electrical Engineering specificity on VLSI design for Multimedia Processing System. He received the IEEE Fellow in 2001, TWAS Engineering Science Medal in 2010 and Fellow of National Academy of Innovators in 2016.
Other Executive Officers
Jessica Pan is our chief financial officer. Jessica joined Himax in 2006 with over 22 years of experience in finance and accounting. Jessica has played an integral role at Himax on finance, accounting, financial planning and analysis, forecasting and tax, having served as interim Chief Financial Officer from October 2010 to January 2012. Prior to joining Himax, Jessica worked as Assistant Finance Manager for Advanced Semiconductor Engineering, Inc. from 2002 to 2006 and as Auditor at Arthur Andersen LLP in Taiwan from 1998 to 2001. She holds a B.S. degree in Agriculture Chemistry from National Taiwan University and an M.B.A. degree from the State University of New York at Buffalo.
74
Hsien Chang Tsai is our vice president in charge of Sales and Operations. Mr. Tsai joined Himax in 2002 as Director of Himax Operation Division initially before serving as Vice President of Himax Display, Inc. where he successfully led the acquisition of Spatial Photonics, Inc. Most recently, he concurrently served as Vice President of Himax Imaging, Ltd. and Vice President of Intelligent Sensing AI Product Center of Himax. Prior to Himax, Mr. Tsai served in the process integration and customer service department of TSMC. Mr. Tsai holds a B.S. degree and M.S. degree in Electrical Engineering from National Taiwan University and an executive M.B.A. degree from National Taiwan University.
Eric Li is our chief IR/PR officer and Spokesperson. Joining Himax in 2012, Mr. Eric Li has an extensive experience in image processing related IC design, having worked in the areas of sales, marketing, R&D and served as Associate Vice President at Himax covering the Intelligent Sensing AI product line. Mr. Li has previously worked in video processing ASIC service and TV/monitor ASSP products before he was put in charge of the fab construction and operation of Himax’s WLO advanced optics operation. Prior to Himax, Mr. Eric Li served in executive positions of Cadence Design Systems, Socle Technology, Macronix International and Powerchip Semiconductor. He holds a B.S. degree in Nuclear Engineering from National Tsing Hua University and an M.S. degree in Computer and Information Science from New Jersey Institute of Technology.
Board Diversity
On August 6, 2021, the SEC approved the Nasdaq Stock Market’s proposal to amend its listing standards to encourage greater board diversity and to require board diversity disclosures for Nasdaq-listed companies. Pursuant to the amended listing standards, Himax, as a foreign private issuer and with a smaller board having five members, is required to have at least one diverse board members or explain the reasons for not meeting this objective. Furthermore, a board diversity matrix is required to be included in the annual report on Form 20-F, containing certain demographic and other information regarding members of our board of directors.
The Company does not currently have any member of its board of directors who is Diverse within the meaning of Nasdaq Rule 5605(f)(2)(B). The Company takes various factors into consideration for candidate identification and selection, including qualifications, capabilities, insights, personal attributes and proficiency in relevant fields, for the purpose of meeting Company's current and future plans as well as objectives. The Company focuses on having a balanced and diverse workforce and will continue to consider all director candidates, including “diverse” director candidates based on their merits.
The table below provides certain information regarding the diversity of our board of directors as of the date of this annual report.
Board Diversity Matrix (As of March 31, 2024) | ||||||||
Country of Principal Executive Offices |
| TAIWAN, REPUBLIC OF CHINA | ||||||
Foreign Private Issuer |
| Yes | ||||||
Disclosure Prohibited Under Home Country Law |
| No | ||||||
Total Number of Directors |
| 5 | ||||||
Female | Male | Non-Binary | Did Not Disclose | |||||
Gender | ||||||||
Part I: Gender Identity |
|
|
|
|
|
|
| |
Directors |
| — |
| 5 |
| — |
| — |
Part II: Demographic Background |
|
|
|
|
|
|
|
|
Underrepresented Individual in Home Country Jurisdiction |
| — | ||||||
LGBTQ+ |
| — | ||||||
Did Not Disclose Demographic Background |
| — | ||||||
6.B. Compensation
For the year ended December 31, 2023, the aggregate cash compensation that we paid to our executive officers was approximately $1.8 million. The aggregate share-based compensation that we paid to our executive officers was approximately $0.2 million. In 2023, our Chairman of the Board voluntarily abandon the number of RSUs to be granted proposed by the compensation committee and then compensate other employees. The goal is to provide competitive compensation to our employees. No executive officer is entitled to any severance benefits upon termination of his or her employment with us.
75
For the year ended December 31, 2023, the aggregate cash compensation that we paid to our independent directors was approximately $150,000. The aggregate share-based compensation that we paid to our independent directors was nil.
The following table summarizes the RSUs and cash award that we granted in 2023 to our directors and executive officers under our 2011 long-term incentive plan. Each unit of RSU represents two ordinary shares. See “Item 6.D. Directors, Senior Management and Employees—Employees––Share-Based Compensation Plans” for more details regarding our RSU grants.
|
| Total Cash |
|
| Ordinary Shares |
| ||||
|
| Award |
| Ordinary Shares |
| Underlying |
| Unvested Portion | ||
Total RSUs |
| Granted |
| Underlying Vested |
| Unvested Portion |
| of cash award | ||
Name |
| Granted |
| (in thousands) |
| Portion of RSUs |
| of RSUs |
| (in thousands) |
Dr. Biing-Seng Wu | — | — | — | — | — | |||||
Jordan Wu | 5,282 | — | 4,226 | 6,338 | — | |||||
Dr. Yan-Kuin Su | — | — | — | — | — | |||||
Yuan-Chuan Horng | — | — | — | — | — | |||||
Dr. Liang-Gee Chen | — | — | — | — | — | |||||
Jessica Pan | 4,465 | — | 4,226 | 4,704 | — | |||||
Hsien Chang Tsai | 2,113 | 28 | 4,226 | — | 28 | |||||
Eric Li | 4,176 | — | 4,226 | 4,126 | — |
6.C. Board Practices
General
Our board of directors consists of five directors, three of whom are independent directors within the meaning of Rule 5605(a)(2) of the Nasdaq Rules. We intend to comply with Rule 5605(b)(1) of the Nasdaq Rules that require boards of U.S. companies to have a board of directors which is comprised of a majority of independent directors. We intend to follow home country practice that permits our independent directors not to hold regularly scheduled meetings at which only independent directors are present in lieu of complying with Rule 5605(b)(2). None of our non-executive directors has a service contract with us that provides for benefits upon termination of service.
Committees of the Board of Directors
To enhance our corporate governance, we have established three committees under the board of directors: the audit committee, the compensation committee and the nominating and corporate governance committee. We have adopted a charter for each of the three committees. Each committee’s members and functions are described below.
Audit Committee. Our audit committee currently consists of Yuan-Chuan Horng, Dr. Yan-Kuin Su and Dr. Liang-Gee Chen. Our board of directors has determined that all of our audit committee members are “independent directors” within the meaning of Rule 5605(a)(2) of the Nasdaq Rules and meet the criteria for independence set forth in Section 10A(m)(3)(B)(i) of the Exchange Act. Our audit committee will oversee our accounting and financial reporting processes and the audits of our financial statements. The audit committee will be responsible for, among other things:
| ● | selecting the independent auditors and pre-approving all auditing and non-auditing services permitted to be performed by the independent auditors; |
| ● | reviewing with the independent auditors any audit problems or difficulties and management’s response; |
| ● | reviewing and approving all proposed related party transactions, as defined in Item 404 of Regulation SK under the Securities Act; |
| ● | discussing the annual audited financial statements with management and the independent auditors; |
| ● | reviewing major issues as to the adequacy of our internal controls and any special audit steps adopted in light of significant deficiencies or material weaknesses in internal controls; |
76
| ● | annually reviewing and reassessing the adequacy of our audit committee charter; |
| ● | meeting separately and periodically with management and the independent auditors; |
| ● | reporting regularly to the board of directors; and |
| ● | such other matters that are specifically delegated to our audit committee by our board of directors from time to time. |
Compensation Committee. Our current compensation committee consists of Yuan-Chuan Horng, Dr. Yan-Kuin Su and Dr. Liang-Gee Chen. Our compensation committee assists our board of directors in reviewing and approving the compensation structure, including all forms of compensation, relating to our directors and executive officers. Our chief executive officer may not be present at any committee meeting where his or her compensation is deliberated. We intend to follow Rule 5605(d)(1)(B) and (2)(B) of the Nasdaq Rules which requires the compensation committees of U.S. companies to be comprised solely of independent directors. The compensation committee will be responsible for, among other things:
| ● | reviewing and making recommendations to our board of directors regarding our compensation policies and forms of compensation provided to our directors and officers; |
| ● | reviewing and determining bonuses for our officers and other employees; |
| ● | reviewing and determining share-based compensation for our directors, officers, employees and consultants; |
| ● | administering our equity incentive plans in accordance with the terms thereof; and |
| ● | such other matters that are specifically delegated to the compensation committee by our board of directors from time to time. |
Nominating and Corporate Governance Committee. Our nominating and corporate governance committee assists the board of directors in identifying individuals qualified to be members of our board of directors and in determining the composition of the board and its committees. Our current nominating and corporate governance committee consists of Yuan-Chuan Horng, Dr. Yan-Kuin Su and Dr. Liang-Gee Chen. We intend to follow Rule 5605(e)(1)(B) of the Nasdaq Rules which requires that nominations committees of U.S. companies be comprised solely of independent directors. Our nominating and corporate governance committee will be responsible for, among other things:
| ● | identifying and recommending to our board of directors nominees for election or re-election, or for appointment to fill any vacancy; |
| ● | reviewing annually with our board of directors the current composition of our board of directors in light of the characteristics of independence, age, skills, experience and availability of service to us; |
| ● | reviewing the continued board membership of a director upon a significant change in such director’s principal occupation; |
| ● | identifying and recommending to our board of directors the names of directors to serve as members of the audit committee and the compensation committee, as well as the nominating and corporate governance committee itself; |
| ● | advising the board periodically with respect to significant developments in the law and practice of corporate governance as well as our compliance with applicable laws and regulations, and making recommendations to our board of directors on all matters of corporate governance and on any corrective action to be taken; and |
| ● | monitoring compliance with our code of business conduct and ethics, including reviewing the adequacy and effectiveness of our procedures to ensure proper compliance. |
77
Terms of Directors and Officers
Under Cayman Islands law and our articles of association, each of our directors holds office until a successor has been duly elected or appointed, except where any director was appointed by the board of directors to fill a vacancy on the board of directors or as an addition to the existing board, such director shall hold office until the next annual general meeting of shareholders at which time such director is eligible for re-election. Our directors are subject to periodic retirement and re-election by shareholders in accordance with our articles of association, resulting in their retirement and re-election at staggered intervals. At each annual general meeting, one-third of our directors are subject to retirement by rotation, or if their number is not a multiple of three, the number nearest to one-third but not exceeding one-third shall retire from office. Any retiring director is eligible for re-election. The chairman of our board of directors and/or the managing director will not be subject to retirement by rotation or be taken into account in determining the number of directors to retire in each year. Under our articles of association, which director will retire at each annual general meeting will be determined as follows: (i) any director who wishes to retire and not offer himself for re-election, (ii) if no director wishes to retire, the director who has been longest in office since his last re-election or appointment, and (iii) if two or more directors have served on the board the longest, then as agreed among the directors themselves or as determined by lot.
6.D. Employees
As of December 31, 2021, 2022 and 2023, we had 2,083, 2,181 and 2,164 employees, respectively. The following is a breakdown of our employees by function as of December 31, 2023:
Function |
| Number |
Research and development(1) | 1,451 | |
Engineering and manufacturing(2) | 258 | |
Sales and marketing(3) | 318 | |
General and administrative | 137 | |
Total | 2,164 |
Notes: (1) | Includes semiconductor design engineers, application engineers, assembly and testing engineers and quality control engineers. |
| (2) | Includes manufacturing personnel of Himax Taiwan, Himax Display, Himax IGI and CMVT, our subsidiaries focused on design and manufacturing of WLO and LCoS products. |
| (3) | Includes field application engineers. |
Share-Based Compensation Plans
Himax Technologies, Inc. 2005 and 2011 Long-Term Incentive Plan
We adopted two long-term incentive plans in October 2005 and September 2011, however, the 2005 plan was terminated in October 2010. The following description of the plan is intended to be a summary and does not describe all provisions of the plan.
Purpose of the Plan. The purpose of the plan is to advance our interests and those of our shareholders by:
| ● | providing the opportunity for our employees, directors and service providers to develop a sense of proprietorship and personal involvement in our development and financial success and to devote their best efforts to our business; and |
| ● | providing us with a means through which we may attract able individuals to become our employees or to serve as our directors or service providers and providing us a means whereby those individuals, upon whom the responsibilities of our successful administration and management are of importance, can acquire and maintain share ownership, thereby strengthening their concern for our welfare. |
Type of Awards. The plan provides for the grant of stock options and restricted share units.
78
Duration. Generally, the plan will terminate five years from the effective date of the plan. But, the amended and restated 2011 Plan was 3rd amended and restated by extending its duration for three (3) years to September 6, 2025, which was approved by our shareholders at the annual general meeting held on August 16, 2022. After the plan is terminated, no awards may be granted, but any award previously granted will remain outstanding in accordance with the plan.
Administration. The plan is administered by the compensation committee of our board of directors or any other committee designated by our board to administer the plan. Committee members will be appointed from time to time by, and will serve at the discretion of, our board. The committee has full power and authority to interpret the terms and intent of the plan or any agreement or document in connection with the plan, determine eligibility for awards and adopt such rules, regulations, forms, instruments and guidelines for administering the plan. The committee may delegate its duties or powers.
Number of Authorized Shares. We have authorized a maximum issuance of 36,153,854 shares in the 2005 plan and 20,000,000 shares in the 2011 plan, and the 2005 plan was terminated in October 2010. As of the date of this annual report, there were no stock options or restricted share units outstanding under the plan except as described under “—Stock Options” and “—Restricted Share Units.”
Eligibility and Participation. All of our employees, directors and service providers are eligible to participate in the plan. The committee may select from all eligible individuals those individuals to whom awards will be granted and will determine the nature of any and all terms permissible by law and the amount of each award.
Stock Options. The committee may grant options to participants in such number, upon such terms and at any time as it determines. Each option grant will be evidenced by an award document that will specify the exercise price, the maximum duration of the option, the number of shares to which the option pertains, conditions upon which the option will become vested and exercisable and such other provisions which are not inconsistent with the plan.
The exercise price for each option will be:
| ● | based on 100% of the fair market value of the shares on the date of grant; |
| ● | set at a premium to the fair market value of the shares on the date of grant; or |
| ● | indexed to the fair market value of the shares on the date of grant, with the committee determining the index. |
The exercise price on the date of grant must be at least equal to 100% of the fair market value of the shares on the date of grant.
Each option will expire at such time as the committee determines at the time of its grant; however, no option will be exercisable later than the 10th anniversary of its grant date. Notwithstanding the foregoing, for options granted to participants outside the United States, the committee can set options that have terms greater than ten years.
Options will be exercisable at such times and be subject to such terms and conditions as the committee approves. A condition of the delivery of shares as to which an option will be exercised will be the payment of the exercise price. Subject to any governing rules or regulations, as soon as practicable after receipt of written notification of exercise and full payment, we will deliver to the participant evidence of book-entry shares or, upon his or her request, share certificates in an appropriate amount based on the number of shares purchased under the option(s). The committee may impose such restrictions on any shares acquired pursuant to the exercise of an option as it may deem advisable.
Each participant’s award document will set forth the extent to which he or she will have the right to exercise the options following termination of his or her employment or services.
We made grants of 2,226,690 units employee stock options to our certain employees on September 30, 2019 with exercise price $2.27 per option. The vesting schedule is, 50% of the options vest half year after the date of grant and 50% of the options vest one year after the date of grant. During 2020, 114,500 units, 39,000 units and 10,000 units of stock option to purchase 114,500 units, 39,000 units and 10,000 units ADS were grant to certain employees at an exercise price of $2.74, $3.9 and $3.35 on March 31, 2020, August 11, 2020 and September 25, 2020, respectively. The options granted in 2020 were fully vested on October 1, 2020.
79
Restricted Share Units. The committee may grant restricted share units to participants. Each grant will be evidenced by an award document that will specify the period(s) of restriction, the number of restricted share units granted and such other provisions as the committee determines.
Generally, restricted share units will become freely transferable after all conditions and restrictions applicable to such shares have been satisfied or lapse and restricted share units will be paid in cash, shares or a combination of the two, as determined by the committee.
The committee may impose such other conditions or restrictions on any restricted share units as it may deem advisable, including a requirement that participants pay a stipulated purchase price for each restricted share unit, restrictions based upon the achievement of specific performance goals and time-based restrictions on vesting.
A participant will have no voting rights with respect to any restricted share units.
Each award document will set forth the extent to which the participant will have the right to retain restricted share units following termination of his or her employment or services.
We made grants of 676,273 RSUs to our employees on September 26, 2018. The vesting schedule for such RSU grants is as follows: 97.15% of the RSU grants vested immediately and were settled by cash in the amount of $3.8 million on the grant date, with the remainder vesting equally on each of September 30, 2019, 2020 and 2021, which will be settled by our ordinary shares, subject to certain forfeiture events.
We made grants of 1,402,714 RSUs to our employees on September 28, 2020. The vesting schedule for such RSU grants is as follows: 98.68% of the RSU grants vested immediately and were settled by cash in the amount of $4.8 million on the grant date, with the remainder vesting equally on each of September 30, 2021, 2022 and 2023, which will be settled by our ordinary shares, subject to certain forfeiture events.
We made grants of 2,604,545 RSUs to our employees on September 28, 2021. The vesting schedule for such RSU grants is as follows: 85.63% of the RSU grants vested immediately and were settled by cash in the amount of $23.2 million on the grant date, with the remainder vesting equally on each of September 30, 2022, 2023 and 2024, which will be settled by our ordinary shares, subject to certain forfeiture events.
We made grants of 3,987,509 RSUs to our employees on September 28, 2022. The vesting schedule for such RSU grants is as follows: 86.41% of the RSU grants vested immediately and were settled by cash in the amount of $17.5 million on the grant date, with the remainder vesting equally on each of September 30, 2023, 2024 and 2025, which will be settled by our ordinary shares, subject to certain forfeiture events.
We made grants of 1,710,607 RSUs to our employees on September 26, 2023. The vesting schedule for such RSU grants is as follows: 97.45% of the RSU grants vested immediately and were settled by cash in the amount of $9.5 million on the grant date, with the remainder vesting equally on each of September 30, 2024, 2025 and 2026, which will be settled by our ordinary shares, subject to certain forfeiture events.
Dividend Equivalents. Any participant selected by the committee may be granted dividend equivalents based on the dividends declared on shares that are subject to any award, to be credited as of dividend payment dates, during the period between the date the award is granted and the date the award is exercised, vests or expires, as determined by the committee. Dividend equivalents will be converted to cash or additional shares by such formula and at such time and subject to such limitations as determined by the committee.
On November 9, 2022, the Company's compensation committee made the unvested RSUs generally include forfeitable dividend-equivalent rights, which entitle holders of RSUs to the same dividend value per share as holders of common stock. The dividend-equivalent rights are subject to the same vesting and other terms and conditions as the underlying RSUs.
Transferability of Awards. Generally, awards cannot be sold, transferred, pledged, assigned, or otherwise alienated or hypothecated, other than by will or by the laws of descent and distribution.
80
Adjustments in Authorized Shares. In the event of any of the corporate events or transactions described in the plan, to avoid any unintended enlargement or dilution of benefits, the committee has the sole discretion to substitute or adjust the number and kind of shares that can be issued or otherwise delivered.
Forfeiture Events. The committee may specify in an award document that the participant’s rights, payments and benefits with respect to an award will be subject to reduction, cancellation, forfeiture or recoupment upon the occurrence of certain specified events, in addition to any otherwise applicable vesting or performance conditions of an award.
If we are required to prepare an accounting restatement owing to our material noncompliance, as a result of misconduct, with any financial reporting requirement under the securities laws, then if the participant is one of the individuals subject to automatic forfeiture under Section 304 of the Sarbanes-Oxley Act of 2002, the participant will reimburse us the amount of any payment in settlement of an award earned or accrued during the twelve-month period following the first public issuance or filing with the SEC (whichever first occurred) of the financial document embodying such financial reporting requirement.
Amendment and Termination. Subject to, and except as, provided in the plan, the committee has the sole discretion to alter, amend, modify, suspend, or terminate the plan and any award document in whole or in part. Amendments to the plan are subject to shareholder approval, to the extent required by law, or by stock exchange rules or regulations.
6.E. Share Ownership
The following table sets forth the beneficial ownership of our ordinary shares, as of March 31, 2024, by each of our directors and executive officers. Beneficial ownership is determined in accordance with the rules and regulations of the SEC.
| Number of Shares |
| Percentage of Shares |
| |
Name |
| Owned |
| Owned | |
Dr. Biing-Seng Wu | 76,904,468 | 22.0 | % | ||
Jordan Wu | 7,464,247 | 2.1 | % | ||
Dr. Yan-Kuin Su | — | — | |||
Yuan-Chuan Horng | 916,104 | * | |||
Dr. Liang-Gee Chen | — | — | |||
Jessica Pan | 95,738 | * | |||
Hsien Chang Tsai | — | — | |||
Eric Li | 15,000 | * |
| * | The sum of the number of ordinary shares held is less than 1.0% of our total outstanding shares. |
None of our directors or executive officers has voting rights different from those of other shareholders.
6.F. Disclosure of a registrant’s action to recover erroneously awarded compensation
Not applicable.
ITEM 7. MAJOR SHAREHOLDERS AND RELATED PARTY TRANSACTIONS
7.A. Major Shareholders
On August 10, 2009, we effected certain changes in our capital stock structure in order to meet the Taiwan Stock Exchange’s primary listing requirement that the par value of shares be NT$10 or $0.3 per share and in order to increase the number of outstanding ordinary shares to be listed on the Taiwan Stock Exchange. In particular, we increased our authorized share capital from $50,000 (divided into 500,000,000 shares of par value $0.0001 each) to $300,000,000 (divided into 3,000,000,000,000 shares of par value $0.0001 each) and distributed 5,999 bonus shares for each share of par value $0.0001 held by shareholders of record as of August 7, 2009. These were followed by a consolidation of every 3,000 shares of par value $0.0001 each into one ordinary share of par value $0.3 each. As a result, the number of ordinary shares outstanding was doubled and each of our ordinary shares had a par value of $0.3.
81
In connection with the above changes, we also changed our ADS ratio effective August 10, 2009 from one ADS representing one ordinary share to one ADS representing two ordinary shares. Such change in ADS ratio was intended to adjust for the net dilutive effect due to the bonus shares distribution and the shares consolidation so that each ADS would represent the same percentage ownership in our share capital immediately before and after the above changes. The number of ADSs also remained the same immediately before and after the above changes.
As of March 31, 2024, 349,448,102 of our shares were outstanding. We believe that, of such shares, 211,972,946 shares in the form of ADSs were registered in the name of a nominee of JPMorgan Chase Bank, N.A., the depositary under our ADS deposit agreement. JPMorgan Chase Bank, N.A., advised us that, as of March 31, 2024, 105,986,473 ADSs, representing 211,972,946 common shares, were held of record by Cede & Co. and 10 other registered shareholders domiciled in and outside of the United States. We have no further information as to common shares held, or beneficially owned, by U.S. persons.
The following table sets forth information known to us with respect to the beneficial ownership of our shares as of March 31, 2024, the most recent practicable date, by (i) each shareholder known by us to beneficially own more than 5% of our shares and (ii) all directors and executive officers as a group.
|
| Percentage of |
| ||
Number of Shares | Shares | ||||
Name of Beneficial Owner |
| Beneficially Owned(3) |
| Beneficially Owned(3) | |
Dr. Biing-Seng Wu(1) | 76,904,468 | 22.0 | % | ||
Whei-Lan Teng(2) | 22,847,370 | 6.5 | % | ||
All directors and executive officers as a group(3) | 85,395,557 | 24.4 | % |
Note: (1) Dr. Biing-Seng Wu directly owns 315,322 ordinary shares. Dr. Biing-Seng Wu beneficially owns (a) 56,549,308 ordinary shares through Sanfair Asia Investments Ltd., a wholly owned subsidiary of Taxus Technology Investment Pte. Ltd. and (b) 20,039,838 ordinary shares through Chi-Duan Investment Co. Ltd. All of the three entities are investment companies controlled by Biing-Seng Wu. Accordingly, Dr. Biing-Seng Wu may be deemed to beneficially own an aggregate of 76,904,468 ordinary shares, representing approximately 22.0% of the outstanding ordinary shares.
| (2) | Whei-Lan Teng beneficially owns 5,434,918 ordinary shares through Renmar Finance Limited, a wholly owned subsidiary of Pleione Technology Investment Pte. Ltd. Both of the entities are investment companies controlled by Whei-Lan Teng. In addition, Whei-Lan Teng, may be attributed beneficial ownership of 17,412,452 ordinary shares held in trust by Corenmar Investment Limited for the benefit of her children. Whei-Lan Teng therefore may be deemed to have shared power to vote or dispose of 22,847,370 ordinary shares. Accordingly, Whei-Lan Teng may be deemed to beneficially own an aggregate of 22,847,370 ordinary shares, representing approximately 6.5% of the outstanding ordinary shares. |
| (3) | Numbers of shares beneficially owned by all directors and executive officers as a group already include an aggregate of 76,904,468 ordinary shares beneficially owned by Dr. Biing-Seng Wu. |
None of our major shareholders has voting rights different from those of other shareholders. We are not aware of any arrangement that may, at a subsequent date, result in a change of control of our company.
7.B. Related Party Transactions
Viewsil Technology Limited (VST)
VST is a subsidiary of our equity method investee, Viewsil Microelectronics (Kunshan) Limited which became a subsidiary of the Company from December 30, 2023. As of December 31, 2022, we made an interest free loan of $1.2 million to VST for short-term funding needs. The loan is repayable on demand. We may consider providing further future loans to VST.
82
Viewsil Microelectronics (Kunshan)Limited (Viewsil)
Viewsil is an equity method investee of the Company, becoming a subsidiary of the Company from December 30, 2023. In 2021, 2022 and 2023, Viewsil provided technical service on a new source driver chip and integrated circuit module for the Company’s research activities for a fee of $1.4 million, $1.05 million and $1.14 million, respectively, which was charged to research and development expense. As of December 31, 2022, the related payables were $2.45 million.
Cheng Mei Materials Technology Corporation (CMMT)
CMMT is an equity method investor of CMVT. In 2021, 2022 and 2023, the purchase of raw materials from CMMT was $3.5 million, $1.1 million and $1.3 million, respectively. As of December 31, 2022 and 2023, the related payable resulting from the purchase of raw materials were $0.3 million and $0.9 million, respectively.
7.C. Interests of Experts and Counsel
Not applicable.
ITEM 8. FINANCIAL INFORMATION
8.A. Consolidated Statements and Other Financial Information
8.A.1. See “Item 18. Financial Statements” for our audited consolidated financial statements.
8.A.2. See “Item 18. Financial Statements” for our audited consolidated financial statements, which cover the last three financial years.
8.A.3. See page F-2 for the report of our independent registered public accounting firm.
8.A.4. Not applicable.
8.A.5. Not applicable.
8.A.6. See Note 29 to our audited consolidated financial statements included in “Item 18. Financial Statements.”
8.A.7. Litigation
We may be subject to legal proceedings, investigations and claims relating to the conduct of our business from time to time. We may also initiate legal proceedings in order to protect our contractual and property rights. However, as of the date of this annual report, we are not currently a party to, nor are we aware of, any legal proceeding, investigation or claim which, in the opinion of our management, is likely to have a material adverse effect on our business, financial condition or results of operations.
8.A.8. Dividends and Dividend Policy
Subject to the Cayman Islands Companies Law, we may declare dividends in any currency, but no dividend may be declared in excess of the amount recommended by our board of directors. Whether our board of directors recommends any dividends and the form, frequency and amount of dividends, if any, will depend upon our future operations and earnings, capital requirements and surplus, general financial condition, contractual restrictions and other factors as the board of directors may deem relevant.
83
On June 27, 2008, we paid a cash dividend in the amount of $66.8 million, or the equivalent of $0.350 per ADS. In 2009, we paid a cash dividend on June 29, 2009 in the amount of $55.5 million, or the equivalent of $0.300 per ADS, and distributed a stock dividend on August 10, 2009 of 5,999 ordinary shares of par value $0.0001 for each ordinary share of par value $0.0001 held by shareholders of record as of August 7, 2009. On August 13, 2010, we paid a cash dividend in the amount of $44.1 million, or the equivalent of $0.250 per ADS. On July 20, 2011, we paid a cash dividend in the amount of $21.2 million, or the equivalent of $0.120 per ADS. On July 25, 2012, we paid a cash dividend in the amount of $10.7 million, or the equivalent of $0.063 per ADS. On July 31, 2013, we paid a cash dividend in the amount of $42.4 million, or the equivalent of $0.250 per ADS. On July 23, 2014, we paid a cash dividend in the amount of $46.0 million, or the equivalent of $0.270 per ADS. On July 8, 2015, we paid a cash dividend in the amount of $51.4 million, or the equivalent of $0.300 per ADS. On August 3, 2016, we paid a cash dividend in the amount of $22.3 million, or the equivalent of $0.130 per ADS. On August 14, 2017, we paid a cash dividend in the amount of $41.3 million, or the equivalent of $0.240 per ADS. On July 31, 2018, we paid a cash dividend in the amount of $17.2 million, or the equivalent of $0.10 per ADS. On July 12, 2021, we paid a cash dividend in the amount of $47.4 million, or the equivalent of $0.272 per ADS. On July 12, 2022, we paid a cash dividend in the amount of $217.9 million, or the equivalent of $1.25 per ADS. On July 12, 2023, we paid a cash dividend in the amount of $83.7 million, or the equivalent of $0.48 per ADS. For more information on the stock dividend distribution, see “Item 7.A. Major Shareholders and Related Party Transactions—Major Shareholders.” The dividends for any of these years should not be considered representative of the dividends that would be paid in any future periods or of our dividend policy.
Our ability to pay cash or stock dividends will depend, at least partially, upon the amount of funds received by us from our direct and indirect subsidiaries, which must comply with the laws and regulations of their respective countries and respective articles of association. We receive cash from Himax Taiwan through intercompany borrowings. Himax Taiwan has not paid us cash dividends in the past. In accordance with amended ROC Company Act and regulations and Himax Taiwan’s amended articles of incorporation, Himax Taiwan is permitted to distribute dividends after allowances have been made for:
| ● | payment of taxes; |
| ● | recovery of prior years’ deficits, if any; |
| ● | legal reserve (in an amount equal to 10% of annual profits after having deducted the above items until such time as its legal reserve equals the amount of its total paid-in capital); |
| ● | special reserve based on relevant laws or regulations, or retained earnings, if necessary; and |
| ● | dividends for preferred shares, if any. |
Furthermore, if Himax Taiwan does not generate any profits for any year as determined in accordance with generally accepted accounting principles in Taiwan, it generally may not distribute dividends for that year.
Any dividend we declare will be paid to the holders of ADSs, subject to the terms of the deposit agreement, to the same extent as holders of our ordinary shares, to the extent permitted by applicable laws and regulations, less the fees and expenses payable under the deposit agreement. Any dividend we declare will be distributed by the depositary bank to the holders of our ADSs. Cash dividends on our ordinary shares, if any, will be paid in U.S. dollars.
8.B. Significant Changes
Except as disclosed elsewhere in this annual report, we have not experienced any significant changes since the date of the annual financial statements.
ITEM 9. THE OFFER AND LISTING
9.A. Offer and Listing Details
Our ADSs have been quoted on the NASDAQ Global Select Market under the symbol “HIMX” since March 31, 2006.
84
9.B. Plan of Distribution
Not applicable.
9.C. Markets
The principal trading market for our shares is the NASDAQ Global Select Market, on which our shares are traded in the form of ADSs.
9.D. Selling Shareholders
Not applicable.
9.E. Dilution
Not applicable.
9.F. Expenses of the Issue
Not applicable.
ITEM 10. ADDITIONAL INFORMATION
10.A. Share Capital
Not applicable.
10.B. Memorandum and Articles of Association
Our shareholders previously adopted the Amended and Restated Memorandum of Association on September 26, 2005 by a special resolution passed by the sole shareholder of our company and the Amended and Restated Articles of Association at an extraordinary shareholder meeting held on October 25, 2005, both of which were filed as an exhibit to our registration statement on Form F-1 (file no. 333-132372) with the SEC on March 13, 2006.
At our annual general meeting on August 6, 2009, our shareholders adopted the Second Amended and Restated Memorandum and Articles of Association, which became effective on August 10, 2009 and were filed as exhibits to our current report on Form 6-K with the SEC on July 13, 2009. These were adopted primarily in connection with our proposed Taiwan listing to meet the Taiwan Stock Exchange’s primary listing requirement concerning protection of material shareholders’ rights under the ROC’s Company Act and Securities Exchange Act. At the same time, our shareholders also adopted the Third Amended and Restated Memorandum and Articles of Association, which were filed as an exhibit to our annual report on Form 20-F for the fiscal year ended December 31, 2009 with the SEC on June 3, 2010 and are substantially the same as the Amended and Restated Memorandum and Articles of Association of our company except that our authorized share capital is stated to be $300,000,000 divided into 1,000,000,000 shares of nominal or par value of $0.3 each, on the condition that it shall become effective if the application made by our company to list its ordinary shares on the Taiwan Stock Exchange is rejected or aborted. On May 20, 2010, the Third Amended and Restated Memorandum and Articles of Association became effective as a result of the termination of our primary listing application to the Taiwan Stock Exchange.
We incorporate by reference into this annual report the description of our Amended and Restated Memorandum and Articles of Association (except for provisions relating to our authorized share capital) contained in our F-1 registration statement (File No. 333-132372) filed with the SEC on March 13, 2006. Such description sets forth a summary of certain provisions of our memorandum and articles of association as currently in effect, which is qualified in its entirety by reference to the full text of the Third Amended and Restated Memorandum and Articles of Association. As of the date of this annual report, our authorized share capital is $300,000,000 divided into 1,000,000,000 shares of nominal or par value of $0.3 each.
85
10.C. Material Contracts
We are not currently, and have not been in the last two years, party to any material contract, other than contracts entered into the ordinary course of business.
10.D. Exchange Controls
We have extracted from publicly available documents the information presented in this section. The information below may be applicable because our wholly owned operating subsidiary, Himax Taiwan, is incorporated in the ROC. Please note that citizens of the PRC and entities organized in the PRC are subject to special ROC laws, rules and regulations, which are not discussed in this section.
The ROC’s Foreign Exchange Control Statute and regulations provide that all foreign exchange transactions must be executed by banks designated to handle foreign exchange transactions by the Central Bank of the ROC. There is an annual limit on the amount of currency a Taiwanese entity may convert into, or out of, NT dollars other than for trade purposes. Current regulations favor trade-related foreign exchange transactions.
With regard to inward and outward remittances (foreign exchange purchased or sold), approval by the Central Bank of the ROC is generally required for any conversion exceeding, in aggregate in each calendar year, $50 million (and /or its equivalent settlement) for companies and $5 million (and/or its equivalent settlement) for Taiwanese citizen and long term 1 year-valid resident permit of foreign individuals. A requirement is also imposed on all private enterprises to report all medium- and long-term foreign debt with the Central Bank of the ROC.
In addition, a foreign person without an alien resident card or an unrecognized foreign entity may remit to and from Taiwan foreign currencies of up to $100,000 per remittance if required documentation is provided to the ROC authorities. This limit applies only to remittances involving a conversion between NT dollars and U.S. dollars or other foreign currencies.
10.E. Taxation
Cayman Islands Taxation
The Cayman Islands currently levies no taxes on individuals or corporations based upon profits, income, gains or appreciation, and there is no taxation in the nature of inheritance tax or estate duty. There are no other taxes likely to be material to us levied by the Government of the Cayman Islands except for stamp duties which may be applicable on instruments executed in, or brought within the jurisdiction of, the Cayman Islands. The Cayman Islands is not party to any double tax treaties. There are no exchange control regulations or currency restrictions in the Cayman Islands.
We have, pursuant to Section 6 of the Tax Concessions Law (1999 Revision) of the Cayman Islands, obtained an undertaking from the Governor-in-Council that:
| (a) | no law which is enacted in the Cayman Islands imposing any tax to be levied on profits, income or gains or appreciations shall apply to us or our operations; |
| (b) | the aforesaid tax or any tax in the nature of estate duty or inheritance tax shall not be payable on our ordinary shares, debentures or other obligations. |
The undertaking that we have obtained is for a period of 20 years from May 3, 2005.
86
United States Federal Income Taxation
The following is a description of material U.S. federal income tax consequences to the U.S. Holders described below of owning and disposing of ordinary shares or ADSs, but it does not purport to be a comprehensive description of all tax considerations that may be relevant to a particular person’s decision to hold the securities. This discussion applies only to a U.S. Holder that holds ordinary shares or ADSs as capital assets for U.S. federal income tax purposes. This discussion does not address any aspect of the “Medicare contributions tax” on “net investment income.” In addition, it does not describe all of the tax consequences that may be relevant in light of the U.S. Holder’s particular circumstances, including alternative minimum tax consequences and tax consequences applicable to U.S. Holders subject to special rules, such as:
| ● | certain financial institutions; |
| ● | dealers or traders in securities who use a mark-to-market method of tax accounting; |
| ● | persons holding ordinary shares or ADSs as part of a hedging transaction, straddle, wash sale, conversion transaction or integrated transaction or persons entering into a constructive sale with respect to the ordinary shares or ADSs; |
| ● | persons whose functional currency for U.S. federal income tax purposes is not the U.S. dollar; |
| ● | entities classified as partnerships for U.S. federal income tax purposes; |
| ● | tax-exempt entities, including “individual retirement accounts” or “Roth IRAs”; |
| ● | persons that own or are deemed to own ten percent or more of our voting stock; or |
| ● | persons holding ordinary shares or ADSs in connection with a trade or business conducted outside of the United States. |
If an entity that is classified as a partnership for U.S. federal income tax purposes owns ordinary shares or ADSs, the U.S. federal income tax treatment of a partner will generally depend on the status of the partner and the activities of the partnership. Partnerships holding ordinary shares or ADSs and partners in such partnerships should consult their tax advisers as to the particular U.S. federal income tax consequences of owning and disposing of the ordinary shares or ADSs.
This discussion is based on the Internal Revenue Code of 1986, as amended, administrative pronouncements, judicial decisions and final, temporary and proposed Treasury regulations, all as of the date hereof. These laws are subject to change, possibly on a retroactive basis. It is also based in part on representations by the depositary and assumes that each obligation under the deposit agreement and any related agreement will be performed in accordance with its terms. You should consult your tax adviser concerning the U.S. federal, state, local and non-U.S. tax consequences of owning and disposing of ordinary shares or ADSs in your particular circumstances.
As used herein, a “U.S. Holder” is a person that is, for U.S. federal tax purposes, a beneficial owner of ordinary shares or ADSs and is: (i) a citizen or resident of the United States; (ii) a corporation, or other entity taxable as a corporation, created or organized in or under the laws of the United States or any political subdivision thereof; or (iii) an estate or trust the income of which is subject to U.S. federal income taxation regardless of its source.
In general, a U.S. Holder of ADSs will be treated for U.S. federal income tax purposes as the owner of the underlying ordinary shares represented by those ADSs. Accordingly, no gain or loss will be recognized if a U.S. Holder exchanges ADSs for the underlying ordinary shares represented by those ADSs.
The U.S. Treasury has expressed concerns that parties to whom American depositary shares are released before delivery of shares to the depositary (“pre-release”) may be taking actions that are inconsistent with the claiming of foreign tax credits for U.S. holders of American depositary shares. Such actions would also be inconsistent with the claiming of the preferred rates of tax, described below, applicable to dividends received by certain non-corporate U.S. holders. Accordingly, the availability of the preferential tax rates for dividends received by certain non-corporate U.S. Holders, described below, could be affected by actions taken by parties to whom ADSs are pre-released.
87
This discussion assumes that we are not, and will not become, a passive foreign investment company (as discussed below).
Taxation of Distributions
Distributions received by U.S. Holders with respect to the ordinary shares or ADSs, other than certain pro rata distributions of ordinary shares, will constitute foreign-source dividend income for U.S. federal income tax purposes to the extent paid out of our current or accumulated earnings and profits, as determined in accordance with U.S. federal income tax principles. We do not to maintain records of earnings and profits in accordance with U.S. federal income tax principles, and therefore it is expected that distributions will generally be reported to U.S. Holders as dividends. Dividends will be included in a U.S. Holder’s income on the date of the U.S. Holder’s (or in the case of ADSs, the depository’s) receipt of the dividends. Subject to applicable limitations and the discussion above regarding concerns expressed by the U.S. Treasury, certain dividends paid by qualified foreign corporations to certain non-corporate holders may be taxable at preferential tax rates applicable to long-term capital gains. A foreign corporation is treated as a qualified foreign corporation with respect to dividends paid on stock that is readily tradable on a securities market in the United States, such as the NASDAQ Global Select Market, where our ADSs are traded. Our ordinary shares are not traded on a securities market in the United States. Non-corporate U.S. Holders of our ordinary shares or ADSs should consult their tax advisers regarding their eligibility for taxation at such preferential rates and whether they are subject to any special rules that limit their ability to be taxed at such preferential rates. Corporate U.S. Holders will not be entitled to claim the dividends-received deduction with respect to dividends paid by us.
Sale and Other Disposition of Ordinary Shares or ADSs
A U.S. Holder will generally recognize U.S.-source capital gain or loss for U.S. federal income tax purposes on the sale or other disposition of ordinary shares or ADSs, which will be long-term capital gain or loss if the ordinary shares or ADSs were held for more than one year. Long-term capital gains of certain non-corporate U.S. Holders may be taxable at preferential rates. The amount of gain or loss will be equal to the difference between the amount realized on the sale or other disposition and the U.S. Holder’s tax basis in the ordinary shares or ADSs. The deductibility of capital losses is subject to limitations.
Passive Foreign Investment Company Rules
We believe that we were not a passive foreign investment company (a “PFIC”) for U.S. federal income tax purposes for our taxable year ended December 31, 2023.
In general, a non-U.S. company will be a PFIC for U.S. federal income tax purposes for any taxable year in which (i) 75% or more of its gross income consists of passive income (such as dividends, interest, rents and royalties) or (ii) 50% or more of the average quarterly value of its assets consists of assets that produce, or are held for the production of, passive income (including cash). If a corporation owns at least 25% (by value) of the stock of another corporation, the corporation will be treated, for purposes of the PFIC tests, as owning its proportionate share of the 25%-owned subsidiary’s assets and receiving its proportionate share of the 25%-owned subsidiary’s income. As PFIC status depends upon the composition of our income and assets and the value of our assets from time to time (and the value of our assets may be determined, in part, based on the market price of our shares and ADSs, which may fluctuate considerably from time to time given that market prices of certain technology companies historically have been volatile), there can be no assurance that we will not be a PFIC for any taxable year.
If we were a PFIC for any taxable year during which a U.S. Holder held ordinary shares or ADSs, certain adverse U.S. federal income tax rules would apply on a sale or other disposition (including a pledge) of ordinary shares or ADSs by the U.S. Holder. In general, under those rules, gain recognized by the U.S. Holder on a sale or other disposition of ordinary shares or ADSs would be allocated ratably over the U.S. Holder’s holding period for the ordinary shares or ADSs. The amounts allocated to the taxable year of the sale or other disposition and to any year before we became a PFIC would be taxed as ordinary income. The amount allocated to each other taxable year would be subject to tax at the highest rate in effect for individuals or corporations, as appropriate, for that taxable year, and an interest charge would be imposed on the tax attributable to such allocated amounts. Similar rules would apply to any distribution in respect of ordinary shares or ADSs to the extent in excess of 125% of the average of the annual distributions on ordinary shares or ADSs received by the U.S. Holder during the preceding three years or the U.S. Holder’s holding period, whichever is shorter. Certain elections may be available that would result in alternative treatments (such as a mark-to-market treatment of the ADSs). U.S. Holders should consult their tax advisers to determine whether any of these elections would be available and, if so, what the consequences of the alternative treatments would be in their particular circumstances.
88
If we were a PFIC in a taxable year in which we pay a dividend or in the prior taxable year, the preferential tax rates discussed above with respect to dividends received by certain non-corporate U.S. Holders would not apply.
In addition, if a U.S. Holder owns ordinary shares or ADSs during any year in which we are a PFIC, the U.S. Holder may be required to file certain information reports, containing such information as the U.S. Treasury may require.
Information Reporting and Backup Withholding
Payments of dividends and sales proceeds that are made within the United States or through certain U.S.-related financial intermediaries generally are subject to information reporting, and may be subject to backup withholding, unless the U.S. Holder is an exempt recipient or, in the case of backup withholding, the U.S. Holder provides a correct taxpayer identification number and certifies that it is not subject to backup withholding. The amount of any backup withholding from a payment to a U.S. Holder will be allowed as a credit against the U.S. Holder’s U.S. federal income tax liability and may entitle the U.S. Holder to a refund, provided that the required information is timely furnished to the Internal Revenue Service.
10.F. Dividends and Paying Agents
Not applicable.
10.G. Statement by Experts
Not applicable.
10.H. Documents on Display
It is possible to read and copy documents referred to in this annual report that have been filed with the SEC at the SEC’s public reference rooms in Washington, D.C., New York and Chicago, Illinois. Please call the SEC at 1-800-SEC-0330 for further information on the reference rooms.
10.I. Subsidiary Information
Not applicable.
10.J. Annual Report to Security Holders
Not applicable.
ITEM 11. QUANTITATIVE AND QUALITATIVE DISCLOSURES ABOUT MARKET RISK
Interest Rate Risk. Our exposure to interest rate risk for changes in interest rates is primarily the interest income generated by our cash deposited with banks. In addition, we are exposed to interest rate risks related to bank borrowings.
Foreign Exchange Risk. The U.S. dollar is our reporting currency. The U.S. dollar is also the functional currency for the majority of our operations. In 2023, more than 99% of our sales and cost of revenues were denominated in U.S. dollars. However, in December 2023 approximately 70% of our operating expenses were denominated in NT dollars, with a small percentage denominated in Japanese Yen, Korean Won and Chinese Renminbi, and the majority of the remainder denominated in U.S. dollars. We anticipate that we will continue to conduct substantially all of our sales in U.S. dollars. We do not believe that we have a material currency risk with regard to the NT dollar. We believe the majority of any potential adverse foreign currency exchange impacts on our operating assets may be offset by a potential favorable foreign currency exchange impact on our operating liabilities. From time to time, we have engaged in, and may continue to engage in, forward contracts to hedge against our foreign currency exposure.
As of December 31, 2023, no foreign currency exchange contracts are outstanding.
89
ITEM 12. DESCRIPTION OF SECURITIES OTHER THAN EQUITY SECURITIES
12.A. Debt Securities
Not applicable.
12.B. Warrants and Rights
Not applicable.
12.C. Other Securities
Not applicable.
12.D. American Depositary Shares
Fees and Charges Payable by ADS Holders
Persons depositing or withdrawing |
| For: |
$5.00 (or less) per 100 ADSs (or portion of 100 ADSs) |
| Issuance of ADSs, including issuances resulting from a distribution of shares or rights or other property Cancellation of ADSs for the purpose of withdrawal, including if the deposit agreement terminates |
|
|
|
$.05 (or less) per ADS |
| Any cash distribution to ADS holders |
|
|
|
A fee equivalent to the fee that would be payable if securities distributed to you had been shares and the shares had been deposited for the issuance of ADSs |
| Distribution of securities distributed to holders of deposited securities which are distributed by the depositary to ADS holders |
|
|
|
$.05 (or less) per ADS per calendar year |
| Depositary services |
|
|
|
Registration or transfer fees |
| Transfer and registration of shares on our share register to or from the name of the depositary or its agent when you deposit or withdraw shares |
|
|
|
Expenses of the depositary |
| Cable, telex and facsimile transmissions (when expressly provided in the deposit agreement) converting foreign currency to U.S. dollars |
|
|
|
Taxes and other governmental charges that the depositary or custodian have to pay on any ADS or share underlying an ADS, e.g., stock transfer taxes, stamp duty or withholding taxes |
| As necessary |
|
|
|
Any charges incurred by the depositary or its agents for servicing the deposited securities |
| As necessary |
The depositary collects its fees for delivery and surrender of ADSs directly from investors depositing shares or surrendering ADSs for the purpose of withdrawal or from intermediaries acting for them. The depositary collects fees for making distributions to investors by deducting those fees from the amounts distributed or by selling a portion of distributable property to pay the fees. The depositary may collect its annual fee for depositary services by deduction from cash distributions or by directly billing investors or charging the book-entry system accounts of participants acting for them. The depositary may collect any of its fees by deduction from
90
any cash distribution payable to ADS holders that are obligated to pay those fees. The depositary may generally refuse to provide fee-attracting services until its fees for those services are paid.
From time to time, the depositary may make payments to us to reimburse and/or share revenue from the fees collected from ADS holders, or waive fees and expenses for services provided, generally relating to costs and expenses arising out of establishment and maintenance of the ADS program. In performing its duties under the deposit agreement, the depositary may use brokers, dealers or other service providers that are affiliates of the depositary and that may earn or share fees or commissions.
Fees and Other Payments from the Depositary to Us
In 2023, we received $0.6 million netting of 30% withholding tax from the depositary relating to the ADR program. The payment from the depositary would be intended to cover certain of our expenses incurred in relation to the ADR program for the year, including:
| ● | legal, audit and other fees incurred in connection with preparation of Form 20-F and annual reports and ongoing SEC compliance and listing requirements; |
| ● | director and officer insurance; |
| ● | stock exchange listing fees; |
| ● | non-deal roadshow expenses; |
| ● | costs incurred by financial printer and share certificate printer; |
| ● | postage for communications to ADR holders; |
| ● | costs of retaining third-party public relations, investor relations and/or corporate communications advisory firms in the U.S.; and |
| ● | costs incurred in connection with participation in retail investor shows and capital markets days. |
Appointment of New Depositary Bank
On July 14, 2017, we appointed JPMorgan Chase Bank, N.A. as our new American depositary receipt bank. Effective the same day, our ADR program was officially transferred to JPMorgan Chase Bank, N.A. for a contract term of ten years.
PART II
ITEM 13. DEFAULTS, DIVIDEND ARREARAGES AND DELINQUENCIES
Not applicable.
ITEM 14. MATERIAL MODIFICATIONS TO THE RIGHTS OF SECURITY HOLDERS AND USE OF PROCEEDS
Not applicable.
ITEM 15. CONTROLS AND PROCEDURES
Evaluation of Disclosure Controls and Procedures
Our chief executive officer and chief financial officer, after evaluating the effectiveness of our disclosure controls and procedures (as defined in Rule 13a-15(e) under the Exchange Act) as of the end of the period covered by this report, have concluded that based on
91
the evaluation of these controls and procedures required by Rule 13a-15(b) of the Exchange Act, our disclosure controls and procedures are effective.
Management’s Report on Internal Control Over Financial Reporting
Our management is responsible for establishing and maintaining adequate internal control over financial reporting. Our internal control over financial reporting is designed to provide reasonable assurance regarding the reliability of financial reporting and the preparation of financial statements for external purposes in accordance with IFRS as issued by the IASB.
Our internal control over financial reporting includes those policies and procedures that:
| ● | pertain to the maintenance of records that, in reasonable detail, accurately and fairly reflect our transactions and dispositions of our assets; |
| ● | provide reasonable assurance that our transactions are recorded as necessary to permit preparation of our financial statements in accordance with IFRS as issued by the IASB, and that our receipts and expenditures are being made only in accordance with authorizations of our management and our directors; and |
| ● | provide reasonable assurance regarding prevention or timely detection of unauthorized acquisition, use or disposition of our assets that could have a material effect on the financial statements. |
Because of its inherent limitations, internal control over financial reporting may not prevent or detect misstatements. Projections of any evaluation of internal control effectiveness to future periods are subject to the risk that controls may become inadequate because of changes in conditions, or that the degree of compliance with the policies or procedures may deteriorate.
Management, with the participation of our chief executive and chief financial officers, assessed the effectiveness of our internal control over financial reporting (as defined in Rule 13a-15(f) under the Exchange Act) as of December 31, 2023 based on the criteria set forth in Internal Control – Integrated Framework (2013) issued by the Committee of Sponsoring Organizations of the Treadway Commission. Based on the assessment, our management believes that our internal control over financial reporting was effective as of December 31, 2023.
92
Attestation Report of the Independent Registered Public Accounting Firm
Report of Independent Registered Public Accounting Firm
To the Stockholders and Board of Directors
Himax Technologies, Inc.:
Opinion on Internal Control Over Financial Reporting
We have audited Himax Technologies, Inc. and subsidiaries’ (the “Company”) internal control over financial reporting as of December 31, 2023, based on criteria established in Internal Control - Integrated Framework (2013) issued by the Committee of Sponsoring Organizations of the Treadway Commission (“COSO”). In our opinion, the Company maintained, in all material respects, effective internal control over financial reporting as of December 31, 2023, based on criteria established in Internal Control – Integrated Framework (2013) issued by the COSO.
We also have audited, in accordance with the standards of the Public Company Accounting Oversight Board (United States) (“PCAOB”), the consolidated statements of financial position of the Company as of December 31, 2022 and 2023, the related consolidated statements of profit or loss, other comprehensive income, changes in equity, and cash flows for each of the years in the three-year period ended December 31, 2023, and the related notes (collectively, the “consolidated financial statements”), and our report dated April 2, 2024 expressed an unqualified opinion on those consolidated financial statements.
Basis for Opinion
The Company’s management is responsible for maintaining effective internal control over financial reporting and for its assessment of the effectiveness of internal control over financial reporting, included in the accompanying Management’s Report on Internal Control Over Financial Reporting. Our responsibility is to express an opinion on the Company’s internal control over financial reporting based on our audit. We are a public accounting firm registered with the PCAOB and are required to be independent with respect to the Company in accordance with the U.S. federal securities laws and the applicable rules and regulations of the Securities and Exchange Commission and the PCAOB.
We conducted our audit in accordance with the standards of the PCAOB. Those standards require that we plan and perform the audit to obtain reasonable assurance about whether effective internal control over financial reporting was maintained in all material respects. Our audit of internal control over financial reporting included obtaining an understanding of internal control over financial reporting, assessing the risk that a material weakness exists, and testing and evaluating the design and operating effectiveness of internal control based on the assessed risk. Our audit also included performing such other procedures as we considered necessary in the circumstances. We believe that our audit provides a reasonable basis for our opinion.
Definition and Limitations of Internal Control Over Financial Reporting
A company’s internal control over financial reporting is a process designed to provide reasonable assurance regarding the reliability of financial reporting and the preparation of financial statements for external purposes in accordance with generally accepted accounting principles. A company’s internal control over financial reporting includes those policies and procedures that (1) pertain to the maintenance of records that, in reasonable detail, accurately and fairly reflect the transactions and dispositions of the assets of the company; (2) provide reasonable assurance that transactions are recorded as necessary to permit preparation of financial statements in accordance with generally accepted accounting principles, and that receipts and expenditures of the company are being made only in accordance with authorizations of management and directors of the company; and (3) provide reasonable assurance regarding prevention or timely detection of unauthorized acquisition, use, or disposition of the company’s assets that could have a material effect on the financial statements.
Because of its inherent limitations, internal control over financial reporting may not prevent or detect misstatements. Also, projections of any evaluation of effectiveness to future periods are subject to the risk that controls may become inadequate because of changes in conditions, or that the degree of compliance with the policies or procedures may deteriorate.
/s/ KPMG |
|
Hsinchu, Taiwan |
|
April 2, 2024 |
|
93
Changes in Internal Control over Financial Reporting
In 2023, no change in our internal control over financial reporting has occurred during the period covered by this annual report that has materially affected, or is reasonably likely to materially affect, our internal control over financial reporting.
ITEM 16. [RESERVED]
16.A. Audit Committee Financial Expert
Our board of directors has determined that Yuan-Chuan Horng is an audit committee financial expert, as that term is defined in Item 16A(b) of Form 20-F and is independent for the purposes of Rule 5605(a)(2) of the Nasdaq Rules and Rule 10A-3 of the Exchange Act.
16.B. Code of Ethics
Our board of directors has adopted a code of business conduct and ethics that applies to our directors, officers and employees, including our principal executive officer, principal financial officer, principal accounting officer or controller and any other persons who perform similar functions for us. We will provide a copy of our code of business conduct and ethics without charge upon written request to:
Himax Technologies, Inc.
Human Resources Department
No. 26, Zilian Road, Xinshi District, Tainan City 744092
Taiwan, Republic of China
16.C. Principal Accountant Fees and Services
KPMG, our independent registered public accounting firm, began serving as our independent auditor upon the formation of our company in 2001.
Our audit committee is responsible for the oversight of KPMG’s work. The policy of our audit committee is to pre-approve all audit and non-audit services provided by KPMG, including audit services, audit-related services, tax services and other services.
We paid the following fees for professional services to KPMG for the years ended December 31, 2022 and 2023.
Year ended December 31, | ||||||
Services |
| 2022 |
| 2023 | ||
Audit Fees(1) | $ | 805,000 | $ | 805,000 | ||
Tax Fees(2) |
| 44,000 |
| 20,000 | ||
All Other Fees(3) |
| 7,000 |
| 7,000 | ||
Total | $ | 856,000 | $ | 832,000 | ||
Note: (1) Audit Fees. This category includes the audit of our annual consolidated financial statements and internal control over financial reporting, quarterly review procedures, services that are normally provided by the independent auditors in connection with statutory and regulatory filings or engagements for those fiscal years. This category also includes statutory audits required by the Tax Bureau of the ROC.
| (2) | Tax Fees. This category consists of fees in relation to transfer pricing reports and tax compliance status. |
| (3) | All Other Fees. This category consists of fees in relation to audit of conflict mineral report. |
16.D. Exemptions from the Listing Standards for Audit Committees
Not applicable.
94
16.E. Purchases of Equity Securities by the Issuer and Affiliated Purchasers
On November 1, 2007, our board of directors authorized a share buyback program allowing us to repurchase up to $40.0 million of our ADSs in the open market or through privately negotiated transactions. We concluded this share buyback program in the first quarter of 2008 and repurchased a total of approximately $33.1 million of our ADSs (equivalent to approximately 7.7 million ADSs) from the open market.
On November 14, 2008, our board of directors authorized another share buyback program allowing us to repurchase up to $50.0 million of our ADSs in the open market or through privately negotiated transactions. We concluded this share buyback program in the third quarter of 2010 and repurchased a total of approximately $50.0 million of our ADSs (approximately 19.3 million ADSs) under this program from the open market.
In April 2011, the Companies Law of the Cayman Islands was amended to permit treasury shares if so approved by the board of directors and to the extent that the articles do not prohibit treasury shares. Therefore, we would hold the treasury shares for future employee awards.
On June 20, 2011, our board of directors authorized another share buyback program allowing us to repurchase up to $25.0 million of our ADSs in the open market or through privately negotiated transactions. We concluded this share buyback program in the fourth quarter of 2012 and repurchased a total of approximately $13.4 million of our ADSs (approximately 9.5 million ADSs) under this program from the open market. We did not conduct any repurchase under this program in 2022.
16.F. Change in Registrant’s Certifying Accountant
Not applicable.
16.G. Corporate Governance
The Nasdaq Rules provide that foreign private issuers may follow home country practice in lieu of the corporate governance requirements of the NASDAQ Stock Market LLC, subject to certain exceptions and requirements and except to the extent that such exemptions would be contrary to U.S. federal securities laws and regulations. The significant differences between our corporate governance practices and those followed by U.S. companies under the Nasdaq Rules are summarized as follows:
| ● | We follow home country practice that permits our independent directors not to hold regularly scheduled meetings at which only independent directors are present in lieu of complying with Rule 5605(b)(2). |
16.H. Mine Safety Disclosure
Not applicable.
16.I. Disclosure Regarding Foreign Jurisdictions that Prevent Inspections
Not applicable.
95
16.J. Insider Trading Policies
Pursuant to applicable SEC transition rules, the disclosure required by Item 16J is not yet applicable to the Company.
16.K. Cybersecurity
Risk Management and Strategy
To strengthen information security, our company collaborated with Deloitte Taiwan, a third-party consulting firm, in 2023. Furthermore, to enhance risk management procedures, our company is currently implementing deploys the Risk Assessment Work Instructions, the Network and Communication Management Work Instructions, and the Emergency Response and Disaster Recovery Management Work Instructions. These instructions are utilized for executing risk management and assessment strategies, implementing network control measures, and establishing procedures for information security incident grading and reporting.
As the frequency of network hacker attacks increases, our company continues to implement strict preventive measures against network attacks. These measures encompass firewall intrusion detection and prevention, internal and external network access control, regular updates of antivirus software, physical management of information equipment, and regular updates of information equipment. Our object is to ensure a secure R&D environment and mitigate operational risks.
For additional information regarding risks to the Company from cybersecurity threats. See “Risk Factors — Risks Related to Our Financial Condition and Business —System security risks, data protection breaches or unexpected system outages or failures could impact our business.”
Governance
Our company has established an information security committee, chaired by the Deputy General Manager of the Business and Operation Center and composing representatives of the heads of each division of the Company. The committee coordinates various information security control measures and information security management strategies. Furthermore, the committee has formed a task-force emergency response team, tasked with severity of suspected information security incidents. In the event of a major network security incident, the team will conduct damage control, restoration, root cause analysis, investigation, and improvement activities. Furthermore, the committee also has established an information security management team, encompassing representatives from the information department and each division of the Company. The team is responsible for facilitating and implementing policy discussions, policy tracking, and other implementation tasks.
Our company’s information security committee reports regularly to the Board of Directors annually on the outcome of the Company’s information security initiatives. The report includes internal and external environmental risks- related to information security incident investigation and handling, plans for managing high-risk information security incidents, and annual information security plans. The committee also conducts network security awareness training for Board members every year to enhance the Board's expertise in information security governance.
In 2023, our company did not experience any major information security incidents. In addition to annual information security awareness training, our company conducted four information security tests to reinforce employee awareness. To ensure the effective implementation of information security policies, all employees who participated in the information security tests successfully met the established qualification criteria.
PART III
ITEM 17. FINANCIAL STATEMENTS
Not applicable.
96
ITEM 18. FINANCIAL STATEMENTS
Our consolidated financial statements and the report thereon by our independent registered public accounting firm listed below are attached hereto as follows:
| (a) | Report of Independent Registered Public Accounting Firm. |
| (b) | Consolidated Statements of Financial Position as of December 31, 2022 and 2023. |
| (c) | Consolidated Statements of Profit or Loss for the years ended December 31, 2021, 2022 and 2023. |
| (d) | Consolidated Statements of Other Comprehensive Income for the years ended December 31, 2021, 2022 and 2023. |
| (e) | Consolidated Statements of Changes in Equity for the years ended December 31, 2021, 2022 and 2023. |
| (f) | Consolidated Statements of Cash Flows for the years ended December 31, 2021, 2022 and 2023. |
| (g) | Notes to the Consolidated Financial Statements. |
97
ITEM 19. EXHIBITS
Exhibit |
| Description of Document |
1.1 | ||
2.1 | Registrant’s Specimen American Depositary Receipt (included in Exhibit 2.3). | |
2.2 | ||
2.3 | ||
2.4 | ||
4.1 | ||
4.2* | ||
8.1 | ||
12.1 | ||
12.2 | ||
13.1 | ||
15.1 | Consent of KPMG, Independent Registered Public Accounting Firm. | |
97.1 | ||
101.INS | XBRL Instance Document | |
101.SCH | XBRL Taxonomy Extension Schema | |
101.CAL | XBRL Taxonomy Extension Calculation Linkbase | |
101.DEF | XBRL Taxonomy Extension Definition Linkbase | |
101.LAB | XBRL Taxonomy Extension Label Linkbase | |
101.PRE | XBRL Taxonomy Extension Presentation Linkbase | |
104 | Cover Page Interactive Data File (formatted as Inline XBRL and contained in Exhibit 101) |
*Confidential treatment has been requested for portions of this exhibit.
98
SIGNATURES
Pursuant to the requirements of Section 12 of the Securities Exchange Act of 1934, the registrant certifies that it meets all of the requirements for filing on Form 20-F and has duly caused this annual report to be signed on its behalf by the undersigned, thereunto duly authorized.
| HIMAX TECHNOLOGIES, INC. | ||
|
|
| |
| By: | /s/ Jordan Wu | |
|
| Name: | Jordan Wu |
|
| Title: | President and Chief Executive Officer |
Date: April 2, 2024
99
HIMAX TECHNOLOGIES, INC.
INDEX TO CONSOLIDATED FINANCIAL STATEMENTS
100
HIMAX TECHNOLOGIES, INC. AND SUBSIDIARIES
Consolidated Financial Statements
December 31, 2021, 2022 and 2023
(With Report of Independent Registered
Public Accounting Firm Thereon)
F-1
Report of Independent Registered Public Accounting Firm
To the Stockholders and Board of Directors
Himax Technologies, Inc.:
Opinion on the Consolidated Financial Statements
We have audited the accompanying consolidated statements of financial position of Himax Technologies, Inc. and subsidiaries (the “Company”) as of December 31, 2022 and 2023, the related consolidated statements of profit or loss, other comprehensive income, changes in equity, and cash flows for each of the years in the three-year period ended December 31, 2023, and the related notes (collectively, the “consolidated financial statements”). In our opinion, the consolidated financial statements present fairly, in all material respects, the financial position of the Company as of December 31, 2022 and 2023, and the results of its operations and its cash flows for each of the years in the three-year period ended December 31, 2023, in conformity with International Financial Reporting Standards as issued by the International Accounting Standards Board.
We also have audited, in accordance with the standards of the Public Company Accounting Oversight Board (United States) (“PCAOB”), the Company’s internal control over financial reporting as of December 31, 2023, based on criteria established in Internal Control – Integrated Framework (2013) issued by the Committee of Sponsoring Organizations of the Treadway Commission (“COSO”), and our report dated April 2, 2024 expressed an unqualified opinion on the effectiveness of the Company’s internal control over financial reporting.
Basis for Opinion
These consolidated financial statements are the responsibility of the Company’s management. Our responsibility is to express an opinion on these consolidated financial statements based on our audits. We are a public accounting firm registered with the PCAOB and are required to be independent with respect to the Company in accordance with the U.S. federal securities laws and the applicable rules and regulations of the Securities and Exchange Commission and the PCAOB.
We conducted our audits in accordance with the standards of the PCAOB. Those standards require that we plan and perform the audit to obtain reasonable assurance about whether the consolidated financial statements are free of material misstatement, whether due to error or fraud. Our audits included performing procedures to assess the risks of material misstatement of the consolidated financial statements, whether due to error or fraud, and performing procedures that respond to those risks. Such procedures included examining, on a test basis, evidence regarding the amounts and disclosures in the consolidated financial statements. Our audits also included evaluating the accounting principles used and significant estimates made by management, as well as evaluating the overall presentation of the consolidated financial statements. We believe that our audits provide a reasonable basis for our opinion.
Critical Audit Matter
The critical audit matter communicated below is a matter arising from the current period audit of the consolidated financial statements that was communicated or required to be communicated to the audit committee and that: (1) relates to accounts or disclosures that are material to the consolidated financial statements and (2) involved our especially challenging, subjective, or complex judgments. The communication of a critical audit matter does not alter in any way our opinion on the consolidated financial statements, taken as a whole, and we are not, by communicating the critical audit matter below, providing a separate opinion on the critical audit matter or on the accounts or disclosures to which it relates.
Impairment assessment of non-financial asset, excluding goodwill in the Wafer Level Optics cash generating unit
As discussed in Note 14 and 15 to the consolidated financial statements, the balance of other intangible assets and property, plant and equipment were $816 thousand and $130,109 thousand, respectively as of December 31, 2023, a portion of which related to the Wafer Level Optics cash generating unit (“CGU”). The Company’s non-financial assets excluding goodwill are reviewed at the reporting date to determine whether there is any indication of impairment. If any such indication exists, impairment assessment will be performed by comparing the carrying amount of the CGU with its recoverable amount, which is the higher of the fair value less costs of disposal and the value in use. The value in use is determined by discounting the estimated future cash flows to their present value using a pre-tax discount rate that reflects current market assessments of the time value of money and the risks specific to the asset.
F-2
We identified the impairment assessment of non-financial assets excluding goodwill in the Wafer Level Optics CGU as a critical audit matter because of the high degree of subjective auditor’s judgment required in evaluating the forecasted future revenues and discount rate assumptions and minor changes to those assumptions could have a significant effect on the Company’s impairment assessment of non-financial assets in the Wafer Level Optics CGU. In addition, the evaluation of the discount rate involved specialized skills and knowledge.
The primary procedures we performed to address this critical audit matter included the following. We tested certain internal controls over the Company’s impairment assessment process of non-financial assets excluding goodwill, including controls related to the determination of forecasted future revenues and the assumptions used to develop the discount rate. We evaluated the Company’s forecasted future revenues by comparing available subsequent purchase orders and industry revenue forecast. We compared the Company’s historical revenue forecasts to actual results to assess the Company’s ability to accurately forecast future revenues. We performed sensitivity analyses over the forecasted future revenues and discount rate to assess their impact on the recoverable amount of the CGU. In addition, we involved valuation professionals with specialized skills and knowledge, who assisted in evaluating the Company’s discount rate, by comparing it against an estimated discount rates developed independently based on market data and inputs.
/s/ KPMG
We have served as the Company’s auditor since 2001.
Hsinchu, Taiwan
April 2, 2024
F-3
HIMAX TECHNOLOGIES, INC. AND SUBSIDIARIES
Consolidated Statements of Financial Position
December 31, 2022 and 2023
(in thousands of US dollars)
December 31, | December 31, | ||||||
| Note |
| 2022 |
| 2023 | ||
Assets |
|
|
|
|
|
| |
Current assets: |
|
|
|
|
|
| |
Cash and cash equivalents |
| 7, 23 | $ | |
| | |
Financial assets at amortized cost |
| 8, 23 |
| |
| | |
Financial assets at fair value through profit or loss |
| 9, 23 |
| |
| | |
Accounts receivable, net (including related parties) |
| 11, 23, 26 |
| |
| | |
Inventories |
| 12 |
| |
| | |
Income taxes receivable |
| 23 |
| |
| | |
Restricted deposit |
| 17, 23, 27 |
| |
| | |
Other receivable from related parties |
| 23, 26 |
| |
| | |
Other current assets |
| 23 |
| |
| | |
Total current assets |
| |
| | |||
Financial assets at fair value through profit or loss |
| 9, 23 |
| |
| | |
Financial assets at fair value through other comprehensive income |
| 10, 23 |
| |
| | |
Equity method investments |
| 13 |
| |
| | |
Property, plant and equipment, net |
| 15, 18, 27, 29, 30 |
| |
| | |
Deferred tax assets |
| 22 |
| |
| | |
Goodwill | 4(k) |
| |
| | ||
Other intangible assets, net |
| 6, 14, 30 |
| |
| | |
Restricted deposit |
| 23, 27 |
| |
| | |
Refundable deposits | 23 | | | ||||
Other non-current assets |
| 19 |
| |
| | |
| |
| | ||||
Total assets | $ | |
| | |||
The accompanying notes are an integral part of these consolidated financial statements.
F-4
HIMAX TECHNOLOGIES, INC. AND SUBSIDIARIES
Consolidated Statements of Financial Position (Continued)
December 31, 2022 and 2023
(in thousands of US dollars)
December 31, | December 31, | ||||||
| Note |
| 2022 |
| 2023 | ||
Liabilities and Equity |
|
|
|
|
|
| |
Current liabilities: |
|
|
|
|
|
| |
Current portion of long-term unsecured borrowings | 18, 23, 27 | $ | | | |||
Short-term secured borrowings |
| 17, 23, 27 |
| |
| | |
Accounts payable (including related parties) | 23, 26 | | | ||||
Income taxes payable |
| 22 |
| |
| | |
Other payable to related parties |
| 23, 26 |
| |
| | |
Contract liabilities-current | 29 | | | ||||
Other current liabilities |
| 5, 15, 16, 23 |
| |
| | |
Total current liabilities |
| |
| | |||
Long-term unsecured borrowings | 18, 23, 27 | | | ||||
Deferred tax liabilities |
| 22 |
| |
| | |
Other non-current liabilities |
| 15, 19, 23 |
| |
| | |
Total liabilities |
| |
| | |||
Equity |
|
|
|
| |||
Ordinary shares |
| 21 |
| |
| | |
Additional paid-in capital |
| 21 |
| |
| | |
Treasury shares |
| ( |
| ( | |||
Accumulated other comprehensive income |
| 21 |
| ( |
| ( | |
Retained earnings |
| |
| | |||
Equity attributable to owners of Himax Technologies, Inc. |
| |
| | |||
Noncontrolling interests |
| 21 |
| |
| | |
Total equity |
| |
| | |||
Total liabilities and equity | $ | |
| | |||
The accompanying notes are an integral part of these consolidated financial statements.
F-5
HIMAX TECHNOLOGIES, INC. AND SUBSIDIARIES
Consolidated Statements of Profit or Loss
For the years ended December 31, 2021, 2022 and 2023
(in thousands of US dollars, except per share data)
| Note |
| 2021 |
| 2022 |
| 2023 | ||
Revenues: |
|
| |||||||
Revenues from third parties, net |
| $ | | | | ||||
Revenues from related parties, net | | | | ||||||
Total revenues | 26, 29 | | | | |||||
Costs and expenses: |
|
|
|
| |||||
Cost of revenues |
| 12, 19, 20, 26, 30 |
| | |
| | ||
Research and development |
| 19, 20, 26, 30 |
| | |
| | ||
General and administrative |
| 19, 20, 26, 30 |
| | |
| | ||
Reversal of credit losses |
| 11 |
| ( | |
| | ||
Sales and marketing |
| 19, 20, 26, 30 |
| | |
| | ||
Total costs and expenses |
|
|
| | |
| | ||
Operating income |
|
|
| | |
| | ||
Non operating income (loss): |
|
|
|
| |||||
Interest income |
|
|
| | |
| | ||
Changes in fair value of financial assets at fair value through profit or loss |
| 9, 23 |
| ( | |
| | ||
Foreign currency exchange gains (losses), net |
|
|
| | |
| ( | ||
Finance costs |
|
|
| ( | ( |
| ( | ||
Share of losses of associates |
| 13 |
| ( | ( |
| ( | ||
Other gains (losses) | 5, 6 | — | | ( | |||||
Other income |
|
| | |
| | |||
| ( | |
| | |||||
Profit before income taxes |
|
|
| | |
| | ||
Income tax expense (benefit) |
| 22 |
| | |
| ( | ||
Profit for the year |
|
|
| | |
| | ||
Loss attributable to noncontrolling interests |
|
|
| | |
| | ||
Profit attributable to Himax Technologies, Inc. stockholders |
|
| $ | | |
| | ||
Basic earnings per ordinary share attributable to Himax Technologies, Inc. stockholders |
| 4(r) | $ | | |
| | ||
Diluted earnings per ordinary share attributable to Himax Technologies, Inc. stockholders |
| 4(r) | $ | | |
| | ||
Basic earnings per ADS attributable to Himax Technologies, Inc. stockholders |
| 4(r) | $ | | |
| | ||
Diluted earnings per ADS attributable to Himax Technologies, Inc. stockholders |
| 4(r) | $ | | |
| | ||
The accompanying notes are an integral part of these consolidated financial statements.
F-6
HIMAX TECHNOLOGIES, INC. AND SUBSIDIARIES
Consolidated Statements of Other Comprehensive Income
For the years ended December 31, 2021, 2022 and 2023
(in thousands of US dollars)
| Note |
| 2021 | 2022 |
| 2023 | |||
Profit for the year | $ | | |
| | ||||
Other comprehensive income: |
|
|
|
| |||||
Items that will not be reclassified to profit or loss: |
| 19, 21, 22, 23 |
|
| |||||
Remeasurements of defined benefit pension plans |
| | |
| | ||||
Unrealized gain (loss) on financial assets at fair value through other comprehensive income |
| ( | |
| | ||||
Income tax related to items that will not be reclassified subsequently |
| ( | ( |
| | ||||
Items that may be reclassified subsequently to profit or loss: |
| ||||||||
Foreign operations - foreign currency translation differences |
| ( | ( |
| ( | ||||
Other comprehensive income for the year, net of tax |
| ( | |
| | ||||
Total comprehensive income for the year |
| | |
| | ||||
Total comprehensive income attributable to noncontrolling interests |
| | |
| | ||||
Total comprehensive income attributable to Himax Technologies, Inc. stockholders | $ | | |
| | ||||
The accompanying notes are an integral part of these consolidated financial statements.
F-7
HIMAX TECHNOLOGIES, INC. AND SUBSIDIARIES
Consolidated Statements of Changes in Equity
For the years ended December 31, 2021, 2022 and 2023
(in thousands of US dollars and shares, except per share data)
Attributable to owners of Himax Technologies, Inc. | |||||||||||||||||||||
Accumulated | |||||||||||||||||||||
Ordinary shares | Additional | Treasury shares | other | ||||||||||||||||||
paid-in | comprehensive | Retained | Noncontrolling | Total | |||||||||||||||||
| Shares |
| Amount |
| capital |
| Shares |
| Amount |
| income |
| earnings |
| Total |
| interests |
| Equity | ||
Balance at January 1, 2021 |
| | $ | |
| |
| ( |
| ( |
| ( |
| |
| |
| |
| | |
Profit (loss) for the year | — | — | — | — | — | — | | | ( | | |||||||||||
Other comprehensive income |
| — |
| — |
| — |
| — |
| — |
| ( |
| — | ( |
| |
| ( | ||
Total comprehensive income for the year |
| — |
| — |
| — |
| — |
| — |
| ( |
| |
| |
| ( |
| | |
Contributions by and distributions to owners |
|
|
|
|
|
|
|
|
|
|
|
|
|
|
|
|
|
| |||
Declaration of cash dividends, $ |
| — |
| — |
| — |
| — |
| — | — |
| ( |
| ( |
| — |
| ( | ||
Share-based compensation expenses |
| — |
| — |
| |
| — |
| — |
| — |
| — |
| |
| |
| | |
Restricted stock vested |
| — |
| — |
| ( |
| |
| |
| — |
| — |
| — |
| — |
| — | |
Employee stock options exercised | — | — | | | | — | — | | — | | |||||||||||
| — |
| — |
| |
| |
| |
| — |
| ( |
| ( |
| |
| ( | ||
Changes in ownership interests |
|
|
|
|
|
|
|
|
|
|
|
|
|
|
|
|
|
|
| ||
Purchase of subsidiaries shares from noncontrolling interest | — | — | — | — | — | — | ( | ( | | ( | |||||||||||
Dilution gain of equity method investment | — | — | | — | — | — | ( | | — | | |||||||||||
Declaration of cash dividends by subsidiary | — | — | — | — | — | — | — | — | ( | ( | |||||||||||
| — |
| — |
| |
| — |
| — |
| — |
| ( |
| ( |
| |
| ( | ||
Balance at December 31, 2021 |
| | $ | |
| |
| ( |
| ( |
| ( |
| |
| |
| |
| | |
The accompanying notes are an integral part of these consolidated financial statements.
F-8
HIMAX TECHNOLOGIES, INC. AND SUBSIDIARIES
Consolidated Statements of Changes in Equity (Continued)
For the years ended December 31, 2021, 2022 and 2023
(in thousands of US dollars and shares, except per share data)
Attributable to owners of Himax Technologies, Inc. | |||||||||||||||||||||
Accumulated | |||||||||||||||||||||
Ordinary shares | Additional | Treasury shares | other | ||||||||||||||||||
paid-in | comprehensive | Retained | Noncontrolling | Total | |||||||||||||||||
| Shares |
| Amount |
| capital |
| Shares |
| Amount |
| income |
| earnings |
| Total |
| interests |
| Equity | ||
Profit (loss) for the year |
| — |
| — |
| — |
| — |
| — |
| — |
| |
| |
| ( |
| | |
Other comprehensive income |
| — |
| — |
| — |
| — |
| — |
| |
| — | |
| |
| | ||
Total comprehensive income for the year |
| — |
| — |
| — |
| — |
| — |
| |
| |
| |
| ( |
| | |
Contributions by and distributions to owners |
|
|
|
|
|
|
|
|
|
|
|
|
|
|
|
|
|
| |||
Declaration of cash dividends, $ |
| — |
| — |
| — |
| — |
| — |
| — |
| ( |
| ( |
| — |
| ( | |
Share-based compensation expenses |
| — |
| — |
| |
| — |
| — |
| — |
| — |
| |
| |
| | |
Restricted stock vested |
| — |
| — |
| ( |
| |
| |
| — |
| — |
| — |
| — |
| — | |
| — |
| — |
| |
| |
| |
| — |
| ( |
| ( |
| |
| ( | ||
Changes in ownership interests |
|
|
|
|
|
|
|
|
|
|
|
|
|
|
|
|
|
|
|
| |
New shares issued by subsidiary |
| — |
| — |
| |
| — |
| — |
| — |
| — |
| |
| |
| | |
Dilution gain of equity method investment |
| — |
| — |
| |
| — |
| — |
| — |
| — |
| |
| — |
| | |
Effect of Himax Media Solutions, Inc. merged into Himax Taiwan | — | — | — | — | — | — | ( | ( | ( | ( | |||||||||||
Disposal of financial assets at fair value through other comprehensive income | — | — | — | — | — | — | ( | ( | ( | ( | |||||||||||
| — |
| — |
| |
| — |
| — |
| — |
| ( |
| |
| |
| | ||
Balance at December 31, 2022 |
| | $ | |
| |
| ( |
| ( |
| ( |
| |
| |
| |
| | |
The accompanying notes are an integral part of these consolidated financial statements.
F-9
HIMAX TECHNOLOGIES, INC. AND SUBSIDIARIES
Consolidated Statements of Changes in Equity (Continued)
For the years ended December 31, 2021, 2022 and 2023
(in thousands of US dollars and shares, except per share data)
Attributable to owners of Himax Technologies, Inc. | |||||||||||||||||||||
Accumulated | |||||||||||||||||||||
| Ordinary shares |
| Additional |
| Treasury shares |
| other |
|
|
|
| ||||||||||
| paid-in |
| comprehensive |
| Retained |
| Noncontrolling |
| Total | ||||||||||||
| Shares |
| Amount |
| capital |
| Shares |
| Amount |
| income |
| earnings |
| Total |
| interests |
| Equity | ||
Profit (loss) for the year | — | — | — | — | — | — |
| |
| |
| ( |
| | |||||||
Other comprehensive income |
| — | — | — | — | — |
| |
| — |
| |
| |
| | |||||
Total comprehensive income for the year | — | — | — | — | — |
| |
| |
| |
| ( |
| | ||||||
Contributions by and distributions to owners |
|
|
|
|
|
|
|
|
|
| |||||||||||
Declaration of cash dividends, $ | — | — | — | — | — | — | ( | ( | — | ( | |||||||||||
Dividend Equivalents | — | — | — | — | — | — | ( | ( | — | ( | |||||||||||
Share-based compensation expenses |
| — |
| — |
| |
| — |
| — |
| — |
| — |
| |
| |
| | |
Restricted stock vested |
| — |
| — |
| ( |
| |
| |
| — |
| — |
| — |
| — |
| — | |
— | — |
| |
| |
| | — | ( |
| ( |
| |
| ( | ||||||
Changes in ownership interests |
|
|
|
|
|
|
|
|
|
| |||||||||||
New shares issued by subsidiary | — | — | — | — | — | — | ( | ( | | | |||||||||||
Purchase of subsidiaries shares from noncontrolling interest | — | — | — | — | — | — | ( | ( | | ( | |||||||||||
Dilution gain of equity method investment |
| — |
| — |
| |
| — |
| — |
| — |
| — |
| |
| — |
| | |
Acquired the controlling power from noncontrolling interest | — | — | — | — | — | — | — | — | | | |||||||||||
Liquidation of financial assets at fair value through other comprehensive income | — | — | — | — | — | — | ( | ( | — | ( | |||||||||||
— | — |
| | — | — | — | ( |
| ( |
| |
| | ||||||||
Balance at December 31, 2023 |
| | $ | |
| |
| ( |
| ( |
| ( |
| |
| |
| |
| | |
The accompanying notes are an integral part of these consolidated financial statements.
F-10
HIMAX TECHNOLOGIES, INC. AND SUBSIDIARIES
Consolidated Statements of Cash Flows
For the years ended December 31, 2021, 2022 and 2023
(in thousands of US dollars)
| 2021 |
| 2022 |
| 2023 | ||
Cash flows from operating activities: |
|
|
|
| |||
Profit for the year | $ | | |
| | ||
Adjustments for: |
|
| |||||
Depreciation and amortization |
| | |
| | ||
Reversal of credit losses recognized on accounts receivable |
| ( | |
| | ||
Gain on disposal of subsidiary | | ( | | ||||
Share-based compensation expenses |
| | |
| | ||
Gains on disposal of property, plant and equipment, net |
| ( | |
| ( | ||
Loss on re-measurement of the pre-existing relationships in a business combination | | | | ||||
Changes in fair value of financial assets at fair value through profit or loss |
| | ( |
| ( | ||
Interest income |
| ( | ( |
| ( | ||
Finance costs |
| | |
| | ||
Income tax expense (benefit) |
| | |
| ( | ||
Share of losses of associates |
| | |
| | ||
Inventories write downs |
| | |
| | ||
Unrealized foreign currency exchange losses (gains) |
| ( | ( |
| | ||
| | |
| | |||
Changes in: |
|
| |||||
Accounts receivable (including related parties) |
| ( | |
| | ||
Inventories |
| ( | ( |
| | ||
Other receivable from related parties | ( | ( | | ||||
Other current assets |
| ( | |
| ( | ||
Other non-current assets | ( | | | ||||
Accounts payable (including related parties) | | ( | | ||||
Other payable to related parties |
| ( | |
| ( | ||
Contract liabilities | | | ( | ||||
Other current liabilities |
| | |
| | ||
Other non-current liabilities |
| ( | |
| ( | ||
Cash generated from operating activities |
| | |
| | ||
Interest received |
| | |
| | ||
Interest paid |
| ( | ( |
| ( | ||
Income tax paid |
| ( | ( |
| ( | ||
Net cash provided by operating activities |
| | |
| | ||
The accompanying notes are an integral part of these consolidated financial statements.
F-11
HIMAX TECHNOLOGIES, INC. AND SUBSIDIARIES
Consolidated Statements of Cash Flows (Continued)
For the years ended December 31, 2021, 2022 and 2023
(in thousands of US dollars)
| 2021 |
| 2022 |
| 2023 | ||
Cash flows from investing activities: |
|
|
|
| |||
Acquisitions of property, plant and equipment | $ | ( | ( |
| ( | ||
Proceeds from disposal of property, plant and equipment |
| | |
| | ||
Acquisitions of intangible assets |
| ( | ( |
| ( | ||
Acquisitions of financial assets at amortized cost |
| ( | ( |
| ( | ||
Proceeds from disposal of financial assets at amortized cost |
| | |
| | ||
Acquisitions of financial assets at fair value through profit or loss |
| ( | ( |
| ( | ||
Proceeds from disposal of financial assets at fair value through profit or loss |
| | |
| | ||
Proceeds from disposal of a subsidiary |
| | |
| | ||
Acquisitions of financial assets at fair value through other comprehensive income | | | ( | ||||
Proceeds from disposal of financial assets at fair value through other comprehensive income | | | | ||||
Acquisition of a subsidiary, net of cash acquired |
| | |
| | ||
Proceeds from capital reduction of investment |
| | |
| | ||
Acquisitions of equity method investments |
| ( | ( |
| | ||
Increase in refundable deposits |
| ( | ( |
| ( | ||
Releases (pledges) of restricted deposit |
| ( | |
| | ||
Cash received in advance from disposal of land | | | | ||||
Net cash provided by (used in) investing activities |
| ( | |
| ( | ||
Cash flows from financing activities: |
|
| |||||
Payments of cash dividends |
| ( | ( |
| ( | ||
Payments of dividend equivalents | | | ( | ||||
Proceeds from issuance of new shares by subsidiaries |
| | |
| | ||
Purchases of subsidiary shares from noncontrolling interests | ( | ( | ( | ||||
Proceeds from short-term unsecured borrowings |
| | |
| | ||
Repayments of short-term unsecured borrowings |
| ( | |
| ( | ||
Proceeds from long-term unsecured borrowings |
| | |
| | ||
Repayments of long-term unsecured borrowings | ( | ( | ( | ||||
Proceeds from short-term secured borrowings |
| | | | |||
Repayments of short-term secured borrowings | ( | ( | ( | ||||
Pledge of restricted deposit | ( | ( | ( | ||||
Payment of lease liabilities | ( | ( | ( | ||||
Guarantee deposits received | | | | ||||
Proceeds from exercise of employee stock options | | | | ||||
Net cash used in financing activities |
| ( | ( |
| ( | ||
Effect of foreign currency exchange rate changes on cash and cash equivalents |
| ( | ( |
| ( | ||
Net increase (decrease) in cash and cash equivalents |
| | ( |
| ( | ||
Cash and cash equivalents at beginning of year |
| | |
| | ||
Cash and cash equivalents at end of year | $ | | |
| | ||
The accompanying notes are an integral part of these consolidated financial statements.
F-12
HIMAX TECHNOLOGIES, INC. AND SUBSIDIARIES
Notes to Consolidated Financial Statements
For the years ended December 31, 2021, 2022 and 2023
Note 1. Reporting entity
Himax Technologies Limited, an exempted company with limited liability under the Cayman Islands Companies Law, was incorporated on April 26, 2005 and changed the name to “Himax Technologies, Inc.” on September 26, 2005. Since March 2006, Himax Technologies, Inc.’s ordinary shares have been quoted on the NASDAQ Global Select Market under the symbol “HIMX” in the form of ADSs and two ordinary shares represent one ADS with effect from August 10, 2009.
The registered office in the Cayman Islands is located at Cricket Square, Hutchins Drive, P.O. Box 2681, Grand Cayman KY1-1111, Cayman Islands. The principal executive office is located at No. 26, Zilian Road, Xinshi District, Tainan City 744092, Taiwan, Republic of China.
The principal operating activities of Himax Technologies, Inc. and subsidiaries (collectively, the Company) are described in Note 4(b).
Note 2. Basis of preparation
| (a) | Statement of compliance |
The consolidated financial statements have been prepared in accordance with International Financial Reporting Standards (“IFRS”) as issued by the International Accounting Standards Board (“IASB”).
The consolidated financial statements were authorized for issuance by the Board of Directors on April 2, 2024.
| (b) | Basis of measurement |
The consolidated financial statements have been prepared on the historical cost basis except for the following material items in the statement of financial position:
| 1. | Financial assets at fair value through profit or loss; |
| 2. | Financial assets at fair value through other comprehensive income; |
| 3. | The defined benefit liability (asset) is recognized as the fair value of the plan assets less the present value of the defined benefit obligation. |
F-13
HIMAX TECHNOLOGIES, INC. AND SUBSIDIARIES
Notes to Consolidated Financial Statements (Continued)
For the years ended December 31, 2021, 2022 and 2023
Note 3. Application of new and revised IFRS as issued by the IASB
a. | Amendments to IFRSs and the new interpretation that are mandatorily effective for the current year |
Effective Date | ||
New, Revised or Amended Standards and Interpretations |
| Announced by IASB |
The Company believes that the adoption of the above amendments to IFRSs did not have a material impact on its consolidated financial statements.
| b. | New and revised standards, amendments and interpretations in issue but not yet effective |
In preparing the accompanying consolidated financial statements, the Company has not adopted the following International Financial Reporting Standards (“IFRS”), International Accounting Standards (“IAS”), Interpretations developed by the International Financial Reporting Interpretations Committee (“IFRIC”) or the former Standing Interpretations Committee (“SIC”) issued by the International Accounting Standards Board (“IASB”) (collectively, “IFRSs”).
Effective Date | ||
New, Revised or Amended Standards and Interpretations |
| Announced by IASB |
As of the date of the consolidated financial statements were authorized for issue, the Company continues in assessing possible impacts that application of the abovementioned amendments will have on the Company’s financial position and financial performance and will disclose these impacts when the assessment is completed.
Note 4. Material accounting policies
The material accounting policies applied in the preparation of these consolidated financial statements are set out as below. The accounting policies set out below have been applied consistently to all periods presented in these consolidated financial statements, except if mentioned otherwise. The accounting policies have been applied consistently by consolidated entities.
(a) Basis of Consolidation
The accompanying consolidated financial statements include the accounts and operations of Himax Technologies, Inc. and its majority owned subsidiaries and entities that it has a controlling financial interest. The Company ‘controls’ an entity when it is exposed to, or has rights to, variable returns from its involvement with the entity and has the ability to affect those returns through its power over the entity. All significant intercompany balances and transactions have been eliminated in consolidation.
F-14
HIMAX TECHNOLOGIES, INC. AND SUBSIDIARIES
Notes to Consolidated Financial Statements (Continued)
For the years ended December 31, 2021, 2022 and 2023
(b) List of Subsidiaries in the Consolidated Financial Statements
Following is general information about Himax Technologies, Inc.’s subsidiaries:
Percentage of Ownership |
| ||||||||||
Jurisdiction of | December 31, | December 31, |
| ||||||||
Investor |
| Subsidiary |
| Main activities |
| Incorporation |
| 2022 |
| 2023 |
|
|
|
|
| | % | | % | ||||
|
|
|
| | % | | % | ||||
|
|
|
| | % | | % | ||||
|
|
|
| | % | | % | ||||
— | | % | |||||||||
— | | % | |||||||||
|
|
|
| | % | | % | ||||
|
|
|
| | % | | % | ||||
| % | | % | ||||||||
|
|
|
| | % | | % | ||||
|
|
|
| | % | | % | ||||
|
|
|
| | % | | % | ||||
|
|
|
| | % | | % | ||||
|
|
|
| | % | | % | ||||
|
|
|
| | % | | % | ||||
|
|
|
| | % | | % | ||||
|
|
|
| | % | | % | ||||
|
|
|
| | % | | % | ||||
|
|
|
| | % | | % | ||||
|
|
|
| | % | | % | ||||
Note (1): On December 30, 2023, Himax Technologies, Inc. acquired the controlling interest in Viewsil and included it as the consolidated entity. Refer to Note 5 for further details.
F-15
HIMAX TECHNOLOGIES, INC. AND SUBSIDIARIES
Notes to Consolidated Financial Statements (Continued)
For the years ended December 31, 2021, 2022 and 2023
Principal Activities
The Company is a leading global fabless semiconductor solution provider dedicated to display imaging processing technologies. The Company’s display driver ICs and timing controllers have been adopted at scale across multiple industries worldwide including TVs, PC monitors, laptops, mobile phones, tablets, automotive, ePaper devices, industrial displays, among others. As the global market share leader in automotive display technology, the Company offers innovative and comprehensive automotive IC solutions, including traditional driver ICs, advanced in-cell Touch and Display Driver Integration (TDDI), local dimming timing controllers (Local Dimming TCON), Large Touch and Display Driver Integration (LTDI) and AMOLED display technologies. The Company is also a pioneer in tinyML visual-AI and optical technology related fields. The Company’s industry-leading WiseEyeTM Smart Sensing technology which incorporates Himax proprietary ultralow power AI processor, always-on CMOS image sensor, and CNN-based AI algorithm has been widely deployed in consumer electronics and AIoT related applications. While the Company optics technologies, such as diffractive wafer level optics, LCoS micro-displays and 3D sensing solutions, are critical for facilitating emerging AR/VR/metaverse technologies. Besides, Himax designs and provides touch controllers, AMOLED ICs, LED drivers, EPD drivers, power management ICs, and CMOS image sensors for diverse display application coverage.
(c) Foreign Currency
The reporting currency of the Company is the United States dollar (USD). The functional currency for the Company and its major operating subsidiaries is the USD. Accordingly, the assets and liabilities of subsidiaries whose functional currency is other than the USD are included in the consolidation by translating the assets and liabilities into the reporting currency (the USD) at the exchange rates applicable at the end of the reporting period. Equity accounts are translated at historical rates. The statements of profit or loss and cash flows are translated at the average exchange rates at the date of transaction. Translation gains or losses are accumulated as a separate component of equity in accumulated other comprehensive income.
(d) Classification of Current and Noncurrent Assets and Liabilities
Current assets are assets held for trading purposes and assets expected to be converted to cash, sold or consumed within one year from the end of the reporting period. Current liabilities are obligations incurred for trading purposes and obligations expected to be settled within one year from the end of the reporting period. Assets and liabilities that are not classified as current are noncurrent assets and liabilities, respectively.
(e) Cash and Cash Equivalents
Cash comprise cash balances and demand deposits. Cash equivalents comprise short-term highly liquid investments that are readily convertible into known amounts of cash and are subject to an insignificant risk of changes in their fair value. Deposits with an original maturity of three months or less at the time of purchase but not for investments and other purposes and are qualified with the aforementioned criteria are classified as cash equivalent.
(f) Financial Instruments
The Company shall recognize a financial asset or a financial liability in its statement of financial position when, and only when, the Company becomes party to the contractual provisions of the instrument. A regular way purchase or sale of financial assets shall be recognized and derecognized, as applicable, using trade date accounting.
F-16
HIMAX TECHNOLOGIES, INC. AND SUBSIDIARIES
Notes to Consolidated Financial Statements (Continued)
For the years ended December 31, 2021, 2022 and 2023
| 1. | Financial Assets |
| (i) | Classification of financial assets |
The classification of financial assets depends on the nature and purpose of the financial assets and is determined at the time of initial recognition. Financial assets are classified into the following categories: measured at amortized cost, measured at fair value through other comprehensive income (FVTOCI) and measured at fair value through profit or loss (FVTPL). The classification of financial assets is generally based on the business model in which a financial asset is managed and its contractual cash flow characteristics. When, and only when, the Company changes its business model for managing financial assets it shall reclassify all affected financial assets.
| i. | Financial assets measured at amortized cost |
A financial asset is measured at amortized cost if it meets both of the following conditions and is not designated as measured at fair value through profit or loss:
| (i) | the asset held within a business model whose objective is to hold assets to collect contractual cash flows; and |
| (ii) | the contractual terms give rise on specified dates to cash flows that are solely payments of principal and interest on the principal amount outstanding. |
Financial assets measured at amortized cost are subsequently measured at amortized cost using the effective interest method. The amortized cost is reduced by impairment losses. Interest income, foreign exchange gains and losses and impairment are recognized in profit or loss. Any gain or loss on derecognition is recognized in profit or loss.
| ii. | Financial assets measured at fair value through other comprehensive income (FVTOCI) |
On initial recognition of an equity investment that is not held for trading, the Company may irrevocably elect to present subsequent changes in the investment’s fair value in OCI. This election is made on an investment-by-investment basis.
Equity investments at FVTOCI are subsequently measured at fair value. Dividends are recognized as income in profit or loss unless the dividend clearly represents a recovery of part of the cost of the investment. Other net gains and losses are recognized in OCI. When an investment is derecognized, the cumulative gain or loss in equity will not be reclassified to profit or loss, instead, is reclassified to retained earnings.
| iii. | Financial assets measured at fair value through profit or loss (FVTPL) |
All financial assets not classified as measured at amortized cost or at fair value through other comprehensive income as described above are measured at fair value through profit or loss.
Such financial assets are initially recognized at fair value, and attributable transaction costs are recognized in profit or loss as incurred. Subsequent to initial recognition, they are measured at fair value and changes therein are recognized in profit or loss.
| (ii) | Impairment of financial assets |
The Company recognizes loss allowances for expected credit loss on financial assets measured at amortized cost (including accounts receivable).
F-17
HIMAX TECHNOLOGIES, INC. AND SUBSIDIARIES
Notes to Consolidated Financial Statements (Continued)
For the years ended December 31, 2021, 2022 and 2023
The loss allowance for accounts receivable is measured at an amount equal to lifetime expected credit losses. For financial assets at amortized cost and contract assets, when the credit risk on the financial instrument has not increased significantly since initial recognition, a loss allowance is recognized at an amount equal to expected credit loss resulting from possible default events of a financial instrument within 12 months after the reporting date. If, on the other hand, there has been a significant increase in credit risk since initial recognition, a loss allowance is recognized at an amount equal to expected credit loss resulting from all possible default events over the expected life of a financial instrument.
When determining whether the credit risk of a financial instrument has increased significantly since initial recognition, the Company considers reasonable and supportable information that is relevant. This includes both qualitative and quantitative information and analysis, based on the Company’s historical experience and credit assessment as well as forward-looking information.
The Company recognizes an impairment gain or loss in profit or loss for all financial instruments with a corresponding adjustment to their carrying amount through a loss allowance account.
| (iii) | Derecognition of financial assets |
The Company derecognizes a financial asset only when the contractual rights to the cash flows from the financial asset expire, or when it transfers the financial asset and substantially all the risks and rewards of ownership of the financial asset to another entity.
On derecognition of a financial asset at amortized cost in its entirety, the difference between the asset’s carrying amount and the sum of the consideration received and receivable is recognized in profit or loss. However, on derecognition of an investment in an equity instrument at FVTOCI, the cumulative gain or loss that had been recognized in other comprehensive income is transferred directly to retained earnings, without recycling through profit or loss.
| 2. | Financial Liabilities |
| (i) | Classification of financial liability |
The Company classify all financial liabilities as measured at amortized cost, except for financial liabilities measured at fair value through profit or loss. Such liabilities, including derivatives that are liabilities, shall be subsequently measured at fair value.
| (ii) | Derecognition of financial liability |
The Company removes a financial liability from its statement of financial position when, and only when, it is extinguished-when the obligation specified in the contract is discharged or cancelled or expires.
On derecognition of a financial liability at amortized cost in its entirety, the difference between the carrying amount of a financial liability extinguished or transferred to another party and the consideration paid, including any non-cash assets transferred or liabilities assumed, shall be recognized in profit or loss.
F-18
HIMAX TECHNOLOGIES, INC. AND SUBSIDIARIES
Notes to Consolidated Financial Statements (Continued)
For the years ended December 31, 2021, 2022 and 2023
(g) Inventories
Inventories primarily consist of raw materials, work-in-process and finished goods awaiting final assembly and test and are stated at the lower of cost and net realizable value. Cost is determined using the weighted-average method. For work-in-process and manufactured inventories, cost consists of the cost of raw materials (primarily fabricated wafer and processed tape), direct labor and an appropriate proportion of production overheads. Net realizable value for raw materials is based on replacement cost. Net realizable value for finished goods and work in process is calculated based on the estimated selling price less all estimated costs of completion and necessary selling costs.
(h) Equity Method Investments
Equity investments in entities where the Company has the ability to exercise significant influence over the operating and financial policy decisions of the investee but does not have a controlling financial interest in the investee, are accounted for using the equity method. The Company’s share of the net income or net loss of an investee is recognized in earnings from the date the significant influence commences until the date that significant influence ceases. The difference between the cost of an investment and the amount of underlying equity in net assets of an investee at investment date is allocated to related assets which are amortized over their useful lives. Any unallocated difference is treated as investor-level goodwill and is not amortized.
The Company discontinues the use of the equity method from the date when the Company ceases to have significant influence over an associate, and then measures the retained interests at fair value at that date. The difference between the carrying amount of the investment at the date the equity method was discontinued and the fair value of the retained interests along with any proceeds from disposing of a part of the interest in the associate is recognized in profit or loss. When the Company discontinues the use of the equity method, the Company shall account for all amounts previously recognized in other comprehensive income in relation to that investment on the same basis as would have been required if the investee had directly disposed of the related assets or liabilities.
At the end of each reporting period, if there is any indication of impairment, the entire carrying amount of the investment including goodwill is tested for impairment as a single asset, by comparing its recoverable amount with its carrying amount. An impairment loss recognized forms part of the carrying amount of the investment in associates. Accordingly, any reversal of that impairment loss is recognized to the extent that the recoverable amount of the investment subsequently increases.
(i) Property, Plant and Equipment
Property, plant and equipment consists primarily of land, building and machinery and equipment used in the design and development of products, and is stated at cost less accumulated depreciation and any accumulated impairment loss. Depreciation on building and machinery and equipment commences when the asset is ready for its intended use. Except for the following paragraph, depreciation is primarily calculated on the straight-line method over the estimated useful lives of related assets which range as follows: building
If significant parts of an item of property, plant and equipment have different useful lives, then they are accounted for as separate items (major components) of property, plant and equipment.
Depreciation methods, useful lives and residual values are reviewed at each reporting date and adjusted if appropriate.
F-19
HIMAX TECHNOLOGIES, INC. AND SUBSIDIARIES
Notes to Consolidated Financial Statements (Continued)
For the years ended December 31, 2021, 2022 and 2023
Property, plant and equipment that are highly probable to be recovered primarily through sale rather than through continuing use, are reclassified as held for sale. Immediately before classification as held for sale, the assets are measured at the lower of their carrying amount and fair value less costs to sell. Impairment losses on assets initially classified as held for sale and any subsequent gains or losses on remeasurement are recognized in profit or loss. Gains are not recognized in excess of the cumulative impairment loss that has been recognized. Once classified as held for sale, the property, plant and equipment are no longer depreciated.
(j) Leases
a. | Identifying a lease |
A contract is, or contains, a lease when all the following conditions are satisfied:
(i) | the contract involves the use of an identified asset, and the supplier does not have a substantive right to substitute the asset; and |
(ii) | the Company has the right to obtain substantially all of the economic benefits from use of the identified asset throughout the period of use; and |
(iii) the Company has the right to direct the use of the identified asset throughout the period of use.
b. | As a lessee |
Payments for leases of low-value assets and short-term leases are recognized as expenses on a straight-line basis during the lease term for which the recognition exemption is applied. Except for leases described above, a right-of-use asset and a lease liability shall be recognized for all other leases at the lease commencement date.
The Company recognizes a right-of-use asset and a lease liability at the lease commencement date. The lease liability is initially measured at the present value of the lease payments, discounted using the lessee’s incremental borrowing rate. The Company determines its incremental borrowing rate by obtaining interest rates from various external financing sources. The right-of-use asset is initially measured at cost, which comprises the initial amount of the lease liability, adjusted for any lease payments made at or before the commencement date, less any lease incentives received, plus any initial direct costs incurred and an estimate of costs to be incurred in restoring the underlying asset.
The right-of-use asset is subsequently depreciated using the straight-line method over the shorter of the useful life of the right-of-use asset or the lease term. The lease liability is subsequently measured at amortized cost using the effective interest method. It is remeasured (i) if there is a change in the lease term; (ii) if there is a change in future lease payments arising from a change in an index or a rate; (iii) if there is a change in the amounts expected to be payable under a residual value guarantee; or (iv) if the Company changes its assessment of whether it will exercise a purchase, extension or termination option. When the lease liability is remeasured in the circumstances aforementioned, a corresponding adjustment is made to the carrying amount of the right-of-use asset. However, if the carrying amount of the right-of-use asset is reduced to zero, any remaining amount of the remeasurement is recognized in profit or loss.
F-20
HIMAX TECHNOLOGIES, INC. AND SUBSIDIARIES
Notes to Consolidated Financial Statements (Continued)
For the years ended December 31, 2021, 2022 and 2023
Lease payments included in the measurement of the lease liability comprise the following:
| (i) | fixed payments, including in-substance fixed payments. |
| (ii) | the exercise price under a purchase option that the Company is reasonably certain to exercise and lease payments in an optional renewal period if the Company is reasonably certain to exercise an extension option. |
Moreover, the lease liability is remeasured when lease modifications occur that decrease the scope of the lease. The Company accounts for the remeasurement of the lease liability by decreasing the carrying amount of the right-of-use asset to reflect the partial or full termination of the lease and recognizes in profit or loss any gain or loss relating to the partial or full termination of the lease.
c. | As a lessor |
Lease income from an operating lease is recognized in profit or loss on a straight-line basis over the lease term. Initial direct costs incurred in negotiating and arranging an operating lease are added to the carrying amount of the asset leased.
(k) Goodwill
Goodwill is recognized when the purchase price exceeds the fair value of identifiable net assets acquired in a business combination. Goodwill is measured at cost less accumulated impairment losses, if any.
Goodwill from acquisition of Himax Semiconductor, Inc. (formerly Wisepal Technologies, Inc., merged into Himax Technologies Limited on July 2, 2018) in 2007 amounting $
Goodwill is not amortized and instead is reviewed for impairment at least annually, or more frequently when there is an indication that the CGU may be impaired. For the purpose of impairment testing, goodwill is allocated to each of the Company’s CGU or groups of CGU that are expected to benefit from the synergies of the combination. If the recoverable amount of a cash-generating unit is less than its carrying amount, the difference is allocated first to reduce the carrying amount of any goodwill allocated to such CGU and then to the other assets of the CGU pro rata based on the carrying amount of each asset in the CGU. Any impairment loss for goodwill is recognized directly in profit or loss. An impairment loss recognized for goodwill is not reversed in subsequent periods.
The recoverable amount is the higher of fair value less costs of disposal and value in use. In assessing value in use which was calculated based on the cash flow forecast from the financial budgets covering the future five-year period with the terminal growth rate. The annual discount rate was
For the years ended December 31, 2021, 2022 and 2023, the Company did not recognize any impairment loss on goodwill.
F-21
HIMAX TECHNOLOGIES, INC. AND SUBSIDIARIES
Notes to Consolidated Financial Statements (Continued)
For the years ended December 31, 2021, 2022 and 2023
(l) Other Intangible Assets
Acquired intangible assets include patents, intellectual property and developed technology acquired in a business combination. These intangible assets are amortized on a straight-line basis over the following estimated useful lives: software
Amortization methods, useful lives and residual values are reviewed at each reporting date and adjusted if appropriate.
(m) Impairment of Non-Financial Assets
The Company’s long-term non-financial assets, which consist of property, plant and equipment and intangible assets, are reviewed at the reporting date to determine whether there is any indication of impairment. If any such indication exists, then the asset’s recoverable amount is estimated.
The recoverable amount of an asset or cash-generating unit is the greater of its value in use and its fair value less costs to sell. In assessing value in use, the estimated future cash flows are discounted to their present value using a pre-tax discount rate that reflects current market assessments of the time value of money and the risks specific to the asset. Considering the terminal growth rate if non-financial assets with an indefinite useful life are allocated to the CGU in comparison with its carrying amount.
For the purpose of impairment testing, assets that cannot be tested individually are grouped together into the smallest group of assets that generates cash inflows from continuing use that are largely independent of the cash inflows of other assets or groups of assets (the “cash-generating unit, or CGU”).
The annual discount rate was
An impairment loss is recognized if the carrying amount of an asset or its CGU exceeds its estimated recoverable amount. Impairment losses are recognized in profit or loss. When an impairment loss subsequently reverses, the carrying amount of the asset or a CGU is increased to the revised estimate of its recoverable amount, but the increased carrying amount does not exceed the carrying amount that would have been determined had no impairment loss been recognized for the asset or CGU in prior years. A reversal of an impairment loss is recognized immediately in profit or loss.
(n) Revenue Recognition
IFRS 15 establishes principles for recognizing revenue that apply to all contracts with customers, using a five-step model framework to determine the method, timing and amount of revenue recognized. The Company generates revenue primarily from sale of goods or services. Revenue from contracts with customers is disaggregated by primarily geographical market and major products.
Under IFRS 15, the Company identifies the contract with the customers and recognizes revenue when performance obligations are satisfied.
Revenue is measured based on the consideration that the Company expects to be entitled in the transfer of goods or services to a customer. The Company recognizes revenue when it satisfies a performance obligation by transferring control over a product or service to a customer. Customers obtain control of the product when the goods are delivered and accepted by customers. Invoices are generated at that point in time.
F-22
HIMAX TECHNOLOGIES, INC. AND SUBSIDIARIES
Notes to Consolidated Financial Statements (Continued)
For the years ended December 31, 2021, 2022 and 2023
The Company’s revenue recognition from product sales is measured at the amount that is highly probable that a significant reversal in the amount of cumulative revenue recognized will not occur. Revenue is reduced for estimated rebates and other similar allowances.
Trade receivable is recognized when the Company is entitled for unconditional right to receive payment upon delivery of goods to customers. The consideration received in advance from the customer but without delivery of goods is recognized as a contract liability, for which revenue is recognized when the control over the goods is transferred to the customer.
The Company expects that the length of time when the Company transfers the goods or services to the customer and when the customer pays for those goods or services will be less than one year. Therefore, the amount of consideration is not adjusted for the time value of money.
(o) Employee Benefits
| 1. | Short-term employee benefits |
Short-term employee benefits are expensed unless another policy allows or requires it to be capitalized. Liabilities recognized in respect of short-term employee benefits are measured at the undiscounted amount of the benefits expected to be paid in exchange for service rendered by employees.
| 2. | Share-based payment arrangements |
The cost of employee services received in exchange for share-based compensation is measured based on the grant-date fair value of the share-based instruments issued. The cost of employee services is equal to the grant-date fair value of shares issued to employees and is recognized in earnings with a corresponding increase in equity over the service period by graded vesting. Compensation cost also considers the number of awards management believes will eventually vest. As a result, compensation cost is reduced by the estimated forfeitures. The estimate is adjusted each period to reflect the current estimate of forfeitures, and finally, the actual number of awards that vest.
| 3. | Defined contribution plans |
Obligations for contributions to defined contribution pension plans are recognized as an employee benefit expense in profit or loss in the periods during which services are rendered by employees.
| 4. | Defined benefit plans |
The Company’s net obligation in respect of defined benefit pension plans is calculated separately for each benefit plan by estimating the amount of future benefit that employees have earned in the current and prior periods, discounting that amount and deducting the fair value of any plan assets. For defined benefit retirement benefit plans, the cost of providing benefit is recognized based on actuarial calculations. Defined benefit costs (including service cost, net interest and remeasurement) under the defined benefit retirement benefit plans are determined using the Projected Unit Credit Method. Service cost (including current service cost), and net interest on the net defined benefit liability (asset) are recognized as employee benefits expense in profit or loss in the period they occur. Remeasurement, comprising actuarial gains and losses and the return on plan assets (excluding interest), is recognized in other comprehensive income in the period in which they occur. Remeasurement recognized in other comprehensive income is reflected immediately in retained earnings and will not be reclassified to profit or loss.
(p) Income Taxes
Income tax expense comprises current and deferred taxes. It is recognized in profit or loss except to the extent that it relates to a business combination, or items recognized directly in equity or in other comprehensive income.
F-23
HIMAX TECHNOLOGIES, INC. AND SUBSIDIARIES
Notes to Consolidated Financial Statements (Continued)
For the years ended December 31, 2021, 2022 and 2023
The Company has adopted International Tax Reform – Pillar Two Model Rules (Amendments to IAS 12) upon their release on May 23, 2023. The amendments provide a temporary mandatory exception from deferred tax accounting for the top-up tax, which is effective immediately, and require new disclosures about the Pillar Two exposure.
The mandatory exception applies retrospectively. However, because no new legislation to implement the top-up tax was enacted or substantially enacted on December 31, 2022 in any jurisdiction in which the Company operates and no related deferred tax was recognized at that date, the retrospective application has no impact on the Company’s consolidated financial statements.
The Company has applied a temporary mandatory relief from deferred tax accounting for the impacts of the top-up tax and accounts for it as a current tax when it is incurred. South Korea and Japan are the only two countries which represent jurisdictions where the Company maintains subsidiaries’ operations and have already enacted tax legislation on December 31, 2023. The Company has evaluated the current tax impact to be immaterial for the year ended 31 December 2023.
| 1. | Current tax |
Current taxes comprise the expected tax payable or receivable on the taxable income or losses for the year and any adjustments to tax payable or receivable in respect of previous years. It is measured using tax rates enacted or substantively enacted tax rate at the reporting date.
| 2. | Deferred tax |
Deferred tax assets and liabilities are recognized for the future tax consequences attributable to differences between the carrying amounts of existing assets and liabilities in the financial statements and their respective tax bases, and operating loss and tax credit carry-forwards. Deferred tax assets and liabilities are measured using enacted tax rates expected to apply to taxable income in the years in which those temporary differences are expected to be recovered or settled. The effect on deferred tax assets and liabilities of a change in tax rates is recognized in income in the period that includes the enactment date. Deferred tax assets are reviewed at each reporting date and are reduced to the extent that it is no longer probable that the related tax benefit will be realized; such reductions are reversed when the probability of future taxable profits improves.
(q) Business Combinations
Acquisitions of businesses are accounted for using the acquisition method. Acquisition-related costs are generally recognized in profit or loss as incurred. Goodwill is measured as the excess of the sum of the consideration transferred, the amount of any non-controlling interests in the acquiree, and the fair value of the acquirer’s previously held equity interest in the acquiree over the net of the acquisition-date amounts of the identifiable assets acquired and the liabilities assumed. Non-controlling interests are initially measured at the non-controlling interests’ proportionate share of the fair value of the acquiree’s identifiable net assets.
Any contingent consideration payable is measured at fair value at the acquisition date. If the contingent consideration is classified as equity, then it is not remeasured and settlement is accounted for within equity. Otherwise, subsequent changes in the fair value of contingent consideration are recognized in profit or loss.
When a business combination is achieved in stages, the Company’s previously held equity interest in the acquiree is remeasured to fair value at the acquisition date, and the resulting gain or loss is recognized in profit or loss.
F-24
HIMAX TECHNOLOGIES, INC. AND SUBSIDIARIES
Notes to Consolidated Financial Statements (Continued)
For the years ended December 31, 2021, 2022 and 2023
(r) Earnings Per Ordinary Share
Basic earnings per ordinary share is computed using profit or loss attributable to the shareholders and weighted average number of ordinary shares outstanding during the period. Diluted earnings per ordinary share is computed using the weighted average number of ordinary and diluted ordinary equivalent shares outstanding during the period. Ordinary equivalent shares are ordinary shares that are contingently issuable upon the vesting of unvested restricted share units (RSUs) and employee stock options granted to employees.
Basic and diluted earnings per ordinary share have been calculated as follows:
Year Ended December 31, | |||||||
| 2021 |
| 2022 |
| 2023 | ||
Profits attributable to Himax Technologies, Inc. stockholders (in thousands) | $ | | |
| | ||
Denominator for basic earnings per ordinary share: |
|
| |||||
Weighted average number of ordinary shares outstanding (in thousands) |
| | |
| | ||
Basic earnings per ordinary share attributable to Himax Technologies, Inc. stockholders | $ | | |
| | ||
Basic earnings per ADS attributable to Himax Technologies, Inc. stockholders(1) | $ | | |
| | ||
Contingently issuable ordinary shares underlying the unvested RSUs and employee stock options granted to employees are included in the calculation of diluted earnings per ordinary share based on treasury stock method.
Year Ended December 31, | |||||||
| 2021 |
| 2022 |
| 2023 | ||
| |||||||
Profits attributable to Himax Technologies, Inc. stockholders (in thousands) | $ | |
| | | ||
Denominator for diluted earnings per ordinary share: |
| ||||||
Weighted average number of ordinary shares outstanding (in thousands) | |
| | | |||
Unvested RSUs (in thousands) | |
| | | |||
Employee stock options (in thousands) | | | | ||||
|
| | | ||||
Diluted earnings per ordinary share attributable to Himax Technologies, Inc. stockholders | $ | |
| | | ||
Diluted earnings per ADS attributable to Himax Technologies, Inc. stockholders(1) | $ | |
| | | ||
Note (1): As the Company’s ordinary shares have been quoted on the NASDAQ Global Select Market under the symbol “HIMX” in the form of ADSs and two ordinary shares represent one ADS with effect from August 10, 2009. The number of ADS equivalent outstanding is determined by dividing the number of ordinary shares by two. Therefore, the weighted average number of ADS equivalent outstanding used in basic earnings per ADS for 2021, 2022 and 2023 is
(s) Segment Reporting
An operating segment is a component of the Company that engages in business activities from which it may earn revenues and incur expenses. All operating segments’ operating results are reviewed regularly by the Company’s chief operating decision maker (“CODM”) to make decisions about resources to be allocated to the segment and assess its performance, and for which discrete financial information is available.
F-25
HIMAX TECHNOLOGIES, INC. AND SUBSIDIARIES
Notes to Consolidated Financial Statements (Continued)
For the years ended December 31, 2021, 2022 and 2023
The Company’s CODM has been identified as the Chief Executive Officer, who regularly reviews operating results to make decisions about allocating resources and assessing performance for the Company. Management has determined that the Company has two operating segments: Driver IC and Non-driver products.
The CODM assesses the performance of the operating segments based on segment sales and segment profit and loss. There are no intersegment sales in the segment revenues reported to the CODM. Segment profit and loss is determined on a basis that is consistent with how the Company reports operating income (loss) in its consolidated statements of operations. Segment profit (loss) excludes income taxes and items in non-operating income (loss).
The Company does not report segment asset information to the Company’s CODM. Consequently, no asset information by segment is presented.
(t) Noncontrolling Interests
Noncontrolling interests are classified in the consolidated statements of profit or loss as part of profit (loss) for the period and the accumulated amount of noncontrolling interests as part of equity in the consolidated statements of financial position. If a change in ownership of a consolidated subsidiary results in loss of control and deconsolidation, any retained ownership interests are re-measured with the gain or loss reported in net earnings.
(u) Use of Judgments and Estimates
The preparation of the consolidated financial statements in conformity with IFRS requires management to make judgments, estimates and assumptions that affect the application of accounting policies and the reported amounts of assets, liabilities, income and expenses. Actual results may differ from these estimates.
Estimates and underlying assumptions are reviewed on an ongoing basis. Revisions to accounting estimates are recognized in the period in which the estimates are revised and in any future periods affected.
Information about critical judgments, estimates and assumptions in applying accounting policies that have the most significant effect on the amounts recognized in the consolidated financial statements is included in the following notes:
| 1. | Valuation of inventory |
Inventories are stated at the lower of cost or net realizable value, and the Company uses judgment and estimate to determine the net realizable value of inventory at the end of each reporting period.
Due to the rapid technological changes, the Company estimates the net realizable value of inventory for obsolescence and unmarketable items at the end of reporting period and then writes down the cost of inventories to net realizable value. The net realizable value of the inventory is mainly determined based on assumptions of future demand within a specific time horizon.
| 2. | Impairment of non-financial assets other than goodwill |
In the process of evaluating the potential impairment of non-financial assets other than goodwill, the Company is required to make subjective judgments in determining the independent cash flows, useful lives, expected future revenue and expenses related to the specific asset groups. Any changes in these estimates based on changed economic conditions or business strategies could result in significant impairment charges or reversal in future years.
F-26
HIMAX TECHNOLOGIES, INC. AND SUBSIDIARIES
Notes to Consolidated Financial Statements (Continued)
For the years ended December 31, 2021, 2022 and 2023
| 3. | Recognition of deferred tax assets |
Deferred tax assets are recognized to the extent that it is probable that future taxable profits will be available against which those deferred tax assets can be utilized. Assessment of the realization of the deferred tax assets requires the Company’s subjective judgment and estimate, including the future revenue growth and profitability, the sources of taxable income, the amount of tax credits that can be utilized and feasible tax planning strategies. Changes in the economic environment, the industry trends and relevant laws and regulations may result in adjustments to the deferred tax assets.
| 4. | Impairment of goodwill |
The assessment of impairment of goodwill requires the Company to make subjective judgment to determine the identified CGU, allocate the goodwill to relevant CGU and estimate the recoverable amount of relevant CGU. In the process of estimating the recoverable amount of relevant CGU, the Company is required to make subjective judgments in determining the discounted rate, the terminal growth rate, the independent cash flows, useful lives, expected future revenue and expenses related to the CGU.
Note 5. Consolidation
The Company holds
The Company’s previously held equity interests in Viewsil was re-measured at fair value, which was determined according to the amount of underlying equity in net assets of Viewsil at acquisition date. The re-measurement loss on the previously held equity interests in Viewsil was $
The results of Viewsil’s operations for 2023 have not been included in the Company’s consolidated financial statements since the acquisition date on December 30, 2023. If the consolidation had occurred on January 1, 2023, management estimates that consolidated revenue would have been $
F-27
HIMAX TECHNOLOGIES, INC. AND SUBSIDIARIES
Notes to Consolidated Financial Statements (Continued)
For the years ended December 31, 2021, 2022 and 2023
The following table summarizes the amounts of estimated fair value of the assets obtained and liabilities assumed at the date of consolidation.
| Fair value | ||
(in thousands) | |||
Recognized amounts of identifiable assets obtained and liabilities assumed: |
|
| |
Cash | $ | | |
Current assets, other than cash |
| | |
Other assets |
| | |
Other current liabilities |
| ( | |
Total identifiable net assets obtained |
| | |
Noncontrolling interests |
| ( | |
$ | | ||
Obtained assets were valued at estimates of their current fair values based on management’s estimate.
Note 6. Disposal of subsidiary
The Company had disposed its
The carrying amount of assets and liabilities of EMZA on the date of disposal was as follow:
| EMZA | ||
(in thousands) | |||
Cash | $ | | |
Current assets, other than cash |
| | |
Property, plant and equipment |
| | |
Other intangible assets |
| | |
Other non-current assets |
| | |
Other current and non-current liabilities |
| ( | |
Net assets disposed of | $ | | |
Note 7. Cash and Cash Equivalents
December 31, |
| December 31, | ||||
| 2022 |
| 2023 |
| ||
(in thousands) | ||||||
Cash, demand deposits and checking accounts | $ | | | |||
Time deposits with less than three months maturity date |
| | | |||
$ | | | ||||
Refer to Note 23 and Note 24 for the disclosure of credit risk, currency risk and sensitivity analysis of the financial assets and liabilities of the Company.
As of December 31, 2022 and 2023, no cash and cash equivalents were pledged with banks as collaterals.
F-28
HIMAX TECHNOLOGIES, INC. AND SUBSIDIARIES
Notes to Consolidated Financial Statements (Continued)
For the years ended December 31, 2021, 2022 and 2023
Note 8. Financial Assets at Amortized Cost
December 31, |
| December 31, | ||||
| 2022 |
| 2023 |
| ||
(in thousands) | ||||||
Time deposit with original maturities more than three months | $ | | | |||
The financial assets at amortized cost are in China Yuan (CNY) and US dollar denominated time deposits with original maturities of more than three months and the expected holding period as of December 31, 2022 and 2023 is due in one year or less.
As of December 31, 2022 and 2023, no financial assets at amortized cost were pledged with banks as collaterals.
Note 9. Financial Assets at Fair Value Through Profit or Loss
Following is a summary of financial assets at fair value through profit or loss as of December 31, 2022 and 2023:
December 31, |
| December 31, | ||||
| 2022 |
| 2023 |
| ||
(in thousands) | ||||||
Money market fund | $ | | | |||
Equity securities-unlisted company |
| | | |||
$ | | | ||||
Current | $ | | | |||
Non-current |
| | | |||
$ | | | ||||
Net gain (loss) of ($
As of December 31, 2022 and 2023, no financial assets at fair value through profit or loss were pledged with banks as collaterals.
Note 10. Financial Assets at Fair Value Through Other Comprehensive Income
The equity securities are held for long-term strategies and therefore are accounted for as FVTOCI. Capital reduction from equity security investments designated as at FVTOCI recognized for the years ended December 31, 2021, 2022 and 2023, were $
As of December 31, 2022 and 2023, no financial assets at fair value through other comprehensive income were pledged with banks as collaterals.
F-29
HIMAX TECHNOLOGIES, INC. AND SUBSIDIARIES
Notes to Consolidated Financial Statements (Continued)
For the years ended December 31, 2021, 2022 and 2023
Note 11. Accounts Receivable, net (including related parties)
December 31, |
| December 31, | |||
| 2022 |
| 2023 | ||
(in thousands) | |||||
Accounts receivable | $ | | | ||
Accounts receivable from related parties | | | |||
Less: Loss allowance |
| | | ||
$ | | | |||
As of December 31, 2022 and 2023, the Company measures the loss allowance for accounts receivable using the simplified approach under IFRS 9 with the lifetime expected credit losses. To measure the expected credit losses, accounts receivable have been grouped based on the days past due, as well as incorporated forward looking information, including relevant industry information. Analysis of expected credit losses which was measured based on the aforementioned method, was as follows:
December 31, 2022 | ||||||||
Loss | ||||||||
Carrying | allowance | |||||||
amount of | Weighted | for lifetime | ||||||
accounts | average loss | expected | ||||||
| receivable |
| rate |
| credit | |||
(in thousands) | (in thousands) | |||||||
Not past due | $ | | | % | $ | | ||
Past due within 30 days |
| | | % | | |||
Past due 31‑60 days |
| | % | | ||||
Past due 61‑90 days |
| | % | | ||||
Past due 91‑120 days |
| | % | | ||||
Past due over 121 days |
| | | % | | |||
$ | |
| $ | | ||||
December 31, 2023 | ||||||||
Loss | ||||||||
Carrying | allowance | |||||||
amount of | Weighted | for lifetime | ||||||
accounts | average loss | expected | ||||||
| receivable |
| rate |
| credit | |||
(in thousands) | (in thousands) | |||||||
Not past due | $ | | | % | $ | | ||
Past due within 30 days |
| | | % | | |||
Past due 31‑60 days |
| | | % | | |||
Past due 61‑90 days |
| | | % | | |||
Past due 91‑120 days |
| | | % | | |||
Past due over 121 days |
| | % | | ||||
$ | |
| $ | | ||||
There were no changes in loss allowance as of December 31, 2022 and 2023.
F-30
HIMAX TECHNOLOGIES, INC. AND SUBSIDIARIES
Notes to Consolidated Financial Statements (Continued)
For the years ended December 31, 2021, 2022 and 2023
The activity in the loss allowance is as follows:
Loss Allowance
Balance at | Amounts | ||||||||
Beginning | Charges to | utilized / | Balance at | ||||||
Period |
| of year |
| earnings |
| write-offs |
| end of year | |
| (in thousands) | ||||||||
Year 2021 | $ | |
| ( |
| |
| | |
Year 2022 | $ | |
| |
| |
| | |
Year 2023 | $ | | | | | ||||
Note 12. Inventories
| December 31, | December 31, | |||
2022 |
| 2023 | |||
(in thousands) | |||||
Finished goods | $ | | | ||
Work in process |
| | | ||
Raw materials |
| | | ||
Supplies |
| | | ||
$ | | | |||
The amounts of inventories that were charged to cost of revenues were $
As of December 31, 2022 and 2023, none of the Company’s inventories was pledged as collateral.
Note 13. Equity Method Investments
Associates consisted of the following:
December 31, 2022 | December 31, 2023 | |||||||||||||
Place of | ||||||||||||||
Incorporation | ||||||||||||||
Principal | and | Carrying | Holding | Carrying | Holding | |||||||||
Name of Associate |
| Activities |
| Operation |
| amount |
| % |
| amount |
| % | ||
(in thousands) | (in thousands) | |||||||||||||
Ganzin Technology Corp. |
|
| $ | — |
| | $ | — |
| | ||||
Iris Optronics Co., Ltd. |
|
|
| |
| |
| |
| | ||||
Viewsil Microelectronics (Kunshan) Limited |
|
|
| |
| |
| — |
| | ||||
Guangzhou Pixtalks Information Technology Co., Ltd. | | | | | ||||||||||
Prilit Optronics, Inc. | | | | | ||||||||||
|
|
|
| $ | |
|
| $ | |
|
| |||
Prilit Optronics, Inc. was purchased with original investment amount of $
F-31
HIMAX TECHNOLOGIES, INC. AND SUBSIDIARIES
Notes to Consolidated Financial Statements (Continued)
For the years ended December 31, 2021, 2022 and 2023
There is no individually significant associate for the Company. The following table summarized the amount recognized by the Company at its share of those associates:
For the year ended December 31, | |||||||
| 2021 | 2022 |
| 2023 | |||
(in thousands) | |||||||
The Company’s share of losses of associates | $ | ( | ( |
| ( | ||
The Company’s share of other comprehensive income of associates | $ | | ( |
| | ||
The Company’s share of total comprehensive income of associates | $ | ( | ( |
| ( | ||
The Company has not recognized losses of $
As of December 31, 2022 and 2023,
Note 14. Other Intangible Assets
| Technology |
| Software |
| Others |
| Total | ||
(in thousands) | |||||||||
Cost |
|
|
|
|
|
|
|
| |
Balance at January 1, 2022 | $ | |
| |
| |
| | |
Additions |
| |
| |
| |
| | |
Disposals |
| |
| ( |
| |
| ( | |
Disposal of subsidiary |
| ( |
| |
| ( |
| ( | |
Effect of exchange rate changes |
| |
| ( |
| ( |
| ( | |
Balance at December 31, 2022 |
| |
| |
| |
| | |
Additions |
| |
| |
| |
| | |
Consolidation through obtaining control of subsidiary | | | | | |||||
Effect of exchange rate changes |
| |
| ( |
| |
| ( | |
Balance at December 31, 2023 | $ | |
| |
| |
| | |
Accumulated Amortization |
|
|
|
|
|
|
|
| |
Balance at January 1, 2022 | $ | |
| |
| |
| | |
Amortization for the year |
| |
| |
| |
| | |
Disposals |
| |
| ( |
| |
| ( | |
Disposal of subsidiary |
| ( |
| |
| ( |
| ( | |
Effect of exchange rate changes |
| |
| ( |
| ( |
| ( | |
Balance at December 31, 2022 |
| |
| |
| |
| | |
Amortization for the year | | | | ||||||
Effect of exchange rate changes |
| |
| ( |
| |
| ( | |
Balance at December 31, 2023 | $ | |
| |
| |
| | |
Carrying amounts |
|
|
|
|
|
|
|
| |
At December 31, 2022 | $ | |
| |
| |
| | |
At December 31, 2023 | $ | |
| |
| |
| | |
Others in other intangible assets includes the acquired trademark $
F-32
HIMAX TECHNOLOGIES, INC. AND SUBSIDIARIES
Notes to Consolidated Financial Statements (Continued)
For the years ended December 31, 2021, 2022 and 2023
Other intangible assets were amortized on a straight-line basis over their estimated useful lives as follows:
Technology |
| years | |
Software |
| years | |
Others (except for trademark) |
| years |
Note 15. Property, Plant and Equipment
(a)
Prepayments | |||||||||||||||||
for purchase | |||||||||||||||||
Research | Office | of equipment | |||||||||||||||
Building | and | furniture | and | ||||||||||||||
and | development | and | construction | ||||||||||||||
| Land |
| improvements |
| Machinery |
| equipment |
| equipment |
| Others |
| in progress |
| Total | ||
(in thousands) | |||||||||||||||||
Cost |
|
|
|
|
|
|
|
|
|
|
|
|
|
|
|
| |
Balance at January 1, 2022 | $ | |
| |
| |
| |
| |
| |
| |
| | |
Additions | | | | | | | | | |||||||||
Transfers |
| |
| |
| |
| |
| |
| |
| ( |
| | |
Disposals |
| |
| ( |
| ( |
| ( |
| ( |
| ( |
| |
| ( | |
Disposal of subsidiary |
| |
| |
| |
| |
| ( |
| ( |
| |
| ( | |
Effect of exchange rate changes |
| |
| |
| |
| |
| ( |
| ( |
| |
| ( | |
Balance at December 31, 2022 | |
| |
| |
| | | | | | ||||||
Additions |
| |
| |
| |
| | | | | | |||||
Consolidation through obtaining control of subsidiary |
| |
| |
| |
| | | | | | |||||
Transfers |
| |
| |
| |
| | | |
| ( | | ||||
Reclassification to assets held for sale |
| ( |
| |
| |
| | | | | ( | |||||
Disposals | | | ( | ( | ( | ( | | ( | |||||||||
Effect of exchange rate changes |
| |
| |
| |
| | ( | ( | | ( | |||||
Balance at December 31, 2023 | $ | |
| |
| |
| | | | | | |||||
Accumulated Depreciation |
|
|
|
|
|
|
|
|
|
| |||||||
Balance at January 1, 2022 | $ | |
| |
| |
| |
| |
| |
| |
| | |
Depreciation for the year |
| |
| |
| |
| |
| |
| |
| |
| | |
Disposals |
| |
| ( |
| ( |
| ( |
| ( |
| ( |
| |
| ( | |
Disposal of subsidiary |
| |
| |
| |
| |
| ( |
| ( |
| |
| ( | |
Effect of exchange rate changes | |
| |
| |
| |
| ( |
| ( |
| |
| ( | ||
Balance at December 31, 2022 |
| |
| |
| |
| |
| |
| |
| |
| | |
Depreciation for the year |
| |
| |
| |
| |
| |
| |
| |
| | |
Disposals | | | ( | ( | ( | ( | | ( | |||||||||
Effect of exchange rate changes |
| |
| |
| |
| |
| ( |
| ( |
| |
| ( | |
Balance at December 31, 2023 | $ | |
| |
| |
| |
| |
| |
| |
| | |
Carrying amounts |
|
|
|
|
|
|
|
|
|
|
|
|
|
|
|
| |
At December 31, 2022 | $ | |
| |
| |
| |
| |
| |
| |
| | |
At December 31, 2023 | $ | |
| |
| |
| |
| |
| |
| |
| | |
Others in property, plant and equipment includes mold equipment, leasehold improvements, right-of-use assets and other equipment.
F-33
HIMAX TECHNOLOGIES, INC. AND SUBSIDIARIES
Notes to Consolidated Financial Statements (Continued)
For the years ended December 31, 2021, 2022 and 2023
As of December 31, 2023, a piece of land $
The Company incurred non-cash capital expenditures of $
The above items of property, plant and equipment are depreciated on a straight-line basis over their estimated useful lives as follows:
Buildings |
| |
Building improvements |
| |
Machinery |
| |
Research and development equipment |
| |
Office furniture and equipment |
| |
Others |
|
For the years ended December 31, 2021, 2022 and 2023, the Company did not recognize any impairment loss on property, plant and equipment.
Information on property, plant and equipment that were pledged to bank as collateral is provided in Note 27.
(b) Lease Arrangements
(i) Right-of-use assets
Addition to right-of-use assets during 2022 and 2023 were $
(ii) Lease liabilities
| December 31, |
| December 31, | ||
2022 | 2023 | ||||
| (in thousands) | ||||
Current portion (classified under other current liabilities) | $ | | | ||
Non-current portion (classified under other non-current liabilities) |
| | | ||
$ | | | |||
(iii) Additional lease information
Year ended December 31, | |||||||
| 2021 |
| 2022 | 2023 | |||
(in thousands) | |||||||
Expenses relating to short-term leases | $ | | | | |||
Expenses relating to low-value asset leases | $ | | | | |||
Expenses relating to variable lease payments not included in the measurement of lease liabilities | $ | | | | |||
F-34
HIMAX TECHNOLOGIES, INC. AND SUBSIDIARIES
Notes to Consolidated Financial Statements (Continued)
For the years ended December 31, 2021, 2022 and 2023
The reconciliation of lease liabilities to cash flows arising from financing activities was as follows:
| Year ended December 31, | ||||
2022 |
| 2023 | |||
| (in thousands) | ||||
Balance at beginning of year | $ | | | ||
Change from financing activities: |
|
|
| ||
Payment of lease liabilities |
| ( | ( | ||
Total change from financing activities |
| ( | ( | ||
Other changes: |
|
|
| ||
New lease |
| | | ||
Interest expense |
| | | ||
Interest paid |
| ( | ( | ||
Lease modifications | ( | ( | |||
Disposal of subsidiary | ( | — | |||
Effect of exchange rate changes |
| ( | | ||
Total liability-related other changes |
| | | ||
Balance at end of year | $ | | | ||
Note 16. Other Current Liabilities
| December 31, |
| December 31, | ||
2022 | 2023 | ||||
(in thousands) | |||||
Accrued payroll and related expenses | $ | |
| | |
Guarantee deposit received | | | |||
Accrued mask, mold fees and other expenses for RD |
| |
| | |
Received in advance from disposal of land |
| — |
| | |
Accrued software maintenance |
| |
| | |
Lease liabilities |
| |
| | |
Payable for purchases of building and equipment | | | |||
Provision on onerous inventory contract | | | |||
Allowance for sales discounts | | | |||
Accrued insurance, welfare expenses, professional fee and others |
| |
| | |
$ | |
| | ||
The activity in the sales discounts is as follows:
Allowance for sales discounts
Balance at | Balance at | ||||||||
beginning | Charges to | Amounts | end of | ||||||
Period |
| of year |
| earnings |
| utilized |
| year | |
| (in thousands) | ||||||||
Year 2021 | $ | | | ( | | ||||
Year 2022 | $ | |
| |
| ( |
| | |
Year 2023 | $ | |
| | ( |
| | ||
F-35
HIMAX TECHNOLOGIES, INC. AND SUBSIDIARIES
Notes to Consolidated Financial Statements (Continued)
For the years ended December 31, 2021, 2022 and 2023
Note 17. Short-Term Borrowings
| December 31, |
| December 31, |
| ||
2022 | 2023 |
| ||||
(in thousands) |
| |||||
Secured borrowings | $ | |
| | ||
Unused credit lines | $ | |
| | ||
Interest rate-secured borrowings |
| % | % | |||
As of December 31, 2022 and 2023, cash and time deposits totaling $
As of December 31, 2023, unused credit lines will expire between February 2024 and October 2024. Among the unused credit lines, $
The reconciliation of borrowings to cash flows arising from financing activities was as follows:
| Unsecured |
| Secured | ||
borrowings | borrowings | ||||
(in thousands) | |||||
January 1, 2022 | $ | | | ||
Change from financing activities: | |||||
Proceeds from borrowings | | | |||
Repayments of borrowings | | ( | |||
Total changes from financing activities | | | |||
December 31,2022 | | | |||
Change from financing activities: | |||||
Proceeds from borrowings | | | |||
Repayments of borrowings | ( | ( | |||
Total changes from financing activities | | | |||
December 31,2023 | $ | |
| | |
Note 18. Long-Term Borrowings
| December 31, | December 31, | ||||
| 2022 |
| 2023 | |||
| (in thousands) | |||||
Unsecured borrowings |
| $ | | | ||
Less: current portion |
| ( | ( | |||
Total |
| $ | | | ||
Unused long-term credit lines |
| $ | | | ||
Interest rate |
| |||||
Duration | 2020/8/4~ | 2020/8/4~ | ||||
The Company entered into unsecured borrowings with Chang Hwa Bank, in the amount of $
F-36
HIMAX TECHNOLOGIES, INC. AND SUBSIDIARIES
Notes to Consolidated Financial Statements (Continued)
For the years ended December 31, 2021, 2022 and 2023
As of December 31, 2022 and 2023, for enhancing the guaranty, land and building and improvements totaling $
The reconciliation of borrowings to cash flows arising from financing activities was as follows:
Year ended December 31, | |||||
| 2022 |
| 2023 | ||
(in thousands) | |||||
Balance at beginning of year | $ | | | ||
Change from financing activities: | |||||
Proceeds from borrowings |
| | — | ||
Repayments of borrowings |
| ( | ( | ||
Total changes from financing activities |
| ( | ( | ||
Balance at end of year | $ | | | ||
Note 19. Employee benefits
| 1. | Defined benefit plans |
Pursuant to the ROC Labor Standards Law, the Company has established a defined benefit pension plan covering full-time employees in the ROC that provides retirement benefits to retiring employees based on years of service and the average salary for the six-month period before the employee’s retirement.
Reconciliations of defined benefit obligation at present value and plan asset at fair value are as follows:
| December 31, |
| December 31, | ||
2022 | 2023 | ||||
(in thousands) | |||||
Present value of the defined benefit obligations | $ | | | ||
Fair value of plan assets |
| ( |
| ( | |
Prepaid pension costs | $ | ( |
| ( | |
(i) Plan assets
The Fund is administered by a pension fund monitoring committee (the “Committee”) and is deposited in the Committee’s name in the Bank of Taiwan. Under the ROC Labor Standards Law, the minimum return on the plan assets should not be lower than the average interest rate on two-year time deposits published by the local banks. As of December 31, 2023, the Funds deposited in the Committee’s name in the Bank of Taiwan amounted to $
F-37
HIMAX TECHNOLOGIES, INC. AND SUBSIDIARIES
Notes to Consolidated Financial Statements (Continued)
For the years ended December 31, 2021, 2022 and 2023
(ii) Movements in present value of the defined benefit obligations
Year ended December 31, | |||||
| 2022 |
| 2023 | ||
(in thousands) | |||||
Balance at beginning of year | $ | |
| | |
Service costs |
| |
| | |
Interest expense |
| |
| | |
Remeasurements loss (gain): |
|
|
|
| |
Actuarial loss (gain) arising from: |
|
| |||
-Changes in demographic assumptions |
| |
| — | |
-Experience adjustment |
| |
| ( | |
-Change in financial assumptions |
| ( |
| | |
Effect of changes in exchange rates |
| ( |
| ( | |
Balance at end of year | $ | |
| | |
(iii) Movements in the fair value of plan assets
Year ended December 31, | |||||
| 2022 |
| 2023 | ||
(in thousands) | |||||
Balance at beginning of year | $ | |
| | |
Interest income |
| ||||
Remeasurements gain: |
| ||||
-Return on plan assets excluding interest income |
| |
| | |
Actual benefits paid |
| — |
| ( | |
Effect of changes in exchange rate |
| ( |
| | |
Balance at end of year | $ | |
| | |
(iv) Expenses recognized in profit or loss
Year ended December 31, | |||||||
| 2021 | 2022 |
| 2023 | |||
(in thousands) | |||||||
Current service costs | $ | — | |
| | ||
Interest income | ( | ( |
| ( | |||
$ | ( | — |
| ( | |||
Cost of revenues | $ | | |
| — | ||
Research and development | ( | ( |
| ( | |||
General and administrative | — | — |
| — | |||
Sales and marketing | — | — |
| — | |||
$ | ( | — |
| ( | |||
(v) Remeasurement of net defined benefit liability recognized in other comprehensive income
Year ended December 31, | |||||
| 2022 |
| 2023 | ||
(in thousands) | |||||
Balance at beginning of year | $ | ( |
| ( | |
Recognized during the period |
| ( |
| ( | |
Balance at end of year | $ | ( |
| ( | |
F-38
HIMAX TECHNOLOGIES, INC. AND SUBSIDIARIES
Notes to Consolidated Financial Statements (Continued)
For the years ended December 31, 2021, 2022 and 2023
(vi) Actuarial assumptions
The principal actuarial assumptions were as follows:
| December 31, |
| December 31, |
| |
2022 | 2023 |
| |||
Discount rate |
| ||||
Rate of increase in compensation levels |
|
The Company expects to make contribution of
As at December 31, 2023, the weighted average duration of the defined benefits obligation was between 15 years to 16 years.
(vii) Sensitivity analysis
Reasonably possible changes at December 31, 2022 and 2023 to one of the relevant actuarial assumptions, holding other assumptions constant, would have affected the defined benefit obligation by the amounts shown below.
December 31, 2022 | December 31, 2023 | |||||||
| + 0.5% |
| - 0.5% |
| + 0.5% |
| ‑0.5% | |
(in thousands) | ||||||||
Discount rate |
| ( |
| |
| ( |
| |
Rate of increase in compensation levels |
| |
| ( |
| |
| ( |
| 2. | Defined contribution plans |
Beginning July 1, 2005, pursuant to the newly effective ROC Labor Pension Act, the Company is required to make a monthly contribution for full-time employees in the ROC that elected to participate in the Defined Contribution Plan at a rate no less than
The Company established a defined contribution plan in the United States that qualifies under Section 401(k) of the Internal Revenue Code. This plan covers substantially all employees who meet the service requirement. The Company’s contribution to the plan may be made at the discretion of the board of directors. Expenses recognized in 2021, 2022 and 2023, based on the contribution called for were
All PRC employees participate in employee social security plans, including pension and other welfare benefits, which are organized and administered by governmental authorities. The Company has no other substantial commitments to employees. The premiums and welfare benefit contributions that should be borne by the Company are calculated in accordance with relevant PRC regulations, and are paid to the labor and social welfare authorities. Expenses recognized based on this plan were $
Other foreign subsidiaries recognized pension expenses of $
F-39
HIMAX TECHNOLOGIES, INC. AND SUBSIDIARIES
Notes to Consolidated Financial Statements (Continued)
For the years ended December 31, 2021, 2022 and 2023
| 3. | Cash award |
On September 28, 2021 and 2022, and September 26, 2023, the Company’s compensation committee granted annual bonuses by cash payouts totaling $
The amounts of cash award expenses included in applicable costs of revenues and expense categories and related tax effects are summarized as follows:
Year ended December 31, | |||||||
| 2021 |
| 2022 |
| 2023 | ||
(in thousands) | |||||||
Cost of revenues | $ | | | | |||
Research and development | | | | ||||
General and administrative | | | | ||||
Sales and marketing | | | | ||||
Total compensation | $ | | | | |||
Income tax benefit | $ | | | | |||
Note 20. Share-Based Compensation
The amounts of share-based compensation expenses included in applicable costs of revenues and expense categories and related tax effects are summarized as follows:
Year ended December 31, | |||||||
| 2021 | 2022 |
| 2023 | |||
(in thousands) | |||||||
Cost of revenues | $ | |
| |
| | |
Research and development | |
| |
| | ||
General and administrative | |
| |
| | ||
Sales and marketing | |
| |
| | ||
Total compensation | $ | |
| |
| | |
Income tax benefit | $ | |
| |
| | |
| (a) | Long-term Incentive Plan |
| (i) | Restricted share Units (RSUs) |
On September 7, 2011, the Company’s shareholders approved a long-term incentive plan. The amended and restated plan was amended and restated by extending its duration to September 6, 2025, which was approved by the Company’s shareholders at the annual general meeting held on August 16, 2022. The plan permits the grants of options or RSUs to the Company’s employees, directors and service providers where each unit of RSU represents two ordinary shares of the Company.
On September 26, 2018, the Company’s compensation committee made grants of
F-40
HIMAX TECHNOLOGIES, INC. AND SUBSIDIARIES
Notes to Consolidated Financial Statements (Continued)
For the years ended December 31, 2021, 2022 and 2023
On September 28, 2020, the Company’s compensation committee made grants of
On September 28, 2021, the Company’s compensation committee made grants of
On September 28, 2022, the Company’s compensation committee made grants of
On September 26, 2023, the Company’s compensation committee made grants of
On November 9, 2022, the Company’s compensation committee made the unvested RSUs generally include forfeitable dividend-equivalent rights, which entitle holders of RSUs to the same dividend value per share as holders of common stock. The dividend-equivalent rights are subject to the same vesting and other terms and conditions as the underlying RSUs.
The amount of compensation expense from the long-term incentive plan was determined based on the estimated fair value and the market price of ADS (one ADS represents two ordinary shares) underlying the RSUs granted on the date of grant, which were $
F-41
HIMAX TECHNOLOGIES, INC. AND SUBSIDIARIES
Notes to Consolidated Financial Statements (Continued)
For the years ended December 31, 2021, 2022 and 2023
RSUs activity under the long-term incentive plan during the periods indicated is as follows:
| Number of |
| Weighted | ||
Underlying | Average Grant | ||||
| Shares for RSUs |
| Date Fair Value | ||
Balance at January 1, 2021 |
| | $ | | |
Granted | | | |||
Vested | ( | | |||
Forfeited | ( | | |||
Balance at December 31, 2021 |
| |
| | |
Granted |
| |
| | |
Vested |
| ( |
| | |
Forfeited |
| ( |
| | |
Balance at December 31, 2022 |
| |
| | |
Granted | | | |||
Vested | ( | | |||
Forfeited | ( | | |||
Balance at December 31, 2023 | | | |||
As of December 31, 2023, the total compensation cost related to the unvested RSUs not yet recognized was $
In 2021, 2022 and 2023, the Company settled RSUs release with shares buyback of
The allocation of compensation expenses and related tax effects from the RSUs granted to employees under the long-term incentive plan are summarized as follows:
Year ended December 31, | |||||||
| 2021 | 2022 |
| 2023 | |||
(in thousands) | |||||||
Cost of revenues | $ | |
| |
| | |
Research and development | |
| |
| | ||
General and administrative | |
| |
| | ||
Sales and marketing | |
| |
| | ||
Total compensation | $ | |
| |
| | |
Income tax benefit | $ | |
| |
| | |
| (ii) | Employee stock options |
On September 23, 2019, the Company’s compensation committee approved a plan to grant stock options, the 2019 plan, to certain employees. The 2019 plan authorizes grants to purchase up to
F-42
HIMAX TECHNOLOGIES, INC. AND SUBSIDIARIES
Notes to Consolidated Financial Statements (Continued)
For the years ended December 31, 2021, 2022 and 2023
The 2019 plan has
During 2020,
The calculated value of each option award is estimated on the date of grant using the Black-Scholes option-pricing model that used the weighted average assumptions in the following table. The Company uses the simplified method to estimate the expected term of the options as it does not have sufficient historical share option exercise experience and the exercise data relating to employees of other companies is not easily obtainable. The risk-free rates for the expected term of the options are based on the interest rates of
| 2019 plan |
| |
Valuation assumptions: |
|
| |
Expected dividend yield |
| | % |
Expected volatility |
| % | |
Expected term (years) |
| ||
Risk-free interest rate |
| % |
Stock option activity during the periods indicated is as follows:
Weighted | |||||||
Weighted | average | ||||||
average | remaining | ||||||
Number | exercise | contractual | |||||
| of Units |
| price |
| term | ||
Balance at January 1, 2021 |
| | $ | |
| ||
Exercised | ( | | |||||
Expired | ( | | |||||
Balance at December 31, 2021 | — | — | |||||
Exercisable at December 31, 2021 |
| — | — | ||||
| (b) | Employee stock options |
| (i) | On March 19, 2021, board of directors of CM Visual Technology Corp. approved a plan to grant stock options, the 2021 plan, to certain employees. This plan authorizes grants to purchase up to |
The 2021 plan has
F-43
HIMAX TECHNOLOGIES, INC. AND SUBSIDIARIES
Notes to Consolidated Financial Statements (Continued)
For the years ended December 31, 2021, 2022 and 2023
The calculated value of each option award is estimated on the date of grant using the Black-Scholes option-pricing model that used the weighted average assumptions in the following table. CM Visual Technology Corp. uses the simplified method to estimate the expected term of the options as it does not have sufficient historical share option exercise experience and the exercise data relating to employees of other companies is not easily obtainable. Since CM Visual Technology Corp.’ shares are not publicly traded and its shares are rarely traded privately, expected volatility is computed based on the average historical volatility of similar entities with publicly traded shares. The risk-free rate for the expected term of the options is based on the interest rates of
| 2021 plan | |||
Granted in | Granted in | |||
2021 | 2023 | |||
Valuation assumptions: | ||||
Expected dividend yield |
|
| ||
Expected volatility |
|
| ||
Expected term (years) |
|
| ||
Risk-free interest rate |
|
| ||
Stock option activity during the periods indicated is as follows:
|
|
|
|
| Weighted | ||
|
| Weighted |
| average | |||
|
| average |
| remaining | |||
Number |
| exercise |
| contractual | |||
of shares |
| price |
| term | |||
Balance at January 1, 2021 |
| — | $ | — | |||
Granted |
| |
| |
|
| |
Exercised |
| — |
| — |
|
| |
Forfeited |
| ( |
| |
|
| |
Balance at December 31, 2021 |
| |
| |
| ||
Exercised | — | — | |||||
Forfeited | ( | | |||||
Balance at December 31, 2022 | | | |||||
Granted | | | |||||
Exercised | — | — | |||||
Effect of capital reduction | ( | | |||||
Forfeited | — | — | |||||
Balance at December 31, 2023 | | | |||||
Exercisable at December 31, 2023 |
| |
| |
| ||
(ii) | On June 28, 2021, board of directors of Liqxtal Technology Inc. approved a plan to grant stock options, the 2021 plan, to certain employees. This plan authorizes grants to purchase up to |
The 2021 plan has and half years contractual life and
F-44
HIMAX TECHNOLOGIES, INC. AND SUBSIDIARIES
Notes to Consolidated Financial Statements (Continued)
For the years ended December 31, 2021, 2022 and 2023
The calculated value of each option award is estimated on the date of grant using the Black-Scholes option-pricing model that used the weighted average assumptions in the following table. Liqxtal Technology Inc. uses the simplified method to estimate the expected term of the options as it does not have sufficient historical share option exercise experience and the exercise data relating to employees of other companies is not easily obtainable. Since Liqxtal Technology Inc.’ shares are not publicly traded and its shares are rarely traded privately, expected volatility is computed based on the average historical volatility of similar entities with publicly traded shares. The risk-free rate for the expected term of the options is based on the interest rates of
| 2021 plan | |
Valuation assumptions: | ||
Expected dividend yield |
| |
Expected volatility |
| |
Expected term (years) |
| |
Risk-free interest rate |
|
Stock option activity during the periods indicated is as follows:
|
|
|
|
| Weighted | ||
| Weighted |
| average | ||||
| average |
| remaining | ||||
| Number |
| exercise |
| contractual | ||
| of shares |
| price |
| term | ||
Balance at January 1, 2021 |
| — | $ | — |
|
| |
Granted |
| |
| |
|
| |
Exercised |
| — |
| — |
|
| |
Forfeited |
| ( |
| |
|
| |
Balance at December 31, 2021 |
| |
| |
| ||
Exercised | ( | | |||||
Forfeited | ( | | |||||
Balance at December 31, 2022 | — | — | — | ||||
Exercisable at December 31, 2022 |
| — |
| — |
| — | |
(iii) On January 28, 2022, board of directors of EMZA approved a plan to grant stock options, the 2022 Option Plan, to certain employees. This plan authorizes grants to purchase up to
All Options granted under this 2022 Option Plan shall vest over a
F-45
HIMAX TECHNOLOGIES, INC. AND SUBSIDIARIES
Notes to Consolidated Financial Statements (Continued)
For the years ended December 31, 2021, 2022 and 2023
The calculated value of each option award is estimated on the date of grant using the Black-Scholes option-pricing model that used the weighted average assumptions in the following table. EMZA uses the simplified method to estimate the expected term of the options as it does not have sufficient historical share option exercise experience and the exercise data relating to employees of other companies is not easily obtainable. Since EMZA’s shares are not publicly traded and its shares are rarely traded privately, expected volatility is computed based on the average historical volatility of similar entities with publicly traded shares. The risk-free rate for the expected term of the options is based on the interest rates of
| 2022 Option Plan |
| |
Valuation assumptions: |
| ||
Expected dividend yield |
| | % |
Expected volatility |
| | % |
Expected term (years) |
| ||
Risk-free interest rate |
| | % |
Stock option activity during the periods indicated is as follows:
|
|
| Weighted | ||||
Weighted | average | ||||||
average | remaining | ||||||
Number | exercise | contractual | |||||
of shares | price | term | |||||
Balance at January 1, 2022 |
| | $ | |
| ||
Granted |
| |
| |
| ||
Exercised |
| — |
| — |
| ||
Forfeited |
| ( |
| |
| ||
Cancelled |
| ( |
| |
| ||
Balance at December 31, 2022 |
| |
| |
| — | |
Exercisable at December 31, 2022 |
| — |
| — |
| — | |
F-46
HIMAX TECHNOLOGIES, INC. AND SUBSIDIARIES
Notes to Consolidated Financial Statements (Continued)
For the years ended December 31, 2021, 2022 and 2023
Note 21. Equity
| (a) | Ordinary Shares |
The Company’s authorized ordinary shares, with par value of $
The Company’s issued and fully paid ordinary shares, with par value of $
The Company’s ordinary shares have been quoted on the NASDAQ Global Select Market under the symbol “HIMX” in the form of ADSs and two ordinary shares represent one ADS with effect from August 10, 2009.
| (b) | Additional Paid-in Capital |
Balance of additional paid-in capital as of December 31, 2022 and 2023 were as follows:
| December 31, |
| December 31, | ||
2022 | 2023 | ||||
(in thousands) | |||||
From ordinary shares | $ | |
| | |
From treasury shares |
| |
| | |
From share-based compensation |
| |
| | |
From share of changes in equities of associates |
| |
| | |
$ | |
| | ||
F-47
HIMAX TECHNOLOGIES, INC. AND SUBSIDIARIES
Notes to Consolidated Financial Statements (Continued)
For the years ended December 31, 2021, 2022 and 2023
(c) | Earnings distribution |
As a holding company, the major asset of the Company is the
The accumulated legal and special reserve provided by Himax Taiwan as of December 31, 2022 and 2023 amounted to $
For the year ended December 31, 2023, the Company declared the cash dividend of $
| (d) | Accumulated other comprehensive income |
Changes in accumulated other comprehensive income, net of tax, are as follows:
|
| Unrealized |
| Defined |
| Accumulated | |||
Foreign | gains | benefit | other | ||||||
currency | (losses) on | pension | comprehensive | ||||||
translation | securities | plans | income | ||||||
(in thousands) | |||||||||
Beginning balance, January 1, 2021 | $ | | ( | | ( | ||||
Exchange differences arising on translation of foreign operations |
| ( | | | ( | ||||
Changes in fair value of financial assets |
| | ( | | ( | ||||
Remeasurement of defined benefit pension plans |
| | | | | ||||
Ending balance, December 31, 2021 |
| | ( | | ( | ||||
Exchange differences arising on translation of foreign operations |
| ( | | | ( | ||||
Changes in fair value of financial assets |
| | | | | ||||
Remeasurement of defined benefit pension plans |
| | | | | ||||
Ending balance, December 31, 2022 | ( |
| ( |
| |
| ( | ||
Exchange differences arising on translation of foreign operations | ( | | | ( | |||||
Changes in fair value of financial assets | | | | | |||||
Remeasurement of defined benefit pension plans | | | | | |||||
Ending balance, December 31, 2023 | $ | ( |
| ( |
| |
| ( | |
F-48
HIMAX TECHNOLOGIES, INC. AND SUBSIDIARIES
Notes to Consolidated Financial Statements (Continued)
For the years ended December 31, 2021, 2022 and 2023
(e) | Noncontrolling interest |
Year ended December 31, | ||||||||
| 2021 | 2022 |
| 2023 | ||||
(in thousands) | ||||||||
Balance at the beginning of year | $ | | |
| | |||
Equity attributable to non-controlling interests |
|
| ||||||
Loss for the year | ( |
| ( |
| ( | |||
Changes in fair value of financial assets | ( |
| |
| | |||
Remeasurement of defined benefit pension plans | |
| |
| | |||
Share-based compensation expenses | |
| |
| | |||
New shares issued by subsidiaries | — |
| |
| | |||
Acquired the controlling power from noncontrolling interest | — | | | |||||
Purchase of subsidiaries shares from noncontrolling interest | | | | |||||
Effect of Himax Media Solutions, Inc. merged into Himax Taiwan | — | ( | | |||||
Disposal of financial assets at fair value through other comprehensive income | — | ( | | |||||
Exchange differences arising on translation of foreign operations | — |
| |
| | |||
Declaration of cash dividends | ( |
| |
| | |||
Balance at the end of year | $ | | |
| | |||
Note 22. Income Taxes
The Company is incorporated in the Cayman Islands, a tax-free country; accordingly, pretax income generated by the group parent company is not subject to local income tax. Substantially all of the Company’s taxable income is derived from the operations in the ROC and, therefore, substantially all of the Company’s income tax expense attributable to income from continuing operations is incurred in the ROC. Other foreign subsidiary companies calculate income tax in accordance with local tax law and regulations.
According to the amendments to the ROC Statute for Industrial Innovation in July 2022, in addition to providing
F-49
HIMAX TECHNOLOGIES, INC. AND SUBSIDIARIES
Notes to Consolidated Financial Statements (Continued)
For the years ended December 31, 2021, 2022 and 2023
(a) | Income tax expense (benefit) recognized in profit or loss for the years ended December 31, 2021, 2022 and 2023 consists of the following: |
Year ended December 31, | |||||||
| 2021 | 2022 |
| 2023 | |||
(in thousands) | |||||||
Current tax expense |
|
|
|
| |||
Current period | $ | |
| |
| | |
Adjustment for prior periods | |
| ( |
| ( | ||
|
| |
| ( | |||
Deferred tax expense |
|
|
|
|
| ||
Origination and reversal of temporary differences | |
| ( |
| | ||
Investment tax credits and operating loss carryforward | |
| |
| ( | ||
|
| ( |
| ( | |||
Total income tax expense (benefit) | $ | |
| |
| ( | |
(b) | Income taxes expense (benefit) recognized directly in other comprehensive income for the years ended December 31, 2021, 2022 and 2023 consist of the following: |
Year ended December 31, | |||||||
| 2021 | 2022 |
| 2023 | |||
(in thousands) | |||||||
Items that will not be reclassified to profit or loss: |
|
| |||||
Remeasurements of defined benefit pension plans | $ | |
| |
| ( | |
(c) | Reconciliation of the expected income tax expense computed based on the ROC statutory income tax rate of |
Years ended December 31, | |||||||||||||||
2021 | 2022 | 2023 | |||||||||||||
| Rate | Amount |
| Rate |
| Amount |
| Rate | Amount | ||||||
(in thousands) | (in thousands) | (in thousands) | |||||||||||||
Profit before income taxes |
|
| $ | |
|
| $ | |
|
| $ | | |||
Income tax expense calculated at the statutory rate |
| | % | |
| | % | |
| | % | | |||
Tax on undistributed earnings |
| | % | |
| | % | |
| | % | | |||
Tax benefit resulting from setting aside legal reserve from prior year’s income | | ( | ( | % | ( | ( | % | ( | |||||||
Tax benefit resulting from actual investment from prior year’s undistributed earnings | | ( | ( | % | ( | | | ||||||||
Increase in tax credits |
| ( | % | ( |
| ( | % | ( |
| ( | % | ( | |||
Effect of change of unrecognized deductible temporary differences and tax losses carryforwards |
| | % | |
| | % | |
| | % | | |||
Net of non-taxable income and non-deductible expense |
| ( | % | ( |
| ( | % | ( |
| ( | % | ( | |||
Changes in unrecognized tax benefits |
| | % | |
| | % | |
| ( | % | ( | |||
Foreign tax rate differential |
| | % | |
| | % | |
| | % | | |||
Variance from audits, amendments and examinations of prior years’ income tax filings |
| | |
| ( | % | ( |
| ( | % | ( | ||||
Others |
| | |
| ( | % | ( |
| | % | | ||||
Income tax expense (benefit) |
| $ | |
| $ | |
| $ | ( | ||||||
Effective tax rate |
| | % |
|
| | % |
|
| ( | % |
| |||
F-50
HIMAX TECHNOLOGIES, INC. AND SUBSIDIARIES
Notes to Consolidated Financial Statements (Continued)
For the years ended December 31, 2021, 2022 and 2023
(d) | As of December 31, 2022 and 2023, the components of deferred tax assets and deferred tax liabilities were as follows: |
| December 31, |
| December 31, | ||
2022 | 2023 | ||||
(in thousands) | |||||
Deferred tax assets: |
|
|
|
|
|
Inventory | $ | |
| | |
Tax credit carryforwards |
| |
| | |
Accrued compensated absences |
| |
| | |
Allowance for sales discounts |
| |
| | |
Depreciation |
| |
| | |
Others |
| |
| | |
$ | |
| | ||
Deferred tax liabilities: |
|
| |||
Remeasurement of defined benefit plans | $ | ( |
| ( | |
Unrealized foreign exchange gain |
| ( |
| ( | |
Others | ( | ( | |||
$ | ( |
| ( | ||
As of December 31, 2023, the Company has not provided for income taxes on undistributed earnings of approximately $
(e) | Changes in deferred tax assets and liabilities were as follows: |
|
|
| Recognized |
|
|
| Recognized |
| |||||||
Recognized | in other | Recognized | in other | ||||||||||||
January 1, | in profit or | comprehensive | December | in profit or | comprehensive | December | |||||||||
2022 | loss | income | 31, 2022 | loss | income | 31, 2023 | |||||||||
(in thousands) | |||||||||||||||
Inventory | $ | |
| |
| |
| |
| ( |
| |
| | |
Tax credit carryforwards |
| |
| — |
| |
| — |
| |
| |
| | |
Operating loss carryforward |
| |
| ( |
| |
| — |
| — |
| |
| | |
Accrued compensated absences |
| |
| |
| |
| |
| |
| |
| | |
Allowance for sales discounts |
| |
| |
| |
| |
| |
| |
| | |
Depreciation |
| |
| |
| |
| |
| |
| |
| | |
Unrealized foreign exchange loss |
| ( |
| ( |
| |
| ( |
| |
| |
| ( | |
Remeasurement of defined benefit plans |
| ( |
| ( |
| ( |
| ( |
| ( |
| |
| ( | |
Acquired intangible assets |
| ( |
| |
| |
| — |
| — |
| |
| | |
Others |
| |
| |
| |
| |
| ( |
| |
| | |
Total | $ | |
| |
| ( |
| |
| |
| |
| | |
F-51
HIMAX TECHNOLOGIES, INC. AND SUBSIDIARIES
Notes to Consolidated Financial Statements (Continued)
For the years ended December 31, 2021, 2022 and 2023
(f) | Unrecognized Deferred Tax Assets |
Gross amount of deferred tax assets have not been recognized in respect of the following items.
| December 31, |
| December 31, | ||
2022 | 2023 | ||||
(in thousands) | |||||
Unused tax credits | $ | |
| | |
Unused operating loss carryforwards-statutory tax |
| |
| | |
Unused operating loss carryforwards-undistributed earnings tax |
| |
| | |
Others |
| |
| | |
$ | |
| | ||
As of December 31, 2023, the unused investment tax credits with its expiration year from 2024 to 2035 from US operations were $
Tax loss carryforwards is utilized in accordance with the relevant jurisdictional tax laws and regulations. Net losses from foreign subsidiaries are approved by tax authorities in respective jurisdiction to offset future taxable profits. Under ROC Income Tax Acts, the tax loss carryforward in the preceding ten years is available to be deducted from tax income for Taiwan operations. The statutory losses would be deducted for undistributed earnings tax and were not subject to expiration for Taiwan operations.
As of December 31, 2023, the expiration period for abovementioned unrecognized deferred tax assets of unused operating loss carryforwards for statutory tax were as follows:
|
| Unrecognized |
| |||||
Deductible amount | deferred tax assets | Expiration year | ||||||
(in thousands) | ||||||||
Taiwan operations | $ | | $ | |
| |||
| |
| |
| ||||
Hong Kong operations |
| |
| |
| |||
US operations |
| |
| |
| |||
$ | | |||||||
(g) | Assessments by the tax authorities |
The Company’s major taxing jurisdiction is Taiwan. All Taiwan subsidiaries’ income tax returns have been examined and assessed by the ROC tax authorities through 2021. The income tax returns of 2022 for all Taiwan subsidiaries are open to examination by the ROC tax authorities. Taiwanese entities are customarily examined by the tax authorities and it is possible that a future examination will result in a positive or negative adjustment to the Company’s unrecognized tax benefits within the next 12 months; however, management is unable to estimate a range of the tax benefits or detriment as of December 31, 2023.
F-52
HIMAX TECHNOLOGIES, INC. AND SUBSIDIARIES
Notes to Consolidated Financial Statements (Continued)
For the years ended December 31, 2021, 2022 and 2023
Note 23. Financial Instruments
(a) | Categories of financial instruments |
(i) | Financial assets |
| December 31, |
| December 31, | ||
2022 | 2023 | ||||
(in thousands) | |||||
Financial assets measured at fair value through profit or loss (including current and noncurrent) | $ | |
| | |
Financial assets measured at fair value through other comprehensive income | | | |||
Measured at amortized cost: |
|
|
|
| |
Cash and cash equivalents |
| |
| | |
Financial assets at amortized cost |
| |
| | |
Accounts receivable and other receivables (including related parties) |
| |
| | |
Restricted deposit (including current and noncurrent) |
| |
| | |
Refundable deposits (including current and noncurrent) |
| |
| | |
Subtotal |
| |
| | |
Total | $ | |
| | |
(ii) | Financial liabilities |
| December 31, |
| December 31, | ||
2022 | 2023 | ||||
(in thousands) | |||||
Measured at amortized cost: |
|
|
|
| |
Short-term secured borrowings | $ | |
| | |
Accounts payables and other payables (including related parties) |
| |
| | |
Long-term unsecured borrowings (including current portion) | | | |||
Lease liabilities (including current and noncurrent) | | | |||
Guarantee deposits |
| |
| | |
Total | $ | |
| | |
F-53
HIMAX TECHNOLOGIES, INC. AND SUBSIDIARIES
Notes to Consolidated Financial Statements (Continued)
For the years ended December 31, 2021, 2022 and 2023
(b) | Liquidity risk |
The following, except for payables (including related parties) that are repayable within a year, are the contractual maturities of financial liabilities, including estimated interest payments of unsecured borrowings, secured borrowings and lease liabilities.
| Contractual |
| Within 6 |
| 6‑12 |
|
|
| Over 5 | ||||
(in thousands) | cash flows | months | months | 1‑2 years | 2‑5 years | years | |||||||
December 31, 2022 |
|
|
|
|
|
|
|
|
|
|
|
| |
Non-derivative financial liabilities |
|
|
|
|
|
|
|
|
|
|
|
| |
Short-term secured borrowings | $ | | | | — | — | | ||||||
Long-term unsecured borrowings (including current portion) | |
| |
| |
| |
| |
| | ||
Lease liabilities |
| |
| |
| |
| |
| |
| | |
Guarantee deposits |
| |
| |
| |
| |
| |
| | |
$ | |
| |
| |
| |
| |
| | ||
December 31, 2023 |
|
|
|
|
|
|
|
|
|
|
|
| |
Non-derivative financial liabilities |
|
|
|
|
|
|
|
|
|
|
|
| |
Short-term secured borrowings | $ | | | | — | — | | ||||||
Long-term unsecured borrowings (including current portion) | |
| |
| |
| |
| |
| | ||
Lease liabilities |
| |
| |
| |
| |
| |
| | |
Guarantee deposits |
| |
| |
| |
| |
| — |
| | |
$ | |
| |
| |
| |
| |
| | ||
The Company does not expect the cash flows included in the maturity analysis to occur significantly earlier or at significantly different amounts.
(c) | Currency risk |
i. Exposure to foreign currency risk
The Company’s significant exposure to foreign currency risk was as follows:
(in thousands) | December 31, 2022 | December 31, 2023 | ||||||||||
| Foreign |
| Exchange |
| Functional |
| Foreign |
| Exchange |
| Functional | |
currency | rate | currency | currency | rate | currency | |||||||
Financial assets |
|
|
|
|
|
|
|
|
|
|
| |
Monetary items |
|
|
|
|
|
|
|
|
|
|
| |
NTD | |
| |
| |
| |
| |
| | |
CNY | |
| |
| |
| |
| |
| | |
JPY | | | | | | | ||||||
Financial liabilities |
|
|
|
|
|
|
|
|
|
|
| |
Monetary items |
|
|
|
|
|
|
|
|
|
|
| |
NTD | | | | | | | ||||||
JPY | |
| |
| |
| |
| |
| | |
ii. Sensitivity analysis
The Company’s exposure to foreign currency risk arises from the translation of the foreign currency exchange gains and losses on cash and cash equivalents, accounts receivable, other receivable, accounts payable, other payable and lease liabilities that are denominated in foreign currency.
F-54
HIMAX TECHNOLOGIES, INC. AND SUBSIDIARIES
Notes to Consolidated Financial Statements (Continued)
For the years ended December 31, 2021, 2022 and 2023
Depreciation or appreciation of the USD by
iii. Interest rate risk
The Company’s short-term secured borrowings and long-term unsecured borrowings carried floating interest rates and fixed interest rates. The Company’s exposure to changes in interest rates is mainly from floating-rate borrowings. Any change in interest rates will cause the effective interest rates of borrowings to change and thus cause the future cash flows to fluctuate over time.
The following sensitivity analysis is determined based on the exposure to interest rate risk. For floating-rate debts, the analysis assumes that the balances of outstanding debts at the end of the reporting period had been outstanding for the entire year.
For the Company’s floating-rate debts, assuming all other variables were remained constant, an increase or a decrease in the interest rate by
(d) | Fair value information |
i. Financial instruments not measured at fair value
The Company considers that the carrying amounts of financial assets and financial liabilities measured at amortized cost approximate their fair values.
ii. Financial instruments measured at fair value
(1) Fair value hierarchy
December 31, 2022 | |||||||||||
Carrying | Fair Value | ||||||||||
(in thousands) |
| Amount |
| Level 1 |
| Level 2 |
| Level 3 |
| Total | |
Financial assets measured at fair value through profit or loss |
|
|
|
|
|
|
|
|
|
| |
Equity securities-unlisted company | $ | |
| |
| |
| |
| | |
Subtotal |
| |
| |
| |
| |
| | |
Financial assets measured at fair value through other comprehensive income |
|
|
|
|
|
|
|
|
|
| |
Equity securities-unlisted company |
| |
| |
| |
| |
| | |
Total | $ | |
| |
| |
| |
| | |
F-55
HIMAX TECHNOLOGIES, INC. AND SUBSIDIARIES
Notes to Consolidated Financial Statements (Continued)
For the years ended December 31, 2021, 2022 and 2023
December 31, 2023 | |||||||||||
Carrying | Fair Value | ||||||||||
(in thousands) |
| Amount |
| Level 1 |
| Level 2 |
| Level 3 |
| Total | |
Financial assets measured at fair value through profit or loss |
|
|
| ||||||||
Money market fund | $ | | | — | — | | |||||
Equity securities-unlisted company | | — | — | | | ||||||
Subtotal | | | — | | | ||||||
Financial assets measured at fair value through other comprehensive income | |||||||||||
Equity securities-listed company | | | — | — | | ||||||
Equity securities-unlisted company | | — | — | | | ||||||
Total | $ | | | — | | | |||||
(2) Valuation techniques and assumptions used in fair value measurement
The fair value of financial instruments traded in active markets is determined with reference to quoted market prices.
The fair value of financial instruments is based on the valuation techniques. The fair value using valuation techniques refers to the current fair value of other financial instruments with similar conditions and characteristics, or using a discounted cash flow method, or other valuation techniques which include model calculating with observable market data at the reporting date.
The fair value of equity securities-unlisted company is determined by reference to market valuations for similar operating entities quoted in an active market based on the net assets value of investees. The significant unobservable input is primarily the liquidity discounts,
(3) Transfer between levels of the fair value hierarchy
There were no transfers between levels for the years ended December 31, 2022 and 2023.
F-56
HIMAX TECHNOLOGIES, INC. AND SUBSIDIARIES
Notes to Consolidated Financial Statements (Continued)
For the years ended December 31, 2021, 2022 and 2023
(4) Movement in financial assets included in Level 3 of fair value hierarchy
| Financial assets | ||||||
Financial assets | at fair value | ||||||
at fair value | through other | ||||||
through profit or | comprehensive | ||||||
(in thousands) |
| loss |
| income |
| Total | |
January 1, 2022 | $ | | | | |||
Addition | | — | | ||||
Disposal | — | ( | ( | ||||
Recognized in other comprehensive income | — | | | ||||
Recognized in profit or loss | | — | | ||||
December 31, 2022 | $ | | | | |||
Financial assets | |||||||
Financial assets | at fair value | ||||||
at fair value | through other | ||||||
| through profit or |
| comprehensive |
| |||
(in thousands) | loss | income | Total | ||||
January 1, 2023 | $ | |
| |
| | |
Addition |
| |
| |
| | |
Disposal |
| |
| ( |
| ( | |
Capital reduction of investment | ( | | ( | ||||
Recognized in other comprehensive income | | ( | ( | ||||
Recognized in profit or loss |
| |
| |
| | |
December 31, 2023 | $ | |
| |
| | |
Note 24. Financial Risk Management
(a) | Overview |
The Company is exposed to the following risks due to usage of financial instruments:
| (1) | Credit risk |
| (2) | Liquidity risk |
| (3) | Market risk |
Hereinafter discloses information about the Company’s exposure to variable risks, and the goals, policies and procedures of the Company’s risk measurement and risk management.
(b) | Risk management framework |
Management of related divisions are appointed to review, control, trace and monitor the strategic risks, financial risks and operational risks faced by the Company. Management reports to executive officers the progress of risk controls from time to time and, if necessary, report to the board of directors, depending on the extent of impact of risks.
(c) | Credit risk |
Credit risk is the risk of financial loss to the Company if a customer or counterparty to a financial instrument fails to meet its contractual obligations. The Company’s exposures to credit risk are primarily from cash and cash equivalents, financial assets at amortized cost and accounts receivable.
F-57
HIMAX TECHNOLOGIES, INC. AND SUBSIDIARIES
Notes to Consolidated Financial Statements (Continued)
For the years ended December 31, 2021, 2022 and 2023
The Company deposits its cash and cash equivalents with various reputable financial institutions. Financial assets at amortized cost are time deposits with original maturities of greater than three months. The Company has not experienced any material losses on deposits of the Company’s cash and cash equivalents and financial assets at amortized cost. Management performs periodic evaluations of the relative credit standing of these financial institutions and limits the amount of credit exposure with any one institution. Management believes that there is a limited concentration of credit risk in cash and cash equivalent and financial assets at amortized cost.
The Company derived substantially all of its revenues from sales of display drivers that are incorporated into TFT-LCD panels. The TFT-LCD panel industry is intensely competitive and is vulnerable to cyclical market conditions and subject to price fluctuations. Management continuously evaluates and controls the credit quality, credit limit and financial strength of its customers to ensure any overdue receivables are taken necessary procedures.
The Company depends on two customers for majority of its revenues. The Company’s sales to these two customers as a percentage of revenues are as follows:
Year Ended December 31, |
| ||||||
| 2021 | 2022 |
| 2023 |
| ||
Customer A and its affiliates |
| ||||||
Customer C |
| ||||||
The percentage of the Company’s accounts receivable accounted by customers, those representing more than 10% of total accounts receivable balance, is summarized as follows:
December 31, | December 31, |
| |||
| 2022 |
| 2023 |
| |
Customer A and its affiliates |
| ||||
Customer C |
|
Refer to Note 11 for aging analysis of accounts receivable and the movement in the loss allowance.
In addition, the Company has at times agreed to extend the payment terms for certain of its customers. Other customers have also requested extension of payment terms, and the Company may grant such requests for extension in the future. As a result, a default by any such customer, a prolonged delay in the payment of accounts receivable, or the extension of payment terms for the Company’s customers could adversely affect the Company’s cash flow, liquidity and operating results. Management performs ongoing credit evaluations of each customer and adjusts credit policy based upon payment history and the customer’s credit worthiness, as determined by the review of their current credit information.
(d) | Liquidity risk |
The objective of liquidity risk management is to ensure the Company has sufficient liquidity to fund its business requirements associated with existing operations over the next 12 months. The Company manages its liquidity risk by maintaining adequate working capital and unused credit facilities.
At December 31, 2023, the Company’s working capital together with existing unused credit facilities under its existing loan agreements will be sufficient to fulfill all of its contractual obligations. Therefore, management believes that there is no liquidity risk resulting from incapable of financing to fulfill the contractual obligations.
(e) | Market risk |
Market risk is the risk that changes in market prices, such as foreign exchange rates and interest rates, will affect the Company’s income or the value of its holdings of financial instruments. The objective of market risk management is to manage and control market risk exposures within acceptable parameters, while optimizing the return.
F-58
HIMAX TECHNOLOGIES, INC. AND SUBSIDIARIES
Notes to Consolidated Financial Statements (Continued)
For the years ended December 31, 2021, 2022 and 2023
| (1) | Currency risk |
The Company is exposed to currency risk on operating activities that are denominated in a currency other than the respective functional currency of the Company, the USD. The currencies used in these transactions are the NTD, CNY and JPY.
| (2) | Interest rate risk |
The Company is exposed to interest rate risk primarily related to its outstanding borrowings. The Company’s borrowings carried floating interest rates. To manage the interest rate risk, the Company periodically assesses the interest rates of bank loans and maintains good relationships with financial institutions to obtain lower financing costs. The Company also strengthens the management of working capital to reduce the dependence on bank loans as well as the risk arising from fluctuation of interest rates.
Note 25. Capital management
Through clear understanding and managing of significant changes in external environment, related industry characteristics, and corporate growth plan, the Company manages its capital structure in a manner to ensure it has sufficient financial resources to fund its working capital needs, capital expenditures, research and development activities, dividend payments and other business requirements associated with its existing operations over the next 12 months.
There were no changes in the Company’s approach to capital management during the year ended December 31,2023. Neither the Company nor its subsidiaries are subject to externally imposed capital managements.
December 31, | December 31, | ||||
| 2022 |
| 2023 | ||
(in thousands) | |||||
Total liabilities | $ | |
| | |
Less: cash and cash equivalents |
| |
| | |
$ | |
| | ||
Equity attributable to owners of Himax Technologies, Inc. | $ | |
| | |
Note 26. Related-party Transactions
| (a) | Name and relationship |
Name of related parties |
| Relationship |
Viewsil Microelectronics (Kunshan) Limited (Viewsil)(1) | Associates | |
Viewsil Technology Limited (VST)(1) | Associates | |
Ganzin Technology Corp. | Associates | |
Prilit Optronics, Inc.(2) | Associates | |
Iris Optronics Co., Ltd. | Associates | |
Guangzhou Pixtalks Information Technology Co., Ltd. | Associates | |
Cheng Mei Materials Technology Corporation (CMMT) | Other related parties | |
Ningbo Cheng Mei Materials Technology Co., Ltd. | Other related parties |
Note 1: Equity method investee of the Company, becoming as a subsidiary of the Company from December 30, 2023. VST is the subsidiary of Viewsil.
Note 2: It became equity method investee of the Company in October 2022.
F-59
HIMAX TECHNOLOGIES, INC. AND SUBSIDIARIES
Notes to Consolidated Financial Statements (Continued)
For the years ended December 31, 2021, 2022 and 2023
| (b) | Significant transactions with related parties |
(i) |
Year ended December 31, | |||||||
| 2021 |
| 2022 |
| 2023 | ||
| (in thousands) | ||||||
Sales of goods |
|
|
|
|
|
| |
Associates | $ | — | — | | |||
Other related parties | |
| |
| | ||
$ | |||||||
December 31, | |||||
| 2022 |
| 2023 | ||
| (in thousands) | ||||
Accounts receivable |
|
|
|
| |
Other related parties | $ | |
| | |
(ii) |
Year ended December 31, | |||||||
| 2021 |
| 2022 |
| 2023 | ||
(in thousands) | |||||||
Purchase of raw materials |
| ||||||
CMMT | $ | | | | |||
Other related parties |
| | — | — | |||
$ | | | | ||||
December 31, | |||||
| 2022 |
| 2023 | ||
(in thousands) | |||||
Accounts payable |
| ||||
CMMT | $ | | | ||
(iii) | The Company made an interest-free loan of $ |
F-60
HIMAX TECHNOLOGIES, INC. AND SUBSIDIARIES
Notes to Consolidated Financial Statements (Continued)
For the years ended December 31, 2021, 2022 and 2023
(iv) |
| Year ended December 31, | ||||||
| 2021 |
| 2022 |
| 2023 | ||
| (in thousands) | ||||||
Revenue from miscellaneous service | |||||||
Associates | $ | |
| |
| | |
Other related parties |
| |
| |
| — | |
$ | |
| |
| | ||
Technical service fee |
|
|
|
|
|
| |
Viewsil | $ | |
| |
| | |
Miscellaneous fee |
|
|
|
|
|
| |
CMMT | $ | |
| |
| | |
Associates |
| |
| — |
| — | |
$ | |
| |
| | ||
| December 31, | ||||
| 2022 |
| 2023 | ||
| (in thousands) | ||||
Other receivable | |||||
Associates | $ | |
| | |
Other related parties |
| — |
| | |
$ | |
| | ||
Other payable |
|
|
|
| |
Viewsil | $ | |
| — | |
Other related parties |
| |
| | |
$ | |
| | ||
| (c) | Compensation of key management personnel |
For the years ended December 31, 2021, 2022 and 2023, the aggregate cash compensation that the Company paid to the independent directors was $
The compensation to key management personnel for the years ended December 31, 2021, 2022 and 2023 were as follows:
Year ended December 31, | |||||||
| 2021 | 2022 |
| 2023 | |||
(in thousands) | |||||||
Short-term employee benefits | $ | |
| |
| | |
Post-employment benefits |
| |
| |
| | |
Share-based compensation |
| |
| |
| | |
$ | |
| |
| | ||
F-61
HIMAX TECHNOLOGIES, INC. AND SUBSIDIARIES
Notes to Consolidated Financial Statements (Continued)
For the years ended December 31, 2021, 2022 and 2023
Note 27. Pledged assets
December 31, | December 31, | ||||||
Pledged assets |
| Pledged to secure |
| 2022 |
| 2023 | |
(in thousands) | |||||||
Restricted cash and time deposit (1) | Short-term secured borrowings | $ | |
| | ||
Restricted time deposits (1) | For customs duties |
| |
| | ||
Land (2) | Long-term unsecured borrowings |
| |
| | ||
Building and improvements (2) | Long-term unsecured borrowings | | | ||||
$ | | | |||||
Note (1): The pledged assets are booked as restricted deposits and classified as current or noncurrent by its liquidity.
Note (2): Guarantee and collateral for long-term unsecured borrowings.
Note 28. Commitments and Contingencies
| (a) | As of December 31, 2022 and 2023, the Company had entered into several contracts for the acquisition of equipment and computer software. Total contract prices amounted to $ |
| (b) | As of December 31, 2023, amount of outstanding letters of credit for the purchase of machinery and equipment was $ |
| (c) | The Company from time to time is subject to claims regarding the proprietary use of certain technologies. Currently, management is not aware of any such claims that it believes could have a material adverse effect on the Company’s financial position or results of operations. |
| (d) | Since Himax Taiwan is not a listed company, it will depend on Himax Technologies, Inc. to meet its equity financing requirements in the future. Any capital contribution by Himax Technologies, Inc. to Himax Taiwan may require the approval of the relevant ROC authorities. The Company may not be able to obtain any such approval in the future in a timely manner, or at all. If Himax Taiwan is unable to receive the equity financing it requires, its ability to grow and fund its operations may be materially and adversely affected. |
| (e) | The Company has entered into several wafer fabrication or assembly and testing service arrangements or multi-year purchase agreements with suppliers. The Company may be obligated to make payments for purchase orders entered into pursuant to these arrangements. The Company’s purchase obligations also include agreements to purchase goods or services, primarily inventory, that are enforceable and legally binding on us and that specify all significant terms, including fixed or minimum quantities to be purchased, fixed or variable price provisions, and the approximate timing of the transaction. Among all these purchase agreements, the longest termination term shall expire in 2028. Purchase obligations exclude agreements that are cancelable without penalty. Contractual obligations resulting from above purchase orders and agreements with known amounts approximate $ |
F-62
HIMAX TECHNOLOGIES, INC. AND SUBSIDIARIES
Notes to Consolidated Financial Statements (Continued)
For the years ended December 31, 2021, 2022 and 2023
| (f) | The Company is involved in various claims arising in the ordinary course of business. In the opinion of management, the ultimate disposition of these matters will not have a material adverse effect on the Company’s consolidated financial position, results of operations, or liquidity. As of December 31, 2023, management is not aware of any pending litigation against the Company. |
Note 29. Segment, Product and Geographic Information
The Company has two operating segments: Driver IC and Non-driver Products. The Driver IC segment generally is engaged in the design, research, development and sale of displays driver for large-sized TFT-LCD panels, which are used in televisions and desktop monitors, and displays driver for small and medium-sized TFT-LCD panels, which are used in mobile handsets and consumer electronics products. The Non-driver segment primarily is engaged in the design, research, manufacturing and sale of non-driver products, such as timing controllers, 3D Sensing Solution, LCoS, CMOS Image Sensors and WLO.
Year Ended December 31, 2021 | ||||||||
Non-driver | Consolidated | |||||||
| Driver IC |
| products |
| Total | |||
(in thousands) | ||||||||
Segment revenues | $ | |
| |
| | ||
Segment operating income (loss) | $ | |
| ( |
| | ||
Non operating loss, net |
|
|
| ( | ||||
Consolidated profit before income taxes |
|
|
| $ | | |||
Significant noncash items: |
|
|
|
| ||||
Share-based compensation | $ | |
| |
| | ||
Depreciation and amortization | $ | |
| |
| | ||
Year Ended December 31, 2022 | ||||||||
Non-driver | Consolidated | |||||||
| Driver IC |
| products |
| Total | |||
(in thousands) | ||||||||
Segment revenues | $ | | | | ||||
Segment operating income (loss) | $ | | ( | | ||||
Non operating income, net |
| | ||||||
Consolidated profit before income taxes | $ | | ||||||
Significant noncash items: |
| |||||||
Share-based compensation | $ | |
| |
| | ||
Depreciation and amortization | $ | |
| |
| | ||
Year Ended December 31, 2023 | ||||||||
Non-driver | Consolidated | |||||||
| Driver IC |
| products |
| Total | |||
(in thousands) | ||||||||
Segment revenues | $ | | | | ||||
Segment operating income (loss) | $ | | ( | | ||||
Non operating income, net |
| | ||||||
Consolidated profit before income taxes | $ | | ||||||
Significant noncash items: | ||||||||
Share-based compensation | $ | |
| |
| | ||
Depreciation and amortization | $ | |
| |
| | ||
F-63
HIMAX TECHNOLOGIES, INC. AND SUBSIDIARIES
Notes to Consolidated Financial Statements (Continued)
For the years ended December 31, 2021, 2022 and 2023
The following tables summarize information pertaining to the segment revenues from customers in different geographic region (based on customer’s headquarter location):
For the year ended December 31, 2021 | |||||||
Non-driver | Consolidated | ||||||
| Driver IC |
| products |
| Total | ||
(in thousands) | |||||||
China | $ | |
| |
| | |
Taiwan |
| |
| |
| | |
Other Asia Pacific (Philippines, Korea and Japan) |
| |
| |
| | |
Europe and America |
| |
| |
| | |
$ | |
| |
| | ||
For the year ended December 31, 2022 | |||||||
Non-driver | Consolidated | ||||||
| Driver IC |
| products |
| Total | ||
(in thousands) | |||||||
China | $ | | | | |||
Taiwan |
| | | | |||
Other Asia Pacific (Philippines, Korea, Japan and Israel) |
| | | | |||
Europe and America | | | |||||
$ | | | | ||||
For the year ended December 31, 2023 | |||||||
Non-driver | Consolidated | ||||||
| Driver IC | products | Total | ||||
(in thousands) | |||||||
China | $ | | | | |||
Taiwan |
| | | | |||
Other Asia Pacific (Philippines, Korea, Japan and Israel) |
| | | | |||
Europe and America | | | | ||||
$ | | | | ||||
The following tables summarize information pertaining to the segment revenues from major product lines:
For the year ended December 31, 2021 | |||||||
Non-driver | Consolidated | ||||||
| Driver IC |
| products |
| Total | ||
(in thousands) | |||||||
Display drivers for large-sized applications | $ | |
| |
| | |
Display drivers for small and medium-sized applications |
| |
| |
| | |
Non-driver products |
| |
| |
| | |
$ | |
| |
| | ||
For the year ended December 31, 2022 | |||||||
Non-driver | Consolidated | ||||||
| Driver IC |
| products |
| Total | ||
(in thousands) | |||||||
Display drivers for large-sized applications | $ | |
| |
| | |
Display drivers for small and medium-sized applications |
| |
| |
| | |
Non-driver products |
| |
| |
| | |
$ | |
| |
| | ||
F-64
HIMAX TECHNOLOGIES, INC. AND SUBSIDIARIES
Notes to Consolidated Financial Statements (Continued)
For the years ended December 31, 2021, 2022 and 2023
For the year ended December 31, 2023 | |||||||
Non-driver | Consolidated | ||||||
| Driver IC |
| products |
| Total | ||
(in thousands) | |||||||
Display drivers for large-sized applications |
| $ | |
| |
| |
Display drivers for small and medium-sized applications |
| |
| |
| | |
Non-driver products |
| |
| |
| | |
$ | |
| |
| | ||
The carrying values of the Company’s property, plant and equipment are located in the following countries:
December 31, |
| December 31, | |||
| 2022 |
| 2023 | ||
(in thousands) | |||||
Taiwan | $ | | | ||
U.S. |
| | | ||
China |
| | | ||
Korea |
| | | ||
Japan |
| | | ||
$ | | | |||
Revenues from significant customers, those representing 10% or more of total revenue for the respective periods, are summarized as follows:
Year ended December 31, | |||||||
2021 |
| 2022 |
| 2023 | |||
(in thousands) | |||||||
Driver IC segment: |
|
|
|
| |||
Customer A and its affiliates | $ | | | | |||
Customer C | | | | ||||
$ | | | | ||||
Non-driver products segment: | |||||||
Customer A and its affiliates | $ | | | | |||
Customer C | | | | ||||
$ | | | | ||||
Accounts receivable from significant customers, those representing 10% or more of total accounts receivable for the respective dates, is summarized as follows:
December 31, |
| December 31, | |||
| 2022 |
| 2023 | ||
(in thousands) | |||||
Customer A and its affiliates | $ | | | ||
Customer C | | | |||
$ | | | |||
The Company has recognized the following contract liabilities in relation to revenue from contracts with customers:
| December 31, |
| December 31, | ||
2022 | 2023 | ||||
| (in thousands) | ||||
Contract liabilities-current | $ | | | ||
F-65
HIMAX TECHNOLOGIES, INC. AND SUBSIDIARIES
Notes to Consolidated Financial Statements (Continued)
For the years ended December 31, 2021, 2022 and 2023
Revenue recognized in the current reporting period amounted to $
All of the service contracts are for periods of one year or less. As permitted under IFRS 15, the transaction price allocated to these unsatisfied contracts is not disclosed. As of December 31, 2023, the Company did not recognize an asset in relation to costs to fulfill a service contract.
Note 30. The Nature of Expenses
| (a) | Depreciation of property, plant and equipment |
Year ended December 31, | |||||||
| 2021 |
| 2022 |
| 2023 | ||
(in thousands) | |||||||
Recognized in cost of revenues | $ | | | | |||
Recognized in operating expenses | | | | ||||
$ | | | | ||||
| (b) | Amortization of intangible assets |
Year ended December 31, | |||||||
| 2021 |
| 2022 |
| 2023 | ||
(in thousands) | |||||||
Recognized in cost of revenues | $ | | | | |||
Recognized in operating expenses | | | | ||||
$ | | | | ||||
| (c) | Employee benefits expense |
Year ended December 31, | |||||||
| 2021 |
| 2022 |
| 2023 | ||
(in thousands) | |||||||
Salary | $ | | | | |||
Labor and health insurance | | | | ||||
Pension | | | | ||||
Others | | | | ||||
$ | | | | ||||
Employee benefits expense summarized by function | |||||||
Recognized in cost of revenues | $ | | | | |||
Recognized in operating expenses | | | | ||||
$ | | | | ||||
F-66
HIMAX TECHNOLOGIES, INC. AND SUBSIDIARIES
Notes to Consolidated Financial Statements (Continued)
For the years ended December 31, 2021, 2022 and 2023
Note 31. Himax Technologies, Inc. (the Parent Company only)
As a holding company, dividends received from Himax Technologies, Inc.’s subsidiaries in Taiwan, if any, will be subjected to withholding tax under ROC law as well as statutory and other legal restrictions.
The condensed separate financial information of Himax Technologies, Inc. is presented as follows:
Condensed Statements of Financial Position
December 31, |
| December 31, | |||
| 2022 |
| 2023 | ||
(in thousands) | |||||
Cash | $ | | | ||
Financial asset at amortized cost |
| | | ||
Other current assets |
| | | ||
Financial asset at fair value through profit or loss |
| | | ||
Investments in subsidiaries and affiliates |
| | | ||
Total assets | $ | | | ||
Current liabilities | $ | | | ||
Current portion of long-term unsecured borrowings | | | |||
Short-term secured borrowings |
| | | ||
Debt borrowing from a subsidiary |
| | | ||
Long-term unsecured borrowings | | | |||
Total equity |
| | | ||
Total liabilities and equity | $ | | | ||
Himax Technologies, Inc. had no guarantees as of December 31, 2022 and 2023.
Condensed Statements of Profit or Loss
Year ended December 31, | ||||||||
2021 |
| 2022 | 2023 | |||||
(in thousands) | ||||||||
Revenues | $ | |
| | — | |||
Costs and expenses |
| | | | ||||
Operating loss |
| ( | ( | ( | ||||
Interest income |
| | | | ||||
Changes in fair value of financial assets at fair value through profit or loss |
| ( | | | ||||
Foreign currency exchange gains (losses), net |
| | ( | ( | ||||
Finance costs |
| ( | ( | ( | ||||
Loss on re-measurement of the pre-existing relationships in a business combination | | | ( | |||||
Share of profits of subsidiaries and affiliates |
| | | | ||||
Profit before income taxes |
| | | | ||||
Income tax expense |
| | | — | ||||
Profit for the year | $ | | | | ||||
F-67
HIMAX TECHNOLOGIES, INC. AND SUBSIDIARIES
Notes to Consolidated Financial Statements (Continued)
For the years ended December 31, 2021, 2022 and 2023
Condensed Statements of Other Comprehensive Income
Year Ended December 31, | |||||||
| 2021 | 2022 |
| 2023 | |||
(in thousands) | |||||||
Profit for the year | $ | |
| |
| | |
Other comprehensive income: |
|
| |||||
Items that will not be reclassified to profit or loss: | |||||||
Remeasurements of defined benefit pension plans | |
| |
| | ||
Unrealized gain (loss) on financial assets at fair value through other comprehensive income | ( |
| |
| | ||
Income tax related to items that will not be reclassified subsequently | ( |
| ( |
| | ||
Items that may be reclassified subsequently to profit or loss: | |||||||
Foreign operations - foreign currency translation differences | ( |
| ( |
| ( | ||
Other comprehensive income for the year, net of tax | ( |
| |
| | ||
Total comprehensive income for the year | $ | |
| |
| | |
F-68
HIMAX TECHNOLOGIES, INC. AND SUBSIDIARIES
Notes to Consolidated Financial Statements (Continued)
For the years ended December 31, 2021, 2022 and 2023
Condensed Statements of Cash Flows
Year ended December 31, | |||||||
| 2021 |
| 2022 |
| 2023 | ||
(in thousands) | |||||||
Cash flows from operating activities: |
|
|
|
| |||
Profit for the year | $ | | |
| | ||
Adjustments for: |
| ||||||
Changes in fair value of financial assets at fair value through profit or loss | | ( |
| ( | |||
Interest income | ( | ( |
| ( | |||
Finance costs | | |
| | |||
Share of profits of subsidiaries and affiliates | ( | ( |
| ( | |||
Loss on re-measurement of the pre-existing relationships in a business combination | | | | ||||
Unrealized foreign currency exchange losses (gains) | ( | |
| | |||
( | ( |
| ( | ||||
Changes in: |
| ||||||
Other current assets | ( | ( |
| ( | |||
Other current liabilities | | ( |
| | |||
Cash generated from operating activities | ( | ( |
| ( | |||
Interest received | | |
| | |||
Interest paid | ( | ( |
| ( | |||
Net cash used in operating activities | ( | ( |
| ( | |||
Cash flows from investing activities: |
|
|
|
| |||
Acquisitions of financial asset at amortized cost |
| ( | ( |
| ( | ||
Acquisitions of financial assets at fair value through profit or loss |
| | |
| ( | ||
Net cash used in investing activities |
| ( | ( |
| ( | ||
Cash flows from financing activities: |
|
|
|
|
| ||
Payments of cash dividends |
| ( | ( |
| ( | ||
Payments of dividend equivalents |
| | |
| ( | ||
Repayments of long-term unsecured borrowings | ( | ( | ( | ||||
Proceeds from short-term secured borrowings |
| | |
| | ||
Repayments of short-term secured borrowings | ( | ( | ( | ||||
Proceeds from issue of RSUs from subsidiaries |
| | |
| | ||
Proceeds from exercise of employee stock options | | | | ||||
Proceeds from debt from a subsidiary |
| | |
| | ||
Repayments of debt from a subsidiary |
| ( | ( |
| ( | ||
Net cash provided by financing activities |
| | |
| | ||
Net increase (decrease) in cash |
| ( | |
| | ||
Cash at beginning of year |
| | |
| | ||
Cash at end of year | $ | | |
| | ||
F-69