UNITED STATES
SECURITIES AND EXCHANGE COMMISSION
WASHINGTON, D.C. 20549
FORM
REGISTRATION STATEMENT PURSUANT TO SECTION 12(b) OF THE SECURITIES EXCHANGE ACT OF 1934 |
OR
ANNUAL REPORT PURSUANT TO SECTION 13 OR 15(d) OF THE SECURITIES EXCHANGE ACT OF 1934 |
For the fiscal year ended
OR
TRANSITION REPORT PURSUANT TO SECTION 13 OR 15(d) OF THE SECURITIES EXCHANGE ACT OF 1934 |
OR
SHELL COMPANY REPORT PURSUANT TO SECTION 13 OR 15(d) OF THE SECURITIES EXCHANGE ACT OF 1934 |
Commission File No.
Telephone: +44 1932 822000
Company Secretary
company.secretary@haleon.com
Telephone:
Securities registered or to be registered pursuant to Section 12(b) of the Act.
Title of each class |
| Trading Symbol(s) |
| Name of each exchange on which registered |
|
| |||
1Not for trading, but only in connection with the listing of the American Depositary Shares on the New York Stock Exchange.
Securities registered pursuant to Section 12(g) of the Act:
None
Securities for which there is a reporting obligation pursuant to Section 15(d) of the Act
None
Indicate the number of outstanding shares of each of the issuer’s classes of capital or common stock as of the close of the period covered by the annual report:
Indicate by check mark if the registrant is a well-known seasoned issuer, as defined in Rule 405 of the Securities Act.
Yes ☐
If this report is an annual or transition report, indicate by check mark if the registrant is not required to file reports pursuant to Section 13 or 15(d) of the Securities Exchange Act of 1934.
Yes ☐
Indicate by check mark whether the registrant (1) has filed all reports required to be filed by Section 13 or 15(d) of the Securities Exchange Act of 1934 during the preceding 12 months (or for such shorter period that the registrant was required to file such reports), and (2) has been subject to such filing requirements for the past 90 days.
Indicate by check mark whether the registrant has submitted electronically every Interactive Data File required to be submitted pursuant to Rule 405 of Regulation S-T (§ 232.405 of this chapter) during the preceding 12 months (or for such shorter period that the registrant was required to submit such files).
Indicate by check mark whether the registrant is a large accelerated filer, an accelerated filer, a non-accelerated filer, or an emerging growth company. See definition of “large accelerated filer,” “accelerated filer,” and “emerging growth company” in Rule 12b-2 of the Exchange Act.
Accelerated filer | Non-accelerated filer | Emerging growth company | |
☑ | ☐ | ☐ |
If an emerging growth company that prepares its financial statements in accordance with U.S. GAAP, indicate by check mark if the registrant has elected not to use the extended period for complying with any new or revised financial accounting standards† provided pursuant to Section 13(a) of the Exchange Act. ☐
† The term “new or revised financial accounting standard” refers to any update issued by the Financial Accounting Standards Board to its Accounting Standards Codification after April 5, 2012.
Indicate by check mark whether the registrant has filed a report on and attestation to its management’s assessment of the effectiveness of its internal control over financial reporting under Section 404(b) of the Sarbanes-Oxley Act (15 U.S.C. 7262(b)) by the registered public accounting firm that prepared or issued its audit report.
If securities are registered pursuant to Section 12(b) of the Act, indicate by check mark whether the financial statements of the registrant included in the filing reflect the correction of an error to previously issued financial statements.
Indicate by check mark whether any of those error corrections are restatements that required a recovery analysis of incentive-based compensation received by any of the registrant’s executive officers during the relevant recovery period pursuant to §240.10D-1(b). ☐
Indicate by check mark which basis of accounting the registrant has used to prepare the financial statements included in this filing:
U.S. GAAP | Other | |
☐ | Accounting Standards Board ☑ | ☐ |
If “Other” has been checked in response to the previous question, indicate by check mark which financial statement item the registrant has elected to follow.
Item 17 ☐ Item 18 ☐
If this is an annual report, indicate by check mark whether the registrant is a shell company (as defined in Rule 12b-2 of the Exchange Act).
Yes
No ☑
Auditor Firm Id: | Auditor Name: | Auditor Location: | ||
Auditor Firm Id: | Auditor Name: | Auditor Location: | ||
Auditor Firm Id: | Auditor Name: | Auditor Location: |
| Annual Report and Form 20-F 2023 |

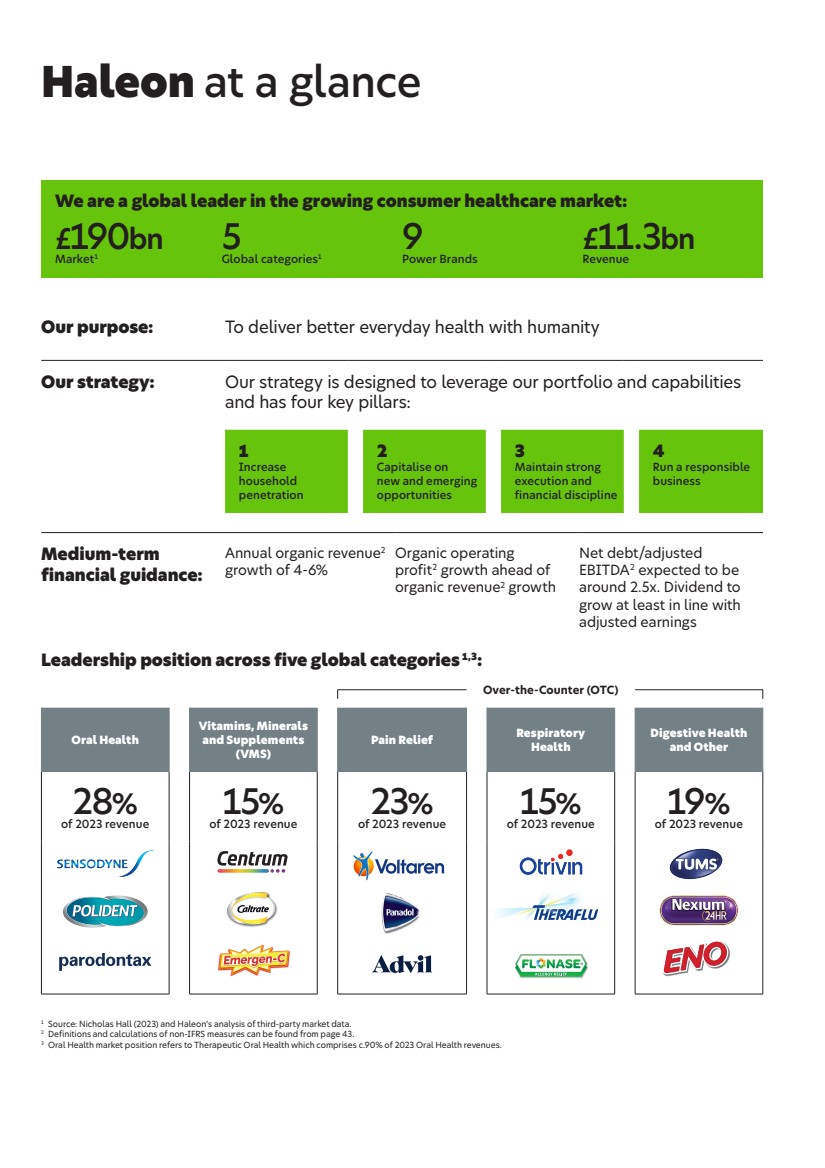
| We are a global leader in the growing consumer healthcare market: £190bn Market1 5 Global categories1 9 Power Brands £11.3bn Revenue Haleon at a glance Our purpose: To deliver better everyday health with humanity Our strategy: Our strategy is designed to leverage our portfolio and capabilities and has four key pillars: 1 Increase household penetration 2 Capitalise on new and emerging opportunities 3 Maintain strong execution and financial discipline 4 Run a responsible business Medium-term financial guidance: Annual organic revenue2 growth of 4-6% Organic operating profit2 growth ahead of organic revenue2 growth Net debt/adjusted EBITDA2 expected to be around 2.5x. Dividend to grow at least in line with adjusted earnings Leadership position across five global categories 1,3: Over-the-Counter (OTC) Oral Health Vitamins, Minerals and Supplements (VMS) Pain Relief Respiratory Health Digestive Health and Other 28% of 2023 revenue 15% of 2023 revenue 23% of 2023 revenue 15% of 2023 revenue 19% of 2023 revenue 1 Source: Nicholas Hall (2023) and Haleon’s analysis of third-party market data. 2 Definitions and calculations of non-IFRS measures can be found from page 43. 3 Oral Health market position refers to Therapeutic Oral Health which comprises c.90% of 2023 Oral Health revenues. |
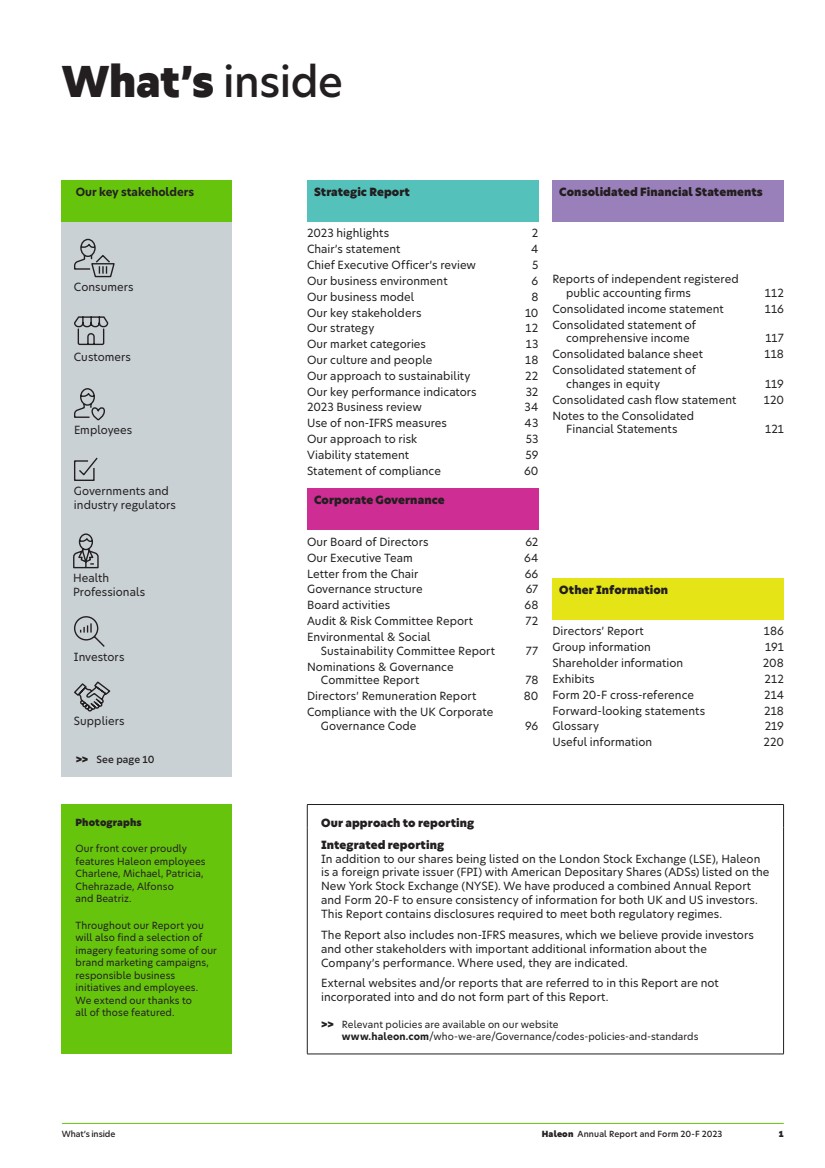
| Photographs Our front cover proudly features Haleon employees Charlene, Michael, Patricia, Chehrazade, Alfonso and Beatriz. Throughout our Report you will also find a selection of imagery featuring some of our brand marketing campaigns, responsible business initiatives and employees. We extend our thanks to all of those featured. What’s inside Consolidated Financial Statements Reports of independent registered public accounting firms 112 Consolidated income statement 116 Consolidated statement of comprehensive income 117 Consolidated balance sheet 118 Consolidated statement of changes in equity 119 Consolidated cash flow statement 120 Notes to the Consolidated Financial Statements 121 Other Information Directors’ Report 186 Group information 191 Shareholder information 208 Exhibits 212 Form 20-F cross-reference 214 Forward-looking statements 218 Glossary 219 Useful information 220 Strategic Report 2023 highlights 2 Chair’s statement 4 Chief Executive Officer’s review 5 Our business environment 6 Our business model 8 Our key stakeholders 10 Our strategy 12 Our market categories 13 Our culture and people 18 Our approach to sustainability 22 Our key performance indicators 32 2023 Business review 34 Use of non-IFRS measures 43 Our approach to risk 53 Viability statement 59 Statement of compliance 60 Corporate Governance Our Board of Directors 62 Our Executive Team 64 Letter from the Chair 66 Governance structure 67 Board activities 68 Audit & Risk Committee Report 72 Environmental & Social Sustainability Committee Report 77 Nominations & Governance Committee Report 78 Directors’ Remuneration Report 80 Compliance with the UK Corporate Governance Code 96 >> See page 10 Suppliers Investors Health Professionals Governments and industry regulators Employees Customers Consumers Our key stakeholders Our approach to reporting Integrated reporting In addition to our shares being listed on the London Stock Exchange (LSE), Haleon is a foreign private issuer (FPI) with American Depositary Shares (ADSs) listed on the New York Stock Exchange (NYSE). We have produced a combined Annual Report and Form 20-F to ensure consistency of information for both UK and US investors. This Report contains disclosures required to meet both regulatory regimes. The Report also includes non-IFRS measures, which we believe provide investors and other stakeholders with important additional information about the Company’s performance. Where used, they are indicated. External websites and/or reports that are referred to in this Report are not incorporated into and do not form part of this Report. >> Relevant policies are available on our website www.haleon.com/who-we-are/Governance/codes-policies-and-standards What’s inside Haleon Annual Report and Form 20-F 2023 1 |
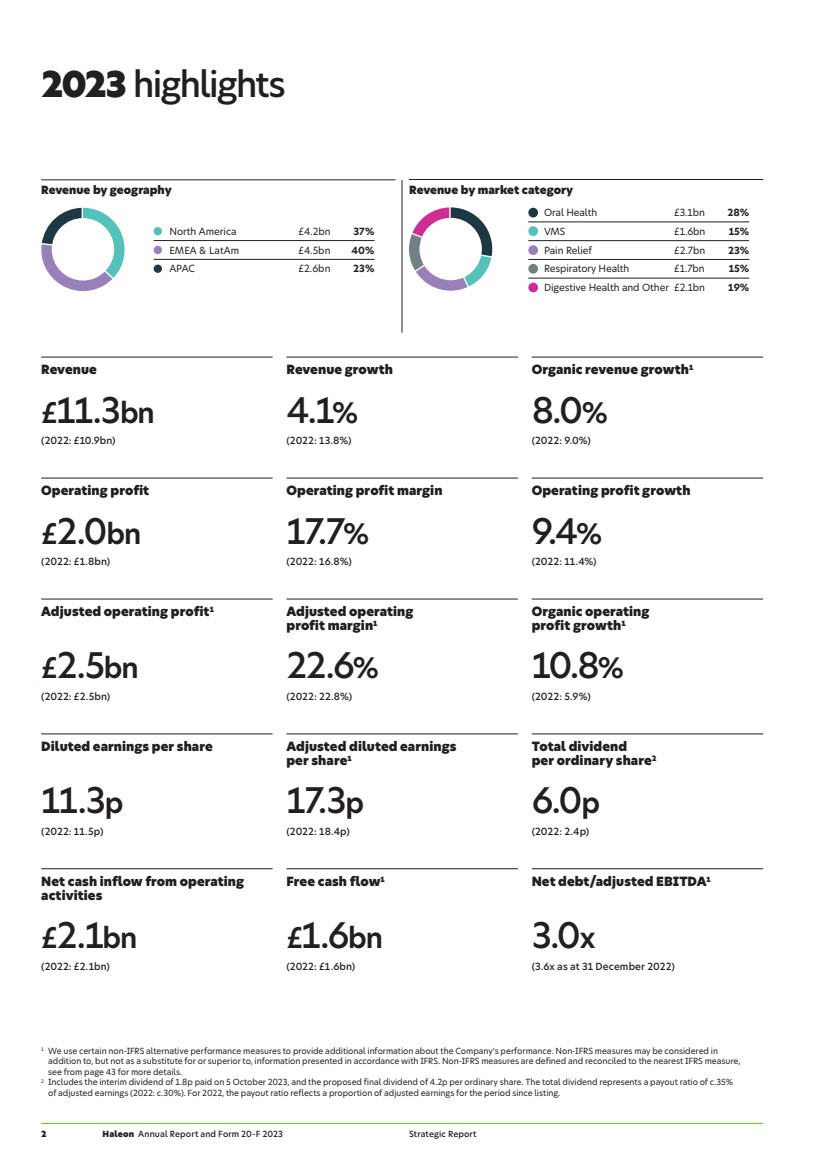
| 2023 highlights Revenue Revenue growth Organic revenue growth1 £11.3bn 4.1% 8.0% (2022: £10.9bn) (2022: 13.8%) (2022: 9.0%) Operating profit Operating profit margin Operating profit growth £2.0bn 17.7% 9.4% (2022: £1.8bn) (2022: 16.8%) (2022: 11.4%) Adjusted operating profit1 Adjusted operating profit margin1 Organic operating profit growth1 £2.5bn 22.6% 10.8% (2022: £2.5bn) (2022: 22.8%) (2022: 5.9%) Diluted earnings per share Adjusted diluted earnings per share1 Total dividend per ordinary share2 11.3p 17.3p 6.0p (2022: 11.5p) (2022: 18.4p) (2022: 2.4p) Net cash inflow from operating activities Free cash flow1 Net debt/adjusted EBITDA1 £2.1bn £1.6bn 3.0x (2022: £2.1bn) (2022: £1.6bn) (3.6x as at 31 December 2022) 1 We use certain non-IFRS alternative performance measures to provide additional information about the Company’s performance. Non-IFRS measures may be considered in addition to, but not as a substitute for or superior to, information presented in accordance with IFRS. Non-IFRS measures are defined and reconciled to the nearest IFRS measure, see from page 43 for more details. 2 Includes the interim dividend of 1.8p paid on 5 October 2023, and the proposed final dividend of 4.2p per ordinary share. The total dividend represents a payout ratio of c.35% of adjusted earnings (2022: c.30%). For 2022, the payout ratio reflects a proportion of adjusted earnings for the period since listing. Revenue by geography North America £4.2bn 37% EMEA & LatAm £4.5bn 40% APAC £2.6bn 23% Revenue by market category Oral Health £3.1bn 28% VMS £1.6bn 15% Pain Relief £2.7bn 23% Respiratory Health £1.7bn 15% Digestive Health and Other £2.1bn 19% 2 Haleon Annual Report and Form 20-F 2023 Strategic Report |
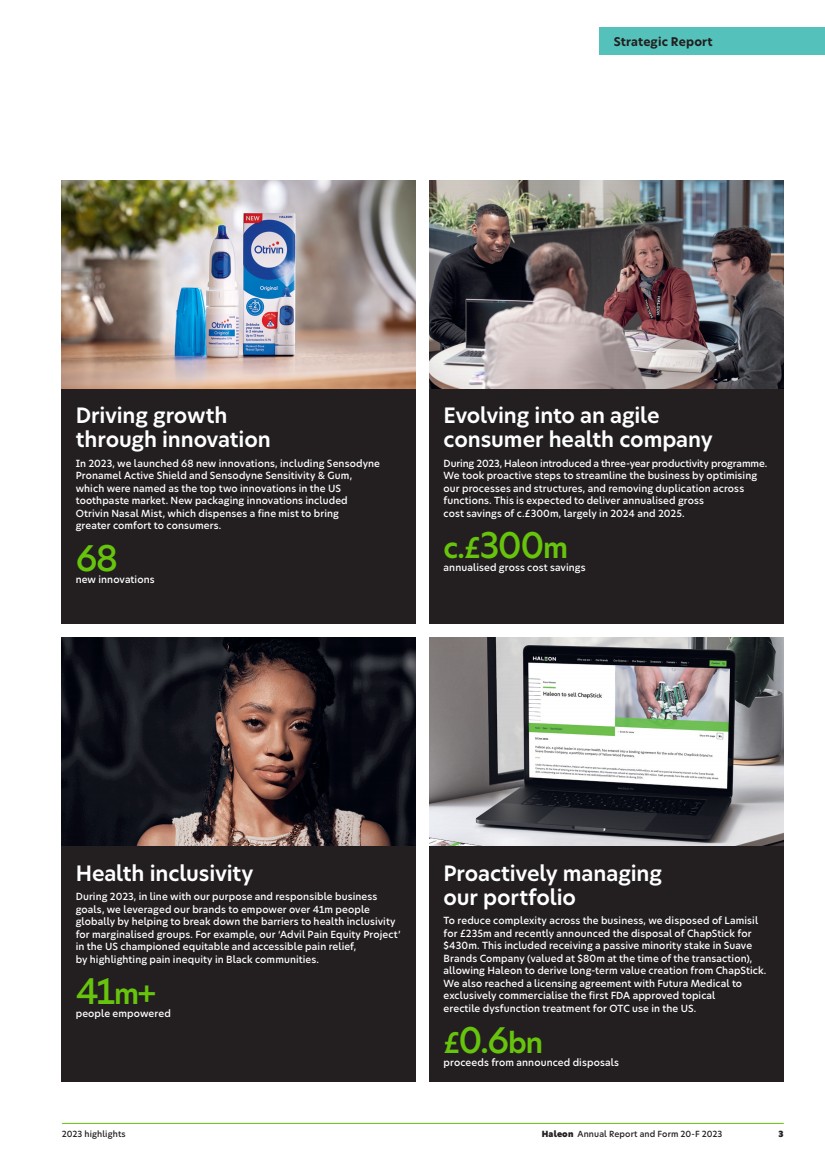
| Driving growth through innovation In 2023, we launched 68 new innovations, including Sensodyne Pronamel Active Shield and Sensodyne Sensitivity & Gum, which were named as the top two innovations in the US toothpaste market. New packaging innovations included Otrivin Nasal Mist, which dispenses a fine mist to bring greater comfort to consumers. 68 new innovations Evolving into an agile consumer health company During 2023, Haleon introduced a three-year productivity programme. We took proactive steps to streamline the business by optimising our processes and structures, and removing duplication across functions. This is expected to deliver annualised gross cost savings of c.£300m, largely in 2024 and 2025. c.£ annualised gross cost savings 300m Health inclusivity During 2023, in line with our purpose and responsible business goals, we leveraged our brands to empower over 41m people globally by helping to break down the barriers to health inclusivity for marginalised groups. For example, our ‘Advil Pain Equity Project’ in the US championed equitable and accessible pain relief, by highlighting pain inequity in Black communities. 41m+ people empowered Proactively managing our portfolio To reduce complexity across the business, we disposed of Lamisil for £235m and recently announced the disposal of ChapStick for $430m. This included receiving a passive minority stake in Suave Brands Company (valued at $80m at the time of the transaction), allowing Haleon to derive long-term value creation from ChapStick. We also reached a licensing agreement with Futura Medical to exclusively commercialise the first FDA approved topical erectile dysfunction treatment for OTC use in the US. £0.6bn proceeds from announced disposals Haleon Annual Report and Form 20-F 2023 3 Strategic Report 2023 highlights |
| Chair’s statement Sir Dave Lewis Chair 2023: a year of delivering everyday health with humanity 2023 marked our first full calendar year as a standalone business, during which we made good progress in establishing our position as a world-leading global consumer health company, with strong foundations to support long-term growth. While we recognise we have much more to achieve, it was good to see the business demonstrate continued momentum. We delivered meaningful progress across all elements of our strategy to drive sustainable growth and shareholder returns, giving us confidence that we are on the right course to achieve medium and long-term success. The transformation into a global consumer health company continues and the Board and I were encouraged by visits to Haleon’s regional operations. The opportunities ahead of Haleon are significant. Strong financial performance Haleon’s financial performance is driven by deep human understanding and investment in trusted science, coupled with strong execution and financial discipline. By harnessing these competitive advantages, Haleon achieved organic revenue growth of 8.0% (reported 4.1%), ahead of our medium-term guidance. Adjusted operating profit at constant currency also grew strongly at 10.4% (reported operating profit +9.4%). Consistent with the priorities set out at the time of listing, we have rapidly de-levered to 3.0x net debt/adjusted EBITDA as at 31 December 2023. Strong cash generation enabled us to accelerate debt repayment and we now expect to operate at leverage of around 2.5x over the medium-term. This underpinned our decision to announce a capital allocation of £500m for share buybacks in 2024. Dividend The Board is proposing a total dividend of 6.0p per ordinary share which represents a pay-out ratio of approximately 35% of 2023 adjusted earnings. This includes a final dividend of 4.2p per ordinary share. In line with our capital allocation priorities to invest for growth, explore acquisitions and return surplus capital to shareholders, our current intention is to grow the dividend at least inline with adjusted earnings. Importance of governance, purpose and culture One of my priorities as Chair is to ensure Haleon’s continued commitment to good corporate governance, which supports both our purpose and culture. During 2023, we actively engaged with, and responded to, UK regulatory consultations on corporate governance, reporting and disclosure reforms. Our first digitally enabled AGM was held in April 2023. We will continue to embrace technology to maximise participation, and will broadcast this year’s AGM from Haleon’s offices in London. We also embedded the Environmental & Social Sustainability Committee, which is focused on providing oversight and effective governance over Haleon’s environmental and social sustainability agenda, and the external governance and regulatory requirements relevant to these areas. This included approving a baseline year update for our virgin plastic and Scope 3 carbon reduction goals from 2020 to 2022, to align with better data availability and accuracy. Further progress was also made in ensuring that our growth correlates with our sustainability goals. For example, 70% of packaging for Haleon products is recycle-ready, so we remain on track to make all packaging recyclable or reusable by 2030. We have also taken steps to further enhance our safeguards around modern slavery and the protection of human rights, as they relate to Haleon’s operations around the world. In terms of building our culture, we continued to embed our diversity, equity and inclusion (DEI) principles across the business, with a focus on ethnicity and gender. Priorities for 2024 The Board considers the following to be our priorities for the year ahead: — Increasing agility and productivity across the business, by continuing to optimise and evolve existing processes and structures. — Driving performance quality, by focusing on the strategic pillars which underpin our business. — Creating shareholder value through effective capital allocation to maximise shareholder returns. — Continued focus on strong corporate governance and ethical behaviours. Thank you On behalf of the Board, I would like to thank the Executive Team and all Haleon employees globally for their hard work throughout the year. Their dedication has enabled the business to achieve strong financial performance, while delivering on our strategic objectives and building strong foundations for the future. While we are pleased with the progress made to date, we look forward to building on these foundations and delivering on future growth opportunities in 2024, and beyond. 4 Haleon Annual Report and Form 20-F 2023 Strategic Report |
| Chief Executive Officer’s review Brian McNamara Chief Executive Officer Building a track-record for growth I am very pleased with Haleon’s performance in 2023, which despite the challenging economic backdrop, saw Haleon deliver strong financial results; a testament to the strength of our category-leading brands. During the year, we advanced our ambition to become more dynamic and agile, driven by our purpose to deliver better everyday health with humanity. As I reflect on 2023 and look to 2024 and beyond, I am confident about our ability to continue building a business that creates value for all our stakeholders. Our strategy is delivering In 2023, we delivered organic revenue growth of 8.0% (reported 4.1%), and adjusted operating profit growth of 10.4% at constant currency (reported operating profit +9.4%). Importantly, this was underpinned by growth in both price and volume, reflecting the quality and resilience of our brands. Haleon continued to drive consumer preference, with 58% of our brands maintaining or growing market share. We also maintained our attractive financial profile, delivering free cash flow of £1.6bn, enabling us to de-lever faster than expected to 3.0x leverage as at 31 December 2023. Strong delivery against strategic pillars Our four strategic pillars underpin our growth ambitions. Highlights last year included: — Increasing household penetration, with market share gains for many of our category-leading brands. Sensodyne performed well, as more consumers sought the therapeutic benefits of the brand’s sensitivity toothpastes. For example, Sensodyne Sensitivity & Gum and Sensodyne Pronamel Active Shield were named as the top two innovations in the US toothpaste market. Panadol also performed well, boosted by addressing specialist need states such as migraine and body pain. — Capitalising on new and emerging opportunities, by innovating and delivering our brands to more consumers in more markets, and increasing channel penetration. For example, we expanded the Centrum global footprint by entering new markets in Sweden, the Middle East and Africa. Our e-commerce sales also grew, increasing 17% over the year to account for 10% of total sales globally. — Maintaining strong execution and financial discipline, with operating profit growing ahead of revenue growth in 2023, delivering margin expansion at constant currency and positive operational leverage. — Running a responsible business, with the business making good progress against its ethical standards, environmental and health inclusivity goals. During 2023, we empowered over 41m people to be more included in opportunities for better everyday health. We met our aim for producing 1bn recycle-ready toothpaste tubes two years ahead of schedule and were recognised by the Dow Jones Sustainability Index Europe 2023. We also progressed our Diversity, Equity and Inclusion (DEI) ambitions, including the launch of our diverse talent programme. Building a more agile and dynamic business We are focused on ensuring that Haleon is best placed to deliver consistent outperformance over the long-term. As an independent company, we have a unique opportunity to re-evaluate how the business operates, ensuring we deliver as effectively and efficiently as possible. Our three-year productivity programme is on track, delivering efficiencies and greater agility, while supporting continued investment. The programme is expected to result in gross annualised cost savings of c.£300m, largely in 2024 and 2025, with around one third of the benefit expected in 2024 and the remainder in 2025. We also continue to actively manage our portfolio, exploring opportunities for divestments and bolt-on acquisitions that offer strategic and commercial benefits. Recent examples include the completion of the Lamisil disposal in October 2023 and the disposal of ChapStick announced in January 2024. These divestments allow us to reduce complexity and focus on higher growth brands, while providing optionality in capital allocation, consistent with the allocation of £500m for share buybacks in 2024, announced with full-year results. Changes to our leadership team During the year, we continued to build our Executive Team to ensure the right mix of capabilities and experience to drive Haleon’s future growth and success. Namrata Patel was appointed as Chief Supply Chain Officer, together with Ed Petter as Chief Corporate Affairs Officer, and Björn Timelin as Head of Strategy. Each bring strong leadership credentials and experience with global consumer-facing companies. Confidence in delivering on growth ambitions I am confident in the strength of our business and brand portfolio and remain committed to our medium-term growth targets. During 2024, we expect to deliver organic revenue growth of 4-6% and organic profit growth ahead of revenue growth. Together with our focus on continued strong cash generation and effective capital allocation, we expect to drive value and attractive returns for our shareholders. Thank you I’d like to thank all Haleon employees for their enormous contribution during a period of significant transformation. I’m incredibly proud to work with such a talented and dedicated global team. On behalf of the Executive Team, I’d also like to thank the Board for their ongoing support and guidance. Haleon Annual Report and Form 20-F 2023 5 Strategic Report Chief Executive Officer’s review |
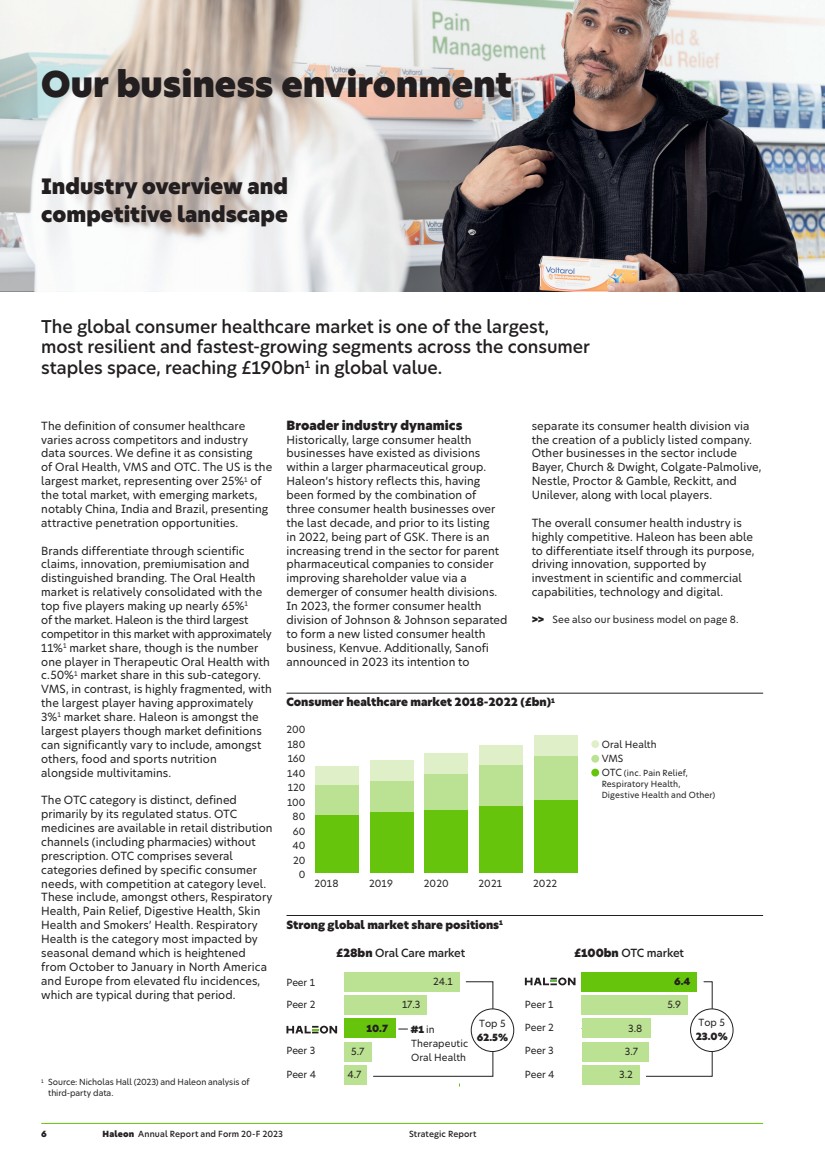
| Consumer healthcare market 2018-2022 (£bn)1 Oral Health VMS OTC (inc. Pain Relief, Respiratory Health, Digestive Health and Other) 0 20 40 60 80 100 120 140 160 180 200 2018 2019 2020 2021 2022 Strong global market share positions1 Peer 1 Peer 2 Peer 3 Peer 4 6.4 5.9 3.8 3.7 3.2 Top 5 23.0% £100bn OTC market Peer 1 Peer 2 Peer 3 Peer 4 24.1 17.3 10.7 5.7 4.7 Top 5 62.5% £28bn Oral Care market #1 in Therapeutic Oral Health Our business environment Industry overview and competitive landscape The global consumer healthcare market is one of the largest, most resilient and fastest-growing segments across the consumer staples space, reaching £190bn1 in global value. The definition of consumer healthcare varies across competitors and industry data sources. We define it as consisting of Oral Health, VMS and OTC. The US is the largest market, representing over 25%1 of the total market, with emerging markets, notably China, India and Brazil, presenting attractive penetration opportunities. Brands differentiate through scientific claims, innovation, premiumisation and distinguished branding. The Oral Health market is relatively consolidated with the top five players making up nearly 65%1 of the market. Haleon is the third largest competitor in this market with approximately 11%1 market share, though is the number one player in Therapeutic Oral Health with c.50%1 market share in this sub-category. VMS, in contrast, is highly fragmented, with the largest player having approximately 3%1 market share. Haleon is amongst the largest players though market definitions can significantly vary to include, amongst others, food and sports nutrition alongside multivitamins. The OTC category is distinct, defined primarily by its regulated status. OTC medicines are available in retail distribution channels (including pharmacies) without prescription. OTC comprises several categories defined by specific consumer needs, with competition at category level. These include, amongst others, Respiratory Health, Pain Relief, Digestive Health, Skin Health and Smokers’ Health. Respiratory Health is the category most impacted by seasonal demand which is heightened from October to January in North America and Europe from elevated flu incidences, which are typical during that period. Broader industry dynamics Historically, large consumer health businesses have existed as divisions within a larger pharmaceutical group. Haleon’s history reflects this, having been formed by the combination of three consumer health businesses over the last decade, and prior to its listing in 2022, being part of GSK. There is an increasing trend in the sector for parent pharmaceutical companies to consider improving shareholder value via a demerger of consumer health divisions. In 2023, the former consumer health division of Johnson & Johnson separated to form a new listed consumer health business, Kenvue. Additionally, Sanofi announced in 2023 its intention to separate its consumer health division via the creation of a publicly listed company. Other businesses in the sector include Bayer, Church & Dwight, Colgate-Palmolive, Nestle, Proctor & Gamble, Reckitt, and Unilever, along with local players. The overall consumer health industry is highly competitive. Haleon has been able to differentiate itself through its purpose, driving innovation, supported by investment in scientific and commercial capabilities, technology and digital. >> See also our business model on page 8. 1 Source: Nicholas Hall (2023) and Haleon analysis of third-party data. 6 Haleon Annual Report and Form 20-F 2023 Strategic Report |
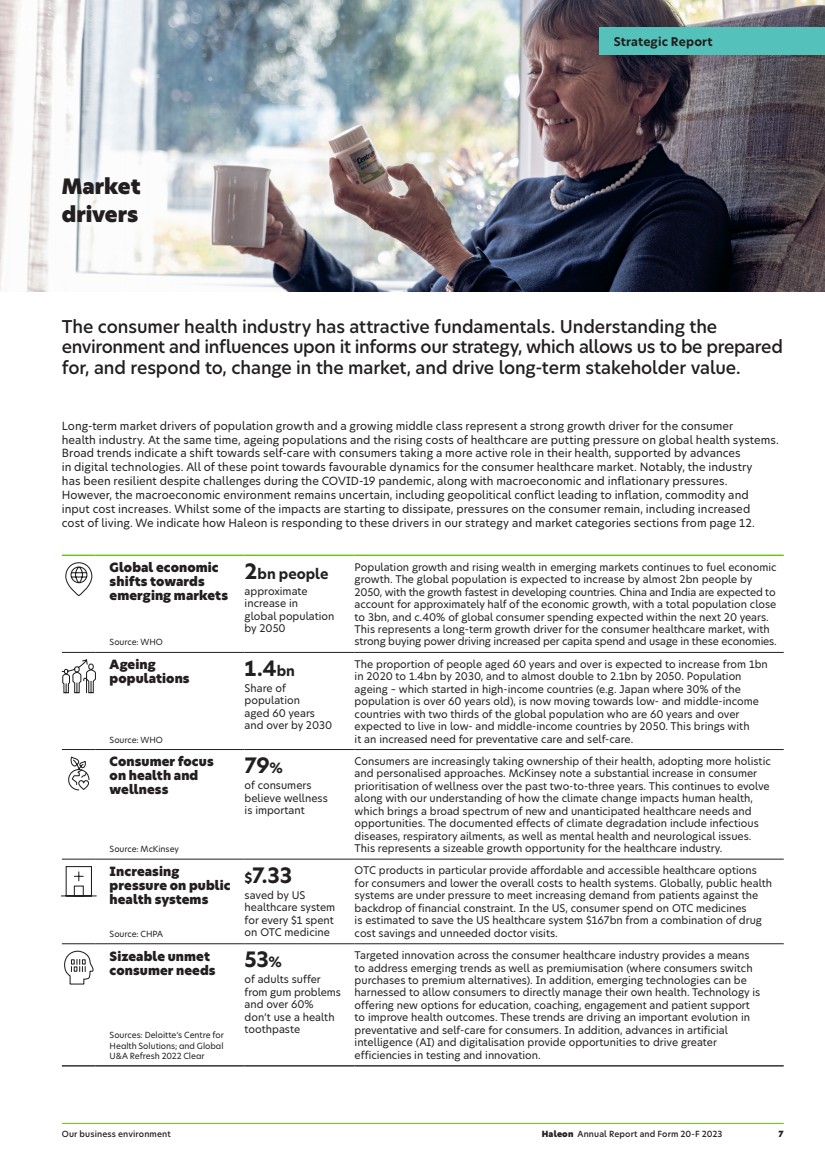
| Market drivers The consumer health industry has attractive fundamentals. Understanding the environment and influences upon it informs our strategy, which allows us to be prepared for, and respond to, change in the market, and drive long-term stakeholder value. Long-term market drivers of population growth and a growing middle class represent a strong growth driver for the consumer health industry. At the same time, ageing populations and the rising costs of healthcare are putting pressure on global health systems. Broad trends indicate a shift towards self-care with consumers taking a more active role in their health, supported by advances in digital technologies. All of these point towards favourable dynamics for the consumer healthcare market. Notably, the industry has been resilient despite challenges during the COVID-19 pandemic, along with macroeconomic and inflationary pressures. However, the macroeconomic environment remains uncertain, including geopolitical conflict leading to inflation, commodity and input cost increases. Whilst some of the impacts are starting to dissipate, pressures on the consumer remain, including increased cost of living. We indicate how Haleon is responding to these drivers in our strategy and market categories sections from page 12. Global economic shifts towards emerging markets 2bn people approximate increase in global population by 2050 Population growth and rising wealth in emerging markets continues to fuel economic growth. The global population is expected to increase by almost 2bn people by 2050, with the growth fastest in developing countries. China and India are expected to account for approximately half of the economic growth, with a total population close to 3bn, and c.40% of global consumer spending expected within the next 20 years. This represents a long-term growth driver for the consumer healthcare market, with Source: WHO strong buying power driving increased per capita spend and usage in these economies. Ageing populations 1.4bn Share of population aged 60 years and over by 2030 The proportion of people aged 60 years and over is expected to increase from 1bn in 2020 to 1.4bn by 2030, and to almost double to 2.1bn by 2050. Population ageing – which started in high-income countries (e.g. Japan where 30% of the population is over 60 years old), is now moving towards low- and middle-income countries with two thirds of the global population who are 60 years and over expected to live in low- and middle-income countries by 2050. This brings with Source: WHO it an increased need for preventative care and self-care. Consumer focus on health and wellness 79% of consumers believe wellness is important Consumers are increasingly taking ownership of their health, adopting more holistic and personalised approaches. McKinsey note a substantial increase in consumer prioritisation of wellness over the past two-to-three years. This continues to evolve along with our understanding of how the climate change impacts human health, which brings a broad spectrum of new and unanticipated healthcare needs and opportunities. The documented effects of climate degradation include infectious diseases, respiratory ailments, as well as mental health and neurological issues. Source: McKinsey This represents a sizeable growth opportunity for the healthcare industry. Increasing pressure on public health systems $7.33 saved by US healthcare system for every $1 spent on OTC medicine OTC products in particular provide affordable and accessible healthcare options for consumers and lower the overall costs to health systems. Globally, public health systems are under pressure to meet increasing demand from patients against the backdrop of financial constraint. In the US, consumer spend on OTC medicines is estimated to save the US healthcare system $167bn from a combination of drug Source: CHPA cost savings and unneeded doctor visits. Sizeable unmet consumer needs 53% of adults suffer from gum problems and over 60% don’t use a health toothpaste Targeted innovation across the consumer healthcare industry provides a means to address emerging trends as well as premiumisation (where consumers switch purchases to premium alternatives). In addition, emerging technologies can be harnessed to allow consumers to directly manage their own health. Technology is offering new options for education, coaching, engagement and patient support to improve health outcomes. These trends are driving an important evolution in preventative and self-care for consumers. In addition, advances in artificial intelligence (AI) and digitalisation provide opportunities to drive greater efficiencies in testing and innovation. Sources: Deloitte’s Centre for Health Solutions; and Global U&A Refresh 2022 Clear Haleon Annual Report and Form 20-F 2023 7 Strategic Report Our business environment |
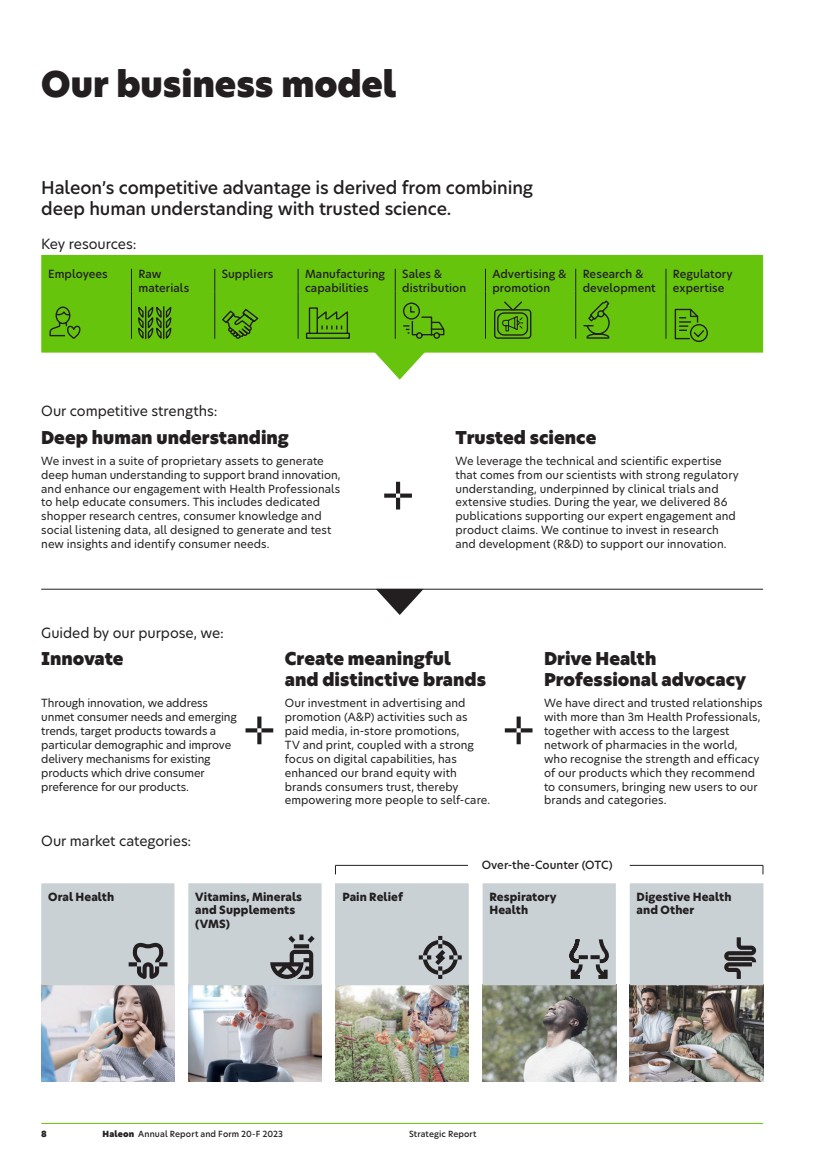
| Our market categories: Over-the-Counter (OTC) Oral Health Vitamins, Minerals and Supplements (VMS) Pain Relief Respiratory Health Digestive Health and Other Key resources: Employees Raw materials Suppliers Manufacturing capabilities Sales & distribution Advertising & promotion Research & development Regulatory expertise Our competitive strengths: Deep human understanding Trusted science We invest in a suite of proprietary assets to generate deep human understanding to support brand innovation, and enhance our engagement with Health Professionals to help educate consumers. This includes dedicated shopper research centres, consumer knowledge and social listening data, all designed to generate and test new insights and identify consumer needs. We leverage the technical and scientific expertise that comes from our scientists with strong regulatory understanding, underpinned by clinical trials and extensive studies. During the year, we delivered 86 publications supporting our expert engagement and product claims. We continue to invest in research and development (R&D) to support our innovation. Guided by our purpose, we: Innovate Create meaningful and distinctive brands Drive Health Professional advocacy Through innovation, we address unmet consumer needs and emerging trends, target products towards a particular demographic and improve delivery mechanisms for existing products which drive consumer preference for our products. Our investment in advertising and promotion (A&P) activities such as paid media, in-store promotions, TV and print, coupled with a strong focus on digital capabilities, has enhanced our brand equity with brands consumers trust, thereby empowering more people to self-care. We have direct and trusted relationships with more than 3m Health Professionals, together with access to the largest network of pharmacies in the world, who recognise the strength and efficacy of our products which they recommend to consumers, bringing new users to our brands and categories. Our business model Haleon’s competitive advantage is derived from combining deep human understanding with trusted science. 8 Haleon Annual Report and Form 20-F 2023 Strategic Report |
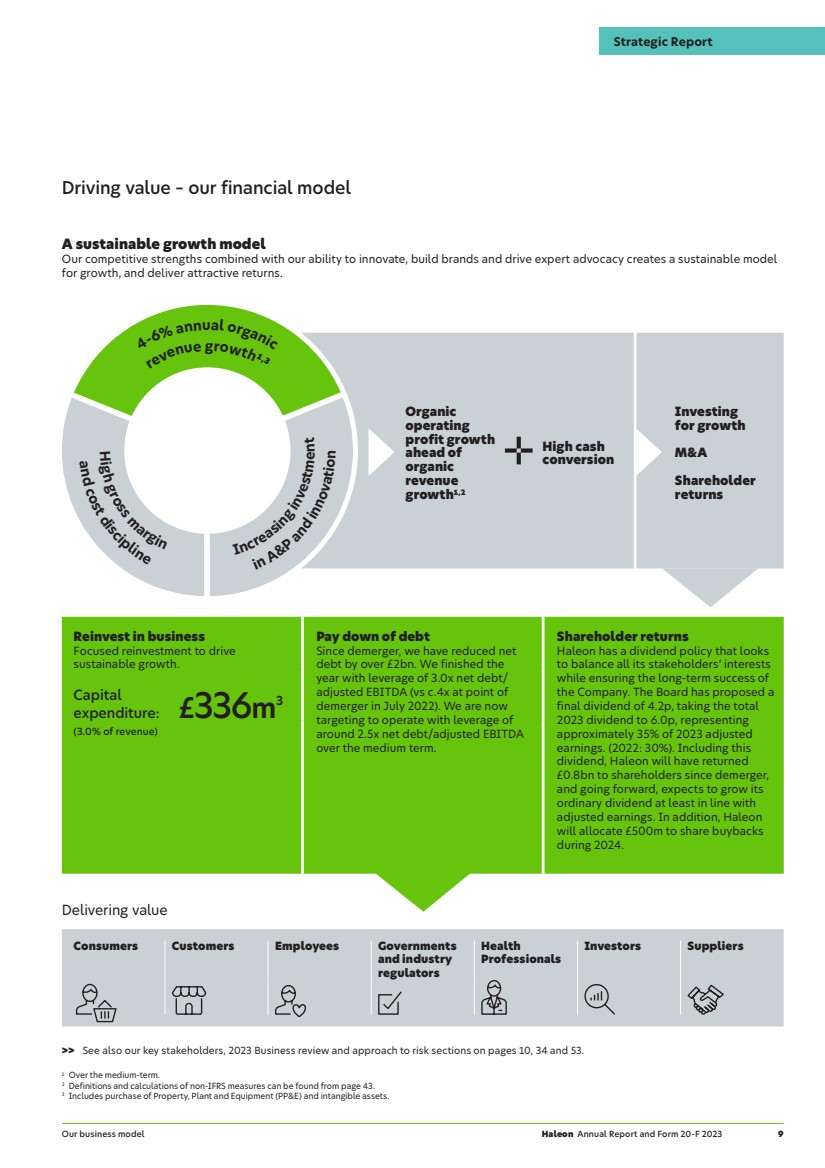
| Reinvest in business Focused reinvestment to drive sustainable growth. Pay down of debt Since demerger, we have reduced net debt by over £2bn. We finished the year with leverage of 3.0x net debt/ adjusted EBITDA (vs c.4x at point of demerger in July 2022). We are now targeting to operate with leverage of around 2.5x net debt/adjusted EBITDA over the medium term. Shareholder returns Haleon has a dividend policy that looks to balance all its stakeholders’ interests while ensuring the long-term success of the Company. The Board has proposed a final dividend of 4.2p, taking the total 2023 dividend to 6.0p, representing approximately 35% of 2023 adjusted earnings. (2022: 30%). Including this dividend, Haleon will have returned £0.8bn to shareholders since demerger, and going forward, expects to grow its ordinary dividend at least in line with adjusted earnings. In addition, Haleon will allocate £500m to share buybacks during 2024. Capital expenditure: £336m3 (3.0% of revenue) Delivering value Consumers Customers Employees Governments and industry regulators Health Professionals Investors Suppliers Organic operating profit growth ahead of organic revenue growth1,2 High cash conversion Investing for growth Shareholder returns M&A High gross margin a nd cost discipline Increasing investm e n t in A&P and innovatio n revenue growth1,3 4-6% annual organic Driving value – our financial model A sustainable growth model Our competitive strengths combined with our ability to innovate, build brands and drive expert advocacy creates a sustainable model for growth, and deliver attractive returns. >> See also our key stakeholders, 2023 Business review and approach to risk sections on pages 10, 34 and 53. 1 Over the medium-term. 2 Definitions and calculations of non-IFRS measures can be found from page 43. 3 Includes purchase of Property, Plant and Equipment (PP&E) and intangible assets. Haleon Annual Report and Form 20-F 2023 9 Strategic Report Our business model |
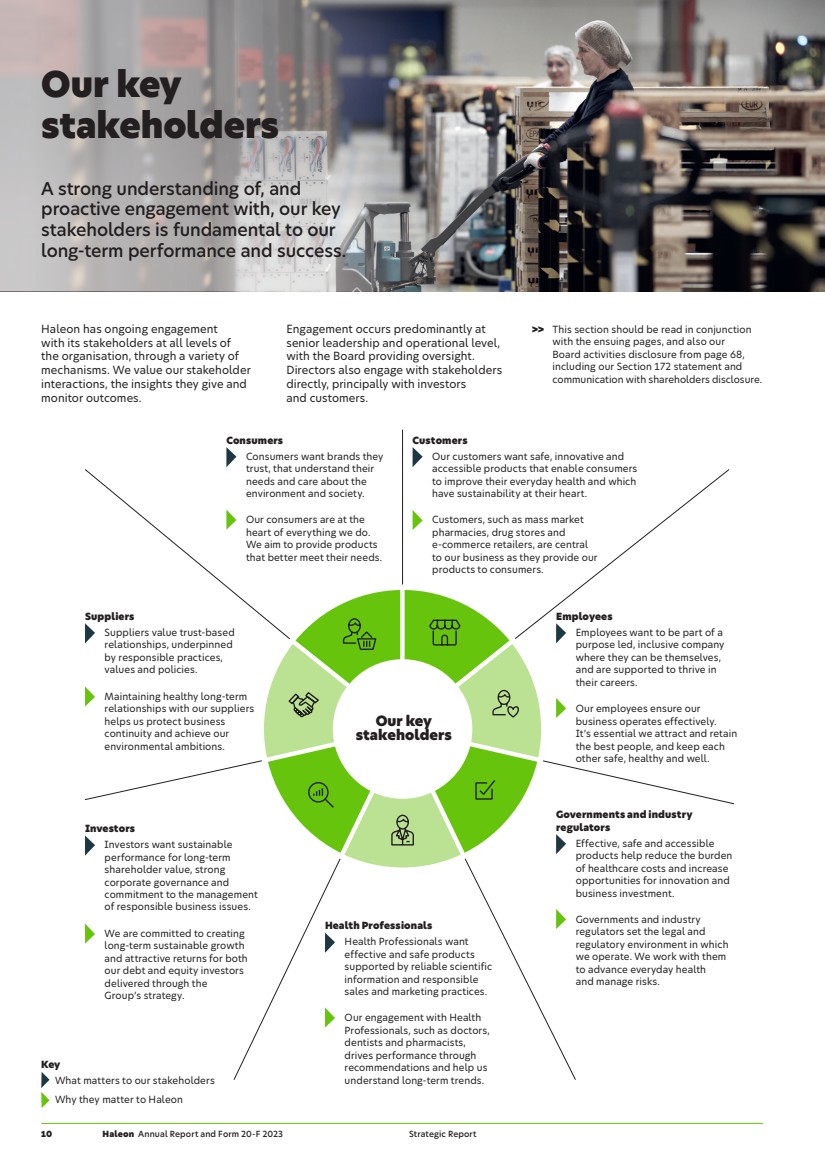
| Our key stakeholders A strong understanding of, and proactive engagement with, our key stakeholders is fundamental to our long-term performance and success. Haleon has ongoing engagement with its stakeholders at all levels of the organisation, through a variety of mechanisms. We value our stakeholder interactions, the insights they give and monitor outcomes. Engagement occurs predominantly at senior leadership and operational level, with the Board providing oversight. Directors also engage with stakeholders directly, principally with investors and customers. >> This section should be read in conjunction with the ensuing pages, and also our Board activities disclosure from page 68, including our Section 172 statement and communication with shareholders disclosure. Consumers Consumers want brands they trust, that understand their needs and care about the environment and society. Our consumers are at the heart of everything we do. We aim to provide products that better meet their needs. Customers Our customers want safe, innovative and accessible products that enable consumers to improve their everyday health and which have sustainability at their heart. Customers, such as mass market pharmacies, drug stores and e-commerce retailers, are central to our business as they provide our products to consumers. Suppliers Suppliers value trust-based relationships, underpinned by responsible practices, values and policies. Maintaining healthy long-term relationships with our suppliers helps us protect business continuity and achieve our environmental ambitions. Employees Employees want to be part of a purpose led, inclusive company where they can be themselves, and are supported to thrive in their careers. Our employees ensure our business operates effectively. It’s essential we attract and retain the best people, and keep each other safe, healthy and well. Investors Investors want sustainable performance for long-term shareholder value, strong corporate governance and commitment to the management of responsible business issues. We are committed to creating long-term sustainable growth and attractive returns for both our debt and equity investors delivered through the Group’s strategy. Health Professionals Health Professionals want effective and safe products supported by reliable scientific information and responsible sales and marketing practices. Our engagement with Health Professionals, such as doctors, dentists and pharmacists, drives performance through recommendations and help us understand long-term trends. Governments and industry regulators Effective, safe and accessible products help reduce the burden of healthcare costs and increase opportunities for innovation and business investment. Governments and industry regulators set the legal and regulatory environment in which we operate. We work with them to advance everyday health and manage risks. Our key stakeholders Key What matters to our stakeholders Why they matter to Haleon 10 Haleon Annual Report and Form 20-F 2023 Strategic Report |
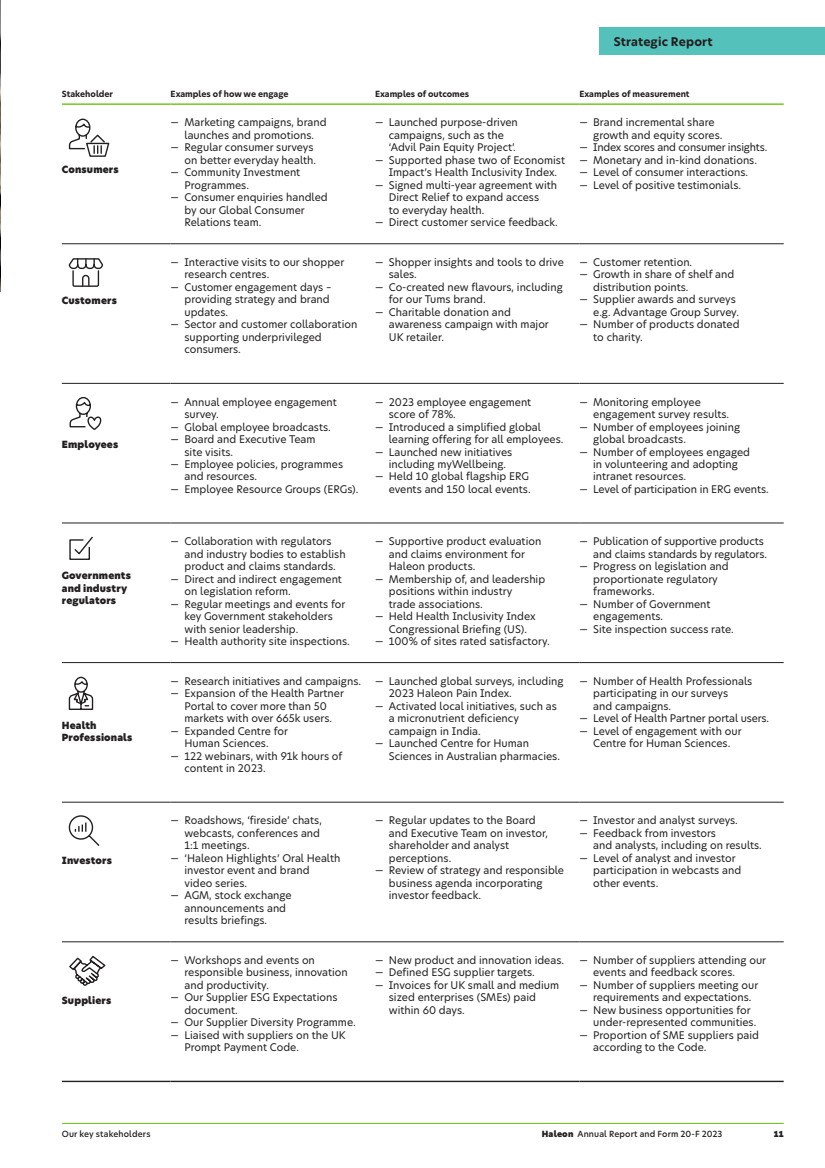
| Stakeholder Examples of how we engage Examples of outcomes Examples of measurement Consumers — Marketing campaigns, brand launches and promotions. — Regular consumer surveys on better everyday health. — Community Investment Programmes. — Consumer enquiries handled by our Global Consumer Relations team. — Launched purpose-driven campaigns, such as the ‘Advil Pain Equity Project’. — Supported phase two of Economist Impact’s Health Inclusivity Index. — Signed multi-year agreement with Direct Relief to expand access to everyday health. — Direct customer service feedback. — Brand incremental share growth and equity scores. — Index scores and consumer insights. — Monetary and in-kind donations. — Level of consumer interactions. — Level of positive testimonials. Customers — Interactive visits to our shopper research centres. — Customer engagement days – providing strategy and brand updates. — Sector and customer collaboration supporting underprivileged consumers. — Shopper insights and tools to drive sales. — Co-created new flavours, including for our Tums brand. — Charitable donation and awareness campaign with major UK retailer. — Customer retention. — Growth in share of shelf and distribution points. — Supplier awards and surveys e.g. Advantage Group Survey. — Number of products donated to charity. Employees — Annual employee engagement survey. — Global employee broadcasts. — Board and Executive Team site visits. — Employee policies, programmes and resources. — Employee Resource Groups (ERGs). — 2023 employee engagement score of 78%. — Introduced a simplified global learning offering for all employees. — Launched new initiatives including myWellbeing. — Held 10 global flagship ERG events and 150 local events. — Monitoring employee engagement survey results. — Number of employees joining global broadcasts. — Number of employees engaged in volunteering and adopting intranet resources. — Level of participation in ERG events. Governments and industry regulators — Collaboration with regulators and industry bodies to establish product and claims standards. — Direct and indirect engagement on legislation reform. — Regular meetings and events for key Government stakeholders with senior leadership. — Health authority site inspections. — Supportive product evaluation and claims environment for Haleon products. — Membership of, and leadership positions within industry trade associations. — Held Health Inclusivity Index Congressional Briefing (US). — 100% of sites rated satisfactory. — Publication of supportive products and claims standards by regulators. — Progress on legislation and proportionate regulatory frameworks. — Number of Government engagements. — Site inspection success rate. Health Professionals — Research initiatives and campaigns. — Expansion of the Health Partner Portal to cover more than 50 markets with over 665k users. — Expanded Centre for Human Sciences. — 122 webinars, with 91k hours of content in 2023. — Launched global surveys, including 2023 Haleon Pain Index. — Activated local initiatives, such as a micronutrient deficiency campaign in India. — Launched Centre for Human Sciences in Australian pharmacies. — Number of Health Professionals participating in our surveys and campaigns. — Level of Health Partner portal users. — Level of engagement with our Centre for Human Sciences. Investors — Roadshows, ‘fireside’ chats, webcasts, conferences and 1:1 meetings. — ‘Haleon Highlights’ Oral Health investor event and brand video series. — AGM, stock exchange announcements and results briefings. — Regular updates to the Board and Executive Team on investor, shareholder and analyst perceptions. — Review of strategy and responsible business agenda incorporating investor feedback. — Investor and analyst surveys. — Feedback from investors and analysts, including on results. — Level of analyst and investor participation in webcasts and other events. Suppliers — Workshops and events on responsible business, innovation and productivity. — Our Supplier ESG Expectations document. — Our Supplier Diversity Programme. — Liaised with suppliers on the UK Prompt Payment Code. — New product and innovation ideas. — Defined ESG supplier targets. — Invoices for UK small and medium sized enterprises (SMEs) paid within 60 days. — Number of suppliers attending our events and feedback scores. — Number of suppliers meeting our requirements and expectations. — New business opportunities for under-represented communities. — Proportion of SME suppliers paid according to the Code. Haleon Annual Report and Form 20-F 2023 11 Strategic Report Our key stakeholders |
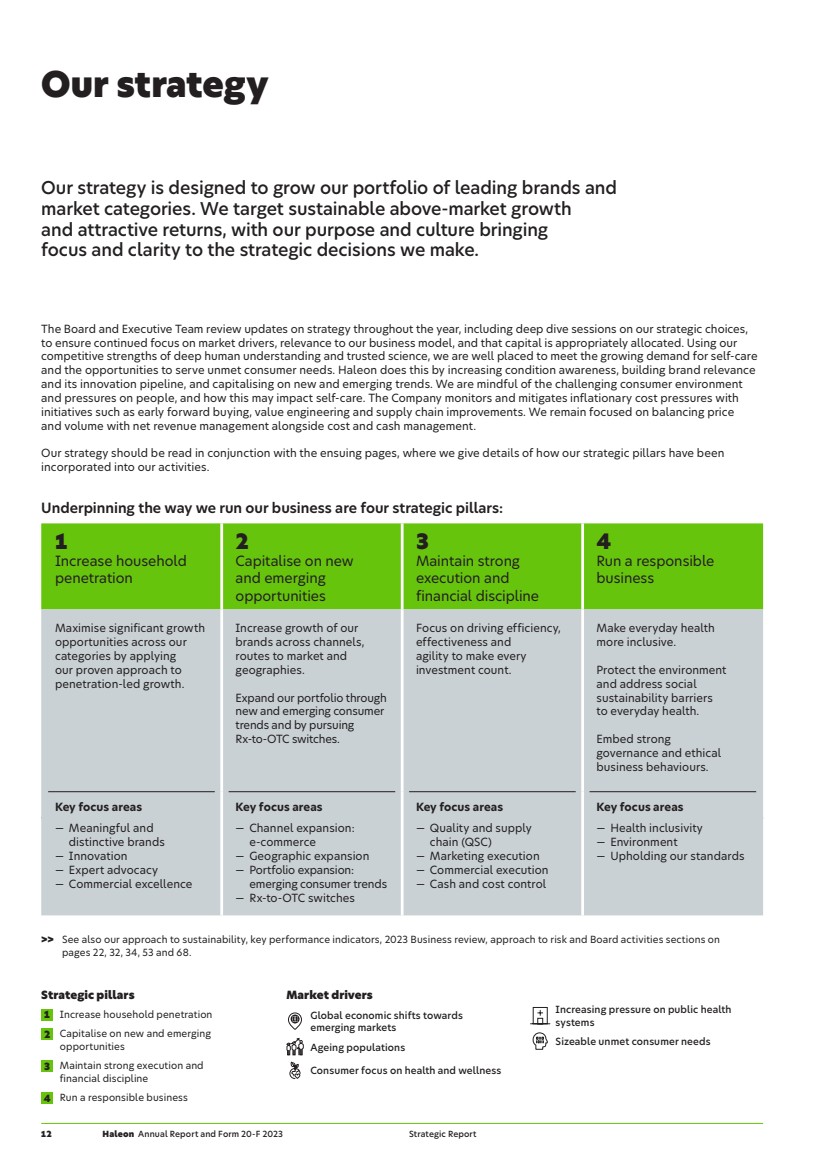
| Our strategy Our strategy is designed to grow our portfolio of leading brands and market categories. We target sustainable above-market growth and attractive returns, with our purpose and culture bringing focus and clarity to the strategic decisions we make. The Board and Executive Team review updates on strategy throughout the year, including deep dive sessions on our strategic choices, to ensure continued focus on market drivers, relevance to our business model, and that capital is appropriately allocated. Using our competitive strengths of deep human understanding and trusted science, we are well placed to meet the growing demand for self-care and the opportunities to serve unmet consumer needs. Haleon does this by increasing condition awareness, building brand relevance and its innovation pipeline, and capitalising on new and emerging trends. We are mindful of the challenging consumer environment and pressures on people, and how this may impact self-care. The Company monitors and mitigates inflationary cost pressures with initiatives such as early forward buying, value engineering and supply chain improvements. We remain focused on balancing price and volume with net revenue management alongside cost and cash management. Our strategy should be read in conjunction with the ensuing pages, where we give details of how our strategic pillars have been incorporated into our activities. Underpinning the way we run our business are four strategic pillars: 1 Increase household penetration 2 Capitalise on new and emerging opportunities 3 Maintain strong execution and financial discipline 4 Run a responsible business Maximise significant growth opportunities across our categories by applying our proven approach to penetration-led growth. Increase growth of our brands across channels, routes to market and geographies. Expand our portfolio through new and emerging consumer trends and by pursuing Rx-to-OTC switches. Focus on driving efficiency, effectiveness and agility to make every investment count. Make everyday health more inclusive. Protect the environment and address social sustainability barriers to everyday health. Embed strong governance and ethical business behaviours. Key focus areas — Meaningful and distinctive brands — Innovation — Expert advocacy — Commercial excellence Key focus areas — Channel expansion: e-commerce — Geographic expansion — Portfolio expansion: emerging consumer trends — Rx-to-OTC switches Key focus areas — Quality and supply chain (QSC) — Marketing execution — Commercial execution — Cash and cost control Key focus areas — Health inclusivity — Environment — Upholding our standards Market drivers Global economic shifts towards emerging markets Ageing populations Consumer focus on health and wellness Increasing pressure on public health systems Sizeable unmet consumer needs Strategic pillars 1 Increase household penetration 2 Capitalise on new and emerging opportunities 3 Maintain strong execution and financial discipline 4 Run a responsible business >> See also our approach to sustainability, key performance indicators, 2023 Business review, approach to risk and Board activities sections on pages 22, 32, 34, 53 and 68. 12 Haleon Annual Report and Form 20-F 2023 Strategic Report |
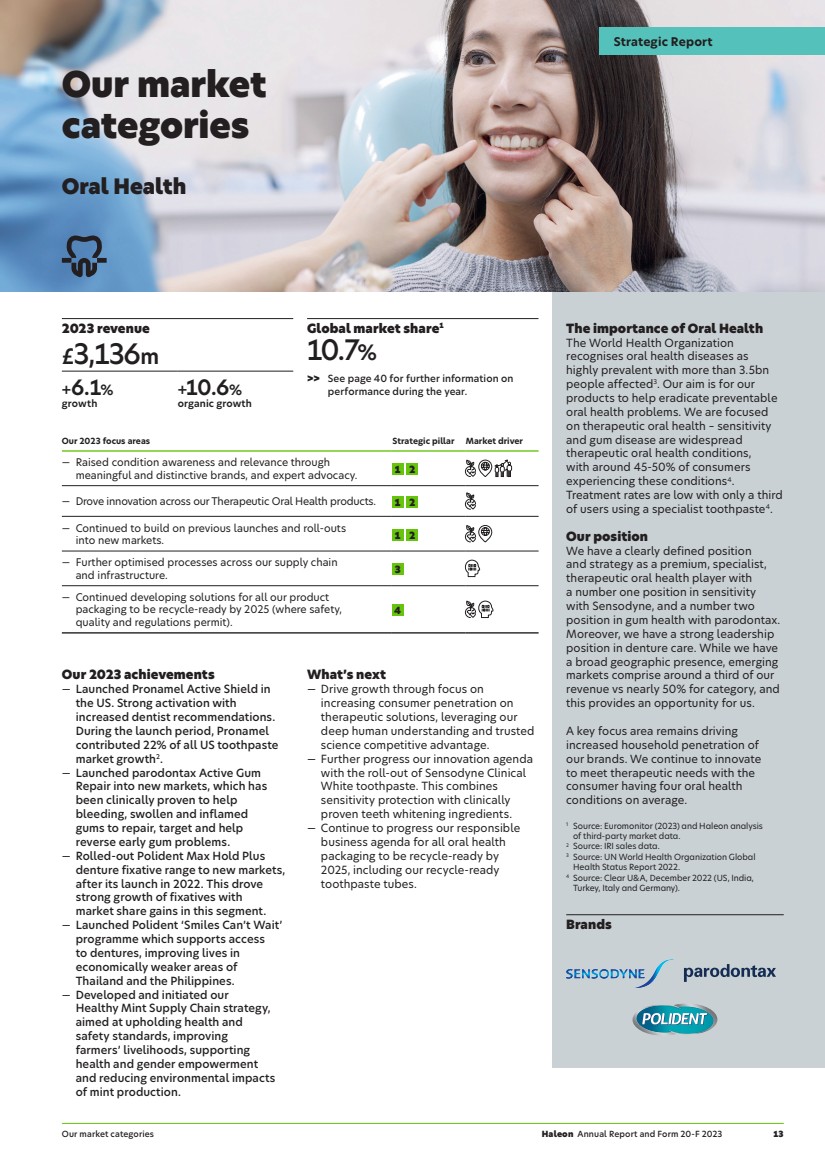
| Brands Our market categories Oral Health 2023 revenue £3,136m +6.1% growth +10.6% organic growth Global market share1 10.7% >> See page 40 for further information on performance during the year. Our 2023 focus areas Strategic pillar Market driver — Raised condition awareness and relevance through meaningful and distinctive brands, and expert advocacy. 1 2 — Drove innovation across our Therapeutic Oral Health products. 1 2 — Continued to build on previous launches and roll-outs into new markets. 1 2 — Further optimised processes across our supply chain and infrastructure. 3 — Continued developing solutions for all our product packaging to be recycle-ready by 2025 (where safety, quality and regulations permit). 4 Our 2023 achievements — Launched Pronamel Active Shield in the US. Strong activation with increased dentist recommendations. During the launch period, Pronamel contributed 22% of all US toothpaste market growth2. — Launched parodontax Active Gum Repair into new markets, which has been clinically proven to help bleeding, swollen and inflamed gums to repair, target and help reverse early gum problems. — Rolled-out Polident Max Hold Plus denture fixative range to new markets, after its launch in 2022. This drove strong growth of fixatives with market share gains in this segment. — Launched Polident ‘Smiles Can’t Wait’ programme which supports access to dentures, improving lives in economically weaker areas of Thailand and the Philippines. — Developed and initiated our Healthy Mint Supply Chain strategy, aimed at upholding health and safety standards, improving farmers’ livelihoods, supporting health and gender empowerment and reducing environmental impacts of mint production. What’s next — Drive growth through focus on increasing consumer penetration on therapeutic solutions, leveraging our deep human understanding and trusted science competitive advantage. — Further progress our innovation agenda with the roll-out of Sensodyne Clinical White toothpaste. This combines sensitivity protection with clinically proven teeth whitening ingredients. — Continue to progress our responsible business agenda for all oral health packaging to be recycle-ready by 2025, including our recycle-ready toothpaste tubes. The importance of Oral Health The World Health Organization recognises oral health diseases as highly prevalent with more than 3.5bn people affected3. Our aim is for our products to help eradicate preventable oral health problems. We are focused on therapeutic oral health – sensitivity and gum disease are widespread therapeutic oral health conditions, with around 45-50% of consumers experiencing these conditions4. Treatment rates are low with only a third of users using a specialist toothpaste4. Our position We have a clearly defined position and strategy as a premium, specialist, therapeutic oral health player with a number one position in sensitivity with Sensodyne, and a number two position in gum health with parodontax. Moreover, we have a strong leadership position in denture care. While we have a broad geographic presence, emerging markets comprise around a third of our revenue vs nearly 50% for category, and this provides an opportunity for us. A key focus area remains driving increased household penetration of our brands. We continue to innovate to meet therapeutic needs with the consumer having four oral health conditions on average. 1 Source: Euromonitor (2023) and Haleon analysis of third-party market data. 2 Source: IRI sales data. 3 Source: UN World Health Organization Global Health Status Report 2022. 4 Source: Clear U&A, December 2022 (US, India, Turkey, Italy and Germany). Haleon Annual Report and Form 20-F 2023 13 Strategic Report Our market categories |
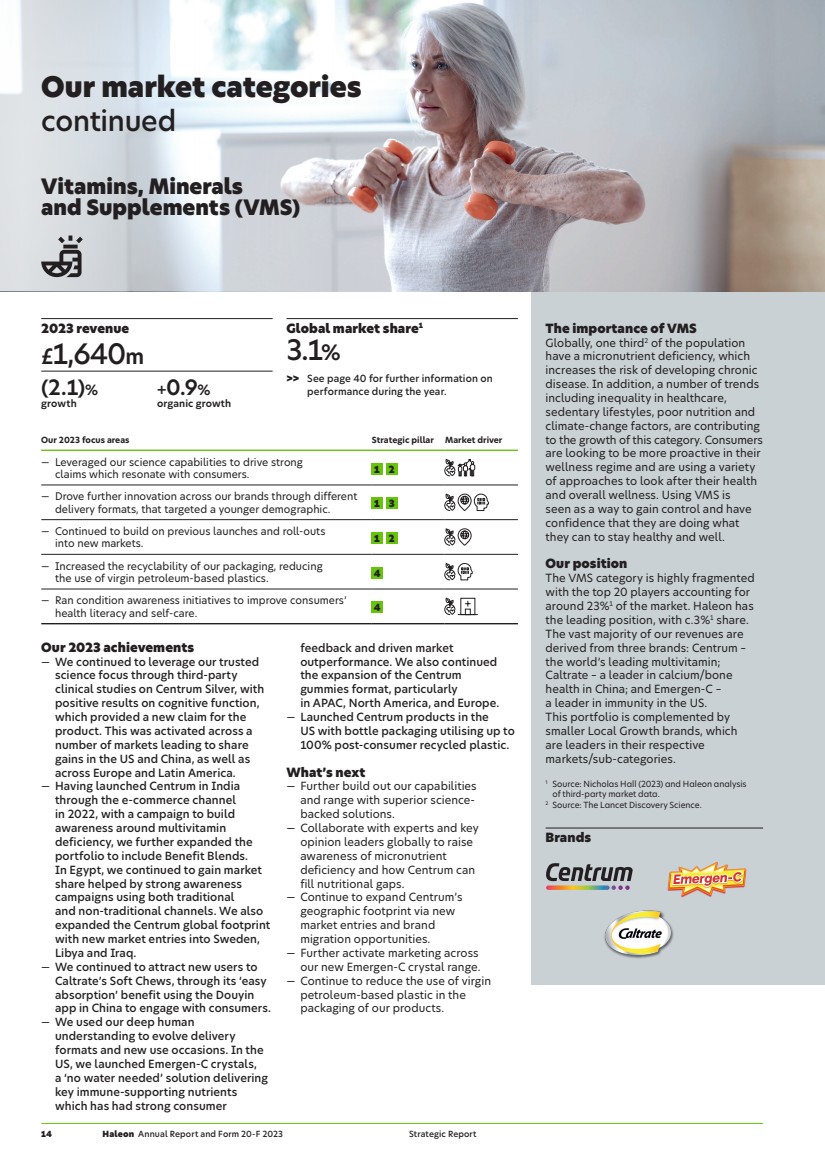
| Brands Our market categories continued Vitamins, Minerals and Supplements (VMS) 2023 revenue £1,640m (2.1)% growth +0.9% organic growth Global market share1 3.1% >> See page 40 for further information on performance during the year. Our 2023 focus areas Strategic pillar Market driver — Leveraged our science capabilities to drive strong claims which resonate with consumers. 1 2 — Drove further innovation across our brands through different delivery formats, that targeted a younger demographic. 1 3 — Continued to build on previous launches and roll-outs into new markets. 1 2 — Increased the recyclability of our packaging, reducing the use of virgin petroleum-based plastics. 4 — Ran condition awareness initiatives to improve consumers’ health literacy and self-care. 4 Our 2023 achievements — We continued to leverage our trusted science focus through third-party clinical studies on Centrum Silver, with positive results on cognitive function, which provided a new claim for the product. This was activated across a number of markets leading to share gains in the US and China, as well as across Europe and Latin America. — Having launched Centrum in India through the e-commerce channel in 2022, with a campaign to build awareness around multivitamin deficiency, we further expanded the portfolio to include Benefit Blends. In Egypt, we continued to gain market share helped by strong awareness campaigns using both traditional and non-traditional channels. We also expanded the Centrum global footprint with new market entries into Sweden, Libya and Iraq. — We continued to attract new users to Caltrate’s Soft Chews, through its ‘easy absorption’ benefit using the Douyin app in China to engage with consumers. — We used our deep human understanding to evolve delivery formats and new use occasions. In the US, we launched Emergen-C crystals, a ‘no water needed’ solution delivering key immune-supporting nutrients which has had strong consumer feedback and driven market outperformance. We also continued the expansion of the Centrum gummies format, particularly in APAC, North America, and Europe. — Launched Centrum products in the US with bottle packaging utilising up to 100% post-consumer recycled plastic. What’s next — Further build out our capabilities and range with superior science-backed solutions. — Collaborate with experts and key opinion leaders globally to raise awareness of micronutrient deficiency and how Centrum can fill nutritional gaps. — Continue to expand Centrum’s geographic footprint via new market entries and brand migration opportunities. — Further activate marketing across our new Emergen-C crystal range. — Continue to reduce the use of virgin petroleum-based plastic in the packaging of our products. The importance of VMS Globally, one third2 of the population have a micronutrient deficiency, which increases the risk of developing chronic disease. In addition, a number of trends including inequality in healthcare, sedentary lifestyles, poor nutrition and climate-change factors, are contributing to the growth of this category. Consumers are looking to be more proactive in their wellness regime and are using a variety of approaches to look after their health and overall wellness. Using VMS is seen as a way to gain control and have confidence that they are doing what they can to stay healthy and well. Our position The VMS category is highly fragmented with the top 20 players accounting for around 23%1 of the market. Haleon has the leading position, with c.3%1 share. The vast majority of our revenues are derived from three brands: Centrum – the world’s leading multivitamin; Caltrate – a leader in calcium/bone health in China; and Emergen-C – a leader in immunity in the US. This portfolio is complemented by smaller Local Growth brands, which are leaders in their respective markets/sub-categories. 1 Source: Nicholas Hall (2023) and Haleon analysis of third-party market data. 2 Source: The Lancet Discovery Science. 14 Haleon Annual Report and Form 20-F 2023 Strategic Report |
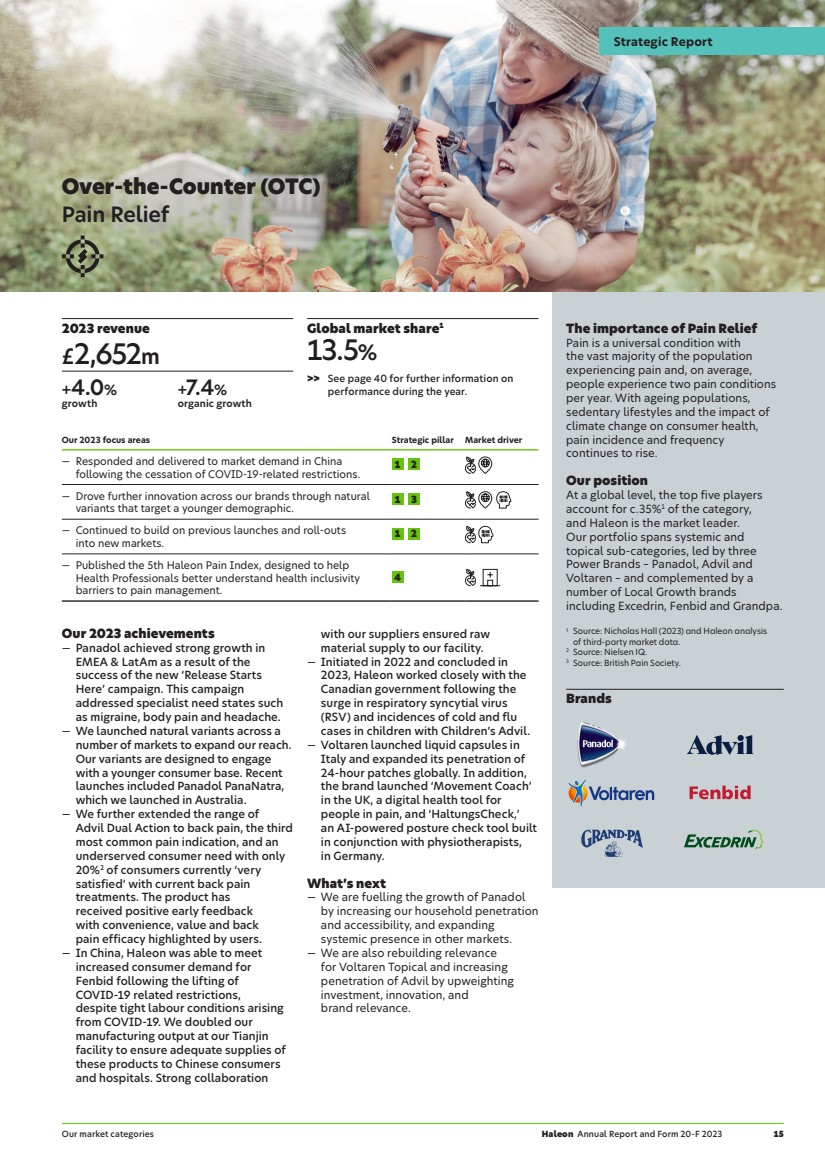
| Brands Over-the-Counter (OTC) Pain Relief 2023 revenue £2,652m +4.0% growth +7.4% organic growth Global market share1 13.5% >> See page 40 for further information on performance during the year. Our 2023 focus areas Strategic pillar Market driver — Responded and delivered to market demand in China following the cessation of COVID-19-related restrictions. 1 2 — Drove further innovation across our brands through natural variants that target a younger demographic. 1 3 — Continued to build on previous launches and roll-outs into new markets. 1 2 — Published the 5th Haleon Pain Index, designed to help Health Professionals better understand health inclusivity barriers to pain management. 4 Our 2023 achievements — Panadol achieved strong growth in EMEA & LatAm as a result of the success of the new ‘Release Starts Here’ campaign. This campaign addressed specialist need states such as migraine, body pain and headache. — We launched natural variants across a number of markets to expand our reach. Our variants are designed to engage with a younger consumer base. Recent launches included Panadol PanaNatra, which we launched in Australia. — We further extended the range of Advil Dual Action to back pain, the third most common pain indication, and an underserved consumer need with only 20%2 of consumers currently ‘very satisfied’ with current back pain treatments. The product has received positive early feedback with convenience, value and back pain efficacy highlighted by users. — In China, Haleon was able to meet increased consumer demand for Fenbid following the lifting of COVID-19 related restrictions, despite tight labour conditions arising from COVID-19. We doubled our manufacturing output at our Tianjin facility to ensure adequate supplies of these products to Chinese consumers and hospitals. Strong collaboration with our suppliers ensured raw material supply to our facility. — Initiated in 2022 and concluded in 2023, Haleon worked closely with the Canadian government following the surge in respiratory syncytial virus (RSV) and incidences of cold and flu cases in children with Children’s Advil. — Voltaren launched liquid capsules in Italy and expanded its penetration of 24-hour patches globally. In addition, the brand launched ‘Movement Coach’ in the UK, a digital health tool for people in pain, and ‘HaltungsCheck,’ an AI-powered posture check tool built in conjunction with physiotherapists, in Germany. What’s next — We are fuelling the growth of Panadol by increasing our household penetration and accessibility, and expanding systemic presence in other markets. — We are also rebuilding relevance for Voltaren Topical and increasing penetration of Advil by upweighting investment, innovation, and brand relevance. The importance of Pain Relief Pain is a universal condition with the vast majority of the population experiencing pain and, on average, people experience two pain conditions per year. With ageing populations, sedentary lifestyles and the impact of climate change on consumer health, pain incidence and frequency continues to rise. Our position At a global level, the top five players account for c.35%1 of the category, and Haleon is the market leader. Our portfolio spans systemic and topical sub-categories, led by three Power Brands – Panadol, Advil and Voltaren – and complemented by a number of Local Growth brands including Excedrin, Fenbid and Grandpa. 1 Source: Nicholas Hall (2023) and Haleon analysis of third-party market data. 2 Source: Nielsen IQ. 3 Source: British Pain Society. Haleon Annual Report and Form 20-F 2023 15 Strategic Report Our market categories |
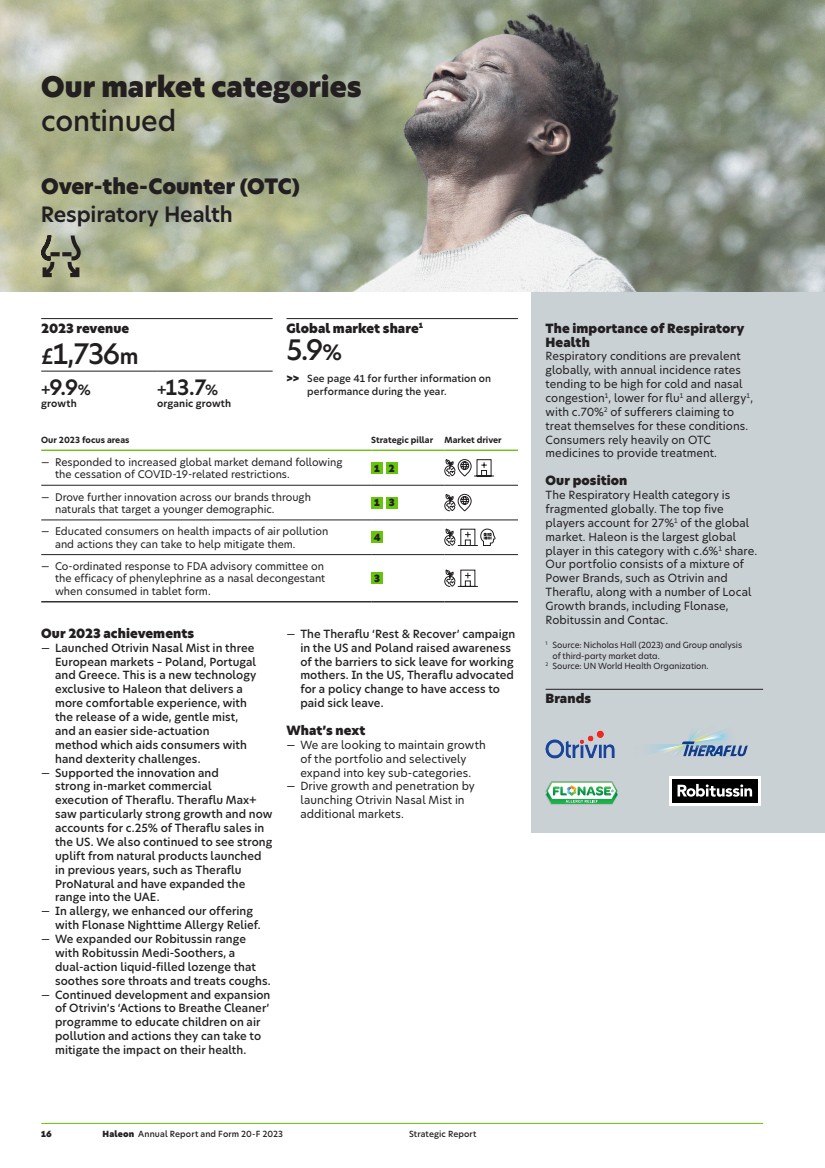
| Brands Our market categories continued Over-the-Counter (OTC) Respiratory Health 2023 revenue £1,736m +9.9% growth +13.7% organic growth Global market share1 5.9% >> See page 41 for further information on performance during the year. Our 2023 focus areas Strategic pillar Market driver — Responded to increased global market demand following the cessation of COVID-19-related restrictions. 1 2 — Drove further innovation across our brands through naturals that target a younger demographic. 1 3 — Educated consumers on health impacts of air pollution and actions they can take to help mitigate them. 4 — Co-ordinated response to FDA advisory committee on the efficacy of phenylephrine as a nasal decongestant when consumed in tablet form. 3 Our 2023 achievements — Launched Otrivin Nasal Mist in three European markets – Poland, Portugal and Greece. This is a new technology exclusive to Haleon that delivers a more comfortable experience, with the release of a wide, gentle mist, and an easier side-actuation method which aids consumers with hand dexterity challenges. — Supported the innovation and strong in-market commercial execution of Theraflu. Theraflu Max+ saw particularly strong growth and now accounts for c.25% of Theraflu sales in the US. We also continued to see strong uplift from natural products launched in previous years, such as Theraflu ProNatural and have expanded the range into the UAE. — In allergy, we enhanced our offering with Flonase Nighttime Allergy Relief. — We expanded our Robitussin range with Robitussin Medi-Soothers, a dual-action liquid-filled lozenge that soothes sore throats and treats coughs. — Continued development and expansion of Otrivin’s ‘Actions to Breathe Cleaner’ programme to educate children on air pollution and actions they can take to mitigate the impact on their health. — The Theraflu ‘Rest & Recover’ campaign in the US and Poland raised awareness of the barriers to sick leave for working mothers. In the US, Theraflu advocated for a policy change to have access to paid sick leave. What’s next — We are looking to maintain growth of the portfolio and selectively expand into key sub-categories. — Drive growth and penetration by launching Otrivin Nasal Mist in additional markets. The importance of Respiratory Health Respiratory conditions are prevalent globally, with annual incidence rates tending to be high for cold and nasal congestion1, lower for flu1 and allergy1, with c.70%2 of sufferers claiming to treat themselves for these conditions. Consumers rely heavily on OTC medicines to provide treatment. Our position The Respiratory Health category is fragmented globally. The top five players account for 27%1 of the global market. Haleon is the largest global player in this category with c.6%1 share. Our portfolio consists of a mixture of Power Brands, such as Otrivin and Theraflu, along with a number of Local Growth brands, including Flonase, Robitussin and Contac. 1 Source: Nicholas Hall (2023) and Group analysis of third-party market data. 2 Source: UN World Health Organization. 16 Haleon Annual Report and Form 20-F 2023 Strategic Report |
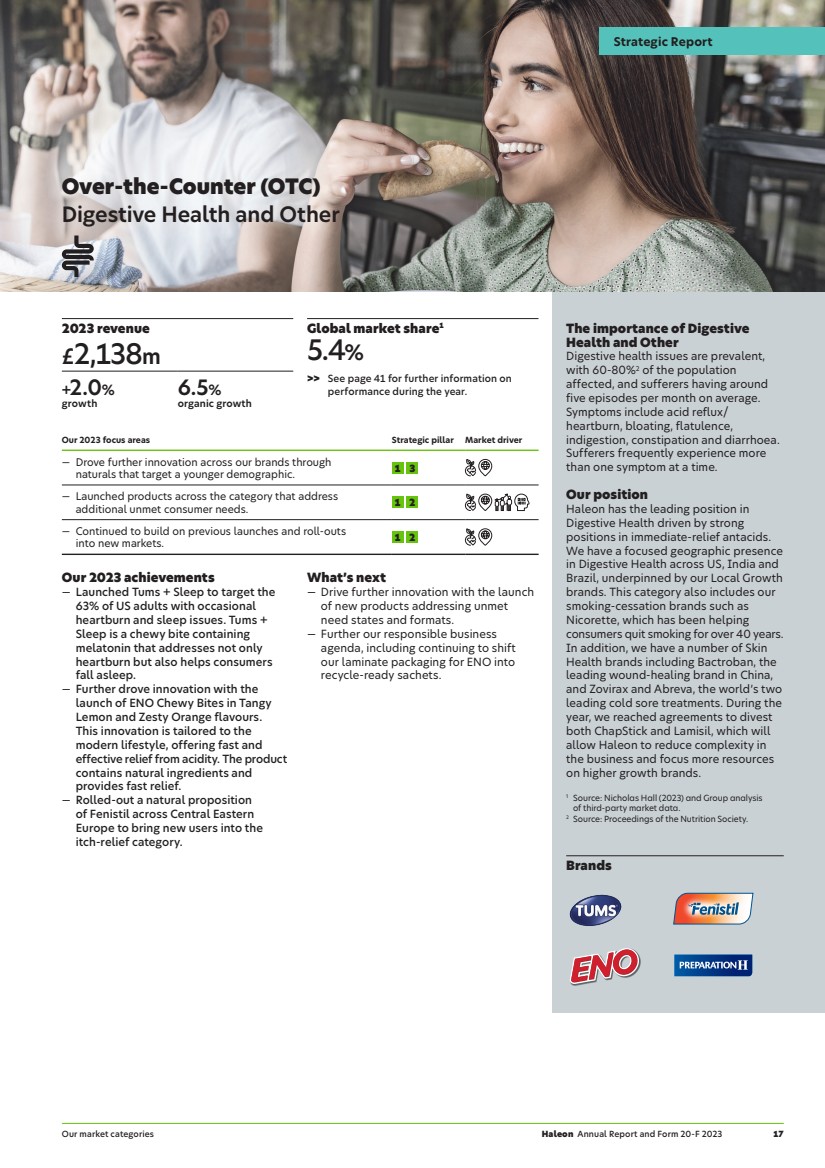
| Brands Over-the-Counter (OTC) Digestive Health and Other 2023 revenue £2,138m +2.0% growth 6.5% organic growth Global market share1 5.4% >> See page 41 for further information on performance during the year. Our 2023 focus areas Strategic pillar Market driver — Drove further innovation across our brands through naturals that target a younger demographic. 1 3 — Launched products across the category that address additional unmet consumer needs. 1 2 — Continued to build on previous launches and roll-outs into new markets. 1 2 Our 2023 achievements — Launched Tums + Sleep to target the 63% of US adults with occasional heartburn and sleep issues. Tums + Sleep is a chewy bite containing melatonin that addresses not only heartburn but also helps consumers fall asleep. — Further drove innovation with the launch of ENO Chewy Bites in Tangy Lemon and Zesty Orange flavours. This innovation is tailored to the modern lifestyle, offering fast and effective relief from acidity. The product contains natural ingredients and provides fast relief. — Rolled-out a natural proposition of Fenistil across Central Eastern Europe to bring new users into the itch-relief category. What’s next — Drive further innovation with the launch of new products addressing unmet need states and formats. — Further our responsible business agenda, including continuing to shift our laminate packaging for ENO into recycle-ready sachets. The importance of Digestive Health and Other Digestive health issues are prevalent, with 60-80%2 of the population affected, and sufferers having around five episodes per month on average. Symptoms include acid reflux/ heartburn, bloating, flatulence, indigestion, constipation and diarrhoea. Sufferers frequently experience more than one symptom at a time. Our position Haleon has the leading position in Digestive Health driven by strong positions in immediate-relief antacids. We have a focused geographic presence in Digestive Health across US, India and Brazil, underpinned by our Local Growth brands. This category also includes our smoking-cessation brands such as Nicorette, which has been helping consumers quit smoking for over 40 years. In addition, we have a number of Skin Health brands including Bactroban, the leading wound-healing brand in China, and Zovirax and Abreva, the world’s two leading cold sore treatments. During the year, we reached agreements to divest both ChapStick and Lamisil, which will allow Haleon to reduce complexity in the business and focus more resources on higher growth brands. 1 Source: Nicholas Hall (2023) and Group analysis of third-party market data. 2 Source: Proceedings of the Nutrition Society. Haleon Annual Report and Form 20-F 2023 17 Strategic Report Our market categories |
| Our culture and people To ensure the long-term success of Haleon, we are focused on our purpose led culture. We reinforce this through our core value, key behaviours and leadership standards. In addition, a range of responsible business standards, policies and practices, including our Code of Conduct, provide a framework to guide our approach in delivering our strategy and business performance. Our purpose: To deliver better everyday health with humanity Our core value: Seeking to always do the right thing Our key behaviours: Go beyond Do what matters most Keep it human Our leadership standards: Drive growth Deeply understand our consumers and customers Build ‘one’ Haleon Motivate and unleash potential Our culture is supported by our governance and organisational structure. The Board is responsible for, and monitors, our culture, including adherence to our core value and behaviours to ensure they are embedded and aligned to our strategy and purpose. The Directors receive regular reports on all aspects of culture, including reports from our Speak Up channel and results from our employee survey. The CEO and Executive Team are responsible for embedding our culture on a day-to-day basis, as well as for implementing our strategy, monitoring the Group’s performance, and providing updates to the Board on overall performance, risk management and our system of internal controls. We have 14 business units, alongside global category and brand teams, who are responsible for delivering our strategy, innovation agenda and global brand campaigns. They are supported by global functions, in key areas including ethics and compliance, corporate affairs, sustainability, finance, human resources, legal, marketing and R&D. During 2023, we embarked on a three-year productivity programme to transition to an organisation focused on efficiency and agility ensuring we deliver our purpose and strategy. This has resulted in structural changes and severances, which we have aimed to handle sensitively and in compliance with all applicable laws and regulations. Inevitably, this has had a short-term impact on our culture as we embed our new structure and ways of working. Additional details are in Note 6 to the Consolidated Financial Statements. >> Further details about our governance structure and Board activities, including consideration of culture are in the Corporate Governance section from page 61. Measuring our culture Measuring and tracking our culture is crucial to ensuring we deliver our purpose and strategy, and remain a trusted company. We have a range of indicators including consumer, customer and supplier feedback forums mentioned in our stakeholder section, and not limited to the examples below: — Annual mandatory Code of Conduct training including anti-bribery and corruption and keeping data secure for all the Board, Executive Team, employees and third-party temporary workers, with a 98%1 completion rate in 2023. It is also part of onboarding requirements for new starters. — A framework of internal financial and operational controls, audit and assurance programmes that monitor the Company’s compliance with regulations and internal procedures and policies. Reports are sent to senior management, the Executive Team and the Audit & Risk Committee for monitoring, review and discussion. Where required, corrective measures are put in place to reinforce appropriate procedures. During 2023, no unsatisfactory rated internal audit reports were issued. — Haleon encourages anyone, whether working for the Company or not, to speak up about misconduct, breaches of policy or procedures, and suspected violations of laws and regulations. Concerns are managed independently and can be raised in 35 languages via web form, email, telephone, or post. All cases are handled in accordance with Haleon’s investigatory principles: humanity, confidentiality, proportionality and non-retaliation. Regular updates and investigation reports are reviewed by senior management and the Audit & Risk Committee, and learnings are converted into recommendations and updated training. >> See also our business model, key stakeholders, strategy, approach to risk and financial statement sections on pages 8, 10, 12, 53 and from page 97. 1 Non-completion due to leavers during the period. 18 Haleon Annual Report and Form 20-F 2023 Strategic Report |
| — Our annual employee survey measures both employee engagement and our wider culture. Our 2023 results showed 78% of employees felt that Haleon fulfils its core engagement values, and 78% feel that it fulfils its core cultural objectives. Areas where we do well include our customer focus, commitment to the environment, society and business ethics, whereas we need to continue to focus on our work processes and how we collaborate. — We measure our environmental, health and safety performance across the Company and conduct risk-based audits that the Executive Team and Board monitor. Metrics include, but are not limited to, our reportable injury and illness rate, which in 2023 was 0.14 per 100,000 hours worked 1 , and there were no fatalities2 .. — We conduct regular conversations and year-end reviews with employees, which include them demonstrating their actions and contributions during the year against our core value and behaviours, and where applicable, leadership standards. >> See also our key stakeholders and key performance indicator sections on pages 10 and 32. >> See also the Audit & Risk Committee Report from page 72. 1 Includes employees and third-party temporary workers. 2 Includes employees, third-party temporary workers and contractors. Our people Our people comprise of permanent and fixed-term direct employees. Our business is also supported by third-party temporary workers and contractors. We aspire to have people policies that provide equal opportunities, create an inclusive culture and support our purpose, strategy and long-term success. Our initiatives and policies reflect relevant employment law, including the provisions of the Universal Declaration of Human Rights and International Labour Organization (ILO) Declaration on Fundamental Principles and Rights at Work. Attracting, fostering and developing talent During 2023, we worked to strengthen our recruitment approach so that we consistently attract leading talent, maintain a diverse employee-base and provide opportunities for career and skills development to retain our existing talent. New hires were made in roles and locations strategically important to business success, and we made incremental improvements in key performance areas. However, there remain significant opportunities to optimise our hiring processes and experiences for candidates and stakeholders. We are focused on this as part of our three-year productivity programme. Development and learning at Haleon has three objectives: build the right competencies to stay safe and compliant within our regulatory environment; develop strategic capabilities; and provide employees with opportunities to grow and reach their potential. In 2023, we introduced a simplified global learning offering to all employees through our internal development portal and external content libraries with a range of development courses, videos and articles, and supported by a mini-MBA in deep human understanding. To embed our leadership standards, build capabilities and develop leadership behaviours, we established a global leadership development programme. In addition, a suite of self-serve, leader-led sessions were launched to support all new teams as the business continues to transform, which will be expanded in 2024. We also launched a simplified approach to talent management based on our Leadership Standards, including holding talent reviews throughout the year to understand our talent landscape and the strategic capabilities needed to drive business growth. Furthermore, we evolved and simplified our approach to assessing and rewarding employee performance. Through regular conversations, employee performance is reviewed against objectives, and performance outcomes are calibrated across the business. Employee health and wellbeing Supporting our employees’ health and wellbeing, building a culture that allows them to be at their best and thrive is a priority for us. Building on the initiatives we already offer and as outlined in our 2022 Annual Report, in 2023 we focused on the following: — MyWellbeing, a holistic energy-management and resilience course that equips participants with skills and tools to optimise their own wellbeing. — Micro-learnings, themed webinars and resources to increase capability for oneself and others. — A health, safety and wellbeing leadership programme available to all our site leadership and business unit leadership teams, which we will embed into our wider leadership curriculum in 2024. — Developing a respectful workplace training module, focused on preventing harassment and retaliation. Looking ahead, we plan to review and refresh our preventative health programme, which gives employees and their eligible dependants access to a core set of healthcare services. We also expect to launch a new occupational health and wellbeing standard to improve governance and oversight of our initiatives, and refresh and relaunch our existing Mental Health Matters training for line managers. Workplace environment During 2023, we opened new offices in both London, UK, and Bengaluru, India, with sensory rooms and green and open spaces in which to connect, create and collaborate. Our Bengaluru office was awarded a ‘Gold’ accessibility score by Mobility Mojo for offering a safe environment for employees with disabilities and neurodivergence. Where possible, employees are able to embrace our ‘Hybrid at Haleon’ philosophy, which empowers managers and teams to trust each other and find the right approach to drive performance. For those working remotely, we have enhanced controls and systems to ensure our Company data is secure, including awareness campaigns as part of our wider commitment to the responsible use, storage and protection of Company and personal data. Important data is safeguarded from corruption, compromise or loss and we have appropriate data retention schedules to guide us as to when to delete data. >> See also our cyber-security disclosure on page 21. >> Further details about employees can be found across the Report including our workforce engagement disclosure on page 70, and Note 7 on page 128. Haleon Annual Report and Form 20-F 2023 19 Strategic Report Our culture and people |
| Our culture and people continued Championing diversity, equity and inclusion (DEI) We are committed to creating a diverse, inclusive and respectful workplace, and view this as key to delivering our purpose and strategy. We acknowledge that this is an area for continual improvement, including further strengthening our diversity data and ensuring it is integrated into our culture. Our position statement applies to all employees and third-party temporary workers. Our ambition is focused on delivering three strategic priorities: 1 Employee belonging: workplace inclusion – create a work environment that is inclusive and accessible where all employees feel like they belong, are valued and have tools to thrive. 2 Diverse representation: workforce diversity – attract, recruit, promote and retain the best talent that reflects a diverse workforce at all levels and areas of the business. 3 Societal change: community impact – leverage our expertise to enable health inclusivity through our business relationships, brands and research. Our global DEI council is sponsored by the Chief Human Resources Officer and chaired by the Global Head of Talent. The council meets quarterly to discuss priorities, drive accountability, and initiate, fund and oversee the implementation of Haleon’s global DEI activities. We have made progress against our DEI goals in 2023 with several initiatives that incorporate key areas of diversity, including ethnicity, disability, LGBTQ+ and gender. — Our diversity dashboard provides insights around gender, allowing us to track progress, and proactively communicate findings and recommendations back to the business. — We are piloting an athlete career transition (ACT) programme to support attracting and hiring diverse talent. — Our people-management development programme develops DEI capabilities, including how we address unconscious bias. We launched our diverse talent programme, designed to accelerate leadership potential and career progression, and have five cohorts set up for 2024. In addition, our four global ERGs successfully delivered 10 flagship events in 2023, with c.2,000 participants and 150 local events. Our ERGs help build our inclusive culture and are instrumental in providing different perspectives. >> See also our Nominations & Governance Committee Report on page 78. Company gender diversity As at 31 December 2023 Men Women Other Non-disclosed Total Directors 6 5 — — 11 Executive Team1 8 7 — — 15 Executive Team direct reports 51 48 — 1 100 Senior managers2 908 739 — 5 1,652 All employees 13,516 11,768 5 119 25,408 1 At 15 March 2024, the Executive Team comprised 8 men, 4 women and 12 members overall. 2 Comprises Leadership roles as defined in our glossary. Upholding our standards We are committed to transparency, integrity, consumer satisfaction, safety and compliance with all relevant laws and regulations. We have standards and policies in place to ensure we uphold the highest business ethics, including consumer and pharmacovigilance policies and processes. Our products undergo extensive quality testing and controls as part of our manufacturing processes. In addition, we have portals for consumers to get product information and report adverse reactions. Code of Conduct Our Code promotes ethical business conduct, and provides guidance to our Board and Executive Team, employees and third-party temporary workers. Failing to comply with our Code is deemed to be misconduct and can result in disciplinary action, including dismissal. Our suppliers, distributors, agents, consultants and contractors are also subject to many of its principles. — 19 principles. — Available in 17 languages. — Mixture of written standards and a decision tree approach to making the right choices and guidance on when to ask for advice. Anti-bribery and corruption (ABAC) Our ABAC Policy sets out our global principles, standards, requirements and zero-tolerance approach. All employees and third-party temporary workers must observe and uphold the policy. — Regular checks are run internally as part of our financial control procedures, and due diligence checks are performed on all high-risk suppliers. — During 2023, an update on the state of implementation of the policy was reported to the Executive Team and Audit & Risk Committee. Human rights Our Human Rights Policy sets out how we integrate human rights into our business operations and our relationships with suppliers. We seek to align our human rights procedures with international agreements and guidelines, such as the UN Guiding Principles on Business and Human Rights (UNGPs) and the Organisation for Economic Co-Operation and Development’s (OECD) Guidelines for Multinational Enterprises. We are committed to upholding the Universal Declaration of Human Rights and the core labour standards set out by the ILO. — Our Human Rights Steering Committee comprised of members of our Executive Team and senior management, provide oversight and support on key issues. It is responsible for approving and monitoring our human rights strategy and action plan, which is reported to the Environmental & Social Sustainability Committee annually. — We have key actions across three workstreams: building our capacity to understand human rights risks; strengthening due diligence processes; and investing in business relationships to prevent and mitigate risks and remediate impacts. — During 2023, we initiated a saliency assessment of human rights risks in Haleon’s value chain to enable us to focus on issues important to our business. 20 Haleon Annual Report and Form 20-F 2023 Strategic Report |
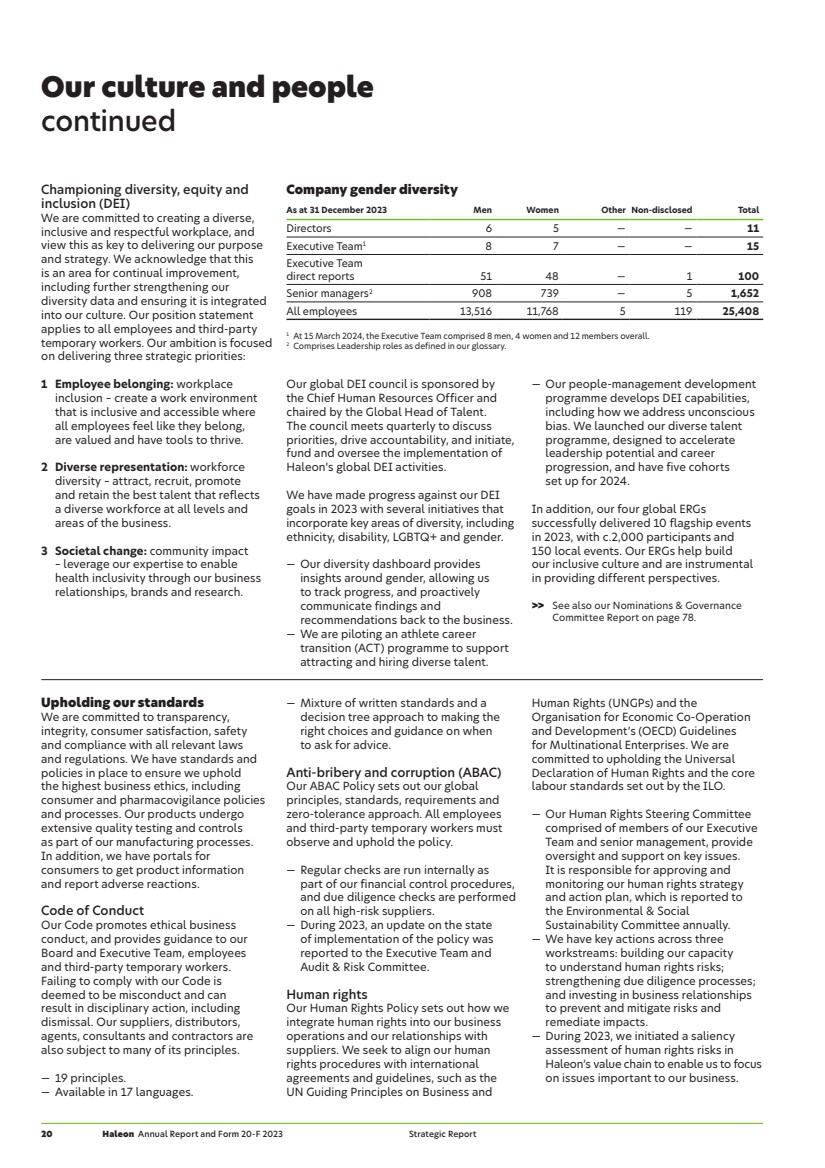
| — We developed an e-learning module, translated into 15 languages, which we launched in 2023 and will roll-out further in 2024. A facilitators’ pack was also developed for use at manufacturing sites where workers have no access to computers. — We developed an incident response and communications plan, and ran workshops for employees across key business functions. Responsible suppliers Haleon’s supply chain has significant scale and complexity with a mixture of direct and indirect supplies and services such as raw materials and logistics. We are a member of Manufacture 2030, a platform to drive consistency and transparency of supplier sustainability reporting. — Our Supplier Code of Conduct establishes the minimum environmental, social and ethical standards to be met by any entity that supplies products or services to Haleon. — We follow set processes for contracting with new suppliers, and those we continue to work with, including due diligence processes and using approved buying channels. — In 2023, we launched our Supplier ESG Expectations outlining targets that we want our suppliers to meet, such as moving to renewable electricity and ensuring certain materials are covered by industry-recognised certifications. — Our third-party risk management process seeks to assess risks across our supply chain, and where necessary we undertake targeted in-depth due diligence. We use a combination of EcoVadis and Sedex assessments and Pharmaceutical Supply Chain Initiative audits to assess risks to drive improvements. Health and safety We continue to embed our Environment, Health, Safety and Wellbeing Policy and three-year strategy to develop a zero-harm culture and reduce significant incidents. We have an environment, health and safety (EHS) management system and are focused on three pillars: to strengthen our health and safety culture and capability; prevent harm; and make it easier. Each pillar is supported by annual targets and objectives to drive continuous improvement, which has helped reduce the number of reportable and serious incidents. — We run risk-based health and safety training for employees and third-party temporary workers, which includes how to identify measures to reduce workplace risks. — All contractors working at Haleon sites receive induction training and instruction on working safely. — During 2023, we focused on refreshing and integrating our global EHS and engineering standards, reinforcing our 12 Life Saving Rules and deploying our Leading with Care programme to senior leaders across the Company. — Looking ahead, we are focused on risk assessment training, and further embedding our Leading with Care programme and suite of EHS and engineering standards. >> See also our statement of compliance on page 60 with links to our standards and policies, including our Code of Conduct and Modern Slavery Statement. Cyber-security As detailed in our approach to risk and risk factors, there is a risk that a cyber-security attack could compromise our ability to manufacture, distribute and sell our products and services to our customers. Our commitment to cyber-security is reflected in our ongoing investment into this area, which includes the use of advanced technologies and engagement of third-party experts to provide additional support and guidance. We have a dedicated cyber-security threat intelligence function focused on the threat landscape and attack vectors that are targeting healthcare providers, including ransomware threats. Cyber intelligence is integrated into our cyber-security risk management and governance processes. Haleon’s Chief Information Security Officer is responsible for the cyber-security function, and provides frequent updates including current threats, operational key risk indicators, and cyber-security maturity improvements to the Executive Team and Audit & Risk Committee, who have oversight of our information security and cyber risk strategy. Cyber-security risk updates are shared with the wider Board by the Committee. — Our Chief Information Security Officer has over 25 years of information technology and security experience. — External consultants are engaged to assess our cyber-security maturity against the US National Institute of Standards and Technology Cybersecurity Framework (NIST CSF). They help guide our plans and processes to best protect Haleon from threats including a framework for data controls which covers our digital supply chain. — We have a third-party risk management process in place ensuring that inherent risk assessments are completed for third-party suppliers with additional due diligence assessments completed for higher-risk suppliers. Processes include identification and mitigation of risks, risk assessments, adherence to information and control standards, and incident notification requirements in contracts. — We constantly look to mature our cyber-security systems and controls to keep pace with the threat landscape. Our preparedness activities include testing our response procedures and processes by performing simulations and crisis management exercises, and penetration testing to develop our response to potential incidents, such as ransomware attacks. Vulnerability management, monitoring and alerting processes are in place to help protect the Company against cyber attacks. — Our annual awareness campaigns promote our global cyber-security policies and procedures, handling of confidential data, social media and cyber-security practices, and remind employees of resources available to protect themselves, Haleon and consumers. Internal policies for protecting Company assets include protection of information, acceptable use of technology resources, AI and related procedures. We are focused on minimising risks through fostering secure practices and behaviours, for example, constant programmes aimed at recognising and reporting suspicious online behaviour or phishing. — During 2023, Haleon did not identify any significant cyber-security incidents. >> See also our approach to risk, Audit & Risk Committee Report and Risk factors on pages 53, 72 and 193. Haleon Annual Report and Form 20-F 2023 21 Strategic Report Our culture and people |
| Our approach to sustainability As a global leader in consumer healthcare, we believe Haleon is well placed to understand and help address several of the social and environmental barriers holding people back from achieving better everyday health. Our responsible business strategy is committed to making everyday health more inclusive, reducing our environmental impact, and operating with ethical and responsible standards of business conduct. In 2023, we established the Environmental & Social Sustainability Committee (ESS), reflecting the strategic importance of this area. Progress against our responsible business strategy was externally recognised in 2023, our first year of rating by several ESG indices. Haleon received a low-risk rating by Sustainalytics and was recognised as one of their 2024 ESG Top-Rated Companies. We were also added to the Dow Jones Sustainability Index Europe (DJSI) 2023, and S&P’s 2024 Global Sustainability Yearbook, based on our score in the top decile of the Personal Products Category. Health inclusivity In 2023, we empowered over 41 million people to be more included in opportunities for better everyday health1, through inclusive products, education programmes and services. We aim to empower 50 million people a year by 2025. We track the number of people engaging with a Haleon brand or expert initiative to improve their self-care. Our focus includes those who are discriminated against because of disability, age, race and ethnicity, gender and sexuality. We take action to improve health inclusivity by driving change through our brands, empowering self-care, investing in research and action, and building healthier communities through our community investment programmes. During 2023 we focused on: — The launch of ‘The Advil Pain Equity Project’ with a long-term aim to help address the bias and prejudice that Black people in America experience when they seek pain management. — In Thailand and the Philippines, Polident’s ‘Smiles Can’t Wait’ provided free dentures to over 1,500 people who otherwise were not able to afford them, and also provided accessible oral health check-ups, samples, and educational kits to over 50,000 people. — We expanded the reach of, and content available on, the Haleon Health Partner portal, an online database which includes tools and materials to support Health Professionals when they have conversations with patients. — We continued to support Economist Impact in their publication of the second phase of the Health Inclusivity Index (Index). Phase two of the Index included the measurement of experience of health inclusion across 42,000 people in 40 countries. The Index found that more than three in five people worldwide experience health exclusion, with vulnerable and younger populations the worst affected. — Following earthquakes in Turkey and Syria, Haleon worked with Direct Relief to sponsor dental clinics in the affected areas, which provided treatment for more than 10,000 people. Environment Haleon is focused on continually reducing the environmental impact of its products and operations. We are using leading industry standards and working with industry groups, peers and suppliers to achieve our environmental aims. We have set greenhouse gas (GHG) emissions reduction goals aligned to the Intergovernmental Panel on Climate Change (IPCC) pathway to 1.5°C and aim to achieve net zero carbon emissions from source to sale by 2040, aligned to guidance from The Climate Pledge and Race to Zero. Haleon also works to raise awareness of the linkages between climate change, air pollution and health, and has joined the Alliance for Clean Air. 1 Reporting period = 1 December 2022 – 30 November 2023. Where actual data on initiatives contributing to the goal has not been accessible, extrapolations have been applied in a conservative manner to determine indicative results. >> More information, including all ESG indices ratings, is available at www.haleon.com/our-impact/esg-reporting-hub >> More information on the Health Inclusivity Index is available at www.impact.economist.com/projects/health-inclusivity-index We continue to improve the data collection processes used to measure and track our Scope 3 emissions and virgin petroleum-based plastic footprint. We have updated our baseline year from 2020 to 2022, when we became a standalone business, as the 2022 data used to calculate and substantiate our packaging footprint and value chain emissions has greater availability and accuracy. Our virgin plastic reduction goal is calibrated considering limitations in the use of mechanically recycled plastic for healthcare products. We are working with suppliers to access bioplastics and chemically recycled resins suitable for healthcare products, whilst introducing mechanically recycled plastics in some product formats where permitted. 22 Haleon Annual Report and Form 20-F 2023 Strategic Report |
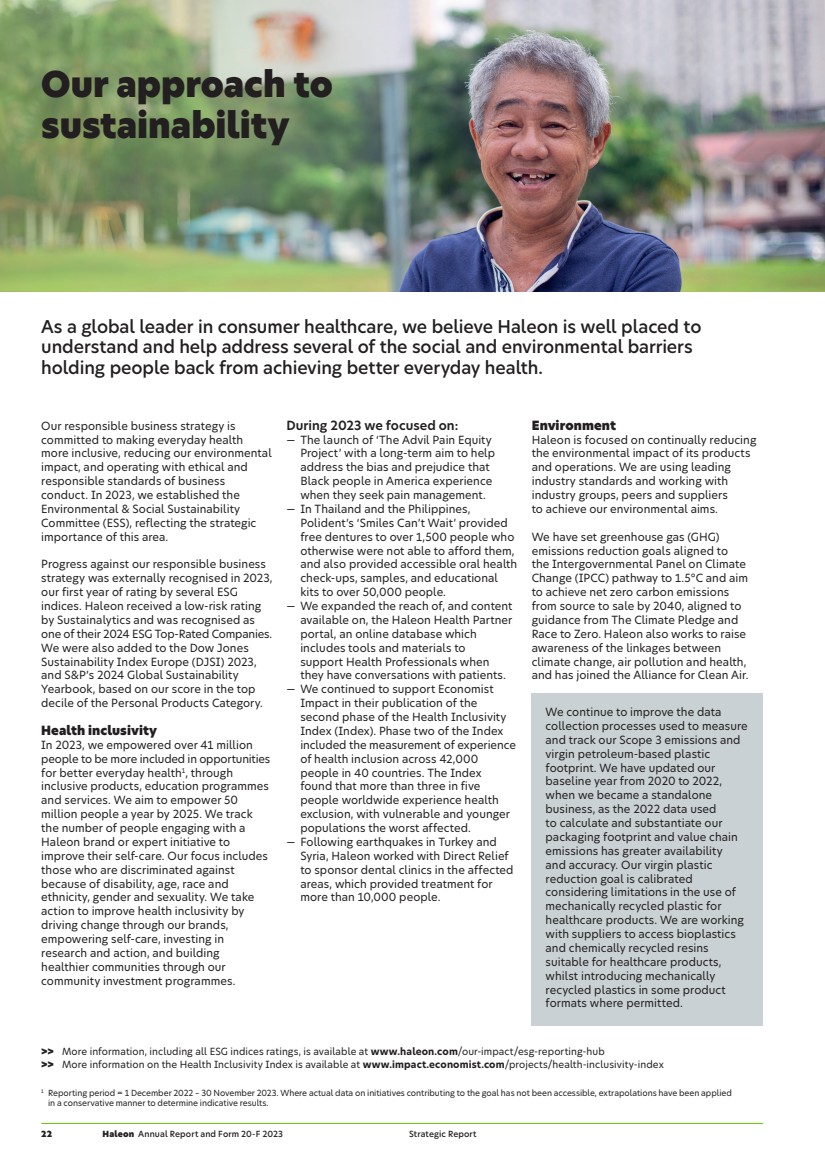
| Our aims 2023 Performance1 Empower millions of people a year to be more included in opportunities for better everyday health, empowering 50 million people a year by 2025. 41m+ (2022: 22m+) Reduce our net Scope 1 and 2 carbon emissions by 100% by 2030 vs a 2020 baseline2. 48%reduction (2022: 44% reduction) Reduce our Scope 3 carbon emissions from source to sale by 42% by 2030 vs a 2022 baseline. 4% increase in our estimated Scope 3 emissions footprint Reduce our use of virgin petroleum-based plastic by 10% by 2025, and a third by 2030 vs a 2022 baseline3 .. 3% increase in our estimated virgin petroleum-based plastic footprint Develop solutions for all product packaging to be recycle-ready by 2025, as part of our goal to make all packaging recyclable or reusable by 2030, where safety, quality and regulations permit. 70% recycle-ready packaging (2022: 65% recycle-ready) All key agricultural, forest and marine-derived materials used in our ingredients and packaging to be sustainably sourced and deforestation-free by 20304. 91% of palm oil derivatives (2022: 92% of palm oil derivatives) 48% of paper-based packaging In 2023, our Scope 3 emissions and virgin petroleum-based plastic footprints have increased in the reporting period due to a mixture of volume growth, inventory holding, and the mix of products sold. We remain confident in our future delivery based on our pipeline of reduction projects that will contribute towards achievement of these aims. We achieved our goal of producing one billion recycle-ready toothpaste tubes since their initial launch in 2020, two years ahead of our aim to achieve this by 2025. We are also driving global and local initiatives to collect, sort and recycle our packaging. In 2023, Haleon worked with Colgate-Palmolive, New Jersey-based Mazza Recycling and San Francisco-based AI company Glacier to improve the sorting of toothpaste tubes within waste at recycling centres in New Jersey, US. This is part of our larger industry combined efforts to increase recycling of toothpaste tubes. As part of our aim to source key ingredients and packaging materials more sustainably, we increased the number of materials in scope for sustainable sourcing reporting in 2023, with a focus on also increasing our percentage of sustainably sourced paper materials. As members of the Alliance for Water Stewardship (AWS), we are taking steps to enable more environmentally sustainable and socially equitable management of water. This includes certifying our manufacturing sites with the AWS certification by 2025 and aiming for water neutrality for sites in water-stressed basins by 2030. We achieved our first water neutral site and our first site recommended for AWS certification in 2023, at Cape Town, South Africa. 1 The 2023 reporting period for Scope 1 and 2 carbon emissions (market-based) and health inclusivity is 1 December 2022 - 30 November 2023. The 2023 reporting period for Scope 3 emissions, packaging and sustainable sourcing is 1 July 2022 – 30 June 2023. The 2020 and 2022 baseline reporting periods are the calendar years. The 2022 reporting period for Scope 1 and 2 carbon emissions (market-based) and health inclusivity is the calendar year, and for packaging and sustainable sourcing is 1 July 2021 – 30 June 2022. Scope 1, 2 and 3 emissions calculated in line with the GHG Protocol. Scope 1 and 2 are emissions from Haleon’s direct operations. Scope 3 includes all indirect emissions from Haleon’s value chain, and our source to sale commitments include GHG Protocol categories except 6, 7 and 10-15. 2 Calculated in accordance with methodology and data improvements and updated carbon emissions factors for our 2020 baseline, and so the 2022 value differs from the value disclosed in the 2022 Annual Report and Form 20-F. Our updated total scope 1 & 2 emissions (market-based) 2020 baseline is 96 thousand tonnes CO2 e, from the 89 thousand tonnes CO2 e reported in 2022. 3 Scope includes product packaging and some devices, including toothbrushes. The calculation is based on our internal manufacturing data and does not include data on third-party manufacturing. 4 Scope includes Haleon’s globally managed spend on key materials which are agricultural, forestry or marine-derived. Globally managed spend covers the majority of our internal spend and expands across some of our third-party manufacturing network. >> Further details are in our TCFD and SECR disclosures from pages 24 and 188, our principal risk related to ESG on page 56, and Notes 1 and 12 to the Consolidated Financial Statements on pages 123 and 133. Haleon Annual Report and Form 20-F 2023 23 Strategic Report Our approach to sustainability |
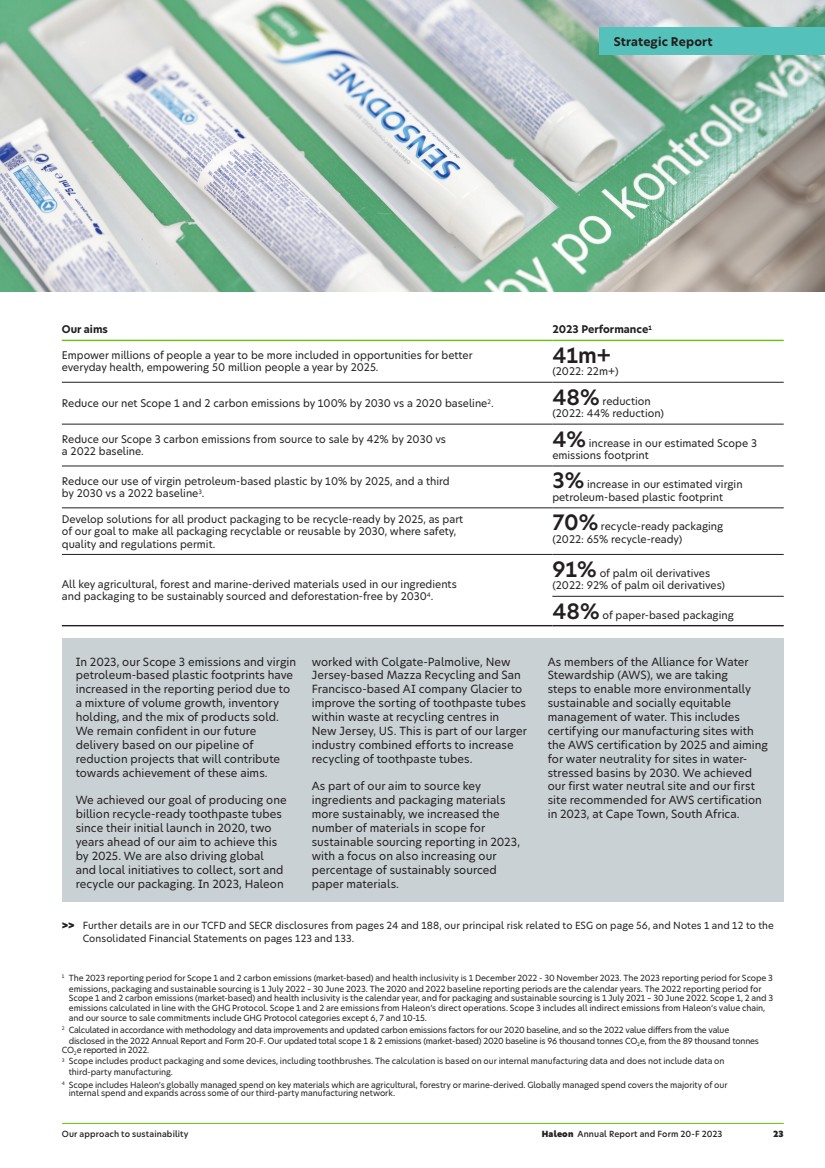
| Audit & Risk Committee Environmental & Social Sustainability Committee Remuneration Committee Environment Steering Committee Enterprise Risk and Compliance Committee Chief Executive Officer and Haleon Executive Team Haleon Board Sustainability Compliance and Risk Forum Our purpose underpins our drive to tackle carbon emissions. We aim to achieve net zero carbon emissions from source to sale by 2040 aligned to guidance from The Climate Pledge and Race to Zero. In accordance with TCFD guidance, we have conducted a comprehensive analysis to assess the risks and opportunities linked to climate change that may have an impact on our business. This statement highlights the most significant risks identified, along with any financial implications, and outlines the corresponding actions we are undertaking in response. Compliance statement In accordance with the FCA’s Listing Rule 9.8.6R(8), Companies Act 2006, S414CB(A1) and (2A), and the SEC’s Guidance Regarding Disclosure Related to Climate Change (2010), we present our TCFD compliance statement and confirm that we have made climate-related financial disclosure for the year ended 31 December 2023 which is consistent with the TCFD Recommendations and Recommended Disclosures, on pages 24 – 31. >> We also include further climate-related disclosures throughout the Annual Report, including information on our principal risk related to ESG on page 56, key performance indicators on pages 32-33, Notes 1 and 12 of the Financial Statements on page 123 and from page 133, and a breakdown of our GHG emissions on page 189. The Board takes overall accountability for risk and opportunity management, including climate change. The Board delegates specific matters related to climate change to subcommittees in the following ways: — The Environmental & Social Sustainability Committee (ESS) reviews progress against Haleon’s environmental and social governance (ESG) metrics and reviews delivery against its key environmental and net zero priorities. The Committee meets at least twice a year and is composed of three Non-Executive Directors. In their first meeting, the Committee received an ‘Education and Assessment’ session, facilitated by external experts, to evaluate Haleon’s responsible business strategy and goals, including those on climate. — The Audit & Risk Committee meets at least four times a year and oversees Haleon’s principal risks, including Haleon’s principal risk related to ESG, which covers climate change (page 56). — The Remuneration Committee meets at least four times a year and supports Haleon’s climate strategy by aligning Haleon’s Performance Share Plan with ESG performance via the ESG qualifier. This includes our Scope 1 and 2 decarbonisation commitment (page 83). Governance Governance over climate-related risks and opportunities is consistent with the governance structures in place across Haleon, comprising of the Board, Board subcommittees, executive and management-level governance committees, and specialist working groups (see diagram below, with arrows indicating flow of information). Task Force on Climate-related Financial Disclosures (TCFD) Our approach to sustainability continued 24 Haleon Annual Report and Form 20-F 2023 Strategic Report |
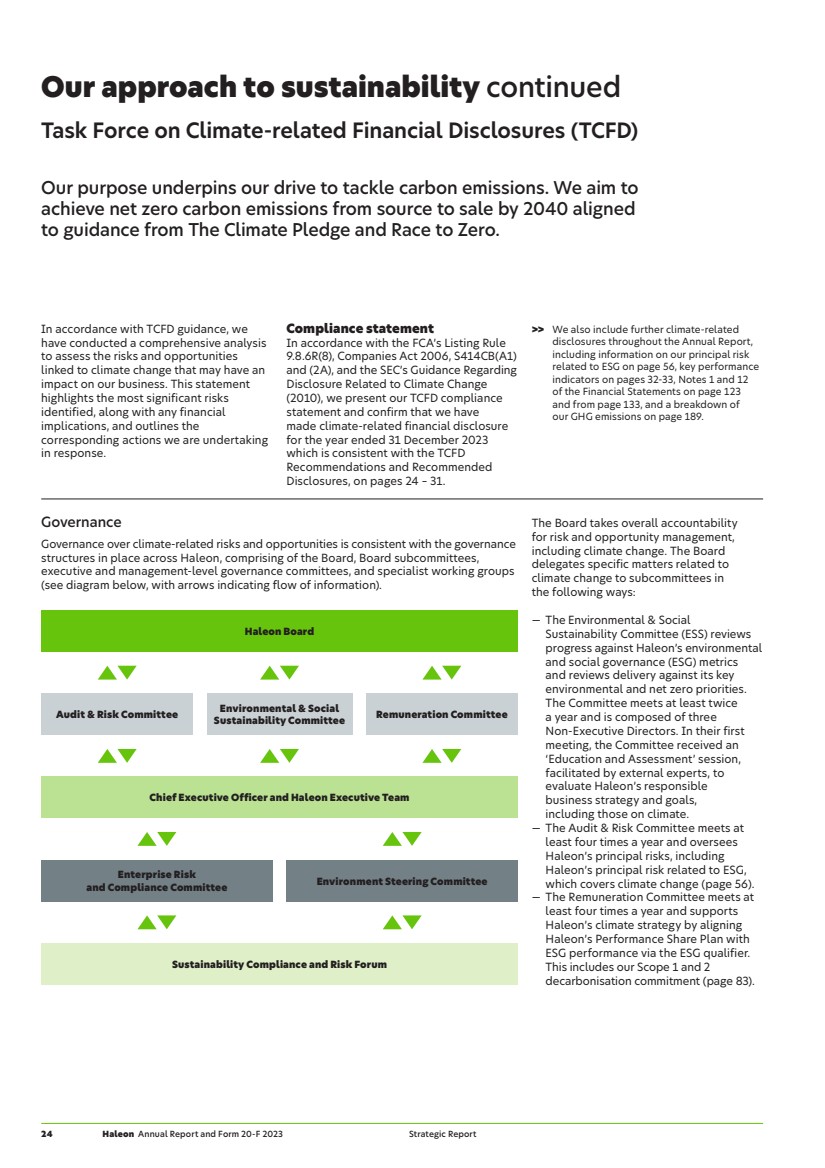
| The Chief Executive Officer and the Executive Team are responsible for the delivery of Haleon’s responsible business strategy, and they are supported by various governance forums to monitor the climate strategy, including the management of climate-related risks and opportunities. — The Environment Steering Committee governs progress against Haleon’s environment strategy and commitments, including climate change commitments. The Committee meets at least quarterly and makes strategic recommendations on managing our environmental footprint for approval by the Executive Team and the Board. It also monitors climate-related risks and opportunities. It is chaired by the Vice President of Sustainability and Executive Team members include the Chief Corporate Affairs Officer, the Chief Supply Chain Officer, and the Chief R&D Officer. — The Enterprise Risk and Compliance Committee (ERCC) consists of members of the Executive Team and Heads of Audit and Risk, and of Ethics and Compliance. The ERCC meets quarterly and ensures that principal risks are managed effectively, reviewing them twice a year. This includes Haleon’s principal risk related to ESG, which covers climate-related risks (see page 56). The principal risk is owned by the Chief Corporate Affairs Officer and monitored through Haleon’s risk management framework, described from page 53. — Compliance and Risk Forums (CRF) are conducted by our functional teams, categories and business units, to embed risk management in day-to-day business operations. The Sustainability CRF meets at least bi-monthly and is responsible for monitoring, assessing, and mitigating potential risks that may impact Haleon’s responsible business strategy delivery, including risks associated with climate change. Membership includes the Vice President of Sustainability and members of the sustainability team. — Working groups in our global functions, global categories and business units integrate responsible business targets, principles and initiatives (including climate change) into Haleon’s strategic business planning process, capital planning and budgeting, evaluation of potential divestments or acquisitions, day-to-day responsibilities and metric management. Responsible business scorecards, at both enterprise-wide and business unit level, track in-year targets against our responsible business commitments, including targets tracking carbon emissions reduction. The ESS Committee and the Executive Team receive progress updates against these quarterly, including performance against our climate commitments, alongside other information as a tool to inform decision-making. Responsible business targets are tied to employee personal objectives and performance evaluations where relevant, including climate-related objectives for executive management. Executive remuneration incorporates specific responsible business-related KPIs. For the year ended 2023, this included climate-related objectives (see pages 33 and 88). Strategy and risk management Identifying, assessing, and managing climate-related risks The process for identifying, assessing and managing climate-related risks is consistent with Haleon’s four-step enterprise risk management process described from page 53. This ensures that accountability for the identification, assessment, mitigation and monitoring of risks is aligned with Haleon’s strategic objectives. At the corporate level, ESG and the integration of sustainability and climate-related risks into our Business and investment decisions was identified as a principal risk 56, reflecting the level of enterprise prioritisation. The Sustainability CRF leads the climate risk identification and assessment process, which is formally conducted on an annual basis. Risks are assessed by taking into consideration the likely impact (considering both financial and reputation impacts), the probability of the risk, and the controls that are in place to manage the risk, in line with Haleon’s risk management framework outlined from page 53. This helps to identify where management should focus its effort. Continuous evaluation and management of risk is embedded in our strategy to ensure an appropriate, measured and timely response. Risk owners are assigned to climate risks and continually monitor and assess each risk. A combination of internal knowledge and external factors, such as horizon scanning, legal and regulatory developments, and emerging climate science, are considered to determine whether to mitigate, transfer or accept climate-related risks. In some cases, it may be deemed appropriate to transfer the risk, for example by discharging costs or liability to another party in our value chain. Part of the risk assessment process is also acceptance: establishing a level of comfort with the risk, considering our existing control strategies, and considering them currently sufficient. We also use scenario analysis and stakeholder input to identify, assess and manage climate-related opportunities, and consider these in our strategy accordingly. The most significant climate-related risks and opportunities are described in detail on pages 27 to 31 along with our plans to manage these, with an impact summary on page 123. These are considered to have the most significant impact on our business, strategy and financial planning. Risk and mitigation plans undergo a formal review at least once a year. Haleon will conduct a climate-related risk and opportunity assessment using scenario analysis at least every three years. Haleon Annual Report and Form 20-F 2023 25 Strategic Report Task Force on Climate-related Financial Disclosures (TCFD) |
| Task Force on Climate-related Financial Disclosures (TCFD) continued Our approach to sustainability continued Our resilience to climate change As outlined in the climate-related risks on pages 27 – 31, the quantitative scenario analysis indicates that our business is not at high risk of significant financial impacts arising from climate-related risks in the short-term. Any climate-related risks with a medium-risk financial impact are either projected to occur in the long-term or have already been addressed through our mitigating actions. As a result, we do not anticipate the need for major changes to our strategy in order to respond to these risks. In the medium and long-term, we will need to consider transition risks. The transition to a low-carbon economy could have financial implications for Haleon, as consumer preferences shift towards sustainable products, potentially impacting our market share and brand reputation. Additionally, increased carbon taxes on emissions across our operations and supply chain could also have financial impacts. However, these risks can be mitigated if we achieve our carbon reduction targets for emissions across all scopes. We have already conducted life-cycle assessments for 11 key products to better understand and mitigate the risks associated with their life-cycle stages. You can read more in our Climate Action Transition Plan, which is consistent with the strategy outlined in this disclosure, and goes into further detail. In the long-term, we need to be aware of the impacts of physical risks. Our key facilities could be affected by flooding and heatwaves, leading to disruption and damage. Our Oral Health product line could also be impacted by disruptions in the supply of raw materials, particularly wheat and corn, which are at a higher risk of yield impact due to long-term climate change. While we already have a resilient sourcing strategy for these key crops, we need to continue monitoring the situation. The transition to a low-carbon economy also presents an opportunity for Haleon, as consumer preferences shift towards more sustainable products. In order to capitalise on this opportunity, we need to improve the sustainability of our products and make consumers aware of these changes through substantiated consumer messaging. See page 123 for more information on how the impact of climate change was considered in financial planning. Climate-related scenario analysis Climate-related scenario analysis is used to assess the potential impact of climate-related risks and opportunities. In 2022, we performed our first qualitative analysis which we refreshed in 2023, both qualitatively and quantitatively, to assess the risks and opportunities in greater detail and understand the impact of climate change on our existing business model. The results have been used to inform our strategy and financial planning, including updates to our underlying cash flows for our planned actions to meet our climate ambitions. We worked with a climate analytics company, Risilience, to quantify the potential financial impact of our physical and transition climate risks and opportunities. Risilience used a ‘Digital Twin’, which is a data-driven digital representation of our business and value chain. This used data from our business including current and approved financial projections, market breakdown, key facilities, raw materials and GHG footprint, to stress test and quantify the potential financial impact of climate risks and opportunities under different scenarios. The climate scenarios used as part of the analysis are outlined below. We also modelled a 2.5oC warming trajectory but are disclosing the results with the highest potential impact. Warming trajectory by 2100 Climate scenario Rationale behind climate scenario analysis selection 1.5°C Paris Ambition: Rapid transition to a low-carbon economy with orderly emissions reductions and rapid consumer preference change. Enables us to test our business strategy against the most optimistic scenario from a climate-transition perspective. Aligns with our target to be a net zero business by 2040, aligned to guidance from The Climate Pledge and Race to Zero. Aligns with TCFD and IPCC1 recommendations to include a 2°C or lower scenario, with 1.5°C scenario recommended as the ‘2°C or lower’, aligning with the latest scientific research from the IPCC. This scenario represents the ‘worst case’/highest potential for transition risk for our business. >4°C No Policy: Reversal of emissions reductions and abolishment of climate policy leading to extreme warming. Enables us to test business strategy against the worst-case scenario from a physical risk perspective. This scenario was used in our qualitative analysis in 2022. A number of assumptions were made in carrying out the analysis: — Current mitigating actions were not modelled for any of the scenarios. — All scenarios were modelled independently, i.e., no correlation was assumed between different risks and opportunities. — Investment costs required to realise opportunities were not taken into account. While many scenario models and techniques are advanced, we recognise that knowledge in this area is growing, and we expect models and pathways to evolve with time. Models also have limitations, and there are certain areas which are challenging to model. Additionally, in certain situations, different models can project contrasting results. In these situations, we have considered how different outcomes would impact our businesses. 1 We used the IPCC Representative Concentration Pathways (RCPs) to assess physical climate risk. RCPs are commonly used by climate scientists to assess physical climate risk, with each pathway representing a different GHG concentration trajectory which can then be translated into global warming impacts. We used climate data from the World Climate Research Programmes Coupled Model Intercomparison Project – Phase 6 (CMIP 6 – adjusted for spatial resolution and bias corrected) to do this translation. RCPs feed into climate, crop and flood models. There are four RCP pathways with RCP8.5 representing the worst case scenario. 26 Haleon Annual Report and Form 20-F 2023 Strategic Report |
| Impact of climate-related risks and opportunities and resilience of our strategy For 2023, we have updated the time horizons used to consider the impact of climate risks and opportunities. The length of the time horizons was reduced to allow greater alignment to modelling capabilities for quantitative scenario analysis and to reduce the risk of modelling uncertainties associated with using time horizons beyond 2050. This provides more accurate results compared to using longer time horizons and aligns with our business risk cycles, allowing us to use the analysis for strategic decision making. We define short, medium and long-term horizons as follows: — Short-term (0-4 years): aligns to our financial planning and risk management framework. — Medium-term (5-9 years): aligns to our interim Scopes 1, 2 and 3 emissions reduction targets of 2030. — Long-term (10+ years): aligns to our net zero target of 2040 and the UK Government’s net zero target of 2050. The following climate risks and opportunities have been identified as those with the potential to be significant to our business over the short, medium and long-term. For each risk and opportunity, further details are only provided for the scenario analysis with the most significant impact to Haleon. The risks and opportunities as presented integrated several components of TCFD: strategy, risks, and metrics and targets. Physical risks Risk Impact analysis Management of risk Impact of extreme weather events on operations and supply chain The revenue and cost impact of damage and disruption to key facilities from the following climate hazards: riverine, coastal and flash flooding, heatwaves, water stress, and temperate and tropical windstorms. Potential impacts included in our Paris Ambition (1.5°C) and No Policy (4°C) scenario analysis included: — Revenue disruption from the interruption of supply of electricity, gas and water, due to heatwaves and flooding. — Inefficiencies in production due to disrupted employee travel, e.g., caused by flooding. — Increased facility and operational down time, due to damaged transport infrastructure. — Direct damage to stock, buildings, and contents from flood and windstorms. Under a No Policy (4°C) scenario, the hazards with the greatest potential to impact our business are riverine and flash flooding, and heatwaves, over the long-term time horizon. Three of our sites, Guayama (Puerto Rico), Tianjin (China) and Dungarvan (Ireland), are at greatest risk of property damage from riverine flooding owing to their close proximity to rivers. Sites in the US, southern Europe and eastern China are located in regions that could experience a rapid increase in heatwave probability driven by global average temperatures and the likelihood of prolonged extreme temperature events. Heatwaves have the potential to cause disruption through interrupting our supply chain (such as from infrastructure damage to the road and rail network) as well as reducing the productivity of our workforce through human health impacts. The risk of water stress is considered to be low with 0.4% of annual revenue from our owned sites being potentially impacted in the long-term (by 2050). Assumptions: — 2023 financial values are kept constant up to 2050 and acute physical risk shocks were applied to these values. — The revenue share for our sites was assumed to be site revenue as a proportion of total revenue. The remaining revenue share was split proportionally across third-party manufacturers’ sites. — Meteorological conditions that could lead to water stress (i.e., severe drought) were considered. Local geological conditions were excluded from the analysis. Actions: — Production sites are included within a loss-prevention survey programme and are routinely visited to ensure appropriate resilience measures are in place, including flood, wind and storm protection. — Our manufacturing sites have emergency plans, disaster recovery plans, and business continuity plans (BCPs), which we continuously improve to further enable our sites to withstand extreme weather events. — Our BCPs include options for multiple sourcing for manufacturing of our products. This is achieved by using a combination of Haleon or third-party manufacturing organisations’ sites, spread across different geographies. — We conducted value-chain water footprint analysis to better understand potential water-related risks in specific geographies and prioritise actions. — All our manufacturing sites are implementing the AWS standard to address local water-related risks and opportunities. In 2023, our Cape Town site was recommended for certification; it also became water neutral following water replenishment activities, which began in 2022 with WWF South Africa. Metrics and targets: — All our manufacturing sites in water-stressed basins to be water neutral by 2030. We consider water neutral achieved when the amount of water replenished in the catchment exceeds the site’s water withdrawal. — AWS certifications at our manufacturing sites by 2025. — We aim to introduce additional metrics from 2024 to further track owned and third-party sites’ exposure to extreme weather events. Paris Ambition (1.5°C) S M L No Policy (4°C) S M L Financial impact of risk or opportunity Low risk Medium risk High risk Opportunity £10m-£40m £40m-£80m >£80m Key Time horizon for impact S Short-term M Medium-term L Long-term 0-4 years 5-9 years 10+ years Haleon Annual Report and Form 20-F 2023 27 Strategic Report Task Force on Climate-related Financial Disclosures (TCFD) |
| Task Force on Climate-related Financial Disclosures (TCFD) continued Physical risks continued Risk Impact analysis Management of risk Reduced availability of raw materials due to chronic weather impact The financial impacts on ingredient production due to chronic climate change induced by changing temperature and precipitation patterns. The following raw materials were considered for the analysis: corn, wheat, mint, palm oil and soybean. Potential impacts included in our Paris Ambition (1.5°C) and No Policy (4°C) scenario analysis included: — Reduction in crop yields leading to supply and demand implications and price volatility. — Supply shortages which could prevent or limit the production of key product lines and lead to a loss in revenue. — Increased costs due to long-term chronic drought affecting crop supply and implementation of adaptation measures such as irrigation solutions. Scenario analysis was conducted to assess the financial impact of crop yield fluctuations caused by long-term climate change for our key crops. Changes in rainfall and temperature were assessed using data on crop sourcing locations and crop vulnerability. The effects of sudden hazards like heatwaves and droughts on crops were also assessed, considering the sourcing locations with a high likelihood or increasing probability of such events. Changes in long-term precipitation and temperature patterns under the No Policy (4°C) scenario are likely to affect wheat and corn sourcing, with wheat experiencing the largest average percentage yield decline of c.37% between 2023 and 2050. Our key sourcing regions for these crops (France, US and UK) could also be impacted by extreme weather events, such as drought or severe heatwave events, further reducing crop yields. In our Oral Health products, corn is a crucial ingredient. However, the projected impact on corn yields in 2050 is anticipated to be minimal, accounting for less than 3% of the total revenue generated by Oral Health products in 2023. Under the No Policy (4°C) scenario, certain areas of central US may see corn yields decline as a result of precipitation variation. Assumptions: — 2023 financial values are kept constant up to 2050 and acute physical risk shocks are applied to these values. — The impact of climate conditions on raw material supply is limited to temperature and precipitation. Other conditions, such as soil quality, were excluded from the analysis. — Revenue impacts were considered in terms of reduced crop yields leading to production limitations. Price fluctuations were not considered in the analysis. Actions: — Seek to assess feasibility of substituting raw materials with lower-risk alternatives, for example replacing corn-derived ingredients with alternatives to reduce exposure to yield and cost fluctuations. — We have a robust sustainable sourcing strategy in place (see page 23). — Our sourcing strategy involves multiple sourcing options from different geographies and holding materials’ safety stocks where feasible. Continuity of supply is a priority for our procurement team. — Haleon has defined and launched its Supplier ESG Expectations, which outlines the targets we have set our suppliers, such as requiring materials to be covered by industry-recognised certifications where relevant. — Sustainability requirements are embedded into tender processes. Metrics and targets: — We aim for all of our key agricultural, forest, and marine-derived materials to be sustainably sourced and deforestation-free by 20301 .. For the key material supply chains in scope of this goal, we use recognised global certification programmes wherever possible, for example Roundtable on Sustainable Palm Oil (RSPO) Mass Balance certification for our palm oil derivatives, and Forest Stewardship Council (FSC) and Programme for the Endorsement of Forest Certification (PEFC) certifications for our paper packaging materials. Where these are not available, we are working with independent experts to define clear standards and processes for sustainable sourcing based on the specific issues and opportunities for each material. Paris Ambition (1.5°C) S M L No Policy (4°C) S M L 1 Scope includes Haleon’s globally managed spend on key materials that are agricultural, forest, or marine-derived. Globally managed spend covers the majority of our internal spend and expands across some of our third-party manufacturing network. Our approach to sustainability continued Financial impact of risk or opportunity Low risk Medium risk High risk Opportunity £10m-£40m £40m-£80m >£80m Key Time horizon for impact S Short-term M Medium-term L Long-term 0-4 years 5-9 years 10+ years 28 Haleon Annual Report and Form 20-F 2023 Strategic Report |
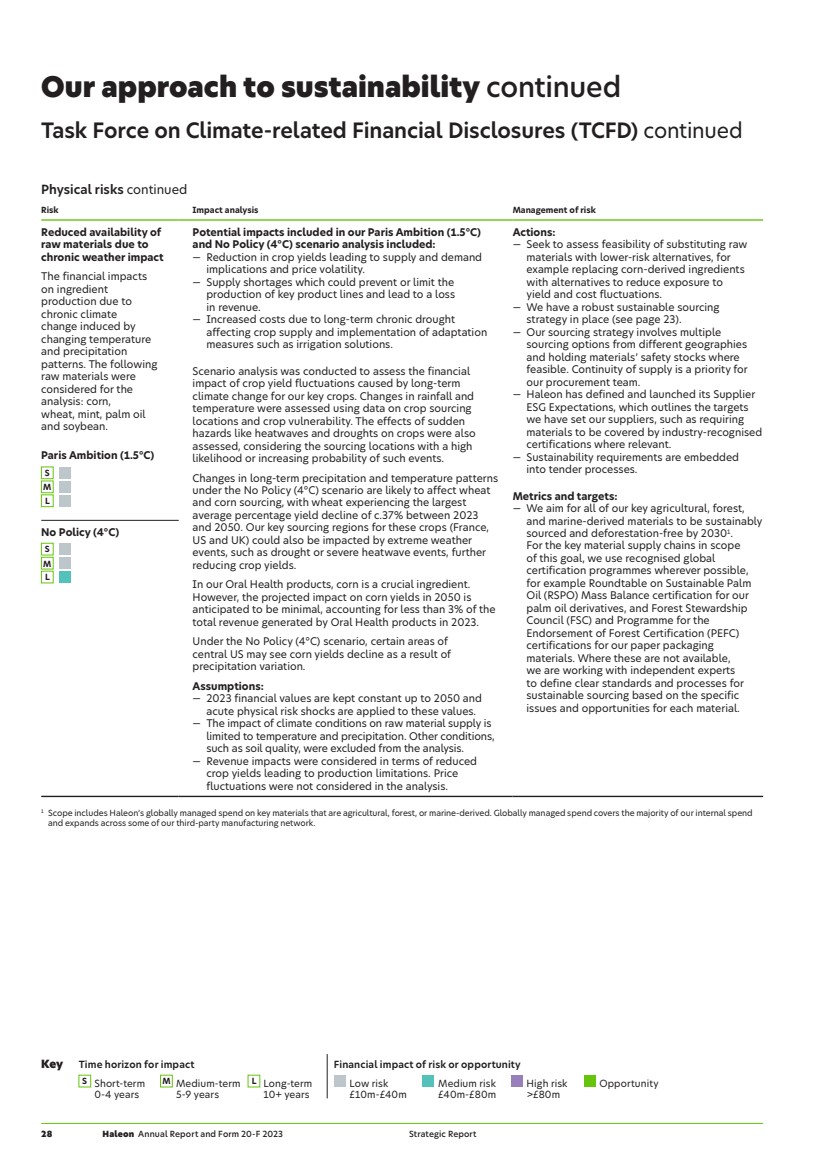
| Transition risks Risk Impact analysis Management of risk Policy: carbon pricing The financial impacts of carbon taxes on emissions across our operations and supply chain. Potential impacts included in our Paris Ambition (1.5°C) scenario analysis included the following (the No Policy (4°C) scenario was not relevant): — Direct increase to overhead costs from Scope 1 and 2 emissions (e.g., cost of electricity and fuel). — Increased cost of raw materials from upstream suppliers passing through increased costs from Scope 3 emissions. — Reduction in sales from passing the costs from carbon taxes on to consumers. Under a Paris Ambition (1.5°C) scenario where global carbon prices are expected to grow significantly from 2023, the potential impact is a medium risk if we do not reach our SBTi-aligned target for Scope 1 and 2 emissions. However, if we meet our SBTi target, the risk is significantly reduced as we aim to achieve at least 95% absolute Scope 1 and 2 emissions reduction by 2030 (vs a 2020 baseline). Indirect Scope 3 emissions account for the majority of our exposure to carbon costs, particularly upstream emissions associated with farming and processing, which could be passed on by our suppliers. We have limited ability to influence these costs as they will depend on the extent to which suppliers reflect carbon tax expenditure within prices. The risk of indirect Scope 3 costs will be greatly reduced if we are able to meet our commitment to reduce Scope 3 emissions by 42% by 2030 (vs a 2022 baseline) and deliver our net zero target by 2040, aligned to guidance from Race to Zero and Amazon Climate Pledge. Assumptions: — Business as usual emissions trajectory where emissions grow proportionally to revenue growth. — Linear trajectories were used between scenario data points to estimate climate pricing data for intervening years. — All global emissions are subject to carbon pricing and no border adjustments were included in the analysis. — No risk is assumed under a No Policy (4°C) scenario. This is due to this scenario representing a reversal of current policies including currently implemented carbon prices. — Carbon price used in the analysis (2027 weight average carbon price (USD/tonne): $83.45. Carbon prices used in analysis were collated from sources such as the IMF, IEA and NGFS. Actions: — Delivery of our carbon emissions reduction targets for Scopes 1, 2 and 3 carbon emissions as outlined in our Climate Action Transition Plan will mitigate our operations’ exposure to future carbon pricing and environmental taxation. — We work with our suppliers and through industry groups like Manufacture 2030 and Energize to help suppliers map their carbon emissions and take actions to reduce their carbon footprint. Metrics and targets: — Reduce absolute Scope 1 and 2 carbon emissions by 95% by 2030 vs a 2020 baseline. — Reduce Scope 3 carbon emissions from source to sale by 42% by 2030 vs a 2022 baseline1 .. — Achieve net zero carbon emissions from source to sale by 2040, aligned to guidance from the Climate Pledge and Race to Zero1 .. Paris Ambition (1.5°C) S M L No Policy (4°C) Not applicable 1 Our net zero and Scope 3 carbon emissions targets span carbon emission categories from source to sale (excluding GHG protocol categories 6, 7 and 10-15). Financial impact of risk or opportunity Low risk Medium risk High risk Opportunity £10m-£40m £40m-£80m >£80m Key Time horizon for impact S Short-term M Medium-term L Long-term 0-4 years 5-9 years 10+ years Haleon Annual Report and Form 20-F 2023 29 Strategic Report Task Force on Climate-related Financial Disclosures (TCFD) |
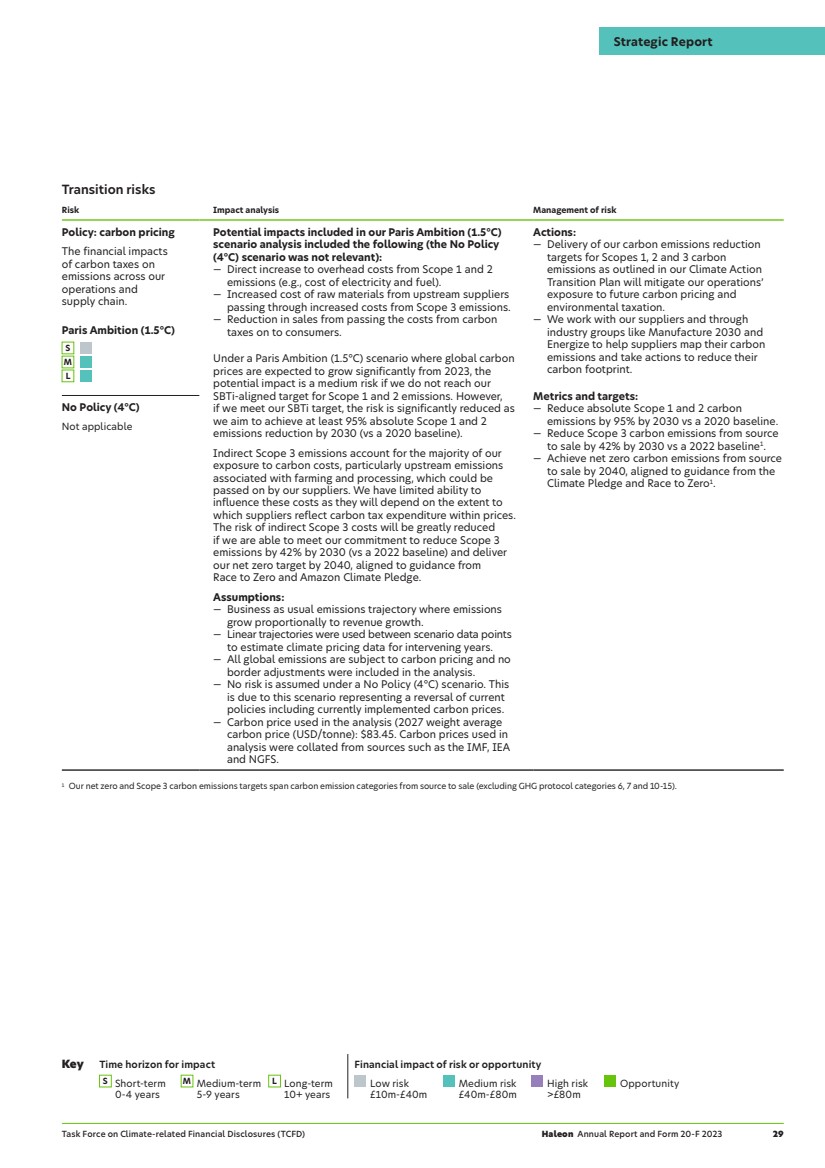
| Task Force on Climate-related Financial Disclosures (TCFD) continued Transition risks continued Risk Impact analysis Management of risk Changing consumer preferences The financial impact of taking no action towards the sustainability of our products, and consumer purchasing shifting towards more sustainable brands (e.g., products with less plastic or more recyclable packaging). Potential impacts included in our Paris Ambition (1.5°C) and No Policy (4°C) scenario analysis included: — Reduction in product sales and loss in market share. — Reputational damage and reduction in brand loyalty. Under a Paris Ambition (1.5°C) scenario, it is expected that consumers will rapidly shift towards more sustainable products. The unmitigated potential risk to our business is considered to be medium. The majority of potential revenue loss is driven by our Oral Health products which represent the largest share of total revenue. Oral Health product consumers in the US are likely to see a rapid shift towards more sustainable products. Assumptions: — Buying preferences will vary at differing rates across global regions. — To model demand shifts of our products, consumer-led demand for sustainable packaging was used as a proxy. — The risk was modelled under a scenario where we do not act to improve the sustainability of our products, in order to analyse the unmitigated impact of consumer demand shifts. Actions: — To meet or exceed the expectations of Haleon’s key stakeholders, including consumers, we are committed to deliver on our responsible business strategy and targets (page 23). — We have carried out life-cycle assessments for 11 key products to better identify the risks and opportunities across the life-cycle stages. — Haleon’s sustainability impact assessment tool enables our R&D teams to calculate, analyse and compare the impact of product and packaging design decisions on key environmental-impact parameters (including carbon footprint and packaging). — We are participating in externally verified sustainable choice ranges such as Amazon’s ‘Climate Pledge Friendly’ programme as well as making substantiated statements in relation to our products’ sustainability credentials. — With a focus on health inclusivity, our brands seek to tackle specific barriers that stand in the way of better everyday health. This includes empowering consumers and Health Professionals to better understand the impact of climate change on health and equip both with tools and solutions to manage and mitigate the impact on everyday health. Metrics and targets: — Haleon has set targets with an aim to respond to changing consumer preferences, for example our aims for 100% of product packaging to be recycle-ready by 2025 and recyclable by 2030 where safety, quality and regulations permit, and to reduce our use of virgin petroleum-based plastic packaging by 10% by 2025 and by a third by 2030 vs a 2022 baseline. See page 23 for our performance. Where relevant, we incorporate environmental credentials into consumer-facing statements or listings in retailers’ sustainable choices ranges. Paris Ambition (1.5°C) S M L No Policy (4°C) S M L Our approach to sustainability continued Financial impact of risk or opportunity Low risk Medium risk High risk Opportunity £10m-£40m £40m-£80m >£80m Key Time horizon for impact S Short-term M Medium-term L Long-term 0-4 years 5-9 years 10+ years 30 Haleon Annual Report and Form 20-F 2023 Strategic Report |
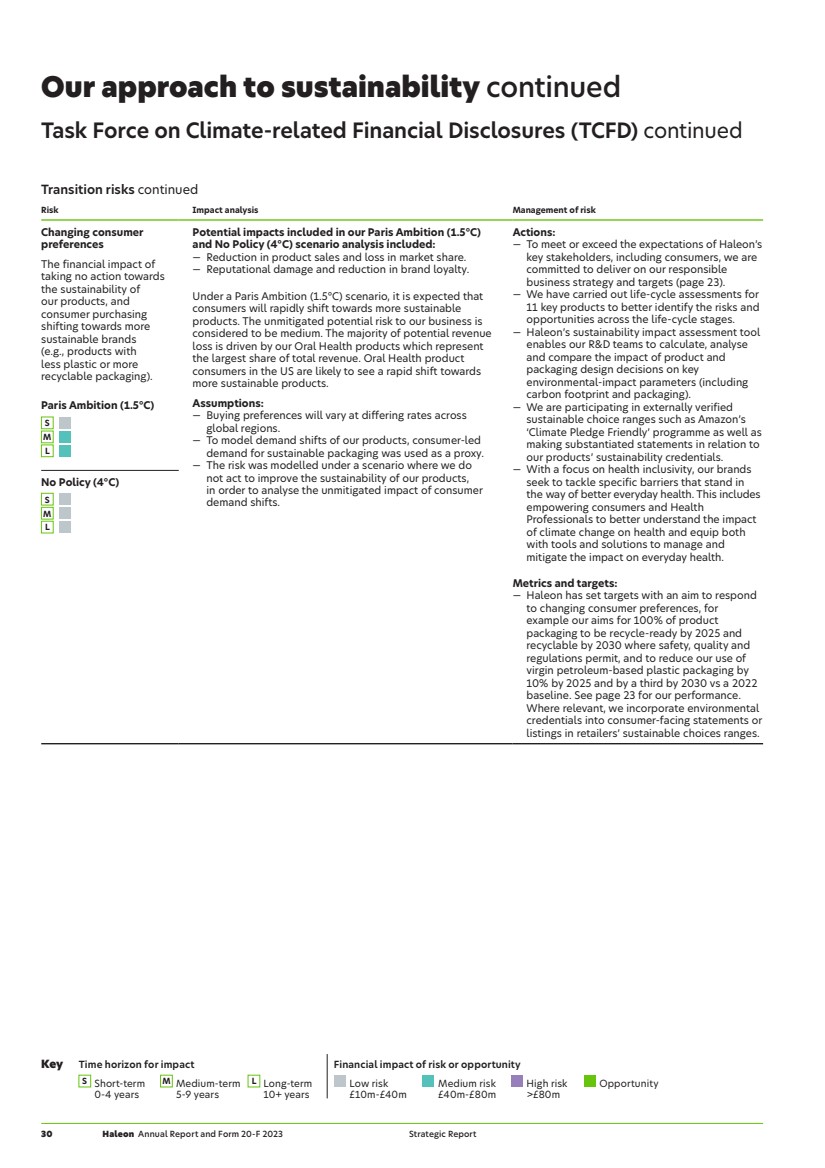
| Transition opportunities Opportunity Impact analysis Management of opportunity Changing consumer preferences The financial impacts of taking action towards the sustainability of our products, and consumer purchasing shifting towards more sustainable brands (e.g., products with less plastic or more recyclable packaging). Potential impacts included in our Paris Ambition (1.5°C) and No Policy (4°C) scenario analysis included: — Changing consumer demand to low-carbon alternatives leading to a gain in market share and an increase in product sales. — Positive reputational impacts and increasing brand loyalty. The potential market opportunity for more sustainable products could be significant under a Paris Ambition (1.5°C) scenario, equating to 2.6% additional revenue in 2032, compared to baseline projected revenues. Consistent with the risk above, the greatest potential for upside is driven by our Oral Health products. The size of the potential opportunity decreases in the long term, as more products align with consumer preferences and take actions to meet future climate targets. Therefore, the opportunity reduces for product groups which have already seen a sustainable shift. Assumptions: — Buying preferences will vary at differing rates across global regions. To model demand shifts for Haleon’s products, consumer-led demand for sustainable packaging was used as a proxy. — The opportunity was modelled under a future where we work to improve the sustainability of our products in order to understand the potential financial gains that could be realised. Actions: — Our actions are consistent with management of the risk of changing consumer preferences. Metrics and targets: — Haleon has set targets with an aim to respond to changing consumer preferences, for example our aims for 100% of product packaging to be recycle-ready by 2025 and recyclable by 2030 where safety, quality and regulations permit, and to reduce our use of virgin petroleum-based plastic packaging by 10% by 2025 and by a third by 2030 vs a 2022 baseline. See page 23 for our performance. Where relevant, we incorporate environmental credentials into consumer-facing statements or listings in retailers’ sustainable choices ranges. Paris Ambition (1.5°C) S M L No Policy (4°C) S M L Metrics and targets We have made significant progress in establishing our standalone responsible business strategy as a separately listed company (following listing in July 2022). This has included the development of targets, associated delivery plans to meet targets, and performance and risk management forums and processes. As outlined in this disclosure, we have developed metrics alongside our scenario analysis which are used to monitor certain risks and opportunities. This includes cross-industry metrics and targets recommended by TCFD, which can be found mapped to risks and opportunities on pages 27-31, in key performance indicators on pages 32-33, in our Scope 1, 2 and 3 emissions set out in line with the UK Government’s guidance on Streamlined Energy and Carbon Reporting (SECR) on pages 188-189, and built into our ESG Qualifier as described on pages 33 and 83. In August 2023, the Science Based Targets initiative validated our near-term target to reduce absolute Scope 1 and 2 GHG emissions by 95% by 2030 from a 2020 base year4. We are also committed to reducing absolute Scope 3 GHG emissions from purchased goods and services, capital goods, fuel and energy-related activities, upstream transportation and distribution, waste generated in operations, upstream leased assets and downstream transportation and distribution by 42% versus our 2022 baseline within the same time frame. This target, based on its original 2020 baseline, was also validated by the Science Based Targets initiative. As described on page 22, we have updated the baseline year for our carbon Scope 3 and virgin plastic reduction goals from 2020 to 2022. We will re-submit our Scope 3 target with its updated 2022 baseline for revalidation this year. Our 2023 performance is described on pages 22-23. Performance against these targets, along with additional environmental metrics and reporting methodologies, can be found on our website. Priorities for 2024 After completing our quantitative scenario analysis at the end of 2023, our main focus for the upcoming year will be interpreting the findings and determining the appropriate mitigating actions and associated metrics and targets. In line with our journey to meet our net zero ambition, as published within our Climate Action Transition Plan, we continue to develop and refine metrics to track and manage our transition risks and opportunities. It is Haleon’s plan to continue to evolve on this journey and publish additional metrics in 2024. We will also continue to develop our Climate Action Transition Plan over time to include a costed plan for our transition. 4 The target boundary includes biogenic land-related emissions and removals from bioenergy feedstocks. >> More information on our Climate Action Transition Plan is available at www.haleon.com/our-impact/esg-reporting-hub Financial impact of risk or opportunity Low risk Medium risk High risk Opportunity £10m-£40m £40m-£80m >£80m Key Time horizon for impact S Short-term M Medium-term L Long-term 0-4 years 5-9 years 10+ years Haleon Annual Report and Form 20-F 2023 31 Strategic Report Task Force on Climate-related Financial Disclosures (TCFD) |
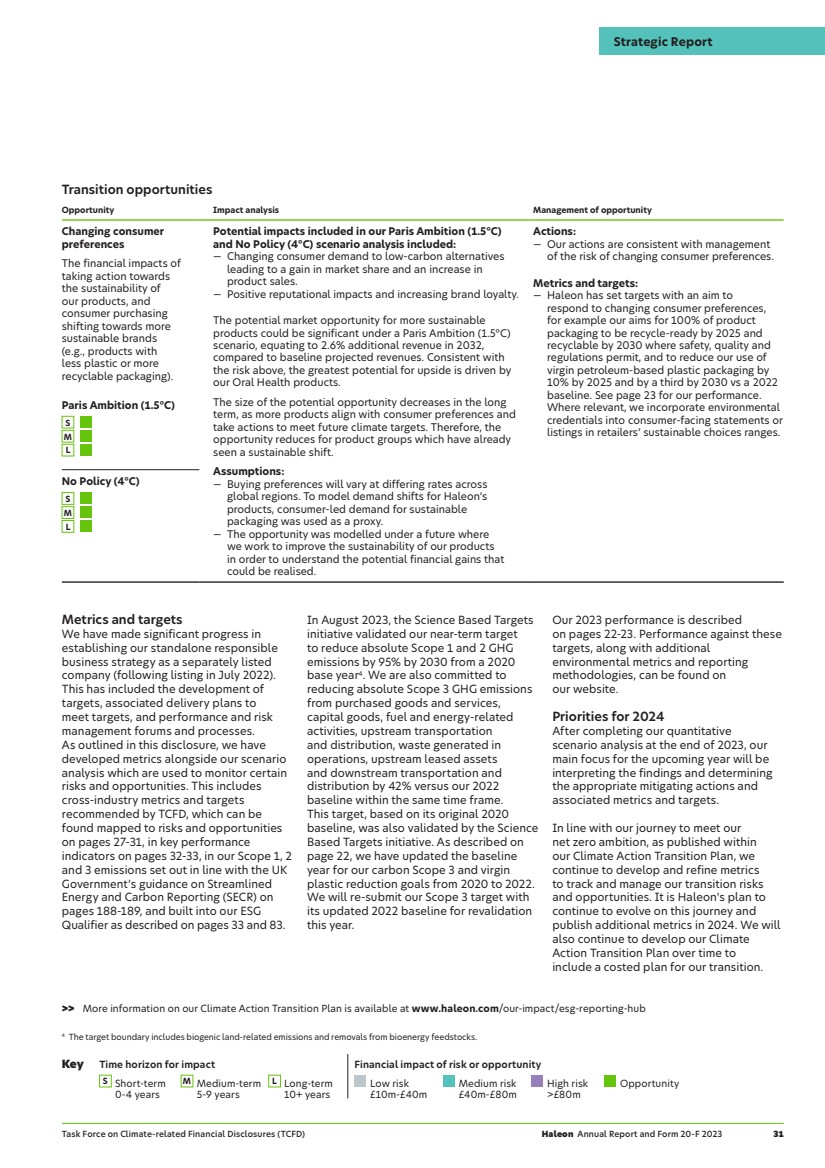
| We have several enterprise metrics monitoring performance across the business, from which we select our key performance indicators (KPIs). These are the most applicable in tracking our strategic performance, sustainability and commitment to our key stakeholders. The Board and Executive Team monitor our KPIs to ensure continued alignment to our strategy and, where applicable, they are linked to Executive Directors’ remuneration. Having demerged from GSK in 2022, we are still in the process of building up five years of data. >> See also the Directors’ Remuneration Report from page 80, and forward-looking statements on page 218. Strategic pillars 1 Increase household penetration 2 New and emerging opportunities 3 Strong execution and financial discipline 4 Responsible business Executive Director Remuneration Performance Share Plan Annual Incentive Plan 1 Organic revenue growth, adjusted operating profit, free cash flow and net debt are non-IFRS measures. Definitions and calculations of non-IFRS measures can be found from page 43. KPI Relevance and calculation Future focus Organic revenue growth1 1 2 3 Delivery on our 4-6% guidance. Measures the strength of our existing portfolio. Data is derived directly from our Financial Statements. Continue to deliver on our guidance prioritising driving growth from recently launched innovations. 2023 2020 2.8%2 9.0% 3.8%2 8.0% 2021 2022 Adjusted operating profit1 1 2 3 Continued profitable growth. Our adjusted operating profit is an important indicator of the strength of our business model. Data is derived directly from our Financial Statements. Drive positive operating leverage in the business whilst at the same time ensuring healthy investment to drive top-line growth. In 2024, this KPI will be replaced by organic profit growth to provide a more direct representation of the Company’s performance. 2023 2020 £2.1bn £2.5bn £2.2bn £2.5bn 2021 2022 Free cash flow1 3 A key component in measuring the viability of our business. Provides the business with capacity to invest in the business, pay down debt and make shareholder returns. Data is derived directly from our Financial Statements. Drive free cash flow through a combination of working capital management and efficiencies across the business. 2023 2020 £2.0bn £1.6bn £1.2bn £1.6bn 2021 2022 Net debt/adjusted EBITDA1 3 Achieve less than 3x net debt/ adjusted EBITDA during 20243 .. Reducing our leverage strengthens our balance sheet and maintains our Investment-Grade credit rating. Data is derived directly from our Financial Statements. Operate a strong Investment-Grade balance sheet with medium-term leverage of c.2.5x net debt/adjusted EBITDA. In 2024, this will no longer be a KPI given expected delivery of less than 3.0x leverage during the year. 2023 3.6x 3.0x 2022 Business gained/maintained share 1 2 Drive market share gains through brand building, innovation and increased investment in A&P and R&D. The attractiveness of our products is key for all our stakeholders, giving them confidence in our ability to increase household penetration and capitalise on new and emerging opportunities. Based on Haleon’s analysis of third-party market revenue data, including IQVIA, IRI and Nielsen data. Ensure healthy investment in A&P through numerous media campaigns and drive innovation through investment in R&D. 2023 66% 58% 2022 Carbon reduction4 4 Reduce our net Scope 1 and 2 carbon emissions by 100%, versus our 2020 baseline by 2030. Decarbonising our operations is a key focus area and helps protect against climate-related transition risks. We track the percentage change in total tonnes of market-based net Scope 1 and 2 GHG emissions versus 2020. We are focused on addressing our remaining Scope 1 emissions by transitioning to renewable-energy-powered systems for heating and cooling. 2023 44% 48% 2022 Our key performance indicators 2 This footnote is intentionally left blank. 3 In February 2022, Haleon expected to reach leverage of less than 3x net debt/adjusted EBITDA by the end of 2024 (as presented at its Capital Markets Day). 32 Haleon Annual Report and Form 20-F 2023 Strategic Report |
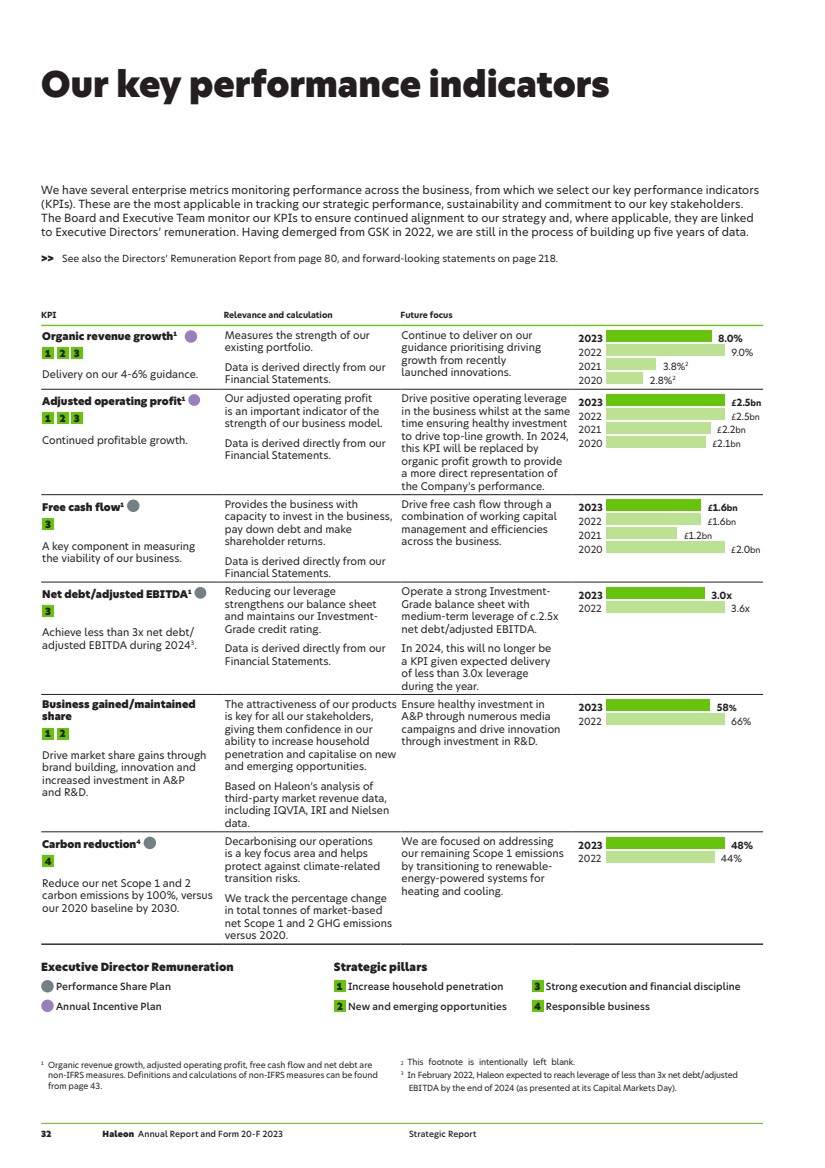
| KPI Relevance and calculation Future focus Recycle-ready packaging5 4 Develop recycle-ready solutions for all product packaging by 2025, as part of our goal to make all packaging recyclable or reusable by 2030, where safety, quality and regulations permit. A key priority and commitment for Haleon is to play its part to accelerate the transition to a circular economy. We track the percentage of recycle-ready packaging in market. Continue to transition our packaging to recycle-ready formats using mono-materials designed for recycling. This will no longer be a KPI in 2024 given our commitment will complete in 2025. This KPI will be replaced by reduction in virgin petroleum-based plastic packaging. 2023 65% 70% 2022 Gender diversity 4 Achieve gender parity (48-52%) in leadership roles6 globally by 2030. We believe diversity is a key source of competitive advantage and an important consideration for employees and investors. Calculated as a percentage of employees who self-identify as female compared to overall number of permanent employees. Our 2024 goal is 45.5%, which we are working towards through targeted initiatives, and aiming to ensure that our hiring, pipeline and development processes are bias free. 2023 43.7% 44.9% 2022 Employee engagement 4 Build a company where employees are proud to work, feel inspired, challenged, supported and have a sense of personal accomplishment. Ensuring employees feel Haleon is fulfilling its core engagement index measures is fundamental to our long-term success. We track responses to our core engagement index measures in our annual employee survey. Continue to focus on strengthening our work processes to enhance productivity, allow for greater agility and deliver better performance. Initiatives include improving our communications on change and future direction. 2023 80% 78% 2022 Following the strong strategic progress made since our de-merger, Haleon has reviewed its KPIs given a number of targets are within sight of delivery. Net debt/adjusted EBITDA will no longer be a KPI in 2024 given expected delivery of less than 3.0x leverage during 2024. The Company has a commitment to maintain an Investment-Grade balance sheet and operate at c.2.5x net debt/adjusted EBITDA over the medium term. Additionally, given Haleon’s commitment to active portfolio management and the recently announced disposals of Lamisil and ChapStick, the Board will now consider adjusted operating profit growth and adjusted operating margin on an organic basis (i.e. excluding the impact of acquisitions and divestments, and at constant currency) which will give a more direct representation of the Company’s performance. In addition, from 2024 we will focus on adjusted diluted EPS growth at constant currency to ensure value creation across the business. In responsible business, given our commitment on recycle-ready packaging will complete in 2025, we will replace this metric with reduction in virgin petroleum-based packaging, which will be included as part of the ESG qualifier in Haleon’s 2024-2026 Performance Share Plan (PSP) awards. Our KPIs and Executive Director remuneration in 2023 Elements of our Executive Director remuneration are linked to the delivery of specific KPIs that are considered the most relevant in assessing business performance and our commitment to our stakeholders. ESG qualifier The PSP has an ESG qualifier with thresholds set for three responsible business KPIs. If any of the thresholds are missed, a reduction in the level of vesting of up to 10% could be applied for each missed threshold. If the metrics are static or go backwards compared to the baseline, a 25% reduction in the level of vesting could be applied for each measure (i.e. a potential overall reduction of up to 75%). Performance Share Plan 50% linked to net debt/Adjusted EBITDA 50% linked to cumulative free cash flow Annual Incentive Plan 60% linked to organic revenue growth 20% linked to adjusted operating profit 20% linked to individual business objectives 4 The reporting period runs from 1 December 2022 to 30 November 2023. Carbon offsets account for 25% of our market-based Scope 1 and 2 carbon emissions. Calculated in accordance with methodology and data improvements, and updated carbon emissions factors for our 2020 baseline, hence the 2022 result differs from the value disclosed in the 2022 Annual Report and Form 20-F. 5 Reporting period runs from 1 July 2022 to 30 June 2023. 6 Leadership roles’ is defined in our glossary. Haleon Annual Report and Form 20-F 2023 33 Strategic Report Our key performance indicators |
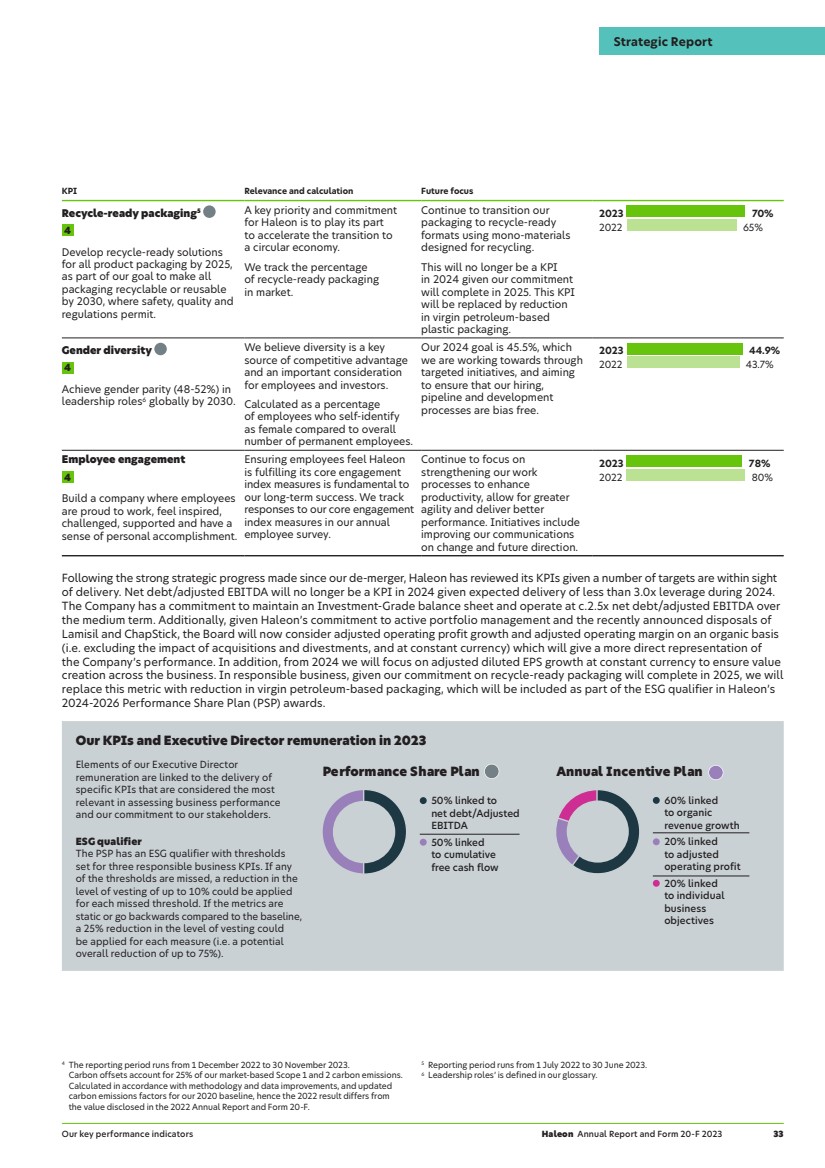
| 2023 Business review Chief Financial Officer’s review Tobias Hestler Chief Financial Officer I am pleased to report strong financial performance for 2023 demonstrating the continued resilience of our business. Since 2021, the business has added £1.8bn of additional revenue, £1.0bn of adjusted gross profit and £0.4bn of adjusted operating profit driving strong cash generation. This meant we reached the initial leverage target outlined at our Capital Markets Day in February 2022, one year ahead of our expectation. We have therefore updated our capital allocation priorities and plan to return £500m to shareholders through buybacks in 2024. Haleon is now on a journey to become more agile and consumer focused with a leading portfolio. During 2023, we examined our processes to ensure that they were fit for purpose and restructured where necessary. Additionally, we proactively managed our portfolio and agreed to divest both Lamisil and ChapStick which will drive more focus to our key growth areas. I would like to thank everyone at Haleon for all their efforts across the business. Profitable growth For 2023, we reported revenue of £11.3bn (+4.1%), delivering organic revenue growth of 8.0%. Foreign exchange reduced revenue by (3.8)% and net M&A by (0.1)%. We saw broad-based organic growth demonstrating the long-term attractiveness of our brands and geographic footprint. Our strong execution in market meant that we were able to increase prices to help offset inflationary cost pressures, whilst also preserving volume growth. Our growth was profitable, with operating profit of £1,996m (+9.4%) and adjusted operating profit up 10.4% at constant currency reflecting strong operating leverage across the business. This drove adjusted operating margin growth of 50bps at constant currency. Margin was down 20bps at actual exchange rates. EPS was 11.3p, and adjusted EPS was 17.3p, down 6.0% reflecting the annualisation of our interest charge given 2023 was our first full year as a standalone company. Investments We continued to ensure the business remains fully invested whilst being focused on cost discipline to deliver value. This included investments into our systems, processes and sales force. Our A&P spend was flat and up 3% at constant currency for the year. We drove further efficiencies in spend through agency consolidation and in-house production. Spend was targeted across advertising and expert engagement which delivered strong ROI. Advertising spend increased in key areas including Oral Health and VMS, and in important growth markets such as India and China. Adjusted R&D expenditure totalled £297m (2022: £303m), representing a healthy level of spend into innovation. Our gross capital expenditure was £336m (2022: £328m) with spend focused on sales and marketing, manufacturing sites and technology, particularly in automation. Becoming agile and consumer focused During the year, we announced a programme to increase agility and productivity across the business which will result in annualised gross cost savings of c.£300m, largely in 2024 and 2025. We are on-track to deliver this through initiatives including restructuring. As a result, a number of employees have left the business as we de-layer functions, increase the speed of decision making and route to market. Haleon is also focused on proactively managing its portfolio and will remain rigorous and disciplined where there are opportunities. During 2023, we disposed of Lamisil for £235m, and reached an agreement to sell ChapStick for approximately $430 million, and a passive minority interest in Suave Brands Company, allowing Haleon to participate in further value creation of the brand. Both Lamisil and ChapStick are strong brands in their own right, but divesting allows us to reduce complexity, accelerate revenue growth, reduce debt and drive shareholder returns. Driving shareholder returns Since demerger, our strong free cash flow generation has allowed us to reduce net debt by over £2bn, finishing the year at £8.5bn with over £1bn of cash on hand. Our debt is staggered and secured at attractive rates. During 2023, we repaid $300m of our 2024 notes, one year early. We next have $700m due in March 2024 with $1.75bn due in March 2025, both of which we expect to fund largely from our operational cash flows. Our leverage at the end of 2023 stood at 3.0x net debt/adjusted EBITDA. Hence, leverage of less than 3x is in sight to be achieved during 2024. Given this, we have updated our capital allocation priorities. Haleon is now targeting to operate at around 2.5x net debt/adjusted EBITDA over the medium term. We believe that this is the right leverage to enable the business to appropriately balance our capital allocation priorities of continued investment for growth, explore acquisitions and return surplus capital to shareholders through dividends and share buybacks. Given these priorities, the Board has proposed a final dividend for 2023 of 4.2p per ordinary share and a total dividend of 6.0p per ordinary share, which represents approximately 35% of our 2023 adjusted earnings. As a result, since demerger, Haleon will have returned £0.8bn in dividends to shareholders. Going forward, Haleon expects to grow its ordinary dividend at least in line with adjusted earnings. In addition, we expect to allocate capital of £500m to share buybacks in 2024. This reflects expected savings from our productivity programme, cash proceeds from announced disposals and accelerated progress in de-leveraging. Looking ahead I am encouraged by the strength and resilience of our business model to deliver superior shareholder returns. There is more to do as we become more agile and consumer focused. Nevertheless, I am confident Haleon will deliver another year of strong performance. This, combined with our capital allocation framework, will drive value for all our stakeholders. 34 Haleon Annual Report and Form 20-F 2023 Strategic Report |
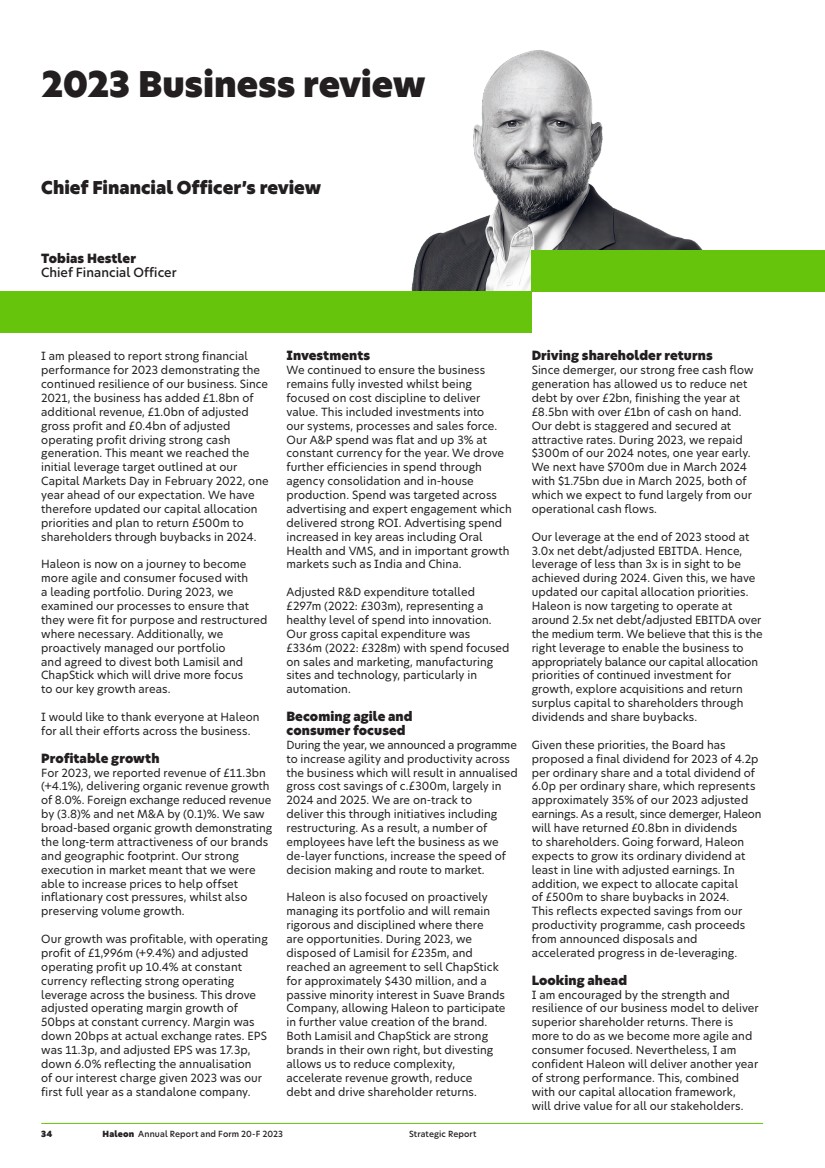
| Revenue Revenue increased 4.1% to £11,302m (2022: £10,858m). Adverse foreign exchange had a 3.8% impact on total revenue. This was largely driven by the Pound Sterling strengthening against the Argentine Peso, the Chinese Renminbi and other emerging market currencies. The net impact of M&A3 had a 0.1% adverse impact largely from the disposal of Lamisil which was completed in November 2023. Revenue grew 8.0% organically for 2023. Gross profit Reported gross profit increased by 2.6% to £6,747m (2022: £6,577m) with gross margin down 90bps to 59.7%. Adjusted gross profit increased by 3.4% or 7.3% at constant currency to £7,001m (2022: £6,772m) with adjusted gross margin of 61.9% (2022: 62.4%). Adjusted gross profit was driven by pricing and ongoing supply chain, and manufacturing efficiency benefits. This helped offset higher commodity-related costs and cost inflation which particularly impacted performance in the first half. During the second half of the year, these headwinds eased resulting in growth in adjusted gross profit margin in the fourth quarter. Operating profit Operating profit increased by 9.4% to £1,996m (2022: £1,825m) and operating profit margin increased 90bps to 17.7% (2022: 16.8%). Adjusted operating profit increased by 3.1% to £2,549m (2022: £2,472m) or 10.4% at constant currency. Adjusted operating profit growth at constant currency was driven by strong revenue growth, partly offset by higher A&P spend and investments into our systems, processes and sales force. In addition, adjusted operating profit was impacted by higher commodity and raw material costs, and cost inflation. Net finance costs Net finance costs were £368m (2022: £207m). This reflected finance costs of £402m (2022: £258m), primarily related to the annualisation of interest on the issuance of £9.2bn in notes in March 2022 and finance income of £34m (2022: £51m). Tax charge The statutory tax charge of £517m (2022: £499m) represented an effective tax rate on reported results of 31.8% (2022: 30.8%). The 2023 tax charge includes a £155m non-cash charge related to intragroup transfers. The 2022 tax charge included a £102m non-cash charge due to the revaluation of US deferred tax liabilities given the increase in the blended rate of US state taxes that applies due to the demerger. The tax charge on an adjusted basis was £512m (2022: £506m) and the effective tax rate on an adjusted basis was 23.5% (2022: 22.3%). Profit after tax and earnings per share Profit after tax attributable to shareholders of the Group was £1,049m (2022: £1,060m), and adjusted profit after tax attributable to shareholders was £1,607m (2022: £1,700m), down 5.5% at AER and up 2.5% at constant currency. The increase at constant exchange rates was driven by 10.4% growth in adjusted operating profit which was partly offset by the annualisation of interest costs and the higher tax rate described above. This resulted in diluted earnings per share of 11.3p (2022: 11.5p) and adjusted diluted earnings per share of 17.3p (2022: 18.4p). Income statement summary 2023 £m 20222 £m % change Revenue 11,302 10,858 4.1 Revenue growth 4.1% 13.8% Organic revenue growth1 8.0% 9.0% Gross profit 6,747 6,577 2.6 Adjusted gross profit1 7,001 6,772 3.4 Operating profit 1,996 1,825 9.4 Adjusted operating profit1 2,549 2,472 3.1 Net finance costs (368) (207) 77.8 Profit before tax 1,628 1,618 0.6 Adjusted profit before tax1 2,181 2,265 (3.7) Profit after tax attributed to shareholders of the Group 1,049 1,060 (1.0) Adjusted profit after tax attributed to shareholders of the Group1 1,607 1,700 (5.5) Earnings per ordinary share Diluted (pence) 11.3 11.5 (1.7) Adjusted1 (pence) 17.3 18.4 (6.0) 1 Definitions and calculations of non-IFRS measures can be found from page 43. 2 For a discussion of the Group’s financial and operating performance for the year ending 31 December 2021 and 31 December 2022, see Haleon’s 2022 Annual Report and Form 20-F, pages 36-45, filed with the SEC on 20 March 2023. 3 Net M&A (predominately the disposal of Lamisil) includes the impact of Manufacturing Service Agreements (MSAs). Haleon Annual Report and Form 20-F 2023 35 Strategic Report 2023 Business review |
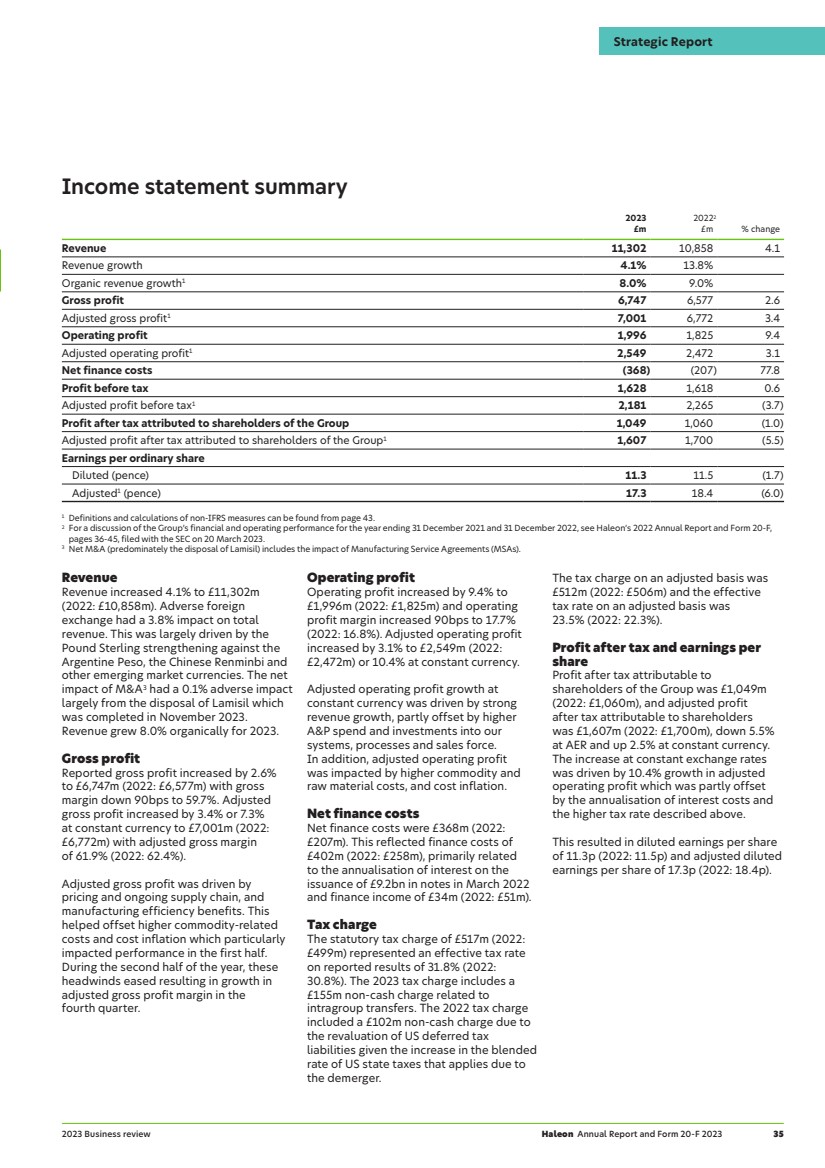
| 2023 Business review continued Geographical segment performance Revenue by geographical segment for the year ended 31 December Revenue (£m) Revenue change (%) 2023 2022 Reported Constant currency1 Organic1 Price1 Vol/Mix1 North America 4,195 4,116 1.9% 2.7% 2.7% 3.6% (0.9)% EMEA & LatAm 4,545 4,270 6.4% 12.4% 12.6% 12.8% (0.2)% APAC 2,562 2,472 3.6% 9.0% 9.0% 2.7% 6.3% Group 11,302 10,858 4.1% 7.9% 8.0% 7.0% 1.0% 1 Price and volume/mix are components of organic revenue growth. Definitions and calculations of non-IFRS measures can be found from page 43. Adjusted operating profit by geographical segment for the year ended 31 December Adjusted operating profit1 (£m) YoY change YoY constant currency1 2023 2022 2023 2023 Group operating profit 1,996 1,825 9.4% 19.1% Reconciling items between adjusted operating profit and operating profit2 553 647 (14.5)% (14.1)% Group adjusted operating profit3 2,549 2,472 3.1% 10.4% North America 1,107 1,070 3.5% 4.7% EMEA & LatAm 1,010 977 3.4% 12.6% APAC 541 506 6.9% 17.8% Corporate and other unallocated (109) (81) 34.6% 6.1% Group adjusted operating profit 2,549 2,472 3.1% 10.4% 1 Definitions and calculations of non-IFRS measures can be found from page 43. 2 Reconciling items for these purposes are the adjusting items, which are defined under Use of non-IFRS Measures. A reconciliation between operating profit and adjusted operating profit is included under Use of non-IFRS Measures. 3 On a segment basis, adjusted operating profit is the measure of segment profit or loss reviewed by the Company’s chief operating decision maker. Adjusting items are not allocated by segment, as these items are managed centrally by the Group, and therefore are not part of the measure of segment profit or loss reviewed by the Company’s chief operating decision maker. 36 Haleon Annual Report and Form 20-F 2023 Strategic Report |
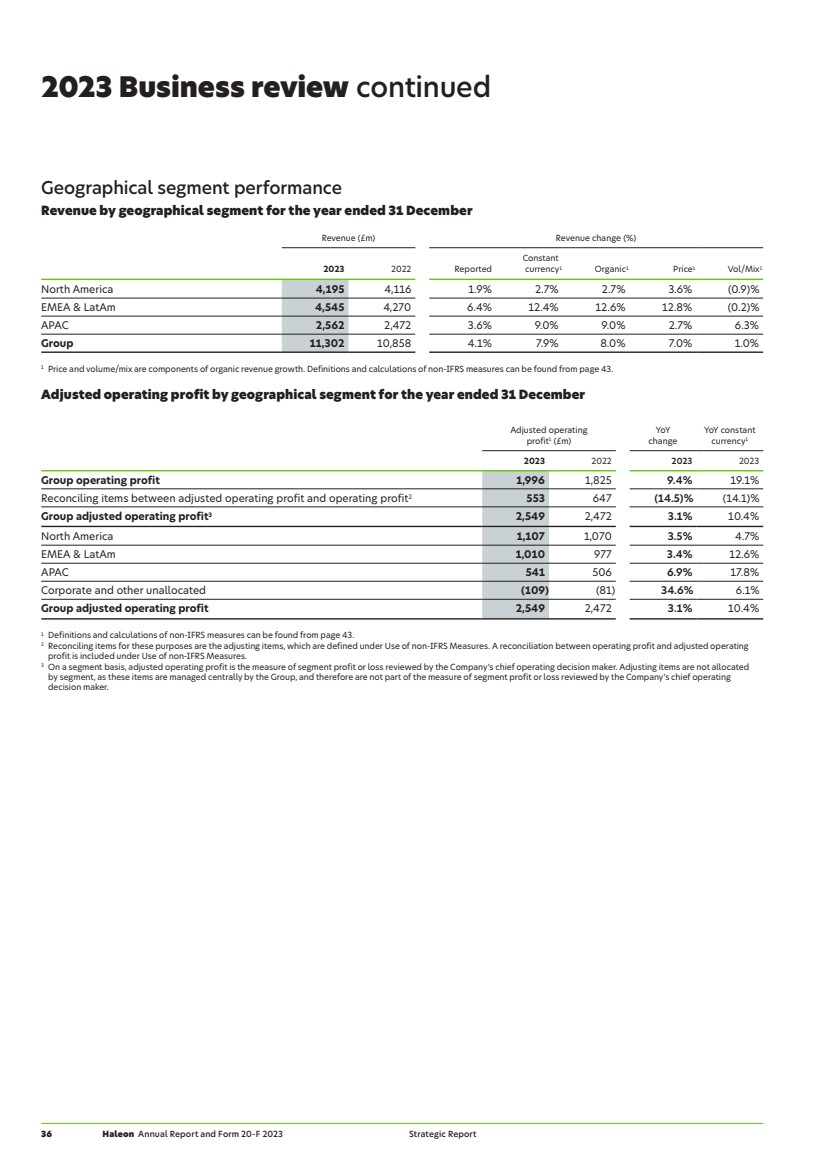
| 2023 Revenue North America 37% Geographical segment performance North America change (%) 2023 £m 2022 £m YoY Constant currency1 Organic1 Price2 Vol/Mix2 Revenue 4,195 4,116 1.9% 2.7% 2.7% 3.6% (0.9)% Adjusted operating profit1 1,107 1,070 3.5% 4.7% 4.8% n/a n/a Adjusted operating profit margin1 26.4% 26.0% 0.4% 0.5% 0.5% n/a n/a 1 Definitions and calculations of non-IFRS measures can be found from page 43. 2 Price and volume/mix are components of organic revenue growth. 3 In 2024, Haleon will consider organic profit growth as a KPI replacing adjusted operating profit; See page 33. Revenue was £4,195m (2022: £4,116m), a growth of 1.9% on a reported basis which included the negative effect of exchange rates of (0.8)%. There was no impact from net M&A. As a result, revenue grew 2.7% on an organic basis with +3.6% price and (0.9)% volume/mix. Excluding the impact of foreign exchange and net M&A, Oral Health revenue was up high-single digit in the year, with double digit growth in Sensodyne underpinned by strong performance from Sensodyne Pronamel Active Shield and Sensodyne Sensitivity & Gum. VMS declined mid single digit driven by weakness in the immunity subcategory resulting in a double digit decline in Emergen-C. Centrum declined low-single digit, largely driven by performance in the fourth quarter from retailer stocking patterns. Centrum Silver continued to see strong performance following the activation of cognitive function claims. Respiratory Health revenue grew high-single digit reflecting a strong cold and flu season at the start of the year combined with a normal seasonal sell-in and good consumption in the second half. Pain Relief grew low-single digit with strength in Excedrin and Voltaren partly offset by lower growth in Advil given the tough comparative from strength last year in Canada. Digestive Health and Other revenue was flat reflecting low-single digit growth in Digestive Health offset by a decline in Skin Health. Adjusted operating profit increased 3.5% at AER and 4.7% at constant currency driven by pricing, strong cost management and a one-time tax credit which more than offset significant cost inflation in material and labour costs across the region. Adjusted operating profit margin expanded 40bps at AER and 50bps at CER to 26.4%. Revenue growth 1.9% Organic revenue growth1 2.7% Organic profit growth3 4.8% Haleon Annual Report and Form 20-F 2023 37 Strategic Report 2023 Business review |
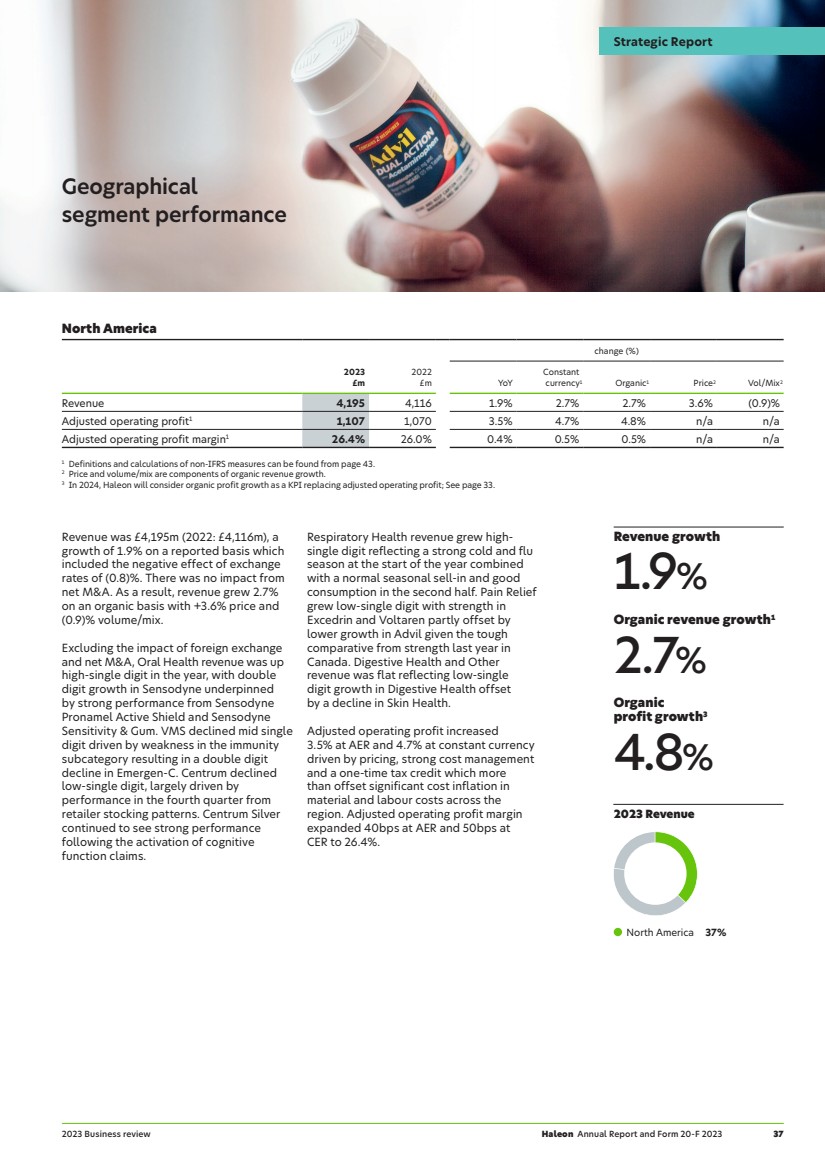
| 2023 Revenue EMEA & LatAm 40% 2023 Business review continued Geographical segment performance continued Geographically, Latin America, Middle East & Africa and Central and Eastern Europe all saw strong double digit revenue growth which was driven by price. Southern Europe was up high single digit with strength in Italy. Northern Europe was up mid-single digit with particularly strong performance in UK and recovered performance in Germany. Adjusted operating profit increased 3.4% at AER and 12.6% at constant currency driven by pricing and operational efficiency improvements that more than offset inflationary cost pressures. The impact of divestments was most pronounced in this region, negatively impacting adjusted operating profit growth by 80bps. Adjusted operating profit margin decreased by 70bps at AER to 22.2% and increased 10bps at CER. Revenue was £4,545m (2022: £4,270m), a growth of 6.4% on a reported basis which included the negative effect of foreign exchange (6.0)% and net M&A impact of (0.2)%. As a result, revenue grew +12.6% on an organic basis with +12.8% price and (0.2)% volume/mix. There was a c.3% impact to revenue from pricing in Turkey and Argentina, which impacted the overall Group by c.1%. Excluding the impact of foreign exchange and net M&A, Oral Health, Respiratory Health, Digestive Health and Other all grew double digit. In Oral Health, revenue was supported by double digit growth across all three Power Brands, Sensodyne, parodontax and Polident/Poligrip. VMS saw low-single digit growth with double digit growth in Centrum partly offset by a decline in some Local Growth brands. Pain Relief increased high-single digit driven by double digit growth in Panadol given strength in Northern and Central & Eastern Europe, and low-single digit growth in Voltaren due to good growth in Middle East & Africa and Southern Europe. Respiratory Health saw strong demand in Theraflu particularly in Central & Eastern Europe as well as double digit growth in Otrivin due to growth in Middle East and Africa and Central and Eastern Europe. In Digestive Health and Other, there was double digit growth in Digestive Health, Smokers Health and Skin Health. In Digestive Health, ENO was particularly strong, and in Skin Health Zovirax also saw strong growth. Europe, Middle East & Africa (EMEA) and Latin America (LatAm) change (%) 2023 £m 2022 £m YoY Constant currency1 Organic1 Price2 Vol/Mix2 Revenue 4,545 4,270 6.4% 12.4% 12.6% 12.8% (0.2)% Adjusted operating profit1 1,010 977 3.4% 12.6% 13.4% n/a n/a Adjusted operating profit margin1 22.2% 22.9% (0.7)% 0.1% 0.2% n/a n/a 1 Definitions and calculations of non-IFRS measures can be found from page 43. 2 Price and volume/mix are components of organic revenue growth. 3 In 2024, Haleon will consider organic profit growth as a KPI replacing adjusted operating profit; See page 33. Organic profit growth3 13.4% Organic revenue growth1 12.6% Revenue growth 6.4% 38 Haleon Annual Report and Form 20-F 2023 Strategic Report |
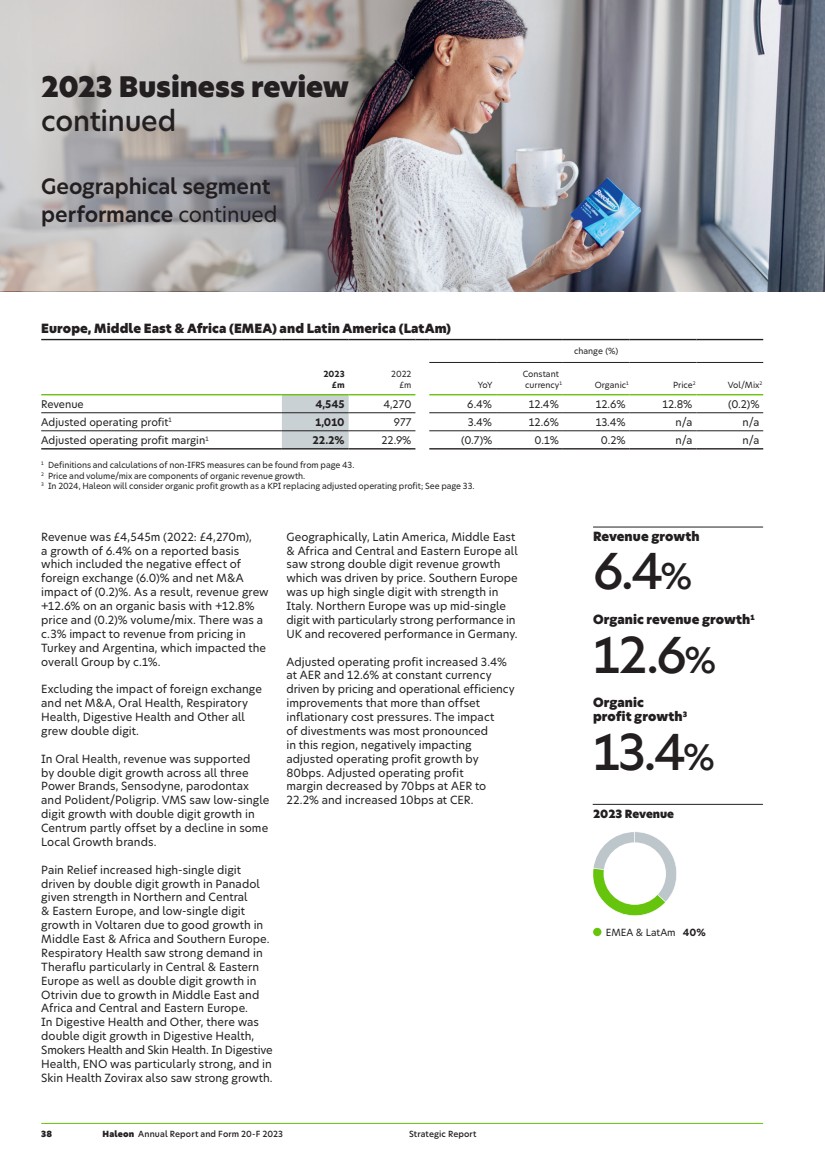
| 2023 Revenue Asia Pacific 23% Geographically, performance was particularly strong in China, and up double digit given strength in Fenbid and Contac at the start of the year. India saw high-single digit growth driven by continued strong growth in Sensodyne. Australia and New Zealand was up mid-single digit underpinned by Panadol performance and South East Asia & Taiwan also saw mid-single digit growth. Adjusted operating profit increased 6.9% at AER and 17.8% at constant currency driven by positive operating leverage from strong revenue growth combined with operational efficiencies which more than offset inflationary cost pressure. Adjusted operating profit margin increased by 60bps at AER to 21.1% or 170bps at CER. Revenue was £2,562m (2022: £2,472m), a growth of 3.6% on a reported basis which included the negative impact of exchange rates of (5.4)%. As a result, revenue grew +9.0% on an organic basis with +2.7% price and +6.3% volume/mix. Excluding the impact of foreign exchange and net M&A, Respiratory Health and Pain Relief saw double digit growth. There was strong demand for Contac and Fenbid during the first half of the year, following the cessation of COVID-19-related lockdowns in China. Inventory in both these products were pro-actively managed in the second half of the year to normal pre-pandemic levels. In Pain Relief, performance was supported by Voltaren and Panadol with strong results in China and Australia respectively. Oral Health grew mid-single digit driven by mid-single digit growth in Sensodyne, with double digit growth in India and mid-single digit growth in China. parodontax also delivered double digit growth. VMS grew mid-single digit with Centrum and Caltrate both up mid-single digit. Digestive Health and Other increased mid-single digit. Asia Pacific (APAC) change (%) 2023 £m 2022 £m YoY Constant currency1 Organic1 Price2 Vol/Mix2 Revenue 2,562 2,472 3.6% 9.0% 9.0% 2.7% 6.3% Adjusted operating profit1 541 506 6.9% 17.8% 17.6% n/a n/a Adjusted operating profit margin1 21.1% 20.5% 0.6% 1.7% 1.6% n/a n/a 1 Definitions and calculations of non-IFRS measures can be found from page 43. 2 Price and volume/mix are components of organic revenue growth. 3 In 2024, Haleon will consider organic profit growth as a KPI replacing adjusted operating profit; See page 33. Organic profit growth3 17.6% Organic revenue growth1 9.0% Revenue growth 3.6% Haleon Annual Report and Form 20-F 2023 39 Strategic Report 2023 Business review |
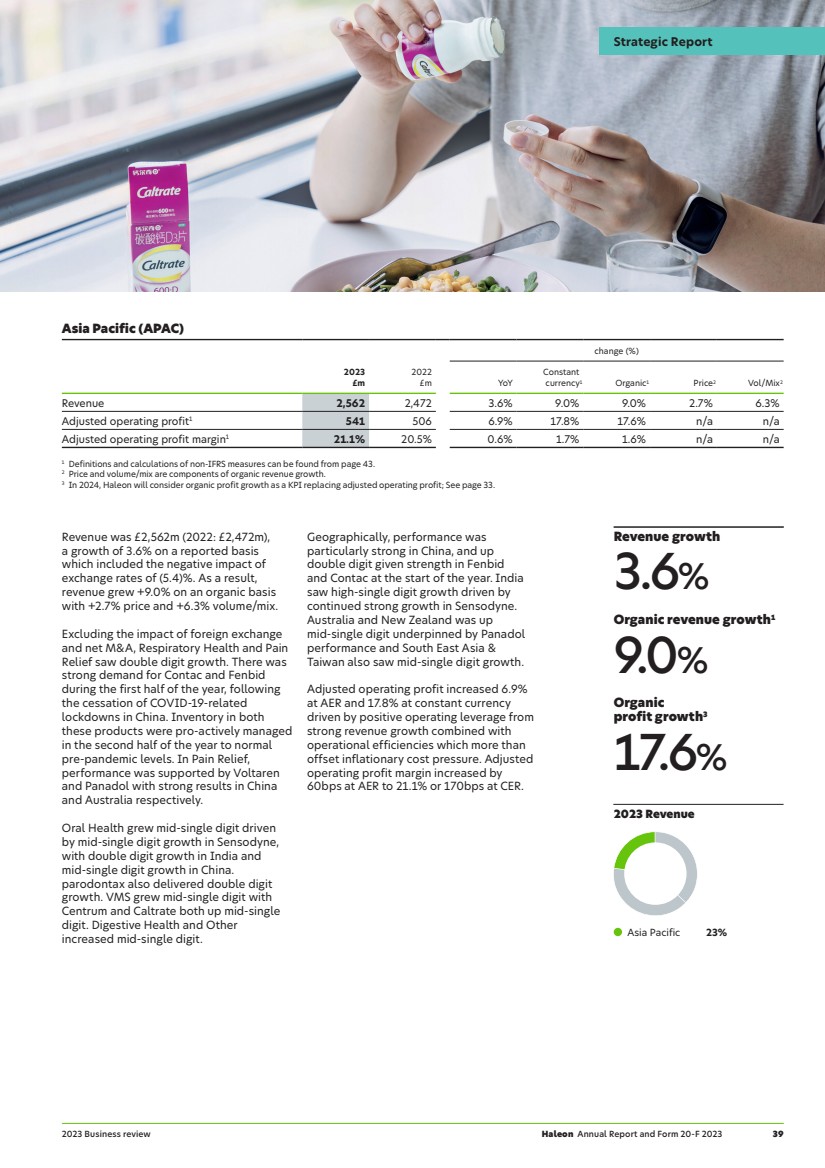
| 2023 Business review continued Pain Relief Revenue was £2,652m (2022: £2,551m), a growth of + 4.0% on a reported basis which included the negative effect of exchange rates of (3.2)% and net M&A impact of (0.2)%. This resulted in 7.4% organic growth. Growth in revenue excluding the impact of foreign exchange and net M&A was driven by double digit growth in Panadol due to strength in Middle East and Africa and Australia supported by improved capacity. Voltaren grew mid-single digit with strong growth in the US, Central and Eastern Europe and Middle East and Africa. Advil grew low single digit and was impacted by more competitive market conditions in the second half of the year and a tough comparative from strong demand in Canada last year following the RSV surge and resulting surge in medication needs for children with Children’s Advil. Fenbid grew over 50% due to exceptional growth in H1 2023 due to the cessation of COVID-19 lockdown restrictions, with inventory levels normalising in H2. Revenue declined in Q4 due to lapping the tough comparatives for Fenbid given strong growth in the prior year as COVID-19 lockdowns ended in China. VMS Revenue was £1,640m (2022: £1,675m), a decrease of (2.1)% on a reported basis which included the negative effect of exchange rates of (3.0)%. This resulted in 0.9% organic growth. Growth in revenue excluding the impact of foreign exchange and net M&A was driven by low-single digit growth with double digit growth in Centrum partly offset by a decline in some Local Growth brands. Centrum increased mid single digit with LatAm and China both up double digit. This partly offset a slight decline in North America driven mainly by weakness in the first half of the year. Caltrate increased mid-single digit driven by a similar level of growth in China. As expected, Emergen-C declined double digit in North America given the immunity category reversion to pre-COVID-19 levels, although the brand saw improved performance in Q4 up low single digit in the region. Oral Health Revenue was £3,136m (2022: £2,957m), a growth of +6.1% on a reported basis which included the negative effect of exchange rates of (4.5)%. This resulted in 10.6% organic growth. Growth in revenue excluding the impact of foreign exchange was driven by Sensodyne with North America, Middle East and Africa, LatAm and India, all seeing double digit growth. Parodontax benefited from particularly healthy growth in Middle East and Africa and US. Denture Care growth was underpinned by strong performance from innovations such as Polident Max Hold+ and some recovery from the COVID-19 pandemic. Elsewhere, Aquafresh saw mid-single digit growth driven by strong execution in-market. Revenue by market category for the year ended 31 December Revenue (£m) Revenue change (%) 2023 2022 Reported Constant currency1 Organic1 Oral Health 3,136 2,957 6.1% 10.6% 10.6% VMS 1,640 1,675 (2.1)% 1.0% 0.9% Pain Relief 2,652 2,551 4.0% 7.3% 7.4% Respiratory Health 1,736 1,579 9.9% 13.7% 13.7% Digestive Health and Other 2,138 2,096 2.0% 6.0% 6.5% Group revenue 11,302 10,858 4.1% 7.9% 8.0% 1 Price and volume/mix are components of organic revenue growth. Definitions and calculations of non-IFRS measures can be found from page 43. Revenue by market category 40 Haleon Annual Report and Form 20-F 2023 Strategic Report |
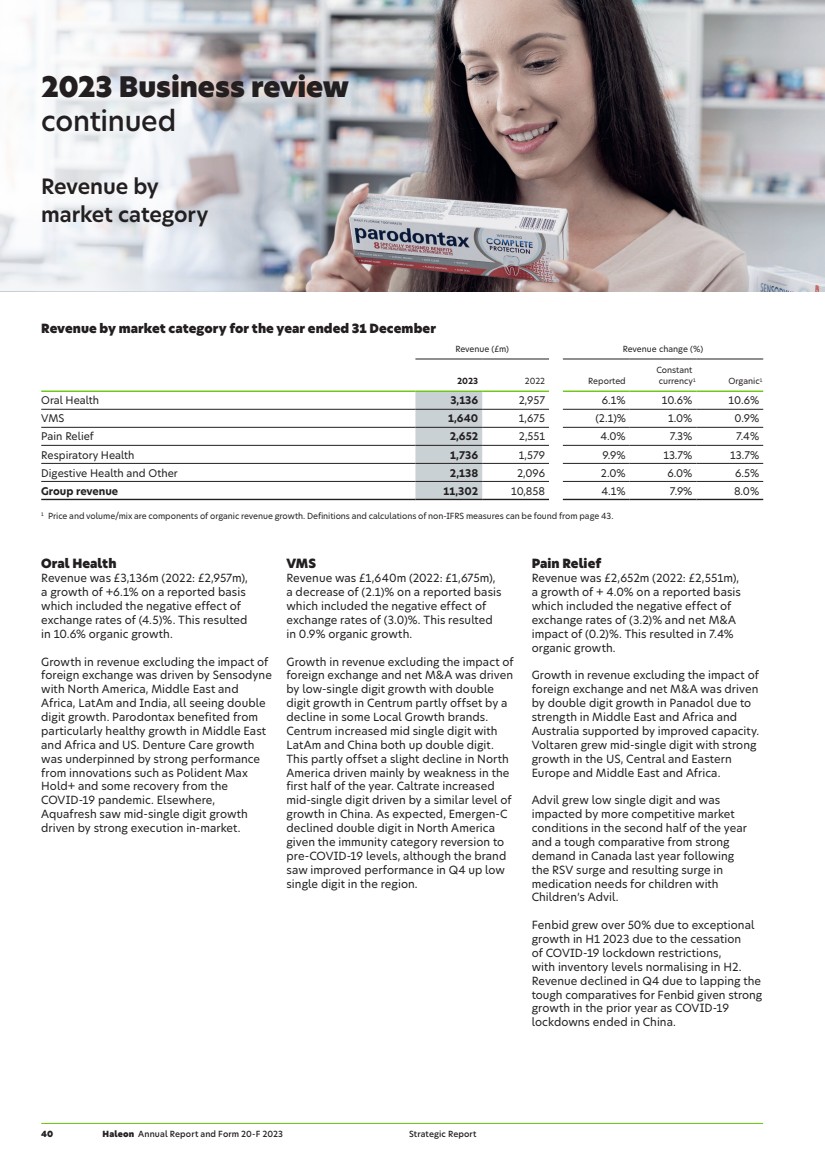
| Digestive Health and Other Revenue was £2,138m (2022: £2,096m), a growth of +2.0% on a reported basis which included (4.0)% negative effect of exchange rates and (0.5)% from net M&A. This resulted in organic growth of 6.5%. Revenue excluding the impact of foreign exchange, was driven by mid single digit growth across the three areas in this product category comprising c.50% Digestive Health, c.25% Skin Health and c.25% Smoking Cessation brands. Growth in Digestive Health was underpinned by strength in Tums, which was particularly strong in the fourth quarter following a recall in the same period in 2022. Eno also saw double digit growth that was partially offset by a decline in Nexium. In Skin Health, double digit growth in Bactroban was a key growth driver. Respiratory Health Revenue was £1,736m (2022: £1,579m), a growth of +9.9% on a reported basis which included the negative effect of exchange rates of (3.8)%. This resulted in organic growth of 13.7%. Growth in revenue excluding the impact of foreign exchange, resulted from a strong cold and flu season at the start of the year. Following a normal seasonal sell-in in Q3, cold and flu products saw low single digit organic growth in North America and double digit growth in EMEA & LatAm during the fourth quarter. Contac sales were particularly strong, mainly due to significant growth in China in H1 following the end of lockdowns at the end of 2022. Allergy sales grew low single digit for the year. Theraflu and Otrivin both increased double digit, with strength in Central & Eastern Europe and Middle East & Africa. Haleon Annual Report and Form 20-F 2023 41 Strategic Report 2023 Business review |
| Currency mix of net debt (including swaps) 1 includes £208m of net cash in other currencies USD 54% EUR 20% GBP1 11% CNH 15% Currency mix of total borrowings (as issued) USD 69% EUR 21% GBP 8% Other 1% 0 450 900 1350 1800 2024 2025 2026 2027 2028 2029 2030 2032 2034 2038 2052 Bond debt maturity profile (£m) USD EUR GBP 548 707 650 646 398 763 299 1,561 1,551 1,336 775 2022 2023 Net debt1 (£m) De-leveraging through a combination of net debt reduction and adjusted EBITDA growth Adjusted EBITDA1 (£m) 9,868 8,514 2022 2023 2,730 +4% (14)% 2,831 Net debt/ adjusted EBITDA1 2022 2023 3.6x 3.0x 2023 Business review continued Indebtedness, liquidity and financial risk management separation costs which were offset by a full year of interest costs and increased restructuring costs. Liquidity At 31 December 2023, the Group had total liquidity of £2,914m comprising £1,920m of bank facilities and £1,044m of cash and cash equivalents, less £50m of bank overdrafts. The Group has undrawn credit facilities of $1,300m (2022: $1,400m) with maturity date of September 2024 and £900m (2022: £1,000m) with maturity date of September 2026. As at 31 December 2023, no amounts were drawn under these facilities (2022: nil). The Group uses short-term financing to manage working capital requirements and has access to a $10,000m US commercial paper programme and a £2,000m Euro commercial paper programme. There was no commercial paper outstanding as of 31 December 2023 (2022: £302m). Management believes that the Group has sufficient working capital for present requirements and to minimise liquidity risk, the Group has policies to limit the amount of debt maturing in any year. In addition, policies require the Group to always maintain a minimum available liquidity, including undrawn revolving credit facilities and available cash, less commercial paper issued. Interest rate risk The Group’s strategic priorities are to minimise interest costs and minimise income statement volatility arising from interest rates. The Group has a policy to limit the amount of floating rate debt it holds to manage the amount of income statement volatility. The Group will regularly assess its interest rate profile in light of changes to market interest rates. At 31 December 2023, 77% of debt was fixed with the balance being exposed to floating rates. Foreign exchange translation risk The Group’s policy is to manage Group net debt such that the currency mix of debt broadly aligns with the currency mix of earnings, considering relative interest costs and practical implications. The currency mix of debt includes the impact of foreign exchange and cross-currency swaps. As at 31 December 2023, the Group’s long-term and short-term credit ratings were Moody’s: Baa1/P-2 and S&P: BBB/A-2. Total borrowings/profit after tax was 8.3x and net debt/adjusted EBITDA was 3.0x as at 31 December 2023. Haleon expects to operate with leverage of around 2.5x net debt/adjusted EBITDA over the medium term. Cash generation Net cash from operating activities totalled £2,100m in 2023 (2022: £2,063m). Free cash flow was £1,575m, a £4m decrease versus 2022, driven by an increase in operational cashflows and reduction in Indebtedness At 31 December 2023, the Group’s total borrowings were £9,456m (2022: £10,440m), and the Group’s net debt was £8,514m (2022: £9,868m). Long-term financing consists of $8,448m in USD bonds, as well as €2,350m Euro bonds and £700m GBP bonds issued in March 2022 under a £10,000m Euro Medium Term Note programme. $302m of bond debt was repaid early in 2023 using cashflows from operations. Bond financing includes the $700m USD bond due March 2024, now classified as short-term debt on the balance sheet. 1 Definitions and calculations of non-IFRS measures can be found from page 43. 42 Haleon Annual Report and Form 20-F 2023 Strategic Report |
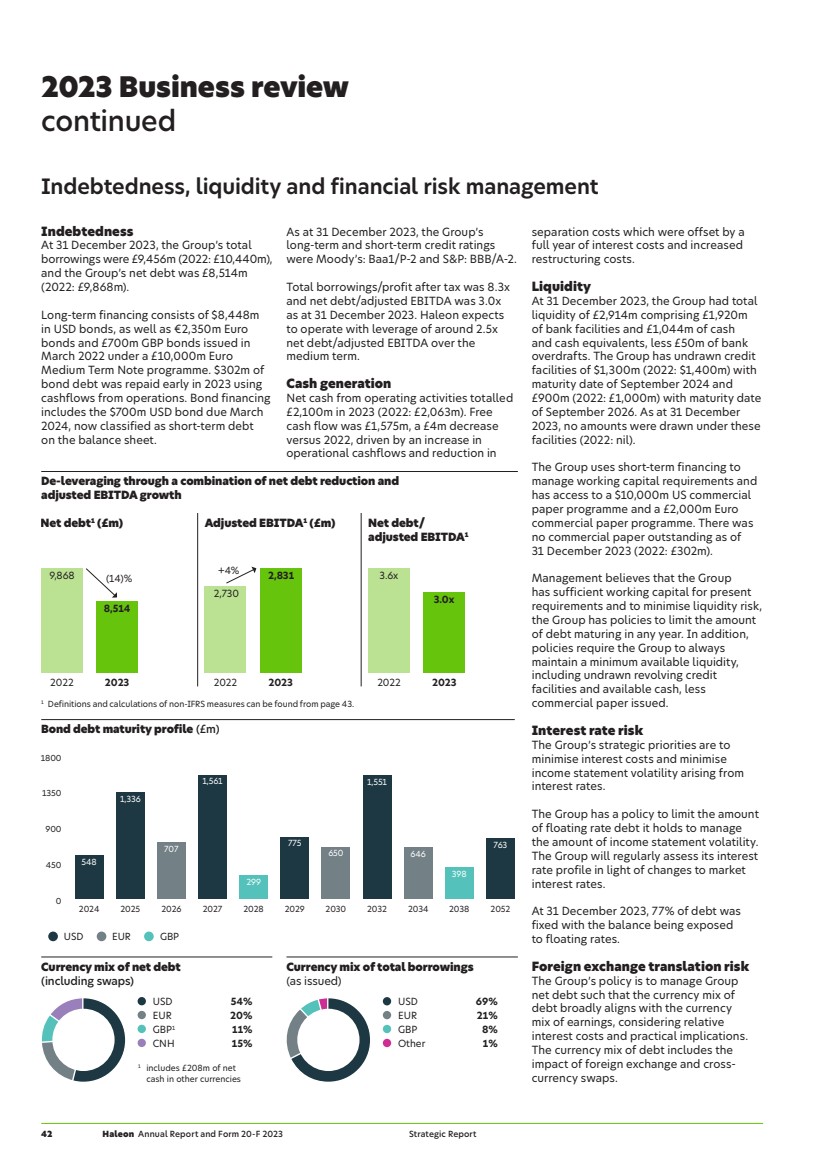
| Use of non-IFRS measures We use certain alternative performance measures (APMs) to make financial, operating, and planning decisions and to evaluate and report performance. We believe these measures provide useful information to investors and as such, where clearly identified, we have included certain alternative performance measures in this document to allow investors to better analyse our business performance and allow greater comparability. To do so, we have excluded items affecting the comparability of period-over-period financial performance. Adjusted results and other non-IFRS measures may be considered in addition to, but not as a substitute for or superior to, information presented in accordance with IFRS and may not be directly comparable with similar measures used by other companies. Additionally, we are unable to present reconciliations of forward-looking information for non-IFRS measures because we are unable to forecast accurately certain adjusting items required to present a meaningful comparable IFRS forward-looking financial measure. Adjusted results exclude net amortisation and impairment of intangible assets, restructuring costs, transaction-related costs, separation and admission costs, and disposals and others, in each case net of the impact of taxes (where applicable) (collectively, the adjusting items). We believe that adjusted results, when considered together with the Group’s operating results as reported under IFRS, provide investors, analysts and other stakeholders with helpful complementary information to understand the financial performance and position of the Group from period to period and allow the Group’s performance to be more easily comparable. Adjusted results include the benefits of restructuring programmes but exclude significant costs (such as significant legal, restructuring and transaction items). They should not be regarded as a complete picture of the Group’s financial performance, which is presented in the Group’s reported results. The exclusion of other adjusting items may result in adjusted results being materially higher or lower than reported results. In particular, when significant impairments, restructuring charges and legal costs are excluded, adjusted results will be higher than reported results. Adjusting items Adjusted results exclude the following items (net of the impact of taxes, where applicable): Net amortisation and impairment of intangible assets Net impairment of intangibles, impairment of goodwill and amortisation of acquired intangible assets, excluding computer software. These adjustments are made to reflect the performance of the business excluding the effect of acquisitions. Changes to APMs In 2023, we introduced organic operating profit growth as a new APM. Organic operating profit growth differs from our presentation of adjusted operating profit growth as it is further adjusted for the effects of acquisitions, divestments, MSAs, and exchange rates. Management believes that presenting organic operating profit growth contributes to the understanding of the Group’s performance in a meaningful and consistent way as well as aligning with our organic revenue growth measure. The new APM was effective from 1 January 2023 but we have presented alongside 2022 comparatives. Beginning in 2024, our organic revenue growth calculation will cap pricing in excess of 26 percent per annum for countries experiencing hyperinflation. For Haleon, this will apply to Argentina and Turkey. Corresponding adjustments will be made to all income statement related lines when calculating organic growth changes. Additionally, we are no longer presenting free cash flow conversion and net capital expenditure as APMs since they are simply a mathematical derivation of free cash flow in proportion to profit after tax and an aggregation of cash flow line items, respectively. Adjusted results Adjusted results comprise adjusted cost of sales, adjusted gross profit, adjusted gross profit margin, adjusted selling, general and administration (SG&A), adjusted research and development (R&D), adjusted other operating income/(expense), adjusted operating expenses, adjusted operating profit, adjusted operating profit margin, adjusted net finance costs, adjusted profit before tax, adjusted income tax, adjusted effective tax rate, adjusted profit after tax, adjusted profit attributable to shareholders and adjusted diluted earnings per share. Restructuring costs From time to time, the Group may undertake business restructuring programmes that are structural in nature and significant in scale. The cost associated with such programmes includes severance and other personnel costs, professional fees, impairments of assets, and other related items. Transaction-related costs Transaction-related accounting or other adjustments related to significant acquisitions including deal costs and other pre-acquisition costs when there is certainty that an acquisition will complete. It also includes costs of registering and issuing debt and equity securities and the effect of inventory revaluations on acquisitions. Haleon Annual Report and Form 20-F 2023 43 Strategic Report Use of non-IFRS measures |

| Use of non-IFRS measures continued Disposals and others Includes gains and losses on disposals of assets, businesses and tax indemnities related to business combinations, legal settlement and judgements, impact of changes in tax rates and tax laws on deferred tax assets and liabilities, retained or uninsured losses related to acts of terrorism, significant product recalls, natural disasters and other items. Separation and admission costs Costs incurred in relation to and in connection with separation, UK admission and registration of the Company’s ordinary shares represented by the Company’s American Depositary Shares (ADSs) under the US Exchange Act of 1934 and listing of ADSs on the NYSE (the US Listing). These costs are not directly attributable to the sale of the Group’s products and specifically relate to the foregoing activities, affecting comparability of the Group’s financial results in historical and future reporting periods. These gains and losses are not directly attributable to the sale of the Group’s products and vary from period to period, which affects comparability of the Group’s financial results. From period to period, the Group will also need to apply judgement if items of unique nature arise that are not specifically listed above. The following tables set out a reconciliation between IFRS and adjusted results for the year ended 31 December 2023: 2023 £m IFRS results Net amortisation and impairment of intangible assets1 Restructuring costs2 Transaction-related costs3 Separation and admission costs4 Disposals and others5 Adjusted results Revenue 11,302 — — — — — 11,302 Gross profit 6,747 224 26 — 4 — 7,001 Gross profit margin % 59.7% 61.9% Operating profit 1,996 224 169 2 120 38 2,549 Operating profit margin % 17.7% 22.6% Net finance costs (368) — — — — — (368) Profit before tax 1,628 224 169 2 120 38 2,181 Income tax (517) (53) (35) — (29) 122 (512) Effective tax rate % 31.8% 23.5% Profit after tax for the year 1,111 171 134 2 91 160 1,669 The following table shows the adjusting items to reconcile cost of sales to adjusted cost of sales: 2023 £m IFRS results Net amortisation and impairment of intangible assets1 Restructuring costs2 Transaction-related costs3 Separation and admission costs4 Disposals and others5 Adjusted results Cost of sales (4,555) 224 26 — 4 — (4,301) Cost of sales (4,555) 224 26 — 4 — (4,301) The following table shows the adjusting items to reconcile operating expenses to adjusted operating expenses among the relevant components thereof: 2023 £m IFRS results Net amortisation and impairment of intangible assets1 Restructuring costs2 Transaction-related costs3 Separation and admission costs4 Disposals and others5 Adjusted results Selling, general and administration (4,413) — 129 2 116 6 (4,160) Research and development (311) — 14 — — — (297) Other operating income/(expense) (27) — — — — 32 5 Operating expenses (4,751) — 143 2 116 38 (4,452) The following table shows the adjusting items used to reconcile diluted earnings per share to adjusted diluted earnings per share: 2023 £m IFRS results Net amortisation and impairment of intangible assets1 Restructuring costs2 Transaction-related costs3 Separation and admission costs4 Disposals and others5 Adjusted results Profit attributable to shareholders (£m) 1,049 171 134 2 91 160 1,607 Weighted average number of shares (millions) 9,263 9,263 Diluted earnings per share (pence) 11.3 1.8 1.4 — 1.1 1.7 17.3 1 Net amortisation and impairment of intangible assets: includes impairment of intangible assets of £185m and amortisation of intangible assets excluding computer software of £39m. 2 Restructuring costs: includes amounts related to business transformation activities. 3 Transaction-related costs: includes amounts related to acquisition of a manufacturing site. 4 Separation and admission costs: includes amounts incurred in relation to and in connection with the separation and listing of the Group as a standalone business. 5 Disposals and others: includes net losses on disposals of assets and businesses totalling £38m. The tax effect includes a £155m deferred tax charge related to intragroup transfers. 44 Haleon Annual Report and Form 20-F 2023 Strategic Report |
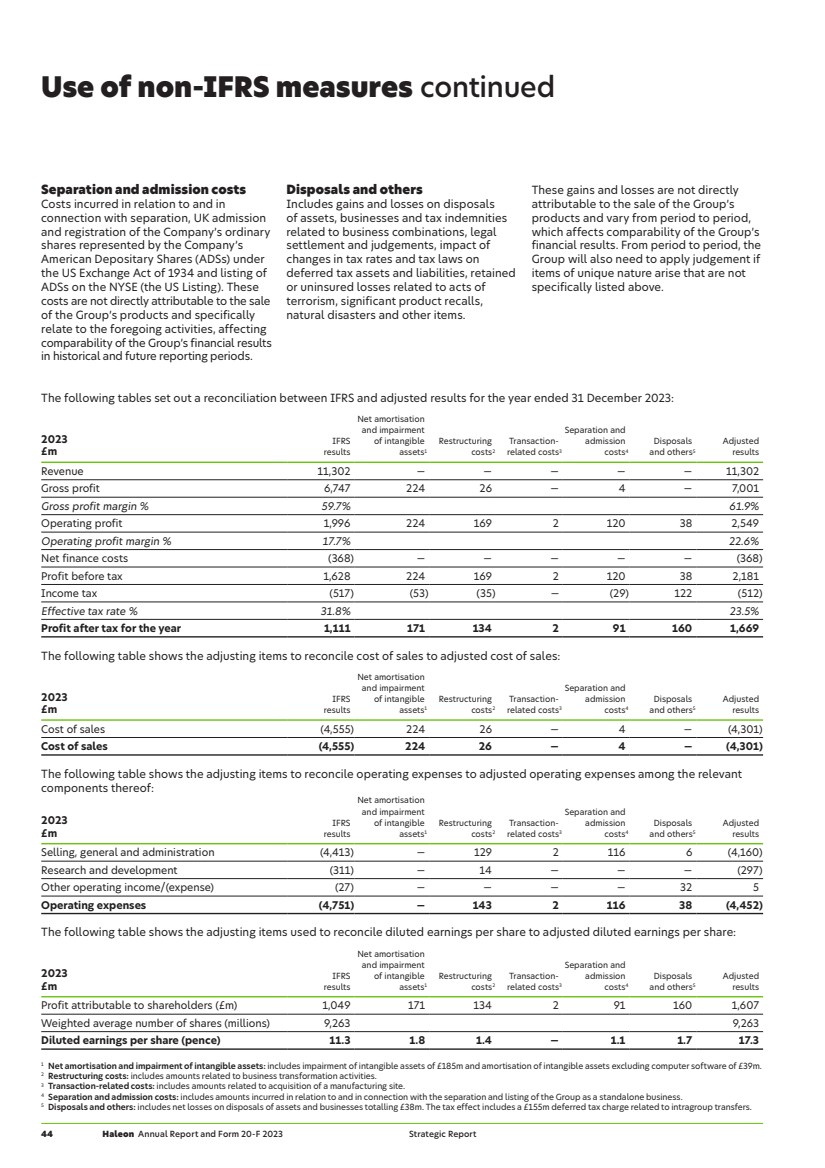
| The following tables set out a reconciliation between IFRS and adjusted results for the year ended 31 December 2022: 2022 £m IFRS results Net amortisation and impairment of intangible assets1 Restructuring costs2 Transaction-related costs3 Separation and admission costs4 Disposals and others5 Adjusted results Revenue 10,858 — — — — — 10,858 Gross profit 6,577 172 19 — 4 — 6,772 Gross profit margin % 60.6% 62.4% Operating profit 1,825 172 41 8 411 15 2,472 Operating profit margin % 16.8% 22.8% Net finance costs (207) — — — — — (207) Profit before tax 1,618 172 41 8 411 15 2,265 Income tax (499) (37) (7) (2) (55) 94 (506) Effective tax rate % 30.8% 22.3% Profit after tax for the year 1,119 135 34 6 356 109 1,759 The following table shows the adjusting items to reconcile cost of sales to adjusted cost of sales: 2022 £m IFRS results Net amortisation and impairment of intangible assets1 Restructuring costs2 Transaction-related costs3 Separation and admission costs4 Disposals and others5 Adjusted results Cost of sales (4,281) 172 19 — 4 — (4,086) Cost of sales (4,281) 172 19 — 4 — (4,086) The following table shows the adjusting items to reconcile operating expenses to adjusted operating expenses among the relevant components thereof: 2022 £m IFRS results Net amortisation and impairment of intangible assets1 Restructuring costs2 Transaction-related costs3 Separation and admission costs4 Disposals and others5 Adjusted results Selling, general and administration (4,483) — 25 8 407 44 (3,999) Research and development (300) — (3) — — — (303) Other operating income/(expense) 31 — — — — (29) 2 Operating expenses (4,752) — 22 8 407 15 (4,300) The following table shows the adjusting items used to reconcile diluted earnings per share to adjusted diluted earnings per share: 2022 £m IFRS results Net amortisation and impairment of intangible assets1 Restructuring costs2 Transaction-related costs3 Separation and admission costs4 Disposals and others5 Adjusted results Profit attributable to shareholders (£m) 1,060 135 34 6 356 109 1,700 Weighted average number of shares (millions) 9,239 9,239 Diluted earnings per share (pence) 11.5 1.4 0.4 0.1 3.8 1.2 18.4 1 Net amortisation and impairment of intangible assets: includes impairment of intangible assets of £129m and amortisation of intangible assets excluding computer software of £43m. 2 Restructuring costs: includes amounts related to business transformation activities. 3 Transaction-related costs: includes amounts related to acquisition of a manufacturing site. 4 Separation and admission costs: includes amounts incurred in relation to and in connection with the separation and listing of the Group as a standalone business. 5 Disposals and others: includes net gains on disposals of assets and business changes totalling £20m, offset by other items including a provision with respect to PPI litigation. The tax effect includes a £102m deferred tax charge related to the revaluation of US deferred tax liabilities due to the increase in the blended rate of US state taxes expected to apply as a result of the demerger. Haleon Annual Report and Form 20-F 2023 45 Strategic Report Use of non-IFRS measures |

| Use of non-IFRS measures continued The following tables set out a reconciliation between IFRS and adjusted results for the year ended 31 December 2021: 2021 £m IFRS results Net amortisation and impairment of intangible assets1 Restructuring costs2 Transaction-related costs Separation and admission costs3 Disposals and others4 Adjusted results Revenue 9,545 — — — — — 9,545 Gross profit 5,950 8 44 — — — 6,002 Gross profit margin % 62.3% 62.9% Operating profit 1,638 16 195 — 278 45 2,172 Operating profit margin % 17.2% 22.8% Net finance costs (2) — — — — — (2) Profit before tax 1,636 16 195 — 278 45 2,170 Income tax (197) 8 (36) — (47) (197) (469) Effective tax rate % 12.0% 21.6% Profit after tax for the year 1,439 24 159 — 231 (152) 1,701 The following table shows the adjusting items used to reconcile cost of sales to adjusted cost of sales: 2021 £m IFRS results Net amortisation and impairment of intangible assets1 Restructuring costs2 Transaction-related costs Separation and admission costs3 Disposals and others4 Adjusted results Cost of sales (3,595) 8 44 — — — (3,543) Cost of sales (3,595) 8 44 — — — (3,543) The following table shows the adjusting items to reconcile operating expenses to adjusted operating expenses among the relevant components thereof: 2021 £m IFRS results Net amortisation and impairment of intangible assets1 Restructuring costs2 Transaction-related costs Separation and admission costs3 Disposals and others4 Adjusted results Selling, general and administration (4,086) — 150 — 278 76 (3,582) Research and development (257) 8 1 — — — (248) Other operating income/(expense) 31 — — — — (31) — Operating expenses (4,312) 8 151 — 278 45 (3,830) The following table shows the adjusting items used to reconcile diluted earnings per share to adjusted diluted earnings per share: 2021 £m IFRS results Net amortisation and impairment of intangible assets1 Restructuring costs2 Transaction-related costs Separation and admission costs3 Disposals and others4 Adjusted results Profit attributable to shareholders (£m) 1,390 24 159 — 231 (152) 1,652 Weighted average number of shares (millions) 9,235 9,235 Diluted earnings per share (pence) 15.1 0.2 1.7 — 2.5 (1.6) 17.9 1 Net amortisation and impairment of intangible assets: includes impairment of intangible assets of £12m, reversal of impairment of £36m and amortisation of intangible assets excluding computer software of £40m. 2 Restructuring costs: includes amounts related to business transformation activities. 3 Separation and admission costs: includes amounts incurred in relation to and in connection with the separation and listing of the Group as a standalone business. 4 Disposals and others: includes net gains on disposals of assets and businesses totalling £31m, offset by tax indemnities related to business combinations and other expense items totalling £76m. Income tax includes a £164m tax credit related to an uplift of the tax basis of certain intragroup brand transfers. 46 Haleon Annual Report and Form 20-F 2023 Strategic Report |
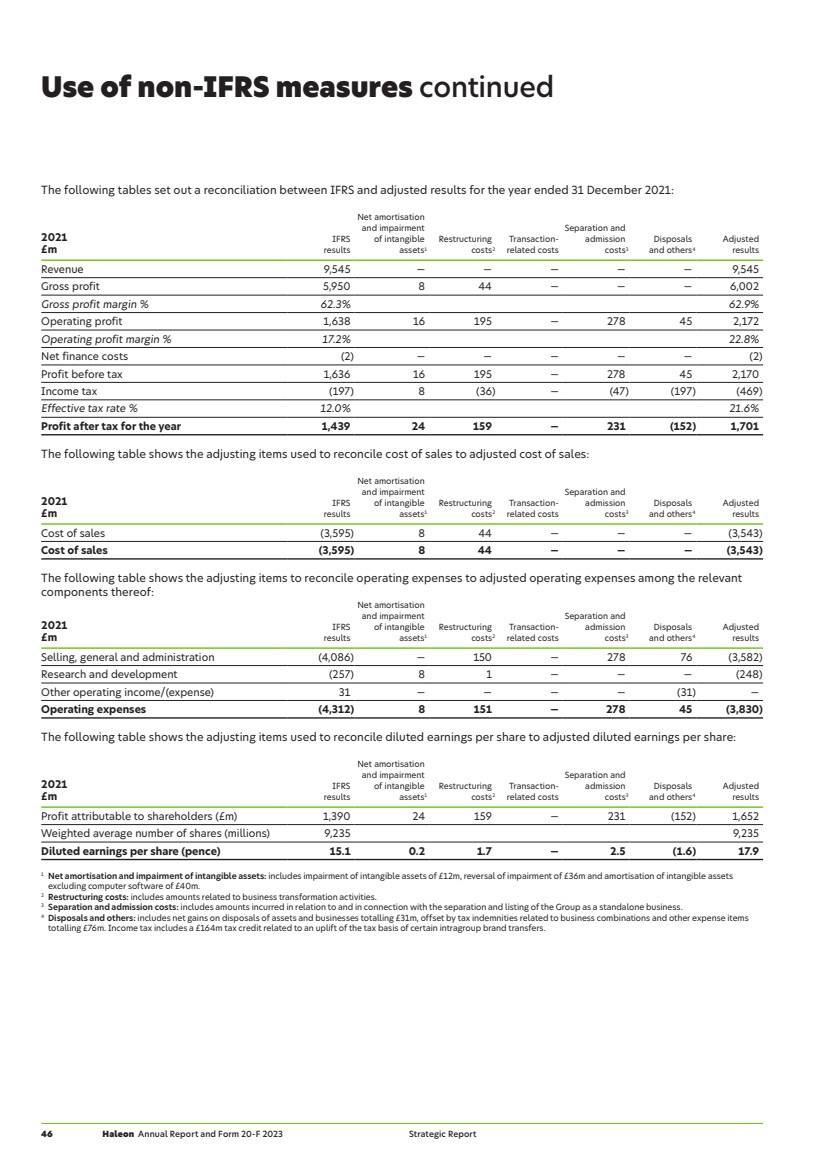
| Constant currency The Group’s reporting currency is Pound Sterling, but the Group’s significant international operations give rise to fluctuations in foreign exchange rates. To neutralise foreign exchange impact and to better illustrate the change in results from one year to the next, the Group discusses its results both on an ‘as reported basis’ or using actual exchange rates (AER) (local currency results translated into Pound Sterling at the prevailing foreign exchange rate) and using constant currency exchange rates (CER). To calculate results on a constant currency basis, prior year exchange rates are used to restate current year comparatives. The principal currencies and relevant exchange rates in the key markets where the Group operates are shown below. Average rates: 2023 2022 2021 USD/£ 1.24 1.24 1.38 Euro/£ 1.15 1.17 1.16 CNY/£ 8.81 8.31 8.86 Organic revenue growth and organic operating profit growth Our organic growth measures take our adjusted results and further exclude the impact of divestments, acquisitions, MSAs relating to divestments and closure of production sites, and the impact of foreign currency exchange movements from one period to the next. The Group believes discussing organic revenue growth and organic operating profit growth contributes to the understanding of the Group’s performance and trends because it allows for a year-on-year comparison of revenue and operating profit in a meaningful and consistent manner. Organic measures are calculated period to period as follows, using prior year exchange rates to restate current year comparatives: — Current year organic measures exclude revenue and operating profit from brands or businesses acquired in the current accounting period. — Current year organic measures exclude revenue and operating profit attributable to brands or businesses acquired in the prior year from 1 January to the date of completion of the acquisition. — Prior year organic measures exclude revenue and operating profit in respect to brands or businesses divested or closed in the current accounting period from 12 months prior to the completion of the disposal or closure until the end of the prior accounting period. — Prior year organic measures exclude revenue and operating profit in respect to brands or businesses divested or closed in the previous accounting period in full. — Prior year and current year organic measures exclude revenue and operating profit attributable to MSAs relating to divestments and closure of production sites taking place in either the current or prior year, each an organic adjustment. These adjustments are made because these agreements are transitional in nature and, with respect to production site closures, include a ramp-down period in which revenue and operating profit attributable to MSAs gradually reduces several months before the production site closes. To calculate organic growth for the period, organic measures for the prior year are subtracted from organic measures in the current year and divided by organic measures in the prior year. Organic revenue growth by individual geographical segment is further discussed by price and volume/mix changes, which are defined as follows: — Price: defined as the variation in revenue attributable to changes in prices during the period. Price excludes the impact to organic revenue growth due to (i) the volume of products sold during the period and (ii) the composition of products sold during the period. Price is calculated as current year net price minus prior year net price multiplied by current year volume. Net price is the sales price, after deduction of any trade, cash or volume discounts that can be reliably estimated at point of sale. Value added tax and other sales taxes are excluded from the net price. — Volume/mix: defined as the variation in revenue attributable to changes in volumes and composition of products sold in the period. Haleon Annual Report and Form 20-F 2023 47 Strategic Report Use of non-IFRS measures |
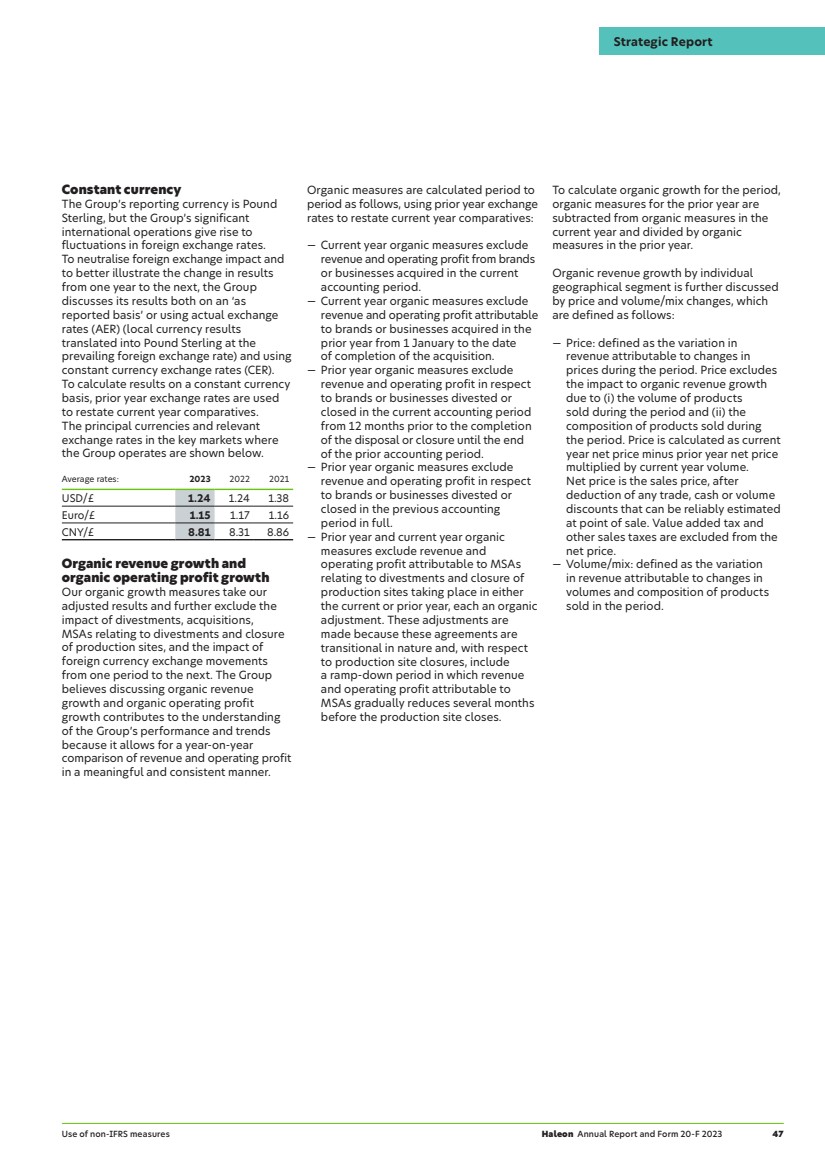
| Use of non-IFRS measures continued The following tables reconcile reported revenue growth and reported operating profit growth to organic revenue growth and organic operating profit growth, respectively, for the periods presented. Geographical segments North America EMEA & LatAm APAC Total 2023 vs 2022 (%) Revenue growth 1.9 6.4 3.6 4.1 Organic adjustments — 0.2 — 0.1 Effect of exchange rates 0.8 6.0 5.4 3.8 Organic revenue growth 2.7 12.6 9.0 8.0 Price 3.6 12.8 2.7 7.0 Volume/mix (0.9) (0.2) 6.3 1.0 North America EMEA & LatAm APAC Corporate and other unallocated Total 2023 vs 2022 (%) Operating profit growth — — — — 9.4 Adjusting items — — — — (14.5) Adjusted operating profit growth 3.5 3.4 6.9 34.6 3.1 Effect of exchange Rates 1.2 9.2 10.9 (28.5) 7.3 Adjusted operating profit growth (CER) 4.7 12.6 17.8 6.1 10.4 Organic adjustments 0.1 0.8 (0.2) — 0.4 Organic operating profit growth 4.8 13.4 17.6 6.1 10.8 North America EMEA & LatAm APAC Total 2022 vs 2021 (%) Revenue growth 16.8 10.1 15.4 13.8 Organic adjustments 0.3 0.9 (1.0) 0.2 Effect of exchange rates (11.2) (0.1) (3.8) (5.0) Organic revenue growth 5.9 10.9 10.6 9.0 Price 2.9 6.4 2.6 4.3 Volume/mix 3.0 4.5 8.0 4.7 48 Haleon Annual Report and Form 20-F 2023 Strategic Report |

| North America EMEA & LatAm APAC Corporate and other unallocated Total 2022 vs 2021 (%) Operating profit growth — — — — 11.4 Adjusting items — — — — 21.2 Adjusted operating profit growth 29.2 1.8 9.8 5.2 13.8 Effect of exchange rates (17.9) (0.6) (4.2) 5.2 (7.8) Adjusted operating profit growth (CER) 11.3 1.2 5.6 — 6.0 Organic adjustments 0.2 1.3 (3.4) — (0.1) Organic operating profit growth 11.5 2.5 2.2 — 5.9 North America EMEA & LatAm APAC Total 2021 vs 2020 (%) Revenue growth (6.7) (4.5) 4.3 (3.5) Organic adjustments 2.4 3.4 2.0 2.7 Effect of exchange rates 5.6 4.6 2.8 4.6 Organic revenue growth1 1.3 3.5 9.1 3.8 Price 2.2 Volume/mix 1.6 North America EMEA & LatAm APAC Corporate and other unallocated Total 2021 vs 2020 (%) Operating profit growth — — — — 2.5 Adjusting items — — — — 12.2 Adjusted operating profit growth (7.7) 12.0 22.3 36.3 4.7 Effect of exchange rates 6.5 7.6 2.9 3.6 6.4 Adjusted operating profit growth (CER) (1.2) 19.6 25.2 39.9 11.1 Organic adjustments 7.1 3.1 4.7 — 5.3 Organic operating profit growth 5.9 22.7 29.9 39.9 16.4 1 Organic revenue growth for the year ended 31 December 2020 excludes revenue attributable to brands acquired as part of the Pfizer Transaction for the period 1 January 2020 to 31 July 2020 and includes revenue attributable to these brands for the period 1 August 2020 to 31 December 2020. Sales patterns during these two periods were materially impacted by the COVID-19 pandemic, with increased sales during the former period driven by accelerated purchases by consumers, combined with increased consumption and sales during the latter period negatively impacted by a reduction in consumer inventories and weak cold and flu incidence. Haleon Annual Report and Form 20-F 2023 49 Strategic Report Use of non-IFRS measures |
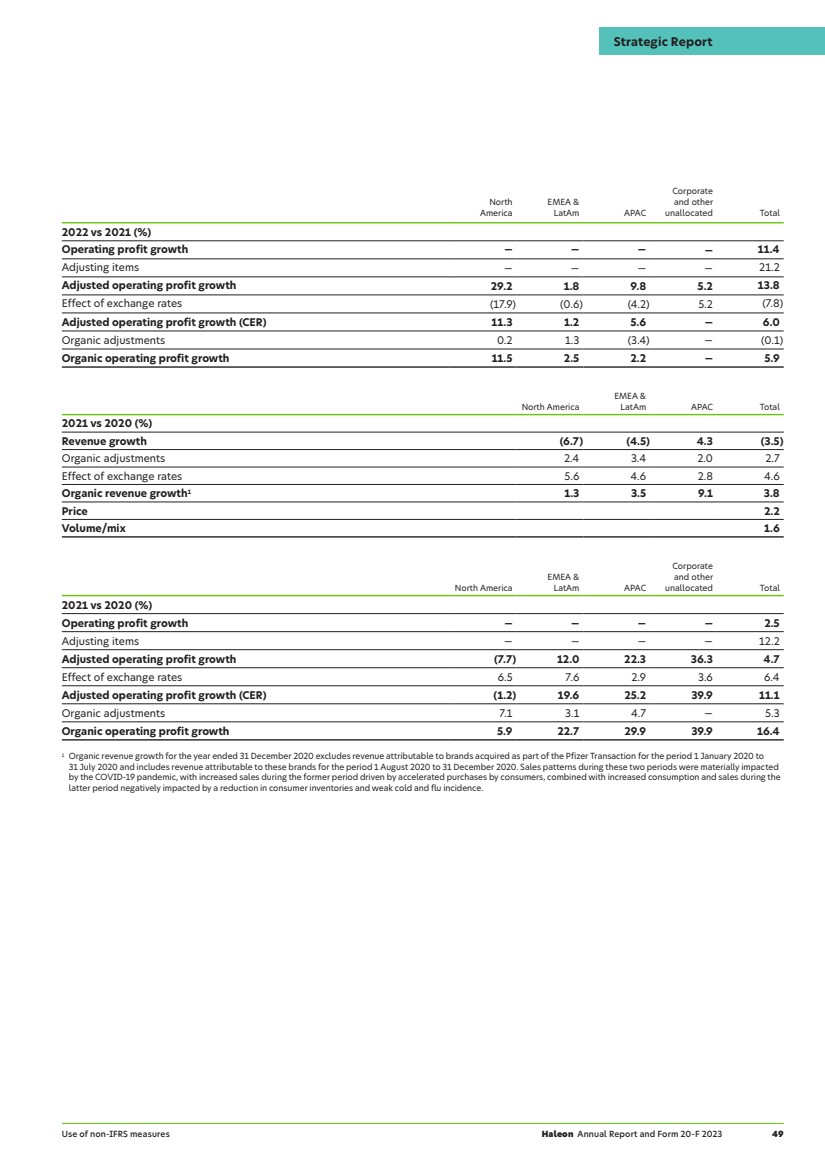
| Use of non-IFRS measures continued Market categories Oral Health VMS Pain Relief Respiratory Health Digestive Health and Other Total 2023 vs 2022 (%) Revenue growth 6.1 (2.1) 4.0 9.9 2.0 4.1 Organic adjustments — — 0.2 — 0.5 0.1 Effect of exchange rates 4.5 3.0 3.2 3.8 4.0 3.8 Organic revenue growth 10.6 0.9 7.4 13.7 6.5 8.0 Oral Health VMS Pain Relief Respiratory Health Digestive Health and Other Total 2022 vs 2021 (%) Revenue growth 8.6 11.6 14.0 39.5 7.4 13.8 Organic adjustments (0.3) (0.2) (0.4) — 2.2 0.2 Effect of exchange rates (2.7) (6.4) (4.7) (6.9) (6.7) (5.0) Organic revenue growth 5.6 5.0 8.9 32.6 2.9 9.0 Oral Health VMS Pain Relief Respiratory Health Digestive Health and Other Total 2021 vs 2020 (%) Revenue growth (0.8) 0.5 2.1 (12.8) (9.8) (3.5) Organic adjustments — 0.3 0.3 6.4 7.6 2.7 Effect of exchange rates 5.2 3.4 4.1 4.6 5.3 4.6 Organic revenue growth1 4.4 4.2 6.5 (1.8) 3.1 3.8 1 Organic revenue growth for the year ended 31 December 2020 excludes revenue attributable to brands acquired as part of the Pfizer Transaction for the period 1 January 2020 to 31 July 2020 and includes revenue attributable to these brands for the period 1 August 2020 to 31 December 2020. Sales patterns during these two periods were materially impacted by the COVID–19 pandemic with increased sales during the former period driven by accelerated purchases by consumers combined with increased consumption and sales during the latter period negatively impacted by a reduction in consumer inventories and weak cold and flu incidence. 50 Haleon Annual Report and Form 20-F 2023 Strategic Report |
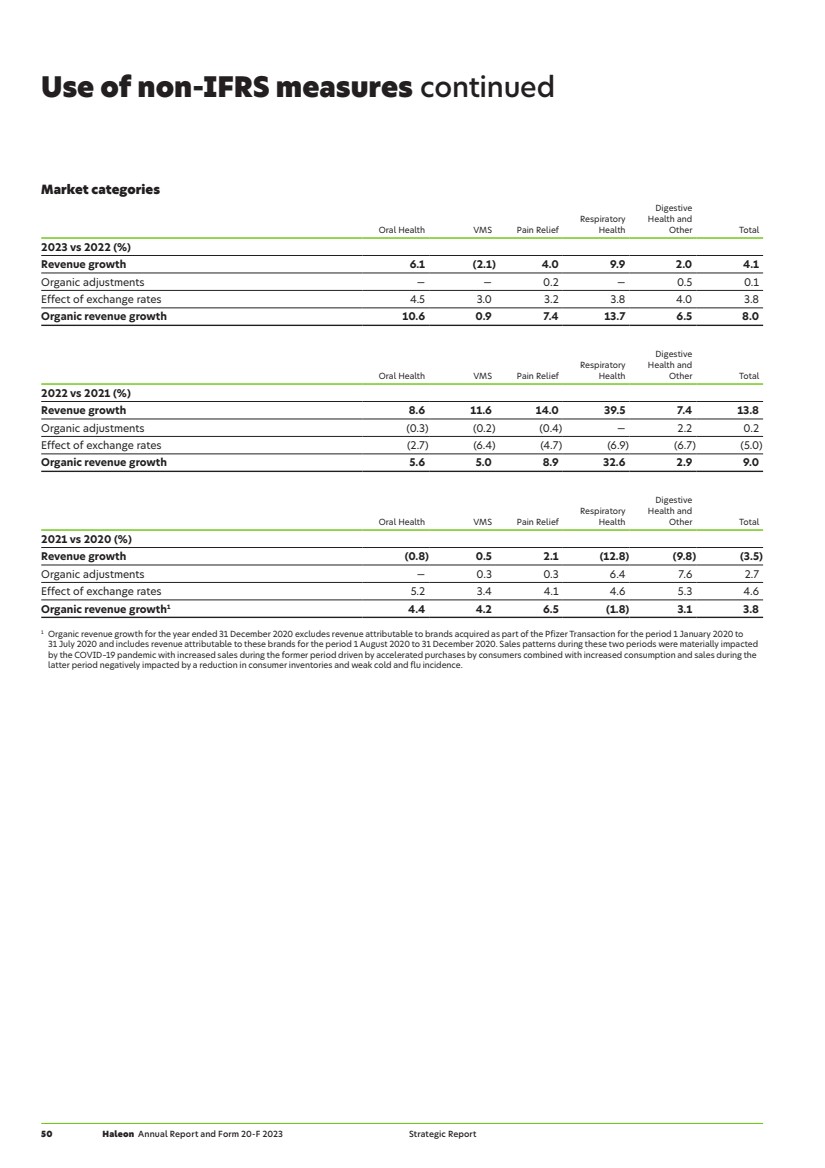
| Adjusted EBITDA Adjusted EBITDA is calculated as profit after tax excluding income tax, finance income, finance expense, adjusting items (as defined on page 43), depreciation of property, plant and equipment and right of use assets, amortisation of computer software, impairment of property, plant and equipment, right of use assets and computer software net of impairment reversals. Adjusted EBITDA does not reflect cash expenditures, or future requirements for capital expenditures or contractual commitments. Further, adjusted EBITDA does not reflect changes in, or cash requirements for, working capital needs, and although depreciation and amortisation are non-cash charges, the assets being depreciated and amortised are likely to be replaced in the future and adjusted EBITDA does not reflect cash requirements for such replacements. Adjusted EBITDA eliminates differences in performance caused by variations in capital structures (affecting net finance costs), tax positions (such as the availability of net operating losses against which to relieve taxable profits), the cost and age of tangible assets (affecting relative depreciation expense) and the extent to which intangible assets are identifiable (affecting relative amortisation expense). As a result, we believe that adjusted EBITDA provides useful information to understand and evaluate the Group’s operating results. The reconciliation between profit after tax for the year and Adjusted EBITDA for the years ended 31 December 2023, 31 December 2022 and 31 December 2021 is provided below: £m 2023 2022 2021 Profit after tax 1,111 1,119 1,439 Add back: Income tax 517 499 197 Less: Finance income (34) (51) (17) Add back: Finance expense 402 258 19 Operating profit 1,996 1,825 1,638 Net amortisation and impairment of intangible assets 224 172 16 Restructuring costs 169 41 195 Transaction-related costs 2 8 — Separation and admission costs 120 411 278 Disposals and others 38 15 45 Adjusted operating profit 2,549 2,472 2,172 Add back: Depreciation of property, plant and equipment 152 142 139 Add back: Depreciation of right of use assets 49 38 35 Add back: Amortisation of computer software 69 64 54 Add back: Impairment of property, plant and equipment, rights of use assets and computer software net of impairment reversals 12 14 13 Adjusted EBITDA 2,831 2,730 2,413 Haleon Annual Report and Form 20-F 2023 51 Strategic Report Use of non-IFRS measures |
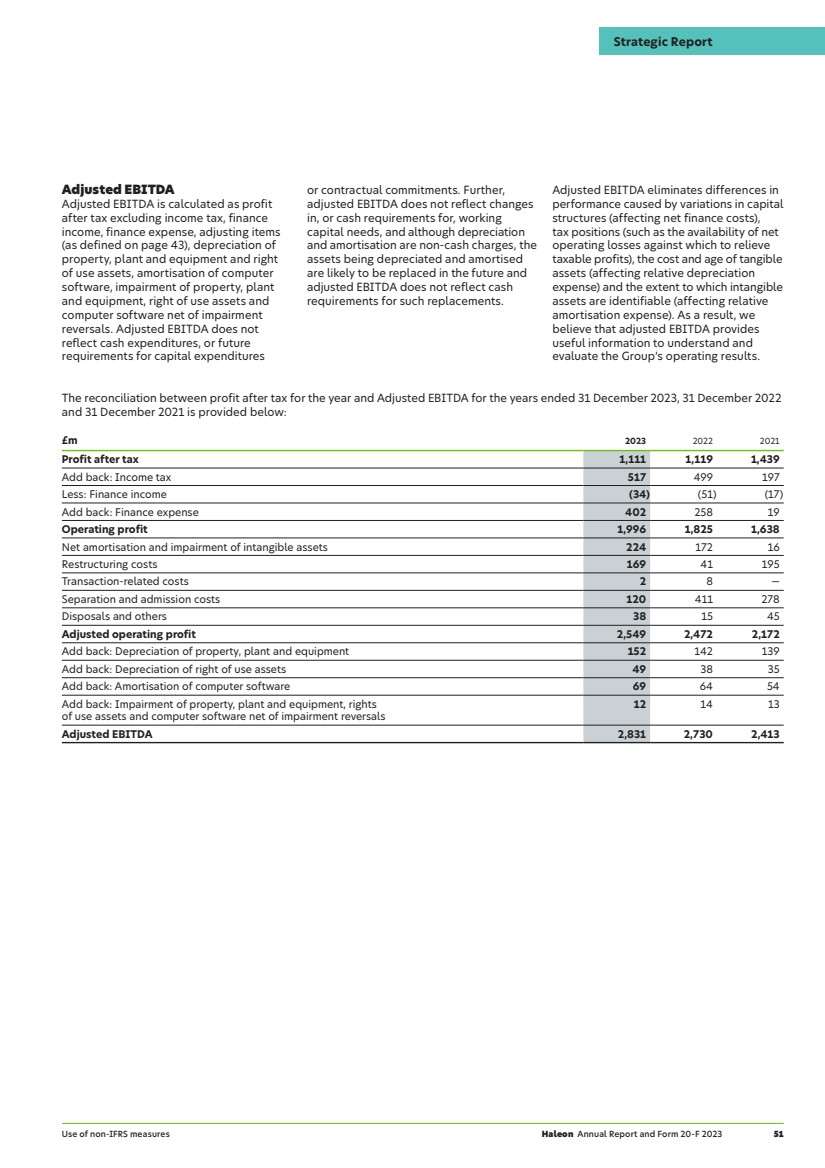
| Use of non-IFRS measures continued Free cash flow Free cash flow is calculated as net cash inflow from operating activities plus cash inflows from the sale of intangible assets, the sale of property, plant and equipment and interest received, less cash outflows for the purchase of intangible assets, the purchase of property, plant and equipment, distributions to non-controlling interests and interest paid. We believe free cash flow is meaningful to investors because it is the measure of the funds generated by the Group available for distribution of dividends, repayment of debt or to fund the Group’s strategic initiatives, including acquisitions. The purpose of presenting free cash flow is to indicate the ongoing cash generation within the control of the Group after taking account of the necessary cash expenditures for maintaining the capital and operating structure of the Group (in the form of payments of interest, corporate taxation and capital expenditure). The reconciliation of net cash inflow from operating activities to free cash flow for the years ended 31 December 2023, 31 December 2022 and 31 December 2021 is provided below: £m 2023 2022 2021 Net cash inflow from operating activities 2,100 2,063 1,356 Purchase of property, plant and equipment (234) (304) (228) Proceeds from sale of property, plant and equipment — — 12 Purchase of intangible assets (102) (24) (70) Proceeds from sale of intangible assets 246 36 137 Less: Distributions to non-controlling interests (58) (48) (35) Less: Interest paid (404) (163) (15) Add: Interest received 27 19 16 Free cash flow 1,575 1,579 1,173 Net debt Net debt at a period end is calculated as short-term borrowings (including bank overdrafts and short-term lease liabilities), long-term borrowings (including long-term lease liabilities), and derivative financial liabilities less cash and cash equivalents and derivative financial assets. We analyse the key cash flow items driving the movement in net debt to understand and assess cash performance and utilisation in order to maximise the efficiency with which resources are allocated. The analysis of cash movements in net debt allows management to more clearly identify the level of cash generated from operations that remains available for distribution after servicing the Group’s debt. In addition, the ratio of net debt to adjusted EBITDA is used by investors, analysts and credit rating agencies to analyse our operating performance in the context of targeted financial leverage. The reconciliation of net debt to the different balance sheet items as at 31 December 2023 and 31 December 2022 is provided below: £m 2023 2022 Short-term borrowings (656) (437) Long-term borrowings (8,800) (10,003) Derivative financial liabilities (190) (206) Derivative financial assets 88 94 Cash and cash equivalents 1,044 684 Net debt (8,514) (9,868) 52 Haleon Annual Report and Form 20-F 2023 Strategic Report |

| Accountability to stakeholders for organisational oversight Board Board Committees Audit & Risk | Environmental & Social Sustainability Nominations & Governance | Remuneration Enterprise Risk & Compliance Committee Risk management at Haleon Three lines Leads and directs actions and applications of resources to achieve the objectives of the organisation Expertise, support, monitoring and challenge on risk-related matters Independent and objective assurance and advice on all matters related to the achievements of objectives Business units Functions Enterprise Risk Management Expert Risk & Control Functions Internal Audit 1 2 3 First line Second line Third line Top down Internal inputs — Board/Board Committees — Enterprise Risk & Compliance Committee — Annual enterprise risk assessment — Internal data and insights — Strategic objectives — Internal audit outcomes Bottom up External inputs — Expert risk & control functions — Business unit and function ongoing risk/control strategy review — Business unit and function annual risk assessment — UK Corporate Governance Code, laws and regulations — External partners — External audit outcomes Our approach to risk We understand the challenges and uncertainties we face and take a proactive approach to risk management to maximise opportunities, drive informed commercial decision-making, and protect our people and assets. Risk management framework At Haleon, management of risk is firmly embedded in our strategy to achieve our long-term goals. We have a diverse range of risks and have appropriate processes and tools to identify risks before they materialise. We have simplified and embedded the risk management framework within the strategy and planning cycle, which ensures accountability for the identification, assessment, mitigation and monitoring of risks aligned with our strategic objectives. The framework supports information flow and open communication between the Board, the Audit & Risk Committee (ARC), the Executive Team, our functions, business units, markets and sites. Our framework defines the essential elements of the Group’s approach to risk management and compliance programmes, ensuring risks associated with conducting business activities are effectively controlled, in line with the Board’s risk appetite and compliance with regulatory requirements. The framework is aligned to the three lines model which assigns roles and responsibilities for the management of risks within Haleon. Risk governance The Board has ultimate accountability for managing the Group’s risks and setting our risk appetite in line with our strategic objectives. The Board ensures appropriate oversight through various mechanisms, including strategy meetings, management reports and reviews of selected risk areas. To assist the Board in discharging its responsibilities, the ARC is responsible for reviewing and assessing the effectiveness of the Group’s risk management and internal control systems, covering the Group’s enterprise risks, financial and operational controls and procedures. Control strategy Management action and reporting Risk identification Assessment of residual risk and prioritisation Haleon Annual Report and Form 20-F 2023 53 Strategic Report Our approach to risk |
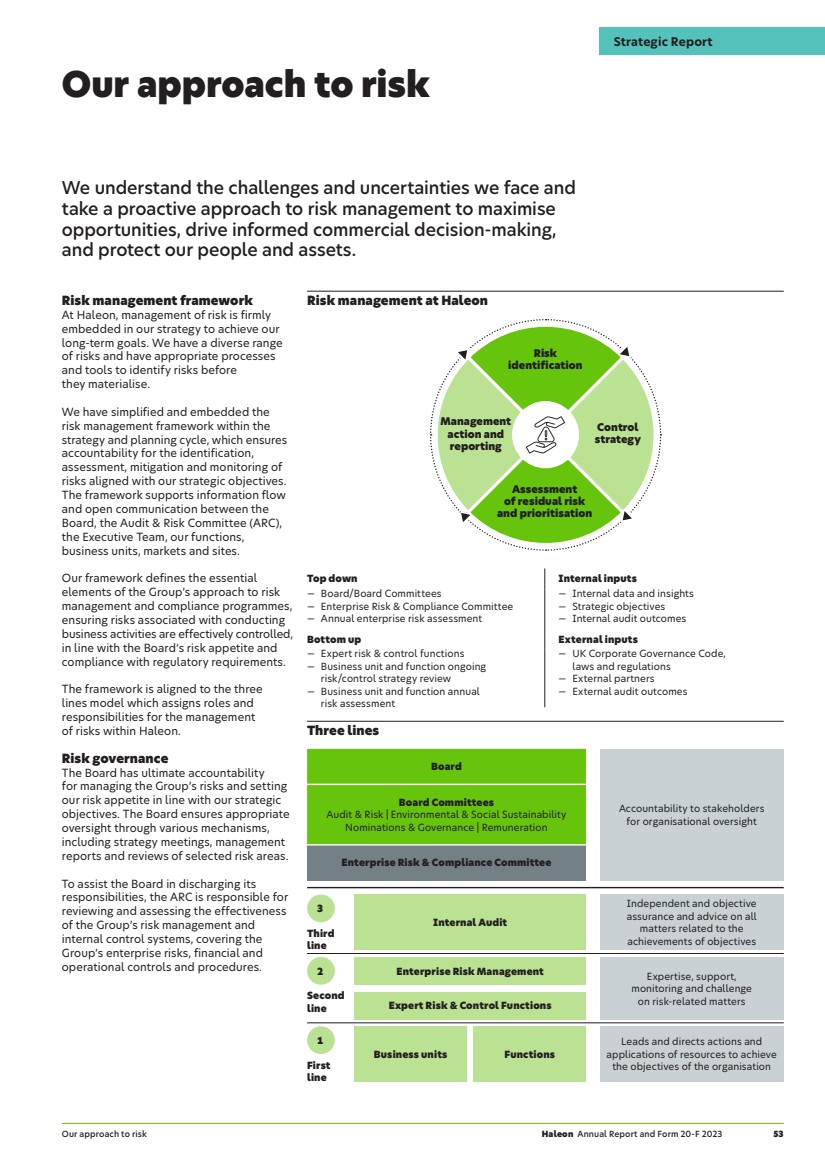
| Our approach to risk continued and result in an adverse effect on the business. Haleon also faces other enterprise risks that we manage as part of our integrated risk management framework and include health and safety, product quality, product user safety, financial, and legal and compliance. Our principal risks remain unchanged from the previous year and are not listed in any particular order and do not comprise an exhaustive list of risks associated with the business. While a robust assessment of these risks has been undertaken, additional risks not known to the Board or assessed to be less significant may also materialise Our principal risks Our principal risks are a subset of our enterprise risks and are deemed by the Board to be the most significant risks faced by the Group, including those that can materially impact our performance and/or reputation and could threaten our long-term business model or liquidity. The annual enterprise risk assessment (ERA) for 2023 included a risk survey and interviews with the Board, Executive Team and business unit general managers to identify and evaluate both current and emerging risks, and to inform the 2024 internal audit plan. The ERA outcome also reflects on whether we think the impact and likelihood associated with each of our enterprise risks are increasing or decreasing. The top-down process is complemented by horizon scanning to identify external trends, and inputs from risk review meetings at all levels of the organisation help us identify opportunities and/or emerging risks. The ERA results have been shared with the ARC and the Board to confirm the principal risks and agree on the Group’s risk management priorities for 2024. These governance forums provide the ERCC with a bottom-up view of risks and issues along with oversight of how the key risks are being managed. Open communication and adequate reporting remain essential to ensure Haleon’s leaders maintain a sound risk culture and are kept informed to allow for swift decisions and meaningful actions. An annual management confirmation review across each business unit and function ensures key risks are well managed and that corrective and preventative actions are in place to address any significant gaps. Assessing risk We continuously assess and evaluate the risks posed by the changing environments in which we operate to ensure an appropriate, measured, and timely response by considering potential impacts and most likely scenarios. The Executive Team is joined by the Heads of Audit & Risk and Ethics & Compliance to form the Enterprise Risk and Compliance Committee (ERCC). The ERCC meets quarterly and ensures that risks are adequately managed, and the risk management framework is effectively deployed throughout the Group. The ERCC discusses enterprise and emerging risks, reviews industry trends, regulatory developments, high-profile incidents and critical audit findings. Each enterprise risk is owned by an ERCC member, who is accountable for designing and implementing risk mitigation strategies and regularly reporting risk updates to the ARC and ERCC. At a functional, business unit, market and site level, regular risk review meetings ensure a more granular review of risk and operationalisation of strategic priorities. Principal risk and link to strategy Description and risk development 1 2 3 4 Growth model Our success depends on our ability to identify and explore business opportunities to deliver organic growth. Failure to meet our medium-term organic growth objectives due to inadequate strategic and/or financial planning, lack of innovation, and deficient execution could result in erosion of shareholder value and damage to our reputation. The potential room for growth given the limited penetration of some categories and the fit of consumer health care with the consumer’s needs and social demographic trends will continue to attract competitors at a global and local level. This exposes us to the risk of our product portfolio not being aligned to consumer needs or demands, and innovation not being responsive to competitor offerings, changes in consumer preference or market structure. In addition, the risk of increasing customer concentration, market consolidation and shifts in sales channel structures can lead to increasing pressure on pricing and margins. This risk remains unchanged from 2022. >> See also our business model on page 8. Trend key Increasing risk Decreasing risk Unchanged New risk Strategy key Increase household penetration Capitalise on new and emerging opportunities 3 Maintain strong execution and financial discipline 4 Run a responsible business 1 2 54 Haleon Annual Report and Form 20-F 2023 Strategic Report |
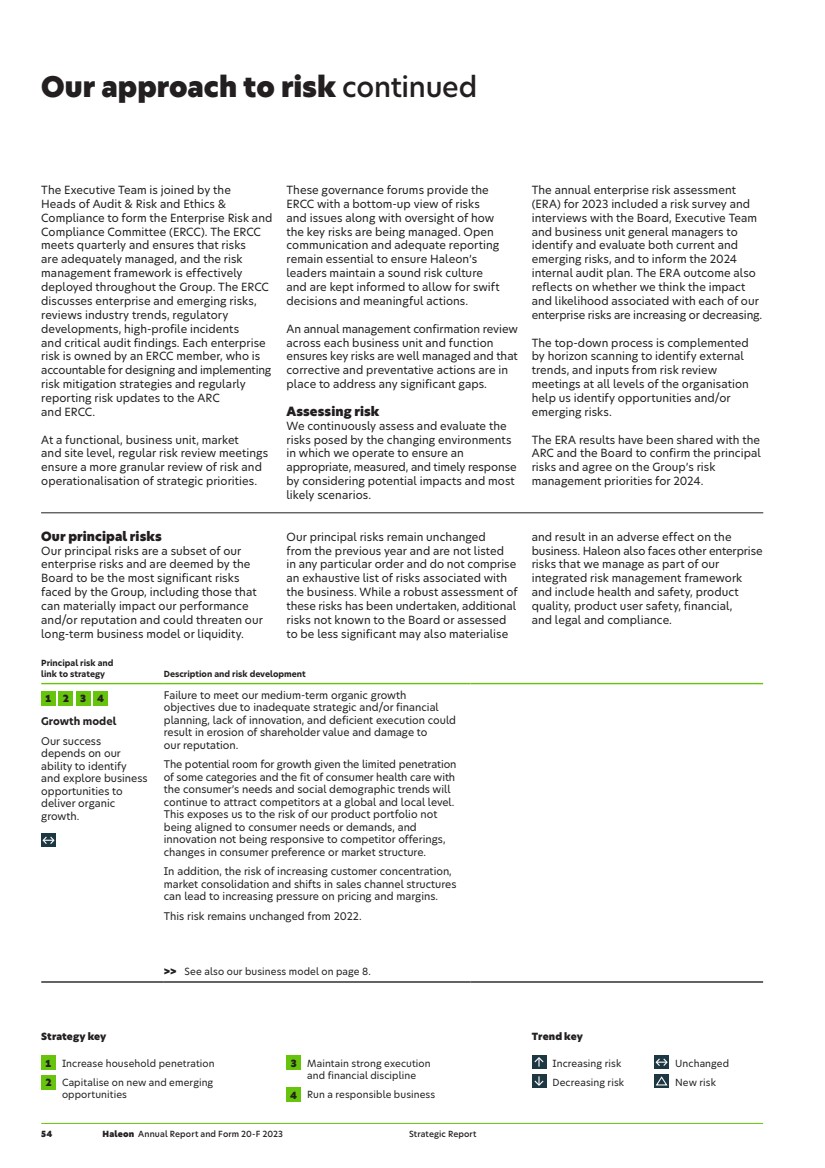
| Trend key Increasing risk Decreasing risk Unchanged New risk Strategy key Increase household penetration Capitalise on new and emerging opportunities 3 Maintain strong execution and financial discipline 4 Run a responsible business 1 2 Principal risk and link to strategy Description and risk development 3 4 People and organisation Talent attraction and retention is pivotal to the success of Haleon as is the effectiveness of our operating structures. Inability to attract, develop and retain a diverse range of skilled employees as we deliver a fit for the future organisation in a highly competitive market, which could have an impact on our ability to achieve our strategic objectives. If we do not execute effective talent management processes, including career progression and driving people engagement, we will not be successful in establishing a strong employer brand and ultimately affect our ability to have a workforce that is realising its full potential. Failing to pursue a fit for the future, efficient organisation in a fast-paced environment could impair the achievement of our objectives. This risk remains unchanged from 2022. >> See also our culture and people section from page 18. 2 4 Trusted ingredients Haleon’s brands must reflect trusted science and ingredients to consumers. Loss of customer confidence due to not pursuing best-in-class science or not monitoring and responding to emerging ingredient data and changes in consumer perception of product ingredients could negatively impact our brands and our reputation. The regulatory and public scrutiny of the safety, efficacy, purity and potential environmental impact of ingredients in healthcare products remains a key area of focus. Failure to actively monitor ingredient-related risks and address emerging ingredient regulations and industry and market trends can negatively impact our business and reputation. Our priority areas include: responsible practices to address active pharmaceutical ingredients in the environment; appropriate use of titanium dioxide inclusive of nanomaterials; and monitoring the potential for nitrosamine formation in our products. We take these responsible business actions to ensure our products are safe when used as directed and compliant with existing regulations. This risk has increased in 2023 to reflect the rapidly increasing pressure and scrutiny from governments, regulators, NGOs and consumers over the safety and efficacy of ingredients within consumer healthcare products. >> Haleon may incur liabilities or be forced to recall products as a result of real or perceived product quality or other product-related issues, see page 196. >> More information is available at www.haleon.com/our-impact/environment/sourcing-trusted-ingredients-sustainably Haleon Annual Report and Form 20-F 2023 55 Strategic Report Our approach to risk |
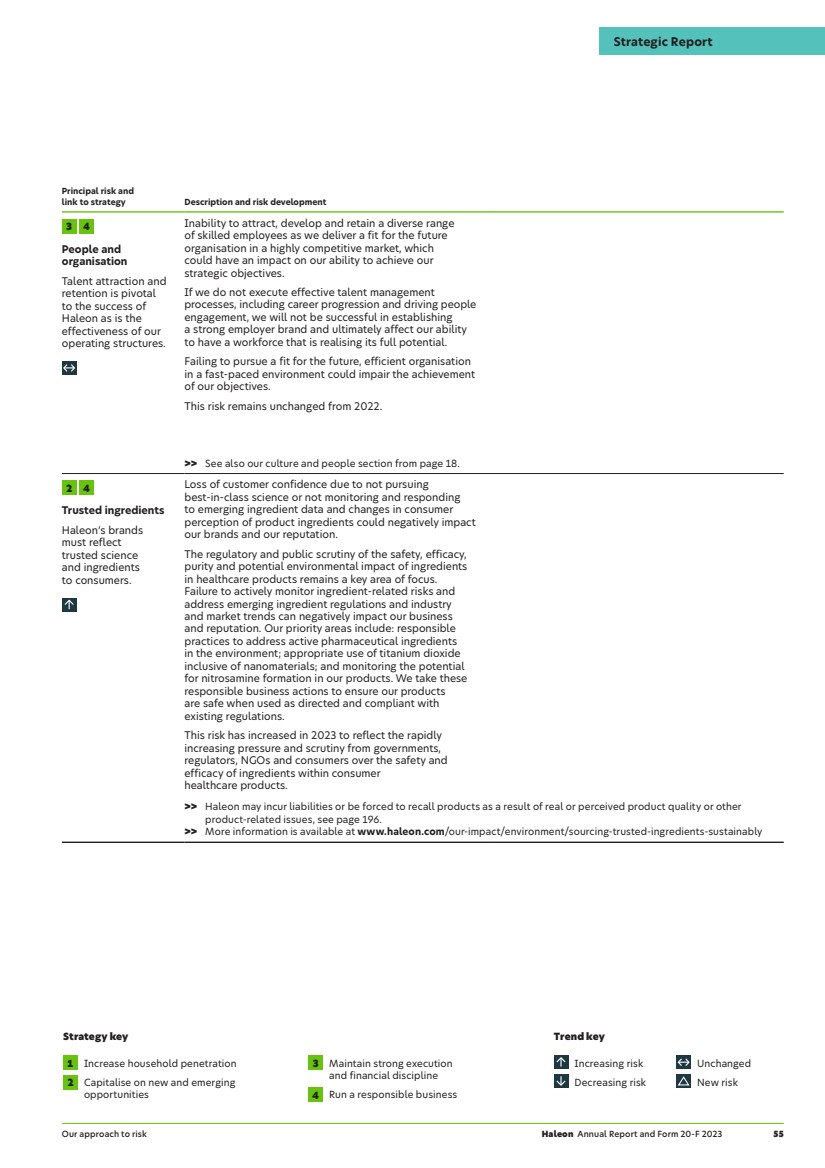
| Our approach to risk continued Principal risk and link to strategy Description and risk development 1 2 3 4 Supply chain resilience Continued challenges to our supply chain capacity test our resilience to ensure we meet increasing customer demand. Disruption or constraints in our global sourcing and supply network due to external or internal factors or insufficient capacity leading to the inability to meet consumer demand and desired service levels. The end-to-end supply chain has also been impacted by rising commodity and energy costs and remains a key area of focus. This risk has increased in 2023, mainly in anticipation of the impact from ongoing and potential geopolitical and environmental factors. 2 4 Environmental, social and governance Sustainability and climate-related risks are integrated into our business and investment decisions. Failure to address existing and emerging environmental, social and governance risks could materially damage our reputation leading to significant financial losses. Responsible performance is critical to our investors, customers, consumers and employees. We are partially reliant on infrastructure changes and external factors to achieve our goals. Important dependencies include: the pace at which global energy supplies switch to renewables; the recycling industry developing technology to recycle small formats; the availability of responsibly and sustainably sourced or recycled materials; and the rapidly changing regulatory and legislative environment. The uncertain nature of climate change, governmental response and consumer behaviour bring additional challenges and opportunities. While we continue to operate in a fast-moving external reporting and regulatory environment, the risk remains unchanged from 2022. >> See also our approach to sustainability from page 22, including our TCFD disclosure. Strategy key Increase household penetration Capitalise on new and emerging opportunities 3 Maintain strong execution and financial discipline 4 Run a responsible business 1 2 Trend key Increasing risk Decreasing risk Unchanged New risk 56 Haleon Annual Report and Form 20-F 2023 Strategic Report |
| Principal risk and link to strategy Description and risk development 4 Cyber-security Haleon’s operations depend on robust and secure IT systems and information management. Major disruption to our IT systems, including through cyber attacks, could materially impact our operations, harm our reputation and lead to significant financial losses. We see cyber attacks increasing in scope, scale and sophistication as geopolitical competition and conflict mounts. As our activities rely on digital services, such adversity could disrupt our global business, our research and development, supply chain and sales, and ultimately impact our results and reputation. The likelihood of such threats continues to be on the rise due to our public profile, use of third parties who support various activities, the increasingly dynamic geopolitical situation and our manufacturing processes relying on end-of-life equipment for some critical processes. Thus, cyber-security continues to be a key risk and we respond accordingly. This risk has increased since 2022 due to an increase in cyber attacks, phishing incidents and enhancements needed to Haleon’s infrastructure in order to comply with the US National Institute of Standards and Technology Cybersecurity Framework (NIST CSF). 2 3 4 Geopolitical instability Changes in the geopolitical landscape are continuously monitored. Failure to monitor and respond to the increasing geopolitical tensions destabilising key markets can impair our ability to deliver our growth and strategic objectives, leading to commercial, financial and reputational losses, challenging the exchange of products and services, and restricting the movement of talent. Increased sanctions, other supranational guidelines and the imposition of tariffs raise our risk profile and could lead to severe trade disruptions, cash flow constraints, and restricted opportunities for strategic growth. International cooperation remains under pressure, including the increasingly complex political relationship between China and the US, our two largest markets, which may hinder the prospects of current trade deals and increase retaliation. This risk has increased in 2023 as a result of increasing protectionist policies. Looking forward into 2024, it is expected to be an important year with many countries around the world heading into government elections. Trend key Increasing risk Decreasing risk Unchanged New risk Strategy key Increase household penetration Capitalise on new and emerging opportunities 3 Maintain strong execution and financial discipline 4 Run a responsible business 1 2 Haleon Annual Report and Form 20-F 2023 57 Strategic Report Our approach to risk |
| Our approach to risk continued Emerging risks Emerging risks are uncertainties or potential disruptors that have not yet crystallised into specific risks and whose potential impact is difficult to predict. They are reviewed by the Board alongside our enterprise risks. >> See also our culture and people, approach to sustainability (including our TCFD disclosure), Audit & Risk Committee Report and risk factors sections on pages 18, 22, 72 and 193. Emerging risk and link to strategy Description and risk development Outlook 2 3 4 Macroeconomic uncertainty Haleon’s operations benefit from a stable macroeconomic environment. Macroeconomic uncertainty represents challenging conditions that affect the economies where we operate. For instance, significant increases in energy costs and inflationary pressures, including materials, wages and transportation costs, may adversely impact consumer behaviours and our cost structure. The continuation of higher interest rates could result in higher financing costs and cash outflows. Changes to fiscal and monetary policies may lead to unexpected tax exposures for the Group. Fluctuations between trading currencies introduce exposure to transactional and translational currency risks. Macroeconomic volatility in key markets remains on the horizon for 2024. We remain proactive and vigilant in monitoring the financial conditions and assessing the potential impact of these scenarios on our business model and financial targets. 2 3 4 Mass Generative AI Haleon could utilise AI in a controlled, and risk-conscious manner to find efficiency gains or add new business capabilities. AI has the potential to both significantly disrupt the industry within which we operate and create opportunities to drive competitive advantage. Adoption of AI within the business is still at nascent stages with regulatory guidelines still evolving. Unclear use of AI may cause a misalignment with the organisation’s culture, generate unreliable outputs and may also impact potential business growth. AI capabilities and expectations continue to grow rapidly. We are actively monitoring the progress in this area including changes to the regulatory landscape and continue to assess AI’s impact on Haleon and Haleon’s AI adoption goals. Strategy key Increase household penetration Capitalise on new and emerging opportunities 3 Maintain strong execution and financial discipline 4 Run a responsible business 1 2 Trend key Increasing risk Decreasing risk Unchanged New risk 58 Haleon Annual Report and Form 20-F 2023 Strategic Report |
| Viability statement The assessment considered the Group’s prospects related to revenue, operating profit and free cash flow. The Directors considered the maturity dates for the Group’s debt obligations and its access to public and private debt markets, including its committed credit facilities. The Directors also carried out a robust review and analysis of the principal risks facing the Group, including those risks that could materially and adversely affect the Group’s business model, future performance, solvency and liquidity. Stress testing was performed on a number of scenarios, including the potential impact of severe but plausible scenarios over the viability period for each potential combination of principal risks identified below. In total, four individual scenarios have been created incorporating a In accordance with Provision 31 of the 2018 UK Corporate Governance Code, the Directors have assessed the viability of the Group by considering the activities and principal risks together with factors likely to affect the Group’s future development, performance, financial position, cash flows, liquidity position and borrowing facilities, as described in the Annual Report. The Directors’ assessment of viability has been made over a three-year period, which corresponds to the Group’s planning cycle. Additionally, the Directors believe this presents the readers of the Annual Report with a reasonable degree of confidence over the period assessed. combination of principal risks, with a fifth collective scenario, which combines all the individual scenarios. Mitigating actions for such scenarios include reducing A&P spend, reducing capital spend, pausing M&A activity and cancelling shareholder dividends. Based on the assessment described above and considering the Group’s current financial position, debt maturity profile, stable cash generation, access to liquidity, geographic diversification and lack of concentration of supply, the Directors have a reasonable expectation that the Group is well positioned to manage principal risks and potential downside impacts of such risks materialising. As a result, the Directors expect that the Company will be able to continue in operation and meet its liabilities as they fall due over the assessment period. Scenario modelled Key assumptions Link to principal risks Scenario 1: A climate event results in a major manufacturing site shutdown for 18 months, causing disruption to the supply chain increasing commodity, freight and labour costs and a Group-wide cyber event which would cause lost sales for two weeks. — Decrease in net revenue and gross profit as a result of a loss of product sales. — Increase in commodity, freight and labour costs of other manufacturing sites. — Supply chain resilience. — Trusted ingredients. — Environmental, social and governance. — Cyber-security. Scenario 2: No sales price increases or volume growth over the forecast period across all product categories to reflect slower economic growth and competitor activity. — No price increases and forecasted growth, with a corresponding impact on cost of goods sold due to lower volumes. — Growth model. — Geopolitical instability. — Macroeconomic uncertainties (emerging risk). Scenario 3: Inability to access capital market, inflationary pressure, foreign currency volatility, interest and tax risks, and geopolitical risks. — Failure to further issue commercial paper. — Double interest costs on floating rate debt bonds. — Depreciation of major local currencies where the Group generates its profits by 5% against pound sterling. — No revenue and operating profit generated from countries involved in armed conflict across the plan period. — Geopolitical instability. — Macroeconomic uncertainties (emerging risk). Scenario 4: A significant incident that leads to a product recall and reputational damage for a key brand resulting in nil sale of products from this brand for six months. — 75% decrease in sales and operating profit for a Power Brand for six months. — Significant legal fine (5% of group turnover) — Write off all inventories relating to the product of the above Power Brand. — Additional investment in A&P to rebuild the brand. — Growth model. — Supply chain resilience. — Trusted ingredients. Scenario 5: Combination of all the above scenarios together with mitigating actions that could reasonably be implemented. — Reduced A&P spend, reduced capital spend, and cancellation of shareholder dividends. — All the above. Haleon Annual Report and Form 20-F 2023 59 Strategic Report Viability statement |
| Statement of compliance Section 172 statement Details relevant to how the Directors have had regard to the matters set out in Section 172(1)(a) to (f) of the Companies Act 2006 can be found across the Report, including, but not limited to, the Chair’s statement and CEO review on pages 4 and 5, culture and people from page 18, and our approach to sustainability from page 22. The Section 172 statement is provided on page 69. Non-financial and sustainability information statement Non-financial and sustainability information, including a description of policies, due diligence processes, outcomes and risks and opportunities can be found in the Annual Report as set out below. Internal verification and disclosure controls apply to all the information covered in these areas. Our Climate-related Financial Disclosures are contained in the TCFD disclosure on pages 24 to 31 and, for item (h), also on pages 32, 188 and 189. >> Further information about our responsible business assurance activities can be found at www.haleon.com/our-impact/esg-reporting-hub A description of the business model Our business model 8 Environmental matters Our approach to sustainability 22 Task Force on Climate-related Financial Disclosures 24 Our key performance indicators 32 Our approach to risk 53 Environmental & Social Sustainability Committee Report 77 Note 1 General information: Impact of climate change 123 Note 12 Property, plant and equipment: Impact of climate change 133 Streamlined Energy and Carbon Reporting 188 Employee matters Our key stakeholders 10 Our culture and people 18 Our key performance indicators 32 Our approach to risk 53 Section 172 statement 69 Workforce engagement 70 Directors’ Remuneration Report 80 Miscellaneous Reporting Requirements 187 Social matters Our approach to sustainability 22 Environmental & Social Sustainability Committee Report 77 Human rights Our culture and people 20 Anti-corruption and anti-bribery Our culture and people 20 Audit & Risk Committee Report 72 Policy, due diligence and outcomes Our approach to risk 53 Viability statement 59 Audit & Risk Committee Report 72 Non-financial key performance indicators Our key performance indicators 32 Environment www.haleon.com/our-impact/environment www.haleon.com/who-we-are/Governance/codes-policies-and-standards www.haleon.com/who-we-are/our-policy-positions www.haleon.com/our-impact/esg-reporting-hub Employees www.haleon.com/our-impact/upholding-our-standards www.haleon.com/who-we-are/Governance/codes-policies-and-standards www.haleon.com/who-we-are/our-policy-positions www.haleon.com/our-impact/gender-pay-gap www.haleon.com/our-impact/esg-reporting-hub Social matters and business conduct www.haleon.com/our-impact/upholding-our-standards www.haleon.com/who-we-are/Governance/codes-policies-and-standards www.haleon.com/who-we-are/our-policy-positions www.haleon.com/our-impact/esg-reporting-hub Human rights and modern slavery www.haleon.com/our-impact/upholding-our-standards www.haleon.com/who-we-are/Governance/codes-policies-and-standards www.haleon.com/our-impact/esg-reporting-hub Our Modern Slavery Act Statement can be found at www.haleon.com under RESOURCES Anti-corruption and anti-bribery www.haleon.com/who-we-are/Governance/codes-policies-and-standards The Strategic Report on pages 2 to 60 was approved by the Board on 15 March 2024. Amanda Mellor Company Secretary Our key policies and positioning statements, including our Code of Conduct can be found on Haleon’s website: 60 Haleon Annual Report and Form 20-F 2023 Strategic Report |
| Corporate Governance Contents Our Board of Directors 62 Our Executive Team 64 Letter from the Chair 66 Governance structure 67 Board activities 68 Section 172 statement 69 Workforce engagement 70 Board development, effectiveness and performance 71 Audit & Risk Committee Report 72 Environmental & Social Sustainability Committee Report 77 Nominations & Governance Committee Report 78 Directors’ Remuneration Report 80 Compliance with the UK Corporate Governance Code 96 Centrum Centrum is a leading global multivitamin brand, with a range of specially crafted formulations backed by over 40 years of nutritional science. In 2023, the brand launched an award-winning campaign for Centrum Silver, leveraging the results of a study completed with COSMOS that showed the tablets can improve cognitive function and episodic memory for those aged 65+. The image shown above is taken from the Centrum ‘You Did It’ campaign. Corporate Governance Haleon Annual Report and Form 20-F 2023 61 |
| Board composition Chair 1 Executive Directors 2 Independent Non-Executive Directors 6 Non-Executive Directors 2 Ethnicity White 9 Mixed/Multiple ethnic groups 2 Gender Men 6 Women 5 Board and Committee membership key: Committee Chair A Audit & Risk E Environmental & Social Sustainability N Nominations & Governance R Remuneration Our Board of Directors Chair and Executive Directors Sir Dave Lewis Chair N Appointed: 23 May 2022 Skills and experience: Dave was Group Chief Executive of Tesco plc from 2014 until September 2020. Prior to joining Tesco, he spent 28 years at Unilever plc, holding a variety of leadership roles in Europe, Asia and the Americas, including President Americas and Global President for Personal Care. Other significant appointments: — PepsiCo Inc. (Non-Executive Director) — World Wildlife Fund UK (Chair) Brian McNamara Chief Executive Officer Appointed: 23 May 2022 Skills and experience: Brian joined GSK’s Consumer Healthcare business as Head of Europe and the Americas in 2015. He was previously at Novartis AG where he held senior leadership roles, including serving as OTC Division Head and as a member of the Novartis Executive Committee. He began his career at Procter & Gamble, where he gained extensive experience in product supply, brand marketing, and customer leadership. Other significant appointments: — The Consumer Goods Forum (Board Member) — Mondelēz International, Inc. (Non-Executive Director) Tobias Hestler Chief Financial Officer Appointed: 23 May 2022 Skills and experience: Tobias joined GSK’s Consumer Health Joint Ventures as CFO in 2017. He has previously held a number of local and global finance leadership roles at Novartis in the US and Europe, culminating in the position of CFO at Sandoz, the generics division of Novartis AG. Other significant appointments: — No external appointments Independent Non-Executive Directors Manvinder Singh (Vindi) Banga Senior Independent Non-Executive Director (SID) A N R Appointed: 18 July 2022 Skills and experience: Vindi spent 33 years at Unilever plc, culminating in becoming President of the Global Foods, Home and Personal Care businesses and executive board member. He has subsequently held a range of non-executive directorships, including at GSK plc (as Senior Independent Director), Marks & Spencer plc (as Senior Independent Director), the Confederation of British Industry (CBI) and Thomson Reuters Corp. Other significant appointments: — Clayton Dubilier & Rice LLC (Operating Partner) — UK Government Investments Limited (Chairman) — Marie Curie Trust (Chairman) Tracy Clarke Independent Non-Executive Director A E N R Appointed: 18 July 2022 Skills and experience: Tracy held a range of senior executive positions during her 30-year tenure at Standard Chartered Bank, where her last role was Private Bank CEO and Regional CEO, Europe & Americas. Tracy’s prior non-executive roles include Chair of the Remuneration Committees of Sky plc and Eaga plc and Remuneration Committee member of Inmarsat plc. Other significant appointments: — TP ICAP Group plc (Non-Executive Director and Remuneration Committee Chair) — Starling Bank Limited (Senior Independent Director and Remuneration Committee Chair) Deirdre Mahlan Independent Non-Executive Director A N R Appointed: 18 July 2022 Skills and experience: Deirdre is a qualified accountant and held a number of senior finance and general management roles during her 27-year career at Diageo, including President, Diageo North America and Chief Financial Officer of Diageo plc. Prior to Diageo, she held senior finance roles in Joseph Seagram and Sons, Inc. and PwC. Deirdre was a Non-Executive Director of Experian plc from 2012 to 2022. Other significant appointments: — Duckhorn Portfolio, Inc. (Interim President, Chief Executive Officer and Chair) — Kimberly-Clark Corporation (Non-Executive Director) The detailed breakdown of gender and ethnic representation as required by the Listing Rules is shown on page 79. 62 Haleon Annual Report and Form 20-F 2023 Corporate Governance |
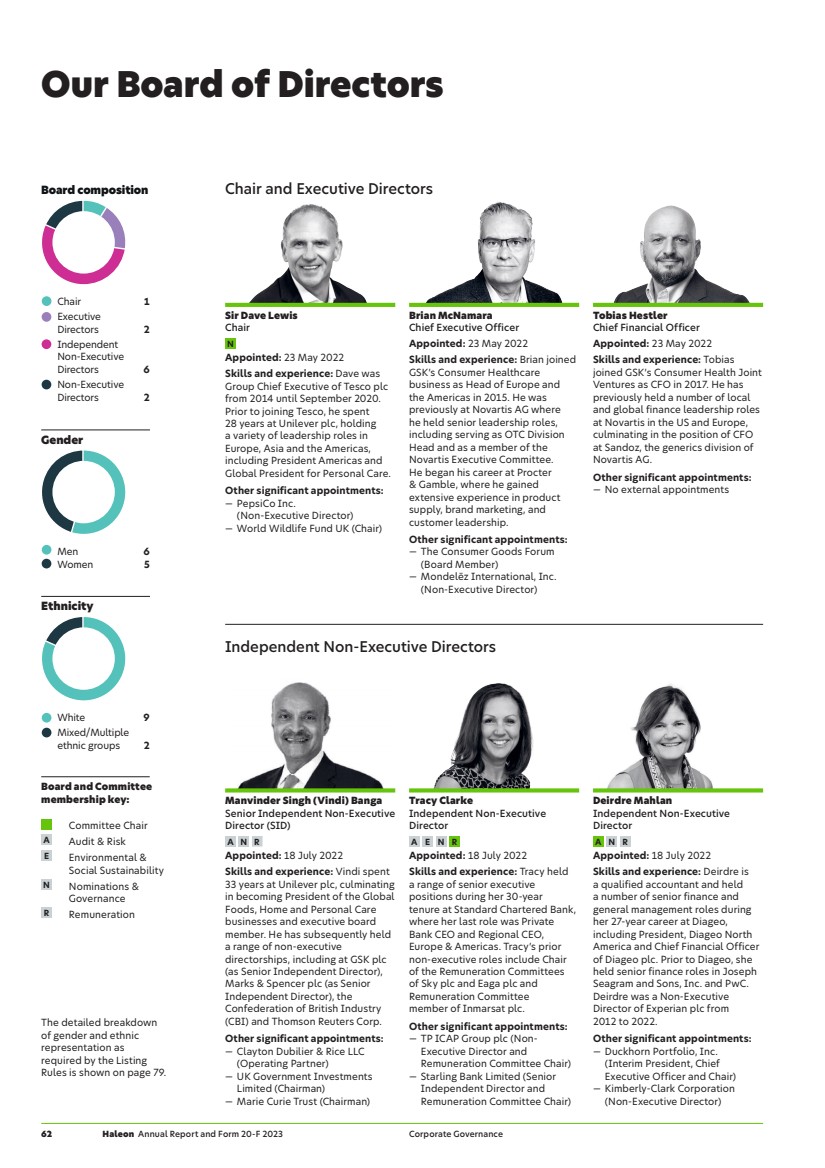
| Skills and experience (excluding Executive Directors) This table shows the number of Directors with each relevant skill/experience. Consumer Healthcare International Supply chain Technology Digital/innovation Regulatory Finance M&A/transformation Sustainability/ responsible business Employee engagement Governance/investor 7 5 9 3 1 2 3 3 7 5 2 5 Independent Non-Executive Directors Marie-Anne Aymerich Independent Non-Executive Director E Appointed: 18 July 2022 Skills and experience: Marie-Anne previously led the worldwide Oral Care category at Unilever plc where she developed a portfolio of new premium brands. Prior to that, Marie-Anne was Brand General Manager of LVMH Group’s Dior perfume and beauty business. Before joining LVMH, Marie-Anne was Managing Director for Unilever’s Home Care and Personal Care business in France. Other significant appointments: — Pierre Fabre Group (Non-Executive Director) — Academy of St Martin in the Fields (Trustee, member of Nomination Committee) Dame Vivienne Cox Independent Non-Executive Director A E R Appointed: 18 July 2022 Skills and experience: Vivienne worked for BP plc for 28 years, holding senior leadership roles including Executive Vice President and Chief Executive of BP’s gas, power and renewables business. Vivienne’s previous non-executive directorships include GSK plc, where she was Workforce Engagement Director, BG Group plc, Rio Tinto plc, Pearson plc and the UK Government’s Department for International Development. Other significant appointments: — Victrex plc (Chair) — Venterra Group plc (Non-Executive Director) Asmita Dubey Independent Non-Executive Director Appointed: 18 July 2022 Skills and experience: Asmita has over 25 years of experience working in consumer businesses and is currently Chief Digital & Marketing Officer of L’Oréal Group. She has extensive experience of working and building joint business partnerships in China and served on GSK’s Consumer Healthcare Digital Advisory Board for two years from March 2020 to March 2022. Other significant appointments: — L’Oréal (Chief Digital & Marketing Officer and member of Executive Committee) Amanda Mellor Company Secretary Appointed: 23 May 2022 Skills and experience: Amanda brings extensive experience in company secretarial, corporate governance, investor relations and investment banking. Other appointments: — Volution Group plc (Senior Independent Director) — GC100 (Executive Committee Member) Company Secretary Non-Executive Directors (nominated by Pfizer Inc.) David Denton Non-Executive Director Appointed: 1 March 2023 Skills and experience: Dave is Chief Financial Officer and Executive Vice President for Pfizer Inc. providing strategic global financial leadership. He has over 25 years of finance and operational expertise including more than 20 years in the healthcare sector. Prior to joining Pfizer in 2022, he was CFO and Executive Vice President of Lowe’s Companies Inc. from 2018. Previously, he was executive vice president and CFO of CVS Health Corporation. Other significant appointments: — Pfizer Inc. (Chief Financial Officer and Executive Vice President) Bryan Supran Non-Executive Director Appointed: 18 July 2022 Skills and experience: Bryan is Senior Vice President & Deputy General Counsel for Pfizer Inc. with responsibility for counselling Pfizer management and directors on strategic initiatives and business development transactions. During his tenure at Pfizer, he also has led Pfizer’s intellectual property and international legal teams and provided legal support for Pfizer’s R&D and manufacturing organisations. Previously, Bryan worked at Ropes & Gray LLP. Other significant appointments: — Pfizer Inc. (Senior Vice President and Deputy General Counsel) >> Further details can be found at www.haleon.com/who-we-are/leadership Corporate Governance Our Board of Directors Haleon Annual Report and Form 20-F 2023 63 |
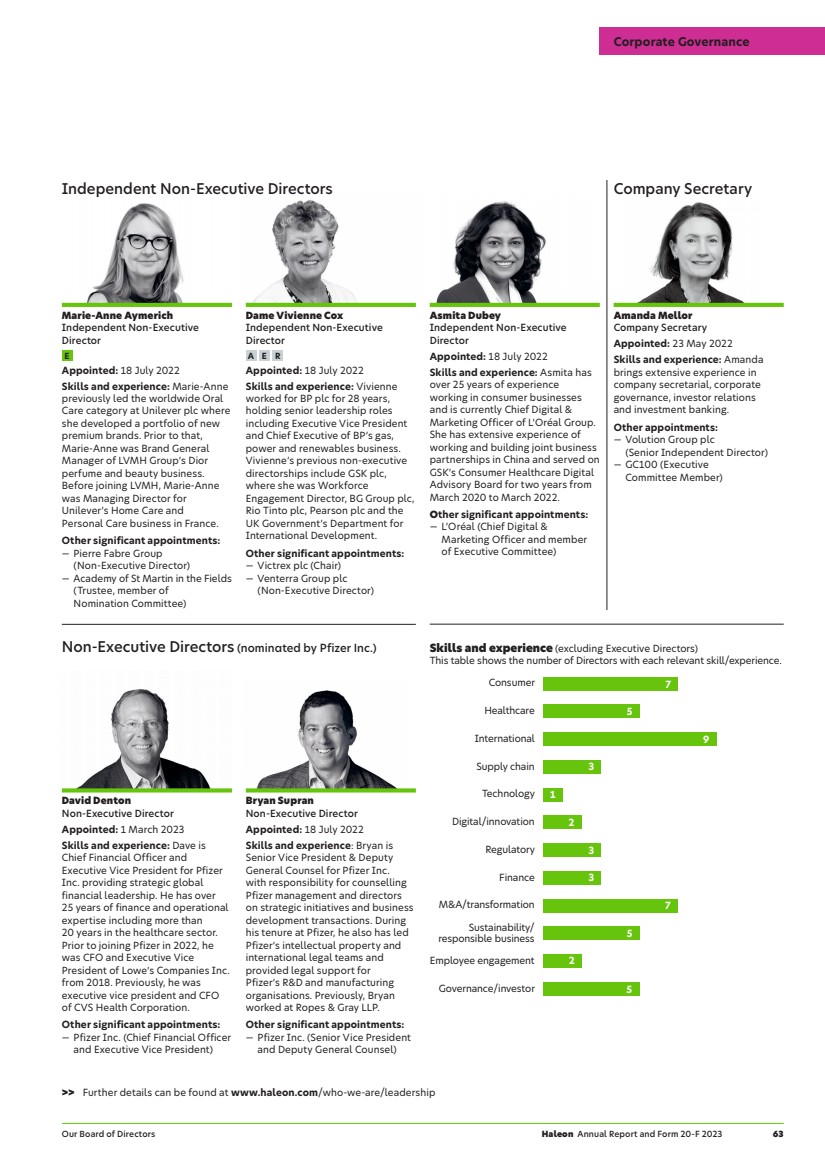
| Ethnicity White 8 Mixed/Multiple ethnic groups 1 Not specified/ Prefer not to say 1 Gender Men 6 Women 4 Our Executive Team In addition to Brian McNamara and Tobias Hestler, the Executive Team comprises: Keith Choy President, Asia Pacific Appointed: 16 December 2021 Skills and experience: Keith has almost 30 years’ experience in the consumer-packaged goods and health industries and joined GSK’s Consumer Healthcare business in 2019. He was previously President, International Markets for Pfizer Consumer Healthcare. Keith has also held roles at Wyeth Pharmaceutical and Gillette. Filippo Lanzi President, EMEA & LatAm Appointed: 16 December 2021 Skills and experience: Filippo joined GSK in 2015 holding leadership roles in south and central eastern Europe prior to becoming APAC Regional Head. He then became Head of EMEA in 2019, prior to leading LatAm, too. Before this, he worked for Novartis OTC as General Manager in Italy and Greece. Filippo also held positions at Johnson & Johnson and Nestlé S.A. Mairéad Nayager Chief Human Resources Officer Appointed: 1 March 2022 Skills and experience: Mairéad was Chief Human Resources Officer at Diageo plc for six and a half years until January 2022, having previously held a number of HR leadership roles across Diageo’s businesses in Europe and Africa during her 16-year tenure. Prior to joining Diageo, Mairéad spent three years at the Irish Business and Employers Confederation (IBEC). Mairéad will be leaving Haleon in May 2024. Lisa Paley President, North America Appointed: 16 December 2021 Skills and experience: Prior to joining GSK’s Consumer Healthcare business in 2019, Lisa spent a decade at Pfizer Consumer Healthcare where she was most recently President, North America. She was previously Vice President of Sales at Johnson & Johnson and also held various roles at Pfizer Consumer Healthcare/ Warner-Lambert. Namrata Patel Chief Supply Chain Officer Appointed: 6 November 2023 Skills and experience: Namrata has extensive global experience in manufacturing and end-to-end supply chain management. She has held senior leadership positions at companies including The Coca-Cola Company, Gillette and Procter & Gamble and currently sits on the board of Oxford Biomedica plc as an Independent Non-Executive Director. Bart Derde (Chief Supply Chain Officer), Amy Landucci (Chief Digital and Technology Officer), Jooyong Lee (Head of Strategy and Office of the CEO), and Teri Lyng (Head of Transformation and Sustainability) served as members of the Executive Team from 16 December 2021 to 31 December 2023. The detailed breakdown of gender and ethnic representation as required by the Listing Rules is shown on page 79. 64 Haleon Annual Report and Form 20-F 2023 Corporate Governance |
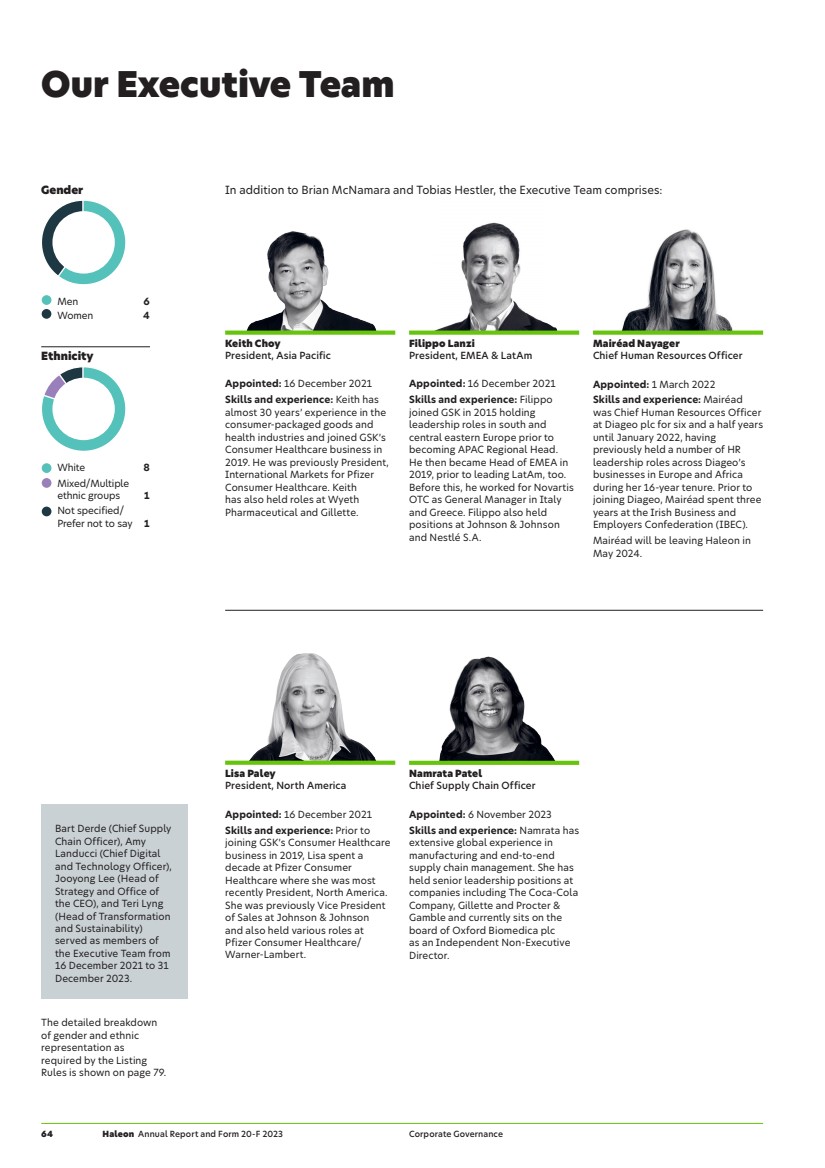
| Ed Petter Chief Corporate Affairs Officer Appointed: 1 January 2024 Skills and experience: Ed has spent the last seven years at BT Group plc as Group Corporate Affairs Officer and a member of the Executive Committee. He has previously held leadership roles at Lloyds Banking Group and McDonald’s after spending four years working in consultancy at McKinsey & Company and Blue Rubicon. Franck Riot Chief R&D Officer Appointed: 16 December 2021 Skills and experience: Franck has over 20 years’ experience leading R&D in consumer-led industries. Prior to joining GSK’s Consumer Healthcare business in 2019, he was Vice President of Research and Innovation for the Essential Dairy and Plant-Based Division, Danone S.A. Before this, he was Group R&D Director at Nomad Foods and previously held a variety of R&D leadership roles at Danone. Tamara Rogers Chief Marketing Officer Appointed: 16 December 2021 Skills and experience: Tamara has 30 years of experience in FMCG. Prior to joining GSK’s Consumer Healthcare business in 2019, Tamara spent nearly 25 years at Unilever plc, most recently as Executive Vice President, Personal Care, North America and prior to that, SVP Global Deodorants. Tamara is a board member of the Global Self-Care Federation. Bjarne Philip Tellmann General Counsel Appointed: 16 December 2021 Skills and experience: Prior to joining GSK’s Consumer Healthcare business in 2020, Bjarne was General Counsel of Pearson plc, before which he held a range of legal leadership roles at The Coca-Cola Company in the US, Europe and Asia and at Kimberly-Clark Corporation. Bjarne began his career in private practice at Sullivan & Cromwell LLP and White and Case LLP. Bjarne will be leaving Haleon in March 2024. Bjorn Timelin Head of Strategy Appointed: 2 October 2023 Skills and experience: Bjorn was Senior Partner at McKinsey & Company specialising in strategic and commercial topics for consumer-facing companies, with clients across the retail, consumer packaged goods, media, and luxury goods sectors. Prior to this he spent four years at Procter & Gamble’s beauty care division in the UK and Switzerland. >> Further details can be found at www.haleon.com/who-we-are/leadership Corporate Governance Our Executive Team Haleon Annual Report and Form 20-F 2023 65 |
| Letter from the Chair Sir Dave Lewis Chair As I shared in my Chair’s statement on page 4, this has been a year of encouraging progress for Haleon in its first full year since listing in July 2022. Following the significant work last year to enable Haleon to operate as a standalone Company, the Board’s role in 2023 has been to guide and support the management team delivering on the Company’s strategic and financial plans, and building Haleon’s capabilities to drive sustainable profitable growth. Haleon has great potential for growth. We have made positive progress in 2023 and I am pleased with the commitment and focus of the Board and all Haleon employees to drive the Company forward and continue to create sustainable value for our shareholders. Board focus The Board held several strategic discussions in 2023, including an offsite meeting with the Executive Team in October to review our long-term category and market ambitions, financial targets and investment plans. Deep dives provided insights across key strategic areas including the consumer healthcare landscape, our China and US businesses, supply chain, innovation, and cyber-security risks. These enhanced the Board’s understanding of Haleon’s key deliverables, risks and opportunities. During the year, the Board visited our Oral Health facility in Weybridge, UK and Pain Relief center in Richmond, Virginia, US. I also had the opportunity to visit Haleon operations in Brazil, India, and Mexico. Seeing our regional operations first-hand provided insight into major markets and R&D initiatives. It also gave Directors a chance to meet employees across different locations. Employee engagement has continued to develop during the year and feedback on the Company’s activities is regularly discussed by the Board. Further detail on our workforce engagement and the Workforce Engagement Director’s statement is set out on page 70. Monitoring our culture, people and sustainability ambitions are key areas of oversight for the Board. Our discussions centred on the cultural transformation programme to create a purpose led, consumer centric, and performance focused culture, which is supported by focus on performance, simplification and productivity. Directors also considered and fulfilled duties in relation to Haleon’s governance, risk and controls during the year. They received training on directors’ duties and, in line with all employees, completed training on the Code of Conduct, including anti-bribery and corruption. Details on the Board’s activities for 2023 are provided on page 68. Embedding the Environmental & Social Sustainability Committee Running a responsible business is one of our four strategic pillars, and underpins the way we operate. The Environmental & Social Sustainability Committee was established in March 2023 to provide oversight of this important area. The Committee had a thorough induction process covering Haleon’s responsible business strategy and the ESG regulatory landscape. The Committee then focused on progress against our key environmental and health inclusivity goals and sustainability strategy. Further information is provided on page 77. Board succession planning The Board welcomed Dave Denton as a Non-Executive Director in March 2023. He replaced John Young as a representative director of Pfizer. Dave received a full induction following his appointment. Talent, capabilities and succession planning remains a key area of focus for the Board, Executive Team and senior management, and our commitment to having a diverse and inclusive pipeline of talent underpins our efforts to cultivate top talent capable of leading the Company for the future. Detail on the work of the Nominations & Governance Committee on this are provided on page 78. Board annual performance review The Board conducted an internal review of its effectiveness for 2023. After completing Haleon’s first full year as a standalone company, the opportunity to review our progress and identify any needed changes in approach, was particularly important. I was pleased with the Board’s engagement with this review and that the Directors were positive about what had been achieved to date, and objective as to the areas of focus going forward. You can read further details on page 71. Annual General Meeting (AGM) Haleon held its first AGM in April 2023. We were pleased with the level of international participation, and that the digital format enabled greater accessibility from across our global shareholder base. We will be continuing the digital focus for our 2024 AGM on 8 May 2024, which will be broadcast from our offices in London. Details on how to join the meeting will be provided in our Notice of Meeting. 66 Haleon Annual Report and Form 20-F 2023 Corporate Governance |
| Governance structure The Board The Board’s main role is to promote the long-term sustainable success of the Company, generating value for shareholders and contributing to wider society. It sets the Company’s purpose, values, strategy and long-term objectives. The Board is also responsible for the Group’s system of corporate governance, activities, risk management and financial performance. Audit & Risk Committee >> See page 72 The role of the Committee is to oversee the integrity of the financial reporting and audit process, and to oversee the maintenance of sound internal controls and risk management systems. The Committee monitors the effectiveness of internal and external audit and reviews concerns about financial fraud and whistleblowing. Nominations & Governance Committee >> See page 78 The role of the Committee is to lead the process for appointments to the Board and make recommendations to ensure plans are in place for orderly succession to both the Board and senior management positions, and oversee a diverse succession pipeline. The Committee also has a role to ensure that the Company is managed to high standards of corporate governance. Remuneration Committee >> See page 80 The role of the Committee is to set the broad structure for the Company’s Remuneration Policy and to determine the remuneration of the Chair, the Executive Team and the Company Secretary. The Committee is also responsible for reviewing workforce remuneration and the alignment of incentives and rewards with the Company’s culture. Environmental & Social Sustainability Committee >> See page 77 The role of the Committee is to provide oversight and effective governance over progress with the environmental and social sustainability agenda and the external governance and regulatory requirements relevant to these areas. The Chief Executive Officer (CEO) is responsible for: — Developing Haleon’s strategic direction for consideration by the Board. — Implementing the strategy and reporting on progress. — Day-to-day management of the Company, communicating expectations in relation to Company culture and ensuring responsible business conduct across the business. — Providing effective leadership, co-ordination and performance management of the Executive Team. The Executive Team is responsible for: — Supporting the CEO on the delivery of Haleon’s strategy. — Providing input into strategic and operational decisions aligned to business priorities, and supporting on the delivery of actions. — Supporting the CEO in implementing decisions made by the Board. Board and Committee meetings and attendance during 2023 Board papers are circulated to all Directors in advance of the meeting allowing sufficient time for their consideration. If any Director is unable to attend a meeting, they can communicate their opinions and comments on the matters to be considered via the Chair of the Board or the relevant Committee Chair. Following the conclusion of each scheduled Board meeting, without the Executive Directors present, the Chair holds a session with the Non-Executive Directors. Director Board Audit & Risk Committee Nominations & Governance Committee Remuneration Committee Environmental & Social Sustainability Committee Chair and Executive Directors Sir Dave Lewis 6/6 3/3 Brian McNamara 6/6 Tobias Hestler 6/6 Independent Non-Executive Directors Vindi Banga 6/6 7/7 3/3 5/5 Marie-Anne Aymerich 6/6 2/2 Tracy Clarke 6/6 7/7 3/3 5/5 2/2 Dame Vivienne Cox 6/6 7/7 5/5 2/2 Asmita Dubey1 5/6 Deirdre Mahlan 6/6 7/7 3/3 5/5 Non-Executive Directors Bryan Supran 6/6 John Young2 1/1 David Denton3 5/5 1 Apologies in advance of the meeting. 2 Stepped down from the Board on 28 February 2023. 3 Appointed to the Board on 1 March 2023. >> Matters reserved for the Board, Committees’ terms of reference, along with the Chair, CEO and SID’s role descriptions are available at www.haleon.com/who-we-are/Governance/board-and-board-committees Corporate Governance Governance structure Haleon Annual Report and Form 20-F 2023 67 |
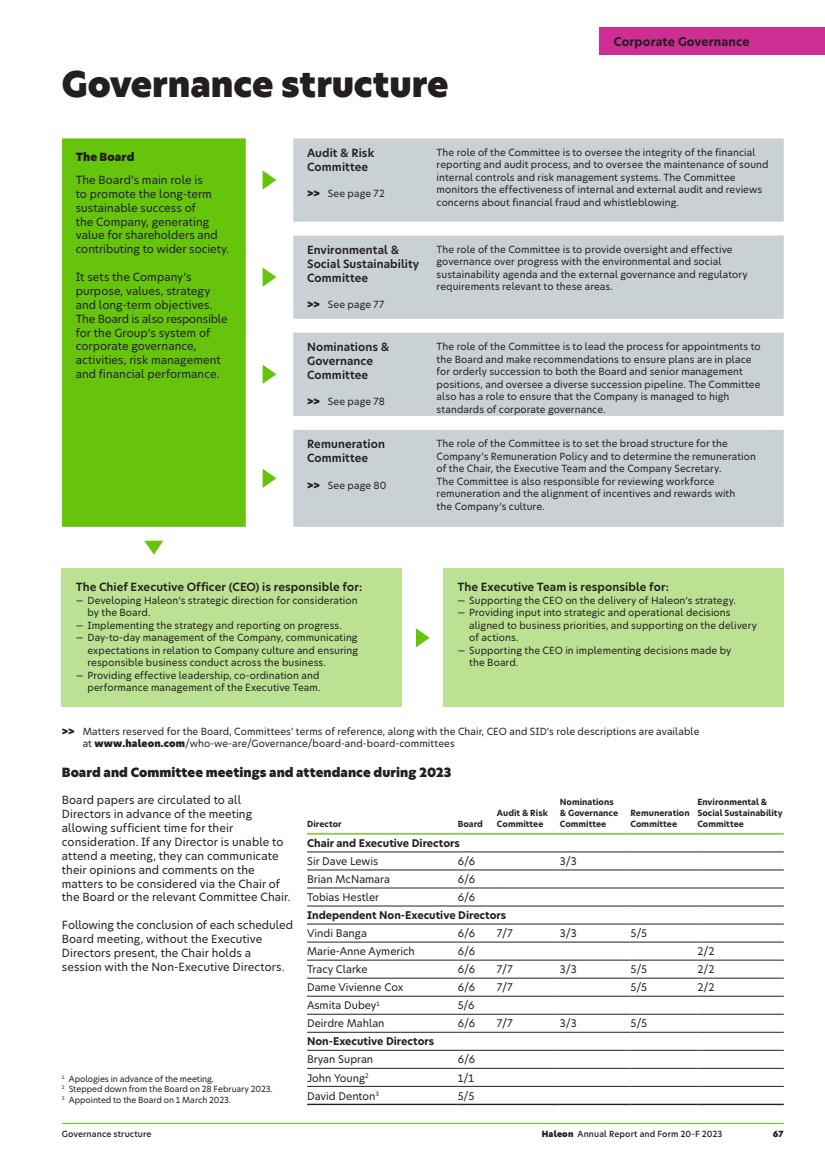
| Board activities The Board reviewed and discussed a wide range of Company activities during the year. The table below gives insight into the matters reviewed by the Board, the nature of Board discussion, and the relevant factors considered within the context of Section 172(1)(a) to (f) of the Companies Act 2006 (‘Section 172’). Key areas of Board discussion Item Activity Group strategy A B C — Reviewed the strategic and operational performance of the business by brand, market categories and regions. — Discussed the global economy, geopolitics, and impact on growth and performance. — Considered the global consumer and competitive landscape and opportunities for innovation. — Received a deep dive into the supply chain and discussed the quality supply chain (QSC) five-year strategy. — Reviewed investment and divestment opportunities, and approved the divestments of Lamisil and ChapStick. Financials and performance A F — Reviewed and approved the 2024-26 corporate plan and 2024 financial plan. — Monitored Haleon’s financial performance and growth against the 2023 financial plan and external commitments. — Discussed financial performance against the 2023-2025 plan, future outlook and analyst consensus. — Considered the approach to capital allocation and returns, including allocating £500m of capital for share buybacks in 2024. — Reviewed and approved the dividend policy, reviewed the approach to the 2022 dividend and approved the 2022 final dividend, the 2023 interim dividend and the proposed 2023 final dividend. — Approved the quarterly, half-yearly and full-year results, the 2022 Annual Report and Accounts and Notice of 2023 AGM. Risk management E — Discussed the Company’s system of risk management and internal controls (alongside regular updates from the Audit & Risk Committee). — Assessed the effectiveness of the Company’s risk and control processes. — Reviewed the Company’s principal risks and mitigation plans. People, culture and values A B — Discussed the results from the employee engagement survey and 2024 focus areas including business process design and optimisation. — Discussed Haleon’s productivity programme, and considered updates on progress and culture. — Discussed and approved the 2023 Gender Pay Gap Report for publication. — Reviewed proposals for the Weybridge Research & Development Innovation facility, and approved the building of an Innovation facility to support the Oral Health Category. — Reviewed proposals for new office space in London and the benefit to UK-based employees. — Considered Haleon’s cultural ambition to be purpose led, consumer centric and performance focused and ongoing progress. Governance A E — Considered reports from the Chairs of each Board Committee on key areas of Committee discussion and focus. — Discussed progress made against the action plans from the 2022 Board effectiveness review. — Approved changes to various governance policies to simplify and better align with Haleon’s operating model. — Received and discussed regular updates on key governance and disclosure matters, including recent consultations on the UK Corporate Governance Code. Shareholder and engagement A E F — Discussed the external environment including global indicators and inflation trends. — Considered updates from Investor Relations, including share price and valuation analysis, market engagement and ownership analysis, and the views of institutional investors. — Received and discussed updates on employee engagement by the Workforce Engagement Director. — Reviewed the preparations for the 2023 AGM and the enhanced digital focus. Sustainability C D E — Approved the Modern Slavery Statement. — Approved the establishment of the Environmental & Social Sustainability Committee. — Considered Haleon’s sustainability agenda and progress plan against each of our strategic market categories. D Community and environment E Business conduct F Members of the Company Relevant Section 172 factors Long term B Employees C Business relationships A >> See also our key stakeholders and culture and people sections on pages 10 and 18. 68 Haleon Annual Report and Form 20-F 2023 Corporate Governance |
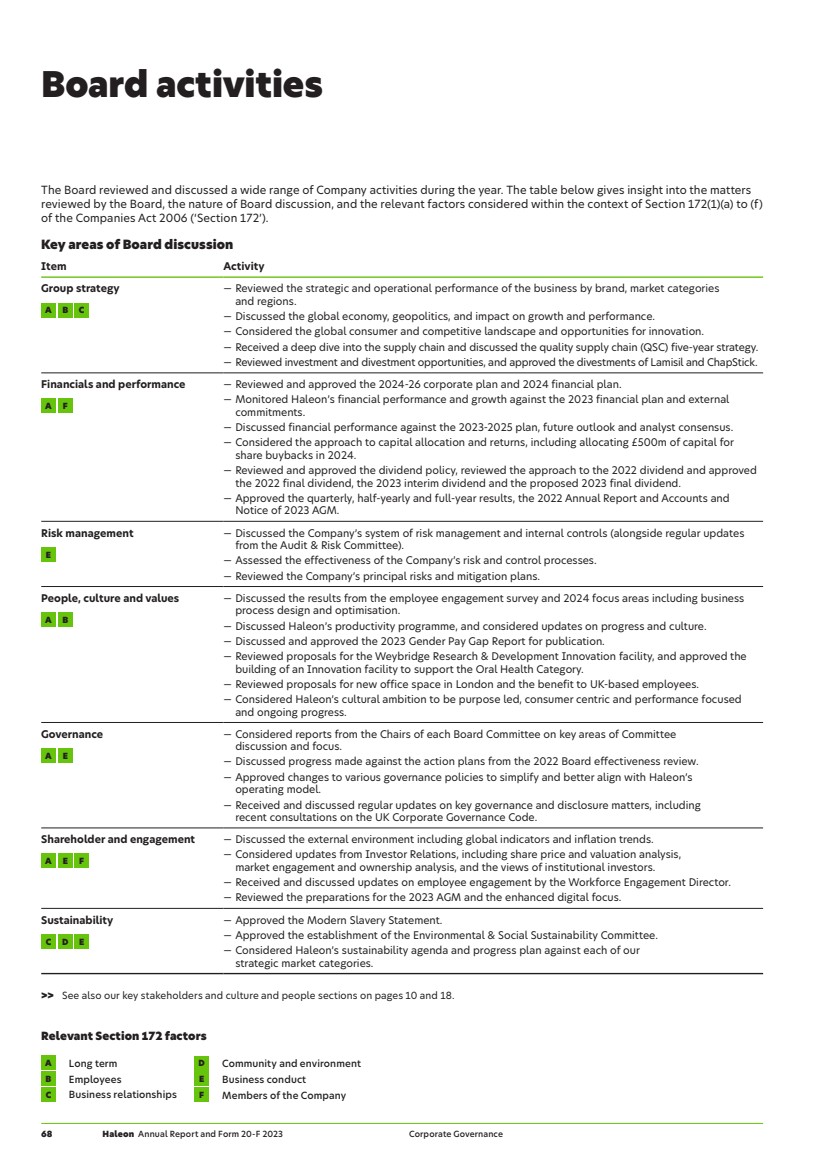
| Section 172 statement The Board considers that, during 2023, it has acted to promote the long-term success of the Company for the benefit of its members while having due regard to the factors set out in Section 172. Understanding the needs and expectations of the Company’s stakeholders is fundamental to Haleon’s purpose: to deliver better everyday health with humanity. Examples of how Section 172 duties and key stakeholders were considered by the Board when making key decisions during 2023 are set out below. Divestment of Lamisil and ChapStick The Board considered the following Section 172 factors: the long-term success of the Company, its relationship with suppliers, the need to act fairly between members, and maintaining high standards of business conduct. How the Board had regard to these factors: — Towards the end of 2022, the Board conducted a strategic portfolio review to identify potential divestment and investment opportunities that would support Haleon’s growth ambitions. — The Board considered the brand portfolio segmentation and the optimum timing and priority of divestments to enhance organic growth and returns over the longer term. — The Board received updates on the brand portfolio, competitive landscape and customer perspectives throughout 2023. — In assessing divestment options, the Board considered the financial impact, marketability, separation issues, speed of execution, and simplification of the supply chain. — To enable strategic focus on the Power Brands and Local Growth brands, the Board agreed to divest the Lamisil and ChapStick brands. — The Board reviewed the offers received for the sale of Lamisil and ChapStick. In accepting each final offer, the Board considered the level of return, the financial impact of the divestment on Haleon, impact on employees, the business risks, and the timescale for delivery. The Board considered that these divestments would enable Haleon to focus on the key strategic areas for longer-term, sustainable growth. Cultural transformation The Board considered the following Section 172 factors: employees, business relationships, maintaining high standards of business conduct, and the long-term success of the Company. How the Board had regard to these factors: — The Company has been on a journey of cultural transformation to evolve Haleon’s culture as an independent consumer health business. — Employees have been engaged on initiatives to support Haleon in shaping its enterprise culture and to ultimately influence its performance and growth and drive behaviours. — The Board had a dedicated session on culture to review the feedback from the 2023 employee engagement survey and the progress being made towards Haleon’s ambition to be purpose led, consumer centric and performance focused and the key areas of focus for management in 2024. — The Board discussed and considered the impact of the Haleon productivity programme as part of Haleon’s cultural evolution. — The Board regularly discussed feedback from workforce engagement activities during the year and considered the plan for workforce engagement for 2024. — The Board encouraged management to keep customers at the heart of any cultural change. This led to an expansion of the cultural descriptors to include ‘consumer centric’, recognising the need for a clear link between purpose, culture and brand in a consumer health business. Communication with shareholders During the year, Directors engaged with shareholders and investors through face-to-face and virtual meetings to discuss progress and performance against Haleon’s strategy. — The CEO and CFO conducted fireside chats with analysts and investors, as well as in-person meetings at a number of investor roadshows. — The Chair met with certain major institutional shareholders of the Group. — The Chair of the Remuneration Committee corresponded with major institutional shareholders in relation to 2024 annual and long-term incentives. — Delivered Haleon’s first AGM, with participation from retail shareholders. — Shareholders’ views were regularly discussed by the Board through reports from the CEO, CFO and updates from the Investor Relations team. Board conduct and standards The Board places a high value in setting the right standards of conduct for the Company, and creating a culture which enables and encourages employees to do the right thing. Training on the Code of Conduct was completed by all Board members, which included anti-bribery and corruption. Corporate Governance Section 172 statement Haleon Annual Report and Form 20-F 2023 69 |
| Dame Vivienne Cox Workforce Engagement Director During the year, I have enjoyed the opportunity to engage with employees across different parts of the Company, which I have found insightful and valuable. The sessions have highlighted: the positive actions taking place to deliver health inclusivity and the opportunities to further educate and work closely with communities; the collaborative team mindset which is an enabler to innovation; the need to simplify processes and further invest in the business to accelerate competitive intelligence; and the clear support for Haleon’s purpose, strategy and culture. Looking ahead to 2024, I will be seeking to engage on a number of topics including brand and customers, remuneration, innovation and consumer focus, purpose and health inclusivity, and work processes as an enabler of engagement. Workforce engagement In line with Provision 5 of the UK Corporate Governance Code, the Board regularly assesses the appropriateness of the mechanism for workforce engagement. The Board believes that the mechanism of a designated Non-Executive Director remains the most effective method for Haleon to enable the employee voice to be heard, and for key insights to be brought into the Boardroom. Employee insight The Board values the opportunity to engage with employees. It is vital to understand the issues that are important to our employees across Haleon’s markets and regions, learn about their experience of working at Haleon and be aware of any challenges that need to be addressed. Alongside providing an insight into the Company’s culture, maintaining a pulse on employee engagement enables understanding of current and future drivers of attraction and retention at Haleon. Engagement plan In preparing the workforce engagement plan for 2023, the key drivers of engagement originated from the 2022 employee engagement survey, which identified the need to better manage workload, streamline processes, improve communication channels and provide opportunities for career growth. During 2023, I met with employees on five occasions. It was important to ensure these sessions included a cross-business group of culturally diverse employees from across our key markets and functions. Amongst other matters, the sessions explored: — Health inclusivity, which was a session with members of various ERGs. — Innovation enablement, which was a session that took place during the Board’s visit to the US, and was joined by members of the US R&D team. — Culture, performance and purpose, which was joined by Quality Supply Chain employees. — Work processes, which was conducted over two sessions, joined by APAC senior managers, and the second session joined by EMEA & LatAm senior managers. These sessions offered valuable insight into drivers of employee engagement at Haleon. The discussions highlighted the progress made towards developing a caring culture grounded in safety and quality, and employee connections to Haleon’s purpose and vision. Key points raised included further promoting employee wellbeing, streamlining systems and processes for greater agility, continuing to foster local empowerment, and unifying culture through change. Continued engagement In addition to my activities, direct engagement with employees remains extremely valuable, and the Board had the opportunity to meet with employees during its visits to the Oral Health facility in Weybridge, UK and the R&D site in Virginia, US. In addition, the Board receives regular verbal updates from management, which will continue to form a regular part of the Board’s agenda for 2024, alongside updates on employee survey results, and detailed summaries at the end of each financial year. Workforce engagement Board activities continued >> See also the consideration of workforce pay and approach to engagement on page 92. 70 Haleon Annual Report and Form 20-F 2023 Corporate Governance |

| Board development, effectiveness and performance Training, development and induction A central piece of Haleon’s culture is a commitment to support the continuing development of all employees. Directors are very supportive of this and are committed to their own ongoing professional development. The training programmes available to the Board are under continual review and are updated in line with the most pressing developments in both Haleon’s governance structure and the broader commercial environment. During 2023, the Directors participated in internal training sessions including directors’ duties and disclosure obligations, the Code of Conduct and anti-bribery and corruption. The Board also received briefings on a range of strategically important matters to ensure they were informed of developments in these areas, and were provided with regular governance updates on topical issues including, changes to the UK Corporate Governance Code and other potential changes in governance and sustainability reporting. A structured induction programme was prepared for David Denton who joined the Board on 1 March 2023. This covered, amongst other matters, strategy, Group structure, directors’ duties, governance, key operations, finance, risk and internal audit, legal, ESG and HR. Board effectiveness and evaluation The Board undertakes an annual evaluation process to assess how it, its Committees and individual Directors are performing, and to highlight areas for improvement or evolution. The Board reviewed progress against each action from the 2022 Board and Committee action plans, and determined that progress had been made against all actions. For 2023, the Board adopted a question and discussion-based evaluation process conducted by the Company Secretary. Other regular meeting attendees were also requested to provide feedback. Findings on the Committees were shared with each respective Committee Chair, whilst those on the Board as a whole were shared with the Nominations & Governance Committee, before discussion with the wider Board. Action plans for the Board and each Committee were agreed for 2024, and are detailed in the table below. Directors’ performance Evaluation of each Director’s individual performance was carried out by the Chair. The reviews will be used as the basis for recommending the re-election of Directors by shareholders at the next AGM. The Chair had one-to-one discussions with each Director to discuss, amongst other things: — Their performance and individual effectiveness. — Their time commitment to Haleon, including the potential impact of outside interests. — Their ongoing personal development. — The Board’s composition, including Non-Executive Director succession plans. — Current and future Committee membership and structure. — The effective functioning of the Board. The Chair review process was led by the Senior Independent Non-Executive Director who sought feedback from the Non-Executive Directors separately, Action plan Board — Focus on delivery of strategic objectives, driving performance and shareholder returns. — Continue focus on cultural evolution and interactions with our talent and key business areas. — Enhance oversight of risk management and internal controls to reflect changes to the UK Corporate Governance Code. Audit & Risk Committee — Continue oversight and focus on key areas of the Committee’s remit. — Continue focus on risk management with further deep dives on key areas, including IT and cyber-security. — Review compliance with the UK Corporate Governance Code on internal controls and continue focus on SOX. Environmental & Social Sustainability Committee — Review delivery of Haleon’s first Responsible Business Report. — Continue focus on Haleon’s preparedness for current and future external sustainability disclosures, including the Corporate Sustainability Reporting Directive. — Continue oversight of the delivery of sustainability KPIs and targets. Nominations & Governance Committee — Continue focus on succession planning for the Board and the Executive Team. — Enhance oversight of subsidiary governance. — Support development, talent management and succession planning of senior management. Remuneration Committee — Continue oversight and focus on key areas of the Committee’s remit. — Review executive remuneration structures and targets to ensure balance with Company-wide offering and wider workforce decisions. — Focus on effectiveness and transparency of disclosures and reporting. without the Chair present, and also took into account the views of the Executive Directors. The feedback was collated and shared with the Chair. Key findings and conclusion Overall, Directors felt positive about the Board and how it functioned, noting the step-up in effectiveness during 2023 with the completion of the first full annual cycle of Board activities and disclosures since Haleon’s listing in 2022. The culture of the Board was considered to be positive with open, direct discussions, good engagement and interactions with the Executive Team. The Board was felt to have a strong mix of experience and relevant expertise to support the business. Directors noted that Board and Committee operations and governance worked well, with discussions supported by good quality papers and comprehensive agendas. Progress had been made in relation to strategy and this would continue to be an area of focus for 2024. Progress had also been made in relation to risk, with all key risks appropriately prioritised during the year. All Board Committees were felt to be well established and supported by experienced Chairs. The Environmental & Social Sustainability Committee had made a good start with its remit, developing its understanding of the sustainability agenda, data and commitments. Each of the Directors is considered to be an effective member of the Board and all Directors as at the date of this Report will seek re-election at the AGM. An externally facilitated Board evaluation will be undertaken in 2024. Corporate Governance Board development, effectiveness and performance Haleon Annual Report and Form 20-F 2023 71 |
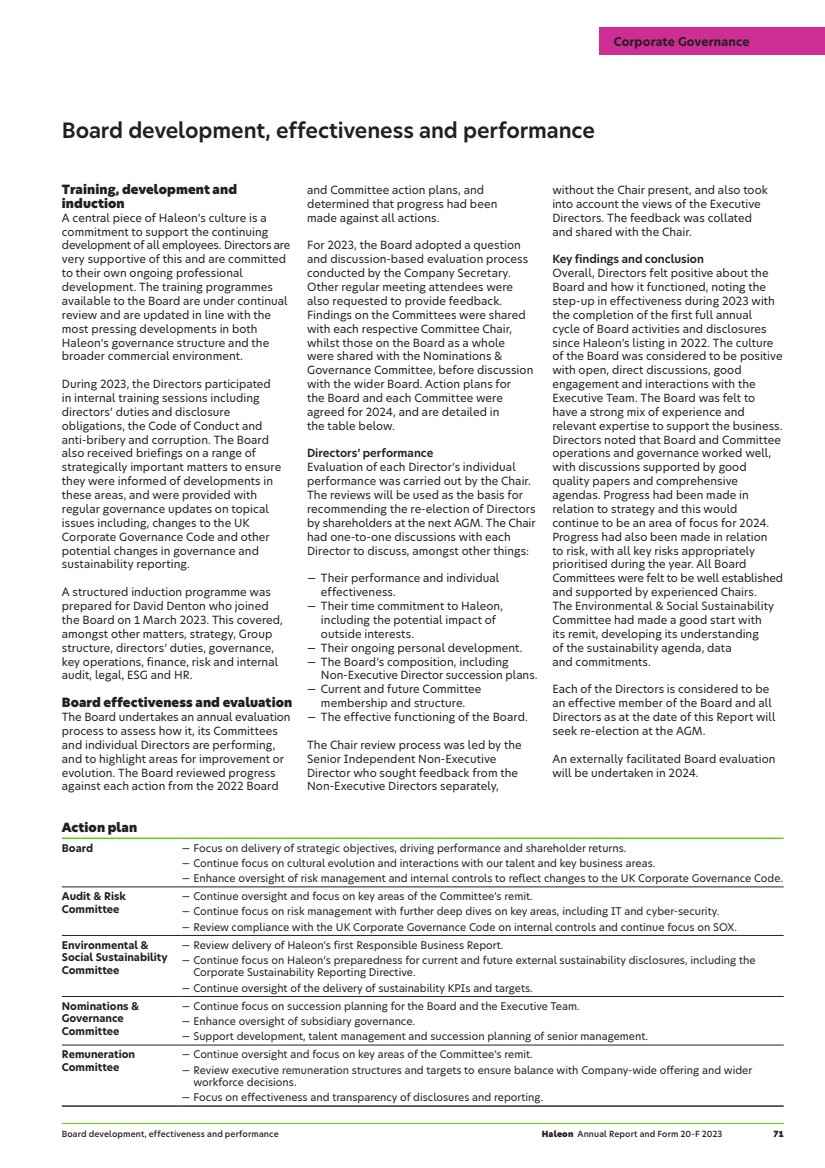
| Audit & Risk Committee Report Deirdre Mahlan Chair Letter from the Chair During the year, the Committee has focused on its core objectives in overseeing the integrity of the Group’s financial reporting process, the effectiveness of the external audit and the robustness of the Company’s control environment to manage risks. The Committee has closely monitored the Group’s successful first year of compliance with Section 404 of the US Sarbanes-Oxley Act (SOX), as well as the effectiveness of the audit process as we transitioned to our new external auditor, KPMG LLP. The Committee has also had a series of deep dives into the Group’s cyber-security controls and technology infrastructure, product user safety and trusted ingredients. Further information on this and our other activities are set out later in this report. Changes in regulatory reporting, including the recent updates to the UK Corporate Governance Code and the impact to the Group, will be an additional area of focus for the Committee in 2024. Key duties and responsibilities The Committee’s responsibilities include monitoring and reviewing: — The integrity of financial reporting of the Company’s Financial Statements including reviewing significant judgements and the adequacy of related disclosures. — The external and internal audit process and performance of the Internal Audit function and the external auditor. — The effectiveness of the Company’s system of internal control. — The process for the management of related-party transactions. — The Group’s risk management system, and the identification and management of risks. — The Company’s process for monitoring compliance with legal and regulatory requirements and ethical codes of practice. Membership and meetings The Committee comprises solely Independent Non-Executive Directors. Details are set out on pages 62 and 63, together with details of their attendance for the year on page 67. The Chair, CEO, CFO, General Counsel, Group Financial Controller, Head of Audit, Risk and Assurance, and the lead audit partner from KPMG LLP regularly attend meetings, with other attendees invited as appropriate. The Committee also met without management present and met privately with the audit partner and with the Head of Audit, Risk and Assurance. The Board has confirmed that it is satisfied: — That the Committee members collectively possess an appropriate breadth of recent and relevant financial expertise including competence in accounting and/or audit and experience in the consumer healthcare industry. — That Deirdre Mahlan possesses the relevant attributes to be the designated Audit Committee Financial Expert in accordance with US federal securities laws and regulations. Looking ahead The Committee will continue to focus on its key areas of responsibility, including the Group’s financial reporting and disclosures, internal control over financial reporting, the effectiveness of KPMG LLP as external auditor and the approach to the 2024 external audit. In addition, the Committee will consider the impact of the recent changes to the UK Corporate Governance Code which take effect in 2025 and the further development of the Group’s enterprise risk management framework and compliance programmes. Controls surrounding the IT environment will remain a particular area of focus for the Committee as the Group continues to embed changes in the IT landscape post separation and make improvements in IT controls. The Committee will continue to review key IT initiatives and related risks and progress in the maturity of the control environment at each Committee meeting. 72 Haleon Annual Report and Form 20-F 2023 Corporate Governance |
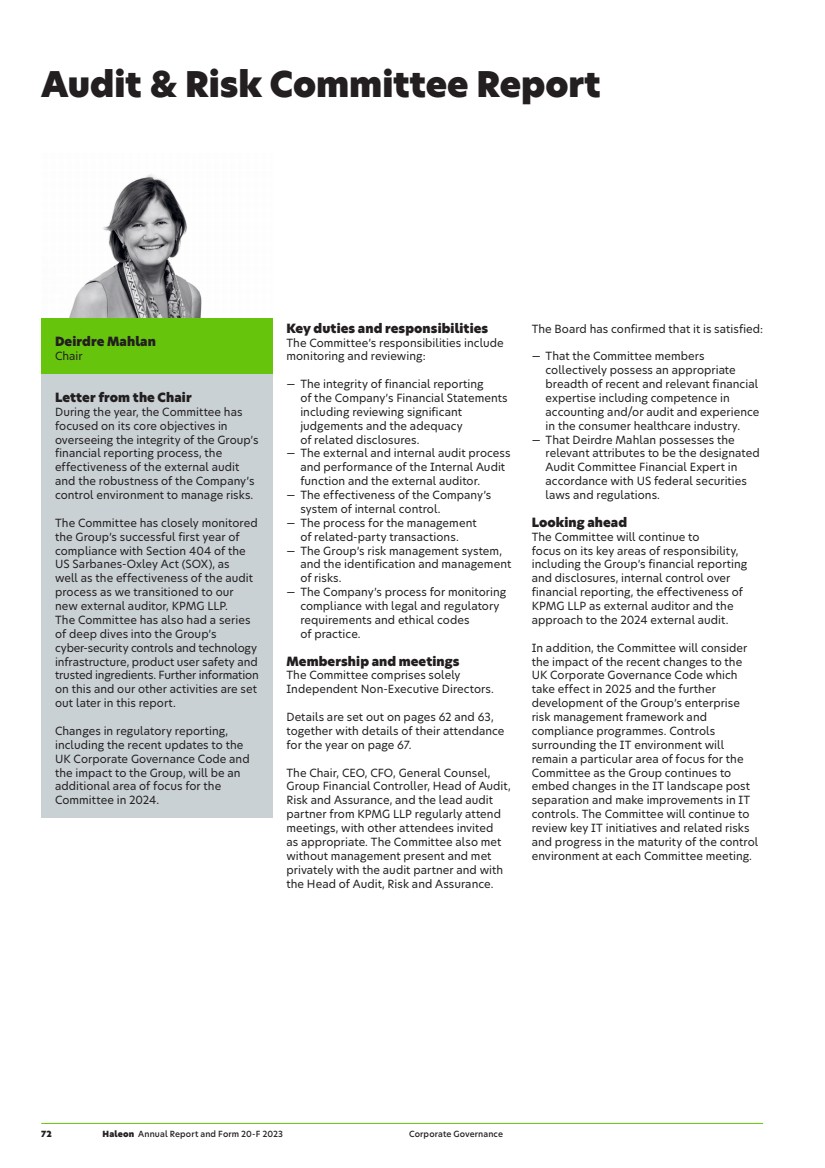
| Committee activities External reporting — Discussed and recommended to the Board for approval, the quarterly trading statements, interim and full-year financial statements, and the 2023 Annual Report. — Reviewed the Group’s policy on the use of non-IFRS measures and adjusting items including disclosure and presentation, as well as the introduction of organic operating profit growth as a new non-IFRS measure. — Reviewed and challenged the going concern assumptions for 2023 and the principles underpinning the longer-term viability statement. — Reviewed and challenged the treatment of key accounting matters and judgements including the estimation of the recoverable amount of indefinite life brands. — Considered tax and treasury matters, and compliance with statutory reporting obligations. — Assessed whether the Annual Report, as a whole, was fair, balanced, and understandable. Internal and external audit — Approved the statutory audit engagement letter for KPMG LLP in respect of Haleon plc and its subsidiaries for the period ended 31 December 2023. — Held periodic meetings with the external auditor, without management present. — Reviewed and agreed policies and processes designed to safeguard independence of the external auditor, including the approval of the 2024 Non-Audit Services Policy. — Assessed the effectiveness of the external auditor. — Approved the 2024 Internal Audit plan. — Received and discussed regular updates on the 2023 Internal Audit Plan from the Head of Audit Risk and Assurance, and met him regularly without management present. Internal controls — Received and discussed regular updates on internal controls, including the results of testing, and discussed instances where the effectiveness of internal controls was considered to be insufficient or required remediation. — Considered the assessment to determine the Company’s status as an FPI. — Reviewed the Group’s first SOX evaluation and certification of internal controls over financial reporting for the year ended 31 December 2023. Related-party transactions — Reviewed related parties for IFRS purposes as part of the year-end process. Risk management — On behalf of the Board, reviewed the processes by which the Group’s principal risks are identified and managed and received periodic reports of the status of principal risks; reported any issues arising from these reports to the Board. — Undertook detailed reviews of key risk areas and processes including digital and technical infrastructure, and cyber-security. — Reviewed tax and treasury policies and considered consistency with the risk appetite of the Company. — Considered the Group’s insurance policy and insurance programmes. — Reviewed the effectiveness of the risk management and internal control systems. Compliance — Received and discussed regular updates from the General Counsel on legal issues. — Monitored fraud reporting, the confidential hotline and whistleblowing arrangements, and discussed trends with management. — Reviewed and discussed reports from the Compliance function, including updates on Haleon’s Speak Up, concerns management and internal investigations framework. — Considered the new ethics and compliance model. Corporate Governance Audit & Risk Committee Report Haleon Annual Report and Form 20-F 2023 73 |

| Audit & Risk Committee Report continued Financial and narrative reporting During the year, the Committee reviewed and recommended approval of the interim and full-year financial statements, and associated releases. In conducting its review, the Committee assessed key judgement areas, going concern and viability statements, and impairment reviews. The Committee evaluated whether the Annual Report, taken as a whole, was fair, balanced and understandable and contained the necessary information for shareholders to assess the Group’s performance, business model and strategy. To support this assessment, management established processes to ensure consistency of disclosures, address financial reporting risks and co-ordinate Company-wide input. In fulfilling its role, the Committee recommended to the Board for approval, a near-final version of the Annual Report at its February 2024 meeting following the Committee’s assessment that it was fair, balanced, and understandable. Internal audit The Internal Audit function provides independent, objective assurance to the Board, the Committee and senior management on the adequacy and effectiveness of Haleon’s risk management, governance, and internal control processes. The appointment of the Head of Audit, Risk and Assurance is a matter reserved to the Committee. The Head of Audit, Risk and Assurance holds regular discussions with the Committee Chair and provides regular reports to the Committee on the function’s activities. The effectiveness of the Internal Audit function, including its quality, experience and expertise relative to the size of the business, was continually monitored through reports received by the Committee during the period. These reports provided key internal audit observations and described proposed improvement measures and related time frames given to management. The Committee approved the annual work plan which includes risk-based reviews of financial, operational, strategic and governance risks, reviews of emerging risks and business change activity, together with assurance over risk management activities. The 2024 Internal Audit plan will be regularly reviewed and updated as required to reflect evolving assurance requirements and priorities. Throughout the year, the Committee reviewed key disclosures and reporting requirements to ensure clear communication of material information to shareholders. This included assessing assumptions underlying impairment testing, calculating gain/loss on disposal of intangible brand assets, the going concern and viability assessments and climate-related financial reporting. The Committee received updates on the control environment, financial reporting integrity, the Annual Report verification process, including management’s checklist confirming compliance with the relevant regulatory requirements, and external audit outcomes. The key audit matters reviewed by the external auditor and the related outcomes are set out in the external auditor’s report on pages 99-115. The Committee monitors engagements with external stakeholders relevant to its areas of oversight, including the UK’s Financial Reporting Council (FRC) and the US Securities and Exchange Commission. The FRC carried out a review of Haleon’s Annual Report for the year ended 31 December 2022. No significant questions or queries were raised, and the Group took into consideration their recommendations when preparing this Annual Report. The Committee notes that the FRC’s review does not provide assurance that the Annual Report is correct in all material respects as the FRC’s role is not to verify information provided, but to consider compliance with reporting requirements. During the year the Committee also reviewed correspondence from the FRC’s Audit Quality Review (AQR) team, who reviewed Deloitte’s audit of the Group’s 2022 Financial Statements as part of its annual inspection of audit firms. The Committee received and reviewed the final report from the AQR team which identified no key findings or other findings, and noted several areas of good practice. Significant reporting matters in relation to the Financial Statements considered by the Committee during 2023 Accounting area Committee’s conclusion and response Recoverable amount of indefinite life brands As at 31 December 2023, the Group had approximately £18,073m of intangible assets that are indefinite life brands. The Group tests at least annually whether indefinite life brands have suffered any impairment. Impairment testing is inherently judgemental and requires management to make multiple estimates, including those related to the future revenue growth of each brand, terminal growth rates, profit margins, and discount rates. The Committee reviewed information on the impairment tests performed, focusing on the critical assumptions as well as any changes from the prior year. In 2023, the Group recognised non-cash net impairment charges totalling £184 million, principally related to the ChapStick brand, as it was determined the carrying value was less than the estimated recoverable amount. The Committee noted the decrease in the recoverable amount of the ChapStick brand was mainly driven by the Group’s strategic decision to sell the brand below its carrying value. For those brands with limited levels of headroom, the Committee also reviewed and challenged sensitivity analyses provided by management to understand the impact of changes in key assumptions. The Committee was satisfied with the assumptions utilised by management and also considered and reviewed the Group’s relevant impairment disclosures. Refer to Note 14 of the Consolidated Financial Statements on page 136 for further detail. 74 Haleon Annual Report and Form 20-F 2023 Corporate Governance |
| US Sarbanes-Oxley Act of 2002 (SOX) The Group is required to comply with the provisions of SOX, specifically Sections 302 and 404, as it relates to an FPI listed on a US exchange. During 2023, the Group completed a successful first year of compliance with Section 404 of SOX. The Group’s internal control over financial reporting was deemed to be designed and operating effectively as at 31 December 2023. This is a significant achievement for the Group and the Committee was satisfied with the progress in implementing the requirements under Section 404 of SOX with respect to internal controls over financial reporting. The Committee will continue to monitor the progress of the Group’s internal control optimisation efforts, remediation of internal control deficiencies, and internal controls related to technology systems and associated infrastructure. >> See also our management’s report on internal control over financial reporting on page 192. Internal control and risk management The Board is responsible for establishing procedures to manage risk and oversee the Group’s internal control framework including setting risk appetite in line with the Group’s strategic objectives, and ensuring appropriate oversight through various mechanisms, including strategy meetings, management reports and reviews of selected risk areas. On behalf of the Board, the Committee is responsible for reviewing and assessing the effectiveness of the Group’s risk management and internal control systems. A fundamental part of the work carried out included the review of the Group’s principal risks and its financial and operational controls and procedures. The Committee discussed information on risk mitigation plans, internal control maturity and areas for improvement. The Group’s approach to risk management and internal controls has further evolved and will continue to be refined throughout 2024. The risk management framework is designed to actively manage, rather than eliminate, the significant risks and uncertainties the Group may face. Consequently, the Group’s internal control system can only provide reasonable, but not absolute, assurance over its principal risks. In 2023, a top-down enterprise risk assessment was conducted to review and prioritise the Group’s principal risks, assess the magnitude of risk exposure, and highlight any emerging risks. In parallel, a bottom-up risk identification was performed across business units, markets, sites and functions. The Committee reviewed the findings, agreed on the principal risks and concluded that management’s approach to risk and risk appetite was satisfactory. >> See also our approach to risk section from page 53. The Committee reviewed and endorsed a range of policies and programmes, including: — The Company’s Code of Conduct (Code) and its core value of seeking to always do the right thing, applicable to the Board, Executive Team, employees and third-party temporary workers. The Code supports and encourages good judgement while maintaining a culture of risk accountability. — The mandatory anti-bribery and corruption (ABAC) training. — The annual confirmation process from business unit and function general managers attesting their governance responsibility and the effectiveness of the internal control framework, including issue response through corrective and preventative actions. — Internal controls, discussing opportunities to further simplify and evolve the framework in line with our strategy and operating model. — The crisis and business continuity management procedures. — Haleon’s concerns management and data analysis measuring traction and progress. — Risk deep dives over principal risks, including trusted ingredients, cyber-security (and IT infrastructure), and other enterprise risk areas such as treasury, tax and trade compliance. Based on the Committee’s activities performed throughout the year, and its annual effectiveness review, the Committee considered the Group’s system of internal control and risk management under the provisions of the UK Corporate Governance Code for the year ended 31 December 2023 and up to the date of approval of the Annual Report are effective. Corporate Governance Audit & Risk Committee Report Haleon Annual Report and Form 20-F 2023 75 |
| Audit & Risk Committee Report continued Cyber-security and technology infrastructure Following the Committee’s review of Haleon’s enterprise systems and technology infrastructure environment in December 2022, certain risk areas were identified. During the year, the Committee received progress updates on the mitigation and remediation plans for these risks and was pleased that the remediation commitments due for completion in 2023 were successfully achieved. The Committee also received deep dives into a number of cyber-security risks during the year. The Haleon Information Security team commissioned an external partner, PwC, to conduct an assessment of Haleon as a standalone company in the first quarter of 2023 leveraging the industry standard framework, National Institute of Standards and Technology (NIST) Cybersecurity Framework. This assessment provided an objective baseline across all assets. The findings were discussed with the Committee along with a prioritised plan which continues to grow cyber-security maturity for the Company. The Committee received and discussed a deep dive into some of the risk areas and will continue to monitor the progress in this area. External audit Following an audit tender carried out in 2022, KPMG LLP was appointed as auditor of the Group and engaged in respect of the statutory audit of Haleon plc and its subsidiaries for the 2023 financial year. Nicholas Frost was appointed the lead audit partner for the period ended 31 December 2023. During the period, the Committee reviewed and discussed the plans for the external audit, the proposed audit fees, and terms of engagement. It reviewed the external audit process and quality and experience of the audit partner engaged in the audit and also considered the extent and nature of the challenge demonstrated by the external auditor in their work and interactions with management. The Committee regularly receives reports from the external auditor on the progress of its audit activities. The Committee reviews the contents of these reports, the level of professional judgement and challenge of management assumptions demonstrated by the external auditor and, where appropriate, requests that management respond to that challenge and tracks management response to ensure a satisfactory outcome to the challenges raised. In considering the independence of KPMG LLP, the Committee received a statement of independence from the external auditor, a report describing the arrangements to identify, report and manage any conflicts of interest, and reviewed the extent of non-audit services provided to the Group. The Committee confirmed its satisfaction with the effectiveness and independence of KPMG LLP with respect to their engagements in their respective jurisdictions. The Committee assessed the effectiveness of the external audit process including the quality of the audit team and involvement by the lead audit partner, the adequacy of audit planning, the timely and robust execution of the audit, the quality of communications to the Committee, and auditor independence and objectivity. The Committee concluded that the 2023 external audit was effective, and that the external auditor continued to perform effectively. Following the Committee’s recommendation, the Board recommends to shareholders the reappointment of KPMG LLP as the external auditor for 2024. The total fees paid to KPMG LLP for the year ended 31 December 2023 were £17.1m, of which £1.2m related to non-audit work. Details of the fees paid to the external auditor are in Note 6 to the Consolidated Financial Statements on page 127. Non-audit services The Committee has adopted a policy designed to safeguard the independence and objectivity of the external auditor. This policy, which complies with the FRC’s 2019 Revised Ethical Standard and SOX, sets out a framework for determining whether it is appropriate to retain the external auditor to provide non-audit services and outlines the process for pre-approving non-audit fees. The policy includes a list of permitted non-audit services in line with the relevant regulations. Any service not on this list is prohibited. The Committee has pre-approved the use of the external auditor for non-audit services where: — They are included in the policy’s list of permitted non-audit services; and — They are approved by the Group Financial Controller, or their designate in certain defined circumstances, when not exceeding £100,000; or — They are approved by the CFO and the Chair of the Audit & Risk Committee when they exceed £100,000. The total fee for non-audit services provided by the external auditor is reported to the Audit & Risk Committee on a quarterly basis. Management’s approval based on monetary limits is not a delegation of authority for approval by the Audit & Risk Committee, but rather a confirmation of adherence to the policy for permissible non-audit services. The Committee reviews the nature and level of non-audit services undertaken by the external auditor during the year to satisfy itself that there is no impact on its independence. During the period ended 31 December 2023, the external auditor undertook non-audit work in relation to other assurance services, corporate finance and other services and was paid a total of £1.2m. The Committee considers for the year ended 31 December 2023, that the Company has complied with the Competition and Markets Authority’s Statutory Audit Services for Large Companies Market Investigation (Mandatory Use of Competitive Tender Processes and Audit Committee Responsibilities) Order 2014 and the FRC’s Audit Committees and the External Audit: Minimum Standard. 76 Haleon Annual Report and Form 20-F 2023 Corporate Governance |
| Environmental & Social Sustainability Committee Report Marie-Anne Aymerich Chair Letter from the Chair The Committee was established in March 2023 and has since started to lay down some good foundations. We held an extensive education session covering Haleon’s responsible business strategy, its goals and the external ESG landscape. In addition, the Committee held two formal meetings during the rest of the year. During those meetings we spent significant time considering Haleon’s sustainability disclosures, the vast regulatory and reporting requirements in this area, and received comprehensive deep dives on areas within the Committee’s remit including packaging and health inclusivity. The Committee has covered much ground since March, but there is more to do in 2024 to support the delivery of Haleon’s sustainability ambitions and disclosure obligations. Key duties and responsibilities The Committee’s responsibilities for environmental and social sustainability (ESS) include monitoring and reviewing: — Haleon’s progress against its ESS agenda and associated external governance and regulatory requirements. — Emerging ESS issues that could impact the Group’s operations, ESS initiatives, or reputation. — Haleon’s ESS engagement with relevant external stakeholders, NGOs and other interested parties. — The ESS disclosures within the Annual Report and external ESS reporting, including the Climate Action Transition Plan. Membership and meetings The Committee comprises solely Independent Non-Executive Directors. Details are set out on pages 62 and 63, together with details of attendance for the year on page 67. The Chair, CEO, Head of Transformation and Sustainability, VP Sustainability, and the Sustainability Programme Director regularly attended meetings in 2023. Other attendees were invited to meetings as appropriate. Committee induction Following the establishment of the Committee, an induction session was held with input from external experts. The session covered Haleon’s responsible business strategy, environmental and social sustainability, the external environment and mandatory reporting, regulations and disclosures relevant to the Committee’s remit. This helped to shape the Committee’s agenda for the rest of 2023, with particular focus on Haleon’s health inclusivity strategy, sustainable packaging, and external reporting. Key metrics and future reporting As part of the deep dive sessions, the Committee reviewed the scope and ambition of the Company’s health inclusivity and packaging targets. The Committee reviewed the threshold level of impact required for the Company to measure achievement against Haleon’s social impact goal, and considered how to balance the breadth of reach of the initiatives versus the depth of impact. The Committee also approved an update to Haleon’s baseline year for our Scope 3 carbon emissions and virgin petroleum-based plastic reduction targets. In addition to Haleon’s current ESS ambitions, the Committee considered Haleon’s future external ESG disclosure requirements, including how to most effectively and efficiently balance reporting requirements from different jurisdictions as a global business. Looking ahead The Committee will continue to focus on oversight in relation to packaging, carbon net zero, health inclusivity and progress against the Company’s sustainability ambitions. Committee activities Responsible business strategy — Reviewed Haleon’s half-year performance against the responsible business scorecard measures. Key metrics — Received and discussed a deep dive on the progress of Haleon’s health inclusivity strategy and social impact goals as well as sustainable packaging. — Reviewed and approved the updates to Haleon’s baseline year from 2020 to 2022 for our Scope 3 carbon emissions and virgin petroleum-based plastic reduction targets. External reporting — Considered external reporting in relation to TCFD and CSRD reporting, Haleon’s Responsible Business Report and human rights. Stakeholder engagement — Discussed regular updates on stakeholder engagement. >> See also our approach to sustainability from page 22. Corporate Governance Environmental & Social Sustainability Committee Report Haleon Annual Report and Form 20-F 2023 77 |
| Nominations & Governance Committee Report Sir Dave Lewis Chair Letter from the Chair This year the Committee focused on succession planning for the Executive Team, given there has been a number of changes. The Committee also had sessions on talent and succession within the wider organisation and received insight into the broader talent agenda for senior management. Discussions during the year also focused on progress against the Board’s Diversity & Inclusion Policy, diversity at the top two management levels of the Group and progress against our responsible business ambitions. In addition, we continued to regularly consider the composition of the Board and discussed Non-Executive Director succession. The Committee will continue to focus on its key areas of responsibility with a particular emphasis on developing a strong and diverse talent pipeline at the Board and senior management level. Key duties and responsibilities The Committee’s responsibilities include: — Leading the process for appointments to the Board. — Ensuring plans are in place for orderly succession to both the Board and senior leadership positions. — Overseeing the development of a diverse pipeline for succession at Board and senior management level. — Reviewing and recommending the Board Diversity & Inclusion Policy. — Monitoring and, where appropriate, recommending changes to the Company’s corporate governance framework. Membership and meetings Excluding the Chair, who was considered independent on appointment, the Committee comprises solely Independent Non-Executive Directors. Details are set out on pages 62 and 63, together with details of attendance for the year on page 67. The CEO and the Chief Human Resources Officer regularly attended meetings, with other attendees invited as appropriate. Sucession planning The Committee continued to build on its existing processes to strengthen its focus on succession planning. During 2023, it assessed the composition of the Board in terms of the balance of Executive and Non-Executive roles, and its skills, experience, diversity, capacity and tenure. The Committee also discussed the Company’s leadership requirements including assessing the Executive Team’s capabilities and development plans against the current and future succession needs. In addition, it reviewed the people strategy and talent agenda more broadly to help in developing a pipeline of potential future leaders. With the exception of David Denton who was appointed on 1 March 2023, the Directors were all newly appointed in July 2022 and the Committee considers that the Board’s membership and composition remains appropriate. Composition, time commitment and independence Further to the disclosure on page 71, the Committee assessed the composition and effectiveness of the Board and its Committees. This included reviewing the Committee activities Succession planning — Considered Non-Executive Director’s tenure and succession planning arrangements for the Board including the CEO and CFO. — Reviewed the composition of the Executive Team and discussed key experiences, strengths, development areas, performance and succession coverage. — Reviewed and discussed the Board skills and experience matrix for Non-Executive Directors. Board composition and diversity — Reviewed the composition of the Board and its Committees, including diversity metrics. — Discussed progress against objectives and approved the updated Board Diversity & Inclusion Policy. Evaluation and annual assessment of performance — Assessed the independence of the Non-Executive Directors. — Recommended to the Board each Director stand for re-election by shareholders at the Company’s 2023 AGM. — Reviewed and made recommendations to the Board in respect of each Director’s actual, potential or perceived conflicts of interest. — Reviewed the independence and time commitments of the Non-Executive Directors. Governance — Considered the creation of a Conduct and Standards Group and reviewed its Terms of Reference. — Discussed the feedback from the 2023 Board and Committee effectiveness review and the action plans. — Recommended the membership of the Environmental & Social Sustainability Committee. — Considered the Director induction plan for David Denton. 78 Haleon Annual Report and Form 20-F 2023 Corporate Governance |
| balance of skills, experience, and diversity represented. It also assessed each Non-Executive Director’s time commitment and reported the outcomes of this activity to the Board. The assessment considered internal responsibilities and the number and nature of the Directors’ external commitments. All Non-Executive Directors demonstrated they have sufficient time to devote to their present role. The Senior Independent Director (SID) reviewed the time commitment of the Chair as part of his annual review of the Chair’s performance. In line with Provision 11 of the UK Corporate Governance Code, over half of our Board members are Independent Non-Executive Directors. Bryan Supran and David Denton are not considered independent as they are nominees of Pfizer. Board diversity, equity and inclusion The Board and its Committees have a diverse mix of gender, socio-economic and ethnic backgrounds, knowledge, personal attributes, skills and experience. While all Director appointments are based on merit, each candidate is assessed against objective criteria, with the prime objective to maintain and enhance the Board’s overall effectiveness. The Committee monitors progress against the Board and its Committees’ diversity objectives which are set out in the Board Diversity & Inclusion Policy (the Policy), as part of its Board and Committee succession planning and, in addition to the skills and experience matrix, has regular regard to external guidance on improving diversity. As a result of this, the Board updated the Policy during 2023, to reflect evolving best practice and regulation. A copy of the Policy can be found on our website, as outlined below. As at 15 March 2024, the Company met the recommendations of the FTSE Women Leaders Review on gender diversity, and the Parker Review objective on board ethnic minority representation. The Board met and exceeded the FCA Listing Rules requirements in respect of female representation and ethnic diversity, as set out in the table below. While no women currently serve as Chair, SID, CEO or CFO as required by the Listing Rules, three out of the four Board Committee Chairs, as well as the Workforce Engagement Director, are appointments currently held by women. As part of our succession planning and as appointments to the Board are considered, we will be mindful of the Listing Rules requirements. Gender representation as at 31 December 2023 Number of Board members Percentage of the Board Number of senior positions on the Board (Chair, SID, CEO and CFO) Number in executive management1 Percentage of executive management Men 6 55% 4 8 53% Women 5 45% 0 7 47% Not specified/prefer not to say — — — — — Ethnicity representation as at 31 December 2023 Number of Board members Percentage of the Board Number of senior positions on the Board (Chair, SID, CEO and CFO) Number in executive management1 Percentage of executive management White British or other White (including minority-white groups) 9 82% 3 12 80% Mixed/Multiple Ethnic Groups — — — — — Asian/Asian British 2 18% 1 2 17% Black/African/Caribbean/Black British — — — — — Other ethnic group, including Arab — — — — — Not specified/prefer not to say — — — 12 3% >> Information on the gender balance of the Executive Team and their direct reports is available on page 20. >> See our Board Diversity & Inclusion Policy at www.haleon.com/who-we-are/Governance/board-and-board-committees 1 Executive management is defined as members of the Haleon Executive Team (including the CEO and CFO). 2 Representing one individual based in a country in which it is illegal to collect diversity data. Corporate Governance Nominations & Governance Committee Report Haleon Annual Report and Form 20-F 2023 79 |
| Letter from the Chair I am delighted to present the Directors’ Remuneration Report for Haleon plc for the year ended 31 December 2023. Our first Directors’ Remuneration Policy received strong shareholder support and was approved by 98.2% of shareholders at the 2023 AGM. The first Directors’ Remuneration Report received 98.7% support from our shareholders. Both the Remuneration Policy and its implementation in 2023 were designed to reward performance that delivers, at a minimum, Haleon’s investment case and drive growth, and it was therefore pleasing that shareholders have endorsed this approach. The Committee remains confident that the remuneration structure in place supports a management team that is committed to delivering consistently strong performance, while creating a sustainable, values and purpose-led Company. I would like to thank the shareholders that engaged with me and provided helpful feedback as the Committee designed, refined and finalised the remuneration structure. Tracy Clarke Chair of the Remuneration Committee 15 March 2024 Tracy Clarke Chair diversity in leadership roles. As the business is getting closer to reaching its initial deleveraging target (below 3.0x net debt/adjusted EBITDA), to ensure that the performance measures continue to support the most critical strategic objectives, for the 2024-2026 performance cycle the net debt/adjusted EBITDA measure (50% weighting) will be replaced with a combination of two alternative measures, adjusted diluted earnings per share growth (EPS) (30% weighting) and organic operating margin improvement (operating margin) (20% weighting). EPS will drive a focus on bottom-line performance, whilst operating margin will enhance the focus on profitable growth, both of which are critical to driving long-term shareholder value. The addition of EPS and operating margin improvement will rebalance the incentive structure towards a focus on profitability, highlighting the importance of achieving margin improvement alongside top-line growth. Despite this change in the 2024-2026 metrics, our strategy remains consistent. The 50% weighting on cumulative free cash flow will remain for 2024 as it continues to be a strategic priority to drive financial discipline. The generation of stable cash flow is a critical part of how value is created for our shareholders, including our ability to deliver returns. In addition, as the external commitment on recycle-ready packaging runs to 2025, this threshold will be replaced by a metric assessing the reduction in virgin petroleum-based packaging as part of the ESG qualifier for the 2024-2026 cycle. This metric is aligned with Haleon’s external commitment to reduce use of virgin petroleum-based plastic, with the threshold taking into account the change in the baseline from 2020 to 2022, as set out on page 22. In combination across the 2024 AIP and PSP, the financial measures have been chosen to align our Executive Directors’ remuneration with our strategy to deliver sustainable above-market growth and attractive returns, while running a responsible business, which is integral to all that we do. Rewarding 2023 performance 2023 was a year of strong financial performance against a set of stretching targets. Organic revenue growth was achieved at 8.0% and adjusted operating profit growth was achieved at 10.4%. However, as these targets were set in a high inflation environment, when reviewing these outcomes the Committee carefully considered the impact of inflation experienced in several markets in the context of wider business performance in 2023. On this basis, the Committee considered it appropriate to apply discretion to the 2023 annual incentive plan (AIP) outcome which resulted in a reduction of c.10 ppts compared to the formulaic result. The overall outcome under the 2023 AIP was therefore 75.2% of the maximum opportunity for the CEO and 77.7% of maximum opportunity for the CFO. The Haleon PSP Refill awards granted in March 2023 vested in March 2024, by reference to the performance period ended on 31 December 2023. These awards vested at 81% of maximum, based on performance against the Cumulative free cash flow and net debt/adjusted EBITDA targets. The full details of the 2023 remuneration paid to Directors and the basis for its determination are set out on pages 84-88. 2024 remuneration structure There have been no changes to the Directors’ Remuneration Policy approved by shareholders at the 2023 AGM. For 2024, the AIP performance measures remain (subject to aligning names and definitions of measures to the Company’s financial KPIs) Organic revenue growth (60% weighting), Organic operating profit growth (20% weighting) and individual business objectives (IBOs) (20% weighting). Following review and due consideration, the Committee concluded that the balance of measures remains in line with the investment case for Haleon, in particular the weighting towards organic revenue growth, and so no changes were made to the AIP structure for 2024. The 2023 PSP performance measures included cumulative free cash flow (50%), net debt/adjusted EBITDA (50%) and ESG qualifier thresholds on carbon reduction, recycle-ready packaging and gender Directors’ Remuneration Report 80 Haleon Annual Report and Form 20-F 2023 Corporate Governance |
| I am very grateful for the support and valuable comments that we have received. The Committee will continue to ensure that the performance measures support our strategy, including the delivery of attractive returns. I remain available for any shareholders who wish to discuss our policy, or any of the content set out in this report, ahead of the 2024 AGM. in July 2022. This is in line with the average 4.5% increase awarded to UK employees. The base fees for Non-Executive Directors will also increase by 4.5%. Shareholder engagement In December 2023, I wrote to our largest shareholders regarding the changes we are making to the 2024 PSP performance measures and other aspects of the implementation of our Directors’ Remuneration Policy in 2024. >> Further information about the measures and targets linked to incentive awards is provided on pages 85-89. Having considered all relevant factors, including workforce remuneration arrangements, inflation rates and market practice, the Committee approved a 4.5% salary increase for the Executive Directors and a 4.5% fee increase for the Chair, the first pay increase awarded to the Executive Directors and the Chair since the demerger Committee activities Executive remuneration and incentive plans — Approving the 2023 AIP and PSP targets and the 2022 AIP outcome. — Considering updates on the 2023 AIP. — Approving the 2024 AIP and PSP measures and targets. — Approving 2023 and 2024 remuneration arrangements for the members of the Haleon Executive Team, including the Executive Directors, and the Company Secretary. — Noting regular market updates on executive remuneration, investors’ views and governance. Stakeholder engagement — Considering shareholder feedback on the 2022 Directors’ Remuneration Report and the outcomes of the 2023 AGM. — Considering and approving the 2023 shareholder engagement timeline and materials. — Discussing the workforce remuneration arrangements. Governance — Approving the final 2022 and 2023 Directors’ Remuneration Reports. — Noting updates on the operation of share plans. — Approving amendments to the malus and clawback policy. — Approving the 2023 schedule of business and noting risk management procedures for the Committee. — Approving appointment of the independent Committee advisers. — Considering and approving relevant documents, policies and delegated authorities to allow the Committee to effectively discharge its responsibilities. Key duties and responsibilities The Remuneration Committee’s principal responsibilities are: — Making recommendations to the Board on remuneration principles and policy as applied to Executive Directors. — Setting, reviewing and approving individual remuneration arrangements for the Chair of the Board, Executive Directors, senior leadership and the Company Secretary, and such other executives as required. — Designing remuneration policies and practices that support the Company’s strategy and promote its long-term sustainable success. — Ensuring that performance conditions are transparent, stretching and rigorously applied. — Enabling the use of discretion over outcomes and recovery and withholding of awards where the Committee deems this to be appropriate. — Making recommendations to the Board concerning the introduction of new share incentive plans which require Board or shareholder approval. — Reviewing employee remuneration and key related policies, and the alignment of incentives and rewards, with the Company’s culture and taking these into account when determining the policy for executive remuneration. Membership and meetings The Committee comprises solely Independent Non-Executive Directors. Details are set out on page 62 and 63, together with details of attendance for the year on page 67. The Chair, CEO, Chief Human Resources Officer, Global Head of Reward and a representative from the independent remuneration adviser (PwC) attend meetings on a regular basis. Other attendees are invited to meetings as appropriate. The Committee also meets without management present. No Directors or executives are present when their own remuneration is discussed and they are not involved in determining their own remuneration. >> Details of the Committee effectiveness review are set out on page 71. Corporate Governance Directors’ Remuneration Report Haleon Annual Report and Form 20-F 2023 81 |
| The current Directors’ Remuneration Policy (Policy) was approved at the 2023 AGM and is expected to apply until the 2026 AGM. The Committee is comfortable that the current Policy operated as intended during 2023 and that the overall 2023 remuneration paid to Directors as set out below and within the Annual Report on Remuneration, was appropriate. >> The complete Policy is available on the Company’s website: www.haleon.com/who-we-are/Governance/codes-policies-and-standards Summary of the application of the Directors’ Remuneration Policy in 2023 and 2024 Element 2023 2024 2025 2026 2027 2028 Application for 2023 Application for 2024 Base Salary 2023 base salaries: — CEO: £1,250,000 — CFO: £700,000 2024 base salaries: — CEO: £1,306,250 (+4.5%) — CFO: £731,500 (+4.5%) Benefits Benefits operate in line with the Policy Benefits will operate in line with the Policy Pension arrangements Employer contributions: — CEO: 7% of salary — CFO: 7% of salary No change Annual Incentive Plan (AIP) Deferral period Maximum AIP opportunities: — CEO: 200% of salary — CFO: 200% of salary 2023 performance measures: — 60% Organic revenue growth1 — 20% Adjusted operating profit — 20% IBOs 50% of any AIP earned is deferred for three years No change to AIP opportunities 2024 performance measures (no change): — 60% Organic revenue growth — 20% Organic operating profit growth — 20% IBOs 50% of any AIP earned is deferred for three years Performance Share Plan (PSP) Vesting period Holding period 2023 PSP award levels: — CEO: 450% of salary — CFO: 350% of salary 2023 performance measures: — 50% Cumulative free cash flow — 50% Net debt/adjusted EBITDA — ESG qualifier No change to PSP award levels 2024 performance measures: — 50% Cumulative free cash flow — 30% Adjusted diluted EPS growth — 20% Organic operating margin improvement — ESG qualifier Share ownership requirements Share ownership requirements: — CEO: 450% of salary — CFO: 350% of salary No change 1 Organic revenue growth was referred to as ‘organic sales growth’ in the 2022 Directors’ Remuneration Report. This measure has not changed, however, the name has been aligned with the strategic KPI for ease of reference. Malus and clawback The Committee may apply malus and clawback at any time prior to the second anniversary of the date the cash element of an annual bonus is paid, or a share award vests. The Committee may only invoke these malus and clawback provisions in accordance with the Haleon malus and clawback policy from time to time, in circumstances such as a material misstatement of results; a failure of risk management resulting in material financial loss; an error or material misstatement which results in an overpayment (such as in the assessment of performance); a corporate failure of the Company; employee misconduct; or material reputational damage to the Company. In addition, on 1 December 2023, the Company adopted a mandatory clawback policy that complies with the SEC requirements introduced during the year. Remuneration at a glance Directors’ Remuneration Report continued 82 Haleon Annual Report and Form 20-F 2023 Corporate Governance |
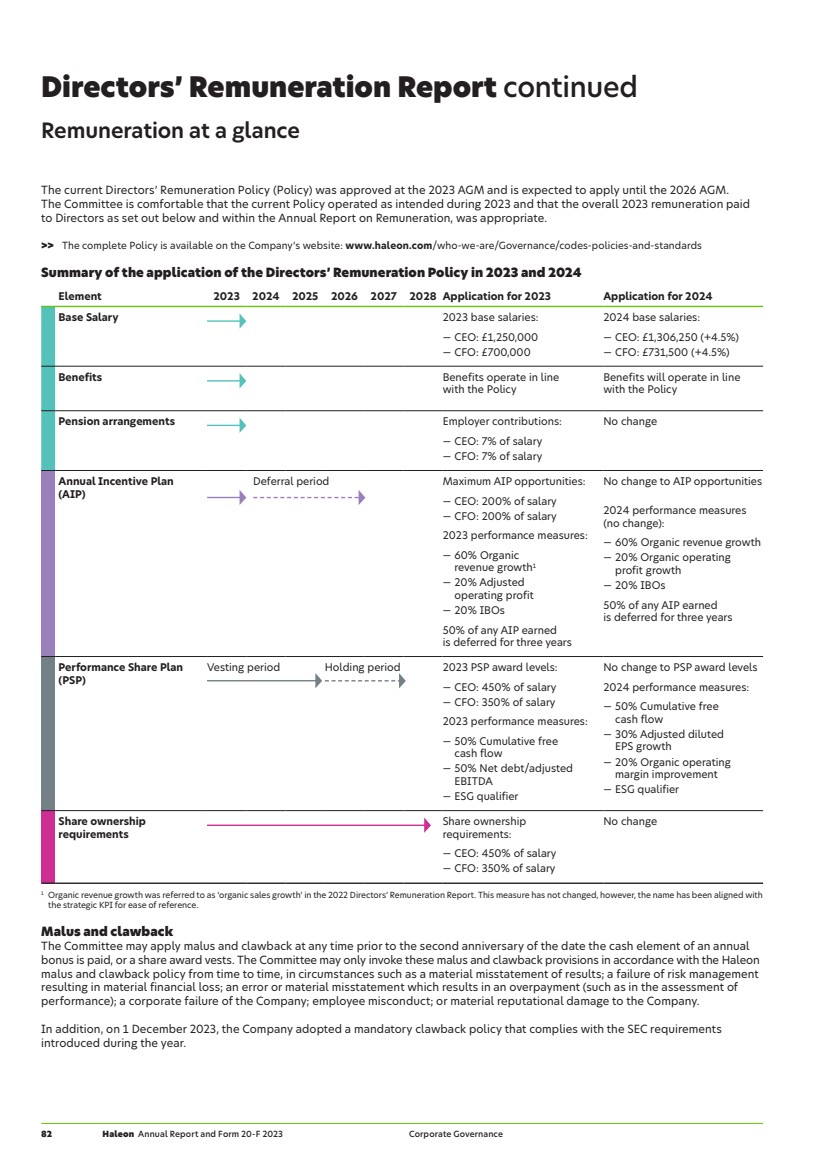
| Minimum 100% £1,509,000 24% 16% 26% 20% 26% 33% 56% 58% 41% £6,274,000 £9,634,000 £5,763,000 Target Maximum Actual 2023 CEO Fixed pay AIP PSP CFO Minimum 100% £794,000 26% 17% 39% 23% 30% 53% 51% 53% 8% £3,025,000 £4,644,000 £2,046,000 Target Maximum Actual 2023 CEO 75.2% CFO 77.7% CEO 81% CFO 81% 2023 remuneration scenarios and actual remuneration received The charts below show the potential levels of remuneration which could be received by the Executive Directors under different performance scenarios based on the levels of regular AIP and PSP awards granted in the year, as well as actual remuneration received in respect of 2023 including vesting of the PSP Refill awards. What performance means for Executive Directors’ pay in 2023 At Haleon, remuneration packages are designed to ensure strong alignment between pay and performance. 2023 saw the Company perform strongly against its financial and strategic objectives which has been appropriately reflected in the incentive outcomes, as set out in the Annual Report on Remuneration from page 84. 2023 AIP outcome Following a year of strong performance, the formulaic AIP outcomes were 85.1% of maximum (CEO) and 87.6% of maximum (CFO). However, in line with the Committee’s discretion, the outcome was reduced by c.10 ppts to reflect higher than expected inflation experienced in several markets. 2023 PSP Refill awards The PSP Refill awards vested at 81% of maximum, in line with performance against the cumulative free cash flow and net debt/ adjusted EBITDA targets, combined with considerable progress on responsible business objectives. Link between incentive measures and strategy There is a strong link between Haleon’s performance measures and the Company’s strategy. A combination of financial and non-financial measures has been chosen to ensure that executive remuneration is aligned with the key performance indicators (KPIs) used by the business to monitor performance against our strategic priorities. The table below sets out the incentive measures and weightings used in 2023: Strategic KPI (as shown on pages 32-33 of this report) AIP measures PSP measures Organic revenue growth Organic revenue growth (60% weighting) Adjusted operating profit Adjusted operating profit (20% weighting) Net debt to adjusted EBITDA Net debt/adjusted EBITDA (50% weighting) Free cash flow Cumulative free cash flow (50% weighting) Carbon reduction Carbon reduction (ESG qualifier) Recycle-ready packaging Recycle-ready packaging (ESG qualifier) Gender diversity Gender diversity (ESG qualifier) Further details of the performance measures for the 2023 AIP and PSP awards, and how they are aligned with Company strategy and the creation of shareholder value, are set out on pages 85-88 of this Directors’ Remuneration Report. 2024 AIP and PSP performance measures aligned with the 2024 strategic KPIs are set out on pages 87 and 89 of this Directors’ Remuneration Report. Corporate Governance Directors’ Remuneration Report Haleon Annual Report and Form 20-F 2023 83 |
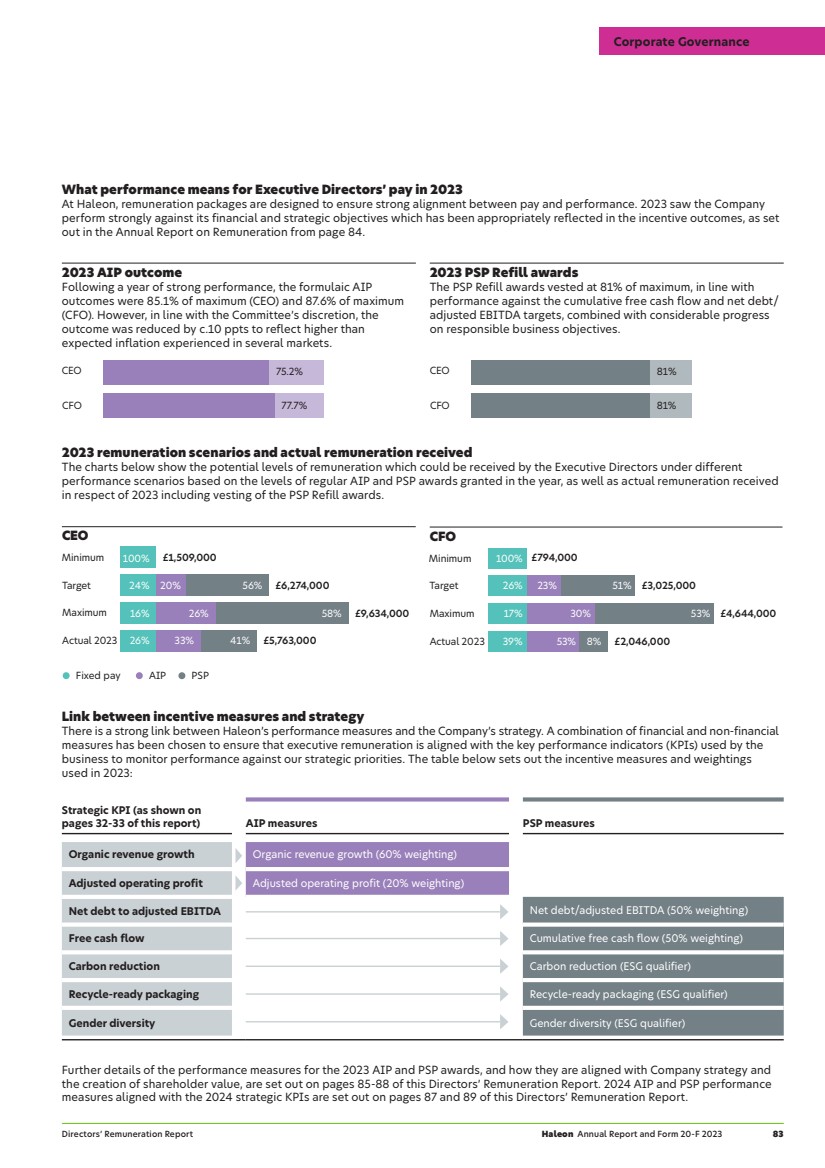
| Directors’ Remuneration Report continued Annual Report on Remuneration Planned implementation for 2024 Content within a box indicates that all the information in the panel is planned for implementation in 2024. ‘Single figure’ of remuneration – Executive Directors The following table shows a single total figure of remuneration for each Executive Director in respect of qualifying services for the 2023 and 2022 financial years. £000 Brian McNamara 2023 Brian McNamara 20223,4 Tobias Hestler 2023 Tobias Hestler 20223 Salary 1,250 719 700 410 Benefits 171 4745 45 35 Pension 88 87 49 36 Total fixed remuneration 1,509 1,280 794 481 AIP1 1,880 1,014 1,088 518 PSP2 2,374 — 164 — Total variable remuneration 4,254 1,014 1,252 518 Total remuneration6 5,763 2,294 2,046 999 1 The value of the 2023 AIP includes both the cash (50% of the AIP) and deferred portion (50% of the AIP). The deferred part of the bonus is subject to malus and clawback in accordance with the malus and clawback policies, but no further performance conditions. 2 2023 PSP vesting shows the PSP Refill awards which vested in March 2024. The value of awards has been calculated based on the average share and ADS price over the last three months of 2023 (£3.2887/$8.2421) and includes the accumulated dividends delivered in the form of shares. The actual value of vesting PSP Refill awards, based on the share price on the vesting date could not be calculated prior to the publication of this Report and therefore will be shown in the 2024 Report. Due to the share price appreciation over the vesting period, the estimated value per share of the 2023 PSP Refill awards is higher than the value per share at grant by $50,156 (£40,448) for Brian McNamara and by £2,900 for Tobias Hestler. The value of the 2023 PSP Refill award for Brian McNamara has been converted to GBP using the average 2023 exchange rate of 1.24. There were no Haleon PSP awards vesting in 2022. 3 2022 remuneration is shown for the period between Directors’ appointment (23 May 2022) and the end of the financial year (31 December 2022). 4 Pre-demerger remuneration for Brian McNamara was set in US Dollars and has been converted to GBP in the table above, using the average 2022 exchange rate of 1.24. 5 The value of 2022 benefits for Brian McNamara has been restated to show the actual cost of tax equalisation arrangements provided in line with the GSK plc policy, as set out in the 2022 Directors’ Remuneration Report. The total reduction in this value was £55,780. 6 Each remuneration element is rounded to the nearest £1,000, and totals reflect the sum of these rounded values. Salary Executive Directors received no salary increases in 2023. Executive Director Annual base salary as of 1 January 2023 Annual base salary as of 1 April 2023 Brian McNamara £1,250,000 £1,250,000 Tobias Hestler £700,000 £700,000 2024 salaries The Committee carefully considered whether any increases should be awarded to Executive Directors’ salaries in 2024. Factors that have been taken into account when considering Directors’ pay included investors’ expectations, external environment, Company performance, planned salary increases for the wider employee population, personal performance of the executives and competitive market positioning of the total remuneration packages against the main peer groups. In 2023 these peer groups included constituents of the FTSE 30 (excluding financial services) and a bespoke group of large international FMCG companies1. The Committee noted that Executive Directors’ salaries had not been reviewed since the demerger. Based on the considerations set out above, the Committee approved a 2024 salary increase of 4.5% for the Executive Directors, in line with the average increase which will be awarded to the wider UK workforce. Executive Director Annual base salary from 1 April 2024 % increase Brian McNamara £1,306,250 4.5 Tobias Hestler £731,500 4.5 1 In 2023 this group included Diageo, AstraZeneca, GSK, British American Tobacco, Vodafone Group, Imperial Brands, Danone S.A., Heineken N.V., Burberry Group, Associated British Foods, L’Oréal S.A., Pernod Ricard SA, Sanofi and Siemens Healthineers AG. Benefits 2023 benefits for Executive Directors included private healthcare (including spouse or partner and eligible dependent children), life assurance/death in service benefit, membership of a Group Income Protection plan (including self-insured, where appropriate, in line with standard policy), personal tax and financial planning, car travel, reimbursement of expenses properly incurred in the ordinary course of business, which are deemed to be taxable benefits, and (for the CEO only) home security services. Executive Directors are eligible to participate in the HM Revenue and Customs (HMRC) approved Haleon Share Save Plan and Share Reward Plan. Details of Executive Directors’ rights under the Share Save Plan are set out in the ‘Outstanding share options’ table on page 95. 84 Haleon Annual Report and Form 20-F 2023 Corporate Governance |
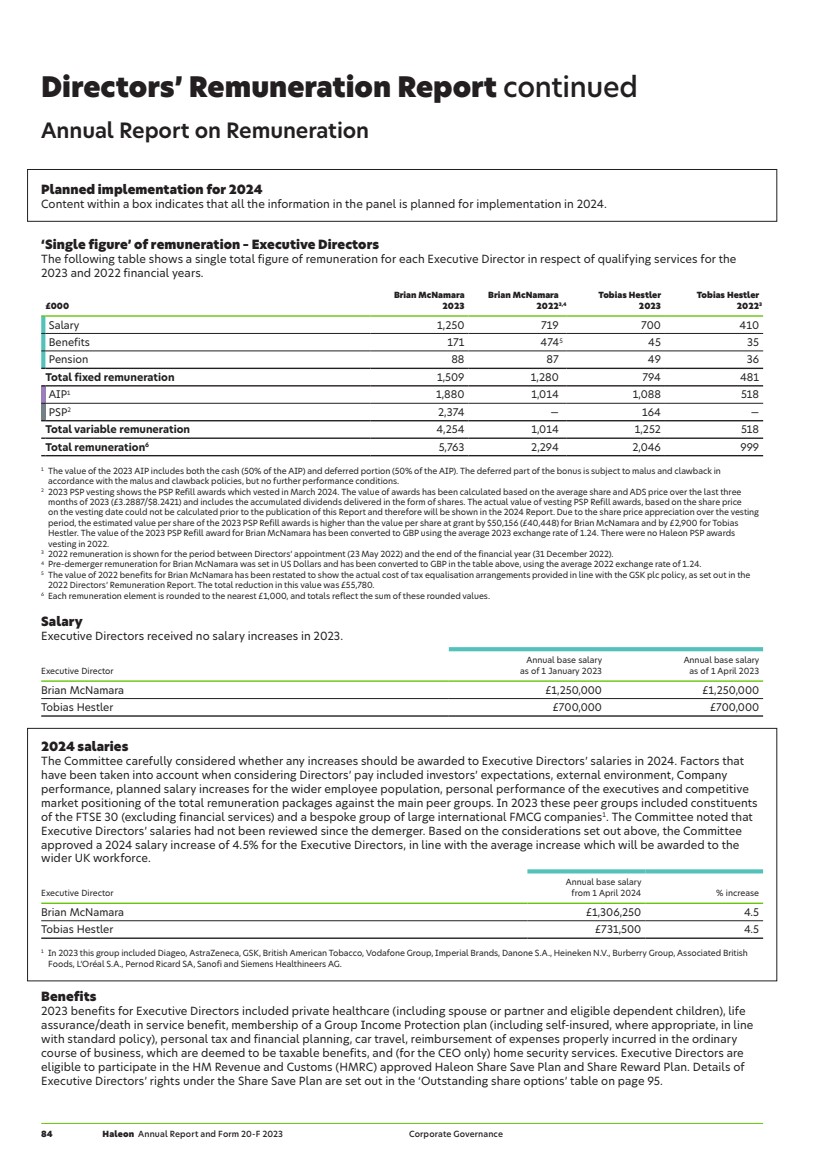
| 2024 benefits Benefits for 2024 remain in line with the Policy. Pension Both Executive Directors receive pension contributions at the rate of 7% of annual base salary which includes contributions to the pension plan as well as cash allowances. Executive Directors do not participate in defined benefit pension plans. Executive Director Pension plan contributions Pension allowance Total 2023 pension contributions Brian McNamara £0 £87,500 £87,500 Tobias Hestler £5,333 £43,667 £49,000 2024 Pension Pension for 2024 remains in line with the Policy. Approach to pension arrangements for Executive Directors is in line with the broader workforce. 2023 Annual Incentive Plan (AIP) awards The 2023 AIP awards were based on performance for the year ended 31 December 2023. 80% of the bonus opportunity is determined by financial performance and 20% is based upon the achievement of IBOs. The figures below represent the total 2023 AIP awards to be paid, including the portion payable in cash in 2024, and the portion deferred into shares for a further three years to be released in 2027, subject to continued employment and malus and clawback provisions. In line with the Policy, deferral provisions apply to 50% of the 2023 AIP value. 2023 AIP targets 2023 AIP outcome AIP outcome (% of max per element) Performance measures Weighting Threshold (25% of max) Target (50% of max) Maximum (100% of max) Actual Outcome (% of max) Brian McNamara Tobias Hestler Organic revenue growth 60% 3.3% 5.3% 7.3% 6.8% 88.5% 53.1% 53.1% Adjusted operating profit 20% 3.4% 7.4% 11.4% 9.2% 73.0% 14.6% 14.6% IBOs – Brian McNamara 20% Details of performance are set out on page 86. 7.5% — IBOs – Tobias Hestler — 10.0% AIP award (% of maximum) 75.2% 77.7% AIP award (value) £1,880,000 £1,087,800 The colour bars represent the actual outcome. 2023 was a year of strong financial performance. The 2023 AIP was subject to a set of ambitious targets which were defined at the beginning of the year, in line with our stretching business plan. The outcomes were at the upper end of the improved guidance provided by the Company at Half Year. Organic revenue growth was achieved at 8.0%, and adjusted operating profit growth was achieved at 10.4% (this compares to the reported organic operating profit growth of 10.8% for 2023; from 2024, the AIP measure will be aligned with the organic operating profit growth). Given that targets were set in a high inflation environment, the Committee considered whether the incentive outcome fairly reflects the underlying business performance. This analysis included determining the level of impact of higher-than-expected inflation experienced in several markets on the outcome of the 2023 AIP. Having discussed this impact, the Committee considered it appropriate to apply discretion to the 2023 AIP outcome which resulted in a reduction to the organic sales growth outcome from 8.0% to 6.8% and the adjusted operating profit from 10.4% to 9.2% to reflect the high inflationary impact. This has reduced the outcome of the 2023 AIP for the Executive Directors by c. 10 percentage points, from 85.1% of maximum for the CEO and 87.6% of maximum for the CFO to 75.2% of maximum for the CEO and 77.7% of maximum for the CFO respectively. Corporate Governance Directors’ Remuneration Report Haleon Annual Report and Form 20-F 2023 85 |
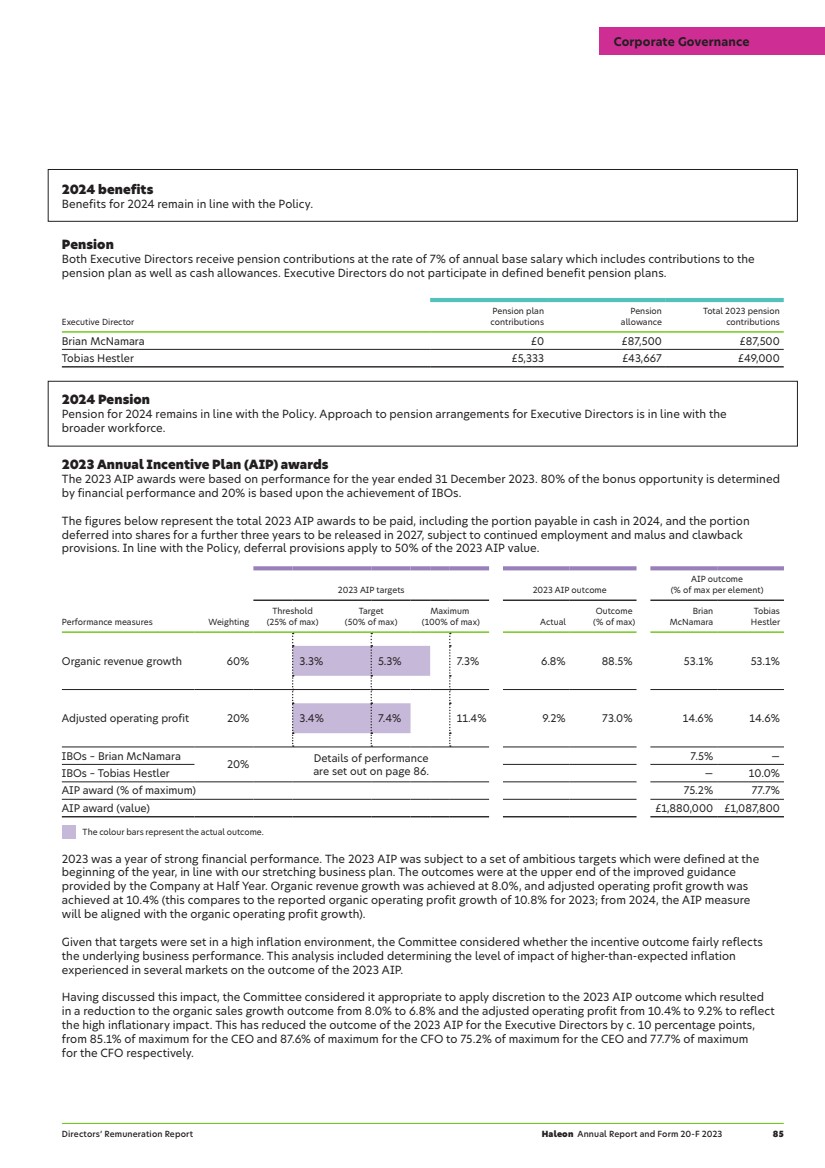
| Directors’ Remuneration Report continued Annual Report on Remuneration continued Achievement of 2023 Individual Business Objectives (IBOs) 20% of the Executive Directors’ 2023 AIP is linked to the achievement of IBOs which were focused on key strategic objectives. In addition to the objectives outlined in the bonus, there is an expectation that the Executive Directors will each demonstrate the required high leadership standards and behaviours of the Company. At the end of the year, the Committee considered the performance of each Executive Director against pre-set objectives. At its meeting in February 2024, it concluded that 2023 had seen progress in the achievement of our strategic objectives, as described in the Strategic Report. This has been reflected in the assessment of the Executive Directors’ 2023 IBOs, showing their contribution to the execution of Group strategy during 2023. IBOs are calibrated with a high degree of stretch in them such that outcomes above target are only achieved for exceptional performance over the performance period. The table below summarises performance against the key 2023 IBOs for the current Executive Directors: Brian McNamara Objective Description of performance Portfolio Review Carry out a category portfolio review and commence implementation – Review of category brand portfolio to align with Haleon’s strategic priorities. – Divested Lamisil successfully with agreement to divest Chapstick. – Evaluation of other M&A opportunities. Culture Develop the blueprint for Haleon cultural development and deliver the streamlined organisation objective – Culture plans devised and implementation started with further stages to be completed in 2024. – Changes implemented amongst others, include cascade of leadership standards through the organisation, update of talent review processes, installation of employee health and wellbeing working groups, review of the compensation and benefits policies. Growth strategy Define growth strategy for key markets to deliver accelerated growth – Long term strategy further developed for key markets to accelerate our growth momentum. – A number of strategic initiatives have been deployed, with further implementation steps to be completed in 2024. Recognising Mr McNamara’s performance against his IBOs during 2023, the Committee judged that 7.5% of a maximum of 20% attributable to IBOs was appropriate to reflect the progress made against the stretching objectives set. Tobias Hestler Objective Description of performance Productivity Build a 3-year productivity plan – Productivity programme successfully set-up and in execution, in line with the Board-approved 3-year plan. – Savings goal fully embedded into operational plans across all business units. – 2023 project milestones and targets have been delivered in line with expectations. Review of strategy in key markets – Review completed and aligned with the Board. – Kicked-off execution delivering a detailed project plan, and engagement strategy. Portfolio Review Carry out a category portfolio review and commence implementation – Review of category brand portfolio to align with Haleon’s strategic priorities. – Divested Lamisil successfully with binding agreement to divest Chapstick through a combination of cash and passive minority structure allowing Haleon to participate in further value creation of the brand. – Evaluation of other M&A opportunities. Recognising Mr Hestler’s performance against his IBOs during 2023, the Committee judged that 10% of a maximum of 20% attributable to IBOs was appropriate to reflect the progress made against the stretching objectives set. 86 Haleon Annual Report and Form 20-F 2023 Corporate Governance |
| Deferral policy for the 2023 AIP In line with the Policy, 50% of the 2023 AIP awards (to be paid in March 2024) have been deferred for three years into conditional awards over Haleon shares, subject to continued employment and malus and clawback provisions. Deferred Annual Bonus Plan (DABP) awards in respect of the 2022 AIP made in 2023 The following table sets out details of mandatory deferral into the DABP of the 2022 AIP awards made on 23 March 2023: Executive Director Type of award Nature of award Number of shares subject to award Grant price1 Face value at grant Brian McNamara DABP Conditional shares 127,512 £3.23 £411,865 Tobias Hestler DABP Conditional shares 70,995 £3.23 £229,314 1 Grant price is calculated as the average closing share price over the three business days immediately preceding the grant date. 2024 AIP awards In line with the Policy, for 2024 the target and maximum AIP opportunities for our Executive Directors will be: Executive Director Target opportunity (% of salary) Maximum opportunity (% of salary) Brian McNamara 100% 200% Tobias Hestler 100% 200% Performance will be based on Group financial performance targets aligned to the Group’s KPIs, as well as IBOs. The measures and percentage weightings will remain unchanged from 2023, with names and definitions updated to align with the strategic KPIs: — Organic revenue growth (60%); — Organic operating profit growth (20%); and — Individual Business Objectives (20%). 2024 AIP targets are considered commercially sensitive and will be disclosed in the 2024 Annual Report. In line with the Policy, 50% of all 2024 AIP awards will be deferred for three years into conditional awards over Haleon shares, subject to continued employment, malus and clawback provisions. Performance Share Plan Refill awards vesting As set out in our 2022 Report, ‘Refill’ share awards were granted to the Executive Directors (as well as other former GSK employees) in respect of the lapsed portion of GSK share awards that were time pro-rated at demerger. PSP Refill awards were granted on 23 March 2023 and vested on 1 March 2024. The performance measures for the PSP Refill awards were aligned with the measures for the annual 2022 PSP awards, being cumulative free cash flow (50%) and net debt/adjusted EBITDA (50%). The targets were aligned with those used for the 2022 award and were calibrated to reflect the shorter performance period. Target ranges Outcome Performance measures Weighting Minimum (25% vesting)1 Maximum (100% vesting)1 Actual outcome Level of vesting Cumulative free cash flow (Measured on a cumulative basis over the performance period FY 22-23) 50% £2,905m £3,543m 3,443m 88% Net debt/adjusted EBITDA (Measured as a ratio at year end 2023) 50% 3.4x 2.8x 3.0x 74% Overall vesting level (% of maximum) 81% The colour bars represent the actual outcome. 1 Straight-line interpolation is applied for performance between minimum and maximum. Corporate Governance Directors’ Remuneration Report Haleon Annual Report and Form 20-F 2023 87 |
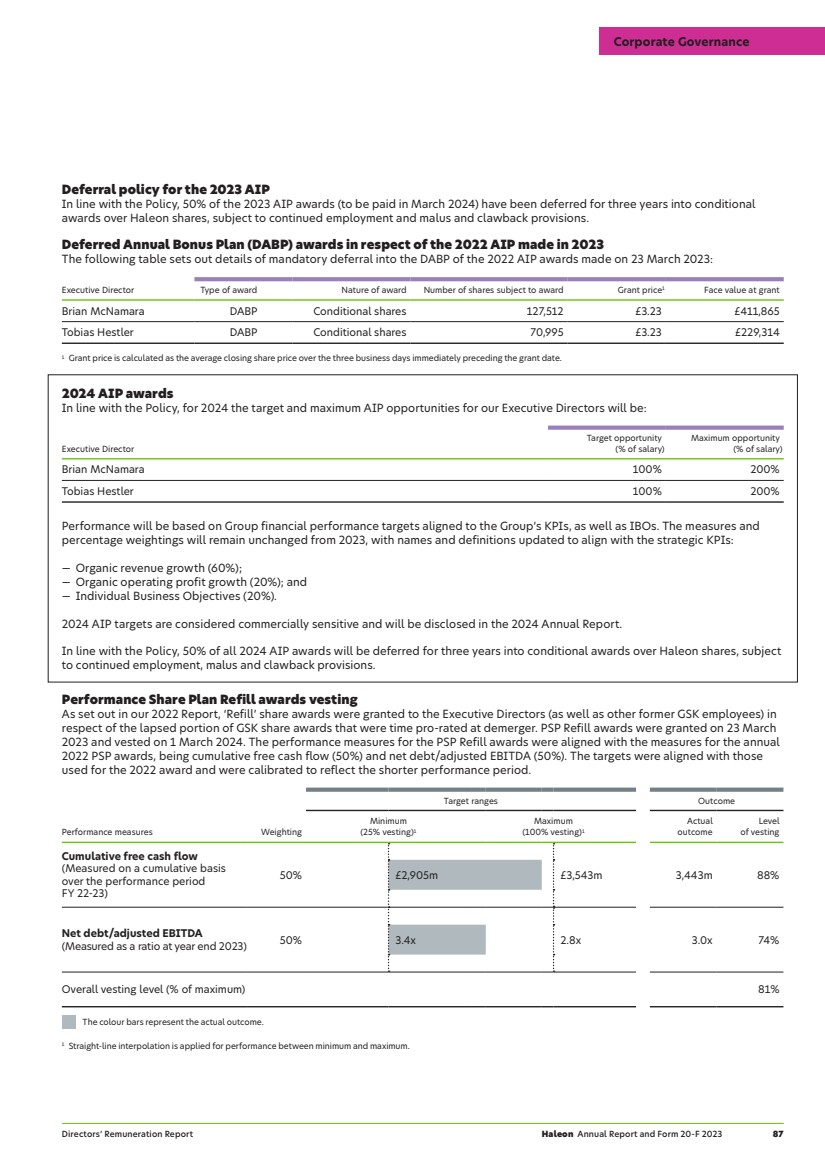
| Directors’ Remuneration Report continued Annual Report on Remuneration continued The Committee also considered progress made during 2023 on carbon reduction, recycle-ready packaging and gender diversity when determining the vesting outcome. Based on the considerable progress on responsible business objectives shown in 2023, no reduction was applied to the level of vesting shown below. Executive Director Number of shares awarded Type of award Percentage of the PSP Refill award vesting Number of shares vesting Value of shares vesting2 Brian McNamara 434,906 ADS1 81% 357,197 £2,374,237 Tobias Hestler 60,878 Ordinary shares 81% 50,011 £164,471 1 Each ADS represents two ordinary shares. 2 The value of the 2023 PSP Refill award at vesting for Brian McNamara has been converted to GBP using the average 2023 exchange rate of 1.24. Due to the share price appreciation over the vesting period, the estimated value per share of the 2023 PSP Refill awards is higher than the value per share at grant by $50,156 (£40,448) for Brian McNamara and by £2,900 for Tobias Hestler. Performance Share Plan awards made in 2023 Brian McNamara and Tobias Hestler were granted awards with a face value of 450% of salary and 350% of salary respectively. The following table sets out details of awards made on 23 March 2023: Executive Director End of the performance period Type of award Nature of award Number of shares subject to award Grant price1 Face value at grant Brian McNamara 31 December 2025 PSP Conditional shares 1,741,487 £3.23 £5,625,000 Tobias Hestler 31 December 2025 PSP Conditional shares 758,514 £3.23 £2,450,000 1 Grant price is calculated as the average closing share price over the three business days immediately preceding the grant date. Performance measures for the PSP awards granted in 2023 Target ranges Measure Weighting Minimum (25% vesting)1 Maximum (100% vesting)1 Cumulative free cash flow (Measured on a cumulative basis over the performance period FY 23-25) 50% £4.520bn £5.520bn Net debt/adjusted EBITDA (Measured as a ratio at year end 2025) 50% 2.7x 2.3x 1 Straight-line interpolation is applied for performance between minimum and maximum. An ESG qualifier is also included within the 2023 PSP design, to reflect commitments that the Company has made on carbon reduction, recycle-ready packaging and gender diversity. In designing the ESG qualifier, the Committee has set thresholds for each of the three measures and, at the end of the performance period, if any of the thresholds are missed, a reduction in the level of vesting of 10% could be applied for each missed threshold. In addition, if the metrics are static or go backwards compared to the 2022 baseline, a 25% reduction in the level of vesting could be applied for each measure (i.e., a potential overall reduction of up to 75%). The ESG qualifier thresholds for the 2023 PSP are as follows: Measure Threshold Carbon reduction (Measured for 12 months to November 2025) At least 48% reduction in Scope 1 and 2 carbon emissions from the 2020 level. Recycle-ready packaging (Measured for 12 months to June 2025) At least 80% of packaging should be recycle-ready. Diversity (Quarterly average in 2025) At least 45% of leadership roles should be held by women. In determining the vesting levels and any adjustment which should apply, the Committee will also consider wider factors, including whether broader plans to meet Haleon’s responsible business commitments are on track. 88 Haleon Annual Report and Form 20-F 2023 Corporate Governance |
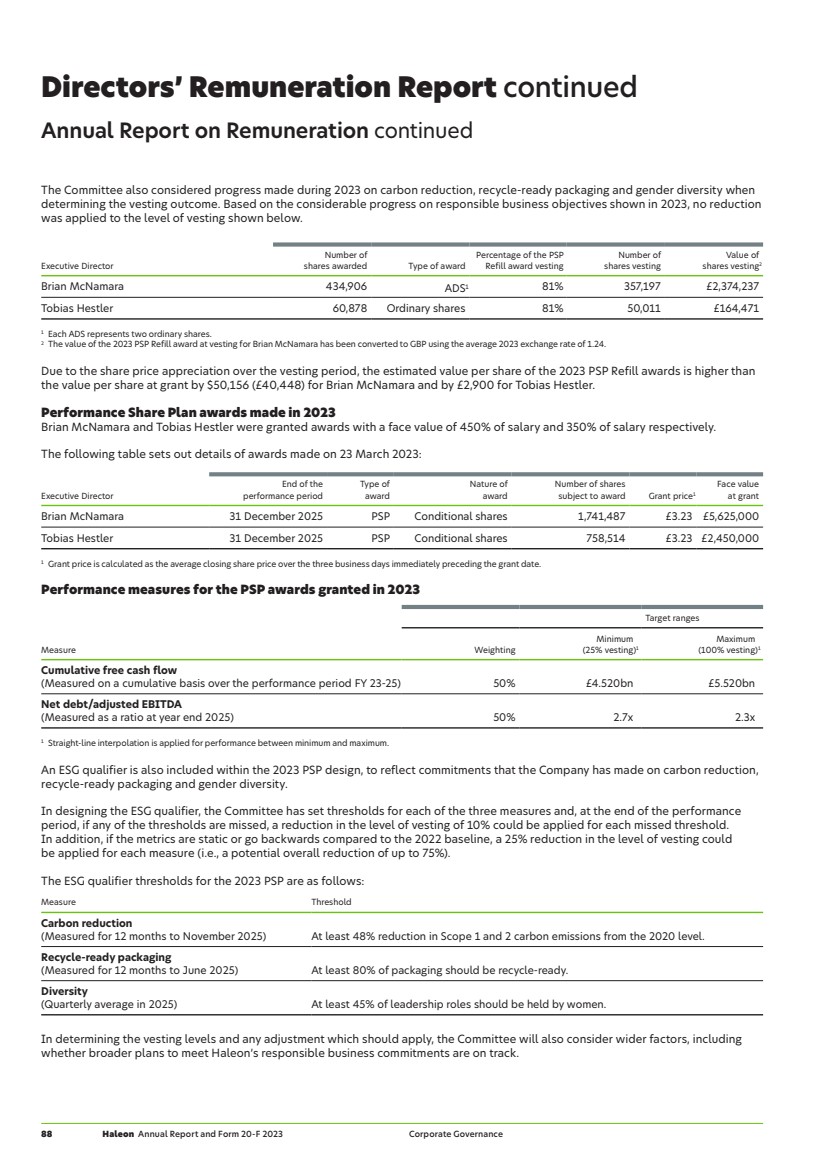
| Performance Share Plan awards to be made in 2024 Brian McNamara and Tobias Hestler will be granted awards with a face value of 450% of salary and 350% of salary respectively. Performance measures for the 2024 PSP awards The 2023 PSP performance measures included cumulative free cash flow (50%), net debt/adjusted EBITDA (50%) and the ESG qualifier threshold on carbon reduction, recycle-ready packaging and gender diversity in leadership roles. As the business is getting closer to reaching its initial deleveraging target (below 3.0x net debt/adjusted EBITDA), to ensure that the performance measures continue to support the most critical strategic objectives, for the 2024-2026 performance cycle the net debt/adjusted EBITDA measure (50% weighting) will be replaced with a combination of two alternative measures, adjusted diluted earnings per share growth (EPS) (30% weighting) and organic operating margin improvement (operating margin) (20% weighting). This change in financial metrics does not signal a change in strategy, which remains consistent. EPS will be aligned with the headline adjusted diluted EPS metric disclosed in the Annual Report and will be measured as compound growth over the performance period at constant currency (i.e., cumulative growth calculated each year on an organic basis, at constant currency and removing the impact of acquisitions and divestments). It is expected that one-off events, such as M&A, which were not anticipated at the time of target setting, will be excluded from the calculation in the year when the event occurred. In addition, the impact of any share buybacks will be considered by the Remuneration Committee on a case-by-case basis. Operating margin targets will be expressed as a cumulative basis points (bps) improvement and measured at constant currency. This measure is derived from organic revenue growth and organic profit growth and as such, excludes the impact of acquisitions, divestments, closures of brands, and the impact of translational currency exchange movements. It will be based on margin improvement over the performance period (i.e., cumulative improvement calculated each year on an organic basis). The 50% weighting on cumulative free cash flow will remain for 2024 as it continues as a strategic priority to drive financial discipline. The generation of stable cash flow is a critical part of how value is created for our shareholders, including our ability to deliver returns. Target ranges Measure Weighting Minimum (25% vesting)1 Maximum (100% vesting)1 Cumulative free cash flow (Measured on a cumulative basis over the performance period FY 24-26) 50% £5.310bn £6.490bn Adjusted diluted EPS growth (Measured as % growth on a cumulative basis over three years) 30% 6% p.a. 10% p.a. Organic operating margin improvement (Measured as bps improvement on a cumulative basis over three years) 20% +100 bps +270 bps 1 Straight-line interpolation is applied for performance between minimum and maximum. The Committee reviews the mix of measures in incentives on an annual basis and will continue to consider whether the performance measures remain aligned with our strategic priorities. An ESG qualifier is also included within the 2024 PSP design, to reflect commitments that the Company has made on carbon reduction, the use of plastic and gender diversity. The operation of the qualifier is unchanged from 2023, such that at the end of the performance period, if any of the thresholds are missed, a reduction in the level of vesting of 10% could be applied for each missed threshold. In addition, if the metrics are static or go backwards compared to the 2023 baseline, a 25% reduction in the level of vesting could be applied for each measure (i.e., a potential overall reduction of up to 75%). The carbon reduction and gender diversity ESG thresholds were retained in the 2024-2026 measures. The external commitment on recycle-ready packaging runs to 2025, and therefore this metric will be replaced by a metric assessing the reduction in virgin petroleum-based packaging as part of the ESG qualifier for the 2024-2026 cycle, in line with Haleon’s commitment to reduce the use of virgin petroleum-based plastic. The threshold was set taking into account the change in the baseline year from 2020 to 2022, as the 2022 data used to calculate our packaging footprint has greater availability and accuracy. More detail can be found on page 22. The ESG qualifier thresholds for the 2024 PSP are as follows: Measure Threshold Carbon reduction (Measured for 12 months to November 2026) At least 55% reduction in Scope 1 and 2 carbon emissions from the 2020 level. Reduction in virgin petroleum-based packaging (Measured for 12 months to June 2026) At least 12% reduction from the 2022 level. Diversity (Quarterly average in 2026) At least 46% of leadership roles should be held by women. In determining the vesting levels and any adjustment which should apply, the Committee will also consider wider factors, including whether broader plans to meet Haleon’s responsible business commitments are on track. Corporate Governance Directors’ Remuneration Report Haleon Annual Report and Form 20-F 2023 89 |
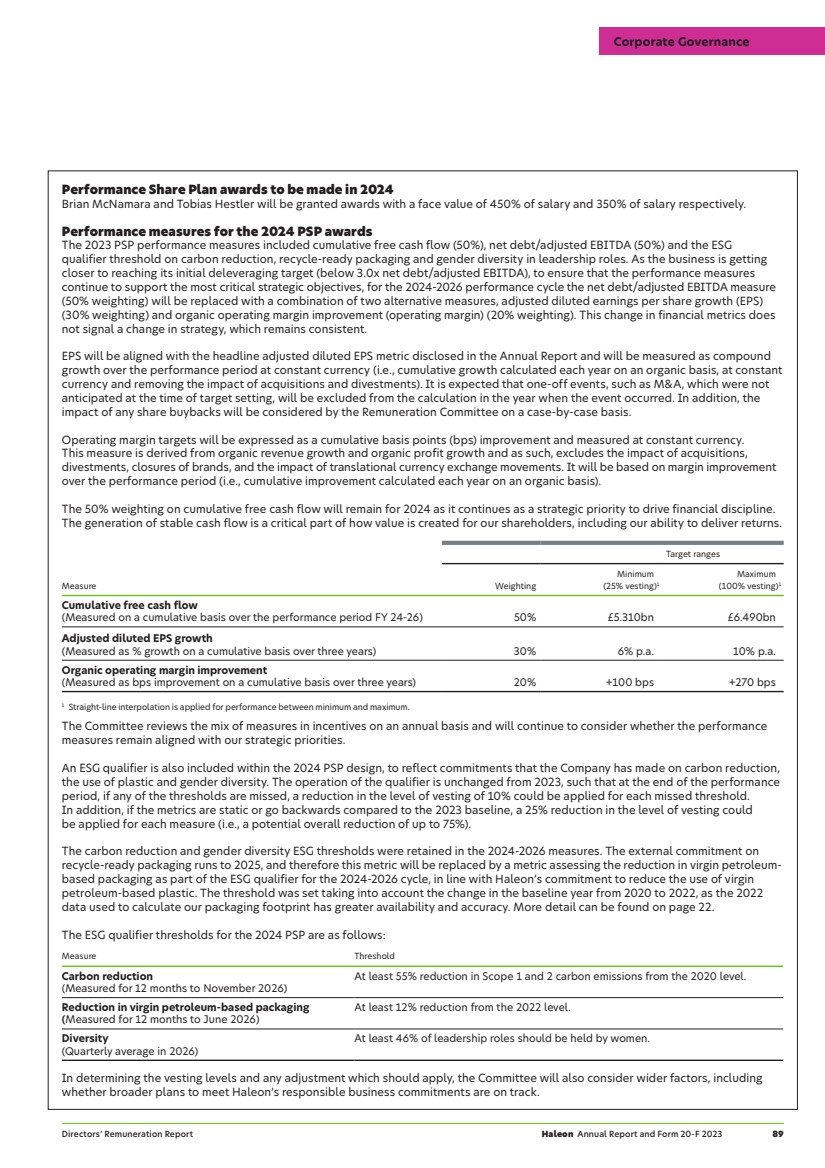
| Directors’ Remuneration Report continued Annual Report on Remuneration continued Principles addressed when determining the remuneration outcomes for Executive Directors When determining the remuneration outcomes, the Committee had regard to a number of key principles: clarity and simplicity of the incentive structure (remuneration aligned with market practice, consisting of a single short-term incentive and long-term incentive), avoiding payment for failure (a range of design features take into account risk, including malus and clawback provisions), proportionality (rewarding performance against stretching targets), and acting in line with our purpose and culture when setting remuneration. The full description of how our Policy aligns with these principles is set out on page 86 of the 2022 Annual Report, available on the website at www.haleon.com. In addition, when determining incentive outcomes, the Committee may use its discretion to ensure that a fair and balanced outcome is achieved, taking into account the overall performance of the Company, including all relevant external factors and the experience of shareholders. Any use of discretion would be explained in the Directors’ Remuneration Report and may, as appropriate, be the subject of consultation with the Company’s major shareholders. Payments for loss of office and to past Directors There were no payments to Directors for loss of office and no payments to past Directors during 2023. Total shareholder return (TSR) The chart shows the monthly value, from the time of demerger to 31 December 2023, of a notional sum of £100 invested in Haleon shares on 18 July 2022, compared to £100 invested in the FTSE 100 on the same date. The FTSE 100 Index was chosen as the comparator because the Company is a constituent of this index. To provide shareholders with additional context, the chart also shows a bespoke group of large international FMCG companies used for remuneration benchmarking: Diageo, AstraZeneca, GSK, British American Tobacco, Vodafone Group, Imperial Brands, Danone S.A., Heineken N.V., Burberry Group, Associated British Foods, L’Oréal S.A., Pernod Ricard SA, Sanofi and Siemens Healthineers AG. Jul 2022 Jul 2023 Jun 2023 May 2023 Apr 2023 Mar 2023 Feb 2023 Jan 2023 Aug 2022 Aug 2023 Sep 2022 Sep 2023 Oct 2022 Oct 2023 Nov 2022 Nov 2023 Dec 2023 Dec 2022 70 80 90 100 110 120 Total shareholder return Haleon FTSE 100 Large international FMCG companies Chief Executive Officer – historical remuneration information The table below shows the remuneration of the Chief Executive Officer in place at the time over the same period. Year 2022 2023 Chief Executive Officer Brian McNamara Brian McNamara Single figure of total remuneration (£’000)1 2,294 5,763 AIP outcome (% of maximum)2 72% 75% PSP vesting (% of maximum)3 n/a 81% 1 Pre-demerger remuneration for Brian McNamara was set in US Dollars and has been converted to GBP in the table above, using the average 2022 exchange rate of 1.24. 2 2022 AIP value has been pro-rated for the period between Director’s appointment (23 May 2022) and the end of the financial year (31 December 2022). 3 There were no PSP awards vesting in 2022. Relative importance of spend on pay The table below sets out the amounts payable in respect of 2022 and 2023 on all-employee pay and dividends: Year 2022 2023 Total staff costs1 £1,835m £2,149m Dividends2 £11,930m £388m 1 Total staff costs are presented in line with Note 7 to the Financial Statements. 2 Dividends are presented in line with Note 10 to the Financial Statements. 90 Haleon Annual Report and Form 20-F 2023 Corporate Governance |
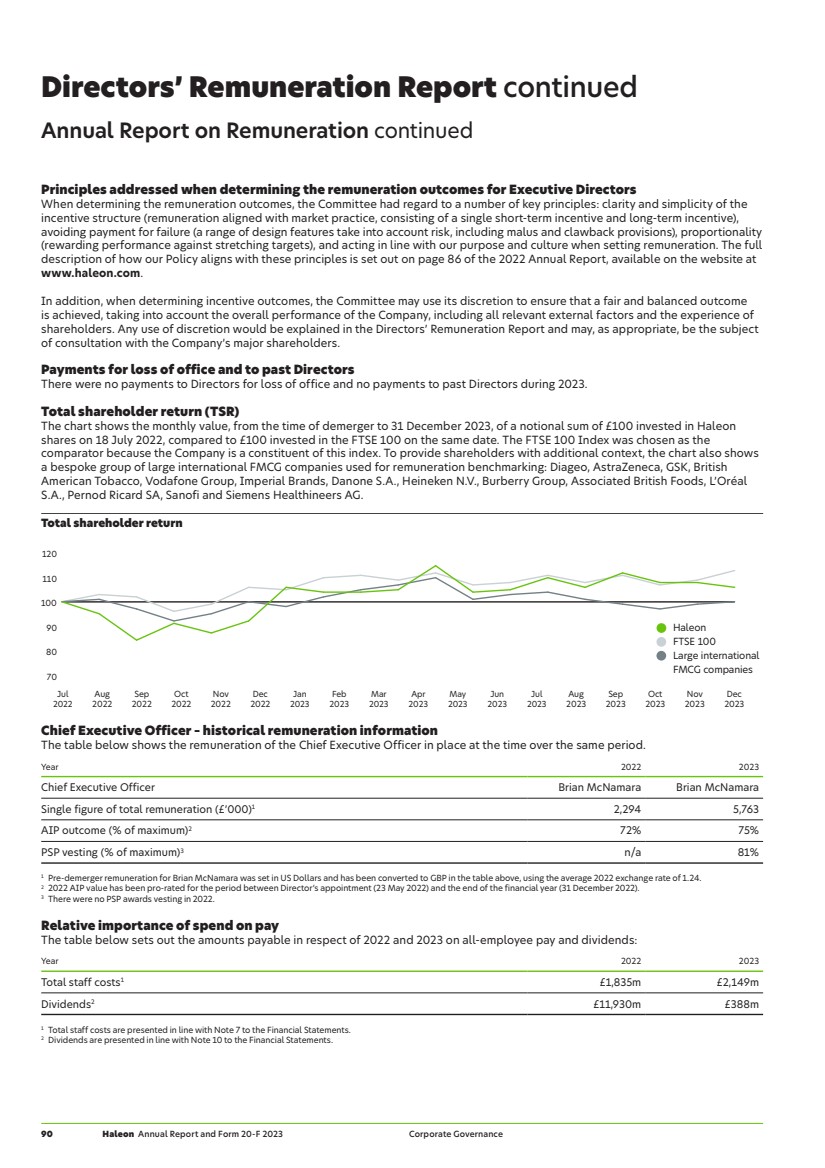
| Chief Executive Officer’s pay compared with employee pay The table below compares the CEO’s ‘single figure’ of total remuneration to that received by three representative UK employees in 2023 and 2022. The total remuneration for each quartile employee, and the salary component within this, is also outlined below. Year Method4 25th percentile pay ratio Median pay ratio 75th percentile pay ratio 20231 Option B 93:1 50:1 38:1 20222,3 Option B 64:1 32:1 24:1 1 2023 CEO single figure includes the value of the PSP Refill award which was made to compensate the value foregone on early vesting of the GSK award. This award vested in March 2024. 2 2022 CEO single figure does not include any long-term incentive component as the first Haleon PSP award was made to the CEO in 2022. The 2022 CEO pay ratio has been recalculated based on the restated value of the 2022 benefits for the CEO, as shown in the single figure table in this report. 3 The total 2022 remuneration for employees is based on earnings between 23 May 2022 and 31 December 2022 and the 2022 bonus pro-rated for that period. 4 See Methodology below. Year 25th percentile £000 Median £000 75th percentile £000 2023 salary 49 67 91 2023 total remuneration 62 114 152 Methodology In line with the approach taken in 2022, we have chosen to use Option B as our preferred methodology to calculate the CEO pay ratio. Given the complexity of the pay arrangements for different categories of UK employees at Haleon, this approach allows us to leverage the existing gender pay gap calculations and thus presents a practical and efficient approach, using robust and meaningful data that is representative of the remuneration levels for UK employees. The Company used data from the 2023 gender pay gap calculation to determine employees positioned at each pay quartile and excluded those employees who left the Company before 31 December 2023. Remuneration was calculated in line with the methodology used to determine the single total figure of remuneration for the CEO, as presented in this Report. Remuneration figures are determined with reference to the financial year ending on 31 December 2023. The remuneration covers salary, benefits and pension contributions, bonus in respect of 2023 which will be paid in March 2024 and share awards without performance conditions granted in 2023. No components were omitted from the calculation and no adjustments were made to any of the pay elements. Where required, actual remuneration was converted into a full-time equivalent by pro-rating earnings to reflect full-time contractual working hours. The Committee determined that the identified employees are reasonably representative of the pay quartiles, since the structure of their remuneration arrangements is in line with that of the majority of employees in the UK. The Committee believes that the median pay ratio for the 2023 financial year is consistent with the pay, reward and progression policies for the Company’s UK employees. The change in the CEO pay ratio from the prior year is primarily attributed to the vesting of the Haleon PSP Refill awards for the CEO whereas the 2022 single figure of remuneration did not include any long-term incentive awards. Corporate Governance Directors’ Remuneration Report Haleon Annual Report and Form 20-F 2023 91 |
| Directors’ Remuneration Report continued Annual Report on Remuneration continued Percentage change in remuneration The table below sets out how the change in remuneration for each Director between 2022 and 2023 compared to a wider UK employee comparator group: Change in 2023 against 2022 Salary/fees1 (% change) Benefits2 (% change) Bonus3 (% change) Executive Directors Brian McNamara 0% -52% 4% Tobias Hestler 0% 5% 8% Chair and Non-Executive Directors Sir Dave Lewis 0% 19% n/a Manvinder Singh (Vindi) Banga 0% -52% n/a Marie-Anne Aymerich 0% 191% n/a Tracy Clarke 0% -89% n/a Dame Vivienne Cox 0% -87% n/a David Denton4 n/a n/a n/a Asmita Dubey 0% -35% n/a Deirdre Mahlan 0% 146% n/a Bryan Supran4 n/a -43% n/a John Young5 0% -11% n/a Average for all UK employees6,7 6% 35% 18% 1 Change in salary/fees for Directors is shown as the change from the post-demerger annual rate of salary applicable for 2022 to the rate applicable for 2023. 2 Change in benefits for Directors is shown as annualised value of post-demerger benefits for 2022 compared with the full value of benefits in 2023. 3 Change in bonus for the Executive Directors is shown as the annualised value of the post-demerger 2022 AIP compared with the full value of the 2023 AIP. 4 David Denton and Bryan Supran do not receive Non-Executive Director fees. David Denton joined the Board with effect from 1 March 2023. 5 John Young stepped down from the Board with effect from 28 February 2023. 6 Only a very small number of individuals are employed by the same entity as Directors. As the number of employees is fewer than five, data for this entity is not presented. Therefore the table above shows a comparison to the average remuneration for all UK employees of Haleon. 7 Average change in salary for the UK employees is the average increase awarded to the UK workforce in 2023. Average change in benefits for the UK employees represents a change in the medical benefit offering in the UK between 2022 and 2023 which resulted in an increase in the average monthly premium. Average change in bonus for the UK employees is calculated as the change in the business multiplier between 2022 and 2023 and will be re-stated in the 2024 report when actual bonus data is available. Consideration of workforce pay and approach to engagement The Board receives regular updates on employee engagement, including employee engagement survey results, with a detailed update presented annually. In addition, workforce engagement is covered on page 70, which includes commentary on how the views of employees were considered by the Board. To ensure that the remuneration-related decisions are fair and appropriate, the Committee considered employees’ pay increases when determining the appropriate salary levels for the Executive Directors and fees for the Chair. In addition, the Committee was provided with an update on bonus outcomes for the wider employee population, which were taken into account to ensure that the bonus outcomes appropriately reflect business performance at all levels in the organisation. Furthermore, the Committee approved the implementation of Haleon’s all-employee share plans and agreed the terms and details of the 2023 and 2024 share awards made to the executives and other senior employees. In 2023, the Workforce Engagement Director, Dame Vivienne Cox, conducted a series of meetings with various groups of employees across multiple geographies and functions. She covered the role of the Board and the Committee in one of her sessions, setting out how the Remuneration Committee operates and how it considers wider workforce remuneration arrangements. In addition, employees have been informed about the alignment between the executive remuneration structure and the wider workforce remuneration arrangements as part of the wider reward communications. The Directors’ Remuneration Policy, which is available on Haleon’s website, has been shared with employees, providing an opportunity to view and assess the remuneration structure which applies to the Board. The Company always welcomes employee feedback, and views on executive remuneration will be shared with the Committee. 92 Haleon Annual Report and Form 20-F 2023 Corporate Governance |
| Remuneration Committee advisers During 2023, PwC was the independent remuneration adviser to the Committee. PwC was appointed by the Committee in August 2022. As part of this process, the Committee considered the services that PwC provided to other FTSE 100 companies and Haleon’s competitors, as well as other potential conflicts of interest. PwC is a member of the Remuneration Consultants’ Group and voluntarily operates under their code of conduct when providing advice on executive remuneration in the UK. PwC regularly meets with the Chair of the Committee without management present. The Committee is comfortable that the PwC engagement partner and team providing remuneration advice to the Committee do not have connections with Haleon or its individual Directors that may impair their independence and objectivity. The total fees paid to PwC for the provision of independent advice to the Committee in 2023 were £74,500 charged on a fixed fee as well as time and materials basis. During 2023, PwC also provided other services to Haleon entities, including tax advice, internal audit and assurance, controls (e.g., SOX, organisational controls and cyber-security assessments), general management consultancy, advice relating to Group-wide projects, staff augmentation for cyber-security specific requirement, short and medium secondees, deals and transactions work. Remuneration advice is provided by an entirely separate team within PwC. Statement of voting at the Annual General Meeting (AGM) The Directors’ Remuneration Policy and the 2022 Directors’ Remuneration Report were approved by shareholders at the 2023 AGM. Each of these resolutions received a significant vote in favour by shareholders and the Committee is grateful for this support and endorsement by our shareholders. The votes received were: Resolution For % Against % Withheld To approve the Directors’ Remuneration Report 7,769,899,285 98.72% 101,062,356 1.28% 34,883,051 To approve the Directors’ Remuneration Policy 7,728,166,817 98.19% 142,531,194 1.81% 35,150,085 Directors’ service contracts and letters of appointment Brian McNamara’s and Tobias Hestler’s service contracts, dated 9 May 2022 and 10 May 2022 respectively, are subject to a 12-month notice period and any payments for loss of office will be in line with the Directors’ Remuneration Policy disclosed in the 2022 Annual Report. Executive Directors’ service contracts are available for inspection at the Company’s registered office and included as exhibits to this Annual Report and Form 20-F. The Non-Executive Directors and the Chair were each appointed by a letter of appointment for an initial term of three years, and either party may terminate the appointment on three months’ notice, or, if earlier, with the consent of the Board. All Non-Executive Directors are subject to annual re-election by shareholders at the AGM and there is no provision in their letters of appointment giving them a right to compensation upon early termination. 2023 Non-Executive Directors’ remuneration The Chair is entitled to receive an annual fee which was set at £700,000 per annum for 2023. The 2023 base fee for each other Non-Executive Director was £95,000 per annum. Bryan Supran and David Denton are Pfizer employees and do not receive any fees for acting as Non-Executive Directors of Haleon plc. Additional fees payable in 2023 were as follows: — £50,000 per annum for the Senior Independent Director; — £30,000 per annum for the Workforce Engagement Director; — £40,000 per annum for chairing the Audit & Risk Committee; — £40,000 per annum for chairing the Remuneration Committee; and — £30,000 per annum for chairing the Environmental & Social Sustainability Committee. Corporate Governance Directors’ Remuneration Report Haleon Annual Report and Form 20-F 2023 93 |
| Directors’ Remuneration Report continued Annual Report on Remuneration continued 2024 Non-Executive Directors’ remuneration The Board reviewed the Non-Executive Directors’ fees and, at the recommendation of the Chair and the CEO, approved a 4.5% increase to the base fee for the Non-Executive Directors, bringing the 2024 base fee to £99,275 per annum. In addition, a 4.5% increase was applied to the Chair’s annual fee, bringing the 2024 Chair’s fee to £731,500 per annum. No other changes were made to the remuneration of the Non-Executive Directors. ‘Single figure’ of remuneration – Non-Executive Directors The table below shows the actual fees paid to our Non-Executive Directors in 2023 and 2022. Non-Executive Director2,4 2023 fees (£000) 2023 benefits (£000) 2023 total remuneration (£000) 2022 fees (£000)1 2022 benefits (£000) 2022 total remuneration (£000) Sir Dave Lewis 700 5.6 706 426 2.9 429 Manvinder Singh (Vindi) Banga 145 0.6 146 66 0.6 67 Marie-Anne Aymerich 120 3.0 123 43 0.5 44 Tracy Clarke 135 0.2 135 61 0.6 62 Dame Vivienne Cox 125 0.4 125 57 1.3 58 David Denton3 0 0.2 0 — — — Asmita Dubey 95 1.8 97 43 1.3 44 Deirdre Mahlan 135 14.2 149 61 2.6 64 Bryan Supran 0 6.1 6 — 4.9 5 John Young3 16 0.8 17 43 0.5 44 1 Remuneration shown in the table in respect of 2022 includes fees and benefits for the period between 23 May-31 December 2022 for Sir Dave Lewis and 18 July-31 December 2022 for all other Directors, in line with their appointment dates. 2 In addition to the Directors listed in the table, prior to separation and demerger, Victoria Whyte and David Redfern were appointed as administrative directors on 20 October 2021 and resigned on 23 May 2022. They were not remunerated for these duties. 3 John Young stepped down from the Board with effect from 28 February 2023. John was succeeded as Non-Executive Director and representative of Pfizer by David Denton with effect from 1 March 2023. 4 Fees and total remuneration have been rounded to the nearest £1,000 for presentation purposes, and totals reflect the sum of these rounded values. Statement of Directors’ shareholding and share interests Total shareholding of Directors on 31 December 2023 is shown below. Director Shares beneficially owned1 Shares not subject to performance Options not subject to performance Shares subject to performance Total interest Share ownership as % of 2023 salary/fee2 Share ownership requirement met Chair Sir Dave Lewis 94,627 — — — 94,627 44% n/a Executive Directors Brian McNamara 246,572 129,069 4,717,325 5,092,966 82% No Tobias Hestler 11,631 71,861 7,919 1,732,883 1,824,294 23% No Non-Executive Directors Manvinder Singh (Vindi) Banga 329,800 — — — 329,800 1136% n/a Marie-Anne Aymerich 27,884 — — — 27,884 96% n/a Tracy Clarke 12,504 — — — 12,504 43% n/a Dame Vivienne Cox 0 — — — 0 0% n/a David Denton 0 — — — 0 n/a n/a Asmita Dubey 0 — — — 0 0% n/a Deirdre Mahlan 80,000 — — — 80,000 276% n/a Bryan Supran 50,000 — — — 50,000 n/a n/a John Young3 80,541 — — — 80,541 277% n/a 1 Beneficial interest also includes shares held indirectly through Haleon ADSs and shares/ADSs held by connected persons. 2 Share ownership as % of 2023 salary/fee is based on the average share price between 1 July and 31 December 2023 of £3.2716. Shares that count towards the requirement include beneficial holdings and unvested DABP shares on an after-tax basis. 3 John Young stepped down from the Board with effect from 28 February 2023. John was succeeded as Non-Executive Director and representative of Pfizer by David Denton with effect from 1 March 2023. The shareholding shown above is as of John Young’s resignation date. The following changes to Directors’ interests in ordinary shares or ADSs occurred between 31 December 2023 and 7 March 2024 (being the latest practicable date): 440,123 ADSs vested for Brian McNamara (357,197 released and 82,926 lapsed) and 61,621 shares vested for Tobias Hestler (50,011 released and 11,610 lapsed) under the PSP Refill awards on 1 March 2024. 94 Haleon Annual Report and Form 20-F 2023 Corporate Governance |
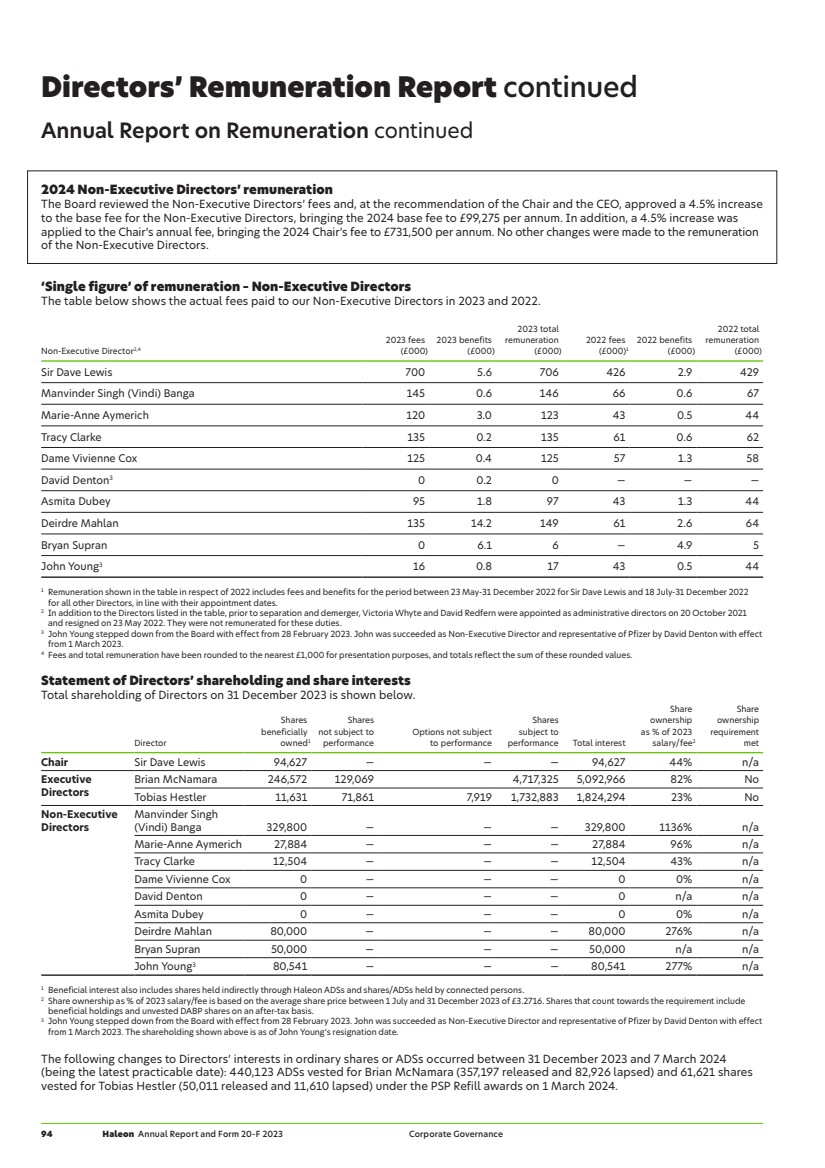
| Non-Executive Directors, including the Chair, are encouraged to build up a personal holding in the shares of the Company equal to the value of one year of their annual base fee. Executive Directors are required to build and maintain significant holdings of shares in Haleon over time (450% of salary for the CEO and 350% of salary for the CFO). Until these requirements have been met, Executive Directors are required to hold all Haleon shares acquired under the PSP and/or DABP (net of income tax and National Insurance contributions). Executive Directors are required to comply with shareholding requirements for two years after leaving the Company, at a level equal to the lower of their shareholding requirement immediately prior to departure or their actual shareholding on departure. During this period, former Executive Directors will be required to seek permission to deal from the Company Secretary. Outstanding share options The following table sets out the share options held by Executive Directors in the Haleon Share Save Plan as at the end of the period. No other Directors participated in any option scheme. Date of grant Exercise price Market price at 31 Dec 2023 Exercise period Number of options Beginning End Beginning of period Granted Exercised Cancelled Forfeited Lapsed End of period Tobias Hestler1,2 22 Dec 22 £2.2728 £3.2165 1 Feb 26 31 Jul 26 7,9193 Nil Nil Nil Nil Nil 7,919 1 No gain was made by Directors in 2023 on the exercise of these options. 2 No price was paid for the award of any option. 3 The total number of shares under option is calculated based on a three-year savings period with contributions of £500 per month. The exercise price represents a 20% discount from the share price at the time the invitations were sent to UK employees. The total face value of the award based on the share price on 31 December 2023 of £3.2165 is £7,473. Additional disclosures Further information is provided on compensation and interests of Directors and senior management. For the purpose of this disclosure, this group includes the Executive and Non-Executive Directors and the Executive Team. The following table sets out aggregate remuneration for this group for 2023. 2023 remuneration £000 Total compensation paid 37,381 Aggregate increase in accrued pension benefits (net of inflation) — Aggregate payments to defined contribution schemes 1,204 During 2023, members of this group were awarded shares and ADSs under the Company’s share plans, as set out in the table below. To align the interests of senior management with those of shareholders, Executive Directors and Executive Team members are required to build and maintain significant holdings of shares in Haleon over time. Selected Executive Team members are required to hold shares to an equivalent multiple of three times their base salary. Awards Dividend equivalents Shares ADSs Shares ADSs Performance Share Plan 6,326,775 1,084,997 165,726 21,370 Share Value Plan1 26,418 19,155 0 0 Deferred Investment Awards1,2 0 0 5,035 0 1 Executive Directors are not eligible to receive Deferred Investment Awards or participate in the Share Value Plan. 2 Deferred Investment Award made in 2022 represents a conversion of the legacy GSK Deferred Investment Award into Haleon shares. At 7 March 2024 (being the latest practicable date), this group and persons closely associated with them had the following interests in shares and ADSs of the Company. Interests awarded under the various share plans are described in Note 26 to the Financial Statements, ‘Employee share schemes’ on page 167. Interests as at 7 March 20241 Shares ADSs Owned 759,468 445,200 Unexercised options 7,919 0 Deferred Annual Bonus Plan 200,930 0 Performance Share Plan 12,524,482 663,441 Share Value Plan2 11,196 0 Deferred Investment Awards2,3 417,387 0 1 This disclosure excludes employees who ceased to be members of the Haleon Executive Team by 7 March 2024. 2 Executive Directors are not eligible to receive Deferred Investment Awards or participate in the Share Value Plan. 3 Deferred Investment Award made in 2022 represents a conversion of the legacy GSK Deferred Investment Award into Haleon shares. Corporate Governance Directors’ Remuneration Report Haleon Annual Report and Form 20-F 2023 95 |
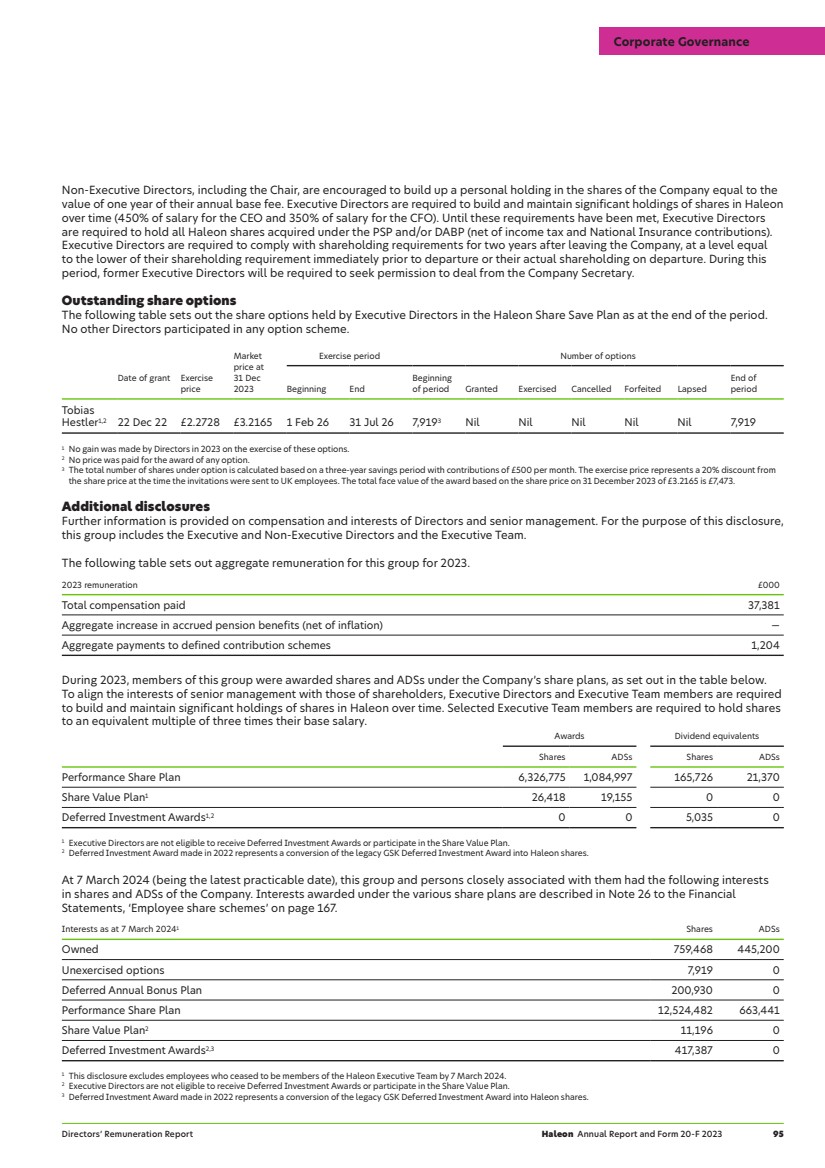
| Compliance with the UK Corporate Governance Code The Board considers that the Company has applied the principles and complied fully with the provisions set out in the 2018 UK Corporate Governance Code (the Code) for the period from 1 January 2023 to 31 December 2023. The table below summarises how the principles of the Code have been applied throughout this period. It should be read in conjunction with the Strategic Report and Corporate Governance section, including the Directors’ Remuneration Report. >> See also our summary statement outlining differences between the Group’s UK corporate governance practices from those of US companies on page 208. >> The Code is published on the FRC website: www.frc.org.uk Code principle Page(s) Board leadership and company purpose A The Board effectiveness review showed that the Board continues to operate effectively. This is attributed to the diverse and complementary expertise of the Directors, which promotes balanced decision-making focused on long-term sustainable success. Careful procedures manage conflicts of interest should they arise with Directors linked to the controlling shareholder, including recusal from certain Board discussions where required. 62, 63, 71, 186 B The Board has agreed the strategic direction of the Group and monitored the strategy, medium plans and evolution of the culture and values at its meetings during 2023. 68 C The Board monitors performance and KPIs through regular updates, presentations and deep dives into key areas. The Company’s controls and risk management processes are overseen by the Audit & Risk Committee. 68, 75 D Stakeholder engagement activities during the period included meetings with major institutional shareholders, shareholder representative bodies and employees (through the Workforce Engagement Director). The AGM also provides the opportunity for the Board to engage directly with shareholders. 69, 70 E The Board received updates on policies and practices throughout the period. Any employee can raise matters of concern confidentially through the Speak Up programme which is overseen by the Audit & Risk Committee. 68, 73 Division of responsibilities F The Chair has led the Board effectively during 2023, demonstrating objective judgement and promoting a culture of openness and debate. 71 G There is an appropriate balance of Executive, Independent Non-Executive and Non-Executive Directors. There is a clear division of responsibilities between the Chair and the Chief Executive. 62, 63, 67, 78 H The Non-Executive Directors have diverse backgrounds and skill sets. The Board effectiveness and evaluation review concluded that all Non-Executive Directors are effective and devote appropriate time to their duties. The Chair meets regularly with Non-Executive Directors without Executive Directors present. 62, 63, 71, 78 I The Chair and Company Secretary ensure the Board and its Committees receive timely, accurate and clear information to support their decision-making. 71 Composition, success and evaluation J Appointments to the Board are led by the Nominations & Governance Committee save where Pfizer nominates Non-Executive Directors under the relationship agreement. Directors are subject to annual re-election at the AGM. 78 K The Board skills matrix is maintained and reviewed by the Nominations & Governance Committee, who also reviews membership of Board Committees on a regular basis. 78 L The Board effectiveness and evaluation review concluded that the Board continues to operate effectively. The Senior Independent Director led the review of the Chair’s performance. 71 Audit, risk and internal control M The Audit & Risk Committee is responsible for assessing the independence and effectiveness of the external auditor and the internal audit function. It has reviewed all of the Group’s published Financial Statements. 73 N The Board is satisfied that the Annual Report, taken as a whole is fair, balanced and understandable. The viability and going concern statements specifically cover the Board’s assessment of the current and future prospects of the Group. 59, 74, 98, 190 O The Board and, as appropriate, the Audit & Risk Committee (in line with its terms of reference) has reviewed the principal risks, monitors risk appetite and oversees the internal control framework. 68, 75 Remuneration P The Remuneration Committee has developed a policy on Executive Director remuneration which was approved by shareholders at the 2023 AGM. 82 Q No Directors are involved in deciding their own remuneration outcomes. The Remuneration Committee followed a clear process while developing the Directors’ Remuneration Policy. 81 R The Remuneration Committee exercises independent judgement and considers the application of discretion permitted when determining the outcome of performance-related Executive remuneration. 80, 83, 85, 86, 90 96 Haleon Annual Report and Form 20-F 2023 Corporate Governance |
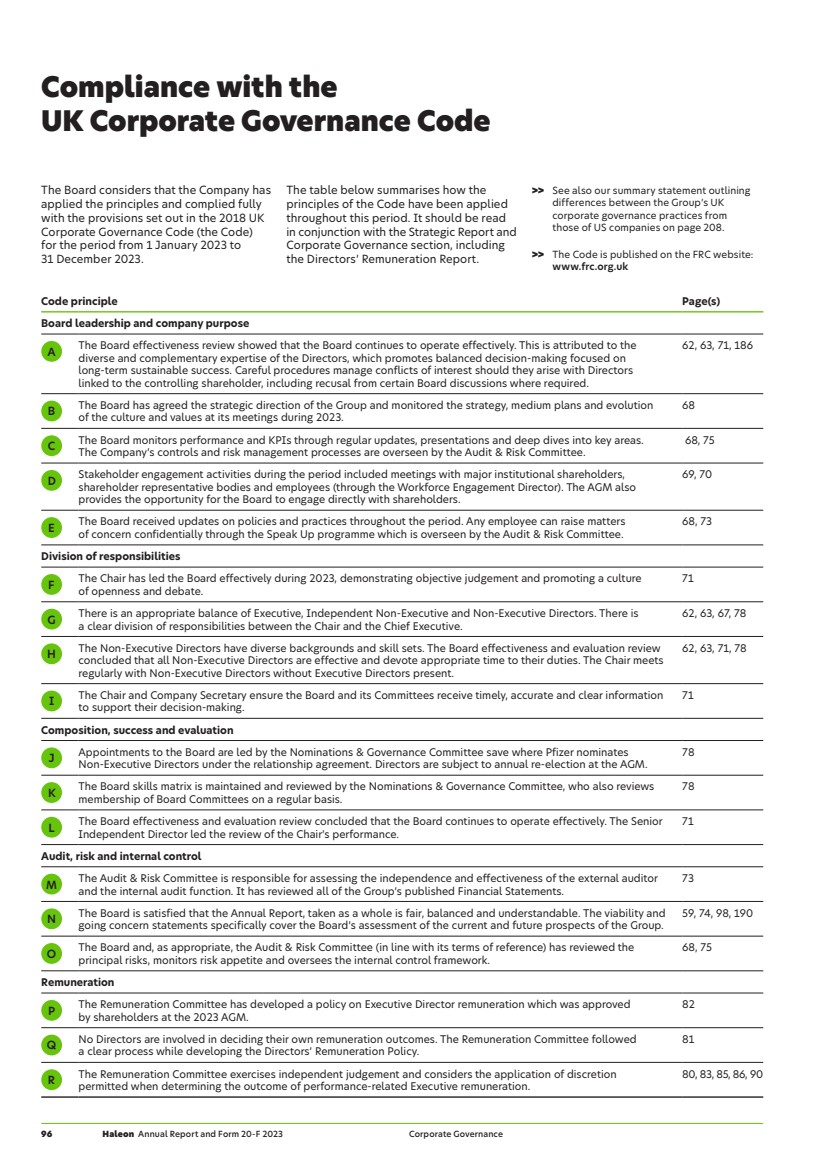
| Financial Statements Consolidated Financial Statements Contents Reports of independent registered public accounting firms 112 Consolidated income statement 116 Consolidated statement of comprehensive income 117 Consolidated balance sheet 118 Consolidated statement of changes in equity 119 Consolidated cash flow statement 120 Notes to the Consolidated Financial Statements 121 Sensodyne: Sensodyne is a leading global range of toothpastes, mouthwashes and toothbrushes designed to tackle sensitivity. The brand is a key growth driver in Oral Health, delivering double digit growth and gaining market share in 2023. In the US, Sensodyne recently launched two new innovations, Pronamel Active Shield and Sensitivity & Gum. The image above is taken from the Sensodyne ‘Faces and Dentists’ campaign. Haleon Annual Report and Form 20-F 2023 97 |
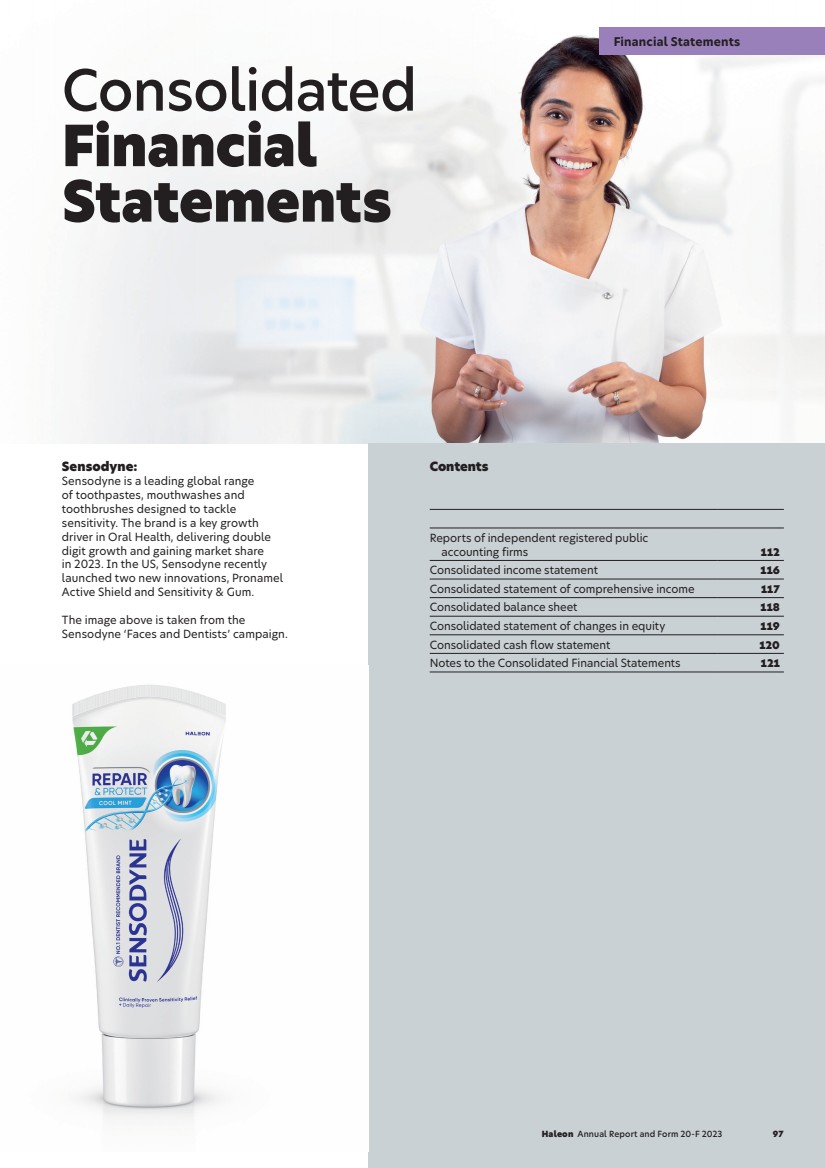
| 98 Haleon Annual Report and Form 20-F 2023 Annual Report and Form 20-F 2022 Financial Statements This page is intentionally left blank |

| Financial Statements Independent auditor’s report to the members of Haleon plc Haleon Annual Report and Form 20-F 2023 99 This page is intentionally left blank |

| 100 Haleon Annual Report and Form 20-F 2023 Financial Statements This page is intentionally left blank |

| Financial Statements Independent auditor’s report to the members of Haleon plc Haleon Annual Report and Form 20-F 2023 101 This page is intentionally left blank |

| 102 Haleon Annual Report and Form 20-F 2023 Financial Statements This page is intentionally left blank |

| Financial Statements Independent auditor’s report to the members of Haleon plc Haleon Annual Report and Form 20-F 2023 103 This page is intentionally left blank |

| 104 Haleon Annual Report and Form 20-F 2023 Financial Statements This page is intentionally left blank |

| Financial Statements Independent auditor’s report to the members of Haleon plc Haleon Annual Report and Form 20-F 2023 105 This page is intentionally left blank |

| 106 Haleon Annual Report and Form 20-F 2023 Financial Statements This page is intentionally left blank |

| Draft content Financial Statements Independent auditor’s report to the members of Haleon plc Haleon Annual Report and Form 20-F 2023 107 This page is intentionally left blank |

| 108 Haleon Annual Report and Form 20-F 2023 Financial Statements This page is intentionally left blank |

| Financial Statements Independent auditor’s report to the members of Haleon plc Haleon Annual Report and Form 20-F 2023 109 This page is intentionally left blank |

| 110 Haleon Annual Report and Form 20-F 2023 Financial Statements This page is intentionally left blank |

| Financial Statements Independent auditor’s report to the members of Haleon plc Haleon Annual Report and Form 20-F 2023 111 This page is intentionally left blank |

| Report of independent registered public accounting firm To the Shareholders and Board of Directors Haleon plc: Opinions on the Consolidated Financial Statements and Internal Control Over Financial Reporting We have audited the accompanying consolidated balance sheet of Haleon plc and subsidiaries (the Company) as of December 31, 2023, the related consolidated income statement, statement of comprehensive income, statement of changes in equity, and cash flow statement for the year ended December 31, 2023 and the related notes (collectively, the consolidated financial statements). We also have audited the Company’s internal control over financial reporting as of December 31, 2023, based on criteria established in Internal Control — Integrated Framework (2013) issued by the Committee of Sponsoring Organisations of the Treadway Commission. In our opinion, the consolidated financial statements referred to above present fairly, in all material respects, the financial position of the Company as of December 31, 2023, and the results of its operations and its cash flows for the year ended December 31, 2023, in conformity with International Financial Reporting Standards (IFRS) as issued by the International Accounting Standards Board (IASB). Also in our opinion, the Company maintained, in all material respects, effective internal control over financial reporting as of December 31, 2023 based on criteria established in Internal Control — Integrated Framework (2013) issued by the Committee of Sponsoring Organisations of the Treadway Commission. Basis for Opinions The Company’s management is responsible for these consolidated financial statements, for maintaining effective internal control over financial reporting, and for its assessment of the effectiveness of internal control over financial reporting, included in the accompanying management’s report on internal control over financial reporting. Our responsibility is to express an opinion on the Company’s consolidated financial statements and an opinion on the Company’s internal control over financial reporting based on our audits. We are a public accounting firm registered with the Public Company Accounting Oversight Board (United States) (PCAOB) and are required to be independent with respect to the Company in accordance with the U.S. federal securities laws and the applicable rules and regulations of the Securities and Exchange Commission and the PCAOB. We conducted our audits in accordance with the standards of the PCAOB. Those standards require that we plan and perform the audits to obtain reasonable assurance about whether the consolidated financial statements are free of material misstatement, whether due to error or fraud, and whether effective internal control over financial reporting was maintained in all material respects. Our audit of the consolidated financial statements included performing procedures to assess the risks of material misstatement of the consolidated financial statements, whether due to error or fraud, and performing procedures that respond to those risks. Such procedures included examining, on a test basis, evidence regarding the amounts and disclosures in the consolidated financial statements. Our audit also included evaluating the accounting principles used and significant estimates made by management, as well as evaluating the overall presentation of the consolidated financial statements. Our audit of internal control over financial reporting included obtaining an understanding of internal control over financial reporting, assessing the risk that a material weakness exists, and testing and evaluating the design and operating effectiveness of internal control based on the assessed risk. Our audit also included performing such other procedures as we considered necessary in the circumstances. We believe that our audits provide a reasonable basis for our opinions. Definition and Limitations of Internal Control Over Financial Reporting A company’s internal control over financial reporting is a process designed to provide reasonable assurance regarding the reliability of financial reporting and the preparation of financial statements for external purposes in accordance with generally accepted accounting principles. A company’s internal control over financial reporting includes those policies and procedures that (1) pertain to the maintenance of records that, in reasonable detail, accurately and fairly reflect the transactions and dispositions of the assets of the company; (2) provide reasonable assurance that transactions are recorded as necessary to permit preparation of financial statements in accordance with generally accepted accounting principles, and that receipts and expenditures of the company are being made only in accordance with authorisations of management and directors of the company; and (3) provide reasonable assurance regarding prevention or timely detection of unauthorised acquisition, use, or disposition of the company’s assets that could have a material effect on the financial statements. Because of its inherent limitations, internal control over financial reporting may not prevent or detect misstatements. Also, projections of any evaluation of effectiveness to future periods are subject to the risk that controls may become inadequate because of changes in conditions, or that the degree of compliance with the policies or procedures may deteriorate. 112 Haleon Annual Report and Form 20-F 2023 Financial Statements |
| Financial Statements Critical Audit Matters The critical audit matter communicated below is a matter arising from the current period audit of the consolidated financial statements that was communicated or required to be communicated to the audit committee and that: (1) relates to accounts or disclosures that is material to the consolidated financial statements and (2) involved our especially challenging, subjective, or complex judgments. The communication of a critical audit matter does not alter in any way our opinion on the consolidated financial statements, taken as a whole, and we are not, by communicating the critical audit matter below, providing separate opinions on the critical audit matter or on the accounts or disclosures to which it relates. Assessment of the recoverable amounts for the Preparation H intangible assets As discussed in Note 14 to the Consolidated Financial Statements, as of December 31, 2023, the Company has £1,103 million of indefinite useful life intangible asset related to its Preparation H brand. As discussed in Note 3, the Company performs impairment testing on an annual basis and whenever events or changes in circumstances indicate that a brand’s carrying value may exceed its recoverable amount. The recoverable amount utilised in the impairment test is estimated using a fair value less costs to sell model, which relies on certain assumptions and estimates. Key assumptions and estimates used by management in determining the recoverable amounts include the terminal growth rate and discount rate. We identified the assessment of the recoverable amount for the Preparation H intangible asset as a critical audit matter. A high degree of auditor judgment was required to evaluate the terminal growth rate and discount rate used to estimate the recoverable amount of the brand. The terminal growth rate and discount rate included subjective determinations of future market and economic conditions that were sensitive to variation. Minor changes to the assumptions used could have had a significant effect on the Company’s determination of the recoverable amount. Additionally, specialised skills and knowledge were needed to evaluate the discount rate. The following are the primary procedures we performed to address this critical audit matter: — evaluated the design and tested operating effectiveness of certain internal controls related to the indefinite life brands impairment process. This included controls over the development of the terminal growth rate and discount rate — challenged the Company’s terminal growth rate by comparing to publicly available data — performed sensitivity analysis on the terminal growth rate and discount rate to assess their impact on the Company’s determination that the fair value exceeds the carrying value — involved a valuation professional with specialised skills and knowledge who assisted in independently developing a range of discount rates and terminal growth rates using publicly available market data for comparable companies and comparing these rates with the rates by the Company. /s/ KPMG LLP We have served as the Company’s auditor since 2023. London, United Kingdom 15 March 2024 Report of independent registered public accounting firm Haleon Annual Report and Form 20-F 2023 113 |
| Report of independent registered public accounting firm To the Shareholders and the Board of Directors. Haleon plc: Opinion on the Consolidated Financial Statements We have audited the accompanying consolidated balance sheet of Haleon plc and subsidiaries (the Company) as of December 31, 2022, the related consolidated income statement, statement of comprehensive income, statement of changes in equity, and cash flow statement for the year ended December 31, 2022, and the related notes (collectively, the consolidated financial statements). In our opinion, the consolidated financial statements present fairly, in all material respects, the financial position of the Company as of December 31, 2022, and the results of its operations and its cash flows for the year ended December 31, 2022, in conformity with International Financial Reporting Standards as issued by the International Accounting Standards Board. Basis for Opinion These consolidated financial statements are the responsibility of the Company’s management. Our responsibility is to express an opinion on these consolidated financial statements based on our audit. We are a public accounting firm registered with the Public Company Accounting Oversight Board (United States) (PCAOB) and are required to be independent with respect to the Company in accordance with the U.S. federal securities laws and the applicable rules and regulations of the Securities and Exchange Commission and the PCAOB. We conducted our audit(s) in accordance with the standards of the PCAOB. Those standards require that we plan and perform the audit to obtain reasonable assurance about whether the consolidated financial statements are free of material misstatement, whether due to error or fraud. Our audit included performing procedures to assess the risks of material misstatement of the consolidated financial statements, whether due to error or fraud, and performing procedures that respond to those risks. Such procedures included examining, on a test basis, evidence regarding the amounts and disclosures in the consolidated financial statements. Our audit also included evaluating the accounting principles used and significant estimates made by management, as well as evaluating the overall presentation of the consolidated financial statements. We believe that our audit provides a reasonable basis for our opinion. Critical Audit Matter The critical audit matter communicated below is a matter arising from the current period audit of the consolidated financial statements that was communicated or required to be communicated to the audit committee and that: (1) relates to accounts or disclosures that are material to the consolidated financial statements and (2) involved our especially challenging, subjective, or complex judgments. The communication of a critical audit matter does not alter in any way our opinion on the consolidated financial statements, taken as a whole, and we are not, by communicating the critical audit matter below, providing a separate opinion on the critical audit matter or on the accounts or disclosures to which it relates. Impairment testing of Indefinite Life Brands As disclosed in Notes 3 and 14 to the consolidated financial statements, at December 31, 2022, the Company’s balance sheet includes £19,333 million of indefinite useful life intangible assets related to its brands (Indefinite Life Brands). The Company performs impairment testing on an annual basis and whenever events or changes in circumstances indicate that a brand’s carrying value may exceeds its recoverable amounts. The recoverable amounts utilized in the impairment tests are estimated using a fair value less costs to sell model, which relies on certain assumptions and estimates. Key assumptions and estimates used by management in determining the recoverable amounts include revenue growth rates and discount rates. We identified the impairment testing of Indefinite Life Brands as a critical audit matter. A high degree of challenging auditor judgment was required to evaluate the projected revenue growth rates and discount rates used to estimate the recoverable amounts of the brands. The revenue growth rates and discount rates included subjective determinations of future market and economic conditions that were sensitive to variation. Minor changes to assumptions used could have had a significant effect on the Company’s determination of the recoverable amounts. Additionally, specialized skills and knowledge were needed to evaluate the discount rates. The following are the primary procedures we performed to address this critical audit matter. We evaluated the design of certain internal controls related to the Indefinite Life Brands impairment process. This included controls over the development of the revenue growth rates and discount rates. We evaluated the revenue growth rates used in the Indefinite Life Brands impairment by: — comparing the Company’s historical forecasts to actual results to evaluate the Company’s historical ability to accurately forecast — comparing the Company’s historical results to the forecasts to evaluate the Company’s ability to accurately forecast — comparing the cash flow projections used in the impairment tests with available external industry data to assess the reasonableness of the assumptions used. We involved valuation professionals with specialized skills and knowledge who assisted in evaluating the discount rates used in the impairment tests by comparing them to discount rates that were developed using publicly available market data, including that of comparable companies. /s/KPMG LLP We served as the Company’s auditor for 2022. New York, New York March 20, 2023 114 Haleon Annual Report and Form 20-F 2023 Financial Statements |
| Financial Statements To the Shareholders and the Board of Directors of Haleon UK Holdings (No.2) Limited (formerly known has GlaxoSmithKline Consumer Healthcare Holdings (No.2) Limited). Opinion on the Financial Statements We have audited the accompanying consolidated income statements, the consolidated statements of comprehensive income, the consolidated statements of changes in equity, and the consolidated cash flow statements of Haleon UK Holdings (No.2) Limited (formerly known as GlaxoSmithKline Consumer Healthcare Holdings (No.2) Limited) and its subsidiaries (the “Company”) (predecessor to Haleon plc), for the year ended December 31, 2021, and the related notes (collectively referred to as the “financial statements”). In our opinion, the financial statements present fairly, in all material respects, the results of the Company’s operations and its cash flows for the year ended December 31, 2021, in conformity with International Financial Reporting Standards (“IFRS”) as issued by the International Accounting Standards Board (“IASB”). Basis for Opinion These financial statements are the responsibility of the Company’s management. Our responsibility is to express an opinion on the Company’s financial statements based on our audits. We are a public accounting firm registered with the Public Company Accounting Oversight Board (United States) (PCAOB) and are required to be independent with respect to the Company in accordance with the U.S. federal securities laws and the applicable rules and regulations of the Securities and Exchange Commission and the PCAOB. We conducted our audits in accordance with the standards of the PCAOB. Those standards require that we plan and perform the audit to obtain reasonable assurance about whether the financial statements are free of material misstatement, whether due to error or fraud. The Company is not required to have, nor were we engaged to perform, an audit of its internal control over financial reporting. As part of our audits, we are required to obtain an understanding of internal control over financial reporting but not for the purpose of expressing an opinion on the effectiveness of the Company’s internal control over financial reporting. Accordingly, we express no such opinion. Our audits included performing procedures to assess the risks of material misstatement of the financial statements, whether due to error or fraud, and performing procedures that respond to those risks. Such procedures included examining, on a test basis, evidence regarding the amounts and disclosures in the financial statements. Our audits also included evaluating the accounting principles used and significant estimates made by the management, as well as evaluating the overall presentation of the financial statements. We believe that our audits provide a reasonable basis for our opinion. /s/ Deloitte LLP London, United Kingdom 11 March 2022 (20 March 2023 as to Note 11) We began serving as the Company’s auditor in 2019. In 2022 we became the predecessor auditor. Report of independent registered public accounting firm Haleon Annual Report and Form 20-F 2023 115 |
Consolidated income statement
for the year ended
Notes | 31 December 2023 | 31 December 2022 | 31 December 2021 | |
Revenue | 4 | | | |
Cost of sales | ( | ( | ( | |
Gross profit | | | | |
| ( | ( | ( | |
Research and development | ( | ( | ( | |
Other operating (expense)/income | 5 | ( | | |
Operating profit | 6 | | | |
| 8 | | | |
Finance expense | 8 | ( | ( | ( |
Net finance costs | ( | ( | ( | |
| | | | |
Income tax | 9 | ( | ( | ( |
Profit after tax for the year | | | | |
| | | | |
Profit attributable to non-controlling interests | | | | |
| 11 | | | |
Diluted earnings per share (pence) | 11 | | | |
Consolidated statement of comprehensive income
for the year ended
Notes | 31 December 2023 | 31 December 2022 | 31 December 2021 | |
Profit after tax for the year | | | | |
| ||||
Items that may be subsequently reclassified to the income statement: | ||||
Exchange movements on overseas net assets | 23 | ( | | ( |
Exchange movements on overseas net assets of non-controlling interests | 23 | ( | ( | – |
Fair value movements on cash flow hedges | 25 | | | |
Reclassification of cash flow hedges to the income statement | 25 | ( | ( | – |
Related tax on items that may be subsequently reclassified to the income statement1 | 9 | | ( | ( |
Total | ( | | ( | |
| ||||
Remeasurement gains on defined benefit plan | 20 | | | |
Related tax on items that will not be reclassified to the income statement | 9 | | ( | ( |
Total | | | | |
Other comprehensive (expenses)/income, net of tax for the year | ( | | ( | |
| | | | |
Total comprehensive income for the year attributable to: | ||||
Shareholders of the Group | | | | |
Non-controlling interests | | | |
| 1 |
Consolidated balance sheet
as at
Notes | 31 December 2023 | 31 December 2022 | |
Non-current assets | |||
Property, plant and equipment | 12 | | |
Right of use assets | 13 | | |
Intangible assets | 14 | | |
Deferred tax assets | 9 | | |
Post-employment benefit assets | 20 | | |
Derivative financial instruments | 25 | | |
Other non-current assets | 16 | | |
Total non-current assets | | | |
Current assets | |||
Inventories | 15 | | |
Trade and other receivables | 16 | | |
Cash and cash equivalents | 17 | | |
Derivative financial instruments | 25 | | |
Current tax receivables | | | |
Assets held for sale | 27 | | – |
Total current assets | | | |
Total assets | | | |
Current liabilities | |||
Short-term borrowings | 19 | ( | ( |
Trade and other payables | 18 | ( | ( |
Derivative financial instruments | 25 | ( | ( |
Current tax payables | ( | ( | |
Short-term provisions | 21 | ( | ( |
Total current liabilities | ( | ( | |
Non-current liabilities | |||
Long-term borrowings | 19 | ( | ( |
Deferred tax liabilities | 9 | ( | ( |
Post-employment benefit obligations | 20 | ( | ( |
Derivative financial instruments | 25 | ( | ( |
Long-term provisions | 21 | ( | ( |
Other non-current liabilities | ( | ( | |
Total non-current liabilities | ( | ( | |
Total liabilities | ( | ( | |
Net assets | | | |
Equity | |||
Share capital | 23 | | |
Other reserves | 23 | ( | ( |
Retained earnings | | | |
Shareholders’ equity | | | |
Non-controlling interests | | | |
Total equity | | |
The accompanying notes form part of these financial statements. The financial statements on pages 116 to 176 were approved by the Board of Directors and signed on its behalf by:
Tobias Hestler
Chief Financial Officer
15 March 2024
118 Haleon Annual Report and Form 20-F 2023 | Financial Statements |
| Financial Statements | ||||||
Consolidated statement of changes in equity
for the year ended
Notes | Share | Share | Other | Retained | Shareholders’ | Non- | Total | |
At 1 January 2023 | | – | ( | | | | | |
Profit after tax | – | – | – | | | | | |
Other comprehensive (expenses)/income | – | – | ( | | ( | ( | ( | |
Total comprehensive (expenses)/income | – | – | ( | | | | | |
Distributions to non-controlling interests | – | – | – | – | – | ( | ( | |
Dividends to equity shareholders | 10 | – | – | – | ( | ( | – | ( |
Share-based incentive plans | 26 | – | – | – | | | – | |
Tax on share-based incentive plans | – | – | – | | | – | | |
Purchase of shares by employee benefit trusts | – | – | ( | – | ( | – | ( | |
At 31 December 2023 | | – | ( | | | | |
Notes | Share | Share | Other | Retained | Shareholders’ | Non- | Total | |
At 1 January 2022 | | – | ( | | | | | |
Profit after tax | – | – | – | | | | | |
Other comprehensive income/(expenses) | – | – | | | | ( | | |
Total comprehensive income | – | – | | | | | | |
Issue of share capital of the former ultimate holding company | | – | – | – | | – | | |
Capital reduction of the former ultimate holding company | ( | – | – | – | ( | – | ( | |
Transactions between the former ultimate holding company and equity shareholders1 | – | | – | – | | – | | |
Effect of change of ultimate holding company | ( | ( | ( | – | ( | – | ( | |
Transactions with equity shareholders1 | – | – | – | ( | ( | – | ( | |
Distributions to non-controlling interests | – | – | – | – | – | ( | ( | |
Dividends to equity shareholders1 | 10 | – | – | – | ( | ( | – | ( |
Issue of share capital | | | – | – | | – | | |
Capital reduction | ( | ( | – | – | ( | – | ( | |
Share-based incentive plans | 26 | – | – | – | | | – | |
At 31 December 2022 | | – | ( | | | | |
Notes | Share | Share | Other | Retained | Shareholders’ | Non- | Total | |
At 1 January 2021 | | – | ( | | | | | |
Profit after tax | – | – | – | | | | | |
Other comprehensive income/(expenses) | – | – | ( | | ( | – | ( | |
Total comprehensive income/(expenses) | – | – | ( | | | | | |
Contribution from parent | 23 | – | – | | – | | – | |
Distributions to non-controlling interests | – | – | – | – | – | ( | ( | |
Dividends to equity shareholders1 | 10 | – | – | – | ( | ( | – | ( |
At 31 December 2021 | | – | ( | | | | |
| 1 |
Consolidated Financial Statements | Haleon Annual Report and Form 20-F 2023 119 |
Consolidated cash flow statement
for the year ended
Notes | 31 December 2023 | 31 December 2022 | 31 December 2021 | |
Cash flows from operating activities | ||||
Profit after tax | | | | |
Taxation charge | 9 | | | |
Net finance costs | 8 | | | |
Depreciation of property, plant and equipment and right of use assets | 12, 13 | | | |
Amortisation of intangible assets | 14 | | | |
Impairment and assets written off, net of reversals | 4 | | | |
Loss/(gain) on sale of intangible assets, property, plant and equipment and businesses | | ( | ( | |
Share-based incentive plan expense | 26 | | | – |
Other non-cash movements | ( | | ( | |
Increase/(decrease) in pension and other provisions | | ( | ( | |
Changes in working capital: | ||||
Increase in inventories | ( | ( | ( | |
Decrease/(increase) in trade receivables | | ( | | |
Increase in trade payables | | | | |
Net change in other receivables and payables | ( | | ( | |
Taxation paid | ( | ( | ( | |
Net cash inflow from operating activities | | | | |
Cash flows from investing activities | ||||
Purchase of property, plant and equipment | ( | ( | ( | |
Proceeds from sale of property, plant, and equipment | – | – | | |
Purchase of intangible assets | ( | ( | ( | |
Proceeds from sale of intangible assets | | | | |
Purchase of business, net of cash acquired | 27 | ( | – | – |
Loans to related parties | 24 | – | ( | – |
Proceeds from settlement of amounts invested with GSK finance companies | 24 | – | | |
Interest received | | | | |
Net cash outflow from investing activities | ( | ( | ( | |
Cash flows from financing activities | ||||
Payment of lease liabilities | ( | ( | ( | |
Interest paid | ( | ( | ( | |
Dividends paid to shareholders | ( | ( | ( | |
Distributions to non-controlling interests | ( | ( | ( | |
Contribution from parent | – | | | |
Repayment of borrowings | 19 | ( | ( | – |
Proceeds from borrowings | 19 | – | | |
Purchase of shares by employee benefit trust | ( | – | – | |
Other financing cash flows | ( | | ( | |
Net cash (outflow)/inflow from financing activities | ( | | ( | |
Increase in cash and cash equivalents and bank overdrafts | | | | |
Cash and cash equivalents and bank overdrafts at the beginning of the year | | | | |
Exchange adjustments | ( | | ( | |
Increase in cash and cash equivalents and bank overdrafts | | | | |
Cash and cash equivalents and bank overdrafts at the end of the year | | | | |
Cash and cash equivalents and bank overdrafts at the end of the year comprise: | ||||
Cash and cash equivalents | 17 | | | |
Overdrafts | ( | ( | ( | |
Cash and cash equivalents and bank overdrafts at the end of the year | | | |
120 Haleon Annual Report and Form 20-F 2023 | Financial Statements |
1. General information
Haleon is a public company limited by shares, incorporated under the laws of England and Wales with registered number 13691224. The Company has ordinary shares with a nominal value of £
Basis of preparation
The Consolidated Financial Statements have been prepared in accordance with International Financial Reporting Standards as issued by the International Accounting Standards Board (IASB IFRS), including interpretations issued by the IFRS Interpretations Committee (IFRIC) and International Financial Reporting Standards as adopted by the United Kingdom (UK IFRS) (together IFRS) and the Companies Act 2006. IFRS as adopted by the UK differs in certain respects from IFRS as issued by the IASB. The differences have no impact on the Group’s Consolidated Financial Statements for the years presented.
Until July 2022, Haleon UK Holdings (No.2) Limited (HHL2) (previously, GlaxoSmithKline Consumer Healthcare Holdings (No.2) Limited (CHHL2)), the former ultimate holding company of the Group and the accounting predecessor, was jointly owned by GSK plc and its subsidiaries which held the majority controlling equity interest of
This set of Consolidated Financial Statements have been prepared as if the Group had been in existence throughout all the periods presented by applying the principles of predecessor accounting in accordance with SEC Regulation C Rule 405 and IFRS although the actual legal transaction and corporate reorganisation occurred in July 2022. There was no economic change or event impacting the reporting entity because the business activities of the predecessor and successor remained identical and only the legal form and ownership allocation has changed.
Accounting convention
The Consolidated Financial Statements are prepared on a historical cost basis unless otherwise indicated. The Consolidated Financial Statements are presented in Pound Sterling (GBP, £), the functional currency of the Company and presentation currency of the Group, and all values are denominated in millions of GBP (£m or £ million) unless stated otherwise.
Financial period
These Consolidated Financial Statements cover the financial year from 1 January 2023 to 31 December 2023, with comparative figures for the financial years from 1 January 2022 to 31 December 2022 and from 1 January 2021 to 31 December 2021.
Going concern
The Directors have reviewed the Group’s cash flow forecasts, financial position and exposure to principal risks and have formed the view that the Group will generate sufficient cash to meet its ongoing requirements for at least 12 months from the date the Financial Statements have been authorised. At 31 December 2023, the Group had cash and cash equivalents, net of bank overdrafts, of £
Basis of consolidation
Entities over which the Group has the power to direct the relevant activities so as to affect the returns to the Group, generally through control over the financial and operating policies from either voting or contractual rights, are accounted for as subsidiaries. Interests acquired in entities are consolidated from the date the Group acquires control and interests sold are deconsolidated from the date control ceases.
Notes to the Consolidated Financial Statements continued
Where, as part of a business combination, the Group is not able to exercise control over a particular operation due to the existence of legal or other restrictions, the associated assets and liabilities are not consolidated, and a financial asset or liability is recognised for the economic benefit or obligation to be received under the contribution agreement. The assets and liabilities are consolidated, and the associated financial asset or liability derecognised, on the date at which the Group is able to exercise control over these operations.
Transactions and balances between subsidiaries are eliminated and no profit before tax is recognised on sales between subsidiaries until the products are sold to customers outside the Group. Transactions with non-controlling interests are recorded directly in equity. Deferred tax relief on unrealised intra-group profit is accounted for only to the extent that it is considered recoverable. Refer to Note 30 ‘Subsidiaries’ for a list of the Group’s subsidiary undertakings.
Foreign currencies
The Consolidated Financial Statements are presented in GBP, which is also the Company’s functional currency. Each entity in the Group determines its own functional currency and items included in the financial statements of each entity are measured using that functional currency.
Foreign currency transactions in individual Group companies are translated into functional currency using exchange rates at the date of the transaction. Foreign exchange gains and losses from settlement of these transactions, and from translation of monetary assets and liabilities at the rates prevailing on the reporting period date, are recognised in the income statement except when deferred in equity as qualifying hedges. Non-monetary items carried at fair value that are denominated in foreign currencies are retranslated at the rates prevailing at the date when the fair value was measured. Non-monetary items measured in terms of historical cost in a foreign currency are not retranslated.
In preparing the Consolidated Financial Statements, the balances in individual Group companies are translated from their functional currency into GBP. The income statement, the cash flow statement and all other movements in assets and liabilities are translated at average rates of exchange as a proxy for the transaction rate, or at the transaction rate itself if more appropriate. Assets and liabilities are translated at the closing rates at the end of the reporting period.
The effect of exchange rate differences during the year on net assets of foreign operations is recorded in equity.
The Group applies hedge accounting to certain exchange differences arising between the functional currencies of a foreign operation and the functional currency of the parent entity, regardless of whether the net investment is held directly or through an intermediate parent. Differences arising on retranslation of a financial liability designated as a foreign currency net investment hedge are recorded in other comprehensive income/(expenses) and accumulated in equity to the extent that the hedge is effective, which may be subsequently reclassified to the consolidated income statement. These differences are reported within profit or loss to the extent that the hedge is ineffective. Gains and losses on the hedging instrument accumulated in equity are reclassified to profit or loss on the disposal or partial disposal of the foreign operation.
The principal currencies and relevant exchange rates in the key markets where the Group operates are shown below:
Average rates | Year end rates | |||||
2023 | 2022 | 2021 | 2023 | 2022 | 2021 | |
USD/£ | | | | | | |
Euro/£ | | | | | | |
CNY/£ | | | | | | |
122 Haleon Annual Report and Form 20-F 2023 | Financial Statements |
Impact of climate change
In preparing these Consolidated Financial Statements we have considered the impact of climate change. The Group does not believe that there is a material impact on the financial reporting judgements and estimates arising from climate change in the short term and as a result the valuation of our assets and liabilities has not been significantly impacted by these risks as at 31 December 2023. In concluding, we specifically considered the impact of climate change on the following areas:
Financial Statement area | Relevant climate-related risks | Relevant ESG targets | Relevant Note for further information |
Property, plant and equipment | - Damage and disruption caused by extreme weather events - Carbon pricing regulations | - Carbon reduction - Water neutrality at our manufacturing sites | Note 12 ‘Property, plant and equipment’ |
Goodwill and intangible brands | - Damage and disruption caused by extreme weather events - Reduced availability and increased price volatility of raw materials due to climate change - Carbon pricing regulations - Loss of attractiveness due to consumers’ increasing expectations | - Carbon reduction - Recycle-ready packaging - Sustainably sourced and deforestation-free ingredients and packaging - Reduced use of virgin petroleum-based plastic | Note 14 ‘Intangible assets’ |
Inventory | - Reduced availability and increased price volatility of raw materials due to climate change - Carbon pricing regulations | - Recycle-ready packaging - Sustainably sourced and deforestation-free ingredients and packaging - Reduced use of virgin petroleum-based plastic | Note 15 ‘Inventories’ |
Going concern and viability | - Damage and disruption caused by extreme weather events |
Whilst there is currently no short-term impact anticipated from climate change, the judgements and estimates of the Group will be regularly reviewed in light of the increasing risks and dynamic regulatory landscape as this continues to evolve.
2. Accounting policies
The accounting policies adopted are the same as those which were applied for the previous financial year except as set out below under the heading ‘Recent accounting developments’.
Where an accounting policy is generally applicable to a specific note to the Consolidated Financial Statements, the policy is described within that note.
The accounting policies below have been applied throughout the Consolidated Financial Statements and apply to the Financial Statements as a whole.
Revenue
The Group receives revenue for supply of goods to external customers against orders received. The majority of contracts that the Group enters into relate to sales orders containing single performance obligations for the delivery of consumer health products.
Product revenue is recognised when control of the goods is passed to the customer. The point at which control passes is determined by each customer arrangement, but generally occurs on delivery to the customer.
Revenue represents net invoice value (i.e., list price after the deduction of discounts, pricing allowances, customer incentives, promotional rebates and coupons). Revenue includes fixed and variable consideration.
Variable consideration arises on the sale of goods as a result of discounts and allowances given and accruals for estimated future returns and rebates. Discounts can either be on-invoice or off-invoice whilst allowances and rebates are generally off-invoice. The discounts, allowances and promotional rebates are recognised as a deduction from revenue at the time that the related revenue is recognised or when the Group has committed to pay the consideration, whichever is later. Variable consideration is not included in the transaction price until it is highly probable that a significant reversal in the amount of cumulative revenue recognised will not occur.
Notes to the Consolidated Financial Statements continued
The methodology and assumptions used to estimate returns and rebates are monitored and adjusted regularly in light of contractual and legal obligations, historical trends, past experience and projected market conditions. Once the uncertainty associated with the returns and rebates is resolved, revenue is adjusted accordingly. The differences between actual amounts settled and the estimated accrued amounts are recognised as a change in management estimate in the subsequent reporting period. The assumptions used in estimation are based on known facts with a high level of accuracy. In addition, the Group’s promotional programmes are typically short-term in nature resulting in lower inherent estimation uncertainty.
Some contracts for the sale of consumer health products provide customers with a right to return the goods within a specified period. A refund liability is recognised for the goods that are expected to be returned (i.e., the amount not included in the transaction price). A right of return asset (and the corresponding adjustment to cost of sales) is also recognised for the right to recover the goods from the customer. The Group uses the most likely amount method to estimate the variable consideration in contracts with a right to return.
The Group also provides retrospective volume rebates to certain customers once the products purchased during the period exceed the threshold specified in the contract. A refund liability is recognised for the expected future rebates (i.e., the amount not included in the transaction price). The Group applies the most likely amount method to estimate the variable consideration in the contract related to rebates. Volume rebates and refund liabilities are recognised in trade and other payables.
The Group has elected to apply the practical expedient not to disclose the aggregate amount of transaction price allocated to performance obligations that are unsatisfied (or partially unsatisfied) as at the end of the reporting period.
Research and development
Research and development (R&D) expenditure is charged to the income statement in the period in which it is incurred. R&D expenditure comprises expenditure that is directly attributable to the research and development of new products or variants, including the costs attributable to the generation or improvement of intellectual property and product registrations, depreciation and amortisation of equipment, real estate and IT assets used by the R&D function.
Recent accounting developments
On 20 June 2023, the UK Finance (No.2) Bill 2022-23 was substantively enacted in the UK, including legislation to implement in the UK certain parts of the OECD’s Pillar Two regime for periods beginning on or after 1 January 2024. Refer to Note 9 ‘Taxation’ for further information about the anticipated impact of this legislation. On 19 July 2023, the UK Endorsement Board adopted the temporary, mandatory deferred tax exception to IAS 12, as issued by the IASB in May 2023. The exception has been applied and the Group has neither recognised nor disclosed information about deferred tax assets or liabilities relating to Pillar Two income taxes.
IFRS 17 ‘Insurance Contracts’ is effective from 1 January 2023 and introduces a new model for accounting for insurance contracts. We have reviewed existing arrangements and concluded that IFRS 17 is not material for the Group. We have also reviewed other new standards or amendments to standards that have been issued by the IASB and are effective from 1 January 2023 and concluded that they are not material to the Group.
All new accounting standards, amendments to accounting standards and interpretations that have been published by the IASB and are not effective for 31 December 2023 reporting periods, have not been early adopted by the Group. These standards, amendments or interpretations are not expected to have a material impact on the entity in the current or future reporting periods.
3. Critical accounting judgements and key sources of estimation uncertainty
In preparing the Consolidated Financial Statements, management is required to make judgements about when or how items should be recognised in the Consolidated Financial Statements and estimates and assumptions that affect the amounts of assets, liabilities, income and expenses reported in the Consolidated Financial Statements. Actual amounts and results could differ from those estimates.
There are no critical accounting judgements. The following is the key source of estimation uncertainty.
Indefinite life brands
Estimation of the recoverable amount of indefinite life brands requires significant estimates of the value of each brand. The Group reviews indefinite life brands for impairment at least annually or when there is an indication that the assets may be impaired. The recoverable amounts of indefinite life brands are estimated using the fair value less costs to sell methodology. These calculations use management’s estimates consistent with current budgets and plans that have been formally approved, assumptions of market participants and are based on discounted cash flow forecasts using estimated long-term growth rates. Refer to Note 14 ‘Intangible assets’ for further details about the Group’s indefinite life brands and sensitivity analysis of Preparation H.
124 Haleon Annual Report and Form 20-F 2023 | Financial Statements |
| Financial Statements | ||||||
4. Segment information
The Group is organised into business units based on geographical areas and has
| – | North America |
| – | Europe, Middle East, Africa and Latin America (EMEA & LatAm) |
| – | Asia Pacific (APAC) |
No operating segments have been aggregated to form the above reportable operating segments.
The Group’s Commercial Operations Board, which consists of the CEO, CFO and other members of senior leadership, is the Chief Operating Decision Maker (CODM) who monitors the operating results of the Group’s reportable segments separately for the purpose of making decisions about resource allocation and performance assessment. The CODM uses a measure of adjusted operating profit to assess the performance of the reportable segments. Adjusted operating profit is defined as operating profit less net intangible amortisation and impairment of brands, licences, and patents, restructuring costs, transaction-related costs, separation and admission costs, and disposals and others. The CODM does not review IFRS operating profit or total assets on a segment basis.
The composition of these geographical segments is reviewed on an annual basis. Analysis of revenue and adjusted operating profit by geographical segment is included below:
Revenue by segment
2023 | 2022 | 2021 | |
North America | | | |
EMEA & LatAm | | | |
APAC | | | |
Group revenue | | | |
Transactions between Haleon’s geographical regions are carried out at arm’s length terms in accordance with appropriate transfer pricing rules and Organisation for Economic Cooperation and Development (OECD) principles.
Adjusted operating profit by segment
2023 | 2022 | 2021 | |
Group operating profit | | | |
Reconciling items between Group operating profit and Group adjusted operating profit1 | | | |
Total | | | |
North America | | | |
EMEA & LatAm | | | |
APAC | | | |
Corporate and other unallocated | ( | ( | ( |
Total | | | |
| 1 | The reconciling items above include: |
| a) | Net amortisation and impairment of intangible assets of £ |
| b) | Restructuring costs of £ |
| c) | Transaction-related costs of £ |
| d) | Separation and admission costs of £ |
| e) | Disposals and others of £ |
Notes to the Consolidated Financial Statements | Haleon Annual Report and Form 20-F 2023 125 |
Notes to the Consolidated Financial Statements continued
The primary products sold by each of the reportable segments consist of Oral Health, Vitamins, Minerals and Supplements, Pain Relief, Respiratory Health, Digestive Health and Other products and the product portfolio is consistent across the reportable segments. Analysis of revenue by market category is included below:
Revenue by market category
2023 | 2022 | 2021 | |
Oral Health | | | |
Vitamins, Minerals and Supplements | | | |
Pain Relief | | | |
Respiratory Health | | | |
Digestive Health and Other | | | |
Group revenue | | | |
Revenue attributable to the country of domicile and foreign countries with the most significant contribution to the Group’s revenue are included below:
Revenue by geography
2023 | 2022 | 2021 | |
UK | | | |
US & Puerto Rico | | | |
China | | | |
Rest of the World | | | |
Group revenue | | | |
Other segmental information
North America | EMEA & | APAC | Other | Total | |
Year ended 31 December 2023 | |||||
Impairment charges | | | | | |
Impairment reversal | – | – | – | – | – |
Year ended 31 December 2022 | |||||
Impairment charges | | | | | |
Impairment reversal | – | – | – | – | – |
Year ended 31 December 2021 | |||||
Impairment charges | | | | | |
Impairment reversal | – | – | – | ( | ( |
Non-current assets attributable to the country of domicile and all foreign countries with significant non-current assets are included below:
2023 | 2022 | 2021 | |
UK | | | |
US & Puerto Rico | | | |
Rest of the World | | | |
Non-current assets | | | |
Non-current assets by location excludes derivatives, deferred tax assets and post-employment benefit assets.
126 Haleon Annual Report and Form 20-F 2023 | Financial Statements |
| Financial Statements | ||||||
5. Other operating (expense)/ income
Other operating expense/income includes income and expense from all other operating activities which are not related to the ordinary course of business of the Group, such as gains/losses from disposals and transaction-related costs.
In 2023, the Group recognised £
In 2022, the Group recognised a £
6. Operating profit
Expenditure is recognised in respect of goods and services received when supplied in accordance with contractual terms. Provision is made when an obligation exists for a future liability in respect of a past event and where the amount of the obligation can be reliably estimated. Advertising & Promotion (A&P) expenditure is charged to the income statement as incurred. Shipment costs on intercompany transfers are charged to cost of sales; distribution costs on sales to customers are included in selling, general and administration (SG&A).
Key expenses included in operating profit
2023 | 2022 | 2021 | ||
Advertising and promotion1 | | | | |
Distribution costs1 | | | | |
Separation and admission costs | | | | |
Restructuring costs | | | |
| 1 | Reported within selling, general and administration. |
Separation and admission costs represent costs incurred in relation to and in connection with the separation and listing of the Group as a standalone business in 2022. Separation and admission costs are reported within cost of sales (2023: £
Restructuring costs
Restructuring costs are recognised and provided for, where appropriate, in respect of the direct expenditure of a business reorganisation where the plans are sufficiently detailed and well advanced, and where a valid expectation to those affected has been created by either starting to implement the restructuring plans or announcing its main features. Restructuring costs are those mainly related to specific Board-approved restructuring programmes, including integration costs following material acquisitions, which are structural in nature and significant in scale.
Restructuring costs include severance and other personnel costs, professional fees, impairments of assets, and other related items.
Haleon may undertakesrestructuring programmes in response to changes in the Group’s trading environment and overall strategy or following significant acquisitions. Costs, both cash and non-cash, of these programmes are provided for as individual elements are approved and meet the accounting recognition criteria. As a result, charges may be incurred over a number of years following the initiation of a major restructuring programme.
Restructuring costs in 2023 mainly relate to business transformation activities associated with our programme to increase productivity and agility. In 2022 and 2021, restructuring costs mainly related to activities aiming to generate synergies from the integration of the Pfizer Group’s Consumer Healthcare business into the Group’s business, following the Pfizer Transaction completed on 31 July 2019. Refer to Note 21 ‘Provisions’ for further details about the Group’s restructuring provisions.
A breakdown of the restructuring costs is included below:
2023 | 2022 | 2021 | ||
Cost of sales | | | | |
Selling, general and administration, and other operating expenses | | | | |
Research and development | | ( | | |
Total | | | |
2023 | 2022 | 2021 | ||
Cash | | | | |
Non-cash | | | | |
Total | | | |
Notes to the Consolidated Financial Statements | Haleon Annual Report and Form 20-F 2023 127 |
Notes to the Consolidated Financial Statements continued
Fees payable to the Group’s auditors (and their associates) included in operating profit
In April 2023 KPMG LLP (UK) was appointed as external auditor for the Group. In the previous year, in light of UK and US rules on independence, the Group had two external auditors KPMG LLP (US) and Deloitte LLP. KPMG LLP (US) was appointed to conduct an audit of the Group’s financial statements under the rules and standards of the US Securities and Exchange Commission (SEC) and the US Public Company Accounting Oversight Board (PCAOB) standards. Deloitte LLP was engaged in respect of the statutory audit of the financial statements of the Group’s parent company and its subsidiaries in accordance with International Standards of Auditing (UK ISAs). A fee breakdown for each firm is shown in the table below.
2023 | 2022 | 2021 | |||
KPMG LLP (UK) | Audit of Group Consolidated Financial Statements | | – | – | |
Audit of the Company’s subsidiaries | | – | – | ||
Audit services | | – | – | ||
Other services1 | | – | – | ||
Total | | – | – | ||
KPMG LLP (US) | Audit of Group Consolidated Financial Statements | – | | – | |
Audit services | – | | – | ||
Other services1 | – | | – | ||
Total | – | | – | ||
Deloitte LLP | Audit of Parent Company and Consolidated Financial Statements2 | – | | | |
Audit of the Company’s subsidiaries | – | | | ||
Audit services | – | | | ||
Other assurance services3 | – | | | ||
Total | – | | |
| 1 | Other services provided by KPMG relate to permissible tax compliance and advisory services £ |
| 2 | Includes (2022: £ |
| 3 | Includes (2022: £ |
7. Employees and remuneration of key management personnel
Employees
The average number of employees by individual geographical segment and the Group’s total employment costs are included below.
Average number of employees
2023 | 2022 | 2021 | |
North America | | | |
EMEA & LatAm | | | |
APAC | | | |
Total1 | | | |
| 1 | The increase in average number of employees is mainly due to the build-up of sales force in India after the termination of the Consignment Selling Agreement (CSA) with Unilever, employees of the acquired manufacturing site in Brazil, and the recruitment for Haleon standalone support function after the demerger. The increase was partially offset by the impact of the productivity programme. |
Aggregate remuneration of all employees including Directors
2023 | 2022 | 2021 | |
Wages and salaries | | | |
Social security costs | | | |
Pensions and other post-employment costs (Note 20) | | | |
Share-based incentive plans (Note 26) | | | |
Severance costs from integration and restructuring activities | | | |
Total | | | |
128 Haleon Annual Report and Form 20-F 2023 | Financial Statements |
| Financial Statements | ||||||
Remuneration of key management personnel
Key management personnel comprises the Executive Directors and the Executive Team. The compensation of key management personnel in respect of their services to the Group in aggregate was as follows:
Remuneration of key management personnel
2023 | 2022 | 2021 | |
Wages and salaries | | | |
Social security costs | | | |
Pensions and other post-employment costs | | | |
Share-based incentive plans | | | |
Non-executive directors fees | | – | – |
Total | | | |
Directors’ remuneration
In 2021,
8. Net finance costs
Net finance costs comprise finance expense and finance income. Finance income includes income on cash and cash equivalents and income on other financial assets. Finance expense includes interest costs in relation to financial liabilities including interest on bonds and lease liabilities, which represents the unwind of the discount rate applied to lease liabilities. Borrowing costs are recognised based on the effective interest method.
Net finance costs
2023 | 2022 | 2021 | |
Interest income on financial assets at amortised cost: | |||
Other receivables | – | | |
Cash and cash equivalents | | | |
Financial assets measured at fair value through profit or loss | | ( | |
Net gains and losses arising from: | |||
Financial instruments mandatorily measured at fair value through profit or loss | ( | | ( |
Retranslation of loans and bonds | | ( | |
Total finance income | | | |
Interest expense arising on: | |||
Financial liabilities at amortised cost | ( | ( | ( |
Derivatives at fair value through profit or loss | – | | ( |
Reclassification of hedges from other comprehensive income | | | – |
Finance expense arising on lease liabilities | ( | ( | ( |
Other finance expense | ( | ( | ( |
Total finance expense | ( | ( | ( |
Net finance costs | ( | ( | ( |
9. Taxation
Income tax
Income tax expense represents the sum of the current and deferred taxes.
Current tax payable or recoverable is based on taxable profit for the year, and any adjustments in respect of prior periods. Taxable profit differs from profit as reported in the income statement because some items of income or expense are taxable or deductible in different years or may never be taxable or deductible. The amount of current tax payable or receivable is the best estimate of the amount expected to be paid to, or received from, tax authorities. It is calculated using tax rates and laws that have been substantively enacted at the reporting date.
Tax assets and liabilities are offset when there is a legally enforceable right to set off current tax assets against current tax liabilities and when they either relate to income taxes levied by the same taxation authority on either the same taxable entity or on different taxable entities which intend to settle the current tax assets and liabilities on a net basis.
Notes to the Consolidated Financial Statements | Haleon Annual Report and Form 20-F 2023 129 |
Notes to the Consolidated Financial Statements continued
Tax is charged or credited to the income statement, except when it relates to items charged or credited to other comprehensive income/(expense) or directly to equity, in which case the tax is recognised in other comprehensive income/(expense) or in equity.
The Group recognises provisions for uncertain tax positions when it is probable that a tax authority would not accept an uncertain tax treatment. This is done by assuming the tax authority will examine all the amounts and would have full knowledge of all related information when making those examinations. Uncertain tax positions are assessed and measured on an issue-by-issue basis within the jurisdictions that we operate either using management’s estimate of the most likely outcome where the issues are binary, or the expected value approach where the issues have a range of possible outcomes.
Where open tax matters exist, the ultimate liability for such matters may vary from the amounts provided and is dependent upon the outcome of negotiations with the relevant tax authorities or, if necessary, litigation proceedings. At 31 December 2023, the Group had recognised provisions of £
The Group recognises interest on late paid taxes as part of financing costs, and any penalties, if applicable, as part of the income tax expense.
Tax charged to the income statement
The major components of income tax expense are:
Taxation charge/(credit) based on profits for the period
2023 | 2022 | 2021 | |
Current year charge | | | |
Charge in respect of prior periods | ( | | ( |
Total current taxation | | | |
Total deferred taxation | ( | | ( |
Total | | | |
The tax charge on the Group’s profit for the year can be reconciled from the standard rate of corporation tax in the UK of
Reconciliation of the taxation rate on the Group profits
2023 | 2022 | 2021 | |
Profit before tax | | | |
UK statutory rate of taxation of | | | |
Differences in overseas taxation rates | ( | | |
Benefit of substance-based tax rulings | ( | ( | ( |
R&D tax credits | ( | ( | ( |
Tax losses not recognised | – | | |
Permanent differences on disposals, acquisitions and transfers | | – | ( |
Items non-deductible/taxable for tax purposes | | | |
Re-assessment of prior year estimates | ( | | ( |
Changes in tax rates | | | |
Total tax charge | | | |
The Group has a substantial business presence in many countries around the world. The effect of overseas tax rates represents the tax impact on profits arising outside the UK that are then taxed at rates different to the statutory rate in the UK. In 2023 this results in a reduction to the tax charge due to the increase in the statutory rate of tax in the UK, whereas in 2022 and 2021 this impact was to increase the tax charge. In all years, beneficial incentives offered in certain countries have reduced the overall tax charge.
The tax effect of disposals, acquisitions and transfers can vary from the accounting profit or loss that arises. The items recorded in 2023 and 2021 relate to intra-group transfers. The tax impact of these transfers are a charge and a credit respectively, reflected in deferred tax, and relates to the different tax rates and rules that exist in various jurisdictions around the world.
Items non-deductible/taxable for tax purposes include irrecoverable withholding taxes, charges on controlled foreign companies, as well as legal and transactional fees that are not deductible for tax purposes.
130 Haleon Annual Report and Form 20-F 2023 | Financial Statements |
| Financial Statements | ||||||
The re-assessment of prior year estimates includes settlements reached following conclusion of tax authority review and differences between final tax return submissions and liabilities accrued in these financial statements; the release of prior year uncertain tax positions and a one-off deferred tax adjustment of £
The impact of changes in tax rates results from the revaluation of temporary differences due to new tax rates coming into force. In 2023, this primarily relates to new Cantonal legislation substantively enacted in Switzerland that increases the applicable tax rate from 2025. In 2022 and 2021, similar changes to tax rates impacted the Group in the US and the UK respectively.
Future tax charges, and therefore the effective tax rate, may be affected by factors such as acquisitions, disposals, restructurings, the location of research and development activity, tax regime reforms, agreements with tax authorities and resolution of open matters as the Group continues to bring its tax affairs up to date around the world.
On 20 June 2023, the UK Finance (No.2) Bill 2022-23 was substantively enacted in the UK, including legislation to implement in the UK certain parts of the OECD’s Pillar Two regime for periods beginning on or after 1 January 2024. These rules will apply to the Group. The primary purpose of this legislation is to introduce a global minimum tax rate of
Tax authorities around the world are responding to the new rules in a variety of ways, with examples being the introduction of corporate income tax, amendments to statutory rates of tax, and the introduction of ‘Domestic Minimum Top Up Taxes’. The precise implementation of the changes will dictate how any additional tax will be calculated and reported by the Group in the future. Based on the rules in force at the reporting date, it is estimated that the impact of Pillar Two will increase the adjusted effective tax rate of the Group by less than
In addition to the amounts charged to the income statement, tax of £
Deferred tax
Deferred tax is the tax expected to be payable or recoverable in the future arising from temporary differences between the carrying amounts of assets and liabilities in the financial statements and the corresponding tax bases used in the computation of taxable profit. It is accounted for using the statement of financial position liability method. Deferred tax liabilities are generally recognised for all taxable temporary differences and deferred tax assets are recognised to the extent that it is probable that temporary differences or taxable profits will be available against which deductible temporary differences can be utilised.
Such assets and liabilities are not recognised if the temporary difference arises from the initial recognition (other than in a business combination) of assets and liabilities in a transaction that affects neither the taxable profit nor the accounting profit. Deferred tax liabilities are not recognised to the extent they arise from the initial recognition of non-tax deductible goodwill. In addition, the Group has neither recognised nor disclosed information about deferred tax assets or liabilities relating to Pillar Two income taxes as required by the temporary, mandatory deferred tax exception to IAS 12. Refer to Note 2 ‘Accounting policies’.
Deferred tax liabilities are recognised for taxable temporary differences arising on investments in subsidiaries and associates, and interests in joint arrangements, except where the Group is able to control the reversal of the temporary difference and it is probable that the temporary difference will not reverse in the foreseeable future.
The carrying amount of deferred tax assets is reviewed at each reporting period date and adjusted to reflect changes in the Group’s assessment that sufficient taxable profits will be available to allow all or part of the asset to be recovered. Deferred tax is calculated at the tax rates that are expected to apply in the period when the liability is settled or the asset realised, based on tax rates that have been enacted or substantively enacted by the reporting period date.
Deferred tax assets and liabilities comprise of:
2023 | 2022 | |
Deferred tax assets | | |
Deferred tax liabilities | ( | ( |
Total | ( | ( |
Notes to the Consolidated Financial Statements | Haleon Annual Report and Form 20-F 2023 131 |
Notes to the Consolidated Financial Statements continued
Movement in deferred tax assets and liabilities
Accelerated capital allowances | Intangibles | Pensions & other post-employment benefits | Tax losses | Intra-group profit | Other net | Total | |
As at 1 January 2023 | ( | ( | | | | | ( |
Exchange adjustments | | | ( | ( | ( | ( | |
(Charge)/credit to income statement | ( | ( | | ( | | | |
(Charge)/credit to statement of comprehensive income | – | – | ( | – | – | | – |
Credit directly to equity | – | – | – | – | – | | |
At 31 December 2023 | ( | ( | | | | | ( |
Accelerated capital allowances | Intangibles | Pensions & other post-employment benefits | Tax losses | Intra-group profit | Other net | Total | |
As at 1 January 2022 | ( | ( | | | | | ( |
Exchange adjustments | ( | ( | | | | | ( |
(Charge)/credit to income statement | ( | ( | | | | | ( |
(Charge)/credit to statement of comprehensive income | – | – | ( | – | – | ( | ( |
Reclassification and other movements | – | | – | – | – | ( | – |
At 31 December 2022 | ( | ( | | | | | ( |
Provision for deferred tax liabilities of £
The Group has recognised a deferred tax asset for trading losses of £
10. Dividends
Dividends are recognised on the date that the shareholder’s right to receive payment is established. Interim dividends are recognised when they become payable to Company’s shareholders. Final dividends are recognised when they are approved by shareholders. The Board are proposing a final dividend for the year ended 31 December 2023 of
Dividends declared and paid during the year
2023 | 2022 | 2021 | |||||||
Paid/payable | Dividend per share (pence) | Total dividend (£m) | Paid/payable | Dividend per share (£) | Total dividend (£m) | Paid/payable | Dividend per share (£) | Total dividend (£m) | |
2023 interim dividend | 5 Oct 2023 | | | n/a | n/a | n/a | n/a | n/a | n/a |
2022 final dividend | 27 Apr 2023 | | | n/a | n/a | n/a | n/a | n/a | n/a |
Pre-demerger dividends1 | n/a | n/a | n/a | n/a | | | n/a | | |
| 1 | During 2022 and 2021, the Group declared and paid a series of dividends to GSK and Pfizer under the Shareholders’ Agreement valid at that time. The dividends per share for the dividends declared and paid before the demerger activities that took place in July 2022 were paid from the former ultimate holding company of CHHL2 and were calculated based on CHHL2’s share structure. In 2022, the Group utilised a £ |
132 Haleon Annual Report and Form 20-F 2023 | Financial Statements |
| Financial Statements | ||||||
11. Earnings per share
Basic earnings per share is calculated by dividing the profit attributable to shareholders by the Company’s weighted average number of share units in issue during the year after deducting treasury shares or shares held by employee benefit trusts (EBTs) if any.
Basic earnings per share for the year ended 31 December 2021 has been adjusted retrospectively, as required by IAS 33 ‘Earnings per share’, to reflect the share structure of the Company resulting from the increase in the number of ordinary shares outstanding as a result of the demerger activities that took place in July 2022. As a result, basic earnings per share for the year ended 31 December 2021 has been calculated by dividing the profit attributable to shareholders by the Company’s weighted average number of shares in issue, with
Diluted earnings per share has been calculated after adjusting the weighted average number of shares used in the basic calculation to assume the conversion of all potentially dilutive shares. There were
The total number of shares held in connection with employee long-term incentive schemes as at 31 December 2023 was
Earnings per share
2023 | 2022 | 2021 | |
Profit after tax attributable to equity shareholders (£m) | | | |
Weighted average number of shares (million) | | | |
Weighted average number of shares (held by EBTs) (million)1 | ( | – | – |
Basic weighted average number of shares (million) | | | |
Effect of dilutive potential shares (million) | | | – |
Diluted weighted average number of shares (million) | | | |
Basic earnings per share (pence) | | | |
Diluted earnings per share (pence) | | | |
| 1 | The total number of shares held as at 31 December 2023 was |
12. Property, plant and equipment
Land, buildings, plant, equipment and vehicles are valued at their cost, less any accumulated depreciation and any accumulated impairment losses.
Assets under construction are carried at cost, less any recognised impairment losses. Depreciation of these assets commences when the assets are ready for their intended use.
The cost of property, plant and equipment includes directly attributable incremental costs incurred in acquisition and installation of the assets.
Depreciation is recognised on a straight-line basis, over the estimated useful lives of the asset. Residual values and useful lives are reviewed, and where appropriate adjusted annually. Estimated useful lives of the major categories of assets are shown below:
Freehold buildings | |
Leasehold land and buildings | Lease term or |
Plant and machinery | |
Equipment and vehicles |
Property, plant and equipment is subject to review for impairment if triggering events or circumstances indicate an impairment may exist. If an indication of impairment exists, the recoverable amount of the asset or cash generating unit is estimated and any impairment loss is charged to the income statement as it arises.
Where there has been a change in the estimates used to determine recoverable amount and an impairment loss subsequently reverses, the carrying amount of the asset is increased to the revised estimate of its recoverable amount, not to exceed the carrying amount that would have been determined had no impairment loss been recognised for the asset in prior years and an impairment loss reversal is recognised immediately in the income statement.
On disposal of property, plant and equipment, the cost and related accumulated depreciation and impairments are derecognised from the Consolidated Financial Statements and the net amount, less any proceeds, is taken to the income statement.
Notes to the Consolidated Financial Statements | Haleon Annual Report and Form 20-F 2023 133 |
Notes to the Consolidated Financial Statements continued
Property, plant and equipment
Land and | Plant, | Assets under | Total | |
Cost at 1 January 2022 | | | | |
Exchange adjustments | | | | |
Additions | | | | |
Disposals and write-offs | ( | ( | – | ( |
Reclassifications | ( | | ( | ( |
Cost at 31 December 2022 | | | | |
Exchange adjustments | ( | ( | ( | ( |
Additions | | | | |
Additions from business acquisitions | | | | |
Disposals and write-offs | ( | ( | – | ( |
Reclassifications | | | ( | ( |
Cost at 31 December 2023 | | | | |
Depreciation at 1 January 2022 | ( | ( | – | ( |
Exchange adjustments | ( | ( | – | ( |
Charge for the year | ( | ( | – | ( |
Disposals and write-offs | | | – | |
Depreciation at 31 December 2022 | ( | ( | – | ( |
Exchange adjustments | | | – | |
Charge for the year | ( | ( | – | ( |
Disposals and write-offs | | | – | |
Reclassifications | | ( | – | – |
Depreciation at 31 December 2023 | ( | ( | – | ( |
Impairment at 1 January 2022 | ( | ( | ( | ( |
Exchange adjustments | ( | ( | – | ( |
Impairment losses | – | ( | – | ( |
Disposals and write-offs | | | – | |
Reclassifications | – | | – | |
Impairment at 31 December 2022 | ( | ( | ( | ( |
Exchange adjustments | – | | – | |
Impairment losses | – | ( | ( | ( |
Disposals and write-offs | – | | – | |
Impairment at 31 December 2023 | ( | ( | ( | ( |
Depreciation and impairment at 31 December 2022 | ( | ( | ( | ( |
Depreciation and impairment at 31 December 2023 | ( | ( | ( | ( |
Net book value at 31 December 2022 | | | | |
Net book value at 31 December 2023 | | | | |
Reversals of impairment arise from subsequent reviews of the impaired assets where the conditions which gave rise to the original impairments are deemed no longer to apply.
Reclassifications include £
134 Haleon Annual Report and Form 20-F 2023 | Financial Statements |
| Financial Statements | ||||||
Impact of climate change
Management undertook a modelling exercise to estimate the potential impact that extreme weather events could have on the Group’s manufacturing sites. Management considered that the hazards with the greatest potential impact over the long-term time horizon are riverine and flash flooding, and heatwaves. Given the geographical spread of the Group’s manufacturing sites, the prospect of every site being impacted in any given year, or for every year, is considered remote and as a result, the level of loss potentially arising would not be considered significant for the Group. In addition, the majority of the Group’s assets have useful lives that end ahead of the medium- to long-term timescales expected for extreme climate events to occur. Therefore, we consider that there is no material impairment risk on the property, plant, and equipment balances for the year as a result of climate change.
13. Right of use assets
When the Group leases an asset, a ‘right of use asset’ is recognised for the leased item and a lease liability is recognised for any lease payments to be paid over the lease term at the lease commencement date except for short-term leases (defined as leases with a lease term of 12 months or less) and leases of low-value assets (defined as assets with an initial fair value less than approximately £
The right of use asset is initially measured at cost, being the present value of the lease payments paid or payable, plus any initial direct costs incurred in entering into the lease and less any lease incentives received. Non-lease components are accounted for separately from the lease components in plant and equipment leases but are not separately accounted for in land and buildings or vehicle leases.
Right of use assets where title is expected to pass to the Group at a point in the future are depreciated in a manner consistent to that for owned property, plant and equipment. In other cases, right of use assets are depreciated over the shorter of the useful life of the asset or the lease term. The lease term is the non-cancellable period of the lease plus any periods for which the Group is ‘reasonably certain’ to exercise any extension options. If right of use assets are considered to be impaired, the carrying value is reduced accordingly.
Lease liabilities are initially measured at the value of the lease payments over the lease term that are not paid at the commencement date and are usually discounted using the incremental borrowing rates of the applicable Group entity (the rate implicit in the lease is used if it is readily determinable). Lease payments included in the lease liability include both fixed payments and in-substance fixed payments during the term of the lease.
After initial recognition, the lease liability is recorded at amortised cost using the effective interest method. It is remeasured when there is a change in future lease payments or if the Group’s assessment of the lease term changes; any changes in the lease liability as a result of these changes also results in a corresponding change in the recorded right of use asset.
Right of use assets
Land and | Plant and | Vehicles | Total | |
Net book value at 1 January 2022 | | | | |
Exchange adjustments | | – | | |
Additions | | – | | |
Depreciation | ( | ( | ( | ( |
Net book value at 31 December 2022 | | – | | |
Exchange adjustments | ( | – | ( | ( |
Additions | | | | |
Depreciation | ( | – | ( | ( |
Disposals and write-offs | ( | – | – | ( |
Net book value at 31 December 2023 | | | | |
The total cash outflow for leases amounted to £
Notes to the Consolidated Financial Statements | Haleon Annual Report and Form 20-F 2023 135 |
Notes to the Consolidated Financial Statements continued
14. Intangible assets
Goodwill
Goodwill arising on consolidation represents the excess of the fair value of the consideration transferred over the fair value of the Group’s share of the identifiable assets and liabilities of the acquired subsidiaries at the date of acquisition. Goodwill is not subject to amortisation but is tested annually for impairment, or more frequently where indicators of impairment exist and is carried at cost less any accumulated impairment losses.
For the purpose of impairment testing, assets are grouped in cash generating units (CGUs). A CGU is identified as the lowest aggregation of assets that generate largely independent cash inflows, and which is looked at by management for monitoring and managing the business.
If the recoverable amount of the CGU is less than the carrying amount, an impairment loss is allocated first to reduce the carrying amount of any goodwill allocated to the CGU and then to the other assets of the CGU pro rata on the basis of the carrying amount of each asset in the CGU. Any impairment loss is immediately recognised in the consolidated income statement and an impairment loss recognised for goodwill is not subsequently reversed.
The recoverable amount is the higher of fair value less costs of disposal and value in use. In assessing value in use, the estimated future cash flows are discounted to their present value using a pre-tax discount rate that reflects current market assessments of the time value of money and the risks specific to the asset for which the estimates of future cash flows have not been adjusted.
Management uses the approved three-year strategic plan and the projected cash flows for a further two-year period as the basis for the Group CGUs value in use calculations.
On disposal, the attributable amount of goodwill is included in the determination of the gain or loss on disposal.
Other intangibles
Intangible assets are recognised when they are identifiable, the Group controls the asset, it is probable that future economic benefits attributed to the asset will flow to the Group and the cost of the asset can be reliably measured.
Separately purchased brands are initially measured at cost, being the purchase price as at the date of acquisition. Acquired brands are valued independently and recognised at fair value when the Group completes a business combination from third parties, where brands have a value which is substantial and long term and where the brands either are contractual or legal in nature or can be sold separately from the rest of the businesses acquired. The determination of the fair values of the separately identified intangibles is based, to a considerable extent, on management’s judgement. Brands are amortised over their estimated useful lives of up to
Indefinite life brands mainly comprise trademarks and brands for which there is no foreseeable limit to the period over which they are expected to generate net cash inflows. These are considered to have an indefinite life, given the strength and durability of the brands and the level of advertising and promotion support. These brands are in relatively similar, stable and profitable market sectors, with similar risk profiles, and their size, diversification and market shares mean that the risk of market-related factors causing a reduction in the lives of the brands is considered to be relatively low. The Group is not aware of any material legal, regulatory, contractual, competitive, economic or other factors which could limit their useful lives. Accordingly, they are not amortised.
Intangible assets are stated at cost less provisions for amortisation and impairments. Licences, patents, know-how and marketing rights separately acquired or acquired as part of a business combination are amortised over their estimated useful lives, generally not exceeding
Any development costs incurred by the Group and associated with acquired licences, patents, know-how or marketing rights are written off to the income statement when incurred.
The costs of acquiring and developing computer software for internal use and internet sites for external use are capitalised as intangible fixed assets where the software or site supports a significant business system and the expenditure leads to the creation of an asset. Enterprise Resource Planning (ERP) systems software is amortised over
The carrying values of all non-current assets are reviewed for impairment, either on a standalone basis or as part of a larger CGU, when there is an indication that the assets might be impaired. Additionally, intangible assets with indefinite useful lives and intangible assets which are not yet available for use are tested for impairment annually. Any provision for impairment is charged to the income statement. If the recoverable amount of an intangible is less than the carrying amount, an impairment loss is recognised in the income statement. The recoverable amount is the higher of fair value less costs of disposal and value in use. Impairment losses are only reversed if there has been a change in estimates used to determine recoverable amounts and only to the extent that the revised recoverable amounts do not exceed the carrying values that would have existed, net of amortisation, had no impairments been recognised.
136 Haleon Annual Report and Form 20-F 2023 | Financial Statements |
| Financial Statements | ||||||
Intangible assets
Goodwill | Indefinite life | Amortised | Computer | Assets under construction | Total | |
Cost at 1 January 2022 | | | | | – | |
Exchange adjustments | | | ( | | – | |
Additions | – | | | | – | |
Disposals and write-offs | – | ( | ( | ( | – | ( |
Reclassifications | – | – | – | | – | |
Transfer to assets held for sale | – | ( | – | – | – | ( |
Cost at 31 December 2022 | | | | | – | |
Exchange adjustments | ( | ( | ( | ( | ( | ( |
Additions | | – | | | | |
Disposals and write-offs | – | – | ( | ( | – | ( |
Reclassifications | – | ( | | | | |
Transfer to assets held for sale | – | ( | ( | – | – | ( |
Cost at 31 December 2023 | | | | | | |
Amortisation at 1 January 2022 | – | – | ( | ( | – | ( |
Exchange adjustments | – | – | ( | ( | – | ( |
Charge for the period | – | – | ( | ( | – | ( |
Disposals and write-offs | – | – | | | – | |
Transfer to assets held for sale | – | – | – | – | – | – |
Amortisation at 31 December 2022 | – | – | ( | ( | – | ( |
Exchange adjustments | – | – | | | – | |
Charge for the period | – | – | ( | ( | – | ( |
Disposals and write-offs | – | – | | | – | |
Reclassifications | – | – | ( | – | – | ( |
Transfer to assets held for sale | – | – | | – | – | |
Amortisation at 31 December 2023 | – | – | ( | ( | – | ( |
Impairment at 1 January 2022 | – | ( | – | ( | – | ( |
Exchange adjustments | – | ( | – | – | – | ( |
Impairment losses | – | ( | – | ( | – | ( |
Disposals and write-offs | – | | – | | – | |
Impairment at 31 December 2022 | – | ( | – | ( | – | ( |
Exchange adjustments | – | | – | – | – | |
Impairment losses | – | ( | ( | ( | – | ( |
Reversal of impairment losses | – | – | – | – | – | – |
Reclassifications | – | – | ( | – | – | ( |
Disposals and write-offs | – | – | – | | – | |
Transfer to assets held for sale | – | | – | – | – | |
Impairment at 31 December 2023 | – | ( | ( | ( | – | ( |
Amortisation and impairment at 31 December 2022 | – | ( | ( | ( | – | ( |
Amortisation and impairment at 31 December 2023 | – | ( | ( | ( | – | ( |
Net book value at 31 December 2022 | | | | | – | |
Net book value at 31 December 2023 | | | | | | |
The net book value of computer software included £
In 2023, the Group completed the disposal of the rights in Lamisil, an amortised brand, for cash consideration of £
Notes to the Consolidated Financial Statements | Haleon Annual Report and Form 20-F 2023 137 |
Notes to the Consolidated Financial Statements continued
On 21 December 2023, the Group entered into a binding agreement for the sale of the ChapStick brand to Suave Brands Company, a portfolio company of Yellow Wood Partners. Under the terms of the transaction, the Group will receive pre-tax cash proceeds of approximately £
The Group recognised an impairment of £
Asset held for sale include the recoverable assets attributable to the ChapStick brand.
Goodwill impairment
Goodwill mainly arose from the Novartis Transaction in 2015 (£
Goodwill is allocated to the Group’s CGUs as follows:
2023 | 2022 | |
North America | | |
EMEA & LatAm | | |
APAC | | |
Net book value at 31 December | | |
The recoverable amounts of the CGUs are assessed using a value in use model (2022: value in use). Value in use is calculated using a discounted cash flow approach, with a pre-tax discount rate applied to the projected risk-adjusted pre-tax cash flows and terminal value.
The discount rate used is based on the pre-tax weighted average cost of capital (WACC) of the CGUs. The discount rates are specific to each CGU and are determined based on the cost of capital, including a market premium and country-specific political risk premiums.
Details relating to the discounted cash flow model used in the impairment tests of the APAC, EMEA & LatAm, and North America CGUs are as follows:
Valuation basis | Value in use | ||
Key assumptions | Sales growth rates | ||
Profit margins | |||
Terminal growth rates | |||
Discount rates | |||
| Taxation rates | ||
Determination of assumptions | Growth rates are internal forecasts based on both internal and external market information. | ||
Margins reflect past experience, adjusted for expected changes. | |||
Terminal growth rates are based on internal projections and external forecasts of the relevant markets. | |||
Discount rates are based on the Group WACC, adjusted where appropriate. | |||
| Taxation rates are based on appropriate rates for each CGU. | ||
Period of specific projected cash flows | Five years | ||
Terminal growth rates | 2023 | 2022 | |
North America | |||
EMEA & LatAm | |||
APAC | |||
Discount rates (pre-tax) | 2023 | 2022 | |
North America | |||
EMEA & LatAm | |||
APAC | |||
The terminal growth rate does not exceed the long-term projected growth rate for the Group. Goodwill is monitored for impairment at individual CGU level. In each case the valuation indicated substantial headroom such that it is remote that a reasonably possible change to key assumptions would result in an impairment of goodwill.
138 Haleon Annual Report and Form 20-F 2023 | Financial Statements |
| Financial Statements | ||||||
Indefinite life brands and amortised brands impairment
Indefinite life brands comprise a portfolio of consumer health products. The net book value of the major brands are as follows:
2023 | 2022 | |
Advil | | |
Voltaren | | |
Centrum | | |
Caltrate | | |
Otrivin | | |
Robitussin | | |
Preparation H | | |
Nexium | | |
Fenistil | | |
Emergen-C | | |
Theraflu | | |
Panadol | | |
Sensodyne | | |
Nicotinell | | |
Excedrin | | |
Polident | | |
Biotene | | |
Vitasprint | | |
Corega | | |
ChapStick1 | – | |
Other brands | | |
Total | | |
| 1 | ChapStick has been classified as an asset held for sale as at 31 December 2023. |
The Group tests all its indefinite life brands for impairment by applying a fair value less costs to sell model using a three-year strategic plan approved by management and cash flows beyond the three-year period are extrapolated using the terminal growth rates. All brands were tested for impairment using brand-specific assumptions which included a discount rate equal to the Group’s post-tax WACC of
In 2023, the Group recorded a non-cash impairment charge of £
Additionally, in 2023, the carry value of Preparation H continues to be sensitive to reasonably possible changes in key assumptions. The post- tax discount rate used for the brand is
Other than as disclosed above, management do not consider that any reasonably possible changes in the key assumptions would cause the fair value less costs to sell of the individually significant brands disclosed above to fall below their carrying values.
In 2022, the Group recorded an impairment charge of £
Notes to the Consolidated Financial Statements | Haleon Annual Report and Form 20-F 2023 139 |
Notes to the Consolidated Financial Statements continued
For Robitussin’s impairment testing in 2023, we have applied a post-tax discount rate of
Robitussin was sensitive to reasonably possible changes in key assumptions in 2021 and continued to be sensitive in 2022. Although the brand had recovered from the lower cold and flu incidence resulting from COVID-19 social distancing measures from previous years, the discount rate increased in 2022 causing the brand’s headroom to continue to be low at approximately
For 2021, the income statement charge for net impairment losses includes impairments of Zyrtec, Treely and capitalised costs for a discontinued research and development project, netted off by reversal of impairments in relation to Alvedon, Abreva and Solpadeine.
Certain assets were transferred from intangible assets to assets held for sale and subsequently disposed of during the year.
A breakdown of the amortisation, impairment losses and reversals is included below:
Amortisation | Net impairment | |||||
2023 | 2022 | 2021 | 2023 | 2022 | 2021 | |
Cost of sales | | | | | | ( |
Selling, general and administration | | | | | | |
Research and development | – | – | – | – | – | |
Total | | | | | | ( |
Impact of climate change
The Group has stress tested the future cash flows for the potential impact of climate change and concluded that there is sufficient headroom for goodwill. Preparation H’s recoverable amount is sensitive to reasonably possible changes in key assumptions that would lead to an immaterial additional impairment charge due to either physical damage in our manufacturing sites or the associated costs of future transition risk. Carbon pricing is the highest potential transition risk that could have a medium risk in medium- to long-term time frame. With continued decarbonisation efforts and Haleon’s focus on meeting the targets to minimise carbon pricing impacts, this is not expected to have a material impact on the key assumptions used in the impairment assessment.
15. Inventories
Inventories are included in the Consolidated Financial Statements at the lower of cost (including raw materials, direct labour, other direct costs and related production overheads) and net realisable value. Cost is determined on a first in, first out basis. Net realisable value is the estimated selling price less the estimated costs necessary to make a sale.
Composition of inventory balances
2023 | 2022 | |
Raw materials and consumables | | |
Work in progress | | |
Finished goods | | |
Total | | |
The total cost of inventories recognised as an expense and included in cost of sales amounted to £
The reversals of prior year write-downs of inventories in 2023 is £
Impact of climate change
The Group’s inventory turnover cycle is much shorter than the longer-term time horizons associated with the climate-related risks and therefore the risk of material write-down of Haleon’s inventory is deemed to be low.
140 Haleon Annual Report and Form 20-F 2023 | Financial Statements |
| Financial Statements | ||||||
16. Trade and other receivables
Trade receivables are initially measured at the original invoice amount and subsequently measured at amortised cost less allowances for expected credit losses which are measured at an amount equal to lifetime expected credit losses. In determining credit risk, the Group considers reasonable and supportable information that is relevant and available without undue costs or effort. This includes both quantitative and qualitative information and analysis based on the Group’s ageing of the receivables, customers’ payment history, and forward-looking information including wider macroeconomic factors. Trade receivables sold under a non-recourse factoring agreement are derecognised at the point of sale as risks and rewards are substantially transferred.
When a trade receivable is determined to have no reasonable expectation of recovery it is written off, firstly against any expected credit loss allowance available and then to the income statement.
Subsequent recoveries of amounts previously provided for or written off are credited to the income statement. Long-term receivables are discounted where the effect is material.
Trade and other receivables
2023 | 2022 | |||||
Current | Non-current | Total | Current | Non-current | Total | |
Trade receivables, net of expected credit loss allowance | | – | | | – | |
Other prepayments and accrued income | | – | | | – | |
Employee loans and advances | | – | | | – | |
Other third-party receivables | | | | | | |
Total | | | | | | |
Expected credit loss allowance
2023 | 2022 | |
At 1 January | | |
Exchange adjustments | ( | |
Charge for the year | | |
Subsequent recoveries of amounts provided for | ( | ( |
Utilised | ( | ( |
At 31 December | | |
Set out below is the information about the credit risk exposure of the Group’s trade receivables using a provision matrix:
Year ended 31 December 2023
Trade receivables | |||||||||||||
Days past due | |||||||||||||
Current | 0-30 days | 31-90 days | 91-180 days | 181 days- | Greater | Total | |||||||
Estimated total gross carrying amount at default | | | | | | | | ||||||
Expected credit loss | | | | | | | | ||||||
Year ended 31 December 2022
Trade receivables | |||||||||||||
Days past due | |||||||||||||
Current | 0-30 days | 31-90 days | 91-180 days | 181 days- | Greater | Total | |||||||
Estimated total gross carrying amount at default | |||||||||||||
Expected credit loss | |||||||||||||
Notes to the Consolidated Financial Statements | Haleon Annual Report and Form 20-F 2023 141 |
Notes to the Consolidated Financial Statements continued
Concentrations of credit risk with respect to trade receivables are limited due to the Group’s customer base being large and diverse.
Within other third-party receivables, £
17. Cash and cash equivalents
Cash and cash equivalents comprise of cash at bank and in hand and short-term highly liquid deposits which are primarily held for operating purposes with an original maturity of three months or less, that are readily convertible to a known amount of cash and subject to an insignificant risk of changes.
Cash and cash equivalents include £
Cash and cash equivalents held in the following currencies, that mostly influence the Group, are presented below:
2023 | 2022 | |
Pound Sterling (GBP) | | |
Taiwan Dollar (TWD) | | |
United States Dollar (USD) | | |
Indian Rupee (INR) | | |
Euro (EUR) | | |
Others | | |
Total | |
18. Trade and other payables
Trade payables are initially recognised at fair value and then held at amortised cost. Long-term payables are discounted where the effect is material. Trade payables are derecognised when the original liability is either discharged, usually through payment, or substantially modified.
Composition of trade and other payables
2023 | 2022 | |
Trade payables | | |
Customer return and rebate accruals | | |
Other payables and accruals | | |
Wages and salaries | | |
Accrued interest on financial liabilities | | |
Social security | | |
VAT payables | | |
Deferred income | | |
Total | | |
142 Haleon Annual Report and Form 20-F 2023 | Financial Statements |
| Financial Statements | ||||||
Customer return and rebate accruals are provided for by the Group at the point of sale in respect of the estimated rebates, discounts or allowances payable to customers. Accruals are made at the time of sale but the actual amounts paid are based on claims made some time after the initial recognition of the sale. The level of accrual is reviewed and adjusted quarterly in light of historical experience of actual rebates, discounts or allowances given and returns made and any changes in arrangements. The assumptions used in estimation are based on known facts with a high level of accuracy. In addition, the Group’s promotional programmes are typically short-term in nature resulting in lower inherent estimation uncertainty. As a result, management considered no likelihood of material change in the next financial year.
Customer return and rebate accruals are not presented net against any trade receivables that may be owing from the same customer as the offsetting criteria in IAS 32 have not been met.
Refer to Note 24, ‘Related party transactions’ for further details on amounts payable to GSK and Pfizer.
The Group does not have significant financing arrangements for trade payables.
19. Borrowings
All borrowings are initially recorded at fair value, net of transaction costs. Borrowings are subsequently carried at amortised cost, with the difference between the proceeds, net of transaction costs, and the amount due on redemption being recognised as a charge to the income statement over the period of the relevant borrowing.
Lease liabilities
The corresponding liability to the lessor is recognised as a lease obligation within short-term and long-term borrowings. The carrying amount is subsequently increased to reflect interest on the lease liability and reduced by lease payments made.
For calculating the discounted lease liability on leases, the implicit rate in the lease is used. If this is not available, the incremental borrowing rate with a lease-specific adjustment is used. Finance costs are charged to the income statement to produce a constant periodic rate of charge on the remaining balance of the obligations for each accounting period.
Variable rents are not part of the lease liability and the right of use asset. These payments are charged to the income statement as incurred. Short-term and low-value leases are not capitalised, and lease rentals are also charged to the income statement as incurred.
Composition of borrowings
2023 | 2022 | |||||
Current | Non-current | Total | Current | Non-current | Total | |
Commercial paper | – | – | – | ( | – | ( |
Loan and overdrafts | ( | – | ( | ( | – | ( |
Lease liabilities | ( | ( | ( | ( | ( | ( |
Non-voting preference shares | – | ( | ( | – | ( | ( |
Bonds | ( | ( | ( | – | ( | ( |
Total | ( | ( | ( | ( | ( | ( |
Notes to the Consolidated Financial Statements | Haleon Annual Report and Form 20-F 2023 143 |
Notes to the Consolidated Financial Statements continued
Carrying value | ||
Bonds1 | 2023 | 2022 |
$ | - | |
$ | | |
$ | | |
€ | | |
$ | | |
£ | | |
$ | | |
€ | | |
$ | | |
€ | | |
£ | | |
$ | | |
Total | | |
| 1 | These instruments contain a variety of different features including early redemption options, call options, put options and mandatory early redemption options, which depend on different triggering events such as change in control, change in laws, regulations and tax law. These features are considered embedded derivatives. These features have not been accounted for separately from the instruments as they are considered closely related to the bonds. |
| 2 | The Group exercised its option to redeem at par the $ |
The issuers, Haleon UK Capital plc (formerly GSK Consumer Healthcare Capital UK plc), Haleon US Capital LLC (formerly GSK Consumer Healthcare Capital US LLC) and Haleon Netherlands Capital B.V. (formerly GSK Consumer Healthcare Capital NL B.V.) formally changed their names in March 2023.
Short-term borrowings
As at 31 December 2023, the Group had within short-term borrowings, Pre-Separation USD Notes of $
The Group has access to a £
As at 31 December 2023, the Group had short-term bank loans of £
Long-term borrowings
As at 31 December 2023, the Group had within long-term borrowings, Euro Medium Term Notes and USD Notes of £
On 2 March 2023, the Group exercised its option to redeem at par the $
On 17 July 2022, as part of the demerger activities, the Company issued
144 Haleon Annual Report and Form 20-F 2023 | Financial Statements |
| Financial Statements | ||||||
Committed credit facilities
The Group has undrawn credit facilities of £
Lease liabilities
The maturity analysis of lease liabilities recognised on the Group balance sheet is as follows:
2023 | 2022 | |
Due within one year | ( | ( |
Due between one and two years | ( | ( |
Due between two and three years | ( | ( |
Due between three and four years | ( | ( |
Due between four and five years | ( | ( |
Due after five years | ( | ( |
Total | ( | ( |
Refer to Note 8 ‘Net finance costs’ for further details on finance expense arising on lease liabilities.
Movement in assets and liabilities arising from financing activities
At 1 January | Cash flows | Foreign | Fair value | At | |
Reconciliation of movement in liabilities to cash flow statement | |||||
Long-term borrowings | ( | | | | ( |
Short-term borrowings | ( | | | ( | ( |
Lease liabilities | ( | | | ( | ( |
Derivative financial instruments | ( | | – | ( | ( |
Total financial liabilities arising from financing activities | ( | | | ( | ( |
Cash and cash equivalents net of bank overdrafts | | | ( | – | |
Total | ( | | | ( | ( |
At 1 January | Cash flows | Foreign | Fair value | At | |
Reconciliation of movement in liabilities to cash flow statement | |||||
Long-term borrowings | – | ( | ( | | ( |
Short-term borrowings | ( | ( | – | ( | ( |
Lease liabilities | ( | | ( | ( | ( |
Derivative financial instruments | ( | ( | – | | ( |
Total financial liabilities arising from financing activities | ( | ( | ( | | ( |
Cash and cash equivalents net of bank overdrafts | | | | – | |
Total | | ( | ( | | ( |
Notes to the Consolidated Financial Statements | Haleon Annual Report and Form 20-F 2023 145 |
Notes to the Consolidated Financial Statements continued
20. Pensions and other post-employment benefits
The Group operates pension arrangements which cover the Group’s material obligations to provide pensions to retired employees. These arrangements have been developed in accordance with local practices in the countries concerned. Pension benefits can be provided by state schemes, by defined contribution schemes, whereby retirement benefits are determined by the value of funds arising from contributions paid in respect of each employee, or by defined benefit schemes, whereby retirement benefits are based on employee pensionable remuneration and length of service. In certain countries, pension benefits are provided on an unfunded basis, some are administered by trustee companies. The Group also provides other post-employment benefits, mainly post-employment healthcare plans in the US. These plans are predominantly unfunded. Formal, independent, actuarial valuations of the Group’s main plans are undertaken regularly, normally at least every
For defined benefit retirement plans, the difference between the fair value of the plan assets and the present value of the plan liabilities is recognised as an asset or a liability on the consolidated balance sheet. Defined benefit plan liabilities are assessed using the projected unit funding method and applying the principal actuarial assumptions at the reporting period date consistent with the advice of qualified actuaries. Pension scheme assets are measured at fair value at the balance sheet date. The amount of any pension fund asset recognised on the balance sheet is limited to any future refunds from the plan or the present value of reductions in future contributions to the plan.
The amount charged to operating costs in the income statement is the cost of accruing pension benefits promised to employees over the year, plus the costs of individual events such as past service benefit changes, settlements, curtailments plus the finance charge for interest on net liability (such events are recognised immediately in the income statement).
Remeasurements of the net defined benefit liability (or asset) comprise actuarial gains and losses and the return on plan assets excluding amounts included in net interest. Actuarial gains and losses are taken to the consolidated statement of comprehensive income. Actuarial gains and losses comprise both the effects of changes in actuarial assumptions and experience adjustments arising from differences between the previous actuarial assumptions and what has actually occurred. The return on plan assets, in excess of interest income, and costs incurred for the management of plan assets are also taken to other comprehensive income.
The costs of other post-employment liabilities are calculated in a similar way to defined benefit pension schemes and spread over the period during which benefit is expected to be derived from the employees’ services. Future cash flows are discounted at rates reflecting the yields of high-quality corporate bonds.
The Group’s contributions to defined contribution plans are charged to the income statement as incurred.
Discount rates are derived from AA-rated corporate bond yields, except in countries where there is no deep market in corporate bonds, government bond yields are used instead. Discount rates are selected to reflect the term of the expected benefit payments. Projected inflation rate and pension increases are long-term predictions based on the yield gap between long-term index-linked and fixed-interest government bonds, where available, or on long-term inflation forecasts.
For the year ended 31 December 2021, GSK operated certain pension schemes in which the Group’s UK and US employees participated. These schemes included defined benefit arrangements where the assets were held independently of the Group’s finances and which were funded partly by contributions from members and partly by contributions from GSK at rates advised by independent qualified actuaries.
Before the demerger from GSK in July 2022, it was announced that GSK’s UK defined benefit plans and US cash balance pension plans were closed to future accruals and GSK would continue to maintain the plans only for existing participants. GSK charged the Group a management fee relating to the pension arrangements for the Group’s UK and US employees calculated as if the arrangements were on a defined contribution basis. The costs of such defined contribution arrangements were not included with the pension charge. This arrangement is not in practice post demerger.
Following the demerger from GSK, the Group operates its own defined contribution pension schemes for the Group’s UK and US employees.
In addition, there are a number of post-employment healthcare schemes, the principal one of which is in the US.
146 Haleon Annual Report and Form 20-F 2023 | Financial Statements |
| Financial Statements | ||||||
Assumptions
The Group has applied the following financial assumptions in assessing the defined benefit liabilities:
2023 | 2022 | |
Germany | ||
Rate of increase of future earnings | | |
Discount rate | | |
Expected pension increases | | |
Inflation rate | | |
Switzerland | ||
Rate of increase of future earnings | | |
Discount rate | | |
Expected pension increases | N/A | N/A |
Inflation rate | | |
Ireland | ||
Rate of increase of future earnings | | |
Discount rate | | |
Expected pension increases | | |
Inflation rate | | |
Rest of World | ||
Rate of increase of future earnings | N/A | N/A |
Discount rate | | |
Expected pension increases | N/A | N/A |
Inflation rate | | |
The average life expectancy assumed now for an individual at the age of
As at 31 December 2023
Germany | Switzerland | Ireland | Rest of World | |||||
Years | Male | Female | Male | Female | Male | Female | Male | Female |
Current | ||||||||
Projected for 2043 | ||||||||
As at 31 December 2022
Germany | Switzerland | Ireland | Rest of World | |||||
Years | Male | Female | Male | Female | Male | Female | Male | Female |
Current | ||||||||
Projected for 2042 | ||||||||
The mortality rates are based on standard tables in each country (Heubeck 2018 in Germany, BVG 2020 in Switzerland and ILT15 in Ireland)
with allowances for future improvements.
Income statement
2023 | 2022 | 2021 | |
German pension schemes | |||
Swiss pension schemes | |||
Irish pension schemes | |||
Other overseas pension schemes | |||
Unfunded post-employment healthcare schemes | |||
Total | |||
Analysed as: | |||
Defined benefit pension schemes | |||
Defined contribution pensions schemes |
Notes to the Consolidated Financial Statements | Haleon Annual Report and Form 20-F 2023 147 |
Notes to the Consolidated Financial Statements continued
The costs of the defined benefit pension and post-employment healthcare schemes are charged in the income statement as follows:
Net pensions | Other post- | Total post- | |
2023 | |||
Cost of sales | | | |
Research and development | | – | |
Selling, general and administration | | – | |
31 December 2023 | | | |
2022 | |||
Cost of sales | | | |
Research and development | | – | |
Selling, general and administration | | – | |
31 December 2022 | | | |
2021 | |||
Cost of sales | | | |
Research and development | – | – | – |
Selling, general and administration | | – | |
31 December 2021 | | | |
The amounts recorded in the income statement and statement of comprehensive income in relation to the defined benefit pension and post-employment healthcare schemes were as follows:
2023 | 2022 | 2021 | |||||||
Pensions | Other | Total | Pensions | Other | Total | Pensions | Other | Total | |
31 December | |||||||||
Amounts charged to operating profit: | |||||||||
Current service cost | | | | | | | | | |
Past service cost/(credit) | | – | | | – | | ( | – | ( |
Gain from settlement | – | – | – | – | – | – | ( | – | ( |
Net interest cost | | | | | | | | | |
Total | | | | | | | | | |
Remeasurements recorded in the statement of comprehensive income | ( | | ( | ( | ( | ( | ( | ( | ( |
Balance sheet
The assets of funded schemes are generally held in separately administered trusts, either as specific assets or as a proportion of a general fund or are insurance contracts. Assets are invested in different classes in order to maintain a balance between risk and return. Investments are diversified to limit the financial effect of the failure of any individual investment.
The pension plans are exposed to risk that arises because the estimated market value of the plans’ assets might decline, the investment returns might reduce, or the estimated value of the plans’ liabilities might increase.
Long-term investment strategies for the plans, with investments across a broad range of assets, have been agreed with the trustees to include return-seeking assets to generate future returns and liability-matching assets to better match future pension obligations. The main market risks within the asset portfolio are credit risk, interest rates, long-term inflation, equities and property risk.
The plan liabilities are a series of future cash flows with relatively long duration. On an IAS 19 basis, these cash flows are sensitive to changes in the expected long-term inflation rate and the discount rate (AA corporate bond yield curve) where an increase in long-term inflation corresponds with an increase in the liabilities, and an increase in the discount rate corresponds with a decrease in the liabilities.
148 Haleon Annual Report and Form 20-F 2023 | Financial Statements |
| Financial Statements | ||||||
The fair values of the assets and liabilities of the German, Swiss and Irish defined benefit pension schemes, together with aggregated data for other defined benefit pension schemes in the Group are as follows:
31 December 2023
Germany | Switzerland | Ireland | Rest of World | Total | |
Listed equities | | | | | |
Property | – | | – | – | |
Listed bonds | | | | | |
Insurance contracts | | | – | – | |
Other assets | | | | | |
Fair value of assets | | | | | |
Asset ceiling restriction | – | ( | – | – | ( |
Fair value of assets after asset ceiling | | | | | |
Present value of scheme obligations | ( | ( | ( | ( | ( |
Recognised on the balance sheet | ( | – | | ( | ( |
Included in post-employment benefit assets | – | – | | | |
Included in post-employment benefit obligations | ( | – | – | ( | ( |
Total | ( | – | | ( | ( |
Actual return on plan assets | | | | | |
31 December 2022
Germany | Switzerland | Ireland | Rest of World | Total | |
Listed equities | | | | | |
Property | – | | – | – | |
Listed bonds | | | | | |
Insurance contracts | | | – | – | |
Other assets | – | | | | |
Fair value of assets | | | | | |
Asset ceiling restriction | – | ( | – | – | ( |
Fair value of assets after asset ceiling | | | | | |
Present value of scheme obligations | ( | ( | ( | ( | ( |
Recognised on the balance sheet | ( | – | | ( | ( |
Included in post-employment benefit assets | – | – | | | |
Included in post-employment benefit obligations | ( | – | – | ( | ( |
Total | ( | – | | ( | ( |
Actual loss on plan assets | ( | ( | ( | ( | ( |
The defined benefit pension obligation is analysed as follows:
2023 | 2022 | |
Funded | ( | ( |
Unfunded | ( | ( |
Total | ( | ( |
Notes to the Consolidated Financial Statements | Haleon Annual Report and Form 20-F 2023 149 |
Notes to the Consolidated Financial Statements continued
The movement in the net defined benefit liability is as follows:
Fair value | Present | Net pensions | Net post | |
At 1 January 2022 | | ( | ( | ( |
Exchange adjustments | | ( | ( | ( |
Service cost | – | ( | ( | ( |
Past service cost | – | ( | ( | – |
Interest income/(cost) | | ( | ( | ( |
Remeasurements: | ||||
Return on plan assets, excluding amounts included in interest | ( | – | ( | – |
Gain from change in financial assumptions | – | | | |
Experience (losses)/gains | – | ( | ( | |
Employers' contributions | | – | | – |
Scheme participants' contributions | | ( | | – |
Benefits paid | ( | | | |
At 31 December 2022 | | ( | ( | ( |
Exchange adjustments | | ( | ( | |
Service cost | – | ( | ( | ( |
Past service cost | – | ( | ( | – |
Interest income/(cost) | | ( | ( | ( |
Remeasurements: | ||||
Return on plan assets, excluding amounts included in interest | | – | | – |
Gain from change in financial assumptions | – | ( | ( | ( |
Experience (losses)/gains | – | ( | ( | |
Employers' contributions | | – | | – |
Scheme participants' contributions | | ( | | – |
Benefits paid | ( | | | |
At 31 December 2023 | | ( | ( | ( |
A reconciliation of the net post-employment benefit to the balances recognised on the consolidated balance sheet is as follows:
2023 | 2022 | |
Net pension obligations | ( | ( |
Net post-employment obligations | ( | ( |
Net post-employment benefit | ( | ( |
Post-employment benefit assets recognised on the consolidated balance sheet | ||
Post-employment benefit obligations recognised on the consolidated balance sheet | ( | ( |
Net post-employment benefit | ( | ( |
Employer contributions for 2024 are estimated to be approximately £
The defined benefit pension and post-employment obligations analysed by membership category is as follows:
Pension | Post-employment obligations | |||
2023 | 2022 | 2023 | 2022 | |
Active | ( | ( | ( | ( |
Retired | ( | ( | ( | ( |
Deferred | ( | ( | ( | – |
Total | ( | ( | ( | ( |
The approximate effect of changes in assumptions used on the benefit obligations and on the annual defined benefit and post-employment costs are detailed below. This information has been determined by taking into account the duration of the liabilities and the overall profile of the plan membership.
150 Haleon Annual Report and Form 20-F 2023 | Financial Statements |
| Financial Statements | ||||||
Sensitivity analysis
2023 | 2022 | |
Increase in annual pension cost | | |
Increase in annual post-employment benefits cost | | |
Increase in pension obligation | | |
Increase in post-employment benefits obligation | | |
Decrease in annual pension cost | ( | ( |
Decrease in annual post-employment benefits cost | ( | ( |
Decrease in pension obligation | ( | ( |
Decrease in post-employment benefits obligation | ( | ( |
Increase in annual post-retirement cost | | |
Increase in post-retirement obligation | | |
Decrease in annual post-retirement cost | ( | ( |
Decrease in post-retirement obligation | ( | ( |
A | ||
Increase in annual pension cost | | |
Increase in annual post-employment benefits cost | | – |
Increase in pension obligation | | |
Increase in post-employment benefits obligation | | |
The weighted average duration of the defined benefit obligation is as follows:
Years | 2023 | 2022 |
Pension benefits | ||
Post-employment benefits |
Notes to the Consolidated Financial Statements | Haleon Annual Report and Form 20-F 2023 151 |
Notes to the Consolidated Financial Statements continued
21. Provisions
Provisions are recognised where a legal or constructive obligation exists at the balance sheet date, as a result of a past event, where the amount of the obligation can be reliably estimated and where the outflow of economic benefit is probable.
Provisions are measured at management’s best estimate of the most likely outcome of the expenditure required to settle the obligation at the reporting date and are discounted to present value where the effect is material. Provisions are classified as non-current where the exact timing of settlement is uncertain but they are expected to be settled in more than 12 months.
Provisions
Restructuring | Other | Total | |
As at 1 January 2022 | ( | ( | ( |
Exchange adjustments | ( | ( | ( |
Charge for the period | ( | ( | ( |
Reversed unused | | | |
Utilised | | | |
Other movements | | ( | – |
As at 31 December 2022 | ( | ( | ( |
Exchange adjustments | | | |
Charge for the period | ( | ( | ( |
Reversed unused | | | |
Utilised | | | |
Other movements | ( | | – |
As at 31 December 2023 | ( | ( | ( |
2023 | 2022 | |
To be settled within one year | ( | ( |
To be settled after one year | ( | ( |
Total provision | ( | ( |
Other provisions include employee-related, legal, environmental, and other provisions. Refer to Note 6, ‘Operating profit’ for further details about the Group’s restructuring costs.
22. Contingent liabilities and commitments
Contingent liabilities
Contingent liabilities are potential future outflows where the likelihood of payment is considered more than remote, but is not considered probable or cannot be measured reliably. No provision is made for contingent liabilities, but there is a chance that they will result in an obligation in the future.
At 31 December 2023, contingent liabilities, comprising guarantees and other items arising in the normal course of business, amounted to £
The Group is involved in significant legal and administrative proceedings, principally relating to product liabilities. The most significant of these matters, other than tax matters, are described herein. Provision is made for the outcome of tax, legal and other disputes where it is both probable that the Group will suffer an outflow of funds and it is possible to make a reliable estimate of that outflow.
Legal proceedings
The Group may become involved in legal proceedings, in respect of which it is not possible to determine whether a potential outflow is probable, or to make a reliable estimate of the expected financial effect, if any, that could result from the proceedings. In these cases, appropriate disclosure about such cases would be included but no provision would be made. Costs associated with claims made by the Group against third parties are charged to the income statement as they are incurred.
The Group makes provision for these proceedings on a regular basis as summarised in the accounting policy above.
152 Haleon Annual Report and Form 20-F 2023 | Financial Statements |
| Financial Statements | ||||||
With respect to each of the legal proceedings described below, other than those for which a provision has been made, the Group is unable to make a reliable estimate of the expected financial effect at this stage. The Group does not believe that information about the amount sought by the plaintiffs, if that is known, would be meaningful with respect to those legal proceedings. This is due to a number of factors, including, but not limited to, the stage of proceedings, the entitlement of parties to appeal a decision and clarity as to theories of liability, damages and governing law.
The Group’s position could change over time, and, therefore, there can be no assurance that any losses that result from the outcome of any legal proceedings will not exceed by a material amount the value of the provisions reported in the Group’s financial statements. If this were to happen, it could have a material adverse impact on the results of operations of the Group in the reporting period in which the judgements are incurred or the settlements entered into.
Zantac litigation
GSK and/or Pfizer have been named as defendants (alongside other manufacturers of ranitidine, as well as retailers and distributors) in personal injury lawsuits, as well as economic injury and medical monitoring class actions, filed in the US involving Zantac. The Group understands that outside the US, there are class actions and individual actions pending against GSK and Pfizer in Canada, along with a class action against GSK in Israel.
The Group is not a party to any Zantac claims and the Group has never marketed Zantac in any form in the US or Canada. The Group is not primarily liable for any OTC or prescription Zantac claims.
The Group has received notices of potential claims for indemnification relating to OTC Zantac arising out of the Stock and Asset Purchase Agreement (SAPA), which the Group has rejected on the basis that the scope of the indemnities set out in the SAPA only covers the Consumer Healthcare businesses of GSK and Pfizer as conducted when their Consumer Healthcare joint venture was formed in 2018. At that time, neither GSK nor Pfizer marketed OTC Zantac in the US or Canada.
Proton pump inhibitor litigation
The Group is a defendant in the ongoing proton pump inhibitor (PPI) litigation, in which plaintiffs allege that their use of PPIs caused serious bodily injuries, predominantly kidney-related injuries.
The Group reached a settlement agreement with plaintiffs’ counsel to resolve the vast majority of PPI cases (Nexium24HR and Prevacid24HR) pending against the Group. The financial impact was recognised in the Group’s Consolidated Financial Statements for 2022, and is not material to the Group’s financial position, results of operations or cash flows.
German competition litigation
In 2013, GlaxoSmithKline Consumer Healthcare GmbH & Co. KG and other members of a working group of a German trademark association were fined by the Federal Cartel Office of Germany as a result of the exchange of certain information related to retailers during meetings from 2004 to 2006.
Following the fine imposed by the Federal Cartel Office in 2013, the Group is party to civil proceedings in Germany brought by or on behalf of retailers against the Group and other manufacturers of branded drugstore products, alleging that the exchange of information within the working group led to higher purchase prices being paid by the retailers, and claiming that the Group and other working group members are jointly and severally liable for potential damages. The proceedings are taking place in different courts across Germany and are at different stages.
Commitments
Commitments are contractual obligations to acquire certain classes of assets in the future. These amounts are not recorded in the Consolidated Financial Statements.
2023 | 2022 | |
Contracted for but not provided in the Consolidated Financial Statements: | ||
Intangible assets | | |
Property, plant and equipment | | |
Total | |
Notes to the Consolidated Financial Statements | Haleon Annual Report and Form 20-F 2023 153 |
Notes to the Consolidated Financial Statements continued
23. Share capital, share premium and other reserves
Share capital represents the par value of shares that have been issued.
Share premium includes any premiums received on the issue of share capital. Any transaction costs associated with the issuing of shares are deducted from share premium, net of any related income tax benefits.
Other reserves include the following:
| – | EBT shares reserve comprise shares held by an employee benefit trust in connection with the Group’s share-based incentive plans. |
| – | Cash flow hedge reserve comprises gains and losses relating to these types of financial instruments. |
| – | Merger reserve arises as a result of business combinations of entities under common control. |
| – | Other reserves comprises mainly differences between the fair value of the consideration paid for an investment, and the carrying value of assets and liabilities acquired from business combinations under common control. |
Translation reserve arises from the foreign currency translation of the Group’s foreign operations into the Group’s presentation currency.
Retained earnings includes all current and prior years’ retained profits, remeasurement gains/(losses), including any tax impacts on defined benefit plans.
Share capital and share premium
At | ||
Ordinary shares at £ | Number | |
Share capital | £'000 | |
Share premium | £'000 | – |
The table above presents the movement of share capital and share premium of the Company for the year ended 31 December 2023. All ordinary shares are issued and fully paid. All ordinary shares rank equally with regard to the Company’s residual assets. Holders of these shares are entitled to dividends declared from time to time and are entitled to
Other reserves
The analysis of other reserves is as follows:
Cumulative translation reserve | EBT shares | Cash flow | Merger | Total | |
As at 1 January 2022 | | – | | ( | ( |
Other comprehensive income | – | – | | – | |
Effective portion of changes in fair value of hedging instruments | – | – | – | – | – |
Amount reclassified to income statement | – | – | – | – | – |
Effect of change in ultimate holding company | – | – | – | ( | ( |
Exchange movements on overseas net assets | | – | – | – | |
As at 31 December 2022 | | – | | ( | ( |
Other comprehensive income | – | – | | – | |
Effective portion of changes in fair value of hedging instruments | – | – | – | – | – |
Amount reclassified to income statement | – | – | ( | – | ( |
Purchase of shares by employee benefit trust | – | ( | – | – | ( |
Exchange movements on overseas net assets | ( | – | – | – | ( |
As at 31 December 2023 | | ( | | ( | ( |
| 1 | Shares owned through an EBT. The total number of shares held in connection with employee share schemes as at 31 December 2023 was |
154 Haleon Annual Report and Form 20-F 2023 | Financial Statements |
| Financial Statements | ||||||
The cumulative translation exchange in equity is attributable to:
Shareholders | Non- | Total | |
As at 1 January 2022 | | | |
Exchange movements on overseas net assets | | ( | |
As at 31 December 2022 | | | |
Exchange movements on overseas net assets | ( | ( | ( |
As at 31 December 2023 | | ( | |
24. Related party transactions
A related party under IFRS is a person or entity that is related to the Group. These include both people and entities that have, or are subject to, influence or control over the Group.
Related parties
Upon the completion of the demerger on 18 July 2022, GSK ceased to be a related party of the Group under IAS 24, ‘Related Party Disclosures’.
There were no significant transactions with Pfizer for the year ended 31 December 2023. The Group undertook significant transactions with entities from within GSK during the period ended 18 July 2022, and the year ended 31 December 2021 and with entities from within Pfizer for the years ended 31 December 2022 and 2021.
The Group had transactions with related parties under manufacture and supply agreements, distribution agreements, support service agreements, provision of research and development, toll-manufacturing services and transitional services agreements. In addition, the Group earned net interest income resulting from funds on-lent to GSK and Pfizer. All related party transactions are undertaken at arm’s length in accordance with the Group transfer pricing policy.
Where the legal completion of local transfer of assets and liabilities has been delayed, but the Group is able to exercise control over the relevant activities, the relevant net assets and profits have been recognised in the results.
Transaction values for the year ended 31 December (unless otherwise indicated):
Pfizer companies | GSK companies | ||||
2023 | 2022 | 2021 | Period ended | 2021 | |
Sales of goods | – | – | – | | |
Purchases of goods | – | – | – | ( | ( |
Services, royalties, and other income | – | – | – | | |
Services, royalties, and other expense | – | ( | ( | ( | ( |
Interest income | – | | – | | |
Interest expense | – | – | – | ( | ( |
Dividend paid | | | | | |
Balance outstanding as at 31 December:
Pfizer companies | GSK companies | |||
2023 | 2022 | 2023 | 2022 | |
Other amounts owing to related parties | – | – | – | – |
Other amounts owing from related parties | – | – | | |
Loan amounts owing to related parties | – | – | – | – |
Loan amounts owing from related parties | – | – | – | – |
Pre demerger, the Group had a £
Notes to the Consolidated Financial Statements | Haleon Annual Report and Form 20-F 2023 155 |
Notes to the Consolidated Financial Statements continued
As at 31 December 2023, other amounts owing from GSK of £
As at 31 December 2021, the loan amounts owing from related parties of £
As at 31 December 2021, the loan amounts owing to related parties of £
25. Capital and financial risk management
Financial assets are measured at amortised cost, fair value through other comprehensive income (FVTOCI) or fair value through profit or loss (FVTPL). The measurement basis is determined by reference to both the business model for managing the financial asset and the contractual cash flow characteristics of the financial asset. For financial assets other than trade receivables, a 12-month expected credit loss allowance is recorded on initial recognition. If there is subsequent evidence of a significant increase in the credit risk of an asset, the allowance is increased to reflect the full lifetime expected credit loss. If there is no realistic prospect of recovery, the asset is written off.
Derivatives and hedge accounting
Derivative financial instruments are used to manage exposure to market risks. The principal derivative instruments used by the Group are forward foreign exchange contracts and swaps.
Derivative financial instruments are classified as held-for-trading and are measured at fair value. Derivatives designated as hedging instruments are classified on inception as fair value hedges, cash flow hedges or net investment hedges. The treatment of changes in the value of derivatives depends on their use as explained below.
Fair value hedges
Certain derivatives are held to hedge the risk of changes in value of a specific bond or other loan. In these situations, the Group designates the liability and related derivative to be part of a fair value hedge relationship. The carrying value of the bond is adjusted by the fair value of the risk being hedged, with changes going to the income statement. Gains and losses on the corresponding derivative are also recognised in the income statement. The amounts recognised are offset in the income statement to the extent that the hedge is effective. Ineffectiveness may occur if the critical terms do not exactly match, or if there is a value adjustment resulting from a change in credit risk (in either the Group or the counterparty to the derivative) that is not matched by the hedged item. When the relationship no longer meets the criteria for hedge accounting, the fair value hedge adjustment made to the bond is amortised to the income statement using the effective interest method.
Cash flow hedges
Derivatives are also held to hedge the uncertainty in timing or amount of future forecast cash flows. Such derivatives are designated as being part of cash flow hedge relationships. For an effective hedge, gains and losses from changes in the fair value of derivatives are recognised in equity. Any ineffective elements of the hedge are recognised in the income statement. Ineffectiveness may occur if there are changes to the expected timing of the hedged transaction. If the hedged cash flow relates to a non-financial asset, the amount accumulated in equity is subsequently included within the carrying value of that asset. For other cash flow hedges, amounts deferred in equity are taken to the income statement at the same time as the related cash flow. When a derivative no longer qualifies for hedge accounting, any cumulative gain or loss remains in equity until the related cash flow occurs. When the cash flow takes place, the cumulative gain or loss is taken to the income statement. If the hedged cash flow is no longer expected to occur, the cumulative gain or loss is taken to the income statement immediately.
Net investment hedges
Certain derivatives and financial liabilities are designated as hedges of the currency risk on the Group’s investment in foreign subsidiaries. Differences arising on retranslation of a financial liability designated as a foreign currency net investment hedge and the fair value of derivatives are recorded in equity to the extent that the hedge is effective. These differences on retranslation and the fair value of derivatives are reported within the income statement to the extent that the hedge is ineffective. Gains and losses accumulated in equity are included in the income statement when the foreign operation is disposed of.
Derivatives for which hedge accounting is not applied
Derivatives not designated as hedges are held in order to hedge certain balance sheet items and commodity exposures. No hedge accounting is applied to these derivatives, which are carried at fair value with changes being recognised in the income statement.
Risk management
The key objectives of the Group’s treasury activities are to minimise the net cost of financial operations and reduce volatility arising from financial risks.
Treasury activities are governed by the Board. The Group has a Treasury Risk Committee (TRC), chaired by the CFO, that meets on a regular basis to review treasury activities. The TRC’s members receive management information relating to treasury activities.
156 Haleon Annual Report and Form 20-F 2023 | Financial Statements |
| Financial Statements | ||||||
The Group may use a variety of financial instruments to finance its operations and derivative financial instruments to manage market risks from these operations. Derivatives principally comprise of foreign exchange forward contracts and swaps which are used to manage interest rate and foreign exchange risk on borrowings.
Derivatives are used exclusively for hedging purposes in relation to underlying business activities and not as trading or speculative instruments.
Capital management
The Group manages its capital to ensure that entities in the Group are able to operate as going concerns whilst availing themselves of intercompany funding where appropriate.
2023 | 2022 | |
Cash and cash equivalents | | |
Short-term borrowings | ( | ( |
Long-term borrowings | ( | ( |
Derivative financial assets associated with long-term borrowings | | |
Derivative financial liabilities associated with long-term borrowings | ( | ( |
Total equity | | |
Total capital | | |
As at 31 December 2023, the Group’s long-term credit rating with S&P Global Ratings (S&P) is BBB (stable outlook) (2022: BBB) and with Moody’s Investors Service (Moody’s) it is Baa1 (stable outlook) (2022: Baa1). The Group’s short-term credit ratings are A-2 and P-2 with S&P and Moody’s, respectively (2022: A-2 and P-2 respectively).
Liquidity risk management
The Group’s policy is to borrow centrally in order to meet anticipated funding requirements. The strategy is to diversify liquidity sources and to maintain broad access to financial markets. Each day, the Group sweeps cash to or from a number of global subsidiaries and central treasury accounts for liquidity management purposes.
The Group uses both notional and physical cash pool arrangements as appropriate by location and currency. For notional cash pools, liquidity is drawn against foreign currency balances to provide both local funding and central liquidity as required and with balances actively managed and maintained to appropriate levels. As balances in notional pooling arrangements are not settled across currencies, gross cash and overdraft balances are reported. At 31 December 2023, the Group had £
The Group uses short-term financing to manage working capital requirements and has access to a $
The Group has access to
Long-term financing consists of $
Foreign exchange risk management
Foreign currency transaction exposures arising on internal and external trade flows are selectively hedged. The Group’s objective is to minimise the exposure of overseas operating subsidiaries to transaction risk by matching local currency income with local currency costs where possible. Foreign currency cash flows may be hedged selectively as approved by the TRC. Cash surpluses or borrowing requirements of subsidiary companies are usually managed centrally using foreign exchange forward contracts and swaps to hedge future repayments back into the originating currency.
Borrowings denominated in, or swapped into, foreign currencies that match investments in overseas Group assets may be treated as a hedge against the relevant assets. Forward contracts in major currencies are also used to reduce exposure to the Group’s investment in overseas assets. Refer to ‘Net investment hedges’ section of this Note for further details.
Notes to the Consolidated Financial Statements | Haleon Annual Report and Form 20-F 2023 157 |
Notes to the Consolidated Financial Statements continued
Credit risk management
Credit risk is the risk that a counterparty will default on its contractual obligations, resulting in financial loss to the Group, and arises on cash and cash equivalents and favourable derivative financial instruments held with banks and financial institutions as well as credit exposures to wholesale and retail customers, including outstanding receivables.
The Group considers its maximum credit risk to be £
The Group’s greatest concentration of credit risk at 31 December 2023 is £
There has been no change in the estimation techniques or significant assumptions made during the current reporting period in assessing the loss allowance for financial assets at amortised cost since the adoption of IFRS 9.
Treasury-related credit risk
The Group has continued to maintain a consistent approach to counterparty risk throughout the year. The aggregate credit risk in respect of financial instruments that the Group may have with one counterparty is limited by reference to the long-term credit ratings assigned for that counterparty by a recognised credit rating agency (e.g., S&P or Moody’s.) The Group measures expected credit losses over cash and cash equivalents as a function of individual counterparty credit ratings and associated 12-month default rates. Based on the available credit ratings, the credit risk of outstanding financial instruments has not increased significantly since their initial recognition. Expected credit losses over cash and cash equivalents and third-party financial derivatives are deemed to be immaterial and so have not been recognised.
AAA/Aaa | AA/Aa | A/A | BBB/Baa | BB+/Ba1 | Total | |
2023 | ||||||
Bank balances and deposits | | | | | | |
Money market funds | | | – | – | – | |
Cash and cash equivalents | | | | | | |
Government securities | – | – | – | – | | |
Derivative financial instruments | – | | | – | – | |
Total | | | | | | |
2022 | ||||||
Bank balances and deposits | – | | | | | |
Money market funds | | – | – | – | – | |
Cash and cash equivalents | | | | | | |
Derivative financial instruments | – | – | | | – | |
Total | | | | | | |
The credit ratings in the above tables are as assigned by S&P and Moody’s. Where the opinion of the two rating agencies differs, the lower rating of the two is assigned to the counterparty. Where local rating or Fitch data is the only source available, the ratings are converted to global ratings equivalent to those of S&P or Moody’s using published conversion tables.
Wholesale and retail credit risk
The Group does not have a substantial wholesale and retail credit risk as a result of its diversified geographical presence, product offering, consumer profile, and historical credit loss information. Where appropriate, the Group utilises credit insurance and receivables factoring to minimise the credit risk of the trade receivables in the Group (refer to Note 16 ‘Trade and other receivables’ for further details about the Group’s expected credit losses). Factoring arrangements are based on a portfolio approach and are used to mitigate risk arising from large credit risk concentrations. All factoring arrangements are non-recourse.
158 Haleon Annual Report and Form 20-F 2023 | Financial Statements |
| Financial Statements | ||||||
Interest rate risk management
The Group manages the interest rate risk on its net debt portfolio, with the objectives of minimising the effective net interest cost and income statement volatility.
The Group’s main interest rate risk arises from borrowings and investments with floating rates and from the refinancing of maturing fixed-rate debt where any changes in interest rates will affect future cash flows. The policy on interest rate risk management limits the net amount of floating-rate debt to a specific cap.
Interest rate and forward starting interest rate swaps
The forward starting interest rate contracts, exchanging floating interest for fixed interest, were designated as cash flow hedges to hedge the interest variability of the interest cash flows associated with the future fixed-rate debt.
The interest rate swap contracts, exchanging fixed interest rate for floating interest, have been designated as fair value hedges to hedge the variability in fair value associated with the Group’s fixed-rate debt. The interest rate swaps and the interest payments on the loan occur simultaneously and the fair value of interest rate swaps and the fair value of related debt affect the income statement at the same time.
Derivative financial instruments and hedging
Derivative financial instruments are used to mitigate exposure to foreign exchange transactional risks of the Group. The fair value of a derivative financial instrument is classified as a non-current asset or liability if the remaining maturity is more than 12 months and as a current asset or liability if the maturity is less than 12 months. All foreign exchange contracts are for periods of
The Group has the following derivative financial instruments:
2023 | 2022 | |||||
Notional | Fair value | Fair value | Notional | Fair value | Fair value | |
Non-current | ||||||
Fair value hedges – interest rate swap contracts | | – | ( | | | ( |
Net investment hedges – cross currency interest rate swaps | | | – | | | ( |
Current | ||||||
Net investment hedges – foreign exchange contracts | | | ( | | | ( |
Cash flow hedges – foreign exchange contracts | | | ( | – | – | – |
Derivatives designated and effective as hedging instruments | | | ( | | | ( |
Non-current | ||||||
Cross currency interest rate swap contracts | | | ( | | | – |
Current | ||||||
Foreign exchange contracts | | | ( | | | ( |
Derivatives classified as held for trading | | | ( | | | ( |
Total derivative instruments | | | ( | | | ( |
Fair value hedges
At issuance in March 2022, $
Cash flow hedges
In 2022, the Group entered into forward starting interest rate swaps (derivatives) to pre-hedge interest rate risk on the fixed rate bonds issued in March 2022. These derivatives were designated in a cash flow hedge relationship. The derivatives were settled in March 2022 and as a result cash flow hedges were terminated with a net cash inflow of £
In 2023, the Group established a programme of hedging highly probable forecast transactional foreign exchange exposure using foreign exchange contracts (FX forwards and FX swaps). The key exposure designated under cash flow hedge accounting are forecast receipts from customers and payments to suppliers, capital expenditure and other administration expenses payable in foreign currency.
Notes to the Consolidated Financial Statements | Haleon Annual Report and Form 20-F 2023 159 |
Notes to the Consolidated Financial Statements continued
Net investment hedges
At 31 December 2023 and 31 December 2022, certain foreign exchange contracts and cross currency interest rate swaps were designated as net investment hedges in respect of the foreign currency translation risk arising on consolidation of the Group’s net investment in its European (Euro) and Chinese (CNY) foreign operations as shown in the table above.
The carrying value of the EUR bonds in Note 19 ‘Borrowings’ included £
The following tables provide information regarding hedging instruments and the related hedged items as at 31 December:
Hedging instruments
Average | Notional | Change in fair value | Carrying value | |
2023 | ||||
Cash flow hedges | ||||
Below 10 years | ||||
FX forward contracts/FX swaps | N/A | |||
Fair value hedges | ||||
Below 10 years | ||||
EUR IRS | | ( | ( | |
USD IRS | | ( | ( | |
Net investment hedges | ||||
Below 10 years | ||||
EUR FX swaps | | | | |
CNH CCIRS | | | | |
CNH FX swaps/forward | | | | |
EUR bonds | N/A | | | ( |
10-30 years | ||||
EUR bonds | N/A | | | ( |
2022 | ||||
Fair value hedges | ||||
Below 10 years | ||||
EUR IRS | | ( | ( | |
USD IRS | | ( | ( | |
Net investment hedges | ||||
Below 10 years | ||||
EUR FX swaps | | | ( | ( |
CNH CCIRS | | | ( | ( |
EUR bonds | N/A | | ( | ( |
10-30 years | ||||
EUR bonds | N/A | | ( | ( |
160 Haleon Annual Report and Form 20-F 2023 | Financial Statements |
| Financial Statements | ||||||
Hedged items
2023 | 2022 | |||||||
Carrying | Accumulated | Change in | Balance in | Carrying | Accumulated | Change in | Balance in | |
Cash flow hedges | ||||||||
Pre-hedging of long-term interest rate | – | – | – | ( | – | – | – | ( |
Transactional FX forecast exposure3 | | – | – | ( | – | – | – | |
Fair value hedges | ||||||||
Bonds4 | ( | | | – | ( | | | – |
Net investment hedges | ||||||||
Net assets in foreign currency5 | | ( | ( | – | | | | – |
| 1 | Accumulated fair value adjustments on the hedged items included in the carrying amount of the hedged item. |
| 2 | Balance in cash flow hedge reserve for continued transactional FX forecast hedges and discontinued hedges net of tax. |
| 3 | In 2023 the Group established a programme to hedge forecast transactional foreign exchange exposure. |
| 4 | The difference in change in value for calculating hedge ineffectiveness between derivatives and bonds is due to upfront cash receipt on derivatives and hedge ineffectiveness. |
| 5 | Relates to net investment hedges which is part of the translation reserve in equity. |
The following table details the effectiveness of the hedging relationships and the amounts reclassified from the hedging reserve to the income statement for cash flow hedges, recognised under finance income or expense. There was no ineffectiveness on fair value or net investment hedges.
Hedging | Hedge | Hedged | As hedged | |
2023 | ||||
Cash flow hedges | ||||
Transactional FX hedge | | – | – | |
Pre-hedging of long-term interest rates | ||||
Below 10 years | | – | – | |
10-30 years | | – | – | |
2022 | ||||
Cash flow hedges | ||||
Pre-hedging of long-term interest rates | ||||
Below 10 years | | | – | |
10-30 years | | – | – | – |
Fair value of financial assets and liabilities excluding lease liabilities
The table on the next page presents the carrying amounts and the fair values of the Group’s financial assets and liabilities. The fair values of the financial assets and liabilities are included at the price that would be received to sell an asset or paid to transfer a liability in an orderly transaction between market participants at the measurement date.
The following methods and assumptions were used to estimate the fair values:
| – | Cash and cash equivalents carried at amortised cost, trade and other receivables and certain other non-current assets, loans amounts owing from/(to) related parties, trade and other payables and certain other non-current liabilities: approximates to the carrying amount. |
| – | Cash and cash equivalents (money market funds) carried at fair value: based on net asset value of the funds. |
| – | Short-term loans, overdrafts and commercial paper: approximates to the carrying amount because of the short maturity of these instruments. |
| – | Interest rate swaps and foreign exchange contracts: based on present value of contractual cash flows using market-sourced data (exchange rates and interest rates) at the balance sheet date. |
| – | Long-term loans: based on executable quotes or thinly traded prices (a level 2 fair value measurement) for European and US Medium Term Notes; based on present value of contractual cash flows for non-voting preference shares and based on the approximation of the carrying amount in the case of other floating-rate bank loans. |
Notes to the Consolidated Financial Statements | Haleon Annual Report and Form 20-F 2023 161 |
Notes to the Consolidated Financial Statements continued
2023 | 2022 | |||
Carrying | Fair value | Carrying | Fair value | |
Financial assets measured at amortised cost: | ||||
Cash and cash equivalents | | | | |
Trade and other receivables and certain other non-current assets | | | | |
Loan amounts owing from related parties | – | – | – | – |
Financial assets mandatorily measured at fair value through profit or loss: | ||||
Held for trading derivatives that are not in a designated and effective hedging relationship | | | | |
Cash and cash equivalents (money market funds) | | | | |
Derivatives designated and effective as hedging instruments | ||||
Fair value hedge | – | – | | |
Cash flow hedge | | | – | – |
Net investment hedge | | | | |
Total financial assets | | | | |
Financial liabilities measured at amortised cost: | ||||
Short-term loans and overdrafts | ( | ( | ( | ( |
Other bonds | ( | ( | ( | ( |
Commercial papers | – | – | ( | ( |
Non-voting preference shares | ( | ( | ( | ( |
Trade and other payables and certain other non-current liabilities in scope of IFRS 9 | ( | ( | ( | ( |
Bonds in a designated hedge relationship | ( | ( | ( | ( |
Financial liabilities mandatorily measured at fair value through profit or loss: | ||||
Held for trading derivatives that are not in a designated and effective hedging relationship | ( | ( | ( | ( |
Derivatives designated and effective as hedging instruments | ||||
Fair value hedge | ( | ( | ( | ( |
Cash flow hedge | ( | ( | – | – |
Net investment hedge | ( | ( | ( | ( |
Total financial liabilities | ( | ( | ( | ( |
Net financial assets and financial liabilities | ( | ( | ( | ( |
Financial instruments held at fair value shown according to the fair value hierarchy is provided below. Financial assets and liabilities held at fair value are categorised by the valuation methodology applied in determining their fair value. Where possible, quoted prices in active markets are used (level 1). Where such prices are not available, the asset or liability is classified as level 2, provided all significant inputs to the valuation model used are based on observable market data. If one or more of the significant inputs to the valuation model is not based on observable market data, the instrument is classified as level 3.
162 Haleon Annual Report and Form 20-F 2023 | Financial Statements |
| Financial Statements | ||||||
At 31 December 2023 | Level 1 | Level 2 | Level 3 | Total |
Financial assets at fair value through profit or loss: | ||||
Held for trading derivatives that are not in a designated and effective hedging relationship | – | | – | |
Cash and cash equivalents (money market funds) | | – | – | |
Derivatives designated and effective as hedging instruments: | ||||
Cash flow hedge | – | | – | |
Net investment hedge | – | | – | |
Total financial assets | | | – | |
Financial liabilities at fair value through profit or loss: | ||||
Held for trading derivatives that are not in a designated and effective hedging relationship | – | ( | – | ( |
Derivatives designated and effective as hedging instruments | ||||
Fair value hedge | – | ( | – | ( |
Cash flow hedge | – | ( | – | ( |
Net investment hedge | – | ( | – | ( |
Total financial liabilities | – | ( | – | ( |
At 31 December 2022 | Level 1 | Level 2 | Level 3 | Total |
Financial assets at fair value through profit or loss: | ||||
Held for trading derivatives that are not in a designated and effective hedging relationship | – | | – | |
Cash and cash equivalents (money market funds) | | – | – | |
Derivatives designated and effective as hedging instruments in a fair value hedge | ||||
Fair value hedge | – | | – | |
Cash flow hedge | – | – | – | – |
Net investment hedge | – | | – | |
Total financial assets | | | – | |
Financial liabilities at fair value through profit or loss: | ||||
Held for trading derivatives that are not in a designated and effective hedging relationship | – | ( | – | ( |
Derivatives designated and effective as hedging instruments in a fair value hedge | ||||
Fair value hedge | – | ( | – | ( |
Cash flow hedge | – | – | – | – |
Net investment hedge | – | ( | – | ( |
Total financial liabilities | – | ( | – | ( |
Other assets and liabilities in scope of IFRS 9
Trade and other receivables and other non-current assets
The following table reconciles financial instruments within trade and other receivables and other non-current assets which fall within the scope of IFRS 9 to the relevant balance sheet amounts.
The financial assets are predominantly non-interest earning. Non-financial instruments include tax receivables and prepayments, which are outside the scope of IFRS 9.
At 31 December 2023 | At 31 December 2022 | |||||
Financial | Non-financial | Total | Financial | Non-financial | Total | |
Trade and other receivables (Note 16) | | | | | | |
Other non-current assets (Note 16) | | | | | | |
Total | | | | | | |
Notes to the Consolidated Financial Statements | Haleon Annual Report and Form 20-F 2023 163 |
Notes to the Consolidated Financial Statements continued
Trade and other payables, other provisions and other non-current liabilities
The following table reconciles financial liabilities within trade and other payables, other provisions and other non-current liabilities which fall within the scope of IFRS 9 to the relevant balance sheet amounts. Accrued wages and salaries are included within financial liabilities. Non-financial instruments include payments on account, tax and social security payables and provisions which do not arise from contractual obligations to deliver cash or another financial asset, which are outside the scope of IFRS 9.
At 31 December 2023 | At 31 December 2022 | |||||
Financial | Non-financial | Total | Financial | Non-financial | Total | |
Trade and other payables (Note 18) | ( | ( | ( | ( | ( | ( |
Provisions (Note 21) | ( | ( | ( | ( | ( | ( |
Other non-current liabilities | ( | ( | ( | ( | ( | ( |
Total | ( | ( | ( | ( | ( | ( |
Offsetting of financial assets and liabilities
Financial assets and liabilities are offset and the net amount reported in the balance sheet where there is a legally enforceable right to offset the recognised amounts, and there is an intention to settle on a net basis or realise the asset and settle the liability simultaneously. There are also arrangements that do not meet the criteria for offsetting but still allow for the related amounts to be offset in certain circumstances, such as bankruptcy or the termination of a contract.
The following tables set out the financial assets and liabilities that are offset, or subject to enforceable master netting arrangements and other similar agreements but not offset, as at 31 December 2023 and 31 December 2022. The column ‘Net amount’ shows the impact on the Group’s balance sheet if all offset rights were exercised.
At 31 December 2023 | Gross financial | Gross financial | Net financial | Related | Net amount |
Financial assets | |||||
Derivative financial assets | | – | | ( | |
Financial liabilities | |||||
Derivative financial liabilities | ( | – | ( | | ( |
At 31 December 2022 | |||||
Financial assets | |||||
Derivative financial assets | | – | | ( | |
Financial liabilities | |||||
Derivative financial liabilities | ( | – | ( | | ( |
Amounts which do not meet the criteria for offsetting on the balance sheet but could be settled net in certain circumstances principally relate to derivative transactions under International Swaps and Derivatives Association (ISDA) agreements where each party has the option to settle amounts on a net basis in the event of default of the other party. As there is presently not a legally enforceable right of offset, these amounts have not been offset in the balance sheet but have been presented separately in the tables above.
164 Haleon Annual Report and Form 20-F 2023 | Financial Statements |
| Financial Statements | ||||||
Sensitivity analysis
Foreign exchange sensitivity
The
2023 | 2022 | |
– | ( | |
– | | |
| | |
( | ( |
The equity impact, shown below, for foreign exchange sensitivity relates to derivative and non-derivative financial instruments hedging the Group’s net investments in its European (Euro) and Chinese (CNY) foreign operations.
2023 | 2022 | |
( | ( | |
| | |
( | ( | |
| |
Interest rate sensitivity
The Group is exposed to interest rate risk on its outstanding borrowings and investments where any changes in interest rates will affect future cash flows or the fair values of financial instruments. The table below shows the Group’s hypothetical sensitivity to changes in interest rates in relation to Pound Sterling, US Dollar and Euro variable rate financial assets and liabilities, including derivatives. If the interest rates applicable to floating-rate financial assets and liabilities were to have increased by
2023 | 2022 | |
| | |
( | ( | |
( | ( |
Notes to the Consolidated Financial Statements | Haleon Annual Report and Form 20-F 2023 165 |
Notes to the Consolidated Financial Statements continued
Contractual cash flows for non-derivative financial liabilities and derivative instruments
The following table provides an analysis of the anticipated contractual cash flows including interest payable for the Group’s borrowings on an undiscounted basis. Interest is calculated based on debt held at the balance sheet date without taking account of future issuance. Floating-rate interest is estimated using the prevailing interest rate at the balance sheet date. Cash flows in foreign currencies are translated using spot rates at the balance sheet date.
At 31 December 2023 | Borrowings | Interest on | Lease | Interest | Trade | Total |
Due in less than one year | | | | | | |
Between one and two years | | | | | | |
Between two and three years | | | | | – | |
Between three and four years | | | | | – | |
Between four and five years | | | | – | – | |
After five years | | | | – | – | |
Gross contractual cash flows | | | | | | |
At 31 December 2022 | ||||||
Due in less than one year | | | | | | |
Between one and two years | | | | | | |
Between two and three years | | | | | | |
Between three and four years | | | | | | |
Between four and five years | | | | | – | |
After five years | | | | | – | |
Gross contractual cash flows | | | | | | |
The table below provides an analysis of the anticipated contractual cash flows for the Group’s derivative instruments, using undiscounted cash flows. Cash flows in foreign currencies are translated using spot rates at 31 December. The gross cash flows of foreign exchange contracts are presented for the purposes of this table although, in practice, the Group uses standard settlement arrangements to reduce its liquidity requirements on these instruments.
2023 | 2022 | |||
Receivables | Payables | Receivables | Payables | |
Foreign exchange contracts | ||||
Due in less than one year | | ( | | ( |
Interest rate swap contracts | ||||
Due in less than one year | | ( | | ( |
Between one and two years | | ( | | ( |
Between two and three years | | ( | | ( |
Between three and four years | | ( | | ( |
Between four and five years | | ( | – | – |
After five years | | ( | – | – |
Gross contractual cash flows | | ( | | ( |
166 Haleon Annual Report and Form 20-F 2023 | Financial Statements |
| Financial Statements | ||||||
26. Employee share schemes
Incentives in the form of share awards are provided to employees under share schemes. The fair value of equity-settled share schemes is calculated at the grant date using a fair value model and is charged to the income statement over the vesting period with a corresponding adjustment to the equity share-based payment reserve. At the end of each reporting period, the Group reviews its charge and revises it accordingly based on the number of shares expected to vest. The impact of the revision of the original estimates, if any, is recognised in profit or loss such that the cumulative expense reflects the revised estimate.
For cash-settled share-based payments, the fair value of service rendered is based on the fair value of the liability related to the share-based instrument granted.
Description of the Group’s plans
The Group operates a number of share-based payment schemes for Executive Directors and other employees which are predominantly equity-settled, however may be cash-settled in certain locations.
Performance Share Plan
Under the Performance Share Plan, awards are granted to Executive Directors and other employees over ordinary shares or ADS in Haleon plc at no cost. The percentage of each award that vests is based upon the performance of the Group over a defined measurement period with dividends reinvested during the same period. The performance conditions attached to each award are based on
Share Value Plan
Under the Share Value Plan, awards are granted to qualifying employees over ordinary shares or ADS in Haleon plc at no cost. These awards generally vest after
Share Save and Share Reward Plans
The Share Save and Share Reward Plans are HMRC-approved savings-related plans. These plans are made available to all UK employees.
The Share Save Plan enables participants to save up to £
Participants of the Share Reward Plan contribute up to £
Deferred Annual Bonus Plan (DABP)
Executive Directors are required to defer
Legacy GSK share plans
Incentives in the form of shares in the Group’s equity shareholder, GSK plc, were provided to employees under share award schemes until the demerger date. The share-based compensation charge for these schemes has been recorded in the income statement as selling, general and administration (2022: £
Haleon has also issued Deferred Investment Awards, representing the conversion of legacy GSK awards subsequently issued in Haleon plc ordinary shares. This is a cash-settled share-based payment transaction.
Notes to the Consolidated Financial Statements | Haleon Annual Report and Form 20-F 2023 167 |
Notes to the Consolidated Financial Statements continued
The total cost between each of the relevant schemes is as below:
Charge (£m) | 2023 | 2022 |
Equity-settled | ||
Performance Share Plan | | |
Share Value Plan | | |
Share Save Plan | | – |
Cash-settled | ||
Share Value Plan | | |
Total | | |
The Group has £
The movements in ordinary shares, ADS awards and share options during the year, split between each of the relevant schemes, are shown below:
Performance Share Plan | Share Value Plan | Share Save Plan1 | |||
Number of share awards ('000) | Ordinary shares | ADS | Ordinary shares | ADS | Share options |
At 1 January 2022 | |||||
Awards granted | | | | | |
Dividends reinvested | – | – | – | – | – |
Awards released/exercised | – | – | – | – | – |
Awards cancelled | – | – | – | – | – |
At 31 December 2022 | | | | | |
Awards granted | | | | | |
Dividends reinvested | | | | – | n/a |
Awards released/exercised | – | – | ( | ( | ( |
Awards cancelled | ( | ( | ( | ( | ( |
At 31 December 2023 | | | | | |
| 1 | Number of share options exercisable as at 31 December 2023 was |
Fair value of awards
The weighted average fair values of share awards and share options granted during the year were as below:
Weighted fair value | 2023 | 2022 |
Performance Share Plan | ||
Ordinary shares | £ | £ |
ADS | $ | $ |
Share Value Plan | ||
Ordinary shares | £ | £ |
ADS | $ | $ |
Share Save Plan1 | ||
Share options | £ | £ |
| 1 | Weighted average exercise prices (£) for options exercised during the year was £ |
168 Haleon Annual Report and Form 20-F 2023 | Financial Statements |
| Financial Statements | ||||||
For the purposes of valuing options in relation to the Share Save Plan to arrive at the share-based payment charge, a Black-Scholes option pricing model has been used. The assumptions used in the model are as follows:
2023 Grant | 2022 Grant | |
Weighted average fair value at the measurement date (£) | ||
Risk-free interest rate (%) | ||
Expected dividend yield (%) | ||
Volatility (%) | ||
Expected life (years) | ||
Share Save Plan-related options grant price (including | £ | £ |
The expected volatility reflects the assumption that the historical volatility over a period similar to the life of the share options is indicative of future trends, which may not necessarily be the actual outcome.
At 31 December 2023, the range of exercise prices on options outstanding were between £
There has been no change in the effective exercise price of any outstanding options during the year.
Employee benefit trusts
The Group sponsors employee benefit trusts (EBTs) to acquire and hold shares in Haleon plc to satisfy awards made under employee share plans. The trustees of the EBTs purchase shares with finance provided by the Group by way of gifts or loans. The costs of running the EBTs are charged to the income statement. Shares held by the EBTs are deducted from other reserves and amortised down to the value of proceeds, if any, receivable from other subsidiaries on exercise by a transfer to retained earnings. The trustees have waived their rights to dividends on the shares held by the EBTs. At 31 December 2023, the EBTs held
27. Business acquisitions and disposals
Business combinations where common control exists at the time of the transaction are accounted for by adopting the principles of predecessor accounting. Such business combinations are accounted for by recognising all assets and liabilities acquired at their previous carrying values with effect from the beginning of the earliest period reported in the financial statements. No new goodwill arises from such transactions and the differences between the fair value of the consideration paid and the carrying value of assets and liabilities acquired is recorded within equity in the merger reserve.
Business combinations where common control does not exist before the transaction are accounted for using the acquisition accounting method. Identifiable assets, liabilities and contingent liabilities acquired are measured at fair value at acquisition date. The consideration transferred is measured at fair value and includes the fair value of any contingent consideration. Where the consideration transferred, together with the non-controlling interest, exceeds the fair value of the net assets, liabilities and contingent liabilities acquired, the excess is recorded as goodwill, denominated in the currency of the operation acquired.
The costs related to business combinations are charged to the income statement in the period in which they are incurred. Where not all the equity of a subsidiary is acquired, the non-controlling interest is recognised either at fair value or at the non-controlling interest’s share of the net assets of the subsidiary, on a case-by-case basis.
Disposal groups are generally measured at the lower of their carrying value or fair value less costs to sell. Any gain or loss resulting from the disposal is recognised in the consolidated income statement.
Changes in the Group’s ownership percentage of subsidiaries are accounted for within equity.
Acquisitions
On 28 April 2023, the Group completed the acquisition of the Jacarepaguá (Brazil) manufacturing site from GSK for a final consideration of £
Notes to the Consolidated Financial Statements | Haleon Annual Report and Form 20-F 2023 169 |
Notes to the Consolidated Financial Statements continued
28. Non-controlling interests
Non-controlling interests comprises equity interests in entities not attributable, directly or indirectly, to a parent. The Group’s non-controlling interests are individually not material.
29. Post balance sheet events
On 29 February 2024 the Board proposed a final dividend of
30. Subsidiaries
Accounting policy
A subsidiary is an entity directly or indirectly controlled by the Company. Control is achieved where the Company has existing rights that give it the current ability to direct the activities that affect the Company’s returns and exposure or rights to variable returns from the entity.
The results of subsidiaries acquired or disposed of during the year are included in the consolidated income statement from the effective date of acquisition or up to the effective date of disposal, as appropriate. Where necessary, adjustments are made to the financial statements of subsidiaries to bring their accounting policies in line with those used by the Group. All intra-group transactions, balances, income and expenses are eliminated on consolidation. Non-controlling interests in the net assets of consolidated subsidiaries are identified separately from the Group’s equity therein. Non-controlling interests consist of the amount of those interests at the date of the original acquisition and the non-controlling shareholder’s share of changes in equity since the date of the acquisition. Total comprehensive income is attributed to non-controlling interests even if this results in the non-controlling interests having a deficit balance.
No subsidiaries are excluded from the Group consolidation.
List of subsidiaries
A full list of the Company’s subsidiaries (as defined in the Large and Medium-sized Companies and Groups (Accounts and Reports) Regulations 2008) as at 31 December 2023 is detailed below:
Company name | Effective % ownership | Security | Registered address | |
|---|---|---|---|---|
Wholly owned subsidiaries | ||||
Altogether Services, Inc. | Common | c/o United Corporate Services Inc., 10 Bank Street, Suite 560, White Plains NY 10606, United States | ||
Consumer Healthcare Holdings Limited2 | Ordinary | Building 5, First Floor, The Heights, Weybridge, Surrey, KT13 0NY, England | ||
Consumer Healthcare Intermediate Holdings Limited2 | Ordinary | Building 5, First Floor, The Heights, Weybridge, Surrey, KT13 0NY, England | ||
Duncan Consumer Healthcare Philippines Inc. | Common | 23rd Floor, The Finance Centre, 26th Street Corner 9th Avenue, Bonifacio Global City, Taguig City, 1634, Philippines | ||
Ferrosan (No.2) AB4 | Ordinary | Gävlegatan 16, 113 30, Stockholm, Sweden | ||
Ferrosan ApS | A Shares, B Shares | Delta Park 37, 2665, Vallensbæk Strand, Denmark | ||
Glaxo Wellcome Ceylon Limited | Ordinary, Ordinary B | 121 Galle Road, Kaldemulla, Moratuwa, Sri Lanka | ||
GlaxoSmithKline Asia Private Limited | Equity | Patiala Road, Nabha 147201, Dist Patiala, Punjab, India | ||
GlaxoSmithKline Consumer Healthcare (Hong Kong) Limited | Ordinary | 23/F., Tower 6, The Gateway, 9 Canton Road, Tsimshatsui, Kowloon, Hong Kong | ||
GlaxoSmithKline Consumer Healthcare (Thailand) Limited | Ordinary | 13th Floor, Unit 13.06, Wave Place Building, 55 Wireless Road, Lumpini Sub-district, Pathumwan District, Bangkok, 10330, Thailand | ||
GlaxoSmithKline Consumer Healthcare (UK) (No.1) Limited | Ordinary | Building 5, First Floor, The Heights, Weybridge, Surrey, KT13 0NY, England | ||
GlaxoSmithKline Consumer Healthcare GmbH | Ordinary | Schottenring 25, Wien, 1010 | ||
GlaxoSmithKline Consumer Healthcare GmbH & Co. KG2 | Partnership Capital | Barthstr. 4, 80339, München, Germany | ||
GlaxoSmithKline Consumer Healthcare Investments (Ireland) (No 3) Limited4 | Ordinary | Knockbrack, Dungarvan, Co Waterford, X35 RY76, Ireland | ||
170 Haleon Annual Report and Form 20-F 2023 | Financial Statements |
| Financial Statements | ||||||
Company name | Effective % ownership | Security | Registered address | |
|---|---|---|---|---|
GlaxoSmithKline Consumer Healthcare Japan K.K. | Ordinary | 1-8-1 Akasaka Minato-ku, Tokyo, Japan | ||
GlaxoSmithKline Consumer Healthcare Mexico, S. De R.L. de C.V. | Ordinary, Ordinary Variable | Boulevard Adolfo Ruiz Cortines No. 3720, Torre 3 Piso 11, Colonia Jardines del Pedregal, Alcaldía Alvaro Obregón, Ciudad de México, C.P. 01900, Mexico | ||
GlaxoSmithKline Consumer Healthcare Pte. Ltd.2 | Ordinary | 23, Rochester Park #03-02, Singapore, 139234, Singapore | ||
GlaxoSmithKline Consumer Healthcare Sdn. Bhd. | Ordinary | Lot 89, Jalan Enggang, Ampang / Hulu Kelang Industrial Estate, Selangor Darul Ehsan, 68000 Ampang, Malaysia | ||
GlaxoSmithKline Consumer Healthcare Vietnam Company Limited | Charter Capital | Floor 16, Metropolitan, 235 Dong Khoi, Ben Nghe Ward, District 1, Ho Chi Minh City, Vietnam | ||
GlaxoSmithKline Consumer Private Limited | Equity | Patiala Road, Nabha 147201, Dist Patiala, Punjab, India | ||
GlaxoSmithKline Dungarvan Limited | Ordinary | Knockbrack, Dungarvan, Co Waterford, X35 RY76, Ireland | ||
GlaxoSmithKline Panama S.A. | Ordinary | Urbanizacion Industrial Juan D, Calles A Y B, Republic of Panama, Panama | ||
GlaxoSmithKline Paraguay S.A. | Ordinary | Oficial Gilberto Aranda 333, Planta Alta casi Salvador del Mundo, Asuncion, Paraguay | ||
GlaxoSmithKline Tuketici Sagligi Anonim Sirketi | Nominative | Esentepe Mah. Bahar Sk. Özdilek River Plaza, Vyndham Grand No: 13 İç Kapı No: 80 Şişli, Istanbul, Turkey | ||
GSK Bangladesh Private Limited | Ordinary | K-248/1 Dewalibari, Konabari, Gazipur-1700, Bangladesh, Gazipur, 1700, Bangladesh | ||
GSK CH Caricam Sociedad de Responsabilidad Limitada | Participation interests | Urbanizacion Industrial Juan D, Calles A Y B, Republic of Panama, Panama | ||
GSK Consumer Healthcare Chile SpA | Interests share | Av. Andrés Bello N°2687, 25th floor, Las Condes, Chile | ||
GSK Consumer Healthcare Holdings (No.5) Limited | Ordinary | Building 5, First Floor, The Heights, Weybridge, Surrey, KT13 0NY, England | ||
GSK Consumer Healthcare Holdings (No.6) Limited | Ordinary | Building 5, First Floor, The Heights, Weybridge, Surrey, KT13 0NY, England | ||
GSK Consumer Healthcare Peru S.R.L | Ordinary | Av Jorge Basadre 349, piso 5, San Isidro, Lima, 05W-109, Peru | ||
GSK Consumer Healthcare Singapore Pte. Ltd. | Ordinary | 23, Rochester Park #03-02, Singapore, 139234, Singapore | ||
GSK Consumer Healthcare Trinidad and Tobago Limited | Ordinary | Level 2, Invader's Bay Tower, Invader's Bay, Port-of-Spain, Trinidad | ||
Haleon (China) Co. Ltd (formerly GlaxoSmithKline Consumer Healthcare (China) Co. Ltd)3 | Registered Capital | Room 506, No.1 Shen’gang Boulevard, Lin-gang Special Area of China Pilot Free Trade Zone, Shanghai, 200000, China | ||
Haleon (Shanghai) Health Management Consulting Co., Ltd. | Registered Capital | Unit 03, 25th floor, No. 90 Qirong Road, Pilot Free Trade Zone, China (Shanghai), China | ||
Haleon (Suzhou) Pharmaceutical Co., Ltd. (formerly Wyeth Pharmaceutical Co. Ltd)3 | Registered Capital | 4 Baodai West Road, Suzhou, Jiangsu Province, 215128, China | ||
Haleon (Suzhou) Technology Co., Ltd. (formerly GlaxoSmithKline (Suzhou) Trading Co. Ltd)3 | Registered Capital | Second floor of the Administrative building, No. 669, Gangpu, Guoxiang Street, Wuzhong Economic Development Zone, Suzhou, China | ||
Haleon (Taizhou) Technology Co., Ltd (formerly GlaxoSmithKline Technology (Taizhou) Co. Ltd)3 | Registered Capital | Room 708 in Building D, Phase II of New Drug Innovation Base, Taizhou, Jiangsu Province, 225300, China | ||
Haleon Alcala, S.A. (formerly SmithKline Beecham S.A.)3 | Ordinary | Ctra de Ajalvir Km 2.500, Alcala de Henares, 28806, Madrid, Spain | ||
Haleon Australia Pty Ltd | Ordinary | Level 48, 8 Parramatta Square, 10 Darcy Street, Parramatta, Sydney NSW 2150, Australia | ||
Haleon Belgium N.V. (formerly GlaxoSmithKline Consumer Healthcare S.A.)3 | Ordinary | Da Vincilaan 5, 1930 Zaventem, Belgium | ||
Haleon Brasil Distribuidora Ltda (formerly GlaxoSmithKline Brasil Produtos para Consumo e Saude Ltda)3 | Quotas | Av das Americas, 3500, 4th floor, rooms 407-420, Rio de Janeiro, RJ, 22621-000, Brazil | ||
Haleon Canada ULC / Haleon Canada SRI (formerly GlaxoSmithKline Consumer Healthcare ULC / GlaxoSmithKline Soins De Sante Aux Consommateurs SRI)3 | A Class Preference, Common | 1133 Melville Street, Suite 3500, The Stack, Vancouver BC V6E 4E5, Canada | ||
Notes to the Consolidated Financial Statements | Haleon Annual Report and Form 20-F 2023 171 |
Notes to the Consolidated Financial Statements continued
Company name | Effective % ownership | Security | Registered address | |
|---|---|---|---|---|
Haleon CH Israel Ltd (formerly GSK Consumer Healthcare Israel Ltd)3 | Ordinary | 25 Basel Street, Petech Tikva 49510, Israel | ||
Haleon CH SARL (formerly GSK Consumer Healthcare SARL)2,3 | Ordinary | Route de I’Etraz, 1197 Prangins, Switzerland | ||
Haleon Colombia S.A.S. (formerly GlaxoSmithKline Consumer Healthcare Colombia S.A.S.)3 | Ordinary | Carrera 7 No. 113 - 43 Piso 4, Colombia | ||
Haleon Costa Rica S.A. (formerly GlaxoSmithKline Costa Rica S.A.)3 | Ordinary | Oficentro Terracampus, Edificio, Uno, Quinto Piso, Autopista Florencio del Castillo, kilometro siete, Cartago, La Unión San Diego, Costa Rica | ||
Haleon Czech Republic s.r.o. (formerly Consumer Healthcare Czech Republic s.r.o.)3 | Ordinary | Hvezdova 1734/2c, Prague, 4 140 00, Czech Republic | ||
Haleon Denmark Aps (formerly GlaxoSmithKline Consumer Healthcare Aps)3 | Ordinary | Delta Park 37, 2665, Vallensbæk Strand, Denmark | ||
Haleon EG General Trading LLC (formerly GSK Consumer Healthcare Egypt LLC)3 | Quotas | North 90th street, Boomerang Building, 5th District, Cairo, Egypt | ||
Haleon EG Limited (formerly GSK Consumer Healthcare Egypt Limited)3 | Ordinary | North 90th street, Boomerang Building, 5th District, Cairo, Egypt | ||
Haleon Finland Oy (formerly GlaxoSmithKline Consumer Healthcare Finland Oy)3 | Ordinary | Energiakuja 3, Helsinki, 00180, Finland | ||
Haleon France (formerly GlaxoSmithKline Santé Grand Public)3 | Ordinary | 23 rue François Jacob, 92500, Rueil-Malmaison, France | ||
Haleon Germany GmbH | Ordinary | Barthstr. 4, 80339, München, Germany | ||
Haleon Hellas Single Member Societe Anonyme (formerly GlaxoSmithKline Consumer Healthcare Hellas Single Member Societe Anonyme)3 | Ordinary | 274 Kifissias Avenue Halandri, Athens, 152 32, Greece | ||
Haleon Holdings (No.2) LLC (formerly GSK Consumer Healthcare Holdings No. 2 LLC)2,3 | LLC Interests | Corporation Service Company, 251 Little Falls Drive, Wilmington DE 19808, United States | ||
Haleon Hungary Korlátolt Felelosségu Társaság (formerly GlaxoSmithKline-Consumer Hungary Kft.)3 | Membership Interests | H-1124, Csorsz utca 43, Budapest, Hungary | ||
Haleon Insurance Limited (formerly GSK Consumer Healthcare Insurance Limited)3 | Ordinary | Dorey Court, Admiral Park, St Peter Port, GY1 4AT, Guernsey | ||
Haleon Intermediate Holdings Limited1,2 | Ordinary | Building 5, First Floor, The Heights, Weybridge, Surrey, KT13 0NY, United Kingdom | ||
Haleon Ireland Limited (formerly GlaxoSmithKline Consumer Healthcare (Ireland) Limited)3 | Ordinary | 12 Riverwalk, Citywest Business Campus, Dublin 24, Ireland | ||
Haleon Italy Manufacturing S.r.l. (formerly Pfizer Consumer Manufacturing Italy S.r.l.)2,3 | Quotas | 90, Via Nettunese, 04011, Aprilia (Prov. di Latin), Italy | ||
Haleon Italy S.r.l. (formerly GlaxoSmithKline Consumer Healthcare S.r.l.)3 | Ordinary | Via Monte Rosa 91, Milano, Italy, 20149 | ||
Haleon Kazakhstan Limited Liability Partnership (formerly GSK CH Kazakhstan LLP)3 | Charter Capital | 32 A Manasa Str., Bostandyk District, Almaty, 050008, Kazakhstan | ||
GlaxoSmithKline Limited3 | Ordinary | Likoni Road, PO Box 78392, Nairobi, Kenya | ||
Haleon Korea Co., Ltd. (formerly GlaxoSmithKline Consumer Healthcare Korea Co., Ltd.)3 | Ordinary | 9F LS Yongsan Tower, 92 Hangang-daero, Yongsan-gu, Seoul, 04386, Republic of Korea | ||
Haleon Levice, s.r.o. (formerly GSK Consumer Healthcare Levice, s.r.o.)3 | Ordinary | Priemyselny Park Gena, Ul. E. Sachsa 4-6, 934 01, Levice, Slovakia | ||
Haleon Netherlands B.V. (formerly GlaxoSmithKline Consumer Healthcare B.V.)3 | Ordinary | Van Asch van Wijckstraat 55G, 3811 LP, Amersfoort, Netherlands | ||
Haleon Netherlands Capital B.V. (formerly GSK Consumer Healthcare Capital NL B.V.)3 | Ordinary | Building 5, First Floor, The Heights, Weybridge, Surrey, KT13 0NY, United Kingdom | ||
Haleon New Zealand ULC | Ordinary | Level 1, 1.04, 12 Madden Street, Auckland, 1010, New Zealand | ||
Haleon Norway AS (formerly GlaxoSmithKline Consumer Healthcare Norway AS)3 | Ordinary | Lysaker Torg 5, 3rd floor, Lysaker, 1366, Norway | ||
Haleon Philippines, Inc. (formerly GlaxoSmithKline Consumer Healthcare Philippines Inc.)3 | Common | 23rd Floor, The Finance Centre, 26th Street Corner 9th Avenue, Bonifacio Global City, Taguig City, 1634, Philippines | ||
172 Haleon Annual Report and Form 20-F 2023 | Financial Statements |
| Financial Statements | ||||||
Company name | Effective % ownership | Security | Registered address | |
|---|---|---|---|---|
Haleon Poland sp. z.o.o. (formerly GlaxoSmithKline Consumer Healthcare Sp. z.o.o.)3 | Ordinary | Rzymowskiego 53, 02-697, Warszawa, Poland | ||
Haleon Portugal, Lda. (formerly GlaxoSmithKline Consumer Healthcare, Produtos para a Saude e Higiene, Lda)3 | Ordinary Quota | Rua Dr Antonio Loureiro Borges No 3, Arquiparque, Miraflores, 1495-131, Alges, Portugal | ||
Haleon Romania SRL (formerly GlaxoSmithKline Consumer Healthcare S.R.L.)3 | Ordinary | 1-5 Costache Negri Street, Opera Center One, 6th floor (Zone 2), District 5, Bucharest, Romania | ||
GlaxoSmithKline Consumer Healthcare Saudi Limited3 | Ordinary | 603 Salamah Tower, 6th Floor, Madinah Road, Al-Salamah District, Jeddah 21425, Saudi Arabia | ||
Haleon Schweiz AG (formerly GSK Consumer Healthcare Schweiz AG)3 | Ordinary | Suurstoffi 14, 6343, Rotkreuz, Switzerland | ||
Haleon Slovakia s. r. o. (formerly GlaxoSmithKline Consumer Healthcare Slovakia s. r. o.)3 | Ownership Interests | Galvaniho 7/A, Bratislava, 821 04, Slovakia | ||
Haleon South Africa (Pty) Ltd (formerly GlaxoSmithKline Consumer Healthcare South Africa (Pty) Ltd)3 | Ordinary | 17 Muswell Road South, Block D - Wedgefield Phase 2, Bryanston, Gauteng, South Africa, 2191, South Africa | ||
Haleon Spain, S.A. (formerly GlaxoSmithKline Consumer Healthcare, S.A.)3 | Ordinary | Severo Ochoa, 2, Parque Tecnologico de Madrid, Tres Cantos, 28760, Madrid, Spain | ||
Haleon Sweden AB (formerly GlaxoSmithKline Consumer Healthcare AB)3 | Ordinary | Gävlegatan 16, 113 30, Stockholm, Sweden | ||
Haleon UK Capital plc (formerly GSK Consumer Healthcare Capital UK plc)2,3 | Ordinary | Building 5, First Floor, The Heights, Weybridge, Surrey, KT13 0NY, England | ||
Haleon UK Corporate Director Limited (formerly GSK Consumer Healthcare Holdings (No.4) Limited)3 | Ordinary | Building 5, First Floor, The Heights, Weybridge, Surrey, KT13 0NY, England | ||
Haleon UK Corporate Secretary Limited (formerly GSK Consumer Healthcare Holdings (No.8) Limited)3 | Ordinary | Building 5, First Floor, The Heights, Weybridge, Surrey, KT13 0NY, England | ||
Haleon UK Enterprises Limited2 | Voting shares | Building 5, First Floor, The Heights, Weybridge, Surrey, KT13 0NY, England | ||
Haleon UK Export Limited (formerly GSK Consumer Healthcare Export Limited)3 | Ordinary | Building 5, First Floor, The Heights, Weybridge, Surrey, KT13 0NY, United Kingdom | ||
Haleon UK Finance (USD) Limited (formerly GlaxoSmithKline Consumer Healthcare Finance No.2 Limited)3 | Ordinary | Building 5, First Floor, The Heights, Weybridge, Surrey, KT13 0NY, England | ||
Haleon UK Finance Limited (formerly GlaxoSmithKline Consumer Healthcare Finance Limited)3 | Ordinary | Building 5, First Floor, The Heights, Weybridge, Surrey, KT13 0NY, England | ||
Haleon UK Holding Canada Limited (formerly GSK Canada Holding Company Limited)3 | Ordinary | Building 5, First Floor, The Heights, Weybridge, Surrey, KT13 0NY, England | ||
Haleon UK Holding New Zealand Limited (formerly GSK New Zealand Holding Company Limited)3 | Ordinary | Building 5, First Floor, The Heights, Weybridge, Surrey, KT13 0NY, England | ||
Haleon UK Holding Sri Lanka Limited (formerly GlaxoSmithKline Consumer Healthcare Sri Lanka Holdings Limited)3 | Ordinary | Building 5, First Floor, The Heights, Weybridge, Surrey, KT13 0NY, England | ||
Haleon UK Holdings (No.1) Limited (formerly GSK Consumer Healthcare Holdings (No.1) Limited)2,3 | Non-voting preference shares; Ordinary | Building 5, First Floor, The Heights, Weybridge, Surrey, KT13 0NY, England | ||
Haleon UK Holdings (No.2) Limited (formerly GlaxoSmithKline Consumer Healthcare Holdings (No.2) Limited)2,3 | A Shares; B Shares; Preference shares; Deferred shares | Building 5, First Floor, The Heights, Weybridge, Surrey, KT13 0NY, England | ||
Haleon UK Holdings (No.3) Limited (formerly GSK Consumer Healthcare Holdings (No.3) Limited)3 | Non-voting preference shares; Ordinary | Building 5, First Floor, The Heights, Weybridge, Surrey, KT13 0NY, England | ||
Haleon UK Holdings (No.7) Limited (formerly GSK Consumer Healthcare Holdings (No.7) Limited)3 | Ordinary | Building 5, First Floor, The Heights, Weybridge, Surrey, KT13 0NY, England | ||
Notes to the Consolidated Financial Statements | Haleon Annual Report and Form 20-F 2023 173 |
Notes to the Consolidated Financial Statements continued
Company name | Effective % ownership | Security | Registered address | |
|---|---|---|---|---|
Haleon UK Holdings Limited (formerly GlaxoSmithKline Consumer Healthcare Holdings Limited)2,3 | A Shares, B Shares, C Shares | Building 5, First Floor, The Heights, Weybridge, Surrey, KT13 0NY, England | ||
Haleon UK IP (No.2) Limited (formerly Stiefel Consumer Healthcare (UK) Limited)3 | Ordinary | Building 5, First Floor, The Heights, Weybridge, Surrey, KT13 0NY, United Kingdom | ||
Haleon UK IP Limited (formerly GlaxoSmithKline Consumer Healthcare (UK) IP Limited)2,3 | Ordinary | Building 5, First Floor, The Heights, Weybridge, Surrey, KT13 0NY, England | ||
Haleon UK Research Limited | Ordinary | Building 5, First Floor, The Heights, Weybridge, Surrey, KT13 0NY, England | ||
Haleon UK Services Limited2 | Ordinary | Building 5, First Floor, The Heights, Weybridge, Surrey, KT13 0NY, England | ||
Haleon UK Trading Limited (formerly GlaxoSmithKline Consumer Healthcare (UK) Trading Limited)2,3 | Ordinary | Building 5, First Floor, The Heights, Weybridge, Surrey, KT13 0NY, England | ||
Haleon UK Trading Services Limited (formerly GlaxoSmithKline Consumer Trading Services Limited)2,3 | Ordinary | Building 5, First Floor, The Heights, Weybridge, Surrey, KT13 0NY, United Kingdom | ||
Haleon US Capital LLC (formerly GSK Consumer Healthcare Capital US LLC)2,3 | LLC Interests | Corporation Service Company, 251 Little Falls Drive, Wilmington DE 19808, United States | ||
Haleon US Holdings Inc. (formerly GSK Consumer Healthcare Holdings (US) Inc.)3 | Preferred, Common | Corporation Service Company, 251 Little Falls Drive, Wilmington DE 19808, United States | ||
Haleon US Holdings LLC (formerly GlaxoSmithKline Consumer Healthcare Holdings (US) LLC)2,3 | LLC Interests | Corporation Service Company, 251 Little Falls Drive, Wilmington DE 19808, United States | ||
Haleon US Inc. (formerly GSK Consumer Health, Inc.)3 | Common | Corporation Service Company, 251 Little Falls Drive, Wilmington DE 19808, United States | ||
Haleon US IP LLC (formerly GlaxoSmithKline Consumer Healthcare (US) IP LLC)3 | LLC Interests | Corporation Service Company, 251 Little Falls Drive, Wilmington DE 19808, United States | ||
Haleon US LLC (formerly GlaxoSmithKline Consumer Healthcare L.L.C.)3 | LLC Interests | Corporation Service Company, 2595 Interstate Drive Suite 103, Harrisburg PA 17110, United States | ||
Haleon US Services Inc. (formerly GSK Consumer Healthcare Services, Inc.)3 | Common | Corporation Service Company, 251 Little Falls Drive, Wilmington DE 19808, United States | ||
Iodosan S.p.A. | Ordinary | Via Monte Rosa 91, Milano, Italy, 20149 | ||
JSC Haleon Rus (formerly GlaxoSmithKline Healthcare AO)3 | Ordinary | Premises III, Room 9, floor 6, Presnenskaya nab. 10, 123112, Moscow, Russian Federation | ||
Kuhs GmbH | Ordinary | Barthstr. 4, 80339, München, Germany | ||
Limited Liability Company “Haleon Ukraine” (formerly GlaxoSmithKline Healthcare Ukraine O.O.O.)3 | Ownership Interests | Pavla Tychyny avenue, 1-V, Kiev, 02152, Ukraine | ||
N.C.H. - Nutrition Consumer Health Ltd | Ordinary | 14 Hamephalsim St, Petach Tikva, Israel | ||
Northstar Switzerland SARL | Ordinary | Route de I’Etraz 2, c/o Haleon CH SARL, 1197 Prangins, Switzerland | ||
P.T. Sterling Products Indonesia | A Shares; B Shares | Pondok Indah Office Tower 5 Level 12, Suite 1201, Jalan Sultan Iskandar Muda Kav. V-TA, Pondok Pinang, Jakarta Selatan 12310, Indonesia | ||
Panadol GmbH | Ordinary | Barthstr. 4, 80339, München, Germany | ||
PF Consumer Healthcare B.V. | Class A, Class B | Van Asch van Wijckstraat 55G, 3811 LP Amersfoort, Netherlands | ||
PF Consumer Healthcare Brazil Importadora e Distribuidora de Medicamentos Ltda | Quota | Barueri, at Avenida Ceci, No.1900, Block III, Part 67, Tambore District, Sao Paulo, 06460, Brazil | ||
PF Consumer Healthcare Canada ULC / PF Soins De Sante SRI | Common | 1133 Melville Street, Suite, 3500, The Stack, Vancouver BC V6E 4E5, Canada | ||
PF Consumer Healthcare Holding B.V. | Ordinary | Van Asch van Wijckstraat 55G, 3811 LP Amersfoort, Netherlands | ||
PF Consumer Taiwan LLC | Interests | The Corporation Trust Company, Corporation Trust Center, 1209 Orange Street, Wilmington DE 19801, United States | ||
Pfizer Laboratories PFE (Pty) Ltd. | Common | Flushing Meadows Building, The Campus, 57 Sloane Street, Bryanston 2021, South Africa | ||
174 Haleon Annual Report and Form 20-F 2023 | Financial Statements |
| Financial Statements | ||||||
Company name | Effective % ownership | Security | Registered address | |
|---|---|---|---|---|
Pfizer PFE Colombia S.A.S | Common | Carrera 7 No. 113 - 43 Piso 4, Colombia | ||
PT Haleon Indonesia Trading | Ordinary | Pondok Indah Office Tower 5 Level 12, Suite 1201, Jalan Sultan Iskandar Muda Kav. V-TA, Pondok Pinang, Jakarta Selatan 12310, Indonesia | ||
PT. Bina Dentalindo4 | Ordinary | Gedung Graha Ganesha Lantai 3, Jl Raya Bekasi Km 17, No5, Jakarta Timur 13930, Indonesia | ||
Stafford-Miller (Ireland) Limited2 | Ordinary | Clocherane, Youghal Road, Dungarvan, Co. Waterford, Ireland | ||
Sterling Drug (Malaya) Sdn Berhad | Ordinary | Lot 89, Jalan Enggang, Ampang / Hulu Kelang Industrial Estate, Selangor Darul Ehsan, 68000 Ampang, Malaysia | ||
Sterling Products International, Incorporated | Common | Corporation Service Company, 251 Little Falls Drive, Wilmington DE 19808, United States | ||
Treerly Health Co., Ltd | Registered Capital | Unit 01A, Room 3901, No 16. East Zhujiang Road, Tianhe District, Guangzhou City, China | ||
Wyeth Pharmaceuticals Company | Partnership Interests | State Road No. 3, Kilometer 142.1, Guayama, 00784, Puerto Rico | ||
Subsidiaries where the effective interest is less than 100%
Company name | Effective % ownership | Security | Registered address |
GSK-Gebro Consumer Healthcare GmbH | Ordinary | Bahnhofbichl 13, 6391 Fieberbrunn, Kitzbühel, Austria | |
Haleon Pakistan Limited (formerly GlaxoSmithKline Consumer Healthcare Pakistan Limited)3 | Ordinary | 11-A, 11th Floor, Sky Tower (East Wing), Dolmen City, HC-3, Block 4, Scheme-5, Clifton, Karachi, Sindh 75600, Pakistan | |
Haleon US Enterprises Inc. (formerly Beecham Enterprises Inc.)3 | Common | Corporation Service Company, 251 Little Falls Drive, Wilmington DE 19808, United States | |
Haleon US LP (formerly GlaxoSmithKline Consumer Healthcare, L.P.)2,3 | Partnership Interests | Corporation Service Company, 251 Little Falls Drive, Wilmington DE 19808, United States | |
Pfizer Biotech Corporation | Ordinary | 24F, No. 66, Sec 1, Zhong Xiao W. Rd, Taipei 100, Taiwan | |
Sino-American Tianjin Smith Kline & French Laboratories Ltd2 | Ordinary | Cheng Lin Zhuang Industrial Zone, Dong Li District, Tianjin, 300163, China | |
SmithKline Beecham (Private) Limited | Ordinary | World Trade Center, Level 34, West Tower, Echelon Square, Colombo 1, Sri Lanka | |
The following UK subsidiaries will take advantage of the audit exemption set out within Section 479A of the Companies Act 2006, supported by guarantees issued by Haleon plc (under section 479C of the Companies Act 2006) over their liabilities for the year ended 31 December 2023. Unless otherwise stated, the undertakings listed below are owned, either directly or indirectly, by the Company.
Name | Company |
Consumer Healthcare Holdings Limited | 11986432 |
Consumer Healthcare Intermediate Holdings Limited | 11986416 |
GlaxoSmithKline Consumer Healthcare (UK) (No.1) Limited | 00753340 |
Haleon UK Holding Canada Limited | 12342809 |
Haleon UK Holding New Zealand Limited | 12342879 |
Haleon UK Holding Sri Lanka Limited | 09400298 |
Haleon UK Holdings (No.1) Limited | 13355627 |
Haleon UK Holdings (No.3) Limited | 13401293 |
Haleon UK Holdings (No.7) Limited | 13414769 |
Notes to the Consolidated Financial Statements | Haleon Annual Report and Form 20-F 2023 175 |
Notes to the Consolidated Financial Statements continued
The following UK subsidiaries, having not traded during the year will take advantage of the audit exemption set out within Section 480 of the Companies Act 2006 for the year ended 31 December 2023. Unless otherwise stated, the undertakings listed below are owned, either directly or indirectly, by the Company.
Name | Company |
GSK Consumer Healthcare Holdings (No. 5) Limited | 13401372 |
GSK Consumer Healthcare Holdings (No. 6) Limited | 13401308 |
Haleon UK Corporate Director Limited | 13401336 |
Haleon UK Corporate Secretary Limited | 13434151 |
| 1 | Directly held by Haleon plc. |
| 2 | Principal subsidiary of the Group as at 31 December 2023. |
| 3 | The Company changed its name during the period between 1 January 2023 and 15 March 2024. The former name of the Company is included in brackets. The Group has a programme of action to rename and harmonise all legal entity names to reflect the Haleon brand. |
| 4 | The Company is in liquidation. |
176 Haleon Annual Report and Form 20-F 2023 | Financial Statements |
| Haleon Annual Report and Form 20-F 2023 177 Financial Statements This page is intentionally left blank |

| 178 Haleon Annual Report and Form 20-F 2023 Financial Statements This page is intentionally left blank |

| Financial Statements Parent Company statement of changes in equity Haleon Annual Report and Form 20-F 2023 179 This page is intentionally left blank |

| 180 Haleon Annual Report and Form 20-F 2023 Financial Statements This page is intentionally left blank |

| Financial Statements Notes to the Parent Company Financial Statements Haleon Annual Report and Form 20-F 2023 181 This page is intentionally left blank |

| 182 Haleon Annual Report and Form 20-F 2023 Financial Statements This page is intentionally left blank |

| Financial Statements Notes to the Parent Company Financial Statements Haleon Annual Report and Form 20-F 2023 183 This page is intentionally left blank |

| 184 Haleon Annual Report and Form 20-F 2023 Financial Statements This page is intentionally left blank |

| Other Information Contents Directors’ Report 185 Streamlined Energy and Carbon Reporting 188 Group information 191 History and development of the Group 191 Director and Executive Team shareholdings 192 Executive Director benefits upon termination of office 192 Property, plant and equipment 192 Disclosure controls and procedures 192 Management’s report on internal control over financial reporting 192 Change in certifying accountant 192 Risk factors 193 Description of securities other than equity securities 202 Articles of Association 203 Impact of regulation 204 Exchange controls and restrictions on payment of dividends 204 Material contracts 205 Shareholder information 208 Summary of significant corporate governance differences from NYSE listing standards 208 Purchases of equity securities by the Company and affiliated purchasers 208 Dividend history 209 Shareholder profiles 209 Tax information for shareholders 210 Exhibits 212 Form 20-F cross reference 214 Forward-looking statements 218 Glossary 219 Useful information 220 Voltaren: Voltaren is a topical pain relief brand, used in over 40 million households globally and sold in 87 countries around the world. In 2023, the brand launched Voltaren Hot Cookie, a 24-hour medicated patch which delivers continuous pain relief with almost no wasted product. Voltaren also leveraged AI to launch ‘HaltungsCheck,’ a posture check tool in Germany and a digital health tool, ‘Movement Coach’ in the UK. The image above is taken from the Voltaren ‘It’s not just movement’ campaign. Other Information Haleon Annual Report and Form 20-F 2023 185 |
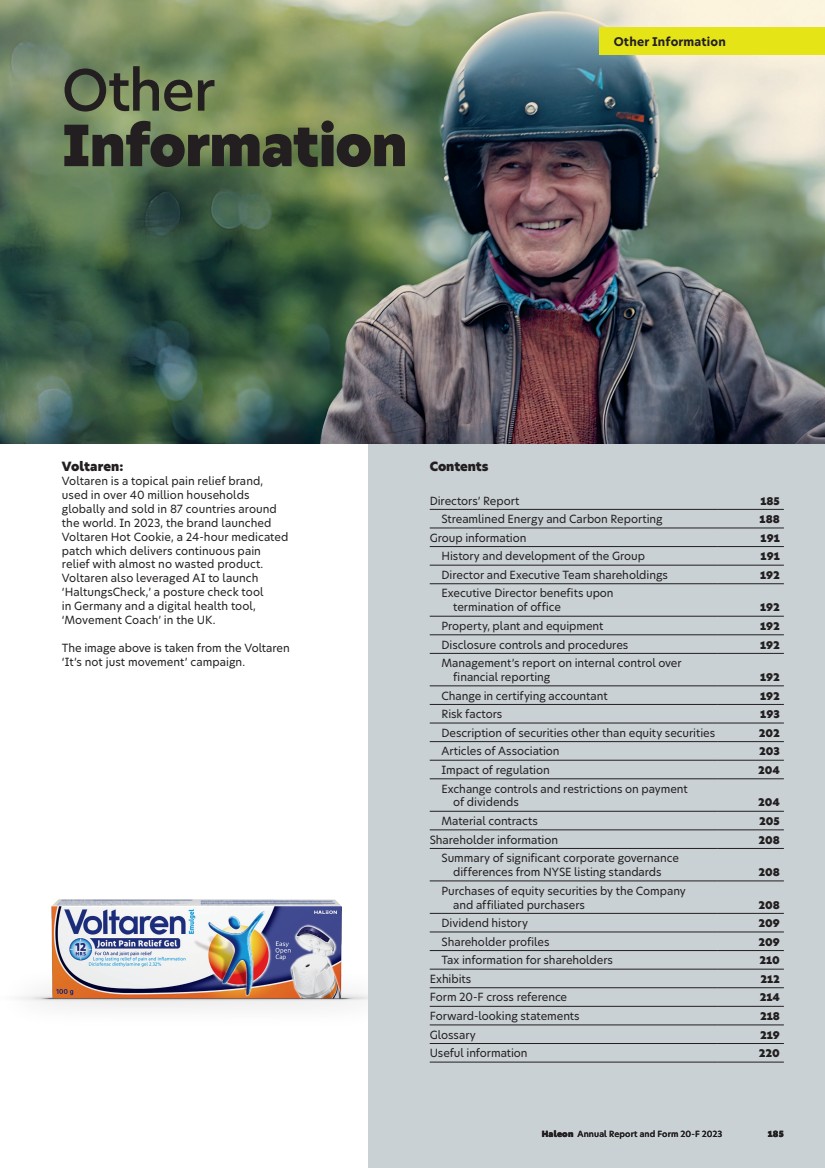
| Shares As at 31 December 2023, the Company had 9,234,573,831 ordinary shares of £0.01 each and 25,000,000 non-voting preference shares of £1.00 each in issue. No shares were held in Treasury. There are no special control rights or restrictions on share transfers or limitations on the holding of any class of shares. Further information about the Company’s ordinary shares and non-voting preference shares can be found in Articles of Association on page 203. At its AGM held in April 2023, Haleon received shareholder approval to make purchases of its own ordinary shares (i) on-market up to a maximum number representing 10% of its issued share capital and (ii) off-market up to a maximum number representing 4.99% of its issued share capital from each of GSK and Pfizer, subject to limitations on the maximum price applicable to each purchase, and noting that no more than 10% of its issued share capital would be purchased in aggregate pursuant to these authorities. During the year, the Company did not purchase any of its own shares. Resolutions seeking shareholder authority for the purchase of the Company’s shares will be put to shareholders at the AGM to be held on 8 May 2024. Dividends and dividend policy On 29 February 2024, the Board proposed a final dividend of 4.2p per ordinary share which will be paid, subject to shareholder approval, following the Company’s 2024 AGM. The Company paid an interim dividend of 1.8p per ordinary share on 5 October 2023 in respect of its 2023 half-year results. In respect of trading since demerger to 31 December 2022, the Company paid a final dividend of 2.4p per ordinary share on 27 April 2023. Haleon has a dividend policy that looks to balance all its stakeholders’ interests while ensuring the long-term success of the Company. Subject to market conditions and Board approval, Haleon expects to grow its ordinary dividend at least in line with adjusted earnings. Future ordinary dividends are expected to be paid half-yearly with approximately one third of the dividend paid as an interim dividend, following the Company’s half-year results, and the balance paid as a final dividend, subject to shareholder approval, following the Company’s AGM. Dividends are announced in Pound Sterling, with an equivalent US Dollar amount paid in respect of the Company’s ADSs. See Note 10 to the Consolidated Financial Statements on page 132, for information on dividends paid on non-voting preference shares. Financial risk management The Group’s financial risk management objectives and policies, including its use of financial instruments, are set out in Note 25 to the Consolidated Financial Statements from page 156. Future business developments of the Group Details of these are set out in the Strategic Report from page 2. Group subsidiaries As a Group that operates globally, Haleon’s operations and activities are carried out by subsidiaries, branches and scientific/ representative offices established under the laws of many jurisdictions. A full list of subsidiaries is provided at Note 30 of the Consolidated Financial Statements from page 170. Directors’ powers The Directors may exercise all the powers of the Company, subject to the Articles of Association (Articles), legislation and regulation. This includes the ability, subject to shareholder approval at Haleon’s AGM each year, to exercise the authority to allot or purchase the Company’s shares. Further details of the powers of the Directors can be found in the Articles of Association section on page 203. Conflicts of interest Under the Articles and as permitted by the Companies Act, the Board may authorise any matter which would otherwise involve a Director breaching their duty to avoid conflicts of interest and may attach to any such authorisation such conditions and/or restrictions as the Board deems appropriate (including in respect of the receipt of information or restrictions on participation at Board meetings). The Board has a formal system for Directors to declare such situations to be considered for authorisation by those Directors who have no interest in the matter being considered. Situations considered by the Board and authorisations given are recorded in the Board minutes and in a register of conflicts maintained by the Company Secretary and are reviewed annually by the Board. The Board believes that this system operates effectively. Insurance and indemnities The Company maintained directors’ and officers’ liability insurance cover during the period of this Annual Report. Each Director also benefits from an indemnity provided by the Company in respect of any proceedings brought by third parties against them personally in their capacity as Director. Code of Conduct Our Code of Conduct (Code) applies to the Board and Executive Team, employees and third-party temporary workers and complies with the NYSE rules as set out in Section 406 of SOX. Our Code includes a prohibition on engaging in insider trading or use of non-public information that could manipulate the price of Haleon’s shares, either to our own advantage or for another person and also applies to any other company with which we do business. Further details on our Code are set out in the Strategic Report on pages 18 and 20, and the Board’s oversight of the Code is set out on pages 69 and 75. Directors’ Report This Directors’ Report contains information to be given in accordance with the Companies Act 2006. Relevant information below, which is contained elsewhere in this Annual Report, is incorporated by cross reference. >> Our Code is available at www.haleon.com/who-we-are/Governance/codes-policies-and-standards 186 Haleon Annual Report and Form 20-F 2023 Other Information |
| The Companies (Miscellaneous Reporting) Regulations 2018 Employee engagement The below statement relates to our employees as defined in the glossary and should be read in conjunction with our stakeholder and people disclosures in the Strategic Report on pages 10 and 18, respectively, Section 172 statement and workforce engagement disclosures from page 69, and other engagement disclosures in the Directors’ Remuneration Report from page 80. During 2023, the key forms of engagement to provide information to our employees included a fortnightly global email ‘Connecting Haleon’, intranet global news page, CEO-led global broadcasts, fireside chats on priority topics, internal social media channels, dedicated senior manager calls, as well as regional leadership calls and direct emails, videos and business function team meetings. Employees have been consulted and given opportunities to express their views and concerns through participation in the annual employee engagement survey, team meetings, townhalls, ERGs, and Q&As at global broadcasts and fireside chats. They have been made aware of the financial and economic factors affecting the performance of the Company through quarterly, global broadcasts and emails from the CEO, internal social media updates, as well as functional and regional team meetings. The Chair and Directors have engaged with employees through direct interactions, ‘employee listening sessions’ with our Workforce Engagement Director and other opportunities held during the year to meet Executive Directors via video meetings or in person. Engagement with suppliers, customers and others in a business relationship with Haleon Our business relationships with our suppliers, customers and others are fundamental to our success. During the year, the Board considered matters related to them and had regard to the impact of decisions on them as detailed in the Section 172 statement on page 69. The Board monitors relationships through a mixture of presentations, reports and direct engagement. Details of how relationships have been maintained throughout the year are set out in the our key stakeholders section on page 10. Share plan details 2023 share awards and grants to employees Our current policy is to settle the majority of awards or grants under the Company’s share plans with shares purchased in the market, however, the Company continues to review this policy. The Company’s share plans incorporate the Investment Association’s current guidelines on dilution. During the year, the Company satisfied its obligations under its share plans solely by the purchase of shares in the market, accordingly there has been no dilution from the awards made. As at 31 December 2023, there were 5,489,346 options outstanding, solely in respect of the Company’s HMRC-approved all-employee Share Save Plan. Employee benefit trusts (EBTs) The Group operates EBTs for the benefit of employees and former employees. The EBTs purchase ordinary shares or ADSs in the market and release them to current and former employees in satisfaction of share awards. During 2023, the EBTs released 414,105 ordinary shares and 316,435 ADSs. At 31 December 2023 the EBTs held 5,309,233 ordinary shares and 2,545,712 ADSs in the Company. The EBTs adopt a prudent approach to purchasing shares, using funds provided by the Group, based on expectations of future requirements. Shares or ADSs that have not been allocated to share plan participants are held by the EBTs and although the trustee has the right to vote or abstain from exercising their voting rights in relation to those shares, it has a policy of not voting, which is in line with guidelines. The trustee also has the right to accept or reject any offer relating to the shares or ADSs in any way it sees fit. Dividend waivers are in place in respect of unallocated shares and ADSs held in the EBTs. significant interest in the Company including 32% of Haleon’s shares and thus of the voting rights of the Company. As a result, Pfizer possesses sufficient voting power to exercise significant influence over all matters requiring shareholder approval, including the election or removal of Directors and advisers, the declaration of dividends, whether to accept the terms of a takeover offer and other matters to be determined by the Haleon shareholders. In addition, Pfizer has the right to nominate two persons to be appointed to the Board as representative Directors for so long as it continues to hold 20% or more of Haleon’s shares in issue, and a right to nominate one person to be appointed as a representative Director for so long as it continues to hold less than 20% but at least 10% of Haleon’s shares in issue. Significant shareholders The following persons have disclosed an interest in the issued ordinary share capital of the Company in accordance with the requirements of rules 5.1.2 or 5.1.5 of the FCA’s Disclosure Guidance and Transparency Rules. The Company’s major shareholders have the same voting rights as other shareholders. The Company does not know of any arrangements the operation of which may result in a change in its control. Other than as set out below, no changes to major shareholdings were disclosed to the Company between 31 December 2023 and 7 March 2024. The Company is a party to the Pfizer Relationship Agreement, the principal purpose of which is to regulate the continuing relationship between the Company and its controlling shareholder, Pfizer Inc., following demerger. Pfizer retains a Number of ordinary shares disclosed as a percentage of the Company’s issued share capital at: Shareholder Date of latest disclosure to the Company Number of ordinary shares disclosed Date of latest disclosure to the Company 31 December 2023 Pfizer 3 August 2022 2,955,063,6261 32% 32% GSK and certain controlled undertakings of GSK 18 January 2024 385,320,110 4.17% 7.42% 1 Pfizer holds its interest in ordinary shares and ADSs. Other Information Directors’ Report Haleon Annual Report and Form 20-F 2023 187 |
| Significant agreements and change of control provisions The Group is a party to certain arrangements which could be terminated upon a change of control of the Company (and/ or the Group’s UK and US debt-issuing entities) and which are considered significant in terms of their potential impact on the business of the Group as a whole. These arrangements include each series of notes issued under the Company’s EMTN programme and the USD note programme. The notes contain a redemption or purchase upon change of control provision which, if triggered, allows note holders to exercise their option to require the UK and US debt-issuing entities to redeem, or at such issuers’ options, to purchase, the notes and pay any accrued and unpaid interest due. Further information on the notes issued and outstanding under the programmes as at 31 December 2023 is available in Note 19 to the Consolidated Financial Statements from page 143. In addition, the Company is a party to the Pfizer Relationship Agreement, the principal purpose of which is to regulate the continuing relationship between the Company and its controlling shareholder, Pfizer, following demerger. This terminates upon Pfizer (or a member of its group) ceasing to hold at least 10% of Haleon’s ordinary shares. Throughout the period under review, the Company has complied with provisions and obligations in the Pfizer Relationship Agreement and, as far as the Company is aware, Pfizer has also complied. Further information on the Pfizer Relationship Agreement can be found on page 207. Streamlined Energy and Carbon Reporting (SECR) In line with the requirements set out in the UK Government’s guidance on SECR, the table on page 189 represents Haleon’s energy use and associated carbon emissions from electricity and fuel in the UK and the rest of the world (ROW), calculated with reference to the Greenhouse Gas Protocol: A Corporate Accounting and Reporting Standard. In our 2022 reporting period, the UK accounted for 4% of our global total energy use as well as 3% of our Scope 1 and 2 emissions (location-based). Energy efficiency action taken In 2023, we focused on developing and beginning to implement our strategy to reduce Scope 1 carbon emissions, having achieved 100% renewable electricity at sites within our operational control in 2022. This strategy, when fully implemented, will replace most of our fossil-fuelled boilers with electric ones to meet our 2030 goal to reduce our absolute Scope 1 and 2 carbon emissions by 95% versus our 2020 baseline. To maintain 100% renewable electricity at sites within our operational control, we utilise a combination of on-site solar, Power Purchase Agreements (PPAs), and renewable electricity certificates. In 2023, we spent more than £5.7m on energy-reduction projects to install additional solar generation at two of our sites, as well as implement more energy-efficient equipment and improved metering at several of our sites. Employment of disabled persons Our commitment is to ensure our workforce reflects the diversity of the communities within which we operate, and we believe in the power of diversity as a source of competitive advantage. We are striving to create an inclusive environment in which everyone can contribute and feel a sense of belonging, are understood and valued, treated fairly and equally, and supported to progress and thrive. We want our employees to be able to be their authentic selves and, as a result, perform at their best. All employees must ensure an equitable and inclusive culture free of discrimination and encourage respectful and inclusive behaviour. Every effort is made to ensure that applications for employment from disabled people are fully and fairly considered and that disabled employees have equal opportunities for training, career development and promotion. Political donations The Group does not make political contributions or sponsor political meetings, conferences, conventions, or events, as set out in our Anti-Bribery and Corruption (ABAC) Policy. In the year to 31 December 2023, the Group did not make any political contributions or provide any sponsorship. In accordance with the Federal Election Campaign Act in the US, Haleon employees are able to make personal contributions to our US Political Action Committee (PAC). A PAC is a corporate or labour-based political committee that collects voluntary contributions from eligible US employees into a separate fund. In donating to the PAC, participating eligible employees are exercising their legal right to pool their resources and make political contributions, which are subject to strict limitations under US law. The fund is managed by a board of directors of participating employees from Haleon’s US operating company and makes contributions or expenditures in connection with Federal and State elections. The PAC is not controlled by Haleon. The operations of the Haleon PAC are reviewed regularly to ensure compliance with applicable US laws. Disclosure reports for the Haleon PAC can be viewed at www.fec.gov. In 2023, a total of $57,500 was donated to political organisations by the Haleon PAC. English law requires prior shareholder approval for political contributions to political parties and independent election candidates as well as for any political expenditure. The definitions of political donations, political expenditure and political organisations used in the legislation are, however, quite broad. As a result, the definitions may cover legitimate business activities not in the ordinary sense considered to be political donations or political expenditure, nor are they designed to support any political party or independent election candidate. Therefore, notwithstanding our policy, and while we do not intend to make donations to any political parties or organisations, nor to incur any political expenditure, we will annually seek shareholder authorisation for any inadvertent expenditure as a precautionary measure to ensure that the Company and its subsidiaries do not inadvertently breach the legislation. Directors’ Report continued >> See also our approach to sustainability section from page 22. >> See our ABAC Policy at www.haleon.com/who-we-are/Governance/codes-policies-and-standards >> See our position on political advocacy at www.haleon.com/who-we-are/our-policy-positions 188 Haleon Annual Report and Form 20-F 2023 Other Information |
| Streamlined Energy and Carbon Reporting continued 20211 2021 Total1 20221 2022 Total1 20232 2023 Total2 Carbon emissions from our Operations3 UK ROW Global UK ROW Global UK ROW Global Total Scope 1 GHG emissions (thousands of tonnes CO2e, including on-site fuel use, fleet mileage and refrigerant losses) 3 57 60 3 53 56 2 58 60 Total Scope 2 GHG emissions (location-based) (thousands of tonnes CO2e) 3 145 148 3 137 140 3 139 142 Total Scope 2 GHG emissions (market-based) (thousands of tonnes CO2e) — 15 15 — 7 7 — 7 7 Total Scope 1 & 2 GHG emissions (location-based) (thousands of tonnes CO2e) 6 203 209 6 190 196 5 197 202 Total Scope 1 & 2 GHG emissions (market-based) (thousands of tonnes CO2e) 3 72 75 3 61 64 2 65 67 Total GHG emissions offset (thousands of tonnes CO2e) — — — — 9 9 — 17 17 Total net Scope 1 & 2 carbon emissions (market-based)4 (thousands of tonnes CO2e) 3 72 75 3 51 54 2 48 50 Total energy consumed (GWh) 32 669 701 29 652 681 27 670 697 Total renewable energy consumed (GWh) 16 299 315 15 344 359 15 356 371 Total renewable electricity consumed (GWh) 16 279 295 15 312 328 15 326 341 Renewable electricity (%) 100% 83% 84% 100% 100% 100% 100% 100% 100% Renewable energy (%) 50% 45% 45% 52% 53% 53% 56% 53% 53% Intensity Ratio GHG emissions intensity (location-based) (tonnes of CO2e per £m revenue)5 19 22 22 17 18 18 14 18 18 Carbon emissions from our value chain Total Scope 3 carbon emissions (thousands of tonnes CO2e) 2,333 2,336 1 Data for 2021 and 2022 have been calculated in accordance with methodology and data improvements, for example replacing estimates with actuals. The 2022 results have also been re-stated to align with the calendar year, rather than December 2021 – November 2022 as they were reported in the 2022 Annual Report and Form 20-F. As a result, some values differ slightly from the values disclosed in the 2022 Annual Report and Form 20-F, as disclosed in Haleon’s Basis of Reporting, available on the ESG Reporting Hub. 2 For the 2023 reporting period we have used data from 1 December 2022 to 30 November 2023. The exception is Scope 3, where the 2023 reporting period is 1 July 2022 to 30 June 2023. 3 GHG emissions are expressed in carbon dioxide equivalents (CO2e) reflecting the effective amount of CO2 generated by all gas emissions which add to the greenhouse effect and global warming. Carbon emissions have been calculated according to the Greenhouse Gas Protocol: A Corporate Accounting and Reporting Standard (updated with Scope 2 guidance). For further information on the methodologies used to calculate our emissions and energy metrics, please see our reporting criteria Basis of Reporting available at the web address outlined above. Scope of reporting is sites over which Haleon has full operational control. 4 This calculation takes the total emissions offset in the reporting period into account. 5 Carbon emissions intensity is derived from the ratio of the total Scope 1 and 2 GHG emissions (location-based) (tCO2e) from all sites where we have full operational control to the total revenue in the same reporting period. This provides a stable and comparable metric at this time. Other Information Directors’ Report Haleon Annual Report and Form 20-F 2023 189 |
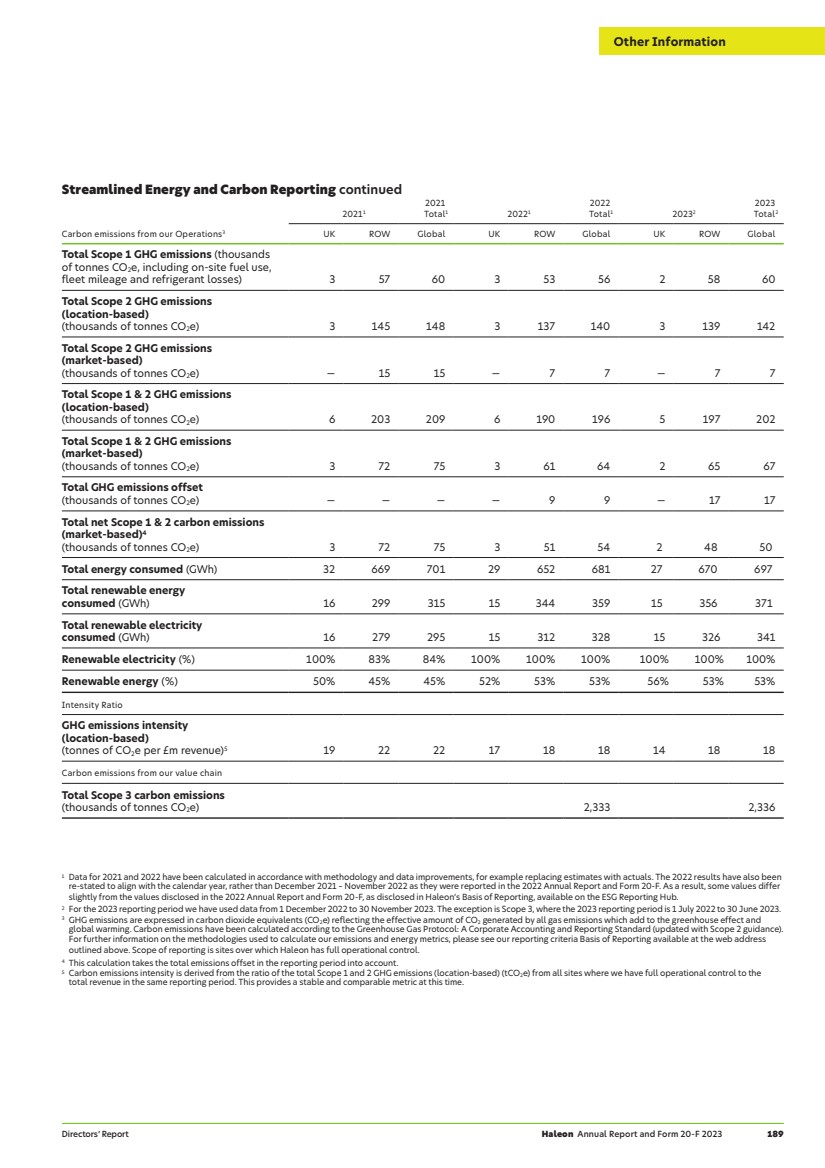
| Directors’ Report continued Going concern The Directors believe that it is appropriate to adopt the going concern basis of accounting in preparing the Group’s Consolidated Financial Statements. Further detail as to the Directors’ assessment is set out in Note 1 to the Consolidated Financial Statements on page 121. An overview of the business activities of Haleon, including a review of the principal business risks that the Group faces, is given in the Strategic Report on pages 54 to 58 and in Group information from page 191. The scenarios considered and assessment made by the Directors with respect to the Company’s risk factors and viability are set out on page 59. Directors’ Report In addition to the information set out herein, this Directors’ Report incorporates by reference the following sections of this Annual Report: — Strategic Report from page 2, including R&D from page 8. — Corporate Governance from page 61. — Statement of Directors’ responsibilities, including Disclosure of information to auditors on page 98. — Group information from page 191, including Articles of Association and Material contracts on pages 203 and 205. — Note 24 to the Consolidated Financial Statements (Related party transactions) from page 155. — Note 29 to the Consolidated Financial Statements (Post balance sheet events) from page 170. — Shareholder information from page 208. The only matters to report in respect of Listing Rule 9.8.4 are in relation to material contracts (set out from page 205) and agreements with controlling shareholders (set out on pages 186, 187 and from page 205). By order of the Board Amanda Mellor Company Secretary Haleon plc Registered in England and Wales, Company number 13691224 15 March 2024 190 Haleon Annual Report and Form 20-F 2023 Other Information |
| On 2 March 2015, GSK and Novartis formed a consumer healthcare joint venture to combine the majority of GSK’s consumer healthcare business and all of Novartis’ OTC business. Novartis’ business provided GSK with a meaningful incremental presence in OTC. The combination added a leading portfolio of globally recognised consumer-preferred and expert-recommended brands in the Pain Relief, Respiratory Health, Smokers’ Health and Skin Health categories to the Group’s business. In June 2018, GSK acquired Novartis’ shareholding in the GSK/Novartis JV for $13bn, enabling GSK to take full operational and strategic control of the business. On 31 July 2019, GSK completed a transaction with Pfizer to combine substantially all of GSK and Pfizer’s respective consumer healthcare businesses into a new world-leading consumer healthcare joint venture (the Pfizer Transaction). The transaction, which was transformational to the scale of the Group’s business, brought together two businesses with highly complementary geographic footprints and brand portfolios. While the Group retained its strong European footprint, completion of the transaction also provided the Group with incremental geographical scale in the US, where it became the leader in OTC/VMS, and in China, where it became the leading OTC/VMS multinational. From a portfolio perspective, the transaction provided the Group with global leadership in the higher-growth VMS market as well as a leading presence in the US Pain Relief market complementing the Group’s existing Pain Relief portfolio. Since completion of the Pfizer Transaction and prior to demerger, GSK owned 68% of the ordinary shares in the entity through which both GSK and Pfizer held their equity interests in the joint venture, with Pfizer holding the remaining 32%. Alongside integration of the Pfizer consumer healthcare business, the Group exited approximately 50 non-strategic and growth-dilutive OTC and skincare assets from 2019 to 2021 to raise £1.1bn of net proceeds. These disposals have further focused the business on higher-growth categories, markets and channels and thereby enhanced the growth profile of Haleon. History and development of the Group Haleon is the result of the combination of three consumer health businesses over the last decade. The focus of the business has been sharpened through divestment of growth-dilutive brands and those outside of our core categories. In addition, the scientific and consumer products’ experience of its legacy businesses has been enhanced by investment in commercial and scientific capabilities, technologies and facilities, most notably in the digital sphere. On 18 July 2022, Haleon demerged from GSK creating a company with management, infrastructure, capital allocation and incentives focused specifically on consumer healthcare. The Group has a strong and established presence in all key channels relevant for consumer healthcare and a scale which allows it to effectively engage with retail partners of all sizes, buying groups, distributors, pharmacy chains and individual pharmacies. Prior to demerger, the Group had transformed since 2012 through progressive strategic M&A and divestments to create a world leader in consumer health. The Group’s scale greatly expanded through the successful combination of the legacy GSK consumer healthcare business with the Novartis consumer healthcare business in 2015, and the subsequent combination of this business with the Pfizer consumer healthcare business in 2019. In addition, the Group’s focus has been sharpened since 2012 through the progressive divestment of GSK’s nutritionals businesses and the divestment by the Group of non-strategic OTC brands, including its programme of divestments of non-strategic and growth-dilutive brands (with aggregate net proceeds from divested brands of £1.1bn) during the period from 2019 to 2021. This deliberate strategy has resulted in a portfolio more focused on higher-growth categories, markets and channels. These transactions also provided a catalyst for a broader transformation of the Group. Prior to its combination with the Novartis consumer healthcare business in 2015, GSK’s consumer healthcare business was already one of the world’s leading OTC and Oral Health companies with a long heritage in consumer health products dating back to the 18th century. The Group sold a range of leading OTC brands across Respiratory Health, Pain Relief, Digestive Health, Skin Health and Smokers’ Health, together with a strong portfolio of Oral Health brands. Geographically, the GSK consumer healthcare business had a strong presence in higher-growth emerging markets in the Middle East, Africa and Asia, which complemented its businesses in Europe and North America. GSK ownership Demerger from GSK and independent listing 2020 2022 Exit of non-strategic categories to Unilever 2021 Significant divestment programme Disposal of 50 non-strategic growth-dilutive assets 2019 Joint Venture formation: Pfizer Consumer Healthcare 2018 Full buyout of Novartis from JV 2015 Joint Venture formation: Novartis Consumer Healthcare 2013 Divest Exit of beverages 2012 Exit of non-strategic OTC Group information Other Information Group information Haleon Annual Report and Form 20-F 2023 191 |
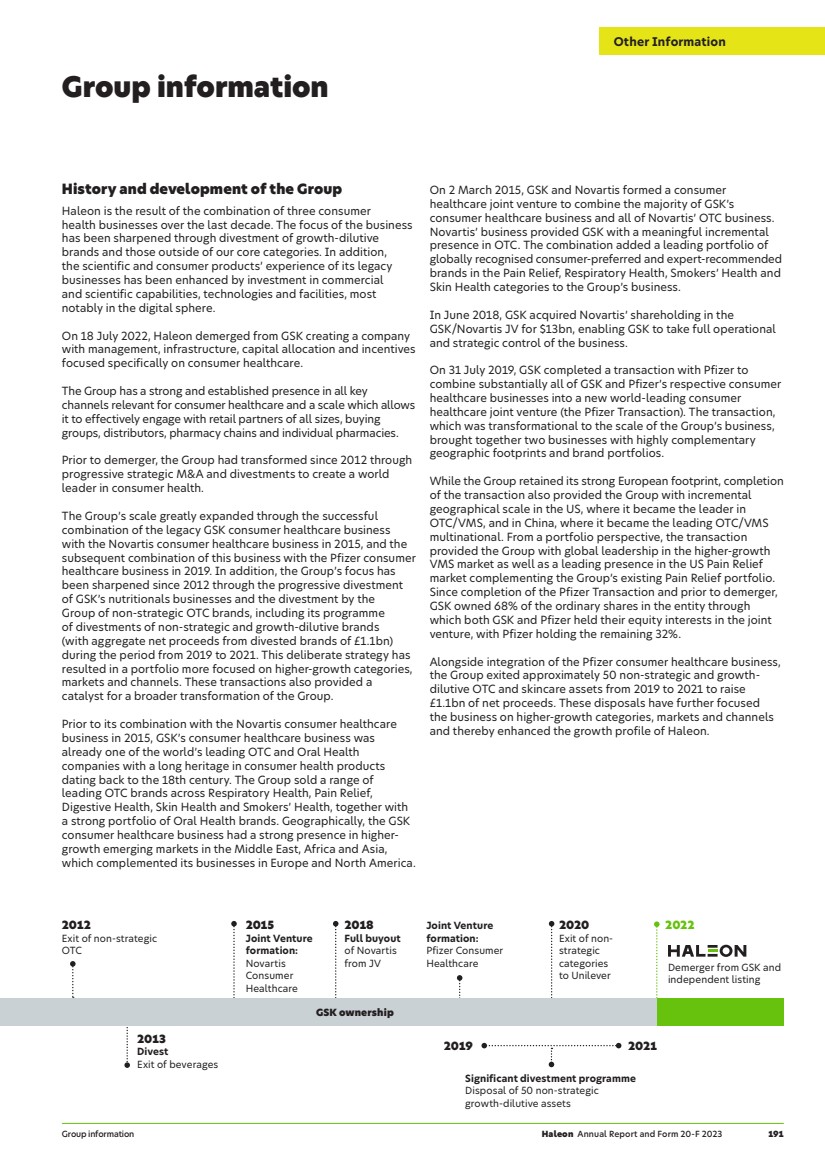
| — Management is responsible for establishing and maintaining adequate internal control over financial reporting for the Group. Internal control over financial reporting is designed to provide reasonable assurance regarding the reliability of financial reporting and the preparation of Financial Statements for external purposes in accordance with IFRS. — Management conducted an evaluation of the effectiveness of internal control over financial reporting based on the framework, Internal Control – Integrated Framework (2013) issued by the Committee of Sponsoring Organizations of the Treadway Commission (COSO). — There have been no changes in the Group’s internal control over financial reporting during 2023 that have materially affected, or are reasonably likely to materially affect, the Group’s internal control over financial reporting. — Management has assessed the effectiveness of internal control over financial reporting as at 31 December 2023 and concluded it is effective. — KPMG LLP, which has audited the Consolidated Financial Statements of the Group for the year ended 31 December 2023, has also assessed the effectiveness of the Group’s internal control over financial reporting under Auditing Standard 2201 of the Public Company Accounting Oversight Board (US). Their audit report is set out from page 112. Change in certifying accountant On 20 April 2023, Haleon shareholders approved the appointment of KPMG LLP (KPMG UK) as its principal accountants for the financial year ending 31 December 2023 at its AGM. KPMG US, which was formerly serving as the Company’s principal accountants in respect of the US, declined to stand for re-election. The decision to change principal accountants was approved by the Haleon plc Board on the recommendation of the Company’s Audit & Risk Committee. In respect of the financial year ended 31 December 2022, there were no: (i) disagreements with KPMG US on any matter of accounting principles or practices, financial statement disclosure, or auditing scope or procedures, which disagreements if not resolved to their satisfaction would have caused them to make reference in connection with their opinion to the subject matter of the disagreement, or (ii) reportable events. The audit report of KPMG US on the Consolidated Financial Statements of Haleon plc and subsidiaries as of and for the year ended 31 December 2022 did not contain any adverse opinion or disclaimer of opinion, nor was it qualified or modified as to uncertainty, audit scope, or accounting principles. We did not consult KPMG UK during our two most recent financial years or any subsequent interim period regarding (i) the application of accounting principles to a specified transaction, either completed or proposed or the type of audit opinion that might be rendered on our Financial Statements; or (ii) any matter that was the subject of a disagreement as that term is used in Item 16F(a)(1)(iv) of Form 20-F or a ‘reportable event’ as described in Item 16F(a)(1)(v) of Form 20-F. Director and Executive Team shareholdings As at 7 March 2024, being the latest practicable date prior to publication of this Annual Report, the Directors and the Executive Team members had beneficial interests in 1,649,868 Haleon ordinary shares (including ordinary shares held indirectly through Haleon ADSs), representing 0.02% of that class. These shareholdings indicate all Directors’ or Executive Team members’ beneficial interests and those held by their spouses and other connected persons. As at 7 March 2024, no Director or Executive Team member held more than 1% of the total issued share capital or has a beneficial interest in the shares of any subsidiary. Executive Director benefits upon termination of office Further information can be found in the Directors’ Remuneration Report from page 80. Property, plant and equipment The Group has interests in properties in numerous countries. None of these interests is individually material in the context of the Group as a whole. Such properties are used by the Group predominantly for manufacturing, distribution and R&D activities. In particular, the Group owns a supply chain of 24 in-house dedicated consumer health manufacturing sites, with key sites located in Levice (Slovakia), Dungarvan (Ireland), Nyon (Switzerland) and Guayama (Puerto Rico). In addition, the Group owns four R&D centres in Richmond, Virginia (USA), Weybridge (UK), Maidenhead (UK) and Suzhou (China) providing it with a broad range of in-house scientific capabilities. The Group is not aware of any environmental issues affecting its properties which would have a material impact upon the Group, and there are no material encumbrances on its properties. The Group believes its existing facilities are satisfactory for its current business and it currently has no plans to construct new facilities or expand or improve its current facilities in a manner that is material to the Group. Disclosure controls and procedures The Group carried out an evaluation under the supervision and with the participation of members of the Group’s management, including the CEO and CFO, of the effectiveness of the design and operation of the Group’s disclosure controls and procedures as required by Item 15(a) of Form 20-F as at 31 December 2023. Based on their evaluation, the CEO and the CFO concluded that, as at that date, the Company maintained an effective system of disclosure controls and procedures. Management’s report on internal control over financial reporting In accordance with the requirements of Section 404 of SOX, the following report is provided by management in respect of the Company’s internal control over financial reporting (as defined in Rules 13a-15(f) and 15d-15(f) under the US Securities Exchange Act of 1934, as amended (the Exchange Act)). Group information continued 192 Haleon Annual Report and Form 20-F 2023 Other Information |
| The Group’s ability to execute its marketing and sales strategy is subject to challenges As a consumer products business, the Group relies on a strategy of leveraging its existing brands and products to drive increased sales and profits. The successful implementation of this strategy depends on, among other things, the Group’s ability to: identify and offer competitively priced products that appeal to evolving consumer preferences; formulate its strategy in response to these changing consumer preferences; innovate successfully on its existing products; and effectively utilise a range of distribution channels in its key markets. Failure to execute this strategy successfully for any reason, including any reduction in consumer demand for the types of products which the Group offers due to changes in consumer lifestyle, environmental concerns, economic downturns or other considerations could have a material adverse effect on the Group’s business, prospects, financial condition and results of operations. The Group’s business results are impacted by the Group’s ability to manage disruptions in the Group’s global supply chain The Group is engaged in the manufacturing and sourcing of products and materials on a global scale. The Group’s operations and those of its suppliers, contract manufacturers and logistics providers have been and may continue to be disrupted by a number of factors, including, but not limited to: increased and/ or changing regulation, as well as regulatory compliance issues; environmental events, including natural disasters (such as fires, floods and earthquakes) and any potential effect of climate change; global shipping, logistics, transport and warehousing constraints, for example due to regional or local conflicts (such as the recent conflict in the Middle East and shipping disruption in the Red Sea) or widespread health emergencies, such as pandemics or epidemics any of which may lead to delays in deliveries and constraints on shipping and logistics as a result of local lockdowns; global supply chain disruption impacting their suppliers; strikes and other labour disputes; cybersecurity failures or incidents; loss, impairment, closure or disruption of key manufacturing sites; loss of, or capacity constraints relating to key suppliers or contract manufacturers; raw material and product quality or safety issues (see The Group may incur liabilities or be forced to recall products as a result of real or perceived product quality or other product-related issues on page 196); industrial accidents or other occupational health and safety issues; the impact on the Group’s suppliers of tighter credit or capital markets; the lack of availability, or retention, of qualified personnel; governmental incentives and controls (including exchange controls, import and export restrictions, such as new or increased tariffs, sanctions, quotas or trade barriers); acts of war (see The Group’s business may be impacted by the effects of regional and local conflicts on page 200) or terrorism, political unrest or uncertainty, fires or explosions, and other external factors over which the Group has no control; and increases in ingredient, commodity, utilities and oil prices. While the product ranges of the Group’s leading brands are manufactured by multiple sources, some of the Group’s products are currently primarily manufactured at a single location and the loss of the use of all or a portion of any of these manufacturing facilities or the loss of the use of, or capacity constraints at, key suppliers in relation to the Group’s other products could impact the Group’s ability to provide these products. Risk factors The Group has identified a broad range of risks relating to its business and the industry in which it operates. These risks are described below and, together with all other information contained in this Annual Report, should be carefully considered in evaluating the Group. The risks and uncertainties described below represent those we consider to be material as at the date of this Annual Report, with material risks being those to which senior management pay particular attention and which could cause the delivery of the Group’s strategy, financial condition, results of operations and/or prospects to differ materially from expectations. However, these risks and uncertainties are not the only ones facing the Group. If any of the following risks occur, our business, financial condition, results of operations and prospects could be materially and adversely affected. Additional risks and uncertainties not presently known to us or that we currently deem immaterial also may impair our business operations. Risks relating to the Group’s business and industry The Group operates in a highly competitive market The Group faces substantial and increasing competition in all of its product categories and geographic markets. There are relatively low barriers to entry in certain product categories in many of the markets in which the Group operates (particularly in the VMS category) and accordingly the Group’s businesses compete with companies of all sizes on many different fronts, including cost-effectiveness, product effectiveness and quality, brand recognition and loyalty, technological innovations, consumer convenience, promotional activities, new product introductions and expansion into new markets and channels. The Group expects to continue to see heightened activity from its competitors worldwide, including: (i) increasing and aggressive competition from smaller, high-growth companies which often operate on a regional basis, and may disrupt existing route-to-market models; (ii) increasing competition from multinational corporations moving for the first time into, or expanding or focusing their presence (whether through acquisitions, disposals, demergers or other means) in the global consumer healthcare market; (iii) continuing competition from private label products, which are brands sold exclusively by a particular retailer; and (iv) an increase in the introduction and aggressive marketing of new products in high demand healthcare areas. Some of the Group’s competitors may conduct more effective advertising and promotion activities than the Group does, introduce competing products more quickly and/or respond more effectively to business and economic conditions and changing consumer preferences, including by launching innovative new products. If the Group is unable to anticipate the timing and scale of these threats across its markets or to successfully respond to them, then its brand loyalty may be harmed, it may lose market share and its business, prospects, results of operations and financial condition may be materially adversely affected. Other Information Group information Haleon Annual Report and Form 20-F 2023 193 |
| and capitalise on access to data) and price comparison sites, changing consumer preferences (as consumers increasingly shop online), and, in certain categories (particularly VMS), the increased presence of alternative retail channels, such as subscription services, sales through social media platforms and direct-to-consumer businesses (especially those which specialise in rapid distribution). The strong growth in e-commerce and the emergence of alternative retail channels may create pricing and margin pressures and/or adversely affect the Group’s relationships with key retailers. If the Group is not able to successfully manage and adapt to these changes in the retail landscape, the Group’s business, prospects, results of operations and financial condition could be materially and adversely affected. The Group may not be able to develop and commercialise new products effectively The future growth of the Group is to a significant extent dependent on its ability to develop new products or new formulations of existing products. The Group’s ability to launch new products and to expand into adjacent categories, channels of distribution or markets is affected by whether the Group can successfully: identify, develop and fund technological innovations; obtain and maintain necessary intellectual property protection and avoid infringing intellectual property rights of others; obtain and maintain approvals and registrations of regulated products in the countries in which the Group has business operations; anticipate the needs and preferences of consumers and customers by, among other things, effectively utilising digital technology and marketing and data analytics to gain new commercial insights and develop or identify relevant products aligned to those preferences; and successfully compete to in-license products. The identification, development and introduction of innovative new products that drive incremental sales involves considerable time, costs and effort, as well as significant risk that any new product may not generate sufficient customer and consumer interest and sales to become a profitable product or to cover the costs of its development and promotion. New products must be developed to meet the Group’s own rigorous internal specifications, as well as the relevant regulatory and safety requirements imposed in our various markets. Each of these restrictions means that a new product can fail to make it to market at any stage or do so in a cost-effective manner. In addition, new products that make it to market may not be accepted quickly or significantly in the marketplace. Any failure to develop and commercialise new products in a timely fashion may lead to decreased market share, decreased revenue and/or increased R&D costs and, consequently, may materially and adversely affect the results of the Group’s operations and financial condition. Failure to retain key talent or attract new talent The Group relies upon a number of key executives and employees who have an in-depth understanding of the consumer healthcare industry and the Group’s technologies, products, programmes, collaborative relationships and strategic goals. While the Group follows a disciplined, ongoing succession planning process and has succession plans in place for those individuals comprising our Board of Directors and our Executive Team (as set out on pages 62 to 65) (Senior Management) and other key executives, these do not guarantee that the services of qualified senior executives will continue to be available to the Group at all times. In addition, the Group purchases certain raw and packaging materials from single-source suppliers or a limited number of suppliers and new suppliers may have to be qualified under industry, governmental and its own standards, which can require additional investment and take a significant period of time. Although the Group has contingency plans in place, such as dual sourcing programmes and alternative supply arrangements, those plans may not be sufficient to mitigate manufacturing or supplier interruptions, and the Group may also be limited in its ability to pass on any increases in the prices it charges for its products as a result of fixed-price supply agreements or hedging arrangements. A significant disruption to the manufacturing or sourcing of products or materials for any reason, including those mentioned above, could interrupt product supply and, if not remedied, could lead to litigation or regulatory action, product delistings by retailers, financial penalties, and reputational damage that could materially and adversely affect the Group’s business, results of operations and financial condition. Increasing dependence on key retail customers, changes in the policies of the Group’s retail customers, the emergence of alternative retail channels and the rapidly changing retail landscape The Group’s products are sold in a highly competitive global marketplace which has experienced increased trade concentration and the growing presence, in both traditional and digital operations, of large-scale retailers, including pharmacies, discounters and e-commerce retailers. The Group is increasingly dependent on certain retailers, and some of these retailers have and may continue to have greater bargaining strength than the Group does. For example, similar to its competitors, while the Group maintains relationships with a variety of significant retailers across its key markets, sales attributable to its top five largest retailers account for over half of the Group’s revenue in the US market. The Group’s large-scale retail customers, including pharmacies, may use their leverage to demand higher trade discounts, allowances, display fees or increased investment, which could lead to reduced sales or profitability. The loss of a key retailer or a significant reduction in sales to a key retailer could materially and adversely affect the Group’s business, prospects, results of operations and financial condition. The Group’s business might also be negatively affected by the growing presence and bargaining strength of customers who operate internationally and retail buying alliances (horizontal alliances of retailers, retail chains or entire retailer groups that cooperate in pooling their resources) and the enhanced leverage that such alliances possess. The Group has also been and may continue to be negatively affected by changes in the policies or practices of the Group’s retail trade and pharmacy customers, such as inventory de-stocking, limitations on access to shelf space, delisting of the Group’s products, or environmental, sustainability, supply chain or packaging initiatives and other conditions. Private label products sold by the Group’s retail customers, which are typically sold at lower prices than branded products, are a source of competition for certain of the Group’s products. In addition, the retail landscape in many of the Group’s markets continues to evolve as a result of the rapid growth of e-commerce retailers (who are able to generate private label products Group information continued Risk factors continued 194 Haleon Annual Report and Form 20-F 2023 Other Information |
| Failure to respond effectively to the challenges raised by climate change and other sustainability and ESG matters Concern over climate change and social impacts has increased the focus on the sustainability of practices and products in the market and may result in new or additional legal and regulatory requirements to reduce or mitigate the effects of climate change on the environment and social impacts. Areas of focus relevant to the Group’s business include, among others, responsible sourcing and deforestation, the use of plastic, energy and water, the recyclability or recoverability of packaging, including single-use and other plastic packaging, and the use of certain materials, such as palm oil where the environmental or social impact of the material can attract scrutiny. New or additional legal and regulatory requirements more stringent than the Group’s current legal and regulatory obligations and/or the Group’s existing practices and procedures, may require the Group to revise its operations and supply chain management. Such requirements may also require upgrades to our systems and processes for capturing ESG data, and compliant ESG reporting may therefore be dependent on those upgrades being in place and fully embedded. There may also be financial impacts as governments implement taxation initiatives, such as extended producer responsibility taxes or carbon taxes, to help recover the cost of managing plastic waste and the impacts of climate change. There may also be reputational impacts, including related impacts such as product delistings with customers or loss of preference with consumers, investors, employees or other stakeholders, should the Group fail, or be perceived to fail, to meet either its publicly stated sustainability goals or community expectations in relation to sustainability initiatives. For further information on the specific climate-related risks facing the Group, see Task Force on Climate-related Financial Disclosures, from page 24. These developments may result in increased costs and disruption to the Group’s operations, and to loss of revenue, which could materially and adversely affect the Group’s business, results of operations, cash flows and financial condition. The Group may not be able to sufficiently protect its intellectual property rights or avoid claims of infringement on the intellectual property rights of others The Group relies on various types of intellectual property rights such as trade marks, patents, copyrights and designs, whether registered or unregistered, as well as unpatented proprietary knowledge and trade secrets, to protect its business. However, these rights do not afford complete protection against third parties’ claims and infringements, for example, due to territorial limitations on intellectual property protections in certain markets in which the Group operates. Additionally, there can be no assurance that third parties will not independently develop knowledge and trade secrets that are similar to the Group’s, or develop products or brands that compete effectively with the Group’s products and brands without infringing, misusing or otherwise violating any of the Group’s intellectual property rights. The Group’s intellectual property rights may also be challenged in the future. In the event of such a challenge, the Group could incur significant costs to defend its intellectual property rights, even if it is ultimately successful. Additionally, there is a risk that the Group will not be able to obtain licences for the intellectual property rights necessary to support new product introductions and product innovations. Competition for such talent is intense, and there can be no assurance that the Group will be able to continue to attract and retain such talent. If the Group is unable to recruit, attract and retain talented, highly qualified Senior Management and other key people for any reason the Group’s business, prospects, results of operations and financial condition could be materially and adversely affected. Damage to the Group’s reputation Maintaining the Group’s strong reputation and trust with consumers and customers globally is critical to selling the Group’s branded products. Negative publicity, posts or comments on social media about the Group, its products, the ways it does business, threatened or pending litigation or regulatory proceedings, its public policy engagement, environmental, social and governance practices, including as they relate to diversity, equality and inclusion, the health, safety and welfare of employees or other stakeholders, or relations with its employees, or regulatory infractions, violations of sanctions or anti-bribery rules, whether or not deserved, could jeopardise the Group’s reputation and/or expose it to adverse press and social media attention. Whether true or untrue, such negative publicity, posts or comments on social media could damage the Group’s brands and its reputation and/or lead to boycotts of its products. Moreover, the Group’s reputation could be harmed as a result of inappropriate use of its branded products being promoted on social media and any associated negative publicity. The Group’s reputation may also be adversely affected if third parties with whom the Group contracts (or an owner, acquirer or other related party of such), including its suppliers, manufacturers and customers, fail to maintain high ethical, social and environmental standards, comply with local laws and regulations or become subject to other negative events or adverse publicity. While the Group has policies and procedures for managing third-party relationships, it may not be possible to fully ensure that third parties adhere to the same standards and values as the Group or to replace third-party relationships in a timely and/or cost-effective manner. Counterfeiting is a common issue for successful brands and has been amplified by the growth of e-commerce. Although the Group has an anti-counterfeiting programme in place, third parties continue to sell counterfeit versions of the Group’s products. These counterfeits are inferior in quality to the genuine Group products and may pose safety risks to consumers. Consumers of the Group’s brands could confuse the Group’s products with or purchase these counterfeit products. The consumption of inferior quality products, which consumers believe to be genuine (and, in some instances, may cause consumer safety issues) could also damage the reputation of the Group and its brands and lead to a reduction in market share. Damage to the Group’s reputation or loss of consumer confidence in the Group’s products for these or any other reasons could materially and adversely affect the Group’s business, results of operations, cash flows and financial condition, as well as require resources to rebuild the Group’s reputation. Other Information Group information Haleon Annual Report and Form 20-F 2023 195 |
| Furthermore, such product quality or other product-related issues also expose the Group to a significant risk of litigation, particularly product liability claims, and regulatory action (see Risks related to litigation, disputes and regulatory investigations, from page 199). Failure by the Group to manufacture its products in accordance with good manufacturing practices could have the potential to do significant damage to the Group’s reputation and materially and adversely affect the results of its operations and financial condition. In addition, if any of the Group’s competitors or customers supply faulty or contaminated products to the market, the Group’s industry could be negatively impacted, which in turn could have material adverse effects on the Group’s business. A cyber-security incident, data breach or a failure of a key information technology system The Group relies extensively on information technology systems (IT systems), including some which are managed, hosted, provided and/or used by third parties, including cloud-based service providers, and their vendors, in order to conduct its business. Although the Group has a broad array of information security measures in place, the Group’s IT systems, including those of third-party service providers with whom it has contracted, have been, and will likely continue to be, subject to computer viruses or other malicious codes, unauthorised access attempts, phishing and other cyber-attacks. Cyber-attacks and other cyber incidents are occurring more frequently, are constantly evolving in nature, are becoming more sophisticated and are being made by groups, individuals and nation states with a wide range of expertise and motives. While the Group has implemented systems, monitoring and training to prevent cyber-attacks and other cyber incidents from being successful, the Group cannot guarantee that its security efforts will protect against breaches or breakdowns of its, or its third-party service providers’, IT systems since the techniques used in these attacks change frequently and may be difficult to detect for periods of time, and so such cyber-attacks may from time to time succeed. In addition, the Group cannot guarantee that it or its third-party service providers’ response to any such incidents will fully remedy the extent of the damage caused by these incidents. Although the Group has policies and procedures in place to ensure that all personal information collected by it or its third-party service providers is securely maintained, data breaches due to human error or intentional or unintentional conduct may still occur in future. Furthermore, the Group periodically upgrades its IT systems or adopts new technologies. If such an upgrade or new technology does not function as designed, does not go as planned or increases the Group’s exposure to a cyber-attack or cyber incident, it may adversely impact the Group’s business, including its ability to ship products to customers, issue invoices and process payments or order raw and packaging materials. If the Group were to suffer a significant loss or disclosure of confidential business or stakeholder information as a result of a breach of its IT systems, including those of third-party service providers with whom it has contracted, or otherwise, the Group may suffer reputational, competitive and/or business harm, incur significant costs and be subject to government investigations, litigation, fines and/or damages, which may materially and adversely impact the Group’s business, prospects, results of operations and financial condition. The Group also uses intellectual property rights in-licensed from licensors. The Group’s licences to such intellectual property rights may not provide exclusive or unrestricted rights in all fields of use and in all territories in which the Group may wish to develop or commercialise its products in the future, may restrict its rights to offer certain products in certain markets, and may not grant the Group full control over the maintenance, protection, enforcement or use of such intellectual property rights, leaving the Group reliant on the licensors to conduct such activities. Further, the agreements under which the Group licenses intellectual property rights from others are complex, and the provisions of such agreements may be susceptible to multiple interpretations. As such, resolution of any dispute relating to such contracts may be costly, time-consuming and ultimately narrow the scope of the Group’s rights to the intellectual property being licensed, or increase what the Group believes to be its financial or other obligations under the relevant agreement. Infringement, misuse or other violation of any of the Group’s intellectual property rights, including by current or former employees, contractors or third parties, may dilute or diminish the value and goodwill of the Group’s brands and products in the marketplace, which could materially and adversely affect the Group’s results of operations and make it more difficult for the Group to maintain a strong market position, leading to a material and adverse effect on the Group’s business and results of operations. The Group may incur liabilities or be forced to recall products as a result of real or perceived product quality or other product-related issues Failure to comply with good manufacturing or good distribution practices and regulations, as well as other regulations in relation to product quality, throughout the Group’s in-house and contract manufacturing supply and distribution chains, could lead to product supply interruptions, product recalls or withdrawals, litigation and/or regulatory enforcement action and fines from regulators, despite employee training, promotion of a health and safety culture, and control measures and systems being in place that are designed to ensure that the safety and quality of the Group’s products is maintained. Additionally, products may be contaminated or tampered with during distribution or at stores. The Group is increasingly using new technology to enhance the manufacture and testing of its products, such as the deployment of new electronic documentation systems and advanced laboratory information management tools. Such technology is inherently susceptible to the threat of cyber-attacks which pose an ongoing risk to the integrity of product quality data and its audit trail. The Group also continues to be reliant on third parties and is continuing to undertake a global network rationalisation programme to reduce the number of manufacturing sites it uses, both of which are factors that may increase the risks to safe and timely supply of products. Product recalls or withdrawals arising as a result of real or perceived product quality, efficacy, safety, environmental or other product-related issues, whether initiated on a voluntary basis or otherwise, can result in a range of adverse consequences to the Group, including lost sales, the requirement to hold increased inventories of substitute products, the cost of re-formulations, damaged relationships with regulators, loss of market share to competitors, adverse publicity and reputational harm, in addition to the direct costs of implementing any recall. Group information continued Risk factors continued 196 Haleon Annual Report and Form 20-F 2023 Other Information |
| manufacturing components; a decrease in the Group’s workforce or in the efficiency of such workforce as a result of illness, travel restrictions, absenteeism or governmental regulations and transportation and logistics challenges; failure of third parties on which the Group relies to meet their obligations to the Group, or significant disruptions in their ability to do so; restrictions on the Group’s employees’ ability to work and travel, mandated closure of certain distributors or retailers, the Group’s offices, shared business service centres and/or operating and manufacturing facilities, or other restrictions that could prevent the Group as well as its third-party partners, suppliers or customers from sufficiently staffing operations; disruptions and volatility in the global capital markets, which may increase the cost of capital and/or adversely impact the Group’s access to capital; and/or volatility in foreign exchange rates and in raw and packaging materials and logistics costs. Despite the Group’s efforts to manage these impacts, their ultimate impact also depends on factors beyond the Group’s knowledge or control, including the duration, severity and geographic scope of an outbreak, the availability, widespread distribution and use of safe and effective vaccines and the actions taken to contain its spread and mitigate its public health and economic effects. The Group may not successfully acquire and integrate other businesses, license rights to technologies or products, form and manage alliances, or divest businesses The Group may decide in the future to pursue acquisitions, technology licensing arrangements, strategic alliances or divestitures as part of its business strategy. The Group may not complete these transactions in a timely manner, on a cost-effective basis or at all. In addition, the Group may be subject to regulatory constraints or limitations or other unforeseen factors that prevent it from realising the expected benefits of such transactions. Even if the Group is successful in completing an acquisition, the products, intellectual property and technologies that are acquired may not be successful or may require significantly greater resources and investments than originally anticipated. The Group may be unable to integrate acquisitions successfully into its existing business, and the Group may be unable to achieve expected operating margin improvements, synergies or efficiencies. The Group could also incur or assume significant debt and unknown or contingent liabilities in connection with acquisitions. The Group’s reported operating results could be negatively affected by acquisition or disposition-related charges, amortisation of expenses related to intangibles and charges for impairment of long-term assets. The Group may be subject to litigation in connection with, or as a result of, acquisitions, dispositions, licences or other alliances and the Group may be liable for future or existing litigation and claims related to the acquired business, disposition, licence or other alliance because either the Group is not indemnified for such claims or the scope or availability of indemnification is limited. These effects could cause the Group to incur significant expenses and could materially and adversely affect the Group’s business, results of operations and financial condition. While the Group has disaster recovery and business continuity plans in place, if its IT systems were damaged, breached or were to cease to function properly for any reason or if it does not effectively resolve such issues on a timely basis, the Group may suffer interruptions in its ability to manage or conduct business as well as reputational harm, and may be subject to governmental investigations and litigation, any of which may materially and adversely impact the Group’s business, prospects, results of operations and financial condition. The Group relies on third parties in many aspects of its business Due to the scale and scope of the Group’s business, the Group relies on relationships with third parties, including its suppliers, contract manufacturers, distributors, contractors, commercial banks, joint venture partners and external business partners, for route to market and for certain administrative and other functions. If the Group is unable to effectively manage and maintain its third-party relationships, including its contractual arrangements, if such third parties fail to meet their obligations to the Group or if there are substantial disruptions in the relationships between the Group and third parties, the Group’s results of operations could be adversely impacted. For example, in China, part of the Group’s business is conducted through a joint venture between Haleon, the Tianjin Pharmaceutical Group and Tianjin Pharmaceutical Da Ren Tang Group Corporation Limited (the TSK&F Joint Venture), pursuant to a joint venture agreement which is due to expire in September 2024. The Group is in discussions with the joint venture parties to agree an extension to the term of the TSK&F Joint Venture or alternative arrangements for the continued operation of its business. There can be no assurance that any extension, or alternative arrangements, would be implemented by September 2024 on terms which allow the Group to continue to operate its business in China on materially the same basis as it currently operates under the TSK&F Joint Venture, or at all. If the Group does not agree an extension to the term of the TSK&F Joint Venture or implement alternative arrangements, then the continuity and development of part of its operations and route to market in China, as well as its business, results of operations and cash flows in that market, may be adversely affected. Third-party relationships inherently involve the Group holding a lesser degree of control over business operations, and compliance with laws, regulations and Group policies and practices than is available for the Group’s own operations and compliance. As such, the Group’s financial, reputational, operational and legal risk is potentially increased, including in respect of health and safety, environmental, social and governance issues, modern slavery, and anti-bribery and corruption. The Group faces various risks related to pandemics, epidemics or similar widespread public health concerns A pandemic, epidemic or similar widespread health concern could have a variety of impacts on the Group’s business, results of operations, cash flows and financial condition, including: effects on the health, safety and wellbeing of the Group’s employees, including key employees; volatility in the demand for and availability of the Group’s products; decreases in demand and sales for certain of the Group’s products such as Theraflu and Robitussin due to a particularly weaker cold and flu season; changes in regulatory policy, including restrictions on sales of certain products; disruptions to the Group’s global supply chain due to, among other things, the availability of raw materials or Other Information Group information Haleon Annual Report and Form 20-F 2023 197 |

| Risks relating to changes in law and the political and economic environment, regulation and legislation The Group’s business is subject to legal and regulatory risks in all the markets in which it operates They apply to most aspects of the Group’s products, including their development, ingredients, formulation, manufacture, packaging content, labelling, storage, transportation, distribution, export, import, advertising, promotion beyond therapeutic indications, sale and environmental impact. Many different governmental and regulatory authorities in the Group’s markets regulate and have jurisdiction over different aspects of the Group’s business activities. In addition, the Group’s selling practices are regulated by competition law authorities in the UK, as well as in the EU, the US and other markets. Additionally, in China, where the Group has significant sales and operations, governmental authorities introduced changes in regulations relating to registrations of all generic medicines (including OTC products) and recently introduced changes for oral health products. These affect both new and existing products and impose increased data submission requirements for products the Group markets in China. There is a risk that commercialisation of certain products of the Group may be restricted in China if the Group is unable to comply with these regulatory changes on the required timetable. Because of the Group’s extensive international operations, the Group could be materially and adversely affected by violations of worldwide anti-bribery laws, including those that prohibit companies and their intermediaries from making improper payments to government officials or other third parties for the purpose of obtaining or retaining business, such as the US Foreign Corrupt Practices Act, the UK Bribery Act 2010, and other laws that prohibit commercial bribery. Additionally, in certain jurisdictions, the Group’s engagement with Health Professionals and other external leaders is subject to applicable restrictions. While the Group’s policies mandate compliance with such laws, the Group cannot provide assurance that the Group’s internal control policies and procedures will always protect the Group from reckless or criminal acts committed by its employees, joint venture partners or agents. Similarly, due to the Group’s international operations, the Group could also be materially and adversely affected by any violations of international sanctions laws, which continue to evolve in response to geopolitical events (see also The Group’s business may be impacted by the effects of regional and local conflicts, on page 200). While it is the Group’s policy to comply with all legal and regulatory requirements applicable to the Group’s business, there can be no guarantee that the Group will always achieve full compliance and a finding that the Group is in violation of, or out of compliance with, applicable laws or regulations could subject the Group to civil remedies, including fines, damages, injunctions or product recalls, or criminal sanctions. Even if a claim is unsuccessful, is without merit or is not fully pursued, the Group may incur costs in responding to such a claim and negative publicity surrounding such assertions regarding the Group’s products, processes or practices. The Group faces risks relating to the regulation and perception of the ingredients it uses in its products Regulatory bodies and consumer groups may, from time to time, request or conduct reviews of the use of certain ingredients that are used in manufacturing the Group’s products. If the result of such reviews is an inability to use, or restrictions on the use Risks relating to the Group’s leverage and debt service obligations Prior to the demerger, the Group incurred financial indebtedness in order to fund the pre-demerger dividend (as described in Note 10 to the Consolidated Financial Statements). As a result, the Group has higher leverage levels than are reflected in the Group’s longer-term strategy and has significant debt service obligations. The Group’s longer-term strategy to improve its financial risk profile, including by reducing levels of indebtedness, may not be successful. The Group’s outstanding financial indebtedness as at 31 December 2023 is set out in Note 19 to the Consolidated Financial Statements. The degree to which the Group is leveraged could have important consequences for the Group’s business, including, but not limited to: increasing the Group’s vulnerability to, and reducing its flexibility to respond to, a downturn in the Group’s business or general adverse economic and industry conditions; limiting the Group’s ability to obtain additional financing in the longer term; requiring the dedication of a substantial portion of the Group’s cash flow from operations to the payment of interest on the Group’s indebtedness and the repayment of principal, thereby reducing the availability of such cash flow to fund capital expenditures, dividends, joint ventures, acquisitions or other general corporate purposes; increasing the cost of future borrowings for the Group; a downgrade in the Group’s credit rating, which may, in turn, increase the cost of the Group’s financing arrangements and make it difficult for the Group to access financing on commercially acceptable terms or at all; limiting the Group’s flexibility in planning for, or reacting to, changes in the Group’s business and the competitive environment and the industry in which it operates; and placing the Group at a competitive disadvantage as compared to some of its competitors, to the extent that they are not as highly leveraged. Any of these or other consequences or events could have a material adverse effect on the Group’s business, financial condition and results of operations. In addition, the Group may incur substantial additional indebtedness in the future. The covenants in existing financing instruments do not fully prohibit the Company or its subsidiaries from incurring more indebtedness. If new debt is added to the Group’s debt levels, the risks that it faces could intensify. The incurrence of additional indebtedness would increase the leverage-related risks described herein and would increase the risk of a downgrade in the Group’s credit rating. Goodwill and indefinite-life intangible assets are a material component of the Group’s balance sheet and may be subject to impairments The Group has recorded a significant amount of goodwill and indefinite-life intangible assets on its balance sheet as set out in Note 14 to the Consolidated Financial Statements. The Group tests the carrying values of goodwill and indefinite-life intangible assets for impairment at least annually and whenever events or circumstances indicate the carrying value may not be recoverable. The estimates and assumptions about future results of operations and cash flows made in connection with impairment testing could differ from future actual results of operations and cash flows. Any resulting impairment charge, although non-cash, could have a material adverse effect on the Group’s results of operations and financial condition. Group information continued Risk factors continued 198 Haleon Annual Report and Form 20-F 2023 Other Information |
| Sustained elevated interest rates may in future increase the Group’s interest expenses associated with these and future debt obligations and thereby reduce cashflow available for other purposes. Any hedging arrangements entered into by the Group to offset this risk may prove not to be fully effective or available on terms that are acceptable to the Group. Risks related to litigation, disputes and regulatory investigations The Group is, and may in the future be, subject to legal proceedings, disputes and regulatory and governmental investigations in various contexts, including consumer fraud actions, competitor and regulatory challenges to product and marketing claims, competition law investigations, product liability and quality claims, human resources claims, contractual disputes and other disputes or claims arising in the ordinary course of its business operations. These legal actions, disputes and investigations may relate to aspects of the Group’s businesses and operations that are specific to the Group, or that are common to companies that operate in the Group’s markets, and this risk may be enhanced in circumstances where the Group is operating in new markets. Legal actions and disputes may arise under contracts, regulations or from a course of conduct taken by the Group, and may be class actions. Further information on legal proceedings impacting the Group are detailed in Note 22 to the Consolidated Financial Statements, on page 152. In connection with acquisitions, disposals or other transactions, the Group may enter into contractual arrangements pursuant to which the Group may become exposed to litigation risk despite not being a party to proceedings in relation to which the indemnities may be implicated. In connection with the separation as further set out below under “The Group has indemnification obligations in favour of the GSK Group and the Pfizer Group, which could be significant”, GSK and Pfizer have each served the Group with notice of potential claims for indemnification relating to OTC Zantac, the outcome of which claims is currently uncertain. The Group has rejected both GSK’s and Pfizer’s requests for indemnification on the basis that the scope of the indemnities set out in the joint venture agreement only covers the consumer healthcare businesses of GSK and Pfizer when the Consumer Healthcare JV was formed in 2018. Given the large or indeterminate amounts of damages sometimes sought by claimants, other sanctions that might be imposed (including the Group no longer being able to use key claims) and the inherent unpredictability of litigation and disputes, it is possible that an adverse outcome to any litigation, dispute, government or regulatory investigation could have a material adverse effect on the Group’s business, financial condition, results of operations and prospects. The Group has made provisions for legal disputes and matters, including amounts relating to legal and administrative proceedings, which we believe are reasonably possible (but not probable) to be realised. Given the inherent uncertainty of litigation, it is possible that we might incur additional liabilities as a consequence of the proceedings and claims brought against us, including those that are not currently believed by us to be reasonably possible. Details of these contingencies are included within Other provisions as set out in Note 21 to the Consolidated Financial Statements, on page 152. of, certain ingredients and/or any requirement for remedial action, the Group may incur significant additional costs and/ or need to invest substantial resources to make formulation adjustments to its products. Additionally, the Group may be adversely affected by the findings and any remedial actions resulting from the EU’s ongoing investigations into the impact of pharmaceuticals in the environment. While the Group monitors and seeks to respond to and address the impact of any emerging regulatory and legislative developments, new or more stringent ingredient legislation could have a negative impact on the Group’s business, undermine the Group’s reputation and goodwill and affect consumer demand or trade customer demand for products containing such ingredients. If the Group voluntarily removes, or is required to remove, certain ingredients from its products, it may not be able to develop an alternative formulation, successfully modify its existing products or obtain necessary regulatory approvals on a timely basis, or at all, which could materially and adversely impact the Group’s business, prospects, financial condition and results of operations. The Group’s business is subject to market fluctuations and general economic conditions, including inflationary pressures and increased interest rates Uncertainty, fluctuations or negative trends in the international economic climate have had and could continue to have a material adverse effect on the Group’s business and profitability. There will be market fluctuations and economic factors that will be beyond the Group’s control, but that will have the potential to materially and adversely affect its business, revenue, financial condition and operating results. Such factors include: (i) inflation or deflation; (ii) changes in government, fiscal and monetary policies; (iii) changes in the financial standing of the Group’s customers, suppliers and consumers, including levels of employment, real disposable income, salaries and wage rates; (iv) consumer confidence and consumer perception of economic conditions; (v) retailers’ perception of consumer spending habits; (vi) technological change; (vii) exposure to possibly adverse governmental or regulatory actions in countries where the Group operates or conducts business; (viii) levels of volatility in global markets; (ix) exposure to the effects of economic sanctions or other restrictive economic measures as a result of the Group’s global presence; and (x) any change or development in global, national or regional economic and political conditions. For example, the Group is exposed to inflationary pressures and commodity prices, which generally affect the Group through their impact on payroll and supply costs (including freight). Whilst the Group may increase product prices in order to mitigate the impact of inflation, competitive pressures may constrain the Group’s ability to fully recover any increased costs in this way, and so the Group may remain subject to market risk with respect to inflationary pressures and increases in commodity prices. In addition, the Group’s initiatives to offset headwinds from inflation in input prices and commodities, including forward buying, value engineering and alternative supply arrangements, may not be sufficient to mitigate these risks. Relatedly, the Group is also subject to risks arising from the recent rapid increase of interest rates in many markets around the world. In particular, the Group has obligations under financial instruments that bear interest at floating rates, and borrowings under the Group’s bank financing facilities (see Note 25 to the Consolidated Financial Statements, from page 156). Other Information Group information Haleon Annual Report and Form 20-F 2023 199 |
| The Group faces risks including but not limited to: — Disruption to the Group’s business operations, including adverse impacts on its employees and on its revenue derived in regions involved in conflict. — Foreign exchange risk relating to its revenues denominated in relevant currencies. For example, the Group generates revenue from sales of its products in Russia in Russian Rubles, and denominates its significant costs in other currencies, such as Pound Sterling, Euro and USD. Sanctions against Russia have increased volatility in the value of the Russian Ruble, which may affect the results of the Group’s operations in Russia as the relative value between its derived revenues and incurred costs fluctuates. The Group may not be able to offset any devaluation of such currencies through increased prices of its products. In addition, the imposition of exchange controls may limit the Group’s ability to repatriate profits from its operations in relevant countries. — Reduced demand for the Group’s products which exposes the Group to increased counterparty risk in relation to customers and receivables from customers. — Compliance with global sanctions regimes, and possible counter measures imposed in response, many of which are evolving rapidly and are increasingly complex to operate within. — Potential litigation risk from the Group’s counterparties seeking to assert their rights for payments that are unable to be made by the Group because of sanctions imposed on counterparties or financial institutions. — Reputational risks associated with the Group’s continued presence in certain markets. Negative publicity surrounding the Group’s continued presence and/or supply of products in countries involved in conflict could damage the Group’s brands and its reputation, lead to boycotts of its products outside the conflict region and/or have consequences on the continuation of operations and/or sales, including a determination by the Group to discontinue all sales in such countries. — As part of the Russian Government’s indicated plans to seize the assets of western companies leaving Russia, in the event that the Group discontinues its Russian operations, the potential (i) nationalisation of the Group’s Russian assets, (ii) devaluing of the Group’s Russian patents and trademarks and (iii) introduction of restrictions on, or imposition of unfavourable terms in respect of, payments made from Russia or relating to assets in Russia. The impact of conflict remains highly uncertain and there may be additional risks to the Group arising out of or relating to the current conflicts and escalating military conflicts globally, which could also have a material adverse effect on the Group’s business. Failure to comply with regulation regarding the use of personal data The Group is subject to regulations in the jurisdictions in which it operates regarding the use of personal data. The Group collects and processes personal data from its consumers, customers, business contacts and employees as part of the operation of its business, and therefore it must comply with data protection and privacy laws. Those laws generally impose certain requirements on the Group in respect of the collection, retention, use and processing of such personal information. Notwithstanding its efforts, the Group is exposed to the risk that this data could be wrongfully appropriated, lost, disclosed, retained, stolen or processed in breach of data protection laws. EU GDPR and the GDPR as it forms part of retained EU law in the UK as well as the increased data protection regulation in other The Group faces risks associated with significant international operations The Group operates on a global basis. While geographic diversity helps to reduce the Group’s exposure to risks in any one country or part of the world, it also means that the Group faces risks associated with significant international operations, including, but not limited to: exchange rate risks; regulatory limits on the import and export of products, or repatriation of earnings (including exchange and export/import controls); political or economic instability, geopolitical events and rising geopolitical trade tensions as well as social or labour unrest; foreign ownership and investment restrictions and the potential for nationalisation or expropriation of property or other resources; changes to trade policies and agreements and other foreign or domestic legal and regulatory requirements, including those resulting in potentially adverse tax consequences or the imposition of and/or the increase in onerous trade restrictions, tariffs and/or price controls (including requirements to exclusively utilise local manufacturing); and changes to labour laws, travel or immigration restrictions. Any or all of the foregoing risks could adversely impact consumer confidence, affect the Group’s product mix and/or have a significant impact on the Group’s ability to sell its products on a competitive basis in international markets and may materially and adversely affect its business, prospects, results of operations and financial condition. Volatility in material and other costs could materially and adversely impact the Group’s profitability Increases in the costs of and/or a reduction in the availability of materials, including active pharmaceutical ingredients and excipients and raw and packaging material commodities, as well as labour, energy, logistics and other necessary services, such as those seen during the COVID-19 pandemic and in relation to inflationary pressures, may adversely affect the Group’s profit margins. If material and other cost increases continue in the future, the Group may be unable to pass along such higher costs in the form of price increases, achieve cost efficiencies, or otherwise manage the exposure through sourcing strategies, ongoing productivity initiatives and the potential use of commodity hedging contracts. Sustained price increases may lead to declines in sales volumes as competitors may not adjust their prices or consumers may decide not to pay higher prices, which could lead to sales declines and loss of market share and could materially and adversely affect the Group’s business, results of operations and financial condition. The Group’s business may be impacted by the effects of regional and local conflicts The Group monitors the effects of regional and local conflicts. However, the broader economic consequences of Russia’s invasion of Ukraine and other recent regional conflicts, including in the Middle East, continue to be difficult to predict, and the ongoing global geopolitical and economic instability related to the actions of governments relating thereto (including sanctions measures), the effects of which include (but are not limited to) changes in commodity, freight, logistics and input costs, could continue to adversely impact the Group’s business and/or the trading prices of its securities. Group information continued Risk factors continued 200 Haleon Annual Report and Form 20-F 2023 Other Information |
| Changes in the tax systems of the countries in which the Group operates could adversely affect the Group’s financial condition and results of operations Many countries, including the ones in which the Group operates, change their tax laws from time to time, including by legislation, regulation, administrative practice, judicial action or entering into or amending tax treaties. The Group’s financial condition and results of operations may be adversely affected by such changes. For example, the Organisation for Economic Co-Operation and Development’s base erosion and profit shifting project and Pillar Two regime, which is focused on establishing a global minimum corporate taxation rate, has caused or is anticipated to cause changes in the tax laws of many countries in which the Group operates, and it is estimated that Pillar Two will increase the adjusted effective tax rate of the Group by less than 1%. Similarly, the US Government routinely proposes changes to US tax laws, and such changes, including any expansion of the scope of the US anti-inversion rules, could also adversely affect the Group’s tax profile. Risks relating to separation of its business from GSK The Group has indemnification obligations in favour of the GSK Group and the Pfizer Group, which could be significant The Group, GSK, and Pfizer, entered into the Pfizer Stock and Asset Purchase Agreement (Pfizer SAPA) on 19 December 2018 pursuant to which the Group, GSK, and Pfizer agreed to form a new global consumer healthcare joint venture. The Pfizer SAPA, as amended from time to time, including by the Pfizer SAPA Amendment Agreement, contains certain cross indemnities among the Group, the GSK Group and the Pfizer Group. Among other provisions, the Group is required to indemnify the GSK Group and Pfizer Group in respect of “Purchaser Liabilities” and “Assumed Liabilities.” GSK and Pfizer have each served the Group with notice of potential claims under the relevant indemnification provisions in the Pfizer SAPA in relation to possible liabilities connected with OTC Zantac which the Group has rejected (see Legal proceedings in Note 22 to the Consolidated Financial Statements, on page 152). It is not possible, at this stage, to meaningfully assess whether the outcome will result in a probable outflow, or to quantify or reliably estimate what liability (if any) the Group may have to GSK and/or Pfizer under the relevant indemnities. In addition the Group has entered into a tax covenant with GSK and Pfizer on 1 June 2022 (the Tax Covenant), effective from the time of the Demerger. The Tax Covenant contains certain indemnities (subject to certain financial and other limitations) in respect of taxation given from GSK and Pfizer to Haleon (and vice versa). If any amounts payable by the Group under these indemnities (or additional taxes imposed on the Group that are not indemnified by GSK and/or Pfizer under the Tax Covenant) are substantial, this could have a material adverse effect on the financial condition, results of operations and/or prospects of the Group. The Tax Covenant will restrict the Company’s ability to engage in certain transactions The Tax Covenant imposes certain restrictions on the Company which largely fall away from July 2024. For example, there are restrictions on certain asset disposals as well as on certain internal restructuring transactions (including liquidations or the issuance or redemption of stock or debt of certain subsidiaries of the Company). Although the Company does not currently anticipate that these restrictions would have a material adverse impact on the Company, these restrictions may reduce the Company’s ability to engage in certain business transactions that otherwise might be advantageous, until July 2024 when the majority of such restrictions fall away. jurisdictions, such as China, Russia and the US, introduced the potential for significant new levels of fines for non-compliance based on turnover. As part of its ongoing compliance with applicable requirements, the Group may be required to expend significant capital or other resources and/or modify its operations to meet such requirements, any or a combination of which could have a material adverse effect on the Group’s business, financial condition and financial results, or otherwise harm its reputation. The Group is exposed to risks relating to fluctuations in currency exchange rates and related hedging activities The Group operates internationally and holds assets, incurs liabilities, generates sales and pays expenses in a variety of currencies other than Pound Sterling (the currency in which it reports its financial results). The most significant foreign currency exposures are to the USD, Euro, Swiss Franc and Chinese Renminbi, including $8,448m of USD-denominated bonds and €2,350m of Euro-denominated bonds incurred by the Group as at 31 December 2023. Fluctuations in exchange rates for foreign currencies have reduced and could continue to reduce the Pound Sterling value of sales, earnings and cash flows the Group receives from markets outside the UK, increase its supply costs (as measured in Pound Sterling) in those markets, negatively impact its competitiveness in those markets or otherwise materially and adversely impact its business or financial condition. The Group’s foreign currency exposure will be greater for so long as the leverage levels of the Group are higher than are reflected in the Group’s longer-term strategy, the success of which cannot be guaranteed. The Group aims to manage this risk through hedging where possible and practical; however, such hedging activities may be ineffective or may not offset more than a portion of the adverse financial effect resulting from variations to such rates. The Group is also exposed to counterparty credit (or repayment) risk under hedging contracts. To the extent any hedging activities of the Group are wholly or partially ineffective, or to the extent a hedging counterparty fails to meet its obligations under any hedging agreement, this could result in losses which could have a material adverse effect on the Group’s business, results of operations and financial condition. Determinations made by the Group with respect to the application of tax law may result in challenges from or disputes with tax authorities which result in the payment of additional amounts for tax The worldwide nature of the Group’s operations means that the Group is subject to the tax laws in each country in which it operates. Tax laws are complex and on occasion are subject to interpretation by Haleon and the relevant fiscal authorities, such that this may result in conflict and creates the risk of double taxation. Additionally, the Group is subject to many different forms of taxation within any given jurisdiction in which it operates (including, but not limited to, corporate income taxes, capital gains taxes on direct or indirect transfers of ownership, stamp duty and similar transfer taxes, value added taxes, property taxes and social security and other payroll taxes). The global tax environment across all taxes continues to change rapidly creating further complexity and uncertainty. This means that the Group may be subject to domestic and cross-border tax authority disputes in the future, which could result in the payment of additional amounts of tax. Such potential disputes and the resulting payment obligations could have a material adverse effect on the Group’s business, results of operations and financial condition. At 31 December 2023, the Group had recognised provisions of £148 million in respect of uncertain tax positions. Other Information Group information Haleon Annual Report and Form 20-F 2023 201 |
| Group information continued Description of securities other than equity securities Fees and charges payable by ADR holders The Company’s American Depositary Receipt (ADR) programme is administered by J.P. Morgan Chase Bank, N.A. (the Depositary), as the Depositary. The holder of an ADR may have to pay the following fees and charges to the Depositary in connection with ownership of the ADR: Category Depositary actions Associated fee or charge Depositing or substituting the underlying shares Each person to whom ADRs are issued against deposits of shares, including deposits and issuances in respect of: (i) share distributions, stock splits, rights, mergers or (ii) exchange of securities or any other transactions or event or other distribution affecting the ADSs or the deposited securities. Up to $5.00 for each 100 ADSs (or portion thereof) issued or delivered (as the case may be). Receiving or distributing dividends Distribution of cash/stock dividends. $0.05 or less per ADS. Selling or exercising rights Distribution or sale of securities, the fee being in an amount equal to the fee for the execution and delivery of ADSs which would have been charged as a result of the deposit of such securities. Up to $5.00 for each 100 ADSs (or portion thereof). Withdrawing, cancelling or reducing an underlying security Surrendering ADSs for cancellation and withdrawal of deposited property. Up to $5.00 for each 100 ADSs (or portion thereof) surrendered or cancelled (as the case may be). Transferring, combination or split-up of receipts Not applicable. Not applicable. General depositary services, particularly those charged on an annual basis1 Other services performed by the Depositary in administering the ADRs. A fee of $0.05 or less per ADS per calendar year held on the applicable record date(s) established by the Depositary. Fees and expenses of the Depositary Fees and expenses incurred by the Depositary or the Depositary’s agents on behalf of holders, including in connection with: (i) stock transfer or other taxes and other governmental charges, (ii) cancellation transaction fees and delivery expenses, (iii), transfer or registration expenses in connection with the deposit and withdrawal of deposited securities, (iv) expenses in connection with the conversion of foreign currency into US Dollars (which are paid out of such foreign currency); (v) cable, telex, facsimile transmission/delivery and (vi) any other charge payable by the ADR Depositary or its agents. As incurred by the Depositary. 1 With effect from 6 December 2022, Haleon agreed that the Depositary could charge an administration fee of $0.03 per ADR annually. Direct and indirect payments by the Depositary The Depositary anticipates reimbursing Haleon for certain expenses incurred by it that are related to the establishment and maintenance of the ADR programme upon such terms and conditions as Haleon and the Depositary may agree from time to time. The Depositary may make available to Haleon a set amount or a portion of the Depositary fees charged in respect of the ADR programme or otherwise upon such terms and conditions as Haleon and the Depositary may agree from time to time. In respect of the year ended 31 December 2023, the Depositary made payments of approximately $16.2m. Under certain circumstances, including removal of the Depositary or termination of the ADR programme by Haleon, Haleon is required to repay certain amounts paid to it and to compensate the Depositary for payments made or services provided on behalf of Haleon. 202 Haleon Annual Report and Form 20-F 2023 Other Information |
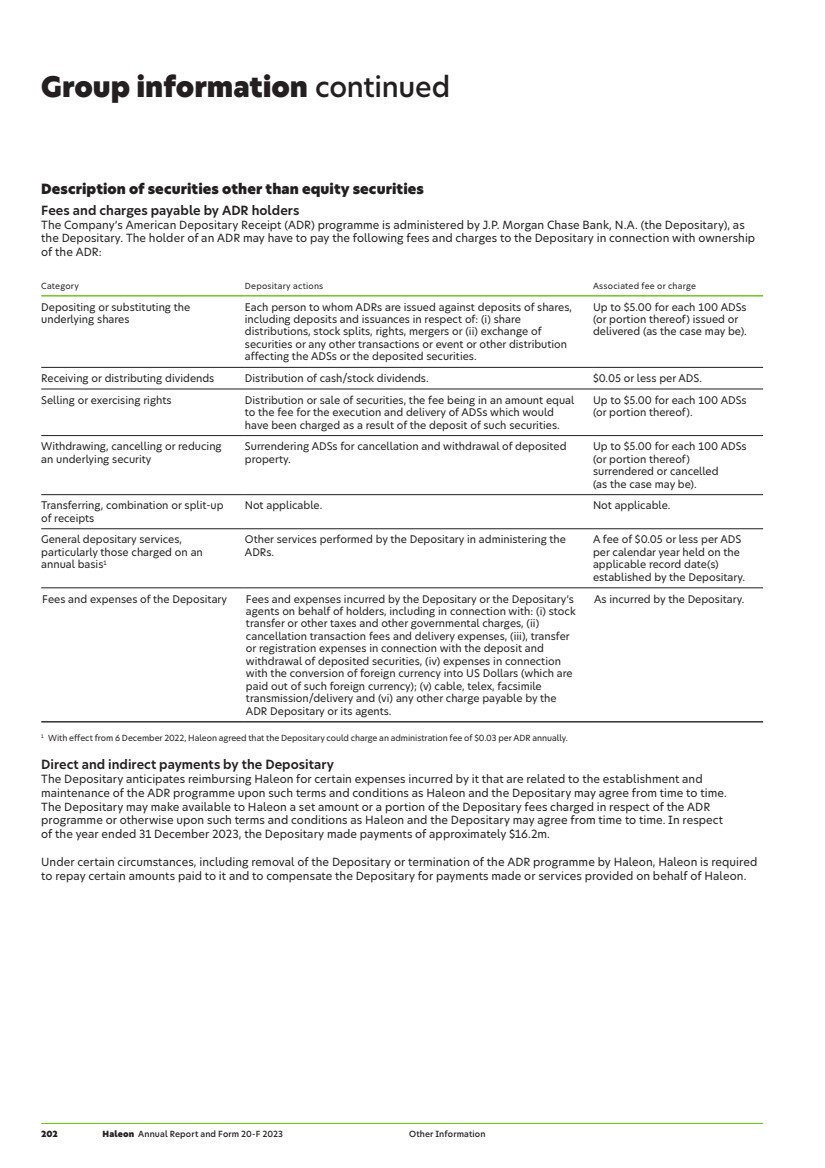
| The non-voting preference shares rank pari passu with all other non-voting preference shares and have preferential dividend rights ahead of the ordinary shares, entitling holders to quarterly cumulative dividends at a fixed rate of 9.5% per annum for five years from the date of the issue, following which the rate shall be reset for each subsequent period of five consecutive years at the rate equal to the Bank of England base rate prevailing at the time of reset plus 7.5%. Dividends on the non-voting preference shares which have become payable are required to be paid in full before any repurchases or distributions can be made with respect to the ordinary shares. Any dividend unclaimed after a period of six years from the date it was declared or became due for payment is forfeited and reverts to the Company unless the Board decides otherwise. The Board may decide how dividends or other money payable in cash relating to a share are paid. If shareholders fail to provide the necessary details to enable payment, or if payment cannot be made using the details provided by the shareholder, the dividend or other amount payable will be treated as unclaimed. Rights on a winding up The non-voting preference shares carry preferential rights to participate in a distribution of capital in the event of insolvency (including on a winding-up) up to an amount equal to their nominal value plus accrued dividend and any arrears or deficiency in amount of the cumulative dividend. The ordinary shares do not carry any rights to participate in a capital distribution (including on a liquidation) other than those that exist as a matter of law. Under the Companies Act, upon a liquidation, after the claims of creditors have been satisfied and subject to any special rights attaching to any other class of shares in the Company (including the non-voting preference shares), surplus assets (if any) are distributed among the shareholders in proportion to the number and nominal amounts of their ordinary shares. Redemption of non-voting preference shares Each non-voting preference share is redeemable in whole at the option of the Company or each relevant shareholder in respect of its entire holding on any date falling not less than five years after the date on which that share was issued or, if earlier, on the Company undergoing a change of control. General meetings The Company is required to give at least 21 days’ notice of a general meeting unless a special resolution reducing the period to not less than 14 days has been passed at the immediately preceding AGM. The Board may decide to allow persons entitled to attend and participate in a general meeting to do so by simultaneous attendance and participation by means of an electronic facility with no member necessarily in physical attendance at the electronic meeting, and to permit Directors or others to attend and speak, and the chair of the meeting to preside, by electronic means. Shareholders present in person or by proxy by means of such electronic facility will be counted in the quorum for, and be entitled to participate in, the relevant general meeting. Restrictions in respect of designated persons The Company can apply restrictions and take certain actions in relation to its shares where the Company believes the holder is or may be designated as a sanctioned person by certain authorities (including the UK, US, EU or any respective governmental institutions) or where it would be unlawful by virtue of any applicable sanctions laws. Articles of Association The Articles of Association, adopted on 31 May 2022, contain (amongst others) provisions to the following effect. Any amendment requires the approval of shareholders by a special resolution at a general meeting. The Company’s objects are unrestricted. Directors The Board has the authority to manage the business of the Company, for example, through powers to issue and repurchase its shares, subject where required to shareholder resolutions. Subject to certain exceptions, the Directors do not have power to vote at Board meetings on matters in which they have a material interest. The Company by ordinary resolution, or the Board, may appoint any person permitted by law to do so and willing to act to be a Director. In addition to any power of removal under legislation, the Company may by special resolution remove a Director before the expiration of their period of office and may (subject to the Articles) by ordinary resolution appoint another person as a Director in their place. All Directors must retire from office at the AGM each year and may offer themselves for re-election. Rights and restrictions The liability of shareholders is limited to the amount, if any, unpaid on the ordinary shares held by them. Subject to any rights attached to existing shares, the Company may issue (i) shares with such rights and restrictions as the Company may by ordinary resolution decide, or (if there is no such resolution or so far as it does not make specific provision) as the Board may decide and (ii) redeemable shares, and the Board may determine the terms and conditions applied to shares so issued. Such rights, restrictions, terms and conditions apply to the relevant shares as if they were set out in the Articles. Shareholders are entitled to vote at a general meeting or class meeting on a poll. Any resolution put to a vote at a general meeting of the Company shall be decided on a poll. The Companies Act and the Articles provide that on a poll every shareholder has one vote per ordinary share held and a shareholder may vote in person or by one or more proxies. The proxies appointed by them taken together have the same voting rights as the shareholder could exercise in person. In the case of joint holders, the vote of the senior who tenders a vote is accepted to the exclusion of the votes of the other joint holders and seniority is determined by the order in which the names stand in the register. Non-voting preference shares do not confer any right to vote at a general meeting. Non-voting preference shareholders are, however, entitled to vote at any class meeting of non-voting preference shareholders. A shareholder is not entitled to vote any share held by them at any general or class meeting if any call or other sum then payable remains unpaid or if that shareholder has been served with a restriction notice (as defined in the Articles) after failure to provide the Company with information concerning interests in those shares required to be provided under the Companies Act. Dividends The Company may by ordinary resolution declare dividends not exceeding the amount recommended by the Board. Subject to the Companies Act, the Board may pay dividends whenever the financial position of the Company, in the opinion of the Board, justifies its payment. Other Information Group information Haleon Annual Report and Form 20-F 2023 203 |
| Impact of regulation The Group’s activities are subject to regulation on a local and international level that impact the Group’s activities. The majority of the Group’s products can be categorised according to four principal regulatory classifications: OTC medicines; medical devices; foods; and cosmetics. Each is subject to regulatory regimes that restrict research, development, manufacturing, testing, marketing and sale of the Group’s products, and the process of obtaining regulatory approvals and ongoing compliance with applicable laws, regulations and other requirements necessitate the expenditure of substantial time and financial resources, which can increase the cost and complexity of the Group’s business (see, for example, The Group may not be able to develop and commercialise new products effectively in the Risk Factors section on page 193). In the US, the FDA is our principal regulator and we must also comply with regulations promulgated by other federal and state authorities. In the EU, the regulatory system is based on a network of national competent authorities in the European Economic Area, working together with the European Medicines Agency and the European Commission. In China, the National Medical Products Administration (and affiliated institutions) is the primary regulator supervising and regulating drugs, medical devices and cosmetics. — OTC medicines. OTC medicines are regulated according to guidelines and standards published by the International Council for Harmonisation of Technical Requirements for Pharmaceuticals for Human Use. The requirements govern, among other things, pre-clinical and clinical testing, pre- and post-marketing approval, production, distribution, import, export, and advertising. Failure to comply can result in recalls, seizures, injunctions, refusal or withdrawal of approval of products, fines or criminal prosecution. — Medical devices. All medical devices must satisfy safety and performance, quality system (some low-risk devices may be exempt) and labelling requirements, with the degree of regulatory scrutiny increasing with the potential risks of the medical device. Regulatory controls on medical devices, including pre-market authorisation requirements, may require the provision of stringent supporting material, including (among other things) independent external audits of the manufacturer’s quality systems, independent external review of the technical data and documentation of relevant clinical evidence to support the manufacturer’s claims. — Food. Most food products do not require pre-market authorisation, although specific categories (such as food supplements, foods for special medical purposes or dietary supplements) may require notification of sale to regulators. In some countries, such as China, products classified as functional health foods require a formal pre-market review and registration. Products in this category are subject to strict quality and safety standards, including for packaging and product composition. — Cosmetics. Cosmetics can be classified differently by territory: a cosmetic in one country may be classified as a medicine, or even a medical device, in another country (e.g., fluoride toothpaste is a cosmetic in the EU and a drug in the US). Some countries require pre-market approval involving the provision of safety assessments, manufacturing data and raw material functionality, while other countries require no registration. Group information continued Additional laws, regulations and other requirements materially relevant to the Group’s business include: — Claims and labelling. The labelling and advertising for all product classifications which the Group markets is subject to applicable laws in markets in which the Group operates, which may specify text format and the order of information, require specific information and statements, and restrict misleading, unfair or unsubstantiated claims in advertisements and on labels. Regulatory authorities may take enforcement action against businesses which fail to comply with relevant rules. — Pricing. The Group’s activities are also subject to price control laws and regulations in some of the markets in which it operates. For example, in China, in respect of medicines (both Rx and OTC) in the hospital channel, the government regulates prices through a centralised procurement mechanism, medical insurance reimbursement standards and strengthened regulation of medical and pricing practices. — Consumer safety and quality. The Group is subject to vigilance regulations designed to ensure the safety of its products, whether in the development pipeline, already approved, or post-launch. These regulations require the collection, detection, assessment, monitoring and prevention of adverse events/undesirable effects, through (among other things) inspection by health authorities, reporting of serious safety events, and preparation of periodic safety reports. The Group is also subject to quality regulations that apply to innovation, manufacturing practices, testing, marketing, post-marketing studies and reporting by product classification. These regulations can require pre- and post-approval inspections of facilities to ensure good manufacturing practice compliance, and the imposition of quality systems regulations on medical devices. Exchange controls and restrictions on payment of dividends Other than certain economic sanctions in force from time to time, there are no governmental laws, decrees or regulations in the UK restricting the import or export of capital or affecting the remittance of dividends, interest or other payments to non-resident holders of ordinary shares or ADRs. There are no limitations under English law or the Articles on the right of non-resident or foreign owners to be the registered holders of, or to exercise voting rights in, ordinary shares or ADRs. 204 Haleon Annual Report and Form 20-F 2023 Other Information |
| Material contracts The contracts listed below have been entered into by the Company or a member of the Group within the two years immediately preceding the date of this Annual Report and are material to the Company or any member of the Group (other than contracts entered into in the ordinary course of business) or were subsisting during this period of review and are contracts of significance with a controlling shareholder in accordance with Listing Rule 9.8.4R(10). Pfizer Stock and Asset Purchase Agreement Pursuant to a stock and asset purchase agreement dated 19 December 2018 and amended and restated on 31 July 2019 (the Pfizer SAPA), GSK, Pfizer and GlaxoSmithKline Consumer Healthcare Holdings (No.2) Limited (now known as Haleon UK Holdings (No.2) Limited) (CH JVCo, as the holding company for the Group prior to separation) agreed to form a new global consumer healthcare joint venture (the GSK/ Pfizer JV), through: (i) the acquisition by CH JVCo of the Pfizer Contributed CH Business (as defined below) from Pfizer and (ii) the transfer by GSK to CH JVCo of those parts of the GSK Contributed CH Business (as defined below) not already owned by GlaxoSmithKline Consumer Healthcare Holdings Limited (now known as Haleon UK Holdings Limited) (GSKCHH, the former holding company of the Group). Completion of the transaction (Pfizer Completion) took place on 31 July 2019. Following the Demerger, the Group has assumed the obligations of CH JVCo under each of the contracts disclosed in this section. Asset Perimeter: GSK Contributed CH Business The “GSK Contributed CH Business” has the meaning given to “Purchaser Business” in the Pfizer SAPA, which was defined as follows: (i) the worldwide business of researching, developing, manufacturing, marketing, commercialising, distributing and selling the products sold under the brand names listed for GSK in an annex to the Pfizer SAPA as conducted by GSK (directly and indirectly) as of the date of the Pfizer SAPA and as of immediately prior to Pfizer Completion; (ii) the business reflected in certain specified financial statements of the GSK Contributed CH Business, including the assets, rights, properties, activities, operations and liabilities that comprised such business; (iii) the business of marketing, commercialising, distributing and selling any over-the-counter healthcare or medicine products, wellness products and other personal care, oral care, nutrition, skin health, cosmetic and related products (the Consumer Healthcare Products) as conducted by GlaxoSmithKline Asia Private Limited (including pursuant to the Consignment Selling Agreement) as of the date of the Pfizer SAPA and as of immediately prior to Pfizer Completion; and (iv) to the extent not otherwise reflected in the financial statements referred to in (ii) above, the research and development of any Consumer Healthcare Products, as conducted by GSK (directly and indirectly) through its consumer healthcare business (directly or indirectly pursuant to a contractual arrangement with any other GSK business, to the extent of the GSK consumer healthcare business’ right pursuant to such contractual arrangement), as of the date of the Pfizer SAPA and as of immediately prior to Pfizer Completion, but excluded: the worldwide business of researching, developing, manufacturing, marketing, commercialising, distributing and selling pharmaceutical products to the extent such business and the economic benefit attached to such business was not reflected in the financial statements referred to in (ii) above; and the excluded assets listed for GSK in an annex to the Pfizer SAPA, namely: (i) the assets within the scope of (and proceeds of) GSK’s divestment of the Horlicks brand and other consumer healthcare nutrition products in India to Unilever N.V. (which completed on 1 April 2020); (ii) GlaxoSmithKline Consumer Healthcare Limited (GSK’s listed subsidiary in India); (iii) GlaxoSmithKline Bangladesh; (iv) GlaxoSmithKline Consumer Nigeria plc; (v) Imitrex and Ventolin; and (vi) certain manufacturing sites in Argentina, Brazil, Indonesia, India and Nigeria. The parties subsequently agreed to transfer manufacturing sites in Indonesia, Argentina and Brazil into the Group. Asset Perimeter: Pfizer Contributed CH Business The “Pfizer Contributed CH Business” has the meaning given to “Business” in the Pfizer SAPA, which was defined as the worldwide business of researching, developing, manufacturing, marketing, commercialising, distributing and selling: the products sold under the brand names listed for Pfizer in an annex to the Pfizer SAPA, as conducted by Pfizer (directly and indirectly) as of the date of the Pfizer SAPA and as of immediately prior to Pfizer Completion; and any over-the-counter consumer healthcare or medicine products, wellness products and other personal care, oral care, nutrition, skin health, cosmetic and related products, as conducted by Pfizer (directly and indirectly) through its Pfizer consumer healthcare business unit (directly or indirectly pursuant to a contractual arrangement with any other Pfizer business unit, to the extent of the Pfizer consumer healthcare business unit’s rights pursuant to such contractual arrangement) as of the date of the Pfizer SAPA and as of immediately prior to Pfizer Completion, but excluded: (i) any product marketed, commercialised, distributed or sold under the brands Diflucan One, Feldene Gel or Ponstan (or any other products containing the same or similar compounds as such products) in any jurisdiction; (ii) any pharmaceutical products or pharmaceutical products that have become or may in the future become, in whole or in part, over-the-counter products (other than the products included in the definition of “Business”); and (iii) any product containing any of the following compounds (or marketed, commercialised, distributed or sold under any of the following brands) in any jurisdiction: (a) Sildenafil citrate (Viagra); (b) Celecoxib (Celebrex); (c) Varenicline (Chantix/Champix); (d) Atorvastatin (Lipitor); (e) Gabapentin (Neutontin); and (f) Fesoterodine (Toviaz). Indemnities Under the Pfizer SAPA, GSK and Pfizer each agreed to indemnify each other and the Group in respect of losses (other than losses relating to tax, which were subject to a separate regime – see below) relating to certain liabilities that the parties agreed would be retained by GSK or Pfizer, respectively, relating to, among other things: (i) the assets that were excluded from the GSK Contributed CH Business or the Pfizer Contributed CH Business respectively (as described above); (ii) liabilities under any pension or other employee benefit plans not sponsored by GSKCHH or another member of the Group, subject to certain exceptions; and (iii) any liabilities arising from any third-party claim in respect of products containing talc or asbestos distributed or sold by GSK or Pfizer at any time before Pfizer Completion. The Group is required to indemnify GSK and Pfizer in respect of “Purchaser Liabilities” and “Assumed Liabilities”, which were defined as follows: “Purchaser Liabilities” means any and all liabilities (other than certain specified exceptions – including those liabilities GSK agreed to indemnify the Group in respect of, as summarised above) of GSK or any of its affiliates, whether arising prior to, on or after Pfizer Completion, to the extent resulting from or arising out of the past, present or future ownership, operation, use or conduct of the Purchaser Business, where “Purchaser Business” has the meaning described above under the section entitled “Pfizer Stock and Asset Purchase Agreement—Asset Perimeter: GSK Contributed CH Business”; and Other Information Group information Haleon Annual Report and Form 20-F 2023 205 |
| Separation Co-operation and Implementation Agreement The Separation Co-operation and Implementation Agreement (the SCIA) was entered into on 1 June 2022 among GSK, Pfizer, CH JVCo and the Company, among others, and details certain actions that were to be taken and arrangements that were to be implemented to effect completion of, or which otherwise relate to, the Separation. The SCIA records the obligations of the parties relating to such matters and contains certain terms on which relations between the parties are governed following completion of the Separation. The SCIA also sets out certain other rights and obligations of the parties relating to, among other things, information rights and confidentiality. Pursuant to the terms of the SCIA, Pfizer has certain rights to certain information regarding the Company and the Group. Subject to certain exceptions, those rights will not apply if and when Pfizer and members of Pfizer’s group cease to hold, in aggregate, Haleon ordinary shares or Haleon ADSs in respect of such Haleon shares representing at least 10% of the Haleon shares in issue (or the ordinary shares of any ultimate holding company thereof from time to time). Tax Covenant In accordance with the SCIA, the Company, GSK and Pfizer, among others, entered into a tax covenant on 1 June 2022, which has been effective from the time of the Demerger (the Tax Covenant). Subject to certain financial and other customary limitations, the Tax Covenant contains certain indemnities in respect of taxation given from GSK and Pfizer to the Company (and vice versa) where it has been agreed that such taxes are properly allocable to the indemnifying party. Amongst other things, GSK and Pfizer have provided the Company with indemnities for tax arising (if any) pursuant to certain pre-demerger reorganisation steps within the Group and the steps which comprised the Separation. As is customary for demerger transactions, the Company has provided a more limited set of tax indemnities to GSK and Pfizer. The Tax Covenant also imposes certain restrictions on the Company, which largely fall away from July 2024. For example, there are restrictions on certain asset disposals as well as on certain internal restructuring transactions (including liquidations or the issuance or redemption of stock or debt of certain subsidiaries of the Company). Although the Company does not currently anticipate that these restrictions would have a material adverse impact on the Company, these restrictions may reduce the Company’s ability to engage in certain business transactions that otherwise might be advantageous, until July 2024 when the majority of such restrictions fall away. Exchange Agreements Subject to and shortly after completion of the demerger, a series of share-for-share exchanges occurred pursuant to certain share exchange agreements in order to rationalise the Company’s shareholding structure such that GSK, the Scottish Limited Partnerships (SLPs) and Pfizer hold their remaining interests in the consumer healthcare business by holding shares in the Company, as the listed parent company. Pfizer Exchange Agreement On 1 June 2022, Pfizer and the Company, among others, entered into an exchange agreement pursuant to which Pfizer transferred all of its interests in the company that held 32% of the ordinary shares in the Group prior to separation to the Company in exchange for the issuance by the Company of Haleon ordinary shares to Pfizer and J.P. Morgan Chase Bank N.A. (as depositary on behalf of Pfizer), representing in aggregate 32% of the issued “Assumed Liabilities” means any and all liabilities (other than certain specified exceptions – including those liabilities Pfizer agreed to indemnify the Group in respect of, as summarised above) of Pfizer or any of its affiliates, whether arising prior to, on or after Pfizer Completion, to the extent resulting from or arising out of the past, present or future ownership, operation, use or conduct of the Business, where “Business” has the meaning described above under “Pfizer Stock and Asset Purchase Agreement—Asset Perimeter: Pfizer Contributed CH Business”. The Pfizer SAPA Amendment Agreement also extends the Group’s indemnification obligations in favour of GSK and Pfizer to include, among other things, all losses (other than losses relating to tax, which were subject to a separate regime (see below)) relating to liabilities to the extent resulting from or arising out of the past, present or future ownership, operation, use or conduct of the consumer healthcare business since Pfizer Completion, subject to certain exceptions (see Pfizer SAPA Amendment Agreement below). In respect of tax, each of GSK and Pfizer provided an indemnity, subject to customary exclusions and limitations, to the Group in respect of, among other things, tax liabilities of the companies contributed to the GSK/Pfizer JV arising up to the point of Pfizer Completion. The indemnities provided by each of GSK, Pfizer and the Group under the Pfizer SAPA survived completion of the Demerger and Separation. Pfizer SAPA Amendment Agreement On 1 June 2022, GSK, Pfizer, CH JVCo and the Company entered into the second amendment agreement to the Pfizer SAPA (the Pfizer SAPA Amendment Agreement) to implement certain amendments, including: (i) amendments to the Pfizer SAPA that were deemed appropriate as a result of the Group being an independent, separate business from GSK and Pfizer from Separation; (ii) amendments that were deemed appropriate as a result of an overlap with certain other ancillary agreements that are currently being entered into as part of the Separation; and (iii) to include the Company in the Pfizer SAPA indemnity framework by way of a guarantee given by the Company of CH JVCo’s indemnification obligations under the Pfizer SAPA. Pursuant to the Pfizer SAPA Amendment Agreement: (i) the Group’s indemnification obligations under the Pfizer SAPA (as described under Pfizer Stock and Asset Purchase Agreement— Indemnities on the previous page), were extended to include, among other things, all losses (other than losses relating to tax, which were subject to a separate regime) relating to liabilities to the extent resulting from or arising out of the past, present or future ownership, operation, use or conduct of the consumer healthcare business since Pfizer Completion, subject to certain exceptions primarily related to liabilities retained by each of Pfizer and GSK, respectively, under the Pfizer SAPA; and (ii) the Company, which is deemed a ‘Purchaser Indemnified Party’ under the Pfizer SAPA and has the benefit of the indemnities given to CH JVCo under the Pfizer SAPA, has provided a guarantee of CH JVCo’s indemnity obligations under the Pfizer SAPA (as described under Pfizer Stock and Asset Purchase Agreement— Indemnities on the previous page), as amended by the Pfizer SAPA Amendment Agreement. The Pfizer SAPA Amendment Agreement also includes provisions related to the release of guarantees given by Pfizer for the benefit of companies in the Group (or vice versa). Group information continued Material contracts continued 206 Haleon Annual Report and Form 20-F 2023 Other Information |
| Registration Rights Agreement The Registration Rights Agreement (the Registration Rights Agreement) was entered into on 1 June 2022 among the Company, Pfizer, GSK and the SLPs. GSK, Pfizer and the SLPs, together with their respective affiliates, successors or permitted assigns, to the extent they are holders or beneficial owners of the Company’s registrable securities, are referred to in the Registration Rights Agreement as “Holders”. The Company’s registrable securities include all shares and ADSs held by the Holders in the Company after Separation and equity securities issued in exchange or replacement thereof. The Registration Rights Agreement provides for certain demand and piggyback registration rights to the Holders. The Company filed a shelf registration statement on Form F-1 (the Shelf Registration Agreement) on 28 July 2022 in partial satisfaction of the demand registration rights. Additionally, pursuant to the demand registration rights: (i) following the expiration of the lock-up restrictions in the Lock-up Deed, each Holder now has the right to sell any part of its registrable securities in an underwritten offering pursuant to the Shelf Registration Statement (the Shelf Underwriting) by delivering a written request to the Company. The Company shall give notice of such request to the Holders of other registrable securities registered on the Shelf Registration Statement, and, subject to certain limitations, include in the Shelf Underwriting the registrable securities of the other requesting Holders; (ii) if the Shelf Registration Statement is not available for use by the Holders, each Holder may require the Company to file one or more registration statements covering all or any part of its registrable securities, subject to certain limitations. The Company shall use its reasonable best efforts to file or confidentially submit with the SEC such registration statement no later than 60 days from receipt of request from the Holder if the registration is on Form F-1 or Form S-1 (or 30 days if the registration is on Form F-3 or Form S-3); and (iii) the Registration Rights Agreement includes customary provisions that permit the Company to postpone filing or confidentially submitting a registration statement, or if a registration statement has been filed or confidentially submitted, suspend use of, or withdraw, such registration statement for a limited duration to avoid disclosing material non-public information in certain circumstances. The Holders also have certain ‘piggyback’ registration rights, pursuant to which they will be entitled to register the resale of their registrable securities alongside certain offerings of securities that the Company may undertake, subject to “cutback” in certain such cases. The Registration Rights Agreement contains customary indemnification obligations on the part of the Company and, in certain circumstances, the Holders. The Company is obligated to pay all expenses associated with the registration of the registrable securities under the Registration Rights Agreement, except for transfer taxes and commissions payable in an underwritten offering (payable by the Holders). The Registration Rights Agreement terminates with regards to the Holders affiliated with GSK and the Holders affiliated with Pfizer when they, respectively, cease to hold registrable securities representing more than 1% of Haleon’s outstanding ordinary shares. and outstanding Haleon ordinary shares immediately following separation (to the nearest whole Haleon ordinary share), and 25 million non-voting preference shares. Following completion of these transactions, the Company indirectly owned 100% of the Group. Pfizer Relationship Agreement The relationship agreement between the Company and Pfizer was entered into as a deed on 1 June 2022 (the Pfizer Relationship Agreement). The principal purpose of the Pfizer Relationship Agreement is to regulate the continuing relationship between the Company and Pfizer after Admission. References to aggregate interests in Haleon ordinary shares in the Pfizer Relationship Agreement include both direct holdings of Haleon ordinary shares and interests in Haleon ordinary shares held indirectly through holdings of Haleon ADSs. Pursuant to the Pfizer Relationship Agreement, Pfizer has undertaken, that, for so long as Pfizer is a controlling shareholder (as defined in Appendix I to the Listing Rules), it shall (and shall procure that its associates (as defined in Appendix I of the Listing Rules) shall): (i) conduct all transactions and arrangements with the Company and the Group at arm’s length and on normal commercial terms; (ii) not take any action that would have the effect of preventing the Company from complying with its obligations under the Listing Rules; and (iii) not propose or procure the proposal of a shareholder resolution of the Company which is intended or appears to be intended to circumvent the proper application of the Listing Rules. For so long as Pfizer is a controlling shareholder, it shall (and shall, so far as it is legally able to do so, procure that its associates shall) not take any action which precludes the Company or any other member of the Group from carrying on an independent business as its main activity. Under the Pfizer Relationship Agreement, Pfizer is granted the right to nominate two persons to be appointed to the Board as representative directors for so long as it and its affiliates together continue to hold 20% or more of the Haleon ordinary shares in issue and a right to nominate one person to be appointed to the Board as a representative director for so long as it and its affiliates together continue to hold less than 20% but at least 10% of the Haleon ordinary shares in issue. Pfizer is subject to customary standstill provisions, subject to certain exceptions, and the Pfizer Relationship Agreement imposes certain obligations on the Company in connection with seeking shareholder authority to carry out share repurchases to ensure that no such repurchases result in a requirement for Pfizer to make a general offer for Haleon ordinary shares in accordance with Rule 9 of the City Code (provided that Pfizer has not itself entered into any disqualifying transactions). Under the Pfizer Relationship Agreement, Pfizer agrees to procure that any member of its group that held an interest in Haleon ordinary shares on Admission shall, for such time as that member of Pfizer’s group holds an interest in Haleon ordinary shares, comply with the provisions of the Pfizer Relationship Agreement as if that member of Pfizer’s group were a party to the Pfizer Relationship Agreement with the same obligations as Pfizer. The Pfizer Relationship Agreement will terminate on the date that Pfizer and its affiliates cease to hold at least 10% of the Haleon ordinary shares in issue. Other Information Group information Haleon Annual Report and Form 20-F 2023 207 |
| Purchases of equity securities by the Company and affiliated purchasers During the financial year ended 31 December 2023, the following ordinary shares (including ordinary shares held indirectly through Haleon ADSs) were purchased by the Company’s Employee Benefit Trusts. No shares were repurchased by the Company. Period Total number of shares purchased1 Average price paid per share (£) Total number of shares purchased as part of publicly announced plans or programmes Maximum number of shares that may yet be purchased under the plans or programmes 1 January – 31 January Nil Nil Nil N/A 1 February – 28 February Nil Nil Nil N/A 1 March – 31 March Nil Nil Nil N/A 1 April – 30 April Nil Nil Nil N/A 1 May – 31 May 58,157 3.42 Nil N/A 1 June – 30 June Nil Nil Nil N/A 1 July – 31 July Nil Nil Nil N/A 1 August – 31 August 3,050,000 3.30 Nil N/A 1 September – 30 September Nil Nil Nil N/A 1 October – 31 October Nil Nil Nil N/A 1 November – 30 November Nil Nil Nil N/A 1 December – 31 December 8,100,000 3.40 Nil N/A 1 Shares purchased on the open market in the UK and US. Committees The Company has a number of Board Committees which are similar in purpose and constitution to those required for domestic companies under NYSE rules. The NYSE requires US companies to have audit, remuneration and nominating/corporate governance committees composed entirely of independent directors, as defined under the NYSE rules. The Company’s Nominations & Governance, Audit & Risk, and Remuneration Committees consist entirely of Non-Executive Directors who are independent under the standards of the Code, which may not necessarily be the same as the NYSE independence standards. The nominating/ governance committee is responsible for identifying individuals qualified to become members of the Board and to recommend to the Board a set of corporate governance principles. As the Company is subject to the Code, the Company’s Nominations & Governance Committee is responsible for nominating, for approval by the Board, candidates for appointment to the Board and its Committees. The Company’s Nominations & Governance Committee consists of the Chair and Independent Non-Executive Directors. The Chair of the Company is not a member of either the Remuneration or Audit & Risk Committees. As set out on page 72, the Audit & Risk Committee is chaired by Deirdre Mahlan, an Independent Non-Executive Director, who, in the Board’s view, has the experience and qualifications to satisfy the criterion under US rules for an ‘audit committee financial expert’. Shareholder approval of equity compensation plans The NYSE rules for US companies require that shareholders must be given the opportunity to vote on all equity-compensation plans and material revisions to those plans. Haleon complies with UK requirements that are similar to the NYSE rules. The Board, however, does not explicitly take into consideration the NYSE’s detailed definition of what are considered ‘material revisions’. The Group’s statement of compliance with the UK Corporate Governance Code issued in July 2018 by the Financial Reporting Council (the Code) is set out on page 96. The Company’s ADSs are listed on the NYSE and we are subject to the reporting and other requirements of the SEC applicable to US foreign private issuers. We are required to disclose any significant ways in which our corporate governance practices differ from those followed by US companies under the Listing Standards of the NYSE. The significant differences between Haleon’s corporate governance practices as a UK company and those required by NYSE standards for US companies are as follows. Independence The Code’s principles recommend that at least half the Board, excluding the Chair, should consist of independent non-executive directors. As at 7 March 2024, the Board consisted of the Chair, independent at the time of his appointment, two Executive Directors, six Independent Non-Executive Directors and two Non-Executive Directors who were nominated to the Board by Pfizer. The Pfizer-nominated Directors are not considered independent. NYSE listing rules applicable to US companies state that companies must have a majority of independent directors. The NYSE has set out six bright line tests for director independence. The Board’s judgement is that, with the exception of the Pfizer-nominated Non-Executive Directors, the Non-Executive Directors are independent and, as such, Independent Non-Executive Directors make up a majority of the Board. However, it did not explicitly take into consideration the NYSE’s tests in reaching this determination. Summary of significant corporate governance differences from NYSE listing standards Shareholder information 208 Haleon Annual Report and Form 20-F 2023 Other Information |
| Dividend history The table below sets out the dividends declared following demerger and for each subsequent financial year in respect of the Company’s ordinary shares and ADSs. >> Information about dividends paid prior to demerger can be found in Note 10 to the Consolidated Financial Statements on page 132. Pence US$ 2023 6.0 —1 2022 2.4 0.0597319 1 The US Dollar equivalent of the final dividend will be set based on the actual foreign exchange rate achieved by the Company prior to payment. Two ordinary shares represent one ADS and the US Dollar equivalent of the interim dividend paid to ADS holders on 5 October 2023 was $0.043871 per ADS. Shareholder profiles Analysis of shareholdings as at 31 December 2023 Holding of shares Number of accounts % of total accounts % of total shares Number of shares Up to 1,000 44,592 72.57 0.16 14,387,545 1,001 – 5,000 12,918 21.02 0.30 28,116,370 5,001 – 100,000 3,126 5.09 0.52 48,228,639 100,001 to 1,000,000 464 0.76 1.91 176,085,656 Over 1,000,000 347 0.56 97.11 8,967,755,621 Totals 61,447 100 100 9,234,573,831 Held by Institutional and corporate holders 59,888 97.46 33.35 3,080,071,136 Individuals and other corporate bodies 1,558 2.54 49.39 4,560,566,969 Guaranty Nominees Limited 1 0.00 17.26 1,593,935,726 J.P. Morgan Chase Bank, N.A. is the Depositary for the Company’s ADR programme. The Company’s ADSs are listed on the NYSE. Ordinary shares representing the Company’s ADR programme, which is managed by the Depositary, are registered in the name of Guaranty Nominees Limited. As at 7 March 2024, (being the latest practicable date prior to publication of this Annual Report) Guaranty Nominees Limited held 1,595,245,726 ordinary shares representing approximately 17.26% of the Company’s issued share capital. As at the latest practicable date, the number of holders of ordinary shares in the US was 853 with holdings of 874,591 ordinary shares, and the number of registered holders of ADSs was 15,580 with holdings of 797,614,464 ADSs. Certain of these ordinary shares and ADSs were held by brokers or other nominees. As a result, the number of holders of record or registered holders in the US is not representative of the number of beneficial holders or of the residence of beneficial holders. Other Information Shareholder information Haleon Annual Report and Form 20-F 2023 209 |
| Shareholder information continued Stamp duty and stamp duty reserve tax UK stamp duty and/or stamp duty reserve tax (SDRT) will, subject to certain exemptions, be payable on the transfer of shares at a rate of 0.5% (rounded up to the nearest £5 in the case of stamp duty) of the consideration for the transfer. Notwithstanding this, provided that an instrument is executed in pursuance of the agreement that gave rise to the charge to SDRT and that instrument is stamped within six years of the agreement (including being stamped as exempt) any SDRT charge should be cancelled and any SDRT which has already been paid will be repaid. UK stamp duty and/or SDRT will, subject to certain exemptions, be payable on any transfer of shares to the ADS custodian or depositary at a rate of 1.5% of the amount of any consideration provided (if transferred on sale), or their value (if transferred for no consideration). However, no stamp duty or SDRT should be payable on the transfer of, or agreement to transfer, an ADS. US shareholders This section describes the material US federal income tax consequences to a US holder (as defined below) of owning shares or ADSs. It applies to you only if you hold your shares or ADSs as capital assets for tax purposes. This discussion addresses only US federal income taxation and does not discuss all of the tax consequences that may be relevant to you in light of your individual circumstances, including foreign, state or local tax consequences, estate and gift tax consequences, and tax consequences arising under the Medicare contribution tax on net investment income or the alternative minimum tax. This section does not apply to you if you are a member of a special class of holders subject to special rules, including: a dealer in securities, a trader in securities that elects to use a mark-to-market method of accounting for securities holdings, a tax-exempt organisation, a life insurance company, a person that actually or constructively owns 10% or more of the combined voting power of our voting stock or of the total value of our stock, a person that holds shares or ADSs as part of a straddle or a hedging or conversion transaction, a person that purchases or sells shares or ADSs as part of a wash sale for tax purposes, or a person whose functional currency is not the US Dollar. This section is based on the Internal Revenue Code of 1986, as amended, its legislative history, existing and proposed regulations, published rulings and court decisions, all as currently in effect, as well as on the Convention Between the US and the UK (the Treaty). These authorities are subject to change, possibly on a retroactive basis. In addition, this section is based in part upon the representations of the Depositary and the assumption that each obligation in the Deposit Agreement and any related agreement will be performed in accordance with its terms. You are a US holder if you are a beneficial owner of shares or ADSs and you are, for US federal income tax purposes: a citizen or resident of the US, a domestic corporation, an estate whose income is subject to US federal income tax regardless of its source, or a trust if a US court can exercise primary supervision over the trust’s administration and one or more US persons are authorised to control all substantial decisions of the trust. If an entity or arrangement that is treated as a partnership for US federal income tax purposes holds the shares or ADSs, the US federal income tax treatment of a partner will generally depend on the status of the partner and the tax treatment of the partnership. Tax information for shareholders A summary of certain UK tax and US federal income tax consequences for holders of shares and ADSs who are citizens of the UK or the US is set out below. It is not a complete analysis of all the possible tax consequences of the purchase, ownership or sale of these securities. It is intended only as a general guide. Holders are advised to consult their advisers with respect to the tax consequences of the purchase, ownership or sale of their shares or ADSs and the consequences under state and local tax laws in the US and the implications of the current UK/US tax conventions. US holders of ADSs generally will be treated as the owners of the underlying shares for the purposes of the current UK/US double taxation conventions relating to income and gains (Income Tax Convention), estate and gift taxes (Estate and Gift Tax Convention), and for the purposes of the Internal Revenue Code of 1986, as amended. UK shareholders This summary only applies to a UK resident shareholder that holds shares as capital assets. Taxation of dividends For the 2023/2024 UK tax year, UK resident individuals are entitled to a dividend tax allowance of up to £1,000, so that the first £1,000 of dividends received in a tax year will be free of tax. Dividends in excess of this allowance will be taxed at 8.75% for basic rate taxpayers, 33.75% for higher rate taxpayers and 39.35% for additional rate taxpayers. UK resident shareholders that are corporation taxpayers should note that dividends payable on ordinary shares are generally entitled to exemption from corporation tax provided certain conditions are met. Taxation of capital gains UK resident shareholders may be liable for UK tax on gains on the disposal of shares or ADSs. For disposals by individuals in the 2023/2024 UK tax year, a taxable capital gain accruing on a disposal of shares or ADSs will be taxed at 10% for basic rate taxpayers, or 20% if, after all allowable deductions, the individual’s taxable income for the year exceeds the basic rate income tax banding. Note this is following the use of any exemptions available to the individual taxpayer such as the annual exempt amount. A disposal by corporation tax payers may give rise to a chargeable gain for the purposes of UK corporation tax, depending on the circumstances and subject to any available exemption or relief. Corporation tax is charged on gains at the rate of corporation tax applicable to that company. Inheritance tax Individual (UK-domiciled or otherwise) shareholders may be liable to UK inheritance tax on the transfer of shares or ADSs. Tax may be charged on the amount by which the value of the shareholder’s estate is reduced as a result of any transfer by way of lifetime gift or other disposal at less than full market value. In the case of a bequest on death, tax may be charged on the value of the shares at the date of the shareholder’s death. If such a gift or other disposal were subject to both UK inheritance tax and US estate or gift tax, the Estate and Gift Tax Convention would generally provide for tax paid in the US to be credited against tax payable in the UK. 210 Haleon Annual Report and Form 20-F 2023 Other Information |
| Sales or dispositions If you sell or otherwise dispose of your shares or ADSs, you will recognise capital gain or loss for US federal income tax purposes equal to the difference between the US Dollar value of the amount that you realise and your tax basis, determined in US Dollars, in your shares or ADSs. Capital gain of a non-corporate US holder is generally taxed at preferential rates where the property is held for more than one year. The gain or loss will generally be income or loss from sources within the US for foreign tax credit limitation purposes. Passive foreign investment company (PFIC) classification We believe that we should not be currently classified as a PFIC for US federal income tax purposes and we do not expect to become a PFIC in the foreseeable future. However, this conclusion is a factual determination that is made annually and thus may be subject to change. It is therefore possible that we could become a PFIC in a future taxable year. The discussion above in this section assumes that we are not classified as a PFIC for US federal income tax purposes. If we were to be treated as a PFIC, any gain realised on the sale or other disposition of your shares or ADSs would in general not be treated as capital gain. Instead, you would generally be treated as if you had realised any gain and certain ‘excess distributions’ ratably over your holding period for the shares or ADSs. Amounts allocated to the current year and any year before we were a PFIC would be taxed as ordinary income and amounts allocated to other years would be taxed at the highest tax rate in effect for each such year, and would be subject to an interest charge in respect of the tax attributable to each such year. In addition, dividends that you receive from us would not be eligible for the preferential tax rate if we were a PFIC (or treated as a PFIC with respect to you) either in the taxable year of the distribution or the preceding taxable year, but instead would be taxable at rates applicable to ordinary income. If you own our shares or ADSs during any year that we are a PFIC with respect to you, you may be required to file IRS Form 8621. You should consult your own tax adviser regarding the US federal, state and local tax consequences of owning and disposing of shares and ADSs in your particular circumstances. In general, and taking into account the earlier assumptions, for US federal income tax purposes, if you hold ADRs evidencing ADSs, you will be treated as the owner of the shares represented by those ADRs. Exchanges of shares for ADRs, and ADRs for shares, generally will not be subject to US federal income tax. Distributions Under the US federal income tax laws, the gross amount of any distribution we pay out of our current or accumulated earnings and profits (as determined for US federal income tax purposes), other than certain pro-rata distributions of our shares that are generally not taxable, will be treated as a dividend that is subject to US federal income taxation. If you are a non-corporate US holder, dividends that constitute qualified dividend income will be taxable to you at the preferential rates applicable to long-term capital gains provided that you hold the shares or ADSs for more than 60 days during the 121-day period beginning 60 days before the ex-dividend date and meet other holding period requirements. Dividends we pay with respect to the shares or ADSs generally will be qualified dividend income provided that, in the year that you receive the dividend, the shares or ADSs are readily tradable on an established securities market in the US or we are eligible for the benefits of the Treaty. Our ADSs are listed on the NYSE and we therefore expect that dividends on the ADSs will be qualified dividend income. In addition, we believe that we are currently eligible for the benefits of the Treaty and that dividends on the shares and ADS will be qualified dividend income on that basis, but there can be no assurance that we will continue to be eligible for the benefits of the Treaty. Dividends will generally be income from sources outside the US and will generally be ‘passive’ income for the purposes of computing the foreign tax credit allowable to you. The dividend is taxable to you when you, in the case of shares, or the Depositary, in the case of ADSs, receive the dividend, actually or constructively. The dividend will not be eligible for the dividends-received deduction generally allowed to US corporations in respect of dividends received from other US corporations. The amount of the dividend distribution that you must include in your income will be the US Dollar value of the Sterling payments made, determined at the spot Sterling/US Dollar rate on the date the dividend is distributed, regardless of whether the payment is in fact converted into US Dollars. Generally, any gain or loss resulting from currency exchange fluctuations during the period from the date the dividend is distributed to the date you convert the payment into US Dollars will be treated as ordinary income or loss and will not be eligible for the special tax rate applicable to qualified dividend income. The gain or loss generally will be income or loss from sources within the US for foreign tax credit limitation purposes. Distributions in excess of current and accumulated earnings and profits, as determined for US federal income tax purposes, will be treated as a non-taxable return of capital to the extent of your basis in the shares or ADSs and thereafter as capital gain. However, we do not expect to calculate earnings and profits in accordance with US federal income tax principles. Accordingly, you should expect to generally treat distributions we make as dividends. Other Information Shareholder information Haleon Annual Report and Form 20-F 2023 211 |
Exhibits
The following exhibits are filed as part of this Annual Report on Form 20-F with the SEC, and are publicly available through the SEC’s website.
>> www.sec.gov and search Haleon plc under Company Filings.
|
Exhibit 11 |
|
|
|
|
|
|
|
Exhibit 2.11 |
|
|
|
|
|
|
|
Exhibit 2.21 |
|
|
|
|
|
|
|
Exhibit 2.31 |
|
|
|
|
|
|
|
Exhibit 2.4 |
|
Description of Securities Registered Under Section 12 of the Exchange Act. |
|
|
|
|
|
Exhibit 4.11 |
|
Service Agreement between Haleon UK Services Limited and Brian McNamara dated 9 May 2022. |
|
|
|
|
|
Exhibit 4.21 |
|
Service Agreement between Haleon UK Services Limited and Tobias Hestler dated 10 May 2022. |
|
|
|
|
|
Exhibit 4.31 |
|
|
|
|
|
|
|
Exhibit 4.41 |
|
|
|
|
|
|
|
Exhibit 4.51 |
|
|
|
|
|
|
|
Exhibit 4.61 |
|
|
|
|
|
|
|
Exhibit 4.71 |
|
Demerger Agreement dated as of 1 June 2022 between the Registrant and GSK plc. |
|
|
|
|
|
Exhibit 4.81 |
|
|
|
|
|
|
|
Exhibit 4.91 |
|
|
|
|
|
|
|
Exhibit 4.101 |
|
Exchange Agreement dated as of 1 June 2022 between GSK plc and the Registrant. |
|
|
|
|
|
Exhibit 4.111 |
|
|
|
|
|
|
|
Exhibit 4.121 |
|
|
|
|
|
|
1 Incorporated by reference
2 This entity was dissolved on 28 December 2022
Exhibit 4.131 | Pfizer Relationship Agreement dated as of 1 June 2022 between the Registrant and Pfizer Inc. | |
Exhibit 4.141 | ||
Exhibit 4.151 | ||
Exhibit 4.161 | ||
Exhibit 4.171 | ||
Exhibit 4.18 | ||
Exhibit 4.19 | ||
Exhibit 4.20 | ||
Exhibit 8 | List of subsidiaries of Haleon plc as at 31 December 2023 (can be found on pages 170-176). | |
Exhibit 12.1 | ||
Exhibit 12.2 | ||
Exhibit 13.1 | ||
Exhibit 15.1 | ||
Exhibit 15.2 | ||
Exhibit 15.3 | ||
Exhibit 171 | ||
Exhibit 97 | ||
Exhibit 101.INS | Inline XBRL Instance Document. | |
Exhibit 101.SCH | XBRL Taxonomy Extension Schema. | |
Exhibit 101.CAL | XBRL Taxonomy Extension Schema Calculation Linkbase. | |
Exhibit 101.DEF | XBRL Taxonomy Extension Schema Definition Linkbase. | |
Exhibit 101.LAB | XBRL Taxonomy Extension Schema Label Linkbase. | |
Exhibit 101.PRE | XBRL Taxonomy Extension Schema Presentation Linkbase. | |
Exhibit 104 | Cover Page Interactive Data File - (formatted as Inline XBRL and contained in Exhibit 101). | |
1 Incorporated by reference
| Disclosures cross referenced in the table below and in the following pages will be included in Haleon’s Annual Report on Form 20-F for 2023 filed with the SEC. Item Form 20-F caption Location Page 1 Identity of Directors, senior management and advisers Not applicable 2 Offer statistics and expected timetable Not applicable 3 Key information 3A (Reserved) Not applicable 3B Capitalisation and indebtedness Not applicable 3C Reason for the offer and use of proceeds Not applicable 3D Risk factors Group information: Risk factors 193 4 Information on the company 4A History and development of the company Consolidated Financial Statements: Note 1 General information 121 Group information: History and development of the Group 191 Useful information: Investor information – Website and electronic communication 220 4B Business overview Haleon at a glance Inside front cover Consolidated Financial Statements: Note 1 General information 121 Consolidated Financial Statements: Note 4 Segment information 125 Group information: Risk factors 193 Group information: Impact of regulation 204 4C Organisational structure Consolidated Financial Statements: Note 30 Subsidiaries 170 Group information: History and development of the Group 191 4D Property, plant and equipment Strategic Report: Our Business model 8 Consolidated Financial Statements: Note 12 Property, plant and equipment 133 Directors’ Report: Streamlined energy and carbon reporting 188 Group information: Property, plant and equipment 192 4A Unresolved staff comments Not applicable 5 Operating and financial review and prospects 5A Operating results Strategic Report: Our market categories 13 Strategic Report: Our key performance indicators 32 Strategic Report: 2023 Business Review 34 Strategic Report: Viability statement 59 Consolidated Financial Statements: Note 1 General information – ‘Foreign Currencies’ 121 Consolidated Financial Statements: Note 2 Accounting policies 123 Consolidated Financial Statements: Note 25 Capital and financial risk management – ‘Net investment hedges’, ‘Foreign exchange risk management’ and ‘Foreign exchange sensitivity’ 156 Group information: Risk factors – Risks relating to changes in law and the political and economic environment, regulation and legislation 193 Form 20-F cross reference 214 Haleon Annual Report and Form 20-F 2023 Other information |
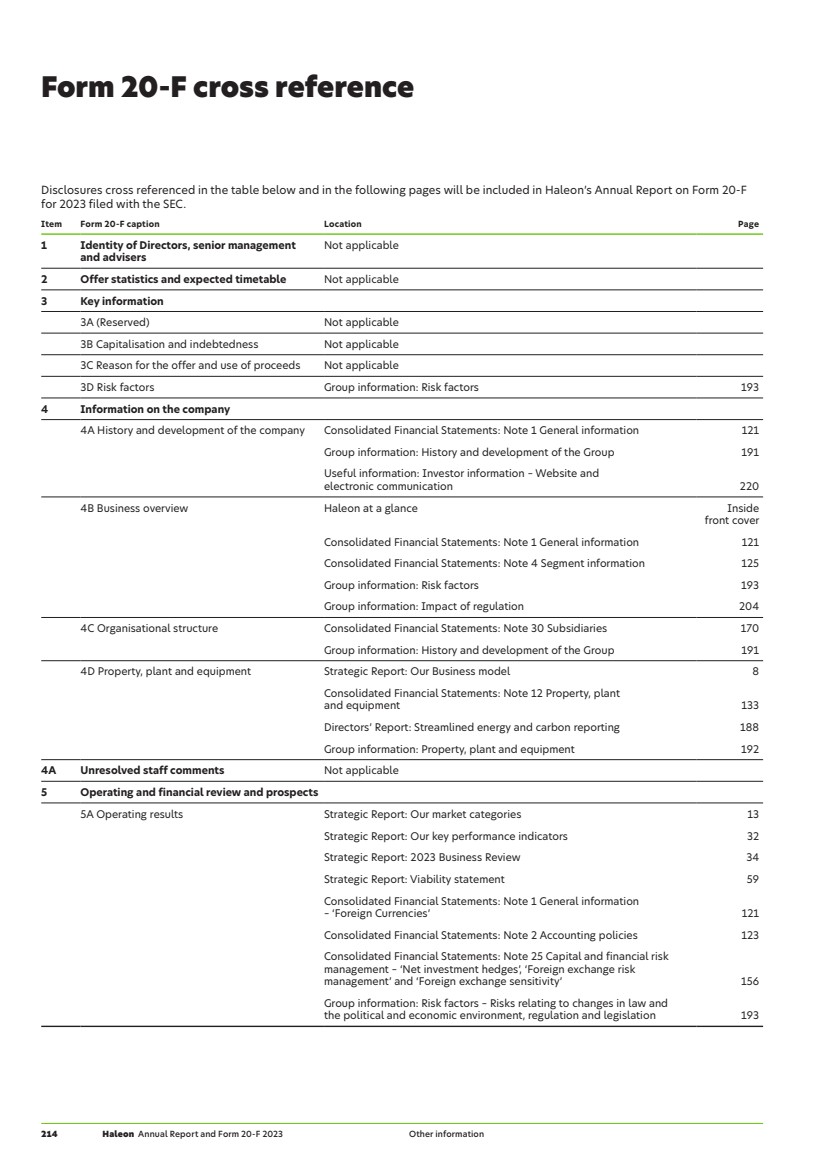
| Item Form 20-F caption Location Page 5B Liquidity and capital resources Strategic Report: 2023 Business review – ‘indebtedness, liquidity and financial risk management’ 42 Strategic Report: Use of non-IFRS measures 43 Strategic Report: Viability statement 59 Consolidated Financial Statements: Note 8 Net finance costs 129 Consolidated Financial Statements: Note 16 Trade and other receivables 141 Consolidated Financial Statements: Note 17 Cash and cash equivalents 142 Consolidated Financial Statements: Note 19 Borrowings 143 Consolidated Financial Statements: Note 22 Contingent liabilities and commitments 152 Consolidated Financial Statements: Note 25 Capital and financial risk management 156 5C Research and development, patents and licenses, etc. Strategic Report: Our business model 8 Strategic Report: Our market categories 13 Consolidated Financial Statements: Consolidated income statement 116 Consolidated Financial Statements: Note 14 Intangible assets 136 5D Trend information Strategic Report: 2023 Business review 34 5E Critical accounting estimates Not applicable Non-GAAP financial measures Strategic Report: 2023 Business review 34 Strategic Report: Use of non-IFRS measures 43 6 Directors, senior management and employees 6A Directors and senior management Corporate Governance: Our Board of Directors 62 Corporate Governance: Our Executive Team 64 Directors’ Report: Significant shareholders 187 6B Compensation Corporate Governance: Directors’ Remuneration Report 80 Consolidated Financial Statements: Note 7 Employees and remuneration of key management personnel 128 Consolidated Financial Statements: Note 20 Pensions and other post-employment benefits 146 6C Board practices Corporate Governance: Our Board of Directors 62 Corporate Governance: Our Executive Team 64 Corporate Governance: Governance structure 67 Corporate Governance: Audit & Risk Committee Report 72 Corporate Governance: Environmental & Social Sustainability Committee Report 77 Corporate Governance: Nominations & Governance Report 78 6D Employees Consolidated Financial Statements: Note 7 Employees and remuneration of key management personnel 128 6E Share ownership Corporate Governance: Directors’ Remuneration Report – Annual Report on Remuneration 84 Consolidated Financial Statements: Note 26 Employee share schemes 167 Group information: Directors’ and Executive Team shareholdings 192 6F Disclosure of a registrant’s action to recover erroneously awarded compensation Not applicable Other Information Form 20-F cross reference Haleon Annual Report and Form 20-F 2023 215 |
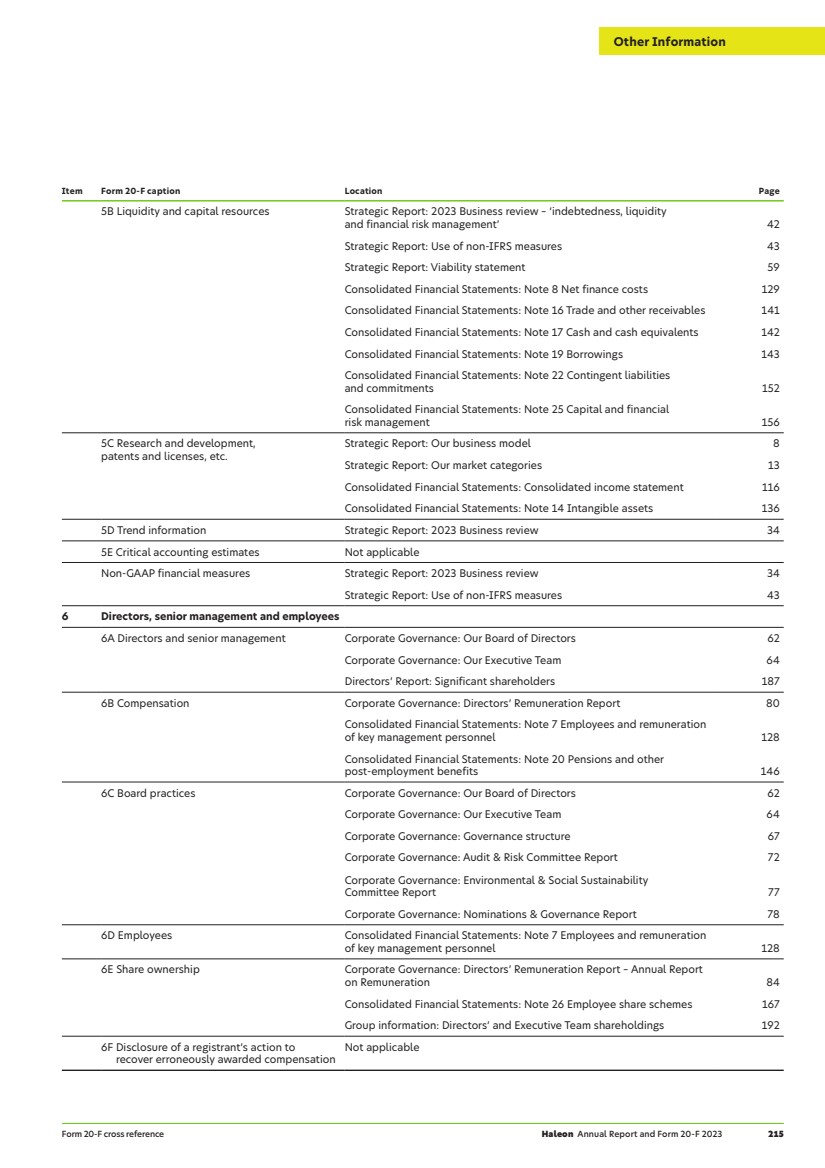
| Form 20-F cross reference continued Item Form 20-F caption Location Page 7 Major shareholders and related party transactions 7A Major shareholders Directors’ Report: Significant shareholders 187 Shareholder information: Shareholder profiles 209 7B Related party transactions Consolidated Financial Statements: Note 24 Related party transactions 155 Group information: Material contracts 205 7C Interests of experts and counsel Not applicable 8 Financial information 8A Consolidated statements and other financial information Strategic Report: Use of non-IFRS measures 43 Consolidated Financial Statements 97 Reports of independent registered public accounting firms 112 Directors’ Report: Dividends and dividend policy 186 8B Significant changes Consolidated Financial Statements: Post balance sheet events 170 9 The offer and listing 9A Offer and listing details Useful information: Trading markets 220 9B Plan of distribution Not applicable 9C Markets Useful information: Trading markets 220 9D Selling shareholders Not applicable 9E Dilution Not applicable 9F Expenses of the issue Not applicable 10 Additional information 10A Share capital Not applicable 10B Memorandum and articles of association Group information: Articles of Association 203 Shareholder information: Exhibit 1 212 10C Material contracts Group information: Material contracts 205 10D Exchange controls Group information: Exchange controls and restrictions on payment of dividends 204 10E Taxation Shareholder information: Tax information for shareholders 210 10F Dividends and paying agents Not applicable 10G Statement by experts Not applicable 10H Documents on display Useful information: Investor information – AGM and documents on display 220 10I Subsidiary information Not applicable 10J Annual Report to security holders Not applicable 11 Quantitative and qualitative disclosures about market risk Consolidated Financial Statements: Note 25 Capital and financial risk management 156 12 Description of securities other than equity securities 12A Debt securities Not applicable 12B Warrants and rights Not applicable 12C Other securities Not applicable 12D American depositary shares Group information: Fees and charges payable by ADR holders 202 216 Haleon Annual Report and Form 20-F 2023 Other information |
| Item Form 20-F caption Location Page 13 Defaults, dividend arrearages and delinquencies Not applicable 14 Material modifications to the rights of security holders and use of proceeds Not applicable 15 Controls and Procedures 15A Disclosure controls and procedures Group information: Disclosure controls and procedures 192 15B Management’s annual report on internal control over financial reporting Group information: Management’s report on internal control over financial reporting 192 15C Attestation report of the registered public accounting firm Reports of independent registered public accounting firms 112 15D Changes in internal control over financial reporting Not applicable 16 (Reserved) 16A Audit committee financial expert Governance: Audit & Risk Committee Report 72 Shareholder information: Summary of significant corporate governance differences from NYSE listing standards – Committees 208 16B Code of ethics Directors’ Report: Code of Conduct 186 16C Principal accountant fees and services Corporate Governance: Audit & Risk Committee Report – External audit 76 Corporate Governance: Audit & Risk Committee Report– Non-audit services 76 Group Financial Statements: Note 6 Operating profit 127 16D Exemptions from the listing standards for audit committees Not applicable 16E Purchase of equity securities by the issuer and affiliated purchasers Shareholder information: Purchases of equity securities by the Company and affiliated purchasers 208 16F Change in registrant’s certifying accountant Corporate Governance: Audit & Risk Committee Report – External audit 76 Group information: Change in certifying accountant 192 16G Corporate Governance Shareholder information: Summary of significant corporate governance differences from NYSE listing standards 208 16H Mine safety disclosure Not applicable 16I Disclosure regarding foreign jurisdictions that prevent inspections Not applicable 16J Insider trading policies Not applicable 16K Cybersecurity Strategic Report: Our culture and people 18 Strategic Report: Our approach to risk 53 Governance Report: Audit & Risk Committee Report 72 Group information: Risk factors 193 17 Financial statements Not applicable 18 Financial statements Consolidated Financial Statements 97 19 Exhibits Other information: Exhibits 212 Other Information Forward-looking statements Haleon Annual Report and Form 20-F 2023 217 |
| This Annual Report and Form 20-F contains certain statements that are, or may be deemed to be, ‘forward-looking statements’ (including for purposes of the safe harbor provisions for forward-looking statements contained in Section 27A of the US Securities Act and Section 21E of the Exchange Act). Forward-looking statements give Haleon’s current expectations and projections about future events, including strategic initiatives and future financial condition and performance, and so Haleon’s actual results may differ materially from what is expressed or implied by such forward-looking statements. Forward-looking statements sometimes use words such as “expects”, “anticipates”, “believes”, “targets”, “plans”, “intends”, “aims”, “projects”, “indicates”, “may”, “might”, “will”, “should”, “potential”, “could” and words of similar meaning (or the negative thereof). All statements, other than statements of historical facts, included in this Report are forward-looking statements. Such forward-looking statements include, but are not limited to, statements relating to future actions, prospective products or product approvals, delivery on strategic initiatives (including but not limited to acquisitions, realisations of efficiencies and responsible business goals), future performance or results of current and anticipated products, sales efforts, expenses, the outcome of contingencies such as legal proceedings, dividend payments and financial results. Any forward-looking statements made by or on behalf of Haleon speak only as of the date they are made and are based upon the knowledge and information available to Haleon on the date of this Annual Report and Form 20-F. These forward-looking statements and views may be based on a number of assumptions and, by their nature, involve known and unknown risks, uncertainties and other factors because they relate to events and depend on circumstances that may or may not occur in the future and/or are beyond Haleon’s control or precise estimate. Such risks, uncertainties and other factors that could cause Haleon’s actual results, performance or achievements to differ materially from those in the forward-looking statements include, but are not limited to, those discussed under Risk Factors on pages 193 to 201 of this Annual Report & Form 20-F. Forward-looking statements should, therefore, be construed in light of such risk factors and undue reliance should not be placed on forward-looking statements. Subject to our obligations under English and US law in relation to disclosure and ongoing information (including under the Market Abuse Regulations, the UK Listing Rules and the Disclosure and Transparency Rules of the Financial Conduct Authority), we undertake no obligation to update publicly or revise any forward-looking statements, whether as a result of new information, future events or otherwise. You should, however, consult any additional disclosures that Haleon may make in any documents which it publishes and/or files with the SEC and take note of these disclosures, wherever you are located. No statement in this document is or is intended to be a profit forecast or profit estimate. Forward-looking statements 218 Haleon Annual Report and Form 20-F 2023 Other information |
| ADR American Depositary Receipt ADR depositary J.P. Morgan Chase Bank, N.A. ADS American Depositary Share, listed on the New York Stock Exchange AER Actual exchange rates Annual Report or Report The Annual Report and Form 20-F APAC Asia Pacific region CER Constant currency exchange rates CMO Third-party contract manufacturing organisations Companies Act The UK Companies Act 2006, as amended Company, Group or Haleon Haleon plc and its subsidiaries Consumer Staples sector Companies that produce and sell items considered essential for everyday use Employee Persons on permanent or fixed-term contracts, who are directly employed by Haleon plc or its subsidiaries (does not include third-party temporary workers or contractors) EMEA Europe, Middle East and Africa region EMTN Euro Medium Term Note ERG Employee resource group FCA UK Financial Conduct Authority FDA The US Food and Drug Administration FRC UK Financial Reporting Council Health Professional(s) Pharmacy, dental, respiratory and dermatology wellness professionals and related teams IASB International Accounting Standards Board ISSB International Sustainability Standards Board LatAm Latin America region Leadership roles Employees within our compensation grades 0-5. These roles include members of the Executive Team, their direct reports (excluding administration support), heads of department and other upper management Local Growth brands Local strategic brands that have scale and leadership positions LSE London Stock Exchange MSA Manufacture and Supply Agreement NYSE New York Stock Exchange Ordinary share £0.01 pence each in the Company OTC Over-the-Counter. Three market categories are collectively known as OTC: Pain Relief, Respiratory Health and Digestive Health and Other. Purchases of products in these categories are controlled but do not require a prescription Parent Company Haleon plc Power Brands Haleon’s nine large-scale multinational brands: Advil, Centrum, Otrivin, Panadol, parodontax, Polident, Sensodyne, Theraflu and Voltaren Rx-to-OTC switches Switches of products requiring a prescription to products with OTC status SEC US Securities and Exchange Commission VMS Vitamins, Minerals and Supplements Workforce Haleon’s employees >> For definitions of our non-IFRS measures see from page 43. Glossary Other Information Useful information Haleon Annual Report and Form 20-F 2023 219 |
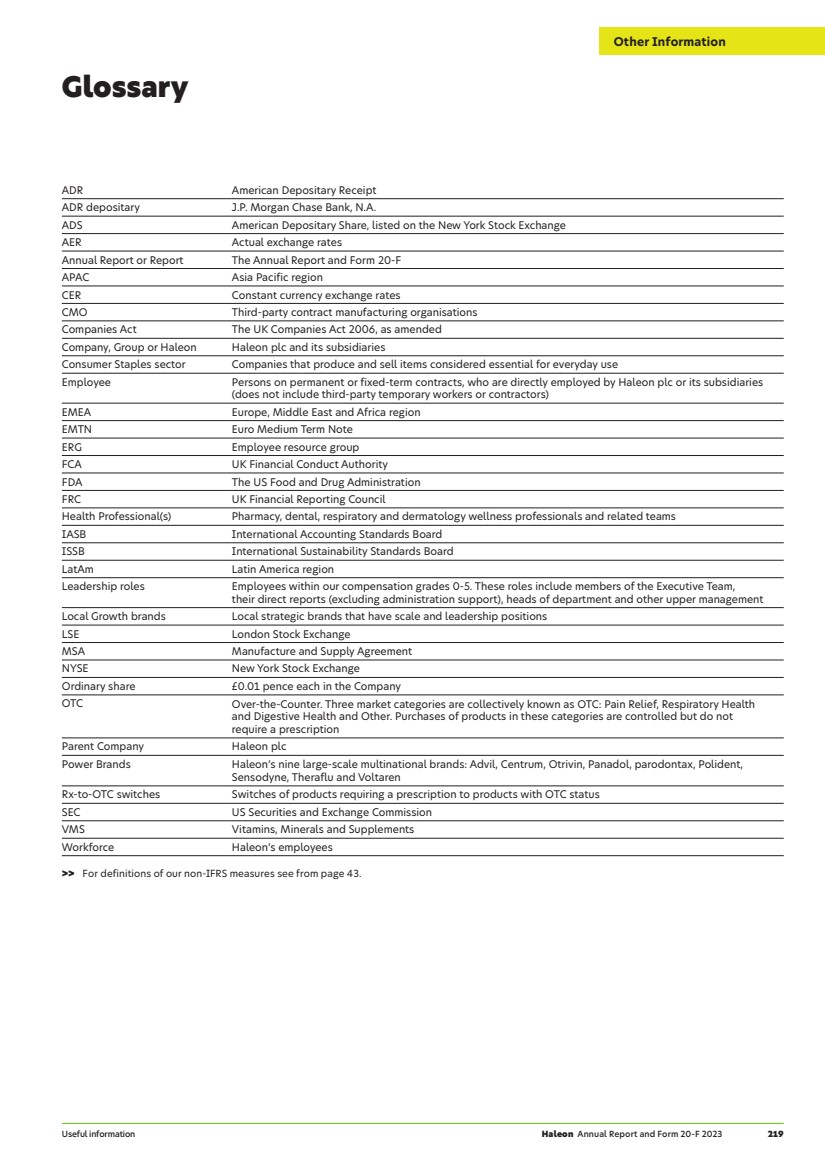
| Shareholder security Many companies have become aware that their shareholders have received unsolicited telephone calls or correspondence concerning investment matters. These are typically from ‘brokers’ who target UK shareholders, offering to sell them what often turn out to be worthless or high-risk shares in US or UK investments. These operations are commonly known as ‘boiler rooms’. More detailed information on this or similar activity can be found on the FCA website at www.fca.org.uk/consumers. Details of any share dealing facilities that the Company endorses will be included in Company mailings. Trading markets The principal trading market for the Company’s ordinary shares is the LSE. The ordinary shares are also listed on the NYSE, trading in the form of ADSs evidenced by ADRs and traded under the ticker symbol ‘HLN’. Each ADS represents two ordinary shares. American Depositary Receipts The Company has a sponsored ADR facility with J.P. Morgan Chase Bank, N.A., as Depositary. Each ADR represents two ordinary shares. All enquiries regarding ADR holder accounts and payment of dividends should be directed to: J.P. Morgan Chase Bank, N.A. Shareowner Services, PO Box 64504, St. Paul, MN 55164-0504, USA +1 800 990 1135 (US calls) (toll-free) +1 651 453 2128 (non-US calls) www.shareowneronline.com under ‘contact us’ www.adr.com AGM and documents on display The Company’s AGM will be held on 8 May 2024. Terms and conditions of all Directors’ appointments will be available for inspection at the Company’s registered office during normal business hours and during the AGM. Shareholders may electronically appoint a proxy to vote on their behalf at the 2024 AGM. Shareholders who hold their shares through CREST may appoint proxies through the CREST electronic proxy appointment service, by using the procedures described in the CREST Manual. Financial calendar Event Proposed date 2023 Final dividend — Ex-dividend date 14 March 2024 — Record date 15 March 2024 — Payment date1 16 May 2024 2024 first quarter trading statement 1 May 2024 2024 Annual General Meeting 8 May 2024 2024 half-year results 1 August 2024 2024 third quarter trading statement 31 October 2024 Financial year end 31 December 1 Payment is subject to shareholder approval at the AGM. Website and electronic communication Haleon is committed to reducing the cost and environmental impact of producing and distributing printed documents in large quantities and this Annual Report and Form 20-F 2023 has been made available to shareholders through our website at www.haleon.com. The Company is subject to the information requirements of the Securities Exchange Act of 1934 applicable to US foreign private issuers. In accordance with these requirements, the Company files its Annual Report and Form 20-F and other related documents with the SEC. The SEC maintains an internet site at www.sec.gov that contains reports and other information regarding issuers, including Haleon, that file electronically with the SEC. Ordinary share registrar For information on a range of shareholder services, including enquiries concerning individual shareholdings, notification of a shareholder’s change of address and amalgamation of shareholder accounts (in order to avoid duplicate mailing of shareholder communications), shareholders should contact the Company’s Registrar, Equiniti, using the contact details below. Equiniti Limited, Aspect House, Spencer Road, Lancing, West Sussex BN99 6DA, UK +44 (0) 371 384 2227 Dividend services and bank mandate The Company only makes dividend and other distribution payments into a nominated bank account. Shareholders must complete and return a direct payment instruction to the Company’s Registrar, Equiniti, in order to ensure your payments are received quickly and securely into your UK bank account. Dividend reinvestment plan (DRIP) As an alternative to receiving cash dividends, shareholders may choose to reinvest your dividends to buy more Haleon ordinary shares through the dividend reinvestment plan (DRIP). A DRIP election form can be downloaded from www.shareview.co.uk or requested by contacting Equiniti using the contact details above. Ordinary shareholders can alternatively sign up to Equiniti’s new service, EQ Boost. Through this service, ordinary shareholders can boost cash dividends and convert them into eVouchers for a range of retailers. You can access further information or sign up for EQ Boost at www.shareview.co.uk/Clients/EQBoost Overseas payment service It is also possible for overseas shareholders to have their dividends paid directly to their bank accounts in a local currency. Charges are payable for this service. Useful information 220 Haleon Annual Report and Form 20-F 2023 Other information |
| CBP023835 Designed and produced by Design Bridge and Partners, London. www.designbridge.com Printed by Park Communications, a Carbon Neutral Company, on FSC® certified paper. Park works to the EMAS standard and its Environmental Management System is certified to ISO 14001. This publication has been manufactured using 100% offshore wind electricity sourced from UK wind. 100% of the inks used are vegetable oil-based, 95% of press chemicals are recycled for further use and, on average, 99% of any waste associated with this production will be recycled and the remaining 1% used to generate energy. This document is printed on Revive 100 Silk, a white triple coated sheet that is manufactured from FSC® Recycled certified fibre derived from 100% pre and post-consumer wastepaper containing 100% recycled fibre. The FSC® label on this product ensures responsible use of the world’s forest resources. Haleon Annual Report and Form 20-F 2023 |
| Haleon plc Registered office address: Building 5, First Floor, The Heights Weybridge Surrey KT13 0NY England www.haleon.com Packs shown are representative portfolio examples. Packaging will vary by country for linguistic, legal and regulatory reasons. |
SIGNATURE
The registrant hereby certifies that it meets all of the requirements for filing on Form 20-F and that it has duly caused and authorized the undersigned to sign this Annual Report on Form 20-F on its behalf.
Haleon plc
Date : March 15 , 2024
|
/s/ Tobias Hestler |
|
|
|
|
|
Tobias Hestler |
|
|
Chief Financial Officer |
|