UNITED STATES
SECURITIES AND EXCHANGE COMMISSION
Washington, D.C. 20549
FORM
ANNUAL REPORT PURSUANT TO SECTION 13 OR 15(d) OF THE SECURITIES EXCHANGE ACT OF 1934 |
For the fiscal year ended:
TRANSITION REPORT PURSUANT TO SECTION 13 OR 15(d) OF THE SECURITIES EXCHANGE ACT OF 1934 |
For the transition period from to
Commission file number:
(Exact name of registrant as specified in its charter)
(State or other jurisdiction of | (I.R.S. Employer | |
(Address of principal executive offices) | (Zip Code) |
(
(Registrant’s telephone number, including area code)
Securities registered pursuant to Section 12(b) of the Act:
Title of each class |
| Trading symbol |
| Name of each exchange on which registered |
Securities registered pursuant to Section 12(g) of the Act: None
Indicate by check mark if the registrant is a well-known seasoned issuer, as defined in Rule 405 of the Securities Act.þ
Indicate by check mark if the registrant is not required to file reports pursuant to Section 13 or Section 15(d) of the Act.☐ Yes þ
Indicate by check mark whether the registrant (1) has filed all reports required to be filed by Section 13 or 15(d) of the Securities Exchange Act of 1934 during the preceding 12 months (or for such shorter period that the registrant was required to file such reports), and (2) has been subject to such filing requirements for the past 90 days.
þ
Indicate by check mark whether the registrant has submitted electronically every Interactive Data File required to be submitted pursuant to Rule 405 of Regulation S-T (§232.405 of this chapter) during the preceding 12 months (or for such shorter period that the registrant was required to submit such files).
þ
Indicate by check mark whether the registrant is a large accelerated filer, an accelerated filer, a non-accelerated filer, a smaller reporting company or an emerging growth company. See the definitions of “large accelerated filer,” “accelerated filer,” “smaller reporting company” and “emerging growth company” in Rule 12b-2 of the Exchange Act.
☑ | Accelerated filer | ☐ | ||
Non-accelerated filer | ☐ | Smaller reporting company | ||
Emerging growth company |
If an emerging growth company, indicate by check mark if the registrant has elected not to use the extended transition period for complying with any new or revised financial accounting standards provided pursuant to Section 13(a) of the Exchange Act. ☐
Indicate by check mark whether the registrant has filed a report on and attestation to its management’s assessment of the effectiveness of its internal control over financial reporting under Section 404(b) of the Sarbanes-Oxley Act (15 U.S.C. 7262(b)) by the registered public accounting firm that prepared or issued its audit report.
If securities are registered pursuant to Section 12(b) of the Act, indicate by check mark whether the financial statements of the registrant included in the filing reflect the correction of an error to previously issued financial statements.
Indicate by check mark whether any of those error corrections are restatements that required a recovery analysis of incentive-based compensation received by any of the registrant’s executive officers during the relevant recovery period pursuant to §240.10D-1(b). ☐
Indicate by check mark whether the registrant is a shell company (as defined in Rule 12b-2 of the Act).
Aggregate market value of the voting and non-voting common equity held by non-affiliates, computed by reference to the price at which the common stock was last sold on the New York Stock Exchange on June 30, 2023, was approximately $
DOCUMENTS INCORPORATED BY REFERENCE
The Registrant’s definitive Proxy Statement pertaining to the 2024 Annual Meeting of Stockholders, filed or to be filed not later than 120 days after the end of the fiscal year pursuant to Regulation 14A, is incorporated herein by reference into Part III.
TABLE OF CONTENTS
MARKET AND INDUSTRY DATA AND FORECASTS
Market and industry data and other statistical information and forecasts used throughout this Annual Report on Form 10-K (this “Annual Report”) are based on independent industry publications, government publications and reports by market research firms or other published independent sources. We have not sought or obtained the approval or endorsement of the use of this third-party information. Some data also is based on our good faith estimates, which are derived from our review of internal surveys, as well as independent sources. Forecasts are particularly likely to be inaccurate, especially over long periods of time.
2
Unless the context otherwise indicates, all references in this Annual Report to the “Company,” “we,” “us,” “our” or “ours” or similar words are to Hilltop Holdings Inc. and its direct and indirect wholly owned subsidiaries, references to “Hilltop” refer solely to Hilltop Holdings Inc., references to “PCC” refer to PlainsCapital Corporation (a wholly owned subsidiary of Hilltop), references to “Securities Holdings” refer to Hilltop Securities Holdings LLC (a wholly owned subsidiary of Hilltop), references to “Hilltop Securities” refer to Hilltop Securities Inc. (a wholly owned subsidiary of Securities Holdings), references to “Momentum Independent Network” refer to Momentum Independent Network Inc. (a wholly owned subsidiary of Securities Holdings), Hilltop Securities and Momentum Independent Network are collectively referred to as the “Hilltop Broker-Dealers,” references to the “Bank” refer to PlainsCapital Bank (a wholly owned subsidiary of PCC), references to “FNB” refer to First National Bank, references to “SWS” refer to the former SWS Group, Inc., references to “PrimeLending” refer to PrimeLending, a PlainsCapital Company (a wholly owned subsidiary of the Bank) and its subsidiaries as a whole.
FORWARD-LOOKING STATEMENTS
This Annual Report includes “forward-looking statements” within the meaning of Section 27A of the Securities Act of 1933, as amended (the “Securities Act”), and Section 21E of the Securities Exchange Act of 1934 (the “Exchange Act”), as amended by the Private Securities Litigation Reform Act of 1995. All statements, other than statements of historical fact, included in this Annual Report that address results or developments that we expect or anticipate will or may occur in the future, and statements that are preceded by, followed by or include, words such as “anticipates,” “believes,” “could,” “estimates,” “expects,” “forecasts,” “goal,” “intends,” “may,” “might,” “plan,” “probable,” “projects,” “seeks,” “should,” “target,” “view” or “would” or the negative of these words and phrases or similar words or phrases, including such things as our business strategy, our financial condition, our revenue, our liquidity and sources of funding, market trends, operations and business, taxes, the impact of natural disasters or public health emergencies, information technology expenses, cybersecurity incidents, capital levels, mortgage servicing rights (“MSR”) assets, stock repurchases, dividend payments, expectations concerning mortgage loan origination volume, servicer advances and interest rate compression, expected levels of refinancing as a percentage of total loan origination volume, projected losses on mortgage loans originated, total expenses, the effects of government regulation applicable to our operations, the appropriateness of, and changes in, our allowance for credit losses and provision for (reversal of) credit losses, expected future benchmarks rates, anticipated investment yields, our expectations regarding accretion of discount on loans in future periods, the collectability of loans, and the outcome of litigation are forward-looking statements.
These forward-looking statements are based on our beliefs, assumptions and expectations of our future performance taking into account all information currently available to us. These beliefs, assumptions and expectations are subject to risks and uncertainties and can change as a result of many possible events or factors, not all of which are known to us. If an event occurs, our business, business plan, financial condition, liquidity and results of operations may vary materially from those expressed in our forward-looking statements. Certain factors that could cause actual results to differ include, among others:
| ● | the credit risks of lending activities, including our ability to estimate credit losses and the allowance for credit losses, as well as the effects of changes in the level of, and trends in, loan delinquencies and write-offs; |
| ● | effectiveness of our data security controls in the face of cyber attacks and any legal, reputational and financial and financial risks following a cybersecurity incident; |
| ● | changes in general economic, market and business conditions in areas or markets where we compete, including changes in the price of crude oil; |
| ● | changes in the interest rate environment; |
| ● | risks associated with our concentration in real estate related loans; |
| ● | the effects of our indebtedness on our ability to manage our business successfully, including the restrictions imposed by the indenture governing our indebtedness; |
| ● | disruptions to the economy and financial services industry, risks associated with uninsured deposits and responsive measures by federal or state governments or banking regulators, including increases in the cost of our deposit insurance assessments; |
3
| ● | cost and availability of capital; |
| ● | changes in state and federal laws, regulations or policies affecting one or more of our business segments, including changes in regulatory fees, deposit insurance premiums, capital requirements and the Dodd-Frank Wall Street Reform and Consumer Protection Act (the “Dodd-Frank Act”); |
| ● | changes in key management; |
| ● | competition in our banking, broker-dealer, and mortgage origination segments from other banks and financial institutions as well as investment banking and financial advisory firms, mortgage bankers, asset-based non-bank lenders and government agencies; |
| ● | legal and regulatory proceedings; |
| ● | risks associated with merger and acquisition integration; and |
| ● | our ability to use excess capital in an effective manner. |
For a more detailed discussion of these and other factors that may affect our business and that could cause the actual results to differ materially from those anticipated in these forward-looking statements, see Item 1A, “Risk Factors,” and Item 7, “Management’s Discussion and Analysis of Financial Condition and Results of Operations,” herein. We caution that the foregoing list of factors is not exhaustive, and new factors may emerge, or changes to the foregoing factors may occur, that could impact our business. All subsequent written and oral forward-looking statements concerning our business attributable to us or any person acting on our behalf are expressly qualified in their entirety by the cautionary statements above. We do not undertake any obligation to update any forward-looking statement, whether written or oral, relating to the matters discussed in this Annual Report except to the extent required by federal securities laws.
4
PART I
Item 1. Business.
General
Hilltop Holdings Inc. is a diversified, Texas-based financial holding company registered under the Bank Holding Company Act of 1956, as amended (the “Bank Holding Company Act”). Our primary line of business is to provide business and consumer banking services from offices located throughout Texas through the Bank. We also provide an array of financial products and services through our broker-dealer and mortgage origination segments. We endeavor to build and maintain a strong financial services company through organic growth as well as acquisitions, which we may make using available capital, excess liquidity and, if necessary or appropriate, additional equity or debt financing sources. The following includes additional details regarding the financial products and services provided by each of our two primary business units.
PCC. PCC is a financial holding company that provides, through its subsidiaries, traditional banking and wealth, investment and treasury management services primarily in Texas and residential mortgage loans throughout the United States.
Securities Holdings. Securities Holdings is a holding company that provides, through its subsidiaries, investment banking and other related financial services, including municipal advisory, sales, trading and underwriting of taxable and tax-exempt fixed income securities, clearing, securities lending, structured finance and retail brokerage services throughout the United States.
At December 31, 2023, on a consolidated basis, we had total assets of $16.5 billion, total deposits of $11.1 billion, total loans, including loans held for sale, of $8.9 billion and stockholders’ equity of $2.2 billion.
Our common stock is listed on the New York Stock Exchange (“NYSE”) under the symbol “HTH.”
Our principal office is located at 6565 Hillcrest Avenue, Dallas, Texas 75205, and our telephone number at that location is (214) 855-2177. Our internet address is www.hilltop-holdings.com. Our Annual Reports on Form 10-K, Quarterly Reports on Form 10-Q, Current Reports on Form 8-K and amendments to those reports filed or furnished pursuant to Section 13(a) or 15(d) of the Exchange Act are available on our website, free of charge, at http://ir.hilltop-holdings.com/ under the tab “Investor Relations - Filings” as soon as reasonably practicable after we electronically file such reports with, or furnish them to, the Securities and Exchange Commission (the “SEC”). The references to our website in this Annual Report are inactive textual references only. The information on our website is not incorporated by reference into this Annual Report. The SEC maintains a public website, www.sec.gov, which includes information about and the filings of issuers that file electronically with the SEC.
Business Segments
Under accounting principles generally accepted in the United States (“GAAP”), our business units are comprised of three reportable business segments organized primarily by the core products offered to the segments’ respective customers: banking, broker-dealer, and mortgage origination. These segments reflect the manner in which operations are managed and the criteria used by our chief operating decision maker, our President and Chief Executive Officer, to evaluate segment performance, develop strategy and allocate resources.
5
The following graphic reflects our current business segments.
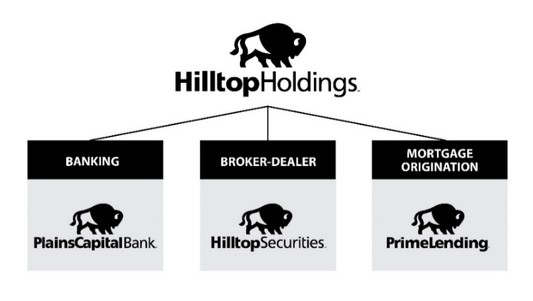
Corporate includes certain activities not allocated to specific business segments. These activities include holding company financing and investing activities, merchant banking investment opportunities, and management and administrative services to support the overall operations of the Company. Hilltop’s merchant banking investment activities include the identification of attractive opportunities for capital deployment in companies engaged in non-financial activities through its merchant bank subsidiary, Hilltop Opportunity Partners LLC.
For more financial information about each of our business segments, see Item 7, “Management’s Discussion and Analysis of Financial Condition and Results of Operations,” herein. See also Note 27 in the notes to our consolidated financial statements included under Item 8, “Financial Statements and Supplementary Data.”
Banking
The banking segment includes the operations of the Bank, which, at December 31, 2023, had $13.3 billion in assets and total deposits of $11.1 billion. The primary sources of our deposits are residents of and businesses located in Texas. At December 31, 2023, the Bank employed approximately 1,000 people.
The table below sets forth a distribution of the banking segment’s loans, classified by portfolio segment. The banking segment’s loan portfolio included $1.6 billion in warehouse lines of credit extended to PrimeLending and its affiliated business arrangements (“ABAs”), of which $0.9 billion was drawn at December 31, 2023. Amounts advanced against the warehouse lines of credit are included in the table below, but are eliminated from net loans on our consolidated balance sheets.
| Total |
| % of Total |
| ||
Loans Held | Loans Held |
| ||||
for Investment | for Investment |
| ||||
Commercial real estate: | ||||||
Non-owner occupied | $ | 1,889,882 |
| 22.0 | % | |
Owner occupied |
| 1,422,234 |
| 16.5 | % | |
Commercial and industrial |
| 1,440,137 |
| 16.8 | % | |
Mortgage warehouse lending | 156,838 | 1.8 | % | |||
Construction and land development |
| 1,031,095 |
| 12.0 | % | |
1-4 family residential |
| 1,757,178 |
| 20.4 | % | |
Consumer |
| 27,351 |
| 0.3 | % | |
7,724,715 | 89.8 | % | ||||
PrimeLending warehouse lines of credit | 873,911 | 10.2 | % | |||
Total loans held for investment | $ | 8,598,626 |
| 100.0 | % | |
6
Our lending policies seek to establish an asset portfolio that will provide a return on stockholders’ equity sufficient to maintain capital to assets ratios that meet or exceed established regulations. In support of that goal, we have designed our underwriting standards to determine:
| ● | that our borrowers possess sound ethics and competently manage their affairs; |
| ● | that we know the source of the funds the borrower will use to repay the loan; |
| ● | that the purpose of the loan makes economic sense; and |
| ● | that we identify relevant risks of the loan and determine that the risks are acceptable. |
We implement our underwriting standards according to the facts and circumstances of each particular loan request, as discussed below.
Business Banking. Our business banking customers primarily consist of real estate (including construction and land development), wholesale/retail trade, healthcare, institutions of higher education, agribusiness and energy companies. We provide these customers with extensive banking services, such as online banking, business check cards and other add-on services as determined on a customer-by-customer basis. Our treasury management services, which are designed to reduce the time, burden and expense of collecting, transferring, disbursing and reporting cash, are also available to our business customers. We offer our business banking customers term loans, commercial real estate loans, lines of credit, equipment loans, letters of credit, agricultural loans and other lending products.
Commercial and industrial loans are primarily made within Texas and are underwritten on the basis of the borrower’s ability to service the debt from cash flow from an operating business. In general, commercial and industrial loans involve more credit risk than residential and commercial real estate loans and, therefore, usually yield a higher return. The increased risk in commercial and industrial loans results primarily from the type of collateral securing these loans, which typically includes accounts receivable, equipment and inventory. Additionally, increased risk arises from the expectation that commercial and industrial loans generally will be serviced principally from operating cash flow of the business, and such cash flows are dependent upon successful business operations. Historical trends have shown these types of loans to have higher delinquencies than mortgage loans. As a result of the additional risk and complexity associated with commercial and industrial loans, such loans require more thorough underwriting and servicing than loans to individuals. To manage these risks, our policy is to attempt to secure commercial and industrial loans with both the assets of the borrowing business and other additional collateral and guarantees that may be available. In addition, depending on the size of the credit, we actively monitor the financial condition of the borrower by analyzing the borrower’s financial statements and assessing certain financial measures, including cash flow, collateral value and other appropriate credit factors. We also have processes in place to analyze and evaluate on a regular basis our exposure to industries, products, market changes and economic trends.
The Bank offers term financing on commercial real estate that includes retail, office, multi-family, industrial and warehouse properties. Commercial mortgage lending can involve high principal loan amounts, and the repayment of these loans is dependent, in large part, on a borrower’s ongoing business operations or on income generated from the properties that are leased to third parties. Accordingly, we apply the measures described above for commercial and industrial loans to our commercial real estate lending, with increased emphasis on analysis of collateral values. As a general practice, the Bank requires its commercial mortgage loans to (i) be secured with first lien positions on the underlying property, (ii) maintain adequate equity margins, (iii) be serviced by businesses operated by an established management team and (iv) be guaranteed by the principals of the borrower. The Bank seeks lending opportunities where cash flow from the collateral provides adequate debt service coverage and/or the guarantor’s net worth is comprised of assets other than the project being financed.
The Bank’s mortgage warehouse lending activities consist of asset-based lending in which the Bank provides short-term, revolving lines of credit to independent mortgage bankers (“IMBs”). IMBs are generally small businesses, with mortgage loan origination and servicing as their sole or primary business. IMBs use the funds from their lines of credit to provide home loans to prospective and existing homeowners. When the IMBs subsequently sell the loans to institutional investors in the secondary market—typically within 30 days of closing the transaction—the proceeds from the sale are used to pay down and therefore replenish their lines of credit.
7
The Bank also offers construction financing for commercial, retail, office, industrial, warehouse, single-family and multi-family developments. Construction loans involve additional risks because loan funds are advanced upon the security of a project under construction, and the project is of uncertain value prior to its completion. If the Bank is forced to foreclose on a project prior to completion, it may not be able to recover the entire unpaid portion of the loan. Additionally, the Bank may be required to fund additional amounts to complete a project and may have to hold the property for an indeterminate period of time. Because of uncertainties inherent in estimating construction costs, the market value of the completed project and the effects of governmental regulation on real property, it can be difficult to accurately evaluate the total funds required to complete a project and the related loan-to-value ratio. As a result of these uncertainties, construction lending often involves the disbursement of substantial funds with repayment dependent, in part, on the success of the ultimate project rather than the ability of a borrower or guarantor to repay the loan. The Bank generally requires that the subject property of a construction loan for commercial real estate be pre-leased because cash flows from the completed project provide the most reliable source of repayment for the loan. Loans to finance these projects are generally secured by first liens on the underlying real property. The Bank conducts periodic completion inspections, either directly or through an agent, prior to approval of periodic draws on these loans.
In addition to the real estate lending activities described above, a portion of the Bank’s real estate portfolio consists of one-to-four family residential mortgage loans typically collateralized by owner occupied properties. These residential mortgage loans are generally secured by a first lien on the underlying property and have maturities up to 30 years. These loans are shown in the loans held for investment table above as “1-4 family residential.”
Personal Banking. The Bank offers a broad range of personal banking products and services for individuals. Similar to its business banking operations, the Bank also provides its personal banking customers with a variety of add-on features such as check cards, safe deposit boxes, online banking, bill pay, overdraft privilege services and access to automated teller machine (ATM) facilities throughout the United States. The Bank offers a variety of deposit accounts to its personal banking customers including savings, checking, interest-bearing checking, money market and certificates of deposit.
The Bank loans to individuals for personal, family and household purposes, including lines of credit, home improvement loans, home equity loans, and loans for purchasing and carrying securities.
Private Banking and Investment Management. The Bank’s private banking team personally assists high net worth individuals and their families with their banking needs, including depository, credit, asset management, and trust and estate services. The Bank offers trust and asset management services in order to assist these customers in managing, and ultimately transferring, their wealth.
The Bank provides personal trust, investment management and employee benefit plan administration services, including estate planning, management and administration, investment portfolio management and employee benefit account and individual retirement account services.
Broker-Dealer
The “Hilltop Broker-Dealers” include the operations of Hilltop Securities, a broker-dealer subsidiary registered with the SEC and the Financial Industry Regulatory Authority, Inc. (“FINRA”) and a member of the NYSE, Momentum Independent Network, an introducing broker-dealer subsidiary that is also registered with the SEC and FINRA, and Hilltop Securities Asset Management, LLC. Hilltop Securities and Momentum Independent Network are both registered with the Commodity Futures Trading Commission (“CFTC”) as non-guaranteed introducing brokers and as members of the National Futures Association (“NFA”). Additionally, Hilltop Securities Asset Management, LLC, Hilltop Securities and Momentum Independent Network are investment advisers registered with the SEC under the Investment Advisers Act of 1940. At December 31, 2023, Hilltop Securities had total assets of $2.9 billion and net capital of $281 million, which was $274 million in excess of its minimum net capital requirement of $7 million. At December 31, 2023, the Hilltop Broker-Dealers employed approximately 770 people and maintained 40 locations in 16 states.
Our broker-dealer segment has four primary lines of business: (i) public finance services, (ii) structured finance, (iii) fixed income services, and (iv) wealth management, which includes retail, clearing services and securities lending.
8
These lines of business and the respective services provided reflect the current manner in which the broker-dealer segment’s operations are managed.
Public Finance Services. The public finance services line of business assists public entities nationwide, including cities, counties, school districts, utility districts, tax increment zones, special districts, state agencies and other governmental entities, in originating, syndicating and distributing securities of municipalities and political subdivisions. In addition, the public finance services line of business provides specialized advisory and investment banking services for airports, convention centers, healthcare institutions, institutions of higher education, housing, industrial development agencies, toll road authorities, and public power and utility providers.
Additionally, through its arbitrage rebate, treasury management and government investment pools management departments, the public finance services line of business provides state and local governments with advice and guidance with respect to arbitrage rebate compliance, portfolio management and local government investment pool administration.
Structured Finance. The structured finance line of business provides advisory services and product expertise related to derivatives for U.S. Agency to-be-announced (“TBA”) and commodities. The business line participates in programs in which it issues forward purchase commitments of mortgage-backed securities to certain non-profit housing clients and sells TBA mortgage-backed securities. Additionally, this business line provides agricultural insurance through Hilltop Securities Insurance Agency Inc., whereby we act as an agent in these transactions and retain no underwriting risk with regard to the sale of insurance products.
Fixed Income Services. The fixed income services line of business specializes in sales, trading and underwriting of U.S. government and government agency bonds, corporate bonds, municipal bonds, mortgage-backed, asset-backed and commercial mortgage-backed securities and structured products to support sales and other client activities. In addition, the fixed income services line of business provides asset and liability management advisory services to community banks.
Wealth Management. The wealth management line of business is comprised of our retail, clearing services and securities lending groups.
Retail. The retail group acts as a securities broker for retail customers in the purchase and sale of securities, options, and futures contracts that are traded on various exchanges or in the over-the-counter market through our employee-registered representatives or independent contractor arrangements. We extend margin credit on a secured basis to our retail customers in order to facilitate securities transactions. Through Hilltop Securities Insurance Agency Inc. we hold insurance licenses to facilitate the sale of insurance and annuity products by Hilltop Securities and Momentum Independent Network advisors to retail clients. We act as an agent in these transactions and retain no underwriting risk related to these insurance and annuity products. In addition, through our investment management team, the retail group provides a number of advisory programs that offer advisors a wide array of products and services for their advisory businesses. In most cases, we charge commissions to our clients in accordance with an established commission schedule, subject to certain discounts based upon the client’s level of business, the trade size and other relevant factors. The Momentum Independent Network advisors may also contract directly with third-party carriers to sell specified insurance products to their customers. The commissions received from these third-party carriers are paid directly to the advisor. At December 31, 2023, we employed 92 registered representatives in 16 retail brokerage offices and had contracts with 186 independent retail representatives for the administration of their securities business.
Clearing Services. The clearing services group offers fully disclosed clearing services to FINRA- and SEC-registered member firms for trade execution and clearance as well as back office services such as record keeping, trade reporting, accounting, general back-office support, securities and margin lending, reorganization assistance and custody of securities. At December 31, 2023, we provided services to 105 financial organizations, including correspondent firms, correspondent broker-dealers, registered investment advisers, discount and full-service brokerage firms, and institutional firms.
Securities Lending. The securities lending group performs activities that include borrowing and lending securities for other broker-dealers, lending institutions, and internal clearing and retail operations. These activities involve borrowing securities to cover short sales and to complete transactions in which customers have failed to deliver securities by the required settlement date, and lending securities to other broker-dealers for similar purposes.
9
Mortgage Origination
Our mortgage origination segment operates through a wholly owned subsidiary of the Bank, PrimeLending, which is a residential mortgage banker licensed to originate and close loans in all 50 states and the District of Columbia. PrimeLending primarily originates its mortgage loans through a retail channel, with limited lending through its ABAs. During 2023, funded loan volume through ABAs was approximately 14% of the mortgage origination segment’s total loan volume. At December 31, 2023, our mortgage origination segment operated from over 210 locations in 45 states, originating 28.9%, 7.9% and 5.2%, respectively, of its mortgage loans (by dollar volume) from its Texas, California and South Carolina locations. The mortgage lending business is subject to variables that can impact loan origination volume, including seasonal and interest rate fluctuations. Historically, the mortgage origination segment has experienced increased loan origination volume from purchases of homes during the spring and summer months, when more people tend to move and buy or sell homes. An increase in mortgage interest rates tends to result in decreased loan origination volume from refinancings, while a decrease in mortgage interest rates tends to result in increased loan origination volume from refinancings. Changes in mortgage interest rates have historically had a lesser impact on home purchases volume than on refinancing volume.
PrimeLending handles loan processing, underwriting and closings in-house. Mortgage loans originated by PrimeLending are funded through warehouse lines of credit maintained with the Bank. PrimeLending sells substantially all mortgage loans it originates to various investors in the secondary market. In addition, the mortgage origination segment originates loans on behalf of the Bank. PrimeLending’s determination of whether to retain or release servicing on mortgage loans it sells is impacted by, among other things, changes in mortgage interest rates, and refinancing and market activity. Loan volumes to be originated on behalf of and retained by the banking segment are evaluated each quarter. Loans sold to and retained by the Bank during 2023, 2022 and 2021 were $140 million, $532 million, and $778 million, respectively. Loan volumes to be originated on behalf of and retained by the banking segment are expected to be impacted by, among other things, an ongoing review of the prevailing mortgage rates, balance sheet positioning at Hilltop and the banking segment’s outlook for commercial loan growth. PrimeLending may, from time to time, manage its mortgage servicing rights (“MSR”) assets through different strategies, including varying the percentage of mortgage loans sold servicing released and opportunistically selling MSR assets. As mortgage loans are sold in the secondary market, PrimeLending pays down its warehouse lines of credit with the Bank. Loans sold are subject to certain standard indemnification provisions with investors, including the repurchase of loans sold and the repayment of sales proceeds to investors under certain conditions.
Our mortgage lending underwriting strategy, driven in large measure by secondary market investor standards, seeks primarily to originate conforming loans. Our underwriting practices include:
| ● | granting loans on a sound and collectible basis; |
| ● | obtaining a balance between maximum yield and minimum risk; |
| ● | ensuring that primary and secondary sources of repayment are adequate in relation to the amount of the loan; and |
| ● | ensuring that each loan is properly documented and, if appropriate, adequately insured. |
PrimeLending also acts as a primary servicer for loans originated prior to sale and loans sold with servicing retained.
PrimeLending had a staff of approximately 1,560 people, including approximately 930 mortgage loan officers, as of December 31, 2023 that produced $8.2 billion in closed mortgage loan volume during 2023, 93.4% of which related to home purchases volume. PrimeLending offers a variety of loan products catering to the specific needs of borrowers seeking purchase or refinancing options, including 30-year and 15-year fixed rate conventional mortgages, adjustable rate mortgages, jumbo loans, new construction loans, and Federal Housing Administration (“FHA”), Veterans Affairs (“VA”), and United States Department of Agriculture (“USDA”) loans. Mortgage loans originated by PrimeLending are secured by a first lien on the underlying property. PrimeLending does not currently originate subprime loans (which it defines to be conventional and government loans that (i) are ineligible for sale to the Federal National Mortgage Association (“FNMA”), Federal Home Loan Mortgage Corporation (“FHLMC”) or Government National Mortgage Association (“GNMA”), or (ii) do not comply with approved investor-specific underwriting guidelines).
10
Geographic Dispersion of our Businesses
The Bank provides traditional banking and wealth, investment and treasury management services. The Bank has a presence in the large metropolitan markets in Texas and conducts substantially all of its banking operations in Texas.
Our broker-dealer services are provided through Hilltop Securities and Momentum Independent Network, which conduct business nationwide, with 84% of the broker-dealer segment’s net revenues during 2023 generated through locations in Texas, New York and California.
PrimeLending provides residential mortgage origination products and services from over 210 locations in 45 states. During 2023, an aggregate of 67% of PrimeLending’s origination volume was concentrated in ten states, with 42% concentrated in Texas, California and South Carolina, collectively. Other than these ten states, none of the states in which PrimeLending operated during 2023 represented more than 3% of PrimeLending’s origination volume.
Employees and Human Capital Resources
At December 31, 2023 we employed approximately 3,800 full-time employees and less than 20 part-time employees. Our employees are not represented by any collective bargaining group. Management believes that we have good relations with our employees.
We encourage and support the growth and development of our employees and, wherever possible, seek to fill positions by promotion and transfer from within the organization. Continual learning and career development are advanced through annual performance and development conversations with employees, internally developed training programs, customized corporate training engagements and seminars, conferences, and other training events employees are encouraged to attend in connection with their job duties.
Employee retention helps us operate efficiently and achieve one of our business objectives, which is being a high-level service provider. We believe our commitment to our core values (integrity, collaboration, adaptability, respect and excellence) as well as actively prioritizing concern for our employees’ well-being, supporting our employees’ career goals, offering competitive wages and providing valuable fringe benefits aids in the retention of our top-performing employees. At December 31, 2023, approximately 36% of our current staff had been with us for ten years or more.
During 2023, women represented over 55% of Hilltop’s workforce, and 11% of the overall executive management team. During 2023, 33% of our employees fell within the minority classification and approximately 45% of our employees were below the age of 45.
Hilltop has three employee-based councils, namely the Culture Council, Diversity Momentum Council and Women Momentum Council, each devoted to driving employee engagement and sponsoring events across the enterprise to promote social networking amongst all employees. Various enterprise initiatives are presented to foster awareness, dialogue and appreciation of cultural diversity, including recognition and celebration of ethnic holidays. In addition, in-person and virtual panel discussions are held to encourage development and success of women within the workplace.
We are committed to offering transparency into our business activities and providing our stakeholders with key data supporting our sustainability. For more information, see our current Environmental, Social and Governance, or ESG, and Sustainability Report, available on our website at https://hilltop-holdings.com/ under the tab “Who We Are – ESG & Sustainability.” The references to our website in this Annual Report are inactive textual references only. The information on our website is not incorporated by reference into this Annual Report.
Competition
We face significant competition in the business segments in which we operate and the geographic markets we serve. Many of our competitors have substantially greater financial resources, lending limits and branch networks than we do, and offer a broader range of products and services.
11
Our banking segment primarily competes with national, regional and community banks within the various markets where the Bank operates. The Bank also faces competition from many other types of financial institutions, including savings and loan associations, credit unions, finance companies, pension trusts, mutual funds, insurance companies, brokerage and investment banking firms, asset-based non-bank lenders, government agencies and certain other non-financial institutions. The ability to attract and retain skilled lending professionals is critical to our banking business. Competition for deposits and in providing lending products and services to consumers and businesses in our market area is intense and pricing is important. Competition for deposits and lending services is also increasing from internet-based competitors and fintech companies. Other factors encountered in competing for deposits are convenient office locations, interest rates and fee structures of products offered. Direct competition for deposits also comes from other commercial bank and thrift institutions, money market mutual funds and corporate and government securities that may offer more attractive rates than insured depository institutions are willing to pay. Competition for loans is based on factors such as interest rates, loan origination fees and the range of services offered by the provider. We seek to distinguish ourselves from our competitors through our commitment to personalized customer service and responsiveness to customer needs while providing a range of competitive loan and deposit products and other services.
Within our broker-dealer segment, we face significant competition based on a number of factors, including price, perceived expertise, quality of advice, reputation, range of services and products, technology, innovation and local presence. Competition for recruiting and retaining securities traders, investment bankers, and other financial advisors is intense. Our broker-dealer business competes directly with numerous other financial advisory and investment banking firms, broker-dealers and banks, including large national and major regional firms and smaller niche companies, some of whom are not broker-dealers and, therefore, are not subject to the broker-dealer regulatory framework. Further, our broker-dealer segment competes with discount brokerage firms, including fintech startups, that do not offer equivalent services but offer discounted prices and certain free services. We seek to distinguish ourselves from our competitors through our commitment to personalized customer service and responsiveness to customer needs while providing a range of investment banking, advisory and other related financial brokerage services.
Our competitors in the mortgage origination business include large financial institutions as well as independent mortgage banking companies, commercial banks, savings banks, savings and loan associations and fintech companies. Our mortgage origination segment competes on a number of factors including customer service, quality and range of products and services offered, price, reputation, interest rates, closing process and duration, and loan origination fees. The ability to attract and retain skilled mortgage origination professionals is critical to our mortgage origination business. We seek to distinguish ourselves from our competitors through our commitment to personalized customer service and responsiveness to customer needs while providing a range of competitive mortgage loan products and services.
Overall, competition among providers of financial products and services continues to increase as technological advances have lowered the barriers to entry for financial technology companies, with consumers having the opportunity to select from a growing variety of traditional and nontraditional alternatives, including online checking, savings and brokerage accounts, online lending, online insurance underwriters, crowdfunding, digital wallets, and money transfer services. The ability of non-banking financial institutions to provide services previously limited to commercial banks has intensified competition. Because non-banking financial institutions are not subject to many of the same regulatory restrictions as banks and bank holding companies, they can often operate with greater flexibility and lower cost structures.
Government Supervision and Regulation
General
We are subject to extensive regulation under federal and state laws. The regulatory framework is intended primarily for the protection of customers and clients, and not for the protection of our stockholders or creditors. In many cases, the applicable regulatory authorities have broad enforcement power over bank holding companies, banks and their subsidiaries, including the power to impose substantial fines and other penalties for violations of laws and regulations. The following discussion describes the material elements of the regulatory framework that applies to us and our subsidiaries. References in this Annual Report to applicable statutes and regulations are brief summaries thereof, do not purport to be complete, and are qualified in their entirety by reference to such statutes and regulations.
12
The Dodd-Frank Act, which significantly altered the regulation of financial institutions and the financial services industry, established the Consumer Financial Protection Bureau (“CFPB”) and requires the CFPB and other federal agencies to implement many provisions of the Dodd-Frank Act. Several aspects of the Dodd-Frank Act have affected our business, including, without limitation, capital requirements, mortgage regulation, restrictions on proprietary trading in securities, investments in hedge funds and private equity funds (the “Volcker Rule”), executive compensation restrictions, potential federal oversight of the insurance industry and disclosure and reporting requirements. In 2018, the Economic Growth, Regulatory Relief and Consumer Protection Act (“EGRRCPA”) became law, which included amendments to the Dodd-Frank Act and other statutes that provide the federal banking agencies with the ability to tailor various provisions of the banking laws and eased the regulatory burden imposed by the Dodd-Frank Act with respect to company-run stress testing, resolutions plans, the Volcker Rule, high volatility commercial real estate exposures, and real estate appraisals.
Recent Regulatory Developments. New regulations and statutes are regularly proposed and/or adopted that contain wide-ranging proposals for altering the structures, regulations and competitive relationships of financial institutions operating and doing business in the United States. Changes in leadership at various federal banking agencies, including the Board of Governors of the Federal Reserve System (the “Federal Reserve Board”), can also change the policy direction of these agencies. Certain of these recent proposals and changes are described below.
The Anti-Money Laundering Act of 2020 (the “AML 2020 Act”) was enacted as part of the National Defense Authorization Act for Fiscal Year 2021. The AML 2020 Act is the most significant revision to the anti-money laundering (“AML”) laws since the Uniting and Strengthening America by Providing Appropriate Tools Required to Intercept and Obstruct Terrorism of 2001, as amended (the “USA PATRIOT Act”). The AML 2020 Act clarifies and streamlines the Currency and Foreign Transactions Reporting Act of 1970, as amended, (the “Bank Secrecy Act”) and AML obligations in the following ways: requires U.S. entities and entities doing business in the United States to report into a national registry maintained by the Financial Crimes Enforcement Network (“FinCEN”) certain beneficial ownership information, subject to exceptions; modernizes the statutory definition of “financial institution” to include (i) entities that provide services involving “value that substitutes for currency,” which includes stored value and virtual currencies and (ii) any person engaged in the trade of antiquities, including an advisor, consultant or any other person who deals in the sale of antiquities; enhances penalties for Bank Secrecy Act and AML violations, including claw back of bonuses; increases AML whistleblower awards and expands whistleblower protections; requires the Secretary of the Treasury to establish and update every four years National AML Priorities, which are incorporated into the Bank Secrecy Act compliance programs at financial institutions subject to the Bank Secrecy Act; among other amendments. Implementing regulations concerning certain provisions of the AML 2020 Act have been proposed by FinCEN, but not all have been finalized. On September 29, 2022, FinCEN issued a final rule establishing a beneficial ownership information reporting requirement under the Corporate Transparency Act (CTA), which was passed as part of the AML 2020 Act. The rule, which became effective January 1, 2024, requires most corporations, limited liability companies, and other entities created in or registered to do business in the United States to report information about their beneficial owners—the persons who ultimately own or control the company, to FinCEN.
In July 2017, the Financial Conduct Authority (“FCA”) announced that it intends to cease compelling banks to submit rates for the calculation of the London Interbank Offered Rate (“LIBOR”) after 2021. The Alternative Reference Rates Committee (“ARRC”) proposed that the Secured Overnight Financing Rate (“SOFR”) is the rate that represents best practice as the alternative to LIBOR for use in derivatives and other financial contracts that are currently indexed to LIBOR. The Federal banking agencies issued a joint statement that imposed a deadline of December 31, 2021 for supervised institutions to cease entering into new contracts that use U.S. Dollar LIBOR as a reference rate and all remaining USD LIBOR tenors ceased to be published or lost representativeness immediately after June 30, 2023.
We cannot predict whether or in what form any proposed regulation or statute will be adopted or the extent to which our business may be affected by any new regulation or statute.
13
Corporate
Hilltop is a legal entity separate and distinct from PCC and its other subsidiaries. On November 30, 2012, concurrent with the consummation of the acquisition of PlainsCapital Corporation (the “PlainsCapital Merger”), Hilltop became a financial holding company registered under the Bank Holding Company Act, as amended by the Gramm-Leach-Bliley Act (“Gramm-Leach-Bliley Act”). Accordingly, it is subject to supervision, regulation and examination by the Federal Reserve Board. The Dodd-Frank Act, Gramm-Leach-Bliley Act, the Bank Holding Company Act and other federal laws subject financial and bank holding companies to particular restrictions on the types of activities in which they may engage and to a range of supervisory requirements and activities, including regulatory enforcement actions for violations of laws and regulations.
Changes of Control. Federal and state laws impose additional notice, approval and ongoing regulatory requirements on any investor that seeks to acquire direct or indirect “control” of a regulated holding company, such as Hilltop. These laws include the Bank Holding Company Act and the Change in Bank Control Act. Among other things, these laws require regulatory filings by an investor that seeks to acquire direct or indirect “control” of a regulated holding company. The determination whether an investor “controls” a regulated holding company is based on all of the facts and circumstances surrounding the investment. As a general matter, an investor is deemed to control a depository institution or other company if the investor owns or controls 25% or more of any class of voting stock, and in certain other circumstances, an investor may be presumed to control a depository institution or other company if the investor owns or controls less than 25% or more of any class of voting stock. Furthermore, these laws may discourage potential acquisition proposals and may delay, deter or prevent change of control transactions, including those that some or all of our stockholders might consider to be desirable.
Regulatory Restrictions on Dividends; Source of Strength. It is the policy of the Federal Reserve Board that bank holding companies should pay cash dividends on common stock only out of income available over the past year and only if prospective earnings retention is consistent with the organization’s expected future needs and financial condition. The policy provides that bank holding companies should not maintain a level of cash dividends that undermines the bank holding company’s ability to serve as a source of strength to its banking subsidiaries. The Dodd-Frank Act requires the regulatory agencies to issue regulations requiring that all bank and savings and loan holding companies serve as a source of financial and managerial strength to their subsidiary depository institutions by providing capital, liquidity and other support in times of financial stress; however, no such proposed regulations have yet been published.
Under Federal Reserve Board policy, a bank holding company is expected to act as a source of financial strength to each of its banking subsidiaries and commit resources to their support. Such support may be required at times when, absent this Federal Reserve Board policy, a holding company may not be inclined to provide it. As discussed herein, a bank holding company, in certain circumstances and subject to certain limitations, could be required to guarantee the capital plan of an undercapitalized banking subsidiary.
Scope of Permissible Activities. Under the Bank Holding Company Act, Hilltop and PCC generally may not acquire a direct or indirect interest in, or control of more than 5% of, the voting shares of any company that is not a bank or bank holding company. Additionally, the Bank Holding Company Act may prohibit Hilltop from engaging in activities other than those of banking, managing or controlling banks or furnishing services to, or performing services for, its subsidiaries, except that it may engage in, directly or indirectly, certain activities that the Federal Reserve Board has determined to be closely related to banking or managing and controlling banks as to be a proper incident thereto. In approving acquisitions or the addition of activities, the Federal Reserve Board considers, among other things, whether the acquisition or the additional activities can reasonably be expected to produce benefits to the public, such as greater convenience, increased competition, or gains in efficiency, that outweigh such possible adverse effects as undue concentration of resources, decreased or unfair competition, conflicts of interest or unsound banking practices.
Notwithstanding the foregoing, the Gramm-Leach-Bliley Act, effective March 11, 2000, eliminated the barriers to affiliations among banks, securities firms, insurance companies and other financial service providers and permits bank holding companies to become financial holding companies and thereby affiliate with securities firms and insurance companies and engage in other activities that are financial in nature. The Gramm-Leach-Bliley Act defines “financial in nature” to include: securities underwriting; dealing and market making; sponsoring mutual funds and investment
14
companies; insurance underwriting and agency; merchant banking activities; and activities that the Federal Reserve Board has determined to be closely related to banking. Prior to enactment of the Dodd-Frank Act, regulatory approval was not required for a financial holding company to acquire a company, other than a bank or savings association, engaged in activities that were financial in nature or incidental to activities that were financial in nature, as determined by the Federal Reserve Board.
Under the Gramm-Leach-Bliley Act, a bank holding company may become a financial holding company by filing a declaration with the Federal Reserve Board if each of its subsidiary banks is “well capitalized” under the Federal Deposit Insurance Corporation Improvement Act prompt corrective action provisions, is “well managed,” and has at least a “satisfactory” rating under the Community Reinvestment Act of 1977 (the “CRA”). The Dodd-Frank Act underscores the criteria for becoming a financial holding company by amending the Bank Holding Company Act to require that bank holding companies be “well capitalized” and “well managed” in order to become financial holding companies. Hilltop became a financial holding company on December 1, 2012.
Safe and Sound Banking Practices. Bank holding companies are not permitted to engage in unsafe and unsound banking practices. The Federal Reserve Board’s Regulation Y, for example, generally requires a holding company to give the Federal Reserve Board prior notice of any redemption or repurchase of its equity securities, if the consideration to be paid, together with the consideration paid for any repurchases or redemptions in the preceding year, is equal to 10% or more of the company’s consolidated net worth. In addition, bank holding companies are required to consult with the Federal Reserve Board prior to making any redemption or repurchase, even within the foregoing parameters. The Federal Reserve Board may oppose the transaction if it believes that the transaction would constitute an unsafe or unsound practice or would violate any law or regulation. Depending upon the circumstances, the Federal Reserve Board could take the position that paying a dividend would constitute an unsafe or unsound banking practice.
The Federal Reserve Board has broad authority to prohibit activities of bank holding companies and their nonbanking subsidiaries that represent unsafe and unsound banking practices or that constitute violations of laws or regulations, and can assess civil money penalties for certain activities conducted on a knowing or reckless basis, if those activities caused a substantial loss to a depository institution. The penalties can be as high as $2.4 million for each day the activity continues. In addition, the Dodd-Frank Act authorizes the Federal Reserve Board to require reports from and examine bank holding companies and their subsidiaries, and to regulate functionally regulated subsidiaries of bank holding companies.
Anti-tying Restrictions. Subject to various exceptions, bank holding companies and their affiliates are generally prohibited from tying the provision of certain services, such as extensions of credit, to certain other services offered by a bank holding company or its affiliates.
Capital Adequacy Requirements and BASEL III. Hilltop and PlainsCapital, which includes the Bank and PrimeLending, are subject to capital adequacy requirements under the comprehensive capital framework for U.S. banking organizations known as “Basel III”. Basel III, which reformed the existing frameworks under which U.S. banking organizations historically operated, became effective January 1, 2015 and was fully phased in as of January 1, 2019. Basel III was developed by the Basel Committee on Banking Supervision and adopted by the Federal Reserve Board, the Federal Deposit Insurance Corporation (“FDIC”), and the Office of the Comptroller of the Currency (the “OCC”). On July 27, 2023, the Federal Reserve, the FDIC, and the Office of the Comptroller issued a proposal, referred to as “Basel III Endgame,” that would result in significant changes to the U.S. regulatory capital rules for banking organizations with total consolidated assets of $100 billion or more. Since neither Hilltop, nor any of its banking organization subsidiaries, would surpass the $100 billion threshold, a discussion of such proposal is not included herein.
The federal banking agencies’ risk-based capital and leverage ratios are minimum supervisory ratios generally applicable to banking organizations that meet certain specified criteria, assuming that they have the highest regulatory rating. Banking organizations not meeting these criteria are expected to operate with capital positions well above the minimum ratios. The federal bank regulatory agencies may set capital requirements for a particular banking organization that are higher than the minimum ratios when circumstances warrant. Federal Reserve Board guidelines also provide that banking organizations experiencing internal growth or making acquisitions will be expected to maintain strong capital positions substantially above the minimum supervisory levels, without significant reliance on intangible assets.
15
Final rules published by the Federal Reserve Board, the FDIC, and the OCC implemented the Basel III regulatory capital reforms and changes required by the Dodd-Frank Act. Among other things, Basel III increased minimum capital requirements, introduced a new minimum leverage ratio and implemented a capital conservation buffer. The regulatory agencies carefully considered the potential impacts on all banking organizations, including community and regional banking organizations such as Hilltop and PlainsCapital, and sought to minimize the potential burden of these changes where consistent with applicable law and the agencies’ goals of establishing a robust and comprehensive capital framework. Under the guidelines in effect beginning January 1, 2015, a risk weight factor of 0% to 1250% is assigned to each category of assets based generally on the perceived credit risk of the asset class. The risk weights are then multiplied by the corresponding asset balances to determine a “risk-weighted” asset base.
Under Basel III, total capital consists of two tiers of capital, Tier 1 and Tier 2. Tier 1 capital consists of common equity Tier 1 capital and additional Tier 1 capital. Below is a list of certain significant components that comprise the tiers of capital for Hilltop and PlainsCapital under Basel III.
Common equity Tier 1 capital:
| ● | includes common stockholders’ equity (such as qualifying common stock and any related surplus, undivided profits, disclosed capital reserves that represent a segregation of undivided profits and foreign currency translation adjustments, excluding changes in other comprehensive income (loss) and treasury stock); |
| ● | includes certain minority interests in the equity capital accounts of consolidated subsidiaries; and |
| ● | excludes goodwill and various intangible assets. |
Additional Tier 1 capital:
| ● | includes certain qualifying minority interests not included in common equity Tier 1 capital; |
| ● | includes certain preferred stock and related surplus; |
| ● | includes certain subordinated debt; and |
| ● | excludes 50% of the insurance underwriting deduction. |
Tier 2 capital:
| ● | includes allowance for credit losses, up to a maximum of 1.25% of risk-weighted assets; |
| ● | includes minority interests not included in Tier 1 capital; and |
| ● | excludes 50% of the insurance underwriting deduction. |
The following table summarizes the Basel III requirements.
Item |
| Requirement |
|
Minimum common equity Tier 1 capital ratio |
| 4.5 | % |
Common equity Tier 1 capital conservation buffer |
| 2.5 | % |
Minimum common equity Tier 1 capital ratio plus capital conservation buffer |
| 7.0 | % |
Minimum Tier 1 capital ratio |
| 6.0 | % |
Minimum Tier 1 capital ratio plus capital conservation buffer |
| 8.5 | % |
Minimum total capital ratio |
| 8.0 | % |
Minimum total capital ratio plus capital conservation buffer |
| 10.5 | % |
In order to avoid limitations on capital distributions, including dividend payments, stock repurchases and certain discretionary bonus payments to executive officers, Basel III also implemented a capital conservation buffer, which requires a banking organization to hold a buffer above its minimum risk-based capital requirements. This buffer helps to ensure that banking organizations conserve capital when it is most needed, allowing them to better weather periods of economic stress. The buffer is measured relative to risk-weighted assets.
The rules also prohibit a banking organization from making distributions or discretionary bonus payments during any quarter if its eligible retained income is negative in that quarter and its capital conservation buffer ratio was less than
16
2.5% at the beginning of the quarter. A banking organization with a buffer greater than 2.5% would not be subject to limits on capital distributions or discretionary bonus payments; however, a banking organization with a buffer of less than 2.5% would be subject to increasingly stringent limitations as the buffer approaches zero. The eligible retained income of a banking organization is defined as its net income for the four calendar quarters preceding the current calendar quarter, based on the organization’s quarterly regulatory reports, net of any distributions and associated tax effects not already reflected in net income. When the rules were fully phased-in in 2019, the minimum capital requirements plus the capital conservation buffer should have exceeded the prompt corrective action well-capitalized thresholds.
During 2023, our eligible retained income was positive and our capital conservation buffer was greater than 2.5%, and therefore, we were not subject to limits on capital distributions or discretionary bonus payments. We anticipate similar results during 2024.
At December 31, 2023, Hilltop had a total capital to risk-weighted assets ratio of 22.34%, Tier 1 capital to risk-weighted assets ratio of 19.32% and a common equity Tier 1 capital to risk-weighted assets ratio of 19.32%. Hilltop’s actual capital amounts and ratios in accordance with Basel III exceeded the regulatory capital requirements including conservation buffer in effect at the end of the period.
At December 31, 2023, PlainsCapital had a total capital to risk-weighted assets ratio of 16.58%, Tier 1 capital to risk-weighted assets ratio of 15.44% and a common equity Tier 1 capital to risk-weighted assets ratio of 15.44%. Accordingly, PlainsCapital’s actual capital amounts and ratios in accordance with Basel III resulted in it being considered “well-capitalized” and exceeded the regulatory capital requirements including conservation buffer in effect at the end of the period.
Phase-in of Current Expected Credit Losses Accounting Standard. In June 2016, the Financial Accounting Standards Board issued an update to the accounting standards for credit losses that included the Current Expected Credit Losses (“CECL”) methodology, which replaces the existing incurred loss methodology for certain financial assets. CECL became effective January 1, 2020. In December 2018, the federal bank regulatory agencies approved a final rule modifying their regulatory capital rules and providing an option to phase-in, over a period of three years, the day-one regulatory capital effects resulting from the implementation of CECL. The final rule also revises the agencies’ other rules to reflect the update to the accounting standards. In March 2020, in connection with the economic uncertainties associated with the effects of the pandemic, the agencies’ issued an additional transition option that permitted banking institutions to mitigate the estimated cumulative regulatory capital effects from CECL over a five-year transitionary period through December 31, 2024. We elected to exercise this option for phase-in.
Volcker Rule. Provisions of the Volcker Rule and the final rules implementing the Volcker Rule restrict certain activities provided by the Company, including proprietary trading and sponsoring or investing in “covered funds,” which include many private equity and hedge funds. For purposes of the Volcker Rule, purchases or sales of financial instruments such as securities, derivatives, contracts of sale of commodities for future delivery or options on the foregoing held for 60 days or longer are presumed not to be held for short-term gain and therefore are not deemed to be proprietary trading. Exempted activities include, among others, the following: (i) underwriting; (ii) market making; (iii) risk mitigating hedging; (iv) trading in certain government securities; (v) employee compensation plans and (vi) transactions entered into on behalf of and for the account of clients as agent, broker, custodian, or in a trustee or fiduciary capacity.
On November 14, 2019, the federal banking agencies, among other agencies, published a separate final rule to provide greater clarity and certainty about the activities prohibited by the Volcker Rule and to improve supervision and implementation of the Volcker Rule based on the agencies’ experience implementing these provisions since 2013. Compliance with the final rule began January 1, 2021, however, banking entities were allowed to voluntarily comply with the final rule in whole or in part prior to the compliance date, subject to the agencies’ completion of necessary technological changes.
In July 2020, the federal banking agencies published a final rule to streamline and improve the covered funds provisions of the Volcker Rule by making the following changes: permitting the activities of qualifying foreign excluded funds; revising the exclusions from the definition of “covered fund” for foreign public funds, loan securitizations, public
17
welfare investments and small business investment companies; creating new exclusions from the definition of “covered fund” for credit funds, qualifying venture capital funds, family wealth management vehicles, and customer facilitation vehicles; permitting certain transactions that could otherwise be prohibited under affiliate transaction restrictions unique to the Volcker Rule; modifying the definition of “ownership interest”; and providing that certain investments made in parallel with a covered fund, as well as certain restricted profit interests held by an employee or director, need not be included in a banking entity’s calculation of its ownership interest in the covered fund.
While management continues to assess compliance with the Volcker Rule, we have reviewed our processes and procedures in regard to proprietary trading and covered funds activities and we believe we are currently complying with the provisions of the Volcker Rule. However, it remains uncertain how the scope of applicable restrictions and exceptions will be interpreted and administered by the relevant regulators. Absent further regulatory guidance, we are required to make certain assumptions as to the degree to which our activities, processes and procedures in these areas comply with the requirements of the Volcker Rule. If these assumptions are not accurate or if our implementation of compliance processes and procedures is not consistent with regulatory expectations, we may be required to make certain changes to our business activities, processes or procedures, which could further increase our compliance and regulatory risks and costs.
Acquisitions by Bank Holding Companies. The Bank Holding Company Act requires every bank holding company to obtain the prior approval of the Federal Reserve Board before it may acquire all or substantially all of the assets of any bank, or ownership or control of any voting shares of any bank, if after such acquisition it would own or control, directly or indirectly, more than 5% of the voting shares of such bank. In approving bank acquisitions by bank holding companies, the Federal Reserve Board is required to consider, among other things, the financial and managerial resources and future prospects of the bank holding company and the banks concerned, the convenience and needs of the communities to be served, and various competitive factors. In addition, the Dodd-Frank Act requires the Federal Reserve Board to consider “the risk to the stability of the U.S. banking or financial system” when evaluating acquisitions of banks and nonbanks under the Bank Holding Company Act. With respect to interstate acquisitions, the Dodd-Frank Act amends the Bank Holding Company Act by raising the standard by which interstate bank acquisitions are permitted from a standard that the acquiring bank holding company be “adequately capitalized” and “adequately managed” to the higher standard of being “well capitalized” and “well managed”.
Control Acquisitions. The Change in Bank Control Act prohibits a person or group of persons from acquiring “control” of a bank holding company unless the Federal Reserve Board has been notified and has not objected to the transaction. As a general matter, an investor is deemed to control a depository institution or other company if the investor owns or controls 25% or more of any class of voting stock or 33% or more of the total equity of such other company, and in certain other circumstances, an investor may be presumed to control a depository institution or other company if the investor owns or controls less than 25% or more of any class of voting stock.
Banking
The Bank is subject to various requirements and restrictions under the laws of the United States, and to regulation, supervision and regular examination by the Texas Department of Banking. The Bank, as a state member bank, is also subject to regulation and examination by the Federal Reserve Board. The Bank is subject to the supervisory and enforcement authority by the CFPB with respect to federal consumer protection laws, including laws relating to fair lending and the prohibition of unfair, deceptive or abusive acts or practices in connection with the offer, sale or provision of consumer financial products and services.
The Bank is also an insured depository institution and, therefore, subject to regulation by the FDIC, although the Federal Reserve Board is the Bank’s primary federal regulator. The Federal Reserve Board, the Texas Department of Banking, the CFPB and the FDIC have the power to enforce compliance with applicable banking statutes and regulations. Such requirements and restrictions include requirements to maintain reserves against deposits, restrictions on the nature and amount of loans that may be made and the interest that may be charged thereon and restrictions relating to investments and other activities of the Bank.
18
Restrictions on Transactions with Affiliates. Transactions between the Bank and its banking and nonbanking affiliates, including Hilltop, PrimeLending, and PCC, are subject to Sections 23A and 23B of the Federal Reserve Act, as implemented by the Federal Reserve Board’s Regulations W.
In general, Section 23A imposes limits on the amount of such transactions, and also requires certain levels of collateral for loans to affiliated parties. It also limits the amount of advances to third parties that are collateralized by the securities or obligations of Hilltop or its subsidiaries. Among other changes, the Dodd-Frank Act expanded the definition of “covered transactions” and clarified the amount of time that the collateral requirements must be satisfied for covered transactions, and amended the definition of “affiliate” in Section 23A to include “any investment fund with respect to which a member bank or an affiliate thereof is an investment adviser.”
Affiliate transactions are also subject to Section 23B of the Federal Reserve Act, which generally requires that certain transactions between the Bank and its affiliates be on terms substantially the same, or at least as favorable to the Bank, as those prevailing at the time for comparable transactions with or involving other nonaffiliated persons.
Loans to Insiders. The restrictions on loans to directors, executive officers, principal stockholders and their related interests (collectively referred to herein as “insiders”) contained in the Federal Reserve Act and Regulation O apply to all insured institutions and their subsidiaries and holding companies. These restrictions include conditions that must be met before insider loans can be made, limits on loans to an individual insider and an aggregate limitation on all loans to insiders and their related interests. These loans cannot exceed the institution’s total unimpaired capital and surplus, and the Federal Reserve Board may determine that a lesser amount is appropriate. Insiders are subject to enforcement actions for knowingly accepting loans in violation of applicable restrictions. The Dodd-Frank Act amended the statutes placing limitations on loans to insiders by including credit exposures to the person arising from a derivatives transaction, repurchase agreement, reverse repurchase agreement, securities lending transaction, or securities borrowing transaction between the member bank and the person within the definition of an extension of credit.
Restrictions on Distribution of Subsidiary Bank Dividends and Assets. Dividends paid by the Bank have provided a substantial part of PCC’s operating funds and for the foreseeable future it is anticipated that dividends paid by the Bank to PCC will continue to be PCC’s and Hilltop’s principal source of operating funds. Capital adequacy requirements serve to limit the amount of dividends that may be paid by the Bank. Pursuant to the Texas Finance Code, a Texas banking association may not pay a dividend that would reduce its outstanding capital and surplus unless it obtains the prior approval of the Texas Banking Commissioner. Additionally, the FDIC and the Federal Reserve Board have the authority to prohibit Texas state banks from paying a dividend when they determine the dividend would be an unsafe or unsound banking practice. As a member of the Federal Reserve System, the Bank must also comply with the dividend restrictions with which a national bank would be required to comply. Those provisions are generally similar to those imposed by the state of Texas. Among other things, the federal restrictions require that if losses have at any time been sustained by a bank equal to or exceeding its undivided profits then on hand, no dividend may be paid.
In the event of a liquidation or other resolution of an insured depository institution, the claims of depositors and other general or subordinated creditors are entitled to a priority of payment over the claims of holders of any obligation of the institution to its stockholders, including any depository institution holding company (such as PCC and Hilltop) or any stockholder or creditor thereof.
Branching. The establishment of a bank branch must be approved by the Texas Department of Banking and the Federal Reserve Board, which consider a number of factors, including financial history, capital adequacy, earnings prospects, character of management, needs of the community and consistency with corporate powers. The regulators will also consider the applicant’s CRA record. Under the Dodd-Frank Act, de novo interstate branching by banks is permitted if, under the laws of the state where the branch is to be located, a state bank chartered in that state would be permitted to establish a branch.
Prompt Corrective Action. The Federal Deposit Insurance Corporation Improvement Act of 1991 (“FDICIA”) establishes a system of prompt corrective action to resolve the problems of undercapitalized financial institutions. Under this system, the federal banking regulators have established five capital categories (“well capitalized,” “adequately capitalized,” “undercapitalized,” “significantly undercapitalized” and “critically undercapitalized”) in which all
19
institutions are placed. Federal banking regulators are required to take various mandatory supervisory actions and are authorized to take other discretionary actions with respect to institutions in the three undercapitalized categories. The severity of the action depends upon the capital category in which the institution is placed. Generally, subject to a narrow exception, the banking regulator must appoint a receiver or conservator for an institution that is critically undercapitalized. The federal banking agencies have specified by regulation the relevant capital level for each category.
An institution that is categorized as “undercapitalized,” “significantly undercapitalized” or “critically undercapitalized” is required to submit an acceptable capital restoration plan to its appropriate federal banking agency. A bank holding company must guarantee that a subsidiary depository institution meets its capital restoration plan, subject to various limitations. The controlling holding company’s obligation to fund a capital restoration plan is limited to the lesser of 5% of an undercapitalized subsidiary’s assets at the time it became undercapitalized or the amount required to meet regulatory capital requirements. An undercapitalized institution is also generally prohibited from increasing its average total assets, making acquisitions, establishing any branches or engaging in any new line of business, except under an accepted capital restoration plan or with FDIC approval. The regulations also establish procedures for downgrading an institution to a lower capital category based on supervisory factors other than capital. PlainsCapital was classified as “well capitalized” at December 31, 2023.
Pursuant to FDICIA, an “undercapitalized” bank is prohibited from increasing its assets, engaging in a new line of business, acquiring any interest in any company or insured depository institution, or opening or acquiring a new branch office, except under certain circumstances, including the acceptance by the federal banking regulators of a capital restoration plan for the Bank.
FDIC Insurance Assessments. The FDIC has adopted a risk-based assessment system for insured depository institutions that takes into account the risks attributable to different categories and concentrations of assets and liabilities. The FDIC establishes an initial base deposit insurance assessment for banks with $10 billion or more in assets using a scorecard that is generally based on a supervisory evaluation that the institution’s primary federal regulator provides to the FDIC and information that the FDIC determines to be relevant to the institution’s financial condition and the risk posed to the deposit insurance fund. The FDIC may terminate its insurance of deposits if it finds that the institution has engaged in unsafe and unsound practices, is in an unsafe or unsound condition to continue operations, or has violated any applicable law, regulation, rule, order or condition imposed by the FDIC.
The FDIC is required to maintain a designated reserve ratio of the deposit insurance fund (“DIF”) to insured deposits in the United States. The Dodd-Frank Act required the FDIC to assess insured depository institutions to achieve a DIF ratio of at least 1.35% by September 30, 2020, which was accomplished on November 28, 2018. However, extraordinary growth in insured deposits in 2020 caused the DIF ratio to fall below 1.35%. Accordingly, on October 24, 2022, the FDIC published a final rule to increase the initial base deposit insurance assessment rate schedules by 2 basis points beginning the first quarterly assessment period of 2023 (i.e., January 1 through March 31, 2023). The increase in assessment rate schedules increased the likelihood that the DIF ratio will reach the statutory minimum of 1.35% by the statutory deadline of September 30, 2028. Accruals for DIF assessments were $7.0 million during 2023.
As a result of the bank failures during early 2023 and in an effort to strengthen public confidence in the banking system and protect depositors, regulators announced that any losses to the DIF to support uninsured depositors will be recovered by a special assessment on banking organizations, as required by law. On November 16, 2023, the FDIC adopted a final rule to implement this special assessment based on a banking organization’s estimated uninsured deposits as of December 31, 2022, excluding the first $5 billion in estimated uninsured deposits. Based on our calculation, we do not expect the Bank to be impacted by this special assessment.
The Dodd-Frank Act permanently increased the standard maximum deposit insurance amount to $250,000. The FDIC insurance coverage limit applies per depositor, per insured depository institution for each account ownership category.
Community Reinvestment Act. The CRA requires, in connection with examinations of financial institutions, that federal banking regulators (in the Bank’s case, the Federal Reserve Board) evaluate the record of each financial institution in meeting the credit needs of its local community, including low and moderate-income neighborhoods. These facts are also considered in evaluating mergers, acquisitions and applications to open a branch or facility. Failure to adequately
20
meet these criteria could impose additional requirements and limitations on the Bank. Additionally, the Bank must publicly disclose the terms of various CRA-related agreements. On May 5, 2022, the Federal banking agencies released a notice of proposed rulemaking to “strengthen and modernize” the CRA regulations by updating how CRA activities qualify for consideration, where CRA activities are considered, and how CRA activities are evaluated. The proposed rulemaking was finalized on October 24, 2023, and will take effect on April 1, 2024, with staggered compliance dates of January 1, 2026 and January 1, 2027.
The Bank received a “satisfactory” CRA rating in connection with its most recent CRA performance evaluation. A CRA rating of less than “satisfactory” adversely affects a bank’s ability to establish new branches and impairs a bank’s ability to commence new activities that are “financial in nature” or acquire companies engaged in these activities. See “Risk Factors — We are subject to extensive supervision and regulation that could restrict our activities and impose financial requirements or limitations on the conduct of our business and limit our ability to generate income.”
Privacy. Under the Gramm-Leach-Bliley Act, financial institutions are required to disclose their policies for collecting and protecting confidential information. Customers generally may prevent financial institutions from sharing nonpublic personal financial information with nonaffiliated third parties except under narrow circumstances, such as the processing of transactions requested by the consumer or when the financial institution is jointly sponsoring a product or service with a nonaffiliated third-party. Additionally, financial institutions generally may not disclose consumer account numbers to any nonaffiliated third-party for use in telemarketing, direct mail marketing or other marketing to consumers. The Bank and all of its subsidiaries have established policies and procedures to comply with the privacy provisions of the Gramm-Leach-Bliley Act.
Federal Laws Applicable to Credit Transactions. The loan operations of the Bank are also subject to federal laws and implementing regulations applicable to credit transactions, such as the Truth-In-Lending Act, the Home Mortgage Disclosure Act of 1975, the Equal Credit Opportunity Act, the Fair Credit Reporting Act of 1978, the Fair Debt Collection Practices Act, the Service Members Civil Relief Act, the Dodd-Frank Act and rules and regulations of the various federal agencies charged with the responsibility of implementing these federal laws. Interest and other charges collected or contracted for by the Bank are subject to state usury laws and federal laws concerning interest rates.
Federal Laws Applicable to Deposit Operations. The deposit operations of the Bank are subject to the Right to Financial Privacy Act, the Truth in Savings Act and the Electronic Funds Transfer Act and Regulation E issued by the CFPB to implement that act. The Dodd-Frank Act amends the Electronic Funds Transfer Act to, among other things, give the Federal Reserve Board the authority to establish rules regarding interchange fees charged for electronic debit transactions by payment card issuers having assets over $10 billion and to enforce a new statutory requirement that such fees be reasonable and proportional to the actual cost of a transaction to the issuer.
Capital Requirements. The Federal Reserve Board and the Texas Department of Banking monitor the capital adequacy of PlainsCapital by using a combination of risk-based guidelines and leverage ratios. The agencies consider PlainsCapital’s capital levels when taking action on various types of applications and when conducting supervisory activities related to the safety and soundness of individual banks and the banking system.
On January 1, 2019, PlainsCapital fully transitioned to the final rules that substantially amended the regulatory risk-based capital rules to implement the Basel III regulatory capital reforms. For additional discussion of Basel III, see the section entitled “Government Supervision and Regulation — Corporate — Capital Adequacy Requirements and Basel III” earlier in this Item 1.
On December 13, 2019, the Federal Reserve Board, the FDIC and the OCC published a final rule modifying the treatment of high volatility commercial real estate (“HVCRE”) exposures as required by EGRRCPA. The final rule clarified certain defined terms in the HVCRE exposure definition in a manner generally consistent with the call report instructions as well as the treatment of credit facilities that finance one- to four-family residential properties and the development of land. The final rule became effective on April 1, 2020.
The FDIC Improvement Act. FDICIA made a number of reforms addressing the safety and soundness of the deposit insurance system, supervision of domestic and foreign depository institutions, and improvement of accounting standards.
21
This statute also limited deposit insurance coverage, implemented changes in consumer protection laws and provided for least-cost resolution and prompt regulatory action with regard to troubled institutions.
FDICIA requires every bank with total assets in excess of $500 million to have an annual independent audit made of the Bank’s financial statements by a certified public accountant to verify that the financial statements of the Bank are presented in accordance with GAAP and comply with such other disclosure requirements as prescribed by the FDIC.
Brokered Deposits. Under FDICIA, banks may be restricted in their ability to accept brokered deposits, depending on their capital classification. “Well capitalized” banks are permitted to accept brokered deposits, but banks that are not “well capitalized” are not permitted to accept such deposits. The FDIC may, on a case-by-case basis, permit banks that are “adequately capitalized” to accept brokered deposits if the FDIC determines that acceptance of such deposits would not constitute an unsafe or unsound banking practice with respect to such bank. Pursuant to a provision in EGRRCPA, the FDIC published a final rule on February 4, 2019 excepting a capped amount of reciprocal deposits from being considered as brokered deposits for certain insured depository institutions. On December 15, 2020, the FDIC also approved a final rule intended to modernize the FDIC’s framework for regulating brokered deposits and ensure the classification of a deposit appropriately reflects changes in the banking landscape. The final rule is also intended to modify the interest rate restrictions applicable to certain depository institutions and clarify the application of the brokered deposit requirements to non-maturity deposits. The final rule became effective on April 1, 2021, but full compliance was not required during a transitionary period ending January 1, 2022. Effective January 1, 2022, we continued to treat deposits swept to the Bank from the broker-dealer segment as non-brokered with the cost of these sweep deposits being based on a current market rate of interest rather than a per account fee. At December 31, 2023, PlainsCapital was “well capitalized” and therefore not subject to any limitations with respect to its brokered deposits.
Check Clearing for the 21st Century Act. The Check Clearing for the 21st Century Act gives “substitute checks,” such as a digital image of a check and copies made from that image, the same legal standing as the original paper check.
Federal Home Loan Bank System. The Federal Home Loan Bank (“FHLB”) system, of which the Bank is a member, consists of regional FHLBs governed and regulated by the Federal Housing Finance Board. The FHLBs serve as reserve or credit facilities for member institutions within their assigned regions. The reserves are funded primarily from proceeds derived from the sale of consolidated obligations of the FHLB system. The FHLBs make loans (i.e., advances) to members in accordance with policies and procedures established by the FHLB and the boards of directors of each regional FHLB.
As a system member, according to currently existing policies and procedures, the Bank is entitled to borrow from the FHLB of its respective region and is required to own a certain amount of capital stock in the FHLB. The Bank is in compliance with the stock ownership rules with respect to such advances, commitments and letters of credit and home mortgage loans and similar obligations. All loans, advances and other extensions of credit made by the FHLB to the Bank are secured by a portion of the respective mortgage loan portfolio, certain other investments and the capital stock of the FHLB held by the Bank.
Anti-terrorism and Money Laundering Legislation. The Bank is subject to the USA PATRIOT Act, the Bank Secrecy Act and rules and regulations of FinCEN and the Office of Foreign Assets Control. These statutes and related rules and regulations impose requirements and limitations on specific financial transactions and account relationships intended to guard against money laundering and terrorism financing. The Bank has established a customer identification program pursuant to Section 326 of the USA PATRIOT Act and the Bank Secrecy Act, including obtaining beneficial ownership information on new legal entity customers and otherwise has implemented policies and procedures intended to comply with the foregoing rules until such time as FinCEN adopts final regulations implementing the Corporate Transparency Act, which is part of the AML 2020 Act. FinCEN issued a final rule, effective on January 1, 2024, imposing certain reporting requirements of beneficial ownership of certain business entities other than those entities not meeting, or excluded from, the definition of a “reporting company.”
Incentive Compensation Guidance. On June 21, 2010, the Federal Reserve Board, the Office of the Comptroller of the Currency, the Office of Thrift Supervision and the FDIC jointly issued comprehensive final guidance on incentive compensation policies (the “Incentive Compensation Guidance”) intended to ensure that the incentive compensation
22
policies of banking organizations do not undermine the safety and soundness of such organizations by encouraging excessive risk-taking. The Incentive Compensation Guidance sets expectations for banking organizations concerning their incentive compensation arrangements and related risk-management, control and governance processes. The Incentive Compensation Guidance, which covers all employees that have the ability to materially affect the risk profile of an organization, either individually or as part of a group, is based upon three primary principles: (i) balanced risk-taking incentives, (ii) compatibility with effective controls and risk management, and (iii) strong corporate governance. Any deficiencies in compensation practices that are identified may be incorporated into the organization’s supervisory ratings, which can affect its ability to make acquisitions or perform other actions. In addition, under the Incentive Compensation Guidance, a banking organization’s federal regulator may initiate enforcement action if the organization’s incentive compensation arrangements pose a risk to the safety and soundness of the organization.
Broker-Dealer
The Hilltop Broker-Dealers are broker-dealers registered with the SEC, FINRA, all 50 U.S. states and the District of Columbia. Hilltop Securities is a member of various securities exchanges and is also registered in Puerto Rico and the U.S. Virgin Islands. Much of the regulation of broker-dealers, however, has been delegated to self-regulatory organizations, principally FINRA, the Municipal Securities Rulemaking Board and national securities exchanges. These self-regulatory organizations adopt rules (which are subject to approval by the SEC) for governing its members and the industry. Broker-dealers are also subject to federal securities laws and SEC rules, as well as the laws and rules of the states in which a broker-dealer conducts business. While the SEC, the states, and the exchanges may conduct regulatory examinations, the Hilltop Broker-Dealers are members of, and are primarily subject to regulation, supervision and regular examination by FINRA.
The regulations to which broker-dealers are subject cover all aspects of the securities business, including, but not limited to, sales and trade practices, net capital requirements, record keeping and reporting procedures, relationships and conflicts with customers, the handling of cash and margin accounts, experience and training requirements for certain employees, the conduct of investment banking and research activities and the conduct of registered persons, directors, officers and employees. Broker-dealers are also subject to the privacy and anti-money laundering laws and regulations discussed herein. Additional legislation, changes in rules promulgated by the SEC, securities exchanges, self-regulatory organizations or states or changes in the interpretation or enforcement of existing laws and rules often directly affect the method of operation and profitability of broker-dealers. The SEC, FINRA, securities exchanges, self-regulatory organizations and states may conduct administrative and enforcement proceedings that can result in censure, fine, profit disgorgement, monetary penalties, suspension, revocation of registration or expulsion of broker-dealers, their registered persons, officers or employees. The principal purpose of regulation and discipline of broker-dealers is the protection of customers and the securities markets rather than protection of creditors and stockholders of broker-dealers.
Limitation on Businesses. The businesses that the Hilltop Broker-Dealers may conduct are limited by its agreements with, and its oversight by, FINRA, other regulatory authorities (including self-regulatory organizations) and federal and state law. Participation in new business lines, including trading of new products or participation on new exchanges or in new countries often requires governmental, FINRA and/or exchange approvals, which may take significant time and resources. In addition, the Hilltop Broker-Dealers are operating subsidiaries of Hilltop, which means their activities are further limited by those that are permissible for financial holding companies and subsidiaries of financial holding companies, and as a result, the Hilltop Broker-Dealers and Hilltop may be prevented from entering new businesses that may be profitable in a timely manner, if at all.
Net Capital Requirements. The SEC, FINRA and various other regulatory authorities have stringent rules and regulations with respect to the maintenance of specific levels of net capital by regulated entities. Rule 15c3-1 of the Exchange Act (the “Net Capital Rule”) requires that a broker-dealer maintain minimum net capital. Generally, a broker-dealer’s net capital is net worth plus qualified subordinated debt less deductions for non-allowable (or non-liquid) assets and other adjustments and operational charges. At December 31, 2023, the Hilltop Broker-Dealers were in compliance with applicable net capital requirements.
The SEC, CFTC, FINRA and other regulatory organizations impose rules that require notification when net capital falls below certain predefined thresholds. These rules also dictate the ratio of debt-to-equity in the regulatory capital
23
composition of a broker-dealer, and constrain the ability of a broker-dealer to expand its business under certain circumstances. If a broker-dealer fails to maintain the required net capital, it may be subject to censure, fine, monetary penalties and other regulatory sanctions, including suspension, revocation of registration or expulsion by the SEC or applicable regulatory authorities, and suspension, revocation or expulsion by these regulators could ultimately lead to the broker-dealer’s liquidation. Additionally, the Net Capital Rule and certain FINRA rules impose requirements that may have the effect of prohibiting or limiting a broker-dealer from distributing or withdrawing capital and requiring prior notice to, and/or approval from, the SEC and FINRA for certain capital withdrawals.
Compliance with the net capital requirements may limit our operations and require a greater use of capital. Such rules require that a certain percentage of our assets be maintained in relatively liquid form and therefore act to restrict our ability to withdraw capital from our broker-dealer entities, which in turn may limit our ability to pay dividends, repay debt or redeem or purchase shares of our outstanding common stock. Any change in such rules or the imposition of new rules affecting the scope, coverage, calculation or amount of capital requirements, or a significant operating loss or any unusually large charge against capital, could adversely affect our ability to pay dividends, repay debt, meet our debt covenant requirements or to expand or maintain our operations. In addition, such rules may require us to make substantial capital contributions into one or more of the Hilltop Broker-Dealers in order for such subsidiaries to comply with such rules, either in the form of cash or subordinated loans made in accordance with the requirements of all applicable net capital rules.
Customer Protection Rule. The Hilltop Broker-Dealers that hold customers’ funds and securities are subject to the SEC’s customer protection rule (Rule 15c3-3 under the Exchange Act), which generally provides that such broker-dealers maintain physical possession or control of all fully-paid securities and excess margin securities carried for the account of customers and maintain certain reserves of cash or qualified securities.
Securities Investor Protection Corporation (“SIPC”). The Hilltop Broker-Dealers are subject to the Securities Investor Protection Act and belong to SIPC, whose primary function is to provide financial protection for the customers of failing brokerage firms. SIPC provides protection for customers up to $500,000, of which a maximum of $250,000 may be in cash.
Anti-Money Laundering. The Hilltop Broker-Dealers must also comply with anti-money laundering laws such as the USA PATRIOT Act and other related laws, rules and regulations discussed herein, including FINRA AML requirements, designed to fight international money laundering and to block terrorist access to the U.S. financial system. We are required to have systems and procedures to ensure compliance with such laws and regulations.
CFTC Oversight. Hilltop Securities and Momentum Independent Network are registered as introducing brokers with the CFTC and NFA. The CFTC also has net capital regulations (CFTC Rule 1.17) that must be satisfied. Our futures business is also regulated by the NFA, a registered futures association. Violation of the rules of the CFTC, the NFA or the commodity exchanges could result in remedial actions including fines, registration restrictions or terminations, trading prohibitions or revocations of commodity exchange memberships.
Investment Advisory Activity. Hilltop Securities Asset Management, LLC, Hilltop Securities and Momentum Independent Network are registered with, and subject to oversight and inspection by, the SEC as investment advisers under the Investment Advisers Act of 1940, as amended. The investment advisory business of our subsidiaries is subject to significant federal regulation, including with respect to wrap fee programs, the management of client accounts, the safeguarding of client assets, client fees and disclosures, transactions among affiliates and recordkeeping and reporting procedures. Legislation and changes in regulations promulgated by the SEC or changes in the interpretation or enforcement of existing laws and regulations often directly affect the method of operation and profitability of investment advisers. The SEC may conduct administrative and enforcement proceedings that can result in censure, fine, suspension, revocation of registration or expulsion of the investment advisory business of our subsidiaries, our officers or employees.
Volcker Rule. Provisions of the Volcker Rule and the final rules implementing the Volcker Rule also restrict certain activities provided by the Hilltop Broker-Dealers, including proprietary trading and sponsoring or investing in “covered funds.”
24
Regulation Best Interest (“Regulation BI”) and Form CRS Relationship Summary (“Form CRS”). Beginning June 2020, the “best interest” standard requires a broker-dealer to make recommendations of securities transactions, or investment strategies involving securities, to a retail customer without putting its financial interests ahead of the interests of a retail customer. Form CRS requires SEC-registered investment advisers (“RIAs”) and broker-dealers to deliver to retail investors a succinct, plain English summary about the relationship and services provided by the firm and the required standard of conduct associated with the relationship and services. Regulation BI heightens the standard of care for broker-dealers when making investment recommendations and imposes disclosure, conduct and policy and procedural obligations that could impact the compensation our wealth management line of business and its representatives receive for selling certain types of products, particularly those that offer different compensation across different share classes (such as mutual funds and variable annuities). In addition, Regulation BI prohibits a broker-dealer and its associated persons from using the term “adviser” or “advisor” if the broker-dealer is not an RIA or the associated person is not a supervised person of an RIA.
Changing Regulatory Environment. The regulatory environment in which the Hilltop Broker-Dealers operate is subject to frequent change. Our business, financial condition and operating results may be adversely affected as a result of new or revised legislation or regulations imposed by the U.S. Congress, the SEC, FINRA or other U.S. and state governmental and regulatory authorities. The business, financial condition and operating results of the Hilltop Broker-Dealers also may be adversely affected by changes in the interpretation and enforcement of existing laws and rules by these governmental and regulatory authorities. In the current era of heightened regulation of financial institutions, the Hilltop Broker-Dealers can expect to incur increasing compliance costs, along with the industry as a whole.
Mortgage Origination
PrimeLending and the Bank are subject to the rules and regulations of the CFPB, FHA, VA, FNMA, FHLMC and GNMA with respect to originating, processing, selling and servicing mortgage loans and the issuance and sale of mortgage-backed securities. Those rules and regulations, among other things, prohibit discrimination and establish underwriting guidelines which include provisions for inspections and appraisals, require credit reports on prospective borrowers and fix maximum loan amounts, and, with respect to VA loans, fix maximum interest rates. Mortgage origination activities are subject to, among others, the Equal Credit Opportunity Act, Fair Housing Act, Federal Truth-in-Lending Act, Secure and Fair Enforcement of Mortgage Licensing Act, Home Mortgage Disclosure Act, Fair Credit Reporting Act and the Real Estate Settlement Procedures Act and the regulations promulgated thereunder which, among other things, prohibit discrimination and require the disclosure of certain basic information to borrowers concerning credit terms and settlement costs. PrimeLending and the Bank are also subject to regulation by the Texas Department of Banking with respect to, among other things, the establishment of maximum origination fees on certain types of mortgage loan products. PrimeLending and the Bank are also subject to the provisions of the Dodd-Frank Act. Among other things, the Dodd-Frank Act established the CFPB and provides mortgage reform provisions regarding a customer’s ability to repay, restrictions on variable-rate lending, loan officers’ compensation, risk retention, and new disclosure requirements. The Dodd-Frank Act also clarifies that applicable state laws, rules and regulations related to the origination, processing, selling and servicing of mortgage loans continue to apply to PrimeLending.
The final rules concerning mortgage origination and servicing address the following topics:
Ability to Repay and Qualified Mortgage Standards Under the Truth in Lending Act (Regulation Z). This final rule requires that for residential mortgages, creditors must make a reasonable and good faith determination based on verified and documented information that the consumer has a reasonable ability to repay the loan according to its terms. The final rule also establishes a presumption of compliance with the ability to repay determination for a certain category of mortgages called “qualified mortgages” meeting a series of detailed requirements. The final rule also provides a rebuttable presumption for higher-priced mortgage loans. On December 29, 2020, the CFPB published a final rule creating a new category of “qualified mortgage,” called a seasoned qualified mortgage, for first lien, fixed rate covered loans that meet certain performance requirements, are held in portfolio by the originating creditor or first purchaser for a 36-month period, comply with general restrictions on product features and points and fees, and meet certain underwriting requirements. As the result of the pandemic, the CFPB approved a final rule on April 27, 2021 that delayed the mandatory compliance date for the General Qualified Mortgage final rule from July 1, 2021 to October 1, 2022 to ensure flexibility for consumers affected by the pandemic.
25
High-Cost Mortgage and Homeownership Counseling Amendments to the Truth in Lending Act (Regulation Z). This final rule strengthens consumer protections for high-cost mortgages (generally bans balloon payments and prepayment penalties, subject to exceptions and bans or limits certain fees and practices) and requires consumers to receive information about homeownership counseling prior to taking out a high-cost mortgage.
Appraisals for High-Risk Mortgages (Regulation Z). The final rule permits a creditor to extend a higher-priced (subprime) mortgage loan (“HPML”) only if the following conditions are met (subject to exceptions): (i) the creditor obtains a written appraisal; (ii) the appraisal is performed by a certified or licensed appraiser; and (iii) the appraiser conducts a physical property visit of the interior of the property. The rule also requires that during the application process, the applicant receives a notice regarding the appraisal process and their right to receive a free copy of the appraisal.
Disclosure and Delivery Requirement for Copies of Appraisals and Other Written Valuations Under the Equal Credit Opportunity Act (Regulation B). This final rule requires a creditor to provide a free copy of appraisal or valuation reports prepared in connection with any closed-end loan secured by a first lien on a dwelling. The final rule requires notice to applicants of the right to receive copies of any appraisal or valuation reports and creditors must send copies of the reports whether or not the loan transaction is consummated. Creditors must provide the copies of the appraisal or evaluation reports for free, however, the creditors may charge reasonable fees for the cost of the appraisal or valuation unless applicable law provides otherwise.
Escrow Requirements under the Truth in Lending Act (Regulation Z). This final rule requires a minimum duration of five years for an escrow account on certain higher-priced mortgage loans, subject to certain exemptions for loans made by certain creditors that operate predominantly in rural or underserved areas, as long as certain other criteria are met.
Mortgage Servicing Rules Under the Real Estate Settlement Procedures Act (Regulation X) and the Truth in Lending Act Regulation Z). Two final rules under the Truth in Lending Act and the Real Estate Settlement Procedures Act, protect consumers from detrimental actions by mortgage servicers and to provide consumers with better tools and information when dealing with mortgage servicers. The final rules include a number of exemptions and other adjustments for small servicers, defined as servicers that service 5,000 or fewer mortgage loans and service only mortgage loans that they or an affiliate originated or own.
Loan Originator Compensation Under the Truth in Lending Act (Regulation Z). This final rule revises and clarifies existing regulations and commentary on loan originator compensation. The rule also prohibits, among other things: (i) certain arbitration agreements; (ii) financing certain credit insurance in connection with a mortgage loan; (iii) compensation based on a term of a transaction or a proxy for a term of a transaction; and (iv) dual compensation from a consumer and another person in connection with the transaction. The final rule also imposes a duty on individual loan officers, mortgage brokers and creditors to be “qualified” and, when applicable, registered or licensed to the extent required under applicable State and Federal law.
Risk Retention (Dodd Frank Act). This final rule requires that at least one sponsor of each securitization retains at least 5% of the credit risk of the assets collateralizing asset-backed securities. Sponsors are prohibited from hedging or transferring this credit risk, and the rule applies in both public and private transactions. Securitizations backed by “qualified residential mortgages” or “servicing assets” are exempt from the rule, and the definition of “qualified residential mortgages” is subject to review of the joint regulators every five years.
Any additional regulatory requirements affecting our mortgage origination operations will result in increased compliance costs and may impact revenue.
26
Item 1A. Risk Factors.
The following discussion sets forth what management currently believes could be the material regulatory, market and economic, liquidity, legal and business and operational risks and uncertainties that could impact our business, results of operations and financial condition. Other risks and uncertainties, including those not currently known to us, could also negatively impact our business, results of operations and financial condition. Thus, the following should not be considered a complete discussion of all of the risks and uncertainties we may face, and the order of their respective significance may change. Below is a summary of our risk factors with a more detailed discussion following.
| ● | Our allowances for credit losses for loans and debt securities may prove inadequate or we may be negatively affected by credit risk exposures. Also, future additions to our allowance for credit losses will reduce our future earnings. |
| ● | Adverse developments affecting the financial services industry, such as bank failures or concerns involving liquidity, may have a material effect on the Company’s operations. |
| ● | Our operational systems and networks have been, and will continue to be, subject to an increasing risk of continually evolving cybersecurity or other technological risks, which could result in a loss of customer business, financial liability, regulatory penalties, damage to our reputation or the disclosure of confidential information. |
| ● | Our banking segment is subject to risk arising from conditions in the commercial real estate market and may be adversely affected by weaknesses in the commercial real estate market. |
| ● | Our business and results of operations may be adversely affected by unpredictable economic, market and business conditions. |
| ● | Our business is subject to interest rate risk, and fluctuations in interest rates may adversely affect our earnings, capital levels and overall results. |
| ● | Our mortgage origination business is subject to fluctuations based upon seasonal and other factors and, as a result, our results of operations for any given quarter may not be indicative of the results that may be achieved for the full fiscal year. |
| ● | The financial services industry is characterized by rapid technological change, and if we fail to keep pace, our business may suffer. |
| ● | We are heavily reliant on technology, and a failure to effectively implement new technological solutions or enhancements to existing systems or platforms could adversely affect our business operations and the financial results of our operations. |
| ● | Our geographic concentration may magnify the adverse effects and consequences of any regional or local economic downturn. |
| ● | An adverse change in real estate market values may result in losses in our banking segment and otherwise adversely affect our profitability. |
| ● | The economic impact of the pandemic has adversely affected, and may continue to adversely affect, our business, financial condition, liquidity and results of operations. |
| ● | Our risk management processes may not fully identify and mitigate exposure to the various risks that we face, including interest rate, credit, liquidity and market risk. |
| ● | Our hedging strategies may not be successful in mitigating our exposure to interest rate risk. |
| ● | Our bank lending, margin lending, stock lending, securities trading and execution and mortgage purchase businesses are all subject to credit risk. |
| ● | We depend on our computer and communications systems and an interruption in service would negatively affect our business. |
27
| ● | Climate change could adversely affect our business and performance, including indirectly through impacts on our customers. |
| ● | We are heavily dependent on dividends from our subsidiaries. |
| ● | Our indebtedness may affect our ability to operate our business, and may have a material adverse effect on our financial condition and results of operations. We may incur additional indebtedness, including secured indebtedness. |
| ● | We may not be able to generate sufficient cash to service all of our indebtedness, including the Senior Notes (as defined below), and may be forced to take other actions to satisfy our obligations under our indebtedness that may not be successful. |
| ● | A reduction in our credit rating could adversely affect us or the holders of our securities. |
| ● | The indenture governing the Senior Notes (as defined below) contains, and any instruments governing future indebtedness would likely contain, restrictions that limit our flexibility in operating our business. |
| ● | We are subject to extensive supervision and regulation that could restrict our activities and impose financial requirements or limitations on the conduct of our business and limit our ability to generate income. |
| ● | We may be subject to more stringent capital requirements in the future. |
| ● | Our broker-dealer business is subject to various risks associated with the securities industry. |
| ● | Market fluctuations could adversely impact our broker-dealer business. |
| ● | Our investment advisory business may be affected if our investment products perform poorly. |
| ● | Our existing correspondents may choose to perform their own clearing services or move their clearing business to one of our competitors or exit the business. |
| ● | Several of our broker-dealer segment’s product lines rely on favorable tax treatment and changes in federal tax law could impact the attractiveness of these products to our customers. |
| ● | Our mortgage origination segment is subject to investment risk on loans that it originates. |
| ● | The CFPB has issued “ability-to-repay” and “qualified mortgage” rules that may have a negative impact on our loan origination process and foreclosure proceedings, which could adversely affect our business, operating results, and financial condition. |
| ● | Changes in interest rates may change the value of our mortgage servicing rights portfolio, which may increase the volatility of our earnings. |
| ● | If we fail to develop, implement and maintain an effective system of internal control over financial reporting, the accuracy and timing of our financial reporting in future periods may be adversely affected. |
| ● | We ultimately may write-off goodwill and other intangible assets resulting from business combinations. |
| ● | The accuracy of our financial statements and related disclosures could be affected if we are exposed to actual conditions different from the judgments, assumptions or estimates used in our critical accounting policies. |
| ● | We are dependent on our management team, and the loss of our senior executive officers or other key employees could impair our relationship with customers and adversely affect our business and financial results. |
| ● | We are subject to losses due to fraudulent and negligent acts. |
| ● | Negative publicity regarding us, or financial institutions in general, could damage our reputation and adversely impact our business and results of operations. |
| ● | We are subject to legal claims and litigation, including potential securities law liabilities, any of which could have a material adverse effect on our business. |
28
Risks Related to our Business
Our allowances for credit losses for loans and debt securities may prove inadequate or we may be negatively affected by credit risk exposures. Also, future additions to our allowance for credit losses will reduce our future earnings.
As a lender, we are exposed to the risk that we could sustain losses because our borrowers may not repay their loans in accordance with the terms of their loans. We maintain allowances for credit losses for loans and debt securities to provide for defaults and nonperformance, which represent an estimate of expected losses over the remaining contractual lives of the loan and debt security portfolios. This estimate is the result of our continuing evaluation of specific credit risks and loss experience, current loan and debt security portfolio quality, present economic, political and regulatory conditions, industry concentrations, reasonable and supportable forecasts for future conditions and other factors that may indicate losses. The determination of the appropriate levels of the allowances for loan and debt security credit losses inherently involves a high degree of subjectivity and judgment and requires us to make estimates of current credit risks and future trends, all of which may undergo material changes. Generally, our nonperforming loans and other real estate owned (“OREO”) reflect operating difficulties of individual borrowers and weaknesses in the economies of the markets we serve.
Under the acquisition method of accounting requirements, we were required to estimate the fair value of the loan portfolios acquired in each of the PlainsCapital Merger, the Federal Deposit Insurance Corporation (“FDIC”) -assisted transaction (the “FNB Transaction”) whereby the Bank acquired certain assets and assumed certain liabilities of FNB, the acquisition of SWS Group, Inc. in a stock and cash transaction (the “SWS Merger”) and the acquisition of The Bank of River Oaks (“BORO”) in an all-cash transaction (“BORO Acquisition,” and collectively with the PlainsCapital Merger, FNB Transaction and the SWS Merger, the “Bank Transactions”) as of the applicable acquisition date and write down the recorded value of each such acquired portfolio to the applicable estimate. For most loans, this process was accomplished by computing the net present value of estimated cash flows to be received from borrowers of such loans. The allowance for credit losses that had been maintained by PCC, FNB, SWS or BORO, as applicable, prior to their respective transactions, was eliminated in this accounting process.
The estimates of fair value as of the consummation of each of the Bank Transactions were based on economic conditions at such time and on Bank management’s projections concerning both future economic conditions and the ability of the borrowers to continue to repay their loans. If management’s assumptions and projections prove to be incorrect, however, the estimate of fair value may be higher than the actual fair value and we may suffer losses in excess of those estimated. Further, the allowance for credit losses established for new loans may prove to be inadequate to cover actual losses, especially if economic conditions worsen.
While Bank management endeavors to estimate the allowance to cover anticipated losses over the lives of our loan and debt security portfolios, no underwriting and credit monitoring policies and procedures that we could adopt to address credit risk could provide complete assurance that we will not incur unexpected losses. These losses could have a material adverse effect on our business, financial condition, results of operations and cash flows. In addition, federal regulators periodically evaluate the adequacy of our allowance for credit losses and may require us to increase our provision for credit losses or recognize further loan charge-offs based on judgments different from those of Bank management. Any such increase in our provision for (reversal of) credit losses or additional loan charge-offs could have a material adverse effect on our results of operations and financial condition.
Adverse developments affecting the financial services industry, such as bank failures or concerns involving liquidity, may have a material effect on the Company’s operations.
Events in early 2023 relating to the failures of certain banking entities have caused general uncertainty and concern regarding the liquidity adequacy of the banking sector as a whole. Although we were not directly affected by these bank failures, the resulting speed and ease in which news, including social media commentary, led depositors to withdraw or attempt to withdraw their funds from these and other financial institutions as well as caused the stock prices of many financial institutions to become volatile. In the future, events such as these bank failures could have an adverse effect on our financial condition and results of operations, either directly or through an adverse impact on certain of our customers.
29
In response to these failures and the resulting market reaction, the Secretary of the Treasury approved actions enabling the FDIC to complete its resolutions of the failed banks in a manner that fully protects depositors by utilizing the Deposit Insurance Fund, including the use of Bridge Banks to assume all of the deposit obligations of the failed banks, while leaving unsecured lenders and equity holders of such institutions exposed to losses. In addition, the Federal Reserve Bank announced it would make available additional funding to eligible depository institutions under a Bank Term Funding Program to help assure banks have the ability to meet the needs of all their depositors. In an effort to strengthen public confidence in the banking system and protect depositors, regulators announced that any losses to the Deposit Insurance Fund to support uninsured depositors will be recovered by a special assessment on banks, as required by law, which could increase the cost of our FDIC insurance assessments. However, it is uncertain whether these steps by the government will be sufficient to reduce the risk of additional bank failures in the future or resultant significant depositor withdrawals at other institutions. As a result of this uncertainty, we face the potential for reputational risk, deposit outflows, increased costs and competition for liquidity, and increased credit risk which, individually or in the aggregate, could have a material adverse effect on our business, financial condition and results of operations.
Our operational systems and networks have been, and will continue to be, subject to an increasing risk of continually evolving cybersecurity or other technological risks, which could result in a loss of customer business, financial liability, regulatory penalties, damage to our reputation or the disclosure of confidential information.
We rely heavily on communications and information systems to conduct our business and maintain the security of confidential information and complex transactions, which subjects us to an increasing risk of cyber incidents from these activities due to a combination of new technologies and the increasing use of the Internet to conduct financial transactions, as well as a potential failure, interruption or breach in the security of these systems, including those that could result from attacks or planned changes, upgrades and maintenance of these systems. Such cyber incidents could result in failures or disruptions in our customer relationship management, securities trading, general ledger, deposits, computer systems, electronic underwriting servicing or loan origination systems; or unauthorized disclosure of confidential and non-public information maintained within our systems. We also utilize relationships with third parties to aid in a significant portion of our information systems, communications, data management and transaction processing. These third parties with which we do business may also be sources of cybersecurity or other technological risks, including operational errors, system interruptions or breaches, unauthorized disclosure of confidential information and misuse of intellectual property, and have experienced cyber attacks. If our third-party service providers encounter any of these issues, we could be exposed to disruption of service, reputation damages, and litigation risk, any of which could have a material adverse effect on our business.
During the second quarter in 2023, a third-party vendor of the Bank confirmed that data specific to the Bank’s customers was likely obtained in a security incident targeting the vendor’s instance of the MOVEit Transfer Application. As a result of this, an unauthorized party likely obtained information in the vendor’s possession about substantially all of the Bank’s customers, including social security numbers and account numbers. Hilltop Securities was notified by the same vendor that certain of its data was also likely obtained in the incident; however, based on the review conducted to date, we do not have indication that protected or confidential information was present within the information obtained related to Hilltop Securities. Given the widespread use of the MOVEit Transfer Application, additional vendors of ours may have been impacted. We have incurred, and may continue to incur, expenses related to this incident, and we remain subject to risks and uncertainties as a result of the incident, including litigation and additional regulatory scrutiny.
The continued occurrence of cybersecurity incidents across a range of industries has resulted in increased legislative and regulatory scrutiny over cybersecurity and calls for additional data privacy laws and regulations at both the state and federal levels. For example, in 2018, the State of California adopted the California Consumer Privacy Act of 2018, which imposes requirements on companies operating in California and provides consumers with a private right of action if covered companies suffer a data breach related to their failure to implement reasonable security measures. These laws and regulations could result in increased operating expenses or increase our exposure to the risk of litigation or regulatory inquiries or proceedings.
Although we devote significant resources to maintain and regularly upgrade our systems and networks to safeguard critical business applications, there is no guarantee that these measures or any other measures can provide absolute security. Our computer systems, software and networks may be adversely affected by cyber incidents such as
30
unauthorized access; loss or destruction of data (including confidential client information); account takeovers; unavailability of service; computer viruses or other malicious code; cyber attacks; and other events. In addition, our protective measures may not promptly detect intrusions, and we may experience losses or incur costs or other damage related to intrusions that go undetected or go undetected for significant periods of time, at levels that adversely affect our financial results or reputation. Further, because the methods used to cause cyber attacks change frequently, or in some cases cannot be recognized until launched, we may be unable to implement preventative measures or proactively address these methods until they are discovered. Cyber threats may derive from human error, fraud or malice on the part of employees or third parties, or may result from accidental technological failure. For example, during the second quarter of 2018, we became the victim of a “spear phishing” attack on one of our employees in which we suffered a $4.0 million wire fraud loss and sensitive customer information was stolen. As a result of this attack, we incurred costs to provide identity protection services, including credit monitoring, to customers who may have been impacted and other legal and professional services, and may also incur expenses in the future including legal and professional expenses and claims for damages. Additional challenges are posed by external extremist parties, including foreign state actors, in some circumstances, as a means to promote political ends. If one or more of these events occurs, it could result in the disclosure of confidential client or customer information, damage to our reputation with our clients, customers and the market, customer dissatisfaction, additional costs such as repairing systems or adding new personnel or protection technologies, regulatory penalties, fines, remediation costs, exposure to litigation and other financial losses to both us and our clients and customers. Such events could also cause interruptions or malfunctions in our operations. We maintain cyber risk insurance, but this insurance may not be sufficient to cover all of our losses from any future breaches of our systems.
We continue to evaluate our cybersecurity program and will consider incorporating new practices as necessary to meet the expectations of regulatory agencies in light of such cybersecurity guidance and regulatory actions and settlements for cybersecurity-related failures and violations by other industry participants. Such procedures include management-level engagement and corporate governance, risk management and assessment, technical controls, incident response planning, vulnerability testing, vendor management, intrusion detection monitoring, patch management and staff training. Even if we implement these procedures, however, we cannot assure you that we will be fully protected from a cybersecurity incident, the occurrence of which could adversely affect our reputation and financial condition.
Our banking segment is subject to risk arising from conditions in the commercial real estate market and may be adversely affected by weaknesses in the commercial real estate market.
As of December 31, 2023, commercial real estate loans comprised approximately 39% of our banking segment’s loan portfolio. Commercial real estate loans generally involve a greater degree of credit risk than residential real estate loans because they typically have larger balances and are more affected by adverse conditions in the economy. Because payments on loans secured by commercial real estate often depend upon the successful operation and management of the properties and the businesses which operate from within them, repayment of such loans may be affected by factors outside the borrower’s control, such as adverse conditions in the real estate market or the economy or changes in government regulations. Commercial real estate markets have been impacted by the economic disruptions caused by the pandemic. The pandemic has also been a catalyst for the evolution of various remote work options that could have an adverse effect on the long-term performance of some types of office properties within the Company’s commercial real estate portfolio. A failure by the banking segment to have adequate risk management policies, procedures and controls could result in an increased rate of delinquencies in, and increased losses from, this portfolio, which, accordingly, could have a material adverse effect on the Company’s business, financial condition and results of operations.
Our business and results of operations may be adversely affected by unpredictable economic, market and business conditions.
Our business and results of operations are affected by general economic, market and business conditions. The credit quality of our loan portfolio necessarily reflects, among other things, the general economic conditions in the areas in which we conduct our business. Our continued financial success depends to a degree on factors beyond our control, including:
| ● | national and local economic conditions, such as the level and volatility of short-term and long-term interest rates, inflation, home prices, unemployment and under-employment levels, energy prices, bankruptcies, household income and consumer spending; |
31
| ● | the availability and cost of capital and credit; |
| ● | incidence of customer fraud; and |
| ● | federal, state and local laws affecting these matters. |
The deterioration of any of these conditions, as we have experienced with past economic downturns, could adversely affect our consumer and commercial businesses and securities portfolios, our level of loan charge-offs and provision for credit losses, the carrying value of our deferred tax assets, the investment portfolio of our insurance segment, our capital levels and liquidity, our securities underwriting business and our results of operations.
Several factors could pose risks to the financial services industry, including tightening monetary policies by central banks, rising energy prices, trade wars, restrictions and tariffs; slowing growth in emerging economies; geopolitical matters, including international political unrest, disturbances and conflicts; acts of war and terrorism; pandemics; changes in interest rates; regulatory uncertainty; continued infrastructure deterioration; low oil prices; disruptions in global or national supply chains; and natural disasters. During 2022, the Russian invasion of Ukraine contributed to significant increases in global oil prices and further disrupted supply chains due to economic sanctions imposed by the U.S. and other trade partners. In addition, the current environment of heightened scrutiny of financial institutions has resulted in increased public awareness of and sensitivity to banking fees and practices. Each of these factors may adversely affect our fees and costs.
Over the last several years, there have been several instances where there has been uncertainty regarding the ability of Congress and the President collectively to reach agreement on federal budgetary and spending matters. A period of failure to reach agreement on these matters, particularly if accompanied by an actual or threatened government shutdown, may have an adverse impact on the U.S. economy. Additionally, a prolonged government shutdown may inhibit our ability to evaluate borrower creditworthiness and originate and sell certain government-backed loans.
Our business is subject to interest rate risk, and fluctuations in interest rates may adversely affect our earnings, capital levels and overall results.
The majority of our assets are monetary in nature and, as a result, we are subject to significant risk from changes in interest rates. Between August 2019 and March 2020, the Federal Open Market Committee of the Federal Reserve Board decreased its target range for short-term interest rates by 200 basis points, while between March 2022 and December 2023, it raised interest rates by 525 basis points and indicated that further changes may occur in 2024. Changes in interest rates may impact our net interest income in our banking segment as well as the valuation of our assets and liabilities in each of our segments. Earnings in our banking segment are significantly dependent on our net interest income, which is the difference between interest income on interest-earning assets, such as loans and securities, and interest expense on interest-bearing liabilities, such as deposits and borrowings. We expect to periodically experience “gaps” in the interest rate sensitivities of our banking segment’s assets and liabilities, meaning that either our interest-bearing liabilities will be more sensitive to changes in market interest rates than our interest-earning assets, or vice versa. In either event, if market interest rates should move contrary to our position, this “gap” may work against us, and our results of operations and financial condition may be adversely affected. Given the potential for an adverse impact on our net interest income associated with interest rate cycle transitions, we periodically evaluate our current “gap” position and determine whether a repositioning of the banking segment’s balance sheet is appropriate. Asymmetrical changes in interest rates, such as if short-term rates increase or decrease at a faster rate than long-term rates, can affect the slope of the yield curve. A continued inversion of the yield curve, as measured by the difference between 10-year U.S. Treasury bond yields and 3-month yields, could adversely impact the net interest income of our banking segment as the spread between interest-earning assets and interest-bearing liabilities becomes further compressed.
As of December 31, 2023, approximately 57% of our loans were advanced to our customers on a variable or adjustable-rate basis and approximately 43% of our loans were advanced to our customers on a fixed-rate basis. As a result, an increase in interest rates could result in increased loan defaults, foreclosures and charge-offs and could necessitate further increases to the allowance for credit losses, any of which could have a material adverse effect on our business, financial condition or results of operations. Alternatively, a decrease in interest rates could negatively impact our margins and profitability. Certain of our variable rate loans only provide for resets of interest rates periodically, which can result in significant periods of time between resets in loan rates, which can negatively impact our margins and
32
profitability. Further, a portion of our adjustable rate loans have interest rate floors at or above the loan's contractual interest rate. As of December 31, 2023, approximately 9% of our total loans’ rates are floored, with most expected to reprice to the loan’s contractual rate at the next reset date. The inability of our loans to adjust downward can contribute to increased income in periods of declining interest rates, although this result is subject to the risks that borrowers may refinance these loans during periods of declining interest rates. Also, when loans are at their floors, there is a further risk that our interest income may not increase as rapidly as our cost of funds during periods of increasing interest rates which could have a material adverse effect on our results of operations.
If we need to offer higher interest rates on checking accounts to maintain current clients or attract new clients, our interest expense will increase, perhaps materially. Furthermore, if we fail to offer interest in a sufficient amount to keep these demand deposits, our core deposits may be reduced, which would require us to obtain funding in other ways or risk slowing our future asset growth.
An increase in the absolute level of interest rates may also, among other things, adversely affect the demand for loans and our ability to originate loans. In particular, if mortgage interest rates increase, the demand for residential mortgage loans and the refinancing of residential mortgage loans will likely decrease, which will have an adverse effect on our income generated from mortgage origination activities. Conversely, a decrease in the absolute level of interest rates, among other things, may lead to prepayments in our loan and mortgage-backed securities portfolios as well as increased competition for deposits. Accordingly, changes in the general level of market interest rates may adversely affect our net yield on interest-earning assets, loan origination volume and our overall results.
Our broker-dealer segment holds securities, principally fixed-income bonds, to support sales, underwriting and other customer activities. If interest rates increase, the value of debt securities held in the broker-dealer segment’s inventory would decrease. Rapid or significant changes in interest rates could adversely affect the segment’s bond sales, trading and underwriting activities. Further, the profitability of our margin and stock lending businesses depends to a great extent on the difference between interest income earned on loans and investments of customer cash balances and the interest expense paid on customer cash balances and borrowings.
In addition, we hold securities that may be sold in response to changes in market interest rates, changes in securities’ prepayment risk, increases in loan demand, general liquidity needs and other similar factors. Such securities are classified as available for sale and are carried at estimated fair value, which may fluctuate with changes in market interest rates. The effects of an increase in market interest rates may result in a decrease in the value of our available for sale investment portfolio.
Market interest rates are affected by many factors outside of our control, including inflation, recession, unemployment, money supply, international disorder and instability in domestic and foreign financial markets. We may not be able to accurately predict the likelihood, nature and magnitude of such changes or how and to what extent such changes may affect our business. We also may not be able to adequately prepare for, or compensate for, the consequences of such changes. Any failure to predict and prepare for changes in interest rates, or adjust for the consequences of these changes, may adversely affect our earnings and capital levels and overall results of operations and financial condition.
Inflationary pressures and rising prices may affect our results of operations and financial condition.
Inflation rose sharply at the end of 2021 and has continued rising in 2022 and 2023 at levels not seen for over 40 years. Inflationary pressures are currently expected to remain elevated throughout 2024. Small to medium-sized businesses may be impacted more during periods of high inflation as they are not able to leverage economics of scale to mitigate cost pressures compared to larger businesses. Consequently, the ability of our business customers to repay their loans may deteriorate, and in some cases this deterioration may occur quickly, which would adversely impact our results of operations and financial condition. Similarly, rising interest rates will negatively impact our mortgage business by making home mortgages more expensive for home buyers and by making mortgage refinancing transactions less likely, which would adversely impact our results of operations and financial condition in PrimeLending. Furthermore, a prolonged period of inflation could cause wages and other costs to Hilltop and its subsidiaries to increase, which could adversely affect our results of operations and financial condition.
33
Our mortgage origination business is subject to fluctuations based upon seasonal and other factors and, as a result, our results of operations for any given quarter may not be indicative of the results that may be achieved for the full fiscal year.
Our mortgage origination business is subject to several variables that can impact loan origination volume, including seasonal and interest rate fluctuations. We typically experience increased loan origination volume from purchases of homes during the second and third calendar quarters, when more people tend to move and buy or sell homes. In addition, an increase in the general level of interest rates may, among other things, adversely affect the demand for mortgage loans and our ability to originate mortgage loans. In particular, if mortgage interest rates increase, the demand for residential mortgage loans and the refinancing of residential mortgage loans will likely decrease, which will have an adverse effect on our mortgage origination activities. Conversely, a decrease in the general level of interest rates, among other things, may lead to increased competition for mortgage loan origination business.
As a result of these variables, our results of operations for any single quarter are not necessarily indicative of the results that may be achieved for a full fiscal year.
The financial services industry is characterized by rapid technological change, and if we fail to keep pace, our business may suffer.
The financial services industry is continually undergoing rapid technological change with frequent introductions of new technology-driven products and services. Many of our competitors have substantially greater resources to invest in technological improvements. We may not be able to effectively or timely implement new technology-driven products and services or be successful in marketing these products and services to our customers and clients. Failure to successfully keep pace with technological change affecting the financial services industry and avoid interruptions, errors and delays could have a material adverse impact on our business, financial condition, results of operations or cash flows.
We are heavily reliant on technology, and a failure to effectively implement new technological solutions or enhancements to existing systems or platforms could adversely affect our business operations and the financial results of our operations.
Like most financial services companies, we significantly depend on technology to deliver our products and services and to otherwise conduct business. To remain technologically competitive and operationally efficient, we have either begun the significant investment in or have plans to invest in new technological solutions, substantial core system upgrades and other technology enhancements within each of our operating segments and corporate. Many of these solutions and enhancements have a significant duration, include phased implementation schedules, are tied to critical systems, and require substantial internal and external resources for design and implementation. Such external resources may be relied upon to provide expertise and support to help implement, maintain and/or service certain of our core technology solutions.
Although we take steps to mitigate the risks and uncertainties associated with these solutions and initiatives, we may encounter significant adverse developments in the completion and implementation of these initiatives. These may include significant time delays, cost overruns, loss of key personnel, technological problems, processing failures, distraction of management and other adverse developments. Further, our ability to maintain an adequate control environment may be impacted.
The ultimate effect of any adverse development could damage our reputation, result in a loss of customer business, subject us to additional regulatory scrutiny, or expose us to civil litigation and possible financial liability, any of which could materially affect us, including our control environment, operating efficiency, and results of operations.
Our geographic concentration may magnify the adverse effects and consequences of any regional or local economic downturn.
We conduct our banking operations primarily in Texas. At December 31, 2023, an aggregate of 76% of the real estate loans in our loan portfolio, and included within the commercial real estate and 1-4 family residential portfolio segments, were secured by properties in Texas. Specifically, 28%, 16%, 9% and 5% of the real estate loans were secured by
34
properties located within the Dallas-Fort Worth, Austin, Houston and Brownsville-Harlingen-McAllen markets, respectively. Substantially all of these loans are made to borrowers who live and conduct business in Texas. Accordingly, economic conditions in Texas have a significant impact on the ability of the Bank’s customers to repay loans, the value of the collateral securing loans, our ability to sell the collateral upon any foreclosure, and the stability of the Bank’s deposit funding sources. Further, low crude oil prices may have a more profound effect on the economy of energy-dominant states such as Texas. The Bank has loans extended to businesses that depend on the energy industry including those within the exploration and production, oilfield services, pipeline construction, distribution and transportation sectors. If crude oil prices were to be depressed for an extended period, the Bank could experience weaker energy loan demand and increased losses within its energy and Texas-related loan portfolios. Moreover, natural disasters, such as Hurricane Harvey in 2017 and Winter Storm Uri in 2021 may also have an adverse impact on local economic conditions.
In addition, mortgage origination fee income is dependent to a significant degree on economic conditions in Texas and California. During 2023, 28.9% and 7.9% of our mortgage loans originated (by dollar volume) were collateralized by properties located in Texas and California, respectively. Also, in our broker-dealer segment, 79% of public finance services net revenues were from entities located in Texas, and 86% of retail brokerage service net revenues were generated through locations in Texas and California. Any regional or local economic downturn that affects Texas or, to a lesser extent, California, whether caused by recession, inflation, unemployment, changing oil prices, natural disasters, supply chain disruptions or other factors, may affect us and our profitability more significantly and more adversely than our competitors that are less geographically concentrated, and could have a material adverse effect on our results of operations and financial condition.
An adverse change in real estate market values may result in losses in our banking segment and otherwise adversely affect our profitability.
At December 31, 2023, 59% of the loan portfolio of our banking segment was comprised of loans with commercial or residential real estate as the primary component of collateral. The real estate collateral in each case provides a source of repayment in the event of default by the borrower and may deteriorate in value during the time the credit is extended. A decline in commercial or residential real estate values generally, and in Texas specifically, could impair the value of the collateral underlying a significant portion of the Bank’s loan portfolio and our ability to sell the collateral upon any foreclosure. In the event of a default with respect to any of these loans, the amounts we receive upon sale of the collateral may be insufficient to recover the outstanding principal and interest on the loan. As a result, our results of operations and financial condition may be materially adversely affected by a decrease in real estate market values.
The economic impact of the pandemic has adversely affected, and may continue to adversely affect, our business, financial condition, liquidity and results of operations.
The worldwide COVID-19 pandemic and related governmental control measures severely disrupted financial markets and overall economic conditions throughout 2020 and 2021 and adversely affected our business. Although the United States economy has begun to recover from the pandemic as many health and safety restrictions have been lifted and vaccine distribution has increased, certain adverse consequences of the pandemic continue to impact the macroeconomic environment and may persist for some time, including labor shortages and disruptions of global supply chains. The growth in economic activity and in the demand for goods and services, coupled with labor shortages and supply chain disruptions, has also contributed to rising inflationary pressures and the risk of recession. As a result of the pandemic and the related adverse economic consequences, we could experience material adverse effects on our business, financial condition, liquidity, and results of operations. The length of the adverse consequences of the pandemic and the impact to the macroeconomic environment are unknown. Until the consequences subside, we could be subject to any of the following risks:
| ● | further increases in the allowance for credit losses and possible recognition of credit losses, especially if businesses close or are substantially limited in their operating capacity, unemployment rates increase, consumer and business confidence declines, consumer trends change and clients and customers draw on their lines of credit or seek additional loans to help finance their businesses; |
35
| ● | possible constraints on liquidity and capital, whether due to increases in risk-weighted assets related to supporting client activities or to regulatory actions; and |
| ● | the possibility that significant portions of our workforce are unable to work effectively, including because of illness, quarantines, sheltering-in-place arrangements, government actions or other restrictions related to the pandemic. |
We also could experience a material reduction in trading volume and lower securities prices in times of market volatility, which would result in lower brokerage revenues, including losses on firm inventory. The fair values of certain of our investments could also be negatively impacted, resulting in unrealized or realized losses on such investments. Moreover, certain actions taken by U.S. or other governmental authorities, including the Federal Reserve Board, that are intended to ameliorate the macroeconomic effects of the pandemic may cause additional harm to our business. Decreases in short-term interest rates, such as those announced by the Federal Reserve Board late in our 2019 fiscal year and during the first fiscal quarter of 2020 had a negative impact on our results of operations, as we have certain assets and liabilities that are sensitive to changes in interest rates.
The length of the adverse consequences of the pandemic and the impact to the macroeconomic environment are unknown. Until the consequences subside, we could be subject to negative effects on our businesses, results of operations and financial condition, as well as our regulatory capital and liquidity ratios.
Our risk management processes may not fully identify and mitigate exposure to the various risks that we face, including interest rate, credit, liquidity and market risk.
We continue to refine our risk management techniques, strategies and assessment methods on an ongoing basis. However, our risk management techniques and strategies (as well as those available to the market generally) may not be fully effective in mitigating our risk exposure in all economic market environments or against all types of risk. For example, we might fail to identify or anticipate particular risks, or the systems that we use, and that are used within our business segments generally, may not be capable of identifying certain risks. Certain of our strategies for managing risk are based upon observed historical market behavior. We apply statistical and other tools to these observations to quantify our risk exposure. Any failures in our risk management techniques and strategies to accurately identify and quantify our risk exposure could limit our ability to manage risks. In addition, any risk management failures could cause our losses to be significantly greater than the historical measures indicate. Further, our quantified modeling does not take all risks into account. As a result, we also take a qualitative approach in reducing our risk, although our qualitative approach to managing those risks could also prove insufficient, exposing us to material unanticipated losses.
Our hedging strategies may not be successful in mitigating our exposure to interest rate risk.
We use derivative financial instruments, primarily consisting of interest rate swaps, to limit our exposure to interest rate risk within the banking and mortgage origination segments. No hedging strategy can completely protect us, and the derivative financial instruments we elect may not have the effect of reducing our interest rate risk. Poorly designed strategies, improperly executed and documented transactions, inaccurate assumptions or the failure of a counterparty to fulfill its obligations could actually increase our risks and losses. In addition, hedging strategies involve transaction and other costs. Our hedging strategies and the derivatives that we use may not adequately offset the risks of interest rate volatility and could result in or magnify losses, which could have an adverse effect on our financial condition and results of operations.
Our bank lending, margin lending, stock lending, securities trading and execution and mortgage purchase businesses are all subject to credit risk.
We are exposed to credit risk in all areas of our business. The Bank is exposed to the risk that its loan customers may not repay their loans in accordance with their terms, the collateral securing the loans may be insufficient, or its credit loss reserve may be inadequate to fully compensate the Bank for the outstanding balance of the loan plus the costs to dispose of the collateral. Further, our mortgage warehousing activities subject us to credit risk during the period between funding by the Bank and when the mortgage company sells the loan to a secondary investor.
36
Our broker-dealer business is subject to credit risk if securities prices decline rapidly because the value of our collateral could fall below the amount of the indebtedness it secures. In rapidly appreciating markets, credit risk increases due to short positions. Our securities lending business as well as our securities trading and execution businesses subject us to credit risk if a counterparty fails to perform or if collateral securing its obligations is insufficient. In securities transactions, we are subject to credit risk during the period between the execution of a trade and the settlement by the customer.
Significant failures by our customers, including correspondents, or clients to honor their obligations, or increases in their rates of default, together with insufficient collateral and reserves, could have a material adverse effect on our business, financial condition, results of operations or cash flows.
We depend on our computer and communications systems and an interruption in service would negatively affect our business.
Our businesses rely on electronic data processing and communications systems. The effective use of technology allows us to better serve customers and clients, increases efficiency and reduces costs. Our continued success will depend, in part, upon our ability to successfully maintain, secure and upgrade the capability of our systems, our ability to address the needs of our clients by using technology to provide products and services that satisfy their demands and our ability to retain skilled information technology employees. Significant malfunctions or failures of our computer systems, computer security, software or any other systems in the trading process (e.g., record retention and data processing functions performed by third parties, and third-party software, such as Internet browsers) could cause delays in customer trading activity. Such delays could cause substantial losses for customers and could subject us to claims from customers for losses, including litigation claiming fraud or negligence. In addition, if our computer and communications systems fail to operate properly, regulations would restrict our ability to conduct business. Any such failure could prevent us from collecting funds relating to customer and client transactions, which would materially impact our cash flows. Any computer or communications system failure or decrease in computer system performance that causes interruptions in our operations could have a material adverse effect on our business, financial condition, results of operations or cash flows.
Climate change could adversely affect our business and performance, including indirectly through impacts on our customers.
Concerns over the long-term impacts of climate change have led, and will continue to lead, to governmental efforts in the United States to mitigate those impacts. Consumers and businesses also may change their behavior as a result of these concerns. We and our customers will need to respond to new laws and regulations, as well as consumer and business preferences resulting from climate change concerns. We and our customers may face cost increases, asset value reductions and operating process changes. The impact on our customers will likely vary depending on their specific attributes, including reliance on or role in carbon intensive activities. Within Texas, where our banking operations are primarily located and in which we have a significant presence for our broker-dealer and mortgage origination segments, a shift in the current state of the energy industry reflecting a transition from carbon intensive activities to low-carbon or “green” technologies and processes could have a more profound impact on our customers, consumer behavior and the economy. Among the impacts to us could be a drop in demand for our products and services, particularly in certain sectors. In addition, we could face reductions in creditworthiness on the part of some customers or in the value of assets securing loans. Our efforts to take these risks into account in making lending and other decisions may not be effective in protecting us from the negative impact of new laws and regulations or changes in consumer or business behavior.
We are heavily dependent on dividends from our subsidiaries.
We are a financial holding company engaged in the business of managing, controlling and operating our subsidiaries. Hilltop conducts limited material business other than activities incidental to holding stock in the Bank and Securities Holdings. As a result, we rely substantially on the profitability of, and dividends from, these subsidiaries to pay our operating expenses and to pay interest on our debt obligations. The Bank and Securities Holdings are subject to significant regulatory restrictions limiting their ability to declare and pay dividends to us. Accordingly, if the Bank and Securities Holdings are unable to make cash distributions to us, then we may be unable to satisfy our operating expense obligations or make interest payments on our debt obligations.
37
Our broker-dealer business is subject to various risks associated with the securities industry.
Our broker-dealer business is subject to uncertainties that are common in the securities industry. These uncertainties include:
| ● | intense competition in the securities industry; |
| ● | the volatility of domestic and international financial, bond and stock markets; |
| ● | extensive governmental regulation; |
| ● | litigation; and |
| ● | substantial fluctuations in the volume and price level of securities. |
As a result of such uncertainties, the revenues and operating results of our broker-dealer segment may vary significantly from quarter to quarter and from year to year. Unfavorable financial or economic conditions could reduce the number and size of transactions in which we provide financial advisory, underwriting and other services. Disruptions in fixed income and equity markets could lead to a decline in the volume of transactions executed for customers and, therefore, to declines in revenues from commissions and clearing services. In addition, the Hilltop Broker-Dealers are operating subsidiaries of Hilltop, which means that their activities are limited to those that are permissible for subsidiaries of a bank holding company.
Market fluctuations could adversely impact our broker-dealer business.
Our broker-dealer segment is subject to risks as a result of fluctuations in the securities markets. Our securities trading, market-making and underwriting activities involve the purchase and sale of securities as a principal, which subjects our capital to significant risks. Market conditions could limit our ability to sell securities purchased or to purchase securities sold in such transactions. If interest rates increase, the value of debt securities we hold in our inventory would decrease. Rapid or significant market fluctuations could adversely affect our business, financial condition, results of operations and cash flow.
In addition, during periods of market disruption, it may be difficult to value certain assets if comparable sales become less frequent or market data becomes less observable. Certain classes of assets or loan collateral that were in active markets with significant observable data may become illiquid due to the current financial environment. In such cases, asset valuations may require more estimation and subjective judgment.
Our investment advisory business may be affected if our investment products perform poorly.
Poor investment returns and declines in client assets in our investment advisory business, due to either general market conditions or underperformance (relative to our competitors or to benchmarks) by investment products, may affect our ability to retain existing assets, prevent clients from transferring their assets out of products or their accounts, or inhibit our ability to attract new clients or additional assets from existing clients. Any such poor performance could adversely affect our investment advisory business and the advisory fees that we earn on client assets.
Our existing correspondents may choose to perform their own clearing services or move their clearing business to one of our competitors or exit the business.
As the operations of our correspondents grow, our correspondents may consider the option of performing clearing functions themselves, in a process referred to as “self-clearing.” The option to convert to self-clearing operations may become more attractive as the transaction volume of a broker-dealer grows. The cost of implementing the necessary infrastructure may eventually be offset by the elimination of per transaction processing fees that would otherwise be paid to a clearing firm. Additionally, performing their own clearing services allows self-clearing broker-dealers to retain their customers’ margin balances, free credit balances and securities for use in margin lending activities. Furthermore, our correspondents may decide to use the clearing services of one of our competitors or exit the business. Any significant loss of correspondents due to self-clearing, moving their clearing business to a competitor or exiting the business could have a material adverse effect on our business, financial condition, results of operations or cash flows.
38
Several of our broker-dealer segment’s product lines rely on favorable tax treatment and changes in federal tax law could impact the attractiveness of these products to our customers.
We offer a variety of services and products, such as individual retirement accounts and municipal bonds, which rely on favorable federal income tax treatment to be attractive to our customers. Should favorable tax treatment of these products be eliminated or reduced, sales of these products could be materially impacted, which could have a material adverse effect on our business, financial condition, results of operations or cash flows.
Our mortgage origination segment is subject to investment risk on loans that it originates.
We intend to sell, and not hold for investment, substantially all residential mortgage loans that we originate through PrimeLending. At times, however, we may originate a loan or execute an interest rate lock commitment (“IRLC”) with a customer pursuant to which we agree to originate a mortgage loan on a future date at an agreed-upon interest rate without having identified a purchaser for such loan. An identified purchaser may also decline to purchase a loan for a variety of reasons. In these instances, we will bear interest rate risk on an IRLC until, and unless, we are able to find a buyer for the loan underlying such IRLC and the risk of investment on a loan until, and unless, we are able to find a buyer for such loan. In addition, in the event of a breach of any representation or warranty concerning a loan, an agency, investor or other third-party could, among other things, require us to repurchase the full amount of the loan or seek indemnification for losses from us, even if the loan is not in default. Further, if a customer defaults on a mortgage payment shortly after the loan is originated, the purchaser of the loan may have a put right, whereby the purchaser can require us to repurchase the loan at the full amount that it paid. During periods of market downturn, we may choose to hold mortgage loans when the identified purchasers have declined to purchase such loans because we may not obtain an acceptable substitute bid price for such loan. The failure of mortgage loans that we hold on our books to perform adequately could have a material adverse effect on our financial condition, liquidity and results of operations. Moreover, if a property securing a mortgage loan on which we own the servicing rights is damaged, including from flooding, we may be responsible for repairs for uninsured damage.
Changes in interest rates may change the value of our mortgage servicing rights portfolio, which may increase the volatility of our earnings.
As a result of our mortgage servicing business, which we may expand in the future, we have a portfolio of MSR assets. An MSR is the right to service a mortgage loan – collect principal, interest and escrow amounts – for a fee. We measure and carry all of our residential MSR assets using the fair value measurement method. Fair value is determined as the present value of estimated future net servicing income, calculated based on a number of variables, including assumptions about the likelihood of prepayment by borrowers.
Current trends of rising interest rates have resulted in an increased valuation of the MSR asset, however one of the principal risks associated with MSR assets is that in a declining interest rate environment, they will likely lose a substantial portion of their value as a result of higher than anticipated prepayments. Moreover, if prepayments are greater than expected, the cash we receive over the life of the mortgage loans would be reduced. The mortgage origination segment uses derivative financial instruments, including U.S. Treasury bond futures and options, as a means to mitigate market risk associated with MSR assets. However, no hedging strategy can protect us completely, and hedging strategies may fail because they are improperly designed, improperly executed and documented or based on inaccurate assumptions and, as a result, could actually increase our risks and losses. An increasing size of our MSR portfolio may increase our interest rate risk and correspondingly, the volatility of our earnings, especially if we cannot adequately hedge the interest rate risk relating to our MSR assets.
An increased size of our MSR portfolio could result in us carrying significant asset balances. This could result in a reduction in our liquidity and cause a reduction in our capital ratios. The combination of these impacts along with other impacts, could cause us to not have sufficient liquidity or capital.
At December 31, 2023, the mortgage origination segment’s MSR asset had a fair value of $96.9 million. All income related to retained servicing, including changes in the value of the MSR asset, is included in noninterest income. Depending on the interest rate environment and market trends related to MSR sales, it is possible that the fair value of
39
our MSR asset may be reduced in the future. If such changes in fair value significantly reduce the carrying value of our MSR asset, our financial condition and results of operations would be negatively affected.
If we fail to develop, implement and maintain an effective system of internal control over financial reporting, the accuracy and timing of our financial reporting in future periods may be adversely affected.
The Sarbanes-Oxley Act and related rules and regulations require that management report annually on the effectiveness of our internal control over financial reporting and assess the effectiveness of our disclosure controls and procedures on a quarterly basis. Effective internal controls are necessary for us to provide timely and reliable financial reports and effectively prevent fraud. We have identified control deficiencies that constituted a material weakness in our internal controls and procedures in the past and may experience a material weakness in future years. If we fail to maintain adequate internal controls, our financial statements may not accurately reflect our financial condition. Any material misstatements could require a restatement of our consolidated financial statements, cause us to fail to meet our reporting obligations or cause investors to lose confidence in our reported financial information, leading to a decline in the market value of our securities.
We ultimately may write-off goodwill and other intangible assets resulting from business combinations.
As a result of purchase accounting in connection with acquisitions, our consolidated balance sheet at December 31, 2023, included goodwill of $267.4 million and other intangible assets, net of accumulated amortization, of $8.5 million. On an ongoing basis, we evaluate whether facts and circumstances indicate any impairment of value of intangible assets. As circumstances change, we may not realize the value of these intangible assets. If we determine that a material impairment has occurred, we will be required to write-off the impaired portion of intangible assets, which could have a material adverse effect on our results of operations in the period in which the write-off occurs. We have goodwill and intangibles balances recorded in connection with acquisitions in our banking, broker-dealer and mortgage origination segments, which we periodically review for impairment. These assets are sensitive to any significant changes in related results of operations of the underlying businesses.
In light of the recent and continuing macroeconomic challenges in the mortgage industry given tight housing inventories and mortgage interest rate levels, our mortgage origination segment experienced lower-than-forecasted operating results during 2023. While the broker-dealer segment experienced higher-than-forecasted operating results during 2023 primarily driven by the combined impacts of the rising interest rate environment and a more favorable housing environment in certain areas of the country, continuing macroeconomic challenges related to mortgage loan origination volumes, customer sensitivity to interest rates and resulting demand for certain products have resulted in a challenging environment associated with the broker-dealer segment’s short- and long-term financial condition, resulting in variability in its operating results. These headwinds, coupled with inflationary pressures associated with compensation, occupancy and software costs within our business segments during 2022 and 2023 have had, and are expected to continue to have, an adverse impact on our operating results during 2024. Given the potential impacts of the operating performance of these reporting segments and overall economic conditions, actual results may differ materially from our current estimates as the scope of such impacts evolves or if the duration of business disruptions is longer than currently anticipated.
We further considered the amount by which fair value exceeded book value in the most recent quantitative analysis and sensitivities performed. At the conclusion of the annual assessment, we determined that as of October 1, 2023 it was more likely than not that the fair value of goodwill and other intangible assets exceeded their respective carrying values. We continue to monitor developments regarding future operating performance of our reportable business segments, overall economic conditions, market capitalization, and any other triggering events or circumstances that may indicate an impairment in the future.
To the extent future operating performance of our reporting segments remains challenged and below forecasted projections, significant assumptions such as expected future cash flows or the risk-adjusted discount rate used to estimate fair value are adversely impacted, or upon the occurrence of what management would deem to be a triggering event that could, under certain circumstances, cause us to perform impairment tests on our goodwill and other intangible assets, an impairment charge may be recorded for that period. In the event that we conclude that all or a portion of our goodwill
40
and other intangible assets are impaired, a non-cash charge for the respective amount of such impairment would be recorded to earnings. Such a charge would have no impact on tangible capital or regulatory capital.
The accuracy of our financial statements and related disclosures could be affected if we are exposed to actual conditions different from the judgments, assumptions or estimates used in our critical accounting estimates.
The preparation of financial statements and related disclosure in conformity with GAAP requires us to make judgments, assumptions and estimates that affect the amounts reported in our consolidated financial statements and accompanying notes. Our critical accounting estimates, which are included in this Annual Report, describe those significant accounting policies and methods used in the preparation of our consolidated financial statements that we consider “critical” because they involve a significant level of estimation uncertainty and have had or are reasonably likely to have a material impact on our financial condition or results of operation. As a result, if future events differ significantly from the judgments, assumptions and estimates in our critical accounting policies, such events or assumptions could have a material impact on our audited consolidated financial statements and related disclosures.
We are dependent on our management team, and the loss of our senior executive officers or other key employees could impair our relationship with customers and adversely affect our business and financial results.
Our success is dependent, to a large degree, upon the continued service and skills of our existing management team and other key employees with long-term customer relationships. Our business and growth strategies are built primarily upon our ability to retain employees with experience and business relationships within their respective segments. The loss of one or more of these key personnel could have an adverse impact on our business because of their skills, knowledge of the market, years of industry experience and the difficulty of finding qualified replacement personnel. In addition, we currently do not have non-competition agreements with certain members of management and other key employees. If any of these personnel were to leave and compete with us, our business, financial condition, results of operations and growth could suffer.
A decline in the market for municipal advisory services could adversely affect our business and results of operations.
Our broker-dealer segment has historically earned a material portion of its revenues from advisory fees paid to it by its clients, in large part upon the successful completion of the client’s transaction. New issuances in the municipal market by cities, counties, school districts, state and other governmental agencies, airports, healthcare institutions, institutions of higher education and other clients that the public finance services line of business serves can be subject to significant fluctuations based on factors such as changes in interest rates, property tax bases, budget pressures on certain issuers caused by uncertain economic times and other factors. A decline in the market for municipal advisory services due to the factors listed above could have an adverse effect on our business and results of operations.
We are subject to losses due to fraudulent and negligent acts.
Our banking and mortgage origination businesses expose us to fraud risk from our loan and deposit customers and the parties they do business with, as well as from our employees, contractors and vendors. We rely heavily upon information supplied by third parties, including the information contained in credit applications, property appraisals, title information, equipment pricing and valuation, and employment and income documentation, in deciding which loans to originate and the terms of those loans. If any of the information upon which we rely is misrepresented, either fraudulently or negligently, and the misrepresentation is not detected prior to funding, the value of the collateral may be significantly lower than expected, the source of repayment may not exist or may be significantly impaired, or we may fund a loan that we would not have funded or on terms we would not have extended. While we have underwriting and operational controls in place to help detect and prevent such fraud, no such controls are effective to detect or prevent all fraud. Whether a misrepresentation is made by the applicant, another third-party or one of our own employees, we may bear the risk of loss associated with the misrepresentation. We have experienced losses resulting from fraud in the past, including loan, wire transfer, document and check fraud, and identity theft. We maintain fraud insurance, but this insurance may not be sufficient to cover all of our losses from any fraudulent acts.
Our broker-dealer activities also expose us to fraud risks. When acting as an underwriter, our broker-dealer segment may be liable jointly and severally under federal, state and foreign securities laws for false and misleading statements
41
concerning the securities, or the issuer of the securities, that it underwrites. We are sometimes brought into lawsuits in connection with our correspondent clearing business based on actions of our correspondents. In addition, we may act as a fiduciary in other capacities that could expose us to liability under such laws or under common law fiduciary principles.
Negative publicity regarding us, or financial institutions in general, could damage our reputation and adversely impact our business and results of operations.
Our ability to attract and retain customers and conduct our business could be adversely affected to the extent our reputation is damaged. Reputational risk, or the risk to our business, earnings and capital from negative public opinion regarding our company, or financial institutions in general, is inherent in our business. Adverse perceptions concerning our reputation could lead to difficulties in generating and maintaining accounts as well as in financing them. In particular, such negative perceptions could lead to decreases in the level of deposits that consumer and commercial customers and potential customers choose to maintain with us. Negative public opinion could result from actual or alleged conduct in any number of activities or circumstances, including lending or foreclosure practices; sales practices; corporate governance and potential conflicts of interest; ethical failures or fraud, including alleged deceptive or unfair lending or pricing practices; regulatory compliance; protection of customer information; cyber attacks, whether actual, threatened, or perceived; negative news about us or the financial institutions industry generally; general company performance; or actions taken by government regulators and community organizations in response to such activities or circumstances. Furthermore, our failure to address, or the perception that we have failed to address, these issues appropriately could impact our ability to keep and attract customers and/or employees and could expose us to litigation and/or regulatory action, which could have an adverse effect on our business and results of operations.
In addition, stockholders, customers and other stakeholders have begun to consider how corporations are addressing environmental, social and governance (“ESG”) issues. Governments, investors, customers and the general public are increasingly focused on ESG practices and disclosures, and views about ESG are diverse and rapidly changing and have become a consideration in investment decisions. These shifts in investing priorities may result in adverse effects on the trading price of our common stock if investors determine that we have not made sufficient progress on ESG matters. We could also face potential negative ESG-related publicity in traditional media or social media if stockholders or other stakeholders determine that we have not adequately considered or addressed ESG matters. If we, or our relationships with certain customers, vendors or suppliers, became the subject of negative publicity, our ability to attract and retain customers and employees, and our financial condition and results of operations, could be adversely impacted.
We are subject to legal claims and litigation, including potential securities law liabilities, any of which could have a material adverse effect on our business.
We face significant legal risks in each of the business segments in which we operate, and the volume of legal claims and amount of damages and penalties claimed in litigation and regulatory proceedings against financial service companies remains high. These risks often are difficult to assess or quantify, and their existence and magnitude often remain unknown for substantial periods of time. Substantial legal liability or significant regulatory action against us or any of our subsidiaries could have a material adverse effect on our results of operations or cause significant reputational harm to us, which could seriously harm our business and prospects. Further, regulatory inquiries and subpoenas, other requests for information, or testimony in connection with litigation may require incurrence of significant expenses, including fees for legal representation and fees associated with document production. These costs may be incurred even if we are not a target of the inquiry or a party to the litigation. Any financial liability or reputational damage could have a material adverse effect on our business, which, in turn, could have a material adverse effect on our financial condition and results of operations.
Further, in the normal course of business, our broker-dealer segment has been subject to claims by customers and clients alleging unauthorized trading, churning, mismanagement, suitability of investments, breach of fiduciary duty or other alleged misconduct by our employees or brokers. We are sometimes brought into lawsuits based on allegations concerning our correspondents. As underwriters, we are subject to substantial potential liability for material misstatements and omissions in prospectuses and other communications with respect to underwritten offerings of securities. Prolonged litigation producing significant legal expenses or a substantial settlement or adverse judgment could have a material adverse effect on our business, financial condition, results of operations or cash flows.
42
Because we may use a substantial portion of our remaining excess capital to make acquisitions or effect a business combination, we may become subject to risks inherent in pursuing and completing any such acquisitions or business combination.
We may make acquisitions or effect business combinations with a substantial portion of our remaining excess capital. We may not, however, be able to identify suitable targets, consummate acquisitions or effect a combination on commercially acceptable terms or, if consummated, successfully integrate personnel and operations.
The success of any acquisition or business combination will depend upon, among other things, the ability of management and our employees to integrate personnel, operations, products and technologies effectively, to attract, retain and motivate key personnel and to retain customers and clients of targets. It is possible that the integration process could result in the loss of key employees, the disruption of ongoing business or inconsistencies in standards, controls, procedures and policies that adversely affect our ability to maintain relationships with clients, customers, depositors and employees. In addition, the integration of certain operations will require the dedication of significant management resources, which may temporarily distract management’s attention from our day-to-day business. Any inability to realize the full extent, or any, of the anticipated cost savings and financial benefits of any acquisitions we make, as well as any delays encountered in the integration process, could have an adverse effect on our business and results of operations, which could adversely affect our financial condition and cause a decrease in our earnings per share or decrease or delay the expected accretive effect of the acquisitions and contribute to a decrease in the price of our common stock. In addition, any acquisition or business combination we undertake may consume available cash resources, result in potentially dilutive issuances of equity securities and divert management’s attention from other business concerns. Even if we conduct extensive due diligence on a target business that we acquire or with which we merge, our diligence may not surface all material issues that may adversely affect a particular target business, and we may be forced to later write-down or write-off assets, restructure our operations or incur impairment or other charges that could result in our reporting losses. Consequently, we also may need to make further investments to support the acquired or combined company and may have difficulty identifying and acquiring the appropriate resources.
We may enter, through acquisitions or a business combination, into new lines of business or initiate new service offerings subject to the restrictions imposed upon us as a regulated financial holding company. Accordingly, there is no basis for you to evaluate the possible merits or risks of the particular target business with which we may combine or that we may ultimately acquire.
Subject to the restrictions imposed upon us as a regulated financial holding company, we may also use excess capital to make investments in companies engaged in non-financial activities. These investments could decline in value and are likely to be substantially less liquid than exchange-listed securities, if we are able to sell them at all. If we are required to sell these investments quickly, we may receive significantly less value than if we could otherwise have sold them. Losses on these investments could have an adverse impact on our profitability, results of operations and financial condition.
We may be subject to environmental liabilities in connection with the foreclosure on real estate assets securing the loan portfolio of our banking segment.
Hazardous or toxic substances or other environmental hazards may be located on the real estate that secures our loans. If we acquire such properties as a result of foreclosure, or otherwise, we could become subject to various environmental liabilities. For example, we could be held liable for the cost of cleaning up or otherwise addressing contamination at or from these properties. We could also be held liable to a governmental entity or third-party for property damage, personal injury or other claims relating to any environmental contamination at or from these properties. In addition, we could be held liable for costs relating to environmental contamination at or from our current or former properties. We may not detect all environmental hazards associated with these properties. If we ever became subject to significant environmental liabilities, our business, financial condition, liquidity and results of operations could be harmed.
43
Risks Related to Our Indebtedness
Our indebtedness may affect our ability to operate our business, and may have a material adverse effect on our financial condition and results of operations. We may incur additional indebtedness, including secured indebtedness.
At December 31, 2023, on a consolidated basis, we had total deposits of $11.1 billion and other indebtedness of $1.2 billion, including $150.0 million in aggregate principal amount of 5% senior notes due 2025 (the “Senior Notes”), $50.0 million aggregate principal amount of 5.75% fixed-to-floating rate subordinated notes due 2030 (the “2030 Subordinated Notes”) and $150.0 million aggregate principal amount of 6.125% fixed-to-floating rate subordinated notes due 2035 (the “2035 Subordinated Notes”). Our significant amount of indebtedness could have important consequences, such as:
| ● | limiting our ability to obtain additional financing to fund our working capital needs, acquisitions, capital expenditures or other debt service requirements or for other purposes; |
| ● | limiting our ability to use operating cash flow in other areas of our business because we must dedicate a substantial portion of these funds to service debt; |
| ● | limiting our ability to compete with other companies who are not as highly leveraged, as we may be less capable of responding to adverse economic and industry conditions; |
| ● | restricting us from making strategic acquisitions, developing properties or pursuing business opportunities; |
| ● | restricting the way in which we conduct our business because of financial and operating covenants in the agreements governing our and certain of our subsidiaries’ existing and future indebtedness, including, in the case of certain indebtedness of subsidiaries, certain covenants that restrict the ability of such subsidiaries to pay dividends or make other distributions to us; |
| ● | exposing us to potential events of default (if not cured or waived) under financial and operating covenants contained in our or our subsidiaries’ debt instruments that could have a material adverse effect on our business, financial condition and operating results; |
| ● | increasing our vulnerability to a downturn in general economic conditions or a decrease in pricing of our products; and |
| ● | limiting our ability to react to changing market conditions in our industry and in our customers’ industries. |
In addition to our debt service obligations, our operations require substantial investments on a continuing basis. Our ability to make scheduled debt payments, to refinance our obligations with respect to our indebtedness and to fund capital and non-capital expenditures necessary to maintain the condition of our operating assets and properties, as well as to provide capacity for the growth of our business, depends on our financial and operating performance, which, in turn, is subject to prevailing economic conditions and financial, business, competitive, legal and other factors.
Subject to the restrictions in the indentures governing the Senior Notes, 2030 Subordinated Notes and 2035 Subordinated Notes (collectively, the “Senior and Subordinated Notes”), we may incur significant additional indebtedness, including secured indebtedness. If new debt is added to our current debt levels, the risks described above could increase.
We may not be able to generate sufficient cash to service all of our indebtedness, including the Senior and Subordinated Notes, and may be forced to take other actions to satisfy our obligations under our indebtedness that may not be successful.
Our ability to satisfy our debt obligations will depend upon, among other things:
| ● | our future financial and operating performance, which will be affected by prevailing economic conditions and financial, business, regulatory and other factors, many of which are beyond our control; and |
| ● | our future ability to refinance the Senior and Subordinated Notes, which depends on, among other things, our compliance with the covenants in the indentures governing the Senior and Subordinated Notes. |
We cannot assure you that our business will generate sufficient cash flow from operations, or that we will be able to obtain financing in an amount sufficient to fund our liquidity needs.
44
If our cash flows and capital resources are insufficient to service our indebtedness, including the Senior and Subordinated Notes, we may be forced to reduce or delay capital expenditures, sell assets, seek additional capital or restructure or refinance our indebtedness, including the Senior and Subordinated Notes. These alternative measures may not be successful and may not permit us to meet our scheduled debt service obligations, including our obligations under the Senior and Subordinated Notes. Our ability to restructure or refinance our debt will depend on the condition of the capital markets and our financial condition at such time. Any refinancing of our debt could be at higher interest rates and may require us to comply with more onerous covenants, which could further restrict our business operations. In addition, the terms of existing or future debt agreements may restrict us from adopting some of these alternatives. In the absence of such operating results and resources, we could face substantial liquidity problems and might be required to dispose of material assets or operations, sell equity and/or negotiate with our lenders and other creditors to restructure the applicable debt in order to meet our debt service and other obligations. We may not be able to consummate those dispositions for fair market value or at all. The indentures governing the Senior and Subordinated Notes may restrict, or market or business conditions may limit, our ability to avail ourselves of some or all of these options. Furthermore, any proceeds that we could realize from any such dispositions may not be adequate to meet our debt service obligations then due.
A reduction in our credit rating could adversely affect us or the holders of our securities.
The credit rating agencies rating our indebtedness regularly evaluate us, and credit ratings are based on a number of factors, including our financial strength and ability to generate earnings, as well as factors not entirely within our control, including conditions affecting the financial services industry and the economy and changes in rating methodologies. There can be no assurance that we will maintain our current credit rating. A downgrade of our credit rating could adversely affect our access to liquidity and capital, and could significantly increase our cost of funds, trigger additional collateral or funding requirements and decrease the number of investors and counterparties willing to lend to us or purchase our securities. This could affect our growth, profitability and financial condition, including liquidity.
The indentures governing the Senior and Subordinated Notes contain, and any instruments governing future indebtedness would likely contain, restrictions that limit our flexibility in operating our business.
The indentures governing the Senior and Subordinated Notes contain, and any instruments governing future indebtedness would likely contain, a number of covenants that impose significant operating and financial restrictions on us, including restrictions on our ability to, among other things:
| ● | dispose of, or issue voting stock of, certain subsidiaries; or |
| ● | incur or permit to exist any mortgage, pledge, encumbrance or lien or charge on the capital stock of certain subsidiaries. |
Any of these restrictions could limit our ability to plan for or react to market conditions and could otherwise restrict corporate activities. Any failure to comply with these covenants could result in a default under the indentures governing the Senior and Subordinated Notes. Upon a default, holders of the Senior and Subordinated Notes have the ability ultimately to force us into bankruptcy or liquidation, subject to the indentures governing the Senior and Subordinated Notes. In addition, a default under the indentures governing the Senior and Subordinated Notes could trigger a cross default under the agreements governing our existing and future indebtedness. Our operating results may not be sufficient to service our indebtedness or to fund our other expenditures and we may not be able to obtain financing to meet these requirements.
45
Risks Related to our Industry
The soundness of other financial institutions could adversely affect our business.
Our ability to engage in routine funding transactions could be adversely affected by the actions and commercial soundness of other financial institutions. Financial services institutions are interrelated as a result of trading, clearing, counterparty and other relationships. We have exposure to many different counterparties and we routinely execute transactions with counterparties in the financial services industry, including brokers and dealers, commercial banks, credit unions, investment banks, mutual and hedge funds, and other institutional clients. As a result, defaults by, or even negative speculation about, one or more financial services institutions, or the financial services industry in general, have led to market-wide liquidity problems in the past and could lead to losses or defaults by us or by other institutions. Many of these transactions expose us to credit risk in the event of default of our counterparty or client. In addition, our credit risk may be exacerbated when we hold collateral that cannot be realized or is liquidated at prices not sufficient to recover the full amount of the receivable due to us. Any such losses could be material and could materially and adversely affect our business, financial condition, results of operations or cash flows.
We face strong competition from other financial institutions and financial service companies, which may adversely affect our operations and financial condition.
Our banking segment primarily competes with national, regional and community banks within various markets where the Bank operates. The Bank also faces competition from many other types of financial institutions, including savings and loan associations, savings banks, finance companies and credit unions. A number of these banks and other financial institutions have substantially greater resources and lending limits, larger branch systems and a wider array of banking services than we do. We also compete with other providers of financial services, such as money market mutual funds, brokerage and investment banking firms, consumer finance companies, pension trusts, governmental organizations and increasingly fintech companies, each of which may offer more favorable financing than we are able to provide. In addition, some of our non-bank competitors are not subject to the same extensive regulations that govern us. The banking business in Texas has remained competitive over the past several years, and we expect the level of competition we face to further increase. Competition for deposits and in providing lending products and services to consumers and businesses in our market area is intense and pricing is important. Other factors encountered in competing for savings deposits are convenient office locations, interest rates and fee structures of products offered. Direct competition for savings deposits also comes from other commercial bank and thrift institutions, money market mutual funds and corporate and government securities that may offer more attractive rates than insured depository institutions are willing to pay. Competition for loans is based on factors such as interest rates, loan origination fees and the range of services offered by the provider. We seek to distinguish ourselves from our competitors through our commitment to personalized customer service and responsiveness to customer needs while providing a range of competitive loan and deposit products and other services. Our profitability depends on our ability to compete effectively in these markets. This competition may reduce or limit our margins on banking services, reduce our market share and adversely affect our results of operations and financial condition.
The financial advisory and investment banking industries also are intensely competitive industries and will likely remain competitive. Our broker-dealer business competes directly with numerous other financial advisory and investment banking firms, broker-dealers and banks, including large national and major regional firms and smaller niche companies, some of whom are not broker-dealers and, therefore, not subject to the broker-dealer regulatory framework. In addition to competition from firms currently in the industry, there has been increasing competition from others offering financial services, including automated trading and other services based on technological innovations. Our broker-dealer business competes on the basis of a number of factors, including the quality of advice and service, technology, product selection, innovation, reputation, client relationships and price. Increased pressure created by any current or future competitors, or by competitors of our broker-dealer business collectively, could materially and adversely affect our business and results of operations. Increased competition may result in reduced revenue and loss of market share. Further, as a strategic response to changes in the competitive environment, our broker-dealer business may from time to time make certain pricing, service or marketing decisions that also could materially and adversely affect our business and results of operations.
Our mortgage origination business faces vigorous competition from banks and other financial institutions, including large financial institutions as well as independent mortgage banking companies, commercial banks, savings banks and
46
savings and loan associations. Our mortgage origination segment competes on a number of factors including customer service, quality and range of products and services offered, price, reputation, interest rates, closing process and duration, and loan origination fees. The ability to attract and retain skilled mortgage origination professionals is critical to our mortgage origination business. We seek to distinguish ourselves from our competitors through our commitment to personalized customer service and responsiveness to customer needs while providing a range of competitive mortgage loan products and services.
Overall, competition among providers of financial products and services continues to increase as technological advances have lowered the barriers to entry for financial technology companies, with consumers having the opportunity to select from a growing variety of traditional and nontraditional alternatives, including online checking, savings and brokerage accounts, online lending, online insurance underwriters, crowdfunding, digital wallets, and money transfer services. The ability of non-banking financial institutions to provide services previously limited to commercial banks has intensified competition. Because non-banking financial institutions are not subject to many of the same regulatory restrictions as banks and bank holding companies, they can often operate with greater flexibility and lower cost structures. This competition could result in the loss of customer deposits and brokerage accounts and lower mortgage originations which could have a material adverse effect on our financial condition and results of operations.
Acquisitions may be delayed, impeded, or prohibited due to regulatory issues.
Acquisitions by financial institutions are subject to approval by a variety of federal and state regulatory agencies. The process for obtaining these required regulatory approvals has become substantially more difficult in recent years. Regulatory approvals could be delayed, impeded, restrictively conditioned or denied due to existing or new regulatory issues we have, or may have, with regulatory agencies, including, without limitation, issues related to Bank Secrecy Act compliance, Community Reinvestment Act issues, fair lending laws, fair housing laws, consumer protection laws, unfair, deceptive, or abusive acts or practices regulations and other similar laws and regulations. We may fail to pursue, evaluate or complete strategic and competitively significant acquisition opportunities as a result of our inability, or perceived or anticipated inability, to obtain regulatory approvals in a timely manner, under reasonable conditions or at all. Difficulties associated with potential acquisitions that may result from these factors could have a material adverse effect on our business, financial condition and results of operations.
Legal and Regulatory Risks
We are subject to extensive supervision and regulation that could restrict our activities and impose financial requirements or limitations on the conduct of our business and limit our ability to generate income.
We are subject to extensive federal and state regulation and supervision, including that of the Federal Reserve Board, the Texas Department of Banking, the FDIC, the CFPB, the SEC and FINRA. Banking regulations are primarily intended to protect depositors’ funds, federal deposit insurance funds and the banking system as a whole, not stockholders or other debt holders. Likewise, regulations promulgated by the SEC and FINRA are primarily intended to protect the securities markets and customers of broker-dealer businesses rather than stockholders or other debt holders. Additionally, the Bank is subject to the CFPB’s supervisory and enforcement authority with respect to federal consumer financial laws.
These regulations affect our lending practices, capital structure, capital requirements, investment practices, brokerage and investment advisory activities, dividends and growth, among other things. Failure to comply with laws, regulations or policies could result in enforcement actions, money damages, civil money penalties or reputational damage, as well as sanctions and supervisory actions by regulatory agencies that could subject us to significant restrictions on or suspensions of our business and our ability to expand through acquisitions or branching. Further, our clearing contracts generally include automatic termination provisions that are triggered in the event we are suspended from any of the national exchanges of which we are a member for failure to comply with the rules or regulations thereof. While we have implemented policies and procedures designed to prevent any such violations of rules and regulations, such violations may occur from time to time, which could have a material adverse effect on our financial condition and results of operations.
The U.S. Congress, state legislatures, and federal and state regulatory agencies frequently revise banking and securities laws, regulations and policies. For example, several aspects of the Dodd-Frank Act have affected our business,
47
including, without limitation, increased capital requirements, increased mortgage regulation, restrictions on proprietary trading in securities, restrictions on investments in hedge funds and private equity funds, executive compensation restrictions, potential federal oversight of the insurance industry and disclosure and reporting requirements. Although the EGRRCPA is intended to ease the regulatory burden imposed by the Dodd-Frank Act with respect to company-run stress testing, resolution plans, the Volcker Rule, high volatility commercial real estate exposures, and real estate appraisals, at this time, it remains difficult to predict the full extent to which the Dodd-Frank Act the EGRRCPA, the AML 2020 Act or the resulting rules and regulations will affect our business. Compliance with new laws and regulations has resulted and likely will continue to result in additional costs, which could be significant and may adversely impact our results of operations, financial condition, and liquidity.
The Bank received a “satisfactory” CRA rating in connection with its most recent CRA performance evaluation. A CRA rating of less than “satisfactory” adversely affects a bank’s ability to establish new branches and impairs a bank’s ability to commence new activities that are “financial in nature” or acquire companies engaged in these activities. Other regulatory exam ratings or findings also may adversely impact our ability to branch, commence new activities or make acquisitions.
We cannot predict whether or in what form any other proposed regulations or statutes will be adopted or the extent to which our business may be affected by any new regulation or statute. These changes become less predictable, yet more likely to occur, following the transition of power from one presidential administration to another, especially as in 2021, when it involves a change in the governing political party. Any such changes could subject our business to additional costs, limit the types of financial services and products we may offer and increase the ability of non-banks to offer competing financial services and products, among other things.
We may be subject to more stringent capital requirements in the future.
We are subject to regulatory requirements specifying minimum amounts and types of capital that we must maintain. From time to time, the regulators change these regulatory capital adequacy guidelines. For example, on July 27, 2023, the Federal Reserve Board, the FDIC, and the Office of the Comptroller of the Currency issued a proposal, referred to as “Basel III Endgame,” that would result in significant changes to the U.S. regulatory capital rules for banking organizations with total consolidated assets of $100 billion or more.
If we fail to meet the minimum capital guidelines and other regulatory requirements as applicable to us, we or our subsidiaries may be restricted in the types of activities we may conduct and we may be prohibited from taking certain capital actions, such as paying dividends and repurchasing or redeeming capital securities.
Failure to meet minimum capital requirements could result in certain mandatory and possible additional discretionary actions by regulators that, if undertaken, could have an adverse material effect on our financial condition and results of operations. The application of more stringent capital requirements for Hilltop and PlainsCapital could, among other things, adversely affect our results of operations and growth, require the raising of additional capital, restrict our ability to pay dividends or repurchase shares and result in regulatory actions if we were to be unable to comply with such requirements.
Periodically, the SEC adopts amendments to Rules 15c3-1 and 15c3-3 under the Exchange Act related to our broker-dealer segment. The implementation of any new requirements from these amendments may increase our cost of regulatory compliance.
The CFPB has issued “ability-to-repay” and “qualified mortgage” rules that may have a negative impact on our loan origination process and foreclosure proceedings, which could adversely affect our business, operating results, and financial condition.
The CFPB’s “qualified mortgage” rule requires mortgage lenders to consider consumers’ ability to repay home loans before extending them credit. The rule describes certain minimum requirements for lenders making ability-to-repay determinations, but does not dictate that they follow particular underwriting models. Lenders are presumed to have complied with the ability-to-repay rule if they issue “qualified mortgages,” which are generally defined as mortgage loans prohibiting or limiting certain risky features. Loans that do not meet the ability-to-repay standard can be
48
challenged in court by borrowers who default and the absence of ability-to-repay status can be used against a lender in foreclosure proceedings. Any loans that we make outside of the “qualified mortgage” criteria, including the newly created “seasoned qualified mortgage” criteria could expose us to an increased risk of liability and reduce or delay our ability to foreclose on the underlying property. Any increases in compliance and foreclosure costs caused by the rule could negatively affect our business, operating results and financial condition.
Risks Related to Our Common Stock
We may issue shares of preferred stock or additional shares of common stock to complete an acquisition or effect a combination or under an employee incentive plan after consummation of an acquisition or business combination, which would dilute the interests of our stockholders and likely present other risks.
The issuance of shares of preferred stock or additional shares of common stock:
| ● | may significantly dilute the equity interest of our stockholders; |
| ● | may subordinate the rights of holders of common stock if preferred stock is issued with rights senior to those afforded our common stock; |
| ● | could cause a change in control if a substantial number of shares of common stock are issued, which may affect, among other things, our ability to use our net operating loss carry forwards; and |
| ● | may adversely affect prevailing market prices for our common stock. |
Our board of directors, in its sole discretion, may designate and issue one or more series of preferred stock from the authorized and unissued shares of preferred stock. Subject to limitations imposed by law or our articles of incorporation, our board of directors is empowered to determine the designation and number of shares constituting each series of preferred stock, as well as any designations, qualifications, privileges, limitations, restrictions or special or relative rights of additional series. The rights of preferred stockholders may supersede the rights of common stockholders. Preferred stock could be issued with voting and conversion rights that could adversely affect the voting power of the shares of our common stock. The issuance of preferred stock could also result in a series of securities outstanding that would have preferences over the common stock with respect to dividends and in liquidation.
Our common stock price may experience substantial volatility, which may affect your ability to sell our common stock at an advantageous price.
Price volatility of our common stock may affect your ability to sell our common stock at an advantageous price. Market price fluctuations in our common stock may arise due to acquisitions, dispositions or other material public announcements, including those regarding dividends or changes in management, along with a variety of additional factors, including, without limitation, other risks identified in “Forward-looking Statements” and these “Risk Factors.” In addition, the stock markets in general, including the NYSE, have experienced extreme price and trading fluctuations. These fluctuations have resulted in volatility in the market prices of securities that often have been unrelated or disproportionate to changes in operating performance. These broad market fluctuations may adversely affect the market price of our common stock.
Existing circumstances may result in several of our directors having interests that may conflict with our interests.
A director who has a conflict of interest with respect to an issue presented to our board will have no inherent legal obligation to abstain from voting upon that issue. We do not have provisions in our bylaws or charter that require an interested director to abstain from voting upon an issue, and we do not expect to add provisions in our charter and bylaws to this effect. Although each director has a duty to act in good faith and in a manner he or she reasonably believes to be in our best interests, there is a risk that, should interested directors vote upon an issue in which they or one of their affiliates has an interest, their vote may reflect a bias that could be contrary to our best interests. In addition, even if an interested director abstains from voting, the director’s participation in the meeting and discussion of an issue in which he or she has, or companies with which he or she is associated have, an interest could influence the votes of other directors regarding the issue.
49
Our rights and the rights of our stockholders to take action against our directors and officers are limited.
We are organized under Maryland law, which provides that a director or officer has no liability in that capacity if he or she performs his or her duties in good faith, in a manner he or she reasonably believes to be in our best interests and with the care that an ordinarily prudent person in a like position would use under similar circumstances. In addition, our charter eliminates our directors’ and officers’ liability to us and our stockholders for money damages, except for liability resulting from actual receipt of an improper benefit or profit in money, property or services or active and deliberate dishonesty established by a final judgment and that is material to the cause of action. Our bylaws require us to indemnify our directors and officers for liability resulting from actions taken by them in those capacities to the maximum extent permitted by Maryland law. As a result, our stockholders and we may have more limited rights against our directors and officers than might otherwise exist under common law. In addition, we may be obligated to fund the defense costs incurred by our directors and officers.
Our charter and bylaws contain provisions that could discourage acquisition bids or merger proposals, which may adversely affect the market price of our common stock.
Authority to Issue Additional Shares. Under our charter, our board of directors may issue up to an aggregate of ten million shares of preferred stock without stockholder action. The preferred stock may be issued, in one or more series, with the preferences and other terms designated by our board of directors that may delay or prevent a change in control of us, even if the change is in the best interests of stockholders. At December 31, 2023, no shares of preferred stock were outstanding.
Banking Laws. Any change in control of our company is subject to prior regulatory approval under the Bank Holding Company Act or the Change in Bank Control Act, which may delay, discourage or prevent an attempted acquisition or change in control of us.
FINRA. Any change in control (as defined under FINRA rules) of any of the Hilltop Broker-Dealers, including through acquisition, is subject to prior regulatory approval by FINRA which may delay, discourage or prevent an attempted acquisition or other change in control of such broker-dealers.
Restrictions on Calling Special Meeting, Cumulative Voting and Director Removal. Our bylaws include a provision prohibiting holders that do not or have not owned, continuously for at least one year as of the record date of such proposed meeting, capital stock representing at least 15% of the shares entitled to be voted at such proposed meeting, from calling a special meeting of stockholders. Our charter does not provide for the cumulative voting in the election of directors. In addition, our charter provides that our directors may only be removed for cause and then only by an affirmative vote of at least two-thirds of the votes entitled to be cast in the election of directors. Any amendment to our charter relating to the removal of directors requires the affirmative vote of two-thirds of all of the votes entitled to be cast on the matter. These provisions of our bylaws and charter may delay, discourage or prevent an attempted acquisition or change in control of us.
There can be no assurance that we will continue to declare cash dividends or repurchase stock.
In October 2016, we announced that our board of directors authorized a dividend program under which we intend to pay quarterly dividends on our common stock, subject to quarterly declarations by our board of directors. During 2023, we declared and paid cash dividends of $0.64 per common share.
In January 2023, our board of directors authorized a new stock repurchase program through January 2024, pursuant to which we are authorized to repurchase, in the aggregate, up to $75.0 million of our outstanding common stock. During 2023, we paid $5.1 million to repurchase an aggregate of 164,604 shares of our common stock at an average price of $30.95 per share pursuant to the stock repurchase program. These shares were returned to the pool of authorized but unissued shares of common stock.
In January 2024, our board of directors authorized a new stock repurchase program through January 2025, pursuant to which we are authorized to repurchase, in the aggregate, up to $75.0 million of our outstanding common stock. Such purchases may be subject to a nondeductible excise tax under the Inflation Reduction Act of 2022 equal to 1% of the fair market value of the shares repurchased, subject to certain limitations.
50
Any future declarations, amount and timing of any dividends and/or the amount and timing of such stock repurchases are subject to capital availability and the discretion of our board of directors, which must evaluate, among other things, whether cash dividends and/or stock repurchases are in the best interest of our stockholders and are in compliance with all applicable laws and any agreements containing provisions that limit our ability to declare and pay cash dividends and/or repurchase stock. Our ability to pay dividends and/or repurchase stock will depend upon, among other factors, our cash balances and potential future capital requirements for strategic transactions, including acquisitions, the ability of our subsidiaries to pay dividends to Hilltop, capital adequacy requirements and other regulatory restrictions on us and our subsidiaries, policies of the Federal Reserve Board, equity and debt service requirements senior to our common stock, earnings, financial condition, the general economic and regulatory climate and other factors beyond our control that our board of directors may deem relevant. In addition, the amount we spend and the number of shares we are able to repurchase under our stock repurchase program may further be affected by a number of other factors, including the stock price and blackout periods in which we are restricted from repurchasing shares. Our dividend payments and/or stock repurchases may change from time to time, and we cannot provide assurance that we will continue to declare dividends and/or repurchase stock in any particular amounts or at all. A reduction in or elimination of our dividend payments, our dividend program and/or stock repurchases could have a negative effect on our stock price.
An investment in our common stock is not an insured deposit.
An investment in our common stock is not a bank deposit and is not insured or guaranteed by the FDIC, SIPC or any other government agency. Accordingly, you should be capable of affording the loss of any investment in our common stock.
Item 1B. Unresolved Staff Comments.
None.
Item 1C. Cybersecurity.
Risk Management and Strategy
Hilltop recognizes the critical importance of protecting company data and the information systems that collect, process and maintain data, and we have developed an enterprise-wide program for assessing, identifying and managing material cybersecurity risks and threats. The systems we utilize include safeguards to protect against or mitigate possible threats, as well as controls designed to ensure accountability, availability, integrity and confidentiality of the data. Security measures are implemented to guard against unauthorized access, alteration, disclosure or destruction of data and systems, including accidental loss and destruction. Our program is supported by management and the board of directors.
Organizational Model
Our Information Security Department is comprised of three primary functions:
| ● | Information Technology (“IT”) Risk assesses technology risks and controls, evaluates application systems’ conformance to internally defined and approved security standards, coordinates audits and examinations for IT and IT security, as well as tracks open risk issues and exceptions. |
| ● | IT Security defines security policies and standards, conducts security awareness and training, evaluates security configuration and assesses vulnerability risk. |
| ● | Security Operations utilizes security solutions to detect and respond to security threats and supports the end-user security needs. We recognize the critical importance of developing, implementing, and maintaining robust cybersecurity measures to safeguard our information systems and protect the confidentiality, integrity and availability of our data. |
Supporting these core information security functions is an Information Security Engineering team within our Engineering organization. This team is charged with the configuration, implementation and ongoing maintenance of the solutions that enhance our security posture.
51
Managing Material Cybersecurity Risks
As a part of our overall risk management strategy, IT Risk conducts risk assessments on the technology environment as well as application systems implemented to support the various business functions of Hilltop based on the Gramm-Leach-Bliley Act guidance. Risks are identified from the Enterprise Risk Management and Internal Audit assessments of IT and Information Security. IT then quantifies the incidents and risks that have been identified and reports to the Operations & Strategy Committee, which is comprised of executives from across the enterprise representing disciplines including compliance, regulatory, information technology, risk, finance and operations, if they meet certain thresholds. The necessary controls are identified to address the risk and this control evaluation contributes to the assessment of the residual risk value. In 2023, additional assessments were completed utilizing the FFIEC Cybersecurity Assessment Tool and the Ransomware Self-Assessment Tool for the enterprise.
Engage Third-Parties on Risk Management
Recognizing the complexity and evolving nature of cybersecurity threats, Hilltop engages with a range of external experts, including cybersecurity assessors, consultants, and auditors in evaluating and testing our risk management systems. These partnerships enable us to leverage specialized knowledge and insights, ensuring our cybersecurity strategies and processes remain at the forefront of industry best practices. Our collaboration with these third-parties includes regular audits, threat assessments, and consultation on security enhancements. In particular, each year we engage a firm to perform penetration testing. We do not allow the same firm to be engaged for more than three years in an effort to obtain diversity in methods of testing. Additionally, at least every two years, we engage a firm to perform a red-team exercise for a simulated cybersecurity event.
Service Provider Oversight
HTH Procurement processes contract requests, contract renewals and onboard of vendors. Such process creates a single point of entry for all sourcing and contract requests. Vendors who match certain inherent risk levels are then sent to Vendor Risk Management (“VRM”) for further review and due diligence. Vendors who host Non-Public Personally Identifiable Information or vendors who we deem materially critical, regardless of risk, are managed by VRM. The VRM’s due diligence process is risk-based and serves as a verification and analysis tool to assist in the evaluation of risk associated with new vendor relationships and ongoing reviews of inherently high-risk and vital vendors. VRM also is tasked with monitoring managed vendors business continuity and disaster recovery processes.
VRM considers specific factors in performing their due diligence based on the risk profile of the high-risk and vital vendor and services being performed. The specific factors include, but are not limited to, a review of the vendor’s:
| ● | Information security and related controls (third-party audit); |
| ● | Existence of disaster recovery and business continuity program and testing; |
| ● | Financial status, including reviews of financial statements; and |
| ● | Geographic location (country risk). |
Material findings are reported to the Operations & Strategy Committee. A report of these vendors also is provided to the Risk Committee of the board of directors, which provides updates to the full board of directors.
Risks from Cybersecurity Threats
We face a number of cybersecurity risks in connection with our business. We do not currently believe that any current cybersecurity threats, including as a result of any previous cybersecurity incidents, have materially affected, or are reasonably likely to materially affect, Hilltop, including its business strategy, results of operations or financial condition. For more information about the cybersecurity risks we face, see Item 1A., “Risk Factors — Our operational systems and networks have been, and will continue to be, subject to an increasing risk of continually evolving cybersecurity or other technological risks, which could result in a loss of customer business, financial liability, regulatory penalties, damage to our reputation or the disclosure of confidential information.”
52
Governance
The board of directors is acutely aware of the critical nature of managing risks associated with cybersecurity threats. To address the significance of these threats to our operations, customers and stockholders, we have established oversight mechanisms to ensure effective management, oversight and governance in managing risks associated with cybersecurity threats.
Board of Directors Oversight
Our board of directors and the Risk Committee of the board of directors oversee an enterprise-wide approach to risk management, including cybersecurity risks, intended to support the achievement of organizational objectives, including strategic objectives, to improve long-term organizational performance and enhance stockholder value. The Risk Committee is central to the board of directors’ oversight of cybersecurity risks and bears the primary responsibility for this function. The Risk Committee is composed of board members with diverse expertise including, risk management assisting them to oversee cybersecurity risks. The Risk Committee receives regular reports from our Chief Information Officer (“CIO”) and provides updates to the full board of directors at each regular meeting of the board of directors, The Risk Committee also reviews all information security plans and policies, which are then recommended to the full board of directors for its review and approval.
Management’s Role Managing Risk
Our CIO plays a pivotal role in informing the Risk Committee on cybersecurity risks and developments. Our CIO provides comprehensive briefings to the Risk Committee on a regular basis, with a minimum frequency of four times per year. These briefings encompass a broad range of topics, including:
| ● | Current cybersecurity landscape and emerging threats; |
| ● | Status of ongoing cybersecurity initiatives and strategies; |
| ● | Incident reports and learnings from any cybersecurity events; |
| ● | Vulnerability management, including software patching, reviews of risk accepted vulnerabilities (remediated, renewed and top risks) and trends related thereto; and |
| ● | Compliance with regulatory requirements and industry standards. |
In addition to Risk Committee meetings, our CIO generally meets with executive management weekly to provide updates regarding current activities and areas of focus. In the event of a potential or actual cybersecurity event, the CIO immediately notifies the General Counsel at which point the information security incident response plan is activated if warranted. The information security incident response plan provides the procedures for responding, including personnel required to be informed and updated. The board of directors is informed promptly in the event such incident is, or is reasonably expected to have, a material impact on operations or financial condition. We also conduct cybersecurity tabletop exercises each year to ensure our processes and procedures align with our technical controls, and to ensure that the organization is prepared for a security-related event.
Primary responsibility for assessing, monitoring and managing our cybersecurity risks rests with our CIO. With over twenty years of experience in the field of cybersecurity, our CIO brings a wealth of expertise to his role. His background includes extensive experience in all facets of information technology and information security and is well-recognized within the industry. His in-depth knowledge and experience are instrumental in developing and executing our cybersecurity strategies.
Our CIO is responsible for our Information Security Program and our information security leaders report directly to our CIO. In order to maintain a separate reporting line for our information security leaders, we also maintain a standing committee, the Information Security Governance Committee, which consists of certain members of executive management and the information security leaders. Our Information Security Governance Committee allows for direct management reporting for IT Risk management, audit/examination report(s) review, and oversight of our IT Security strategy and daily Security Operations.
53
Monitor Cybersecurity Incidents
Our CIO is continually informed about the latest developments in cybersecurity, including potential threats and innovative risk management techniques. This ongoing knowledge acquisition is crucial for the effective prevention, detection, mitigation, and remediation of cybersecurity incidents. To assist our information security team in such knowledge acquisition, we subscribe to certain services that provide us alerts on security incidents and threats. Our CIO oversees the implementation of, and the processes for, the regular monitoring of our information systems. This includes the deployment of advanced security measures and regular system audits to identify potential vulnerabilities. As previously noted, in the event of a cybersecurity incident, the information security incident response plan is enacted. This plan includes immediate actions to mitigate the impact of and remediate the incident.
Item 2. Properties.
The principal office for both Hilltop and the Bank since February 2020 has been located in the City of University Park, Texas. In addition to our principal office, our business segments conduct business at various locations. We have options to renew leases at most locations that we do not own.
Banking. At December 31, 2023, our banking segment conducted business at 62 locations throughout Texas, including four support facilities. The Bank leases 38 banking locations, including its principal offices, and owns the remaining 24 banking locations.
Broker-Dealer. At December 31, 2023, our broker-dealer segment conducted business from 40 locations in 16 states. Each of these locations is leased by Hilltop Securities.
Mortgage Origination. At December 31, 2023, our mortgage origination segment conducted business from over 210 locations in 45 states. Each of these locations is leased by PrimeLending.
Item 3. Legal Proceedings.
For a description of material pending legal proceedings, see the discussion set forth under the heading “Legal Matters” in Note 18 to our Consolidated Financial Statements, which is incorporated by reference herein.
Item 4. Mine Safety Disclosures.
Not applicable.
54
PART II
Item 5. Market for Registrant’s Common Equity, Related Stockholder Matters and Issuer Purchases of Equity Securities.
Securities, Stockholder and Dividend Information
Our common stock is listed on the New York Stock Exchange under the symbol “HTH”. At February 12, 2024, there were 65,153,092 shares of our common stock outstanding with 304 stockholders of record.
In October 2016, we announced that our board of directors authorized a dividend program under which we pay quarterly dividends on our common stock, subject to quarterly declarations by our board of directors. During 2023, we declared and paid cash dividends of $0.64 per common share. On January 25, 2024, we announced that our board of directors increased our quarterly dividend to $0.17 per common share. Although we expect to continue to pay dividends, we may elect not to pay dividends. Any declarations of dividends, and the amount and timing thereof, will be at the discretion of our board of directors, which must evaluate, among other things, whether cash dividends are in the best interest of our stockholders and are in compliance with all applicable laws and any agreements containing provisions that limit our ability to declare and pay cash dividends. Our ability to pay dividends will depend upon, among other factors, our cash balances and potential future capital requirements for strategic transactions, including acquisitions, equity and debt service requirements senior to our common stock, earnings, financial condition, the general economic and regulatory climate and other factors beyond our control that our board of directors may deem relevant. Our dividend payments may change from time to time, and we cannot provide assurance that we will continue to declare dividends in any particular amounts or at all. A reduction in or elimination of our dividend payments and/or our dividend program could have a negative effect on our stock price. See Item 1A, “Risk Factors — Risks Related to our Common Stock — There can be no assurance that we will continue to declare cash dividends or repurchase stock.”
Securities Authorized for Issuance under Equity Compensation Plans
The following table sets forth information at December 31, 2023 with respect to compensation plans under which shares of our common stock may be issued. Additional information concerning our stock-based compensation plans is presented in Note 20, Stock-Based Compensation, in the notes to our consolidated financial statements.
Equity Compensation Plan Information |
| |||||||
|
|
| Number of securities |
| ||||
Number of securities | remaining available for |
| ||||||
to be issued upon | Weighted-average | future issuance under |
| |||||
exercise of | exercise price of | equity compensation plans |
| |||||
outstanding options, | outstanding options, | (excluding securities |
| |||||
Plan Category | warrants and rights | warrants and rights | reflected in first column) |
| ||||
Equity compensation plans approved by security holders* |
| — | $ | — |
| 1,995,985 | ||
Total |
| — | $ | — |
| 1,995,985 | ||
* | Represents shares available for future issuance under the Hilltop Holdings Inc. 2020 Equity Incentive Plan (the “2020 Plan”). |
Issuer Repurchases of Equity Securities
The following table details our repurchases of shares of common stock during the three months ended December 31, 2023.
Period |
| Total Number of Shares Purchased |
| Average Price Paid per Share |
| Total Number of Shares Purchased as Part of Publicly Announced Plans or Programs |
| Approximate Dollar Value of Shares that May Yet Be Purchased Under the Plans or Programs (1) | ||
October 1 - October 31, 2023 |
| — |
| $ | — | — | $ | 70,501,138 | ||
November 1 - November 30, 2023 |
| 20,001 | 29.48 | 20,001 | 69,911,473 | |||||
December 1 - December 31, 2023 |
| 200 | 29.50 | 200 | 69,905,574 | |||||
Total | 20,201 | $ | 29.48 | 20,201 | ||||||
55
| (1) | On January 26, 2023, we announced that our board of directors authorized a new stock repurchase program through January 2024, pursuant to which we are authorized to repurchase, in the aggregate, up to $75.0 million of our outstanding common stock, inclusive of repurchases to offset dilution related to grants of stock-based compensation. In January 2024, our board of directors authorized a new stock repurchase program through January 2025, pursuant to which we are authorized to repurchase, in the aggregate, up to $75.0 million of our outstanding common stock, inclusive of repurchases to offset dilution related to grants of stock-based compensation. With the adoption of the new stock repurchase plan in January 2024, the stock repurchase plan authorized in January 2023 expired. |
Item 6. [Reserved].
Item 7. Management’s Discussion and Analysis of Financial Condition and Results of Operations.
The following discussion is intended to help the reader understand our results of operations and financial condition and is provided as a supplement to, and should be read in conjunction with, our audited consolidated financial statements and the accompanying notes thereto commencing on page F-1. In addition to historical financial information, the following discussion and analysis contains forward-looking statements that involve risks, uncertainties and assumptions. Our results and the timing of selected events may differ materially from those anticipated in these forward-looking statements as a result of many factors, including those discussed under “Item 1A. Risk Factors” and elsewhere in this Annual Report. See “Forward-Looking Statements.”
Unless the context otherwise indicates, all references in this Management’s Discussion and Analysis of Financial Condition and Results of Operations, or MD&A, to the “Company,” “we,” “us,” “our” or “ours” or similar words are to Hilltop Holdings Inc. and its direct and indirect wholly owned subsidiaries, references to “Hilltop” refer solely to Hilltop Holdings Inc., references to “PCC” refer to PlainsCapital Corporation (a wholly owned subsidiary of Hilltop), references to “Securities Holdings” refer to Hilltop Securities Holdings LLC (a wholly owned subsidiary of Hilltop), references to “Hilltop Securities” refer to Hilltop Securities Inc. (a wholly owned subsidiary of Securities Holdings), references to “Momentum Independent Network” refer to Momentum Independent Network Inc. (a wholly owned subsidiary of Securities Holdings), Hilltop Securities and Momentum Independent Network are collectively referred to as the “Hilltop Broker-Dealers,” references to the “Bank” refer to PlainsCapital Bank (a wholly owned subsidiary of PCC), references to “FNB” refer to First National Bank, references to “SWS” refer to the former SWS Group, Inc., references to “PrimeLending” refer to PrimeLending, a PlainsCapital Company (a wholly owned subsidiary of the Bank) and its subsidiaries as a whole.
56
OVERVIEW
We are a financial holding company registered under the Bank Holding Company Act of 1956. Our primary line of business is to provide business and consumer banking services from offices located throughout Texas through the Bank. We also provide an array of financial products and services through our broker-dealer and mortgage origination segments. The following includes additional details regarding the financial products and services provided by each of our primary business units.
PCC. PCC is a financial holding company that provides, through its subsidiaries, traditional banking and wealth, investment and treasury management services primarily in Texas and residential mortgage loans throughout the United States.
Securities Holdings. Securities Holdings is a holding company that provides, through its subsidiaries, investment banking and other related financial services, including municipal advisory, sales, trading and underwriting of taxable and tax-exempt fixed income securities, clearing, securities lending, structured finance and retail brokerage services throughout the United States.
The following historical consolidated data for the periods indicated has been derived from our historical consolidated financial statements included elsewhere in this Annual Report (dollars in thousands, except per share data and weighted average shares outstanding).
| 2023 |
| 2022 |
| 2021 |
| ||||
Statement of Operations Data: | ||||||||||
Net interest income | $ | 466,847 | $ | 458,975 | $ | 422,982 | ||||
Provision for (reversal of) credit losses |
| 18,392 |
| 8,309 |
| (58,213) | ||||
Total noninterest income |
| 728,973 |
| 832,460 |
| 1,410,275 | ||||
Total noninterest expense |
| 1,028,309 |
| 1,126,999 |
| 1,387,398 | ||||
Income before income taxes |
| 149,119 |
| 156,127 |
| 504,072 | ||||
Income tax expense |
| 31,140 |
| 36,833 |
| 117,976 | ||||
Net income | 117,979 | 119,294 | 386,096 | |||||||
Less: Net income attributable to noncontrolling interest |
| 8,333 |
| 6,160 |
| 11,601 | ||||
Income attributable to Hilltop | $ | 109,646 | $ | 113,134 | $ | 374,495 | ||||
Per Share Data: | ||||||||||
Diluted earnings per common share | $ | 1.69 | $ | 1.60 | $ | 4.61 | ||||
Diluted weighted average shares outstanding |
| $ | 65,045 | $ | 70,626 | $ | 81,173 | |||
Cash dividends declared per common share | $ | 0.64 | $ | 0.60 | $ | 0.48 | ||||
Dividend payout ratio (1) | 37.97 | % | 37.36 | % | 10.34 | % | ||||
Book value per common share (end of year) | $ | 32.58 | $ | 31.49 | $ | 31.95 | ||||
Tangible book value per common share (2) (end of year) | $ | 28.35 | $ | 27.18 | $ | 28.37 | ||||
Balance Sheet Data: | ||||||||||
Total assets | $ | 16,466,996 | $ | 16,259,282 | $ | 18,689,080 | ||||
Cash and due from banks |
| 1,858,700 | 1,579,512 | 2,823,138 | ||||||
Securities |
| 2,836,584 | 3,289,530 | 3,046,500 | ||||||
Loans held for sale |
| 943,846 | 982,616 | 1,878,190 | ||||||
Loans held for investment, net of unearned income |
| 8,079,745 | 8,092,673 | 7,879,904 | ||||||
Allowance for credit losses |
| (111,413) | (95,442) | (91,352) | ||||||
Total deposits |
| 11,063,192 | 11,315,749 | 12,818,077 | ||||||
Notes payable |
| 347,145 | 346,654 | 387,904 | ||||||
Total stockholders' equity |
| 2,150,329 | 2,063,529 | 2,549,203 | ||||||
Capital Ratios: | ||||||||||
Common equity to assets ratio |
| 12.89 | % |
| 12.53 | % |
| 13.50 | % | |
Tangible common equity to tangible assets (2) |
| 11.41 | % |
| 11.00 | % |
| 12.17 | % | |
| (1) | Dividend payout ratio is defined as cash dividends declared per common share divided by basic earnings per common share. |
| (2) | For a reconciliation to the nearest GAAP measure, see “—Reconciliation and Management’s Explanation of Non-GAAP Financial Measures.” |
57
Consolidated income before income taxes during 2023 included the following contributions from our reportable business segments.
| ● | The banking segment contributed $199.0 million of income before income taxes during 2023; |
| ● | The broker-dealer segment contributed $73.5 million of income before income taxes during 2023; and |
| ● | The mortgage origination segment incurred $62.8 million of losses before income taxes during 2023. |
During 2023, we paid an aggregate of $5.1 million to repurchase shares of our common stock, and declared and paid total common dividends of $41.6 million.
On May 2, 2022, we announced the commencement of a modified “Dutch auction” tender offer to purchase shares of our common stock for an aggregate cash purchase price of up to $400 million, inclusive of our $100.0 million stock repurchase program authorized in January 2022. On May 27, 2022, including the exercise of our right to purchase up to an additional 2% of our outstanding shares, we completed our tender offer, repurchasing 14,868,469 shares of outstanding common stock at a price of $29.75 per share for a total of $442.3 million. We funded the tender offer with cash on hand.
On January 25, 2024, our board of directors declared a quarterly cash dividend of $0.17 per common share, a 6% increase from the prior quarter, payable on February 28, 2024 to all common stockholders of record as of the close of business on February 12, 2024. Additionally, our board of directors authorized a new stock repurchase program through January 2025, pursuant to which we are authorized to repurchase, in the aggregate, up to $75.0 million of our outstanding common stock. During 2023, we paid $5.1 million to repurchase an aggregate of 164,604 shares of our common stock at an average price of $30.95 per share pursuant to the stock repurchase program. These shares were returned to the pool of authorized but unissued shares of common stock.
Reconciliation and Management’s Explanation of Non-GAAP Financial Measures
We present certain measures in our selected financial data that are not measures of financial performance recognized by GAAP. “Tangible book value per common share” is defined as our total stockholders’ equity reduced by goodwill and other intangible assets, divided by total common shares outstanding. “Tangible common equity to tangible assets” is defined as our total stockholders’ equity reduced by goodwill and other intangible assets, divided by total assets reduced by goodwill and other intangible assets. These measures are important to investors interested in changes from period to period in tangible common equity per share exclusive of changes in intangible assets. For companies such as ours that have engaged in business combinations, purchase accounting can result in the recording of significant amounts of goodwill and other intangible assets related to those transactions.
You should not view this disclosure as a substitute for results determined in accordance with GAAP, and our disclosure is not necessarily comparable to that of other companies that use non-GAAP measures. The following table reconciles these non-GAAP financial measures to the most comparable GAAP financial measures, “book value per common share” and “equity to total assets” (dollars in thousands, except per share data).
December 31, | ||||||||||
| 2023 |
| 2022 |
| 2021 |
| ||||
Book value per common share | $ | 32.58 | $ | 31.49 | $ | 31.95 | ||||
Effect of goodwill and intangible assets per share | (4.23) | (4.31) | (3.58) | |||||||
Tangible book value per common share | $ | 28.35 | $ | 27.18 | $ | 28.37 | ||||
Hilltop stockholders’ equity | $ | 2,122,967 | $ | 2,036,924 | $ | 2,522,668 | ||||
Less: goodwill and intangible assets, net | 275,904 | 278,764 | 282,731 | |||||||
Tangible common equity | $ | 1,847,063 | $ | 1,758,160 | $ | 2,239,937 | ||||
Total assets | $ | 16,466,996 | $ | 16,259,282 | $ | 18,689,080 | ||||
Less: goodwill and intangible assets, net | 275,904 | 278,764 | 282,731 | |||||||
Tangible assets | $ | 16,191,092 | $ | 15,980,518 | $ | 18,406,349 | ||||
Equity to assets |
| 12.89 | % |
| 12.53 | % |
| 13.50 | % | |
Tangible common equity to tangible assets |
| 11.41 | % |
| 11.00 | % |
| 12.17 | % | |
58
Recent Developments
Economic Environment
Beginning in 2022, and continuing through 2023, our operational and financial results have been volatile due to economic headwinds including tight housing inventories on mortgage volumes, declining deposit balances, rapid increases in market interest rates and a volatile economic forecast. The impacts of such headwinds in 2024 remain uncertain and will depend on several developments outside of our control including, among others, the timing and significance of further changes in U.S. treasury yields and mortgage interest rates, exposure to increasing funding costs, inflationary pressures associated with compensation, occupancy and software costs and labor market conditions, and international armed conflicts and their impact on supply chains.
In addition, the banking sector experienced increased uncertainty and concerns associated with liquidity positions primarily due to high-profile bank failures during early 2023 as depositors sought to reduce risks associated with uninsured deposits and withdraw such deposits from existing bank relationships. As a result, both regulatory scrutiny and market focus on liquidity increased. While immediate financial institution safety and soundness concerns have somewhat subsided, these failures underscore the importance of maintaining access to diverse sources of funding.
In light of the above events, we have continued our efforts to monitor deposit flows and balance sheet trends to ensure that our liquidity needs and financial flexibility are maintained. During 2023, we began increasing interest-bearing deposit rates to address rising market interest rates and intense competition for liquidity to combat deposit outflows. The Bank also accessed additional core deposits from our Hilltop Securities Federal Deposit Insurance Corporation (“FDIC”) insured sweep program and utilized its Federal Home Loan Bank (“FHLB”) borrowing capacity through the use of short-term borrowings. Further, to bolster our liquidity position, we increased brokered deposits at the Bank by approximately $390 million during the second quarter of 2023 that had a remaining balance of approximately $208 million at December 31, 2023. Additionally, at December 31, 2023, we accessed approximately $1.1 billion of core deposits from our Hilltop Securities FDIC insured sweep program, while the Bank is not utilizing any of its FHLB borrowing capacity.
Market conditions and external factors may unpredictably impact the competitive landscape for deposits such as those experienced during the first quarter of 2023. Additionally, the rising market interest rate environment has increased competition for liquidity and the premium at which liquidity is available to meet funding needs. An unexpected influx of withdrawals of deposits could adversely impact our ability to rely on organic deposits to primarily fund our operations, potentially requiring greater reliance on secondary sources of liquidity to meet withdrawal deposits or to fund continuing operations. These sources may include proceeds from FHLB advances, sales of investment securities and loans, federal fund lines of credit with correspondent banks, securities sold under agreements to repurchase, brokered time deposits, borrowings from the Federal Reserve and borrowings under lines of credit with other financial institutions. Refer to the discussions in the “Segment Results – Banking Segment” and “Liquidity and Capital Resources – Banking Segment” sections that follow for more details regarding the Bank’s deposits, available liquidity and borrowing capacity at December 31, 2023.
As a result of the bank failures during early 2023 and in an effort to strengthen public confidence in the banking system and protect depositors, regulators announced that any losses to the Deposit Insurance Fund to support uninsured depositors will be recovered by a special assessment on banks, as required by law. On November 16, 2023, the FDIC adopted a final rule to implement this special assessment based on a banking organizations estimated uninsured deposits as of December 31, 2022, excluding the first $5 billion in estimated uninsured deposits. Based on our calculation, we do not expect the Bank to be impacted by this special assessment. Additionally, on March 12, 2023, the Treasury Department, Federal Reserve and FDIC jointly announced the Bank Term Funding Program (“BTFP”). The BTFP aims to enhance liquidity by allowing institutions to pledge certain securities at par value, and at a borrowing rate of ten basis points over the one-year overnight index swap rate. The BTFP is available to eligible U.S. federally insured depository institutions, with advances having a term of up to one year and no prepayment penalties. The future impact of these failures on the economy, financial institutions and their depositors, as well as a governmental regulatory response or actions resulting from the same, is uncertain at this time. To date, we have not leveraged the discount window at the Federal Reserve or the BTFP.
59
We expect uncertainties related to economic headwinds discussed above, the impact of interest rate movements on the shape and inversions of the yield curve, and the increasing cost and challenge for deposits that persisted through 2023 to continue into 2024.
Asset Valuation
At each reporting date between annual impairment tests, we consider potential indicators of impairment, including the condition of the economy and financial services industry; government intervention and regulatory updates; the impact of recent events to financial performance and cost factors of the business segment; performance of our stock and other relevant events.
In light of the recent and continuing macroeconomic challenges in the mortgage industry given tight housing inventories and mortgage interest rate levels, and specifically that our mortgage origination segment did not meet forecasted projections, we identified these collective factors as a triggering event during the second quarter of 2023. As a result, we performed an interim quantitative impairment test on the mortgage origination segment’s goodwill as of June 1, 2023 using revised forecasts and considering sensitivities of assumptions, and the decline in its carrying value, concluded that it was more likely than not that the mortgage origination segment’s estimated fair value of goodwill exceeded its carrying value. Subsequently, the mortgage origination segment continued to experience lower-than-forecasted operating results during the remainder of 2023 due to conditions and challenges noted above and discussed in detail within the discussion of segment results that follow.
Continuing macroeconomic challenges related to mortgage loan origination volumes, customer sensitivity to interest rates and resulting demand for certain products have resulted in a challenging environment associated with the broker-dealer segment’s short- and long-term financial condition, resulting in variability in its operating results.
Given the potential impacts of the operating performance of these reporting segments and overall economic conditions, actual results may differ materially from our current estimates as the scope of such impacts evolves or if the duration of business disruptions is longer than currently anticipated. The mortgage origination and broker-dealer segments have been assigned goodwill of $13.1 million and $7.0 million, respectively. Further, as a part of the most recent annual quantitative analysis performed as of October 1, 2023, management’s evaluation considered the sensitivities performed and the fact that the resulting estimated fair value of our mortgage origination and broker-dealer segments exceeded their respective book values by approximately 25% and 9%, respectively. Accordingly, at the conclusion of the annual assessments, the Company determined that as of October 1, 2023 it was more likely than not that the fair value of goodwill and other intangible assets exceeded their respective carrying values. We continue to monitor developments regarding overall economic conditions, market capitalization, and any other triggering events or circumstances that may indicate an impairment in the future.
To the extent future operating performance of our reporting segments remain challenged and below forecasted projections during 2024, significant assumptions such as expected future cash flows or the risk-adjusted discount rate used to estimate fair value are adversely impacted, or upon the occurrence of what management would deem to be a triggering event that could, under certain circumstances, cause us to perform impairment tests on our goodwill and other intangible assets, an impairment charge may be recorded for that period. In the event that we conclude that all or a portion of our goodwill and other intangible assets are impaired, a non-cash charge for the respective amount of such impairment would be recorded to earnings. Such a charge would have no impact on tangible capital or regulatory capital.
Outlook
Our balance sheet, operating results and certain metrics during 2023 reflected economic headwinds including tight housing inventories on mortgage volumes, declining deposit balances, increases in U.S. treasury yields and mortgage interest rates, and a volatile economic forecast. These headwinds, coupled with exposure to increasing funding costs, inflationary pressures associated with compensation, occupancy and software costs and labor market conditions, international armed conflicts and their impact on supply chains within our business segments during 2022 and 2023 have had, and are expected to continue to have, an adverse impact on our operating results during 2024.
60
See “Item 1A. Risk Factors” for additional discussion of the potential adverse impacts of unpredictable economic, market and business conditions on our business, results of operations and financial condition.
Factors Affecting Results of Operations
As a financial institution providing products and services through our banking, broker-dealer and mortgage origination segments, we are directly affected by general economic and market conditions, many of which are beyond our control and unpredictable. A key factor impacting our results of operations is changes in the level of interest rates in addition to twists in the shape of the yield curve with the magnitude and direction of the impact varying across the different lines of business. Other factors impacting our results of operations include, but are not limited to, fluctuations in volume and price levels of securities, inflation, political events, investor confidence, investor participation levels, legal, regulatory, and compliance requirements and competition. All of these factors have the potential to impact our financial position, operating results and liquidity. In addition, the recent economic and political environment has led to legislative and regulatory initiatives, both enacted and proposed, that could substantially change the regulation of the financial services industry and may significantly impact us.
Factors Affecting Comparability of Results of Operations
LIBOR Cessation
In July 2017, the Financial Conduct Authority (“FCA”) announced that it intends to cease compelling banks to submit rates for the calculation of the London Interbank Offered Rate (“LIBOR”) after 2021. In March 2021, the FCA and the Intercontinental Exchange (“ICE”) Benchmark Administration concurrently confirmed their original intention to stop requesting banks to submit the rates required to calculate LIBOR after the 2021 calendar year and additionally announced firm target dates for the phase out of various LIBOR tenors. Pursuant to the announcement, one week and two-month LIBOR ceased to be published on December 31, 2021, and all remaining USD LIBOR tenors ceased to be published or lost representativeness immediately after June 30, 2023. Additionally, the Financial Accounting Standards Board (“FASB”) issued specific accounting guidance that permits the use of the Overnight Index Swap rate based on the Secured Overnight Financing Rate (“SOFR”) to be designated as a benchmark interest rate for hedge accounting purposes.
Certain loans we originated bore interest at a floating rate based on LIBOR. We also paid interest on certain borrowings based on LIBOR and were counterparty to derivative agreements that were based on LIBOR and had contracts with payment calculations that used LIBOR as the reference rate.
In light of the LIBOR phase out, we took necessary actions, including the negotiation of certain of our agreements based on established alternative benchmark rates. Since the third quarter of 2020, PrimeLending has been originating conventional adjustable-rate mortgage, or ARM, loan products utilizing a SOFR rate with terms consistent with government-sponsored enterprise, or GSE, guidelines. In addition, the Bank’s management team has completed its efforts to amend LIBOR-based contractual terms and establish an alternative benchmark rate. An immaterial amount of expenses have been incurred as a result of our efforts related to the transition of our systems and processes away from LIBOR.
Brokered Deposits
In December 2020, the Federal Deposit Insurance Corporation (“FDIC”) finalized revisions to its rules and prior guidance regarding brokered deposits (the “Revisions”). The Revisions are intended to modernize the FDIC’s framework for regulating brokered deposits and ensure that the classification of a deposit as brokered appropriately reflects changes in the banking landscape. In addition, the Revisions are intended to modify the interest rate restrictions applicable to certain depository institutions and clarify the application of the brokered deposit requirements to non-maturity deposits. The Revisions became effective on April 1, 2021, but full compliance was not required during a transitionary period ended January 1, 2022. We evaluated the Revisions and published FDIC guidance and effective January 1, 2022, after consulting with the FDIC, continue to treat deposits swept to the banking segment from the broker-dealer segment as non-brokered, while the cost of these sweep deposits will be based on a current market rate of interest rather than a per account fee.
61
Recent Acquisitions
On November 30, 2012, we acquired PlainsCapital Corporation pursuant to a plan of merger whereby PlainsCapital Corporation merged with and into our wholly owned subsidiary (the “PlainsCapital Merger”), which continued as the surviving entity under the name “PlainsCapital Corporation”. Concurrent with the consummation of the PlainsCapital Merger, Hilltop became a financial holding company registered under the Bank Holding Company Act of 1956.
On September 13, 2013 (the “Bank Closing Date”), the Bank assumed substantially all of the liabilities, including all of the deposits, and acquired substantially all of the assets of Edinburg, Texas-based FNB from the FDIC, as receiver, and reopened former branches of FNB acquired from the FDIC under the “PlainsCapital Bank” name (the “FNB Transaction”).
On January 1, 2015, we acquired SWS in a stock and cash transaction (the “SWS Merger”), whereby SWS’s broker-dealer subsidiaries became subsidiaries of Securities Holdings and SWS’s banking subsidiary, Southwest Securities, FSB, was merged into the Bank. On October 5, 2015, Southwest Securities, Inc. was renamed “Hilltop Securities Inc.”
On August 1, 2018, we acquired privately-held, Houston-based BORO in an all-cash transaction (“BORO Acquisition”). In connection with the BORO Acquisition, we merged BORO into the Bank, and all customer accounts were converted to the PlainsCapital Bank platform.
Segment Information
We have two primary business units, PCC (banking and mortgage origination) and Securities Holdings (broker-dealer). Under accounting principles generally accepted in the United States (“GAAP”), the business units are comprised of three reportable business segments organized primarily by the core products offered to the segments’ respective customers: banking, broker-dealer and mortgage origination. Consistent with our historical segment operating results, we anticipate that future revenues will be driven primarily from the banking segment, with the remainder being generated by our broker-dealer and mortgage origination segments. Operating results for the mortgage origination segment have historically been more volatile than operating results for the banking and broker-dealer segments.
The banking segment includes the operations of the Bank. The banking segment primarily provides business and consumer banking services from offices located throughout Texas and generates revenue from its portfolio of earning assets. The Bank’s results of operations are primarily dependent on net interest income. The Bank also derives revenue from other sources, including service charges on customer deposit accounts and trust fees.
The broker-dealer segment includes the operations of Securities Holdings, which operates through its wholly owned subsidiaries Hilltop Securities, Momentum Independent Network and Hilltop Securities Asset Management, LLC. The broker-dealer segment generates a majority of its revenues from fees and commissions earned from investment advisory and securities brokerage services. Hilltop Securities is a broker-dealer registered with the SEC and the Financial Industry Regulatory Authority (“FINRA”) and a member of the New York Stock Exchange (“NYSE”). Momentum Independent Network is an introducing broker-dealer that is also registered with the SEC and FINRA. Hilltop Securities, Momentum Independent Network and Hilltop Securities Asset Management, LLC are registered investment advisers under the Investment Advisers Act of 1940.
The mortgage origination segment includes the operations of PrimeLending, which offers a variety of loan products and generates revenue predominantly from fees charged on the origination and servicing of loans and from selling these loans in the secondary market.
Corporate includes certain activities not allocated to specific business segments. These activities include holding company financing and investing activities, merchant banking investment opportunities, and management and administrative services to support the overall operations of the Company.
62
The eliminations of intercompany transactions are included in “All Other and Eliminations.” Additional information concerning our reportable business segments is presented in Note 27, Segment and Related Information, in the notes to our consolidated financial statements.
The following table presents certain information about the continuing operating results of our reportable business segments (in thousands). This table serves as a basis for the discussion and analysis in the segment operating results sections that follow.
Year Ended December 31, | Variance 2023 vs 2022 | Variance 2022 vs 2021 | |||||||||||||||||
2023 | 2022 | 2021 | Amount | Percent | Amount | Percent | |||||||||||||
Net interest income (expense): | |||||||||||||||||||
Banking | $ | 397,936 | $ | 413,603 | $ | 406,524 | $ | (15,667) | (4) | $ | 7,079 | 2 | |||||||
Broker-Dealer | 52,894 | 51,597 | 43,296 | 1,297 | 3 | 8,301 | 19 | ||||||||||||
Mortgage Origination | (20,305) | (10,529) | (20,400) | (9,776) | (93) | 9,871 | 48 | ||||||||||||
Corporate | (12,961) | (13,135) | (17,239) | 174 | 1 | 4,104 | 24 | ||||||||||||
All Other and Eliminations (1) | 49,283 | 17,439 | 10,801 | 31,844 | 183 | 6,638 | 61 | ||||||||||||
Hilltop Consolidated | $ | 466,847 | $ | 458,975 | $ | 422,982 | $ | 7,872 | 2 | $ | 35,993 | 9 | |||||||
Provision for (reversal of) credit losses: | |||||||||||||||||||
Banking | $ | 18,525 | $ | 8,250 | $ | (58,175) | $ | 10,275 | 125 | $ | 66,425 | NM | |||||||
Broker-Dealer | (133) | 59 | (38) | (192) | (325) | 97 | NM | ||||||||||||
Mortgage Origination | — | — | — | — | — | - | - | ||||||||||||
Corporate | — | — | — | — | — | - | - | ||||||||||||
All Other and Eliminations | — | — | — | — | — | - | - | ||||||||||||
Hilltop Consolidated | $ | 18,392 | $ | 8,309 | $ | (58,213) | $ | 10,083 | 121 | $ | 66,522 | NM | |||||||
Noninterest income: | |||||||||||||||||||
Banking | $ | 45,830 | $ | 49,307 | $ | 45,113 | $ | (3,477) | (7) | $ | 4,194 | 9 | |||||||
Broker-Dealer | 403,538 | 341,943 | 381,125 | 61,595 | 18 | (39,182) | (10) | ||||||||||||
Mortgage Origination | 316,840 | 452,915 | 986,990 | (136,075) | (30) | (534,075) | (54) | ||||||||||||
Corporate | 12,887 | 7,525 | 9,133 | 5,362 | 71 | (1,608) | (18) | ||||||||||||
All Other and Eliminations (1) | (50,122) | (19,230) | (12,086) | (30,892) | (161) | (7,144) | (59) | ||||||||||||
Hilltop Consolidated | $ | 728,973 | $ | 832,460 | $ | 1,410,275 | $ | (103,487) | (12) | $ | (577,815) | (41) | |||||||
Noninterest expense: | |||||||||||||||||||
Banking | $ | 226,234 | $ | 235,190 | $ | 226,915 | $ | (8,956) | (4) | $ | 8,275 | 4 | |||||||
Broker-Dealer | 383,024 | 355,713 | 380,798 | 27,311 | 8 | (25,085) | (7) | ||||||||||||
Mortgage Origination | 359,285 | 478,904 | 731,056 | (119,619) | (25) | (252,152) | (34) | ||||||||||||
Corporate | 60,631 | 59,030 | 50,507 | 1,601 | 3 | 8,523 | 17 | ||||||||||||
All Other and Eliminations | (865) | (1,838) | (1,878) | 973 | 53 | 40 | 2 | ||||||||||||
Hilltop Consolidated | $ | 1,028,309 | $ | 1,126,999 | $ | 1,387,398 | $ | (98,690) | (9) | $ | (260,399) | (19) | |||||||
Income (loss) before taxes: | |||||||||||||||||||
Banking | $ | 199,007 | $ | 219,470 | $ | 282,897 | $ | (20,463) | (9) | $ | (63,427) | (22) | |||||||
Broker-Dealer | 73,541 | 37,768 | 43,661 | 35,773 | 95 | (5,893) | (13) | ||||||||||||
Mortgage Origination | (62,750) | (36,518) | 235,534 | (26,232) | (72) | (272,052) | (116) | ||||||||||||
Corporate | (60,705) | (64,640) | (58,613) | 3,935 | 6 | (6,027) | (10) | ||||||||||||
All Other and Eliminations | 26 | 47 | 593 | (21) | (45) | (546) | (92) | ||||||||||||
Hilltop Consolidated | $ | 149,119 | $ | 156,127 | $ | 504,072 | $ | (7,008) | (4) | $ | (347,945) | (69) | |||||||
| (1) | All other and eliminations amounts during each period include FDIC sweep program revenues and expenses earned on broker-dealer segment deposits placed with the banking segment that are eliminated in consolidation. |
NMNot meaningful
Key Performance Indicators
We utilize several key indicators of financial condition and operating performance to evaluate the various aspects of our business. In addition to traditional financial metrics, such as revenue and growth trends, we monitor several other financial measures and non-financial operating metrics to help us evaluate growth trends, measure the adequacy of our capital based on regulatory reporting requirements, measure the effectiveness of our operations and assess operational efficiencies. These indicators change from time to time as the opportunities and challenges in our businesses change.
63
Specifically, performance ratios and asset quality ratios are typically used for measuring the performance of banking and financial institutions. We consider return on average stockholders’ equity, return on average assets and net interest margin to be important supplemental measures of operating performance that are commonly used by securities analysts, investors and other parties interested in the banking and financial industry. The net recoveries (charge-offs) to average loans outstanding ratio is also considered a key measure for our banking segment as it indicates the performance of our loan portfolio.
In addition, we consider regulatory capital ratios to be key measures that are used by us, as well as banking regulators, investors and analysts, to assess our regulatory capital position and to compare our regulatory capital to that of other financial services companies. We monitor our capital strength in terms of both leverage ratio and risk-based capital ratios based on capital requirements administered by the federal banking agencies. The risk-based capital ratios are minimum supervisory ratios generally applicable to banking organizations, but banking organizations are widely expected to operate with capital positions well above the minimum ratios. Failure to meet minimum capital requirements can initiate certain mandatory actions by regulators that, if undertaken, could have a material effect on our financial condition or results of operations.
How We Generate Revenue
We generate revenue from net interest income and from noninterest income. Net interest income represents the difference between the income earned on our assets, including our loans and investment securities, and our cost of funds, including the interest paid on the deposits and borrowings that are used to support our assets. Net interest income is a significant contributor to our operating results. Fluctuations in interest rates, as well as the amounts and types of interest-earning assets and interest-bearing liabilities we hold, affect net interest income. We generated $466.8 million in net interest income during 2023, compared with net interest income of $459.0 million and $423.0 million during 2022 and 2021, respectively. The change in reportable business segment net interest income during 2023, compared with 2022, primarily reflected decreases within our banking and mortgage origination segments.
The other component of our revenue is noninterest income, which is primarily comprised of the following:
| (i) | Income from broker-dealer operations. Through Securities Holdings, we provide investment banking and other related financial services that generated $256.2 million, $266.5 million and $296.3 million in securities commissions and fees and investment and securities advisory fees and commissions, and $97.0 million, $61.1 million and $75.2 million in gains from derivative and trading portfolio activities (included within other noninterest income) during 2023, 2022 and 2021, respectively. |
| (ii) | Income from mortgage operations. Through PrimeLending, we generate noninterest income by originating and selling mortgage loans. During 2023, 2022 and 2021, we generated $316.7 million, $452.0 million and $986.0 million, respectively, in net gains from sale of loans, other mortgage production income (including income associated with retained mortgage servicing rights), and mortgage loan origination fees. |
In the aggregate, we generated $0.7 billion, $0.8 billion and $1.4 billion in noninterest income during 2023, 2022 and 2021, respectively. The decrease in noninterest income during 2023, compared with 2022, was predominantly attributable, as noted in the segment results table previously presented, to a decrease of $135.3 million in net gains from sale of loans, other mortgage production income and mortgage loan origination fees within our mortgage origination segment, partially offset by an increase of $35.9 million in gains from derivative and trading portfolio activities within our broker-dealer segment.
We also incur noninterest expenses in the operation of our businesses. Our businesses engage in labor intensive activities and, consequently, employees’ compensation and benefits represent the majority of our noninterest expenses.
64
Consolidated Operating Results
Income applicable to common stockholders during 2023 was $109.6 million, or $1.69 per diluted share, compared with $113.1 million, or $1.60 per diluted share, during 2022, and $374.5 million, or $4.61 per diluted share, during 2021. Hilltop’s financial results during 2023 included decreases in year-over-year mortgage origination segment net gains from sales of loans and other mortgage production income, a decline in net interest income within the banking segment, and increases in net revenues within all of the broker-dealer segment’s business lines.
Hilltop’s financial results during 2022 reflected a significant decreases in year-over-year mortgage origination segment net gains from sales of loans and other mortgage production income, while the banking segment recorded a provision for credit losses as opposed to a reversal of credit losses in the prior year.
Certain items included in net income during 2023, 2022 and 2021 resulted from purchase accounting associated with the PlainsCapital Merger, the FNB Transaction, the SWS Merger and the BORO Acquisition (collectively, the “Bank Transactions”). Income before income taxes during 2023, 2022 and 2021 included net accretion on earning assets and liabilities of $8.6 million, $10.8 million and $19.2 million, respectively, and amortization of identifiable intangibles of $2.9 million, $4.5 million and $5.2 million, respectively, related to the Bank Transactions.
The information shown in the table below includes certain key performance indicators on a consolidated basis.
Year Ended December 31, | |||||||||
2023 |
| 2022 |
| 2021 |
| ||||
Return on average stockholders' equity (1) | 5.31 | % | 5.11 | % | 15.38 | % | |||
Return on average assets (2) | 0.71 | % | 0.69 | % | 2.17 | % | |||
Net interest margin (3) (4) | 3.07 | % | 2.87 | % | 2.57 | % | |||
Leverage ratio (5) (end of year) | 12.23 | % | 11.47 | % | 12.58 | % | |||
Common equity Tier 1 risk-based capital ratio (6) | 19.32 | % | 18.23 | % | 21.22 | % | |||
| (1) | Return on average stockholders’ equity is defined as consolidated income attributable to Hilltop divided by average total Hilltop stockholders’ equity. |
| (2) | Return on average assets is defined as consolidated net income divided by average assets. |
| (3) | Net interest margin is defined as net interest income divided by average interest-earning assets. We consider net interest margin as a key indicator of profitability as it represents interest earned on our interest-earning assets compared to interest incurred. |
| (4) | The securities financing operations within our broker-dealer segment had the effect of lowering both net interest margin and taxable equivalent net interest margin by 26 basis points, 21 basis points and 16 basis points during 2023, 2022 and 2021, respectively. |
| (5) | The leverage ratio is a regulatory capital ratio and is defined as Tier 1 risk-based capital divided by average consolidated assets. |
| (6) | The common equity Tier 1 risk-based capital ratio is a regulatory capital ratio and is defined as common equity Tier 1 risk-based capital divided by risk weighted assets. Common equity includes common equity Tier 1 capital (common stockholders’ equity and certain minority interests in the equity capital accounts of consolidated subsidiaries, but excluding goodwill and various intangible assets) and additional Tier 1 capital (certain qualifying minority interests not included in common equity Tier 1 capital, certain preferred stock and related surplus, and certain subordinated debt). |
We present net interest margin and net interest income below on a taxable-equivalent basis. Net interest margin (taxable equivalent), a non-GAAP measure, is defined as taxable equivalent net interest income divided by average interest earning assets. Taxable equivalent adjustments are based on the applicable corporate federal income tax rate of 21% for all periods presented. The interest income earned on certain earning assets is completely or partially exempt from federal income tax. As such, these tax-exempt instruments typically yield lower returns than taxable investments. To provide more meaningful comparisons of net interest margins for all earning assets, we use net interest income on a taxable-equivalent basis in calculating net interest margin by increasing the interest income earned on tax-exempt assets to make it fully equivalent to interest income earned on taxable investments.
During 2023, 2022 and 2021, purchase accounting contributed 6, 7 and 12 basis points, respectively, to our consolidated taxable equivalent net interest margin of 3.09%, 2.88% and 2.58%, respectively. The purchase accounting activity is primarily related to the accretion of discount of loans which totaled $8.6 million, $10.5 million and $18.8 million during 2023, 2022 and 2021, respectively, associated with the Bank Transactions.
65
The table below provides additional details regarding our consolidated net interest income (dollars in thousands).
Year Ended December 31, |
| ||||||||||||||||||||||||
2023 | 2022 | 2021 |
| ||||||||||||||||||||||
| Average |
| Interest |
| Annualized |
| Average |
| Interest |
| Annualized |
| Average |
| Interest |
| Annualized |
| |||||||
Outstanding | Earned | Yield or | Outstanding | Earned | Yield or | Outstanding | Earned | Yield or |
| ||||||||||||||||
Balance | or Paid | Rate | Balance | or Paid | Rate | Balance | or Paid | Rate |
| ||||||||||||||||
Assets | |||||||||||||||||||||||||
Interest-earning assets | |||||||||||||||||||||||||
Loans held for sale | $ | 944,470 | $ | 53,736 |
| 5.69 | % | $ | 1,221,235 | $ | 52,315 |
| 4.28 | % | $ | 2,293,543 | $ | 64,767 |
| 2.82 | % | ||||
Loans held for investment, gross (1) | 7,950,878 | 488,538 |
| 6.23 | % | 7,840,848 | 363,892 |
| 4.71 | % | 7,645,292 | 339,548 |
| 4.44 | % | ||||||||||
Investment securities - taxable |
| 2,726,763 |
| 108,250 |
| 3.97 | % |
| 2,819,282 |
| 75,805 |
| 2.69 | % |
| 2,493,848 |
| 47,582 |
| 1.91 | % | ||||
Investment securities - non-taxable (2) |
| 363,493 |
| 13,463 |
| 3.70 | % |
| 310,315 |
| 11,608 |
| 3.74 | % |
| 313,703 |
| 11,448 |
| 3.65 | % | ||||
Federal funds sold and securities purchased under agreements to resell |
| 145,696 |
| 8,954 |
| 6.15 | % |
| 162,575 |
| 4,098 |
| 2.52 | % |
| 152,273 |
| 372 |
| 0.24 | % | ||||
Interest-bearing deposits in other financial institutions |
| 1,597,865 |
| 79,657 |
| 4.99 | % |
| 2,306,960 |
| 31,705 |
| 1.37 | % |
| 2,078,666 |
| 2,942 |
| 0.14 | % | ||||
Securities borrowed | 1,409,765 | 71,924 | 5.03 | % | 1,298,276 | 44,414 | 3.37 | % | 1,445,464 | 61,667 | 4.21 | % | |||||||||||||
Other |
| 65,912 |
| 16,554 |
| 25.11 | % |
| 55,280 |
| 8,873 |
| 16.05 | % |
| 50,929 |
| 3,332 |
| 6.54 | % | ||||
Interest-earning assets, gross (2) |
| 15,204,842 |
| 841,076 |
| 5.53 | % |
| 16,014,771 |
| 592,710 |
| 3.70 | % |
| 16,473,718 |
| 531,658 |
| 3.23 | % | ||||
Allowance for credit losses |
| (103,975) |
| (92,828) |
| (129,689) | |||||||||||||||||||
Interest-earning assets, net |
| 15,100,867 |
| 15,921,943 |
| 16,344,029 | |||||||||||||||||||
Noninterest-earning assets |
| 1,404,393 |
| 1,488,970 |
| 1,451,928 | |||||||||||||||||||
Total assets | $ | 16,505,260 | $ | 17,410,913 | $ | 17,795,957 | |||||||||||||||||||
Liabilities and Stockholders' Equity | |||||||||||||||||||||||||
Interest-bearing liabilities | |||||||||||||||||||||||||
Interest-bearing deposits | $ | 7,711,570 | $ | 223,179 |
| 2.89 | % | $ | 7,561,501 | $ | 50,412 |
| 0.67 | % | $ | 7,722,584 | $ | 23,624 |
| 0.31 | % | ||||
Securities loaned | 1,331,443 | 65,175 | 4.90 | % | 1,184,498 | 38,570 | 3.26 | % | 1,374,142 | 50,974 | 3.71 | % | |||||||||||||
Notes payable and other borrowings |
| 1,579,170 |
| 83,174 |
| 5.27 | % |
| 1,293,133 |
| 43,158 |
| 3.34 | % |
| 1,216,381 |
| 32,393 |
| 2.66 | % | ||||
Total interest-bearing liabilities |
| 10,622,183 |
| 371,528 |
| 3.50 | % |
| 10,039,132 |
| 132,140 |
| 1.32 | % |
| 10,313,107 |
| 106,991 |
| 1.04 | % | ||||
Noninterest-bearing liabilities | |||||||||||||||||||||||||
Noninterest-bearing deposits |
| 3,441,437 |
| 4,455,779 |
| 4,157,962 | |||||||||||||||||||
Other liabilities |
| 351,938 |
| 675,628 |
| 863,976 | |||||||||||||||||||
Total liabilities |
| 14,415,558 |
| 15,170,539 |
| 15,335,045 | |||||||||||||||||||
Stockholders’ equity |
| 2,063,174 |
| 2,213,733 |
| 2,435,185 | |||||||||||||||||||
Noncontrolling interest |
| 26,528 |
| 26,641 |
| 25,727 | |||||||||||||||||||
Total liabilities and stockholders' equity | $ | 16,505,260 | $ | 17,410,913 | $ | 17,795,957 | |||||||||||||||||||
Net interest income (2) | $ | 469,548 | $ | 460,570 | $ | 424,667 | |||||||||||||||||||
Net interest spread (2) |
| 2.03 | % |
| 2.38 | % |
| 2.19 | % | ||||||||||||||||
Net interest margin (2) |
| 3.09 | % |
| 2.88 | % |
| 2.58 | % | ||||||||||||||||
| (1) | Average balance includes non-accrual loans. |
| (2) | Presented on a taxable equivalent basis with taxable equivalent adjustments based on the applicable corporate federal income tax rate of 21% for the periods presented. The adjustment to interest income was $2.7 million, $1.6 million and $1.7 million during 2023, 2022 and 2021, respectively. |
The banking segment’s net interest margin exceeds our consolidated net interest margin shown above. Our consolidated net interest margin includes certain items that are not reflected in the calculation of our net interest margin within our banking segment and reduce our consolidated net interest margin, such as the borrowing costs of Hilltop and the yields and costs associated with certain items within interest-earning assets and interest-bearing liabilities, such as securities borrowed in the broker-dealer segment and securities loaned in the broker-dealer segment, including items related to securities financing operations that particularly decrease net interest margin. In addition, yields and costs on certain interest-earning assets, such as lines of credit extended to other operating segments by the banking segment, are eliminated from the consolidated financial statements.
66
On a consolidated basis, the changes in net interest income during 2023, compared with 2022, were primarily due to changes within the banking segment related to changes in the rates earned or paid on interest-earning assets and interest-bearing liabilities and increased net yields on mortgage loans held for sale and decreases in average warehouse line balance with an unaffiliated bank within the mortgage origination segment. Refer to the discussion in the “Banking Segment” section that follows for more details on the changes in net interest income, including the component changes in the volume of average interest-earning assets and interest-bearing liabilities and changes in the rates earned or paid on those items.
The provision for (reversal of) credit losses is determined by management as the amount necessary to maintain the allowance for credit losses at the amount of expected credit losses inherent within the loans held for investment portfolio. The amount of expense and the corresponding level of allowance for credit losses for loans are based on our evaluation of the collectability of the loan portfolio based on historical loss experience, reasonable and supportable forecasts, and other significant qualitative and quantitative factors. Substantially all of our consolidated provision for (reversal of) credit losses is related to the banking segment. During 2023, the provision for credit losses reflected a significant build in the allowance related to loan portfolio changes since December 31, 2022 and a deteriorating outlook for commercial real estate markets. During 2022, the provision for credit losses was driven by a deteriorating U.S. economic outlook since December 31, 2021. Refer to the discussion in the “Financial Condition – Allowance for Credit Losses on Loans” section that follows for more details regarding the significant assumptions and estimates involved in estimating credit losses.
Noninterest income decreased during 2023, compared with 2022, primarily due to decreases in total mortgage loan sales volume and average loan sales margin within our mortgage origination segment, partially offset by net increases within all of the broker-dealer segment’s business lines. The decrease in noninterest income during 2022, compared with 2021, was primarily due to decreases in total mortgage loan sales volume and average loan sales margin within our mortgage origination segment, and net declines in investment advisory fees and trading gains primarily within the broker-dealer segment’s public finance services and structured finance business lines.
Noninterest expense decreased during 2023, compared with 2022, primarily due to decreases in variable compensation associated with decreases in total mortgage loan sales volume and average loan sales margin within our mortgage origination segment, partially offset by increases in non-variable compensation and other segment operating costs within our broker-dealer segment. We have experienced an increase in certain noninterest expenses during 2023 and 2022, compared with respective prior periods, including compensation, occupancy, and software costs, due to inflationary pressures. We expect such inflationary headwinds to continue and result in higher fixed costs into 2024. The decrease in noninterest expense during 2022, compared with 2021, was primarily due to decreases in both variable and non-variable compensation within our mortgage origination segment associated with the decreased mortgage loan originations, and a decline in variable compensation within our broker-dealer segment, partially offset by increases within our banking segment.
Effective income tax rates were 20.9%, 23.6% and 23.4% for 2023, 2022 and 2021, respectively. The effective tax rate for 2023 was lower than the applicable statutory rate due to the impacts of excess tax benefits on share-based payment awards, investments in tax-exempt instruments and changes in accumulated tax reserves, partially offset by nondeductible expenses and the booking of additional taxes from a recent change in the source of funding for an acquired non-qualified, deferred compensation plan, while 2022 and 2021 approximated statutory rates and included the effect of investments in tax-exempt instruments, offset by nondeductible expenses.
67
Segment Results
Banking Segment
The following table presents certain information about the operating results of our banking segment (in thousands).
Year Ended December 31, | Variance | ||||||||||||||
2023 | 2022 | 2021 | 2023 vs 2022 | 2022 vs 2021 | |||||||||||
Net interest income | $ | 397,936 | $ | 413,603 | $ | 406,524 | $ | (15,667) | $ | 7,079 | |||||
Provision for (reversal of) credit losses |
| 18,525 |
| 8,250 |
| (58,175) |
| 10,275 |
| 66,425 | |||||
Noninterest income |
| 45,830 |
| 49,307 |
| 45,113 |
| (3,477) |
| 4,194 | |||||
Noninterest expense | 226,234 |
| 235,190 |
| 226,915 | (8,956) |
| 8,275 | |||||||
Income before income taxes | $ | 199,007 | $ | 219,470 | $ | 282,897 | $ | (20,463) | $ | (63,427) | |||||
The decrease in income before income taxes during 2023, compared with 2022, was primarily due to a decrease in net interest income and an increase in the provision for credit losses, partially offset by a decline in noninterest expense, while the decrease in income before income taxes during 2022, compared with 2021, was driven by the impact of reversals of credit losses throughout 2021. Changes to net interest income related to the component changes in the volume of average interest-earning assets and interest-bearing liabilities and changes in the rates earned or paid on those items are discussed in more detail below.
As discussed in more detail below, given the intense competition for liquidity and as customers seek higher yields on deposits, the banking segment’s cost of deposits has increased during 2023. We expect such costs during 2024 to continue to be driven by various factors, including competition as well as economic and market area factors. The resulting net interest income spread compression has had, and is expected to continue to have, a negative impact on banking segment operating results.
The information shown in the table below includes certain key indicators of the performance and asset quality of our banking segment.
Year Ended December 31, |
| ||||||
| 2023 |
| 2022 | 2021 |
| ||
Efficiency ratio (1) |
| 50.98 | % | 50.81 | % | 50.25 | % |
Return on average assets (2) |
| 1.15 | % | 1.19 | % | 1.55 | % |
Net interest margin (3) | 3.13 | % | 3.11 | % | 3.07 | % | |
Net recoveries (charge-offs) to average loans outstanding (4) | (0.03) | % | (0.06) | % | 0.01 | % | |
| (1) | Efficiency ratio is defined as noninterest expenses divided by the sum of total noninterest income and net interest income for the period. We consider the efficiency ratio to be a measure of the banking segment’s profitability. |
| (2) | Return on average assets is defined as net income divided by average assets. |
| (3) | Net interest margin is defined as net interest income divided by average interest-earning assets. We consider net interest margin as a key indicator of profitability, as it represents interest earned on interest-earning assets compared to interest incurred. |
| (4) | Net recoveries (charge-offs) to average loans outstanding is defined as the greater of recoveries or charge-offs during the reported period minus charge-offs or recoveries divided by average loans outstanding. We use the ratio to measure the credit performance of our loan portfolio. |
The banking segment presents net interest margin and net interest income in the following discussion and table below, on a taxable equivalent basis. Net interest margin (taxable equivalent), a non-GAAP measure, is defined as taxable equivalent net interest income divided by average interest-earning assets. Taxable equivalent adjustments are based on the applicable corporate federal income tax rates of 21% for all periods presented. The interest income earned on certain earning assets is completely or partially exempt from federal income tax. As such, these tax-exempt instruments typically yield lower returns than taxable investments. To provide more meaningful comparisons of net interest margins for all earning assets, we use net interest income on a taxable equivalent basis in calculating net interest margin by increasing the interest income earned on tax-exempt assets to make it fully equivalent to interest income earned on taxable investments.
During 2023, 2022 and 2021, purchase accounting contributed 7, 9 and 16 basis points, respectively, to the banking segment’s taxable equivalent net interest margin of 3.14%, 3.11% and 3.08%, respectively. These purchase accounting
68
items are primarily related to accretion of discount of loans associated with the Bank Transactions as discussed in the Consolidated Operating Results section.
The table below provides additional details regarding our banking segment’s net interest income (dollars in thousands).
Year Ended December 31, |
| ||||||||||||||||||||||||
2023 | 2022 | 2021 |
| ||||||||||||||||||||||
| Average |
| Interest |
| Annualized |
| Average |
| Interest |
| Annualized |
| Average |
| Interest |
| Annualized |
| |||||||
Outstanding | Earned | Yield or | Outstanding | Earned | Yield or | Outstanding | Earned | Yield or |
| ||||||||||||||||
Balance | or Paid | Rate | Balance | or Paid | Rate | Balance | or Paid | Rate |
| ||||||||||||||||
Assets | |||||||||||||||||||||||||
Interest-earning assets | |||||||||||||||||||||||||
Loans held for investment, gross (1) | $ | 7,786,984 | $ | 454,132 |
| 5.83 | % | $ | 7,371,397 | $ | 339,356 |
| 4.60 | % | $ | 7,069,485 | $ | 323,136 |
| 4.57 | % | ||||
Subsidiary warehouse lines of credit |
| 867,011 |
| 70,024 |
| 7.97 | % |
| 1,128,576 |
| 58,153 |
| 5.08 | % |
| 2,124,700 |
| 80,761 |
| 3.75 | % | ||||
Investment securities - taxable |
| 2,284,654 |
| 72,771 |
| 3.19 | % |
| 2,377,483 |
| 45,282 |
| 1.90 | % |
| 2,026,189 |
| 29,215 |
| 1.44 | % | ||||
Investment securities - non-taxable (2) |
| 112,408 |
| 3,907 |
| 3.48 | % |
| 109,911 |
| 3,871 |
| 3.52 | % |
| 114,118 |
| 3,905 |
| 3.42 | % | ||||
Federal funds sold and securities purchased under agreements to resell |
| 67,011 |
| 3,575 |
| 5.41 | % |
| 118,686 |
| 2,190 |
| 1.87 | % |
| 30,395 |
| 89 |
| 0.30 | % | ||||
Interest-bearing deposits in other financial institutions |
| 1,543,471 |
| 79,657 |
| 5.16 | % |
| 2,174,529 |
| 31,705 |
| 1.46 | % |
| 1,837,196 |
| 2,459 |
| 0.13 | % | ||||
Other |
| 50,673 |
| 2,353 |
| 4.64 | % |
| 36,843 |
| 3,876 |
| 10.52 | % |
| 36,813 |
| 460 |
| 1.25 | % | ||||
Interest-earning assets, gross (2) |
| 12,712,212 | 686,419 |
| 5.40 | % |
| 13,317,425 | 484,433 |
| 3.64 | % |
| 13,238,896 | 440,025 |
| 3.32 | % | |||||||
Allowance for credit losses |
| (103,180) |
| (92,377) |
| (129,303) | |||||||||||||||||||
Interest-earning assets, net |
| 12,609,032 |
| 13,225,048 |
| 13,109,593 | |||||||||||||||||||
Noninterest-earning assets |
| 848,093 |
| 919,618 |
| 966,296 | |||||||||||||||||||
Total assets | $ | 13,457,125 | $ | 14,144,666 | $ | 14,075,889 | |||||||||||||||||||
Liabilities and Stockholders’ Equity | |||||||||||||||||||||||||
Interest-bearing liabilities | |||||||||||||||||||||||||
Interest-bearing deposits | $ | 7,578,587 | $ | 265,560 |
| 3.50 | % | $ | 7,379,265 | $ | 63,148 |
| 0.86 | % | $ | 7,578,963 | $ | 30,988 |
| 0.41 | % | ||||
Notes payable and other borrowings |
| 579,462 |
| 22,230 |
| 3.84 | % |
| 311,735 |
| 6,864 |
| 2.20 | % |
| 142,705 |
| 1,586 |
| 1.11 | % | ||||
Total interest-bearing liabilities |
| 8,158,049 |
| 287,790 |
| 3.53 | % |
| 7,691,000 |
| 70,012 |
| 0.91 | % |
| 7,721,668 |
| 32,574 |
| 0.42 | % | ||||
Noninterest-bearing liabilities | |||||||||||||||||||||||||
Noninterest-bearing deposits |
| 3,582,356 |
| 4,695,265 |
| 4,512,227 | |||||||||||||||||||
Other liabilities |
| 156,980 |
| 145,272 |
| 155,979 | |||||||||||||||||||
Total liabilities |
| 11,897,385 |
| 12,531,537 |
| 12,389,874 | |||||||||||||||||||
Stockholders’ equity |
| 1,559,740 |
| 1,613,129 |
| 1,686,015 | |||||||||||||||||||
Total liabilities and stockholders’ equity | $ | 13,457,125 | $ | 14,144,666 | $ | 14,075,889 | |||||||||||||||||||
Net interest income (2) | $ | 398,629 | $ | 414,421 | $ | 407,451 | |||||||||||||||||||
Net interest spread (2) |
| 1.87 | % |
| 2.73 | % |
| 2.90 | % | ||||||||||||||||
Net interest margin (2) |
| 3.14 | % |
| 3.11 | % |
| 3.08 | % | ||||||||||||||||
| (1) | Average balance includes non-accrual loans. |
| (2) | Presented on a taxable equivalent basis with taxable equivalent adjustments based on the applicable corporate federal income tax rates of 21% for all periods presented. The adjustment to interest income was $0.7 million, $0.8 million and $0.8 million during 2023, 2022 and 2021, respectively. |
The banking segment’s net interest margin exceeds our consolidated net interest margin. Our consolidated net interest margin includes certain items that are not reflected in the calculation of our net interest margin within our banking segment and reduce our consolidated net interest margin, such as the borrowing costs of Hilltop and the yields and costs associated with certain items within interest-earning assets and interest-bearing liabilities, such as securities borrowed in the broker-dealer segment and securities loaned in the broker-dealer segment, including items related to securities financing operations that particularly decrease net interest margin. In addition, yields and costs on certain interest-earning assets, such as lines of credit extended to other operating segments by the banking segment, are eliminated from the consolidated financial statements.
69
The following table summarizes the changes in the banking segment’s net interest income for the periods indicated below, including the component changes in the volume of average interest-earning assets and interest-bearing liabilities and changes in the rates earned or paid on those items (in thousands).
Year Ended December 31, |
| ||||||||||||||||||
2023 vs. 2022 | 2022 vs. 2021 |
| |||||||||||||||||
Change Due To (1) | Change Due To (1) |
| |||||||||||||||||
| Volume |
| Yield/Rate |
| Change |
| Volume |
| Yield/Rate |
| Change |
| |||||||
Interest income | |||||||||||||||||||
Loans held for investment, gross (2) | $ | 19,117 | $ | 95,659 | $ | 114,776 | $ | 13,797 | $ | 2,423 | $ | 16,220 | |||||||
Subsidiary warehouse lines of credit (3) |
| (13,293) |
| 25,164 |
| 11,871 |
| (37,355) |
| 14,747 |
| (22,608) | |||||||
Investment securities - taxable |
| (1,768) |
| 29,257 |
| 27,489 |
| 5,059 |
| 11,008 |
| 16,067 | |||||||
Investment securities - non-taxable (4) |
| 88 |
| (52) |
| 36 |
| (144) |
| 110 |
| (34) | |||||||
Federal funds sold and securities purchased under agreements to resell |
| (967) |
| 2,352 |
| 1,385 |
| 265 |
| 1,836 |
| 2,101 | |||||||
Interest-bearing deposits in other financial institutions |
| (9,201) |
| 57,153 |
| 47,952 |
| 439 |
| 28,807 |
| 29,246 | |||||||
Other |
| 1,455 |
| (2,978) |
| (1,523) |
| — |
| 3,416 |
| 3,416 | |||||||
Total interest income (4) | (4,569) | 206,555 | 201,986 | (17,939) | 62,347 | 44,408 | |||||||||||||
Interest expense | |||||||||||||||||||
Deposits | $ | 1,706 | $ | 200,706 | $ | 202,412 | $ | (819) | $ | 32,979 | $ | 32,160 | |||||||
Notes payable and other borrowings |
| 5,895 |
| 9,471 |
| 15,366 |
| 1,876 |
| 3,402 |
| 5,278 | |||||||
Total interest expense |
| 7,601 |
| 210,177 |
| 217,778 |
| 1,057 |
| 36,381 |
| 37,438 | |||||||
Net interest income (4) | $ | (12,170) | $ | (3,622) | $ | (15,792) | $ | (18,996) | $ | 25,966 | $ | 6,970 | |||||||
| (1) | Changes attributable to both volume and yield/rate are included in yield/rate column. |
| (2) | Changes in the yields earned on loans held for investment, gross included a decline during 2023 of $1.9 million in accretion of discount on loans, compared with 2022, and a decrease of $8.3 million during 2022, compared with 2021. Accretion of discount on loans is expected to decrease in future periods as loans acquired in the Bank Transaction are repaid, refinanced or renewed. |
| (3) | Subsidiary warehouse lines of credit extended to PrimeLending are eliminated from the consolidated financial statements. |
| (4) | Annualized taxable equivalent. |
With regard to net interest income, as of December 31, 2023, the banking segment maintained an asset sensitive rate risk position, meaning the amount of its interest-earning assets maturing or repricing within a given period exceeds the amount of its interest-bearing liabilities also maturing or repricing within that time period. During a period of rising interest rates, being asset sensitive tends to result in an increase in net interest income, but during a period of declining interest rates, tends to result in a decrease in net interest income.
Our portfolio includes loans that periodically reprice or mature prior to the end of an amortized term. The extent and timing of this impact on interest income will ultimately be driven by the timing, magnitude and frequency of interest rate and yield curve movements, as well as changes in market conditions and timing of management strategies. At December 31, 2023, approximately $707 million of our floating rate loans held for investment remained at or below their applicable rate floor, exclusive of our mortgage warehouse lending program, of which approximately 83% are not scheduled to reprice for more than one year based upon agreed-upon terms. If interest rates rise further, yields on the portion of our loan portfolio that remain at applicable rate floors would rise more slowly than increases in market interest rates, unless such loans are refinanced or repaid. Competition for loan growth could also continue to put pressure on new loan origination rates. If interest rates were to fall, the impact on our interest income for certain variable-rate loans would be limited by these rate floors.
Additionally, within our banking segment, the composition of the deposit base and ultimate cost of funds on deposits and net interest income are affected by the level of market interest rates, the interest rates and products offered by competitors, the volatility of equity markets and other factors. Deposit products and pricing structures relative to the market are regularly evaluated to maintain competitiveness over time. During a period of rising interest rates, the cost of
70
funds on deposits, and therefore, interest expense, tends to increase. Given the intense competition for liquidity and the banking industry disruption, and as customers seek higher yields on deposits, our cost of deposits increased during 2023 compared with 2022. We expect such costs during 2024 to continue to be driven by various factors, including continued intense competition for deposits as well as economic and market area factors. The Bank’s deposit base primarily includes a combination of commercial, wealth, and public funds deposits, without a high level of industry concentration. At December 31, 2023, total estimated uninsured deposits were $4.7 billion, or approximately 42% of total deposits, while estimated uninsured deposits, excluding collateralized deposits of $315.7 million, were $4.4 billion, or approximately 40% of total deposits.
Refer to the discussion in the “Liquidity and Capital Resources – Banking Segment” section that follows for more detail regarding the Bank’s activities regarding deposits, available liquidity and borrowing capacity.
To help mitigate net interest income spread compression between our assets and liabilities as the Federal Reserve increases interest rates, management continues to execute certain derivative trades, as either cash flow hedges or fair value hedges, that benefit the banking segment as interest rates rise. Any changes in interest rates across the term structure will continue to impact net interest income and net interest margin. The impact of rate movements will change with the shape of the yield curve, including any changes in steepness or flatness and inversions at any points on the yield curve.
During 2023, 2022 and 2021, the banking segment retained approximately $140 million, $532 million and $778 million, respectively, in mortgage loans originated by the mortgage origination segment. These loans are purchased by the banking segment at par. For origination services provided, the banking segment reimburses the mortgage origination segment for direct origination costs associated with these mortgage loans, in addition to payment of a correspondent fee. The correspondent fees are eliminated in consolidation. The determination of mortgage loan retention levels by the banking segment will be impacted by, among other things, an ongoing review of the prevailing mortgage rates, balance sheet positioning at Hilltop and the banking segment’s outlook for commercial loan growth.
The banking segment’s provision for (reversal of) credit losses has been subject to significant year-over-year and quarterly changes primarily attributable to the effects of the changing economic outlook, macroeconomic forecast assumptions and resulting impact on reserves. Specifically, during 2023, the banking segment’s provision for credit losses reflected a build in the allowance related to loan portfolio changes since December 31, 2022 and a deteriorating outlook for commercial real estate markets. The net impact to the allowance of changes associated with collectively evaluated loans during 2023 included a provision for credit losses of $12.7 million, while individually evaluated loans included a provision for credit losses of $5.8 million. The change in the allowance during 2023 was also impacted by net charge-offs of $2.4 million. During 2022, the banking segment’s provision for credit losses was driven by a deteriorating U.S. economic outlook since December 31, 2021. The change in the allowance during 2022 was also impacted by net charge-offs of $4.2 million. During 2021, the banking segment had net reversals of credit losses on expected losses of collectively evaluated loans of $58.3 million, primarily due to improvements in both macroeconomic forecast assumptions and credit quality metrics on industry sector exposures impacted by the pandemic. The change in the allowance during 2021 was also impacted by net recoveries of $0.5 million. The changes in the allowance for credit losses during the noted periods also reflected other factors including, but not limited to, loan growth, loan mix, and changes in risk grades and qualitative factors from the prior quarter. Refer to the discussion in the “Financial Condition – Allowance for Credit Losses on Loans” section that follows for more details regarding the significant assumptions and estimates involved in estimating credit losses.
The banking segment’s noninterest income decreased during 2023, compared with 2022, primarily due to a decline in service charges on depositor accounts, oil and gas management fees and non-recurring income related to CRA investment that occurred in 2022. Noninterest income during 2022, compared with 2021, increased primarily due to increased wealth management fees.
The banking segment’s noninterest expenses decreased during 2023, compared with 2022, primarily due to decreases in compensation-related expenses, partially offset by an increase in FDIC assessment, professional fees and software related expenses. Noninterest expenses during 2022, compared with 2021, increased primarily due to increased expenses associated with employees’ compensation and benefits and professional fees.
71
Broker-Dealer Segment
The following table provides additional details regarding our broker-dealer segment operating results (in thousands).
Year Ended December 31, | Variance | ||||||||||||||
| 2023 |
| 2022 | 2021 |
| 2023 vs 2022 | 2022 vs 2021 | ||||||||
Net interest income: | |||||||||||||||
Wealth management: | |||||||||||||||
Securities lending | $ | 6,749 | $ | 5,844 | $ | 10,693 | $ | 905 | $ | (4,849) | |||||
Clearing services | 8,064 | 7,598 | 7,314 | 466 | 284 | ||||||||||
Structured finance | 7,957 | 6,680 | 2,857 | 1,277 | 3,823 | ||||||||||
Fixed income services | 1,294 | 19,096 | 19,249 | (17,802) | (153) | ||||||||||
Other | 28,830 | 12,379 | 3,183 | 16,451 | 9,196 | ||||||||||
Total net interest income | 52,894 | 51,597 | 43,296 | 1,297 | 8,301 | ||||||||||
Noninterest income: | |||||||||||||||
Securities commissions and fees by business line (1): | |||||||||||||||
Fixed income services | 27,760 | 32,893 | 47,844 | (5,133) | (14,951) | ||||||||||
Wealth management: | |||||||||||||||
Retail | 87,226 | 76,213 | 73,149 | 11,013 | 3,064 | ||||||||||
Clearing services | 40,081 | 28,749 | 22,478 | 11,332 | 6,271 | ||||||||||
Structured finance | 11,078 | 11,216 | 3,275 | (138) | 7,941 | ||||||||||
Other | 2,849 | 3,684 | 4,016 | (835) | (332) | ||||||||||
168,994 | 152,755 | 150,762 | 16,239 | 1,993 | |||||||||||
Investment and securities advisory fees and commissions by business line: | |||||||||||||||
Public finance services | 89,437 | 86,573 | 108,372 | 2,864 | (21,799) | ||||||||||
Fixed income services | 10,865 | 7,143 | 8,442 | 3,722 | (1,299) | ||||||||||
Wealth management: | |||||||||||||||
Retail | 31,016 | 30,744 | 31,453 | 272 | (709) | ||||||||||
Clearing services | 1,660 | 1,741 | 1,945 | (81) | (204) | ||||||||||
Structured finance | 1,105 | 863 | 1,850 | 242 | (987) | ||||||||||
Other | 244 | 335 | 381 | (91) | (46) | ||||||||||
134,327 | 127,399 | 152,443 | 6,928 | (25,044) | |||||||||||
Other: | |||||||||||||||
Structured finance | 62,858 | 47,192 | 77,424 | 15,666 | (30,232) | ||||||||||
Fixed income services | 34,267 | 13,698 | (2,197) | 20,569 | 15,895 | ||||||||||
Other | 3,092 | 899 | 2,693 | 2,193 | (1,794) | ||||||||||
100,217 | 61,789 | 77,920 | 38,428 | (16,131) | |||||||||||
Total noninterest income | 403,538 | 341,943 | 381,125 | 61,595 | (39,182) | ||||||||||
Net revenue (2) | 456,432 | 393,540 | 424,421 | 62,892 | (30,881) | ||||||||||
Noninterest expense: | |||||||||||||||
Variable compensation (3) | 144,984 | 138,705 | 161,264 | 6,279 | (22,559) | ||||||||||
Non-variable compensation and benefits | 121,411 | 112,440 | 114,912 | 8,971 | (2,472) | ||||||||||
Segment operating costs (4) | 116,496 | 104,627 | 104,584 | 11,869 | 43 | ||||||||||
Total noninterest expense | 382,891 | 355,772 | 380,760 | 27,119 | (24,988) | ||||||||||
Income before income taxes | $ | 73,541 | $ | 37,768 | $ | 43,661 | $ | 35,773 | $ | (5,893) | |||||
| (1) | Securities commissions and fees includes income from FDIC sweep investments with the banking segment of $47.1 million, $13.6 million, and $6.9 million during 2023, 2022, and 2021, respectively, that is eliminated in consolidation. |
| (2) | Net revenue is defined as the sum of total net interest income and total noninterest income. We consider net revenue to be a key performance measure in the evaluation of the broker-dealer segment’s financial position and operating performance as we believe it is a primary revenue performance measure used by investors and analysts. Net revenue provides for some level of comparability of trends across the financial services industry as it reflects both noninterest income, including investment and securities advisory fees and commissions, as well as net interest income. Internally, we assess the broker-dealer segment’s performance on a revenue basis for comparability with our banking segment. |
| (3) | Variable compensation represents performance-based commissions and incentives. |
| (4) | Segment operating costs include provision for (reversal of) credit losses associated with the broker-dealer segment within other noninterest expenses. |
72
The increase in net revenue and income before income taxes during 2023, compared with 2022, was primarily related to the combined impacts of the rising interest rate environment and a more favorable housing environment in certain areas of the country, which was evidenced by improved results period-over-period within our various business lines. All the broker-dealer business lines experienced an increase in net revenues when compared to 2022. Specifically, the broker-dealer segment’s structured finance business line experienced an increase in net revenues due to increased production volumes, and support from certain state legislatures for down payment assistance programs. The wealth management business line’s net revenue improvement was driven by improved customer balance revenues, which included increases in FDIC sweep revenue, despite weaker retail division transactional production. The increase in net revenues in the broker-dealer segment’s fixed income services business line was primarily due to improved trading revenues in both taxable and municipal products offset by a decrease in net interest income from the increase in the cost to carry inventory positions. The increase in net revenues in the broker-dealer segment’s public finance services business line was primarily due to fees earned from managed assets within our treasury management and government investment pool divisions of our public finance services business line and underwriting transactions, offset by a decrease in advisory revenue due to the unfavorable national issuance trends.
The broker-dealer segment is subject to interest rate risk as a consequence of maintaining inventory positions, trading in interest rate sensitive financial instruments and maintaining a matched stock loan book. Changes in interest rates are likely to have a meaningful impact on our overall financial performance. Our broker-dealer segment has historically earned a significant portion of its revenues from advisory fees upon the successful completion of client transactions, which could be adversely impacted by interest rate volatility. Rapid or significant changes in interest rates could adversely affect the broker-dealer segment’s bond trading, sales, underwriting activities and other interest spread-sensitive activities described below. The broker-dealer segment also receives administrative fees for providing money market and FDIC investment alternatives to clients, which tend to be sensitive to short term interest rates. In addition, the profitability of the broker-dealer segment depends, to an extent, on the spread between revenues earned on customer loans and excess customer cash balances, and the interest expense paid on customer cash balances, as well as the interest revenue earned on trading securities, net of financing costs. The broker-dealer segment is also exposed to interest rate risk through its structured finance business line, which is dependent on mortgage loan production that tends to be adversely impacted by increasing interest rates and may result in valuation-related adjustments.
As noted under the section titled “Asset Valuation” earlier in this Item 7, continuing macroeconomic challenges related to mortgage loan origination volumes, customer sensitivity to interest rates and resulting demand for certain products have resulted in a challenging environment associated with the broker-dealer segment’s short- and long-term financial condition, resulting in variability in its operating results. As a part of the most recent annual quantitative analysis performed as of October 1, 2023 using revised forecasts and considering sensitivities of assumptions, we concluded that it was more likely than not that the broker-dealer segment’s estimated fair value of goodwill exceeded its carrying value. However, in the event future operating performance remains challenged and below our forecasted projections, there are negative changes to long-term growth rates or discount rates increase, the fair value of the broker-dealer segment may decline and we may be required to record a goodwill impairment charge. These conditions will continue to be considered during future impairment evaluations of goodwill.
In the broker-dealer segment, interest is earned from securities lending activities, interest charged on customer margin loan balances and interest earned on investment securities used to support sales, underwriting and other customer activities. The increase in net interest income during 2023, compared with 2022, was primarily due to the increase in corporate interest, retail and clearing services business line revenues and the amount of interest received on a structured product investments offset by a decrease in net interest income from the fixed income services business line due to the increased cost to carry inventory positions. The improvement in net interest income during 2022, compared with 2021, was primarily due to the increases in net interest income from our structured finance business line and other divisions within our public finance and wealth management business lines, partially offset by the decline in net interest income within the securities lending division of our wealth management business line.
73
Noninterest income increased during 2023, compared with 2022, primarily due to increases in securities commissions and fees, investment and securities advisory fees and commissions, and other noninterest income. Noninterest income decreased during 2022, compared with 2021, primarily due to declines in investment banking and advisory fees as well as other noninterest income.
Securities commissions and fees increased during 2023, compared with 2022, primarily due to an increase in FDIC sweep revenue given higher short-term interest rates, partially offset by a decrease in fixed income and retail commissions. As FDIC sweep revenues are closely correlated to short-term interest rates, changes in short-term interest rates may affect these revenues. Securities commissions and fees increased during 2022, compared with 2021, primarily due to an increase in money market and FDIC sweep revenues and commission and fees earned on commodities sales transactions, partially offset by a decrease in customer demand for fixed income services. In addition, securities commissions and fees during 2022, compared with 2021, were impacted by decreases in commissions earned in insurance product sales transactions, commissions earned on fixed income products, and net clearing revenues due to the decrease in clearing fees.
Investment and securities advisory fees and commissions increased during 2023, compared with 2022, primarily due to increases in fees earned from managed assets within our treasury management and government investment pool divisions of our public finance services business line and underwriting transactions. Investment and securities advisory fees and commissions decreased during 2022, compared with 2021, primarily due to decreases in fees earned from our municipal advisory and underwriting transactions. Public finance national issuance volume declined approximately 21% during 2022 compared with 2021.
The increase in other noninterest income during 2023, compared with 2022, was primarily due to fixed income trading activities and increases in trading gains earned from structured finance. Specifically, mortgage originations increased 72% during 2023 and customer demand improved compared with 2022. Increased fixed income trading gains during 2023, compared with 2022, were primarily driven by government and agency, mortgage and asset-backed securities trading, partially offset by a decrease in net trading gains from derivative transactions. Also contributing to the overall increase in noninterest income was an increase in the value of the broker-dealer segment’s deferred compensation plan’s assets of $2.5 million during 2023, compared with 2022. With the expected rise in interest rates continuing into 2024, we anticipate continued volatility and generally lower levels of other noninterest income related to our structured finance and fixed income services business lines. Other noninterest income decreased during 2022, compared with 2021, were primarily due to decreases in trading gains earned from our structured finance business line’s derivative activities, given decreased volumes and interest rate volatility. Specifically, the decreased volumes were due to lower mortgage originations, with loan lock volumes totaling $3.8 billion in 2022, a 46% decline when compared with 2021. The decrease in other noninterest income during 2022, compared with the same period in 2021, also reflected a decline within our broker-dealer segment’s deferred compensation plan of $2.8 million.
The increase in noninterest expenses during 2023, compared with 2022, were due to increases in segment operating costs and compensation. The increase in segment operating costs was attributable to an increase in software expenses, travel expenses, quotation and transaction clearing costs and legal fees. The increase in compensation expenses during 2023, compared with 2022, were primarily due to overall increases in non-variable compensation, the impact of changes in variable compensation on improved results, increases in deferred compensation expenses from both the restricted stock plan and the broker-dealer segment’s deferred compensation plan. The declines in noninterest expenses during 2022, compared with 2021, were primarily due to the impact of changes in variable compensation.
74
Selected information concerning the broker-dealer segment, including key performance indicators, follows (dollars in thousands).
Year Ended December 31, | |||||||||
| 2023 |
| 2022 |
| 2021 | ||||
Total compensation as a % of net revenue (1) | 58.4 | % | 63.8 | % | 65.1 | % | |||
Pre-tax margin (2) | 16.1 | % | 9.6 | % | 10.3 | % | |||
FDIC insured program balances at the Bank (end of year) | $ | 1,132,106 | $ | 1,122,091 | $ | 803,941 | |||
Other FDIC insured program balances (end of year) | $ | 852,653 | $ | 695,873 | $ | 1,503,277 | |||
Customer funds on deposit, including short credits (end of year) | $ | 223,414 | $ | 278,670 | $ | 499,476 | |||
Public finance services: | |||||||||
Number of issues (3) | 804 | 894 | 1,143 | ||||||
Aggregate amount of offerings (3) | $ | 46,343,892 | $ | 38,952,431 | $ | 59,929,698 | |||
Structured finance: | |||||||||
Lock production/TBA volume | $ | 6,468,566 | $ | 3,763,743 | $ | 7,007,564 | |||
Fixed income services: | |||||||||
Total volumes | $ | 259,412,621 | $ | 219,791,737 | $ | 244,643,358 | |||
Net inventory (end of year) | $ | 481,052 | $ | 701,923 | $ | 551,289 | |||
Wealth management (Retail and Clearing services groups): | |||||||||
Retail employee representatives (end of year) | 92 | 99 | 106 | ||||||
Independent registered representatives (end of year) | 186 | 163 | 177 | ||||||
Correspondents (end of year) | 105 | 111 | 122 | ||||||
Correspondent receivables (end of year) | $ | 119,996 | $ | 156,859 | $ | 306,064 | |||
Customer margin balances (end of year) | $ | 223,384 | $ | 274,339 | $ | 426,584 | |||
Wealth management (Securities lending group): | |||||||||
Interest-earning assets - stock borrowed (end of year) | $ | 1,406,937 | $ | 1,012,573 | $ | 1,518,372 | |||
Interest-bearing liabilities - stock loaned (end of year) | $ | 1,371,896 | $ | 916,570 | $ | 1,432,196 | |||
| (1) | Total compensation includes the sum of non-variable compensation and benefits and variable compensation. We consider total compensation as a percentage of net revenue to be a key performance measure and indicator of segment profitability. |
| (2) | Pre-tax margin is defined as income before income taxes divided by net revenue. We consider pre-tax margin to be a key performance measure given its use as a profitability metric representing the percentage of net revenue earned that results in a profit. |
| (3) | Noted balances during all prior periods include certain reclassifications to conform to current period presentation. |
Mortgage Origination Segment
The following table presents certain information regarding the operating results of our mortgage origination segment (in thousands).
Year Ended December 31, | Variance | ||||||||||||||
2023 | 2022 | 2021 | 2023 vs 2022 | 2022 vs 2021 | |||||||||||
Net interest income (expense) | $ | (20,305) | $ | (10,529) | $ | (20,400) | $ | (9,776) | $ | 9,871 | |||||
Noninterest income |
| 316,840 |
| 452,915 |
| 986,990 |
| (136,075) |
| (534,075) | |||||
Noninterest expense | 359,285 |
| 478,904 |
| 731,056 |
| (119,619) |
| (252,152) | ||||||
Income (loss) before income taxes | $ | (62,750) | $ | (36,518) | $ | 235,534 | $ | (26,232) | $ | (272,052) | |||||
The mortgage lending business is subject to variables that can impact loan origination volume, including seasonal transaction volumes and interest rate fluctuations. Historically, the mortgage origination segment has experienced increased loan origination volume from purchases of homes during the spring and summer months, when more people tend to move and buy or sell homes. An increase in mortgage interest rates tends to result in decreased loan origination volume from refinancings, while a decrease in mortgage interest rates tends to result in increased loan origination volume from refinancings. While changes in mortgage interest rates have historically had a lesser impact on home purchases volume than on refinancing volume, significant increases in mortgage interest rates that began in 2022, and continued into 2023, negatively impacted home purchase volume. A slight decline in mortgage rates experienced during
75
the end of the fourth quarter of 2023 had minimal impact on 2023 loan origination volume. See details regarding loan origination volume in the table below.
Recent trends, as well as typical historical patterns in loan origination volume from purchases of homes or from refinancings because of movements in mortgage interest rates, may not be indicative of future loan origination volumes. During 2022, and continuing through 2023, certain events adversely impacted total mortgage market origination volumes because of their effect on the economy, including inflation and rising interest rates, the Federal Reserve’s actions and communications, and geopolitical threats. These events have also adversely impacted the willingness and ability of the mortgage origination segment’s customers to conduct mortgage transactions. Specifically, current home inventory shortages and affordability challenges are impacting customers’ abilities to purchase homes. The increase in interest rates that began during 2022, which has led to a sharp reduction in national refinancing volume and the reduction of willing and eligible home buyers, has resulted in competitive mortgage pricing pressure. During the first quarter of 2023, this led to a decline in the average combined net gains from mortgage loan sales and mortgage loan origination fees when compared to the 2022 average. Between March 31, 2023 and December 31, 2023, the average increased slightly, peaking in the third quarter of 2023 and trending back towards the second quarter average during the fourth quarter of 2023. Even though the average improved between the beginning and the end of 2023, the fourth quarter 2023 average remained below the average for the first quarter of 2022. Currently, we anticipate that lower seasonal transaction volumes and the continuation of the mortgage loan production and operating results trends experienced by the mortgage origination segment during 2023 will continue into 2024. Given these expectations, the mortgage origination segment continues to evaluate its cost structure to address the current mortgage environment.
We believe that ongoing initiatives are critical to improving the mortgage origination segment’s short- and long-term financial condition and operating results. As noted under the section titled “Asset Valuation” earlier in this Item 7, the mortgage origination segment experienced operating losses during the second half of 2022 which continued as expected into the first quarter of 2023 due to conditions discussed in detail within this discussion of segment results. However, during the second quarter of 2023, the mortgage origination segment’s operating losses continued which did not meet our forecasted projections. In light of the macroeconomic challenges in the mortgage industry given tight housing inventories and mortgage interest rate levels, and specifically that the mortgage origination segment did not meet forecasted projections at that time, we identified these collective factors as a triggering event during the second quarter of 2023. As a result, we performed an interim quantitative impairment test as of June 1, 2023 using revised forecasts and considering sensitivities of assumptions, and the decline in its carrying value, concluded that it was more likely than not that the mortgage origination segment’s estimated fair value of goodwill exceeded its carrying value at that time. Subsequently, the mortgage origination segment continued to experience lower-than-forecasted operating results during the remainder of 2023 due to conditions and challenges noted above. As a part of the most recent annual quantitative analysis performed as of October 1, 2023 using revised forecasts and considering sensitivities of assumptions, and the decline in its carrying value, concluded that it was more likely than not that the mortgage origination segment’s estimated fair value of goodwill exceeded its carrying value. However, in the event future operating performance remains challenged, the fair value of the mortgage origination segment may decline and we may be required to record a goodwill impairment charge. These conditions will continue to be considered during future impairment evaluations of goodwill.
As a GNMA approved lender, we are subject to certain HUD reporting requirements, including timely reporting if a quarter’s operating loss exceeds more than 20% of its previous quarter or year-end net worth (“the operating loss ratio”). If this occurs, certain additional financial reporting submissions are required. During the first and fourth quarters of 2023, the operating loss ratios were 21.2% and 20.5%. respectively, which were reported to HUD. During the second and third quarters of 2023, the operating loss ratios were below the 20% threshold at 15.8% and 10.0%, respectively.
In addition, as a FNMA and FHLMC approved lender, we are subject to certain minimum capital, net worth and liquidity requirements established by FNMA and FHLMC. These agencies may also monitor additional financial performance trends at their discretion, including risk-based analyses focused on loans that the mortgage origination segment is currently responsible for representation and warranties that agency loans sold meet certain requirements, including representations as to underwriting standards and the validity of certain borrower representations in connection with the loan. One FNMA discretionary performance trend monitors the change in adjusted net worth during the prior twelve months. FNMA’s acceptable threshold for this performance trend is less than minus 30%, but is only considered if a company has four consecutive quarterly losses. During the second, third, and fourth quarters of 2023, PrimeLending
76
experienced four consecutive quarterly losses; the loss ratios during these periods were 50.2%, 37.6%, and 39.8%, respectively. These trends have been reported to FNMA.
The loss before income taxes increased significantly in 2023, compared with 2022. This decrease was primarily the result of decreases in the volume of interest rate lock commitments (“IRLCs”), mortgage loan originations and sales and an increase in the net interest expense, partially offset by a decrease in noninterest expense.
During 2022 and continuing through the beginning of the fourth quarter of 2023, the U.S. 10-Year Treasury Rate and mortgage interest rates increased significantly. During the later part of the fourth quarter of 2023, both rates decreased to levels that approximated rates at the beginning of 2023. Overall, average interest rates during 2023 exceeded average interest rates during 2022. Refinancing volume as a percentage of total origination volume decreased during 2023, compared with 2022. Although we anticipate a relatively stable percentage of refinancing volume relative to total loan origination volume during 2024 as compared to 2023, a higher refinance percentage could be driven by a slowing of purchase volume due to the negative impact on new and existing home sales resulting from existing home inventory shortages and affordability challenges related to new home construction, and/or an increase in all-cash buyers.
The mortgage origination segment primarily originates its mortgage loans through a retail channel, with limited lending through its affiliated business arrangements (“ABAs”). For 2023, funded volume through ABAs was approximately 14% of the mortgage origination segment’s total loan volume. During March 2023 and July 2023, respectively, all of the respective members of two ABAs mutually agreed to dissolve the entities, effective June 2023 and September 2023, respectively. Currently, PrimeLending owns a greater than 50% interest in two remaining ABAs. We expect total production within the ABA channel to approximate 15% of loan volume of the mortgage origination segment during 2024.
The following table provides further details regarding our mortgage loan originations and sales for the periods indicated below (dollars in thousands).
Year Ended December 31, |
| |||||||||||||||||||
2023 | 2022 | 2021 | ||||||||||||||||||
|
| % of |
|
|
| % of |
|
|
| % of |
| Variance | ||||||||
Amount | Total | Amount | Total | Amount | Total |
| 2023 vs 2022 | 2022 vs 2021 | ||||||||||||
Mortgage Loan Originations - units | 26,964 | 41,121 | 77,263 | (14,157) | (36,142) | |||||||||||||||
Mortgage Loan Originations - volume: | ||||||||||||||||||||
Conventional | $ | 5,147,101 |
| 62.44 | % | $ | 8,276,434 |
| 65.37 | % | $ | 15,787,942 |
| 69.65 | % | $ | (3,129,333) | $ | (7,511,508) | |
Government |
| 1,904,237 |
| 23.10 | % |
| 2,572,257 |
| 20.32 | % |
| 3,387,270 |
| 14.94 | % |
| (668,020) |
| (815,013) | |
Jumbo |
| 297,509 |
| 3.61 | % |
| 1,052,508 |
| 8.31 | % |
| 2,511,442 |
| 11.08 | % |
| (754,999) |
| (1,458,934) | |
Other |
| 894,284 |
| 10.85 | % |
| 758,957 |
| 6.00 | % |
| 981,629 |
| 4.33 | % |
| 135,327 |
| (222,672) | |
$ | 8,243,131 |
| 100.00 | % | $ | 12,660,156 |
| 100.00 | % | $ | 22,668,283 |
| 100.00 | % | $ | (4,417,025) | $ | (10,008,127) | ||
Home purchases | $ | 7,701,758 |
| 93.43 | % | $ | 10,823,002 |
| 85.49 | % | $ | 14,429,190 |
| 63.65 | % | $ | (3,121,244) | $ | (3,606,188) | |
Refinancings |
| 541,373 |
| 6.57 | % |
| 1,837,154 |
| 14.51 | % |
| 8,239,093 |
| 36.35 | % |
| (1,295,781) |
| (6,401,939) | |
$ | 8,243,131 |
| 100.00 | % | $ | 12,660,156 |
| 100.00 | % | $ | 22,668,283 |
| 100.00 | % | $ | (4,417,025) | $ | (10,008,127) | ||
Texas | $ | 2,379,425 |
| 28.87 | % | $ | 2,910,754 |
| 22.99 | % | $ | 4,224,691 |
| 18.64 | % | $ | (531,329) | $ | (1,313,937) | |
California |
| 647,831 |
| 7.86 | % |
| 1,077,906 |
| 8.51 | % |
| 2,692,198 |
| 11.88 | % |
| (430,075) |
| (1,614,292) | |
South Carolina |
| 427,298 |
| 5.18 | % |
| 569,206 |
| 4.50 | % |
| 950,028 |
| 4.19 | % |
| (141,908) |
| (380,822) | |
Florida |
| 390,708 |
| 4.74 | % |
| 613,896 |
| 4.85 | % |
| 1,013,206 |
| 4.47 | % |
| (223,188) |
| (399,310) | |
New York |
| 364,979 |
| 4.43 | % |
| 546,043 |
| 4.31 | % |
| 705,601 |
| 3.11 | % |
| (181,064) |
| (159,558) | |
Arizona |
| 345,738 |
| 4.19 | % |
| 562,590 |
| 4.44 | % |
| 1,045,218 |
| 4.61 | % |
| (216,852) |
| (482,628) | |
Missouri |
| 304,723 |
| 3.70 | % |
| 398,826 |
| 3.15 | % |
| 742,220 |
| 3.27 | % |
| (94,103) |
| (343,394) | |
Ohio |
| 251,480 |
| 3.05 | % |
| 529,939 |
| 4.19 | % |
| 868,378 |
| 3.83 | % |
| (278,459) |
| (338,439) | |
North Carolina |
| 239,616 |
| 2.91 | % |
| 391,224 |
| 3.09 | % |
| 740,169 |
| 3.27 | % |
| (151,608) |
| (348,945) | |
Maryland |
| 208,367 |
| 2.53 | % |
| 321,835 |
| 2.54 | % |
| 665,538 |
| 2.94 | % |
| (113,468) |
| (343,703) | |
All other states |
| 2,682,966 |
| 32.54 | % |
| 4,737,937 |
| 37.43 | % | 9,021,036 | 39.79 | % | (2,054,971) | (4,283,099) | |||||
$ | 8,243,131 |
| 100.00 | % | $ | 12,660,156 |
| 100.00 | % | $ | 22,668,283 |
| 100.00 | % | $ | (4,417,025) | $ | (10,008,127) | ||
Mortgage Loan Sales - volume: | ||||||||||||||||||||
Third parties | $ | 7,906,297 |
| 98.26 | % | $ | 12,668,252 |
| 95.97 | % | $ | 22,280,872 |
| 96.62 | % | $ | (4,761,955) | $ | (9,612,620) | |
Banking segment |
| 140,288 |
| 1.74 | % |
| 532,219 |
| 4.03 | % |
| 778,288 |
| 3.38 | % |
| (391,931) |
| (246,069) | |
$ | 8,046,585 |
| 100.00 | % | $ | 13,200,471 |
| 100.00 | % | $ | 23,059,160 |
| 100.00 | % | $ | (5,153,886) | $ | (9,858,689) | ||
We consider the mortgage origination segment’s total loan origination volume to be a key performance measure. Loan origination volume is central to the segment’s ability to generate income by originating and selling mortgage loans,
77
resulting in net gains from the sale of loans, other mortgage production income and other mortgage loan origination fees. Total loan origination volume is a measure utilized by management, our investors, and analysts in assessing market share and growth of the mortgage origination segment.
The mortgage origination segment’s total loan origination volume decreased 34.9% during 2023, compared with 2022, while loss before income taxes increased 71.8%, compared with 2022. The increase in loss before income taxes during 2023 was primarily due to decreases in the volume of IRLCs and mortgage loan originations and sales, a decrease in the average value of IRLCs, and to a lesser extent, an increase in net interest expense, compared with 2022. These trends were partially offset by a decrease in variable compensation, an increase in the average value of mortgage loan origination fees, and to a lesser extent, decreases in non-variable compensation and benefits expense, and segment operating costs, compared with 2022. During 2022, the mortgage origination segment’s total loan origination volume decreased 44.2% compared with 2021, while income before income taxes decreased 115.5% during 2022, compared with 2021. The decrease in income before income taxes during 2022 was primarily due to a decrease in net gains from sale of loans. Mortgage loan origination fees decreased slightly during 2022 compared with 2021, as average mortgage loan origination fees increased. These decreases were partially offset by a decrease in variable compensation, and to a lesser extent, decreases in non-variable compensation and benefits expense, segment operating costs, and net interest expense.
The information shown in the table below includes certain key performance indicators for the mortgage origination segment.
Year Ended December 31, | ||||||||||
2023 | 2022 | 2021 | ||||||||
Net gains from mortgage loan sales (basis points): |
|
| ||||||||
Loans sold to third parties | 198 | 263 | 375 | |||||||
Impact of loans retained by banking segment | (4) | (11) | (13) | |||||||
As reported | 194 | 252 | 362 | |||||||
Variable compensation as a percentage of total compensation | 47.4 | % | 51.9 | % | 65.8 | % | ||||
Mortgage servicing rights asset ($000's) (end of year) (1) | $ | 96,662 | $ | 100,825 | $ | 86,990 | ||||
| (1) | Reported on a consolidated basis and therefore does not include mortgage servicing rights assets related to loans serviced for the banking segment, which are eliminated in consolidation. |
Net interest expense was comprised of interest income earned on loans held for sale offset by interest incurred on warehouse lines of credit primarily held with the Bank, and related intercompany financing costs. The changes in net interest expense during 2023, compared with 2022, reflected the effects of decreased net yields on mortgage loans held for sale, partially offset by a decrease in the average warehouse line balance between the two periods, and during 2022, compared with 2021, included the effects of increased net yields on mortgage loans held for sale between the two periods.
Noninterest income was comprised of the items set forth in the table below (in thousands).
Year Ended December 31, | Variance | |||||||||||||||
| 2023 |
| 2022 |
| 2021 |
| 2023 vs 2022 |
| 2022 vs 2021 |
| ||||||
Net gains from sale of loans | $ | 156,190 | $ | 332,732 | $ | 834,580 | $ | (176,542) | $ | (501,848) | ||||||
Mortgage loan origination fees and other related income | 144,539 | 149,598 | 160,011 | (5,059) | (10,413) | |||||||||||
Other mortgage production income: | ||||||||||||||||
Change in net fair value and related derivative activity: | ||||||||||||||||
IRLCs and loans held for sale | 832 |
| (69,668) |
| (67,714) | 70,500 | (1,954) | |||||||||
Mortgage servicing rights asset | (16,589) | 2,733 | 2,446 | (19,322) | 287 | |||||||||||
Servicing fees | 31,868 | 37,520 | 57,667 | (5,652) | (20,147) | |||||||||||
Total noninterest income | $ | 316,840 | $ | 452,915 | $ | 986,990 | $ | (136,075) | $ | (534,075) | ||||||
The decrease in net gains from sale of loans during 2023, compared with 2022, was primarily the result of a decrease of 39.0% in total loan sales volume, in addition to a decrease in average loan sales margin. Since PrimeLending sells substantially all mortgage loans it originates to various investors in the secondary market, the decrease in loan sales volume during 2023 was consistent with the decrease in loan origination volume during the period.
78
The decrease in mortgage loan origination fees during 2023, compared with 2022, was minimal at 3.4%. The negative impact on fees resulting from a decrease in loan origination volume, was mostly offset by an increase in average mortgage loan origination fees.
Fluctuations in mortgage loan origination fees and net gains on sale of loans are not always aligned with fluctuations in loan origination and loan sale volumes, respectively, since customers may opt to pay PrimeLending discount fees on their mortgage loans, which are included in mortgage loan origination fees, in exchange for a lower interest rate, which decreases the value of a loan in the secondary market.
We consider the mortgage origination segment’s net gains from sale of loans margin, in basis points, to be a key performance measure. Net gains from mortgage loan sales margin is defined as net gains from sale of loans divided by mortgage loan sales volume. The net gains from sale of loans is central to the segment’s generation of income and may include loans sold to third parties and loans sold to and retained by the banking segment. For origination services provided, the mortgage origination segment was reimbursed direct origination costs associated with loans retained by the banking segment, in addition to payment of a correspondent fee. The reimbursed origination costs and correspondent fee are included in the mortgage origination segment operating results, and the correspondent fees are eliminated in consolidation. Loan volumes to be originated on behalf of and retained by the banking segment are evaluated each quarter. Loans sold to and retained by the banking segment during 2023, 2022 and 2021 were $140 million, $532 million and $778 million, respectively. Loan volumes to be originated on behalf of and retained by the banking segment are expected to be impacted by, among other things, an ongoing review of the prevailing mortgage rates, balance sheet positioning at Hilltop and the banking segment’s outlook for commercial loan growth.
Noninterest income included changes in the net fair value of the mortgage origination segment’s IRLCs and loans held for sale and the related activity associated with forward commitments used by the mortgage origination segment to mitigate interest rate risk associated with its IRLCs and mortgage loans held for sale (“net fair value of IRLCs and loans held for sale”). The increase in net fair value of IRLCs and loans held for sale during 2023, compared with 2022, was primarily the result of an increase in the average value of IRLCs and loans held for sale, partially offset by a decrease in the total volume of individual IRLCs and loans held for sale at each year-end.
The mortgage origination segment sells substantially all mortgage loans it originates to various investors in the secondary market. In addition, the mortgage origination segment originates loans on behalf of the Bank. The mortgage origination segment’s determination of whether to retain or release servicing on mortgage loans it sells is impacted by, among other things, changes in mortgage interest rates, refinancing and market activity, and balance sheet positioning at Hilltop. During 2023, 2022 and 2021, the mortgage origination segment retained servicing on approximately 18%, 25% and 29%, respectively, of loans sold. A reduction in third-party mortgage servicers purchasing mortgage servicing rights, even if modest, may result in PrimeLending increasing the rate of retained servicing on mortgage loans sold at any time. The mortgage origination segment may, from time to time, manage its MSR asset through different strategies, including varying the percentage of mortgage loans sold servicing released and opportunistically selling MSR assets. The mortgage origination segment has also retained servicing on certain loans sold to and retained by the banking segment. Gains and losses associated with such sales to the banking segment and the related MSR asset are eliminated in consolidation.
The mortgage origination segment uses derivative financial instruments, including U.S. Treasury bond futures and options and MBS commitments, to mitigate interest rate risk associated with its MSR asset. Changes in the net fair value of the MSR asset are associated with normal customer payments, changes in discount rates, prepayment speed assumptions and customer payoffs. During 2023, the operating results of the mortgage origination segment were impacted by a decrease of $12.5 million in the net fair value of the MSR asset. This decrease was primarily driven by market sales trends during the first quarter of 2023 and 2022. The remaining losses of $4.1 million were generated by the derivatives used to hedge the MSR. During June 2023, the mortgage origination segment sold MSR assets of $19.1 million, which represented $991.0 million of its serviced loan volume at the time. During 2022 and 2021, the mortgage origination segment sold MSR assets of approximately $65 million and $143 million, respectively, with a serviced loan volume totaling $3.7 billion and $12.4 billion, respectively. In addition to net losses generated by changes in the net fair value of the MSR asset and related derivatives, net servicing income of $13.5 million was recognized during 2023.
79
Noninterest expenses were comprised of the items set forth in the table below (in thousands).
Year Ended December 31, | Variance | |||||||||||||||
| 2023 |
| 2022 |
| 2021 |
| 2023 vs 2022 |
| 2022 vs 2021 |
| ||||||
Variable compensation | $ | 118,977 | $ | 183,804 | $ | 373,929 | $ | (64,827) | $ | (190,125) | ||||||
Non-variable compensation and benefits | 132,142 | 170,169 | 194,292 | (38,027) | (24,123) | |||||||||||
Segment operating costs | 84,864 | 92,631 | 113,020 | (7,767) | (20,389) | |||||||||||
Lender paid closing costs | 4,971 | 13,371 | 20,458 | (8,400) | (7,087) | |||||||||||
Servicing expense | 18,331 | 18,929 | 29,357 | (598) | (10,428) | |||||||||||
Total noninterest expense | $ | 359,285 | $ | 478,904 | $ | 731,056 | $ | (119,619) | $ | (252,152) | ||||||
Total employees’ compensation and benefits accounted for the majority of the noninterest expenses incurred during all periods presented. Historically, variable compensation comprises the majority of total employees’ compensation and benefits expenses, but during 2023, as opposed to 2022 and 2021, non-variable compensation was greater than variable compensation. Variable compensation, which is primarily driven by loan origination volume, tends to fluctuate to a greater degree than loan origination volume, because mortgage loan originator and fulfillment staff incentive compensation plans are structured to pay at increasing rates as higher monthly volume tiers are achieved. However, certain other incentive compensation plans driven by non-mortgage production criteria may alter this trend.
While total loan origination volumes decreased 34.9% during 2023, compared with 2022, the aggregate non-variable compensation and benefits of the mortgage origination segment decreased by 22.4%. This decrease was primarily due to a decrease in salaries associated with a reduction in underwriting and loan fulfillment, operations and corporate staff in response to the decreases in loan origination volume that started at the end of 2021, and continued through 2023. Severance costs, included in non-variable compensation above, incurred because of these staff reduction initiatives was $1.4 million during 2023. These actions during 2023 are expected to have an aggregate favorable impact on annualized pre-tax expenses of approximately $11 million. PrimeLending remains committed to evaluating staffing levels and maintaining an appropriate cost structure to address the dynamic mortgage loan origination trends. Segment operating costs decreased during 2023, compared with 2022, primarily due to decreases in occupancy and equipment expense, advertising expense, professional fees and net loan related expenses, excluding credit report expense. During 2022, compared with 2021, segment operating costs decreased primarily due to decreases in business development, professional fees, occupancy and loan-related costs.
In exchange for a higher interest rate, customers may opt to have PrimeLending pay certain costs associated with the origination of their mortgage loan (“lender paid closing costs”). Fluctuations in lender paid closing costs are not always aligned with fluctuations in loan origination volume. Other loan pricing conditions, including the mortgage loan interest rate, loan origination fees paid by the customer, and a customer’s willingness to pay closing costs, may influence fluctuations in lender paid closing costs.
Between January 1, 2014 and December 31, 2023, the mortgage origination segment sold mortgage loans totaling $148.1 billion. These loans were sold under sales contracts that generally include provisions that hold the mortgage origination segment responsible for errors or omissions relating to its representations and warranties that loans sold meet certain requirements, including representations as to underwriting standards and the validity of certain borrower representations in connection with the loan. In addition, the sales contracts typically require the refund of purchased servicing rights plus certain investor servicing costs if a loan experiences an early payment default. While the mortgage origination segment sold loans prior to 2014, it does not anticipate experiencing significant losses in the future on loans originated prior to 2014 because of investor claims under these provisions of its sales contracts.
When a claim for indemnification of a loan sold is made by an agency, investor, or other party, the mortgage origination segment evaluates the claim and determines if the claim can be satisfied through additional documentation or other deliverables. If the claim is valid and cannot be satisfied in that manner, the mortgage origination segment negotiates with the claimant to reach a settlement of the claim. Settlements typically result in either the repurchase of a loan or reimbursement to the claimant for losses incurred on the loan.
80
Following is a summary of the mortgage origination segment’s claims resolution activity relating to loans sold between January 1, 2014 and December 31, 2023 (dollars in thousands).
Original Loan Balance | Loss Recognized | ||||||||||
| % of |
| % of | ||||||||
| Amount |
| Loans Sold |
| Amount |
| Loans Sold |
| |||
Claims resolved with no payment | $ | 239,695 | 0.16 | % | $ | — | - | % | |||
Claims resolved because of a loan repurchase or payment to an investor for losses incurred (1) | 298,226 | 0.20 | % | 23,377 | 0.02 | % | |||||
$ | 537,921 | 0.36 | % | $ | 23,377 | 0.02 | % | ||||
| (1) | Losses incurred include refunded purchased servicing rights. |
For each loan the mortgage origination segment concludes its obligation to a claimant is both probable and reasonably estimable, the mortgage origination segment has established a specific claims indemnification liability reserve.
An additional indemnification liability reserve has been established for probable agency, investor or other party losses that may have been incurred, but not yet reported to the mortgage origination segment based upon a reasonable estimate of such losses. Factors considered in the calculation of this reserve include, but are not limited to, the total volume of loans sold exclusive of specific claimant requests, actual claim inquiries, claim settlements and the severity of estimated losses resulting from future claims, and the mortgage origination segment’s history of successfully curing defects identified in claim requests.
Although management considers the total indemnification liability reserve to be appropriate, there may be changes in the reserve over time to address incurred losses due to unanticipated adverse changes in the economy and historical loss patterns, discrete events adversely affecting specific borrowers or industries, and/or actions taken by institutions or investors. The impact of such matters is considered in the reserving process when probable and estimable. Between March and June 2023 PrimeLending experienced an increase in agency claim inquiries relative to historical trending. However, subsequent to June 2023, agency claims decreased to more closely to approximate historical trends. While no adjustment has been made to the factors considered in the calculation of the indemnification liability reserve as a result of these trends as of December 31, 2023, PrimeLending will continue to monitor agency claim inquiry trends and assess its potential impact on the indemnification liability reserve.
At December 31, 2023 and 2022, the mortgage origination segment’s total indemnification liability reserve totaled $11.7 million and $20.5 million, respectively. The related provision for indemnification losses was $1.6 million, $1.5 million, and $10.0 million during 2023, 2022 and 2021, respectively.
Corporate
The following table presents certain financial information regarding the operating results of corporate (in thousands).
Year Ended December 31, | Variance | ||||||||||||||
2023 | 2022 | 2021 | 2023 vs 2022 | 2022 vs 2021 | |||||||||||
Net interest income (expense) | $ | (12,961) | $ | (13,135) | $ | (17,239) | $ | 174 | $ | 4,104 | |||||
Noninterest income |
| 12,887 |
| 7,525 |
| 9,133 |
| 5,362 |
| (1,608) | |||||
Noninterest expense | 60,631 |
| 59,030 |
| 50,507 | 1,601 |
| 8,523 | |||||||
Loss before income taxes | $ | (60,705) | $ | (64,640) | $ | (58,613) | $ | 3,935 | $ | (6,027) | |||||
Corporate includes certain activities not allocated to specific business segments. These activities include holding company financing and investing activities, merchant banking investment opportunities and management and administrative services to support the overall operations of the Company. Hilltop’s merchant banking investment activities include the identification of attractive opportunities for capital deployment in companies engaged in non-financial activities through its merchant bank subsidiary, Hilltop Opportunity Partners LLC. These merchant banking activities currently include investments within various industries, including power generation, consumer services, youth sports and entertainment, dental health, industrial equipment manufacturing and animal health, with an aggregate carrying value of approximately $78 million at December 31, 2023.
81
As a holding company, Hilltop’s primary investment objectives are to support capital deployment for organic growth and to preserve capital to be deployed through acquisitions, dividend payments and potential stock repurchases. Investment and interest income earned during 2023 was primarily comprised of dividend income from merchant banking investment activities, in addition to interest income earned on intercompany notes.
Interest expense during 2023, 2022 and 2021 included recurring annual interest expense of $7.7 million incurred on our $150.0 million aggregate principal amount of 5% senior notes due April 15, 2025 (“Senior Notes”). During 2023, 2022 and 2021, we incurred interest expense of $12.4 million, $12.3 million and $12.3 million, respectively, on our $50 million aggregate principal amount of 5.75% fixed-to-floating rate subordinated notes due May 15, 2030 (“2030 Subordinated Notes”) and on our $150 million aggregate principal amount of 6.125% fixed-to-floating subordinated notes due May 15, 2035 (“2035 Subordinated Notes,” the 2030 Subordinated Notes and the 2035 Subordinated Notes, collectively, the “Subordinated Notes”), which were issued in May 2020. Additionally, we incurred interest expense of $1.6 million during 2021, on junior subordinated debentures of $67.0 million issued by PCC (the “Debentures”). As discussed in more detail in the section titled “Liquidity and Capital Resources — Junior Subordinated Debentures” below, during the third quarter of 2021, PCC fully redeemed all outstanding Debentures.
Noninterest income during each period included activity related to our investment in a real estate development in Dallas’ University Park, which also serves as headquarters for both Hilltop and the Bank, and net noninterest income associated with activity within our merchant bank subsidiary. During 2021, noninterest income included an aggregate of $6.5 million in pre-tax gains associated with observable transactions related to two merchant bank equity investments.
Noninterest expenses were primarily comprised of employees’ compensation and benefits, occupancy expenses and professional fees, including corporate governance, legal and transaction costs. During 2023, compared with 2022, the increase in noninterest expenses was primarily due to inflationary increases associated with employees’ compensation and benefits, partially offset by decreases in professional fees and occupancy expenses. During 2022, compared with 2021, the increase in noninterest expenses was primarily due to inflationary increases associated with software and occupancy costs, as well as increases in professional fees.
Financial Condition
The following discussion contains a more detailed analysis of our financial condition at December 31, 2023 as compared with December 31, 2022 and December 31, 2021.
Securities Portfolio
At December 31, 2023, investment securities consisted of securities of the U.S. Treasury, U.S. government and its agencies, obligations of municipalities and other political subdivisions, primarily in the State of Texas, as well as mortgage-backed, corporate debt, and equity securities. We may categorize investments as trading, available for sale, held to maturity and equity securities.
Trading securities are bought and held principally for the purpose of selling them in the near term and are carried at fair value, marked to market through operations and held at the Bank and the Hilltop Broker-Dealers. Securities classified as available for sale may, from time to time, be bought and sold in response to changes in market interest rates, changes in securities’ prepayment risk, increases in loan demand, general liquidity needs and to take advantage of market conditions that create more economically attractive returns. Such securities are carried at estimated fair value, with unrealized gains and losses recorded in accumulated other comprehensive income (loss). Equity investments are carried at fair value, with all changes in fair value recognized in net income. Securities are classified as held to maturity based on the intent and ability of our management, at the time of purchase, to hold such securities to maturity. These securities are carried at amortized cost.
82
The table below summarizes our securities portfolio (in thousands).
December 31, |
| ||||||||
2023 |
| 2022 |
| 2021 |
| ||||
Trading securities, at fair value | |||||||||
U.S. Treasury securities | $ | 3,736 | $ | 10,466 | $ | 3,728 | |||
U.S. government agencies: | |||||||||
Bonds | 12,867 | 20,878 | 3,410 | ||||||
Residential mortgage-backed securities | 124,768 | 214,100 | 152,093 | ||||||
Collateralized mortgage obligations | 86,281 | 182,717 | 126,389 | ||||||
Other | 13,079 | — | — | ||||||
Corporate debt securities | 37,569 | 42,685 | 60,671 | ||||||
States and political subdivisions | 180,890 | 260,271 | 285,376 | ||||||
Private-label securitized product | 47,768 | 9,265 | 11,377 | ||||||
Other | 9,033 | 14,650 | 4,954 | ||||||
515,991 | 755,032 | 647,998 | |||||||
Securities available for sale, at fair value | |||||||||
U.S. Treasury securities |
| 4,617 | 19,144 |
| 14,862 | ||||
U.S. government agencies: | |||||||||
Bonds |
| 166,166 | 202,257 |
| 44,133 | ||||
Residential mortgage-backed securities |
| 349,870 | 406,358 |
| 898,446 | ||||
Commercial mortgage-backed securities | 191,746 | 175,499 |
| 210,699 | |||||
Collateralized mortgage obligations |
| 736,481 | 818,894 |
| 916,866 | ||||
Corporate debt securities |
| 24,418 | — |
| — | ||||
States and political subdivisions |
| 34,297 | 36,614 |
| 45,562 | ||||
| 1,507,595 | 1,658,766 |
| 2,130,568 | |||||
Securities held to maturity, at amortized cost | |||||||||
U.S. government agencies: | |||||||||
Residential mortgage-backed securities |
| 278,172 | 301,583 |
| 9,892 | ||||
Commercial mortgage-backed securities | 172,879 | 180,942 |
| 145,742 | |||||
Collateralized mortgage obligations |
| 284,208 | 314,705 |
| 43,990 | ||||
States and political subdivisions |
| 77,418 | 78,302 |
| 68,060 | ||||
| 812,677 |
| 875,532 |
| 267,684 | ||||
Equity securities, at fair value | 321 | 200 | 250 | ||||||
Total securities portfolio | $ | 2,836,584 | $ | 3,289,530 | $ | 3,046,500 | |||
We had net unrealized losses of $114.2 million, $129.8 million and $18.1 million at December 31, 2023, 2022 and 2021, respectively, related to the available for sale investment portfolio. Within the held to maturity portfolio, we had net unrealized losses of $80.8 million and $90.2 million at December 31, 2023 and 2022 compared with net unrealized gains of $8.6 million at December 31, 2021. Equity securities included net unrealized gains of $0.3 million, $0.1 million and $0.2 million at December 31, 2023, 2022 and 2021, respectively. In future periods, we expect changes in prevailing market interest rates, coupled with changes in the aggregate size of the investment portfolio, to be significant drivers of changes in the unrealized losses or gains in these portfolios, and therefore accumulated other comprehensive income (loss).
We transferred certain agency-issued securities from the available-for-sale to held-to-maturity portfolio on March 31, 2022 having a book value of approximately $782 million and a market value of approximately $708 million. As of the date of transfer, the related pre-tax net unrecognized losses of approximately $74 million within the accumulated other comprehensive loss balance are being amortized over the remaining term of the securities using the effective interest method. This transfer was completed after careful consideration of our intent and ability to hold these securities to maturity. Factors used in assessing the ability to hold these securities to maturity were future liquidity needs and sources of funding.
83
Banking Segment
The banking segment’s securities portfolio plays a role in the management of our interest rate sensitivity and generates additional interest income. In addition, the securities portfolio is used to meet collateral requirements for public and trust deposits, securities sold under agreements to repurchase and other purposes. The available for sale and equity securities portfolios serve as a source of liquidity. Historically, the Bank’s policy has been to invest primarily in securities of the U.S. government and its agencies, obligations of municipalities in the State of Texas and other high grade fixed income securities to minimize credit risk. At December 31, 2023, the banking segment’s securities portfolio of $2.3 billion was comprised of trading securities of $0.1 million, available for sale securities of $1.5 billion, held to maturity securities of $812.7 million and equity securities of $0.3 million, in addition to $11.8 million of other investments included in other assets within the consolidated balance sheets.
Broker-Dealer Segment
The broker-dealer segment holds securities to support sales, underwriting and other customer activities. The interest rate risk inherent in holding these securities is managed by setting and monitoring limits on the size and duration of positions and on the length of time the securities can be held. The Hilltop Broker-Dealers are required to carry their securities at fair value and record changes in the fair value of the portfolio to the statements of operations. Accordingly, the securities portfolio of the Hilltop Broker-Dealers included trading securities of $515.9 million at December 31, 2023. In addition, the Hilltop Broker-Dealers enter into transactions that represent commitments to purchase and deliver securities at prevailing future market prices to facilitate customer transactions and satisfy such commitments. Accordingly, the Hilltop Broker-Dealers’ ultimate obligation may exceed the amount recognized in the financial statements. These securities, which are carried at fair value and reported as securities sold, not yet purchased in the consolidated balance sheets, had a value of $34.9 million at December 31, 2023.
Corporate
At December 31, 2023, the corporate portfolio included other investments, including those associated with merchant banking, of available for sale securities of $24.4 million and other assets of $43.6 million within the consolidated balance sheet.
Allowance for Credit Losses for Available for Sale Securities and Held to Maturity Securities
We have evaluated available for sale debt securities that are in an unrealized loss position and have determined that any declines in value are unrelated to credit loss and related to changes in market interest rates since purchase. None of the available for sale debt securities held were past due at December 31, 2023. In addition, as of December 31, 2023, we had evaluated our held to maturity debt securities, considering the current credit ratings and recognized losses, and determined the potential credit loss to be minimal. With respect to these securities, we considered the risk of credit loss to be negligible, and therefore, no allowance was recognized on the debt securities portfolio at December 31, 2023.
84
The following table sets forth the estimated maturities of our debt securities, excluding trading securities, at December 31, 2023. Contractual maturities may be different (dollars in thousands, yields are tax-equivalent).
| One Year |
| One Year to |
| Five Years to |
| Greater Than |
|
|
| ||||||
Or Less | Five Years | Ten Years | Ten Years | Total | ||||||||||||
U.S. Treasury securities: | ||||||||||||||||
Amortized cost | — | $ | 4,985 | — | — | $ | 4,985 | |||||||||
Fair value | — | $ | 4,617 | — | — | $ | 4,617 | |||||||||
Weighted average yield (1) |
| — |
| 0.87 | % |
| — |
| — |
| 0.87 | % | ||||
U.S. government agencies: | ||||||||||||||||
Bonds: | ||||||||||||||||
Amortized cost | $ | 30,005 | $ | 44,511 | $ | 43,675 | $ | 48,426 | $ | 166,617 | ||||||
Fair value | $ | 29,879 | $ | 44,570 | $ | 43,355 | $ | 48,362 | $ | 166,166 | ||||||
Weighted average yield (1) |
| 4.16 | % |
| 5.07 | % |
| 5.74 | % |
| 5.67 | % |
| 5.26 | % | |
Residential mortgage-backed securities: | ||||||||||||||||
Amortized cost | — | $ | 7,165 | $ | 80,581 | $ | 579,586 | $ | 667,332 | |||||||
Fair value | — | $ | 6,919 | $ | 76,572 | $ | 518,786 | $ | 602,277 | |||||||
Weighted average yield (1) | — |
| 2.67 | % |
| 2.56 | % |
| 2.30 | % |
| 2.34 | % | |||
Commercial mortgage-backed securities: | ||||||||||||||||
Amortized cost | $ | 5,040 | $ | 86,455 | $ | 269,339 | $ | 12,281 | $ | 373,115 | ||||||
Fair value | $ | 5,010 | $ | 83,688 | $ | 252,571 | $ | 10,686 | $ | 351,955 | ||||||
Weighted average yield (1) | 2.99 | % |
| 3.29 | % |
| 2.53 | % |
| 3.05 | % |
| 2.73 | % | ||
Collateralized mortgage obligations: | ||||||||||||||||
Amortized cost | — | $ | 42,363 | $ | 173,974 | $ | 865,747 | $ | 1,082,084 | |||||||
Fair value | — | $ | 41,531 | $ | 168,187 | $ | 773,782 | $ | 983,500 | |||||||
Weighted average yield (1) |
| — |
| 4.09 | % |
| 4.02 | % |
| 3.15 | % |
| 3.33 | % | ||
Corporate debt securities: | ||||||||||||||||
Amortized cost | — | $ | 25,919 | — | — | $ | 25,919 | |||||||||
Fair value | — | $ | 24,418 | — | — | $ | 24,418 | |||||||||
Weighted average yield |
| — |
| 1.14 | % |
| — | — |
| 1.14 | % | |||||
States and political subdivisions: | ||||||||||||||||
Amortized cost | $ | 1,959 | $ | 10,452 | $ | 50,072 | $ | 51,889 | $ | 114,372 | ||||||
Fair value | $ | 1,949 | $ | 10,207 | $ | 48,070 | $ | 46,294 | $ | 106,520 | ||||||
Weighted average yield (1) |
| 2.63 | % |
| 2.56 | % |
| 3.00 | % |
| 2.62 | % |
| 2.78 | % | |
Total securities portfolio: | ||||||||||||||||
Amortized cost | $ | 37,004 | $ | 221,850 | $ | 617,641 | $ | 1,557,929 | $ | 2,434,424 | ||||||
Fair value | $ | 36,838 | $ | 215,950 | $ | 588,755 | $ | 1,397,910 | $ | 2,239,453 | ||||||
Weighted average yield (1) |
| 3.92 | % |
| 3.44 | % |
| 3.22 | % |
| 2.89 | % |
| 3.04 | % | |
| (1) | Weighted average yield is defined as interest earned by average interest-earning assets. |
Loan Portfolio
Consolidated loans held for investment are detailed in the table below, classified by portfolio segment (in thousands).
| December 31, | ||||||||
Loan Held for Investment | 2023 | 2022 | 2021 | ||||||
Commercial real estate: | |||||||||
Non-owner occupied | $ | 1,889,882 | $ | 1,870,552 | $ | 1,729,699 | |||
Owner occupied | 1,422,234 | 1,375,321 | 1,313,030 | ||||||
Commercial and industrial |
| 1,607,833 | 1,639,980 | 1,875,420 | |||||
Construction and land development |
| 1,031,095 | 980,896 | 892,783 | |||||
1-4 family residential |
| 1,757,178 | 1,767,099 | 1,303,430 | |||||
Consumer | 27,351 | 27,602 | 32,349 | ||||||
Broker-dealer | 344,172 | 431,223 | 733,193 | ||||||
Loans held for investment, gross |
| 8,079,745 |
| 8,092,673 |
| 7,879,904 | |||
Allowance for credit losses |
| (111,413) | (95,442) | (91,352) | |||||
Loans held for investment, net of allowance | $ | 7,968,332 | $ | 7,997,231 | $ | 7,788,552 | |||
85
Banking Segment
The loan portfolio constitutes the primary earning asset of the banking segment and typically offers the best alternative for obtaining the maximum interest spread above the banking segment’s cost of funds. The overall economic strength of the banking segment generally parallels the quality and yield of its loan portfolio.
As discussed in more detail within the section captioned “Financial Condition – Allowance for Credit Losses on Loans” below, the banking segment’s credit policies emphasize strong underwriting and governance standards and early detection of potential problem credits in order to develop and implement action plans on a timely basis to mitigate potential losses. These formal credit policies and procedures provide the banking segment with a framework for consistent underwriting and a basis for sound credit decisions. The banking segment strives to avoid the risk of concentrations of credit in any particular industry, collateral type, location, or with any individual customer or counterparty.
To manage the credit risks associated with its loan portfolio, management may, depending upon current or anticipated economic conditions and related exposures, apply enhanced risk management measures to loans through analysis of a specific borrower’s financial condition, including cash flow, collateral values, and guarantees, among other credit factors. Given the current market dynamics, including economic uncertainties, the rapid increase in market interest rates since 2022, and a deteriorating outlook for commercial real estate markets, management has heightened its specific review procedures of credits maturing in the next six to twelve months as well as those credits associated with real estate.
The banking segment’s total loans held for investment, net of the allowance for credit losses, were $8.5 billion, $8.5 billion and $8.8 billion at December 31, 2023, 2022 and 2021, respectively. At December 31, 2023, the banking segment’s loan portfolio included warehouse lines of credit extended to PrimeLending and its ABAs of $1.6 billion, of which $0.9 billion was drawn. At December 31, 2022 and 2021, amounts drawn on the available warehouse lines of credit were $0.9 billion and $1.7 billion, respectively. Amounts advanced against the warehouse lines of credit are eliminated from net loans held for investment on our consolidated balance sheets. The banking segment does not generally participate in syndicated loan transactions and has no foreign loans in its portfolio.
A significant portion of the banking segment’s loan portfolio at December 31, 2023 consisted of commercial real estate loans secured by properties. Such loans can involve high principal loan amounts, and the repayment of these loans is dependent, in large part, on a borrower’s ongoing business operations or on income generated from the properties that are leased to third parties. The table below sets forth the banking segment’s commercial real estate loan portfolio, by portfolio industry sector and collateral location as of December 31, 2023 (in thousands).
Brownsville- | Other | |||||||||||||||||||||||||
Dallas- | Harlingen- | San | Outside | |||||||||||||||||||||||
Commercial Real Estate | Fort Worth | Austin | Houston | McAllen | Antonio | Lubbock | Texas | Texas | Total | |||||||||||||||||
Non-owner occupied: | ||||||||||||||||||||||||||
Office | $ | 149,558 | $ | 213,425 | $ | 53,118 | $ | 16,372 | $ | 22,071 | $ | 3,872 | $ | 62,741 | $ | 329 | $ | 521,486 | ||||||||
Retail | 148,247 | 72,992 | 25,515 | 19,455 | 9,742 | 12,905 | 38,621 | 10,207 | 337,684 | |||||||||||||||||
Hotel/Motel | 49,288 | 25,030 | 72,258 | 17,521 | 340 | 18,461 | 36,403 | 13,894 | 233,195 | |||||||||||||||||
Multifamily | 11,355 | 11,089 | 41,984 | 57,099 | — | 34,018 | 56,980 | 10,719 | 223,244 | |||||||||||||||||
Industrial | 114,432 | 44,609 | 8,454 | 4,906 | 3,113 | 705 | 21,922 | 426 | 198,567 | |||||||||||||||||
All other | 105,406 | 60,125 | 26,836 | 12,813 | 24,143 | 54,043 | 58,007 | 34,333 | 375,706 | |||||||||||||||||
$ | 578,286 | $ | 427,270 | $ | 228,165 | $ | 128,166 | $ | 59,409 | $ | 124,004 | $ | 274,674 | $ | 69,908 | $ | 1,889,882 | |||||||||
Owner occupied: | ||||||||||||||||||||||||||
Office | $ | 122,882 | $ | 88,139 | $ | 23,967 | $ | 14,534 | $ | 35,139 | $ | 8,376 | $ | 10,071 | $ | 4,027 | $ | 307,135 | ||||||||
Retail | 12,165 | 15,619 | 3,337 | 1,104 | 190 | 173 | 3,931 | 1,005 | 37,524 | |||||||||||||||||
Industrial | 170,169 | 37,230 | 33,669 | 8,509 | 13,054 | 7,103 | 33,186 | 23,935 | 326,855 | |||||||||||||||||
All other | 334,361 | 65,670 | 87,858 | 22,214 | 48,649 | 14,677 | 159,554 | 17,737 | 750,720 | |||||||||||||||||
$ | 639,577 | $ | 206,658 | $ | 148,831 | $ | 46,361 | $ | 97,032 | $ | 30,329 | $ | 206,742 | $ | 46,704 | $ | 1,422,234 | |||||||||
Total commercial real estate loans | $ | 1,217,863 | $ | 633,928 | $ | 376,996 | $ | 174,527 | $ | 156,441 | $ | 154,333 | $ | 481,416 | $ | 116,612 | $ | 3,312,116 | ||||||||
At December 31, 2023, the banking segment had loan concentrations (loans to borrowers engaged in similar activities) that exceeded 10% of total loans in its real estate portfolio. The areas of concentration within our real estate portfolio were non-construction commercial real estate loans, non-construction residential real estate loans, and construction and
86
land development loans, which represented 42.9%, 22.7% and 13.3%, respectively, of the banking segment’s total loans held for investment at December 31, 2023. The banking segment’s loan concentrations were within regulatory guidelines at December 31, 2023.
In addition, the Bank’s loan portfolio includes collateralized loans extended to businesses that depend on the energy industry, including those within the exploration and production, field services, pipeline construction and transportation sectors. Crude oil prices remain uncertain given future supply and demand for oil are influenced by international armed conflicts, return to business travel, new energy policies and government regulation, and the pace of transition towards renewable energy resources. At December 31, 2023, the Bank’s energy loan exposure was approximately $46 million of loans held for investment with unfunded commitment balances of approximately $20 million. The allowance for credit losses on the Bank’s energy portfolio was $0.2 million, or 0.5% of loans held for investment at December 31, 2023.
The following table provides information regarding the maturities of the banking segment’s gross loans held for investment, net of unearned income (in thousands).
December 31, 2023 | |||||||||||||||
| Due Within |
| Due From One |
| Due from Five |
| Due After |
|
| ||||||
One Year | To Five Years | To Fifteen Years | Fifteen Years | Total | |||||||||||
Commercial real estate: | |||||||||||||||
Non-owner occupied | $ | 587,689 | $ | 906,892 | $ | 394,875 | $ | 426 | $ | 1,889,882 | |||||
Owner occupied | 305,411 | 532,137 | 529,324 | 55,362 | 1,422,234 | ||||||||||
Commercial and industrial | 2,022,380 | 303,329 | 145,177 | — | 2,470,886 | ||||||||||
Construction and land development | 832,155 | 164,877 | 33,147 | 916 | 1,031,095 | ||||||||||
1-4 family residential | 134,320 | 424,154 | 427,873 | 770,831 | 1,757,178 | ||||||||||
Consumer |
| 14,619 |
| 12,537 |
| 181 |
| 14 |
| 27,351 | |||||
Total | $ | 3,896,574 | $ | 2,343,926 | $ | 1,530,577 | $ | 827,549 | $ | 8,598,626 | |||||
Fixed rate loans | $ | 1,539,998 | $ | 1,676,660 | $ | 1,270,946 | $ | 827,549 | $ | 5,315,153 | |||||
Floating rate loans |
| 2,356,576 |
| 667,266 |
| 259,631 |
| — |
| 3,283,473 | |||||
Total | $ | 3,896,574 | $ | 2,343,926 | $ | 1,530,577 | $ | 827,549 | $ | 8,598,626 | |||||
In the table above, commercial and industrial includes amounts advanced against the warehouse lines of credit extended to PrimeLending. Floating rate loans that have reached their applicable rate floor or ceiling are classified as fixed rate loans rather than floating rate loans. As of December 31, 2023, floating rate loans totaling $707 million had reached their applicable rate floor and were expected to reprice, subject to their scheduled repricing timing and frequency terms. The majority of floating rate loans carry an interest rate tied to a SOFR rate or The Wall Street Journal Prime Rate, as published in The Wall Street Journal.
Broker-Dealer Segment
The loan portfolio of the broker-dealer segment consists primarily of margin loans to customers and correspondents that are due within one year. The interest rate on margin accounts is computed on the settled margin balance at a fixed rate established by management. These loans are collateralized by the securities purchased or by other securities owned by the clients and, because of collateral coverage ratios, are believed to present minimal collectability exposure. Additionally, these loans are subject to a number of regulatory requirements as well as the Hilltop Broker-Dealers’ internal policies. The broker-dealer segment’s total loans held for investment, net of the allowance for credit losses, were $344.1 million, $431.0 million and $733.0 million at December 31, 2023, 2022 and 2021, respectively. The decrease from December 31, 2022 to December 31, 2023, was primarily attributable to a decrease of $51.0 million, or 19%, in customer margin accounts and a decrease of $36.9 million, or 24%, in receivables from correspondents. The decrease from December 31, 2021 to December 31, 2022, was primarily attributable to a decrease of $152.2 million or 36%, in customer margin accounts and a decrease of $149.2 million, or 49%, in receivables from correspondents.
87
Mortgage Origination Segment
The loan portfolio of the mortgage origination segment consists of loans held for sale, primarily single-family residential mortgages funded through PrimeLending, and IRLCs with customers pursuant to which we agree to originate a mortgage loan on a future date at an agreed-upon interest rate. The components of the mortgage origination segment’s loans held for sale and IRLCs are as follows (in thousands).
December 31, |
| |||||||||
| 2023 |
| 2022 |
| 2021 |
| ||||
Loans held for sale: | ||||||||||
Unpaid principal balance | $ | 802,348 | $ | 850,277 | $ | 1,728,255 | ||||
Fair value adjustment |
| 19,846 |
| 5,420 |
| 54,336 | ||||
$ | 822,194 | $ | 855,697 | $ | 1,782,591 | |||||
IRLCs: | ||||||||||
Unpaid principal balance | $ | 383,767 | $ | 506,278 | $ | 1,283,152 | ||||
Fair value adjustment |
| 7,734 |
| 1,767 |
| 25,489 | ||||
$ | 391,501 | $ | 508,045 | $ | 1,308,641 | |||||
The mortgage origination segment uses forward commitments to mitigate interest rate risk associated with its loans held for sale and IRLCs. The notional amounts of these forward commitments at December 31, 2023, 2022 and 2021 were $1.0 billion, $1.2 billion and $2.4 billion, respectively, while the related estimated fair values were ($10.2) million, $3.3 million and $0.4 million, respectively.
Allowance for Credit Losses on Loans
For additional information regarding the allowance for credit losses, refer to the section captioned “Critical Accounting Estimates” included in this Form 10-K.
Loans Held for Investment
The Bank has lending policies in place with the goal of establishing an asset portfolio that will provide a return on stockholders’ equity sufficient to maintain capital to assets ratios that meet or exceed established regulations. Loans are underwritten with careful consideration of the borrower’s financial condition, the specific purpose of the loan, the primary sources of repayment and any collateral pledged to secure the loan.
Underwriting procedures address financial components based on the size and complexity of the credit. The financial components include, but are not limited to, current and projected cash flows, shock analysis and/or stress testing, and trends in appropriate balance sheet and statement of operations ratios. The Bank’s loan policy provides specific underwriting guidelines by portfolio segment, including commercial and industrial, real estate, construction and land development, and consumer loans. The guidelines for each individual portfolio segment set forth permissible and impermissible loan types. With respect to each loan type, the guidelines within the Bank’s loan policy provide minimum requirements for the underwriting factors listed above. The Bank’s underwriting procedures also include an analysis of any collateral and guarantor. Collateral analysis includes a complete description of the collateral, as well as determined values, monitoring requirements, loan to value ratios, concentration risk, appraisal requirements and other information relevant to the collateral being pledged. Guarantor analysis includes liquidity and cash flow evaluation based on the significance with which the guarantors are expected to serve as secondary repayment sources.
The Bank maintains a loan review department that reviews credit risk in response to both external and internal factors that potentially impact the performance of either individual loans or the overall loan portfolio. The loan review process reviews the creditworthiness of borrowers and determines compliance with the loan policy. The loan review process complements and reinforces the risk identification and assessment decisions made by lenders and credit personnel. Results of these reviews are presented to management, the Bank’s board of directors and the Risk Committee of the board of directors of the Company.
88
The allowance for credit losses for loans held for investment represents management’s best estimate of all expected credit losses over the expected contractual life of our existing portfolio. Determining the appropriateness of the allowance is complex and requires judgment by management about the effect of matters that are inherently uncertain. Subsequent evaluations of the then-existing loan portfolio, in light of the factors then prevailing, may result in significant changes in the allowance for credit losses in those future periods. Such future changes in the allowance for credit losses are expected to be volatile given dependence upon, among other things, the portfolio composition and quality, as well as the impact of significant drivers, including prepayment assumptions and macroeconomic conditions and forecasts.
Significant judgment is required to estimate the severity and duration of the current economic uncertainties, as well as its potential impact on borrower default and loss severity. In particular, macroeconomic conditions and forecasts are rapidly changing and remain highly uncertain.
One of the most significant judgments involved in estimating our allowance for credit losses relates to the macroeconomic forecasts used to estimate credit losses over the reasonable and supportable forecast period. To determine the allowance for credit losses as of December 31, 2023, we utilized a single macroeconomic alternative scenario, or S7, published by Moody’s Analytics in December 2023. The alternative scenario utilizes multiple economic variables in forecasting the economic outlook. During our previous quarterly macroeconomic assessment as of September 30, 2023, we utilized the same single macroeconomic alternative scenario published by Moody’s Analytics in September 2023.
The following table summarizes the U.S. Real Gross Domestic Product (“GDP”) growth rates and unemployment rate assumptions used in our economic forecast to determine our best estimate of expected credit losses.
As of | |||||||||||
December 31, | September 30, | June 30, | March 31, | December 31, | |||||||
2023 | 2023 | 2023 | 2023 | 2022 | |||||||
GDP growth rates: | |||||||||||
Q4 2022 | 0.8% | ||||||||||
Q1 2023 | 2.5% | 0.1% | |||||||||
Q2 2023 | 1.4% | 0.4% | (1.4)% | ||||||||
Q3 2023 | 2.9% | 0.1% | 0.4% | (2.5)% | |||||||
Q4 2023 | 1.1% | 0.2% | 0.3% | (3.1)% | (2.4)% | ||||||
Q1 2024 | (1.6)% | (1.9)% | (3.1)% | (2.2)% | 0.4% | ||||||
Q2 2024 | (2.4)% | (3.0)% | (2.7)% | (1.1)% | 1.1% | ||||||
Q3 2024 | (1.3)% | (1.5)% | (0.9)% | 2.1% | |||||||
Q4 2024 | 1.3% | 1.4% | 2.0% | ||||||||
Q1 2025 | 2.6% | 3.1% | |||||||||
Q2 2025 | 3.0% | ||||||||||
Unemployment rates: | |||||||||||
Q4 2022 | 3.7% | ||||||||||
Q1 2023 | 3.5% | 4.0% | |||||||||
Q2 2023 | 3.5% | 3.7% | 4.6% | ||||||||
Q3 2023 | 3.8% | 3.8% | 4.0% | 5.3% | |||||||
Q4 2023 | 3.8% | 4.1% | 4.0% | 4.7% | 6.0% | ||||||
| Q1 2024 | 4.8% | 4.9% | 4.9% | 5.6% | 5.9% | |||||
Q2 2024 | 5.6% | 5.7% | 5.6% | 6.0% | 5.6% | ||||||
Q3 2024 | 6.1% | 6.0% | 6.0% | 5.7% | |||||||
Q4 2024 | 5.6% | 5.7% | 5.8% | ||||||||
Q1 2025 | 5.2% | 5.3% | |||||||||
Q2 2025 | 5.0% | ||||||||||
As of December 31, 2023, we updated our U.S. economic outlook for recent consumer and business spending. In the prior quarter’s forecast, we assumed a mild U.S. recession with real GDP growth contracting (0.6%) on an annual average basis and (1.6%) peak to trough in 2024. In the current economic forecast, real GDP growth contracts more modestly at (0.0%) on an annual average basis and (1.3%) peak to trough in 2024. Labor market conditions remained tighter than expected as the unemployment rate decreased to 3.7% in December despite several downward revisions to recent payroll data. We
89
expect monetary policy to remain restrictive at 5.25% to 5.50% in the near term but revert to 3.50% by year end 2025 as the Federal Reserve balances slower economic growth with its inflation targets.
During 2023, our economic outlook was updated to reflect our expectations of a period of below trend economic growth beginning in 2023 and a mild U.S. recession in 2024. The Federal Reserve increased its federal funds rate target from 4.00% to 4.25% in January 2023 to 5.25% to 5.50% in August 2023 and held rates steady through December 2023. In March and April 2023, as a result of three of the largest bank failures in U.S. history, the Federal Reserve implemented several liquidity programs to stabilize consumer and business confidence. The Federal Reserve continued to balance inflation expectations and labor market constraints with tighter financial conditions throughout 2023. The duration of the higher interest rates also renewed credit and refinance risk concerns about residential and commercial real estate loans. The consumer price index improved from 6.4% in January 2023 to 3.4% in December 2023, but inflation rates still remained above the Federal Reserve’s 2% target. Global supply chains eased throughout 2023 and adjusted to the longer than expected Russia-Ukraine conflict; however, conflicts in the Middle East between Israel and Hamas and the U.S. and Yemen added new uncertainties. Labor market conditions eased modestly but remained historically tight as the unemployment rate increased from 3.4% to 3.7% during the year.
During 2022, our economic outlook was updated to reflect our expectations of a period of below trend economic growth beginning this year and a mild U.S. recession in 2023. COVID cases receded in the United States but continued to disrupt global supply chains and tight labor market conditions. The Russian invasion of Ukraine contributed to global oil prices increasing to near $120 per barrel and further disrupted supply chains due to economic sanctions imposed by the United States and other trade partners. Inflation rates initially expected to be transitory proved to trend persistently higher as the consumer price index rose to 9.1% on an annual basis in June. In response, the Federal Reserve adjusted monetary policy by increasing its federal funds rate target from 0.0% to 0.25% in March 2022 to 4.25% to 4.50% by December 2022. With lower government spending/stimulus and net exports, U.S. real GDP growth rates declined to (1.6%) and (0.6%) during the first and second quarters of 2022. While the Company and most economists downgraded their economic outlooks, the U.S. did not enter a recession. Real GDP growth improved to 3.2% during the third quarter of 2022 and U.S. labor markets proved resilient as unemployment rates decreased during the year from 4.0% to 3.5%
During 2021, our economic forecast improved year-over-year due to a third round of $1.9 trillion in government stimulus enacted in March 2021 through the American Rescue Plan Act. As a result of additional stimulus checks, enhanced unemployment benefits, extended lending from the PPP program, and expanded tax credits, consumer and business spending accelerated the U.S. real GDP growth rate in the second quarter of 2021 to 6.3% and in the third quarter of 2021 to 6.7%. Also, in March 2021, President Biden implemented new programs to extend COVID testing and vaccine eligibility for most adults in the United States by May 2021. Most states also ended their participation in federal pandemic unemployment benefit programs in early summer 2021. The U.S. unemployment rate decreased from 6.7% in December 2020 to 5.9% in June 2021 and decreased further to 4.2% by November 2021. In August 2021, a second wave of COVID cases progressed within the United States and Texas due to the delta variant, which slowed U.S. economic growth and real GDP growth rates to 2.3% in the third quarter of 2021. Then, in November 2021, Congress passed a fourth round of $0.6 trillion in government stimulus through the Infrastructure Investment and Jobs Act, and during December 2021, a third wave of COVID cases progressed in the United States and Texas due to the omicron variant.
During 2023, the provision for credit losses reflected a build in the allowance related to loan portfolio changes since December 31, 2022 and a deteriorating outlook for commercial real estate markets. Specific to the Bank, the net impact to the allowance of changes associated with collectively evaluated loans included a provision of credit losses of $12.7 million, while individually evaluated loans during 2023 included a provision for credit losses of $5.8 million. The change in the allowance for credit losses during 2023 was primarily attributable to the Bank and also reflected other factors including, but not limited to, loan mix, and changes in loan balances and qualitative factors from the prior period. The change in the allowance during 2023 was also impacted by net charge-offs of $2.4 million.
During 2022 and 2023, the impact of changes in the U.S. economic outlook and resulting impact on collectively evaluated loans has resulted in a net build in the allowance balance at December 31, 2023, compared with both December 31, 2022 and December 31, 2021. Taking into consideration changes in loan portfolio between noted periods, the resulting allowance for credit losses as a percentage of our total loan portfolio, excluding margin loans in the broker-dealer segment and banking segment mortgage warehouse lending programs, was 1.47%, 1.27% and 1.37% as of
90
December 31, 2023, 2022 and 2021, respectively. While changes in the U.S. economic outlook have been reflected in our current allowance at December 31, 2023, uncertainties that include, among others, the uncertain timing, duration and significance of further increases in market interest rates and a worsening macroeconomic forecast could adversely impact borrower cash flows and result in further increases in the allowance during future periods. In addition, while all industries could experience adverse impacts, certain of our loan portfolio industry sectors and subsectors, including real estate collateralized by office buildings, have an increased level of risk.
The respective distribution of the allowance for credit losses as a percentage of our total loan portfolio, excluding margin loans in the broker-dealer segment and banking segment mortgage warehouse lending programs, are presented in the following table (dollars in thousands).
Allowance For | |||||||||
Credit Losses | |||||||||
| Total | as a % of |
| ||||||
Total | Allowance | Total Loans | |||||||
Loans Held | for Credit | Held For |
| ||||||
December 31, 2023 | For Investment | Losses | Investment | ||||||
Commercial real estate: | |||||||||
Non-owner occupied (1) | $ | 1,889,882 | $ | 40,061 | 2.12 | % | |||
Owner occupied (2) | 1,422,234 | 28,114 | 1.98 | % | |||||
Commercial and industrial (3) | 1,450,995 | 20,848 | 1.44 | % | |||||
Construction and land development (4) |
| 1,031,095 |
| 12,102 | 1.17 | % | |||
Total commercial loans | 5,794,206 | 101,125 | 1.75 | % | |||||
1-4 family residential |
| 1,757,178 |
| 9,461 | 0.54 | % | |||
Consumer | 27,351 |
| 648 | 2.37 | % | ||||
Total retail loans |
| 1,784,529 |
| 10,109 | 0.57 | % | |||
| |||||||||
Total commercial and retail loans | 7,578,735 | 111,234 | 1.47 | % | |||||
Broker-dealer | 344,172 | 101 | 0.03 | % | |||||
Mortgage warehouse lending | 156,838 | 78 | 0.05 | % | |||||
Total loans held for investment | $ | 8,079,745 | $ | 111,413 | 1.38 | % | |||
| (1) | Included within commercial real estate non-owner occupied portfolio are loans within the office, retail and hotel/motel portfolio industry subsectors. At December 31, 2023, the office, retail and hotel/motel loans held for investment balances of approximately $521 million, $338 million and $233 million, respectively, had an allowance for credit losses of approximately $20 million, $5 million and $5 million, respectively, and an allowance for credit losses as a % of total loans held for investment of 3.8%, 1.4% and 2.2%, respectively. |
| (2) | Included within commercial real estate owner occupied portfolio are loans within the industrial and office portfolio industry subsectors. At December 31, 2023, the industrial and office loans held for investment balances of approximately $327 million and $307 million, respectively, had an allowance for credit losses of approximately $9 million and $7 million, respectively, and an allowance for credit losses as a % of total loans held for investment of 2.6% and 2.2%, respectively. |
| (3) | Commercial and industrial portfolio amounts reflect balances excluding banking segment mortgage warehouse lending. |
| (4) | Included within construction and land development portfolio are loans within the office and retail portfolio industry subsectors. At December 31, 2023, the office and retail loans held for investment balances of approximately $41 million and $19 million, respectively, had an allowance for credit losses of approximately $0.5 million and $0.4 million, respectively, and an allowance for credit losses as a % of total loans held for investment of 1.3% and 1.9%, respectively. |
Allowance Model Sensitivity
Our allowance model was designed to capture the historical relationship between economic and portfolio changes. As such, evaluating shifts in individual portfolio attributes or macroeconomic variables in isolation may not be indicative of past or future performance. It is difficult to estimate how potential changes in any one factor or input might affect the overall allowance for credit losses because we consider a wide variety of factors and inputs in the allowance for credit losses estimate. Changes in the factors and inputs considered may not occur at the same rate and may not be consistent across all geographies or product types, and changes in factors and input may be directionally inconsistent, such that improvement in one factor may offset deterioration in others.
91
However, to consider the sensitivity of credit loss estimates to alternative macroeconomic forecasts, we compared the Company’s allowance for credit loss estimates as of December 31, 2023, excluding margin loans in the broker-dealer segment, and the banking segment mortgage warehouse programs, with modeled results using both upside (“S1”) and downside (“S3”) economic scenario forecasts published by Moody’s Analytics.
Compared to our economic forecast, the upside scenario assumes the economic impacts from international armed conflicts and global supply chain concerns recede faster than expected. Real GDP is expected to grow 3.6% in the first quarter of 2024, 3.4% in the second quarter of 2024, 3.5% in the third quarter of 2024, and 3.4% in the fourth quarter of 2024. Average unemployment rates are expected to decline to 3.0% by the second quarter of 2024 before reverting to historical data. Inflation is expected to trend back toward the Federal Reserve’s target sooner than expected and we expect the federal funds rate to have peaked at 5.3% and return to 3.9% by the end of 2025.
Compared to our economic forecast, the downside scenario assumes the Federal Reserve’s efforts to resolve bank failures are not successful at restoring consumer and business confidences, causing banks to tighten lending standards while the Fed keeps the federal funds rate elevated due to inflation concerns. The international armed conflicts persist longer than anticipated and global supply chain issues worsen causing weaker manufacturing, increased good shortages and a U.S. recession during 2024. Real GDP is expected to decrease 3.3% in the first quarter of 2024, 3.5% in the second quarter of 2024, and 3.4% in the third quarter of 2024. Average unemployment rates are expected to increase to 7.7% by the first quarter of 2025, but improve to 6.9% by year-end 2025 and revert back to historical average rates over time. The Federal Reserve reduces the federal funds rate to support the economy to a 1.1% target by the fourth quarter of 2025 to slow inflation. Disagreements in Congress prevent any additional fiscal measures to stem the recession.
The impact of applying all of the assumptions of the upside economic scenario during the reasonable and supportable forecast period would have resulted in a decrease in the allowance for credit losses of approximately $33 million or a weighted average expected loss rate of 1.0% as a percentage of our total loan portfolio, excluding margin loans in the broker-dealer segment and the banking segment mortgage warehouse lending programs.
The impact of applying all of the assumptions of the downside economic scenario during the reasonable and supportable forecast period would have resulted in an increase in the allowance for credit losses of approximately $47 million or a weighted average expected loss rate of 2.1% as a percentage of our total loan portfolio, excluding margin loans in the broker-dealer segment and the banking segment mortgage warehouse lending programs.
This analysis relates only to the modeled credit loss estimates and is not intended to estimate changes in the overall allowance for credit losses as they do not reflect any potential changes in the adjustment to the quantitative calculation, which would also be influenced by the judgment management applies to the modeled lifetime loss estimates to reflect the uncertainty and imprecision of these modeled lifetime loss estimates based on then-current circumstances and conditions.
Our allowance for credit losses reflects our best estimate of current expected credit losses, which is highly dependent on several assumptions, including the macroeconomic outlook, inflationary pressures and labor market conditions, international armed conflicts and their impact on supply chains, the U.S elections and other various fiscal and monetary policy decisions. Future allowance for credit losses may vary considerably for these reasons.
92
Allowance Activity
The following table presents the activity in our allowance for credit losses within our loan portfolio for the periods presented (in thousands). Substantially all of the activity shown below occurred within the banking segment.
Year Ended December 31, |
| |||||||||
Loans Held for Investment | 2023 |
| 2022 |
| 2021 |
| ||||
Balance, beginning of year | $ | 95,442 | $ | 91,352 | $ | 149,044 | ||||
Provision for (reversal of) credit losses |
| 18,392 |
| 8,309 |
| (58,213) | ||||
Recoveries of loans previously charged off: | ||||||||||
Commercial real estate: |
|
|
| |||||||
Non-owner occupied | 42 | 28 | 16 | |||||||
Owner occupied | 41 | 100 | 250 | |||||||
Commercial and industrial |
| 3,445 |
| 2,746 |
| 2,656 | ||||
Construction and land development |
| — |
| — |
| — | ||||
1-4 family residential |
| 135 |
| 133 |
| 546 | ||||
Consumer | 276 |
| 289 | 281 | ||||||
Broker-dealer | — |
| — | — | ||||||
Total recoveries |
| 3,939 |
| 3,296 |
| 3,749 | ||||
Loans charged off: | ||||||||||
Commercial real estate: |
|
|
| |||||||
Non-owner occupied | 34 | — | — | |||||||
Owner occupied | 977 | — | 310 | |||||||
Commercial and industrial |
| 4,888 |
| 6,945 |
| 2,249 | ||||
Construction and land development |
| 1 |
| — |
| — | ||||
1-4 family residential |
| 73 |
| 138 |
| 312 | ||||
Consumer | 387 |
| 432 | 357 | ||||||
Broker-dealer | — |
| — | — | ||||||
Total charge-offs |
| 6,360 |
| 7,515 |
| 3,228 | ||||
Net recoveries (charge-offs) |
| (2,421) |
| (4,219) |
| 521 | ||||
Balance, end of year | $ | 111,413 | $ | 95,442 | $ | 91,352 | ||||
Average total loans for the year | $ | 7,950,878 | $ | 7,840,848 | $ | 7,645,292 | ||||
Total loans held for investment (end of year) | $ | 8,079,745 | $ | 8,092,673 | $ | 7,879,904 | ||||
Ratios: | ||||||||||
Net recoveries (charge-offs) to average total loans held for investment (1) | (0.03) | % | (0.05) | % | 0.01 | % | ||||
Non-accrual loans to total loans held for investment (end of year) | 0.80 | % | 0.30 | % | 0.60 | % | ||||
Allowance for credit losses on loans held for investment to: | ||||||||||
Total loans held for investment (end of year) | 1.38 | % | 1.18 | % | 1.16 | % | ||||
Non-accrual loans held for investment (end of year) | 173.17 | % | 386.81 | % | 193.08 | % | ||||
| (1) | Net recoveries (charge-offs) to average total loans held for investment ratio presented on a consolidated basis for all periods given relative immateriality of resulting measure by loan portfolio segment. |
Total non-accrual loans increased by $38.8 million from December 31, 2022 to December 31, 2023, compared to a decrease of $20.7 million from December 31, 2021 to December 31, 2022. These changes in non-accrual loans were impacted by loans secured by residential real estate within our mortgage origination segment, which were classified as loans held for sale, of $4.0 million, $4.8 million and $2.9 million at December 31, 2023, 2022 and 2021, respectively.
In addition to changes in non-accrual loans classified as loans held for sale, the increase in non-accrual loans during 2023 was primarily due to the addition of a single commercial real estate non-owner occupied loan with a balance of $33.3 million, the addition of six construction and land development loans to non-accrual status, and the addition in commercial real estate owner occupied loans of three credit relationship with an aggregate loan balance of $4.2 million, partially offset by the foreclosure of one office property in Texas, while the decrease in non-accrual loans during 2022 was primarily due to principal paydowns, settlements and charge-offs associated with several commercial and industrial, single family residential loan and commercial real estate owner occupied loan relationships.
93
As previously discussed in detail within this section, the allowance for credit losses has fluctuated from period to period, which impacted the resulting ratios noted in the table above. During 2021, the significant decline in the allowance for credit losses since December 31, 2020 reflected improvement in both realized economic results and the macroeconomic outlook due to improvements in both macroeconomic forecast assumptions and credit quality metrics on pandemic impacted industry sector exposures, while during 2022 the increase in the allowance for credit losses was driven by a deteriorating U.S. economic outlook since December 31, 2021. Then, during 2023 the significant build in the allowance for credit losses reflected loan portfolio changes and a deteriorating outlook for commercial real estate markets. The distribution of the allowance for credit losses among loan types and the percentage of the loans for that type to gross loans, excluding unearned income, within our loan portfolio is presented in the table below (dollars in thousands).
December 31, | ||||||||||||||||
2023 | 2022 | 2021 | ||||||||||||||
% of | % of | % of | ||||||||||||||
Allocation of the Allowance for Credit Losses | Reserve | Gross Loans | Reserve | Gross Loans | Reserve | Gross Loans | ||||||||||
Commercial real estate: |
| |||||||||||||||
Non-owner occupied | $ | 40,061 | 23.39 | % | $ | 39,247 | 23.11 | % | $ | 36,001 | 21.95 | % | ||||
Owner occupied | 28,114 | 17.60 | % | 24,008 | 17.00 | % | 23,353 | 16.66 | % | |||||||
Commercial and industrial |
|
| 20,926 | 19.90 | % | 16,035 | 20.26 | % |
| 21,982 |
| 23.80 | % | |||
Construction and land development |
|
| 12,102 | 12.76 | % | 6,051 | 12.12 | % |
| 4,674 |
| 11.33 | % | |||
1-4 family residential |
|
| 9,461 | 21.75 | % | 9,313 | 21.84 | % |
| 4,589 |
| 16.54 | % | |||
Consumer | 648 | 0.34 | % | 554 | 0.34 | % |
| 578 |
| 0.41 | % | |||||
Broker-dealer | 101 | 4.26 | % | 234 | 5.33 | % |
| 175 |
| 9.31 | % | |||||
Total |
| $ | 111,413 |
| 100.00 | % | $ | 95,442 |
| 100.00 | % | $ | 91,352 |
| 100.00 | % |
The following table summarizes historical levels of the allowance for credit losses on loans held for investment, distributed by portfolio segment (in thousands).
December 31, | September 30, | June 30, | March 31, | December 31, | |||||||||||
| 2023 |
| 2023 | 2023 |
| 2023 |
| 2022 | |||||||
Commercial real estate: | |||||||||||||||
Non-owner occupied | $ | 40,061 | $ | 40,433 | $ | 43,582 | $ | 38,667 | $ | 39,247 | |||||
Owner occupied | 28,114 | 29,438 | 27,880 | 22,854 | 24,008 | ||||||||||
Commercial and industrial |
| 20,926 |
| 19,722 |
| 17,315 |
| 16,615 |
| 16,035 | |||||
Construction and land development |
| 12,102 |
| 8,970 |
| 7,395 |
| 5,999 |
| 6,051 | |||||
1-4 family residential |
| 9,461 |
| 11,472 |
| 11,618 |
| 11,691 |
| 9,313 | |||||
Consumer | 648 | 601 | 615 | 563 | 554 | ||||||||||
Broker-dealer | 101 | 186 | 901 | 965 | 234 | ||||||||||
$ | 111,413 | $ | 110,822 | $ | 109,306 | $ | 97,354 | $ | 95,442 | ||||||
Unfunded Loan Commitments
In order to estimate the allowance for credit losses on unfunded loan commitments, the Bank uses a process similar to that used in estimating the allowance for credit losses on the funded portion. The allowance is based on the estimated exposure at default, multiplied by the lifetime probability of default grade and loss given default grade for that particular loan segment. The Bank estimates expected losses by calculating a commitment usage factor based on industry usage factors. The commitment usage factor is applied over the relevant contractual period. Loss factors from the underlying loans to which commitments are related are applied to the results of the usage calculation to estimate any liability for credit losses related for each loan type. Letters of credit are not currently reserved because they are issued primarily as credit enhancements and the likelihood of funding is low.
Changes in the allowance for credit losses for loans with off-balance sheet credit exposures are shown below (in thousands).
Year Ended December 31, | ||||||||
2023 |
| 2022 |
| 2021 | ||||
Balance, beginning of year | $ | 7,784 | $ | 5,880 | $ | 8,388 | ||
Other noninterest expense | 1,092 | 1,904 | (2,508) | |||||
Balance, end of year | $ | 8,876 | $ | 7,784 | $ | 5,880 | ||
94
During 2022, the increase in the allowance for unfunded commitments was due to increases in both loan expected loss rates and available commitment balances. During 2023, the increase in the reserve for unfunded commitments was primarily due to increases in expected loss rates.
Potential Problem Loans
Potential problem loans consist of loans that are performing in accordance with contractual terms but for which management has concerns about the ability of an obligor to continue to comply with repayment terms because of the obligor’s potential operating or financial difficulties or whether repayment may depend on collateral or other risk mitigation. Management monitors these loans and reviews their performance on a regular basis. Potential problem loans contain potential weaknesses that could improve, persist or further deteriorate. If such potential weaknesses persist without improving, the loan is subject to downgrade, typically to substandard, in three to six months. Potential problem loans include those loans assigned a grade of special mention and substandard accrual within our risk grading matrix. Potential problem loans do not include purchased credit deteriorated (“PCD”) loans because PCD loans exhibited evidence of more than insignificant credit deterioration at acquisition that made it probable that all contractually required principal payments would not be collected.
At December 31, 2023, we had $207.4 million in potential problem loans, compared to $186.6 million at December 31, 2022 and $201.6 million at December 31, 2021. Our potential problem loans designated as substandard accrual at December 31, 2023, 2022 and 2021 totaled $204.1 million, $182.6 million and $198.5 million, respectively. The increase from December 31, 2022 to December 31, 2023 was primarily attributable to increases in commercial and industrial loans and construction and land development loans, significantly offset by a decrease in commercial real estate non-owner occupied loans. Of the $204.1 million of potential problem loans designated as substandard accrual at December 31, 2023, $87.4 million, $41.2 million and $32.1 million were associated with commercial and industrial, commercial real estate non-owner occupied and commercial real estate owner occupied loans.
Potential problem loans designated as special mention were comprised of three credit relationships totaling $3.2 million at December 31, 2023, compared with four credit relationships totaling $4.0 million at December 31, 2022 and two credit relationships totaling $3.1 million at December 31, 2021. Of the $3.2 million of potential problem loans at December 31, 2023, $1.6 million was associated with a single credit relationship.
95
Non-Performing Assets
The following table presents components of our non-performing assets (dollars in thousands).
December 31, | Variance | |||||||||||||||
| 2023 |
| 2022 |
| 2021 | 2023 vs 2022 | 2022 vs 2021 |
| ||||||||
Loans accounted for on a non-accrual basis: |
|
|
| |||||||||||||
Commercial real estate: |
|
|
|
|
|
|
|
|
|
| ||||||
Non-owner occupied | $ | 36,440 | $ | 1,250 | $ | 2,266 | $ | 35,190 | $ | (1,016) | ||||||
Owner occupied | 5,098 | 3,019 | 4,335 | 2,079 | (1,316) | |||||||||||
Commercial and industrial |
| 9,502 |
| 9,095 |
| 22,478 | 407 | (13,383) | ||||||||
Construction and land development |
| 3,480 |
| 198 |
| 2 | 3,282 | 196 | ||||||||
1-4 family residential |
| 13,801 |
| 15,941 |
| 21,123 | (2,140) | (5,182) | ||||||||
Consumer | 6 | 14 | 23 | (8) | (9) | |||||||||||
Broker-dealer | — | — | — | — | — | |||||||||||
$ | 68,327 | $ | 29,517 | $ | 50,227 | $ | 38,810 | $ | (20,710) | |||||||
Troubled debt restructurings included in accruing loans held for investment (1) | — | 803 | 922 | (803) | (119) | |||||||||||
Non-performing loans (1) | $ | 68,327 | $ | 30,320 | $ | 51,149 | $ | 38,007 | $ | (20,829) | ||||||
Non-performing loans as a percentage of total loans (1) |
| 0.76 | % |
| 0.33 | % |
| 0.52 | % | 0.43 | % | (0.19) | % | |||
Other real estate owned | $ | 5,095 | $ | 2,325 | $ | 2,833 | $ | 2,770 | $ | (508) | ||||||
Other repossessed assets | $ | — | $ | — | $ | — | $ | — | $ | — | ||||||
Non-performing assets (1) | $ | 73,422 | $ | 32,645 | $ | 53,982 | $ | 40,777 | $ | (21,337) | ||||||
Non-performing assets as a percentage of total assets (1) |
| 0.45 | % |
| 0.20 | % |
| 0.29 | % | 0.25 | % | (0.09) | % | |||
Loans past due 90 days or more and still accruing | $ | 115,090 | $ | 92,099 | $ | 60,775 | $ | 22,991 | $ | 31,324 | ||||||
| (1) | Effective January 1, 2023, we adopted Accounting Standards Update (“ASU”) 2022-02 which eliminated the recognition and measurement guidance on troubled debt restructurings for creditors. Therefore, we no longer present troubled debt restructurings as a component of non-performing loans and assets. |
At December 31, 2023, non-accrual loans included 40 commercial and industrial relationships with loans secured primarily by notes receivable, accounts receivable and equipment. Non-accrual loans at December 31, 2023 also included $4.0 million of loans secured by residential real estate which were classified as loans held for sale. As previously noted earlier in this section, the increase in non-accrual loans during 2023 was primarily due to the addition of a single commercial real estate non-owner occupied loan with a balance of $33.3 million. At December 31, 2022, non-accrual loans included 40 commercial and industrial relationships with loans secured by accounts receivable, automobiles, equipment and notes receivable. Non-accrual loans at December 31, 2022 also included $4.8 million of loans secured by residential real estate which were classified as loans held for sale. At December 31, 2021, non-accrual loans included 45 commercial and industrial relationships with loans secured by accounts receivable, life insurance, oil and gas, livestock and equipment. Non-accrual loans at December 31, 2021 also included $2.9 million of loans secured by residential real estate which were classified as loans held for sale.
OREO increased from December 31, 2022 to December 31, 2023, primarily due to additions totaling $5.6 million, partially offset by disposals and valuation adjustments totaling $2.8 million. OREO decreased from December 31, 2021 to December 31, 2022, primarily due to disposals and valuation adjustments totaling $1.8 million, partially offset by additions totaling of $1.3 million.
Loans past due 90 days or more and still accruing at December 31, 2023, 2022 and 2021 were primarily comprised of loans held for sale and guaranteed by U.S. government agencies, including GNMA related loans subject to repurchase within our mortgage origination segment. As of December 31, 2023, $4.2 million of loans subject to repurchase under a forbearance agreement had delinquencies on or after April 2020.
96
Deposits
The banking segment’s major source of funds and liquidity is its deposit base. Deposits provide funding for its investments in loans and securities. Interest paid for deposits must be managed carefully to control the level of interest expense and overall net interest margin. The composition of the deposit base (time deposits versus interest-bearing demand deposits and savings), as discussed in more detail within the section titled “Liquidity and Capital Resources — Banking Segment” below, is constantly changing due to the banking segment’s needs and market conditions. Currently, the banking segment is facing intense competition for its deposit base as customers seek higher yields on deposits. Consistent with the consolidated trend in average rates paid on interest-bearing deposits noted in the table below, the banking segment’s average rate paid on interest-bearing deposits during 2023, 2022 and 2021 was 3.50%, 0.86%, and 0.41% respectively.
Given the rising interest rate environment since the first quarter of 2022 and the intense competition for deposits in its market area, the Bank’s cumulative interest-bearing deposit pricing beta, excluding deposits from the Hilltop Securities FDIC-insured sweep program and brokered deposits, has approximated 65 percent. The deposit pricing beta represents the change in interest-bearing deposit pricing in response to a change in market interest rates. The historical interest-bearing deposit pricing beta for the Bank, excluding deposits from our Hilltop Securities FDIC-insured sweep program and brokered deposits, has approximated 50 percent. We expect that the Bank’s cost related to interest-bearing deposits during 2024 to continue to be driven by various factors, including competition as well as economic and market area factors.
The table below presents the average balance of, and rate paid on, consolidated deposits (dollars in thousands).
Year Ended December 31, | |||||||||||||||||
2023 | 2022 | 2021 | |||||||||||||||
| Average |
| Average |
| Average |
| Average |
| Average |
| Average |
| |||||
Balance | Rate Paid | Balance | Rate Paid | Balance | Rate Paid | ||||||||||||
Noninterest-bearing demand deposits | $ | 3,441,437 |
| 0.00 | % | $ | 4,455,779 |
| 0.00 | % | $ | 4,157,962 |
| 0.00 | % | ||
Interest-bearing deposits: | |||||||||||||||||
Demand |
| 6,369,558 |
| 2.92 | % | 6,320,654 |
| 0.68 | % |
| 6,077,660 |
| 0.19 | % | |||
Savings |
| 282,127 |
| 1.09 | % | 330,743 |
| 0.22 | % |
| 295,075 |
| 0.06 | % | |||
Time |
| 1,059,885 |
| 3.24 | % | 910,104 |
| 0.73 | % |
| 1,349,849 |
| 0.86 | % | |||
7,711,570 | 2.89 | % | 7,561,501 | 0.67 | % | 7,722,584 | 0.30 | % | |||||||||
Total deposits | $ | 11,153,007 |
| 2.00 | % | $ | 12,017,280 |
| 0.42 | % | $ | 11,880,546 |
| 0.20 | % | ||
The table above includes interest-bearing brokered deposits with balances of approximately $208 million at December 31, 2023, compared with approximately $14 million and $228 million at December 31, 2022 and 2021, respectively. As previously discussed, to bolster our liquidity position given banking sector uncertainties in early 2023, we increased brokered deposits at the Bank by approximately $390 million during the second quarter of 2023. The variability in the level of brokered deposits has been, and will continue to be, managed through asset/liability strategy and policies that are address diversification of funding sources and market conditions, including demand by customers and other investors for those deposits, and the cost of funds available from alternative sources at the time. As of December 31, 2023, brokered deposits carried an average weighted interest rate of 5.49% and an average remaining term of 87 days.
At December 31, 2023, total estimated uninsured deposits were $4.7 billion, or approximately 42% of total deposits, while estimated uninsured deposits, excluding collateralized deposits of $315.7 million, were $4.4 billion, or approximately 40% of total deposits. Total estimated uninsured deposits were $4.1 billion, or approximately 36% of total deposits, as of December 31, 2022.
97
The following table presents the scheduled maturities of the portion of our time deposits that are in excess of the FDIC insurance limit of $250,000 as of December 31, 2023 (in thousands).
Months to maturity: |
|
| |
3 months or less | $ | 256,568 | |
3 months to 6 months |
| 69,377 | |
6 months to 12 months |
| 154,900 | |
Over 12 months |
| 62,444 | |
$ | 543,289 |
Borrowings
Our consolidated borrowings are shown in the table below (dollars in thousands).
December 31, |
| |||||||||||||||
2023 | 2022 | 2021 | ||||||||||||||
|
| Average |
|
|
| Average |
|
|
| Average |
| |||||
Balance | Rate Paid | Balance | Rate Paid | Balance | Rate Paid |
| ||||||||||
Short-term borrowings | $ | 900,038 |
| 4.75 | % | $ | 970,056 |
| 2.27 | % | $ | 859,444 |
| 1.22 | % | |
Notes payable |
| 347,145 |
| 4.27 | % |
| 346,654 |
| 4.33 | % |
| 387,904 |
| 5.79 | % | |
Junior subordinated debentures | — | — | % | — | — | % | — | 3.45 | % | |||||||
$ | 1,247,183 |
| 4.64 | % | $ | 1,316,710 |
| 2.86 | % | $ | 1,247,348 |
| 1.32 | % | ||
Short-term borrowings consisted of federal funds purchased, securities sold under agreements to repurchase, borrowings at the FHLB, short-term bank loans and commercial paper. The decrease in short-term borrowings at December 31, 2023, compared with December 31, 2022, primarily reflected decreases in short term bank loans and securities sold
under agreements to repurchase by the broker-dealer segment, partially offset by an increase in federal funds purchased by the banking segment. The increase in short-term borrowings at December 31, 2022 compared with December 31, 2021 primarily reflected increases in federal funds purchased by the banking segment and securities sold under agreement to repurchase by the broker-dealer segment, partially offset by decreases in commercial paper and short-term bank loans within the broker-dealer segment.
Notes payable at December 31, 2023 was comprised of $149.5 million related to the Senior Notes, net of loan origination fees, and Subordinated Notes, net of origination fees, of $197.6 million. Notes payable at December 31, 2022 was comprised of $149.3 million related to Senior Notes, net of loan origination fees, and Subordinated Notes, net of origination fees, of $197.4 million, while notes payable at December 31, 2021 was comprised of $149.1 million related to Senior Notes, net of loan origination fees, Subordinated Notes, net of origination fees, of $197.1 million and mortgage origination segment borrowings of $41.7 million. As discussed in more detail within the section titled “Liquidity and Capital Resources — Junior Subordinated Debentures” below, during the third quarter of 2021, PCC fully redeemed all outstanding Debentures.
98
Liquidity and Capital Resources
Hilltop is a financial holding company whose assets primarily consist of the stock of its subsidiaries and invested assets. Hilltop’s primary investment objectives, as a holding company, are to support capital deployment for organic growth and to preserve capital to be deployed through acquisitions, dividend payments and stock repurchases. At December 31, 2023, Hilltop had $191.6 million in cash and cash equivalents, an increase of $19.1 million from $172.5 million at December 31, 2022. This increase in cash and cash equivalents was primarily due to the receipt of $90.8 million of dividends from subsidiaries, partially offset by cash outflows of $41.6 million in cash dividends declared, $5.1 million in stock repurchases, and other general corporate expenses. Subject to regulatory restrictions, Hilltop has received, and may also continue to receive, dividends from its subsidiaries. If necessary or appropriate, we may also finance acquisitions with the proceeds from equity or debt issuances. We believe that Hilltop’s liquidity is sufficient for the foreseeable future, with current short-term liquidity needs including operating expenses, interest on debt obligations, dividend payments to stockholders and potential stock repurchases.
As discussed in more detail below, our Senior Notes mature in May 2025 and we have the ability to redeem the 2030 Subordinated Notes, in whole or in part, beginning in May 2025. We have begun to evaluate our options and may choose to refinance and/or utilize available cash on hand to satisfy such existing indebtedness. Although it is difficult in the current economic environment to predict the terms and conditions of financing that may be available in the future, we believe that we have sufficient access to credit from financial institutions and/or financing from public and private debt and equity markets to refinance or repay our Senior Notes.
Economic Environment
As previously discussed, operational and financial headwinds during 2022 and 2023 have had, and are expected to continue to have, an adverse impact on our operating results during 2024. The impacts of noted headwinds in 2024 are highly uncertain and will depend on several developments outside of our control, including, among others, the timing and significance of further changes in U.S. treasury yields and mortgage interest rates, exposure to increasing funding costs, inflationary pressures associated with compensation, occupancy and software costs and labor market conditions, and international armed conflicts and their impact on supply chains. In addition, during early 2023, the banking sector experienced increased uncertainty and concerns associated with liquidity positions primarily due to bank failures during early 2023 as depositors sought to reduce risks associated with uninsured deposits and withdraw such deposits from existing bank relationships. As demonstrated during the extreme volatility and disruptions in the capital and credit markets beginning in March 2020 resulting from the pandemic and its negative impact on the economy, we will continue to monitor the economic environment and evaluate appropriate actions to enhance our financial flexibility, protect capital, minimize losses and ensure target liquidity levels.
Dividend Program and Declaration
In October 2016, we announced that our board of directors authorized a dividend program under which we intend to pay quarterly dividends on our common stock, subject to quarterly declarations by our board of directors. During 2023, we declared and paid cash dividends of $0.64 per common share, or $41.6 million.
On January 25, 2024, our board of directors declared a quarterly cash dividend of $0.17 per common share, payable on February 28, 2024 to all common stockholders of record as of the close of business on February 12, 2024.
Future dividends on our common stock are subject to the determination by the board of directors based on an evaluation of our earnings and financial condition, liquidity and capital resources, the general economic and regulatory climate, our ability to service any equity or debt obligations senior to our common stock and other factors.
Stock Repurchases
In January 2023, our board of directors authorized a new stock repurchase program through January 2024, pursuant to which we are authorized to repurchase, in the aggregate, up to $75.0 million of our outstanding common stock, inclusive of repurchases to offset dilution related to grants of stock-based compensation. During 2023, Hilltop paid $5.1 million to
99
repurchase an aggregate of 164,604 shares of our common stock at an average price of $30.95 per share pursuant to the stock repurchase program.
In January 2024, our board of directors authorized a new stock repurchase program through January 2025, pursuant to which we are authorized to repurchase, in the aggregate, up to $75.0 million of our outstanding common stock, inclusive of repurchases to offset dilution related to grants of stock-based compensation. Under the stock repurchase program authorized, we may repurchase shares in the open market or through privately negotiated transactions as permitted under Rule 10b-18 promulgated under the Exchange Act. The extent to which we repurchase our shares and the timing of such repurchases depends upon market conditions and other corporate considerations, as determined by Hilltop’s management team. Repurchased shares will be returned to our pool of authorized but unissued shares of common stock.
The Inflation Reduction Act of 2022, signed into law during August 2022, introduced a nondeductible excise tax equal to 1% of the fair market value of certain shares repurchased beginning in 2023, subject to certain limitations. While we may complete transactions subject to the new excise tax, we do not expect the tax to have a material impact to our financial condition or results of operations.
Tender Offer
On May 2, 2022, we announced the commencement of a modified “Dutch auction” tender offer to purchase shares of our common stock for an aggregate cash purchase price of up to $400 million, inclusive of our $100.0 million stock repurchase program authorized in January 2022. On May 27, 2022 including the exercise of our right to purchase up to an additional 2% of our outstanding shares, we completed our tender offer, repurchasing 14,868,469 shares of outstanding common stock at a price of $29.75 per share for a total of $442.3 million. We funded the tender offer with cash on hand.
Senior Notes due 2025
On April 9, 2015, we completed an offering of $150.0 million aggregate principal amount of our 5% senior notes due 2025 (“Senior Unregistered Notes”) in a private offering that was exempt from the registration requirements of the Securities Act. The Senior Unregistered Notes were issued pursuant to an indenture, dated as of April 9, 2015 (the “indenture”), by and between Hilltop and U.S. Bank National Association, as trustee.
On June 22, 2015, we exchanged substantially all of the Senior Unregistered Notes for notes registered under the Securities Act (the “Senior Registered Notes”) that are substantially identical to the Senior Unregistered Notes (including principal amount, interest rate, maturity and redemption rights), except that the Senior Registered Notes generally are not subject to transfer restrictions. We refer to the Senior Registered Notes and the Senior Unregistered Notes that remain outstanding collectively as the “Senior Notes.”
The Senior Notes bear interest at a rate of 5% per year, payable semi-annually in arrears in cash on April 15 and October 15 of each year, commencing on October 15, 2015. The Senior Notes will mature on April 15, 2025, unless we redeem the Senior Notes, in whole at any time or in part from time to time, on or after January 15, 2025 (three months prior to the maturity date of the Senior Notes) at our election at a redemption price equal to 100% of the principal amount of the Senior Notes to be redeemed plus accrued and unpaid interest to, but excluding, the redemption date. At December 31, 2023, $150.0 million of our Senior Notes was outstanding.
The indenture contains covenants that limit our ability to, among other things and subject to certain significant exceptions: (i) dispose of or issue voting stock of certain of our bank subsidiaries or subsidiaries that own voting stock of our bank subsidiaries, (ii) incur or permit to exist any mortgage, pledge, encumbrance or lien or charge on the capital stock of certain of our bank subsidiaries or subsidiaries that own capital stock of our bank subsidiaries and (iii) sell all or substantially all of our assets or merge or consolidate with or into other companies. The indenture also provides for certain events of default, which, if any of them occurs, would permit or require the principal amount, premium, if any, and accrued and unpaid interest on the then outstanding Senior Notes to be declared immediately due and payable.
100
Subordinated Notes due 2030 and 2035
On May 7, 2020, we completed a public offering of $50 million aggregate principal amount of 2030 Subordinated Notes and $150 million aggregate principal amount of 2035 Subordinated Notes that mature on May 15, 2030 and May 15, 2035, respectively. We collectively refer to the 2030 Subordinated Notes and the 2035 Subordinated Notes as the “Subordinated Notes”. The price to the public for the Subordinated Notes was 100% of the principal amount of the Subordinated Notes. The net proceeds from the offering, after deducting underwriting discounts and fees and expenses of $3.4 million, were $196.6 million.
We may redeem the Subordinated Notes, in whole or in part, from time to time, subject to obtaining Federal Reserve approval, beginning with the interest payment date of May 15, 2025 for the 2030 Subordinated Notes and beginning with the interest payment date of May 15, 2030 for the 2035 Subordinated Notes at a redemption price equal to 100% of the principal amount of the Subordinated Notes being redeemed plus accrued and unpaid interest to but excluding the date of redemption.
The 2030 Subordinated Notes bear interest at a rate of 5.75% per year, payable semi-annually in arrears commencing on November 15, 2020. The interest rate for the 2030 Subordinated Notes will reset quarterly beginning May 15, 2025 to an interest rate, per year, equal to the then-current benchmark rate, which is expected to be three-month term SOFR rate, plus 5.68%, payable quarterly in arrears. The 2035 Subordinated Notes bear interest at a rate of 6.125% per year, payable semi-annually in arrears commencing on November 15, 2020. The interest rate for the 2035 Subordinated Notes will reset quarterly beginning May 15, 2030 to an interest rate, per year, equal to the then-current benchmark rate, which is expected to be three-month term SOFR rate plus 5.80%, payable quarterly in arrears. At December 31, 2023, $200.0 million of our Subordinated Notes was outstanding.
Junior Subordinated Debentures
Following receipt of regulatory approval, during June, July and August 2021, PCC submitted to the trustees of each of the statutory trusts a notice to redeem in full outstanding Debentures of $67.0 million issued by PCC, which resulted in the full redemption to the holders of the associated preferred securities and common securities during the third quarter of 2021.
The Debentures, which were held by four statutory trusts created for the sole purpose of issuing and selling preferred securities and common securities used to acquire the Debentures, had an original stated term of 30 years with original maturities ranging from July 2031 to February 2038. The Debentures were callable at PCC’s discretion with a minimum of a 45- to 60- day notice. The redemptions noted above were funded from available cash balances held at PCC.
Regulatory Capital
We are subject to various regulatory capital requirements administered by the federal banking agencies. Failure to meet minimum capital requirements may prompt certain actions by regulators that, if undertaken, could have a direct material adverse effect on our financial condition and results of operations. Under capital adequacy and regulatory requirements, we must meet specific capital guidelines that involve quantitative measures of our assets, liabilities, and certain off-balance sheet items as calculated under regulatory accounting practices. Our capital amounts and classification are also subject to qualitative judgments by the regulators about components, risk weightings and other factors.
In order to avoid limitations on capital distributions, including dividend payments, stock repurchases and certain discretionary bonus payments to executive officers, Basel III requires banking organizations to maintain a capital conservation buffer above minimum risk-based capital requirements measured relative to risk-weighted assets.
The following table shows PlainsCapital’s and Hilltop’s actual capital amounts and ratios in accordance with Basel III compared to the regulatory minimum capital requirements including conservation buffer ratio in effect at December 31, 2023 (dollars in thousands). Based on actual capital amounts and ratios shown in the following table, PlainsCapital’s ratios place it in the “well capitalized” (as defined) capital category under regulatory requirements. Actual capital amounts and ratios as of December 31, 2023 reflect PlainsCapital’s and Hilltop’s decision to elect the transition option as issued by
101
the federal banking regulatory agencies in March 2020 that permits banking institutions to mitigate the estimated cumulative regulatory capital effects from CECL over a five-year transitionary period through December 31, 2024.
Minimum Capital | |||||||||||
Requirements Including | To Be Well |
| |||||||||
December 31, 2023 | Conservation Buffer | Capitalized |
| ||||||||
| Amount |
| Ratio |
| Ratio |
| Ratio |
| |||
Tier 1 capital (to average assets): | |||||||||||
PlainsCapital | $ | 1,407,660 |
| 10.55 | % | 4.0 | % | 5.0 | % | ||
Hilltop |
| 1,974,918 |
| 12.23 | % | 4.0 | % | N/A | |||
Common equity Tier 1 capital | |||||||||||
PlainsCapital | 1,407,660 |
| 15.44 | % | 7.0 | % | 6.5 | % | |||
Hilltop | 1,974,918 |
| 19.32 | % | 7.0 | % | N/A | ||||
Tier 1 capital (to risk-weighted assets): |
| ||||||||||
PlainsCapital |
| 1,407,660 |
| 15.44 | % | 8.5 | % | 8.0 | % | ||
Hilltop |
| 1,974,918 |
| 19.32 | % | 8.5 | % | N/A | |||
Total capital (to risk-weighted assets): | |||||||||||
PlainsCapital |
| 1,511,239 |
| 16.58 | % | 10.5 | % | 10.0 | % | ||
Hilltop |
| 2,284,357 |
| 22.34 | % | 10.5 | % | N/A | |||
We discuss regulatory capital requirements in more detail in Note 21 to our consolidated financial statements, as well as under the caption “Government Supervision and Regulation — Corporate — Capital Adequacy Requirements and BASEL III” set forth in Part I, Item I. of this Annual Report.
Banking Segment
Within our banking segment, our primary uses of cash are for customer withdrawals and extensions of credit as well as our borrowing costs and other operating expenses. Our corporate treasury group is responsible for continuously monitoring our liquidity position to ensure that our assets and liabilities are managed in a manner that will meet our short-term and long-term cash requirements. Our goal is to manage our liquidity position in a manner such that we can meet our customers’ short-term and long-term deposit withdrawals and anticipated and unanticipated increases in loan demand without penalizing earnings. Funds invested in short-term marketable instruments, the continuous maturing of other interest-earning assets, cash flows from self-liquidating investments such as mortgage-backed securities and collateralized mortgage obligations, the possible sale of available for sale securities, and the ability to securitize certain types of loans provide sources of liquidity from an asset perspective. The liability base provides sources of liquidity through deposits and the maturity structure of short-term borrowed funds. For short-term liquidity needs, we utilize federal fund lines of credit with correspondent banks, securities sold under agreements to repurchase, borrowings from the Federal Reserve and borrowings under lines of credit with other financial institutions. For intermediate liquidity needs, we utilize advances from the FHLB. To supply liquidity over the longer term, we have access to brokered time deposits, term loans at the FHLB and borrowings under lines of credit with other financial institutions.
The above sources of liquidity allow the banking segment to meet increased liquidity demands without adversely affecting daily operations. The Bank’s borrowing capacity through access to secured funding sources is summarized in the following table (in millions). Available liquidity noted below does not include borrowing capacity available through the discount window at the Federal Reserve.
December 31, | ||||||
2023 | 2022 | |||||
FHLB capacity | $ | 4,205 | $ | 4,139 | ||
Investment portfolio (available) |
| 1,594 |
| 1,606 | ||
Fed deposits (excess daily requirements) | 1,612 | 1,332 | ||||
$ | 7,411 | $ | 7,077 | |||
As previously discussed, the banking sector experienced increased uncertainty and concerns associated with its liquidity positions primarily due to high-profile bank failures during early 2023 as depositors sought to reduce risks associated
102
with uninsured deposits and withdraw such deposits from existing bank relationships. As a result, both regulatory scrutiny and market focus on liquidity increased. These failures underscore the importance of maintaining access to diverse sources of funding. In light of these events, we have continued our efforts to monitor deposit flows and balance sheet trends to ensure that our liquidity needs are maintained. During 2023, we began increasing interest-bearing deposit rates to address rising market interest rates and intense competition for liquidity to combat deposit outflows. At December 31, 2023, the Bank also accessed and included approximately $1.1 billion of core deposits on its balance sheet from our Hilltop Securities FDIC-insured sweep program, while the Bank is not utilizing any of its FHLB borrowing capacity noted above through the use of short-term borrowings.
Further, to bolster our liquidity position, we increased brokered deposits at the Bank by approximately $390 million during the second quarter of 2023 that have a remaining balance of approximately $208 million at December 31, 2023. To date, we have not leveraged the discount window at the Federal Reserve or the BTFP.
Within our banking segment, deposit flows are affected by the level of market interest rates, the interest rates and products offered by competitors, the volatility of equity markets and other factors. An economic recovery and improved commercial real estate investment outlook may result in an outflow of deposits at an accelerated pace as customers utilize such available funds for expanded operations and investment opportunities. The Bank regularly evaluates its deposit products and pricing structures relative to the market to maintain competitiveness over time. Currently, the Bank is facing significant competition from bank and non-bank competitors for its deposit base and expects that its interest expense on certain deposits during 2024 to continue to be driven by various factors, including competition as well as economic and market area factors.
The Bank’s 15 largest depositors, excluding Hilltop and Hilltop Securities, collectively accounted for 9.31% of the Bank’s total deposits, and the Bank’s five largest depositors, excluding Hilltop and Hilltop Securities, collectively accounted for 4.49% of the Bank’s total deposits at December 31, 2023. The loss of one or more of our largest Bank customers, or a significant decline in our deposit balances due to ordinary course fluctuations related to these customers’ businesses, could adversely affect our liquidity and might require us to raise deposit rates to attract new deposits, purchase federal funds or borrow funds on a short-term basis to replace such deposits.
Broker-Dealer Segment
The Hilltop Broker-Dealers rely on their equity capital, short-term bank borrowings, interest-bearing and noninterest-bearing client credit balances, correspondent deposits, securities lending arrangements, repurchase agreement financing, commercial paper issuances and other payables to finance their assets and operations, subject to their respective compliance with broker-dealer net capital and customer protection rules. At December 31, 2023, Hilltop Securities had credit arrangements with two unaffiliated banks, with maximum aggregate commitments of up to $425.0 million. These credit arrangements are used to finance securities owned, securities held for correspondent accounts, receivables in customer margin accounts and underwriting activities. These credit arrangements are provided on an “as offered” basis and are not committed lines of credit. In addition, Hilltop Securities has committed revolving credit facilities with two unaffiliated banks, with aggregate availability of up to $200.0 million. At December 31, 2023, Hilltop Securities had no borrowings under its credit arrangements or its credit facilities.
Hilltop Securities uses the net proceeds (after deducting related issuance expenses) from the sale of two commercial paper programs for general corporate purposes, including working capital and the funding of a portion of its securities inventories. The commercial paper notes (“CP Notes”) may be issued with maturities of 14 days to 270 days from the date of issuance. The CP Notes are issued under two separate programs, Series 2019-1 CP Notes and Series 2019-2 CP Notes, in maximum aggregate amounts of $300 million and $200 million, respectively. As of December 31, 2023, the weighted average maturity of the CP Notes was 138 days at a rate of 6.32%, with a weighted average remaining life of 67 days. At December 31, 2023, the aggregate amount outstanding under these secured arrangements was $200.3 million, which was collateralized by securities held for Hilltop Securities accounts valued at $222.6 million.
103
Mortgage Origination Segment
PrimeLending funds the mortgage loans it originates through a warehouse line of credit maintained with the Bank which had a total commitment of $1.5 billion, of which $839 million was drawn at December 31, 2023. PrimeLending sells substantially all mortgage loans it originates to various investors in the secondary market, historically with the majority with servicing released. As these mortgage loans are sold in the secondary market, PrimeLending pays down its warehouse line of credit with the Bank. In addition, PrimeLending has an available line of credit with an unaffiliated bank of up to $1.0 million, of which no borrowings were drawn at December 31, 2023.
PrimeLending owns a 100% membership interest in PrimeLending Ventures Management, LLC (“Ventures Management”) which holds a controlling ownership interest in and is the managing member of certain ABAs. At
December 31, 2023, these ABAs had combined available lines of credit totaling $65.0 million, all of which was with the Bank, with outstanding borrowings of $31.2 million.
Other Material Contractual Obligations, Off-Balance Sheet Arrangements, Commitments and Guarantees
The following table presents information regarding other material contractual obligations at December 31, 2023 not previously discussed (in thousands). Payments related to leases are based on actual payments specified in the underlying contracts, and the table below includes all leases that had commenced as of December 31, 2023.
Payments Due by Period |
| |||||||||||||||
|
|
| More than 1 |
| 3 Years or |
|
|
|
|
| ||||||
1 year | Year but Less | More but Less | 5 Years |
| ||||||||||||
or Less | than 3 Years | than 5 Years | or More | Total |
| |||||||||||
Finance lease obligations | $ | 1,163 | $ | 1,699 | $ | 597 | $ | — | $ | 3,459 | ||||||
Operating lease obligations |
| 30,461 |
| 43,817 |
| 26,595 |
| 21,223 |
| 122,096 | ||||||
Total | $ | 31,624 | $ | 45,516 | $ | 27,192 | $ | 21,223 | $ | 125,555 | ||||||
Additionally, in the normal course of business, we enter into various transactions, which, in accordance with GAAP, are not included in our consolidated balance sheets. We enter into these transactions to meet the financing needs of our customers. These transactions include commitments to extend credit and standby letters of credit, which involve, to varying degrees, elements of credit risk and interest rate risk in excess of the amounts recognized in our consolidated balance sheets.
Banking Segment
We enter into contractual loan commitments to extend credit, normally with fixed expiration dates or termination clauses, at specified rates and for specific purposes. Substantially all of our commitments to extend credit are contingent upon customers maintaining specific credit standards until the time of loan funding. We minimize our exposure to loss under these commitments by subjecting them to credit approval and monitoring procedures. We assess the credit risk associated with certain commitments to extend credit and have recorded a liability related to such credit risk in our consolidated financial statements.
Standby letters of credit are written conditional commitments issued by us to guarantee the performance of a customer to a third-party. In the event the customer does not perform in accordance with the terms of the agreement with the third-party, we would be required to fund the commitment. The maximum potential amount of future payments we could be required to make is represented by the contractual amount of the commitment. If the commitment is funded, we would be entitled to seek recovery from the customer. Our policies generally require that standby letter of credit arrangements contain security and debt covenants similar to those contained in loan agreements.
In the aggregate, the Bank had outstanding unused commitments to extend credit of $2.2 billion at December 31, 2023 and outstanding financial and performance standby letters of credit of $52.8 million at December 31, 2023.
104
Broker-Dealer Segment
The Hilltop Broker-Dealers execute, settle and finance various securities transactions that may expose the Hilltop Broker-Dealers to off-balance sheet risk in the event that a customer or counterparty does not fulfill its contractual obligations. Examples of such transactions include the sale of securities not yet purchased by customers or for the account of the Hilltop Broker-Dealers, use of derivatives to support certain non-profit housing organization clients, clearing agreements between the Hilltop Broker-Dealers and various clearinghouses and broker-dealers, secured financing arrangements that involve pledged securities, and when-issued underwriting and purchase commitments.
Impact of Inflation and Changing Prices
Our consolidated financial statements included herein have been prepared in accordance with GAAP, which presently require us to measure financial position and operating results primarily in terms of historic dollars. Changes in the relative value of money due to inflation or recession are generally not considered. The primary effect of inflation on our operations is reflected in increased operating costs. Historically, changes in interest rates affect the financial condition of a financial institution to a far greater degree than changes in the inflation rate. However, inflation rose sharply at the end of 2021 and has continued to rise in 2023 at levels not seen for over 40 years. Inflationary pressures are currently expected to remain elevated during 2024. Furthermore, a prolonged period of inflation could cause our costs, including compensation, occupancy and software costs, to increase, which could adversely affect our results of operations and financial condition.
While interest rates are greatly influenced by changes in the inflation rate, they do not necessarily change at the same rate or in the same magnitude as the inflation rate. Interest rates are highly sensitive to many factors that are beyond our control, including changes in the expected rate of inflation, the influence of general and local economic conditions and the monetary and fiscal policies of the U.S. government, its agencies and various other governmental regulatory authorities.
Critical Accounting Estimates
We have identified certain accounting estimates which involve a significant level of estimation uncertainty and have had or are reasonably likely to have a material impact on our financial condition or results of operations. Our accounting policies are more fully described in Note 1 to the consolidated financial statements. Actual amounts and values as of the balance sheet dates may be materially different than the amounts and values reported due to the inherent uncertainty in the estimation process. Also, future amounts and values could differ materially from those estimates due to changes in values and circumstances after the balance sheet date. The critical accounting estimates, as summarized below, which we believe to be the most critical in preparing our consolidated financial statements relate to allowance for credit losses, mortgage servicing rights asset, goodwill and identifiable intangible assets and mortgage loan indemnification liability.
Allowance for Credit Losses
The allowance for credit losses for loans represents management’s estimate of all expected credit losses over the expected contractual life of our existing loan portfolio. Determining the appropriateness of the allowance is complex and requires judgment by management about the effect of matters that are inherently uncertain. Subsequent evaluations of the then existing loan portfolio, in light of the factors then prevailing, may result in significant changes in the allowance for credit losses in those future periods.
We employ a disciplined process and methodology to establish our allowance for credit losses that has two basic components: first, an asset-specific component involving individual loans that do not share risk characteristics with other loans and the measurement of expected credit losses for such individual loans; and second, a pooled component for estimated expected credit losses for pools of loans that share similar risk characteristics.
The credit loss estimation process for both on and off-balance sheet exposures involves procedures to appropriately consider the unique characteristics of our loan portfolio segments, which are further disaggregated into loan classes, the level at which credit risk is monitored. When computing allowance levels, credit loss assumptions are estimated using models that analyze loans according to credit risk ratings, loss history, delinquency status and other credit trends and risk
105
characteristics, including current conditions and reasonable and supportable forecasts about the future. Significant variables that impact the modeled losses across our loan portfolios are the U.S. Real Gross Domestic Product, or GDP, growth rates and unemployment rate assumptions. Future factors and forecasts may result in significant changes in the allowance and provision for (reversal of) credit losses in those future periods.
Credit quality is assessed and monitored by evaluating various attributes, such as credit risk ratings, historic loss experience, past due status and other credit trends and risk characteristics, including current conditions and reasonable and supportable forecasts about the future. The results of these continuous credit quality evaluations help form our underwriting criteria for new loans and also factor into the process for estimation of the allowance for credit losses. The allowance level is influenced by loan volumes, loan asset quality, delinquency status, historic loss experience and other conditions influencing loss expectations, such as reasonable and supportable forecasts of economic conditions. The allowance for credit losses will primarily reflect estimated losses for pools of loans that share similar risk characteristics, but will also consider individual loans that do not share risk characteristics with other loans.
In estimating the component of the allowance for credit losses for loans that share similar risk characteristics with other loans, such loans are segregated into loan classes. Loans are designated into loan classes based on loans pooled by product types and similar risk characteristics or areas of risk concentration. In determining the allowance for credit losses, we derive an estimated credit loss assumption from a model that categorizes loan pools based on loan type and internal risk rating or delinquency bucket.
When a loan moves to a substandard non-accrual or worse risk rating grade, it is removed from the collective evaluation allowance methodology and is subject to individual evaluation. A problem asset report is prepared for each loan in excess of a predetermined threshold and the net realizable value of the loan is determined. This value is compared to the appropriate loan basis (depending on whether the loan is a PCD loan or a non-PCD loan) to determine the required allowance for credit loss reserve amount.
Estimating the timing and amounts of future losses is subject to significant management judgment as these loss cash flows rely upon estimates such as default rates, loss severities, collateral valuations, the amounts and timing of principal payments (including any expected prepayments) or other factors that are reflective of current or future expected conditions. These estimates, in turn, depend on the duration of current overall economic conditions, industry, borrower, or portfolio specific conditions, the expected outcome of bankruptcy or insolvency proceedings, as well as, in certain circumstances, other economic factors, including the level of current and future real estate prices. All of these estimates and assumptions require significant management judgment and certain assumptions that are highly subjective. Model imprecision also exists in the allowance for credit losses estimation process due to the inherent time lag of available industry information and differences between expected and actual outcomes.
The provision for (reversal of) credit losses recorded through earnings, and reduced by the charge-off of loan amounts, net of recoveries, is the amount necessary to maintain the allowance for credit losses at the amount of expected credit losses inherent within the loans held for investment portfolio. The amount of expense and the corresponding level of allowance for credit losses for loans are based on our evaluation of the collectability of the loan portfolio based on historical loss experience, reasonable and supportable forecasts, and other significant qualitative and quantitative factors. Refer to “Financial Condition – Allowance for Credit Losses on Loans” and Notes 1 and 6 to the consolidated financial statements for further discussion of the methodology used in establishing the allowance and changes during the relevant period in the provision for (reversal of) credit losses.
Mortgage Servicing Rights Asset
We measure our residential mortgage servicing rights asset using the fair value method. Under the fair value method, the retained MSR assets are carried in the balance sheet at fair value and the changes in fair value are reported in earnings within other noninterest income in the period in which the change occurs. Retained MSR assets are measured at fair value as of the date of sale of the related mortgage loan. Subsequent fair value measurements are determined using a discounted cash flow model. In order to determine the fair value of the MSR asset, the present value of expected future cash flows is estimated. Assumptions used include market discount rates, anticipated prepayment speeds, delinquency and foreclosure rates, and ancillary fee income.
106
The model assumptions and the MSR asset fair value estimates are compared to observable trades of similar portfolios as well as to MSR asset broker valuations and industry surveys, as available. The expected life of the loan can vary from management’s estimates due to prepayments by borrowers, especially when rates fall. Prepayments in excess of management’s estimates would adversely impact the recorded value of the MSR asset. The value of the MSR asset is also dependent upon the discount rate used in the model, which is based on current market rates and is reviewed by management on an ongoing basis. An increase in the discount rate would result in a decrease in the value of the MSR asset. Refer to Notes 1, 3 and 10 to the consolidated financial statements for further discussion of the methodology used in establishing the MSR asset and changes during the relevant period thereof.
Goodwill and Identifiable Intangible Assets
Goodwill and other identifiable intangible assets are initially recorded at their estimated fair values at the date of acquisition. Goodwill and other intangible assets having an indefinite useful life are not amortized for financial statement purposes. In the event that facts and circumstances indicate that the goodwill or other identifiable intangible assets may be impaired, an interim impairment test would be required. Intangible assets with finite lives are amortized over their useful lives. We perform required annual impairment tests of our goodwill and other intangible assets as of October 1st for our reportable business segments.
The goodwill impairment test requires us to make judgments and assumptions. The test consists of estimating the fair value of each reportable business segment based on valuation techniques, including a discounted cash flow model using revenue and profit forecasts and recent industry transaction and trading multiples of our peers, and comparing those estimated fair values with the carrying values of the assets and liabilities of each business segment, which includes the allocated goodwill. If the estimated fair value is less than the carrying value, we will recognize an impairment charge for the amount by which the carrying amount exceeds the business segment’s fair value; however, any loss recognized will not exceed the total amount of goodwill allocated to that business segment.
This evaluation includes multiple assumptions, including estimated discounted cash flows and other estimates that may change over time. If future discounted cash flows become less than those projected by us, future impairment charges may become necessary that could have a materially adverse impact on our results of operations and financial condition in the period in which the write-off occurs.
Mortgage Loan Indemnification Liability
The mortgage origination segment may be responsible for errors or omissions relating to its representations and warranties that the mortgage loans sold meet certain requirements, including representations as to underwriting standards and the validity of certain borrower representations in connection with a mortgage loan. If determined to be at fault, the mortgage origination segment either repurchases the mortgage loans from the investors or reimburses the investors’ losses (a “make-whole” payment). The mortgage origination segment has established an indemnification liability for such probable losses based upon, among other things, the level of current unresolved repurchase requests, the volume of estimated probable future repurchase requests, our ability to cure the defects identified in the repurchase requests, and the severity of an estimated loss upon repurchase. Although we consider this reserve to be appropriate, there can be no assurance that the reserve will prove to be appropriate over time to cover ultimate losses due to conditions outside of our control such as unanticipated adverse changes in the economy and historical loss patterns, discrete events adversely affecting specific borrowers or industries, or actions taken by institutions or investors. The impact of such matters will be considered in the reserving process when known. Refer to “Segment Results—Mortgage Origination Segment” and Notes 1 and 19 to the consolidated financial statements for further discussion of the methodology used in establishing the mortgage loan indemnification liability and changes during the relevant period thereof.
107
Item 7A. Quantitative and Qualitative Disclosures About Market Risk.
The primary objective of the following information is to provide forward-looking quantitative and qualitative information about our potential exposure to market risks. Market risk represents the risk of loss that may result from changes in value of a financial instrument as a result of changes in interest rates, market prices and the credit perception of an issuer. The disclosure is not meant to be a precise indicator of expected future losses, but rather an indicator of reasonably possible losses, and therefore our actual results may differ from any of the following projections. This forward-looking information provides an indicator of how we view and manage our ongoing market risk exposures.
Banking Segment
The banking segment is engaged primarily in the business of investing funds obtained from deposits and borrowings in interest-earning loans and investments, and our primary component of market risk is sensitivity to changes in interest rates. Consequently, our earnings depend to a significant extent on our net interest income, which is the difference between interest income on loans and investments and our interest expense on deposits and borrowings. To the extent that our interest-bearing liabilities do not reprice or mature at the same time as our interest-bearing assets, we are subject to interest rate risk and corresponding fluctuations in net interest income.
There are several common sources of interest rate risk that must be effectively managed if there is to be minimal impact on our earnings and capital. Repricing risk arises largely from timing differences in the pricing of assets and liabilities. Reinvestment risk refers to the reinvestment of cash flows from interest payments and maturing assets at lower or higher rates. Basis risk exists when different yield curves or pricing indices do not change at precisely the same time or in the same magnitude such that assets and liabilities with the same maturity are not all affected equally. Yield curve risk refers to unequal movements in interest rates across a full range of maturities.
We have employed asset/liability management policies that attempt to manage our interest-earning assets and interest-bearing liabilities, thereby attempting to control the volatility of net interest income, without having to incur unacceptable levels of risk. We employ procedures which include interest rate shock analysis, repricing gap analysis and balance sheet decomposition techniques to help mitigate interest rate risk in the ordinary course of business. In addition, the asset/liability management policies permit the use of various derivative instruments to manage interest rate risk or hedge specified assets and liabilities. To help mitigate net interest income spread compression between our assets and liabilities as the Federal Reserve increases interest rates, management continues to execute certain derivative trades, as either cash flow hedges or fair value hedges, that benefit the banking segment as interest rates rise. Any changes in interest rates across the term structure will continue to impact net interest income and net interest margin. The impact of rate movements will change with the shape of the yield curve, including any changes in steepness or flatness and inversions at any points on the yield curve.
An interest rate sensitive asset or liability is one that, within a defined time period, either matures or experiences an interest rate change in line with general market interest rates. The management of interest rate risk is performed by analyzing the maturity and repricing relationships between interest-earning assets and interest-bearing liabilities at specific points in time (“GAP”) and by analyzing the effects of interest rate changes on net interest income over specific periods of time by projecting the performance of the mix of assets and liabilities in varied interest rate environments. Interest rate sensitivity reflects the potential effect on net interest income resulting from a movement in interest rates. A company is considered to be asset sensitive, or have a positive GAP, when the amount of its interest-earning assets maturing or repricing within a given period exceeds the amount of its interest-bearing liabilities also maturing or repricing within that time period. Conversely, a company is considered to be liability sensitive, or have a negative GAP, when the amount of its interest-bearing liabilities maturing or repricing within a given period exceeds the amount of its interest-earning assets also maturing or repricing within that time period. During a period of rising interest rates, a negative GAP would tend to affect net interest income adversely, while a positive GAP would tend to result in an increase in net interest income. During a period of falling interest rates, a negative GAP would tend to result in an increase in net interest income, while a positive GAP would tend to affect net interest income adversely.
108
As illustrated in the table below, the banking segment is currently asset sensitive overall. Loans that adjust daily or monthly to the Wall Street Journal Prime rate comprise a large percentage of interest sensitive assets and are the primary cause of the banking segment’s asset sensitivity. To help neutralize interest rate sensitivity, the banking segment has kept the terms of most of its borrowings under one year as shown in the following table (dollars in thousands).
December 31, 2023 |
| ||||||||||||||||||
| 3 Months or |
| > 3 Months to |
| > 1 Year to |
| > 3 Years to |
|
|
| |||||||||
Less | 1 Year | 3 Years | 5 Years | > 5 Years | Total |
| |||||||||||||
Interest sensitive assets: | |||||||||||||||||||
Loans | $ | 4,037,906 | $ | 1,360,570 | $ | 1,890,126 | $ | 703,995 | $ | 606,344 | $ | 8,598,941 | |||||||
Securities |
| 515,770 |
| 219,420 |
| 442,560 |
| 331,592 |
| 970,615 |
| 2,479,957 | |||||||
Federal funds sold and securities purchased under agreements to resell |
| 1,661,581 |
| — |
| — |
| — |
| — |
| 1,661,581 | |||||||
Other interest sensitive assets |
| 8,107 |
| — |
| — |
| — |
| 29,710 |
| 37,817 | |||||||
Total interest sensitive assets |
| 6,223,364 |
| 1,579,990 |
| 2,332,686 |
| 1,035,587 |
| 1,606,669 |
| 12,778,296 | |||||||
Interest sensitive liabilities: | |||||||||||||||||||
Interest bearing checking | $ | 6,430,544 | $ | — | $ | — | $ | — | $ | — | $ | 6,430,544 | |||||||
Savings |
| 259,745 |
| — |
| — |
| — |
| — |
| 259,745 | |||||||
Time deposits |
| 615,486 |
| 552,468 |
| 44,074 |
| 52,308 |
| — |
| 1,264,336 | |||||||
Notes payable and other borrowings |
| 459,877 |
| 91 |
| 299 |
| 403 |
| 1,729 |
| 462,399 | |||||||
Total interest sensitive liabilities |
| 7,765,652 |
| 552,559 |
| 44,373 |
| 52,711 |
| 1,729 |
| 8,417,024 | |||||||
|
|
|
|
|
| ||||||||||||||
Interest sensitivity gap | $ | (1,542,288) | $ | 1,027,431 | $ | 2,288,313 | $ | 982,876 | $ | 1,604,940 | $ | 4,361,272 | |||||||
Cumulative interest sensitivity gap | $ | (1,542,288) | $ | (514,857) | $ | 1,773,456 | $ | 2,756,332 | $ | 4,361,272 | |||||||||
Percentage of cumulative gap to total interest sensitive assets |
| (12.07) | % |
| (4.03) | % |
| 13.88 | % |
| 21.57 | % |
| 34.13 | % | ||||
The positive GAP in the interest rate analysis indicates that banking segment net interest income would generally rise if rates increase. Because of inherent limitations in interest rate GAP analysis, the banking segment uses multiple interest rate risk measurement techniques. Simulation analysis is used to subject the current repricing conditions to rising and falling interest rates in increments and decrements of 50 to 100 basis points to determine the effect on net interest income changes for the next twelve months. The banking segment also measures the effects of changes in interest rates on economic value of equity by discounting projected cash flows of deposits and loans. Economic value changes in the investment portfolio are estimated by discounting future cash flows and using duration analysis. Investment security prepayments are estimated using current market information. We believe the simulation analysis presents a more accurate picture than the GAP analysis. Simulation analysis recognizes that deposit products may not react to changes in interest rates as quickly or with the same magnitude as earning assets contractually tied to a market rate index. The sensitivity to changes in market rates varies across deposit products. Also, unlike GAP analysis, simulation analysis takes into account the effect of embedded options in the securities and loan portfolios as well as any off-balance-sheet derivatives.
The table below shows the estimated impact of a range of changes in interest rates on net interest income and on economic value of equity for the banking segment at December 31, 2023 (dollars in thousands).
Change in | Changes in | Changes in |
| |||||||||
Interest Rates | Net Interest Income | Economic Value of Equity |
| |||||||||
(basis points) |
| Amount |
| Percent |
|
| Amount |
| Percent |
| ||
+200 | $ | 36,419 |
| 9.05 | % | $ | 228,115 |
| 15.12 | % | ||
+100 | $ | 19,731 |
| 4.90 | % | $ | 139,016 |
| 9.22 | % | ||
-50 | $ | (10,352) |
| (2.57) | % | $ | (97,002) |
| (6.43) | % | ||
-100 | $ | (20,980) |
| (5.21) | % | $ | (210,224) |
| (13.94) | % | ||
-200 | $ | (43,972) |
| (10.92) | % | $ | (455,595) |
| (30.20) | % | ||
The projected changes in the table above were in compliance with established internal policy guidelines, with the exception of the estimated change in economic value of equity impact based on a -200 basis points change in interest rates which marginally exceeded management’s internal policy limit. These projected changes are based on numerous assumptions. Upon implementation of pending assumption updates based on the expected transition into the next interest
109
rate cycle, management anticipates that over time the estimated change in economic value of equity impact will return to compliance with established internal policy limit. Furthermore, the projected changes in net interest income are being impacted by the heightened level of cash balances, which represent a significant portion of the Bank’s sensitivity given simulation analysis assumptions/limitations. As a result, the timing and magnitude of future changes in interest rates and any runoff of deposits, and related decline in cash, may impact projected changes in net interest income as noted in the table above. Given projected impacts on net interest income associated with the expected transition into the next phase of the interest rate cycle, we continue to evaluate our current GAP position, which may result in a repositioning of the banking segment towards a more neutral or liability sensitive balance sheet.
Our portfolio includes loans that periodically reprice or mature prior to the end of an amortized term. Some of our variable-rate loans remain at applicable rate floors, which may delay and/or limit changes in interest income during a period of changing rates. If interest rates were to fall, the impact on our interest income would be limited by these rate floors. In addition, declining interest rates may negatively affect our cost of funds on deposits. The extent of this impact will ultimately be driven by the timing, magnitude and frequency of interest rate and yield curve movements, as well as changes in market conditions and timing of management strategies. If interest rates were to rise, yields on the portion of our portfolio that remain at applicable rate floors would rise more slowly than increases in market interest rates. Any changes in interest rates across the term structure will continue to impact net interest income and net interest margin. The impact of rate movements will change with the shape of the yield curve, including any changes in steepness or flatness and inversions at any points on the yield curve.
Broker-Dealer Segment
Our broker-dealer segment is exposed to market risk primarily due to its role as a financial intermediary in customer transactions, which may include purchases and sales of securities, use of derivatives and securities lending activities, and in our trading activities, which are used to support sales, underwriting and other customer activities. We are subject to the risk of loss that may result from the potential change in value of a financial instrument as a result of fluctuations in interest rates, market prices, investor expectations and changes in credit ratings of the issuer.
Our broker-dealer segment is exposed to interest rate risk as a result of maintaining inventories of interest rate sensitive financial instruments and other interest-earning assets including customer and correspondent margin loans and receivables and securities borrowing activities. Our funding sources, which include customer and correspondent cash balances, bank borrowings, repurchase agreements and securities lending activities, also expose the broker-dealer to interest rate risk. Movement in short-term interest rates could reduce the positive spread between the broker-dealer segment’s interest income and interest expense.
With respect to securities held, our interest rate risk is managed by setting and monitoring limits on the size and duration of positions and on the length of time securities can be held. Much of the interest rates on customer and correspondent margin loans and receivables are indexed and can vary daily. Our funding sources are generally short term with interest rates that can vary daily.
110
The following table categorizes the broker-dealer segment’s net trading securities which are subject to interest rate and market price risk (dollars in thousands).
December 31, 2023 | ||||||||||||||||
1 Year | > 1 Year | > 5 Years | ||||||||||||||
or Less | to 5 Years | to 10 Years | > 10 Years | Total | ||||||||||||
Trading securities, at fair value | ||||||||||||||||
Municipal obligations | $ | 5,672 | $ | 36,163 | $ | 46,271 | $ | 92,784 | $ | 180,890 | ||||||
U.S. government and government agency obligations | 4,124 | 10,971 | (7,007) | 218,549 | 226,637 | |||||||||||
Corporate obligations | 4,903 | 37,895 | 13,657 | 19,732 | 76,187 | |||||||||||
Total debt securities | 14,699 | 85,029 | 52,921 | 331,065 | 483,714 | |||||||||||
Corporate equity securities | — | — | — | — | — | |||||||||||
Other | (2,662) | — | — | — | (2,662) | |||||||||||
$ | 12,037 | $ | 85,029 | $ | 52,921 | $ | 331,065 | $ | 481,052 | |||||||
Weighted average yield | ||||||||||||||||
Municipal obligations | 0.51 | % | 0.49 | % | 1.86 | % | 3.38 | % | 2.43 | % | ||||||
U.S. government and government agency obligations | 0.42 | % | 4.43 | % | 3.76 | % | 5.75 | % | 5.49 | % | ||||||
Corporate obligations | 4.60 | % | 5.68 | % | 3.38 | % | 3.12 | % | 4.43 | % | ||||||
Derivatives are used to support certain customer programs and hedge our related exposure to interest rate risks.
Our broker-dealer segment is engaged in various brokerage and trading activities that expose us to credit risk arising from potential non-performance from counterparties, customers or issuers of securities. This risk is managed by setting and monitoring position limits for each counterparty, conducting periodic credit reviews of counterparties, reviewing concentrations of securities and conducting business through central clearing organizations.
Collateral underlying margin loans to customers and correspondents and with respect to securities lending activities is marked to market daily and additional collateral is required, as necessary.
Mortgage Origination Segment
Within our mortgage origination segment, our principal market exposure is to interest rate risk due to the impact on our mortgage-related assets and commitments, including mortgage loans held for sale, IRLCs and MSR. Changes in interest rates could also materially and adversely affect our volume of mortgage loan originations.
IRLCs represent an agreement to extend credit to a mortgage loan applicant, whereby the interest rate on the loan is set prior to funding. Our mortgage loans held for sale, which we hold in inventory while awaiting sale into the secondary market, and our IRLCs are subject to the effects of changes in mortgage interest rates from the date of the commitment through the sale of the loan into the secondary market. As a result, we are exposed to interest rate risk and related price risk during the period from the date of the lock commitment until (i) the lock commitment cancellation or expiration date or (ii) the date of sale into the secondary mortgage market. Loan commitments generally range from 20 to 60 days, and our average holding period of the mortgage loan from funding to sale is approximately 30 days. An integral component of our interest rate risk management strategy is our execution of forward commitments to sell MBSs to minimize the impact on earnings resulting from significant fluctuations in the fair value of mortgage loans held for sale and IRLCs caused by changes in interest rates.
We have expanded, and may continue to expand, our residential mortgage servicing operations within our mortgage origination segment. As a result of our mortgage servicing business, we have a portfolio of retained MSR. One of the principal risks associated with MSR is that in a declining interest rate environment, they will likely lose a substantial portion of their value as a result of higher than anticipated prepayments. Moreover, if prepayments are greater than expected, the cash we receive over the life of the mortgage loans would be reduced. The mortgage origination segment uses derivative financial instruments, including U.S. Treasury bond futures and options, futures contracts and forward MBS commitments, as a means to mitigate market risk associated with MSR assets. No hedging strategy can protect us completely, and hedging strategies may fail because they are improperly designed, improperly executed and documented
111
or based on inaccurate assumptions and, as a result, could actually increase our risks and losses. The increasing size of our MSR portfolio may increase our interest rate risk and, correspondingly, the volatility of our earnings, especially if we cannot adequately hedge the interest rate risk relating to our MSR.
The goal of our interest rate risk management strategy within our mortgage origination segment is not to eliminate interest rate risk, but to manage it within appropriate limits. To mitigate the risk of loss, we have established policies and procedures, which include guidelines on the amount of exposure to interest rate changes we are willing to accept.
Consolidated
At December 31, 2023, total debt obligations on our consolidated balance sheet, excluding short-term borrowings and unamortized debt issuance costs and premiums, were $350 million, and was all subject to fixed interest rates. If interest rates were to increase by one eighth of one percent (0.125%), the increase in interest expense on any outstanding variable rate debt would not be expected to have a significant impact on our future consolidated earnings or cash flows.
As noted above within the discussion for each business segment, on a consolidated basis, our primary component of market risk is sensitivity to changes in interest rates. Consequently, and in large part due to the significance of our banking segment, our consolidated earnings depend to a significant extent on our net interest income. Refer to the discussion in the “Banking Segment” section above that provides more details regarding sources of interest rate risk and asset/liability management policies and procedures employed to manage our interest-earning assets and interest-bearing liabilities, and potential future repositioning of our GAP position, thereby attempting to control the volatility of net interest income, without having to incur unacceptable levels of risk.
The table below shows the estimated impact of a range of changes in interest rates on net interest income on a consolidated basis at December 31, 2023 (dollars in thousands).
Change in | Changes in | |||||
Interest Rates | Net Interest Income | |||||
(basis points) |
| Amount |
| Percent |
| |
+200 | $ | 50,675 |
| 11.20 | % | |
+100 | $ | 26,814 |
| 5.92 | % | |
-50 | $ | (13,740) |
| (3.04) | % | |
-100 | $ | (27,726) |
| (6.13) | % | |
-200 | $ | (57,406) |
| (12.68) | % | |
The projected changes in the table above were in compliance with established internal policy guidelines. These projected changes are based on numerous assumptions of growth and changes in the mix of assets or liabilities. The projected changes in net interest income are being impacted by the heightened level of cash balances, which represent a significant portion of our asset sensitivity given simulation analysis assumptions/limitations. As a result, the timing and magnitude of future changes in interest rates including runoff of deposits, and related decline in cash, may impact projected changes in net interest income as noted in the table above.
Item 8. Financial Statements and Supplementary Data.
Our financial statements required by this item are submitted as a separate section of this Annual Report. See “Financial Statements,” commencing on page F-1 hereof.
Item 9. Changes in and Disagreements With Accountants on Accounting and Financial Disclosure.
None.
112
Item 9A. Controls and Procedures.
Conclusion Regarding the Effectiveness of Disclosure Controls and Procedures
Our management, with the supervision and participation of our Principal Executive Officer and Principal Financial Officer, has evaluated the effectiveness of the design and operation of our disclosure controls and procedures (as defined in Rules 13a-15(e) and 15d-15(e) under the Exchange Act) as of December 31, 2023, the end of the period covered by this Annual Report.
Based upon that evaluation, our Principal Executive Officer and Principal Financial Officer concluded that, as of the end of the period covered by this report, our disclosure controls and procedures were effective in recording, processing, summarizing and reporting, on a timely basis, information required to be disclosed by us in the reports that we file or submit under the Exchange Act and are effective in ensuring that information required to be disclosed by us in the reports that we file or submit under the Exchange Act is accumulated and communicated to the Company’s management, including our Principal Executive Officer and Principal Financial Officer, as appropriate to allow timely decisions regarding required disclosure.
Management’s Report on Internal Control Over Financial Reporting
Our management is responsible for establishing and maintaining adequate internal control over financial reporting. Internal control over financial reporting is defined in Rules 13a-15(f) and 15d-15(f) under the Exchange Act, as a process designed by, or under the supervision of, our Principal Executive Officer and Principal Financial Officer and effected by our board of directors, management and other personnel to provide reasonable assurance regarding the reliability of financial reporting and the preparation of financial statements for external purposes in accordance with generally accepted accounting principles and includes those policies and procedures that:
| ● | pertain to the maintenance of records that in reasonable detail accurately and fairly reflect the transactions and dispositions of our assets; |
| ● | provide reasonable assurance that transactions are recorded as necessary to permit preparation of financial statements in accordance with generally accepted accounting principles, and that our receipts and expenditures are being made only in accordance with authorization of our management and directors; and |
| ● | provide reasonable assurance regarding prevention or timely detection of unauthorized acquisition, use or disposition of our assets that could have a material effect on the financial statements. |
Because of its inherent limitations, internal control over financial reporting may not prevent or detect misstatements. Projections of any evaluation of effectiveness to future periods are subject to the risks that controls may become inadequate because of changes in conditions, or that the degree of compliance with the policies or procedures may deteriorate.
Management assessed the effectiveness of our internal control over financial reporting as of December 31, 2023. In making this assessment, management used the criteria set forth in Internal Control—Integrated Framework (2013) issued by the Committee of Sponsoring Organizations of the Treadway Commission, or COSO. This assessment included controls over the preparation of financial statements in accordance with the instructions for the Consolidated Financial Statements for Bank Holding Companies (Form FR Y-9C) to meet the reporting requirements of Section 112 of the Federal Deposit Insurance Corporation Improvement Act. Based on our assessment, management concluded that, as of December 31, 2023, our internal control over financial reporting is effective.
PricewaterhouseCoopers LLP, an independent registered public accounting firm, audited the effectiveness of our internal control over financial reporting as of December 31, 2023, and issued an unqualified opinion thereon as stated in their report, which appears on page F-2.
113
Changes in Internal Control Over Financial Reporting
There were no changes in our internal control over financial reporting during our fourth fiscal quarter covered by this annual report that have materially affected, or are reasonably likely to materially affect, our internal control over financial reporting.
Item 9B. Other Information.
Pursuant to Item 408(a) of Regulation S-K, none of our directors or executive officers
Item 9C. Disclosure Regarding Foreign Jurisdictions that Prevent Inspections.
None.
114
PART III
Item 10. Directors, Executive Officers and Corporate Governance.
The information called for by this Item is contained in our definitive Proxy Statement for our 2024 Annual Meeting of Stockholders, and is incorporated herein by reference.
Item 11. Executive Compensation.
The information called for by this Item is contained in our definitive Proxy Statement for our 2024 Annual Meeting of Stockholders, and is incorporated herein by reference.
Item 12. Security Ownership of Certain Beneficial Owners and Management and Related Stockholder Matters.
The information called for by this Item is contained in our definitive Proxy Statement for our 2024 Annual Meeting of Stockholders, and is incorporated herein by reference.
Item 13. Certain Relationships and Related Transactions, and Director Independence.
The information called for by this Item is contained in our definitive Proxy Statement for our 2024 Annual Meeting of Stockholders, and is incorporated herein by reference.
Item 14. Principal Accounting Fees and Services.
The information called for by this Item is contained in our definitive Proxy Statement for our 2024 Annual Meeting of Stockholders, and is incorporated herein by reference.
115
PART IV
Item 15. Exhibits, Financial Statement Schedules.
(a)The following documents are filed herewith as part of this Form 10-K.
Page | ||||
1. | Financial Statements. | |||
Hilltop Holdings Inc. | ||||
Report of Independent Registered Public Accounting Firm (PCAOB ID | F-2 | |||
F-5 | ||||
F-6 | ||||
F-7 | ||||
F-8 | ||||
F-9 | ||||
F-10 | ||||
2. | Financial Statement Schedules. | |||
All financial statement schedules have been omitted because they are not required, not applicable or the information has been included in our consolidated financial statements. | ||||
3. | Exhibits. See the Exhibit Index preceding the signature page hereto. | |||
Item 16. Form 10-K Summary.
None.
116
4.6.4 | ||
4.6.5 | ||
4.7 | ||
10.1.1† | ||
10.1.2† | ||
10.1.3† | ||
10.1.4† | ||
10.2.1† | ||
10.2.2† | ||
10.2.3† | ||
10.2.4† | ||
10.2.5† | ||
10.2.6† | ||
10.2.7† | ||
118
10.3.1† | ||
10.3.2† | ||
10.4† | ||
10.5† | ||
10.6.1† | ||
10.6.2† | ||
10.6.3† | ||
10.7.1† | ||
10.7.2† | ||
10.8.1† | ||
10.8.2† | ||
10.9† | ||
10.10† | ||
119
10.11† | |||
10.11.1† | |||
10.12† | |||
10.12.1† | |||
10.13† | |||
10.13.1† | |||
21.1* | |||
23.1* | |||
31.1* | |||
31.2* | |||
32.1** | |||
97* | |||
101.INS* | XBRL Instance Document – the instance document does not appear in the Interactive Data File because its XBRL tags are embedded within the Inline XBRL document. | ||
101.SCH* | Inline XBRL Taxonomy Extension Schema. | ||
101.CAL* | Inline XBRL Taxonomy Extension Calculation Linkbase. | ||
120
101.DEF* | Inline XBRL Taxonomy Extension Definition Linkbase. | |
101.LAB* | Inline XBRL Taxonomy Extension Label Linkbase. | |
101.PRE* | Inline XBRL Taxonomy Extension Presentation Linkbase. | |
104 | Cover Page Interactive Data File (formatted as Inline XBRL and contained in Exhibit 101). |
*Filed herewith.
**Furnished herewith.
†Exhibit is a management contract or compensatory plan or arrangement.
121
SIGNATURES
Pursuant to the requirements of Section 13 or 15(d) of the Securities Exchange Act of 1934, the registrant has duly caused this report to be signed on its behalf by the undersigned, thereunto duly authorized.
HILLTOP HOLDINGS INC. | ||
Date: February 14, 2024 | By: | /s/ William B. Furr |
William B. Furr | ||
Chief Financial Officer | ||
(Principal Financial Officer and duly authorized officer) | ||
122
Pursuant to the requirements of the Securities Exchange Act of 1934, this report has been signed below by the following persons on behalf of the registrant and in the capacities and on the dates indicated.
Signature |
| Capacity in which Signed |
| Date | |
/s/ Jeremy B. Ford | President, Chief Executive Officer and Director | February 14, 2024 | |||
Jeremy B. Ford | (Principal Executive Officer) | ||||
/s/ William B. Furr | Chief Financial Officer | February 14, 2024 | |||
William B. Furr | (Principal Financial Officer) | ||||
/s/ Keith E. Bornemann | Executive Vice President, Chief Accounting Officer | February 14, 2024 | |||
Keith E. Bornemann | (Principal Accounting Officer) | ||||
/s/ Rhodes Bobbitt | Director | February 14, 2024 | |||
Rhodes Bobbitt | |||||
/s/ Tracy A. Bolt | Director and Chairman of Audit Committee | February 14, 2024 | |||
Tracy A. Bolt | |||||
/s/ J. Taylor Crandall | Director | February 14, 2024 | |||
J. Taylor Crandall | |||||
/s/ Hill A. Feinberg | Director | February 14, 2024 | |||
Hill A. Feinberg | |||||
/s/ Gerald J. Ford | Chairman of the Board | February 14, 2024 | |||
Gerald J. Ford | |||||
/s/ J. Markham Green | Director and Audit Committee Member | February 14, 2024 | |||
J. Markham Green | |||||
/s/ Charlotte Jones | Director | February 14, 2024 | |||
Charlotte Jones | |||||
Director | |||||
Lee Lewis | |||||
/s/ W. Robert Nichols, III | Director | February 14, 2024 | |||
W. Robert Nichols, III | |||||
/s/ Thomas C. Nichols | Director | February 14, 2024 | |||
Thomas C. Nichols | |||||
/s/ Kenneth D. Russell | Director | February 14, 2024 | |||
Kenneth D. Russell | |||||
/s/ A. Haag Sherman | Director and Audit Committee Member | February 14, 2024 | |||
A. Haag Sherman | |||||
/s/ Jonathan S. Sobel | Director | February 14, 2024 | |||
Jonathan S. Sobel | |||||
/s/ Robert Taylor, Jr. | Director | February 14, 2024 | |||
Robert Taylor, Jr. | |||||
Director | |||||
Carl B. Webb |
123
Index to Consolidated Financial Statements
Hilltop Holdings Inc. |
|
|
F-2 | ||
Audited Consolidated Financial Statements | ||
F-5 | ||
F-6 | ||
F-7 | ||
F-8 | ||
F-9 | ||
F-10 |
F-1
Report of Independent Registered Public Accounting Firm
To the Board of Directors and Stockholders of Hilltop Holdings Inc.
Opinions on the Financial Statements and Internal Control over Financial Reporting
We have audited the accompanying consolidated balance sheets of Hilltop Holdings Inc. and its subsidiaries (the “Company”) as of December 31, 2023 and 2022, and the related consolidated statements of operations, of comprehensive income, of stockholders’ equity and of cash flows for each of the three years in the period ended December 31, 2023, including the related notes (collectively referred to as the “consolidated financial statements”). We also have audited the Company’s internal control over financial reporting as of December 31, 2023, based on criteria established in Internal Control – Integrated Framework (2013) issued by the Committee of Sponsoring Organizations of the Treadway Commission (COSO).
In our opinion, the consolidated financial statements referred to above present fairly, in all material respects, the financial position of the Company as of December 31, 2023 and 2022, and the results of its operations and its cash flows for each of the three years in the period ended December 31, 2023 in conformity with accounting principles generally accepted in the United States of America. Also in our opinion, the Company maintained, in all material respects, effective internal control over financial reporting as of December 31, 2023, based on criteria established in Internal Control – Integrated Framework (2013) issued by the COSO.
Basis for Opinions
The Company's management is responsible for these consolidated financial statements, for maintaining effective internal control over financial reporting, and for its assessment of the effectiveness of internal control over financial reporting, included in Management's Report on Internal Control over Financial Reporting appearing under Item 9A. Our responsibility is to express opinions on the Company’s consolidated financial statements and on the Company's internal control over financial reporting based on our audits. We are a public accounting firm registered with the Public Company Accounting Oversight Board (United States) (PCAOB) and are required to be independent with respect to the Company in accordance with the U.S. federal securities laws and the applicable rules and regulations of the Securities and Exchange Commission and the PCAOB.
We conducted our audits in accordance with the standards of the PCAOB. Those standards require that we plan and perform the audits to obtain reasonable assurance about whether the consolidated financial statements are free of material misstatement, whether due to error or fraud, and whether effective internal control over financial reporting was maintained in all material respects.
Our audits of the consolidated financial statements included performing procedures to assess the risks of material misstatement of the consolidated financial statements, whether due to error or fraud, and performing procedures that respond to those risks. Such procedures included examining, on a test basis, evidence regarding the amounts and disclosures in the consolidated financial statements. Our audits also included evaluating the accounting principles used and significant estimates made by management, as well as evaluating the overall presentation of the consolidated financial statements. Our audit of internal control over financial reporting included obtaining an understanding of internal control over financial reporting, assessing the risk that a material weakness exists, and testing and evaluating the design and operating effectiveness of internal control based on the assessed risk. Our audits also included performing such other procedures as we considered necessary in the circumstances. We believe that our audits provide a reasonable basis for our opinions.
Definition and Limitations of Internal Control over Financial Reporting
A company’s internal control over financial reporting is a process designed to provide reasonable assurance regarding the reliability of financial reporting and the preparation of financial statements for external purposes in accordance with generally accepted accounting principles. Management's assessment and our audit of Hilltop Holdings Inc.'s internal control over financial reporting also included controls over the preparation of financial statements in accordance with the
F-2
instructions to the Consolidated Financial Statements for Bank Holding Companies (Form FR Y-9C) to comply with the reporting requirements of Section 112 of the Federal Deposit Insurance Corporation Improvement Act (FDICIA). A company’s internal control over financial reporting includes those policies and procedures that (i) pertain to the maintenance of records that, in reasonable detail, accurately and fairly reflect the transactions and dispositions of the assets of the company; (ii) provide reasonable assurance that transactions are recorded as necessary to permit preparation of financial statements in accordance with generally accepted accounting principles, and that receipts and expenditures of the company are being made only in accordance with authorizations of management and directors of the company; and (iii) provide reasonable assurance regarding prevention or timely detection of unauthorized acquisition, use, or disposition of the company’s assets that could have a material effect on the financial statements.
Because of its inherent limitations, internal control over financial reporting may not prevent or detect misstatements. Also, projections of any evaluation of effectiveness to future periods are subject to the risk that controls may become inadequate because of changes in conditions, or that the degree of compliance with the policies or procedures may deteriorate.
Critical Audit Matters
The critical audit matters communicated below are matters arising from the current period audit of the consolidated financial statements that were communicated or required to be communicated to the audit committee and that (i) relate to accounts or disclosures that are material to the consolidated financial statements and (ii) involved our especially challenging, subjective, or complex judgments. The communication of critical audit matters does not alter in any way our opinion on the consolidated financial statements, taken as a whole, and we are not, by communicating the critical audit matters below, providing separate opinions on the critical audit matters or on the accounts or disclosures to which they relate.
Allowance for Credit Losses for Loans Held for Investment – Collectively Evaluated
As described in Notes 1 and 6 to the consolidated financial statements, the Company’s allowance for credit losses for loans held for investment was $111 million as of December 31, 2023. Management’s allowance for credit losses for collectively evaluated loans is an estimate of expected losses over the lifetime of a loan within the Company’s existing loans held for investment portfolio and is based on historical experience, current conditions and reasonable and supportable forecasts. The credit loss estimation process considers the characteristics of the Company’s loan portfolio segments, which are further disaggregated into loan classes, the level at which credit risk is monitored. The allowance for credit losses for collectively evaluated loans is calculated using statistical credit factors, including probabilities of default (“PD”) and loss given default (“LGD”), to the amortized cost of pools of loan exposures with similar risk characteristics over its contractual life, adjusted for prepayments, to arrive at an estimate of expected credit losses. As described by management, one of the most significant judgments involved in estimating the Company’s allowance for credit losses relates to the macroeconomic forecasts used to estimate credit losses over the reasonable and supportable forecast period. Management utilizes a single macroeconomic alternative scenario published by a third-party that reflects the U.S. economic outlook. This alternative scenario utilizes multiple economic variables in forecasting the economic outlook. Significant variables that impact the modeled losses across the Company’s loan portfolios are the U.S. Real Gross Domestic Product (GDP) growth rates and unemployment rate assumptions. Management also considers adjustments for certain conditions in the Company’s allowance for credit losses estimate qualitatively where they have not been measured directly in management’s collective assessments.
The principal considerations for our determination that performing procedures relating to the allowance for credit losses for collectively evaluated loans held for investment is a critical audit matter are (i) the significant judgment by management in estimating the allowance for credit losses, which in turn led to a high degree of auditor judgment, subjectivity, and effort in performing procedures and evaluating audit evidence relating to management’s determination of the impact of GDP growth rate and unemployment rate forecasts within the macroeconomic alternative scenario, as well as qualitative adjustments to the allowance for credit losses; and (ii) the audit effort involved the use of professionals with specialized skill and knowledge.
F-3
Addressing the matter involved performing procedures and evaluating audit evidence in connection with forming our overall opinion on the consolidated financial statements. These procedures included testing the effectiveness of controls relating to the allowance for credit losses for collectively evaluated loans held for investment, which included controls over evaluation and selection of the variables used in the macroeconomic alternative scenario as well as qualitative adjustments. These procedures also included, among others, the involvement of professionals with specialized skill and knowledge to assist in testing management’s process for estimating the allowance for credit losses, which included (i) evaluating the appropriateness of the methodology and models, (ii) testing the completeness and accuracy of certain data used in the estimate, (iii) evaluating the reasonableness of management’s determination of the impact of GDP growth rate and unemployment rate forecasts within the macroeconomic alternative scenario and (iv) evaluating the reasonableness of qualitative adjustments to the allowance for credit losses.
Valuation of Mortgage Servicing Rights
As described in Notes 1, 3 and 10 to the consolidated financial statements, the Company measures its residential mortgage servicing rights asset at fair value, which totaled $97 million as of December 31, 2023. Management estimates the fair value of residential mortgage servicing rights by valuing the projected net servicing cash flows, which are then discounted to estimate fair value using a discounted cash flow model. The significant unobservable inputs related to the valuation of residential mortgage servicing rights are the discount rate and the constant prepayment rate assumptions. As disclosed by management, the model assumptions and the mortgage servicing rights fair value estimates are compared to observable trades of similar portfolios as well as to broker valuations and industry surveys, as available.
The principal considerations for our determination that performing procedures relating to the valuation of mortgage servicing rights is a critical audit matter are (i) the significant judgment by management in estimating the fair value of residential mortgage servicing rights, which in turn led to a high degree of auditor judgment, subjectivity and effort in performing procedures and evaluating audit evidence relating to management’s estimate of the fair value of mortgage servicing rights and the constant prepayment rate and discount rate assumptions used in the estimate, and (ii) the audit effort involved the use of professionals with specialized skill and knowledge.
Addressing the matter involved performing procedures and evaluating audit evidence in connection with forming our overall opinion on the consolidated financial statements. These procedures included testing the effectiveness of controls relating to the valuation of mortgage servicing rights, which included controls over the constant prepayment rate and discount rate assumptions. These procedures also included, among others, the involvement of professionals with specialized skill and knowledge to assist in testing management’s process for estimating the valuation of mortgage servicing rights, which included (i) evaluating the appropriateness of the methodology, (ii) testing the completeness and accuracy of certain data used in the estimate, (iii) evaluating the reasonableness of the constant prepayment rate and discount rate assumptions used in the estimate and (iv) evaluating the reasonableness of the fair value of mortgage servicing rights, which included comparison to observable trades of similar portfolios and industry surveys.
/s/
February 14, 2024
We have served as the Company’s auditor since 1998.
F-4
HILLTOP HOLDINGS INC. AND SUBSIDIARIES
CONSOLIDATED BALANCE SHEETS
(in thousands, except share and per share data)
December 31, |
| |||||
2023 |
| 2022 |
| |||
Assets | ||||||
Cash and due from banks | $ | | $ | | ||
Federal funds sold |
| |
| | ||
Assets segregated for regulatory purposes | | | ||||
Securities purchased under agreements to resell | | | ||||
Securities: | ||||||
Trading, at fair value |
| |
| | ||
Available for sale, at fair value, net (amortized cost of $ |
| |
| | ||
Held to maturity, at amortized cost, net (fair value of $ | | | ||||
Equity, at fair value | | | ||||
| |
| | |||
Loans held for sale |
| |
| | ||
Loans held for investment, net of unearned income |
| |
| | ||
Allowance for credit losses |
| ( |
| ( | ||
Loans held for investment, net |
| |
| | ||
Broker-dealer and clearing organization receivables |
| |
| | ||
Premises and equipment, net |
| |
| | ||
Operating lease right-of-use assets | | | ||||
Mortgage servicing rights | | | ||||
Other assets |
| |
| | ||
Goodwill |
| |
| | ||
Other intangible assets, net |
| |
| | ||
Total assets | $ | | $ | | ||
Liabilities and Stockholders' Equity | ||||||
Deposits: | ||||||
Noninterest-bearing | $ | | $ | | ||
Interest-bearing |
| |
| | ||
Total deposits |
| |
| | ||
Broker-dealer and clearing organization payables |
| |
| | ||
Short-term borrowings |
| |
| | ||
Securities sold, not yet purchased, at fair value | | | ||||
Notes payable |
| |
| | ||
Operating lease liabilities | | | ||||
Other liabilities |
| |
| | ||
Total liabilities |
| |
| | ||
Commitments and contingencies (see Notes 18 and 19) | ||||||
Stockholders' equity: | ||||||
Hilltop stockholders' equity: | ||||||
Common stock, $ |
| |
| | ||
Additional paid-in capital |
| |
| | ||
Accumulated other comprehensive loss |
| ( |
| ( | ||
Retained earnings | | | ||||
Deferred compensation employee stock trust, net | | | ||||
Employee stock trust ( | ( | ( | ||||
Total Hilltop stockholders' equity |
| |
| | ||
Noncontrolling interests |
| |
| | ||
Total stockholders' equity |
| |
| | ||
Total liabilities and stockholders' equity | $ | | $ | | ||
See accompanying notes.
F-5
HILLTOP HOLDINGS INC. AND SUBSIDIARIES
CONSOLIDATED STATEMENTS OF OPERATIONS
(in thousands, except per share data)
Year Ended December 31, |
| ||||||||
2023 |
| 2022 |
| 2021 |
| ||||
Interest income: | |||||||||
Loans, including fees | $ | | $ | | $ | | |||
Securities borrowed | | | | ||||||
Securities: | |||||||||
Taxable |
| | | | |||||
Tax-exempt |
| | | | |||||
Other |
| | | | |||||
Total interest income |
| | | | |||||
Interest expense: | |||||||||
Deposits |
| | | | |||||
Securities loaned | | | | ||||||
Short-term borrowings |
| | | | |||||
Notes payable |
| | | | |||||
Junior subordinated debentures |
| — | — | | |||||
Other |
| | | | |||||
Total interest expense |
| | | | |||||
Net interest income |
| | | | |||||
Provision for (reversal of) credit losses |
| | | ( | |||||
Net interest income after provision for (reversal of) credit losses |
| | | | |||||
Noninterest income: | |||||||||
Net gains from sale of loans and other mortgage production income |
| | | | |||||
Mortgage loan origination fees |
| | | | |||||
Securities commissions and fees |
| | | | |||||
Investment and securities advisory fees and commissions | | | | ||||||
Other |
| | | | |||||
Total noninterest income |
| | |
| | ||||
Noninterest expense: | |||||||||
Employees' compensation and benefits |
| | | | |||||
Occupancy and equipment, net |
| | | | |||||
Professional services |
| | | | |||||
Other |
| | | | |||||
Total noninterest expense |
| |
| |
| | |||
Income before income taxes |
| |
| |
| | |||
Income tax expense |
| | | | |||||
Net income |
| |
| |
| | |||
Less: Net income attributable to noncontrolling interest |
| | | | |||||
Income attributable to Hilltop | $ | | $ | | $ | | |||
Earnings per common share: | |||||||||
Basic | $ | | $ | | $ | | |||
Diluted | $ | | $ | | $ | | |||
Weighted average share information: | |||||||||
Basic |
| |
| |
| | |||
Diluted |
| |
| |
| | |||
See accompanying notes.
F-6
HILLTOP HOLDINGS INC. AND SUBSIDIARIES
CONSOLIDATED STATEMENTS OF COMPREHENSIVE INCOME (LOSS)
(in thousands)
Year Ended December 31, | ||||||||||
|
| 2023 |
| 2022 |
| 2021 | ||||
Net income | $ | | $ | | $ | | ||||
Other comprehensive income (loss): | ||||||||||
Change in fair value of cash flow hedges, net taxes of $( | ( | | | |||||||
Net unrealized gains (losses) on securities available-for-sale, net taxes of $ |
| |
| ( |
| ( | ||||
Reclassification adjustment for gains (losses) included in net income, net taxes of $ |
| |
| |
| ( | ||||
Adjustment for unrealized losses on securities transferred from available-for sale to held-to-maturity, net taxes of $ | — | ( | — | |||||||
Amortization of unrealized losses on securities transferred from available-for-sale to held-maturity, net of tax $ | | | — | |||||||
Comprehensive income (loss) |
| |
| ( |
| | ||||
Less: comprehensive income attributable to noncontrolling interest |
| |
| |
| | ||||
Comprehensive income (loss) applicable to Hilltop | $ | | $ | ( | $ | | ||||
See accompanying notes.
F-7
HILLTOP HOLDINGS INC. AND SUBSIDIARIES
CONSOLIDATED STATEMENTS OF STOCKHOLDERS’ EQUITY
(in thousands)
|
|
|
|
|
| Accumulated |
|
| Deferred |
|
|
|
|
| Total |
|
|
|
| |||||||||||
Additional | Other | Compensation | Employee | Hilltop | Total | |||||||||||||||||||||||||
Common Stock | Paid-in | Comprehensive | Retained | Employee Stock | Stock Trust | Stockholders’ | Noncontrolling | Stockholders’ | ||||||||||||||||||||||
Shares | Amount | Capital | Loss | Earnings | Trust, Net | Shares | Amount | Equity | Interest | Equity | ||||||||||||||||||||
Balance, December 31, 2020 | $ | $ | $ | $ | $ | | | $ | ( | $ | | $ | | $ | | |||||||||||||||
Net income | — |
| — |
| — |
| — |
|
| — | — |
| — |
| |
| |
| | |||||||||||
Other comprehensive loss | — |
| — |
| — |
| ( |
| — |
| — | — |
| — |
| ( |
| — | ( | |||||||||||
Stock-based compensation expense | — |
| — |
| |
| — |
| — |
| — | — |
| — |
| |
| — |
| | ||||||||||
Common stock issued to board members | |
| — |
| |
| — |
| — |
| — | — |
| — |
| |
| — |
| | ||||||||||
Issuance of common stock related to share-based awards, net | |
| |
| ( |
| — |
| — |
| — | — |
| — |
| ( |
| — |
| ( | ||||||||||
Repurchases of common stock | ( |
| ( |
| ( |
| — |
| ( |
| — | — |
| — |
| ( |
| — |
| ( | ||||||||||
Dividends on common stock ($ | — |
| — |
| — |
| — |
| ( |
| — | — |
| — |
| ( |
| — |
| ( | ||||||||||
Deferred compensation plan | — |
| — |
| — |
| — |
| — |
| ( | ( |
| |
| |
| — |
| | ||||||||||
Adoption of accounting standards | — |
| — |
| — |
| — |
| — |
| — | — |
| — |
| — |
| — |
| — | ||||||||||
Net cash contributed to noncontrolling interest | — |
| — |
| — |
| — |
| — |
| — | — |
| — |
| — |
| ( |
| ( | ||||||||||
Balance, December 31, 2021 | | $ | | $ | | $ | ( | $ | | $ | | | $ | ( | $ | | $ | | $ | | ||||||||||
Net income | — |
| — |
| — |
| — |
| |
| — | — |
| — |
| |
| |
| | ||||||||||
Other comprehensive loss | — |
| — |
| — |
| ( |
| — |
| — | — |
| — |
| ( |
| — |
| ( | ||||||||||
Stock-based compensation expense | — |
| — |
| |
| — |
| — |
| — | — |
| — |
| |
| — |
| | ||||||||||
Common stock issued to board members | |
| — |
| |
| — |
| — |
| — | — |
| — |
| |
| — |
| | ||||||||||
Issuance of common stock related to share-based awards, net | |
| |
| ( |
| — |
| — |
| — | — |
| — |
| ( |
| — |
| ( | ||||||||||
Repurchases of common stock | ( |
| ( |
| ( |
| — |
| ( |
| — | — |
| — |
| ( |
| — |
| ( | ||||||||||
Dividends on common stock ($ | — |
| — |
| — |
| — |
| ( |
| — | — |
| — |
| ( |
| — |
| ( | ||||||||||
Deferred compensation plan | — |
| — |
| — |
| — |
| — |
| ( | |
| ( |
| ( |
| — |
| ( | ||||||||||
Adoption of accounting standards | — |
| — |
| — |
| — |
| — |
| — | — |
| — |
| — |
| — |
| — | ||||||||||
Net cash contributed to noncontrolling interest | — |
| — |
| — |
| — |
| — |
| — | — |
| — |
| — |
| ( |
| ( | ||||||||||
Balance, December 31, 2022 | | $ | | $ | | $ | ( | $ | | $ | | | $ | ( | $ | | $ | | $ | | ||||||||||
Net income | — |
| — |
| — |
| — |
| |
| — | — |
| — |
| |
| |
| | ||||||||||
Other comprehensive income | — |
| — |
| — |
| |
| — |
| — | — |
| — |
| |
| — |
| | ||||||||||
Stock-based compensation expense | — |
| — |
| |
| — |
| — |
| — | — |
| — |
| |
| — |
| | ||||||||||
Common stock issued to board members | |
| — |
| |
| — |
| — |
| — | — |
| — |
| |
| — |
| | ||||||||||
Issuance of common stock related to share-based awards, net | |
| |
| ( |
| — |
| — |
| — | — |
| — |
| ( |
| — |
| ( | ||||||||||
Repurchases of common stock | ( |
| ( |
| ( |
| — |
| ( |
| — | — |
| — |
| ( |
| — |
| ( | ||||||||||
Dividends on common stock ($ | — |
| — |
| — |
| — |
| ( |
| — | — |
| — |
| ( |
| — |
| ( | ||||||||||
Deferred compensation plan | — |
| — |
| — |
| — |
| — |
| ( | ( |
| |
| |
| — |
| | ||||||||||
Net cash contributed to noncontrolling interest | — |
| — |
| — |
| — |
| — |
| — | — |
| — |
| — |
| ( |
| ( | ||||||||||
Balance, December 31, 2023 | | $ | | $ | | $ | ( | $ | | $ | | | $ | ( | $ | | $ | | $ | | ||||||||||
See accompanying notes.
F-8
HILLTOP HOLDINGS INC. AND SUBSIDIARIES
CONSOLIDATED STATEMENTS OF CASH FLOWS
(in thousands)
Year Ended December 31, | |||||||||
| 2023 |
| 2022 |
| 2021 | ||||
Operating Activities | |||||||||
Net income | $ | | $ | | $ | | |||
Adjustments to reconcile net income to net cash provided by operating activities: | |||||||||
Provision for (reversal of) credit losses |
| |
| |
| ( | |||
Depreciation, amortization and accretion, net |
| |
| |
| | |||
Equity in undistributed earnings of merchant banking subsidiaries | ( | ( | | ||||||
Deferred income taxes |
| |
| |
| ( | |||
Other, net |
| |
| |
| | |||
Net change in securities purchased under agreements to resell |
| |
| |
| ( | |||
Net change in trading securities |
| |
| ( |
| | |||
Net change in broker-dealer and clearing organization receivables |
| ( |
| |
| ( | |||
Net change in other assets |
| |
| ( |
| | |||
Net change in broker-dealer and clearing organization payables |
| |
| ( |
| | |||
Net change in other liabilities |
| ( |
| |
| ( | |||
Net change in securities sold, not yet purchased | ( |
| ( | | |||||
Proceeds from sale of mortgage servicing rights asset |
| |
| |
| | |||
Change in valuation of mortgage servicing rights asset | | ( | ( | ||||||
Net gains from sales of loans | ( |
| ( | ( | |||||
Loans originated for sale |
| ( |
| ( |
| ( | |||
Proceeds from loans sold | | | | ||||||
Net cash provided by operating activities | | | | ||||||
Investing Activities | |||||||||
Proceeds from maturities and principal reductions of securities held to maturity |
| |
| |
| | |||
Proceeds from sales, maturities and principal reductions of securities available for sale | |
| |
| | ||||
Purchases of securities held to maturity |
| — |
| ( |
| — | |||
Purchases of securities available for sale | ( |
| ( |
| ( | ||||
Purchases of equity securities |
| ( |
| ( |
| — | |||
Net change in loans held for investment |
| ( |
| ( |
| | |||
Purchases of premises and equipment and other assets |
| ( |
| ( |
| ( | |||
Proceeds from sales of premises and equipment and other real estate owned | | | | ||||||
Net cash received from (paid to) Federal Home Loan Bank and Federal Reserve Bank stock |
| |
| ( |
| ( | |||
Net cash provided by (used in) investing activities |
| |
| ( |
| ( | |||
Financing Activities | |||||||||
Net change in deposits |
| ( |
| ( |
| | |||
Net change in short-term borrowings |
| ( |
| |
| | |||
Proceeds from notes payable |
| |
| |
| | |||
Payments on notes payable |
| ( |
| ( |
| ( | |||
Payments to repurchase common stock |
| ( |
| ( |
| ( | |||
Dividends paid on common stock |
| ( |
| ( |
| ( | |||
Net cash distributed to noncontrolling interest | ( | ( | ( | ||||||
Other, net | ( | ( | ( | ||||||
Net cash used in financing activities | ( | ( | | ||||||
Net change in cash, cash equivalents and restricted cash |
| |
| ( |
| | |||
Cash, cash equivalents and restricted cash, beginning of year |
| |
| |
| | |||
Cash, cash equivalents and restricted cash, end of year | $ | | $ | | $ | | |||
Reconciliation of Cash, Cash Equivalents and Restricted Cash to Consolidated Balance Sheets | |||||||||
Cash and due from banks | $ | | $ | | $ | | |||
Federal funds sold | | | | ||||||
Assets segregated for regulatory purposes | | | | ||||||
Total cash, cash equivalents and restricted cash | $ | | $ | | $ | | |||
Supplemental Disclosures of Cash Flow Information | |||||||||
Cash paid for interest | $ | | $ | | $ | | |||
Cash paid for income taxes, net of refunds | $ | | $ | | $ | | |||
Supplemental Schedule of Non-Cash Activities | |||||||||
Conversion of loans to other real estate owned | $ | | $ | | $ | | |||
Additions to mortgage servicing rights | $ | | $ | | $ | | |||
See accompanying notes.
F-9
1. Summary of Significant Accounting and Reporting Policies
Nature of Operations
Hilltop Holdings Inc. (“Hilltop” and, collectively with its subsidiaries, the “Company”) is a financial holding company registered under the Bank Holding Company Act of 1956. The Company’s primary line of business is to provide business and consumer banking services from offices located throughout Texas through PlainsCapital Bank (the “Bank”). In addition, the Company provides an array of financial products and services through its broker-dealer and mortgage origination subsidiaries.
The Company, headquartered in Dallas, Texas, provides its products and services through
Basis of Presentation
The accompanying consolidated financial statements have been prepared in conformity with accounting principles generally accepted in the United States (“GAAP”), and in conformity with the rules and regulations of the Securities and Exchange Commission (“SEC”).
The preparation of financial statements in conformity with GAAP requires management to make estimates and assumptions that affect the reported amounts of assets and liabilities, the disclosure of contingent assets and liabilities at the date of the financial statements, and the reported amounts of revenues and expenses during the reporting period. Actual results could differ from those estimates. Estimates regarding the allowance for credit losses, the fair values of financial instruments, the mortgage loan indemnification liability, and the potential impairment of goodwill and identifiable intangible assets are particularly subject to change. The Company has applied its critical accounting policies and estimation methods consistently in all periods presented in these consolidated financial statements. Actual amounts and values as of the balance sheet dates may be materially different than the amounts and values reported due to the inherent uncertainty in the estimation process. Also, future amounts and values could differ materially from those estimates due to changes in values and circumstances after the balance sheet date.
Hilltop owns
PrimeLending owns a
PCC also owned
F-10
Hilltop Holdings Inc. and Subsidiaries
Notes to Consolidated Financial Statements (continued)
Hilltop has a
In addition, Hilltop owns
The consolidated financial statements include the accounts of the above-named entities. Intercompany transactions and balances have been eliminated. Noncontrolling interests have been recorded for minority ownership in entities that are not wholly owned and are presented in compliance with the provisions of Noncontrolling Interest in Subsidiary Subsections of the ASC.
In preparing these consolidated financial statements, subsequent events were evaluated through the time the financial statements were issued. Financial statements are considered issued when they are widely distributed to all stockholders and other financial statement users, or filed with the SEC.
Acquisition Accounting
Acquisitions are accounted for under the acquisition method of accounting. Purchased assets, including identifiable intangible assets, and assumed liabilities are recorded at their respective acquisition date fair values. If the fair value of net assets purchased exceeds the consideration given, a bargain purchase gain is recognized. If the consideration given exceeds the fair value of the net assets received, goodwill is recognized.
Securities Purchased Under Agreements to Resell
Securities purchased under agreements to resell (reverse repurchase agreements or reverse repos) are treated as collateralized financings and are carried at the amounts at which the securities will subsequently be resold as specified in the agreements. The Company is in possession of collateral with a fair value equal to or in excess of the contract amounts.
Securities
Management classifies securities at the time of purchase and reassesses such designation at each balance sheet date. Securities held for resale to facilitate principal transactions with customers are classified as trading and are carried at fair value, with changes in fair value reflected in the consolidated statements of operations. The Company reports interest income on trading securities as interest income on securities and other changes in fair value as other noninterest income.
Securities are classified as held to maturity and carried at amortized cost when management has the positive intent and ability to hold them until maturity. Debt securities held but not intended to be held to maturity or on a long-term basis are classified as available for sale. Securities included in this category are those that management intends to use as part of its asset/liability management strategy and that may be sold in response to changes in interest rates, prepayment risk or other factors related to interest rate and prepayment risk. Debt securities available for sale are carried at fair value. Unrealized holding gains and losses on debt securities available for sale, net of taxes, are reported in other comprehensive income (loss) until realized. Premiums and discounts are recognized in interest income using the effective interest method and reflect any optionality that may be embedded in the security.
F-11
Hilltop Holdings Inc. and Subsidiaries
Notes to Consolidated Financial Statements (continued)
Equity securities are carried at fair value, with changes in fair value reflected in the consolidated statements of operations. Equity securities that do not have readily determinable fair values are initially recorded at cost and subsequently remeasured when there is (i) an observable transaction involving the same investment, (ii) an observable transaction involving a similar investment from the same issuer or (iii) an impairment. These remeasurements are reflected in the consolidated statements of operations.
Allowance for Credit Losses on Available for Sale and Held to Maturity Securities
Available for sale debt securities in unrealized loss positions are evaluated for impairment related to credit losses at least quarterly. For available for sale debt securities, a decline in fair value due to credit loss results in recording an allowance for credit losses to the extent the fair value is less than the amortized cost basis. Declines in fair value that have not been recorded through an allowance for credit losses, such as declines due to changes in market interest rates, are recorded through other comprehensive income, net of applicable taxes.
Allowances for credit losses may result from credit deterioration of the issuer or the collateral underlying the security. In performing an assessment of whether any decline in fair value is due to a credit loss, all relevant information is considered at the individual security level. In assessing whether a credit loss exists, the Company compares the present value of cash flows expected to be collected from the security with the amortized cost basis of the security. If the present value of cash flows expected to be collected is less than the amortized cost basis for the security, a credit loss exists and an allowance for credit losses is recorded, limited to the amount by which the fair value is less than the amortized cost basis.
If the Company intends to sell a debt security, or it is more likely than not that the Company will be required to sell the security before recovery of its amortized cost basis, the debt security is written down to its fair value and the write down is charged against the allowance for credit losses, with any incremental impairment reported in earnings. Reversals of the allowance for credit losses are permitted and should not exceed the allowance amount initially recognized.
For debt securities held to maturity, estimated expected credit losses are calculated in a manner like that used for loans held for investment. That is, the historical lifetime probability of default and severity of loss in the event of default is derived or obtained from external sources and adjusted for the expected effects of reasonable and supportable forecasts over the expected lives of the securities on those historical credit losses. With respect to certain classes of debt securities, primarily U.S. Treasuries, the Company considers the history of credit losses, current conditions and reasonable and supportable forecasts, which may indicate that the expectation that nonpayment of the amortized cost basis is or continues to be zero, even if the U.S. government were to technically default. Therefore, the Company has not recorded expected credit losses for those securities.
Loans Held for Sale
Loans held for sale consist primarily of single-family residential mortgages funded through PrimeLending. These loans are generally on the consolidated balance sheet between
F-12
Hilltop Holdings Inc. and Subsidiaries
Notes to Consolidated Financial Statements (continued)
Loans Held for Investment
Loans that management has the intent and ability to hold for the foreseeable future or until maturity or payoff are stated at the amount of unpaid principal reduced by unearned income, net unamortized deferred fees and an allowance for credit losses. Unearned income on installment loans and interest on other loans is recognized using the effective interest method. Net fees received for providing loan commitments and letters of credit that result in loans are deferred and amortized to interest income over the life of the related loan, beginning with the initial borrowing. Net fees on commitments and letters of credit that are not expected to be funded are amortized to noninterest income over the commitment period. Income on direct financing leases is recognized on a basis that achieves a constant periodic rate of return on the outstanding investment.
The accrual of interest on credit deteriorated loans is discontinued when, in management’s opinion, there is a clear indication that the borrower’s cash flow may not be sufficient to meet principal and interest payments, which is generally when a loan is 90 days past due unless the asset is both well secured and in the process of collection. When a loan is placed on non-accrual status, all previously accrued and unpaid interest is charged against income. Once placed on non-accrual status, interest income is recognized on a cash basis. Additionally, accretion of purchased discount on non-accrual loans is suspended.
The Company follows applicable regulatory guidance when measuring past due status. The Company uses the actual days elapsed since the payment due date of the loan to determine delinquency. In response to the pandemic, the Company allowed modifications, such as payment deferrals for up to 90 days and temporary forbearance, to credit-worthy borrowers who were experiencing temporary hardship due to the effects of the pandemic. These modifications generally met the criteria of the Economic Security Act (“CARES Act”) passed in March 2020. Therefore, the Company did not account for such loan modifications as troubled debt restructurings (“TDRs”) through January 1, 2022 when the provisions expired, nor were loans granted payment deferrals related to the pandemic reported as past due or placed on non-accrual status (provided the loans were not past due or on non-accrual status prior to the deferral). The Company elected to accrue and recognize interest income on these modifications during the payment deferral period.
Management defines loans acquired in a business combination as acquired loans. Acquired loans are recorded at estimated fair value on their purchase date with no carryover of the related allowance for credit losses. Acquired loans are segregated between those considered to be credit deteriorated and those without credit deterioration at acquisition. To make this determination, management considers such factors as past due status, non-accrual status and credit risk ratings. For acquired performing loans, a lifetime allowance for credit losses is estimated as of the date of acquisition and is recorded through provision for (reversal of) credit losses. The difference between the purchase price and loan receivable is amortized over the remaining life of the loan.
Purchased credit deteriorated (“PCD”) loans are loans that, as of the date of acquisition, have experienced a more-than-insignificant deterioration in credit quality since origination. For PCD loans, any non-credit discount or premium related to an acquired pool of PCD loans is allocated to each individual asset within the pool. On the acquisition date, the initial allowance for credit losses measured on a pooled basis is allocated to each individual asset within the pool to allocate any non-credit discount or premium. Credit losses are measured based on unpaid principal balance. A lifetime allowance for credit losses is estimated as of the date of acquisition. The initial allowance for credit losses is added to the purchase price and is considered to be part of the PCD loan amortized cost basis.
Allowance for Credit Losses for Loans Held for Investment
Credit quality within the loans held for investment portfolio is continuously monitored by management and is reflected within the allowance for credit losses for loans. The allowance for credit losses, or reserve, is an estimate of expected losses over the lifetime of a loan within the Company’s existing loans held for investment portfolio. The allowance for
F-13
Hilltop Holdings Inc. and Subsidiaries
Notes to Consolidated Financial Statements (continued)
credit losses for loans held for investment is adjusted by a provision for (reversal of) credit losses, which is reported in earnings, and reduced by the charge-off of loan amounts, net of recoveries.
The credit loss estimation process involves procedures to appropriately consider the unique characteristics of the Company’s loan portfolio segments, which are further disaggregated into loan classes, the level at which credit risk is monitored. The allowance for credit losses for loans not evaluated for specific reserves is calculated using statistical credit factors, including probabilities of default (“PD”) and loss given default (“LGD”), to the amortized cost of pools of loan exposures with similar risk characteristics over its contractual life, adjusted for prepayments, to arrive at an estimate of expected credit losses. Economic forecasts are applied over the period management believes it can estimate reasonable and supportable forecasts. Reasonable and supportable forecast periods and reversion assumptions to historical data are credit model specific. The Company typically forecasts economic variables over a to
Commercial loans that exceed a minimum size scope are underwritten and graded using credit models that leverage national industry default data to score the loans. At the conclusion of the process of underwriting or re-grading a borrower, each borrower (for commercial and industrial loans) or property (for commercial real estate loans) is assigned a PD grade threshold. The valuation methodology of risk rating internal grades is based on the merits of the financial ratios of the borrower or the property. In addition, an LGD grade is determined by the credit models utilizing collateral information provided. A master rating scale effectively "pools" the loans by credit scores and assigns a standard one year PD percentage and an LGD percentage equally for all loans that have a given score. For borrowers or loans that do not meet the minimum balance threshold, an internal scorecard is utilized to approximate the grades derived from the credit models and is mapped to the master rating scale. The resulting numerical PD grade is the credit quality indicator for commercial loans. The grades on borrowers or properties that are scored in the credit models are determined at origination and updated at least annually. The grades on the internal scorecards are updated annually if they meet a minimum threshold, or if new circumstances (favorable or unfavorable) warrant a re-scoring.
When computing allowance levels, credit loss assumptions are estimated using models that analyze loans according to credit risk ratings, historic loss experience, past due status and other credit trends and risk characteristics, including current conditions and reasonable and supportable forecasts about the future. Determining the appropriateness of the allowance is complex and requires judgment by management about the effect of matters that are inherently uncertain. Future factors and forecasts may result in significant changes in the allowance and provision (reversal) for credit losses in those future periods. The allowance for credit losses will primarily reflect estimated losses for pools of loans that share similar risk characteristics, but will also consider individual loans that do not share risk characteristics with other loans.
Loans that Share Risk Characteristics with Other Loans (“Collectively Evaluated”)
In estimating the component of the allowance for credit losses for loans that share similar risk characteristics with other loans, such loans are segregated into loan classes. Loans are designated into loan classes based on loans pooled by product types and similar risk characteristics or areas of risk concentration. In determining the allowance for credit losses, the Company derives an estimated credit loss assumption from a model that categorizes loan pools based on loan type and internal risk rating or past due category as follows.
Commercial and Industrial and Commercial Real Estate Loans. The Company assesses the credit quality of the borrower and assigns an internal risk rating by loan type for the commercial and industrial and commercial real estate portfolios. Internal risk ratings are assigned at origination or acquisition, and if necessary, adjusted for changes in credit quality over the life of the exposure. In assessing the internal PD risk rating of the loan or related unfunded commitments, the Company separately evaluates owner and non-owner occupied real estate. The borrower’s financial statements may be used to evaluate amounts and sources of repayments, debt service coverage, debt capacity, and quality of earnings. Other non-financial metrics are also evaluated including the geographies and industries within which it operates, its management strength, and its reputation and historical experience. The internal LGD risk rating also considers assessment of collateral quality and current loan to value, collateral type and loan seniority, covenant strength and performance, as well as any individual, corporate, or government guarantees.
F-14
Hilltop Holdings Inc. and Subsidiaries
Notes to Consolidated Financial Statements (continued)
These factors are based on an evaluation of historical and current information and sometimes involve subjective assessment and interpretation. Specific considerations for construction are considered in the internal PD and LGD risk ratings including property type, development phase and complexity, as well as lease-up and stabilization projections. The PD and LGD factors are further sensitized in the models for future expectations over the loan’s contractual life, adjusted for prepayments.
1-4 Family Residential Loans. The 1-4 family residential loan portfolio is grouped into pools of residential real estate loans with similar credit risk characteristics. For 1-4 family residential loans, the Company utilizes separate credit models designed for these types of loans to estimate the PD and LGD grades for the allowance for credit losses calculation. The models calculate expected losses and prepayments using borrower information at origination, including FICO score, loan type, collateral type, lien position, geography, origination year, and loan to value. Past due status post-origination is also a key input in the models. Current and future changes in economic conditions, including unemployment rates, home prices, index rates, and mortgage rates, are also considered. New originations and loan purchases are scored using the FICO score at origination. FICO score bands are assigned following prevalent industry standards and are used as the credit quality indicator for these types of loans. Substandard non-accrual loans are treated as a separate category in the credit scoring grid as the probability of default is 100% and the FICO score is no longer a relevant predictor.
Consumer Loans. The consumer loan portfolio is grouped into pools of consumer installment loans or revolving lines of credit with similar credit characteristics. The models calculate expected losses using borrower information at origination, including FICO score, origination year, geography, and collateral type.
Broker-Dealer Loans. The broker-dealer loan portfolio is evaluated on an individual basis using the collateral maintenance practical expedient. The collateral maintenance practical expedient allows the broker-dealer to compare the fair value of the collateral of each loan as of the reporting date to loan value. The underlying collateral of the loans to customers and correspondents is marked to market daily and any required additional collateral is collected. The allowance represents the amount of unsecured loan balances at the end of the period.
Qualitative Factors
Estimating the timing and amounts of future losses is subject to significant management judgment as these loss cash flows rely upon estimates such as default rates, loss severities, collateral valuations, the amounts and timing of principal payments (including any expected prepayments) or other factors that are reflective of current or future expected conditions. These estimates, in turn, depend on the duration of current overall economic conditions, industry, borrower, or portfolio specific conditions, the expected outcome of bankruptcy or insolvency proceedings, as well as, in certain circumstances, other economic factors, including the level of current and future real estate prices. All of these estimates and assumptions require significant management judgment and certain assumptions that are highly subjective. Model imprecision also exists in the allowance for credit losses estimation process due to the inherent time lag of available industry information and differences between expected and actual outcomes.
Management considers adjustments for these conditions in its allowance for credit loss estimates qualitatively where they may not be measured directly in its individual or collective assessments, including but not limited to:
| ● | an adjustment to historical loss data to measure credit risk even if that risk is remote and does not meet the scope of assets with zero expected losses; |
| ● | the environmental factors and the areas in which credit is concentrated, such as the regulatory, environmental, or technological environment, the geographical area or key industries, or in the national or regional economic and business conditions where the borrower has exposure; |
| ● | the nature and volume of the company’s financial assets; |
| ● | the borrower’s financial condition, credit rating, credit score, asset quality, or business prospects; |
| ● | the borrower’s ability to make scheduled interest or principal payments; |
| ● | the remaining payment terms of the financial assets and the remaining time to maturity and the timing and extent of prepayments on the financial assets; |
F-15
Hilltop Holdings Inc. and Subsidiaries
Notes to Consolidated Financial Statements (continued)
| ● | the volume and severity of past due or adversely classified financial assets; |
| ● | the value of underlying collateral in which the collateral-dependent practical expedient has not been utilized; |
| ● | any updates to credit lending policies and procedures, including lending strategies, underwriting standards, collection and recovery practices, not reflected in the models; and |
| ● | the quality of the internal credit review system. |
Loans that Do Not Share Risk Characteristics with Other Loans
When a loan is assigned a substandard non-accrual or worse risk rating grade, the loan subsequently is evaluated on an individual basis and no longer evaluated on a collective basis. The net realizable value of the loan is compared to the appropriate loan basis (i.e., PCD loan versus non-PCD loan) to determine any allowance for credit losses. Loans that are below a predetermined threshold, with the exception of 1-4 family residential loans, are fully reserved. The Company generally considers non-accrual loans to be collateral-dependent. The practical expedient to measure credit losses using the fair value of the collateral has been exercised.
For commercial real estate loans, the fair value of collateral is primarily based on appraisals. For owner occupied real estate loans, underlying properties are occupied by the borrower in its business, and evaluations are based on business operations used to service the debt. For non-owner occupied real estate loans, underlying properties are income-producing and evaluations are based on tenant revenues. For income producing construction and land development loans, appraisals reflect the assumption that properties are completed.
For 1-4 family residential loans that are graded substandard non-accrual, an assessment of value is made using the most recent appraisal on file. If the appraisal on file is older than
Consumer loans are charged off when they reach
Off-Balance Sheet Credit Exposures, Including Unfunded Loan Commitments
The Company maintains a separate allowance for credit losses from off-balance sheet credit exposures, including unfunded loan commitments, which is included in other liabilities within the consolidated balance sheets. The Company estimates expected losses by calculating a commitment usage factor based on industry usage factors. The commitment usage factor is applied over the relevant contractual period. Loss factors from the underlying loans to which commitments are related are applied to the results of the usage calculation to estimate any liability for credit losses related for each loan type.
Broker-Dealer and Clearing Organization Transactions
Amounts recorded in broker-dealer and clearing organization receivables and payables include securities lending activities, as well as amounts related to securities transactions for either customers of the Hilltop Broker-Dealers or for the accounts of the Hilltop Broker-Dealers. Securities borrowed and securities loaned transactions are generally reported as collateralized financings. Securities borrowed transactions require the Hilltop Broker-Dealers to deposit cash, letters of credit, or other collateral with the lender. With respect to securities loaned, the Hilltop Broker-Dealers receive collateral in the form of cash or other assets in an amount generally in excess of the market value of securities loaned. The Hilltop Broker-Dealers monitor the market value of securities borrowed and loaned on a daily basis, with additional collateral obtained or refunded as necessary. Interest income and interest expense associated with collateralized financings is included in the accompanying consolidated statements of operations.
F-16
Hilltop Holdings Inc. and Subsidiaries
Notes to Consolidated Financial Statements (continued)
Premises and Equipment
Premises and equipment are stated at cost less accumulated depreciation and amortization computed principally on the straight-line method over the estimated useful lives of the assets, which range between
Leases
The Company determines if an arrangement is a lease at inception. Operating leases with a term of greater than one year are included in operating lease right-of-use (“ROU”) assets and operating lease liabilities on the Company’s consolidated balance sheets. Finance leases are included in premises and equipment and other liabilities on the Company’s consolidated balance sheets. The Company has lease agreements with lease and nonlease components, which are generally accounted for as a single lease component. Leases of low-value assets are assessed on a lease-by-lease basis to determine the need for balance sheet capitalization.
ROU assets represent the Company’s right to use an underlying asset for the lease term and lease liabilities represent its obligation to make lease payments arising from the lease. Operating lease ROU assets and liabilities are recognized on the lease commencement date based on the present value of lease payments over the lease term. As most of the Company’s leases do not provide an implicit rate, the Company uses the incremental borrowing rate commensurate with the lease term based on the information available at the lease commencement date in determining the present value of lease payments. No significant judgments or assumptions were involved in developing the estimated operating lease liabilities as the Company’s operating lease liabilities largely represent the future rental expenses associated with operating leases, and the incremental borrowing rates are based on publicly available interest rates. The operating lease ROU asset also includes any lease payments made and excludes lease incentives. The Company’s lease terms may include options to extend or terminate the lease. These options to extend or terminate are assessed on a lease-by-lease basis, and the ROU assets and lease liabilities are adjusted when it is reasonably certain that an option will be exercised. Rental expense for lease payments is recognized on a straight-line basis over the lease term and is included in occupancy and equipment, net within the Company’s consolidated statements of operations.
Other Real Estate Owned
Real estate acquired through foreclosure (“OREO”) is included in other assets within the consolidated balance sheets and is carried at management’s estimate of fair value, less estimated cost to sell. Any excess of recorded investment over fair value, less cost to sell, is charged against the allowance for credit losses when property is initially transferred to OREO. Subsequent to the initial transfer to OREO, downward valuation adjustments are charged against earnings. Valuation adjustments, revenue and expenses from operations of the properties and resulting gains or losses on sale are included within the consolidated statements of operations in other noninterest income or expense, as appropriate.
Debt Issuance Costs
The Company capitalizes debt issuance costs associated with financing of debt. These costs are amortized using the effective interest method over the repayment term of the debt. Unamortized debt issuance costs are presented in the consolidated balance sheets as a direct reduction from the associated debt liability. Debt issuance costs of $
Goodwill
Goodwill, which represents the excess of cost over the fair value of the net assets acquired, is allocated to reportable business segments and tested for impairment on an annual basis, or more frequently if events or changes in circumstances indicate that the carrying amount should be assessed. The Company performs required annual impairment tests of its
F-17
Hilltop Holdings Inc. and Subsidiaries
Notes to Consolidated Financial Statements (continued)
goodwill as of October 1st for each of its reporting units, which aligns with the Company’s reportable business segments. Goodwill is assigned to business segments at the date the goodwill is initially recorded. Once goodwill has been assigned to business segments, it no longer retains its association with a particular acquisition, and all of the activities within a business segment, whether acquired or internally generated, are available to support the value of the goodwill. The goodwill impairment test requires the Company to make judgments in determining what assumptions to use in the calculation. The process consists of estimating the fair value of each reportable business segment based on valuation techniques, including a discounted cash flow model using revenue and profit forecasts and recent industry transaction and trading multiples of peers, and comparing those estimated fair values with the carrying values of the assets and liabilities of the business segment, which includes the allocated goodwill. If the estimated fair value is less than the carrying value, the Company is required to recognize an impairment charge for the amount by which the carrying amount exceeds the business segment’s fair value; however, any loss recognized will not exceed the total amount of goodwill allocated to that business segment.
Intangibles and Other Long-Lived Assets
Intangible assets are acquired assets that lack physical substance but can be distinguished from goodwill because of contractual or other legal rights or because the asset is capable of being sold or exchanged either on its own or in combination with a related contract, asset or liability. The Company’s intangible assets primarily consist of core deposits, trade names and customer relationships. Intangible assets with definite useful lives are generally amortized on the straight-line method over their estimated lives, although certain intangibles, including core deposits, and customer relationships, are amortized on an accelerated basis. Amortization of intangible assets is recorded in other noninterest expense within the consolidated statements of operations. Intangible assets with indefinite useful lives are tested for impairment on an annual basis as of October 1st, or more often if events or circumstances indicate there may be impairment, and not amortized until their lives are determined to be definite. Intangible assets with definite useful lives, premises and equipment, operating lease ROU assets, and other long-lived assets are tested for impairment whenever events or changes in circumstances indicate the carrying amount of the assets may not be recoverable from future undiscounted cash flows. Impaired assets are recorded at fair value.
Mortgage Servicing Rights
The Company determines its portfolio segment of residential mortgage servicing assets based on the asset type being serviced along with the methods used to manage the risk inherent in the servicing assets, which includes the market inputs used to value the servicing assets. The Company measures its servicing assets at fair value and reports changes in fair value through earnings.
The retained mortgage servicing rights (“MSR”) asset is measured at fair value as of the date of sale of the related mortgage loan. Subsequent fair value measurements of the MSR asset are determined by valuing the projected net servicing cash flows, which are then discounted to estimate fair value using a discounted cash flow model. Assumptions used include market discount rates, anticipated prepayment speeds, delinquency and foreclosure rates, and ancillary fee income.
The model assumptions and the MSR asset fair value estimates are compared to observable trades of similar portfolios as well as to MSR asset broker valuations and industry surveys, as available. The expected life of the loan can vary from management’s estimates due to prepayments by borrowers. The value of the MSR asset is also dependent upon the discount rate used in the model, which is based on current market rates that are reviewed by management on an ongoing basis.
Derivative Financial Instruments
The Company enters into various derivative financial instruments to manage interest rate risk or to hedge specified assets and liabilities. The Company’s derivative financial instruments also include interest rate lock commitments (“IRLCs”) executed with its customers that allow those customers to obtain a mortgage loan on a future date at an agreed-upon interest rate. The IRLCs, forward commitments, interest rate swaps, U.S. Treasury bond futures and options, futures
F-18
Hilltop Holdings Inc. and Subsidiaries
Notes to Consolidated Financial Statements (continued)
contracts, credit default swaps and municipal market data (“MMD”) rate locks meet the definition of a derivative under the provisions of the Derivatives and Hedging Topic of the ASC.
Derivatives are recorded at fair value and included in other assets and other liabilities within the consolidated balance sheets. To qualify for hedge accounting, derivatives must be highly effective at reducing the risk associated with the exposure being hedged and must be designated as a hedge at the inception of the derivative contract. If derivative instruments are designated as hedges of fair values, the change in the fair value of both the derivative instrument and the hedged item are included in current earnings. Changes in the fair value of derivatives designated as hedges of cash flows are recorded in other comprehensive income (loss). Actual cash receipts and/or payments and related accruals on derivatives related to hedges are recorded as adjustments to the line item where the hedged item’s effect on earnings is recorded.
Certain financial instruments, including resale and repurchase agreements, securities lending arrangements and derivatives, may be eligible for offset in the consolidated balance sheets and/or subject to master netting arrangements or similar agreements. The Company generally enters into master netting agreements and collateral agreements with its counterparties. These agreements provide the Company with the right, in the event of a default by the counterparty, to net a counterparty’s rights and obligations under the agreement, and to liquidate and set off collateral against any net amount owed by the counterparty. The Company presents required disclosures related to collateral and derivative positions on a gross basis.
Revenue from Contracts with Customers
Certain activities primarily within the Company’s banking and broker-dealer segments are subject to the provisions of ASC 606, Revenue from Contracts with Customers.
The Company’s banking segment has
The Company’s broker-dealer segment has
Investment and securities advisory fees and commissions
Financial advisory. Revenue from financial advisory service contracts is earned from services related to bond issuances. Under financial advisory agreements, the broker-dealer provides public finance services for school districts, municipality and government agencies to meet their financing needs such as assisting with the issuance of debt, advising on an on-going basis and providing disclosure statements. The fee is either fixed or calculated based on the par value of the bond issuance. Revenue is recognized when the performance obligation for the transaction is satisfied, which is typically the bond issuance date.
F-19
Hilltop Holdings Inc. and Subsidiaries
Notes to Consolidated Financial Statements (continued)
Money Market and Bank-Insured Fund Fees. The broker-dealer earns revenue for placing clients’ deposits in money market funds and brokerage sweep programs with third-party and affiliate banks. The amounts earned from these funds and banks are impacted by short-term interest rates. The performance obligations with the funds and financial institutions that participate in these programs are considered a series of distinct services that are substantially the same and are satisfied each day over the contract term. The revenue is earned daily and settled monthly based on a rate applied, as a percentage, of the deposits placed.
Underwriting. The broker-dealer underwrites securities for business entities and governmental entities that want to raise funds through a sale of securities. Revenues are earned from fees arising from securities offerings in which the broker-dealer acts as the underwriter. Revenue is recognized on the trade date (the date on which the broker-dealer purchases the securities from the issuer) for the portion the broker-dealer is contracted to buy. The broker-dealer believes that the trade date is the appropriate point in time to recognize revenue for securities underwriting transactions, as there are no significant actions which the broker-dealer need to take subsequent to this date and the issuer obtains the control and benefit of the capital markets offering at that point.
Securities commissions and fees
Commissions. The broker-dealer buys and sells securities on behalf of its customers. Each time a customer enters a buy or sell transaction, the broker-dealer charges a commission. Commissions and related clearing expenses are recorded on the trade date (the date the broker-dealer fills the trade order by finding and contracting with a counterparty and confirms the trade with the customer). Commissions and fees revenue is generally recognized at a point in time upon the delivery of contracted services based on a predefined contractual amount or on the trade date for trade execution services based on prevailing market prices and internal and regulatory guidelines.
Loss Contingencies
Loss contingencies, including claims and legal actions arising in the ordinary course of business, are recorded as liabilities when the likelihood of loss is probable and an amount or range of loss can be reasonably estimated.
Stock-Based Compensation
Stock-based compensation expense for all share-based awards granted is based on the grant date fair value estimated in accordance with the provisions of the Stock Compensation Topic of the ASC. The Company recognizes these compensation costs for only those awards expected to vest over the service period of the award.
Income Taxes
Income taxes are accounted for under the asset and liability method. Deferred tax assets and liabilities are recorded for the estimated future tax effects of the temporary difference between the tax basis and book basis of assets and liabilities reported in the accompanying consolidated balance sheets. The provision for income tax expense or benefit differs from the amounts of income taxes currently payable because certain items of income and expense included in the consolidated financial statements are recognized in different time periods by taxing authorities. Interest and penalties incurred related to tax matters are charged to other interest expense or other noninterest expense, respectively. The revaluation of deferred tax assets as a result of enacted tax rate changes, is recognized within income tax expense in the period of enactment.
Benefits from uncertain tax positions are recognized in the consolidated financial statements only when it is more likely than not that the tax position will be sustained upon examination by the appropriate taxing authority having full knowledge of all relevant information. A tax position that meets the more-likely-than-not recognition threshold is measured at the largest amount of cumulative benefit that is greater than fifty percent likely of being realized upon ultimate settlement. Tax positions that previously failed to meet the more-likely-than-not recognition threshold are recognized in the reporting period in which that threshold is met. Previously recognized tax positions that no longer meet the more-likely-than-not recognition threshold are derecognized in the reporting period in which that threshold is no
F-20
Hilltop Holdings Inc. and Subsidiaries
Notes to Consolidated Financial Statements (continued)
longer met. If the Company were to prevail on all uncertain tax positions, the effect would be a benefit to the Company’s effective tax rate. Due to uncertainties in any tax audit outcome, estimates of the ultimate settlement of unrecognized tax positions may change and the actual tax benefits may differ significantly from the estimate.
Deferred tax assets, including net operating loss and tax credit carry forwards, are reduced by a valuation allowance when, in the opinion of management, it is more-likely-than-not that any portion of these tax attributes will not be realized. Periodic reviews of the carrying amount of deferred tax assets are made when it is more likely than not that all or a portion of a deferred tax asset will not be realized.
Cash, Cash Equivalents and Restricted Cash
For the purpose of presentation in the consolidated statements of cash flows, cash, cash equivalents and restricted cash are defined as the amounts included in the consolidated balance sheet captions “Cash and due from banks,” “Federal funds sold” and “Assets segregated for regulatory purposes.” Cash equivalents have original maturities of three months or less.
Repurchases of Common Stock
In accordance with Maryland law, the Company uses the par value method of accounting for its stock repurchases, whereby the par value of the shares is deducted from common stock. The excess of the cost of shares acquired over the par value is allocated to additional paid-in capital based on an estimated average sales price per issued share with the excess amounts charged to retained earnings.
Basic and Diluted Net Income Per Share
Nonvested share-based payment awards that contain nonforfeitable rights to dividends or dividend equivalents are participating securities and are included in the computation of earnings per share pursuant to the two-class method prescribed by the Earnings Per Share Topic of the ASC. The two-class method is an earnings allocation formula that determines earnings per share for each class of common stock and participating security according to dividends declared (or accumulated) and participation rights in undistributed earnings.
Net earnings, less any preferred dividends accumulated for the period (whether or not declared), is allocated between the common stock and participating securities pursuant to the two-class method. Basic earnings per common share is computed by dividing net earnings available to common stockholders by the weighted average number of common shares outstanding during the period, excluding participating nonvested restricted shares. The Company calculated basic earnings per common share using the treasury method instead of the two-class method because there were no instruments which qualified as participating securities during 2023, 2022 or 2021.
Diluted earnings per common share is computed in a similar manner, except that first the denominator is increased to include the number of additional common shares that would have been outstanding if potentially dilutive common shares, excluding the participating securities, were issued using the treasury stock method. During, 2023, 2022 and 2021, restricted stock units (“RSUs”) were the only potentially dilutive non-participating instruments issued by Hilltop. Next, the Company determines and includes in the diluted earnings per common share calculation the more dilutive effect of the participating securities using the treasury stock method or the two-class method. Undistributed losses are not allocated to the nonvested share-based payment awards (the participating securities) under the two-class method as the holders are not contractually obligated to share in the losses of the Company.
2. Recently Issued Accounting Standards
Accounting Standards Adopted During 2023
In March 2022, the FASB issued Accounting Standards Update (“ASU”) 2022-02 to eliminate the recognition and measurement guidance on TDRs for creditors, and require enhanced disclosures about loan modifications for borrowers experiencing financial difficulty. The amendments are effective in periods beginning after December 15, 2022 using
F-21
Hilltop Holdings Inc. and Subsidiaries
Notes to Consolidated Financial Statements (continued)
either a prospective or modified retrospective transition. The Company adopted the provisions of ASU 2022-02 as of January 1, 2023 on a prospective basis. The adoption of this amendment did not have a material impact on the Company’s consolidated financial statements.
In September 2022, the FASB issued ASU 2022-04 to require entities that use supplier finance programs in connection with the purchase of goods and services to disclose the key terms of such programs and information about obligations outstanding at the end of the reporting period, including a rollforward of those obligations and a description of where in the financial statements outstanding amounts are present. The guidance does not affect the recognition, measurement or financial statement presentation of supplier finance program obligations. The amendments are effective in periods beginning after December 15, 2022, except that the amendments to disclose a rollforward of obligations outstanding will be effective beginning after December 15, 2023. The Company adopted the provisions as of January 1, 2023. The adoption of this amendment did not have a material impact on the Company’s consolidated financial statements.
In March 2023, the FASB issued ASU 2023-01 to require entities to classify and account for leases with related parties on the basis of legally enforceable terms and conditions of the arrangement. The amendments are effective in periods beginning after December 15, 2023, including interim periods within those fiscal years, with early adoption permitted. The Company elected to early adopt the provisions of ASU 2023-01 as of January 1, 2023 on a prospective basis for new and existing leasehold improvements. The adoption of this amendment did not have a material impact on the Company’s consolidated financial statements.
Accounting Standards Issued But Not Yet Adopted
In August 2023, the FASB issued ASU 2023-05 to require joint ventures to initially measure all contributions received and liabilities assumed upon its formation at fair value. The guidance is applicable to joint venture entities with a formation date on or after January 1, 2025, with early adoption permitted. The Company is currently evaluating the provisions of the amendments and the impact on its future consolidated statements.
In October 2023, the FASB issued ASU 2023-06 to clarify or improve disclosure and presentation requirements of a variety of topics, which will allow users to more easily compare entities subject to the SEC's existing disclosures with those entities that were not previously subject to the requirements, and align the requirements in the FASB accounting standard codification with the SEC's regulations. The amendments will be effective on the date the SEC removes related disclosure requirements from Regulation S-X or Regulation S-K. If by June 30, 2027, the SEC has not removed the applicable disclosure requirements, the pending amendments will not become effective. Early adoption is prohibited. The Company does not expect the future adoption of this amendment to have a material impact on its consolidated financial statements since the Company is currently subject to the SEC’s disclosure and presentation requirements under Regulation S-X and Regulation S-K.
In November 2023, the FASB issued ASU 2023-07 to enhance disclosures of significant expense and segment profitability categories and amounts for each of the Company’s reportable business segments. The amendments are effective in annual periods beginning after December 15, 2023 and subsequent interim periods, with early adoption permitted. The Company is currently evaluating the provisions of the amendments and the impact on its future consolidated statements.
In December 2023, the FASB issued ASU 2023-09 to improve disclosures and presentation requirements to the transparency of the income tax disclosures by requiring consistent categories and greater disaggregation of information in the rate reconciliation and income taxes paid disaggregated by jurisdiction. The amendments are effective in annual periods beginning after December 15, 2024, with early adoption permitted. The Company is currently evaluating the provisions of the amendments and the impact on it future consolidated statements.
T
F-22
Hilltop Holdings Inc. and Subsidiaries
Notes to Consolidated Financial Statements (continued)
3. Fair Value Measurements
Fair Value Measurements and Disclosures
The Company determines fair values in compliance with The Fair Value Measurements and Disclosures Topic of the ASC (the “Fair Value Topic”). The Fair Value Topic defines fair value, establishes a framework for measuring fair value in GAAP and expands disclosures about fair value measurements. The Fair Value Topic defines fair value as the price that would be received to sell an asset or paid to transfer a liability in an orderly transaction between market participants. The Fair Value Topic assumes that transactions upon which fair value measurements are based occur in the principal market for the asset or liability being measured. Further, fair value measurements made under the Fair Value Topic exclude transaction costs and are not the result of forced transactions.
The Fair Value Topic includes a fair value hierarchy that classifies fair value measurements based upon the inputs used in valuing the assets or liabilities that are the subject of fair value measurements. The fair value hierarchy gives the highest priority to quoted prices in active markets for identical assets or liabilities and the lowest priority to unobservable inputs, as indicated below.
| ● | Level 1 Inputs: Unadjusted quoted prices in active markets for identical assets or liabilities that the Company can access at the measurement date. |
| ● | Level 2 Inputs: Observable inputs other than Level 1 prices. Level 2 inputs include quoted prices for similar assets or liabilities in active markets, quoted prices for identical or similar assets or liabilities in markets that are not active, inputs other than quoted prices that are observable for the asset or liability (such as interest rates, yield curves, prepayment speeds, default rates, credit risks and loss severities), and inputs that are derived from or corroborated by market data, among others. |
| ● | Level 3 Inputs: Unobservable inputs that reflect an entity’s own assumptions about the assumptions that market participants would use in pricing the assets or liabilities. Level 3 inputs include pricing models and discounted cash flow techniques, among others. |
Fair Value Option
The Company has elected to measure substantially all of PrimeLending’s mortgage loans held for sale and the retained MSR asset at fair value, under the provisions of the Fair Value Option. The Company elected to apply the provisions of the Fair Value Option to these items so that it would have the opportunity to mitigate volatility in reported earnings caused by measuring related assets and liabilities differently without having to apply complex hedge accounting provisions. At December 31, 2023 and 2022, the aggregate fair value of PrimeLending’s mortgage loans held for sale accounted for under the Fair Value Option was $
The Company holds a number of financial instruments that are measured at fair value on a recurring basis, either by the application of the Fair Value Option or other authoritative pronouncements. The fair values of those instruments are determined primarily using Level 2 inputs, as further described below. Those inputs include quotes from mortgage loan investors and derivatives dealers and data from independent pricing services. The fair value of loans held for sale is determined using an exit price method.
Trading Securities — Trading securities are reported at fair value primarily using either Level 1 or Level 2 inputs in the same manner as discussed below for available for sale securities.
Available For Sale Securities — Most securities available for sale are reported at fair value using Level 2 inputs. The Company obtains fair value measurements from independent pricing services. As the Company is responsible for the determination of fair value, control processes are designed to ensure that the fair values received from independent pricing services are reasonable and the valuation techniques and assumptions used appear reasonable and consistent with
F-23
Hilltop Holdings Inc. and Subsidiaries
Notes to Consolidated Financial Statements (continued)
prevailing market conditions. The fair value measurements consider observable data that may include dealer quotes, market spreads, cash flows, the U.S. Treasury yield curve, live trading levels, trade execution data, market consensus prepayment speeds, credit information and the financial instruments’ terms and conditions, among other things. The fair value of certain available for sale securities by the Company’s merchant bank subsidiary are measured using the income approach with Level 3 inputs. The fair value of such financial instruments are based upon estimates of expected cash flows using unobservable inputs, including credit spreads derived from comparable securities and benchmark credit curves, and management’s knowledge of underlying collateral.
Equity Securities - For public common and preferred equity stocks, the determination of fair value uses Level 1 inputs based on observable market transactions.
Loans Held for Sale — Mortgage loans held for sale are reported at fair value, as discussed above, using Level 2 inputs that consist of commitments on hand from investors or prevailing market prices. These instruments are held for relatively short periods, typically no more than
Loans Held for Investment —The fair value of certain loans held for investment by the Company’s merchant bank subsidiary are measured, under the provisions of the Fair Value Option, using the income approach with Level 3 inputs. The fair value of such loans are based upon estimates of expected cash flows using unobservable inputs, including credit spreads derived from comparable securities and benchmark credit curves, and management’s knowledge of underlying collateral.
Derivatives — Derivatives, which are included in other assets and liabilities within the Company’s consolidated balance sheets, are reported at fair value using either Level 2 or Level 3 inputs. The Bank uses dealer quotes to value interest rate swaps, forward purchase commitments and forward sale commitments executed for both hedging and non-hedging purposes. PrimeLending and the Hilltop Broker-Dealers use dealer quotes to value forward purchase commitments and forward sale commitments, respectively, executed for both hedging and non-hedging purposes. PrimeLending also issues IRLCs to its customers and the Hilltop Broker-Dealers issue forward purchase commitments to its clients that are valued based on the change in the fair value of the underlying mortgage loan from inception of the IRLC or purchase commitment to the balance sheet date, adjusted for projected loan closing rates. PrimeLending determines the value of the underlying mortgage loan as discussed in “Loans Held for Sale,” above. The Hilltop Broker-Dealers determine the value of the underlying mortgage loan from prices of comparable securities used to value forward sale commitments. Additionally, PrimeLending also uses dealer quotes to value futures contracts and U.S. Treasury bond futures and options used to hedge interest rate risk, and the Hilltop Broker-Dealers use dealer quotes to value U.S. Treasury bond futures and options, futures contracts, credit default swaps and MMD rate locks, used to hedge changes in the fair value of its securities. The fair value of certain derivatives by the Company’s merchant bank subsidiary are measured using Level 3 inputs based upon estimates of expected cash flows using unobservable inputs, including management’s knowledge of underlying collateral.
MSR Asset — The MSR asset is reported at fair value, under the provisions of the Fair Value Option, using Level 3 inputs. The MSR asset is valued by projecting net servicing cash flows, which are then discounted to estimate the fair value. The fair value of the MSR asset is impacted by a variety of factors. Prepayment rates and discount rates, the most significant unobservable inputs, are discussed further in Note 10 to the consolidated financial statements.
Equity Investments — The Company has elected to measure certain equity investments by the Company’s merchant bank subsidiary under the provisions of the Fair Value Option using Level 3 inputs to mitigate volatility in reported earnings changes in fair value and better align with merchant bank investment strategy. Changes in fair value are reported within other noninterest income in the accompanying consolidated statements of operations.
F-24
Hilltop Holdings Inc. and Subsidiaries
Notes to Consolidated Financial Statements (continued)
Securities Sold, Not Yet Purchased — Securities sold, not yet purchased are reported at fair value primarily using either Level 1 or Level 2 inputs in the same manner as discussed above for trading and available for sale securities.
The following tables present information regarding financial assets and liabilities measured at fair value on a recurring basis (in thousands).
| Level 1 |
| Level 2 |
| Level 3 |
| Total |
| |||||
December 31, 2023 | Inputs | Inputs | Inputs | Fair Value |
| ||||||||
Trading securities | $ | | $ | | $ | — | $ | | |||||
Available for sale securities | — | | | | |||||||||
Equity securities | | — | — | | |||||||||
Loans held for sale | — | | | | |||||||||
Loans held for investment | — | — | | | |||||||||
— | | | | ||||||||||
MSR asset | — | — | | | |||||||||
Equity investments | — | — | | | |||||||||
Securities sold, not yet purchased | | | — | | |||||||||
Derivative liabilities | — | | — | | |||||||||
| Level 1 |
| Level 2 |
| Level 3 |
| Total | ||||||
December 31, 2022 | Inputs | Inputs | Inputs | Fair Value | |||||||||
Trading securities | $ | | $ | | $ | — | $ | | |||||
Available for sale securities | — | | — | | |||||||||
Equity securities | | — | — | | |||||||||
Loans held for sale | — | | | | |||||||||
Loans held for investment | — | — | | | |||||||||
Derivative assets | — | | — | | |||||||||
MSR asset | — | — | | | |||||||||
Securities sold, not yet purchased | | | — | | |||||||||
Derivative liabilities | — | | — | | |||||||||
The following table includes a rollforward for those material financial instruments measured at fair value using Level 3 inputs (in thousands).
Total Gains or Losses | |||||||||||||||||||||
(Realized or Unrealized) | |||||||||||||||||||||
Included in | |||||||||||||||||||||
| Balance, |
|
|
|
|
| Transfers |
|
|
| Other |
|
| ||||||||
Beginning of | Purchases/ | Sales/ | to (from) | Included in | Comprehensive | Balance, | |||||||||||||||
Year | Additions | Reductions | Level 3 | Net Income | End of Year | ||||||||||||||||
Year ended December 31, 2023 | |||||||||||||||||||||
Available for sale securities | $ | — | $ | | $ | — | $ | — | $ | — | $ | ( | $ | | |||||||
Loans held for sale | | | ( | ( | ( | — | | ||||||||||||||
Loans held for investment | | — | — | — | | — | | ||||||||||||||
Derivative assets | — | | — | — | | — | | ||||||||||||||
MSR asset | | | ( | — | ( | — | | ||||||||||||||
Equity investment | — | | — | — | — | — | | ||||||||||||||
Total | $ | | $ | | $ | ( | $ | ( | $ | ( | $ | ( | $ | | |||||||
Year ended December 31, 2022 | |||||||||||||||||||||
Loans held for sale | $ | | $ | | $ | ( | $ | | $ | ( | $ | — | $ | | |||||||
Loans held for investment | — | | ( | — | | — | | ||||||||||||||
MSR asset | | | ( | — | | — | | ||||||||||||||
Total | $ | | $ | | $ | ( | $ | | $ | | $ | — | $ | | |||||||
Year ended December 31, 2021 | |||||||||||||||||||||
Loans held for sale | $ | | $ | | $ | ( | $ | ( | $ | ( | $ | — | $ | | |||||||
MSR asset | | | ( | — | | — | | ||||||||||||||
$ | | $ | | $ | ( | $ | ( | $ | | $ | — | $ | | ||||||||
F-25
Hilltop Holdings Inc. and Subsidiaries
Notes to Consolidated Financial Statements (continued)
All net realized and unrealized gains (losses) in the table above are reflected in the accompanying consolidated financial statements. The unrealized gains (losses) relate to financial instruments still held at December 31, 2023.
For material Level 3 financial instruments measured at fair value on a recurring basis at December 31, 2023 and 2022, the significant unobservable inputs used in the fair value measurements were as follows.
Range (Weighted-Average) | |||||||||||||||||||||||
Financial instrument |
| Fair Value |
| Valuation Technique |
| Unobservable Inputs |
| December 31, 2023 | December 31, 2022 | ||||||||||||||
Available for sale securities | $ | | | - | | % | — | - | — | ||||||||||||||
| |||||||||||||||||||||||
Loans held for sale | | | - | | % | ( | %) | | - | | % | ( | %) | ||||||||||
Loans held for investment | | | % | | % | ||||||||||||||||||
Derivative assets | | | % | — | |||||||||||||||||||
MSR asset | | | % | | % | ||||||||||||||||||
| % | | % | ||||||||||||||||||||
Equity investments | | ||||||||||||||||||||||
The Company had
The following table presents those changes in fair value of material instruments recognized in the consolidated statements of operations that are accounted for under the Fair Value Option (in thousands).
Year Ended December 31, 2023 | Year Ended December 31, 2022 | Year Ended December 31, 2021 | |||||||||||||||||||||||||
| Net |
| Other |
| Total |
| Net |
| Other |
| Total |
| Net |
| Other |
| Total | ||||||||||
Gains | Noninterest | Changes in | Gains | Noninterest | Changes in | Gains | Noninterest | Changes in | |||||||||||||||||||
(Losses) | Income | Fair Value | (Losses) | Income | Fair Value | (Losses) | Income | Fair Value | |||||||||||||||||||
Loans held for sale | $ | | $ | — | $ | | $ | ( | $ | — | $ | ( | $ | ( | $ | — | $ | ( | |||||||||
Loans held for investment | |
| — |
| | ( |
| — |
| ( | — |
| — |
| — | ||||||||||||
MSR asset |
| ( |
| — |
| ( |
| |
| — |
| |
| |
| — |
| | |||||||||
The Company determines the fair value of OREO on a non-recurring basis. In particular, the fair value of properties are determined at their respective acquisition date fair values. In addition, facts and circumstances may dictate a fair value measurement when there is evidence of impairment. The Company determines fair value primarily using independent appraisals of OREO properties. The resulting fair value measurements are classified as Level 2 inputs. At December 31, 2023 and 2022, the estimated fair value of OREO was $
Financial Assets and Liabilities Not Measured at Fair Value on Recurring or Non-Recurring Basis
The Fair Value of Financial Instruments Subsection of the ASC requires disclosure of the fair value of financial assets and liabilities, including the financial assets and liabilities previously discussed. The methods for determining estimated fair value for financial assets and liabilities measured at fair value on a recurring or non-recurring basis are discussed above. For other financial assets and liabilities, the Company utilizes quoted market prices, if available, to estimate the fair value of financial instruments. Because no quoted market prices exist for a significant portion of the Company’s
F-26
Hilltop Holdings Inc. and Subsidiaries
Notes to Consolidated Financial Statements (continued)
financial instruments, the fair value of such instruments has been derived based on management’s assumptions with respect to future economic conditions, the amount and timing of future cash flows, and estimated discount rates. Different assumptions could significantly affect these estimates. Accordingly, the estimates provided herein do not necessarily indicate amounts which could be realized in a current transaction. Further, as it is management’s intent to hold a significant portion of its financial instruments to maturity, it is not probable that the fair values shown below will be realized in a current transaction.
Because of the wide range of permissible valuation techniques and the numerous estimates which must be made, it may be difficult to make reasonable comparisons of the Company’s fair value information to that of other financial institutions. The aggregate estimated fair value amount should in no way be construed as representative of the underlying value of Hilltop and its subsidiaries. The following methods and assumptions are typically used in estimating the fair value disclosures for financial instruments:
Cash and Cash Equivalents — For cash and due from banks and federal funds sold, the carrying amount is a reasonable estimate of fair value.
Assets Segregated for Regulatory Purposes — Assets segregated for regulatory purposes may consist of cash and securities with carrying amounts that approximate fair value.
Securities Purchased Under Agreements to Resell — Securities purchased under agreements to resell are carried at the amounts at which the securities will subsequently be resold as specified in the agreements. The carrying amounts approximate fair value due to their short-term nature.
Held to Maturity Securities — For securities held to maturity, estimated fair value equals quoted market price, if available. If a quoted market price is not available, fair value is estimated using quoted market prices for similar securities.
Loans Held for Sale — Loans held for sale includes mortgage loans held for sale that are guaranteed by U.S. government agencies that are subject to repurchase, or have been repurchased, by PrimeLending with carrying amounts that approximate fair value. The fair value of certain mortgage loans originated by PrimeLending on behalf of the Bank are measured using Level 3 inputs. Such loans are reported at fair value using an exit price method.
Loans Held for Investment — The estimated fair values of loans held for investment are measured using an exit price method.
Broker-Dealer and Clearing Organization Receivables and Payables — The carrying amount approximates their fair value.
Deposits — The estimated fair value of demand deposits, savings accounts and NOW accounts is the amount payable on demand at the reporting date. The fair value of fixed-maturity certificates of deposit is estimated using the rates currently offered for deposits of similar remaining maturities. The carrying amount for variable-rate certificates of deposit approximates their fair values.
Short-Term Borrowings — The carrying amounts of federal funds purchased, borrowings under repurchase agreements, Federal Home Loan Bank (“FHLB”) and other short-term borrowings approximate their fair values.
Debt — The fair values are estimated using discounted cash flow analysis based on current incremental borrowing rates for similar types of borrowing arrangements.
Other Assets and Liabilities — Other assets and liabilities primarily consists of cash surrender value of life insurance policies and accrued interest receivable and payable with carrying amounts that approximate their fair values using Level 2 inputs.
F-27
Hilltop Holdings Inc. and Subsidiaries
Notes to Consolidated Financial Statements (continued)
The following tables present the carrying values and estimated fair values of financial instruments not measured at fair value on either a recurring or non-recurring basis (in thousands).
Estimated Fair Value | |||||||||||||||
| Carrying |
| Level 1 |
| Level 2 |
| Level 3 |
| |||||||
December 31, 2023 | Amount | Inputs | Inputs | Inputs | Total | ||||||||||
Financial assets: | |||||||||||||||
Cash and cash equivalents | $ | | $ | | $ | — | $ | — | $ | | |||||
Assets segregated for regulatory purposes | | | — | — | | ||||||||||
Securities purchased under agreements to resell | | — | | — | | ||||||||||
Held to maturity securities | | — | | — | | ||||||||||
Loans held for sale | | — | | | | ||||||||||
Loans held for investment, net | | — | | | | ||||||||||
Broker-dealer and clearing organization receivables |
| |
| — |
| |
| — |
| | |||||
Other assets |
| |
| — |
| |
| — |
| | |||||
Financial liabilities: | |||||||||||||||
Deposits |
| |
| — |
| |
| — |
| | |||||
Broker-dealer and clearing organization payables |
| |
| — |
| |
| — |
| | |||||
Short-term borrowings |
| |
| — |
| |
| — |
| | |||||
Debt |
| |
| — |
| |
| — |
| | |||||
Other liabilities |
| |
| — |
| |
| — |
| | |||||
Estimated Fair Value | |||||||||||||||
| Carrying |
| Level 1 |
| Level 2 |
| Level 3 |
| |||||||
December 31, 2022 | Amount | Inputs | Inputs | Inputs | Total | ||||||||||
Financial assets: | |||||||||||||||
Cash and cash equivalents | $ | | $ | | $ | — | $ | — | $ | | |||||
Assets segregated for regulatory purposes | | | — | — | | ||||||||||
Securities purchased under agreements to resell | | — | | — | | ||||||||||
Held to maturity securities | | — | | — | | ||||||||||
Loans held for sale | | — | | | | ||||||||||
Loans held for investment, net | | — | | | | ||||||||||
Broker-dealer and clearing organization receivables |
| |
| — |
| |
| — |
| | |||||
Other assets |
| |
| — |
| |
| |
| | |||||
Financial liabilities: | |||||||||||||||
Deposits |
| |
| — |
| |
| — |
| | |||||
Broker-dealer and clearing organization payables |
| |
| — |
| |
| — |
| | |||||
Short-term borrowings |
| |
| — |
| |
| — |
| | |||||
Debt |
| |
| — |
| |
| — |
| | |||||
Other liabilities |
| |
| — |
| |
| — |
| | |||||
The Company held equity investments other than securities of $
Year Ended December 31, | ||||||
| 2023 |
| 2022 | |||
Balance, beginning of year |
| $ | |
| $ | |
Additional investments | | | ||||
Upward adjustments | | | ||||
Impairments and downward adjustments | ( | ( | ||||
Other | ( | — | ||||
Balance, end of year | $ | | $ | | ||
F-28
Hilltop Holdings Inc. and Subsidiaries
Notes to Consolidated Financial Statements (continued)
4. Securities
The fair value of trading securities are summarized as follows (in thousands).
December 31, | ||||||
2023 |
| 2022 |
| |||
U.S. Treasury securities | $ | |
| $ | |
|
U.S. government agencies: | ||||||
Bonds | | | ||||
Residential mortgage-backed securities |
| |
| | ||
Collateralized mortgage obligations | | | ||||
Other | | — | ||||
Corporate debt securities | | | ||||
States and political subdivisions | | | ||||
Private-label securitized product | | | ||||
Other | | | ||||
Totals | $ | | $ | | ||
In addition to the securities shown above, the Hilltop Broker-Dealers enter into transactions that represent commitments to purchase and deliver securities at prevailing future market prices to facilitate customer transactions and satisfy such commitments. Accordingly, the Hilltop Broker-Dealers’ ultimate obligation may exceed the amount recognized in the financial statements. These securities, which are carried at fair value and reported as securities sold, not yet purchased in the consolidated balance sheets, had a value of $
The amortized cost and fair value of available for sale and held to maturity securities are summarized as follows (in thousands).
Available for Sale | ||||||||||||
Amortized | Unrealized | Unrealized | ||||||||||
December 31, 2023 | Cost | Gains | Losses | Fair Value | ||||||||
U.S. Treasury securities | $ | | $ | — | $ | ( | $ | | ||||
U.S. government agencies: | ||||||||||||
Bonds | | | ( | | ||||||||
Residential mortgage-backed securities |
| |
| |
| ( |
| | ||||
Commercial mortgage-backed securities | |
| |
| ( |
| | |||||
Collateralized mortgage obligations |
| |
| |
| ( |
| | ||||
Corporate debt securities |
| |
| — |
| ( |
| | ||||
States and political subdivisions |
| |
| |
| ( |
| | ||||
Totals | $ | | $ | | $ | ( | $ | | ||||
Available for Sale | ||||||||||||
Amortized | Unrealized | Unrealized | ||||||||||
December 31, 2022 | Cost | Gains | Losses | Fair Value | ||||||||
U.S. Treasury securities | $ | | $ | | $ | ( | $ | | ||||
U.S. government agencies: | ||||||||||||
Bonds | | | ( | | ||||||||
Residential mortgage-backed securities |
| |
| |
| ( |
| | ||||
Commercial mortgage-backed securities | |
| |
| ( |
| | |||||
Collateralized mortgage obligations |
| |
| — |
| ( |
| | ||||
States and political subdivisions |
| |
| |
| ( |
| | ||||
Totals | $ | | $ | | $ | ( | $ | | ||||
F-29
Hilltop Holdings Inc. and Subsidiaries
Notes to Consolidated Financial Statements (continued)
Held to Maturity | ||||||||||||
Amortized | Unrealized | Unrealized | ||||||||||
December 31, 2023 |
| Cost |
| Gains |
| Losses |
| Fair Value | ||||
U.S. government agencies: | ||||||||||||
Residential mortgage-backed securities | $ | | $ | — | $ | ( | $ | | ||||
Commercial mortgage-backed securities | |
| — |
| ( |
| | |||||
Collateralized mortgage obligations |
| |
| — |
| ( |
| | ||||
States and political subdivisions |
| |
| |
| ( |
| | ||||
Totals | $ | | $ | | $ | ( | $ | | ||||
Held to Maturity | ||||||||||||
Amortized | Unrealized | Unrealized | ||||||||||
December 31, 2022 |
| Cost |
| Gains |
| Losses |
| Fair Value | ||||
U.S. government agencies: | ||||||||||||
Residential mortgage-backed securities | $ | | $ | — | $ | ( | $ | | ||||
Commercial mortgage-backed securities | | — | ( | | ||||||||
Collateralized mortgage obligations |
| |
| — |
| ( |
| | ||||
States and political subdivisions |
| |
| |
| ( |
| | ||||
Totals | $ | | $ | | $ | ( | $ | | ||||
Additionally, the Company had unrealized net gains of $
The Company transferred certain agency-issued securities from the available-for-sale to held-to-maturity portfolio on March 31, 2022 having a book value of approximately $
F-30
Hilltop Holdings Inc. and Subsidiaries
Notes to Consolidated Financial Statements (continued)
Information regarding available for sale and held to maturity securities that were in an unrealized loss position is shown in the following tables (dollars in thousands).
December 31, 2023 | December 31, 2022 | |||||||||||||||
| Number of |
|
| Unrealized |
| Number of |
|
| Unrealized | |||||||
Securities | Fair Value | Losses | Securities | Fair Value | Losses | |||||||||||
Available for Sale | ||||||||||||||||
U.S. treasury securities: | ||||||||||||||||
Unrealized loss for less than twelve months |
| — | $ | — | $ | — |
| — | $ | — | $ | — | ||||
Unrealized loss for twelve months or longer |
| |
| |
| |
| |
| |
| | ||||
| |
| |
| |
| |
| |
| | |||||
U.S. government agencies: | ||||||||||||||||
Bonds: | ||||||||||||||||
Unrealized loss for less than twelve months |
| | | |
| | | | ||||||||
Unrealized loss for twelve months or longer |
| |
| |
| |
| |
| |
| | ||||
| | | |
| |
| |
| | |||||||
Residential mortgage-backed securities: | ||||||||||||||||
Unrealized loss for less than twelve months |
| |
| |
| |
| |
| |
| | ||||
Unrealized loss for twelve months or longer |
| |
| |
| |
| |
| |
| | ||||
| | | |
| |
| |
| | |||||||
Commercial mortgage-backed securities: | ||||||||||||||||
Unrealized loss for less than twelve months |
| |
| |
| |
| |
| |
| | ||||
Unrealized loss for twelve months or longer |
| |
| |
| |
| |
| |
| | ||||
| | | |
| |
| |
| | |||||||
Collateralized mortgage obligations: | ||||||||||||||||
Unrealized loss for less than twelve months |
| |
| |
| |
| |
| |
| | ||||
Unrealized loss for twelve months or longer |
| |
| |
| |
| |
| |
| | ||||
| | | |
| |
| |
| | |||||||
Corporate debt securities: | ||||||||||||||||
Unrealized loss for less than twelve months |
| |
| |
| |
| — |
| — |
| — | ||||
Unrealized loss for twelve months or longer |
| — |
| — |
| — |
| — |
| — |
| — | ||||
| | | |
| — |
| — |
| — | |||||||
States and political subdivisions: | ||||||||||||||||
Unrealized loss for less than twelve months |
| |
| |
| |
| |
| |
| | ||||
Unrealized loss for twelve months or longer |
| |
| |
| |
| |
| |
| | ||||
| | | |
| |
| |
| | |||||||
Total available for sale: | ||||||||||||||||
Unrealized loss for less than twelve months |
| |
| |
| |
| |
| |
| | ||||
Unrealized loss for twelve months or longer |
| |
| |
| |
| |
| |
| | ||||
| | $ | | $ | |
| | $ | | $ | | |||||
December 31, 2023 | December 31, 2022 | |||||||||||||||
| Number of |
|
| Unrealized |
| Number of |
|
| Unrealized | |||||||
Securities | Fair Value | Losses | Securities | Fair Value | Losses | |||||||||||
Held to Maturity | ||||||||||||||||
U.S. government agencies: | ||||||||||||||||
Residential mortgage-backed securities: | ||||||||||||||||
Unrealized loss for less than twelve months |
| — | $ | — | $ | — |
| | $ | | $ | | ||||
Unrealized loss for twelve months or longer |
| |
| |
| |
| |
| |
| | ||||
| |
| |
| |
| |
| |
| | |||||
Commercial mortgage-backed securities: | ||||||||||||||||
Unrealized loss for less than twelve months |
| — |
| — |
| — |
| |
| |
| | ||||
Unrealized loss for twelve months or longer |
| |
| |
| |
| |
| |
| | ||||
| |
| |
| |
| |
| |
| | |||||
Collateralized mortgage obligations: | ||||||||||||||||
Unrealized loss for less than twelve months |
| — |
| — |
| — |
| |
| |
| | ||||
Unrealized loss for twelve months or longer |
| |
| |
| |
| |
| |
| | ||||
| |
| |
| |
| |
| |
| | |||||
States and political subdivisions: | ||||||||||||||||
Unrealized loss for less than twelve months |
| | | |
| | | | ||||||||
Unrealized loss for twelve months or longer |
| |
| |
| |
| |
| |
| | ||||
| |
| |
| |
| |
| |
| | |||||
Total held to maturity: | ||||||||||||||||
Unrealized loss for less than twelve months |
| |
| |
| |
| |
| |
| | ||||
Unrealized loss for twelve months or longer |
| |
| |
| |
| |
| |
| | ||||
| | $ | | $ | |
| | $ | | $ | | |||||
F-31
Hilltop Holdings Inc. and Subsidiaries
Notes to Consolidated Financial Statements (continued)
Expected maturities may differ from contractual maturities because certain borrowers may have the right to call or prepay obligations with or without penalties.
Available for Sale | Held to Maturity | |||||||||||
| Amortized |
|
| Amortized |
| |||||||
Cost | Fair Value |
| Cost | Fair Value | ||||||||
Due in one year or less | $ | | $ | | $ | | $ | | ||||
Due after one year through five years |
| |
| |
| |
| | ||||
Due after five years through ten years |
| |
| |
| |
| | ||||
Due after ten years |
| |
| |
| |
| | ||||
| |
| |
| |
| | |||||
Residential mortgage-backed securities |
| |
| |
| |
| | ||||
Commercial mortgage-backed securities |
| |
| |
| |
| | ||||
Collateralized mortgage obligations |
| |
| |
| |
| | ||||
$ | | $ | | $ | | $ | | |||||
During 2023, 2022 and 2021, the Company recognized net gains from its trading portfolio of $
Securities with a carrying amount of $
Mortgage-backed securities and collateralized mortgage obligations consist principally of GNMA, Federal National Mortgage Association (“FNMA”) and Federal Home Loan Mortgage Corporation (“FHLMC”) pass-through and participation certificates. GNMA securities are guaranteed by the full faith and credit of the United States, while FNMA and FHLMC securities are fully guaranteed by those respective United States government-sponsored agencies, and conditionally guaranteed by the full faith and credit of the United States.
5. Loans Held for Investment
The Bank originates loans to customers primarily in Texas. Although the Bank has diversified loan and leasing portfolios and, generally, holds collateral against amounts advanced to customers, its debtors’ ability to honor their contracts is substantially dependent upon the general economic conditions of the region and of the industries in which its debtors operate, which consist primarily of real estate (including construction and land development), wholesale/retail trade, agribusiness and energy. The Hilltop Broker-Dealers make loans to customers and correspondents through transactions originated by both employees and independent retail representatives throughout the United States. The Hilltop Broker-Dealers control risk by requiring customers to maintain collateral in compliance with various regulatory and internal guidelines, which may vary based upon market conditions. Securities owned by customers and held as collateral for loans are not included in the consolidated financial statements.
F-32
Hilltop Holdings Inc. and Subsidiaries
Notes to Consolidated Financial Statements (continued)
Loans held for investment summarized by portfolio segment are as follows (in thousands).
December 31, | ||||||
| 2023 |
| 2022 | |||
Commercial real estate: | ||||||
Non-owner occupied | $ | | $ | | ||
Owner occupied | | | ||||
Commercial and industrial |
| | | |||
Construction and land development |
| | | |||
1-4 family residential | | | ||||
Consumer | | | ||||
Broker-dealer (1) | | | ||||
| |
| | |||
Allowance for credit losses |
| ( | ( | |||
Total loans held for investment, net of allowance | $ | | $ | | ||
| (1) | Primarily represents margin loans to customers and correspondents associated with broker-dealer segment operations. |
Past Due Loans and Non-accrual Loans
An analysis of the aging of the Company’s loan portfolio is shown in the following tables (in thousands).
|
|
|
|
|
|
| Accruing Loans | ||||||||||||||
Loans Past Due | Total Past | Current | Total | Past Due | |||||||||||||||||
December 31, 2023 | 30-59 Days | 60-89 Days | 90 Days or More | Due Loans | Loans | Loans | 90 Days or More | ||||||||||||||
Commercial real estate: | |||||||||||||||||||||
Non-owner occupied | $ | | $ | — | $ | | $ | | $ | | $ | | $ | — | |||||||
Owner occupied |
| | | | | | | — | |||||||||||||
Commercial and industrial | | | | | | | — | ||||||||||||||
Construction and land development |
| | | | | | | — | |||||||||||||
1-4 family residential |
| | | | | | | — | |||||||||||||
Consumer |
| | | | | | | — | |||||||||||||
Broker-dealer |
| — | — | — | — | | | — | |||||||||||||
$ | | $ | | $ | | $ | | $ | | $ | | $ | — | ||||||||
|
|
|
|
|
|
| Accruing Loans | ||||||||||||||
Loans Past Due | Total Past | Current | Total | Past Due | |||||||||||||||||
December 31, 2022 | 30-59 Days | 60-89 Days | 90 Days or More | Due Loans | Loans | Loans | 90 Days or More | ||||||||||||||
Commercial real estate: | |||||||||||||||||||||
Non-owner occupied | $ | | $ | — | $ | | $ | | $ | | $ | | $ | — | |||||||
Owner occupied |
| | | — | | | | — | |||||||||||||
Commercial and industrial | | | | | | | | ||||||||||||||
Construction and land development |
| | — | — | | | | — | |||||||||||||
1-4 family residential |
| | | | | | | | |||||||||||||
Consumer |
| | | | | | | | |||||||||||||
Broker-dealer |
| — | — | — | — | | | — | |||||||||||||
$ | | $ | | $ | | $ | | $ | | $ | | $ | | ||||||||
In addition to the loans shown in the tables above, PrimeLending had $
F-33
Hilltop Holdings Inc. and Subsidiaries
Notes to Consolidated Financial Statements (continued)
The following table provides details associated with non-accrual loans, excluding those classified as held for sale (in thousands).
Non-accrual Loans | ||||||||||||||||||||||||||||
December 31, 2023 | December 31, 2022 | Interest Income Recognized | ||||||||||||||||||||||||||
With | With No | With | With No | Year Ended December 31, | ||||||||||||||||||||||||
Allowance |
| Allowance |
| Total |
| Allowance |
| Allowance |
| Total |
|
| 2023 |
| 2022 |
| 2021 | |||||||||||
Commercial real estate: | ||||||||||||||||||||||||||||
Non-owner occupied | $ | | $ | | $ | | $ | | $ | | $ | | $ | | $ | | $ | | ||||||||||
Owner occupied |
| | | |
| | | | | | | |||||||||||||||||
Commercial and industrial | | | | | | | | | | |||||||||||||||||||
Construction and land development |
| | | |
| | — | | | | | |||||||||||||||||
1-4 family residential |
| | | |
| | | | | | | |||||||||||||||||
Consumer |
| | — | |
| | — | | — | — | ( | |||||||||||||||||
Broker-dealer |
| — | — | — |
| — | — | — | — | — | — | |||||||||||||||||
$ | | $ | | $ | | $ | | $ | | $ | | $ | | $ | | $ | | |||||||||||
At December 31, 2023 and 2022, $
As shown in the table above, loans accounted for on a non-accrual basis increased from December 31, 2022 to December 31, 2023, by $
The Company considers non-accrual loans to be collateral-dependent unless there are underlying mitigating circumstances, such as expected cash flow recovery. The practical expedient to measure the allowance using the fair value of the collateral has been implemented.
Loan Modifications
As previously discussed, as of January 1, 2023, the Company adopted the new guidance which eliminated the recognition and measurement guidance on TDRs for creditors, and requires enhanced disclosures about loan modifications for borrowers experiencing financial difficulty. Loan modifications are typically structured to create affordable payments for the debtor and can be achieved in a variety of ways. The Bank modifies loans by reducing interest rates and/or lengthening loan amortization schedules.
F-34
Hilltop Holdings Inc. and Subsidiaries
Notes to Consolidated Financial Statements (continued)
The following table presents the amortized cost basis of the loans held for investment modified for borrowers experiencing financial difficulty grouped by portfolio segment and type of modification granted during the periods presented (in thousands).
Total | |||||||||||||||
Modifications as a | |||||||||||||||
Interest Rate | Term | Principal | Payment | % of Portfolio | |||||||||||
Year Ended December 31, 2023 | Reduction | Extension | Forgiveness | Delay | Segment | ||||||||||
Commercial real estate: | |||||||||||||||
Non-owner occupied | $ | — | $ | | $ | — | $ | — | | % | |||||
Owner occupied | — | | — | — | | % | |||||||||
Commercial and industrial | | | — | | | % | |||||||||
Construction and land development | — | | — | — | | % | |||||||||
1-4 family residential | — | — | — | — | — | % | |||||||||
Consumer | — | — | — | — | — | % | |||||||||
Broker-dealer | — | — | — | — | — | % | |||||||||
Total | $ | | $ | | $ | — | $ | | | % | |||||
For 2023, there were
For those loans held for investment modified for borrowers experiencing financial difficulty, the following table provides aging and non-accrual details grouped by portfolio segment (in thousands).
Modified Loans Past Due | Total Modified | Modified | |||||||||||||
December 31, 2023 | 30-59 Days | 60-89 Days | 90 Days or More | Past Due Loans | Non-accrual Loans | ||||||||||
Commercial real estate: | |||||||||||||||
Non-owner occupied | $ | | $ | — | $ | — | $ | | $ | | |||||
Owner occupied | — | — | | | | ||||||||||
Commercial and industrial | — | — | — | — | | ||||||||||
Construction and land development | — | — | — | — | | ||||||||||
1-4 family residential | — | — | — | — | — | ||||||||||
Consumer | — | — | — | — | — | ||||||||||
Broker-dealer | — | — | — | — | — | ||||||||||
Total | $ | | $ | — | $ | | $ | | $ | | |||||
The following table presents the financial effects of the loans held for investment modified for borrowers experiencing financial difficulty for the year ended December 31, 2023 (in thousands).
Weighted Average | Weighted Average | |||||
Interest Rate | Term | |||||
Reduction | Extension | |||||
(in bps) | (in months) | |||||
Commercial real estate: | ||||||
Non-owner occupied | — | % | ||||
Owner occupied | — | % | ||||
Commercial and industrial | | % | ||||
Construction and land development | — | % | ||||
1-4 family residential | — | % | — | |||
Consumer | — | % | — | |||
Broker-dealer | — | % | — | |||
Total | | % |
F-35
Hilltop Holdings Inc. and Subsidiaries
Notes to Consolidated Financial Statements (continued)
Troubled Debt Restructurings
Information regarding TDRs granted during 2022 and 2021 that did not qualify for the CARES Act exemption is shown in the following table (dollars in thousands).
Year Ended December 31, 2022 | Year Ended December 31, 2021 | |||||||||||||||
| Number of |
| Balance at |
| Balance at |
| Number of |
| Balance at |
| Balance at | |||||
Loans | Extension | End of Year | Loans | Extension | End of Year | |||||||||||
Commercial real estate: | ||||||||||||||||
Non-owner occupied | — | $ | — | $ | — | — | $ | — | $ | — | ||||||
Owner occupied | | | | |
| |
| | ||||||||
Commercial and industrial | | | | — |
| — |
| — | ||||||||
Construction and land development | — | — | — | — |
| — |
| — | ||||||||
1-4 family residential | — | — | — | — |
| — |
| — | ||||||||
Consumer | — | — | — | — |
| — |
| — | ||||||||
Broker-dealer | — | — | — | — |
| — |
| — | ||||||||
|
| $ | |
| $ | |
| |
| $ | |
| $ | | ||
All of the loan modifications included in the table above involved payment term extensions. The Bank did not grant principal reductions on any restructured loans during 2022 or 2021.
At December 31, 2022 and 2021, the Bank had nominal unadvanced commitments to borrowers whose loans have been restructured in TDRs. There were
The Company granted temporary forbearance to borrowers of a federally backed mortgage loan experiencing financial hardship due, directly or indirectly, to the pandemic. The CARES Act, which among other things, established the ability for financial institutions to grant a forbearance for up to 180 days, which can be extended for an additional 180-day period upon the request of the borrower. During that time, no fees, penalties or interest beyond the amounts scheduled or calculated as if the borrower made all contractual payments on time and in full under the mortgage contract will accrue on the borrower’s account. As of December 31, 2022, PrimeLending had $
F-36
Hilltop Holdings Inc. and Subsidiaries
Notes to Consolidated Financial Statements (continued)
Credit Risk Profile
Management tracks credit quality trends on a quarterly basis related to: (i) past due levels, (ii) non-performing asset levels, (iii) classified loan levels, and (v) general economic conditions in state and local markets. The Company defines classified loans as loans with a risk rating of substandard, doubtful or loss. A description of the risk rating internal grades for commercial loans to is presented in the following table.
Risk Rating | Internal Grade | Risk Rating Description | ||||||||||||
Pass low risk | 1 - 3 | Represents loans to very high credit quality commercial borrowers of investment or near investment grade. These borrowers have significant capital strength, moderate leverage, stable earnings and growth, and readily available financing alternatives. Commercial borrowers entirely cash secured are also included in this category. | ||||||||||||
Pass normal risk | 4 - 7 | Represents loans to commercial borrowers of solid credit quality with moderate risk. Borrowers in these grades are differentiated from higher grades on the basis of size (capital and/or revenue), leverage, asset quality and the stability of the industry or market area. | ||||||||||||
Pass high risk | 8 - 10 | Represents "pass grade" loans to commercial borrowers of higher, but acceptable credit quality and risk. Such borrowers are differentiated from Pass Normal Risk in terms of size, secondary sources of repayment or they are of lesser stature in other key credit metrics. | ||||||||||||
Watch | 11 | Represents loans on management's "watch list" and is intended to be utilized on a temporary basis for pass grade commercial borrowers where a significant risk-modifying action is anticipated in the near term. | ||||||||||||
Special mention | 12 | Represents loans with potential weaknesses that deserve management's close attention. If left uncorrected, these potential weaknesses may result in a deterioration of the repayment prospects for the loans and weaken the Company's credit position at some future date. | ||||||||||||
Substandard accrual | 13 | Represents loans for which the accrual of interest has not been stopped, but are inadequately protected by the current sound worth and paying capacity of the obligor or the collateral pledged, if any. Loans so classified have a well-defined weakness or weaknesses that jeopardize the liquidation of the debt and are characterized by the distinct possibility that the Company will sustain some loss if the deficiencies are not corrected. | ||||||||||||
Substandard non-accrual | 14 | Represents loans for which the accrual of interest has been stopped and includes loans where interest is more than 90 days past due and not fully secured and loans where a specific valuation allowance may be necessary. | ||||||||||||
Doubtful | 15 | Represents loans that are placed on non-accrual status and may be dependent upon collateral having a value that is difficult to determine or upon some near-term event which lacks certainty. | ||||||||||||
Loss | 16 | Represents loans that are to be charged-off or charged-down when payment is acknowledged to be uncertain or when the timing or value of payments cannot be determined. Rating is not intended to imply that the loan or some portion of it will never be paid, nor does it in any way imply that there has been a forgiveness of debt. | ||||||||||||
F-37
Hilltop Holdings Inc. and Subsidiaries
Notes to Consolidated Financial Statements (continued)
The following table presents loans held for investment grouped by asset class and credit quality indicator, segregated by year of origination or renewal (in thousands).
Amortized Cost Basis by Origination Year | Loans | ||||||||||||||||||||||||||
2018 and | Converted to | ||||||||||||||||||||||||||
December 31, 2023 | 2023 | 2022 | 2021 | 2020 | 2019 | Prior | Revolving | Term Loans | Total | ||||||||||||||||||
Commercial real estate: non-owner occupied | |||||||||||||||||||||||||||
Internal Grade 1-3 (Pass low risk) | $ | | $ | | $ | | $ | | $ | | $ | | $ | ( | $ | | $ | | |||||||||
Internal Grade 4-7 (Pass normal risk) | | | | | | | | | |||||||||||||||||||
Internal Grade 8-11 (Pass high risk and watch) | | | | | | | | | | ||||||||||||||||||
Internal Grade 12 (Special mention) | — | — | | — | — | — | — | — | | ||||||||||||||||||
Internal Grade 13 (Substandard accrual) | | | | | | | — | — | | ||||||||||||||||||
Internal Grade 14 (Substandard non-accrual) | | | — | — | | | — | — | | ||||||||||||||||||
Current period gross charge-offs | — | — | — | — | — | | — | — | | ||||||||||||||||||
Commercial real estate: owner occupied | |||||||||||||||||||||||||||
Internal Grade 1-3 (Pass low risk) | $ | | $ | | $ | | $ | | $ | | $ | | $ | | $ | | $ | | |||||||||
Internal Grade 4-7 (Pass normal risk) | | | | | | | | — | | ||||||||||||||||||
Internal Grade 8-11 (Pass high risk and watch) | | | | | | | | — | | ||||||||||||||||||
Internal Grade 12 (Special mention) | — | — | — | — | — | — | — | — | — | ||||||||||||||||||
Internal Grade 13 (Substandard accrual) | | | | | | | | — | | ||||||||||||||||||
Internal Grade 14 (Substandard non-accrual) | | | | — | | | — | — | | ||||||||||||||||||
Current period gross charge-offs | — | — | — | — | — | | — | — | | ||||||||||||||||||
Commercial and industrial | |||||||||||||||||||||||||||
Internal Grade 1-3 (Pass low risk) | $ | | $ | | $ | | $ | | $ | | $ | | $ | | $ | — | $ | | |||||||||
Internal Grade 4-7 (Pass normal risk) | | | | | | | | | | ||||||||||||||||||
Internal Grade 8-11 (Pass high risk and watch) | | | | | | | | | | ||||||||||||||||||
Internal Grade 12 (Special mention) | — | — | — | — | — | — | | — | | ||||||||||||||||||
Internal Grade 13 (Substandard accrual) | | | | | | | | | | ||||||||||||||||||
Internal Grade 14 (Substandard non-accrual) | | | | | — | | | | | ||||||||||||||||||
Current period gross charge-offs | | | | — | | | — | — | | ||||||||||||||||||
Construction and land development | |||||||||||||||||||||||||||
Internal Grade 1-3 (Pass low risk) | $ | | $ | | $ | | $ | — | $ | | $ | | $ | — | $ | — | $ | | |||||||||
Internal Grade 4-7 (Pass normal risk) | | | | | | | | — | | ||||||||||||||||||
Internal Grade 8-11 (Pass high risk and watch) | | | | | | | | | | ||||||||||||||||||
Internal Grade 12 (Special mention) | — | — | — | — | — | — | — | — | — | ||||||||||||||||||
Internal Grade 13 (Substandard accrual) | | | — | — | — | — | — | | | ||||||||||||||||||
Internal Grade 14 (Substandard non-accrual) | | | — | — | — | — | — | — | | ||||||||||||||||||
Current period gross charge-offs | — | — | — | — | — | | — | — | | ||||||||||||||||||
Construction and land development - individuals | |||||||||||||||||||||||||||
FICO less than 620 | $ | — | $ | — | $ | — | $ | — | $ | — | $ | — | $ | — | $ | — | $ | — | |||||||||
FICO between 620 and 720 | | — | — | — | — | | — | — | | ||||||||||||||||||
FICO greater than 720 | | — | | | — | — | — | — | | ||||||||||||||||||
Substandard non-accrual | — | — | — | — | — | — | — | — | — | ||||||||||||||||||
Other (1) | — | — | — | — | — | — | — | — | — | ||||||||||||||||||
Current period gross charge-offs | — | — | — | — | — | — | — | — | — | ||||||||||||||||||
1-4 family residential | |||||||||||||||||||||||||||
FICO less than 620 | $ | — | $ | | $ | | $ | | $ | | $ | | $ | | $ | — | $ | | |||||||||
FICO between 620 and 720 | | | | | | | | | | ||||||||||||||||||
FICO greater than 720 | | | | | | | | | |||||||||||||||||||
Substandard non-accrual | | — | — | — | — | | — | — | | ||||||||||||||||||
Other (1) | | | | | | | | — | | ||||||||||||||||||
Current period gross charge-offs | — | — | — | — | — | | — | — | | ||||||||||||||||||
Consumer | |||||||||||||||||||||||||||
FICO less than 620 | $ | | $ | | $ | | $ | | $ | | $ | | $ | | $ | | $ | | |||||||||
FICO between 620 and 720 | | | | | | | | | | ||||||||||||||||||
FICO greater than 720 | | | | | | — | | | | ||||||||||||||||||
Substandard non-accrual | — | — | — | — | — | | — | — | | ||||||||||||||||||
Other (1) | | | | | | | | — | | ||||||||||||||||||
Current period gross charge-offs | | | | | | | — | — | | ||||||||||||||||||
Total loans with credit quality measures | $ | | $ | | $ | | $ | | $ | | $ | | $ | | $ | | $ | ||||||||||
Commercial and industrial (mortgage warehouse lending) | $ | | |||||||||||||||||||||||||
Commercial and industrial (loans accounted for at fair value) | $ | | |||||||||||||||||||||||||
Broker-dealer (margin loans and correspondent receivables) | $ | | |||||||||||||||||||||||||
Total loans held for investment | $ | ||||||||||||||||||||||||||
(1) Loans classified in this category were assigned a FICO score based on various factors specific to the borrower for credit modeling purposes.
F-38
Hilltop Holdings Inc. and Subsidiaries
Notes to Consolidated Financial Statements (continued)
6. Allowance for Credit Losses
Available for Sale Securities and Held to Maturity Securities
The Company has evaluated available for sale debt securities that are in an unrealized loss position and has determined that any declines in value is unrelated to credit loss and related to changes in market interest rates since purchase.
Loans Held for Investment
The allowance for credit losses for loans held for investment represents management’s best estimate of all expected credit losses over the expected contractual life of the Company’s existing portfolio. Management’s methodology for determining the allowance for credit losses uses the current expected credit losses (“CECL”) standard. Management considers the level of allowance for credit losses to be a reasonable and supportable estimate of expected credit losses inherent within the loans held for investment portfolio as of December 31, 2023. While the Company believes it has an appropriate allowance for the existing loan portfolio at December 31, 2023, additional provision for losses on existing loans may be necessary in the future. Future changes in the allowance for credit losses are expected to be volatile given dependence upon, among other things, the portfolio composition and quality, as well as changes in macroeconomic forecasts and loan cash flow assumptions. In addition to the allowance for credit losses, the Company maintains a separate allowance for credit losses related to off-balance sheet credit exposures, including unfunded loan commitments, and this amount is included in other liabilities within the consolidated balance sheets. For further information on the policies that govern the estimation of the allowances for credit losses levels, see Note 1 to the consolidated financial statements.
One of the most significant judgments involved in estimating the Company’s allowance for credit losses relates to the macroeconomic forecasts used to estimate credit losses over the reasonable and supportable forecast period. To determine the Company’s best estimate of expected credit losses as of December 31, 2023, the Company utilized a single macroeconomic alternative scenario, or S7, published by Moody’s Analytics in December 2023 that was updated to reflect the U.S. economic outlook. This alternative economic scenario expects inflation persistently higher than the baseline as uneven supply chain and labor market conditions continue to reflect the impact of international armed conflicts, tighter lending standards resulting from bank failures earlier in 2023, and still elevated interest rates contribute to a mild U.S recession starting in the first quarter of 2024. Federal Reserve monetary policy maintains the elevated interest rates to a federal funds rate at the baseline target range of
During 2021, the decrease in the allowance reflected improvements in both realized economic results and the macroeconomic outlook and were significantly comprised of net reversals of credit losses on expected losses of collectively evaluated loans of $
F-39
Hilltop Holdings Inc. and Subsidiaries
Notes to Consolidated Financial Statements (continued)
During 2022, the increase in provision for credit losses was driven by a deteriorating U.S. economic outlook since December 31, 2021. The net impact to the allowance of changes associated with collectively evaluated loans included a provision of credit losses of $
During 2023, the increase in provision for credit losses reflected a build in the allowance related to loan portfolio changes since December 31, 2022 and a deteriorating outlook for commercial real estate markets. Specific to the Bank the net impact to the allowance of changes associated with collectively evaluated loans included a provision of credit losses of $
Changes in the allowance for credit losses for loans held for investments, distributed by portfolio segment, are shown below (in thousands).
| Balance, |
| Provision for |
|
| Recoveries on |
| ||||||||
Beginning of | (Reversal of) | Loans | Charged Off | Balance, | |||||||||||
Year Ended December 31, 2023 | Year | Credit Losses | Charged Off | Loans | End of Year | ||||||||||
Commercial real estate: | |||||||||||||||
Non-owner occupied | $ | | $ | | $ | ( | $ | | $ | | |||||
Owner occupied | | | ( | | | ||||||||||
Commercial and industrial |
| | | ( | |
| | ||||||||
Construction and land development |
| | | ( | — |
| | ||||||||
1-4 family residential |
| | | ( | |
| | ||||||||
Consumer | | | ( | | | ||||||||||
Broker-dealer | | ( | — | — | | ||||||||||
Total | $ | | $ | | $ | ( | $ | | $ | | |||||
| Balance, |
| Provision for |
|
| Recoveries on |
| ||||||||
Beginning of | (Reversal of) | Loans | Charged Off | Balance, | |||||||||||
Year Ended December 31, 2022 | Year | Credit Losses | Charged Off | Loans | End of Year | ||||||||||
Commercial real estate: | |||||||||||||||
Non-owner occupied | $ | | $ | | $ | — | $ | | $ | | |||||
Owner occupied | | | — | | | ||||||||||
Commercial and industrial |
| | ( | ( | |
| | ||||||||
Construction and land development |
| | | — | — |
| | ||||||||
1-4 family residential |
| | | ( | |
| | ||||||||
Consumer | | | ( | | | ||||||||||
Broker-dealer | | | — | — | | ||||||||||
Total | $ | | $ | | $ | ( | $ | | $ | | |||||
| Balance, |
| Provision for |
|
| Recoveries on |
| ||||||||
Beginning of | (Reversal of) | Loans | Charged Off | Balance, | |||||||||||
Year Ended December 31, 2021 | Year | Credit Losses | Charged Off | Loans | End of Year | ||||||||||
Commercial real estate: | |||||||||||||||
Non-owner occupied | $ | | $ | ( | $ | — | $ | | $ | | |||||
Owner occupied | | ( | ( | | | ||||||||||
Commercial and industrial |
| | ( | ( | |
| | ||||||||
Construction and land development |
| | ( | — | — |
| | ||||||||
1-4 family residential |
| | | ( | |
| | ||||||||
Consumer | | ( | ( | | | ||||||||||
Broker-dealer | | ( | — | — | | ||||||||||
Total | $ | | $ | ( | $ | ( | $ | | $ | | |||||
F-40
Hilltop Holdings Inc. and Subsidiaries
Notes to Consolidated Financial Statements (continued)
Unfunded Loan Commitments
The Bank uses a process similar to that used in estimating the allowance for credit losses on the funded portion to estimate the allowance for credit loss on unfunded loan commitments. The allowance is based on the estimated exposure at default, multiplied by the lifetime PD grade and LGD grade for that particular loan segment. The Bank estimates expected losses by calculating a commitment usage factor based on industry usage factors. The commitment usage factor is applied over the relevant contractual period. Loss factors from the underlying loans to which commitments are related are applied to the results of the usage calculation to estimate any liability for credit losses related for each loan type. The expected losses on unfunded commitments align with statistically calculated parameters used to calculate the allowance for credit losses on the funded portion. There is no reserve calculated for letters of credit as they are issued primarily as credit enhancements and the likelihood of funding is low.
Changes in the allowance for credit losses for loans with off-balance sheet credit exposures are shown below (in thousands).
Year Ended December 31, | ||||||||
2023 |
| 2022 |
| 2021 | ||||
Balance, beginning of year | $ | | $ | | $ | | ||
Other noninterest expense | | | ( | |||||
Balance, end of year | $ | | $ | | $ | | ||
During 2021, the decrease in the allowance for unfunded commitments was primarily due to improvements in loan expected loss rates. During 2022, the increase in the allowance for unfunded commitments was due to increases in both loan expected loss rates and available commitment balances, while during 2023, the increase in the allowance for unfunded commitments was primarily due to increases in loan expected loss rates.
7. Cash and Due from Banks
Cash and due from banks consisted of the following (in thousands).
| December 31, | |||||
| 2023 |
| 2022 | |||
Cash on hand | $ | | $ | | ||
Clearings and collection items |
| |
| | ||
Deposits at Federal Reserve Bank |
| |
| | ||
Deposits at Federal Home Loan Bank |
| |
| | ||
Deposits in FDIC-insured institutions |
| |
| | ||
$ | | $ | | |||
The amounts above include interest-bearing deposits of $
8. Premises and Equipment
The components of premises and equipment are summarized as follows (in thousands).
December 31, |
| ||||||
| 2023 |
| 2022 |
| |||
Land and premises | $ | | $ | | |||
Furniture and equipment |
| |
| | |||
| |
| | ||||
Less accumulated depreciation and amortization |
| ( |
| ( | |||
$ | | $ | | ||||
F-41
Hilltop Holdings Inc. and Subsidiaries
Notes to Consolidated Financial Statements (continued)
The amounts shown above include gross assets recorded under finance leases of $
Occupancy expense was reduced by rental income of $
9. Goodwill and Other Intangible Assets
At December 31, 2023, the carrying amount of goodwill of $
Other intangible assets were $
The Company performed required annual impairment tests of its goodwill and other intangible assets having an indefinite useful life as of October 1st for each of its reportable business segments. At October 1, 2023, the Company determined that the estimated fair value of goodwill for each of its business segments and other intangible assets exceeded their carrying values. The Company estimated the fair values of goodwill for its business segments based on both a market and income approach using historical, normalized actual and forecasted results, taking into consideration the amount by which fair value exceeded book value and sensitivities performed. Based on this evaluation, at December 31, 2023, the Company concluded that the goodwill and other identifiable intangible assets were fully realizable.
The Company’s evaluation includes multiple assumptions, including estimated discounted cash flows and other estimates that may change over time. If future discounted cash flows become less than those projected by the Company, future non-cash impairment charges may become necessary that could have a materially adverse impact on the Company’s results of operations and financial condition. Such a charge would have no impact on tangible capital or regulatory capital. As quoted market prices in active stock markets are relevant evidence of fair value, a significant decline in the Company’s common stock trading price may indicate an impairment of goodwill.
In light of the recent and continuing macroeconomic challenges in the mortgage industry given tight housing inventories and mortgage interest rate levels, the mortgage origination segment did not meet forecasted operating projections, the Company identified these collective factors as a triggering event during the second quarter of 2023. As a result, the Company performed an interim quantitative impairment test on the mortgage origination segment’s goodwill as of June 1, 2023 using revised forecasts and considering sensitivities of assumptions, and the decline in its carrying value, concluded that it was more likely than not that the mortgage origination segment’s estimated fair value of goodwill exceeded its carrying value. Subsequently, the mortgage origination segment continued to experience lower-than-forecasted operating results during the remainder of 2023 due to conditions and challenges noted above. Additionally, while the broker-dealer segment experienced higher-than-forecasted operating results during 2023 primarily driven by the combined impacts of the rising interest rate environment and a more favorable housing environment in certain areas of the country, continuing macroeconomic challenges related to mortgage loan origination volumes, customer sensitivity to interest rates and resulting demand for certain products have resulted in a challenging environment associated with the broker-dealer segment’s short- and long-term financial condition, resulting in variability in its operating results.
To the extent future operating performance of the Company’s reporting segments remain challenged and below forecasted projections during 2024, significant assumptions such as expected future cash flows or the risk-adjusted discount rate used to estimate fair value are adversely impacted, or upon the occurrence of what management would deem to be a triggering event that could, under certain circumstances, cause the Company to perform impairment tests on its goodwill and other intangible assets, an impairment charge may be recorded for that period.
F-42
Hilltop Holdings Inc. and Subsidiaries
Notes to Consolidated Financial Statements (continued)
While certain valuation assumptions and judgments may change to account for operating performance of the reporting segments and overall economic conditions, the Company does not anticipate significant changes in methodology used to determine the fair value of its goodwill, intangible assets and other long-lived assets. The Company will continue to monitor developments regarding future operating performance of its business segments, overall economic conditions, market capitalization, and any other triggering events or circumstances that may indicate an impairment in the future.
The carrying value of intangible assets subject to amortization was as follows (in thousands).
| Estimated |
| Gross |
|
| Net |
| |||||||
Useful Life | Intangible | Accumulated | Intangible |
| ||||||||||
December 31, 2023 | (Years) | Assets | Amortization | Assets |
| |||||||||
Core deposits |
| - | $ | | $ | ( | $ | | ||||||
Trademarks and trade names |
|
|
| |
| ( |
| | ||||||
Customer contracts and relationships |
| - |
| |
| ( |
| | ||||||
$ | | $ | ( | $ | | |||||||||
| Estimated |
| Gross |
|
| Net |
| |||||||
Useful Life | Intangible | Accumulated | Intangible |
| ||||||||||
December 31, 2022 | (Years) | Assets | Amortization | Assets |
| |||||||||
Core deposits |
| - | $ | | $ | ( | $ | | ||||||
Trademarks and trade names |
|
| |
| ( |
| | |||||||
Customer contracts and relationships |
| - |
| |
| ( |
| | ||||||
$ | | $ | ( | $ | | |||||||||
Amortization expense related to intangible assets during 2023, 2022 and 2021 was $
2024 | $ | |
2025 |
| |
2026 |
| |
2027 |
| |
2028 |
| |
Thereafter |
| |
$ | |
10. Mortgage Servicing Rights
The following tables present the changes in fair value of the Company’s MSR asset and other information related to the serviced portfolio (dollars in thousands).
Year Ended December 31, | ||||||||
2023 | 2022 | 2021 | ||||||
Balance, beginning of year | $ | | $ | | $ | | ||
Additions |
| |
| |
| | ||
Sales |
| ( |
| ( |
| ( | ||
Changes in fair value: |
| |||||||
Due to changes in model inputs or assumptions (1) |
| ( |
| |
| | ||
Due to customer payoffs |
| ( |
| ( |
| ( | ||
Balance, end of year | $ | | $ | | $ | | ||
F-43
Hilltop Holdings Inc. and Subsidiaries
Notes to Consolidated Financial Statements (continued)
December 31, | ||||||||
2023 | 2022 | |||||||
Mortgage loans serviced for others (2) | $ | | $ | | ||||
MSR asset as a percentage of serviced mortgage loans |
| | % |
| | % |
| |
| (1) | Primarily represents normal customer payments, the impact of changes in interest rates, changes in discount rates and prepayment speed assumptions, and the refinement of other MSR model assumptions. Included in 2022 and 2021 are MSR asset fair value adjustments totaling losses of $ |
| (2) | Represents unpaid principal balance of mortgage loans serviced for others. |
The key assumptions used in measuring the fair value of the Company’s MSR asset were as follows.
December 31, | ||||||
2023 |
| 2022 | ||||
Weighted average constant prepayment rate | | % | | % | ||
Weighted average discount rate | | % | | % | ||
Weighted average life (in years) | ||||||
A sensitivity analysis of the fair value of the Company’s MSR asset to certain key assumptions is presented in the following table (in thousands).
December 31, | |||||
2023 |
| 2022 | |||
Constant prepayment rate: | |||||
Impact of 10% adverse change | $ | ( | $ | ( | |
Impact of 20% adverse change |
| ( |
| ( | |
Discount rate: | |||||
Impact of 10% adverse change |
| ( |
| ( | |
Impact of 20% adverse change |
| ( |
| ( | |
This sensitivity analysis presents the effect of hypothetical changes in key assumptions on the fair value of the MSR asset. The effect of such hypothetical changes in assumptions generally cannot be extrapolated because the relationship of the change in one key assumption to the change in the fair value of the MSR asset is not linear. In addition, in the analysis, the impact of an adverse change in one key assumption is calculated independent of any impact on other assumptions. In reality, changes in one assumption may change another assumption.
Contractually specified servicing fees, late fees and ancillary fees earned of $
11. Deposits
Deposits are summarized as follows (in thousands).
December 31, |
| ||||||
2023 |
| 2022 |
| ||||
Noninterest-bearing demand | $ | | $ | | |||
Interest-bearing: | |||||||
Demand accounts |
| |
| | |||
Brokered - demand |
| |
| | |||
Money market |
| |
| | |||
Brokered - money market |
| |
| | |||
Savings |
| |
| | |||
Time |
| |
| | |||
Brokered - time |
| |
| — | |||
$ | | $ | | ||||
F-44
Hilltop Holdings Inc. and Subsidiaries
Notes to Consolidated Financial Statements (continued)
At December 31, 2023, remaining maturities of estimated uninsured time deposits greater than $250,000 were $
2024 |
| $ | | |
2025 |
| | ||
2026 |
| | ||
2027 |
| | ||
2028 and thereafter |
| | ||
$ | |
12. Short-term Borrowings
Short-term borrowings are summarized as follows (in thousands).
| December 31, | |||||
| 2023 |
| 2022 | |||
Federal funds purchased | $ | | $ | | ||
Securities sold under agreements to repurchase |
| |
| | ||
Federal Home Loan Bank |
| — |
| — | ||
Short-term bank loans | — | | ||||
Commercial paper |
| |
| | ||
$ | | $ | | |||
Federal Funds Purchased and Securities Sold under Agreements to Repurchase
Federal funds purchased and securities sold under agreements to repurchase generally mature to
Information concerning federal funds purchased and securities sold under agreements to repurchase is shown in the following tables (dollars in thousands).
Year Ended December 31, |
| |||||||||
2023 | 2022 |
| 2021 |
| ||||||
Average balance during the year | $ | | $ | | $ | | ||||
Average interest rate during the year |
| | % | | % |
| | % | ||
Maximum month-end balance during the year | $ | | $ | | $ | | ||||
December 31, | ||||||||||
2023 |
| 2022 |
| |||||||
Average interest rate at end of year | | % | | % | ||||||
Securities underlying the agreements at end of year: | ||||||||||
Carrying value | $ | | $ | | ||||||
Estimated fair value | $ | | $ | | ||||||
Federal Home Loan Bank (“FHLB”)
FHLB short-term borrowings mature over terms not exceeding
F-45
Hilltop Holdings Inc. and Subsidiaries
Notes to Consolidated Financial Statements (continued)
available collateral of $
Year Ended December 31, | ||||||||||
2023 | 2022 | 2021 | ||||||||
Average balance during the year | $ | | $ | — | $ | — | ||||
Average interest rate during the year | | % | — | % | — | % | ||||
Maximum month-end balance during the year | $ | | $ | — | $ | — | ||||
December 31, | ||||||||||
2023 | 2022 | |||||||||
Average interest rate at end of year | — | % | — | % | ||||||
Short-Term Bank Loans
The Hilltop Broker-Dealers use short-term bank loans periodically to finance securities owned, margin loans to customers and correspondents, and underwriting activities. Interest on the borrowings varies with the federal funds rate. There were
Commercial Paper
Hilltop Securities uses the net proceeds (after deducting related issuance expenses) from the sale of
13. Notes Payable
Notes payable consisted of the following (in thousands).
December 31, | ||||||
| 2023 |
| 2022 | |||
Senior Notes due April 2025, net of discount of $ | $ | | $ | | ||
Subordinated Notes due May 2030, net of discount of $ |
| |
| | ||
Subordinated Notes due May 2035, net of discount of $ |
| |
| | ||
Ventures Management lines of credit | — | — | ||||
$ | | $ | | |||
Senior Notes
On April 9, 2015, Hilltop completed an offering of $
F-46
Hilltop Holdings Inc. and Subsidiaries
Notes to Consolidated Financial Statements (continued)
proceeds from the offering, after deducting estimated fees and expenses and the initial purchasers’ discounts, were approximately $
In connection with the issuance of the Senior Unregistered Notes, on April 9, 2015, the Company entered into a registration rights agreement with the initial purchasers of the Senior Unregistered Notes. Under the terms of the registration rights agreement, the Company agreed to offer to exchange the Senior Unregistered Notes for notes registered under the Securities Act (the “Senior Registered Notes”). The terms of the Senior Registered Notes are substantially identical to the Senior Unregistered Notes for which they were exchanged (including principal amount, interest rate, maturity and redemption rights), except that the Senior Registered Notes generally are not subject to transfer restrictions. On May 22, 2015 and subject to the terms and conditions set forth in the Senior Registered Notes prospectus, the Company commenced an offer to exchange the Senior Unregistered Notes for Senior Registered Notes. Substantially all of the Senior Unregistered Notes were tendered in the exchange offer, and on June 22, 2015, the Company fulfilled its requirements under the registration rights agreement for the Senior Unregistered Notes by issuing Senior Registered Notes in exchange for the tendered Senior Unregistered Notes. The Senior Registered Notes and the Senior Unregistered Notes that remain outstanding are collectively referred to as the “Senior Notes.”
The Senior Notes bear interest at a rate of
The indenture contains covenants that limit the Company’s ability to, among other things and subject to certain significant exceptions: (i) dispose of or issue voting stock of certain of the Company’s bank subsidiaries or subsidiaries that own voting stock of the Company’s bank subsidiaries, (ii) incur or permit to exist any mortgage, pledge, encumbrance or lien or charge on the capital stock of certain of the Company’s bank subsidiaries or subsidiaries that own capital stock of the Company’s bank subsidiaries and (iii) sell all or substantially all of the Company’s assets or merge or consolidate with or into other companies. The indenture also provides for certain events of default, which, if any of them occurs, would permit or require the principal amount, premium, if any, and accrued and unpaid interest on the then outstanding Senior Notes to be declared immediately due and payable.
Subordinated Notes
On May 7, 2020, Hilltop completed a public offering of $
The 2030 Subordinated Notes and the 2035 Subordinated Notes will mature on May 15, 2030 and May 15, 2035, respectively. Hilltop may redeem the Subordinated Notes, in whole or in part, from time to time, subject to obtaining regulatory approval, beginning with the interest payment date of May 15, 2025 for the 2030 Subordinated Notes and beginning with the interest payment date of May 15, 2030 for the 2035 Subordinated Notes, in each case at a redemption price equal to
The 2030 Subordinated Notes bear interest at the rate of
F-47
Hilltop Holdings Inc. and Subsidiaries
Notes to Consolidated Financial Statements (continued)
an interest rate, per year, equal to the then-current benchmark rate, which is expected to be three-month term Secured Overnight Financing Rate (“SOFR rate”), plus
Federal Home Loan Bank notes
The FHLB notes, as well as other borrowings from the FHLB, are collateralized by FHLB stock, a blanket lien on commercial and real estate loans, as well as by the amount of securities that are in safekeeping at the FHLB.
Ventures Management Lines of Credit
At December 31, 2023, Ventures Management’s ABAs had combined available lines of credit totaling $
Scheduled Maturities
Scheduled maturities for notes payable outstanding at December 31, 2023 are as follows (in thousands).
2024 | $ | — |
2025 |
| |
2026 |
| — |
2027 |
| — |
2028 |
| — |
Thereafter |
| |
$ | |
14. Leases
Hilltop and its subsidiaries lease space, primarily for corporate offices, branch facilities and automated teller machines, under both operating and finance leases. Certain of the Company’s leases have options to extend, with the longest
Supplemental balance sheet information related to finance leases is as follows (in thousands).
December 31, | ||||||
2023 | 2022 | |||||
Finance leases: | ||||||
Premises and equipment | $ | | $ | | ||
Accumulated depreciation | ( | ( | ||||
Premises and equipment, net | $ | | $ | | ||
F-48
Hilltop Holdings Inc. and Subsidiaries
Notes to Consolidated Financial Statements (continued)
Operating lease rental cost and finance lease amortization of ROU assets is included within occupancy and equipment, net in the consolidated statements of operations. Finance lease interest expense is included within other interest expense in the consolidated statements of operations. The Company does not generally enter into leases which contain variable payments, other than due to the passage of time
Year Ended December 31, | |||||||||
2023 | 2022 | 2021 | |||||||
Operating lease cost | $ | | $ | | $ | | |||
Less operating lease and sublease income | ( | ( | ( | ||||||
Net operating lease cost | $ | | $ | | $ | | |||
Finance lease cost: | |||||||||
Amortization of ROU assets | $ | | $ | | $ | | |||
Interest on lease liabilities | | | | ||||||
Total finance lease cost | $ | | $ | | $ | | |||
Supplemental cash flow information related to leases is as follows (in thousands).
Year Ended December 31, | |||||||||
2023 | 2022 | 2021 | |||||||
Cash paid for amounts included in the measurement of lease liabilities: | |||||||||
Operating cash flows from operating leases | $ | | $ | | $ | | |||
Operating cash flows from finance leases | | | | ||||||
Financing cash flows from finance leases | | | | ||||||
Right-of-use assets obtained in exchange for lease obligations: | |||||||||
Operating leases | $ | | $ | | $ | | |||
Finance leases | — | — | — | ||||||
Information regarding the lease terms and discount rates of the Company’s leases is as follows.
December 31, 2023 | December 31, 2022 | |||||||||
Weighted Average | Weighted Average | |||||||||
Remaining Lease | Weighted Average | Remaining Lease | Weighted Average | |||||||
Lease Classification |
| Term (Years) | Discount Rate | Term (Years) | Discount Rate | |||||
Operating | % | % | ||||||||
Finance | % | % | ||||||||
Future minimum lease payments, under lease agreements as of December 31, 2023, are presented below (in thousands).
Operating Leases | Finance Leases | ||||
2024 | $ | | $ | | |
2025 | | | |||
2026 | | | |||
2027 | | | |||
2028 | | | |||
Thereafter | | — | |||
Total minimum lease payments | | | |||
Less amount representing interest | ( | ( | |||
$ | | $ | | ||
As of December 31, 2023, the Company had additional operating leases that have not yet commenced with aggregate future minimum lease payments of approximately $
F-49
Hilltop Holdings Inc. and Subsidiaries
Notes to Consolidated Financial Statements (continued)
15. Income Taxes
The significant components of the income tax provision are as follows (in thousands).
Year Ended December 31, | |||||||||
| 2023 |
| 2022 |
| 2021 | ||||
Current: | |||||||||
Federal | $ | | $ | | $ | | |||
State |
| | | | |||||
| | | | ||||||
Deferred: | |||||||||
Federal | $ | | $ | | $ | ( | |||
State |
| | | ( | |||||
| | | ( | ||||||
$ | | $ | | $ | | ||||
The income tax provision differs from the amount that would be computed by applying the statutory federal income tax rate to income before income taxes as a result of the following (in thousands). The applicable corporate federal income tax rates were
Year Ended December 31, |
| |||||||||
| 2023 |
| 2022 |
| 2021 |
| ||||
Computed tax at federal statutory rate | $ | | $ | | $ | | ||||
Tax effect of: | ||||||||||
Nondeductible expenses | |
| | | ||||||
Compensation limitation | |
| | | ||||||
State income taxes |
| |
| | | |||||
Tax-exempt income, net |
| ( |
| ( | ( | |||||
Minority interest |
| ( |
| ( | ( | |||||
Other | ( |
| ( | ( | ||||||
$ | | $ | | $ | | |||||
The components of the tax effects of temporary differences that give rise to the net deferred tax asset included in other assets within the consolidated balance sheets are as follows (in thousands).
December 31, |
| ||||||
| 2023 |
| 2022 |
| |||
Deferred tax assets: | |||||||
Net operating and built-in loss carryforward | $ | | $ | | |||
Purchase accounting adjustment - loans |
| | | ||||
Allowance for credit losses |
| | | ||||
Compensation and benefits |
| | | ||||
Legal and other reserves |
| | | ||||
Net unrealized losses on securities and other investments | | | |||||
Operating lease liabilities |
| | | ||||
Other | | | |||||
| |
| | ||||
Deferred tax liabilities: | |||||||
Premises and equipment |
| | | ||||
Intangible assets |
| | | ||||
Derivatives |
| | | ||||
Loan servicing |
| | | ||||
Operating lease ROU assets |
| | | ||||
Deferred loan fees |
| | | ||||
Other |
| | | ||||
| |
| | ||||
Net deferred tax asset | $ | | $ | | |||
F-50
Hilltop Holdings Inc. and Subsidiaries
Notes to Consolidated Financial Statements (continued)
The Company’s effective tax rate was
At December 31, 2023, the Company had
Based on the Company’s evaluation of its deferred tax assets, management determined that
GAAP requires the measurement of uncertain tax positions. Uncertain tax positions are the difference between a tax position taken, or expected to be taken, in a tax return and the benefit recognized for accounting purposes. At December 31, 2023 and 2022, the total amount of gross unrecognized tax benefits was $
The aggregate changes in gross unrecognized tax benefits, which excludes interest and penalties, are as follows (in thousands).
Year Ended December 31, |
| |||||||||
| 2023 |
| 2022 |
| 2021 |
| ||||
Balance, beginning of year | $ | | $ | | $ | | ||||
Increases related to tax positions taken during a prior year |
| — | — | | ||||||
Decreases related to tax positions taken during a prior year |
| ( | ( | — | ||||||
Increases related to tax positions taken during the current year | | | | |||||||
Decreases related to expiration of the statute of limitations | ( | ( | ( | |||||||
Balance, end of year | $ | | $ | | $ | | ||||
Specific positions that may be resolved include issues involving apportionment and tax credits. At December 31, 2023, the unrecognized tax benefit is a component of taxes receivable, which is included in other assets within the consolidated balance sheet.
The Company files income tax returns in U.S. federal and numerous state jurisdictions. The Company is subject to tax examinations in numerous jurisdictions in the United States until the applicable statute of limitations expires. The Company is no longer subject to U.S. federal tax examinations for tax years prior to 2020. The Company is open for various state tax examinations for tax years 2019 and later.
16. Employee Benefits
Hilltop and its subsidiaries have benefit plans that provide for elective deferrals by employees under Section 401(k) of the Internal Revenue Code. Employee contributions are determined by the level of employee participation and related salary levels per Internal Revenue Service regulations. Hilltop and its subsidiaries match a portion of employee contributions based on the amount of eligible employees’ contributions and salaries. The amount charged to operating expense for these matching contributions totaled $
In July 2020, pursuant to stockholders’ approval, the Company adopted the Hilltop Holdings Inc. Employee Stock Purchase Plan (the “ESPP”) to provide a means for eligible employees of the Company to purchase shares of Hilltop common stock at a discounted price by accumulating funds, normally through payroll deductions and is intended to
F-51
Hilltop Holdings Inc. and Subsidiaries
Notes to Consolidated Financial Statements (continued)
qualify under Section 423 of the Internal Revenue Code. Participating employees may purchase shares of common stock at
Effective upon the completion of the PlainsCapital Merger, the Company recorded a liability associated with separate retention agreements originally entered into between Hilltop and
The Bank purchased $
Deferred Compensation Plan
As a result of the SWS Merger, the Company assumed a deferred compensation plan (the “SWS Plan”) that allowed former SWS eligible officers and employees to defer a portion of their bonus compensation and commissions. The SWS Plan was formally terminated in September 2022 with scheduled liquidation and distributions to participants no later than August 2024. The SWS Plan matched
The assets of the SWS Plan are held in a rabbi trust and primarily include investments in company-owned life insurance (“COLI”) and Hilltop common stock. These assets are consolidated with those of the Company. Investments in COLI are carried at the cash surrender value of the insurance policies and recorded in other assets within the consolidated balance sheet at December 31, 2023 and 2022. Investments in Hilltop common stock, which are carried at cost, and the corresponding liability related to the deferred compensation plan are presented as components of stockholders’ equity as employee stock trust and deferred compensation employee stock trust, net, at December 31, 2023 and 2022.
17. Related Party Transactions
Jeremy B. Ford, a director and the President and Chief Executive Officer of Hilltop, is the beneficiary of a trust that owns a
Jeremy B. Ford is the son of Gerald J. Ford. Corey G. Prestidge, Hilltop’s General Counsel and Secretary, is the son-in-law of Gerald J. Ford. Accordingly, Messrs. Jeremy Ford and Corey Prestidge are brothers-in-law.
In the ordinary course of business, the Bank has granted loans to certain directors, executive officers and their affiliates (collectively referred to as related parties) totaling $
At December 31, 2023 and 2022, the Bank held deposits of related parties of $
A related party is the lessor in an operating lease with Hilltop. Hilltop’s minimum payment under the lease is currently $
F-52
Hilltop Holdings Inc. and Subsidiaries
Notes to Consolidated Financial Statements (continued)
The Bank purchased loans from a company for which a related party served as a director, president and chief executive officer. At December 31, 2023, the outstanding balance of the purchased loans were paid off, while at December 31, 2022, the outstanding balance was $
Hilltop Plaza Investment
On July 31, 2018, Hillcrest Land LLC purchased approximately
In connection with the purchase of the land, Hillcrest Land LLC entered into a
Concurrent with the ground lease, the Co-Owners entered into an agreement to purchase the improvements of a mixed-use project containing a six-story building (“Hilltop Plaza”). HTH Project LLC and Hillcrest each own an undivided
Hilltop and the Bank entered into separate office leases with an accounting commencement date of for a significant portion of the total rentable corporate office space in Hilltop Plaza, which serves as the headquarters for both companies.
All intercompany transactions associated with the Hilltop Plaza investment and the related transactions discussed above are eliminated in consolidation.
18. Commitments and Contingencies
During 2023, the Bank acted as agent on behalf of certain correspondent banks in the purchase and sale of federal funds. At December 31, 2023 and 2022, the Bank did
Legal Matters
The Company is subject to loss contingencies related to litigation, claims, investigations and legal and administrative cases and proceedings arising in the ordinary course of business. The Company evaluates these contingencies based on information currently available, including advice of counsel. The Company establishes accruals for those matters when a loss contingency is considered probable and the related amount is reasonably estimable. Any accruals are periodically reviewed and may be adjusted as circumstances change. A portion of the Company’s exposure with respect to loss
F-53
Hilltop Holdings Inc. and Subsidiaries
Notes to Consolidated Financial Statements (continued)
contingencies may be offset by applicable insurance coverage. In determining the amounts of any accruals or estimates of possible loss contingencies, the Company does not take into account the availability of insurance coverage. When it is practicable, the Company estimates loss contingencies for possible litigation and claims, whether or not there is an accrued probable loss. When the Company is able to estimate such probable losses, and when it estimates that it is reasonably possible it could incur losses in excess of amounts accrued, the Company is required to make a disclosure of the aggregate estimation. As available information changes, however, the matters for which the Company is able to estimate, as well as the estimates themselves, will be adjusted accordingly.
Assessments of litigation and claims exposures are difficult due to many factors that involve inherent unpredictability. Those factors include the following: the varying stages of the proceedings, particularly in the early stages; unspecified, unsupported, or uncertain damages; damages other than compensatory, such as punitive damages; a matter presenting meaningful legal uncertainties, including novel issues of law; multiple defendants and jurisdictions; whether discovery has begun or is complete; whether meaningful settlement discussions have commenced; and whether the claim involves a class action and if so, how the class is defined. As a result of some of these factors, the Company may be unable to estimate reasonably possible losses with respect to some or all of the pending and threatened litigation and claims asserted against the Company.
The Company is involved in information-gathering requests and investigations (both formal and informal), as well as reviews, examinations and proceedings (collectively, “Inquiries”) by various governmental regulatory agencies, law enforcement authorities and self-regulatory bodies regarding certain of its businesses, business practices and policies, as well as the conduct of persons with whom it does business. Additional Inquiries will arise from time to time. In connection with those Inquiries, the Company receives document requests, subpoenas and other requests for information. The Inquiries could develop into administrative, civil or criminal proceedings or enforcement actions that could result in consequences that have a material effect on the Company's consolidated financial position, results of operations or cash flows as a whole. Such consequences could include adverse judgments, findings, settlements, penalties, fines, orders, injunctions, restitution, or alterations in the Company’s business practices, and could result in additional expenses and collateral costs, including reputational damage.
On June 8, 2022, WR Investments, LP (“WR”) filed claims against Hilltop Securities, et al. through FINRA Dispute Resolution, Midwest Region. WR alleges it suffered a $
In September 2020, PrimeLending received an investigative inquiry from the United States Attorney for the Western District of Virginia regarding PrimeLending’s float down option. The United States Attorney has issued grand jury subpoenas to PrimeLending and PlainsCapital Bank for additional materials regarding this matter. PrimeLending has, and PrimeLending and PlainsCapital Bank will, cooperate with requests for information with respect to this matter.
While the final outcome of litigation and claims exposures or of any Inquiries is inherently unpredictable, management is currently of the opinion that the outcome of pending and threatened litigation and Inquiries will not, except related to specific matters disclosed above, have a material effect on the Company’s business, consolidated financial position, results of operations or cash flows as a whole. However, in the event of unexpected future developments, it is reasonably possible that an adverse outcome in any matter, including the matters discussed above, could be material to the Company’s business, consolidated financial position, results of operations or cash flows for any particular reporting period of occurrence.
Indemnification Liability Reserve
The mortgage origination segment may be responsible to agencies, investors, or other parties for errors or omissions relating to its representations and warranties that each loan sold meets certain requirements, including representations as to underwriting standards and the validity of certain borrower representations in connection with the loan. If determined to
F-54
Hilltop Holdings Inc. and Subsidiaries
Notes to Consolidated Financial Statements (continued)
be at fault, the mortgage origination segment either repurchases the affected loan from or indemnifies the claimant against loss. The mortgage origination segment has established an indemnification liability reserve for such probable losses.
Generally, the mortgage origination segment first becomes aware that an agency, investor, or other party believes a loss has been incurred on a sold loan when it receives a written request from the claimant to repurchase the loan or reimburse the claimant’s losses. Upon completing its review of the claimant’s request, the mortgage origination segment establishes a specific claims reserve for the loan if it concludes its obligation to the claimant is both probable and reasonably estimable.
An additional reserve has been established for probable agency, investor or other party losses that may have been incurred, but not yet reported to the mortgage origination segment based upon a reasonable estimate of such losses. Factors considered in the calculation of this reserve include, but are not limited to, the total volume of loans sold exclusive of specific claimant requests, actual claim settlements and the severity of estimated losses resulting from future claims, and the mortgage origination segment’s history of successfully curing defects identified in claim requests.
While the mortgage origination segment’s sales contracts typically include borrower early payment default repurchase provisions, these provisions have not been a primary driver of claims to date, and therefore, are not a primary factor considered in the calculation of this reserve.
At December 31, 2023 and 2022, the mortgage origination segment’s indemnification liability reserve totaled $
The following tables provide for a rollforward of claims activity for loans put-back to the mortgage origination segment based upon an alleged breach of a representation or warranty with respect to a loan sold and related indemnification liability reserve activity (in thousands).
Representation and Warranty Specific Claims |
| ||||||||
Activity - Origination Loan Balance |
| ||||||||
Year Ended December 31, |
| ||||||||
2023 |
| 2022 |
| 2021 |
| ||||
Balance, beginning of year | $ | | $ | | $ | | |||
Claims made |
| |
| |
| | |||
Claims resolved with no payment |
| ( |
| ( |
| ( | |||
Repurchases |
| ( |
| ( |
| ( | |||
Indemnification payments |
| ( |
| — |
| ( | |||
Balance, end of year | $ | | $ | | $ | | |||
Indemnification Liability Reserve Activity |
| ||||||||
Year Ended December 31, |
| ||||||||
2023 |
| 2022 |
| 2021 |
| ||||
Balance, beginning of year | $ | | $ | | $ | | |||
Additions for new sales |
| |
| |
| | |||
Repurchases |
| ( |
| ( |
| ( | |||
Early payment defaults |
| ( |
| ( |
| ( | |||
Indemnification payments |
| ( |
| — |
| ( | |||
Change in reserves for loans sold in prior years |
| — |
| ( |
| ( | |||
Balance, end of year | $ | | $ | | $ | | |||
December 31, | |||||||||
2023 |
| 2022 |
| ||||||
Reserve for Indemnification Liability: | |||||||||
Specific claims | $ | | $ | | |||||
Incurred but not reported claims |
| | | ||||||
Total | $ | | $ | | |||||
F-55
Hilltop Holdings Inc. and Subsidiaries
Notes to Consolidated Financial Statements (continued)
Although management considers the total indemnification liability reserve to be appropriate, there may be changes in the reserve over time to address incurred losses due to unanticipated adverse changes in the economy and historical loss patterns, discrete events adversely affecting specific borrowers or industries, and/or actions taken by institutions or investors. The impact of such matters is considered in the reserving process when probable and estimable.
Other Contingencies
As discussed in Note 16 to the consolidated financial statements, effective upon completion of the PlainsCapital Merger, Hilltop entered into separate retention agreements with certain executive officers. As of December 31, 2023, a single retention agreement remains, with an initial term of
In addition to this retention agreement, Hilltop and its subsidiaries maintain employment contracts with certain officers that provide for benefits in the event of a “change in control” as defined in these agreements.
19. Financial Instruments with Off-Balance Sheet Risk
Banking
The Bank is party to financial instruments with off-balance sheet risk in the normal course of business to meet the financing needs of its customers. These financial instruments include commitments to extend credit and standby letters of credit that involve varying degrees of credit and interest rate risk in excess of the amount recognized in the consolidated financial statements. Such financial instruments are recorded in the consolidated financial statements when they are funded or related fees are incurred or received. The contract amounts of those instruments reflect the extent of involvement (and therefore the exposure to credit loss) the Bank has in particular classes of financial instruments.
Commitments to extend credit are agreements to lend to a customer provided that the terms established in the contract are met. Commitments generally have fixed expiration dates and may require payment of fees. Because some commitments are expected to expire without being drawn upon, the total commitment amounts do not necessarily represent future cash requirements. Standby letters of credit are conditional commitments issued to guarantee the performance of a customer to a third-party. These letters of credit are primarily issued to support public and private borrowing arrangements. The credit risk involved in issuing letters of credit is essentially the same as that involved in extending loan commitments to customers.
In the aggregate, the Bank had outstanding unused commitments to extend credit of $
The Bank uses the same credit policies in making commitments and standby letters of credit as it does for loans held for investment. The amount of collateral obtained, if deemed necessary, in these transactions is based on management’s credit evaluation of the borrower. Collateral held varies but may include real estate, accounts receivable, marketable securities, interest-bearing deposit accounts, inventory, and property, plant and equipment.
Broker-Dealer
In the normal course of business, the Hilltop Broker-Dealers execute, settle, and finance various securities transactions that may expose the Hilltop Broker-Dealers to off-balance sheet risk in the event that a customer or counterparty does not fulfill its contractual obligations. Examples of such transactions include the sale of securities not yet purchased by customers or for the accounts of the Hilltop Broker-Dealers, use of derivatives to support certain non-profit housing organization clients and to hedge changes in the fair value of certain securities, clearing agreements between the Hilltop Broker-Dealers and various clearinghouses and broker-dealers, secured financing arrangements that involve pledged securities, and when-issued underwriting and purchase commitments.
F-56
Hilltop Holdings Inc. and Subsidiaries
Notes to Consolidated Financial Statements (continued)
20. Stock-Based Compensation
Since 2012, the Company has issued stock-based incentive awards pursuant to the Hilltop Holdings Inc. 2012 Equity Incentive Plan (the “2012 Plan”). In July 2020, pursuant to stockholders’ approval, the Company adopted the Hilltop Holdings Inc. 2020 Equity Incentive Plan (the “2020 Plan”). The 2020 Plan serves as successor to the 2012 Plan. The 2012 Plan and the 2020 Plan are referred to collectively as “the Equity Plans.” The Equity Plans provide for the grant of nonqualified stock options, stock appreciation rights, restricted stock, RSUs, performance awards, dividend equivalent rights and other awards to employees of the Company, its subsidiaries and outside directors of the Company. Shares available for grant under the 2012 Plan that were reserved but not issued as of the effective date of the 2020 Plan were added to the reserves of the 2020 Plan.
During 2023, 2022 and 2021, Hilltop granted
Restricted Stock Units
The Compensation Committee of the board of directors of the Company issued RSUs to certain employees pursuant to the Equity Plans. Certain RSUs are subject to time-based vesting conditions and generally provided for a cliff vest on the third anniversary of the grant date, while other RSUs provided for vesting based upon the achievement of certain performance goals over a
The following table summarizes information about nonvested RSU activity for the periods presented (shares in thousands).
RSUs | ||||||
Weighted | ||||||
Average | ||||||
Grant Date | ||||||
| Outstanding |
| Fair Value | |||
Balance, December 31, 2020 | | $ | | |||
Granted | | $ | | |||
Vested/Released | ( | $ | | |||
Forfeited | ( | $ | | |||
Balance, December 31, 2021 | | $ | | |||
Granted | | $ | | |||
Vested/Released | ( | $ | | |||
Forfeited | ( | $ | | |||
Balance, December 31, 2022 | | $ | | |||
Granted | | $ | | |||
Vested/Released | ( | $ | | |||
Forfeited | ( | $ | | |||
Balance, December 31, 2023 | | $ | | |||
F-57
Hilltop Holdings Inc. and Subsidiaries
Notes to Consolidated Financial Statements (continued)
Vested/Released RSUs include an aggregate of
During 2023, the Compensation Committee of the board of directors of the Company awarded certain executives and key employees an aggregate of
At December 31, 2023, in the aggregate,
21. Regulatory Matters
Banking and Hilltop
PlainsCapital, which includes the Bank and PrimeLending, and Hilltop are subject to various regulatory capital requirements administered by federal banking agencies. Failure to meet minimum capital requirements can initiate certain mandatory — and possibly additional discretionary — actions by regulators that, if undertaken, could have a direct, material effect on the consolidated financial statements. The regulations require PlainsCapital and Hilltop to meet specific capital adequacy guidelines that involve quantitative measures of assets, liabilities and certain off-balance sheet items as calculated under regulatory accounting practices. The Company performs reviews of the classification and calculation of risk-weighted assets to ensure accuracy and compliance with the Basel III regulatory capital requirements as implemented by the Board of Governors of the Federal Reserve System. The capital classifications are also subject to qualitative judgments by the regulators about components, risk weightings and other factors. Quantitative measures established by regulation to ensure capital adequacy require the companies to maintain minimum amounts and ratios (set forth in the following table) of Tier 1 capital (as defined in the regulations) to total average assets (as defined), and minimum ratios of common equity Tier 1, Tier 1 and total capital (as defined) to risk-weighted assets (as defined).
In order to avoid limitations on capital distributions, including dividend payments, stock repurchases and certain discretionary bonus payments to executive officers, Basel III requires banking organizations to maintain a capital conservation buffer above minimum risk-based capital requirements measured relative to risk-weighted assets.
F-58
Hilltop Holdings Inc. and Subsidiaries
Notes to Consolidated Financial Statements (continued)
Minimum |
| ||||||||||||||
Capital | |||||||||||||||
Requirements | |||||||||||||||
Including | |||||||||||||||
Conservation | To Be Well |
| |||||||||||||
December 31, 2023 | December 31, 2022 | Buffer | Capitalized |
| |||||||||||
| Amount |
| Ratio |
| Amount |
| Ratio |
| Ratio |
| Ratio |
| |||
Tier 1 capital (to average assets): | |||||||||||||||
PlainsCapital | $ | |
| | % | $ | |
| | % | | % | | % | |
Hilltop |
| |
| | % |
| |
| | % | | % | N/A | ||
Common equity Tier 1 capital | |||||||||||||||
PlainsCapital | |
| | % | |
| | % | | % | | % | |||
Hilltop | |
| | % | |
| | % | | % | N/A | ||||
Tier 1 capital (to risk-weighted assets): |
|
| |||||||||||||
PlainsCapital |
| |
| | % |
| |
| | % | | % | | % | |
Hilltop |
| |
| | % |
| |
| | % | | % | N/A | ||
Total capital (to risk-weighted assets): | |||||||||||||||
PlainsCapital |
| |
| | % |
| |
| | % | | % | | % | |
Hilltop |
| |
| | % |
| |
| | % | | % | N/A | ||
A reconciliation of equity capital to common equity Tier 1, Tier 1 and total capital (as defined) is as follows (in thousands).
December 31, 2023 | December 31, 2022 |
| |||||||||||
| PlainsCapital |
| Hilltop |
| PlainsCapital |
| Hilltop |
| |||||
Total equity capital | $ | | $ | | $ | | $ | | |||||
Add: | |||||||||||||
Net unrealized holding losses (gains) on securities available for sale and held in trust |
| |
| |
| |
| | |||||
CECL transition adjustment | | | | | |||||||||
Deduct: | |||||||||||||
Goodwill and other disallowed intangible assets | ( |
| ( |
| ( |
| ( | ||||||
Common equity Tier 1 capital (as defined) | |
| |
| | | |||||||
Add: Tier 1 capital |
| — | — | — | — | ||||||||
Deduct: Additional Tier 1 capital deductions |
| — |
| — |
| — |
| — | |||||
Tier 1 capital (as defined) |
| |
| |
| |
| | |||||
Add: Allowable Tier 2 capital | |||||||||||||
Allowance for credit losses, including unfunded commitments |
| |
| |
| |
| | |||||
Capital instruments | — |
| |
| — |
| | ||||||
Deduct: | |||||||||||||
Additional Tier 2 capital deductions | ( |
| ( |
| ( |
| ( | ||||||
Total capital (as defined) | $ | | $ | | $ | | $ | | |||||
Broker-Dealer
Pursuant to the net capital requirements of the Securities Exchange Act of 1934, as amended (the “Exchange Act”), Hilltop Securities has elected to determine its net capital requirements using the alternative method. Accordingly, Hilltop Securities is required to maintain minimum net capital, as defined in Rule 15c3-1 promulgated under the Exchange Act, equal to the greater of $1,000,000 or 2% of aggregate debit balances, as defined in Rule 15c3-3 promulgated under the Exchange Act. Additionally, the net capital rule of the NYSE provides that equity capital may not be withdrawn or cash dividends paid if resulting net capital would be less than 5% of the aggregate debit items. Momentum Independent Network follows the primary (aggregate indebtedness) method, as defined in Rule 15c3-1 promulgated under the Exchange Act, which requires the maintenance of the larger of $250,000 or 6-2/3% of aggregate indebtedness.
F-59
Hilltop Holdings Inc. and Subsidiaries
Notes to Consolidated Financial Statements (continued)
At December 31, 2023, the net capital position of each of the Hilltop Broker-Dealers was as follows (in thousands).
Momentum | |||||||
Hilltop | Independent | ||||||
| Securities |
| Network |
| |||
Net capital | $ | | $ | | |||
Less: required net capital | | | |||||
Excess net capital | $ | | $ | | |||
Net capital as a percentage of aggregate debit items | | % | |||||
Net capital in excess of 5% aggregate debit items | $ | | |||||
Under certain conditions, Hilltop Securities may be required to segregate cash and securities in a special reserve account for the benefit of customers under Rule 15c3-3 promulgated under the Exchange Act. Assets segregated for regulatory purposes under the provisions of the Exchange Act are restricted and not available for general corporate purposes. At December 31, 2023 and 2022, the Hilltop Broker-Dealers held cash of $
Mortgage Origination
As a mortgage originator, PrimeLending and its subsidiaries are subject to minimum capital, net worth and liquidity requirements established by HUD and GNMA, as applicable. On an annual basis, PrimeLending and its subsidiaries submit audited financial statements to HUD and GNMA, as applicable, documenting their respective compliance with minimum net worth and liquidity requirements, including timely reporting if a quarter’s operating loss exceeds more than 20% of its previous quarter or year-end net worth (“the operating loss ratio”). If this occurs, certain additional financial reporting submissions are required. As of December 31, 2023, PrimeLending and its subsidiaries’ operating loss ratio of
22. Stockholders’ Equity
The Bank is subject to certain restrictions on the amount of dividends it may declare without prior regulatory approval. At December 31, 2023, $
Dividends
During 2023, 2022 and 2021, the Company declared and paid cash dividends of $
On January 25, 2024, the Company announced that its board of directors declared a quarterly cash dividend of $
Stock Repurchase Programs
The Company’s board of directors has periodically approved stock repurchase programs under which it authorized the Company to repurchase its outstanding common stock. Under the respective stock repurchase program authorized, the Company could repurchase shares in open-market purchases or through privately negotiated transactions as permitted under Rule 10b-18 promulgated under the Exchange Act. The extent to which the Company repurchased its shares and
F-60
Hilltop Holdings Inc. and Subsidiaries
Notes to Consolidated Financial Statements (continued)
the timing of such repurchases depended upon market conditions and other corporate considerations, as determined by Hilltop’s management team. Repurchased shares will be returned to the Company’s pool of authorized but unissued shares of common stock.
In January 2021, the Hilltop board of directors authorized a new stock repurchase program through January 2022, pursuant to which the Company was originally authorized to repurchase, in the aggregate, up to $
In January 2022, the Hilltop board of directors authorized a new stock repurchase program through January 2023, pursuant to which the Company was originally authorized to repurchase, in the aggregate, up to $
In January 2023, the Hilltop board of directors authorized a new stock repurchase program through January 2024, pursuant to which the Company is authorized to repurchase, in the aggregate, up to $
In January 2024, the Hilltop board of directors authorized a new stock repurchase program through January 2025, pursuant to which the Company is authorized to repurchase, in the aggregate, up to $
Tender Offer
On May 2, 2022, the Company announced the commencement of a modified “Dutch auction” tender offer to purchase shares of its common stock for an aggregate cash purchase price of up to $
F-61
Hilltop Holdings Inc. and Subsidiaries
Notes to Consolidated Financial Statements (continued)
23. Other Noninterest Income and Expense
The following table shows the components of other noninterest income and expense (in thousands).
Year Ended December 31, | |||||||||
| 2023 |
| 2022 |
| 2021 | ||||
Other noninterest income: | |||||||||
Net gain from trading securities portfolio | $ | | $ | | $ | | |||
Net gains from Hilltop Broker-Dealer structured product and derivative activities |
| |
| |
| | |||
Service charges on depositor accounts |
| |
| | | ||||
Trust fees | | | | ||||||
Other |
| |
| |
| | |||
$ | | $ | | $ | | ||||
Other noninterest expense: | |||||||||
Software and information technology | $ | | $ | | $ | | |||
Brokerage commissions and fees | | | | ||||||
Mortgage origination and servicing | | | | ||||||
Business development |
| |
| |
| | |||
Travel, meals and entertainment |
| |
| |
| | |||
Unreimbursed loan closing costs |
| |
| |
| | |||
Office supplies |
| |
| |
| | |||
Funding fees |
| |
| |
| | |||
Amortization of intangible assets |
| |
| |
| | |||
Other | | | | ||||||
$ | | $ | | $ | | ||||
24. Derivative Financial Instruments
The Company uses various derivative financial instruments to mitigate interest rate risk. The Bank’s interest rate risk management strategy involves effectively managing the re-pricing characteristics of certain assets and liabilities to mitigate potential adverse impacts from changes in interest rates on the Bank’s net interest margin. Additionally, the Bank manages variability of cash flows associated with its variable rate debt in interest-related cash outflows with interest rate swap contracts. PrimeLending has interest rate risk relative to interest rate lock commitments (“IRLCs”) and its inventory of mortgage loans held for sale. PrimeLending is exposed to such interest rate risk from the time an IRLC is made to an applicant to the time the related mortgage loan is sold. To mitigate interest rate risk, PrimeLending executes forward commitments to sell mortgage-backed securities (“MBSs”) and futures contracts. Additionally, PrimeLending has interest rate risk relative to its MSR asset and uses derivative instruments, including U.S. Treasury bond futures and options, to hedge this risk. The Hilltop Broker-Dealers use forward commitments to both purchase and sell MBSs to facilitate customer transactions and as a means to hedge related exposure to interest rate risk in certain inventory positions. Additionally, Hilltop Securities uses various derivative instruments, including U.S. Treasury bond futures and options, futures contracts, credit default swaps and MMD rate locks, to hedge changes in the fair value of its securities.
Non-Hedging Derivative Instruments and the Fair Value Option
As discussed in Note 3 to the consolidated financial statements, the Company has elected to measure substantially all mortgage loans held for sale at fair value under the provisions of the Fair Value Option. The election provides the opportunity to mitigate volatility in reported earnings caused by measuring related assets and liabilities differently without applying hedge accounting provisions. The fair values of PrimeLending’s IRLCs and forward commitments are recorded in other assets or other liabilities, as appropriate, and changes in the fair values of these derivative instruments are recorded as a component of net gains from sale of loans and other mortgage production income. These changes in fair value are attributable to changes in the volume of IRLCs, mortgage loans held for sale, commitments to purchase
F-62
Hilltop Holdings Inc. and Subsidiaries
Notes to Consolidated Financial Statements (continued)
and sell MBSs and MSR assets, and changes in market interest rates. Changes in market interest rates also conversely affect the value of PrimeLending’s mortgage loans held for sale and its MSR asset, which are measured at fair value under the Fair Value Option. The effect of the change in market interest rates on PrimeLending’s loans held for sale and MSR asset is discussed in Note 10 to the consolidated financial statements. The fair values of the Hilltop Broker-Dealers’ and the Bank’s derivative instruments are recorded in other assets or other liabilities, as appropriate.
Year Ended December 31, | |||||||||
2023 | 2022 | 2021 | |||||||
Increase (decrease) in fair value of derivatives during year: | |||||||||
PrimeLending | $ | ( | $ | ( | $ | ( | |||
Hilltop Broker-Dealers | ( | ( | |||||||
Bank | | | |||||||
Hedging Derivative Instruments
The Company has entered into interest rate swap contracts to manage the exposure to changes in fair value associated with certain available for sale fixed rate collateralized mortgage backed securities and fixed rate loans held for investment attributable to changes in the designated benchmark interest rate. Certain of these fair value hedges have been designated as a portfolio layer, which provides the Company the ability to execute a fair value hedge of the interest rate risk associated with a portfolio of similar prepayable assets whereby the last dollar amount estimated to remain in the portfolio of assets is identified as the hedged item. Additionally, the Company has outstanding interest rate swap contracts designated as cash flow hedges and utilized to manage the variability of cash flows associated with its variable rate borrowings.
Under each of its interest rate swap contracts designated as cash flow hedges, the Company receives a floating rate and pays a fixed rate on the outstanding notional amount. The Company assesses the hedge effectiveness both at the onset of the hedge and at regular intervals throughout the life of the derivative. To the extent that the derivative instruments are highly effective in offsetting the variability of the hedged cash flows or fair value, changes in the fair value of the derivatives designated as hedges of cash flows are included as a component of other comprehensive income or loss on the Company’s consolidated balance sheets and changes in the fair value of the derivatives designated as hedges of fair value are included in current earnings. Although the Company has determined at the onset of the hedges that the derivative instruments will be highly effective hedges throughout the term of the contract, any portion of derivative instruments subsequently determined to be ineffective will be recognized in earnings.
F-63
Hilltop Holdings Inc. and Subsidiaries
Notes to Consolidated Financial Statements (continued)
Derivative positions are presented in the following table (in thousands).
December 31, 2023 | December 31, 2022 | |||||||||||
| Notional |
| Estimated |
| Notional |
| Estimated | |||||
Amount | Fair Value | Amount | Fair Value | |||||||||
Derivative instruments (not designated as hedges): | ||||||||||||
IRLCs | $ | | $ | | $ | | $ | | ||||
Commitments to purchase MBSs |
| |
| |
| |
| | ||||
Commitments to sell MBSs | |
| ( |
| |
| | |||||
Interest rate swaps | |
| ( |
| |
| ( | |||||
Interest rate swaps back-to-back (asset) (1) | | | — |
| — | |||||||
Interest rate swaps back-to-back (liability) (1) | | ( | — |
| — | |||||||
U.S. Treasury bond futures and options (2) | |
| |
| |
| ( | |||||
Interest rate and other futures (2) | |
| — |
| |
| — | |||||
Credit default swaps | — |
| — |
| |
| ( | |||||
Warrants | |
| |
| — |
| — | |||||
Derivative instruments (designated as hedges): | ||||||||||||
Interest rate swaps designated as cash flow hedges | $ | | $ | | $ | | $ | | ||||
Interest rate swaps designated as fair value hedges (3) | | | | | ||||||||
| (1) | Noted derivative instruments include both customer-facing derivatives as well as offsetting derivatives facing other dealer banks. The fair value of these derivatives include a net credit valuation adjustment that was nominal at December 31, 2023, reducing the fair value of the liability. |
| (2) | Noted derivative instruments include contracts between the Hilltop Broker-Dealers and PrimeLending and their respective counterparties with changes in fair value of the contracts that are settled daily. |
| (3) | The Company designated $ |
The Bank and PrimeLending held aggregate cash collateral advances of $
Derivatives on Behalf of Customers
The Bank offers derivative contracts to certain customers in connection with their risk management needs. These derivatives include back-to-back interest rate swaps. The Bank manages the risk associated with these contracts by entering into an equal and offsetting derivative with a third-party dealer bank. These derivatives generally work together as an economic interest rate hedge, but the Bank does not designate them for hedge accounting treatment. Consequently, changes in fair value of the corresponding derivative financial asset or liability were recorded as either a charge or credit to current earnings during the period in which the changes in fair value occurred, typically resulting in no net earnings impact.
F-64
Hilltop Holdings Inc. and Subsidiaries
Notes to Consolidated Financial Statements (continued)
25. Balance Sheet Offsetting
Certain financial instruments, including resale and repurchase agreements, securities lending arrangements and derivatives, may be eligible for offset in the consolidated balance sheets and/or subject to master netting arrangements or similar agreements. The Company’s accounting policy is to present required disclosures related to collateral and derivative positions on a gross basis. The following tables present the assets and liabilities subject to enforceable master netting arrangements, repurchase agreements, or similar agreements with offsetting rights (in thousands).
Gross Amounts Not Offset in | ||||||||||||||||||
Net Amounts | the Balance Sheet | |||||||||||||||||
| Gross Amounts |
| Gross Amounts |
| of Assets |
|
|
| Cash |
|
| |||||||
of Recognized | Offset in the | Presented in the | Financial | Collateral | Net | |||||||||||||
Assets | Balance Sheet | Balance Sheet | Instruments | Pledged | Amount | |||||||||||||
December 31, 2023 | ||||||||||||||||||
Securities borrowed: | ||||||||||||||||||
Institutional counterparties | $ | | $ | — | $ | | $ | ( | $ | — | $ | | ||||||
Interest rate swaps: | ||||||||||||||||||
Institutional counterparties | | — | | — | ( | | ||||||||||||
Reverse repurchase agreements: | ||||||||||||||||||
Institutional counterparties | | — | | ( | — | | ||||||||||||
Forward MBS derivatives: | ||||||||||||||||||
Institutional counterparties |
| |
| — |
| |
| ( |
| — |
| | ||||||
Treasury futures and options derivatives: | ||||||||||||||||||
Institutional counterparties | | — | | — | — | | ||||||||||||
$ | | $ | — | $ | | $ | ( | $ | ( | $ | | |||||||
December 31, 2022 | ||||||||||||||||||
Securities borrowed: | ||||||||||||||||||
Institutional counterparties | $ | | $ | — | $ | | $ | ( | $ | — | $ | | ||||||
Interest rate swaps: | ||||||||||||||||||
Institutional counterparties | | — | | — | ( | | ||||||||||||
Reverse repurchase agreements: | ||||||||||||||||||
Institutional counterparties | | — | | ( | — | | ||||||||||||
Forward MBS derivatives: | ||||||||||||||||||
Institutional counterparties | | ( | | ( | — | | ||||||||||||
Treasury futures and options derivatives: | ||||||||||||||||||
Institutional counterparties | | ( | ( | — | — | ( | ||||||||||||
$ | | $ | ( | $ | | $ | ( | $ | ( | $ | | |||||||
F-65
Hilltop Holdings Inc. and Subsidiaries
Notes to Consolidated Financial Statements (continued)
Gross Amounts Not Offset in | ||||||||||||||||||
Net Amounts | the Balance Sheet | |||||||||||||||||
| Gross Amounts |
| Gross Amounts |
| of Liabilities |
|
|
| Cash |
|
| |||||||
of Recognized | Offset in the | Presented in the | Financial | Collateral | Net | |||||||||||||
Liabilities | Balance Sheet | Balance Sheet | Instruments | Pledged | Amount | |||||||||||||
December 31, 2023 | ||||||||||||||||||
Securities loaned: | ||||||||||||||||||
Institutional counterparties | $ | | $ | — | $ | | $ | ( | $ | — | $ | | ||||||
Interest rate swaps: | ||||||||||||||||||
Institutional counterparties |
| |
| — |
| |
| ( |
| — |
| | ||||||
Repurchase agreements: | ||||||||||||||||||
Institutional counterparties |
| |
| — |
| |
| ( |
| — |
| | ||||||
Forward MBS derivatives: | ||||||||||||||||||
Institutional counterparties |
| |
| — |
| |
| ( |
| ( |
| | ||||||
$ | | $ | — | $ | | $ | ( | $ | ( | $ | | |||||||
December 31, 2022 | ||||||||||||||||||
Securities loaned: | ||||||||||||||||||
Institutional counterparties | $ | | $ | — | $ | | $ | ( | $ | — | $ | | ||||||
Interest rate swaps: | ||||||||||||||||||
Institutional counterparties | |
| — |
| |
| ( |
| — |
| | |||||||
Credit default swaps: | ||||||||||||||||||
Institutional counterparties | |
| — |
| |
| ( |
| — |
| | |||||||
Repurchase agreements: | ||||||||||||||||||
Institutional counterparties |
| |
| — |
| |
| ( |
| — |
| ( | ||||||
Forward MBS derivatives: | ||||||||||||||||||
Institutional counterparties |
| |
| — |
| |
| ( |
| — |
| | ||||||
$ | | $ | — | $ | | $ | ( | $ | — | $ | | |||||||
Secured Borrowing Arrangements
Secured Borrowings (Repurchase Agreements) — The Company participates in transactions involving securities sold under repurchase agreements, which are secured borrowings and generally mature to
Securities Lending Activities — The Company’s securities lending activities include lending securities for other broker-dealers, lending institutions and its own clearing and retail operations. These activities involve lending securities to other broker-dealers to cover short sales, to complete transactions in which there has been a failure to deliver securities by the required settlement date and as a conduit for financing activities.
When lending securities, the Company receives cash or similar collateral and generally pays interest (based on the amount of cash deposited) to the other party to the transaction. Securities lending transactions are executed pursuant to written agreements with counterparties that generally require securities loaned to be marked-to-market on a daily basis. The Company receives collateral in the form of cash in an amount generally in excess of the fair value of securities loaned. The Company monitors the fair value of securities loaned on a daily basis, with additional collateral obtained or refunded, as necessary. Collateral adjustments are made on a daily basis through the facilities of various clearinghouses. The Company is a principal in these securities lending transactions and is liable for losses in the event of a failure of any other party to honor its contractual obligation. Management sets credit limits with each counterparty and reviews these limits regularly to monitor the risk level with each counterparty. The Company is subject to credit risk through its securities lending activities if securities prices decline rapidly because the value of the Company’s collateral could fall below the amount of the indebtedness it secures. In rapidly appreciating markets, credit risk increases due to short
F-66
Hilltop Holdings Inc. and Subsidiaries
Notes to Consolidated Financial Statements (continued)
positions. The Company’s securities lending business subjects the Company to credit risk if a counterparty fails to perform or if collateral securing its obligations is insufficient. In securities transactions, the Company is subject to credit risk during the period between the execution of a trade and the settlement by the customer.
The following tables present the remaining contractual maturities of repurchase agreement and securities lending transactions accounted for as secured borrowings (in thousands). The Company had
Remaining Contractual Maturities | |||||||||||||||
Overnight and | Greater Than | ||||||||||||||
December 31, 2023 | Continuous | Up to 30 Days | 30-90 Days | 90 Days | Total | ||||||||||
Repurchase agreement transactions: | |||||||||||||||
U.S. government agency securities | $ | | $ | — | $ | — | $ | — | $ | | |||||
Asset-backed securities | | | — | — | | ||||||||||
Securities lending transactions: | |||||||||||||||
Corporate securities | | — | — | — | | ||||||||||
Equity securities | | — | — | — | | ||||||||||
Total | $ | | $ | | $ | — | $ | — | $ | | |||||
Gross amount of recognized liabilities for repurchase agreement and securities lending transactions in offsetting disclosure above | $ | | |||||||||||||
Amount related to agreements not included in offsetting disclosure above | $ | | |||||||||||||
Remaining Contractual Maturities | |||||||||||||||
Overnight and | Greater Than | ||||||||||||||
December 31, 2022 | Continuous | Up to 30 Days | 30-90 Days | 90 Days | Total | ||||||||||
Repurchase agreement transactions: | |||||||||||||||
Asset-backed securities | $ | | $ | | $ | | $ | | $ | | |||||
Securities lending transactions: | |||||||||||||||
Corporate securities | | — | — | — | | ||||||||||
Equity securities | | — | — | — | | ||||||||||
Total | $ | | $ | | $ | | $ | | $ | | |||||
Gross amount of recognized liabilities for repurchase agreement and securities lending transactions in offsetting disclosure above | $ | | |||||||||||||
Amount related to agreements not included in offsetting disclosure above | $ | | |||||||||||||
26. Broker-Dealer and Clearing Organization Receivables and Payables
Broker-dealer and clearing organization receivables and payables consisted of the following (in thousands).
| December 31, | |||||
| 2023 |
| 2022 | |||
Receivables: | ||||||
Securities borrowed | $ | | $ | | ||
Securities failed to deliver |
| |
| | ||
Trades in process of settlement |
| |
| | ||
Other |
| |
| | ||
$ | | $ | | |||
Payables: | ||||||
Securities loaned | $ | | $ | | ||
Correspondents |
| |
| | ||
Securities failed to receive |
| |
| | ||
Other |
| |
| | ||
$ | | $ | | |||
F-67
Hilltop Holdings Inc. and Subsidiaries
Notes to Consolidated Financial Statements (continued)
27. Segment and Related Information
The Company has
The banking segment includes the operations of the Bank. The broker-dealer segment includes the operations of Securities Holdings, and the mortgage origination segment is composed of PrimeLending.
Corporate includes certain activities not allocated to specific business segments. These activities include holding company financing and investing activities, merchant banking investment opportunities and management and administrative services to support the overall operations of the Company.
Balance sheet amounts not discussed previously and the elimination of intercompany transactions are included in “All Other and Eliminations.”
Mortgage | All Other and | Hilltop | ||||||||||||||||
Year Ended December 31, 2023 | Banking | Broker-Dealer | Origination | Corporate | Eliminations | Consolidated | ||||||||||||
Net interest income (expense) | $ | | $ | | $ | ( | $ | ( | $ | | $ | | ||||||
Provision for (reversal of) credit losses | | ( | — | — | — | | ||||||||||||
Noninterest income | | | | | ( | | ||||||||||||
Noninterest expense |
| |
| |
| |
| |
| ( |
| | ||||||
Income (loss) before taxes | $ | | $ | | $ | ( | $ | ( | $ | | $ | | ||||||
Mortgage |
|
| All Other and |
| Hilltop | |||||||||||||
Year Ended December 31, 2022 | Banking | Broker-Dealer | Origination | Corporate | Eliminations | Consolidated | ||||||||||||
Net interest income (expense) | $ | | $ | | $ | ( | $ | ( | $ | | $ | | ||||||
Provision for (reversal of) credit losses |
| | | — | — | — |
| | ||||||||||
Noninterest income |
| | | | | ( |
| | ||||||||||
Noninterest expense |
| |
| |
| | | ( |
| | ||||||||
Income (loss) before taxes | $ | | $ | | $ | ( | $ | ( | $ | | $ | | ||||||
Mortgage |
|
|
| All Other and |
| Hilltop | ||||||||||||
Year Ended December 31, 2021 | Banking | Broker-Dealer | Origination | Corporate | Eliminations | Consolidated | ||||||||||||
Net interest income (expense) | $ | | $ | | $ | ( | $ | ( | $ | | $ | | ||||||
Provision for (reversal of) credit losses |
| ( | ( | — | — | — |
| ( | ||||||||||
Noninterest income |
| | | | | ( |
| | ||||||||||
Noninterest expense |
| |
| |
| | | ( |
| | ||||||||
Income (loss) before taxes | $ | | $ | | $ | | $ | ( | $ | | $ | | ||||||
Mortgage |
|
|
| All Other and |
| Hilltop | ||||||||||||
Banking | Broker-Dealer | Origination | Corporate | Eliminations | Consolidated | |||||||||||||
December 31, 2023 | ||||||||||||||||||
Goodwill | $ | | $ | | $ | | $ | — | $ | — | $ | | ||||||
Total assets | $ | | $ | | $ | | $ | | $ | ( | $ | | ||||||
December 31, 2022 | ||||||||||||||||||
Goodwill | $ | | $ | | $ | | $ | — | $ | — | $ | | ||||||
Total assets | $ | | $ | | $ | | $ | | $ | ( | $ | | ||||||
F-68
Hilltop Holdings Inc. and Subsidiaries
Notes to Consolidated Financial Statements (continued)
28. Earnings per Common Share
The following table presents the computation of basic and diluted earnings per common share (in thousands, except per share data).
| Year Ended December 31, | |||||||||
|
| 2023 |
| 2022 |
| 2021 | ||||
Basic earnings per share: | ||||||||||
Income attributable to Hilltop | $ | | $ | | $ | | ||||
Weighted average shares outstanding - basic |
| |
| |
| | ||||
Basic earnings per common share: | $ | | $ | | $ | | ||||
Diluted earnings per share: | ||||||||||
Income attributable to Hilltop | $ | | $ | | $ | | ||||
Weighted average shares outstanding - basic |
| |
| |
| | ||||
Effect of potentially dilutive securities |
| |
| |
| | ||||
Weighted average shares outstanding - diluted |
| |
| |
| | ||||
Diluted earnings per common share: | $ | | $ | | $ | | ||||
29. Financial Statements of Parent
The following tables present the condensed combined financial statements of the Company’s bank holding company entities, Hilltop and PCC. The tables also include the corporate activities associated with Hilltop Opportunity Partners LLC and the Hilltop Plaza Entities (in thousands). Investments in subsidiaries are determined using the equity method of accounting.
Condensed Combined Statements of Operations and Comprehensive Income
Year Ended December 31, | ||||||||||
2023 |
| 2022 |
| 2021 |
| |||||
Dividends from bank subsidiaries | $ | | $ | | $ | | ||||
Dividends from nonbank subsidiaries | | | | |||||||
Investment income | | | | |||||||
Interest expense | | | | |||||||
Other income | | | | |||||||
General and administrative expense |
| |
| |
| | ||||
Income before income taxes and equity in undistributed earnings of subsidiaries activity |
| |
| |
| | ||||
Income tax benefit |
| ( |
| ( |
| ( | ||||
Equity in undistributed earnings of subsidiaries |
| |
| ( |
| | ||||
Net income | $ | | $ | | $ | | ||||
Other comprehensive income (loss), net | | ( | ( | |||||||
Comprehensive income (loss) | $ | | $ | ( | $ | | ||||
F-69
Hilltop Holdings Inc. and Subsidiaries
Notes to Consolidated Financial Statements (continued)
Condensed Combined Balance Sheets
December 31, | |||||||||
| 2023 |
| 2022 |
| 2021 | ||||
Assets: | |||||||||
Cash and cash equivalents | $ | | $ | | $ | | |||
Available for sale securities | | — | — | ||||||
Loans held for investment, net of unearned income |
| |
| |
| — | |||
Investment in subsidiaries: |
| ||||||||
Bank subsidiaries | |
| |
| | ||||
Nonbank subsidiaries | |
| |
| | ||||
Other assets |
| |
| |
| | |||
Total assets | $ | | $ | | $ | | |||
Liabilities and Stockholders’ Equity: | |||||||||
Accounts payable and accrued expenses | $ | | $ | | $ | | |||
Notes payable |
| |
| |
| | |||
Stockholders’ equity |
| |
| |
| | |||
Total liabilities and stockholders’ equity | $ | | $ | | $ | | |||
Condensed Combined Statements of Cash Flows
Year Ended December 31, | |||||||||
| 2023 |
| 2022 |
| 2021 | ||||
Operating Activities: | |||||||||
Net income | $ | | $ | | $ | | |||
Adjustments to reconcile net income to net cash provided by operating activities: | |||||||||
Equity in undistributed earnings of subsidiaries |
| ( |
| |
| ( | |||
Net realized gains on equity investments |
| — |
| — |
| ( | |||
Deferred income taxes |
| |
| |
| ( | |||
Other, net |
| |
| ( |
| | |||
Net cash provided by operating activities |
| |
| |
| | |||
Investing Activities: | |||||||||
Advancement to nonbank subsidiaries | — | — | ( | ||||||
Repayment of advances to/investments in nonbank subsidiaries | | | | ||||||
Purchases of securities available for sale |
| ( |
| — |
| — | |||
Purchases of equity investments (including merchant banking investments) | ( |
| ( |
| — | ||||
Purchases of premises and equipment and other |
| ( |
| ( |
| ( | |||
Proceeds from sales/disposition of equity investments | — | | | ||||||
Net cash used in investing activities |
| ( |
| ( |
| ( | |||
Financing Activities: | |||||||||
Payments to repurchase common stock | ( | ( | ( | ||||||
Payments on junior subordinated debentures | — | — |
| ( | |||||
Dividends paid on common stock | ( | ( | ( | ||||||
Net cash contributed from (to) noncontrolling interest | | ( | ( | ||||||
Other, net | ( | ( | ( | ||||||
Net cash used in financing activities |
| ( |
| ( |
| ( | |||
Net change in cash and cash equivalents |
| |
| ( |
| | |||
Cash and cash equivalents, beginning of year |
| |
| | | ||||
Cash and cash equivalents, end of year | $ | | $ | | $ | | |||
F-70
Hilltop Holdings Inc. and Subsidiaries
Notes to Consolidated Financial Statements (continued)
30. Selected Quarterly Financial Information (Unaudited)
Selected quarterly financial information is summarized as follows (in thousands, except per share data).
Year Ended December 31, 2023 | |||||||||||||||
| Fourth |
| Third |
| Second |
| First |
| Full | ||||||
Quarter | Quarter | Quarter | Quarter | Year | |||||||||||
Interest income | $ | | $ | | $ | | $ | | $ | | |||||
Interest expense |
| |
| |
| |
| |
| | |||||
Net interest income |
| |
| |
| |
| |
| | |||||
Provision for (reversal of) credit losses |
| |
| ( |
| |
| |
| | |||||
Noninterest income |
| |
| |
| |
| |
| | |||||
Noninterest expense |
| |
| |
| |
| |
| ||||||
Income before income taxes |
| |
| |
| |
| |
| | |||||
Income tax expense |
| |
| |
| |
| |
| | |||||
Net income |
| |
| |
| |
| |
| | |||||
Less: Net income attributable to noncontrolling interest |
| |
| |
| |
| |
| | |||||
Income attributable to Hilltop | $ | | $ | | $ | | $ | | $ | | |||||
Earnings per common share: | |||||||||||||||
Basic: | $ | | $ | | $ | | $ | | $ | | |||||
Diluted: | $ | | $ | | $ | | $ | | $ | | |||||
Cash dividends declared per common share | $ | | $ | | $ | | $ | | $ | | |||||
Year Ended December 31, 2022 | |||||||||||||||
| Fourth |
| Third |
| Second |
| First |
| Full | ||||||
Quarter | Quarter | Quarter | Quarter | Year | |||||||||||
Interest income | $ | | $ | | $ | | $ | | $ | | |||||
Interest expense |
| |
| |
| |
| |
| | |||||
Net interest income |
| |
| |
| |
| |
| | |||||
Provision for (reversal of) credit losses |
| |
| ( |
| |
| |
| | |||||
Noninterest income |
| |
| |
| |
| |
| | |||||
Noninterest expense |
| |
| |
| |
| |
| | |||||
Income before income taxes |
| |
| |
| |
| |
| | |||||
Income tax expense |
| |
| |
| |
| |
| | |||||
Net income |
| |
| |
| |
| |
| | |||||
Less: Net income attributable to noncontrolling interest |
| |
| |
| |
| |
| | |||||
Income attributable to Hilltop | $ | | $ | | $ | | $ | | $ | | |||||
Earnings per common share: | |||||||||||||||
Basic: | $ | | $ | | $ | | $ | | $ | | |||||
Diluted: | $ | | $ | | $ | | $ | | $ | | |||||
Cash dividends declared per common share | $ | | $ | | $ | | $ | | $ | | |||||
F-71