UNITED STATES
SECURITIES AND EXCHANGE COMMISSION
WASHINGTON, D.C. 20549
FORM 20-F
(Mark One)
REGISTRATION STATEMENT PURSUANT TO SECTION 12(b) OR (g) OF THE SECURITIES EXCHANGE ACT OF 1934 |
OR
ANNUAL REPORT PURSUANT TO SECTION 13 OR 15(d) OF THE SECURITIES EXCHANGE ACT OF 1934 |
For the fiscal year ended 31 December 2023
OR
TRANSITION REPORT PURSUANT TO SECTION 13 OR 15(d) OF THE SECURITIES EXCHANGE ACT OF 1934 |
OR
SHELL COMPANY REPORT PURSUANT TO SECTION 13 OR 15(d) OF THE SECURITIES EXCHANGE ACT OF 1934 |
Commission File Number: 001-14642
(Exact name of Registrant as specified in its charter)
ING GROUP
(Translation of Registrant’s name into English)
The Netherlands
(Jurisdiction of incorporation or organization)
The Netherlands
(Address of principal executive offices)
Telephone: +31 20 564 7705
E-mail: Erwin.Olijslager@ing.com
The Netherlands
(Name, Telephone, E-mail and/or Facsimile number and Address of Company Contact Person)
Securities registered or to be registered pursuant to Section 12(b) of the Act.
Title of each class | Trading symbols | Name of each exchange on which registered | ||
1.726% Callable Fixed-to-Floating Rate Senior Notes due 2027 | ||||
2.727% Callable Fixed-to-Floating Rate Senior Notes due 2032 | ||||
4.017% Callable Fixed-to-Floating Rate Senior Notes due 2028 | ||||
3.869% Callable Fixed-to-Floating Rate Senior Notes due 2026 | ||||
4.252% Callable Fixed-to-Floating Rate Senior Notes due 2033 | ||||
6.083% Callable Fixed-to-Floating Rate Senior Notes due 2027 | ||||
$500,000,000 Callable Floating Rate Senior Notes due 2027 | ||||
(i)Not for trading, but only in connection with the registration of American Depositary Shares
representing such ordinary shares, pursuant to the requirements of the Securities and Exchange
Commission.
Securities registered or to be registered pursuant to Section 12(g) of the Act.None
Securities for which there is a reporting obligation pursuant to Section 15(d) of the Act. None
Indicate the number of outstanding shares of each of the issuer’s classes of capital or common stock as of
the close of the period covered by the annual report.
Ordinary Shares, nominal value EUR 0.01 per Ordinary Share3,498,194,469
Indicate by check mark if the registrant is a well-known seasoned issuer, as defined in Rule 405 of the
Securities Act. ☒ Yes ☐ No
If this report is an annual or transition report, indicate by check mark if the registrant is not required to file
reports pursuant to Section 13 or 15(d) of the Securities Exchange Act of 1934. ☐ Yes ☒ No
Note — Checking the box above will not relieve any registrant required to file reports pursuant to Section 13
or 15(d) of the Securities Exchange Act of 1934 from their obligations under those Sections.
Indicate by check mark whether the registrant (1) has filed all reports required to be filed by Section 13 or
15(d) of the Securities Exchange Act of 1934 during the preceding 12 months (or for such shorter period that
the registrant was required to file such reports), and (2) has been subject to such filing requirements for the
past 90 days.
☒ Yes ☐ No
Indicate by check mark whether the registrant has submitted electronically every Interactive Data File
required to be submitted pursuant to Rule 405 of Regulation S-T (§232.405 of this chapter) during the
preceding 12 months (or for such shorter period that the registrant was required to submit and post such
files). ☒ Yes ☐ No
Indicate by check mark whether the registrant is a large accelerated filer, an accelerated filer, a non-
accelerated filer, or an emerging growth company. See definition of “large accelerated filer,” accelerated
filer,” and “emerging growth company” in Rule 12b-2 of the Exchange Act.
company☐
If an emerging growth company that prepares its financial statements in accordance with U.S. GAAP,
indicate by check mark if the registrant has elected not to use the extended transition period for complying
with any new or revised financial accounting standards† provided pursuant to Section 13(a) of the Exchange
Act. ☐
† | The term “new or revised financial accounting standard” refers to any update issued by the Financial Accounting Standards Board to its Accounting Standards Codification after April 5, 2012. |
Indicate by check mark whether the registrant has filed a report on and attestation to its management’s
assessment of the effectiveness of its internal control over financial reporting under Section 404(b) of the
Sarbanes-Oxley Act (15 U.S.C.7262(b)) by the registered public accounting firm that prepared or issued its
audit report. ☒
If securities are registered pursuant to Section 12(b) of the Act, indicate by check mark whether the financial
statements of the registrant included in the filing reflect the correction of an error to previously issued
financial statements. ☐
Indicate by check mark whether any of those error corrections are restatements that required a recovery
analysis of incentive based compensation received by any of the registrant’s executive officers during the
relevant recovery period pursuant to §240.10D-1(b). ☐
Indicate by check mark which basis of accounting the registrant has used to prepare the financial
statements included in this filing:
U.S. GAAP☐ | issued by the International Accounting Standards Board ☒ | Other ☐ |
If “Other” has been checked in response to the previous question, indicate by check mark which financial
statement item the registrant has elected to follow.
☐ Item 17 ☐ Item 18
If this is an annual report, indicate by check mark whether the registrant is a shell company (as defined in
Rule 12b-2 of the Exchange Act). ☐ Yes ☒ No
Contents
Part I
8 | |||
Part II
16K | CYBERSECURITY |
Part III
Additional information
Presentation of information
In this Annual Report, and unless otherwise stated or the context otherwise dictates, references to "ING
Groep N.V.", "ING Groep NV", "ING Groep" and "ING Group" refer to ING Groep NV and references to "ING",
the "Company", the "Group", "we" and "us" refer to ING Groep NV and its consolidated subsidiaries. ING
Groep N.V.'s primary banking subsidiary is ING Bank N.V. (together with its consolidated subsidiaries, "ING
Bank"). References to "Executive Board" and "Supervisory Board" refer to the Executive Board or Supervisory
Board of ING Groep N.V., respectively.
ING presents its consolidated financial statements in euros, the currency of the European Economic and
Monetary Union. Unless otherwise specified or the context otherwise requires, references to “$”, “US$” and
“Dollars” are to the United States dollars and references to "€" and “EUR” are to euros.
ING prepares financial information in accordance with International Financial Reporting Standards as issued
by the International Accounting Standards Board (“IFRS-IASB”) for purposes of reporting with the U.S.
Securities and Exchange Commission (“SEC”), including financial information contained in this Annual Report
on Form 20-F. ING Group’s accounting policies and its use of various options under IFRS-IASB are described
under Note '1.2 Basis of preparation of the Consolidated financial statements’ in the consolidated financial
statements. In this document the term “IFRS-IASB” is used to refer to IFRS-IASB as applied by ING Group.
The published 2023 Financial Statements of ING Group, however, are prepared in accordance with IFRS-EU.
IFRS-EU refers to International Financial Reporting Standards (“IFRS”) as adopted by the European Union
(“EU”), including the decisions ING Group made with regard to the options available under IFRS as adopted
by the EU (IFRS-EU).
IFRS-EU differs from IFRS-IASB, in respect of certain paragraphs in IAS 39 ‘Financial Instruments: Recognition
and Measurement’ regarding hedge accounting for portfolio hedges of interest rate risk. Under IFRS-EU, ING
Group applies fair value hedge accounting for portfolio hedges of interest rate risk (fair value macro hedges)
in accordance with the EU “carve-out” version of IAS 39. Under the EU “IAS 39 carve-out”, hedge accounting
may be applied, in respect of fair value macro hedges, to core deposits and hedge ineffectiveness is only
recognised when the revised estimate of the amount of cash flows in scheduled time buckets falls below the
original designated amount of that bucket, and is not recognised when the revised amount of cash flows in
scheduled time buckets is more than the original designated amount. Under IFRS-IASB, hedge accounting
for fair value macro hedges cannot be applied to core deposits and hedge ineffectiveness arises whenever
the revised estimate of the amount of cash flows in scheduled time buckets is either more or less than the
original designated amount of that bucket. IFRS-IASB financial information is prepared by reversing the
hedge accounting impacts that are applied under the EU “carve-out” version of IAS 39. Financial information
under IFRS-IASB accordingly does not take account of the possibility that, had ING Group applied IFRS-IASB
as its primary accounting framework, it might have applied alternative hedge strategies where those
alternative hedge strategies could have qualified for IFRS-IASB compliant hedge accounting. These decisions
could have resulted in different shareholders’ equity and net result amounts compared to those indicated in
this Annual Report on Form 20-F.
Other than for the purpose of SEC reporting, ING Group intends to continue to prepare its Financial
Statements under IFRS-EU. A reconciliation between IFRS-EU and IFRS-IASB for shareholders’ equity and net
result is included in Note 1 ‘Basis of preparation and material accounting policy information’ to the
consolidated financial statements.
Certain amounts set forth herein, such as percentages, may not sum due to rounding.
ING Group Annual Report 2023 on Form 20-F 5
CAUTIONARY STATEMENT WITH RESPECT TO
FORWARD-LOOKING STATEMENTS
Certain of the statements contained herein are not historical facts, including, without limitation, certain
statements made of future expectations and other forward-looking statements that are based on
management’s current views and assumptions and involve known and unknown risks and uncertainties that
could cause actual results, performance or events to differ materially from those expressed or implied in
such statements. Actual results, performance or events may differ materially from those in such statements
due to a number of factors, including, without limitation,
•changes in general economic conditions and customer behaviour, in particular economic conditions in
ING’s core markets, including changes affecting currency exchange rates and the regional and global
economic impact of the invasion of Russia into Ukraine and related international response measures
•changes affecting interest rate levels
•any default of a major market participant and related market disruption
•changes in performance of financial markets, including in Europe and developing markets
•fiscal uncertainty in Europe and the United States
•discontinuation of or changes in ‘benchmark’ indices
•inflation and deflation in our principal markets
•changes in conditions in the credit and capital markets generally, including changes in borrower and
counterparty creditworthiness
•failures of banks falling under the scope of state compensation schemes
•non-compliance with or changes in laws and regulations, including those concerning financial services,
financial economic crimes and tax laws, and the interpretation and application thereof
•geopolitical risks, political instabilities and policies and actions of governmental and regulatory
authorities, including in connection with the invasion of Russia into Ukraine and related international
response measures
•legal and regulatory risks in certain countries with less developed legal and regulatory frameworks
•prudential supervision and regulations, including in relation to stress tests and regulatory restrictions on
dividends and distributions, (also among members of the group)
•ING’s ability to meet minimum capital and other prudential regulatory requirements
•changes in regulation of US commodities and derivatives businesses of ING and its customers
•application of bank recovery and resolution regimes, including write-down and conversion powers in
relation to our securities
•outcome of current and future litigation, enforcement proceedings, investigations or other regulatory
actions, including claims by customers or stakeholders who feel misled or treated unfairly, and other
conduct issues
•changes in tax laws and regulations and risks of non-compliance or investigation in connection with tax
laws, including FATCA
•operational and IT risks, such as system disruptions or failures, breaches of security, cyber-attacks,
human error, changes in operational practices or inadequate controls including in respect of third parties
with which we do business and including any risks as a result of incomplete, inaccurate, or otherwise
flawed outputs from the algorithms and data sets utilized in artificial intelligence
•risks and challenges related to cybercrime including the effects of cyberattacks and changes in
legislation and regulation related to cybersecurity and data privacy, including such risks and challenges
as a consequence of the use of emerging technologies, such as advanced forms of artificial intelligence
and quantum computing
•changes in general competitive factors, including ability to increase or maintain market share
•inability to protect our intellectual property and infringement claims by third parties
•inability of counterparties to meet financial obligations or ability to enforce rights against such
counterparties
•changes in credit ratings
•business, operational, regulatory, reputation, transition and other risks and challenges in connection with
climate change and Environmental, Social and Governance (ESG)-related matters, including data and
reporting
•inability to attract and retain key personnel
•future liabilities under defined benefit retirement plans
•failure to manage business risks, including in connection with use of models, use of derivatives, or
maintaining appropriate policies and guidelines
•changes in capital and credit markets, including interbank funding, as well as customer deposits, which
provide the liquidity and capital required to fund our operations, and
•the other risks and uncertainties detailed in the most recent annual report of ING Groep N.V. (including
the Risk Factors contained therein) and ING’s more recent disclosures, including press releases, which are
available on www.ing.com.
This document may contain ESG-related material that has been prepared by ING on the basis of publicly
available information, internally developed data and other third-party sources believed to be reliable. ING
has not sought to independently verify information obtained from public and third-party sources and makes
no representations or warranties as to accuracy, completeness, reasonableness or reliability of such
information.
Materiality, as used in the context of ESG, is distinct from, and should not be confused with, such term as
defined in the Market Abuse Regulation or as defined for Securities and Exchange Commission (‘SEC’)
ING Group Annual Report 2023 on Form 20-F 6
reporting purposes. Any issues identified as material for purposes of ESG in this annual report are therefore
not necessarily material as defined in the Market Abuse Regulation or for SEC reporting purposes. In
addition, there is currently no single, globally recognized set of accepted definitions in assessing whether
activities are “green” or “sustainable.” Without limiting any of the statements contained herein, we make no
representation or warranty as to whether any of our securities constitutes a green or sustainable security or
conforms to present or future investor expectations or objectives for green or sustainable investing. For
information on characteristics of a security, use of proceeds, a description of applicable project(s) and/or
any other relevant information, please reference the offering documents for such security.
This annual report contains inactive textual addresses to internet websites operated by us and third parties.
Reference to such websites is made for information purposes only, and information found at such websites
is not incorporated by reference into this annual report. ING does not make any representation or warranty
with respect to the accuracy or completeness of, or take any responsibility for, any information found at
any websites operated by third parties. ING specifically disclaims any liability with respect to any
information found at websites operated by third parties. ING cannot guarantee that websites operated by
third parties remain available following the filing of this annual report or that any information found at such
websites will not change following the filing of this annual report. Many of those factors are beyond ING’s
control.
Any forward-looking statements made by or on behalf of ING speak only as of the date they are made, and
ING assumes no obligation to publicly update or revise any forward-looking statements, whether as a result
of new information or for any other reason.
This document does not constitute an offer to sell, or a solicitation of an offer to purchase, any securities in
the United States or any other jurisdiction.
ING Group Annual Report 2023 on Form 20-F 7
PART I
Item 1.Identity of Directors, Senior
Management And Advisors
Not applicable.
Item 2.Offer Statistics and Expected
Timetable
Not applicable.
Item 3.Key Information
A. Selected financial data
Not applicable.
B. Capitalization and indebtedness
This item does not apply to annual reports on Form 20-F.
C. Reasons for the offer and use of proceeds
This item does not apply to annual reports on Form 20-F.
D. Risk Factors
Summary of Risk factors
The following is a summary of the principal risk factors that could have a material adverse effect on the
reputation, business activities, financial condition, results and prospects of ING. Please carefully consider all
of the information discussed in this section “Risk Factors” for a detailed description of these risks.
Risks related to financial conditions, market environment and general economic trends
•Our revenues and earnings are affected by the volatility and strength of the economic, business,
liquidity, funding and capital markets environments of the various geographic regions in which we
conduct business, including Russia and Ukraine, as well as by changes in customer behaviour in these
regions, and an adverse change in any one region could have an impact on our business, results and
financial condition.
•Inflation, interest volatility and other interest rate changes may adversely affect our business, results
and financial condition.
•The default of a major market participant could disrupt the markets and may have an adverse effect on
our business, results and financial condition.
•Continued risk of political instability and fiscal uncertainty in Europe and the United States, as well as
ongoing volatility in the financial markets and the economy generally have adversely affected, and may
continue to adversely affect, our business, results and financial condition.
•Discontinuation of interest rate benchmarks may negatively affect our business, results and financial
condition.
•Market conditions, including those observed over the past few years, may increase the risk of loans being
impaired and have a negative effect on our results and financial condition.
•We may incur losses due to failures of banks falling under the scope of state compensation schemes.
ING Group Annual Report 2023 on Form 20-F 8
Risks related to the regulation and supervision of the Group
•Non-compliance with laws and/or regulations concerning financial services or financial institutions,
including with respect to financial economic crimes, could result in fines and other liabilities, penalties or
consequences for us, which could materially affect our business and reputation and reduce our
profitability.
•Changes in laws and/or regulations governing financial services or financial institutions or the application
of such laws and/or regulations may increase our operating costs and limit our activities.
•We are subject to additional legal and regulatory risk in certain countries with less developed or
predictable legal and regulatory frameworks.
•We are subject to the regulatory supervision of the ECB and other regulators with extensive supervisory
and investigatory powers.
•Failure to meet minimum capital and other prudential regulatory requirements as applicable to us from
time to time may have a material adverse effect on our business, results and financial condition and on
our ability to make payments on certain of our securities.
•Our US commodities and derivatives business is subject to CFTC and SEC regulation under the Dodd-Frank
Act.
•We are subject to several other bank recovery and resolution regimes that include statutory write-down
and conversion as well as other powers, which remains subject to significant uncertainties as to the
scope and impact on us.
Risks related to litigation, enforcement proceedings and investigations and to changes
in tax laws
•We may be subject to litigation, enforcement proceedings, investigations or other regulatory actions,
and adverse publicity.
•We are subject to different tax regulations in each of the jurisdictions where we conduct business, and
are exposed to changes in tax laws and risks of non-compliance with proceedings or investigations with
respect to tax laws.
•We may be subject to US tax investigation if we fail to comply with our obligations as a Participating
Financial Institution in respect of the Foreign Account Tax Compliance Act (FATCA) and as a Qualified
Intermediary in respect of other US tax regulations
•ING is exposed to the risk of claims from customers who feel misled or treated unfairly because of advice
or information received.
Risks related to the Group’s business and operations
•ING may be unable to meet internal or external aims or expectations or requirements with respect to
ESG-related matters.
•ING may be unable to adapt its products and services to meet changing customer behaviour and
demand, including as a result of ESG-related matters.
•ING’s business and operations are exposed to physical risks, including as a direct result of climate
change.
•ING’s business and operations are exposed to transition risks related to climate change.
•Operational and IT risks, such as system disruptions or failures, breaches of security, cyber attacks,
human error, changes in operational practices, inadequate controls including in respect of third parties
with which we do business or outbreaks of communicable diseases may adversely impact our
reputation, business and results.
•We are subject to increasing risks related to cybercrime and compliance with cybersecurity regulation.
•Because we operate in highly competitive markets, including our home market, we may not be able to
increase or maintain our market share, which may have an adverse effect on our results.
•We may not always be able to protect our intellectual property developed in our products and services
and may be subject to infringement claims, which could adversely impact our core business, inhibit
efforts to monetise our internal innovations and restrict our ability to capitalise on future opportunities.
•The inability of counterparties to meet their financial obligations or our inability to fully enforce our rights
against counterparties could have a material adverse effect on our results.
•A downgrade or a potential downgrade in our credit ratings could have an adverse impact on our results
and net results.
•An inability to retain or attract key personnel may affect our business and results.
•We may incur further liabilities in respect of our defined benefit retirement plans if the value of plan
assets is not sufficient to cover potential obligations, including as a result of differences between actual
results and underlying actuarial assumptions and models.
Risks related to the Group’s risk management practices
•Risks relating to our use of quantitative models or assumptions to model client behaviour for the
purposes of our market calculations may adversely impact our reputation or results.
•We may be unable to manage our risks successfully through derivatives.
Risks related to the Group’s liquidity and financing activities
•Adverse conditions in the capital and credit markets, or significant withdrawals of customer deposits,
may impact our liquidity, borrowing and capital positions, as well as the cost of liquidity, borrowings and
capital.
ING Group Annual Report 2023 on Form 20-F 9
•As a holding company, ING Groep N.V. is dependent for liquidity on payments from its subsidiaries, many
of which are subject to regulatory and other restrictions on their ability to transact with affiliates.
Additional risks relating to ownership of ING shares
•Holders of ING shares may experience dilution of their holdings and may be impacted by any share
buyback programme.
•Because we are incorporated under the laws of the Netherlands and many of the members of our
Supervisory and Executive Board and our officers reside outside of the United States, it may be difficult to
enforce judgements of US courts against ING or the members of our Supervisory and Executive Boards or
our officers.
Risk factors
Any of the risks described below could have a material adverse effect on the business activities, financial
condition, results and prospects of ING as well as ING’s reputation. ING may face a number of the risks
described below simultaneously and some risks described below may be interdependent. While the risk
factors below have been divided into categories, some risk factors could belong in more than one category
and investors should carefully consider all of the risk factors set out in this section. Additional risks of which
the Company is not presently aware, or that are currently viewed as immaterial, could also affect the
business operations of ING and have a material adverse effect on ING’s business activities, financial
condition, results and prospects. The market price of ING shares or other securities could decline due to any
of those risks including the risks described below, and investors could lose all or part of their investments.
Although the most material risk factors have been presented first within each category, the order in which
the remaining risk factors are presented is not necessarily an indication of the likelihood of the risks actually
materialising, of the potential significance of the risks or of the scope of any potential negative impact to
our business, results, financial condition and prospects.
Risks related to financial conditions, market environment and general economic trends
Our revenues and earnings are affected by the volatility and strength of the economic,
business, liquidity, funding and capital markets environments of the various geographic
regions in which we conduct business, as well as by changes in customer behaviour in
these regions, and an adverse change in any one region could have an impact on our
business, results and financial condition.
Because ING is a multinational banking and financial services corporation, with a global presence and
serving 40 million customers, corporate clients and financial institutions in 38 countries, ING’s business,
results and financial condition may be significantly impacted by turmoil and volatility in the worldwide
financial markets or in the particular geographic areas in which we operate. In Retail Banking, our products
include savings, payments, investments, loans and mortgages. In Wholesale Banking, we provide specialised
lending, tailored corporate finance, debt and equity market solutions, payments & cash management, trade
and treasury services. Negative developments in relevant financial markets and/or countries or regions have
in the past had and may in the future have a material adverse impact on our business, results and financial
condition, including as a result of the potential consequences listed below.
Factors such as inflation or deflation, interest rates, securities prices, credit spreads, liquidity spreads,
exchange rates, consumer spending, changes in customer behaviour, climate change, business investment,
real estate values and private equity valuations, government spending the volatility and strength of the
capital markets, political events and trends, supply chain disruptions, shortages, terrorism, pandemics and
epidemics (such as the recent Covid-19 pandemic) or other widespread health emergencies all impact the
business and economic environment and, ultimately, our solvency, liquidity and the amount and
profitability of business we conduct in a specific geographic region. Some of these risks are often
experienced globally as well as in specific geographic regions and are described in greater detail below
under the headings: 'Interest rate volatility and other interest rate changes may adversely affect our
business, results and financial condition'; 'Inflation and deflation may negatively affect our business, results
and financial condition'; 'Market conditions, including those observed over the past few years may increase
the risk of loans being impaired and have a negative effect on our results and financial condition'; and
'Continued risk of political instability and fiscal uncertainty in Europe and the United States, as well as
ongoing volatility in the financial markets and the economy generally have adversely affected, and may
continue to adversely affect, our business, results and financial condition'. All of these are factors in local
and regional economies as well as in the global economy, and we may be affected by changes in any one
of these factors in any one country or region, and more if more of these factors occur simultaneously and/
or in multiple countries or regions or on a global scale.
In case one or more of the factors mentioned above adversely affects the profitability of our business, this
might also result, among other things, in the following:
•inadequate reserves or provisions, in relation to which losses could ultimately be realised through profit
and loss and shareholders’ equity;
•the write-down of tax assets impacting net results and/or equity;
•impairment expenses related to goodwill and other intangible assets, impacting our net result and
equity; and/or
•movements in risk-weighted assets for the determination of required capital.
In particular, we are exposed to financial, economic, market and political conditions in the Benelux countries
and Germany, from which we derive a significant portion of our revenues in both Retail Banking and
ING Group Annual Report 2023 on Form 20-F 10
Wholesale Banking, and which could present risks of economic downturn. Though less material, we also
derive substantial revenues in the following geographic regions: United States, Türkiye, Poland and the
remainder of Eastern Europe, Southern Europe, East Asia (primarily Singapore among others) and Australia.
In an economic downturn affecting some or all of these jurisdictions, we expect that higher unemployment,
lower family income, lower corporate earnings, higher corporate and private debt defaults, lower business
investments and lower consumer spending would adversely affect the demand for banking products, and
that ING may need to increase its reserves and provisions, each of which may result in overall lower
earnings. Securities prices, real estate values and private equity valuations may also be adversely impacted,
and any such losses would be realised through profit and loss and shareholders’ equity. We also offer a
number of financial products that expose us to risks associated with fluctuations in interest rates, securities
prices, corporate and private default rates, the value of real estate assets, exchange rates and credit
spreads. Further, while the Covid-19 pandemic and related response measures have eased, the effects of
these measures (including consequences for commercial real estate occupancies and valuations as a result
of the increased prevalence of work-from-home or hybrid working arrangements) are still being felt in the
financial performance and stability of certain of our business customers. As a result, their impact may
continue to affect our business. We also have wholesale banking activities in both Russia and Ukraine, as
well as investments in Russia, some of which are denominated in local currency. In response to Russia’s
invasion of Ukraine, the international community imposed various punitive measures, including sanctions,
capital controls, restrictions on SWIFT access and restrictions on central bank activity. These measures have
significantly impacted, and may continue to significantly impact, Russia’s economy and have contributed to
heightened instability in global markets and increased inflation due in part to supply chain constraints, as
well as higher energy and commodity prices. Should prices remain elevated for an extended period, most
businesses and households would be negatively impacted, and our business in Russia and Ukraine, as well
as our broader business, may be adversely affected, including through spill-over risk to the entire wholesale
banking portfolio (e.g. commodities financing, energy and utilities and energy-consuming clients).
Environmental and/or climate risks may also directly and indirectly impact ING, for example through,
among other things, losses suffered as a result of extreme weather events, the impact of climate-related
transition risk on the risk and return profile or value of security or operations of certain categories of
customer to which ING has exposure. In addition, these risks may also increase ING’s reputational and
litigation risk if the economic activity that ING supports is not in line with community expectations or ING’s
external commitments or legal or regulatory requirements (this includes, but is not limited to, greenwashing
risk).
For further information on ING’s exposure to particular geographic areas, see Note 31 ‘Information on
geographical areas’ to the consolidated financial statements.
Market conditions, including those observed over the past few years, may increase the
risk of loans being impaired and have a negative effect on our results and financial
condition.
We are exposed to the risk that our borrowers (including sovereigns) may not repay their loans according to
their contractual terms and that the collateral securing the payment of these loans may be insufficient. We
may see adverse changes in the credit quality of our borrowers and counterparties, for example, as a result
of their inability to refinance their indebtedness or in the case of a decline in financial performance. Adverse
changes in the credit quality of our borrowers and/or decreasing collateral values would result in increased
capital requirements and provisions, and any deterioration of market conditions may lead to increasing
delinquencies, defaults and insolvencies across a range of sectors. This may lead to impairment charges on
loans and other assets, higher costs and additions to loan loss provisions. A significant increase in the size of
our provision for loan losses could have a material adverse effect on our business, results and financial
condition.
If we are significantly exposed to a concentrated set of customers or counterparties, an adverse event
affecting these parties could lead to increased losses for the Group, and adversely affect our business,
results and financial condition.
We may incur losses due to failures of banks falling under the scope of state
compensation schemes.
While prudential regulation is intended to minimise the risk of bank failures, in the event such a failure
occurs, given our size, we may incur significant compensation payments to be made under the Dutch
Deposit Guarantee Scheme (DGS), which we may be unable to recover from the bankrupt estate, and
therefore the consequences of any future failure of such a bank could be significant to ING. Such costs and
the associated costs to be borne by us may have a material adverse effect on our results and financial
condition. On the basis of the EU Directive on deposit guarantee schemes, ING pays quarterly risk-weighted
contributions into a DGS-fund. The DGS-fund is to grow to a target size of 0.8 percent of all deposits
guaranteed under the DGS, which is expected to be reached in July 2024. In case of failure of a Dutch bank,
depositor compensation is paid from the DGS-fund. If the available financial means of the fund are
insufficient, Dutch banks, including ING, may be required to pay extraordinary ex-post contributions not
exceeding 0.5 percent of their covered deposits per calendar year. In exceptional circumstances, and with
the consent of the competent authority, higher contributions may be required. However, extraordinary ex-
post contributions may be temporarily deferred if, and for so long as, they would jeopardise the solvency or
liquidity of a bank. Depending on the size of the failed bank, the available financial means in the fund, and
the required additional financial means, the impact of the extraordinary ex-post contributions on ING may
be material.
ING Group Annual Report 2023 on Form 20-F 11
Since 2015, the EU has been discussing the introduction of a pan-European deposit guarantee scheme
(EDIS), which would (partly) replace or complement national compensation schemes.
On 18 April 2023, the European Commission published its proposals for the revision of the common
framework for bank crisis management and deposit insurance (CMDI) that focuses on small and medium-
sized banks, but will affect all EU banks. The CMDI framework consists of the Bank Recovery and Resolution
Directive (BRRD), the Single Resolution Mechanism (SRMR) and the Deposit Guarantee Schemes Directive
(DGSD). The revision of the CMDI framework is part of the debate on the completion of the Banking Union
and in particular its third and missing pillar EDIS. As at the date hereof, EDIS has not yet been adopted by
the European Commission.
Risks related to the regulation and supervision of the Group
Non-compliance with applicable laws and/or regulations, including with respect to
financial economic crimes, could result in fines and other liabilities, penalties or
consequences for us, which could materially affect our business and reputation and
reduce our profitability.
ING has faced, and in the future may continue to face, the consequences of non-compliance with applicable
laws and regulations, including the potential commencement of regulatory investigations or legal
proceedings. For additional information on legal proceedings, see Note 42 ‘Legal proceedings’ in the
consolidated financial statements. There are potential risks in areas where applicable regulations may be
unclear: subject to multiple interpretations or under development; where regulations may conflict with one
another; or where regulators revise their previous guidance or courts overturn previous rulings. These could
result in our failure to meet applicable standards. Regulators and other authorities have the power to bring
investigations and/or administrative or judicial proceedings against us, which could result, among other
things, in suspension or revocation of our licences, cease and desist orders, fines, civil penalties, criminal
penalties or other disciplinary action, which could materially harm our results and financial condition as well
as ING’s reputation. If we fail to address, or appear to fail to address, any of these matters appropriately, our
reputation could be harmed and we could be subject to additional legal risk, which could, in turn, increase
the size and number of claims and damages brought against us or subject us to enforcement actions, fines
and penalties.
Furthermore, as a financial institution, we are exposed to the risk of unintentional involvement in criminal
activity in connection with financial economic crimes, including sanctions circumvention and money
laundering and the funding of terrorist and other criminal activities. The failure or perceived failure by us to
comply with legal and regulatory requirements with respect to financial economic crimes may result in
adverse publicity, claims and allegations, litigation and regulatory investigations and sanctions, which may
have a material adverse effect on our business, results, financial condition and/or prospects in any given
period. For further discussion on the impact of litigation, enforcement proceedings, investigations or other
regulatory actions with respect to financial economic crimes, see 'We may be subject to litigation,
enforcement proceedings, investigations or other regulatory actions, and adverse publicity' below.
Changes in laws and/or regulations governing financial services or financial institutions
or the application of such laws and/or regulations may increase our operating costs and
limit our activities.
We are subject to detailed banking laws and financial regulations in the jurisdictions in which we conduct
business. Regulation of the industries in which we operate has become more extensive and complex, while
also attracting supervisory scrutiny. Compliance with applicable and new laws and regulations is resource-
intensive, and may materially increase our operating costs. Moreover, these regulations intend to protect
our customers, markets and society as a whole and can limit or redirect our activities, among others,
through stricter net capital, market conduct and transparency requirements and restrictions on the
businesses in which we can operate or invest.
Our revenues and profitability and those of our industry have been and will continue to be impacted by
requirements relating to capital, additional loss-absorbing capacity, leverage, minimum liquidity and long-
term funding levels, requirements related to resolution and recovery planning, derivatives clearing and
margin rules and levels of regulatory oversight, as well as limitations on which and, if permitted, how certain
business activities may be carried out by financial institutions.
We are subject to additional legal and regulatory risk in certain countries where we
operate with less developed or predictable legal and regulatory frameworks.
In certain countries in which we operate or where our clients reside, judiciary and dispute resolution systems
may be less effective. As a result, in case of a breach of contract, we may have difficulties in making and
enforcing claims against contractual counterparties and, if claims are made against us, we might encounter
difficulties in mounting a defence against such allegations. If we become party to legal proceedings in a
market with an insufficiently developed judicial system, it could have an adverse effect on our operations
and net results.
In addition, as a result of our operations in certain countries, we are subject to risks of possible
nationalisation, expropriation, price controls, exchange controls and other restrictive government actions, as
well as the outbreak of hostilities and/or war, in these markets. In particular, we have wholesale banking
activities in both Russia and Ukraine, as well as investments in Russia, some of which are denominated in
local currency. Furthermore, the current economic environment in certain countries in which we operate
ING Group Annual Report 2023 on Form 20-F 12
may increase the likelihood for regulatory initiatives to enhance consumer protection or to protect
homeowners from foreclosures. Any such regulatory initiative could have an adverse impact on our ability
to protect our economic interest, for instance in the event of defaults on residential mortgages.
We are subject to the regulatory supervision of the ECB and other regulators with
extensive supervisory and investigatory powers.
In its capacity as principal prudential supervisor in the EU, the ECB has extensive supervisory and
investigatory powers, including the ability to issue requests for information, to conduct regulatory
investigations and on-site inspections, and to impose monetary and other sanctions. For example, under the
Single Supervisory Mechanism (SSM), the relevant (national) competent authorities, including the ECB, may
conduct stress tests and have discretion to impose capital surcharges on financial institutions for risks that
are not otherwise recognised in risk-weighted assets or other surcharges depending on the individual
situation of the bank, and take or require other measures, such as restrictions on or changes to the Group’s
business. Competent authorities may also prohibit the Group from making dividend payments to
shareholders or distributions to holders of its regulatory capital instruments if the Group fails to comply with
regulatory requirements, in particular with supervisory actions, minimum capital requirements (including
buffer requirements) or with liquidity requirements, or if there are shortcomings in its governance and risk
management processes. A failure to comply with prudential or conduct regulations could have a material
adverse effect on the Group’s business, results and financial condition.
Failure to meet minimum capital and other prudential regulatory requirements as
applicable to us from time to time may have a material adverse effect on our business,
results and financial condition and on our ability to make payments on certain of our
securities.
ING is subject to a variety of regulations that require us to comply with minimum requirements for capital
(own funds) and additional loss-absorbing capacity, as well as for liquidity, and to comply with leverage
restrictions. In addition, such capital, liquidity and leverage requirements and their application and
interpretation may change. Any changes may require us to maintain more capital or to raise a different
type of capital by disqualifying existing capital instruments from continued inclusion in regulatory capital,
requiring replacement with new capital instruments that meet the new criteria. Sometimes changes are
introduced subject to a transitional period during which the new requirements are being phased in,
gradually progressing to a fully phased-in, or fully-loaded, application of the requirements.
Any failure to comply with these requirements, or to adapt to changes in such requirements, may have a
material adverse effect on our business, results and financial condition, and may require us to seek
additional capital. Failures to meet minimum capital or other prudential requirements may also result in ING
being prohibited from making payments on certain of our securities. Because implementation phases and
transposition into EU or national regulation where required may often involve a lengthy period, the impact
of changes in capital, liquidity and leverage regulations on our business, results and financial condition, and
on our ability to make payments on certain of our securities, is often unclear.
Our US commodities and derivatives business is subject to CFTC and SEC regulation
under the Dodd-Frank Act.
Our affiliate ING Capital Markets LLC is registered with the Commodity Futures Trading Commission (CFTC) as
a swap dealer and is subject to CFTC regulation of the off-exchange derivatives market pursuant to Title VII
of the US Dodd-Frank Wall Street Reform and Consumer Protection Act (Dodd-Frank). Operating as a swap
dealer requires compliance with CFTC regulatory requirements, which may be burdensome, impose
additional compliance costs and could adversely affect the profitability of this business, as well as exposing
ING to the risk of non-compliance with these regulations.
ING Capital Markets LLC is also registered with the SEC as a security-based swap dealer. Operating as a
security-based swap dealer requires compliance with SEC regulatory requirements, which may be
burdensome, impose additional compliance costs and could adversely affect the profitability of this
business, as well as exposing ING to the risk of non-compliance with these regulations. While most of these
SEC requirements apply to ING Capital Markets LLC, in addition to its CFTC swap dealer requirements, SEC
rules have permitted an Alternative Compliance Mechanism that allows for compliance, subject to eligibility
requirements, with CFTC capital and margin rules applying to swap dealers in lieu of SEC capital and margin
rules applying to security-based swap dealers. ING Capital Markets LLC has elected to use the Alternative
Compliance Mechanism. However, should ING Capital Markets LLC in the future be ineligible for the
Alternative Compliance Mechanism it would be subject to SEC security-based swap dealer rules for margin,
capital, and related financial reporting instead of the CFTC swap dealer rules which could be more capital-
intensive.
On 15 December 2021, the SEC proposed new rules that would for the first time impose public reporting
requirements for some significant security-based swaps positions. The rules would apply even to trades
between non-US counterparties, including ING Bank, provided that the issuer of the reference securities
underlying the security-based swaps is organised in the US, the issuer of the reference securities underlying
the security-based swaps has its principal place of business in the US, or the securities are in certain
categories registered with the SEC.
These proposed regulations, if adopted in their current form, could constrain trading activity in security-
based swaps. In addition, there are, or may be in the future, regulatory requirements or limitations related
to other categories of equity derivatives, such as options or forwards, that could similarly constrain trading
activity in such instruments as well. These various requirements and limitations with respect to equity
ING Group Annual Report 2023 on Form 20-F 13
derivatives generally could have a significant impact on the liquidity and utility of these markets, materially
impacting ING’s business in this market.
In addition, position limits requirements have been imposed by the CFTC for enumerated listed futures
referencing twenty-five physical commodities. In addition, on 1 January 2023, these position limits were
extended to certain positions in swaps that are “economically equivalent” to the enumerated futures
contracts. The position limits on futures and related swaps could limit ING’s position sizes in these swaps
referencing specified physical commodities and similarly limit the ability of counterparties to utilise certain
of our products, to the extent that hedging exemptions from the position limits are unavailable. Any of the
foregoing factors, and any further regulatory developments with respect to commodities and derivatives,
could have a material impact on our business, results and financial condition.
We are subject to several other bank recovery and resolution regimes that include
statutory write-down and conversion as well as other powers, which remains subject to
significant uncertainties as to scope and impact on us.
We are subject to several recovery and resolution regimes, including the Single Resolution Mechanism (SRM),
the ‘Bank Recovery and Resolution Directive’ (BRRD) as implemented in national legislation, such as the
Dutch Financial Supervision Act. The SRM applies to banks that are supervised by the ECB under the SSM,
with the aim of ensuring an orderly resolution of failing banks at minimum cost for taxpayers and the real
economy. The BRRD establishes a common framework for the recovery and resolution of banks within the
European Union, with the aim of providing supervisory authorities and resolution authorities with common
tools and powers to address banking crises pre-emptively to safeguard financial stability and minimise
taxpayers’ exposure to losses. Any application of statutory write-down and conversion or other powers
would not be expected to constitute an event of default under our securities entitling holders to seek
repayment. If any of these powers were to be exercised in respect of ING, there could be a material adverse
effect on both ING and on holders of ING securities, including through a material adverse effect on credit
ratings and/or the price of our securities. Investors in our securities may lose their investment if resolution
measures are taken under current or future regimes.
Risks related to litigation, enforcement proceedings and investigations and to changes
in tax laws
We may be subject to litigation, enforcement proceedings, investigations or other
regulatory actions, and adverse publicity.
We are involved in governmental, regulatory, arbitration and legal proceedings and investigations involving
claims by and against us which arise in the ordinary course of our businesses, including in connection with
our activities as financial services provider, employer, investor and taxpayer. As a financial institution, we
are subject to specific laws and regulations governing financial services and/or financial institutions. See
'Risks related to the regulation and supervision of the Group. Changes in laws and/or regulations governing
financial services or financial institutions or the application of such laws and/or regulations may increase our
operating costs and limit our activities' and 'Our US commodities and derivatives business is subject to CFTC
and SEC regulation under the Dodd-Frank Act' above. Financial reporting irregularities involving other large
and well-known companies, possible findings of government authorities in various jurisdictions which are
investigating several processes, notifications made by whistleblowers, increasing regulatory and law
enforcement scrutiny of ‘know your customer’ anti-money laundering regulations, tax evasion, prohibited
transactions with countries or persons subject to sanctions, and bribery or other anti-corruption measures
and anti-terrorist-financing procedures and their effectiveness, regulatory investigations of the banking
industry, and litigation that arises from the failure or perceived failure by us to comply with legal,
regulatory, tax and compliance requirements could result in adverse publicity and reputational harm, lead
to increased regulatory supervision, affect our ability to attract and retain customers and employees and
maintain access to the capital markets, result in cease and desist orders, claims, enforcement actions, fines
and civil and criminal penalties, other disciplinary action or have other material adverse effects on us in
ways that are not predictable. With respect to sanctions, Russia’s invasion of Ukraine has fundamentally
changed the global political landscape, resulting in a world-wide response, whereby new and significant
sanctions packages were imposed against Russia and Belarus during 2022 and 2023. During 2023, there
have been several noteworthy developments highlighting the increasing focus of the EU, US, and other
governments on the potential circumvention of sanctions against Russia, and the roles of third countries
and companies in facilitating the circumvention or undermining of such sanction’s measures. This has
prompted a concerted effort by governments to impose pressure on companies operating in these
jurisdictions, and to stop the sanctions measures from being sidestepped by targeted Russian parties. The
EU introduced additional measures combating sanctions circumvention and several locations have come
into focus as potential diversion hubs. While various sanctions include grace periods before full compliance
is required, there is no guarantee that ING will be able to implement all required procedures within the
applicable grace periods. In addition, some claims and allegations may be brought by or on behalf of a class
and claimants may seek large or indeterminate amounts of damages, including compensatory, liquidated,
treble and punitive damages. Our reserves for litigation liabilities may prove to be inadequate. Claims and
allegations, should they become public, need not be well founded, true or successful to have a negative
impact on our reputation. In addition, press reports and other public statements that assert some form of
wrongdoing could result in inquiries or investigations by regulators, legislators and law enforcement
officials, and responding to these inquiries and investigations, regardless of their ultimate outcome, is time
consuming and expensive. Adverse publicity, claims and allegations, litigation and regulatory investigations
and sanctions may have a material adverse effect on our business, results, financial condition and/or
prospects in any given period.
ING Group Annual Report 2023 on Form 20-F 14
We are subject to different tax regulations in each of the jurisdictions where we
conduct business, and are exposed to changes in tax laws, and risks of non-compliance
with or proceedings or investigations with respect to, tax laws.
Changes in tax laws (including case law) and tax treaties (including the termination thereof) could increase
our taxes and our effective tax rates and could materially impact our tax receivables and liabilities as well as
deferred tax assets and deferred tax liabilities, which could have a material adverse effect on our business,
results and financial condition. Changes in tax laws could also make certain ING products less attractive,
which could have adverse consequences for our businesses and results. On 7 June 2021, the Dutch
government received a formal notice of termination of the Dutch-Russian tax treaty from Russia, and as a
result, the tax treaty was terminated as of 1 January 2022. The termination of the Dutch-Russian tax treaty
or any other similar developments may have adverse effects on ING and ING’s customers.
Because of the geographic spread of its business, ING may be subject to tax audits, investigations and
procedures in numerous jurisdictions at any point in time. Although we believe that we have adequately
provided for all our tax positions, the ultimate resolution of these audits, investigations and procedures may
result in liabilities which are different from the amounts recognized. In addition, increased bank taxes in
countries where the Group is active result in increased taxes on ING’s banking operations, which could
negatively impact our operations, financial condition and liquidity.
We may be subject to tax investigations under EU, US and local laws if we fail to comply
with our obligations
Due to the nature of its business, ING is subject to various provisions of EU, US, and other local tax laws in
relation to its customers. These include amongst others the Foreign Account Tax Compliance Act (“FATCA”),
which requires ING to provide certain information for the US Internal Revenue Service (IRS), the Qualified
Intermediary (QI) requirements, which require withholding tax on certain US-source payments, and the
Common Reporting Standards (CRS) which requires ING to provide certain information to local tax
authorities. Failure to comply with these requirements and regulations could harm our reputation and could
subject the Group to enforcement actions, fines and penalties, which could have a material adverse effect
on our business, reputation, revenues, results, financial condition and prospects.
ING is exposed to the risk of claims from customers or stakeholders who feel misled or
treated unfairly because of advice or information received.
Our products and services, including banking products and advice services for third-party products are
exposed to claims from customers who might allege that they have received insufficient advice or
misleading information from advisers (both internal and external) as to which products were most
appropriate for them, or that the terms and conditions of the products, the nature of the products or the
circumstances under which the products were sold, were misrepresented to them. When new financial
products are brought to the market, it is ING’s policy to engage in a multidisciplinary product approval
process in connection with the development and distribution of such products, including production of
appropriate marketing and communication materials. Notwithstanding these processes, customers may
make claims against ING if the products do not meet their expectations , either at the purchase/execution of
the product and/or through the life of the product. Customer protection regulations, as well as changes in
interpretation and perception by both the public at large and governmental authorities of acceptable
market practices, influence customer expectations
Products distributed through person-to-person sales forces have a higher exposure to such claims as the
sales forces may provide face-to-face financial planning and advisory services. Complaints may also arise if
customers feel that they have not been treated reasonably or fairly, or that the duty of care has not been
complied with. While a considerable amount of time and resources have been invested in reviewing and
assessing historical sales practices and products that were sold in the past, and in the maintenance of risk
management, legal and compliance procedures to monitor current sales practices, there can be no
assurance that all of the issues associated with current and historical sales practices have been or will be
identified, nor that any issues already identified will not be more widespread than presently estimated.
The negative publicity associated with any sales practices, any compensation payable in respect of any
such issues and regulatory changes resulting from such issues, has had and could have a material adverse
effect on our reputation, business, results, financial condition and prospects. For additional information
regarding legal proceedings or claims, see Note 45 ‘Legal proceedings’ to the consolidated financial
statements.
Risks related to the Group’s business and operations
ING may be unable to meet internal or external aims or expectations or requirements
with respect to ESG-related matters.
Environmental, Social and Governance (ESG) is an area of significant and increased focus for governments
and regulators, investors, ING’s customers and employees, and other stakeholders or third parties (e.g., non-
governmental organisations or NGOs). As a result, an increasing number of laws, regulations and legislative
actions have been introduced to address climate change, sustainability and other ESG-related matters,
including in relation to the financial sector’s operations and strategy. Such recent regulations include the EU
Sustainable Finance Disclosure Regulation (SFDR), EU Taxonomy regulation and EU Green Bond Standards,
which broadly focus on disclosure obligations, standardized definitions and classification frameworks for
environmentally sustainable activities, and the EU Corporate Sustainability Reporting Directive (CSRD), which
requires certain companies, including us, to disclose information on what they see as the risks and
ING Group Annual Report 2023 on Form 20-F 15
opportunities arising from social and environmental issues, and on the impact of their activities on people
and the environment. Third parties may pursue litigation against ING in connection with ESG-related
matters, such as the recently announced potential claims by Friends of the Earth Netherlands
(Milieudefensie) in connection with financing provided by ING to certain companies whose business is reliant
on fossil fuels.
These laws, regulations and legislative frameworks may directly and indirectly impact the business
environment in which ING operates and may expose ING to significant risks, including amongst others,
greenwashing risk and the risk of litigation if governmental standards or community expectations are not
met.
National or international regulatory actions or developments may also result in financial institutions coming
under increased pressure from internal and external stakeholders regarding the management and
disclosure of their ESG risks and related lending and investment activities. ING may from time to time
disclose ESG-related initiatives or aims in connection with the conduct of its business and operations.
However, there is no guarantee that ING will be able to implement such initiatives or meet such aims within
anticipated timeframes, or at all. ING may fail to fulfil internal or external ESG-related initiatives, aims or
expectations, or may be perceived to fail to do so, or may fail to adequately or accurately report
performance or developments with respect to such initiatives, aims or expectations. ING could therefore be
criticised or held responsible for the scope of its initiatives or goals regarding such matters. In addition, ING
might face requests for specific strategies, plans or commitments to address ESG-related matters, which
may or may not be viewed as satisfactory to the relevant internal and external stakeholders (including
NGOs). Any of these factors may have an adverse impact on ING’s reputation and brand value, or on ING’s
business, financial condition and operating results.
ING may be unable to adapt its products and services to meet changing customer
behaviour and demand, including as a result of ESG-related matters.
Customers or other counterparties may increasingly assess sustainability or other ESG-related matters in
their economic decisions. For instance, customers may choose investment products or services based on
sustainability or other ESG criteria, or may look at a financial institution’s ESG-related lending strategy when
choosing to make deposits. To remain competitive and to safeguard its reputation, ING is required to
continuously adapt its business strategy, products and services to respond to emerging, increasing or
changing sustainability and other ESG-related demands from customers, investors and other stakeholders.
However, there is no guarantee that ING’s current or future products or services will meet applicable ESG-
related regulatory requirements, customer preferences or investor expectations.
ING’s business and operations are exposed to transition risks related to climate change.
The transition to a low-carbon or net-zero economy gives rise to risks and uncertainties associated with
climate change-related laws, regulations and oversight, changing or new technologies, and shifting
customer sentiment. For instance, ING may be required to change its lending portfolio to comply with new
climate change-related regulations and other ESG-related demands from customers, investors and other
stakeholders. As a result, it might be unable and unwilling to lend to certain prospective customers, or lead
to the termination of certain existing relationships with certain customers. This could result in claims or legal
challenges from such customers against ING. This transition may also adversely impact the business and
operations of ING’s customers and other counterparties. Further, there is a risk that changing community
standards and market expectations could lead to a reduction in demand and a decline in valuations for
certain assets, which may affect the value of collateral we hold or the financial strength of certain of our
portfolios. If ING fails to adequately factor in such risks in its lending or other business decisions, ING could
be exposed to losses.
The low carbon or net zero transition may also require ING to modify or implement new compliance
systems, internal controls and procedures or governance frameworks. The integration and automation of
internal governance, compliance, and disclosure and reporting frameworks across ING could lead to
increased operational costs for ING and other execution and operational risks. The implementation cost of
these systems may especially be higher in the near term as ING seeks to adapt its business, or address
overlapping, duplicative or conflicting regulatory or other requirements in this fast-developing area.
Furthermore, ING’s ongoing implementation of appropriate systems, controls and frameworks increasingly
requires ING to develop adequate climate change-related risk assessment and modelling capabilities (as
there is currently no standard approach or methodology available), and to collect customer, third party or
other data. There are significant risks and uncertainties inherent in the development of new risk modelling
methodologies and the collection of data, potentially resulting in systems or frameworks that could be
inadequate, inaccurate or susceptible to incorrect customer, third party or other data.
Any delay or failure in developing, implementing or meeting ING’s climate change-related commitments
and regulatory requirements may have a material adverse impact on our business, financial condition,
operating results and reputation, and lead to climate change or ESG-related investigations, enforcement
proceedings or litigation.
ING’s business and operations are exposed to physical risks, including as a direct result
of climate change.
ING’s business and operations may be exposed to the impacts of physical risks arising from climate and
weather-related events, including heatwaves, droughts, flooding, storms, rising sea levels, other extreme
weather events or natural disasters, and to the impacts of physical risks arising from the environmental
ING Group Annual Report 2023 on Form 20-F 16
degradation, including loss of biodiversity, water or resources scarcity, pollution or waste management.
Such physical risks could disrupt ING’s business continuity and operations or impact ING’s premises or
property portfolio, as well as its customers’ property, business or other financial interests. These risks could
potentially result in impairing asset values, financial losses, declining creditworthiness of customers and
increased defaults, delinquencies, write-offs and impairment charges in ING’s portfolio, etc. In particular,
changing climate patterns resulting in more frequent and extreme weather events, such as the severe
flooding that occurred in Western Europe in July 2021, the long-lasting bushfires in Australia in February
2021 or the severe flooding in the eastern states of Australia in early 2022, could lead to unexpected
business interruptions or losses for ING or its customers.
For a description of physical risks to our operations and business other than resulting from natural disasters
as a result of climate change, see 'Operational and IT risks, such as systems disruptions or failures, breaches
of security, cyber attacks, human error, changes in operational practices, inadequate controls including in
respect of third parties with which we do business or outbreaks of communicable diseases may adversely
impact our reputation, business and results' below.
Operational and IT risks, such as systems disruptions or failures, breaches of security,
human error, changes in operational practices, inadequate controls including in respect
of third parties with which we do business or outbreaks of communicable diseases may
adversely impact our reputation, business and results.
Operational and IT risks are inherent to our business. Our clients depend on our ability to process and report
a large number of transactions efficiently and accurately. In addition, we routinely transmit, receive and
store personal, confidential and proprietary information electronically. Losses can result from inadequately
trained or skilled personnel, IT failures (including due to a cyber attack), inadequate or failed internal control
processes and systems (including, as the role of Artificial Intelligence in the finance industry and in our
business increases, any errors as a result of incomplete, inaccurate, or otherwise flawed outputs from the
algorithms and data sets utilized), regulatory breaches, human errors, employee misconduct, including
fraud, or from natural disasters or other external events that interrupt normal business operations. Such
losses may adversely affect our reputation, business and results.
We depend on the secure processing, storage and transmission of confidential and other information in our
computer systems and networks. The equipment and software used in our computer systems and networks
may not always be capable of processing, storing or transmitting information as expected. Despite our
business continuity plans and procedures, certain of our computer systems and networks may have
insufficient recovery capabilities in the event of a malfunction or loss of data. We are consistently managing
and monitoring our IT risk profile globally. ING is subject to increasing regulatory requirements including EU
General Data Protection Regulation (GDPR) and EU Payment Services Directive (PSD2) and the new Digital
Operational Resilience Act (DORA) which will enter into force in January 2025. Failure to appropriately
manage and monitor our IT risk profile could affect our ability to comply with these regulatory
requirements, to securely and efficiently serve our clients or to timely, completely or accurately process,
store and transmit information, and may adversely impact our reputation, business and results. For further
description of the particular risks associated with cybercrime, which is a specific risk to ING as a result of its
strategic focus on technology and innovation, see 'We are subject to increasing risks related to cybercrime
and compliance with cybersecurity regulation' below.
In addition, as finance industry participants are increasingly incorporating Artificial Intelligence into their
processes and systems, the risk of data and information leaks is correspondingly increasing. Our or our
customers’ sensitive, proprietary, or confidential information could be leaked, disclosed, or revealed as a
result of or in connection with our or our third-party providers’ use of generative or other Artifical
Intelligence technologies. Any such information that we input into a third-party generative or other Artificial
Intelligence or machine learning platform could be revealed to others, including if information is used to
train the third party's Artificial Intelligence models. Additionally, where an Artificial Intelligence model
ingests personal information and makes connections using such data, those technologies may reveal other
sensitive, proprietary, or confidential information generated by the model.
Widespread outbreaks of communicable diseases may impact the health of our employees, increasing
absenteeism, or may cause a significant increase in the utilisation of health benefits offered to our
employees, either or both of which could adversely impact our business. Further, as a result of the Covid-19
pandemic, a significant portion of our staff continue to work from home on a full- or part-time basis, which
may raise operational risks, including with respect to information security, data protection, availability of
key systems and infrastructure integrity. In addition, other events including unforeseeable and/or
catastrophic events can lead to an abrupt interruption of activities, and our operations may be subject to
losses resulting from such disruptions. Losses can result from destruction or impairment of property,
financial assets, trading positions, and the loss of key personnel. If our business continuity plans are not able
to be implemented, are not effective or do not sufficiently take such events into account, losses may
increase further.
We are subject to increasing risks related to cybercrime and compliance with
cybersecurity regulation.
Like other financial institutions and global companies, we are regularly the target of cyber attacks, which is
a specific risk to ING as a result of its strategic focus on technology and innovation. In particular, threats
from Distributed Denial of Service (DDoS), targeted attacks (also called Advanced Persistent Threats) and
ransomware have intensified worldwide, and attempts to gain unauthorised access and the sophistication
of techniques used for such attacks is increasing. Cyber threats are constantly evolving and the techniques
used in these attacks change, develop and evolve rapidly, including the use of emerging technologies, such
as advanced forms of Artificial Intelligence and quantum computing. The new cyber risks introduced by
these changes in technology require us to devote significant attention to identification, assessment and
ING Group Annual Report 2023 on Form 20-F 17
analysis of the risks and implementation of corresponding preventative measures. We have faced, and
expect to continue to face, an increasing number of cyber attacks (both successful and unsuccessful) as we
have further digitalised. This includes the continuing expansion of our mobile- and other internet-based
products and services, as well as our usage and reliance on cloud technology.
Cybersecurity, the use and safeguarding of customer data and data privacy have become the subject of
increasing legislative and regulatory focus. The EU’s second Payment Services Directive (PSD2), GDPR and
DORA are examples of such regulations. The resilience of financial institutions against ransomware attacks
is now subject of the yearly stress test executed by the ECB in 2024. In certain locations where ING is active,
there are additional local regulatory requirements and legislation on top of EU regulations that must be
followed for business conducted in that jurisdiction. Some of these legislations and regulations may be
conflicting due to local regulatory interpretations. We may become subject to new EU and local legislation
or regulation concerning cybersecurity, security of customer data in general or the privacy of information
we may store or maintain. Compliance with such new legislation or regulation could increase the Group’s
compliance cost. Failure to comply with new and existing legislation or regulation could harm our reputation
and could subject the Group to enforcement actions, fines and penalties.
ING may be exposed to the risks of misappropriation, unauthorised access, computer viruses or other
malicious code, cyber attacks and other external attacks or internal breaches for purposes of
misappropriating assets or sensitive information, corrupting data, or impairing operational performance,
each of which could have a security impact. These events could also jeopardise our confidential information
or that of our clients or our counterparties. These events can potentially result in financial loss and harm to
our reputation, hinder our operational effectiveness, result in regulatory censure, compensation costs or
fines resulting from regulatory investigations and could have a material adverse effect on our business,
reputation, revenues, results, financial condition and prospects. Even when we are successful in defending
against cyber attacks, such defence may consume significant resources or impose significant additional
costs on ING.
Although the Covid-19 pandemic has now largely subsided, there has been an increase in the digital
behaviour of our customers leading to reduced traffic in branches. Over 95 percent of our customers now
interact with us via digital channels only. This increased reliance on digital banking and remote working may
increase the risk of cybersecurity breaches, loss of personal data and related reputational risk. If any of
these risks were to materialise that may adversely affect our business, results and financial condition.
Because we operate in highly competitive markets, including our home market, we may
not be able to increase or maintain our market share, which may have an adverse
effect on our results.
There is substantial competition in the Netherlands and the other countries in which we do business for the
types of wholesale banking, retail banking, investment banking and other products and services we provide.
Customer loyalty and retention can be influenced by several factors, including brand recognition,
reputation, relative service levels, the prices and attributes of products and services, scope of distribution,
credit ratings and actions taken by existing or new competitors (including non-bank or financial technology
competitors). A decline in our competitive position as to one or more of these factors could adversely
impact our ability to maintain or further increase our market share, which would adversely affect our
results. Such competition is most pronounced in our more mature markets of the Netherlands, Belgium, the
rest of Western Europe and Australia. In recent years, however, competition in emerging markets, such as
Asia and Central and Eastern Europe, has also increased as large financial services companies from more
developed countries have sought to establish themselves in markets which are perceived to offer higher
growth potential, and as local institutions have become more sophisticated and competitive and proceeded
to form alliances, mergers or strategic relationships with some of our competitors. The Netherlands is our
largest market. Our main competitors in the banking sector in the Netherlands are ABN AMRO Bank and
Rabobank.
Competition could also increase due to new entrants (including non-bank and financial technology
competitors) in the markets that may have new operating models that are not burdened by potentially
costly legacy operations and that are subject to reduced regulation. New entrants may rely on new
technologies, advanced data and analytic tools, lower cost to serve, less extensive oversight from regulators
compared to the frameworks established in respect of traditional banks and/or faster processes to challenge
traditional banks. Developments in technology have also accelerated the use of new business models, and
ING may not be successful in adapting to this pace of change or may incur significant costs in adapting its
business and operations to meet such changes. For example, new business models have been observed in
retail payments, consumer and commercial lending (such as peer-to-peer lending), foreign exchange and
low-cost investment advisory services. In particular, the emergence of disintermediation in the financial
sector resulting from new banking, lending and payment solutions offered by rapidly evolving incumbents,
challengers and new entrants, in particular with respect to payment services and products, and the
introduction of disruptive technology may impede our ability to grow or retain our market share and impact
our revenues and profitability.
Increasing competition in the markets in which we operate (including from non-banks and financial
technology competitors) may significantly impact our results if we are unable to match the products and
services offered by our competitors. Future economic turmoil may accelerate additional consolidation
activity. Over time, certain sectors of the financial services industry have become more concentrated, as
institutions involved in a broad range of financial services have been acquired by or merged into other firms
ING Group Annual Report 2023 on Form 20-F 18
or have declared bankruptcy. These developments could result in our competitors gaining greater access to
capital and liquidity, expanding their ranges of products and services, or gaining geographic diversity. We
may experience pricing pressures as a result of these factors in the event that some of our competitors seek
to increase market share by reducing prices, which may have a material adverse impact on our business,
results and financial condition.
We may not always be able to protect our intellectual property developed in our
products and services and may be subject to infringement claims, which could
adversely impact our core business, inhibit efforts to monetize our internal innovations
and restrict our ability to capitalize on future opportunities.
In the conduct of our business, we rely on a combination of contractual rights with third parties and
copyright, trademark, trade name, patent and trade secret laws to establish and protect our intellectual
property, which we develop in connection with our products and services. Third parties may infringe or
misappropriate our intellectual property. We may have to litigate to enforce and protect our copyrights,
trademarks, trade names, patents, trade secrets and know-how or to determine their scope, validity or
enforceability. In that event, we may be required to incur significant costs, and our efforts may not prove
successful. The inability to secure or protect our intellectual property assets could have an adverse effect on
our core business and our ability to compete, including through the monetisation of our internal
innovations.
We may also be subject to claims made by third parties for (i) patent, trademark or copyright infringement,
(ii) breach of copyright, trademark or licence usage rights, or (iii) misappropriation of trade secrets. Any such
claims and any resulting litigation could result in significant expense and liability for damages. If we were
found to have infringed or misappropriated a third-party patent or other intellectual property right
(including where we or a third party have used generative Artificial Intelligence outputs based on data for
which the generative model may not have had consent), we could in some circumstances be enjoined from
providing certain products or services to our customers or from utilising and benefiting from certain
methods, processes, copyrights, trademarks, trade secrets or licences. Alternatively, we could be required to
enter into costly licensing arrangements with third parties or to implement a costly workaround. Any of
these scenarios could have a material adverse effect on our business and results and could restrict our
ability to pursue future business opportunities.
The inability of counterparties to meet their financial obligations or our inability to fully
enforce our rights against counterparties could have a material adverse effect on our
results.
Third parties that have an payment obligations to ING, or obligations to return money, securities or other
assets, may not pay or perform under their obligations. These parties include the issuers and guarantors
(including sovereigns) of securities we hold, borrowers under loans originated, reinsurers, customers, trading
counterparties, securities lending and repurchase counterparties, counterparties under swaps, credit default
and other derivative contracts, clearing agents, exchanges, clearing houses and other financial
intermediaries. Defaults by one or more of these parties on their obligations to us due to bankruptcy, lack of
liquidity, downturns in the economy or real estate values, continuing low oil or other commodity prices,
operational failure or other factors, or even rumours about potential defaults by one or more of these
parties or regarding a severe distress of the financial services industry generally, could have a material
adverse effect on our results, financial condition and liquidity. Given the high level of interdependence
between financial institutions, we are and will continue to be subject to the risk of deterioration of the
commercial and financial soundness, or perceived soundness, of sovereigns and other financial services
institutions. This is particularly relevant to our franchise as an important and large counterparty in equity,
fixed income and foreign exchange markets, including related derivatives.
We routinely execute a high volume of transactions, such as unsecured debt instruments, derivative
transactions and equity investments with counterparties and customers in the financial services industry,
including brokers and dealers, commercial and investment banks, mutual and hedge funds, insurance
companies, institutional clients, futures clearing merchants, swap dealers, and other institutions, resulting in
large periodic settlement amounts, which may result in us having significant credit exposure to one or more
of such counterparties or customers. As a result, we could face concentration risk with respect to liabilities or
amounts we expect to collect from specific counterparties and customers. We are exposed to increased
counterparty risk as a result of recent financial institution failures and weakness and will continue to be
exposed to the risk of loss if counterparty financial institutions fail or are otherwise unable to meet their
obligations. As a result of the Russian invasion of Ukraine and related international response measures,
including sanctions and capital controls, we may be exposed to increased risk of default of counterparties
located in Russia and Ukraine, counterparties of which the ultimate parent is located in Russia or may be
considered effectively controlled or influenced through Russian involvement, and other counterparties in
sectors affected by the response measures. Also, liquidity or currency controls enforced by the Russian
central bank may impact Russian companies’ ability to pay. In addition, we have counterparty exposure to
Russian entities in connection with foreign exchange derivatives for future receipt of foreign currencies
against Russian rouble (RUB). Remaining at risk for ING at year-end 2023 is €0.4 billion local equity and €1.3
billion credit exposures booked outside of Russia, and €0.6 billion with clients in Ukraine. A default by, or
even concerns about the creditworthiness of, one or more of these counterparties or customers or other
financial services institutions could therefore have an adverse effect on our results or liquidity.
ING Group Annual Report 2023 on Form 20-F 19
With respect to secured transactions, our credit risk may be exacerbated when the collateral held by us
cannot be liquidated or is liquidated at prices not sufficient to recover the full amount of the loan or
derivative exposure due to us. We also have exposure to a number of financial institutions in the form of
unsecured debt instruments, derivative transactions and equity investments. For example, we hold certain
hybrid regulatory capital instruments issued by financial institutions which permit the issuer to cancel
coupon payments on the occurrence of certain events or at their option. The ECB has indicated that, in
certain circumstances, it may require these financial institutions to cancel payment. If this were to happen,
we expect that such instruments may experience ratings downgrades and/or a drop in value and we may
have to treat them as impaired, which could result in significant losses. There is no assurance that losses on,
or impairments to the carrying value of, these assets would not materially and adversely affect our
business, results or financial condition.
In addition, we are subject to the risk that our rights against third parties may not be enforceable in all
circumstances. The deterioration or perceived deterioration in the credit quality of third parties whose
securities or obligations we hold could result in losses and/ or adversely affect our ability to rehypothecate
or otherwise use those securities or obligations for liquidity purposes. A significant downgrade in the credit
ratings of our counterparties could also have a negative impact on our income and risk weighting, leading to
increased capital requirements. While in many cases we are permitted to require additional collateral from
counterparties that experience financial difficulty, disputes may arise as to the amount of collateral we are
entitled to receive and the value of pledged assets. Also in this case, our credit risk may also be exacerbated
when the collateral we hold cannot be liquidated at prices sufficient to recover the full amount of the loan or
derivative exposure due to us, which is most likely to occur during periods of illiquidity and depressed asset
valuations, such as those experienced during the financial crisis of 2008. The termination of contracts and
the foreclosure on collateral may subject us to claims. Bankruptcies, downgrades and disputes with
counterparties as to the valuation of collateral tend to increase in times of market stress and illiquidity. Any
of these developments or losses could materially and adversely affect our business, results, financial
condition, and/or prospects.
Ratings are important to our business for a number of reasons, and a downgrade or a
potential downgrade in our credit ratings could have an adverse impact on our results
and net results.
Credit ratings represent the opinions of rating agencies regarding an entity’s ability to repay its
indebtedness. Our credit ratings are important to our ability to raise capital and funding through the
issuance of debt and to the cost of such financing. In the event of a downgrade, the cost of issuing debt will
increase, having an adverse effect on our net results. Certain institutional investors may also be obliged to
withdraw their deposits from ING following a downgrade, which could have an adverse effect on our
liquidity. They can also have lower risk appetite for our debt notes, leading to lower purchases of (newly
issued) debt notes. We have credit ratings from S&P, Moody’s Investor Service and Fitch Ratings. Each of the
rating agencies reviews its ratings and rating methodologies on a recurring basis and may decide on a
downgrade at any time.
As rating agencies continue to evaluate the financial services industry, it is possible that rating agencies will
heighten the level of scrutiny that they apply to financial institutions, increase the frequency and scope of
their credit reviews, request additional information from the companies that they rate and potentially
adjust upward the capital and other requirements employed in the rating agency models for maintenance
of certain ratings levels. It is possible that the outcome of any such review of us would have additional
adverse ratings consequences, which could have a material adverse effect on our results and financial
condition. We may need to take actions in response to changing standards or capital requirements set by
any of the rating agencies, which could cause our business and operations to suffer. We cannot predict
what additional actions rating agencies may take, or what actions we may take in response to the actions
of rating agencies.
Furthermore, ING’s assets are risk-weighted. Downgrades of these assets could result in a higher risk-
weighting, which may result in higher capital requirements. This may impact net earnings and the return on
capital, and may have an adverse impact on our competitive position.
An inability to retain or attract key personnel may affect our business and results.
ING Group relies to a considerable extent on the quality of its senior management, such as members of the
executive committee, and management in the jurisdictions which are material to ING’s business and
operations. The success of ING Group’s operations is dependent, among other things, on its ability to attract
and retain highly qualified personnel. Competition for key personnel in most countries in which ING Group
operates, and globally for senior management, is intense. ING Group’s ability to attract and retain key
personnel, in senior management and in particular areas such as technology and operational management,
client relationship management, finance, risk and product development, is dependent on a number of
factors, including prevailing market conditions and compensation packages offered by companies
competing for the same talent.
The increasing restrictions on, and public and political scrutiny of, remuneration (especially in the
Netherlands), may continue to have an impact on existing ING Group remuneration policies and individual
remuneration packages for personnel. For example, under the EU’s amended Shareholder Rights Directive,
known as SRD II, which came into effect on 10 June 2019, ING is required to hold a shareholder binding vote
on ING’s Executive Board remuneration policy and Supervisory Board remuneration policy at least every four
years. Furthermore the shareholders have an advisory vote on ING’s remuneration report annually. This
may restrict our ability to offer competitive compensation compared with companies (financial and/or non-
financial) that are not subject to such restrictions and it could adversely affect ING Group’s ability to retain
or attract key personnel, which, in turn, may affect our business and results.
ING Group Annual Report 2023 on Form 20-F 20
We may incur further liabilities in respect of our defined benefit retirement plans if the
value of plan assets is not sufficient to cover potential obligations, including as a result
of differences between actual results and underlying actuarial assumptions and
models.
ING Group companies operate various defined benefit retirement plans covering the post-employment
benefits of a number of our employees. The liability recognised in our consolidated balance sheet in respect
of our defined benefit plans is the present value of the defined benefit obligations at the balance sheet date,
less the fair value of each plan’s assets, together with adjustments for unrecognised actuarial gains and
losses and unrecognised past service costs. We determine our defined benefit plan obligations based on
internal and external actuarial models and calculations using the projected unit credit method. Inherent in
these actuarial models are assumptions, including discount rates, rates of increase in future salary and
benefit levels, mortality rates and consumer price index. These assumptions are based on available market
data and are updated annually. Nevertheless, the actuarial assumptions may differ significantly from actual
results due to changes in market conditions, economic and mortality trends and other assumptions. Any
changes in these assumptions could have a significant impact on our present and future liabilities and costs
associated with our defined benefit plans.
Risks related to the Group’s risk management practices
Risks relating to our use of quantitative models or assumptions to model client
behaviour for the purposes of our market calculations may adversely impact our
reputation or results.
We use quantitative methods, systems or approaches that apply statistical, economic financial, or
mathematical theories, techniques and assumptions to process input data into quantitative estimates.
Errors in the development, implementation, use or interpretation of such models, or from incomplete or
incorrect data, can lead to inaccurate, noncompliant or misinterpreted model outputs, which may adversely
impact our reputation and results. In addition, we use assumptions in to model client behaviour for the risk
calculations in our banking books. Assumptions are used to determine the interest rate risk profile of savings
and current accounts and to estimate the embedded option risk in the mortgage and investment portfolios.
Assumptions based on past client behaviour may not always be a reliable indicator of future behaviour. The
realisation or use of different assumptions to determine client behaviour could have a material adverse
effect on the calculated risk figures and, ultimately, our future results or reputation. Furthermore, we may
be subject to risks related to changes in the laws and regulations governing the risk management practices
of financial institutions. For further information, see 'Risks related to the regulation and supervision of the
Group – Changes in laws and/or regulations governing financial services or financial institutions or the
application of such laws and/or regulations may increase our operating costs and limit our activities' above.
As noted there, regulation of the industries in which we operates is becoming increasingly more extensive
and complex, while also attracting supervisory scrutiny. Compliance failures may lead to changes in the
laws and regulations governing the risk management practices and materially increase our operating costs.
We may be unable to manage our risks successfully through derivatives.
We employ various economic hedging strategies with the objective of mitigating the market risks that are
inherent in our business and operations. These risks include currency fluctuations, changes in the fair value
of our investments, the impact of interest rates, equity markets and credit spread changes, the occurrence
of credit defaults and changes in client behaviour. We seek to control these risks by, among other things,
entering into a number of derivative instruments, such as swaps, options, futures and forward contracts,
including, from time to time, macro hedges for parts of our business, either directly as a counterparty or as
a credit support provider to affiliate counterparties. Developing an effective strategy for dealing with these
risks is complex, and no strategy can completely insulate us from risks associated with those fluctuations.
Our hedging strategies also rely on assumptions and projections regarding our assets, liabilities, general
market factors and the creditworthiness of our counterparties that may prove to be incorrect or prove to be
inadequate. Accordingly, our hedging activities may not have the desired beneficial impact on our results or
financial condition. Poorly designed strategies or improperly executed transactions could actually increase
our risks and losses. Hedging strategies involve transaction costs and other costs, and if we terminate a
hedging arrangement, we may also be required to pay additional costs, such as transaction fees or
breakage costs. There have been periods in the past, and it is likely that there will be periods in the future,
during which we have incurred or may incur losses on transactions, possibly significant, after taking into
account our hedging strategies. Further, the nature and timing of our hedging transactions could actually
increase our risk and losses. Hedging instruments we use to manage product and other risks might not
perform as intended or expected, which could result in higher realised or unrealised losses, such as credit
value adjustment risks or unexpected P&L effects, and unanticipated cash needs to collateralise or settle
such transactions. Adverse market conditions can limit the availability and increase the costs of hedging
instruments, and such costs may not be recovered in the pricing of the underlying products being hedged.
In addition, hedging counterparties may fail to perform their obligations, resulting in unhedged exposures
and losses on positions that are not collateralised. As such, our hedging strategies and the derivatives that
we use or may use may not adequately mitigate or offset the risks they intend to cover, and our hedging
transactions may result in losses.
Our hedging strategy additionally relies on the assumption that hedging counterparties remain able and
willing to provide the hedges required by our strategy. Increased regulation, market shocks, worsening
market conditions, and/or other factors that affect or are perceived to affect the financial condition, liquidity
and creditworthiness of ING may reduce the ability and/or willingness of such counterparties to engage in
hedging contracts with us and/or other parties, affecting our overall ability to hedge our risks and adversely
affecting our business, results and financial condition.
ING Group Annual Report 2023 on Form 20-F 21
Risks related to the Group’s liquidity and financing activities
We depend on the capital and credit markets, as well as customer deposits, to provide
the liquidity and capital required to fund our operations, and adverse conditions in the
capital and credit markets, or significant withdrawals of customer deposits, may
impact our liquidity, borrowing and capital positions, as well as the cost of liquidity,
borrowings and capital.
Adverse capital market conditions have in the past affected, and may in the future affect, our cost of
borrowed funds and our ability to borrow on a secured and unsecured basis, thereby impacting our ability
to support and/or grow our businesses. Furthermore, although interest rates are still relatively low by
historical standards and have been since the financial crisis in 2008, interest rates are rising and we have
experienced, and may continue to experience, increased funding costs due in part due to the withdrawal of
perceived government support of financial institutions in the event of future financial crises. In addition,
liquidity in the financial markets has also been negatively impacted as market participants and market
practices and structures adjust to new regulations.
We need liquidity to fund new and recurring business, to pay our operating expenses, interest on our debt
and dividends on our capital stock, maintain our securities lending activities and replace certain maturing
liabilities. Without sufficient liquidity, we will be forced to curtail our operations and our business will suffer.
The principal sources of our funding include a variety of short-and long-term instruments, including deposit
fund, repurchase agreements, commercial paper, medium- and long-term debt, subordinated debt
securities, capital securities and shareholders’ equity.
In addition, because we rely on customer deposits to fund our business and operations, the confidence of
customers in financial institutions may be tested in a manner that may adversely impact our liquidity and
capital position. Consumer confidence in financial institutions may, for example, decrease due to our or our
competitors’ failure to communicate to customers the terms of, and the benefits and risks to customers of,
complex or high-fee financial products. Reduced confidence could have an adverse effect on our liquidity
and capital position through withdrawal of deposits, in addition to our revenues and results. Because a
significant percentage of our customer deposit base is originated via internet banking, a loss of customer
confidence may result in a rapid withdrawal of deposits over the internet.
In the event that our current resources do not satisfy our needs, we may need to seek additional financing.
The availability of additional financing will depend on a variety of factors, such as market conditions, the
general availability of credit, the volume of trading activities, the overall availability of credit to the financial
services industry, our credit ratings and credit capacity, as well as the possibility that customers or lenders
could develop a negative perception of our long- or short-term financial prospects. Also see under the
heading 'Ratings are important to our business for a number of reasons, and a downgrade or a potential
downgrade in our credit ratings could have an adverse impact on our results and net results'. Similarly, our
access to funds may be limited if regulatory authorities or rating agencies take negative actions against us.
If our internal sources of liquidity prove to be insufficient, there is a risk that we may not be able to
successfully obtain additional financing on favourable terms, or at all. Any actions we might take to access
financing may, in turn, cause rating agencies to re-evaluate our ratings.
Disruptions, uncertainty or volatility in the capital and credit markets may also limit our access to capital.
Such market conditions may in the future limit our ability to raise additional capital to support business
growth, or to counterbalance the consequences of losses or increased regulatory capital and rating agency
capital requirements. This could force us to (i) delay raising capital, (ii) reduce, cancel or postpone payment
of dividends on our shares, (iii) reduce, cancel or postpone interest payments on our other securities, (iv)
issue capital of different types or under different terms than we would otherwise, or (v) incur a higher cost of
capital than in a more stable market environment. This would have the potential to decrease both our
profitability and our financial flexibility. Our results, financial condition, cash flows, regulatory capital and
rating agency capital position could be materially adversely affected by disruptions in the financial markets.
Furthermore, regulatory liquidity requirements in certain jurisdictions in which we operate are remain
stringent, undermining our efforts to maintain centralised management of our liquidity. These
developments may cause trapped pools of liquidity and capital, resulting in inefficiencies in the cost of
managing our liquidity and solvency, and hinder our efforts to integrate our balance sheet. An example of
such trapped liquidity includes our operations in Germany where German regulations impose separate
liquidity requirements that restrict ING’s ability to move a liquidity surplus out of the German subsidiary.
As a holding company, ING Groep N.V. is dependent for liquidity on payments from its
subsidiaries, many of which are subject to regulatory and other restrictions on their
ability to transact with affiliates.
ING Groep N.V. is a holding company and, therefore, depends on dividends, distributions and other
payments from its subsidiaries to fund dividend payments to its shareholders and to fund all payments on
its obligations, including debt service obligations.
ING Groep N.V.’s ability to obtain funds to meet its obligations depends on legal and regulatory restrictions
applicable to ING Groep N.V.’s subsidiaries. Many of ING Groep N.V.’s direct and indirect subsidiaries,
including certain subsidiaries of ING Bank N.V., may be subject to laws that restrict dividend payments, as
well as requirements with respect to capital and liquidity levels. For example, certain local governments and
regulators have taken steps and may take further steps to “ring fence” or impose minimum internal total
loss-absorbing capacity on the local affiliates of a foreign financial institution to protect clients and creditors
of such affiliates in the event of financial difficulties involving such affiliates or the broader banking group.
Increased local regulation and supervision have therefore limited and may in the future further limit the
ING Group Annual Report 2023 on Form 20-F 22
ability to move capital and liquidity among affiliated entities and between ING Groep N.V. and its direct and
indirect subsidiaries, limit the flexibility to structure intercompany and external activities of ING as otherwise
deemed most operationally efficient, and increase in the overall level of capital and liquidity required by ING
on a consolidated basis.
Lower earnings of a local entity may also reduce the ability of such local entity to make dividends and
distributions to ING Groep N.V. Other restrictions, such as restrictions on payments from subsidiaries or
limitations on the use of funds in client accounts, may also apply to distributions to ING Groep N.V. from its
subsidiaries.
ING Groep N.V. has also in the past guaranteed and may in the future continue to guarantee the payment
obligations of some of its subsidiaries, including ING Bank N.V. Any such guarantees may require ING Groep
N.V. to provide substantial funds or assets to its subsidiaries or the creditors or counterparties of these
subsidiaries at a time when the guaranteed subsidiary is in need of liquidity to fund its own obligations.
Finally, ING Groep N.V., as the resolution entity of ING, has an obligation to remove impediments to
resolution and to improve resolvability. Regulatory authorities have required and may continue to require
ING to increase capital or liquidity levels at the level of the resolution entity or at particular subsidiaries. This
may result in, among other things, the issuance of additional long-term debt issuance at the level of ING
Groep N.V. or particular subsidiaries.
Additional risks relating to ownership of ING shares
Holders of ING shares may experience dilution of their holdings and may be impacted
by any share buyback programme.
ING’s AT1 Securities may, under certain circumstances, convert into equity securities. Such conversion would
dilute the ownership interests of existing holders of ING shares and such dilution could be substantial.
Additionally, any conversion, or the anticipation of the possibility of a conversion, could depress the market
price of ING shares. Furthermore, we may undertake future equity offerings with or without subscription
rights. In case of equity offerings without subscription rights, holders of ING shares may suffer dilutions. In
case of equity offerings with subscription rights, holders of ING shares in certain jurisdictions, however, may
not be entitled to exercise such rights unless the rights and the related shares are registered or qualified for
sale under the relevant legislation or regulatory framework. Holders of ING shares in these jurisdictions may
suffer dilution of their shareholding should they not be permitted to, or otherwise chose not to, participate
in future equity offerings with subscription rights.
Any share repurchases could affect the price of our ordinary shares, ADSs or other securities and increase
trading price volatility. The existence of a share buyback programme could also cause the price of our
ordinary shares, ADSs or other securities to be higher than it would be in the absence of such a share
buyback programme, and could potentially reduce the market liquidity of our ordinary shares, ADSs or other
securities. There can be no assurance that any share buybacks will enhance shareholder value because the
market price of our ordinary shares or ADSs may decline below the levels at which we repurchase any
ordinary shares or ADSs.
In addition, ING cannot guarantee that any future share buyback programme will be fully consummated.
The timing and amount of share repurchases pursuant to a share buyback programme will depend upon a
number of factors, including market, business conditions, and the trading price of the our ordinary shares or
ADSs. A share buyback programme may also be suspended or terminated at any time, and any such
suspension or termination could negatively affect the trading price of, increase trading price volatility of or
reduce the market liquidity of our ordinary shares, ADSs or other securities. Additionally, a share buyback
programme could diminish our cash reserves, which may impact our ability to finance future growth and to
pursue possible future strategic opportunities.
Because we are incorporated under the laws of the Netherlands and many of the
members of our Supervisory and Executive Board and our officers reside outside of the
United States, it may be difficult to enforce judgments against ING or the members of
our Supervisory and Executive Boards or our officers.
Most of our Supervisory Board members, our Executive Board members and some of the experts named in
this Annual Report, as well as many of our officers are persons who are not residents of the United States,
and most of our and their assets are located outside the United States. As a result, investors may not be
able to serve process on those persons within the United States or to enforce in the United States judgments
obtained in US courts against us or those persons based on the civil liability provisions of the US securities
laws.
Investors also may not be able to enforce judgments of US courts under the US federal securities laws in
courts outside the United States, including the Netherlands. The United States and the Netherlands do not
currently have a treaty providing for the reciprocal recognition and enforcement of judgments (other than
arbitration awards) in civil and commercial matters. Therefore, a final judgment for the payment of money
rendered by any federal or state court in the United States based on civil liability, whether or not predicated
solely upon the US federal securities laws, would not be enforceable in the Netherlands unless the
underlying claim is re-litigated before a Dutch court. However, under current practice, the courts of the
Netherlands may be expected to render a judgment in accordance with the judgment of the relevant US
court, provided that such judgment (i) is a final judgment and has been rendered by a court which has
established its jurisdiction on the basis of internationally accepted grounds of jurisdictions, (ii) has not been
rendered in violation of elementary principles of fair trial, (iii) is not contrary to the public policy of the
Netherlands, and (iv) is not incompatible with (a) a prior judgment of a Netherlands court rendered in a
ING Group Annual Report 2023 on Form 20-F 23
dispute between the same parties, or (b) a prior judgment of a foreign court rendered in a dispute between
the same parties, concerning the same subject matter and based on the same cause of action, provided
that such prior judgment is not capable of being recognised in the Netherlands. It is uncertain whether this
practice extends to default judgments as well.
Based on the foregoing, there can be no assurance that US investors will be able to enforce against us or
members of our board of directors, officers or certain experts named herein who are residents of the
Netherlands or countries other than the United States any judgments obtained in US courts in civil and
commercial matters, including judgments under the US federal securities laws.
In addition, there is doubt as to whether a Dutch court would impose civil liability on us, the members of our
board of directors, our officers or certain experts named herein in an original action predicated solely upon
the US federal securities laws brought in a court of competent jurisdiction in the Netherlands against us or
such members, officers or experts, respectively.
ING Group Annual Report 2023 on Form 20-F 24
Item 4.Information on the Company
A.History and development of the company
General
ING Groep N.V. was established as a Naamloze Vennootschap (a Dutch public limited liability company) on
March 4, 1991. ING Groep N.V. is incorporated under the laws of the Netherlands.
The corporate site of ING, www.ing.com, provides news, investor relations and general information about
the company.
ING is required to file certain documents and information with the United States Securities and Exchange
Commission (SEC). These filings relate primarily to periodic reporting requirements applicable to issuers of
securities, as well as to beneficial ownership reporting requirements as a holder of securities. The most
common filings we submit to the SEC are Forms 6-K and 20-F (periodic reporting requirements). The SEC
maintains an internet site that contains reports, proxy and information statements, and other information
regarding issuers that file electronically with the SEC at http://www.sec.gov. ING’s electronic filings are
available on the SEC’s internet site under CIK ID 0001039765 (ING Groep NV).
The official address of ING Group is:
ING Groep N.V. Bijlmerdreef 106 1102 CT Amsterdam P.O. Box 1800, 1000 BV Amsterdam The Netherlands |
Telephone +31 20 563 9111 |
The name and address of ING Group’s agent for service of process in the United States in connection with
ING’s registration statement on Form F-3 is:
ING Financial Holdings Corporation 1133 Avenue of the Americas New York, NY 10036 United States of America |
Telephone +1 646 424 6000 |
Changes in the composition of the Group
For information on changes in the composition of the Group, reference is made to Note 43 'Consolidated
companies and businesses acquired and divested'.
ING Group Annual Report 2023 on Form 20-F 25
B.Business Overview
ING’s purpose is empowering people to stay a step ahead in life and in
business. Our strategy – making the difference for people and the
planet – is built around this purpose.
In a world that is constantly changing, we aim to be digital and sustainability pioneers, skilled at adapting to
the trends impacting our business. Our two overarching priorities are providing customers with a superior
customer experience (CX) and aiming to put sustainability at the heart of what we do. These priorities are
supported by four ’enablers’: providing seamless digital services, using our scalable technology and
operations, staying safe and secure, and unlocking our people’s full potential.
Providing customers with a superior experience
As an organisation, we need to be customer focused – after all, customers are who we’re here for, our
reason for being. We want to provide them with the products and services they need: executing payments
and other transactions, keeping and managing their money and savings and extending loans and making
investments. Our aim is to do all that with an experience that is easy, instant, personal and relevant. We
realise that different types of customers have different needs. We can make a difference by helping them to
plan for the future and make informed financial decisions, and by providing suitable financial products and
customised advice. Read more on how we cater to our customers’ needs, private individuals, small
businesses and large corporates in 'Superior customer experience'.
Putting sustainability at the heart of what we do
We have a role in society to define new ways of doing business that align with economic changes, growth
and social impact. Climate change is one of the world’s biggest challenges, threatening societies as we know
them today. We’re determined to be a banking leader in building a sustainable future for customers, society
and the environment. We want to lead by example by striving for net zero in our own operations. We also
want to play our part in the low-carbon transformation that’s necessary to achieve a sustainable future,
aiming to steer our financing towards meeting global climate goals and working with clients to achieve their
own sustainability goals. Read more on our sustainability efforts in the 'ESG overview'.
Our enablers
Providing seamless digital services
We know that we can serve our customers better if we use robust, ‘always-on’ channels, providing data-
enabled personalised experiences and end-to-end digitalising processes, with human intervention only
where needed or desired.
Using scalable technology and operations
A technology and operations foundation that is modular and scalable brings many benefits, including
support for providing a superior customer experience, increased safety, speeding up time-to-volume,
shortening time-to-market, and lowering cost-to-serve.
Staying safe and secure
For a bank, trust is the starting point, the most basic requirement for all stakeholders. People trust us with
their money and with their data, and keeping that safe is crucial. As a gatekeeper to the financial system,
we play an important role in the collective fight against fraud, cybercrime, and financial and economic
crimes.
Unlocking our people’s full potential
People are our greatest asset. We seek to attract, develop and retain the best people, and our sustained
success is founded on their continued commitment. What will unlock their full potential is our inclusive
Orange culture where everyone has the opportunity to develop and have impact for our customers and
society. In 2023, we focused on three pillars to deliver for our people: ‘talent & leadership’, ‘culture &
organisation’ and ‘Employee Experience’. Read more about how we unlock our people’s full potential in
'Social'.
ING Group Annual Report 2023 on Form 20-F 26
Superior customer experience
We want to provide customers with an experience that is easy, instant,
personal and relevant. What this looks like depends on the type of
customer. For private individuals and small businesses, our emphasis is
predominantly on mobile banking, while for mid-corporate and
Wholesale Banking clients it’s all about personal relationships and
sector and network expertise.
What we strive for
In response to changing expectations in today’s always-on digital society, ING wants to offer customers an
experience that is easy, instant, personal and relevant.
Easy is about taking the complexity out of banking, making it intuitive, transparent and understandable so
customers feel confident. For example, we aim to clearly price products and services, avoid complicated
jargon and always be accessible.
Instant is about customers having solutions at their fingertips that put them in the driver’s seat of their
finances and make them feel in control by allowing them, for instance, to switch seamlessly between self-
service banking on the app and personal advice in a branch. Different groups of customers have different
requirements. For private individuals and some Business Banking clients (i.e. the self-employed and small
and medium-sized enterprises), the emphasis is on mobile, for both products and services.
Personal is about recognising customers as individuals and getting to know their needs, goals and
challenges so they feel valued. For example, to tailor messaging to their specific situation.
Relevant is about bringing value to customers, anticipating their needs, and proactively providing the right
insights, advice and solutions at the right time, making them feel empowered. For example, by guiding
them on important financial decisions, such as re-financing a mortgage in an environment of rapidly
increasing interest rates.
For Business Banking mid-corporates and Wholesale Banking clients, the emphasis remains on deepening
client relationships, offering deep sector knowledge and networking expertise, tailored products and advice,
supported by seamless digital delivery and services.
Retail Banking – Private Individuals
For customers using Retail Banking products and services, ING intends to provide a seamless digital, mobile-
led experience that’s easy, instant, personal and relevant. We want to engage with our customers on mobile
at every stage of their journey and give them personalised products and services based on relevant, data-
driven insights. Seamless end-to-end digital delivery of customer services is an enabler for a superior
customer experience to earn, and keep, the primary relationship.
Earning ‘primary relationships’ with customers is an important driver for profitable growth. It leads to deeper
relationships, greater customer satisfaction, and ultimately customers choosing us for more of their banking
needs. We want to be our customers’ first partner for their financial business. In Retail Banking, primary
customers have at least two active ING products. One of these should be a current account into which they
deposit regular income. In 2023, the number of primary customers increased by 750,000 over the course of
a year to 15.3 million. Particularly strong growth was achieved in Germany (+252,000), Spain (+129,000),
and the Netherlands (+99,000).
A seamless digital, mobile-led experience
Reflecting customer demand, we are continuously improving our mobile capabilities. In 2023, over 62
percent of customers used mobile banking only (mobile device login through the app or mobile device login
through the website), compared to 58 percent in 2022. High adoption of mobile banking is especially visible
in Türkiye (90 percent), Romania (84 percent), the Netherlands (69 percent), and Spain (66 percent).
In the Netherlands, Australia, Germany, and Spain, over 60 percent of new customers are now fully digitally
onboarded, due to continuous improvements in the mobile onboarding flow. Those improvements aim to
make digital onboarding available to as many new customers as possible. Similar efforts are underway in
other Retail countries.
More customers are using remote video advice and digital self-service channels. We can connect with
customers across multiple channels through ING’s cloud-based customer interaction platform for phone,
chat and video contacts. Our global customer interaction platform is used across seven Retail countries and
in Wholesale Banking to harmonise the experience and ensure customers receive the same services
everywhere. This year, we continued to expand the platform’s footprint, rolling out voice functionality in
Germany and Romania, and chat/chatbot capabilities in Italy. In total, the platform facilitated more than
100,000 video meetings and over 1.8 million authenticated chat conversations in 2023.
ING Group Annual Report 2023 on Form 20-F 27
Daily banking and savings products
Everyday Roundup is a digital functionality that aims to make saving simpler, and it is now used by more
than 1.5 million customers in seven countries (Poland, Australia, Germany, Romania, Türkiye, Spain and,
since the fourth quarter of 2023, the Netherlands). It works by rounding up every transaction on a
customer’s current account and automatically transferring the difference to their savings account. In Spain,
we also connected Everyday Roundup to investment products to help customers who want to start
investing, little by little.
In March, ING in Australia introduced Everyday Roundup to Charity, becoming the first Australian bank to
launch a charitable round-up feature. This enables customers to round up eligible everyday card
transactions to the nearest dollar or five dollars and donate the difference to a charity.
ING in Germany expanded its current account to include a sustainable option. Customers of the so-called
‘Future current account’ pay one additional euro per month, and can choose between various social and
ecological projects that are selected in partnership with the social impact company share®. These projects
are supported by the amount equal to the monthly payment made by the customer. Additionally, a
sustainable use of deposits is earmarked to sustainability criteria defined by ING Germany. These take the
UN principles for responsible banking into account and are aligned with the EU taxonomy. By the end of
2023, 21,000 ‘Future current accounts’ were opened, resulting in more than €90 million in sustainable
deposits that are matched with sustainable loans and investments.
Dealwise, a smart shopping platform available in the app in Romania, Germany and Belgium, offers
personalised deals, supporting customers to save on their daily spending.
Mortgage products
In Belgium, we launched the HomeHub functionality – a new online journey that takes the customer
through the mortgage application process in just four steps, including a conditional approval. A customer
can now simulate this process using the Quick & Easy Simulator, as well as make an appointment using the
recently launched Call me back flow. Customers can get an overview of required documents and check the
status of their application via the HomeHub.
In the Netherlands, orientating customers who have made an appointment via mobile app or web can now
digitally prepare for their appointment by uploading documents based on a personalised document list.
In Belgium and Romania, digitalising partial repayments simplified this process for customers, enabling
them to make changes online to reduce a monthly charge and/or reduce the duration of a loan. This gives
our clients more control of their financing without hassle. In Belgium, these digitalisation efforts led to over
98 percent of early repayment requests being processed automatically or with minimal manual effort (only
one simple check by the employee). In Romania, customers who visit an ING office monthly to make an
early repayment with loan duration reduction can now make the same changes online.
ING in Poland introduced a fully digital process for customers that apply for a change to their mortgage
agreement. In the second half of 2023, almost all customers (>99 percent) conducted the change of the
mortgage tenor online. Additionally, since the fourth quarter of 2023, customers in Poland can also change
their repayment account and/or repayment date online.
Investment products
ING customers have access to smart digital investment tools to make investing accessible. Leveraging the
Dutch investment platform, entry products Easy Invest and Self Invest are now also available in Belgium.
Easy Invest is the most basic product for clients with no experience of investing independently. It consists of
an online risk assessment that helps clients choose the risk level they can tolerate when starting to invest in
one of ING’s mutual funds. Self-Invest is ING’s online brokerage platform offering a wide selection of
international equities for clients to invest in directly by themselves.
In Germany, our self-execution investment tool is serving more than two million clients. Additionally, our
clients in Germany can make use of our robo-adviser, offered in partnership with online wealth manager
Scalable Capital.
Insurance products
ING works together with several insurance partners in various markets to offer our customers compelling
insurance products, based on local customer needs. We offer insurance related to bank products as well as
a range of standalone non-life insurance policies. We enhanced our insurance proposition in 2023, for
example, by launching car insurance in Spain, improving our home, car, health and travel insurance in the
Netherlands, and adding pet insurance to our product offering in Türkiye.
ING Group Annual Report 2023 on Form 20-F 28
Retail Banking – Private Banking & Wealth Management
Private Banking & Wealth Management offers banking services and personalised wealth management to
affluent and (ultra) high-net worth individuals and their entities in the Netherlands, Belgium and
Luxembourg. Through dedicated relationship managers and the support of product specialists and account
management, Private Banking aims to give customers access to a diverse range of products and services
suited to their needs. This includes tailor-made and standardised investment advice based on
comprehensive financial planning. We have been awarded best private bank in the Netherlands by PWM/The
Banker (a Financial Times magazine) and in the MT1000 ranking.
In 2023, the Netherlands introduced investing in private markets, allowing wealthy customers (from €2.5
million in advice/discretionary portfolio management) to invest in, for example, private equity, private credit,
and infrastructure. ING works closely with renowned international players in this regard. Private markets’
importance in the economy is increasing worldwide, and adding our services fits in with ING Private
Banking’s ambition to serve customers even better with innovative investment solutions.
In Belgium, we introduced a new concept of family business events. Over 12 events, 600 family business
owners were invited to exchange views on the transition of a family business to the next generation. Our
customers appreciated these events, combining both the business and private wealth needs.
Retail Banking – Business Banking
The Business Banking segment covers the following three sub-segments:
Self-employed and micro companies: Independent professionals or small companies that employ up to 10
people and have a turnover up to one million euros.
SMEs: Small to medium-sized companies that employ between 10 and 250 people and have a turnover of
between one and 10 million euros.
Mid-corporates: Sophisticated larger companies employing more than 250 employees with a turnover of
between 10 million and 250 million euros.
Business Banking serves customers in seven markets: the Netherlands, Belgium, Luxembourg, Poland,
Romania, Türkiye and Germany. Our customers are focused on managing and growing their businesses
profitably in an ever-changing and increasingly complex environment. Our goal is to support them through
relevant, seamless, trusted and personal financial solutions in key moments.
We apply a needs-based customer segmentation approach that differentiates between basic, and more
complex and/or specific needs. This enables customers to ’self-serve’ using our strong digital foundation but
also access remote and face-to-face advice, when needed.
We are therefore advancing our digitalisation roadmap to create a seamless customer experience by
digitalising key customer journeys: from onboarding to customer in life, and from lending solutions to daily
banking and payments. We have placed emphasis on critical customer journeys, including digital
onboarding in the Netherlands, Belgium, Poland, and Türkiye. Furthermore, we offer instant and fast-track
lending solutions in the Netherlands, Belgium, Poland, Romania, and Türkiye to cater to our customers’
lending requirements. These solutions have significantly enhanced our end-to-end digital rates for lead-to-
cash and customer-acquisition journeys.
For more complex and specific needs, especially for bigger SMEs and mid-corporates, we offer customised
relationship banking. This not only covers tailored solutions and advice, but also sector expertise and access
to ING’s international network.
Customer Experience (CX) day
As part of ING’s focus on continuous improvement of the customer journey, we hold an annual customer
experience (CX) day. On 28 September, ING held its fourth global CX day where over 8,000 colleagues from
across the bank, together with customers, put their collective minds together to come up with tangible
ideas to delight our customers and make their experiences easy, instant, personal and relevant. The event
attracted employees from Retail Banking, Wholesale Banking, ING Hubs, and support functions all around
the world. Together, they identified over 400 improvements to delight our customers, some of which were
created and tested on the day.
Measuring NPS
One of the ways we measure our ability to deliver a superior customer experience is through the Net
Promoter Score (NPS). The NPS indicates whether customers would recommend ING to others. We compare
our NPS to selected peers in each market.
Our ambition is to achieve a number one NPS ranking in all 10 of our Retail markets. In 2023, ING ranked
number one in five of our 10 Retail markets: Australia, Poland, Germany, Romania and Spain. ING ranks in
the top three in another four markets: the Netherlands, Luxembourg, Italy and Belgium (all ranked third). In
Australia, Belgium and Italy, ING’s NPS improved versus last year, while Germany, Romania and Spain
maintained their strong NPS.
ING Group Annual Report 2023 on Form 20-F 29
We ran a separate NPS programme in 32 Wholesale Banking markets throughout 2023, to ensure a broad
coverage of our client base. ING’s relationship NPS score rose to an all-time high of 72 (on a scale of -100 to
+100), compared to last year’s score of 67. All regions showed an increase in NPS and response rate, with
the latter rising from 71 percent to 76 percent overall. The number of detractors decreased from 54 to 33.
The NPS result aids our efforts to continuously improve our customer service and product offering.
Wholesale Banking
ING’s ambition is to provide corporate clients and financial institutions with the financial solutions they need
across their value chains. Underpinning our work is the ‘ING difference’, three major characteristics that offer
value to clients:
1.Our global reach, with local experts: no matter where clients are, our network of experts offers them a
seamless local experience with a global view.
2.We’re sector experts: clients trust us to provide tailored solutions to meet their needs.
3.We’re sustainability pioneers: we’re not just leaders in sustainable finance; we work hand-in-hand with
clients to address some of the most pressing issues in the world today.
ING’s Wholesale Banking business line network covers three regions: EMEA, APAC and the Americas. To bring
our local experts closer to clients, we focused on hiring more talent for client-facing teams in 2023 – such as
for our trade and commodity finance team in Switzerland, our sustainable finance team in Asia, and our
investment banking team in the Netherlands.
Wholesale Banking clients benefit from our deep sector knowledge of over seven sectors and 29 sub-sectors,
including: commodities, food and agriculture; corporate sector coverage; energy; infrastructure and real
estate; financial institutions; technology, media, telecom and healthcare; transport and logistics. Together
with our target sector research capabilities and our client segmentation model, we aim to help clients
navigate the highs and lows of economic cycles, providing them with relevant advice, data-driven insights
and customised, integrated solutions that support their business ambitions.
As a large wholesale bank, with billions of euros flowing through our balance sheet, ING aims to play an
important role in accelerating our clients’ transitions to net zero by 2050. In addition to the financial support
and incentives we provide, we help and advise clients by putting our sector expertise, international network,
climate-action experience and other sustainability-related insights to work for them. This includes our Terra
approach, which uses science-based and sector-agreed pathways for getting our in-scope sector portfolios
in sync with reaching net zero by 2050, and guides us in making business decisions that aim to accelerate
the transition. To better assess the climate performance of our clients and use these insights to identify risks
and opportunities for supporting them in their transitions, we have developed a bespoke ‘client transition
plan’ tool. This online platform is where we have started to centrally collect, assess and monitor the publicly
disclosed climate transition plans of each client. For more information on Terra and the client transition tool,
see ‘Environment’.
Our support comes in the form of financing too. In 2023, we saw €115 billion of volume mobilised and closed
792 sustainability transactions. One example is the green loan provided by ING as sole bank for the
implementation of RetuRO Sistem Garantie Returnare, an important circular-economy project in Romania.
The loan will finance the set-up of regional centres, which will aim to collect, sort and prepare more than six
billion returned plastic, glass and metal beverage packages for recycling each year.
In 2023, ING won the Euromoney Award for Best Bank for ESG in Germany, as well as five awards at the
Global Finance Magazine Sustainable Finance Awards. These included the global award for Outstanding
Leadership in Sustainable Bonds for the third year running, three regional awards in Western Europe for
Outstanding Leadership in Sustainable Finance, Sustainable Bonds and ESG-related Loans respectively, and
a country award for Best Bank for Sustainable Finance in the Netherlands. Our client segmentation model
aligns our strengths with client needs and plays an important role in deepening relationships. ING’s way of
working allows us to respond rapidly to our clients’ changing needs, and to close the gap between local and
global specialists, making an impact in our markets.
Strengthening our foundations
As part of our efforts to strengthen our product foundations, we continued to develop our proprietary
platform, InsideBusiness, in 2023. This included setting up alerts for payments, improving user verification to
comply with local anti-money laundering regulation, and making it easier to download lending notices,
among other updates. Additionally, we rolled out real-time instant payments in the Netherlands, Germany,
Italy, Luxembourg and Portugal, and digitalised the account-opening journey in the Netherlands, Germany
and Belgium.
To further streamline and simplify the infrastructure in our Financial Markets business, we continued to
enhance our digital ecosystem in 2023, from introducing new process automation, APIs and algorithms
across sales and e-trading to providing better pricing, greater stability, and more insights.
Following the creation of our dedicated Payment & Settlements Services (PSS) organisation in 2022, we
continued to implement strategic change within Transaction Services in 2023 by laying the groundwork for
a new structure that took effect on 1 January 2024. This includes a separation of commercial product
management activities from delivery activities, enabling us to evolve our product offering to deliver
competitive and seamless digital solutions for clients at pace, amid a rapidly changing macroeconomic
environment.
We established Capital Markets & Advisory (CMA) in 2023 as the single centre of excellence for our advisory
business and related financing globally across Wholesale Banking. We want to be the strategic partner for
ING Group Annual Report 2023 on Form 20-F 30
our clients in transformational moments in the boardroom and also accelerate our capital velocity
deliverables. Under CMA, we’re upgrading and refocusing our commercial engine, including selective senior
hires, to ensure we have the right capabilities to support our clients throughout their lifecycle.
Finding new ways to help customers stay a step ahead
ING is proud of its innovative culture and considers this an important contributor to a superior customer
experience. To keep surprising customers in a fast-moving competitive environment, we need to keep
finding fresh ways to translate emerging trends and technologies into new business opportunities.
Therefore we also experiment with new and emerging technology (e.g. digital assets, generative AI),
translating it into bite-sized use cases, with central oversight.
For incremental-type innovations that support our strategic priorities of CX and sustainability, such as
digitalising processes, we believe this is best done within individual business lines (Retail, Business Banking,
and Wholesale Banking) where we are closer to the customer.
Blacksmith was established in 2017, as part of ING Labs Singapore, and offers a single platform to digitalise
and automatically apply policy requirements to KYC processes. It also delivers standardised and actionable
customer due diligence (CDD) files. In 2023, Blacksmith reduced ING’s time spent on desk research as part of
the CDD process by 48 percent. This removed a lot of the manual work for analysts, who must typically
collect data and analyse how its attributes are risk rated according to ING policies. Blacksmith also
onboarded Skandinaviska Enskilda Banken (SEB) to digitalise the KYC processes for financial institutions.
Also in 2023, ING sold Invisible Tickets, a next-gen ticketing and payment solution that allows commuters to
pay for the cost of travel using their mobile phone, to Tata Consultancy Services (TCS), which is part of
India’s largest multinational group. TCS will be taking the Invisible Tickets solution to the next level by
introducing it to railway and public transport operators around the globe.
XLINQ is an enterprise software development and SaaS platform with a unique technology to generate
secure and compliant software automatically from business knowledge captured. ING Labs served as an
incubator for XLINQ, which spun out of ING in June 2023. ING retains a warrant to become a minority
shareholder and is a client of XLINQ in several ING countries. XLINQ has two big corporate clients in the
financial services and energy sectors that use its platform to develop reliable software faster with lower
costs.
ING Group Annual Report 2023 on Form 20-F 31
Sustainability at the heart
ING’s purpose is empowering people to stay a step ahead in life and in
business. This also means helping customers and society stay a step
ahead of the challenges they’re facing. Climate change is one of the
world’s greatest challenges. Also, people may struggle with inequality,
poor financial health, or a lack of basic human rights. There’s a growing
sense of urgency and rising expectations that governments and
businesses must help tackle these challenges.
ING aims to put sustainability at the heart of what we do, defining new ways of doing business that align
economic growth with positive environmental and social impact.
Our priorities are as follows:
Climate action: This is our main focus. We want to lead by example by striving for net zero in our own
operations. We aim to play our part in the low-carbon transformation that is necessary to achieve a
sustainable future, steering the most carbon-intensive parts of our lending portfolio towards reaching net
zero by 2050. Read more on ING’s climate action in 'Environment'.
Collaboration: We work with clients to achieve their own sustainability goals, increasing our impact through
partnerships and coalition-building. Read more in 'ESG overview'.
Climate-related, environmental and social risk: We manage the most relevant environmental and social
risks. We also contribute to positive change by supporting clients that seek continuous improvement in
environmental and social practices. Read more in 'Environment'.
Financial health and inclusion: We’re working to advance financial health and inclusion for customers and
communities. Read more in 'Social'.
Empowering colleagues: We empower colleagues to contribute to it all, for example by providing them with
the right knowledge and training. Read more in 'Social'.
ING’s sustainability efforts have been recognised externally by environmental, social and governance (ESG)
rating agencies and other benchmarks. In 2023, Sustainalytics assessed our management of ESG material
risk as ’strong’. Also in 2023, investment research firm MSCI awarded ING an AA ESG rating for the fourth
consecutive year.
As society transitions to a low-carbon economy, so do our clients, and so does ING. The low-carbon
transition cannot happen overnight. Even though we finance a lot of sustainable activities, we still finance
more that's not, which is a reflection of the current global economy and how far the world still needs to go.
Our approach follows data and science, and evolves as the available science evolves. We want to be part of
the solution and strongly believe we can make the most impact by engaging with clients, talking to them
about their climate goals, and helping finance what they need to reach them.
While we are committed to doing our part, we know that the world’s problems cannot be solved by one
sector, much less by one bank. We specifically call on governments and regulators to guide the transition
more firmly. They have to help answer the question "What does ’good’ look like?". We believe an inclusive
approach is the best way to make a meaningful impact. From climate to human rights and financial health,
we seek to increase our impact through partnerships and coalition-building.
ING Group Annual Report 2023 on Form 20-F 32
How we are making the difference
ING is making the difference by concentrating on two overarching
strategic priorities: giving customers a superior experience and putting
sustainability at the heart of what we do. To put these into practice,
and to make that difference for all customers, we have defined four
enablers: providing seamless digital services, using scalable technology
and operations, staying safe and secure, and unlocking our people’s
full potential.
Providing seamless digital services
In a world where accelerating digitalisation is one of the main global trends impacting banking, customers
are spending more and more time online. That’s why we want to make their lives easier by giving them a
seamless digital service.
Customers deserve an easy, instant, personal and relevant experience at every touchpoint, from the way
we communicate and onboard them to how we provide products and handle customer requests. ING
facilitates this by developing, maintaining and enhancing personalised, reliable digital services that aim to
be available 24/7.
Developing, maintaining and enhancing these basics gives us the foundation for providing a superior
customer experience. By digitalising key customer journeys, we are enabling a superior customer
experience at a reduced cost-to-serve, while measuring impact through NPS and cost efficiency. In 2023,
our Digi Index Score was 71.2 percent. The Digi Index concerns a figure that reflects the average of straight-
through processing (STP) rates of key customer journeys that are handled without manual intervention.
The previously reported Digi Index Score was based on scores from countries that included global and local
processes. Global processes are aligned and consistent throughout countries, while local processes could
differ slightly per country. Starting from the first quarter of 2023, the Digi Index has been ’rebaselined’ to
enhance consistency and comparability. Currently, only 33 global processes are used as a baseline, and
local processes have been eliminated. All STP processing has been updated retrospectively, meaning
comparative figures have been adjusted and are based on the 33 global processes. The unadjusted 2022
Digi Index Score amounted to 64.4 percent and, as a result of the rebaselining, the adjusted 2022 score
amounts to 66.8 percent. Our previously reported aim of reaching a Digi Index Score of over 75 percent by
2025 has not been adjusted.
Individual customers increasingly only use the mobile channel. For them, our emphasis continues to be on
mobile and further improving our mobile capabilities.
In 2023, 77.4 percent of our communication was personalised. We use data analytics and machine learning
to personalise digital services for customers. Personalising customer interactions helps customers make
more informed financial decisions and supports mobile sales, while also reducing the need for customers to
use other channels. Given the importance of data for offering personal and relevant services, data security
and privacy protection are crucial.
Data analytics
ING uses advanced data analytics to help achieve both superior customer experience and sustainability
priorities, making the difference for customers, colleagues and society.
Handling calls better by further digitalising our contact centre processes plays a significant role in driving a
better customer experience. In 2023, ING’s Analytics team implemented speech analytics as a metric tool in
the Netherlands and Belgium, providing generated insights into the root causes of contact centre calls, and
helping ING to improve its digital journeys in the app and website. In parallel, ING has further promoted
virtual assistants. These work to provide more precise answers to address customer FAQs, resulting in active
bots in the Netherlands, Belgium, Spain, Poland and Türkiye, handling up to 45 percent of the incoming chat
volumes.
For Retail and Business Banking, ING’s Analytics team has developed acceptance and affordability models in
the lending process with the goal to improve customers’ digital experience and to ensure we are safe and
secure. In the Netherlands, the artificial intelligence-based lending models enabled instant loan decision and
granting within a few minutes instead of days, achieving a higher acceptance ratio by three percent while
keeping the same risk level. In Germany, the use of transactional data based on customer consent has
allowed for the redevelopment of the consumer loan models. This has led to a notable increase in loan
production and approval ratings, helping the business to provide services to more eligible customers.
ING has also used analytics to reduce advertisement blindness (where consumers consciously or
subconsciously ignore advertisements) to improve relevancy, and enable hyper-personalisation. In 2023,
pivotal enhancements to ING’s recommendation engine resulted in highly personalised campaign
management and, eventually, higher customer engagement. We’ve updated the underlying model to a
deep-learning method, helping us tailor our offerings to better meet customer needs. Meanwhile, real-time
processing has been enabled to address customers’ needs instantaneously.
ING Group Annual Report 2023 on Form 20-F 33
In Wholesale Banking, advanced analytics has helped the front office in their preparations for client
interactions, ensuring our colleagues can provide better ideas and ask relevant questions at relevant times.
For example, we use the entity-matching model, which uses a name-matching algorithm to identify our
own clients in datasets, even if the data is not perfectly organised. Using just a small amount of information,
it helps us better understand how our clients behave within our network.
The Analytics team continued to focus on improving the customer due-diligence (CDD) process for
Wholesale Banking, leading to a clearer process for our clients and eliminating the need to ask related
questions in person.
More broadly, the team continued to provide support to protect our customers and the bank against
increasingly sophisticated fraud attempts, such as impersonation scams, through AI-based detection
models.
Additionally, ING, as a partner of the Kickstart AI foundation in the Netherlands, hosted a hackathon with
the foundation in 2023 to boost progress of the Allow More initiative. Based on existing research by the
Dutch government, up to 15 percent of those who are eligible for a financial allowance don’t claim it. Allow
More aims to help individuals identify whether they may be eligible for these allowances. This can
encourage more people to use the available help, which could improve the financial situation of many
people in the Netherlands. As a result of the hackathon, analysis and model development based on the
method generated during the hackathon will be followed across a few banks.
On top of the existing models, ING’s Analytics team continues to improve the customer experience by
exploring new technologies. ING recognises the potential of generative AI (GenAI) and we are taking a
prudent and responsible approach to doing this in a safe and secure way. To better learn about both the
opportunities and risks, we explored opportunities in two areas with a central oversight: Customer contact
(like chatbots and transcript analysis) and software engineering (to write code or fix bugs).
As an example, we piloted LLM (large language models) technologies to improve our chatbot performance
and help customers. The first phase of the pilot came to a close in 2023 with promising customer
satisfaction and deflection improvements – the rate at which our alternative channels and self-service
resources fulfil demand. These experiments have shown there is value in incorporating GenAI into our
processes. In 2024, we will expand our GenAI explorations into a few selected areas: KYC, marketing content
generation and early warning systems. Application of GenAI technology in these domains has the highest
potential to transform our business processes and contribute to our ambition of a superior customer
experience.
Scalable technology and operations
Reflecting our role as a digital-first bank and to enable a superior customer experience, ING believes that
scalable technology and operations foundations are key requirements. We have therefore made this an
integral part of our strategy. Standardisation and automation give us a shorter time to market, quicker time
to volume, consistent and higher quality, and improved productivity. Scalable technology and operations
also help us attract and retain talent by offering employees the opportunity to not only work with
technology but also collaborate across countries and make an impact globally. Scalable technology allows
ING to create specific and local propositions that serve our customers, while leveraging ING’s scale when it
comes to engineering, security, and data experts.
Scalable technology
Our scalable technology strategy provides a foundation for the modular components we use to build and
operate propositions. It allows ING countries to introduce propositions quickly and easily, while providing the
opportunity to add local flavour.
Our scalable technology is divided into three parts: ING’s private cloud infrastructure (IPC), our engineering
pipeline (OnePipeline), and our banking technology platform, with its extendable and reusable services and
components. Given the flexibility and scalability of public cloud technology in general, ING has chosen a
hybrid cloud strategy, i.e., using public cloud providers in addition to IPC. Cloud computing is an important
component for scaling our digital capabilities. IPC is where we store and manage applications and data such
as channel applications, core banking systems and other banking applications. We measure IPC adoption by
the percentage of physical cores – also known as processing cores or CPU cores – in IPC compared to the
total number of physical cores in ING data centres globally. By the end of 2023, 63 percent of all physical
cores in ING were on IPC (2022: 52 percent). By the end of 2025, we expect that figure to have risen to at
least 70 percent.
OnePipeline, our continuous integration and delivery pipeline, provides engineers with a consistent and
secure global capability to develop, test and deploy software. OnePipeline’s key features are being
compliant, secure and reliable. In addition, the platform allows for simple ways of collaboration between
multiple teams. We invest heavily in infrastructure, test and risk automation. At the end of 2023, 62.9
percent of applications were onboarded to this pipeline (2022: 48 percent). We measure the pipeline’s
adoption by the number of applications onboarded to the pipeline (used to develop and deploy to
production), compared to the total number of applications registered in our IT management platform across
all ING entities. Our ambition is to have 90 percent of applications on OnePipeline by 2025.
Touchpoint is part of our banking technology platform. Touchpoint provides a set of reusable shared
services, freeing up capacity for engineers to create more value for customers and employees. By using
ING Group Annual Report 2023 on Form 20-F 34
these shared platform services like an authentication service or Engagement suite, engineers can realise
business solutions like Instant Payments and Open Banking quicker and easier. We measure the Touchpoint-
enabled customer online traffic using the Touchpoint authentication, represented by the number of
Touchpoint-enabled unique customer authentications against the total ING number of unique customer
authentications. At the end of 2023, approximately 64 percent of customer logins used Touchpoint (2022:
approximately 60 percent). By 2025, we expect that figure to increase to 84 percent.
Digital access
In a digital society, customers expect to have round-the-clock access to digital channels, including their
banking services. To live up to their expectations, we strive to provide uninterrupted access to our banking
services, while allowing for scheduled maintenance and downtime. In Retail Banking in 2023, our digital
channel availability for the Netherlands and Belgium was 99.56 percent.
ING’s Chief Technology Office has been diligently working on the identification and analysis of the root
causes of major incidents experienced in 2023. Based on the outcome, we took measures to strengthen our
reliability. For example, we started a reliability programme across the Tech organisation, including an
extensive training for all Tech employees, with the aim of strengthening the overall resilience of our
channels.
For Wholesale Banking clients worldwide, the availability for our Inside Business payments channel and for
our Inside Business Connect channel (file transfer) was 100 percent. These figures are based on outputs of
availability monitoring processes, which are run with a high frequency per hour.
Payment & Settlement Services
The Payment & Settlement Services organisation (PSS), part of the CTO (Chief Technology Office), covers the
full scope of payment and settlement services for Retail and Wholesale Banking.
Our scalable tech and ops provide PSS with high-quality and efficient payment, settlement, and open-
banking services, leveraging our scalable payment and settlement solutions. As of 2023, PSS processed well
over four billion transactions through our central payment engines.
We aim to further consolidate most of our payment services on this platform, improving quality and
reducing price per transaction.
Scalable operations
Our scalable operations are driven by digitalisation and capability hubs, focusing on becoming fully STP,
leveraging expertise and using scale, and sharing productive, quality services across the ING network.
Capability hubs provide shared services and solutions across ING worldwide. The hubs are mainly located in
the Netherlands, Poland, Romania, Slovakia and the Philippines. In 2023, 34 percent of operations were
carried out with the support of these hubs, compared to 32 percent in 2022. Our aim for 2025 is to have the
hubs carry out at least 50 percent of the operational work.
By digitalising client contacts, accelerating remote advice, and increasing the use of chatbots, we reduced
inbound contacts to contact centres by 18 percent in 2023 (versus 2021). We aim for 30 percent less in 2025
(versus 2021). Similarly, by automating and centralising our know-your-customer (KYC) activities this year,
we reached 58 percent of KYC workforce in our hubs and expect to increase that to 60 percent by 2025
through more consolidation, automation and straight-through processing.
Staying safe and secure
Trust is the starting point, the most basic requirement, for all stakeholders. That’s especially true for a
digital-first bank like ING. People trust us with their money and their data. Keeping these safe, and
maintaining this trust, is crucial. See also ‘Risk management’.
Risk appetite framework
The risk appetite framework (RAF) combines various financial and non-financial risk appetite statements
(RAS) into a single, coordinated approach, to provide the business with a clear overview of the relevant risks
and the tools to manage them. These tools include the boundaries and instruments set for each risk type
that help to manage the risk appetite. This view allows the EB, the MBB, and senior management to pursue
ING’s business strategy in a safe, secure and compliant way while meeting regulatory requirements at all
times. See also ‘Risk management’.
Anti-money laundering and KYC
Knowing who we do business with helps to protect our clients, ING and the financial system against financial
economic crimes. As part of our continuing anti-money laundering (AML) efforts, we screen customers,
carry out due-diligence checks, and monitor transactions for unusual or suspicious activities. In 2023, we
strengthened our KYC by enhancing our global way of working. Read more about KYC and AML in
’Compliance risk’ in ’Risk management’.
ING Group Annual Report 2023 on Form 20-F 35
Cyberthreat landscape
Cybercrime remains a continuous threat to companies and to financial institutions in particular.
Ransomware is one of the prime threats, with phishing the most common way that attackers gain access to
a company’s system or network. Phishing is also used to plant information-stealing malware or for drive-by
download attacks – the unintentional download of malicious code to users’ computers or mobile phones.
Other high-ranking threats are attacks against availability, or Distributed Denial of Service (DDoS) attacks,
used against the financial sector and digital services operators for reputational damage and/or extortion.
Different types of cyberthreats are not only relevant for the financial industry, but are increasingly hitting
their supply chains. ING continues to invest in cybersecurity capabilities in all domains (prevention,
detection, response and recovery). See also Non-financial risk’.
Cybersecurity incidents
No cybersecurity incidents with criminal intent were identified on ING IT infrastructure in 2023 that met the
ECB cyber-incident reporting thresholds.
However, in June 2023, a third-party bank account switching service suffered a breach that affected ING
customers in Germany. This involved a customer data leak for private customers who, when opening a
current account with ING, used the German legal account change assistance (Gesetzliche
Kontowechselhilfe). German banks are legally obliged to support private customers in moving their account
from the old to the new bank in this defined generic process. ING in Germany informed authorities and
affected customers about the incident and provided safety instructions and contact options to further
protect personal information.
Preventative measures
Being cybercrime-resilient is a high priority. We continuously test our IT and IT organisational resilience, and
perform crisis management and red-team exercises to improve our response to DDoS and targeted attacks.
Cybersecurity risks from suppliers are monitored and mitigation is initiated where needed. ING maintains a
strong global cybercrime alliance within the financial industry and government institutions to monitor
trends.
ING recognises the value of an effective regulatory framework and is in favour of cybersecurity
requirements being responsive to actual cyberthreats. The adoption of threat-led penetration testing in the
EU’s Digital Operational Resilience Act, which also ensures continuity of business, is a good example. Testing
critical systems on real-life threats helps entities to gain insights. Our staff awareness and training
programme is regularly updated with the latest cybercrime trends and prevention measures.
We have a responsible disclosure procedure for security researchers that may find issues in our business
applications or infrastructure. See also ‘Non-financial risk’.
Identity and access management (IAM)
Identity and access management (IAM) is an important element in our control framework to prevent and
mitigate the risk of unauthorised access to IT systems and the data processed and stored therein. ING has
IAM global processes and controls in place which are periodically reviewed and tested. See also ‘Non-
financial risk’.
Fraud landscape
Types of fraud are also evolving. As the digital world continuously changes, fraudsters have become more
international and their modus operandi more complex. Customers are being deceived in increasingly
sophisticated ways. Online fraud has become a societal problem and in several countries, banks have
collaborated with governments, law-enforcement entities, and other sectors to find innovative ways to
prevent and detect fraud. ING continues to play an important role in preventing and detecting fraud in the
digital world and wants to minimise the impact of fraud losses and the number of fraud victims.
We recognise this transformation in the fraud landscape with developments high on our agenda. We have
improved our ability to monitor and react to fraud incidents and to adapt quickly to new fraud methods. By
using innovative technology, data analytics and IT solutions, we’re better able to identify suspicious
activities. We are increasingly collaborating with peers and other relevant sectors, such as
telecommunications companies.
In 2023, the Fraud organisation was made part of the Global KYC organisation. Joining the two allows us to
draw on combined knowledge and experience, which can help keep ING and our customers safe and secure.
Read more in ’Risk management’.
Data privacy, protection and ethics
In its capacity as a global financial institution, ING processes personal data belonging to our customers,
employees, suppliers and business partners. They trust us with confidential and personal information, so it’s
important that we maintain that trust and keep this data safe from loss or misuse. This is part of our
commitment to ensure safe and transparent banking practices, including in how we manage personal data
in an environment that’s increasingly open and interconnected. ING is bound by European and local data-
protection laws, which can differ from country to country. For more information on how ING has globally
implemented its personal data protection measures, see ’Compliance risk’.
ING Group Annual Report 2023 on Form 20-F 36
As ethical standards evolve over time, we closely monitor regulatory compliance and potential new
requirements to gain an ’outside-in’ view on data ethics. This includes legislation for new trends, like artificial
intelligence.
Everything we do is guided by ING’s Orange Code, which describes the values and behaviours that underpin
our way of working, and which puts integrity above all. Building on the Orange Code is ING’s Global Code of
Conduct. Its 10 core principles provide more detail on our main values. These help to give greater balance to
ING’s decision-making, as we weigh up different relevant factors. We’ve developed supporting
methodologies for this purpose, like Orange Code decision-making, which allow us to arrive at decisions that
are considerate and well informed. As such, ethics routinely plays a significant role in all our decision-
making. Read more in ’Governance’.
To provide further protection, we actively encourage employees to speak up when they are confronted with
unethical or illegal behaviour. Through a variety of reporting channels, like managers, persons of trust, or
ING whistleblower reporting officers, concerns can be reported. ING also has external whistleblower
channels. We take great care to protect the identity of those who report concerns, which they can do
anonymously, as well the confidentiality of their reports to protect them against potential retaliation. We
believe that trust, integrity and ethical behaviour are at the core of any reliable business. They go hand-in-
hand with satisfied customers. Read more in ’Compliance risk’.
Unlocking our people’s full potential
‘Unlocking our people’s full potential’ is a key enabler of our strategy. We are making the difference through
the skills, expertise and actions of our 60,000+ people worldwide. We attract, develop and retain the people
and skills we need at all levels by offering the opportunity to make a global impact and to belong to a
friendly, collaborative and inclusive company. Fostering such an environment is made possible through our
Orange Culture, built on the values of honesty, prudence and responsibility. These values are aligned to the
Orange Behaviours our people exhibit: ‘you take it on and make it happen’, ‘you help others to be
successful’, and ‘you are always a step ahead’. We see the effect of this throughout our business, but in
particular in our levels of retention and in our Organisational Health Index (OHI), which is part of our
continuous-listening approach.
We use the OHI to get an ongoing sense of how our people feel and we make sure to act on their feedback.
We held two pulse OHI surveys in 2023. In May, we had more than 46,000 employees participating, and all
our priorities saw improvements globally, particularly strategic clarity. The second pulse took place in
October. We received feedback from 77 percent of employees, making this our highest-ever response rate.
We sustained the gains from May, which indicates our focused efforts led to sustainable improvements
across our OHI priorities.
Using these data points, together with external trend research and internal needs assessments, in 2023 we
reviewed our people strategy and are focusing on three pillars to further unlock our people’s full potential:
’talent & leadership’, ’culture & organisation’, and ’employee experience’.
Talent & leadership
ING has an abundance of internal talent and a strong culture of developing our people. We offer everyone
the opportunity to develop their business, technical and leadership skills, and we’re opening up new avenues
for them to do so. For example, we have a wide range of academies that deliver specialist professional
development. These are complemented by our leadership curriculum, as part of which we launched the
leadership accelerator in 2023. As a result, our people are building the right skills to thrive in the future.
Culture & organisation
Our culture of diversity, inclusion and belonging continues to improve. Since 2019, we have been guided by
our 70 percent principle, in which we aim for no group or level to be comprised of more than 70 percent of
the same age, nationality or gender. Our culture & organisation pillar takes this further, with the mission to
make sure that ING is a place where everyone, regardless of background or identity, can thrive and realise
their full potential. We do this by embedding inclusion and equity in all our people processes and by having
specific gender-diversity targets for which the Executive Board and Management Board Banking are
accountable. We look at indicators such as the number of women in senior management positions, which
amounts to 31 percent at year-end 2023, up from 29 percent at year-end 2022.
We also continue to build a vitalised culture and organisation that foster healthy performance. We support
our people by offering hybrid working so that they have the autonomy to better balance their professional
and personal lives. Some 77 percent of our employees are working hybrid (one to four days in the office,
based on self-reported data). We care about giving our people this flexibility, and it is highly valued by our
employees, helping us attract and retain great talent. Alongside this flexibility, we offer a competitive total
reward package, and strong learning and development opportunities. This is reflected in our people offer,
which creates clarity on what we offer, and what we ask in return.
Employee experience
We want to free up people’s time so they can focus on making the difference, which is why we aim to make
our employee experience as easy, instant and relevant as our customer experience. In 2023, we made good
progress, with more than 70 percent of our people now covered by our global people management systems,
enabling them to process employee transactions on their mobile devices. We also started a broad cross-
functional initiative to reduce bureaucracy and make services easier to use for employees. For example, in
the Netherlands, we reduced the number of notifications and approval steps on HR-related processes from
ING Group Annual Report 2023 on Form 20-F 37
more than 16,000 to 6,000 per month. In 2024, we plan to further automate HR documents in major
countries such as the Netherlands, the Philippines and Germany.
For more on unlocking our people’s full potential, see 'Social'.
Competition
ING is a leading European universal bank with global activities. Our more than 60,000 colleagues based in 38
countries serve around 40 million individuals, corporates and financial institutions in 10 retail and over 100
wholesale banking markets. ING’s purpose is to empower people to stay a step ahead in life and in business.
Our Retail Banking business, which consists of Private Individuals, Business Banking, and Private Banking &
Wealth Management, offers individuals, small to medium-sized businesses (SMEs) and mid-corporates a full
range of products and services covering payments, savings, insurance, investments, mortgages, trade
finance, structured finance and financial markets solutions, among others. In Wholesale Banking we provide
corporate clients and financial institutions with specialised lending, tailored corporate finance, debt and
equity market solutions, sustainable finance solutions, payments and cash management and trade and
treasury services. We also offer daily banking services such as payments and cash management and trade
and treasury services.
There is substantial competition in the countries in which we do business for the types of wholesale banking,
retail banking, business banking and other products and services we provide. In recent years, competition
has further increased in both developed and emerging markets. Our largest market is the Netherlands,
where our main competitors are ABN AMRO and Rabobank.
Our competitive landscape is transforming as society becomes increasingly digitalised and ever more reliant
on technology and the online economy. In our Retail markets we see an accelerated shift to mobile banking
and contactless payments, which has provided new opportunities for new entrants to join. Our main
competitors are no longer just other banks.
The opening up of the European payments market under the open banking regulation is a significant
competitive development. It has created a more crowded, uneven playing field as third-party payment
providers, fintechs and Big Tech enter this lucrative area once dominated by banks. These new entrants
have operating models that are not burdened with potentially costly legacy operations. Less regulated than
banks, new entrants use technology and advanced data and analytic tools to lower cost to serve and to
speed up processes.
Advances in technology are accelerating the use of new business models, for example in retail payments,
peer-to-peer lending, foreign exchange and low-cost investment advisory services. New solutions offered by
rapidly evolving incumbents, challengers and new entrants, especially with respect to payment services and
products, have disrupted the financial services sector and led to the emergence of disintermediation.
In this competitive landscape, where banking products and services have mostly become commodified, the
main differentiator is customer experience. For consumers, this means a seamless, safe, mobile-first digital
experience that is easy, instant, personal and relevant. Businesses too want to benefit from gains in speed,
transparency, security and efficiency created by technologies such as blockchain and artificial intelligence.
Winners will be those with a strong trusted brand and a superior digital experience, taking the effort out of
managing finances and offering personalised, real-time advice, products and services for all financial needs.
Statements regarding ING’s competitive position reflect the assessment of ING’s management about the
general competitive landscape in which ING operates.
ING Group Annual Report 2023 on Form 20-F 38
Environmental, social and governance
overview
Preparation for CSRD
ING will have to report for the first time in accordance with the CSRD over financial year 2024, for reports
published as of 2025. The CSRD is a legal framework that requires the issuance of a sustainability report. In
July 2023, the European Commission adopted the delegated act of the European Sustainability Reporting
Standards (ESRS), which were published in the Official Journal of the EU in December 2023. For the banking
sector, detailed rules on reporting are expected to follow. However, the EU reached a political agreement on
postponing the deadline for the sector-specific standards by two years.
We will use these ESRS, developed by the European Financial Reporting Advisory Group (EFRAG), to report on
our impacts, risks and opportunities. Up until this year, we have used the Global Reporting Initiative (GRI)
standards to do so. We expect the interoperability between the GRI standards and the ESRS to assist us in
our compliance. However, we also acknowledge some key differences, hence preparation work will be
undertaken in 2024 to comply with CSRD disclosure requirements.
One of the notable differences with the introduction of the CSRD is on the materiality assessment. This
year’s materiality assessment is performed in alignment with GRI standards. Moving from GRI Materiality
Assessment to Double Materiality, in line with the ESRS requirements, will be one of the first actions in 2024
as we determine which material topics and which ESRS to report on in the 2024 Annual Report.
ESG topics addressed in this chapter are divided into three sections: Environment, Social and Governance.
Within the Environment chapter, we address areas including our approach to climate action, sustainable
finance products, and our own carbon footprint. In Social, we address our responsibility towards the well-
being of our employees, customers and society. In Governance, we focus on business ethics, our Orange
Code and way of working. For more on Board composition, structure and oversight, see 'Our leadership and
corporate governance'.
Collaboration and stakeholder engagement
No one sector, much less one bank, has the ability to solve the world’s problems. We believe that an
inclusive approach is the only way we can make any meaningful positive impact. As such, we seek to
increase our impact through partnerships and coalition-building. ING also recognises the importance of
regular and meaningful engagement and dialogue with its many and diverse stakeholders on societal
issues.
Collaboration to increase impact
Contributing to climate standard-setting is an example of our approach to collaboration and stakeholder
engagement. We work with peers, clients, other companies and experts to contribute to standardised
frameworks that banks and clients use to measure and disclose progress towards net-zero targets.
This is important because it means companies in the same industry, and in the same sectors of banks’
portfolios, can be compared in the same way. Banks get a shared understanding of how they can support
the decarbonisation of hard-to-abate sectors.
For example, in 2023, our collaborations with industry peers and other partners saw us make important new
contributions to climate standard-setting. Building on our previous efforts to help develop methodologies
that can be used by financial institutions and sector participants to benchmark their own alignment with net
zero and other climate goals – like the Poseidon Principles for the shipping sector and the Sustainable STEEL
Principles for the steel sector – we’re now collaborating with RMI’s Center for Climate Aligned Finance and
three banking peers on a new methodology for the aluminium sector. This resulted in the launch of the
Sustainable Aluminium Principles at COP28 in December 2023.
We also joined the Partnership for Carbon Accounting Financials (PCAF) and aim to contribute to the
improvement of PCAF methodologies by supporting ongoing and new working groups that are helping
financial institutions understand the impacts of products that are not yet covered.
Human rights is also a topic we collaborate on, as part of the Thun Group, the OECD Advisory Group and as
part of the steering committee for the Equator Principles. We also participate in learning platforms and
promote a shared language among banks, for example through the Shift Financial Institution Practitioners
Circle and the Shift Business Learning Programme, to name a few.
Ongoing stakeholder dialogue
As regards our approach to stakeholder engagement, retail customers, business clients, employees,
investors, NGOs, suppliers, supervisors and regulators are among our most important stakeholders. Rather
than having one-off consultations around specific topics, we have an ongoing dialogue about our role in
society, our products and services, our business performance and other issues.
Our engagement approach is informed by the standards of the Global Reporting Initiative (GRI) and the
Sustainability Accounting Standards Board (SASB), and aims to adhere to the best practice provision of
section 1.1.5 of the Dutch Corporate Governance Code. We engage in dialogue in a risk-based manner, also
ING Group Annual Report 2023 on Form 20-F 39
taking into account the outcomes of our saliency assessment. In all the stakeholder dialogues we engage in,
ING is committed to adhering to its relevant legal obligations relating to confidentiality.
Our ESG governance approach
We have updated our ESG governance approach, integrating and aligning ESG governance with the existing
business-as-usual governance of the bank. We want to be a banking leader in building a sustainable future
for our company, our customers, society and the environment. We do this through the following actions:
•We focus on climate action, leading by example by striving for net zero in our own operations. We play
our full part in the social and low-carbon transformation that’s necessary to achieve a sustainable future,
steering the most carbon-intensive parts of our portfolio towards reaching net zero by 2050.
•We collaborate, working with clients to achieve their own sustainability goals, increasing our impact
through partnerships and coalition-building.
•We manage the most relevant environmental and social risks while fostering the protection of
biodiversity and human rights across all of our relationships.
•We work to advance financial health and inclusion for our customers and communities.
•We empower our colleagues to contribute to our sustainability approach and climate action to make
sure they are highly engaged with our strategy and all sustainability-related topics. For more on
upskilling our workforce, see ’Social’.
•We show climate leadership by stepping up advocacy on government guidance needed for the
transition, by contributing to the development climate standards for the financial industry and by
sharing our insights and learnings.
Board-level governance
The Supervisory Board’s ESG Committee assists the Supervisory Board (SB) with matters relating to ESG,
including, but not limited to, the development and integration of ESG across the company and its strategy.
The ESG Committee also assists the SB by monitoring and advising on relevant ESG developments. To
prevent an overlap between the ESG Committee and the other Supervisory Board committees, and to
safeguard an aligned and common view on ESG, the ESG Committee consists of at least one member of
each of the other committees.
The ESG Committee met four times in 2023. An overview of the variety of topics discussed and supported
can be found in the Supervisory Board report, including how the board monitors and oversees progress
against targets and performance. In addition to the regular meetings, in the first half of 2023 the ESG
Committee participated in a full day of climate-focused training, which included deep-dives on climate
change, biodiversity and sustainable finance. The outside-in view and external inspiration was provided by a
prominent climate academic from a leading Dutch university and the head of the UN’s Environment
Programme Finance Initiative (UNEP FI). In the second half of 2023, the ESG Committee participated in a
social and ESG regulations-focused training session, which included deep-dives on financial health and
inclusion, human rights, Just Transition, ESG regulations and assurance.
ESG is a regular subject on the agenda of ING’s Management Board Banking (MBB), which includes the
members of the Executive Board (EB) in their capacity of day-to-day management of the business and long-
term strategy.
ESG was a formal agenda point in MBB meetings 37 times in 2023. In addition, as we take steps to further
integrate and embed climate action into the business, many of the other topics on the MBB’s regular
meeting agenda have a sustainability angle. This means that the MBB is discussing and taking decisions on
sustainability- and climate-related topics on a frequent basis. The MBB also plays a role in the global
ambition-setting and oversight of our Terra climate-alignment approach.
Senior management-level governance
ESG Change Board
For the integrated oversight of all ESG-related regulatory and change initiatives, and to verify consistency
and efficiency of delivery in each of the involved domains, we’ve created an ESG Change Board. The ESG
Change Board is comprised of representatives of all global ESG-related change and regulatory programmes
alongside representatives from Data, Compliance and internal audit (CAS - Corporate Audit Services).
Steering Committees and Sounding Board
For all major ESG-related regulatory programmes and/or opportunities, dedicated Steering Committees
have been set up with the aim of ensuring that relevant ESG-related regulations and programmes are
monitored, assessed, and implemented. The ESG Sounding Board, comprised of around 15 senior leaders
from across the organisation, helps guide the development and implementation of our strategy related to
ESG topics, as well as monitoring and reporting on our progress.
ESG Risk Committee
The ESG Risk Committee (ERC) is responsible for ensuring the execution and delivery of any ESG risk-related
matters discussed by the Supervisory Board or its committees.
Members have practical insight into strategic and operational issues and are able to align between
functional or business issues. Within its competences, the ERC serves as a technical (content-related) adviser
ING Group Annual Report 2023 on Form 20-F 40
to MBB and MBB delegated committees (Risk-led committees and the ING Group Disclosure committee). The
ERC serves as a planning body for ESG risk priorities and advises on the approval of all material ESG risk-
related items.
Disclosure Committee
The Disclosure Committee (DisCom), which comprises various members of senior management and
business and risk representatives, advises the Boards in fulfilling their responsibilities with respect to ING’s
periodic and ad-hoc disclosure obligations and activities. It aims to ensure that external presentations
including sustainability information of ING are reviewed prior to public release.
Global Sustainability department
The Global Sustainability department is responsible for developing ING’s overall sustainability approach. The
department partners with the business lines on developing ING’s policies, programmes and targets on
sustainability-related risks and opportunities, and is involved in measuring progress towards these targets.
We take a holistic approach to sustainability, which means that climate-change mitigation, climate
adaptation, nature, human rights, financial health, business ethics and other ESG-related topics are all in
scope and supported by dedicated experts. ING’s global head of Sustainability reports directly to ING’s CEO.
Stakeholder engagement is of crucial importance to ING, and we engage in dialogue with key external
stakeholder groups, such as NGOs, governments, academics, sustainable research agencies, investors and
international development organisations. Internal engagement is just as important, by developing global
learning and upskilling programmes on ESG-related topics, also supporting further integration of
sustainability into our business.
Business-level governance
Wholesale Banking
ING has had a Wholesale Banking Sustainability Steering Committee since September 2022. The
committee’s main purpose is to assign clear ownership, accountability and resources within Wholesale
Banking (WB) and relevant support functions to help set and implement WB’s sustainability commitments.
Each of the seven WB sector teams has a sector global sustainability lead. There are also two regional
sustainability leads for Asia-Pacific and the Americas, two key regions in our WB network. These nine leads
coordinate and implement WB’s sustainability ambitions and related tasks at the sector/regional level,
following a clear strategy and associated action plans.
For Wholesale Banking, responsibility for ING’s sustainable finance business sits with the Sustainable Finance
department, whose reporting line is via the head of Wholesale Banking Lending to ING’s head of Wholesale
Banking. This team operates as a centre of expertise for engaging and advising corporate clients, and
supports the execution of sustainability-linked transactions.
Retail Banking
For Retail Banking – which from a governance and organisational perspective includes Business Banking –
the development of new and innovative sustainable products and the progress of lending portfolios towards
climate goals are steered through the Retail Banking Sustainability Steering Committee, which cascades this
responsibility to the relevant experts and country teams as needed. Sustainability/ESG leads in major
countries have a functional line to the global head of Sustainability to create a stronger connection between
global and local activities.
ESG risk governance
ESG risk, and in particular climate risk, is not identified as an independent risk category/ risk type. Rather, it is
a set of drivers affecting the likelihood and severity of existing risk categories/ risk types, therefore the
management of ESG risk is embedded within all risk types. The ESG risk framework outlines ING’s approach
to managing ESG risk as a driver of existing risk types. For full details on ING’s risk framework, ESG Risk
organisation structure and ESG Risk department, see ‘Risk management’.
ESG-linked executive remuneration
ING aims to align its remuneration policy with its risk profile and considers the broader interests of all
stakeholders. To that end, targets in areas such as customer-centricity, risk & regulations, sustainability, and
people are just as important as financial results. At least 50 percent of our Executive Board’s variable
remuneration targets are based on non-financial performance criteria, including ESG-related targets.
For full details of our ESG-linked executive remuneration, see the 'Remuneration report'.
ING Group Annual Report 2023 on Form 20-F 41
Environment
Climate change is one of the biggest challenges facing society. The
financial sector has a role to play in acting on climate change,
supporting the transition to a net-zero economy, protecting nature and
enabling the circular economy. We take this role seriously and want to
be a banking leader in building a sustainable future for our company,
our customers, society and the environment.
Our approach to climate action
We have the ambition to empower our clients to reach net zero by 2050. To achieve this, we need to
carefully manage the risks and potential impacts on our business, while making the most of the
opportunities that come with supporting our customers in making their transitions. Our approach focuses on
taking action at both portfolio level and client level, with the aim of making positive climate impact.
We’ve made sustainability an integral element of our business strategy. And while we believe our biggest
impact comes from focusing on climate action, our climate action approach is closely interlinked with our
approach to nature and to human rights and recognises the interdependencies. Climate change is
accelerating biodiversity and nature loss and negatively impacting human rights. Taking measures to
safeguard and foster nature supports climate mitigation, while taking an inclusive approach to the climate
transition helps to protect human rights.
To be successful, and make the difference for people and the planet, we take a dynamic approach to
climate action: we follow the latest climate science and actively seek guidance from governments and
regulators in how to assess and manage climate risks while supporting a smooth and inclusive transition.
We work closely with reputable third parties to translate climate science into climate pathways, scenarios
and frameworks that guide our actions, aimed at delivering near- and medium-term emissions reductions in
our portfolios on the path to net zero by 2050.
We're taking action to achieve the ambitious targets we've set, yet the achievement of targets is also
dependent on factors that are outside of ING’s direct influence. If a particular sector is unable to align with
net zero by 2050 targets because of, for example, a lack of scalable alternative technologies or insufficient
incentives to encourage the necessary changes in customer behaviour, then as a result we may struggle to
steer our portfolios along the relevant net-zero pathways.
Integrity matters, and transparency drives accountability and accelerates action. ING is committed to
sharing the progress on our targets and the actions we’re taking in our efforts to meet them, and supports
organisations and alliances that promote transparency, clarity and uniformity in reporting. We’re eager to
see further international alignment and harmonisation of reporting requirements, including those focused
on climate impact measurement and target-setting, as well as public sector endorsement of science-based
sectoral pathways. And we continue to call for more concrete guidance from governments and regulators
on climate risk and climate adaptation. These improvements help to provide clarity to our clients, whose
choices impact the real economy.
Our climate action objectives are:
•Aim to reach net zero in our own operations;
•Steer our portfolios and engage with clients for positive climate impact;
•Manage climate and environmental risks.
Aim to reach net zero in our own operations
We aim to play a role in the necessary transition to a net-zero society which begins with our own
operations. This means bringing our buildings, data centres and business travel in line with the net-zero
economy of the future. We measure and steer our progress towards this ambition through our
environmental programme, which is steered by a committee chaired by our chief operations officer (COO)
with the participation of colleagues from finance, real estate, IT and HR.
Our path towards net-zero buildings
Our ambition for our buildings worldwide, both owned and rented, is to reach net zero by 2035. To achieve
this, we focus on improving energy efficiency, using space more efficiently, and moving towards lower-
carbon heating systems. A good example of this is the ING Marnix building in Brussels, which is undergoing
sustainable renovations – insulating the windows and frames, adding rooftop solar installations, and
switching to heat pumps. Digitalisation of the way we work and the way we interact with clients and
customers also supports a decrease in the footprint of our branches and offices.
We also continue to improve our renewable electricity sourcing and reporting. In the Netherlands, for
example, we have a virtual power purchase agreement (PPA) with Vattenfall for the majority of our energy
from the ’Hollandse Kust Zuid’ wind farm. We also continue to increase the amount of installed renewable
electricity generation – this includes in the Netherlands, where installed rooftop solar became operational in
four new locations in 2023, with an additional annual generating capacity of 176,000 kWh. It’s our intention
ING Group Annual Report 2023 on Form 20-F 42
to move over time towards more onsite renewables and direct purchasing agreements from local renewable
projects.
Sustainability at the heart of procurement
We have a process in place that helps us screen our suppliers better (through our Know Your Supplier (KYS)
approach), enabling us to assess whether they share our commitment in fighting climate change and
protecting human rights. In 2023, we also launched a Sustainable Procurement Guideline that contains
environmental and human rights criteria for the different procurement categories to inform the process of
supplier selection.
Working towards sustainable tech & operations
ING’s Tech teams are focusing on reducing CO2 emissions and the impacts of physical materials (e.g.
hardware, cabling, packaging and other waste) related to our data centres, end-user devices and
applications. As part of our data centre consolidation, which involves moving to more energy efficient data
centres in the Netherlands, ING’s data centres in Singapore and the United States were closed in 2023. We
were also able to reduce the number of servers supporting our Workplace Services (WPS) environment by 90
percent or approximately 3,000 servers. They were moved to cloud-based servers which are more
sustainable than physical servers in our data centre. In addition, we enhanced our CO2 footprint awareness
in our workforce, leading to notable reductions in the use of inefficient IT applications. In 2023, we launched
a pilot involving four markets to validate ING’s approach to measuring the environmental impact of our
banking operations processes. Building on this, we are further developing a framework to embed sustainable
processes in our operations.
Conscious working
We promote work practices that encourage employees to be conscious of their impact on the climate. In
particular, we focus on striving to reduce our business travel through the use of CO2 budgets, the continued
use of video-conferencing tools, and policies designed to encourage the use of rail for travel under 500km. In
addition to our efforts to reduce air travel, we also started working on data availability and developing a
methodology to measure our employee commuting impact. In 2023, we continued to procure low-carbon
fuel on a life cycle basis, known in the market and referred to in this report as ‘Sustainable Aviation
Fuel’ (SAF), from our partners at SkyNRG and Neste (producers). We also procured SAF certificates from Air
France-KLM, Lufthansa Group and Singapore Airlines as measures to mitigate our environmental impact.
Additionally, we entered into a partnership with Qantas as part of our SAF sourcing approach this year. In
total, we procured 1465mt of SAF. Globally, we have an ambition to reach at least 90 percent electric
vehicles (EVs) in our car fleet by 2030.
Steer our portfolios and engage with clients for environmental
impact
ING’s largest impact on the environment and earth’s climate is through our financing. We advocate for
financing more sustainable activities, however we know that we still finance more that is not. Officially
endorsing the Paris Agreement in 2015 and joining the Net Zero Banking Alliance in 2021 have set the
precedent for the strategic direction of ING to steer our portfolio to net zero by 2050. We use our Terra
climate alignment approach to address the most carbon-intensive parts of our overall lending portfolio and
steer those to net zero by 2050 or sooner. At client level we use our sector expertise, international network
and climate-action experience to accelerate our clients’ transitions to a low-carbon economy.
To improve how we advise and finance clients in support of their transitions, we’re increasingly incorporating
sustainability and climate-related considerations into our decision-making processes. For example, as part
of our Terra approach, we have devised transition plans for each sector in scope of Terra which help us drive
portfolio-level alignment with net-zero-by-2050 pathways.
When we finance our clients, different governance bodies are in place to assess the incorporation of
sustainability and environment-related considerations in financing decisions.
Supporting the energy transition
We believe that the financial sector has a role in helping the world transition to a low-carbon economy. At
ING, we take this role seriously, as we strive to be a banking leader in driving the energy transition. The
systemic change required means no one can do it alone – governments, NGOs, businesses, financial
institutions and individuals all have a part to play – and we can all make the difference for present and
future generations if we work together towards the same goals.
The energy sector is under external scrutiny in the journey to decarbonisation and is the most critical to
transition to net zero. It is also where ING is focused on driving change with ambitious targets. Our approach
to financing the energy sector balances three main societal interests: the need to decarbonise to fight
climate change, the need for energy to remain accessible and affordable for people and companies, and the
need for security of the energy supply.
Ultimately, building enough new renewable and low-carbon sources of energy will reduce the need for fossil
fuels and ING strongly supports the objective of this transition. The global economy’s reliance on fossil fuels,
in particular on coal for power generation, must reduce to significantly lower levels over the next 10 to 15
years, according to the energy transition pathway set out in the International Energy Agency’s (IEA) Net-
Zero Emissions by 2050 (NZE 2050) Scenario.
ING Group Annual Report 2023 on Form 20-F 43
Terra approach
We use our Terra approach to steer the most carbon-intensive parts of our loan book towards net zero by
2050. We continue to refine and optimise Terra, dynamically incorporating developments in climate science,
and have expanded our coverage to include the mid- and downstream parts of the oil & gas sector value
chain, where previously only the upstream part of the value chain was in scope. We also cover our global
commercial real estate portfolio, where previously we only covered the book for the Netherlands, and we
are expanding Terra to cover Business Banking clients. In doing so, we are first focusing on small and
medium-sized enterprises (SMEs) in the Netherlands active in the agriculture (especially dairy farming) and
transportation (especially inland shipping and road transportation) sectors.
The process for reporting on Terra consists of several steps. Internal data relating to our portfolio
composition is made available soon after ING’s year-end close. External data relating to climate
performances is collected later (often between May and September) when this data becomes available. For
this reason, our actual performance considering year-end financial information and climate-related
information is only available well after the annual report is published and is shared in a separate climate
publication. The overall reporting process includes checking the external data for consistency and matching
it with internal data. A year-on-year portfolio comparison is made to analyse fluctuations at company or
asset level for each sector. This helps us to understand the drivers behind any changes, which can usually be
attributed to the climate performance of clients, the composition of sector portfolios and improvements in
methodologies. When necessary, scenarios and targets are updated in line with scientific updates to the
decarbonisation pathways aimed at keeping global temperature rises within the necessary limits for a
sustainable future.
Once the process is complete, we draft a progress report, which is incorporated into our integrated climate
report. In the report, we make specific calls on sector level to governments and regulators to more firmly
guide the transition with harmonised policies and incentives that accelerate the decarbonisation of the
global economy. The report, approved at Board level, was published in October 2023.
We utilise external data vendors for the sourcing of information related to all Terra sectors (with the
exception of upstream oil & gas). Our data vendors have procedures and methodologies in place to perform
checks and controls on their data. The data processes and models of our data vendors are not audited,
which means that regardless of their checks and controls, data limitations may still exist. Although we
perform our own reviews and sanity checks, our procedures cannot fully mitigate the risk of applying
inaccurate, incorrect and/or incomplete data. For some sectors, like residential and commercial real estate
and mid- and downstream oil & gas, we also make use of proxies and modelling assumptions in our
measurements where the data is not available or partly available from our data vendors. Proxies are often
sector-average emissions intensities published by governmental agencies. In some cases, the proxy data
used for certain countries and is based on public data sources from a specific district within that country.
Furthermore, these sector-average emissions intensity proxies often may not coincide with the current
reporting period, which could lead to over- or understating the portfolio emissions intensity.
Sector transition plans for portfolio-level impact
To clarify our sector strategies and approaches to net-zero targets, we have devised transition plans for
each of the sectors in scope of Terra (sector transition plans). These help us to translate sector strategies
and targets into tangible actions and drive portfolio-level alignment with net-zero-by-2050 pathways.
Tailored plans to each sector take into account the specific conditions, opportunities and challenges of that
industry. They are also consistent in that they all strive to create alignment, will drive action and make
impact at three levels: with clients, with the market/industry (and our peers active in the respective
industries), and with governments and policy-makers – with a fourth element being the upskilling of our
colleagues.
To be able to better assess the climate performance of our clients, and then use these insights to identify
risks and opportunities for supporting clients in their transitions, we have developed a bespoke ‘client
transition plan’ tool. This online platform is where we’ve started to centrally collect, assess and monitor
publicly disclosed climate transition plans of our largest corporate clients, starting with those in scope of
Terra. The transition plan data collected includes, where possible, historic emissions (scope 1, 2 and 3),
commitments, targets, action and investment plans, governance and strategy (such as low-emission
products and services). The data is sourced from the Carbon Disclosure Project (CDP), the Science-Based
Targets initiative and public sustainability reports, and where possible including scope 1, 2 and 3 emissions,
targets and investment plans of each client, starting with those in scope of Terra and eventually expanding
to cover all Wholesale Banking clients. By aggregating this information, we can engage in data-driven
discussions with our clients that should lead to greater impact. The tool will also help make our credit
approval process more efficient.
Challenges facing our sector transition plans
Each sector for which we have introduced specific transition plans faces unique challenges on its route to
net zero. Our sector teams, together with ING’s Economics department, have identified policy interventions
that we believe are necessary for each sector to achieve its net-zero goals. In steering our own portfolio, we
are dependent on these external actions to meet the 2030 and 2050 targets we have set.
Power generation
The sector is facing various hurdles, including increased costs, delays in issuing permits, availability of land,
and wider supply-chain bottlenecks. Given that the actions described below typically have long lead-times,
urgent government action is required.
Maximise solar and wind energy: via permissions and funding incentives like contracts for difference (CfDs).
Boost power storage technologies such as batteries and hydrogen via hydrogen infrastructure and, where
necessary, provide subsidies.
ING Group Annual Report 2023 on Form 20-F 44
CO2 infrastructure: grant permits and build infrastructure for carbon capture and storage (CCS) on existing
waste and biomass incineration plants to create negative emissions.
Power grids: expand, strengthen and modernise (high voltage) power grids to prepare for increased
electricity demand, rapid renewable capacity build out and extreme weather conditions. This includes the
use of batteries for grid support.
Dynamic pricing: for corporates and for consumers, to better match the supply and demand of highly
variable output from renewable power sources (solar and wind).
Oil & gas
The challenges we see in this sector include:
Reduce methane (CH4) emissions: This can include binding commitments and the implementation of
norms and regulations, as well as bringing in additional countries to the Global Methane Pledge. Reducing
methane leaks to the atmosphere is the single most important and cost-effective way to bring down these
emissions. There are also opportunities in the elimination of routine flaring during crude oil extraction and
integrating renewables and low-carbon electricity into oil & gas production.
Maximise carbon capture and storage (CCS): The pace of decarbonisation of fossil fuels can be hastened by
harnessing the potential for CCS. For this, both permissions and infrastructure are required – in the oil & gas
industry, and also in ‘hard to abate’ energy-intensive sectors that remain heavily dependent on fossil fuels
like the cement, steel and petrochemicals industry. Many net-zero and ‘true greening technologies’ still take
years to scale-up before they have a sizable impact on emission reduction, and in the meantime, CCS is an
important bridging technology.
Maximise hydrogen (H2), biomethane and advanced biofuels: These present near-term opportunities to
supply the energy system benefits of oil & gas without additional carbon emissions. According to the IEA,
these low-carbon fuels would need to account for 15 percent of total energy supply by 2030 for the world to
be on track for net-zero emissions by 2050. We are seeing increased support for hydrogen, for instance
from the European Commission, which created the European Hydrogen Bank to ‘guarantee’ a price for H2
off take. However, member state and EU support mechanisms are not always aligned.
Cement
According to the IEA Tracking Clean Energy Progress report, the global cement industry is not on track to
meet its net-zero targets. The report shows that the direct CO2 emissions intensity of cement production
has been broadly flat over the last five years. Major policy developments of the last year (such as the US
Inflation Reduction Act and the EU Green Industrial Plan) hold promise for reducing emissions from the
cement sector, but more cooperation between advanced and developing economies is needed to establish
effective climate policies and prevent carbon leakage. Development and deployment of low-carbon
technology innovation – such as low clinker cement, carbon capture and storage, and electric kilns – needs
to be stimulated, together with emerging technologies in material efficiency and cement recycling.
Steel
For the steel sector to be able to reach its net-zero targets, clear regulation that incentivises and supports
the substantial investments needed in new technology is essential. In addition, the transition the sector is
going through requires green electricity and hydrogen infrastructure. Cooperation between developed
countries on carbon pricing and border taxes will be required to avoid carbon leakage in the initial phase,
after which the knowledge gained should be used to support other major markets like China and India in
their transition.
Automotive
Given the global footprint of the automotive industry, the following steps should be undertaken swiftly and
aligned across the major regional markets of China, Europe and the USA.
Electrification: continue to stimulate the shift to electric vehicles (EVs), by setting norms and phasing out
internal combustion engine vehicles (ICEs), with the aim to gain scale in EV production, stimulate the
development of product ranges, and reduce the relative total cost of ownership (TCO)/km of EVs.
Infrastructure: invest in the accelerated roll-out of EV-related (charging) infrastructure, shift subsidies from
fossil fuels to renewable power, establish localised battery value chains and promote circular practices to
secure resources in the long term.
Decarbonise EV value chain: enforce EV battery recycling and hold both manufacturers and mining
companies accountable for decarbonising their production processes.
Behavioural change: incentivise the replacement of existing ICEs and stimulate the production of energy
efficient EVs by introducing CO2-related road-charging systems, as well as encouraging the use of public
transport and car-sharing. Educate and inform car owners of the lower total cost of ownership of EVs versus
ICEs.
Shipping
In steering our own portfolio we are dependent on these external actions to address challenges in the
shipping sector, to meet the 2030 and 2050 targets we’ve set.
ING Group Annual Report 2023 on Form 20-F 45
Efficiency in fleet and voyages: significantly reduce carbon intensity of vessels and voyages through
increased efficiency measures in the short term (such as energy-saving devices, ’slow steaming’, use of
shore-power in ports and voyage optimisation).
Availability of alternative fuels: scale up availability of low(er) carbon fuels in ports, including drop-in fuels
for existing vessels. Mandate alternative-fuel-capable new builds and retrofits for operating on low carbon
fuels (produced through green pathways) including hydrogen-based e-fuels. Promote green shipping
corridors to create demand for alternative fuels.
Aviation
Actions to engage with government and policy makers are needed to meet net-zero targets. For example,
via IMPACT, there is a need to advocate for reporting standards for airlines and lessors to create more
transparency and consistency. There is also a need for more research into policy, regulatory and market
trends to monitor developments in pricing schemes and sustainable aviation fuel (SAF).
Residential real estate
Reaching net-zero milestones in residential real estate is largely dependent on the national energy mix of
the countries where the homes are located, and requires governments and institutions to accelerate the
installation of new renewable electricity capacity and shift away from fossil fuels like coal, oil, and natural
gas.
Governments also have a primary role to play in driving changes in consumer behaviour by mandating,
incentivising, and supporting homeowners to make sustainability an integral consideration when
constructing or renovating their homes. While the take-up of our sustainable housing products and services
has shown the promise of change to come, we note that demand among customers is still not at the level
required to drive the transition.
We continue to engage with government and regulators, like in Australia, where we participate in
discussions with government and banking sector peers to advocate for improvements to the data and
systems used to understand household energy use.
In both the Netherlands and Belgium, we participate in round-table discussions with government on how to
finance improvements in energy efficiency, also participating in regional Belgian working groups aimed at
accelerating sustainable home renovations.
At EU level we’ve contributed (as a member of the steering committee) to the Energy Efficiency Financial
Institutions Group and to the evolving Energy Performance Buildings Directive (EPBD), and generally seek
opportunities to engage on energy efficiency policy.
Commercial real estate
EU legislation on sustainability in real estate, including climate-related policies, is being developed (for
example the 2021 revision of the EPBD, adopted in early 2023), however the requirements for the real estate
sector from current legislation are still limited, and sometimes voluntary.
We therefore believe that it is necessary to urgently implement a blend of subsidies, regulations and norms
that incentivise the deployment of decarbonisation measures (like insulation and heat pumps) and limit
transition risks.
We also see the need for norms and regulation on data measurement and disclosure. Data measurement is
a precondition for managing CO2 emissions. The real estate sector should be required to measure and
disclose the CO2 emissions of buildings, and define strategies to fill in ‘data gaps’. Sound data measurement
is not only needed to reduce emissions, but is also a way to anticipate (future) legal reporting requirements.
Data quality and disclosures should be ensured via central registration.
Carbon pricing: introduce market-based mechanisms such as a global carbon pricing to incentivise the take-
up of alternative fuels, bring about drastic reduction of emissions, and provide price parity for low-carbon
fuels.
Nature
Our nature approach builds on our Terra approach on climate. We aim to integrate nature in the structures
we’ve already put in place for climate action, and in our sustainability approach in general. Climate change
is one of the drivers of nature loss; with our updated approach we aim to address other main drivers as well.
We’ve identified three objectives that support this, focusing on the impact we have through our loans to
companies:
•Managing risk and impacts;
•Steering our portfolio and engaging with clients;
•Promoting ‘nature-mainstreaming’ internally and externally.
With our approach on nature, we aim to take impactful steps to contribute to halting and ultimately
reversing nature loss.
ING Group Annual Report 2023 on Form 20-F 46
ING’s role in accelerating our Wholesale Banking clients' transition to net
zero by 2050
ING has a role to play in partnering with governments, corporates, citizens and other banks to mobilise the
capital needed to successfully finance the unprecedented economic paradigm shift and facilitating the
transition to net zero by 2050. An important part of this role is to work with clients and help them achieve
their sustainability goals, and where possible in line with science-based trajectories.
Our strategy builds on the following crucial pillars for our success:
•Partnerships in the evolving sustainable finance markets, be it with regulators, other banks or
corporations to set standards that increase transparency for the market. We cannot transition alone and
therefore we deem partnerships with our peers and governments as one of the most important pillars.
•Measure our own progress by continuously reporting on our main strategic objective: to increase volume
mobilised to support the transition.
•Tailoring our products to the needs of our clients. We recognise the diversity of our lending book where
strong sector expertise is required to match our well-established and leading sustainable finance
expertise. Therefore, we work together across teams to develop innovative new products that anticipate
and meet the needs of our clients and support their sustainable actions.
•Engaging with individual clients to understand their sustainability strategies and transition plans, support
them to connect within their value chains, jointly working to meet global targets set in the Paris
Agreement and the Sustainable Development Goals and adhere to ESG regulations.
Through our sustainable finance activities, we aim to deliver on our main ambition – reaching net zero by
2050 through the engagement we have with our clients. We recognise that green is not always black and
white and that delivering on this commitment is not an easy task. As the world of sustainable finance is
maturing, so are we and we are continuously adapting to new market standards, data availability and
quality and the availability of sector-specific pathways that can accelerate our sustainable transition.
Developments in the sustainable finance market
2023 was a year where sustainable finance markets around the world significantly evolved. From the Green
Light Committee, to the Green Bond Standard by EU Member states, to the Financial Conduct Authority
(FCA) that requires asset managers to improve ESG fund disclosures. A global wave of regulatory proposals
has impacted how we do our business. All these developments are aimed to increase transparency,
establish market norms and above all, to prevent greenwashing in the sustainable finance market.
Specifically, product-based market standards have provided guidance on how we engage with our clients.
ING welcomes the market-led standards from the International Capital Market Association (ICMA), the Loan
Market Association (LMA) and the Loan Syndications and Trading Associations (LSTA) and the greenwashing
guidance from supervisors like the European Securities Markets Authority (ESMA) and the Dutch Authority
for the Financial Markets (AFM). The additional guidance sets a market precedent and a minimum standard,
which enables us to engage with our clients, but also other banks in a similar way.
An important development earlier in 2023 was the update to the Sustainability-Linked Loan Principles, set
up by a working group, including ING and led by the LMA. The update provides enhanced guidance on
structuring a sustainability-linked loan. In addition, the LMA has helped standardisation efforts by providing
legal language for loan agreements that all banks should use when describing SLL structures in loan
documentation.
What remains less specifically defined is the term ‘sustainable’ as well as ‘transition finance’, especially on
what attributes are required for a particular asset or project to be classified as 'green’, ‘environmental’,
‘sustainable’, ‘social’ or any similar label. A basis for the determination of such a definition has been
established in the EU with the publication in the Official Journal of the EU on 22 June 2020 of Regulation
(EU) 2020/852 of the European Parliament and of the Council of 18 June 2020 (the 'Sustainable Finance
Taxonomy Regulation') on the establishment of a framework to facilitate sustainable investment (the ‘EU
Sustainable Finance Taxonomy’). We follow such regulations closely and encourage our clients to do the
same.
How we measure our contribution: sustainable volumes mobilised
In the absence of clear definitions on the terminology and use of the term ‘sustainable’, ING defined ‘volume
mobilised’ as the internal and external measurement of progress. We are committed to supporting our
clients in their sustainable transition through our product offering and set ourselves the target to mobilise
€125 billion of volume by 2025. We differentiate between green and social products and sustainability-
linked products. For green and social products, the proceeds are dedicated to finance assets that are in line
with the Green or Social Loan/Bond Principles, hence, financing a specific sustainable economic activity.
Sustainability-linked products are a client engagement product and designed to change the behaviour of a
client and steer their transition. The Sustainability-Linked Loan Principles by the LMA are the main market
guidance. Our product offering applies to our lending, as well as to our investment activities on capital
markets.
Supporting our clients through green and social financing structures
We believe that by financing dedicated proceeds to green and/or social investments, we can significantly
accelerate a green economy.
Green financing solutions, such as green bonds and loans, form an integral part of our sustainable finance
strategy as they are used to fund specific green or sustainable projects. To make sure the proceeds of the
loans and bonds are allocated to activities which have a positive impact on our environment, we structure
our Green Loans and Green Bonds according to the market-accepted practices, in particular the Green Loan/
ING Group Annual Report 2023 on Form 20-F 47
Bond Principles, and align them where possible with the EU Taxonomy. These principles give guidance on
eligible categories for green financing, as well as guidance on the allocation process for proceeds and how
to report on the allocation.
Our sustainability efforts are also directed towards the social aspects of helping customers and society stay
a step ahead of the challenges they face. Social loans and bonds focus on providing funding for social
projects which aim to address or mitigate a specific social issue. They can also seek to achieve positive social
outcomes for specific demographic groups, such as access to healthcare in low-income countries. For this,
we also use the Social Loan/Bond principles for guidance.
Our sustainable finance experts work across sectors to harness innovation and disruptive technologies that
have the potential to accelerate the transition of our clients and our portfolio to net zero. They collaborate
with our global sector coverage colleagues to achieve this, complemented by teams and centres of
expertise dedicated to particular emerging themes. For example, the Sustainable Value Chains team,
created in May 2023, aims to investigate and capitalise on new business opportunities that cut across
existing and new value chains.
Green bond framework funding green through ING’s green bond framework
To support the growth of our green finance portfolio, and to meet green funding needs, ING issues green
bonds, supported by our green bond framework. The framework aligns with the International Capital Market
Association’s (ICMA) Green Bond Principles (GBP). We intend to allocate the proceeds of our green bonds to
an Eligible Green Loan Portfolio of new and existing loans including renewable energy projects and green
buildings.
Under this framework, ING Group and its subsidiaries can issue any debt security (such as senior bonds,
subordinated bonds, covered bonds, commercial papers and medium-term notes) to finance and refinance
assets and projects which aim to contribute to the UN's Sustainable Development Goals and our own
sustainability. ING established its sustainable debt strategy via the publication of the framework. Since then,
we have continued to take steps to enhance our sustainable debt strategy and see it as an important tool in
supporting the growth of our own sustainable finance portfolio.
In alignment with the ICMA’s 2021 GBPs, the framework is presented through four pillars: use of proceeds,
process for project evaluation and selection, management of proceeds and reporting. The framework also
follows the recommendations of the Green Bond Principles regarding external review.
Supporting our clients through sustainability-linked structures
Sustainability-linked loans/ bonds (SLLs) link interest margins to a company’s sustainability performance
through mutually agreed KPIs and pre-defined annual performance targets. This mechanism enables ING to
support, motivate and reward or punish clients in their aim to become more sustainable. ING is the creator
of the sustainability-linked loan, pioneering it in 2017 for Philips. The original loan was linked to the
improvement of Philips’s Sustainalytics ESG rating and later converted into a KPI-linked loan with KPIs
aligned with Philips’s sustainability goals for lives improved, lives improved in underserved communities,
circular revenues, and operational carbon footprint.
Improved market standards and guidelines support us in having more focused discussions with our clients
regarding defining KPIs and address the most material ESG topics of our clients through meaningful and
ambitious sustainability performance targets. We ask our clients to externally verify sustainability
performance targets in line with the Sustainability-Linked Loan Principles by the Loan Market Association
(LMA). We believe that through the annual check-in on targets and continuous client dialogue, we have the
chance to support our clients' transitions from up close, thereby also delivering on our own strategy. As the
originator of the sustainability-linked loan, we strive to keep standards for the use of sustainability-linked
instruments high and welcome all initiatives to strengthen and protect the credibility of the sustainability-
linked loan market. In 2023, sustainability-linked loans accounted for nearly 41 percent of the financing
volume mobilised by ING that contributes to our clients' transitions to more sustainable business models.
Supporting our clients through ESG advisory
Besides financial support, we help clients navigate the rapidly changing regulatory landscape and advise on
their net-zero strategy. Clients benefit from our deep and broad experience built up over the years helping
other companies on ESG-related journeys. Some clients are ahead of the curve and for them we frequently
act as a sounding board, alongside our financing-related role. Other clients are at the early stages of their
sustainability journey. For them, we provide guidance based on our market experience and suggest areas
where they can make impact to become aligned with climate pathways and their peers. The core services
we offer through our ESG Advisory expertise are centered around ESG strategy advisory, ESG rating
advisory, ESG reporting advisory and ESG product advisory.
Other ways to support our clients
We also look for other ways to support clients taking steps to achieve their sustainability ambitions and
anticipate the future economy. Many of these ambitions are based on innovative technologies, business
models or client propositions that have a higher risk profile and are not yet suitable for standard financing
solutions. ING supports clients with their sustainability goals by providing risk-bearing capital, offering a wide
range of tailor-made financial solutions, including equity (investments) and subordinated debt. In addition
to this, we help drive the necessary net zero-supporting innovation by functioning as a laboratory for new
sustainable technologies and business models in need of financing within the EMEA region, with a focus on
circular economy, bio-chemicals, waste and water, and other sustainable development projects.
ING Group Annual Report 2023 on Form 20-F 48
Product offerings for Retail Banking
In Retail Banking, we aim to help customers transition to a low-carbon environment. While we have provided
sustainability products and services in Retail Banking since 2017, in the last two years we have introduced
sustainable banking products across our markets, following a sustainable alternative products roadmap, to
facilitate this transition. It is our aim to have sustainable alternatives for our main retail products in all
markets by 2025.
Product offerings for Retail - Private Individuals
Sustainable housing is one of our main priorities in this area. Residential real estate represents one of the
more carbon-intensive sectors that we lend to. Therefore, it is an opportunity for us to work together with
our customers to reduce the CO2e intensity of their homes.
We aim to steer our work in this area as part of our Terra approach, towards delivery of ING’s overall net-
zero commitment by 2050 – including intermediate 2030 ambitions. To reach net zero, homes in ING’s
mortgages portfolio should reach an average CO2e intensity of 16.8 kg CO2e/m2 in 2030 and 0.3 kg CO2e/
m2 in 2050. These milestones are informed by our convergence pathway, with the latest net zero pathways
published by the Carbon Risk Real Estate Monitor (CRREM V2.02). We aim to steer our mortgage portfolio in
the Netherlands, Germany, Belgium, Poland, Spain, and Australia, representing around 96 percent of our
mortgages book (excluding WestlandUtrecht Bank) in terms of outstanding.
In 2023, we continued to work on this priority, covering how we finance customers to change, provide
inspiration and information that helps them in this process, and finally how we engage with partners and
governments to support ecosystem change. Such engagement with external stakeholders helps to inform
choices we make, particularly related to how we connect our customers with renovation service providers.
To limit negative consequences and empower our customers to realise the positive impacts of making their
homes more sustainable, we offer sustainable mortgages that incentivise customers to choose energy-
efficient homes in the Netherlands, Germany, Belgium, Italy, Romania, and Spain. In Poland, we continued
to support customers in making sustainable decisions with a mortgage for energy-saving houses. In the
Netherlands, we launched a new renovation mortgage, which, for example, allows customers to increase
their loan-to-value to help cover the cost of renovations. We also continued to offer unsecured sustainable
consumer loans that can be used for energy-efficiency renovations in Belgium, Luxembourg and Poland,
extending this offer to Germany in 2023. In Romania we provide incentives for the installation of solar
panels.
In addition to our own financing, we contribute to efforts that connect homeowners to public financing – like
our financing (through our Business Banking lending) of the Warmtefonds (National Heat Fund), which aims
to have both a positive environmental and social impact by enabling low-income households in the
Netherlands to make their homes more sustainable. In 2023, ING made a further €200 million in financing
available to the National Heat Fund.
We also provide customers with a range of tools and platforms that can support them in their renovation
efforts. This includes providing access to renovation platforms that help customers determine what
renovation actions to take, link them to renovation contractors, and connect them to financing to pay for
the necessary improvements. These platforms include homeQgo in the Netherlands, CFP in Belgium
(through our mortgage advisers) and a renovation calculator built in partnership with KfW Bank in Germany.
We strive to raise awareness and educate customers, and have made increasing amounts of information
available. In Belgium, for example, we have launched a Sustainable Buildings Guide, a free digital tool that
helps customers identify which investments to make to improve the energy performance of their homes.
We are also providing renovation-related insights to customers via email newsletters and our websites. In
the Netherlands, our web pages on sustainable housing have been visited more than 200,000 times.
We also continue to build our customer advisory services, for example in the Netherlands, Belgium, and
Germany where we provide training to mortgage advisers on eco-renovations so they can better advise
customers interested in improving the sustainability of their homes.
We monitor the effectiveness of each of these efforts at the country level, and collectively aim to steer on
those through a Net Zero Housing Committee, which brings together representatives from our largest
mortgage markets, and colleagues from ESG Risk, Retail Banking, and Sustainability. A key insight we have
learned from all our efforts is that renovating homes to improve energy efficiency is a massive challenge for
homeowners (particularly those most vulnerable) and housing renovation companies, and requires
significant government intervention to regulate, incentivise, and support the process. Accordingly, ING is
committed to increase our engagement with government and other stakeholders to create more
momentum towards such renovations in society.
Product offerings for Retail - Business Banking
We are helping Business Banking customers make their businesses future-proof, by offering loans and
leasing solutions for sustainable purposes (e.g. transition to renewable energy, sustainable real estate,
electric vehicles). Our ambition is to offer relevant sustainable financing alternatives in all countries and
segments and grow our new production of sustainable financing from approximately €1 billion today to
over €2 billion by 2025.
To offer relevant solutions for all customer segments, our product offering ranges from instant sustainable
loans for the self-employed and micro companies, to tailor-made sustainable loans and lease solutions for
SMEs and mid-corporates. Products such as sustainable loans, sustainable lease solutions and sustainability
improvement loans are now offered in the Netherlands, Belgium, Romania, Poland, Türkiye and
ING Group Annual Report 2023 on Form 20-F 49
Luxembourg. A key development in 2023 was a new agreement with the European Investment Bank (EIB)
making €600 million available for new sustainable loans and leases, at favourable interest rates, to SMEs in
Belgium, the Netherlands and Luxembourg to boost sustainability.
In the Netherlands, we continue to build on our successful real estate platform that helps customers gain
insights on their commercial real estate, provide actionable insights and advice to improve their energy
performance while providing financing solutions. We have scaled this platform to Belgium and are exploring
further ways to extend it to other markets and sectors.
Another notable development in 2023 was the launch of a carbon footprint calculator in Poland, which helps
SMEs calculate their carbon footprint using their own data on energy consumption, raw materials, and
resource use.
Manage climate and environmental risks
Managing our climate (and other environmental) risks is a key element of our climate approach and ING’s
overall strategy. We have invested a significant amount of time and resources in developing our capabilities
and expertise in this emerging and fast-developing area of risk, and strive for continuous improvement.
ING’s integrated climate approach considers how we can mitigate climate change through our financing as
well as how climate change may adversely impact our business. We’re working to become more resilient to
climate risk, and have the ambition to become an expert in managing and mitigating these risks as we are
in managing credit and other forms of financial risk.
Climate risk can impact the macro-economy, businesses, and individual households. Ultimately, physical
and transition risks could impact our balance sheet and profitability. Our approach is focused on
consistently embedding climate risk considerations across our global organisation, aiming to make it an
integral part of how we do business.
Over the near-term time horizon, we plan to continue refining our methodologies to evaluate climate risks
and opportunities. We’re working on putting into practice quantitative methodologies for climate and
environmental (C&E) risk identification, materiality assessment and risk appetite setting. This is supported
by the integration of C&E risk considerations in risk policies and procedures, our ESG Risk Framework.
Going forward we aim to further enhance our climate and environmental risk management by:
•Continuing to address the expectations of the European Central Bank (ECB) Guide on climate-related and
environmental risk;
•Continuing to close the gaps on climate risk data;
•Improving our understanding and assessment of the impact of other environmental factors such as
biodiversity;
•Identifying opportunities to support our customers who face transition or physical climate risks;
•Building up capacity and upskilling colleagues to understand and deal with the impacts of climate and
environmental risks.
Read more on ESG risk structure and governance in 'Risk management'.
Meeting ECB expectations
The European Central Bank expects all banks to be aligned with the 13 expectations outlined in the ECB’s
guide on climate-related and environmental risk. We are currently addressing these, and aim to be aligned
with the ECB’s expectations by the end-of-2024 deadline.
Continuing to close data gaps
Climate-related data is essential to fully understand and manage C&E risks and to report in line with current
and upcoming regulations on ESG disclosures. To keep improving our assessment methods for both physical
and transition risk, we need detailed data from our counterparties, including data on specific assets and
regions, their vulnerability to risks, and the actions they are taking to mitigate these risks. We have
partnered with various external data providers and have launched internal initiatives to source data directly
from our clients and suppliers. Data quality poses a universal challenge for companies and financial
institutions managing climate and environmental risk.
Understanding and assessing interlinkages and dependencies
Biodiversity loss is inextricably linked to climate change, and our approach to ESG risk includes managing
nature-related risks. We aim to introduce further granularity in our biodiversity hotspot analysis, and have
been testing an approach for measuring biodiversity impact which we expect to give us more detailed
insight into the sectors in our portfolio that are both most dependent on and most impacted by biodiversity.
Supporting customers
We’re currently developing an online platform to centrally collect, assess and monitor the publicly disclosed
climate transition plans of our clients. This platform will rely on information sourced from the Carbon
Disclosure Project (CDP), the Science Based Targets initiative and clients’ own public sustainability reports. By
aggregating this information, we’ll improve our insights into our clients’ transition plans, and be better able
to identify both risks and opportunities - enabling us to better support our clients in mitigating and adapting
to the effects of climate change.
ING Group Annual Report 2023 on Form 20-F 50
Social
As an employer, we aim to provide a safe and inclusive workplace, with
a workforce that reflects the diversity of our customer base. We believe
financially healthy people contribute to a healthy economy and drive
social progress, which is why we aim to support customers in meeting
their financial commitments now, while building their financial security
for tomorrow. We believe every person deserves to be treated with
dignity and have their interests considered equally.
We can help address social challenges as a financier, employer, service provider, and driver of progress and
prosperity. We consider our social priorities to begin with our employees, including diversity, equity and
inclusion, learning and development, engagement and well-being. The satisfaction and financial health of
our customers is also central to our social contribution, as is our commitment in society to human rights
and financial inclusion.
Unlocking our people's full potential
ING makes the difference through the activities and actions of our people. We unlock our people's full
potential through our inclusive culture, where everyone has the opportunity to develop and have impact for
our customers and society. In 2023, we focused on three pillars to deliver for our people: ‘talent &
leadership’, ‘culture & organisation’, and ‘employee experience’.
Talent & leadership
Skills and capabilities
Our success depends on our ability to attract, develop and retain people with the skills we need to deliver
great performance. We upskill our workforce by providing our people with the learning and development
they need to perform well and grow their careers. In 2023, we made learning solutions more accessible
through a global learning offer, rolling out Udemy Business to 37 countries, which provides on-demand,
relevant and engaging content in an accessible, digital way. We have had a successful uptake of more than
20,000 global users, earning a 4.2 out of 5 rating from learners.
Completion of learning courses increased by 5.7 percent and 1,189,829 hours of learning were undertaken.
The positive trend for non-mandatory learning continued, making up 48 percent of all learning completed in
2023, up from 43 percent in 2022, with more people electing to learn new skills and build capabilities
relevant to their job roles and function.
In the context of sustainability, we aim to make sure that our colleagues are highly engaged with our
strategy and all sustainability-related topics, especially climate action. In support of this, we’re developing a
global sustainability learning programme. The first delivery – an e-learning covering the fundamentals of
our sustainability approach – launched in April 2023. We have also created upskilling programmes aimed at
developing more expertise, and the first modules on Climate & Environmental Risk were released in July
2023.
We provide role-based development via 10 global academies. These academies offer relevant, engaging and
ING-specific training for the skills required now and in the future. For example, our technology academy
rolled out a new ING-specific learning offering, which was developed in-house, in collaboration with internal
engineers. More than 4,700 engineers have so far enrolled to this global offer and have taken the
opportunity to upskill on topics like Public Cloud, Java and Oracle.
Also in 2023, our COO academy defined six core future skills for our more than 16,000 COO domain team
members. These skills are being assessed across the organisation and learning journeys are being
developed, as we want our Operations teams to be equipped for high performance now, and ready as their
roles change due to increased efficiency, digitalisation and AI.
We also had the Wholesale Banking Business School launch the capital velocity programme in 2023 to
support our strategic ambitions. Participants learned how to optimise the balance book in the face of
challenging external conditions.
Building leaders for today and tomorrow
ING has an abundance of internal talent and a strong culture of developing our people. In 2023, we
introduced a new approach that gives us a broader, deeper and more global visibility of our talent across
ING. This includes emerging leaders and the functional and technical experts that drive the success of our
business. As a result, we’re able to accelerate the development of these leaders, aiming for a healthy
leadership pipeline that reflects our global and diverse organisation, and retain our experts that are hard to
find in the market.
In 2023, we delivered a successful pilot programme to train rising leaders who are preparing for leadership
roles. A diverse global pool of participants (50 participants, coming from 10 countries, 54 percent of whom
were women) graduated from this intensive leadership programme focused on strategically relevant topics
ING Group Annual Report 2023 on Form 20-F 51
such as sustainability, digitalisation and AI, combined with business challenges that allowed them to apply
their learning to genuine business risks and challenges. The programme achieved an above-average Net
Promoter Score (NPS) of 73 and will be scaled up in 2024.
We also support the development of leaders at other key transition points. Our first-time leadership
programme, Leadership Fundamentals, supported 315 people in 21 countries. Our programme for more
experienced People Leaders was updated to include skills required to lead hybrid teams, with 463
participants in 2023.
In addition, we continue to attract and develop early-in-career talent through our global International Talent
Programme (ITP). In 2023, we hired 119 graduates in 11 countries and nine different areas of expertise
(Retail Banking, Business Banking, Wholesale Banking, Tech, Analytics, Risk, Operations, Finance and HR).
These 119 new trainees will replace the 77 that started in 2021, concluded the programme in 2023, and are
now in roles across the bank.
Culture & organisation
Our vision is to unlock our people’s full potential through our inclusive culture where everyone has the
opportunity to develop and have impact for our customers and society. To achieve this vision, we follow an
approach that is based on data and evidence to keep track of progress.
Equal pay for equal work
Equal pay for equal work assesses whether female and male employees in the same job receive equal pay
for equal work. We calculate this with our GJA, which allows us to compare like-for-like jobs. It categorises all
1,425 job profiles within ING in a standardised and simple way, using common language that makes it easier
to compare and match accountabilities and capabilities across countries and business lines.
In 2023, ING performed an ‘equal pay for equal work’ assessment across all countries using data from 2022.
The results have been shared with the countries we operate in for further analysis. There are circumstances
when it is appropriate to pay employees differently, even if they are doing similar jobs, for example because
of differences in skills or differences in performance. Where any unjustified differences are found, we make
the necessary adjustments to ensure equal treatment.
Diversity, inclusion and belonging
Using insights like the gender pay gap and equal pay for equal work analysis, we bring diversity, inclusion
and belonging (DIB) to life with a full package of structure, data, metrics and communication. Our diversity
and inclusion (D&I) policy commits us to:
•Actively support diversity, equity, and inclusion, and embed a culture where everyone is valued and
treated with dignity and respect;
•Ensure that people leaders work in partnership with their teams to create and sustain an inclusive
working environment where everyone's unique contribution is valued and where everyone feels a sense
of belonging;
•Ensure that decisions affecting employment, learning and development, promotion and career
development are based on an individual's ability and reflect genuine requirements of the job;
•Conduct annual analyses of our global gender pay gap and equal pay for equal work as part of our
commitment to denounce discrimination and to promote equal remuneration for work of equal value for
all employees;
•Provide everyone with the appropriate information, and training, on diversity, equity and inclusion in the
workplace;
•Make the necessary adjustments to meet the needs of people with disabilities where reasonable and
practicable to do so;
•Strive continually to provide people with a working environment that is free from discrimination and/or
harassment of any kind;
•Behave in accordance with the values and behaviours of our Orange Code, which applies to all ING
business units in all countries worldwide.
Our stance on discrimination
At ING, we denounce all forms of discrimination. We are working together to create an inclusive workplace
and, in turn, play our part in building an inclusive world. To support our ongoing efforts to create meaningful
change, we have measures that aim to keep discrimination from happening within our company.
Discrimination includes any distinction, exclusion or preference made on the basis of age, sex, gender
identity or expression, gender reassignment, sexual orientation, family responsibility (including pregnancy,
maternity, paternity and adoption), partnership status, cultural background, religion, race, ethnicity,
physical or mental disability, nationality, political opinion, social origin or any other status, that has the
effect of nullifying or impairing equal opportunity or treatment in employment. Any distinction, exclusion or
preference not based on the inherent requirements of the job is deemed as discrimination.
A renewed global diversity, inclusion and belonging (DIB) strategy
To achieve the commitments set out in our global D&I policy, ING's senior management endorsed our new
global DIB strategy in November 2022, which builds on our previous 70 percent principle. It contains clear
actions on increasing gender diversity and equity, while setting a strategic roadmap for structural and
behavioural inclusion at ING, in the actions of our leadership, in our individual and collective behaviours, and
in our structures and processes. This way, we can achieve sustained and measurable change.
ING Group Annual Report 2023 on Form 20-F 52
We are equipping our most senior leaders with practical skills on inclusion through targeted workshops,
attended by 140 leaders across ING globally so far. In 2023, members of our Management Board became
allies of our diversity and inclusion employee networks, of which there are over 35 globally relating to
gender, LGBTQI+, culture, race and ethnicity, disability, and generations. Through structured dialogue with
the leaders of our employee network across ING, the members of the Management Board are learning
about the experiences of employees of diverse identities with the aim of addressing structural inequalities
and driving inclusive behaviour. As well as fostering diversity, inclusion and belonging in these areas, the
networks raise awareness around how workplace issues affect certain groups and provide employees with a
sense of connection and belonging. To celebrate the diversity of our global workforce and encourage
inclusive behaviour, we held our fifth consecutive Global DIB Day in 2023, with 22 countries hosting over 90
events with the active engagement of 4,000 employees.
To improve gender diversity in senior management, in 2023 we made it a requirement that external
recruitment firms provide gender diverse candidate lists. We promote flexible working to enable all parents
to succeed professionally while managing their family lives. We have seen how flexible working benefits the
lives of employees – especially those with care-giving responsibilities – which is why we remain an advocate
of it. In our largest market, the Netherlands, we introduced extended parental leave for new mothers in
2023. This new provision complements our existing parental leave, which is gender neutral and inclusive of
diverse families.
To achieve greater equity, we have embedded ‘bias interrupters’ in our recruitment, performance-
evaluation, and talent-assessment processes. We're also developing the capabilities of our people leaders
and HR professionals to judge fairly and without bias.
We are committed to building a strong internal pipeline of talented women into senior leadership roles.
Through our leadership accelerator programme, which has a 54 (female)/46 (male) percent gender split in
the participant group, we provide content that addresses gender-specific barriers to progression. We also
monitor the gender balance in our leadership pipelines. In 2023, we added a second bank-wide gender
diversity target to increase the representation of women in our leadership pipeline, in addition to the
existing gender diversity target for senior leadership. The variable pay of our Executive Board and
Management Board Banking is linked to the delivery of these internal targets on gender diversity.
Much of our diversity data is based on demographic representation. Our gender diversity analysis continues
to become more advanced, with combined dashboards of hiring, retention, and progression and forecasting
tools. Furthermore, we are broadening the diversity demographics against which employees can self-
disclose, within legal and data protection parameters, to continually inform our strategies and meet
increasing external reporting requirements. As we improve the quantity and quality of diversity
demographics across ING, we will evolve our diversity target-setting where needed to address under-
representation.
To better understand our employees’ experiences of inclusion, we introduced an Inclusion Index in the
fourth quarter of 2023 in our OHI survey. As part of this, we analysed different experiences of inclusion
based on gender, age and organisational demographic, allowing us to take targeted action where required.
The Inclusion Index will be measured annually.
In 2023, we rolled out a diversity, inclusion and belonging learning curriculum for all employees, people
leaders and senior leaders to encourage inclusive behaviours at all levels. The curriculum provides everyone
with training on diversity, equity, and inclusion in the workplace.
External recognition of DIB efforts
One of the ways we create a more equitable and inclusive workplace is through external and independent
review. ING was one of the 484 firms recognised in the 2023 Bloomberg Gender Equality Index (GEI), which
offers public companies the opportunity to disclose information on how they promote gender equality
across five separate areas: female leadership and talent pipeline, equal pay and gender pay parity, inclusive
culture, sexual harassment policies, and pro-women brand. In 2023, ING scored 72.3 percent, an
improvement on the 70.35 percent score from 2022. This is the eighth year that we've been included in the
listing.
We are a founding partner of Workplace Pride, an organisation dedicated to improving the lives of LGBTQI+
people in workplaces worldwide. Its activities include the International Workplace Pride Global Benchmark,
which assesses companies in eight areas and identifies best practices. In 2023, ING scored 82.07 percent in
the benchmark, an improvement on the 78.8 percent score in 2022, earning us a recognition of Workplace
Pride Ambassador for the fourth year running. ING is dedicated to having an LGBTQI+-inclusive culture and
our Rainbow Lions networks across 10 locations have played an important role in shaping this.
Vitality
Our people are our biggest asset and only by unlocking their full potential will we be able to make a
difference for our customers, our society and our planet. Therefore, we need the right energy, which at ING
we call vitality. We are aware that work-related stress is a reality for some, and this is monitored both
locally and globally through a vitality section in our employee survey once a year, with the results used to
shape and track our vitality initiatives.
Building on the initiatives of 2022 to enhance our people’s vitality by supporting them in developing the
right working habits, in 2023 we created a global set of ‘working habits for vitality’ that will help our people
make the right decisions to maintain and improve their vitality. We also give people insights into their
working habits through technology, and offer practical tools to help them work in a sustainable way. These
can be team agreements on working flexibly, or training on how to maintain a healthy work-life balance.
We promote a flexible way of working among our employees through our International Remote Working
programme, hybrid-work flexibility and various paid-time-off programmes.
ING Group Annual Report 2023 on Form 20-F 53
We aim to equip managers with the resources they need to support and guide their teams in having more
‘vitality’, because managers play a key role in the success of the ‘working habits for vitality’ by setting the
right example. The training programme followed a phased roll-out approach until the end of 2023, and will
continue in the first quarter of 2024.
We continue to count on local initiatives to offer customised vitality solutions to our employees. Alongside
the continuous vitality offerings that are available every year, there were a number of local initiatives in
2023 to support our vitality pillars:
Mental health
In Germany, we put a focus on mental health by discussing sensitive topics in interviews with experts and
gave colleagues information and support via monthly newsletters and lunch-and-learns. And at our Poland
Hubs, we marked Mental Health Week by giving employees access to related topics webinars, podcasts and
activities.
Physical health
As part of our Collective Labour Agreement (CLA) in the Netherlands, more than 3,700 employees
underwent a personal health check via an external partner. Based on their individual outcomes, we offered
customised support to improve their vitality, such as online nutrition coaches, face-to-face vitality coaches
and digital support tracks. Employees in Poland also received the same offer.
Social connection
Australia and Germany have either set up or expanded their mental health first aider peer-support
networks. ING employees can opt in to be trained in mental-health first aid to signpost those struggling or in
distress to the appropriate help.
Financial health
In countries such as the Netherlands, Romania, Poland, Spain, the Americas, Belgium, and Australia, we offer
financial coaching for our employees to discuss how financially healthy they are.
Family and friends
Spain's ‘Plan Familia’ is a programme intended to support employees who have a dependent child with a
congenital or acquired disability of over 33 percent with a monthly allowance. Poland has a similar offering.
Belgium rolled out the vitality boost programme, in which employees can follow an 8-10-week journey in
the area of vitality they need most (on any of the pillars). This was a unique and multidimensional approach
that has already led to positive employee experiences and impact.
Employee experience
Providing a superior customer experience is a strategic priority. This matters just as much for employees,
and we are therefore focused on continuing to improve our employee experience. We aim to provide
personal, easy and efficient services that encourage our people to unlock their full potential and be the best
they can be. In 2023, we continued to deploy our global HR system to more than 70 percent of our total
employee population. We also made progress in digitising our employee journeys with more automation,
such as in the area of expenses or employee document handling. Another priority has been the
simplification of HR processes and the reduction of administrative tasks for managers. For instance, in the
Netherlands, we reduced the number of notifications and approval steps on HR-related processes from
16,000 to 6,000 per month.
Customers
Part of ING’s purpose to empower people to stay a step ahead in life and in business means helping
customers and society stay a step ahead of the challenges they’re facing. One of the ways we can make a
difference here is by aiming to advance financial health and inclusion for customers and communities.
Customer-centricity policy
As a global bank, we recognise the impact our activities can have on society and individuals. Therefore, our
Orange Code promise is: ‘Integrity above all, by balancing the rights and interests of all stakeholders’. In
2023, we solidified this promise by creating a global customer centricity policy. The introduction of this
policy is one measure we have taken to prevent contributing to customers’ financial distress. The policy is
based on our customer golden rules (CGR).
ING’s purpose is to empower people to stay a step ahead in life and in business. To help our potential and/or
existing customers do this, ING offers a large variety of financial products to a large variety of customers. As
a result, ING faces a multitude of risks and regulations. The CGR define high-level common principles to
ensure ING handles these risks and regulations appropriately. Complying with the CGR will help to:
•Ensure we protect, safeguard, and not violate the rights of customers;
•Ensure we put the customers’ best interests, protection, and needs at the centre of all our activities;
•Contribute to a sustainable society;
•Mitigate the risk of mis-selling and customer detriment.
The customer golden rules are:
•We offer products and services suitable for the customers throughout the whole relationship lifecycle.
•We offer products and services at a fair price considering the market, costs and risks.
ING Group Annual Report 2023 on Form 20-F 54
•We communicate information on products and services in a clear and non-misleading manner.
•We provide services and trusted advice through professionals with the necessary knowledge and
expertise.
•We consider the Environmental, Social and Governance (ESG) risks and impact of our products and
services.
When we create and sell products, it is our policy to take into account the wider interests of society. This
means we aim to provide products that add value to individual customers, work to offer sustainable
products and avoid publishing information that amounts to greenwashing or ethics washing. We also aim to
provide access to our services for all clients, including those with, for example, low levels of digital literacy or
a disability. Finally, we aim to meet the needs of customers at risk of vulnerability or marginalisation.
Financial health and inclusion
Financially healthy people and businesses can contribute to a healthy economy and help drive social
progress. At the same time, money is a leading cause of stress for people, with half of European households
struggling to make ends meet. According to the group European Pensions, one third are unable to face
unexpected financial expenses and close to 40 percent are not saving for retirement.
ING aims to empower people and businesses towards improved financial health, a state in which an
individual, household, micro, small or medium-sized enterprise can manage their current financial needs
and have confidence in their financial future. This includes managing day-to-day finances to meet short-
term needs, the capacity to absorb financial shocks (resilience), the capacity to reach future goals, and
feeling secure and in control of finances (confidence).
We’re working with the United Nations Environment Programme Finance Initiative under the Principles for
Responsible Banking to contribute to setting a measurement standard for financial health impact for our
industry. As a founding signatory of the Commitment to Financial Health and Inclusion in December 2021,
we’ve committed to setting ambitious targets supported by measures around products and services,
processes, data analytics and/or partnerships, with the aim of promoting financial inclusion, and fostering a
banking sector that supports financial health.
Advancing customers' financial health and inclusion
ING aims to contribute to a positive, measurable impact on our customers’ financial health with a focus on
those with whom we can have the biggest impact. We do this by focusing on a few specific impact areas.
For each area, best practices are shared between business units with the goal of learning from each other.
Financial inclusion, the first area, is about accessibility. ING wants to be an accessible bank for everyone,
including people living with disabilities, whether that means sight, hearing, physical disabilities or cognitive/
learning disabilities. We have taken various steps, such as installing voice-activated ATMs in certain
countries that make it easier for people with a visual impairment to withdraw money and also issuing bank
cards with a notch on top so they can insert them correctly. These cards are also useful for customers with
limited hand functionality. In Australia, customers with speech or hearing difficulties can do their phone
banking via the national relay service and there’s a sign-language service in some of our bank branches in
Poland. Also, in the Netherlands, customers with a visual impairment can use screen readers (software
applications that read out information displayed on a screen) in compatibility with ING.nl and the banking
app, Mijn ING.
It is also about making sure everyone can easily understand our terms and conditions, that the information
on our websites is readily accessible and that customers can use our online banking channels and mobile
apps, irrespective of their situation. We started a programme in 2022 to align digital channels in all our EU
Retail Banking countries with the EU’s Web Content Accessibility Guidelines standard (WCAG 2.1). In the
Netherlands, the Mijn ING app is accessible with a voice-over to transfer money or to get current account
insights.
The second area is focused on building financial resilience. Everyday Round Up, for example, encourages
customers in Poland, Australia, Türkiye, Germany, Spain and Romania to build savings. ING in Spain’s Money
Up! money-management tool aims to help build healthy savings habits and optimise expenses. In the
Netherlands and Belgium, forecasting tools like Kijk Vooruit help customers plan and control their expenses.
For businesses, we launched a similar self-evaluation tool for our Romanian customers in 2023, with a focus
on financial indicators using the customer's own data, and a bank diagnosis feature that identifies potential
financial-health vulnerability. Also in Poland, we introduced a financial-health platform for entrepreneurs,
called Firmove. This provides guidance to entrepreneurs in improving their financial well-being through their
business operations. Additionally, it offers valuable advice and assistance to foster business growth and
enhance sustainability.
Another focus area is that of financial education. Financial illiteracy is one of the biggest threats to financial
health, which we aim to address especially for our young customers. In Belgium, we do this via a financial
check-up session offered to young clients. In countries such as Germany, Italy and Spain, we use
communication and education programmes to help them develop healthy savings and spending habits.
ING Group Annual Report 2023 on Form 20-F 55
Lastly, we see an important role of collaboration with external parties to support the energy transition of
households. In an effort to have an inclusive transition, we are making steps to collaborate with parties such
as banks, governments and others to provide financing means and access to energy education. Here we
aim to focus our efforts on customers who could be struggling with financial health or with energy poverty.
In the Netherlands, ING is a participant of a collaboration between banks, the national heat fund, local
municipalities and energy coaches to help homeowners tackle energy poverty.
Supporting financial health in the community
Our approach to community investment adapts to changing needs. Through a combination of global and
local funding, we support programmes that contribute to inclusive economies in which everyone can
participate. In 2023, ING, together with colleagues and clients, donated €18.7 million to a range of social
programmes, €9.7 million of which was specifically focused on building financial health in communities,
covering the areas of future-proof employment, financial capabilities and social enterprises.
We also donated to the humanitarian appeal to help communities affected by two devastating earthquakes
in southern Türkiye and northern Syria, in February 2023. Together with colleagues and clients, we donated
more than €7.6 million to UNICEF's emergency response and other humanitarian and development
organisations.
Ukraine has been another target of our community investment. An example is our support for the NGO 'For
the good people', focused on financial health and financial capabilities with the specific aim to support
people who have lost their jobs due to mental health disorders. ING also supports 'Convictus Ukraine' and its
WINGs programme that helps improve the economic security of rural, vulnerable and marginalised women,
especially those affected by the war.
ING’s Global Community Investment Fund provided funding to 20 financial-health projects from 13 countries
to help them amplify the impact created at country level.
The ING Netherlands Foundation works with 11 local partners for equal job opportunities. One example is the
collaboration with VHTO, a programme supporting gender diversity in the technology sector. VHTO has
reached more than 11,000 primary and secondary education students with different activities in the
classroom, removing the obstacles that can prevent girls choosing to study IT and eventually selecting it as
a profession. The ING Netherlands Foundation also invests in Young Digitals, an organisation that teaches
young people with fewer opportunities the skills they need to become digital marketers.
As examples of supporting employment, in Germany we partnered with MentorMe, a mentoring
programme that supports vulnerable women in the job market. In Italy, we partner with ‘Fondazione Mondo
Digitale’ (Digital World Foundation) to train around 8,000 people per year, especially women, small
entrepreneurs and young people not in education, with digital skills to better face the challenges of the
labour market. In Belgium, we work with the King Baudouin Foundation managing four funds supporting (i) a
more circular/inclusive economy, (ii) a more digitally inclusive economy, (iii) financial literacy and (iv)
sustainable buildings.
During 2023, ING also initiated projects that assist with financial capabilities In Spain, for example, we invest
in the FARO Project, a public-private partnership between Madrid City Council, ING, and the Nantik Lum
Foundation. The programme trains the social workers in financial education, so they can help and talk to the
users of the city’s social services about financial capabilities, including family finance, savings and avoiding
debt.
We also promote financial health in the community by supporting social enterprise. For example, in
Bulgaria, we collaborated with the Reach for Change foundation in the development of the GROW incubator,
part of the Open the Circle initiative, which provides tailored support for social enterprises that build skills
and job readiness among young people from disadvantaged backgrounds. In Germany, together with Social
Impact GmbH, we match innovative social start-ups with established charities, to exchange knowledge,
expertise and experience. We also provided funding to other social enterprise projects in the Czech Republic,
France, Poland, Romania, Singapore, Ukraine and the United States.
Human rights
We believe every person, everywhere, has the right to be treated with dignity and have their interests
considered equally. ING and our clients have the potential to impact human rights through our operations
and business relationships. Our impact is in the different roles we have: as an employer, a procurer of goods
and services and a provider of financial services to corporate and individual customers.
We work to influence and support business partners to respect human rights in multiple ways. Our ESR
framework includes an overarching policy on human rights to guide us when assessing clients and the
transactions we finance. We also act on a variety of environmental, climate and social topics, as well as
highlighting their interconnectivity.
In the beginning of 2024, we published our 2023 Human Rights Report where we assessed and identified our
most severe potential human rights issues for our workforce, our Wholesale Banking and procurement
activities. For our workforce we identified discrimination, harassment and work-related stress as key issues.
In our Wholesale Banking activities, the identified issues are child labour, forced labour, communities’ land
and resource issues. Regarding our procurement activities, we identified forced labour and occupational
health and safety.
Through our financing activities we have the potential to contribute to or be linked to negative human-rights
impacts and issues, such as child labour and forced labour in relation to workers in the value chain, and land
and resource-related community impacts in relation to local communities. Negative land and resource-
ING Group Annual Report 2023 on Form 20-F 56
related community impacts may, for example, occur due to land acquisition and use of scarce or shared
resources by clients we finance.
To mitigate these potential human-rights impacts, we have an Environmental and Social Risk (ESR) Policy
Framework, which includes an overarching human-rights policy that applies to all sectors we finance. In
addition, we have human-rights elements in dedicated sector policies. We also mitigate potential negative
human rights impacts in line with the UN Guiding Principles on Business and Human Rights (UNGP), as well
as the OECD Guidelines for Multinational Enterprises on Responsible Business Conduct. We do this by
understanding regional and portfolio risks, engaging with clients, using financial leverage when needed, and
being cognisant of human-rights impacts when engaging with stakeholders.
We engage with different stakeholders (internally and externally) to identify common solutions to address
human-rights issues. We consulted with human-rights consultants and civil-society organisations in
drawing up our ESR policy review. We have been working on an integrated approach to stakeholder
engagement at ING and invited clients to discuss challenges and issues that have been brought to our
attention. We find it beneficial to have ongoing dialogue about our role in society, our products and services,
our business performance and other issues. We also engage with other key stakeholder groups, including
communities affected by projects in which we invest, government, regulators and national associations, as
well as pressure groups and NGOs.
The transition out of fossil fuels and into a green economy may impact people, for example, potentially
resulting in stranded assets and consequently affecting surrounding communities. It could also increase
energy poverty for vulnerable people reliant on fossil fuels. We recognise that as the world transitions from
a carbon-intensive economy into a green economy, we must collectively acknowledge the needs of people,
especially the most vulnerable.
Through platforms that set standards on this topic, ING aims to be transparent about our progress in the
hope that others will join us and strive to be a step ahead of broader expectations. Read more in
‘Environmental, social and governance risk’ in ‘Risk management’.
Governance
Good governance is an essential foundation for an effective ESG
strategy. We are guided by our Orange Code, which sets our values and
behaviours and ensures we work with integrity, transparency and high
standards of business ethics. Strong management in our corporate
leadership and board composition is also key to effective governance,
ensuring the overall success of our ESG approach.
Business ethics and integrity
Our culture, including our risk culture, informs the behaviours we share across the organisation, helping us
to make responsible decisions – for ourselves and for our customers – now and in the future. We aim to act
with integrity, whether in encouraging employees to speak up and report concerns, guarding against
corruption and financial crime, or managing our taxation responsibly and transparently.
Orange Code and global Code of Conduct
Our culture starts with the Orange Code, which is a declaration of who we are. It describes what we can
expect from each other when we turn up to work each day. It is a set of standards that we collectively value,
strive to live up to, and invite others to measure us by.
The Orange Code is the sum of two parts, the ING values and ING behaviours, with ‘Integrity above all’ being
the overarching principle. The ING values (being honest, prudent and responsible) are non-negotiable
promises we make to the world, principles we seek to stick to, no matter what. The ING behaviours (take it
on and make it happen, help others to be successful, and always be a step ahead) represent our way to
differentiate ourselves. The Orange Code is embedded in commitments we make to each other and the
standards by which we measure each other’s performance.
The ING Global Code of Conduct outlines the 10 core principles for conduct we expect from employees.
These principles build on the values and behaviours of our Orange Code and are based on ING policies,
minimum standards and guidelines we need to adhere to in our daily business. Having a global Code of
ING Group Annual Report 2023 on Form 20-F 57
Conduct creates consistency in the way we do things and contributes to keeping ING safe, secure and
compliant. Ultimately it helps to safeguard our customers, society and our role in the financial system.
Risk culture
At ING, we attach great importance to a sound risk culture, which is essential for performing our role in
society responsibly and in keeping the bank safe and secure. We determine our risk culture as the way in
which employees identify, understand, discuss and act on the many financial and non-financial risks we are
confronted with every day.
The Orange Code and the global Code of Conduct are the foundation of ING’s risk culture. The global Code of
Conduct defines the most essential conduct principles expected from ING employees in their daily activities,
to create additional risk awareness and better meet expectations stated in external rules and guidelines.
When ING employees onboard, they are required to take an e-learning and sign-off on their adherence to
the global Code of Conduct. Also, every year, all ING employees receive an updated (micro-)e-learning on
(parts of) the global Code of Conduct. As of 2021, the global Code of Conduct is also embedded into our
employees’ performance management cycle with the aim to ensure continuous attention to the global
Code of Conduct, and encourage the dialogue on how to apply it in our daily work practice.
The effectiveness of and compliance with the ING Global Code of Conduct is measured via annual employee
acknowledgements and whistleblower data. Reporters can raise (suspicions of) breaches of the ING Global
Code of Conduct to the ING whistleblower channels. All 10 principles and their underlying topics (such as
market abuse, conflict of interest, etc.) of the ING Global Code of Conduct are considered in scope of the
Whistleblower Policy.
Orange Code decision-making
Balancing the rights and interests of all our stakeholders is one of the key Orange Code principles. To further
enhance risk judgement, we continued to apply the Orange Code decision-making model to dilemmas. This
four-step model supports well-balanced decision-making.

Following the incorporation of the four-step model in the global product approval and review process (PARP)
policy, the Orange Code decision-making model was incorporated in Model Validation guidance. Risk culture
and behavioural risk is continuing to train experts in this area to support the organisation in properly
applying the model in practice.
Behavioural risk
Behavioural risk is an increasingly important risk area for ING and across the financial industry. It arises
when behavioural patterns are at the root of financial and non-financial risks in the organisation.
The complexity of this type of risk is that it is less tangible compared to other risk areas because it focuses
on behavioural patterns and their drivers. There are patterns in how decisions are made, how people
communicate, and whether they can take ownership. Behaviour is driven by formal and informal
mechanisms. Examples of formal drivers are the processes ING applies and how its governance is structured.
Informal drivers are less tangible, such as group dynamics or underlying beliefs that influence behaviour.
Behavioural risk assessments
Behavioural risk assessments identify and analyse undesired behaviours within ING and provide
management with specific direction on how to change these behaviours. They focus on the effectiveness of
groups rather than individuals, the role of leadership, and on less visible aspects such as team dynamics and
unwritten social norms. The goal is to understand and systematically assess what drives undesired habits at
ING. The behavioural risk management framework is used as a guide across ING to identify behavioural risks
in the organisation which require deeper investigation.
ING Group Annual Report 2023 on Form 20-F 58
Behavioural risk interventions
Based on the results of the executed behavioural risk assessments, interventions are taken to mitigate the
behavioural risks in a focused manner. Effective mitigation requires a deep understanding of what drives
undesired behaviours. Behavioural and organisational science theories and evidence-based techniques and
tools play an important role in designing and facilitating interventions.
In 2023, interventions were focused on KYC. New interventions have been designed and developed in close
cooperation with HR and Compliance to improve speak-up and escalation behaviour across the organisation.
Whistleblower
Everyone at ING is expected to always act with integrity and uphold the values and behaviours of our
Orange Code. We won’t ignore, tolerate, or excuse behaviour that breaches our values or people’s trust in
ING. There are many ways for employees to speak up if they have a concern. Reporting is always
confidential and, if preferred, also anonymous. It is our policy to follow up on reports, with an emphasis on
protecting whistleblowers’ identity.
We aim to protect those who report concerns, which is why we regularly look for ways to enhance and
standardise the whistleblower process. This includes safeguarding identities and trying to proactively
prevent retaliation. Across the organisation we’re aligning channels, like our ‘speak up’ channels for
undesirable behaviour, which we’ve brought together in our global Speak Up programme. Anyone who
reports a concern can now choose the appropriate channel, so the reporter journey becomes more
consistent with the same level of protection. Collecting insights across certain channels has allowed us to
better manage anonymous concerns and track whether those that were found to be substantiated were
followed up. We continue to share sanitised reports with the organisation to encourage employees to
speak up.
Financial economic crime
By fulfilling the role of gatekeeper to the financial system, ING plays a role in the collective fight against
financial crime while ensuring that ING remains safe, sound, and compliant – in accordance with applicable
regulations such as the Dutch Financial Supervision Act (Wft) and the Dutch Anti-Money Laundering and
Anti-Terrorist Financing Act (Wwft), and with expectations of society at large.
Bribery and corruption
Bribery and corruption undermine business confidence and corporate integrity, hinder fair business
competition, and harm international trade. ING takes these risks seriously. Bribery and corruption risks are
part of our non-financial risk framework, and are in the design of our client and third-party due diligence,
and monitoring measures in our financial crime risk-management framework. We have continued to
strengthen our ability to respond to bribery and corruption risks in key areas, as part of our multi-year
maturity programme. This supports our zero-tolerance approach to bribery and corruption, and meeting
governance elements of our sustainability objectives.
All ING employees and third parties acting for and on behalf of ING at every level of the organisation are
expected to always do business in accordance with the values and behaviours of ING’s Orange Code. ING has
a zero-tolerance approach to bribery and corruption in all of its relationships and business dealings. This
forms part of its commitment to conduct business in an honest, prudent, and responsible manner. ING does
not, and will not, accept and pay bribes or offer improper inducements or anything that could be perceived
as such. ING expects the same from its customers, business partners, and third parties that perform services
or deliver business on its behalf. In support of its anti-corruption and bribery policies and procedures, ING
has a sound governance structure in place.
Failure to detect signals of money laundering related to human trafficking and modern slavery may result in
the lives of customers and/or other people being substantially harmed. For instance, if a customer is a
human trafficker and their activities remain undetected, the safety, security, and dignity of their victims are
at risk. If a customer is a victim of human trafficking, failure to detect signals of money laundering related to
socioeconomic fraud and human trafficking may stand in the way of saving that customer from a harmful
practice. On an annual basis, ING conducts a Systemic Integrity Risk Analysis (SIRA) for all its entities. SIRA is
the baseline risk assessment for bribery and corruption. In 2023 the outcome of the assessment was that no
location was perceived as having residual risks of concern.
Know Your Customer
Know Your Customer and financial crime compliance continue to play a major role in making sure we only
engage and do business with people and entities that meet regulatory requirements. Knowing who we do
business with is vital to keeping ING safe, secure and compliant. As part of our ongoing anti-money
laundering efforts, we continuously assess relationships with customers, and monitor and screen
transactions. It is our policy to review potentially unusual transactions and suspicious transactions and,
where applicable, report these to the relevant authorities.
Given that we operate in many countries, and our position in the Dutch financial sector and broader society,
ING is considered an important stakeholder in the financial sector in realising this priority, together with
other gatekeepers in the financial system. These include the Dutch Banking Association, the Dutch Central
Bank and other public partners, such as the Tax and Customs Administration, Financial Intelligence Unit, the
Fiscal Intelligence and Investigation Service (FIOD) and the Public Prosecutor’s Office.
ING is focused on continuing to embed applicable requirements in our processes and procedures, including
in our IT systems and data sources, in a robust and sustainable way, and driving a business environment
ING Group Annual Report 2023 on Form 20-F 59
that is compliant by desire and design. The bank also executes ongoing training and awareness to develop
its people to have the right knowledge and skills.
Transparency
As we strive to be a banking leader in building a sustainable future, we communicate transparently on our
actions, we share our successes, but also our challenges. We’re clear and open, sharing our progress
towards our ESG targets. We also recognise how important it is to continuously interact with all
stakeholders, cultivating relationships that drive positive change.
Taxation
Our tax policies and performance are key elements under the governance pillar of our ESG framework. We
are mindful that every aspect of our business, including our approach to tax, has an impact on society. We
have therefore chosen to formalise our approach to clarify our views on responsible tax behaviour and tax
governance.
Our tax principles, which are applicable worldwide, mirror ING’s values of integrity, honesty, prudence and
responsibility. These values are the main drivers for our relationship with tax authorities and for the
adoption of tax transparency as standard practice.
Tax principles and governance
Wherever we operate, we seek to establish and maintain an open and constructive dialogue with local tax
authorities and other government bodies, based on the disclosure of all relevant facts and circumstances. In
this dialogue we seek to provide clarity and establish certainty on all relevant local tax components in
advance. We are transparent about our approach to tax and our tax position. In formulating this approach,
we have taken account of the interests of our stakeholders, including (tax) authorities, non-governmental
organisations, customers, shareholders and society in general.
Disclosures are made in accordance with relevant domestic regulations, as well as applicable reporting
requirements and standards such as the International Financial Reporting Standards. The ING annual report
contains a country-by-country overview of the result (before tax) and the total corporate income tax charge
paid and accrued per tax jurisdiction. ING also submits, annually, a similar type of overview to tax authorities
which enhances their insight into our tax position.
ING joined the Dutch Tax Governance Code developed by the Confederation of Netherlands Industry and
Employers (known as VNO-NCW). ING embraces the principles of the code and will work consciously to
comply with the targets set, as laid out in our Tax Governance Code booklet. This is available on ing.com in
the Compliance section under About Us. The financial information in the Tax Governance Code is recorded
under notes to the consolidated financial statements in this annual report (see Note 31, Information on
geographical areas and Note 34, Taxation).
Tax policies, procedures and a tax control framework have been implemented to support management in
mitigating potential tax risks in a prudent manner. Internal monitoring, control and reporting of tax-related
risks takes place on a continuous basis with annual reporting to the Management Board and Supervisory
Board and various other stakeholders. For SOx 404 purposes (section 404 of the Sarbanes-Oxley Act), an
‘effectiveness of internal control statement’ with respect to tax controls has been provided. Tax risk
management is subject to Corporate Audit testing and evaluation. As part of the tax risk assessment, if
applicable, the potential use of (tax) incentives and/or subsidies is considered acceptable to the extent
explicitly intended by the authorities.
In all countries in which ING is present, it is ING’s position to be cooperatively tax compliant. This implies
being transparent about, and disclosing, relevant tax risks towards tax authorities.
We also believe in the principle that tax should follow business, so profits are allocated to the countries
where business value is created. It is our policy to comply with domestic and international laws and
regulations, taking account of both the letter and the spirit of the law, as well as standards such as the OECD
guidelines for multinational enterprises, and we apply the arm’s length principle.
Tax position of clients
As a global bank, we play a crucial role in fighting financial crime and protecting the financial system from
harmful behaviour. This includes criminal activities such as tax evasion, but also aggressive tax avoidance,
which although not illegal can be damaging to the communities in which we operate. We aim not to
facilitate such activities.
Tax risks not only refer to ING’s own tax position, but also our role as gatekeeper for the financial system as
well as risks in relation to our customers. In this respect, we have integrated a tax-integrity assessment in
our overall customer risk assessment process.
It is our policy not to advise clients on taxation matters. Clients remain responsible for their own tax position.
ING Group Annual Report 2023 on Form 20-F 60
Regulation and Supervision
The banking and broker-dealer businesses of ING are subject to detailed and comprehensive supervision in
all of the jurisdictions in which ING conducts business.
Regulatory agencies and supervisors have broad administrative power and enforcement capabilities over
many aspects of our business, which may include liquidity, capital adequacy, permitted investments, ethical
issues, money laundering, anti-terrorism measures, privacy, recordkeeping, product and sale suitability,
marketing and sales practices, ESG, remuneration policies, personal conduct and our own internal
governance practices. Also, regulators and other supervisory authorities in the EU, the US and elsewhere
continue to scrutinise payment processing and other transactions and activities of the financial services
industry through laws and regulations governing such matters as money laundering, anti-terrorism
financing, tax evasion, prohibited transactions with countries or persons subject to sanctions, and bribery or
other anti-corruption measures.
As discussed under “Item 3. Key Information — Risk Factors”, as a large multinational financial institution we
are subject to reputational and other risks in connection with regulatory and compliance matters involving
these countries.
European Regulatory framework
The Single Supervisory Mechanism (“SSM”) is the first pillar of the Banking Union and has been operational
since 4 November 2014. The SSM is composed of the European Central Bank (“ECB”) and the national
competent authorities of the participating EU member states. The main aims of European banking
supervision are to ensure the safety and soundness of the European banking system, increase financial
integration and stability and ensure consistent supervision. Under the SSM, the ECB is ING Group’s and ING
Bank’s principal prudential supervisor. The ECB is amongst others responsible for tasks such as market
access, compliance with capital and liquidity requirements and governance arrangements. National
competent authorities, including the Dutch Central Bank (De Nederlandsche Bank or “DNB”) for ING Group
and ING Bank, remain responsible for supervision of tasks that have not been transferred to the ECB such as
financial crime and payment supervision.
The SSM is complemented by the second pillar of the Banking Union, the Single Resolution Mechanism
(“SRM”), which comprises the Single Resolution Board (“SRB”) and the national resolution authorities. The
SRM is fully responsible for the resolution of banks within the Eurozone since 1 January 2016. The rules
underpinning the SRM could have a significant impact on business models and capital structure of financial
groups in order to become resolvable.
As the third pillar of the Banking Union, the EU wants to further harmonise the regulation for Deposit
Guarantee Schemes (DGS). One of the key elements is the creation of ex-ante funded DGS funds, financed
by risk-weighted contributions from banks. Since 2015, the EU has been discussing a pan-European (or pan-
banking union) DGS (the European Deposit Insurance Scheme (EDIS)), which would (partly) replace or
complement national compensation schemes, but there is no EDIS yet as political negotiations have stalled.
On 18 April 2023, the European Commission published the proposals for the revision of the common
framework for bank crisis management and deposit insurance (CMDI) that focuses on small and medium-
size banks, but will affect all EU banks. The CMDI framework consists of the Bank Recovery and Resolution
Directive (BRRD), the Single Resolution Mechanism (SRMR) and the Deposit Guarantee Schemes Directive
(DGSD). Proposals on revision of the CMDI are now subject to political negotiations (with some exceptions
concerning e.g. changes to so called "daisy-chain" deductions framework that were already agreed politicly,
and might affect how ING's subsidiaries calculate their internal MREL ratios once proposals are published).
The revision of the CMDI framework is part of the debate on the completion of the Banking Union and in
particular its third and missing pillar EDIS.
Dutch Regulatory Framework
The Dutch regulatory system for financial supervision consists of prudential supervision – monitoring the
soundness of financial institutions and the financial sector, and conduct-of-business supervision – regulating
institutions’ conduct in the financial markets. As far as prudential supervision has not been transferred to
the ECB, it is exercised by the Dutch Central Bank (De Nederlandsche Bank or “DNB”), while conduct-of-
business supervision is performed by the Dutch Authority for the Financial Markets (Autoriteit Financiële
Markten or “AFM”).
Global Regulatory Environment
There is a variety of proposals for laws and regulations that could impact ING globally, in particular those
made by the Financial Stability Board and the Basel Committee on Banking Supervision at the transnational
level and an expanding series of supranational directives and national legislation in the European Union (see
“Item 3. Key Information — Risk Factors — We operate in highly regulated industries. Changes in laws and/
or regulations governing financial services or financial institutions or the application of such laws and/or
regulations governing our business may reduce our profitability). The aggregated impact and possible
interaction of all of these proposals are hard to determine, and it may be difficult to reconcile them where
they are not aligned. The financial industry has also taken initiatives by means of guidelines and self-
regulatory initiatives.
Dodd-Frank Act and other US Regulations
ING Bank has a limited direct presence in the United States through the ING Bank Representative Offices in
New York, Dallas (Texas), Houston (Texas), and Los Angeles (California). Although the offices’ activities are
strictly limited to essentially that of a marketing agent of bank products and services and a facilitator (i.e.
the offices may not take deposits or execute any transactions), the offices are subject to the regulation of
the State of New York Department of Financial Services, the State of Texas Department of Banking, the
California Department of Financial Protection and Innovation, as well as the Federal Reserve. ING Bank also
ING Group Annual Report 2023 on Form 20-F 61
has a subsidiary in the United States, ING Financial Holdings Corporation, which through several operating
subsidiaries offers various financial products, including lending, and financial markets products. These
entities do not accept deposits in the United States on their own behalf or on behalf of ING Bank N.V.
The ING subsidiary, ING Capital Markets LLC, is registered as a swap dealer and subject to a statutory
regulatory regime and CFTC rules and oversight. As a registered entity, it is subject to, among others,
business conduct, record-keeping and reporting requirements, as well as margin requirements and capital
requirements. In that regard, because ING Capital Markets LLC is not subject to regulation by a prudential
regulator, it is required to comply with the CFTC’s capital requirements. In addition to the obligations
imposed on registrants (such as swap dealers), other requirements relating to reporting, clearing, and on-
facility trading have been imposed for much of the off-exchange derivatives market and new risk
management requirements have been proposed focused on business continuity, cybersecurity, and
operation resilience generally. It is possible that some of these compliance requirements, especially the
capital requirements, will increase the costs of and restrict participation in the derivative markets. This could
have the effect of restricting trading activity, reducing trading opportunities and market liquidity, potentially
increasing the cost of hedging transactions and the volatility of the relevant markets. This could adversely
affect the business of ING in these markets. The proposed new risk management requirements could impose
significant compliance costs to the extent inconsistent with the existing group-wide framework.
ING Capital Markets LLC is also registered as a security-based swap dealer and is subject to a statutory
regulatory regime and SEC rules and oversight. The SEC has adopted regulations, among others, establishing
registration, reporting, risk management, business conduct, and margin and capital requirements for
security-based swaps. While ING Capital Markets LLC, as a security-based swap dealer, is required to comply
with SEC rules with respect to most of these requirements, SEC rules have permitted an “Alternative
Compliance Mechanism” that allows for compliance, subject to eligibility requirements, with CFTC capital
and margin rules applying to swap dealers in lieu of SEC capital and margin rules applying to security-based
swap dealers. ING Capital Markets LLC has elected to use the Alternative Compliance Mechanism. However,
should ING Capital Markets LLC in the future be ineligible for the “Alternative Compliance Mechanism”, it
would be subject to SEC security-based swap dealer rules for margin, capital, and related financial reporting
instead of the CFTC swap dealer rules applied to security-based swaps with respect to margin, capital, and
related financial reporting.
On 15 December 2021, the SEC proposed new rules that would for the first time impose public reporting
requirements for some significant security-based swaps positions. The rules would apply even to trades
between non-U.S. counterparties, including ING Bank, provided that the issuer of the reference securities
underlying the security-based swaps is organized in the U.S., the issuer of the reference securities
underlying the security-based swaps has its principal place of business in the U.S., or the securities are in
certain categories registered with the SEC. These proposed regulations, if adopted in their current form,
could constrain trading activity in security-based swaps. In addition, there are, or may be in the future,
regulatory requirements or limitations related to other categories of equity derivatives, such as options or
forwards, that could similarly constrain trading activity in such instruments as well. These various
requirements and limitations with respect to equity derivatives generally could have a significant impact on
the liquidity and utility of these markets, materially impacting ING’s business in this market.
In addition, position limits requirements have been imposed by the CFTC for uncleared swaps referencing
any of twenty-five commodity futures contracts on physical commodities. In addition, on 1 January 2023,
these position limits were extended to certain positions in swaps that are “economically equivalent” to the
enumerated futures contracts. The position limits on futures and related swaps could limit ING’s position
sizes in these swaps referencing specified physical commodities and similarly limit the ability of
counterparties to utilize certain of our products to the extent hedging exemptions from the position limits
are unavailable.
The Dodd-Frank Act also created a new agency, the Financial Stability Oversight Council (FSOC), an
interagency body that is responsible for monitoring the activities of the U.S. financial system, designating
systemically significant financial services firms and recommending a framework for substantially increased
regulation of such firms, including systemically important non-bank financial companies that could consist
of securities firms, insurance companies and other providers of financial services, including non-U.S.
companies. ING has not been designated a systemically significant non-bank financial company by FSOC
and FSOC initiating such a designation currently is deemed unlikely.
Dodd-Frank continues to impose significant requirements on us, some of which may have a material impact
on our operations and results, as discussed further under “Item 3. Key Information — Risk Factors—We
operate in highly regulated industries. Changes in laws and/or regulations governing financial services or
financial institutions or the application of such laws and/or regulations governing our business may reduce
our profitability”.
Basel III and European Union Standards as currently applied by ING Bank
In all jurisdictions where the bank operates through a separate legal entity that is a credit institution, ING
must meet the local implementation of Basel requirements as well. ING uses the Advanced IRB Approach for
credit risk, the Internal Model Approach for its trading book exposures and the Advanced Measurement
Approach for operational risk. A small number of portfolios including certain sovereign exposures are
reported under the Standardized Approach for credit risk.
In December 2010, the Basel Committee on Banking Supervision announced higher global minimum capital
standards for banks, and introduced a new global liquidity standard and a new leverage ratio (LR). The Basel
Committee's package of reforms, collectively referred to as the “Basel III” rules, among other requirements,
increased the amount of common equity required to be held by subject banking institutions, prescribed the
amount of liquid assets and the long term funding a subject banking institution must hold at any given
moment, and limited leverage. Banks are required to hold a “capital conservation buffer” to withstand future
periods of stress. Basel III also introduced a “countercyclical buffer” as an extension of the capital
conservation buffer, which permits national regulators to require banks to hold more capital during periods
ING Group Annual Report 2023 on Form 20-F 62
of high credit growth (to strengthen capital reserves and moderate the debt markets). Further, Basel III
strengthened the definition of capital that had the effect of disqualifying many hybrid securities. during the
years 2013-2022, as well as increased capital requirements associated with certain business conditions (for
example, for credit value adjustments (CVAs) and illiquid collateral) as part of a number of reforms to the
Basel II framework. In addition, the Basel Committee and Financial Stability Board (“FSB”) published
measures that have had the effect of requiring higher loss absorbency capacity, liquidity surcharges,
exposure limits and special resolution regimes for, and instituting more intensive and effective supervision
of, “systemically important financial institutions” (SIFIs), in addition to the Basel III requirements otherwise
applicable to most financial institutions. One such measure, published by the FSB in November 2015, is the
Final Total-Loss Absorbing Capacity (TLAC) standard for G-SIFIs, which aims for G-SIFIs to have sufficient loss-
absorbing and recapitalisation capacity available in resolution. ING has been designated by the Basel
Committee and FSB as a so-called “Global Systemically Important Bank” (G-SIB), since 2011, and by DNB and
the Dutch Ministry of Finance as a “other SII” (O-SII) since 2011. Since December 2020 DNB has required ING
Group to hold a 2.5% O-SII Buffer in addition to the capital conservation buffer and the countercyclical buffer
described above. In May 2023 DNB announced that O-SII Buffer for ING will be lowered to 2.0% from 31 May
2024.
CRR /CRD IV
For European banks the Basel III requirements have been implemented through the Capital Requirement
Regulation (CRR) and the Capital Requirement Directive (CRD IV). The CRD IV regime entered into effect in
August 2014 in the Netherlands, but not all requirements were implemented all at once. Having started in
2014, the requirements have been gradually tightened, mostly before 2019, until the Basel III migration
process was completed.
CRD IV has not only resulted in new quantitative requirements but has also led to the setting of new
standards and evolving regulatory and supervisory expectations in the area of governance, including with
regard to topics like conduct and culture, strategy and business models, outsourcing and reporting
accuracy.
CRRII / CRD V and BRRDII
On 27 June 2019, a series of measures referred to as the Banking Reform Package (including certain
amendments to CRR and CRDIV commonly referred to as ‘CRR II’ and CRD V’) came into force, subject to
various transitional and staged timetables. The adoption of the Banking Reform Package concluded a
process that began in November 2016 and marks an important step toward the completion of the European
post-crisis regulatory reforms, drawing on a number of international standards agreed by the Basel
Committee, the Financial Stability Board and the G20. CRDV was implemented in Dutch law in 2020. The
Banking Reform Package updates the framework of harmonized rules established following the financial
crisis of 2008 and introduces changes to the CRR, CRDIV, the Bank Recovery and Resolution Directive (BRRD)
and the Single Resolution Mechanism Regulation (SRMR). The Banking Reform Package covers multiple
areas, including the Pillar 2 framework, the introduction of a leverage ratio requirement of 3% and a
leverage ratio buffer requirement of 50% of the G-SIB buffer requirement (applicable per 1 January 2023), a
binding Net Stable Funding (NSFR) ratio based on the Basel NSFR standard but including adjustments with
regard to e.g. pass-through models and covered bonds issuance, mandatory restrictions on distributions,
permission for reducing own funds and eligible liabilities, macroprudential tools, a new category of ‘non-
preferred’ senior debt, the minimum requirement for own funds and eligible liabilities (MREL) and the
integration of the TLAC standard into EU legislation. Further, the EBA obtained a mandate to investigate
how to incorporate environmental, social, and governance (ESG) risks into the supervisory process and what
the prudential treatment of assets associated with environmental or social objectives should look like.
Whilst the Banking Reform Package was being developed, the ECB introduced the Targeted Review of
Internal Models (TRIM) in June 2017 to assess reliability and comparability between banks’ models for
calculating each bank’s risk-weighted assets (‘RWA’) used for determining certain of such bank’s capital
requirements. In July 2019, the ECB published the final chapters of the guide to internal models, covering
credit risk, market risk and counterparty credit risk. These risk type-specific chapters are intended to ensure
a common and consistent approach to the most relevant aspects of the regulations on internal models for
banks directly supervised by the ECB. Additionally, they provide transparency on how the ECB understands
the regulations on the use of internal models to calculate own funds requirements for the three risk types.
Impact on ING is through more stringent regulation on the end-to-end process and governance around
internal models as well as an increase of risk weighted assets (RWA).
In 2020, the last TRIM ECB inspection ended. Most of the remedial actions triggered by the TRIM assessments
resulted in the redevelopment of the credit risk models and were addressed. The resolution of remaining
remedial actions is ongoing and is linked mainly to the implementation timelines of the CRRIII/CRD VI.
CRR “quick fix” in response to the Covid‐19 pandemic
On 26 June 2020 Regulation (EU) 2020/873 of the European Parliament and of the Council of 24 June 2020
amending Regulations CRR as regards certain adjustments in response to the COVID-19 pandemic
(commonly referred to as CRR ”quick fix”) was published.
The CRR ‘quick fix’ introduced certain adjustments to the CRR, including temporary measures and measures
that early adopt changes in the regulations that were intended to become effective at a future date. This
notably included reduced capital requirement for certain exposures to small- and medium sized enterprises
(SMEs), a more favourable prudential treatment for certain software assets, one year delay in the
application of the leverage ratio buffer requirement of 50% of the G-SIB buffer (to 1 January 2023). Also, the
‘quick fix’ extended by 2 years transitional arrangements for mitigating the impact on own funds of the
introduction of IFRS 9 (Article 473a (8) of CRR).
ING Group Annual Report 2023 on Form 20-F 63
Final Basel III reforms
In December 2017 the Basel Committee finalised its Basel III post-crisis reforms with the publication of the
revisions to the prudential standards for credit, operational and credit valuation adjustment (CVA) risk as
well as the introduction of an output floor. This package of reforms aims to increase consistency in risk-
weighted asset calculations and improve the comparability of banks’ capital ratios. The use of internal
models will be reduced and the standardised approaches will be made more risk-sensitive and granular.
Following a one-year deferral due to COVID-19, these reforms will take effect from 1 January 2023 and will
be phased in over five years. The implementation of the EU/Basel III reforms will have impact on ING’s risk-
weighted assets and capital ratios, but it is expected that other new banking regulations and model reviews
bring forward a significant part of this impact before the EU implementation date.
CRRIII / CRD VI
On 27 October 2021, the European Commission published a legislative proposal to review the EU’s CRD/CRR
framework. The review consists of the following legislative elements: a proposal to amend CRD V, a proposal
to amend CRR II, and a separate, targeted proposal to amend CRR II in the area of resolution (the so-called
‘daisy chain’-proposal).
This proposed legislative review’s key aim is to implement the final Basel III framework – agreed at the end
of 2017 - in the EU. It is meant to ensure banks remain resilient and capable of withstanding future crises
The proposed revisions mainly relate to the prudential standards for credit, market, operational and credit
valuation adjustment (CVA) risk as well as the introduction of an output floor. Key changes comprise the
reduced use of internal models and more risk-sensitive and granular standardised approaches. It aims to
increase consistency in risk-weighted asset calculations and improve comparability of bank capital ratios.
The Commission’s proposal remains close to the 2017 Basel agreement, but in some areas (often
temporarily) includes targeted measures to account for specificities of the EU banking sector. These
measures relate to topics such as the calculation of the output floor, lending to unrated corporates,
specialized lending, property lending and counterparty credit risk. The European Commission expects that
overall risk-weighted assets will not increase significantly, on average, less than 10% for EU banks at the end
of the transition period.
The proposed implementation date is set at 1 January 2025 for most provisions under review, with a phase-
in period for the output floor of five years. This is two years later than the BCBS’s deadline. The European
Commission also proposes a number of other targeted transitional requirements, phasing out by 2032 at
the latest.
In December 2023 the EU co-legislators reached a political agreement on the review, but the final legislative
texts are yet to be published.
Capital requirements applicable to ING Group at a consolidated level
In accordance with the CRR the minimum Pillar I capital requirements applicable to ING Group are: a
Common Equity Tier 1 (CET1) ratio of 4.5%, a Tier 1 ratio of 6% and a Total capital ratio of 8% of risk-
weighted assets.
In 2020, as a reaction to the COVID-19 pandemic, relevant regulators introduced a number of changes to
the Pillar II capital requirements and the capital buffer requirements applicable to ING, including structural
reductions. The structural reductions of these capital requirements reflect the application of Art.104a in CRD
V, which allowed ING to replace CET1 capital with additional Tier 1 / Tier 2 securities to meet Pillar II
requirement, and a reduction in the overall systemic buffer (i.e. the Systemic Risk Buffer plus the highest of
the O-SII and G-SII buffer) by the Dutch National Bank from 3% to 2.5%. Similarly, various competent
authorities changed or removed their Countercyclical Buffer (CCyB) requirements as a response to COVID-19
pandemic.
Recently, however, various authorities began to increase the CCyB again, including De Nederlandsche Bank
(DNB; for exposures in the Netherlands), Bundesanstalt für Finanzdienstleistungsaufsicht (BaFin; for
exposures in Germany) and National Bank of Belgium (NBB; for exposures in Belgium). DNB increased the
CCyB to 1% from May 2023 and to 2% from May 2024 (in line with the revised countercyclical capital buffer
framework DNB intends to apply a 2% CcyB in a standard risk environment). BaFin decided to set the CcyB
at 0.75% from February 2023. NBB increased the CCyB to 0.5% from October 2023 and to 1% from April
2024. Other authorities announced increases, too.
The CET1 requirement, including buffers, for ING Group at a consolidated level was 10.98% as end of 2023.
This requirement is the sum of a 4.5% Pillar I requirement, a 0.98% Pillar II requirement, a 2.5% Capital
Conservation Buffer (CCB), a 0.50% Countercyclical Buffer (CCyB) (based on 31 December 2023 positions)
and a 2.5% O-SII buffer that is set separately for Dutch systemic banks by the Dutch Central Bank (De
Nederlandsche Bank). This requirement excludes the Pillar II guidance, which is not disclosed. The fully
loaded CET1 requirement (that reflects measures already known on 31 December 2023 but not yet
applicable) would amount to 10.76% (4.5% Pillar I requirement, a 0.93% Pillar II requirement, a 2.5% CCB, a
0.84% CCyB and a 2.0% O-SII buffer).
The Maximum Distributable Amount (MDA) trigger level stood at 10.98% as end of 2023 for CET1, 12.81% for
Tier 1 Capital and 15.25% for Total Capital (after the application of Art.104a of CRDV). ING Group met these
requirements. In the event that ING Group breaches the MDA level, ING will face restrictions on dividend
payments, AT1 instruments coupons and payment of variable remuneration.
Bank recovery and resolution directive
Since its adoption by the European Parliament in 2014, the Bank recovery and resolution directive (BRRD)
has become effective in all EU countries after transposition into national law, including in the Netherlands.
ING Group Annual Report 2023 on Form 20-F 64
The BRRD aims to safeguard financial stability and minimise the use of public funds in case banks face
financial distress or fail to comply with the BRRD. Banks across the EU need to have recovery plans in place
and need to cooperate with resolution authorities to determine, and make feasible, the preferred resolution
strategy. The banking reform which came into force on 27 June 2019 includes changes to the minimum
requirement for own funds and eligible liabilities (MREL) to ensure an effective bail in process. It also includes
new competences for resolution authorities and requires G-SIBs and other banks to build up loss-absorbing
and recapitalization capacity.
In April 2023 the European Commission published a legislative proposal to review the EU’s existing bank
crisis management and deposit insurance (CMDI) framework, with a focus on medium-sized and smaller
banks. Key elements of the proposal include among others: 1) a further harmonization of national
insolvency hierarchies - all deposits would rank above ordinary unsecured claims in insolvency and the
relative ranking between the different categories of deposits would be replaced by a single tier depositor
preference (this may result in a detriment to ordinary unsecured liabilities in case they would no longer rank
pari-passu with some of the deposits), 2) a broader use of deposit guarantee schemes to support resolution
of banks, and 3) an expansion of the scope of resolution tools for smaller and mid-size banks. The EU co-
legislators continue to negotiate the proposals. Based on the draft proposal, majority of the changes would
apply from 18 months from the date of entry into force.
ING has had a recovery plan in place since 2012. The plan includes information on crisis governance,
recovery indicators, recovery options, and operational stability and communication measures. The plan
enhances the bank’s readiness and decisiveness in case of a financial crisis. The plan is updated annually to
make sure it stays fit for purpose. The completeness, quality and credibility of the updated plan is assessed
each year by ING’s regulators.
The Single Resolution Board (SRB) confirmed to ING in 2017 that a single-point-of-entry (SPE) strategy is
ING’s preferred resolution strategy, with ING Groep N.V. as the resolution entity.
In 2023, ING Group received an updated formal notification from De Nederlandsche Bank (DNB) of its MREL
requirements. The MREL requirement has been established to ensure that banks in the European Union have
sufficient own funds and eligible liabilities to absorb losses and to recapitalize bank in the case of a
resolution. The MREL requirement is set for ING Group at a consolidated level, as determined each year by
the Single Resolution Board (SRB). The following MREL requirements for ING Group were applicable on 31
December 2023: 22.29% of RWA, and 5.97% of LR exposure (intermediate MREL targets set by SRB). From 1
January 2024, ING Group will be subject to the following MREL requirements: 23.51% of RWA, and 7.27% of
LR exposure.
CRR II implements the Financial Stability Board’s total loss absorbing (TLAC) requirement for Global
Systemically Important Institutions (G-SII), which is the EU equivalent of a G-SIB. The transitional
requirement—the higher of 16% of the resolution group’s RWA or 6% of the leverage ratio exposure
measure—applied immediately. The higher requirement—18% and 6.75%, respectively—came into effect
as of 1 January 2022. As a G-SII ING is required to meet the TLAC requirement alongside the other minimum
regulatory requirements set out in EU regulation.
On top of MREL and TLAC RWA requirements, ING Group is required to meet the Combined Buffer
Requirement (CBR) of 5.50% of CET1 (as of 31 December 2023). Fully loaded CBR (that reflects measures
already known on 31 December 2023 but not yet applicable) would amount to 5.34%. ING Group met these
requirements. If ING Group breaches the CBR on top of MREL/TLAC (M-MDA), ING may face restrictions on
dividend payments, AT1 instruments coupons and payment of variable remuneration.
Apart from the requirements for the Group on a consolidated level, the internal MREL requirements are also
set for individual ING subsidiaries in EU.
Stress testing
Stress testing is an important risk management tool that provides input for strategic decisions and capital
planning. The purpose of stress testing is to assess the impact of plausible but severe stress scenarios on
ING’s capital and liquidity position. Stress tests provide complementary and forward-looking insights into the
vulnerabilities of certain portfolios, with regards to adverse macroeconomic circumstances, stressed
financial markets, and changes in the (geo)political climate. In addition to assessing P&L, capital and
liquidity positions of ING for a range of different scenarios, idiosyncratic risks are also included. The outcome
of these stress tests help management get insight into the potential impact and define actions to mitigate
this potential impact.
In addition to running internal stress test scenarios to reflect the outcomes of the annual risk assessment,
ING also participates in regulatory stress test exercises. ING participated in the 2023 EU-wide stress test. The
exercise has been coordinated by the European Banking Authority (EBA) and carried out in cooperation with
the European Central Bank (ECB), the European Systemic Risk Board (ESRB), the European Commission (EC)
and the Competent Authorities (CAs) from all relevant national jurisdictions. The baseline macro-financial
scenario is based on the projections from the EU national central banks, IMF and OECD. The adverse stress
test scenario was developed by the ESRB. Both the scenario covers the three years from 2023 to 2025 in line
with the EBA methodology.
The 2023 EU-wide stress test exercise was carried out applying a static balance sheet assumption as of
December 2022, and therefore does not take into account current or future business strategies and
mitigating actions. The results of the EBA stress test shows that even under the severe but hypothetical
scenario ING’s is able to withstand these circumstances even when no mitigating actions have been taken
into account. Under the hypothetical baseline scenario and EBA’s methodological instructions, ING Group
would have a fully loaded common equity Tier 1 capital ratio (CET1) of 14.37% in 2025. Under the
hypothetical adverse scenario and EBA’s methodological instructions, ING Group would have a fully loaded
CET1 ratio of 8.92% in 2025. Our commitment to maintain a robust, fully-loaded Group common equity Tier
ING Group Annual Report 2023 on Form 20-F 65
1 (CET1) ratio in excess of prevailing requirements remains. ING Group published an actual CET1 ratio of
14.47% per 31 December 2022 (a reference date for the stress test), and 14.68 % per 31 December 2023.
The next EBA EU-wide stress test will be held in 2025.
Deposit Schemes
In the Netherlands and other jurisdictions, deposit guarantee schemes and similar funds (‘Compensation
Schemes’) have been implemented from which compensation may become payable to customers of
financial services firms in the event the financial service firm is unable to pay, or unlikely to pay, claims
against it. In many jurisdictions in which we operate, these Compensation Schemes are funded, directly or
indirectly, by financial services firms which operate and/or are licensed in the relevant jurisdiction. ING Bank
is a participant in the Dutch Deposit Guarantee Scheme (‘DGS’), which guarantees an amount of EUR
100,000 per person per bank (regardless of the number of accounts held). Based on the EU Directive on
deposit guarantee schemes, ING pays quarterly risk-weighted contributions into a DGS-fund. The DGS-fund
is to grow to a target size of 0.8% of all deposits guaranteed under the DGS, which is expected to be reached
in July 2024. In case of failure of a Dutch bank, depositor compensation is paid from the DGS-fund. If the
available financial means of the fund are insufficient, Dutch banks, including ING, may be required to pay
extraordinary ex-post contributions not exceeding 0.5% of their covered deposits per calendar year. In
exceptional circumstances and with the consent of the competent authority, higher contributions may be
required. However, extraordinary ex-post contributions may be temporarily deferred if, and for so long as,
they would jeopardise the solvency or liquidity of a bank.
Since 2015, the EU has been discussing the introduction of a pan-European deposit guarantee scheme
(‘EDIS’), but so far no political agreement has been reached on the creation of EDIS. To strengthen the
Banking Union, the common framework for bank crisis management and deposit insurance (CMDI) might be
reformed by making changes to three existing key pieces of EU legislation: the Bank Recovery and
Resolution Directive (BRRD), the Single Resolution Mechanism Regulation (SRMR), and the Deposit Guarantee
Schemes Directive (DGSD). The European Commission published the proposals on 18 April 2023.
Instant Payments and the Payment Services Regulation/PSD3
In November 2023 the Council and the European Parliament reached political agreement on the proposal for
an instant payments regulation. The proposal aims to ensure that instant payments in euro are affordable,
secure and without hindrance across the European Union. Instant Payments are to be credited to the
account of the beneficiary within 10 seconds after receipt of the payment order by the payer’s payment
service provider and shall be available 24 hours a day all year round. The regulation introduces a service to
be provided by payment service providers to payers to verify the match between the bank account number
and the name of the beneficiary provided by the payer to prevent mistakes or fraud.
In June 2023 the European Commission launched its proposal for the Payment Services Regulation (PSR) and
Payment Services Directive 3, which together will succeed the current directive for payment services (PSD2).
The main changes relate to fraud, further development of open banking, the granting of access to payment
systems to non-bank payment service providers, further improving consumer rights and obligations and
national competent authorities to closely monitor compliance and take enforcement action where relevant.
The combat of fraud stands out and addresses new fraud types, such as impersonation fraud. To that end
PSR introduces: an obligation for electronic communications services providers to contribute to the collective
fight against fraud, the IBAN/name check, a legal basis for payment service providers to share fraud related
data, intensified transaction monitoring and an obligation for payment service providers to increase fraud
awareness through education. All actors in the ecosystem must contribute to the combat of fraud. PSR
grants certain refund rights to consumers that suffered damages from the failure of the IBAN/name
verification or that are a victim of bank employee impersonation fraud. Agreement on final texts is not
expected for the upcoming European elections.
The single currency package: the digital euro and access to cash
In October 2023 the ECB’s governing council announced to start the preparation phase for the digital euro.
In June 2023 the European Commission launched its legislative proposal establishing the legal framework
for such euro. It will ensure that people and business when paying with central bank money also have the
possibility to pay digitally, both online and offline, in addition to coins and banknotes. The legislative
proposal on the legal tender of euro cash safeguards the role of cash, it shall continue to be a means of
payment and should continue to be easily accessible.
Benchmarks Regulation
In 2016, the EU adopted a Regulation (the ‘Benchmarks Regulation’ or ‘BMR’) on indices used in the EU as
benchmarks in financial contracts and financial instruments. The Benchmarks Regulation became effective
on 1 January 2018.
The BMR among others requires that supervised entities may only use benchmarks in the EU if these
benchmarks are provided by administrators that are registered with the European Securities and Markets
Authority (‘ESMA’).
Benchmarks that are based on input from contributors shall have a code of conduct in place designed
primarily to ensure reliability of input data, governing issues such as conflicts of interest, internal controls
and benchmark methodologies. Financial contracts and financial instruments in which benchmarks are used
by supervised entities require to have robust fall back wording included in their documentation.
Benchmarks, such as the London Interbank Offered Rate (LIBOR), the Euro Overnight Index Average (EONIA),
the Warsaw Interbank Offered Rate (WIBOR), the Canadian Dollar Offered Rate (CDOR) and Mexico’s
Interbank Equilibrium Interest Rate (TIIE), have been either discontinued or are the subject of ongoing
national and international regulatory reform. ING has established a global benchmarks transition office
ING Group Annual Report 2023 on Form 20-F 66
which is coordinating benchmark transitions with a global impact, to safeguard a controlled execution of all
elements in a transition. For qualitative and quantitative disclosures on IBOR transition refer to “Additional
information – ING Group Risk Management – Market Risk”.
KYC Requirements
Financial institutions continue to face new and increasingly complex regulatory requirements, contributing
to increasing costs of compliance, in the context of heightened regulatory scrutiny. Generally, we expect the
scope and extent of regulations in the jurisdictions in which we operate to continue to increase.
The evolving regulatory landscape drives the need for continuous change in the various processes,
procedures and systems of the bank. Where the timeline for implementation of new or revised
requirements is sometimes quite short, this presents challenges to financial institutions in general. In
addition, in some instances, the complexity of the regulatory landscape gives rise to potential tension
between applicable laws and regulations at a local and/or global level. For example, there seems to continue
to be no full uniformity within the European Union (EU) about the proper application, interpretation and/or
execution of restrictive measures under EU sanctions against Russia (imposed as per February 2022, and
updated from time to time since then, as further described in the below paragraph on ‘Sanctions related
developments’). Another example is the potential tension between data privacy (GDPR) and AML/CFT and
anti-corruption laws and regulations; including the requirement to share information relating to financial
crime concerns to manage risk exposure across the group, while complying with the legislative
requirements relating to data, which can differ significantly depending on jurisdiction.
ING is focussed on continuing to embed applicable requirements in our processes and procedures, including
in our IT systems and data sources, in a robust and sustainable way; driving a business environment which
is compliant by desire and design. The bank also executes ongoing training and awareness to develop its
people to have the right knowledge and skills.
In addition, ING aims to continuously monitor regulatory developments, as well as considering emerging
and evolving risks. This supports assessment of the risks that ING may be exposed to and of the associated
controls and processes ING has in place, so we can appropriately manage these risks in accordance with our
risk appetite. For example, the volatile price and increased use of virtual assets, accompanied by the
continuing growth of virtual assets service providers is a theme in that continued to attract regulatory
attention for potential money laundering, tax and sanctions evasion and terrorist financing.
AML/CTF-related developments
In July 2021, the Commission of the European Union (EU) presented a new package of legislative proposals
to strengthen the EU’s rules on anti-money laundering and countering the financing of terrorism (AML/CFT).
This package consists of the following four items:
•a draft regulation, aimed to establish a new EU AML authority, which shall have direct administrative and
enforceability powers to impose sanctions and penalties against obliged entities established in EU
Member States (the AMLA). Given the cross-border nature of financial crime, the AMLA is aimed to boost
the efficiency of the EU AML/CFT framework, by creating an integrated mechanism with national
supervisors to ensure obliged entities comply with AML/CFT-related obligations in the financial sector.
AMLA will also have a supporting role with respect to non-financial sectors, and coordinate financial
intelligence units in EU member states. In addition to supervisory powers and in order to ensure
compliance, in cases of serious, systematic or repeated breaches of directly applicable requirements, the
AMLA shall impose pecuniary sanctions on the selected obliged entities.
•a draft regulation, recasting the current regulation on transfers of funds which aims to make transfers of
crypto-assets more transparent and fully traceable by, inter alia, introducing the so-called ‘travel rule’
which aims to provide the EU with a solid and proportional framework that complies with the most
demanding international standards on data sharing (data shall travel along with the funds and thus
‘follow the money’) and the exchange of crypto-assets, in particular recommendations 15 and 16 of the
Financial Action Task Force (FATF),
•a draft regulation on AML requirements for the private sector, having direct effect in the local
jurisdictions of EU Member States, catering for the prevention of the use of the financial system for the
purposes of ML/TF (the AMLR), and
•a draft directive (AMLD6) on AML/CTF mechanisms, to be implemented into national laws and thereby
put in place by the EU Member States for the prevention of the use of the financial system for the
purposes of ML/TF, and repealing the fourth EU AML Directive, Directive (EU) 2015/840 (AMLD4), as
amended by the fifth EU AML Directive, Directive (EU) 2018/843 (AMLD5).
In June 2022, the EU Council and Parliament reached a provisional agreement on the regulation on transfers
of funds. More recently, in December 2023, the EU Council and the Parliament also reached a provisional
agreement on the creation of the AMLA.
More (AMLA-, ALMR-, AMLD6- and other AML/CTF-related) developments are expected in the upcoming
years, starting with 2024.
Policy with respect to certain countries
As a result of frequent evaluation of all businesses from economic, strategic and risk perspective ING
continues to believe that for business reasons doing business involving certain specified countries should be
discontinued. In that respect, ING has a policy not to enter into new relationships with clients from these
countries and processes remain in place to discontinue existing relationships involving these countries. At
present these countries are Cuba, Iran, North Korea, Sudan and Syria, as well as the Crimea region.
ING Group Annual Report 2023 on Form 20-F 67
ING Group maintains a limited legacy portfolio of guarantees, accounts, and loans that involve various
entities with a connection to Iran. These positions remain on the books but certain accounts related thereto
are ‘frozen’ where prescribed by applicable laws and procedures and in all cases subject to increased
scrutiny within ING Group. ING Group may receive loan repayments, duly authorised by the relevant
competent authorities where prescribed by applicable laws. For the calendar year 2023, ING Group had
limited revenues (comparable to the revenues in 2022, amounting to approximately USD 40,000). No net
profit is made as there were no repayments made in 2023.
Sanctions related developments
Russia’s invasion of Ukraine has fundamentally changed the global political landscape, resulting in a world-
wide response, whereby new and significant sanctions packages were imposed against Russia and Belarus
since the end of February 2022 and continuing later such year and throughout 2023. These new sanctions
add to existing sanctions imposed on Russia since the 2014 annexation of Crimea.
A significant amount of new sanctions has therefore been implemented since. During 2023, there have been
several noteworthy developments highlighting the increasing focus of the EU, US, and other governments
on the potential circumvention of sanctions against Russia, and the roles of third countries and companies
in facilitating the circumvention or undermining of such sanctions’ measures. This has prompted a
concerted effort by said governments to impose pressure on companies operating in these jurisdictions, and
to stop the sanctions measures from being sidestepped by targeted Russian parties. The EU introduced
additional measures combating sanctions circumvention and several locations have come into focus as
potential diversion hubs. ING continues to actively combat sanctions circumvention and takes great efforts
to make its employees and customers aware of the sanctions circumvention risks of the named countries.
The increase in sanctions as a result of Russia’s invasion has contributed to the increased efforts to cater for
ING’s control framework to remain robust to effectively mitigate against the bank’s sanctions risks, and
apply greater scrutiny of transactions alerted for heightened risk of non-compliance with applicable
sanctions. With the Russian invasion of Ukraine, the global sanctions regimes have been in overdrive,
creating a very complex environment, besides other geopolitical developments. Intensive focus on sanctions
(worldwide) is expected to be continued for the coming years.
This expectation is based on the built experience that the international community is collectively leveraging
their sanction tools in response to the many escalations of Russia’s invasion of Ukraine and the ongoing war
ever since, thereby however also noting that sanction measures of the US, UK and EU and other partner
countries can differ in their scope and these differences present complex operational and legal challenges
for business that operate globally or facilitate global trade and payment activities. These complexities and
challenges require careful navigation. The scope of the restrictive measures are generally broad, yet often
also nuanced and made subject to relatively detailed factual context, ranging from prohibitions and
restrictions which target specific industries, or types of business or activity, to asset freeze sanctions which
target specifically listed/designated corporates, private individuals, and certain legal structures and entities
owned and/or controlled by these targeted individuals.
Accordingly, as part of ING’s Know Your Customer and compliance risk governance and procedures, ING is
continuously monitoring the situation to stay abreast on all relevant updates to implement effective and
appropriate additional control measures and to manage the increased risk and financial impacts of these
developments.
Operationally, the impact of these enhancements has resulted in the need for additional staff members to
review and apply greater scrutiny of transactions alerted for heightened risk of non-compliance with
applicable sanctions.
For additional information regarding regulatory developments, see also this Form 20-F 2023, under
“Additional Information – ING Group Risk Management- Compliance Risk”.
ESG Reporting Regulations
Environmental, Social and Governance (ESG) metrics and disclosures are an increasing focus for businesses
as they respond to a wave of scrutiny from all manner of stakeholders, from investors and regulators to
employees and customers. There’s an expectation that ESG disclosures will comply with mandatory and
voluntary reporting requirements and be reliable, verifiable and comparable to allow those stakeholders to
make decisions that matter to them.
Non-Financial Reporting Directive (NFRD)
Since 2018, companies like ING within the scope of the NFRD (Directive 2014/95/EU) have been required to
disclose information on non-financial matters (environmental, social and employee matters, human rights,
bribery and corruption). The objective of the NFRD is to improve the quality and quantity of corporate non-
financial information reporting.
Under the NFRD, large, listed companies, banks and insurance companies ('public interest entities') with
more than 500 employees are required to publish reports on the policies they implement in relation to social
responsibility and treatment of employees; respect for human rights; anti-corruption and bribery; and
diversity on company boards (in terms of age, gender, educational and professional background). In
particular, the NFRD requires companies to disclose information about their business models, policies
(including implemented due diligence processes), outcomes, risks and risk management, and Key
Performance Indicators relevant to the business.
Corporate Sustainability Reporting Directive (CSRD)
The CSRD (directive (EU) 2022/2464) was published in December 2022 in the Official Journal of the European
Union and should be transposed into national law by 6 July 2024. It profoundly revises the the ESG reporting
requirements under the NFRD, Accounting Directive and the Transparency Directive, and it is designed to
bring sustainability reporting on par with financial reporting over time and monitor the progress of
ING Group Annual Report 2023 on Form 20-F 68
companies’ behaviors in relation to sustainability matters. With the CSRD, the existing sustainability matters
of ESG reporting will be expanded and standardized. Its aims are to:
•harmonize and improve the quality of information published by undertakings, particularly information on
ESG (sustainability-related information);
•provide financial undertakings, investors, relevant stakeholders and the general public with relevant,
comparable and reliable sustainability information;
•encourage investment that supports the transition to a sustainable economy in line with the European
Green Deal.
Undertakings subject to the CSRD will be required to provide more information than under the NFRD.
Undertakings falling within its scope will be required to include the following disclosures in their
management report:
•information necessary to understand the undertaking's impacts on sustainability matters, that is, ESG
matters; and
•information necessary to understand how sustainability matters affect the undertaking's development,
performance and position (double materiality).
The first-time application for undertakings such as ING that are already subject to reporting under the NFRD
is for financial years beginning on or after 1 January 2024. These companies will be later joined by large
non-listed companies (2025), listed SMEs (2026) and certain European subsidiaries of non-EU groups.
Although the objective is to have a similar level of assurance for financial and sustainability reporting, a
progressive approach is taken. Therefore, at this stage, the CSRD ‘only’ requires a ‘limited' assurance from
the auditors. ING Group, as well as some of its subsidiaries are to disclose sustainability related information
in its Management Board report.
European Sustainability Reporting Standards (ESRS)
In July 2023, the European Commission has adopted the final delegated act of the European Sustainability
Reporting Standards (ESRS). Companies subject to the CSRD shall report according to the ESRS and ING will
have to apply the standards over financial year 2024, for reports published in 2025.
The first set of ESRS specify the new sustainability reporting requirements based on the CSRD, covering the
full range of sustainability matters (Environment, Social and Governance). The overall architecture of the
first set of ESRS is designed to ensure that sustainability information is reported in the companies’
management report in a carefully articulated manner and is based on the following reporting structure:
1.Governance: the governance processes, controls and procedures used to monitor and manage impacts,
risks and opportunities
2.Strategy: how the undertaking’s strategy and business model(s) interact with its material impacts, risks
and opportunities, including the strategy for addressing them
3.Impact, risk and opportunity management: the process(es) by which impacts, risks and opportunities are
identified, assessed and managed through policies and actions
4.Metrics and targets: how the undertaking measures its performance, including progress toward the
targets it has set
The first set of standards only includes the cross-cutting and sector-agnostic standards. Sector-specific and
SME-proportionate standards are in the process of being developed and will be submitted for a separate
public consultation, however the Commission has announced a delay in the implementation.
The cross-cutting standards consist of:
•ESRS 1 which prescribes the mandatory concepts and principles to be applied when preparing
sustainability statements under the CSRD.
•ESRS 2 is on general, strategy, governance, and materiality assessment disclosure requirements.
The topical standards consist of:
•Environment topical standards (ESRS E1–E5) outline disclosure requirements for companies to report on
matters related to climate change, pollution, water and marine resources, biodiversity and ecosystems,
and resource use and circular economy.
•Social topical standards (ESRS S1–S4) provide a framework for entities to report on topics related to their
own workforce, the workers in their value chains, the communities impacted by their operations and the
consumers and end-users of their products or services.
•Governance topical standards (ESRS G1–G2) set out disclosure requirements that seek to enhance users’
understanding of a company’s governance structure, its internal control and risk management system,
the company’s strategy and approach, and the processes, procedures and performance in relation to
their business conduct.
EU Taxonomy
The EU Taxonomy Regulation (EU Taxonomy), published in the Official Journal of the EU in 2020, is a
classification system, establishing a list of ‘environmentally sustainable’ economic activities and introducing
reporting requirements. The EU Taxonomy provides companies, investors and policymakers with
appropriate definitions for which economic activities can be considered ‘environmentally sustainable’ and
can be reported accordingly. In this way, it creates security for investors and protect private investors from
greenwashing. For an economic activities to be recognized as ‘environmentally sustainable”, it should meet
the following technical screening criteria:
ING Group Annual Report 2023 on Form 20-F 69
•Substantially contributing to one of the six EU environmental objectives:
•Climate change mitigation
•Climate change adaptation
•Sustainable use and protection of water and marine resources
•Transition to a circular economy
•Pollution prevention and control
•Protection and restoration of biodiversity and ecosystems
•Doing no harm to any of the other 5 objectives, and
•Meeting minimum safeguards, including OECD Guidelines for Multinational Enterprises and the UN
Guiding Principles on Business, ILO standards and Human Rights
For each of the environmental objectives, additional delegated acts are published to provide detailed lists of
eligible economic activities and related technical screening criteria. The delegated acts on the above
mentioned environmental objectives have been published in the Official Journal of the EU which provide the
detailed technical screening criteria to be met for the relevant climate and environmental objectives for
defined activities. The delegated acts on Climate Change Mitigation and Climate Change Adaptation are
applicable since January 2022 and have been adjusted by a complementary delegated act on nuclear and
gas energy activities, which is applicable as of January 2023. The second delegated act for the remaining 4
objectives will be applicable as of 1 January 2024.
For disclosure requirements under the EU Taxonomy, a delegated act supplementing Article 8 of the
Taxonomy is applicable since January 2022. Article 8 of the EU Taxonomy requires companies falling within
the scope of the existing NFRD – and the additional companies to be brought under the scope of the
proposed CSRD in the future – to report on the extent to which their activities are environmentally
sustainable according to the EU Taxonomy. Article 8 of the EU Taxonomy aims to increase transparency in
the market and help prevent greenwashing by providing information to investors about the environmental
performance of assets and economic activities of financial and non-financial undertakings subject to the
NFRD. This delegated act specifies the content, methodology and presentation of information to be
disclosed concerning the proportion of environmentally sustainable economic activities in their businesses,
depending on the type of the company (i.e. non-financial/financial). Within the scope of Article 8 delegated
act, all NFRD non-financial companies have to determine the parts of their turnover, capital and operating
expenditures that are eligible and aligned with the EU Taxonomy. Financial companies on the other hand,
will disclose certain KPIs such as the Green Asset Ratio (GAR), and disclose the EU Taxonomy aligned part of
their balance sheet such as their mortgage book, and loan book by using non-financial companies' EU
Taxonomy disclosures. Credit institutions such as ING should follow the below listed disclosures
requirements:
•From 1 January 2022 (reference date: 31 December 2021): only disclose (i) the proportion in their total
assets of exposures to Taxonomy non-eligible and Taxonomy-eligible economic activities; (ii) the
proportion in their total assets of the exposures to central governments, central banks, and
supranational issuers, derivatives and undertakings that are not in-scope entities, together with (iii)
certain qualitative information for the previous financial year.
•From 1 January 2024 (reference date: 31 December 2023): disclose 5 quantitative templates including
the GAR and accompanying qualitative information.
•1 January 2026: in addition to previous requirements, need to report on the Taxonomy-alignment of
their trading book and fees and commissions for non-banking activities.
Pillar 3 ESG Disclosures
Article 449a of Regulation (EU) No 575/2013 (CRR) requires large institutions with securities traded on a
regulated market of any Member State to disclose prudential information on environmental, social and
governance risks, including physical risks and transition risks, as defined in the report referred to in Article
98(8) of Directive 2013/36/EU. Article 434a CRR mandates the EBA to develop draft implementing technical
standards (ITS) specifying uniform formats and associated instructions for the disclosure of this information.
The ITS on Pillar III disclosures on Environmental, Social and Governance (ESG) risks was adopted by the
European Commission in November 2022, published in the Official Journal of the EU in December 2022 with
a first reporting date in 2023 (reference date: 31 December 2022). The ESG Pillar 3 requires credit institutions
such as ING to disclose the following information:
•Climate risks: how climate change may exacerbate other risks within banks balance sheets.
•Mitigating actions: what mitigating actions banks have in place to address those risks, including financing
activities that reduce carbon emissions.
•Green Asset ratio and Banking Book Taxonomy Alignment ratio: to understand how banks are financing
activities that will meet the publicly agreed Paris agreement objectives of climate change mitigation and
adaptation based on the EU taxonomy of green activities.
The EBA ESG Pillar 3 requirements features (i) a set of 10 quantitative templates that request banks to
disclose climate-related risks and actions to mitigate them, together with exposure to assets that support
the climate change mitigation and adaptation and (ii) qualitative information on their ESG strategies,
governance and risk management arrangements with regard to ESG risk. It should be noted that the EBA
ESG Pillar 3 requirements will become binding following a phased-in approach, with a transitional period for
certain disclosures until 2025 (reference date: 31 December 2024).
Sustainable Finance Disclosure Regulation
The Sustainable Finance Disclosure Regulation (SFDR) is a European regulation intended to improve financial
sector transparency for certain sustainable investment products, via website and pre-contractual
disclosures. It also aims to prevent greenwashing and to increase transparency around sustainability claims
made by financial sector participants. The SFDR imposes sustainability disclosure requirements on certain
financial actors who are offering certain type of financial products or investment advice in the EU covering a
ING Group Annual Report 2023 on Form 20-F 70
broad range of environmental, social and governance (ESG) metrics at both entity- and product-level. The
SFDR came into effect on 10 March 2021, with certain disclosure requirements being in effect at a later
stage.
SEC Climate-Related Disclosures
On March 6, 2024, the SEC adopted final rules that require registrants to disclose certain climate-related
information in registration statements and annual reports. The final rules require, among other things,
disclosure of material climate-related risks and their material impacts; activities to mitigate or adapt to such
risks; information about the registrant's board of directors' oversight of climate-related risks and
management’s role in managing material climate-related risks; and information on any climate-related
targets or goals that are material to the registrant's business, results of operations, or financial condition. In
addition, the final rules require disclosure of Scope 1 and/or Scope 2 greenhouse gas (GHG) emissions by
certain larger registrants when those emissions are material and the filing of an attestation report covering
the required disclosure of such registrants’ Scope 1 and/or Scope 2 emissions, each on a phased-in basis.
Further, where applicable, the final rules also require certain disaggregated financial information relating to
carbon offsets and renewable energy credits or certificates and the financial impacts of certain weather
events and other natural conditions to be disclosed in the notes to the registrant’s financial statements.
While the final rule will become effective in 2024, ING will be required to comply with certain of the rules on
a phased-in basis beginning with the 2025 financial year.
Additional information regarding regulatory developments
For additional information regarding regulatory developments, see also this Form 20-F 2023, under
“Additional Information – ING Group Risk Management- Environmental, social and governance Risk”.
For a description of our segments including a breakdown of total revenues by category for the last three
financial years, refer to Item 5. “Operating and financial review and prospects - Segment reporting”.
C. Organisational structure
ING Groep N.V., a publicly-listed company, is the parent of one main legal entity: ING Bank N.V. (ING Bank).
ING Bank is the parent company of various Dutch and foreign banking and other subsidiaries.
Reference is made to Exhibit 8 “List of subsidiaries of ING Groep N.V.” for a list of principal subsidiaries of ING
Groep. N.V. For the majority of ING’s principal subsidiaries, ING Groep N.V. has control because it either
directly or indirectly owns more than half of the voting power. For subsidiaries in which the interest held is
below 50%, control exists based on the combination of ING’s financial interest and its rights from other
contractual arrangements which result in control over the operating and financial policies of the entity.
D.Property, plants and equipment
ING predominantly leases the land and buildings used in the normal course of its business. In addition, ING
has invested in land and buildings. Management believes that ING’s facilities are adequate for its present
needs in all material respects.
For information on property, plants and equipment, reference is made to Note 9 'Property and equipment',
for information on lease liabilities reference is made to Note 16 'Other liabilities' and for information on
investment properties reference is made to Note 11 'Other assets' in the consolidated financial statements.
Item 4A.Unresolved Staff comments
Not applicable.
ING Group Annual Report 2023 on Form 20-F 71
Item 5. Operating and financial review and prospects
The following operating and financial review and prospects should be read in conjunction with the
consolidated financial statements and the related Notes thereto included elsewhere herein. The
consolidated financial statements have been prepared in accordance with IFRS-IASB. Unless otherwise
indicated, financial information for ING Group included herein is presented on a consolidated basis under
IFRS-IASB.
A.Operating results
Geopolitical and economic events not only have a significant impact on
customers and individuals, but also on financial institutions like ING.
The global economy was lacklustre in 2023. A buoyant reopening phase, which drove GDP growth to well
above pre-pandemic levels, was followed by a weaker spell driven by higher inflation, geopolitical
uncertainty and a disappointing Chinese economy. Europe, being an open economy, suffered from this
weak global environment and the simmering impact of the energy crisis on industry, resulting in stagnant
economic activity.
However, inflation came down significantly in advanced economies, in part driven by lower energy prices, a
fading of supply-chain problems, and of course higher interest rates.
China had a weak 2023 due to underwhelming household consumption upon reopening of the economy,
continued problems in the real estate sector (which is still dealing with a debt overhang), and slowed
demand for production from advanced markets. The latter put pressure on industrial production and
exports.
The United States has been the positive exception, with resilient 2023 GDP growth. The US economy was
supported by continued high government spending, but also by consumers running down excess savings.
This, in turn, kept the job market roaring, which supported income. The effect of higher interest rates started
to show but did not curb economic activity too much. This drove the Fed funds rate to five-and-a half
percent and while a recession was expected, it did not materialise.
The US economy continued to perform well despite significant financial stress in the first half of the year.
The failure of several smaller American banks caused instability and forced governments and central banks
to take action. Eurozone banks were not significantly affected, but the industry did experience a degree of
financial stress. In Switzerland, this financial distress contributed to the emergency takeover of Credit Suisse
by UBS. Overall, monetary tightening had a significant effect on borrowing and deposit growth, but did not
result in a major downturn in activity in advanced markets.
The performance of the eurozone economy in 2023 was stagnant. Germany underperformed the eurozone
average due to a larger share of energy-intensive industries, which continued to suffer from higher energy
prices (despite a decline from 2022 peaks) and overall competitiveness problems. Eurozone consumers
struggled with the loss of purchasing power, with household consumption remaining below its late-2022
peak throughout the year.
However, the labour market remained strong in the eurozone and bankruptcies have not meaningfully
increased. The inflation rate also fell substantially, which caused the European Central Bank (ECB) to pause
interest-rate rises after raising the deposit rate to a record high of four percent.
In general, 2023 saw a smaller impact on the economy from geopolitical events than 2022. While global
risks did not abate, the impact of the Russia-Ukraine war had a more muted effect on advanced markets as
energy prices remained much more subdued and the Israel-Gaza conflict did not result in significant
spillovers to the global economy. Still, the effect on the eurozone was larger than in other major markets,
resulting in a weaker economic performance than peers like the US.
For further information on other factors that can impact ING Group’s results of operations, reference is
made to “Item 3. Key information - Risk Factors”.
For further information on regulatory changes reference is made to “Item 4. Information on the Company –
Regulation and Supervision”.
ING Group Annual Report 2023 on Form 20-F 72
Fluctuations in markets
Fluctuations in equity markets
Our banking operations are exposed to fluctuations in equity markets. ING maintains an internationally
diversified and mainly client-related trading portfolio. Accordingly, market downturns are likely to lead to
declines in securities trading and brokerage activities which we execute for customers and therefore to a
decline in related commissions and trading results. In addition to this, ING also maintains equity
investments in its own non-trading books. Fluctuations in equity markets may affect the value of these
investments.
Fluctuations in interest rates
Our banking operations are exposed to fluctuations in interest rates. Mismatches in the interest re-pricing
and maturity profile of assets and liabilities in our balance sheet can affect the future interest earnings and
economic value of the bank's underlying banking operations. In addition, changing interest rates may
impact the (assumed) behavior of our customers, impacting the interest rate exposure, interest hedge
positions and future interest earnings, solvency and economic value of the bank’s underlying banking
operations. The stability of future interest earnings and margin also depends on the ability to actively
manage pricing of customer assets and liabilities. Especially, the pricing of customer savings portfolios in
relation to re-pricing customer assets and other investments in our balance sheet is a key factor in the
management of the bank’s interest earnings.
Fluctuations in exchange rates
ING Group is exposed to fluctuations in exchange rates. Our management of exchange rate sensitivity
affects the results of our operations through the trading activities (which includes local country versus
international transactions) and because we prepare and publish our consolidated financial statements in
Euros. Because a substantial portion of our income, expenses and foreign investments is denominated in
currencies other than Euros, fluctuations in the exchange rates used to translate foreign currencies,
particularly the U.S. Dollar, Pound Sterling, Turkish Lira, Chinese Renminbi, Australian Dollar, Japanese Yen,
Polish Zloty, Romanian Leu, Korean Won, Brazilian Real, Singapore Dollar, Thai Baht and Russian Ruble into
Euros can impact our reported results of operations, cash flows and reserves from year to year. Fluctuations
in exchange rates will also impact the value (denominated in Euro) of our investments in our non-Euro
reporting subsidiaries. The impact of these fluctuations in exchange rates is mitigated to some extent by the
fact that income and related expenses, as well as assets and liabilities, of each of our non-Euro reporting
subsidiaries are generally denominated in the same currencies. FX translation risk is managed by taking into
account the effect of translation results on the Common Equity Tier 1 ratio (CET1).
Consolidated result of operations
ING Group monitors and evaluates the performance of ING Group at a consolidated level and by segment
using results based on figures according to IFRS as adopted by the European Union (IFRS-EU). The Executive
Board and the Management Board Banking consider this measure to be relevant to an understanding of the
Group’s financial performance, because it allows investors to understand the primary method used by
management to evaluate the Group’s operating performance and make decisions about allocating
resources. In addition, ING Group believes that the presentation of results in accordance with IFRS-EU helps
investors compare its segment performance on a meaningful basis by highlighting result before tax
attributable to ongoing operations and the profitability of the segment businesses. IFRS-EU result is derived
by including the impact of the IFRS-EU ‘IAS 39 carve out’ adjustment compared to IFRS-IASB.
The IFRS-EU ‘IAS 39 carve-out’ adjustment relates to fair value portfolio hedge accounting strategies for the
mortgage and savings portfolios in the Benelux, Germany and Other Challengers that are not eligible under
IFRS-IASB. As no hedge accounting is applied to these mortgage and savings portfolios under IFRS-IASB, the
fair value changes of the derivatives are not offset by fair value changes of the hedge items (mortgages and
savings).
For a reconciliation to IFRS-EU of non-GAAP measures 'Net core lending growth' and 'Net core deposits
growth', please refer to the end of this section.
Segment Reporting
The published 2023 financial statements of ING Group includes financial information in accordance with
International Financial Reporting Standards as adopted by the European Union (IFRS-EU). The segment
reporting in the annual report on Form 20-F has been reconciled with International Financial Reporting
Standards as issued by the International Accounting Standards Board (IFRS-IASB) for consistency with the
other financial information contained in this report. The difference between the accounting standards is
reflected in the Wholesale Banking segment, and in the geographical split of the segments in the
Netherlands, Belgium, Germany and Other Challengers. Reference is made to Note 1 ‘Basis of preparation
and material accounting policy information’ for a reconciliation between IFRS-EU and IFRS-IASB.
ING Group’s segments are based on the internal reporting structure by lines of business.
The Executive Board of ING Group and the Management Board Banking (together the Chief Operating
Decision Maker (CODM)) set the performance targets, approve and monitor the budgets prepared by the
business lines. Business lines formulate strategic, commercial, and financial plans in conformity with the
strategy and performance targets set by the CODM.
Recognition and measurement of segment results are in line with the accounting policies as described in
Note 1 ‘Basis of preparation and material accounting policy information’. The results for the period for each
ING Group Annual Report 2023 on Form 20-F 73
reportable segment are after intercompany and intersegment eliminations and are those reviewed by the
CODM to assess performance of the segments. Transfer prices for inter-segment transactions are set at
arm’s length. Corporate expenses are allocated to business lines based on time spent by head office
personnel, the relative number of staff, or on the basis of income, expenses and/or assets of the segment.
Total assets by country, as presented in Note 31 ‘Information on geographical areas’, does not include
intercompany balances and reconciles to the total assets in the consolidated statement of financial position
of ING Group.
The following overview specifies the segments by line of business and the main sources of income of each of
the segments:
Retail Netherlands (Market Leaders)
Income from retail and private banking activities in the Netherlands, including the SME and mid-corporate
segments, and the Real Estate Finance portfolio related to Dutch domestic mid-corporates. The main
products offered are current and savings accounts, business lending, mortgages and other consumer
lending in the Netherlands.
Retail Belgium (Market Leaders)
Income from retail and private banking activities in Belgium (including Luxembourg), including the SME and
mid-corporate segments. The main products offered are similar to those in the Netherlands.
Retail Germany (Challengers and Growth Markets)
Income from retail and private banking activities in Germany (including Austria). The main products offered
are current and savings accounts, mortgages and other customer lending.
Retail Other (Challengers and Growth Markets)
Income from retail banking activities in the rest of the world, including the SME and mid-corporate segments
in specific countries. The main products offered are similar to those in the Netherlands.
Wholesale Banking
Income from wholesale banking activities. The main products are: lending, debt capital markets, working
capital solutions, export finance, daily banking solutions, treasury and risk solutions, and corporate finance.
Corporate Line
In addition to these segments, ING Group reconciles the total segment results to the total result using
Corporate Line. The Corporate Line reflects capital management activities, as ING Group applies a system of
capital charging for its banking operations in order to create a comparable basis for the results of business
units globally, irrespective of the business units’ book equity and the currency they operate in.
As from 2022, results in the Corporate Line have been impacted by the application of hyperinflation
accounting in the consolidation of our subsidiary in Türkiye (IAS 29).
Following a change in governance, the Asian stakes (our investments in Bank of Beijing and TMBThanachart
Bank (TTB)) are reported in Corporate Line as of 2023 (with a profit before tax of EUR 185 million), whereas
previously they were reported in Retail Other. Comparable data have been adjusted accordingly.
Furthermore, Corporate Line includes certain other income and expenses that are not allocated to the
banking businesses.
Total income for Corporate Line in 2023 amounted to EUR 450 million compared with EUR 84 million in 2022.
This included a hyperinflation accounting impact of EUR -179 million in 2023 versus EUR -279 million in
2022. Excluding hyperinflation accounting impact, total income rose by EUR 266 million, mainly attributable
to higher income from Treasury activities and because 2022 had included EUR -165 million impact for
impairments on our stake in TTB.
Operating expenses for Corporate Line were EUR 542 million, 1.3% up from EUR 535 million in 2022.
Expenses in 2023 included a hyperinflation impact of EUR 48 million and EUR 51 million that was
provisioned, while 2022 had included a hyperinflation impact of EUR 30 million and a EUR 32 million
impairment loss related to the goodwill allocated to Türkiye.
ING Group Annual Report 2023 on Form 20-F 74
Total Operations
The following table sets forth the contribution of ING’s business lines and the corporate line to the net result
for each of the years 2023, 2022 and 2021.
Total operations | |||||||
1 January to 31 December 2023 in EUR million | Retail Banking Netherlands | Retail Banking Belgium | Retail Banking Germany | Retail Other | Wholesale Banking | Corporate Line | Total |
Income: | |||||||
- Net interest income | 3,096 | 2,063 | 2,862 | 3,437 | 4,028 | 489 | 15,976 |
- Net fee and commission income | 959 | 502 | 357 | 519 | 1,259 | -1 | 3,595 |
- Total investment and other income | 945 | 117 | -67 | 277 | 1,771 | -38 | 3,005 |
Total income | 5,001 | 2,683 | 3,152 | 4,233 | 7,057 | 450 | 22,575 |
Expenditure: | |||||||
- Operating expenses | 2,135 | 1,852 | 1,243 | 2,479 | 3,313 | 542 | 11,564 |
- Additions to loan loss provision | 5 | 169 | 119 | 313 | -92 | 5 | 520 |
Total expenditure | 2,140 | 2,022 | 1,362 | 2,792 | 3,222 | 547 | 12,084 |
Result before taxation | 2,861 | 661 | 1,790 | 1,441 | 3,836 | -97 | 10,492 |
Taxation | 740 | 182 | 631 | 359 | 900 | 158 | 2,970 |
Non-controlling interests | 174 | 61 | 235 | ||||
Net result IFRS-EU | 2,121 | 479 | 1,159 | 908 | 2,875 | -255 | 7,287 |
Adjustment of the EU 'IAS 39 carve- out' | -3,147 | -3,147 | |||||
Net result IFRS-IASB | 2,121 | 479 | 1,159 | 908 | -272 | -255 | 4,140 |
Total operations | |||||||
1 January to 31 December 2022 in EUR million | Retail Banking Netherlands | Retail Banking Belgium | Retail Banking Germany | Retail Other | Wholesale Banking | Corporate Line | Total |
Income: | |||||||
- Net interest income | 2,888 | 1,668 | 1,666 | 2,725 | 4,260 | 550 | 13,756 |
- Net fee and commission income | 892 | 511 | 437 | 535 | 1,217 | -6 | 3,586 |
- Total investment and other income | 417 | -32 | 69 | 377 | 849 | -460 | 1,219 |
Total income | 4,196 | 2,147 | 2,172 | 3,637 | 6,325 | 84 | 18,561 |
Expenditure: | |||||||
- Operating expenses | 2,115 | 1,786 | 1,140 | 2,509 | 3,114 | 535 | 11,199 |
- Additions to loan loss provision | 67 | 139 | 131 | 302 | 1,220 | 2 | 1,861 |
Total expenditure | 2,182 | 1,924 | 1,271 | 2,812 | 4,334 | 537 | 13,060 |
Result before taxation | 2,014 | 223 | 901 | 825 | 1,991 | -453 | 5,502 |
Taxation | 540 | 72 | 202 | 254 | 581 | 76 | 1,725 |
Non-controlling interests | 3 | 47 | 52 | 1 | 102 | ||
Net result IFRS-EU | 1,474 | 151 | 696 | 525 | 1,358 | -530 | 3,674 |
Adjustment of the EU 'IAS 39 carve- out' | 8,451 | 8,451 | |||||
Net result IFRS-IASB | 1,474 | 151 | 696 | 525 | 9,810 | -530 | 12,126 |
ING Group Annual Report 2023 on Form 20-F 75
Total operations | |||||||
1 January to 31 December 2021 in EUR million | Retail Banking Netherlands | Retail Banking Belgium | Retail Banking Germany | Retail Other | Wholesale Banking | Corporate Line | Total |
Income: | |||||||
- Net interest income | 3,290 | 1,747 | 1,447 | 2,709 | 4,151 | 270 | 13,615 |
- Net fee and commission income | 771 | 519 | 497 | 530 | 1,197 | 3 | 3,517 |
- Total investment and other income | 201 | 209 | 65 | 202 | 568 | 114 | 1,359 |
Total income | 4,262 | 2,475 | 2,009 | 3,441 | 5,916 | 387 | 18,490 |
Expenditure: | |||||||
- Operating expenses | 2,403 | 1,667 | 1,174 | 2,442 | 2,926 | 580 | 11,192 |
- Additions to loan loss provision | -76 | 225 | 49 | 202 | 117 | 516 | |
Total expenditure | 2,326 | 1,892 | 1,223 | 2,644 | 3,042 | 580 | 11,708 |
Result before taxation | 1,936 | 583 | 786 | 797 | 2,874 | -193 | 6,782 |
Taxation | 499 | 146 | 252 | 209 | 703 | 68 | 1,877 |
Non-controlling interests | 4 | 98 | 26 | 128 | |||
Net result IFRS-EU | 1,437 | 437 | 529 | 490 | 2,144 | -261 | 4,776 |
Adjustment of the EU 'IAS 39 carve- out' | 1,174 | 1,174 | |||||
Net result IFRS-IASB | 1,437 | 437 | 529 | 490 | 3,318 | -261 | 5,951 |
Year ended 31 December 2023 compared to year ended 31 December 2022
Without application of the EU ‘IAS 39 carve-out’, ING’s net result declined by EUR 7,986 million, or -66%, to
EUR 4,140 million compared with EUR 12,126 million in 2022. The net result was affected by a EUR 3,147
million negative contribution of fair value changes on derivatives related to asset-liability-management
activities for the mortgage and savings portfolios in the Benelux, Germany, France, Spain, and Italy, versus a
EUR 8,451 million positive contribution in 2022. These fair value changes were mainly caused by changes in
market interest rates. No hedge accounting is applied to these derivatives under IFRS-IASB.
ING’s IFRS-EU net result (when applying the EU ‘IAS 39 carve-out’) increased to EUR 7,287 million from EUR
3,674 million in 2022. Our interest income benefited from the positive rate environment and expense
growth was limited, despite inflationary effects on staff expenses and continued investments in the growth
of our business. Risk costs declined considerably and were well below the through-the-cycle average,
reflecting the quality of our loan book and our prudent credit risk management.
Total income increased 22% to EUR 22,575 million. Next to a positive rate environment, this was supported
by a growing primary customer base and an increase in lending and deposits. In Retail Banking, we added
750,000 primary customers to reach a total of 15.3 million. Especially Germany, Spain and the Netherlands
contributed to this growth. Net core lending growth (which is the increase in customer lending adjusted for
currency impacts and excluding Treasury and the run-off portfolios) was EUR 8.6 billion in 2023, including
EUR 8.0 billion growth in our mortgage portfolio in a challenging housing market. Our diversified customer
deposit base was resilient. For the full-year 2023, net core deposits growth (which excludes FX impacts and
movements in Treasury deposits) totalled EUR 10.6 billion, driven entirely by Retail Banking.
Net interest income (NII) increased 16% to EUR 15,976 million, as we benefited from a positive interest rate
environment. This was particularly visible in a strong increase of the liability NII. This increase was somewhat
offset by continued subdued loan demand, which impacted our lending NII. In addition, NII for Treasury and
Financial Markets declined, but in each case this was more than compensated in other income. Net interest
income in 2022 had included a EUR -343 million impact from new regulation in Poland for mortgages and a
net TLTRO impact of EUR -87 million. ING’s full-year net interest margin rose to 1.56% in 2023 from 1.34% in
2022. Excluding the impact of the Polish moratorium and TLTRO, the net interest margin showed an
increase of 17 basis points year-on-year.
Net fee and commission income grew only 0.3% to EUR 3,595 million, despite a strong growth in primary
customers and pricing initiatives for payment packages. This is fully explained by limited demand for
mortgages, which led to lower mortgage brokerage volumes, and low trading levels in investment products.
Total investment and other income jumped to EUR 3,005 million in 2023 from EUR 1,219 million in 2022. This
was driven by strong results for Treasury and higher trading results in Financial Markets (both partly offset
by a lower net interest income). Other income in 2022 had included a hedge accounting impact of EUR -288
million and EUR 165 million of impairments on our stake in TTB (TMBThanachart Bank), partly offset by a EUR
125 million gain from the transfer of our investment business in France, a EUR 67 million gain from a legacy
entity in Belgium and EUR 38 million related to the sale of a non-performing loan portfolio in Spain.
Operating expenses increased 3.3% to EUR 11,564 million. Expenses in 2023 included EUR 1,042 million of
regulatory costs, a decline of EUR 208 million year-on-year due to a lower contribution to the Single
Resolution Fund and because 2022 had included a EUR 99 million contribution to the Institutional Protection
Scheme in Poland. Furthermore, expenses in 2023 included EUR 247 million of incidental items, largely
related to restructuring provisions and impairments, compared with EUR 325 million of incidental items in
2022. Expenses excluding regulatory costs and incidental items increased by 6.8%. This increase was mostly
driven by the effect of high inflation on staff expenses, while we also continued to invest in our business. The
cost/income ratio improved significantly in 2023, to 51.2%, compared with 60.3% a year earlier.
Net additions to loan loss provisions dropped to EUR 520 million, or eight basis points of average customer
lending, from EUR 1,861 million (29 basis points) in 2022. Our strong asset quality and robust approach to
risk management resulted in limited new defaults and this was combined with effective recoveries. A net
addition of EUR 533 million on our Russia-related exposure in 2022 was followed by a net release of EUR 218
million in 2023, mainly as a result of continued reduction of our Russia-related exposure.
ING Group Annual Report 2023 on Form 20-F 76
The effective tax rate in 2023 was 28.3%, down from 31.4% recorded in 2022 which had included non-
deductible impairments on TTB and higher non-deductible expenses in various countries.
Year ended 31 December 2022 compared to year ended 31 December 2021
Without application of the EU 'IAS 39 carve-out', ING’s net result increased by EUR 6,175 million, or 103.8%,
to EUR 12,126 million compared with EUR 5,951 million in 2021. The net result was affected by a EUR 8,451
million positive contribution of fair value changes on derivatives related to asset-liability-management
activities for the mortgage and savings portfolios in the Benelux, Germany, France, and Spain, versus EUR
1,174 million in 2021. These fair value changes were mainly caused by changes in market interest rates. No
hedge accounting is applied to these derivatives under IFRS-IASB.
ING’s IFRS-EU net result (when applying the EU ‘IAS 39 Carve-out’) declined to EUR 3,674 million from EUR
4,776 million in 2021, fully due to higher net additions to loan loss provisions, which had been at a very low
level in 2021. The effective tax rate in 2022 was 31.4%, up from 27.7% in 2021. The higher effective tax rate
was caused by the impact of the following non-deductible items for corporate income tax purposes in 2022:
hyperinflation accounting loss in Türkiye, impairments on TTB and interest expenses in various countries.
Income was supported by a growing primary customer base and an increase in lending and deposits. Our
global retail customer base (excluding France, after the announced exit from the retail market) remained
flat at 37.2 million, but even more customers chose ING as their primary bank. In 2022, we gained 585,000
primary customers, bringing the total number to 14.6 million, which was 4% higher than at year-end 2021
(excluding France). Net core lending growth (which is growth in customer lending adjusted for currency
impacts and excluding Treasury and the run-off portfolios) was EUR 18.2 billion in 2022, and net core
deposits growth was EUR 25.1 billion.
In our profit or loss, we saw the benefits of the rising rate environment, which boosted net interest income.
This was on top of the structurally higher fee base, resulting from our efforts to diversify income. All these
positive developments were largely offset, however, by several exceptional income items in 2022 (including
the impact of Türkiye hyperinflation, a mortgage moratorium in Poland and the unwinding of a deposits
hedge in Belgium and our TLTRO-related derivative position), resulting in an income growth of 0.4% to EUR
18,561 million.
Net interest income rose 1.0% to EUR 13,756 million. The increase was driven by higher margins on
liabilities, following the return of positive interest rates in 2022. This was only partly offset by lower margins
on mortgages and other lending, as client rates generally track the higher cost of funds with a delay and
prepayments on mortgages declined. After ECB’s decision to change the conditions for the TLTRO
programme, we had to unwind our TLTRO-related derivative position. Combined with the remaining TLTRO
benefit until 23 November 2022, this led to a net TLTRO impact of EUR -87 million compared to a net benefit
of EUR 483 million in 2021. Net interest income in 2022 also included a EUR -343 million impact from new
regulation in Poland for mortgages. ING’s full year net interest margin declined to 1.34% from 1.39% in
2021. Excluding TLTRO in both years and the impact of the Polish moratorium, the net interest margin
showed an increase of 5 basis points year-on-year.
Net fee and commission income rose 2.0% to EUR 3,586 million. Fee income for daily banking products
strongly increased, reflecting growth in primary customers, an increase in payment package fees and new
service fees. Lending fees also increased, driven by lending growth in Wholesale Banking. This was partly
offset by lower fees from investment products and from Global Capital Markets, reflecting adverse market
conditions.
Total investment and other income decreased to EUR 1,219 million in 2022 from EUR 1,359 million in 2021.
This included the largest part of the impact of Türkiye hyperinflation, EUR -288 million to unwind a macro
fair value hedge of deposits in Belgium (of which EUR -247 million in Retail Banking and EUR -41 million in
Wholesale Banking) and EUR 165 million of impairments on our stake in TTB, while 2021 had included a EUR
72 million recognition of a receivable recorded in Corporate Line. Other income in 2022 was supported by a
EUR 125 million gain from the transfer of our investment business in France, a EUR 67 million gain from a
legacy entity in Belgium and income from the sale of a non-performing loan portfolio in Spain.
Operating expenses increased by EUR 7 million, or 0.1%, to EUR 11,199 million. Expenses in 2022 included
EUR 1,250 million of regulatory costs, slightly lower than in the previous year. Expenses in 2022 furthermore
included EUR 325 million of incidental items, largely related to restructuring provisions and impairments and
also including EUR 75 million for adding the interest-on-interest effect to the compensation for customers
on certain Dutch consumer credit products. Incidental items in 2021 had amounted to EUR 522 million,
mainly reflecting a EUR 180 million provision for the compensation to Dutch customers with certain
consumer credit products and redundancy provisions and impairments related to the announced exit of the
retail banking markets in France and the Czech Republic. Excluding regulatory costs and incidental items,
expenses were up 2.3%, impacted by high inflation, which was mainly visible in staff costs. This was partly
offset by continued cost-efficiency measures and earlier actions taken to change the footprint. The cost/
income ratio was 60.3% versus 60.5% in 2021.
Net additions to loan loss provisions increased to EUR 1,861 million, or 29 basis points of average customer
lending, compared with only EUR 516 million, or 8 basis points, in 2021. Risk costs in 2022 were heavily
impacted by the Russian invasion in Ukraine, which led to a net addition of EUR 533 million on our Russia-
related exposure. The remainder was mainly due to an increase in Stage 3 individual risk costs, particularly
in Wholesale Banking, and new overlays to reflect the risks from secondary impacts, such as an increase in
energy prices, higher interest rates and inflation, as well as supply chain disruptions.
ING Group Annual Report 2023 on Form 20-F 77
Retail Netherlands | |||
Retail Netherlands | |||
in EUR million | 2023 | 2022 | 2021 |
Income: | |||
Net interest income | 3,096 | 2,888 | 3,290 |
Net fee and commission income | 959 | 892 | 771 |
Investment income and other income | 945 | 417 | 201 |
Total income | 5,001 | 4,196 | 4,262 |
Expenditure: | |||
Operating expenses | 2,135 | 2,115 | 2,403 |
Additions to the provision for loan losses | 5 | 67 | -76 |
Total expenditure | 2,140 | 2,182 | 2,326 |
Result before tax | 2,861 | 2,014 | 1,936 |
Taxation | 740 | 540 | 499 |
Non-controlling interests | 0 | 0 | 0 |
Net result IFRS-IASB | 2,121 | 1,474 | 1,437 |
Year ended 31 December 2023 compared to year ended 31 December 2022
The net result of Retail Netherlands increased by EUR 647 million, or 44%, to EUR 2,121 million in 2023 from
EUR 1,474 million in 2022. The result before tax of Retail Netherlands increased 42% to EUR 2,861 million
from EUR 2,014 million in 2022. This was mainly driven by a 19% increase in total income while operating
expenses were broadly flat and risk costs were minimal.
Net interest income was EUR 3,096 million, or 7.2% higher than a year earlier, supported by a strong
increase in liability margins. This was partly offset, however, by lower Treasury-related interest income
(compensated in other income), reflecting activities to benefit from favourable market opportunities
through money market and FX transactions. Net fee and commission income rose by EUR 67 million, or
7.5%, supported by higher fees for payment packages and new service fees. Investment and other income
increased by EUR 528 million, driven by much higher Treasury-related income (that was partly offset by
lower net interest income).
Net core lending (which excludes Treasury products and a EUR 0.4 billion decline in the Westland Utrecht
Bank run-off portfolio) grew by EUR 2.3 billion, as EUR 2.6 billion growth in the mortgage portfolio more than
compensated for a EUR 0.3 billion decrease in other lending. Customer deposits (excluding Treasury)
declined by EUR 1.6 billion, partially due to a shift from deposits to assets under management.
Operating expenses amounted to EUR 2,135 million compared with EUR 2,115 million in 2022. Excluding EUR
38 million lower regulatory costs and EUR 75 million of incidental item costs in 2022 (related to consumer
credit products), expenses rose by EUR 133 million or 7.4%. This was primarily due to higher staff expenses,
reflecting the impact of a new collective labour agreement in 2023, and restructuring provisions.
The net addition to loan loss provisions was very low at EUR 5 million, down from EUR 67 million in the prior
year. Limited net additions in 2023 for the mortgage portfolio, including the impact of a methodology
update, were almost fully offset by a net release for the business lending portfolio.
Year ended 31 December 2022 compared to year ended 31 December 2021
The net result of Retail Netherlands increased by EUR 37 million, or 2.6%, to EUR 1,474 million in 2022 from
EUR 1,437 million in 2021.
The result before tax of Retail Netherlands increased 4.0% to EUR 2,014 million from EUR 1,936 million in
2021. This increase was attributable to lower expenses, mainly due to lower incidental cost items, partly
offset by lower income and limited risk costs, after a net release in 2021.
Total income declined by EUR 66 million to EUR 4,196 million, fully due to a net TLTRO impact of EUR -78
million compared to a EUR 53 million benefit in 2021. Excluding TLTRO, income rose 1.5%. Net interest
income excluding TLTRO declined 8.4% due to lower margins on lending products, reflecting the lengthening
of the duration of the book and lower prepayment penalties. This was partly offset by higher liabilities
income as margins improved and volumes increased. Net core lending (which excludes Treasury products
and a EUR 0.8 billion decline in the Westland Utrecht Bank run-off portfolio) grew by EUR 3.0 billion in 2022,
of which EUR 2.2 billion was in residential mortgages and EUR 0.8 billion in other lending. Net core deposits
growth (excluding Treasury) was EUR 12.9 billion, mainly in savings accounts. Net fee and commission
income strongly increased by EUR 121 million, or 15.7%, mainly due to higher fee income from daily
banking products, supported by increased fees for payment packages and new service fees for business
banking. Investment and other income rose by EUR 216 million, mainly attributable to higher results from
Treasury-related products.
Operating expenses declined to EUR 2,115 million from EUR 2,403 million in 2021, mainly due to a drop in
incidental cost items. 2022 included a EUR 75 million provision for adding the interest-on-interest effect to
the compensation for customers on certain Dutch consumer credit products, while 2021 had contained EUR
289 million of incidental costs. Excluding these incidental items, expenses declined by EUR 73 million, or
3.5%, mainly driven by lower staff and office-space-related expenses, as well as lower regulatory costs.
The net addition to loan loss provisions was EUR 67 million, or 4 basis points of average customer lending,
compared to a net release of EUR 76 million, or -5 basis points, in the previous year. The limited net
additions in 2022 were mainly related to business lending and consumer lending, while risk costs for the
mortgage portfolio were negligible.
ING Group Annual Report 2023 on Form 20-F 78
Retail Belgium | |||
Retail Belgium | |||
in EUR million | 2023 | 2022 | 2021 |
Income: | |||
Net interest income | 2,063 | 1,668 | 1,747 |
Net fee and commission income | 502 | 511 | 519 |
Investment income and other income | 117 | -32 | 209 |
Total income | 2,683 | 2,147 | 2,475 |
Expenditure: | |||
Operating expenses | 1,852 | 1,786 | 1,667 |
Additions to the provision for loan losses | 169 | 139 | 225 |
Total expenditure | 2,022 | 1,924 | 1,892 |
Result before tax | 661 | 223 | 583 |
Taxation | 182 | 72 | 146 |
Net result IFRS-IASB | 479 | 151 | 437 |
Year ended 31 December 2023 compared to year ended 31 December 2022
The net result of Retail Belgium (including ING in Luxembourg) more than tripled to EUR 479 million in 2023
from EUR 151 million in 2022. The result before tax for Retail Belgium (which includes ING’s retail activities in
Luxembourg) jumped to EUR 661 million compared with EUR 223 million in 2022. The strong increase was
mainly due to growth in net interest income and the impact of one-off income items in the year before.
Total income rose by EUR 536 million, or 25%, to EUR 2,683 million. Net interest income increased by EUR
395 million, or 24%, as higher income from liabilities more than compensated for the impact of lower
margins on mortgages due to higher funding costs.
Net fee and commission income slipped 1.8% from a year earlier as higher fees on investment products,
reflecting an increase in assets under management, were offset by lower daily banking fees due to higher
fees paid to brokers. Investment and other income in 2022 had included an impact of EUR -247 million to
unwind a macro fair value hedge and a EUR 67 million gain from a legacy entity. Excluding the
aforementioned two items, investment and other income declined by EUR 31 million, mainly reflecting
lower Treasury-related income.
Customer lending (excluding Treasury) rose by EUR 1.4 billion, equally split over mortgages and other
lending. Customer deposits (excluding Treasury) declined by EUR 1.3 billion, mainly due to customers buying
retail bonds issued by the Belgian government and a shift to assets under management.
Operating expenses were EUR 1,852 million, up 3.7% on the year before. This included EUR 76 million of
incidental item costs related to restructuring and a further optimisation of the branch network, while 2022
had EUR 97 million of incidental item costs. Expenses excluding regulatory costs (which were EUR 33 million
lower year-on-year) and incidental items increased 8.4%. This was mainly due to the impact of automatic
salary indexation on staff expenses.
The net addition to the provision for loan losses amounted to EUR 169 million, or 18 basis points of average
customer lending, up from EUR 139 million in 2022. The increase year-on-year included the impact of model
updates for the mortgage and consumer lending portfolios in 2023.
Year ended 31 December 2022 compared to year ended 31 December 2021
The net result of Retail Belgium (including ING's retail operations in Luxembourg) declined by EUR 286
million to EUR 151 million in 2022 from EUR 437 million in 2021.
The result before tax of Retail Belgium declined to EUR 223 million compared with EUR 583 million in 2021.
The decline was almost fully due to an impact of EUR -247 million to unwind a macro fair value hedge and
EUR 97 million of incidental expenses in 2022.
Income fell by EUR 328 million to EUR 2,147 million from EUR 2,475 million in 2021. Net interest income was
4.5% lower at EUR 1,668 million, including a net TLTRO impact of EUR -29 million compared to a EUR 76
million benefit in 2021. Excluding TLTRO, interest result rose 1.6%, driven by higher liabilities income as
margins improved, partly offset by margin compression on lending products due to higher funding costs.
Net core lending (excluding Treasury) increased by EUR 3.6 billion in 2022, of which EUR 1.4 billion was in
mortgages, and EUR 2.2 billion in other lending. Net core deposits (excluding Treasury) were flat on 2021, as
an increase in savings and deposits was offset by a decline in current accounts. Net fee and commission
income decreased by EUR 8 million, or 1.5%, as lower fees on investment products were only partly
compensated by price increases for payment packages. Investment and other income dropped by EUR 241
million, due to the EUR -247 million impact of the hedge unwinding in 2022 and a EUR 25 million capital gain
on the sale of an associate in the prior year, partly offset by a EUR 67 million gain from a legacy entity in
2022.
Operating expenses increased by EUR 119 million and included EUR 97 million of incidental costs which were
mostly restructuring costs related to the optimisation of the branch network. Excluding these incidental
items, cost growth was limited to 1.3% as the impact of automatic salary indexation could largely be
compensated by FTE reductions and lower IT expenses.
The net addition to the provision for loan losses decreased to EUR 139 million, or 15 basis points of average
customer lending. In 2021, the net addition had been EUR 225 million, equivalent to 25 basis points. The
decline year-on-year was driven by lower risk costs in the mortgage and consumer lending portfolios.
ING Group Annual Report 2023 on Form 20-F 79
Retail Germany | |||
Retail Germany | |||
in EUR million | 2023 | 2022 | 2021 |
Income: | |||
Net interest income | 2,862 | 1,666 | 1,447 |
Net fee and commission income | 357 | 437 | 497 |
Investment income and other income | -67 | 69 | 65 |
Total income | 3,152 | 2,172 | 2,009 |
Expenditure: | |||
Operating expenses | 1,243 | 1,140 | 1,174 |
Additions to the provision for loan losses | 119 | 131 | 49 |
Total expenditure | 1,362 | 1,271 | 1,223 |
Result before tax | 1,790 | 901 | 786 |
Taxation | 631 | 202 | 252 |
Non-controlling interests | 0 | 3 | 4 |
Net result IFRS-IASB | 1,159 | 696 | 529 |
Year ended 31 December 2023 compared to year ended 31 December 2022
The net result of Retail Germany increased by EUR 463 million, or 67%, to EUR 1,159 million in 2023 from
EUR 696 million in 2022.
The result before tax for Retail Germany almost doubled to EUR 1,790 million compared with EUR 901
million in 2022, mainly on the back of a 45% increase in total income. This was driven by a 72% growth in
net interest income, supported by higher liability volumes at significantly improved margins, and by an
increase in interest income from treasury-related products and mortgages.
Net fee and commission income declined 18% to EUR 357 million. This reflected a decrease in fees from
mortgages (due to lower brokerage volumes) and from investment products (due to a lower number of
brokerage trades). Investment and other income decreased by EUR 136 million, largely due to lower
Treasury-related revenues.
Net core lending growth (which excludes Treasury) was EUR 1.7 billion, consisting of EUR 1.4 billion growth in
the residential mortgages portfolio and EUR 0.3 billion growth in other lending. Customer deposits (excluding
Treasury) increased by EUR 8.5 billion following successful promotional campaigns to attract new savings
and customers.
Operating expenses rose 9.0% to EUR 1,243 million. This included EUR 96 million of regulatory costs (up EUR
3 million from 2022) and EUR 20 million of incidental items for restructuring costs and staff allowances
(compared with EUR 10 million in 2022). Excluding regulatory costs and incidental items, cost growth was
8.7% due to higher staff expenses related to annual salary increases, and higher marketing expenses and
investments to support business growth.
Net additions to loan loss provisions declined to EUR 119 million (12 basis points of average customer
lending) and were primarily related to consumer lending.
Year ended 31 December 2022 compared to year ended 31 December 2021
The net result of Retail Germany (including ING's retail operations in Austria until the sale in December 2021)
increased by EUR 167 million, or 31.6%, to EUR 696 million in 2022 from EUR 529 million in 2021.
The result before tax increased 14.6% to EUR 901 million compared with EUR 786 million in 2021, driven by
higher income and lower expenses, partly offset by increased risk costs.
Total income rose 8.1% to EUR 2,172 million from EUR 2,009 million in 2021. Net interest income increased
15.1%, supported by significantly higher margins on liabilities. The increase was only partly offset by lending
margin pressure, a EUR 35 million lower net TLTRO impact (EUR -19 million in 2022 compared to a EUR 16
million benefit in 2021) and the impact of the discontinuation of ING’s Retail Banking activities in Austria in
the previous year. In 2022, net core lending growth (which excludes Treasury products and the Austrian run-
off portfolio as from the second quarter of 2021) was EUR 6.1 billion, almost entirely in residential
mortgages. Net core deposits rose by EUR 0.8 billion as a net outflow in the first half of the year was
followed by a strong inflow in the second half of the year. Net fee income declined by EUR 60 million, or
12.1%, mainly in investment products after a record-high level in 2021, partly compensated by higher fees
from daily banking. Investment and other income increased by EUR 4 million, as a EUR 26 million one-off
loss related to the transfer of our retail operations in Austria recorded in 2021 was partly offset by lower
Treasury-related revenues in 2022.
Operating expenses decreased by EUR 34 million, or 2.9%, to EUR 1,140 million in 2022, reflecting savings
following the discontinuation of the Austrian retail banking activities as well as lower regulatory costs due to
an adjustment of the deposit guarantee contributions in 2022. These decreases were partly offset by higher
staff costs and an increase in marketing expenses to support customer growth, as well as EUR 10 million of
incidental items for staff allowances and restructuring costs.
Net additions to loan loss provisions increased to EUR 131 million (13 basis points of average customer
lending) compared with only EUR 49 million (5 basis points) in 2021. Risk costs in 2022 were primarily
related to consumer lending.
ING Group Annual Report 2023 on Form 20-F 80
Retail Other | |||
Retail Other | |||
in EUR million | 2023 | 2022 | 2021 |
Income: | |||
Net interest income | 3,437 | 2,725 | 2,709 |
Net fee and commission income | 519 | 535 | 530 |
Investment income and other income | 277 | 377 | 202 |
Total income | 4,233 | 3,637 | 3,441 |
Expenditure: | |||
Operating expenses | 2,479 | 2,509 | 2,442 |
Additions to the provision for loan losses | 313 | 302 | 202 |
Total expenditure | 2,792 | 2,812 | 2,644 |
Result before tax | 1,441 | 825 | 797 |
Taxation | 359 | 254 | 209 |
Non-controlling interests | 174 | 47 | 98 |
Net result IFRS-IASB | 908 | 525 | 490 |
Year ended 31 December 2023 compared to year ended 31 December 2022
Retail Other consists of the Other Challengers & Growth Markets. The net result of Retail Other increased to
EUR 908 million in 2023 from EUR 525 million in 2022.
Following a change in governance, the Asian stakes (our investments in Bank of Beijing and TMBThanachart
Bank) are reported in Corporate Line as of 2023 (with a profit before tax of EUR 185 million), whereas
previously they were reported in Retail Other. Comparable data have been adjusted accordingly.
Retail Other’s result before tax increased 75% to EUR 1,441 million, from EUR 825 million in 2022, mainly
thanks to higher interest income and lower regulatory costs.
Total income rose 16% to EUR 4,233 million. Net interest income was up 26% to EUR 3,437 million,
supported by improved margins on liabilities in a higher interest rate environment, and because 2022 had
included a EUR -343 million impact from the introduction of the Polish mortgage moratorium. This more
than compensated negative currency impacts and tighter lending margins.
Net fee and commission income declined by EUR 16 million, or 3.0%, mainly due to lower fees on
investment products. This reflected subdued trading activity and the impact of ING’s exit from the French
retail market in 2022. Investment and other income in 2022 had included EUR 125 million income from the
transfer of our investment business in France to Boursorama (with another EUR 14 million recorded in 2023
for the final settlement) and EUR 38 million of proceeds from the sale of a non-performing loan portfolio in
Spain. Excluding these specific income items, investment and other income increased by EUR 49 million,
mainly due to higher Treasury-related income.
Net customer lending growth (adjusted for currency effects and Treasury) was EUR 4.3 billion in 2023, with
growth in all countries, but particularly in Australia. Net core deposits growth (also excluding currency
impacts and Treasury) was EUR 12.9 billion, primarily driven by net inflows in Spain and Poland.
Operating expenses in 2023 amounted to EUR 2,479 million. This included EUR 36 million of restructuring
costs and impairments, mainly for Poland. By comparison, 2022 had included EUR 51 million of incidental
item costs, mainly restructuring costs for France and the Philippines. Excluding these incidental items and
much lower regulatory costs (as 2022 had included a EUR 99 million contribution to the Institutional
Protection Scheme in Poland), expenses increased by EUR 102 million or 4.9%. This was mainly due to
inflationary pressure on staff expenses, partly offset by savings following the discontinuation of our retail
activities in France and the Philippines, and FX impacts in Türkiye.
The net addition to loan loss provisions amounted to EUR 313 million, or 29 basis points of average
customer lending, compared with EUR 302 million in 2022. Risk costs in 2023 were primarily attributable to
net additions in Poland and Spain, with Poland including EUR 67 million for adjustments to the expected
future cash flows of CHF-indexed mortgages.
Year ended 31 December 2022 compared to year ended 31 December 2021
Retail Other consists of the Other Challengers & Growth Markets. The net result of Retail Other increased to
EUR 525 million in 2022, from EUR 490 million in 2021.
Retail Other’s result before tax increased to EUR 825 million, from EUR 797 million in 2021, mainly due to
higher regulatory costs in Poland and higher risk costs.
Total income rose by EUR 196 million to EUR 3,637 million. Net interest income was up 0.6% to EUR 2,725
million, despite a EUR -343 million impact from new mortgage moratorium regulation imposed by the Polish
government. Excluding this impact, net interest income increased 13.3%. This increase mainly reflected
higher margins on liabilities, notably in Poland, Australia and Spain, following increases in central bank
interest rates. Interest income on lending products declined in most of the countries due to tighter lending
margins. Net customer lending (adjusted for currency effects, Treasury and the run-off portfolio in France as
from the second quarter of 2022) grew by EUR 3.2 billion in 2022, with growth in all countries. Net core
deposits growth (also adjusted for currency impacts and Treasury as well as the France run-off portfolio)
was EUR 5.2 billion, primarily driven by net inflows in Spain, Australia and Poland. Net fee and commission
income rose by EUR 5 million to EUR 535 million, supported by higher daily banking and insurance fees.
ING Group Annual Report 2023 on Form 20-F 81
These increases were largely offset by lower fees from investment products, reflecting low stock markets
and subdued trading activity and the impact of ING’s exit from the French retail market. Investment and
other income rose to EUR 377 million and included EUR 125 million income from the transfer of our
investment business in France. Excluding these exceptional income items, investment and other income
increased by EUR 50 million, mainly due to higher Treasury-related income and the proceeds from the sale
of a non-performing loan portfolio in Spain.
Operating expenses rose by EUR 67 million, or 2.7%, to EUR 2,509 million. In 2022, expenses included EUR 51
million of incidental items, mainly consisting of restructuring provisions related to the discontinuation of our
retail banking activities in France and the Philippines and the refocusing of our partnership for insurance
propositions. 2021 had included EUR 166 million of incidental costs, mainly consisting of restructuring
provisions and impairments related to ING’s decision to exit the retail banking markets in France and the
Czech Republic. Regulatory costs increased by EUR 100 million as 2022 contained a EUR 99 million
contribution to the new Institutional Protection Scheme in Poland. Excluding incidental items and regulatory
costs, expenses increased by EUR 82 million, primarily attributable to inflationary pressure across all
markets, investments in operational process improvements in Australia and EUR 21 million for a litigation
provision in Spain.
The net addition to loan loss provisions amounted to EUR 302 million, or 28 basis points of average
customer lending, in 2022. In the previous year this had been EUR 202 million, or 20 basis points. Risk costs
in 2022 were primarily attributable to net additions in Poland and Spain.
Wholesale Banking | |||
Wholesale Banking | |||
in EUR million | 2023 | 2022 | 2021 |
Income: | |||
Net interest income | 4,028 | 4,260 | 4,151 |
Net fee and commission income | 1,259 | 1,217 | 1,197 |
Investment income and other income | 1,771 | 849 | 568 |
Total income | 7,057 | 6,325 | 5,916 |
Expenditure: | |||
Operating expenses | 3,313 | 3,114 | 2,926 |
Additions to the provision for loan losses | -92 | 1,220 | 117 |
Total expenditure | 3,222 | 4,334 | 3,042 |
Result before tax | 3,836 | 1,991 | 2,874 |
Taxation | 900 | 581 | 703 |
Non-controlling interests | 61 | 52 | 26 |
Net result IFRS-EU | 2,875 | 1,358 | 2,144 |
Adjustment of the EU 'IAS 39 carve-out' | -3,147 | 8,451 | 1,174 |
Net result IFRS-IASB | -272 | 9,810 | 3,318 |
Year ended 31 December 2023 compared to year ended 31 December 2022
Without application of the EU ‘IAS 39 carve-out’, ING’s net result of Wholesale Banking turned to a loss of
EUR -272 million in 2023, compared with a gain of EUR 9,810 million in 2022. The adjustment of the EU ‘IAS
39 carve-out’, included in the net result, was EUR -3,147 million in 2023, compared with EUR 8,451 million in
2022, due to fair value changes on derivatives related to asset-liability-management activities for the
mortgage and savings portfolios in the Benelux, Germany, France, Spain, and Italy. These fair value changes
were mainly a result of changes in market interest rates. No hedge accounting is applied to these
derivatives under IFRS-IASB.
The IFRS-EU net result (when applying the EU ‘IAS 39 carve-out’) increased to EUR 2,875 million from EUR
1,358 million in 2022. In 2023, Wholesale Banking recorded strong results as higher income and significantly
lower risk costs led to a 93% increase in result before tax, to €3,836 million. In 2023, the Wholesale Banking
business was supported by strong capital management, which included steps to de-risk our portfolio and
improve our book quality, for instance via sales initiatives and ongoing management of underperforming
risk-weighted assets (RWAs).
Wholesale Banking posted double-digit income growth to come out at EUR 7,057 million, up 12% from EUR
6,325 million in 2022. This was mainly driven by a 30% increase in income for Daily Banking & Trade
ING Group Annual Report 2023 on Form 20-F 82
Finance, particularly in Payments & Cash Management, Bank Mendes Gans and Working Capital Solutions,
all of which benefited from the higher interest rate environment. And we managed to grow our income from
Trade Finance Services as we continued to support the activities and initiatives of our clients. Income from
Trade & Commodity Finance declined as volumes were under pressure, reflecting lower commodity prices
and lower economic activity.
In Lending we focused on further optimising our capital usage while decreasing risk-weights, prioritising own
origination of high-quality loans. Average asset volumes decreased, reflecting the weaker economic climate
and a continued reduction of our Russia-related exposure. This was more than compensated by a slightly
higher interest margins and a 5.3% growth in fees and commissions, lifting total income for Lending 2.1% to
EUR 3,224 million. Combined with a 7.0% reduction in risk-weighted assets, this led to a significant
improvement in income over average risk-weighted assets .
Financial Markets' income increased by 4.4% to EUR 1,280 million. They recorded strong trading results,
especially in Rates and Credits, as these desks benefited the most from market volatility and good client
flows. In addition, fee income was up by 55%, mainly reflecting higher Capital Markets issuance income.
Income from Treasury & Other increased by EUR 121 million to EUR 401 million, driven by higher income
from Corporate Investments and Corporate Finance. The prior year had included high mark-to-market gains
from credit default positions but also a EUR -41 million hedge accounting impact in Belgium and a net TLTRO
impact of EUR -51 million.
Total operating expenses increased 6.4% to EUR 3,313 million. Excluding lower regulatory costs and EUR 17
million of restructuring costs (versus EUR 10 million of incidental items recorded in 2022) expense growth
was 7.6%. This reflected the impact of collective labour agreements, higher performance-related payments
and strategic investments for business expansion.
In 2023, a net release of EUR 92 million from loan loss provisions was recorded compared to a net addition
of EUR 1,220 million in 2022. Risk costs in 2022 had been significantly impacted by the Russian invasion in
Ukraine, which then led to a net addition of EUR 533 million on our Russia-related exposure. In addition,
2022 had included an increase in Stage 3 individual risk costs, partly as a result of a more negative
macroeconomic outlook. In 2023, EUR 218 million of provisions for our Russia-related portfolio could be
released, mainly due to a reduction of our exposure. Moreover, Stage 3 risk costs were limited in 2023 as
additions for specific files in the real estate portfolio were largely offset by recoveries from previously
provisioned files and secondary market sales.
Year ended 31 December 2022 compared to year ended 31 December 2021
Without application of the EU 'IAS 39 carve-out', ING's net result of Wholesale Banking increased to EUR
9,810 million in 2022 compared with EUR 3,318 million in 2021. The adjustment of the EU ‘IAS 39 carve-out’,
included in the net result, was EUR 8,451 million in 2022, compared with EUR 1,174 million in 2021, due to
fair value changes on derivatives related to asset-liability-management activities for the mortgage and
savings portfolios in the Benelux, Germany, France, and Spain. These fair value changes were mainly a result
of changes in market interest rates. No hedge accounting is applied to these derivatives under IFRS-IASB.
The IFRS-EU net result (when applying the EU ‘IAS 39 carve-out’) declined to EUR 1,358 million from EUR
2,144 million in 2021. Wholesale Banking turned in a strong commercial performance. This was fully offset,
however, by a sharp increase in risk costs, partly due to the Russian invasion in the Ukraine and compared
with an exceptionally low level in 2021. Therefore the net result was 36.7% lower at EUR 1,358 million. The
result before tax decreased 30.7% to EUR 1,991 million from EUR 2,874 million in 2021.
Total income rose 6.9% to EUR 6,325 million in 2022 compared with EUR 5,916 million in 2021, primarily
reflecting income growth in Daily Banking & Trade Finance and Financial Markets. Net interest income
increased by EUR 109 million, or 2.6%, driven by Payments & Cash Management which benefited strongly
from higher interest rates. The increase was largely offset by a EUR 168 million lower net TLTRO impact
(which was EUR 20 million in 2022 compared with EUR 188 million in the previous year) and lower interest
income in Financial Markets. The net core lending book (adjusted for currency impacts and excluding
Treasury and the Lease run-off portfolio) grew by EUR 2.4 billion in 2022. Strong growth in Lending was
largely offset by a net outflow in Daily Banking & Trade Finance and in Financial Markets. Net core deposits
(excluding currency impacts and Treasury) increased by EUR 6.2 billion, primarily in Payments & Cash
Management. Net fee and commission income rose by EUR 20 million, or 1.7%, supported by strong fee
growth in Lending, which was largely offset by the impact of a lower deal flow in Global Capital Markets due
to adverse market conditions. Investment and other income surged by EUR 281 million, mainly driven by
higher trading results in Financial Markets, only partly offset by Treasury & Other which included a EUR -41
million hedge accounting impact in Belgium.
Operating expenses increased 6.4% to EUR 3,114 million from EUR 2,926 million in 2021. Expenses in 2022
included EUR 38 million higher regulatory costs and EUR 10 million of incidental items mainly related to
restructuring costs, while 2021 had included a EUR 44 million impairment on Payvision. Excluding these
incidental items and regulatory costs, expenses increased 7.0%, of which 2.8% was FX impacts, reflecting
the weakening of the euro relative to other currencies. The remaining increase was mainly attributable to
higher staff costs (due to CLA increases and indexation), partly mitigated by continued cost-efficiency
measures.
The addition to loan loss provisions was EUR 1,220 million, or 65 basis points of average customer lending,
while in 2021 risk costs had been exceptionally low at EUR 117 million, or 7 basis points of average customer
lending. Risk costs in 2022 were significantly impacted by the Russian invasion in Ukraine, which led to a net
addition of EUR 533 million on our Russia-related exposure. The remainder was mainly due to an increase in
Stage 3 individual risk costs, partly as a result of a more negative macroeconomic outlook.
ING Group Annual Report 2023 on Form 20-F 83
Lending income increased slightly to EUR 3,157 million. Net interest income declined by EUR 17 million fully
due to a EUR 57 million lower net TLTRO impact. Excluding TLTRO, interest result increased 1.6% as higher
average volumes more than compensated for lower interest margins. Net fee and commission income
increased by EUR 88 million or 19.3%, reflecting significantly higher fee income from several sectors.
Investment and other income declined by EUR 42 million, mainly due to negative fair value adjustments and
secondary sales discounts.
Income from Daily Banking & Trade Finance increased by EUR 352 million to EUR 1,662 million,
predominantly driven by Payments & Cash Management, which benefited strongly from higher interest
rates, and furthermore supported by Bank Mendes Gans.
Income for Financial Markets increased by EUR 122 million to EUR 1,226 million, supported by higher trading
results, especially in forex and money markets which benefited from volatility on the markets following
interest rate hikes, the strengthening of the US dollar and inflationary pressure. Commission income
declined due to a lower deal flow in Global Capital Markets, reflecting a slowdown in the market.
Income for Treasury & Other decreased by EUR 94 million due to a net TLTRO impact of EUR -51 million in
2022 (compared to a benefit of EUR 4 million in the previous year), a EUR -41 million hedge accounting
impact to unwind a macro fair value hedge in Belgium and a EUR 28 million gain on an investment in an
associate recorded in 2021. This was partly offset by mark-to-market gains from credit default positions in
2022.
Customer lending IFRS-IASB versus Customer lending IFRS-EU and Netcore lending growth by business line | |||||||||||||||||||||
Retail Banking Netherlands | Retail Banking Belgium | Retail Banking Germany | Retail Banking Other Retail | Wholesale Banking | Corporate Line | Total | |||||||||||||||
in EUR billion | 2023 | 2022 | change | 2023 | 2022 | change | 2023 | 2022 | change | 2023 | 2022 | change | 2023 | 2022 | change | 2023 | 2022 | change | 2023 | 2022 | change |
Customer lending IFRS-IASB (Loans and advances to customers excluding LLP) | 152,8 | 153,6 | -0,7 | 94,3 | 91,7 | 2,6 | 102,9 | 98,3 | 4,6 | 109,8 | 108,2 | 1,6 | 192,9 | 198,9 | -6,1 | 0,3 | 0,2 | 0,1 | 652,9 | 650,9 | 2,1 |
Remove impact of: EU 'IAS 39 carve out' | 4,9 | 9,4 | 4,9 | 9,4 | -4,5 | ||||||||||||||||
Customer lending IFRS-EU | 152,8 | 153,6 | -0,7 | 94,3 | 91,7 | 2,6 | 102,9 | 98,3 | 4,6 | 109,8 | 108,2 | 1,6 | 188,0 | 189,5 | -1,6 | 0,3 | 0,2 | 0,1 | 648,0 | 641,5 | 6,5 |
Exclude: FX impact | -0,3 | -2,6 | 0.0 | -2,9 | |||||||||||||||||
Exclude: Treasury, run-off portfolios and other | 3,0 | -1,2 | -2,9 | 3,0 | 3,0 | -0,1 | 4,9 | ||||||||||||||
Net core lending growth | 2,3 | 1,4 | 1,7 | 4,3 | -1,2 | 0.0 | 8,6 | ||||||||||||||
Customer deposits IFRS-IASB versus Customer deposits IFRS-EU and Netcore deposits growth by business line | |||||||||||||||||||||
Retail Banking Netherlands | Retail Banking Belgium | Retail Banking Germany | Retail Banking Other Retail | Wholesale Banking | Corporate Line | Total | |||||||||||||||
in EUR billion | 2023 | 2022 | change | 2023 | 2022 | change | 2023 | 2022 | change | 2023 | 2022 | change | 2023 | 2022 | change | 2023 | 2022 | change | 2023 | 2022 | change |
Customer deposits IFRS-IASB | 199,7 | 201,1 | -1,4 | 91,2 | 91,5 | -0,3 | 143,6 | 135,9 | 7,7 | 151,0 | 137,7 | 13,3 | 64,8 | 74,6 | -9,8 | 0.0 | 0.0 | 0.0 | 650,3 | 640,8 | 9,5 |
Remove impact of: EU 'IAS 39 carve out' | 0,0 | 0,0 | 0,0 | 0,0 | 0,0 | ||||||||||||||||
Customer deposits IFRS-EU | 199,7 | 201,1 | -1,4 | 91,2 | 91,5 | -0,3 | 143,6 | 135,9 | 7,7 | 151,0 | 137,7 | 13,3 | 64,8 | 74,5 | -9,8 | 0.0 | 0.0 | 0.0 | 650,3 | 640,8 | 9,5 |
Exclude: FX impact | 0,4 | -0,3 | 0.0 | 0,1 | |||||||||||||||||
Exclude: Treasury, run-off portfolios and other | -0,2 | -1,0 | 0,8 | -0,8 | 2,1 | 0.0 | 1,0 | ||||||||||||||
Net core deposits growth | -1,6 | -1,3 | 8,5 | 12,9 | -7,9 | 0.0 | 10,6 | ||||||||||||||
ING Group Annual Report 2023 on Form 20-F 84
Customer lending IFRS-IASB versus Customer lending IFRS-EU and Netcore lending growth by business line | |||||||||||||||||||||
Retail Banking Netherlands | Retail Banking Belgium | Retail Banking Germany | Retail Banking Other Retail | Wholesale Banking | Corporate Line | Total | |||||||||||||||
in EUR billion | 2022 | 2021 | change | 2022 | 2021 | change | 2022 | 2021 | change | 2022 | 2021 | change | 2022 | 2021 | change | 2022 | 2021 | change | 2022 | 2021 | change |
Customer lending IFRS-IASB (Loans and advances to customers excluding LLP) | 153,6 | 154,3 | -0,7 | 91,7 | 89,7 | 1,9 | 98,3 | 97,1 | 1,2 | 108,2 | 106,7 | 1,5 | 198,9 | 182,4 | 16,5 | 0,2 | 0,2 | 0,0 | 650,9 | 630,4 | 20,5 |
Remove impact of: EU 'IAS 39 carve out' | 9,4 | -2,4 | 9,4 | -2,4 | 11,8 | ||||||||||||||||
Customer lending IFRS-EU | 153,6 | 154,3 | -0,7 | 91,7 | 89,7 | 1,9 | 98,3 | 97,1 | 1,2 | 108,2 | 106,7 | 1,5 | 189,5 | 184,8 | 4,7 | 0,2 | 0,2 | 0,0 | 641,5 | 632,8 | 8,7 |
Exclude: FX impact | -1,3 | 3,9 | 0.0 | 2,5 | |||||||||||||||||
Exclude: Treasury and run-off portfolios | 3,7 | 1,7 | 4,9 | 2,9 | -6,2 | 0,0 | 6,9 | ||||||||||||||
Net core lending growth | 3,0 | 3,6 | 6,1 | 3,2 | 2,4 | 0.0 | 18,2 | ||||||||||||||
Customer deposits IFRS-IASB versus Customer deposits IFRS-EU and Netcore deposits growth by business line | |||||||||||||||||||||
Retail Banking Netherlands | Retail Banking Belgium | Retail Banking Germany | Retail Banking Other Retail | Wholesale Banking | Corporate Line | Total | |||||||||||||||
in EUR billion | 2022 | 2021 | change | 2022 | 2021 | change | 2022 | 2021 | change | 2022 | 2021 | change | 2022 | 2021 | change | 2022 | 2021 | change | 2022 | 2021 | change |
Customer deposits IFRS-IASB | 201,1 | 185,6 | 15,4 | 91,5 | 91,3 | 0,2 | 135,9 | 134,6 | 1,3 | 137,7 | 141,4 | -3,7 | 74,6 | 64,4 | 10,2 | 0.0 | 0.0 | 0.0 | 640,8 | 617,4 | 23,4 |
Remove impact of: EU 'IAS 39 carve out' | 0,0 | 0,1 | 0,0 | 0,1 | -0,1 | ||||||||||||||||
Customer deposits IFRS-EU | 201,1 | 185,6 | 15,4 | 91,5 | 91,3 | 0,2 | 135,9 | 134,6 | 1,3 | 137,7 | 141,4 | -3,7 | 74,5 | 64,3 | 10,3 | 0.0 | 0.0 | 0.0 | 640,8 | 617,3 | 23,5 |
Exclude: FX impact | -2,4 | 0,7 | 0.0 | -1,7 | |||||||||||||||||
Exclude: Treasury and run-off portfolios | -2,5 | -0,2 | -0,4 | 11,3 | -4,7 | 0.0 | 3,4 | ||||||||||||||
Net core deposits growth | 12,9 | 0,0 | 0,8 | 5,2 | 6,2 | 0.0 | 25,1 | ||||||||||||||
ING Group Annual Report 2023 on Form 20-F 85
B.Liquidity and capital resources
ING believes that its working capital is sufficient for its present requirements.
For information regarding our material short and long- term cash requirements from known contractual and
other obligations, see “Additional information – ING Group Risk Management section Funding and liquidity
risk” and Note 47 'Capital management' in the consolidated financial statements.
For information on legal or economic restrictions on the ability of subsidiaries to transfer funds to the
company in the form of cash dividends, loans or advances, see Note 19 'Equity' in the consolidated financial
statements.
For information on the maturity profile of borrowings and a further description of the borrowings, please see
Note 17 'Debt securities in issue', Note 18 'Subordinated loans' and Note 38 'Liabilities and off-balance sheet
commitments by maturity' in the consolidated financial statements.
For information on currency and interest rate structure, see “Additional information – ING Group Risk
Management section Market risk” and “Additional information – ING Group Risk Management section
Funding and liquidity risk”.
For information on the use of financial instruments for hedging purposes, please see Note 36 'Derivatives
and hedge accounting' in the consolidated financial statements.
ING Group Consolidated Cash Flows | |||
cash and cash equivalents | |||
in EUR million | 2023 | 2022 | 2021 |
Treasury bills and other eligible bills included in securities at AC | |||
Deposits from banks | - | - | - |
Loans and advances to banks | |||
Cash and balances with central banks | |||
Cash and cash equivalents at end of year |
Year ended 31 December 2023 compared to year ended 31 December 2022
Net cash flow from operating activities amounts to EUR -11,340 million for the year-end 2023, compared to
EUR -11,112 million for the year-end 2022. The lower in cash flow from operating activities of EUR -228
million in 2023 is explained by higher cash outflows for trading assets and liabilities (EUR -11,714 million),
loans and deposits to/from customers (EUR -3,063 million), taxation paid (EUR -1,227), lower cash inflows
from result before tax, after adjustment for non cash items (EUR -4,301 million) offset by higher cash inflows
from loans and deposits to/from banks (EUR 13,701 million) and non-trading derivatives (EUR 7,878 million).
Net cash flow from investing activities amounts to EUR -8,545 million for the year-end 2023 compared to
EUR -5,307 million in 2022. The net cash flow from investing activities decreased by EUR -3,238 million and is
explained by a net decrease from Financial assets at fair value through OCI of EUR -3,802 million and
increase from Securities at amortised costs of EUR 619 million.
Net cash flow from financing activities amounts to EUR 18,404 million in 2023, compared to EUR 4,649
million in 2022. The increase of EUR 13,755 million is explained by a net increase of EUR 15,999 million of
debt securities partly offset by a net decrease of EUR -562 million of Subordinated loans and higher dividend
and repurchases of treasury shares of EUR -1,688 million in 2023.
The operating, investing and financing activities described above result in a decrease of EUR -2,379 million in
cash and cash equivalents to EUR 93,012 million at year end 2023 including exchange rate effect on cash
and cash equivalents of EUR -898 million.
Year ended 31 December 2022 compared to year ended 31 December 2021
Net cash flow from operating activities amounts to EUR -11,112 million for the year-end 2022, compared to
EUR -14,943 million for the year-end 2021. The increase in cash flow from operating activities of EUR 3,830
million in 2022 is explained by higher cash inflows from results before tax (EUR 8,973 million), trading
liabilities (EUR 17,571 million), customer deposits (EUR 14,717 million) and lower cash inflows from deposits
from banks (EUR -35,414 million).
Net cash flow from investing activities amounts to EUR -5,307 million for the year-end 2022 compared to
EUR 6,220 million in 2022. The net cash flow from investing activities decreased by EUR 11,527 million and is
explained by a net decrease from Financial assets at fair value through OCI of EUR 8,842 million and from
Securities at amortised costs of EUR 2,696 million.
Net cash flow from financing activities amounts to EUR 4,649 million in 2022, compared to EUR 5,387 million
in 2021. The decrease of EUR 738 million is explained by a net increase of EUR 900 million of debt securities
offset by a net decrease of EUR 821 million of Subordinated loans and higher dividend and repurchases of
treasury shares of EUR 821 million in 2022.
The operating, investing and financing activities described above result in a decrease of EUR -12,274 million
in cash and cash equivalents to EUR 95,391 million at year end 2022 including exchange rate effect on cash
and cash equivalents of EUR -504 million.
ING Group Annual Report 2023 on Form 20-F 86
C. Research and development, patents and licenses, etc.
Not applicable.
D. Trend information
For information regarding trend information, see Item 5.A of this Form 20-F.
E. Critical Accounting Estimates
Reference is made to Note 1 'Basis of preparation and material accounting policy information' to the
consolidated financial statements for detailed information on Critical Accounting Estimates.
ING Group Annual Report 2023 on Form 20-F 87
Item 6. Directors, Senior Management and Employees
A.Directors and senior management
Executive Board
Roles and responsibilities
The Executive Board is entrusted with the management of ING Group and its subsidiaries and is responsible
for the continuity and long-term value creation of ING. This includes the day-to-day management of the
business and the setting of the strategy of ING, which responsibility is vested in the members of the
Executive Board collectively. The organisation, main roles and responsibilities of the Executive Board are set
out in the Management Board Charter, which is available on ing.com.
The Executive Board performs its activities under the supervision of the Supervisory Board. The Articles of
Association, the Management Board Charter and the Supervisory Board Charter, which are available on
ing.com, outline which resolutions of the Executive Board are subject to approval by the Supervisory Board.
ING Group indemnifies the members of the Executive Board against direct financial losses in connection with
claims from third parties filed, or threatened to be filed, against them by virtue of their service as a member
of the Executive Board, as far as permitted by law, on the conditions laid down in the Articles of Association
and their commission contract. ING Group has taken out liability insurance for the members of the Executive
Board.
Composition and diversity
ING Group aims to have an adequate and balanced composition of its Executive Board, with a diverse
selection of persons with knowledge, skills and executive experience, preferably gained in the banking
sector, experience in corporate governance of large stock-listed companies and experience in the political
and social environment in which such companies operate. In the selection of the members of the Executive
Board, ING strives for a balance in nationality, gender, and educational and work background. In addition,
there should be a balance of experience and affinity with the nature and culture of the business of ING. We
believe that diverse leadership at the level of the Executive Board fosters a diversity of views and
experiences and facilitates independent opinions and sound decision-making, which has a positive impact
on ING's business. The Gender Diversity Act requires ING to set appropriate and ambitious targets for gender
diversity in its Executive Board and senior management. In addition, there should be a balance of experience
and affinity with the nature and culture of the business of ING. Factors such as nationality, gender, age and
education are also taken into account for the composition of the Executive Board. ING applies a gender
diversity target of at least 30 percent to the Executive Board, which was met over 2023. Also, the Executive
Board had an international composition in 2023, with one board member of Dutch nationality and two
board members with other nationalities.
The Supervisory Board is responsible for selecting and nominating candidates to be appointed or
reappointed to the Executive Board by the General Meeting, among others based on the Executive Board
profile, which is available on ing.com. The Supervisory Board regularly assesses the composition and
functioning of the Executive Board.
Part of this process are the following two topics:
1.Bench strength and succession planning for Executive Board positions are continuous attention points.
Potential internal candidates for such roles may be complemented with potential talent from outside
ING.
2.A long-term view is taken on the composition of the Executive Board, which, for example, means that
steps are taken to improve the development path of women within ING and the appointment of women
in senior positions throughout the organisation, in line with ING's D&I policy.
See more information on diversity, including on gender diversity in senior management, in the paragraphs
on Unlocking our people's full potential in 'How we are making the difference'. For more information on the
composition of the Executive Board, see 'Our leadership'.
ING Group Annual Report 2023 on Form 20-F 88
Appointment, suspension and dismissal
Members and proposed members of the Executive Board are appointed, suspended and dismissed by the
General Meeting. Candidates for appointment to the Executive Board are assessed by the Dutch Central
Bank (DNB) and the European Central Bank (ECB) for suitability and integrity and must continue to meet
these criteria while in function.
For the appointment of Executive Board members, the Supervisory Board may draw up a binding list of
candidates, which may be rendered non-binding by the General Meeting. A resolution of the General
Meeting to render this list non-binding, or to suspend or dismiss Executive Board members without this
being proposed by the Supervisory Board, requires an absolute majority of the votes cast. Additionally, this
majority must represent more than half of the issued share capital. This quorum requirement cannot be
waived in a second general meeting. This ensures that such significant shareholder proposals cannot be
adopted in a general meeting with a low attendance rate and can only be adopted with substantial support
of ING Group’s shareholders.
Remuneration and share ownership
Details of the remuneration of members of the Executive Board, including shares granted to them, are set
out in the ‘Remuneration report’.
Members of the Executive Board are permitted to hold shares in the share capital of ING Group for long-term
investment purposes. Transactions by members of the Executive Board in these shares need to comply with
the ING regulations for insiders, which are available on ing.com.
Relevant positions pursuant to CRD IV / conflicting interests
Members of the Executive Board may hold other positions outside ING. No member of the Executive Board
had corporate directorships relevant under Capital Requirements Directive 4 (CRD IV) outside ING throughout
2023.
Members of the Executive Board are to report any conflict of interest (including potential conflicts of
interest) to the chairperson of the Executive Board and the other Executive Board members, and shall
provide all relevant information. The Executive Board, excluding the member concerned, decides whether a
conflict of interest exists.
In case of a conflict of interest, the relevant member of the Executive Board abstains from discussions and
decision-making on the topic or the transaction in relation to which they have a conflict of interest with ING
Group.
Transactions involving actual or potential conflicts of interest
There were no transactions reported in 2023 in which there were conflicts of interest with Executive Board
members that are of material significance to ING Group and/or to the relevant board members.
If a member of the Executive Board obtains financial products and services, other than loans, which are
provided by subsidiaries of ING Group in the ordinary course of business on terms that apply to employees,
this is not considered a significant conflict of interest and is therefore not reported. Banking and financial
products in which the granting of credit is of a secondary nature, e.g. credit cards and overdrafts in current
account, are not considered a loan for this purpose and are therefore not disclosed in the ‘Remuneration
report’. For an overview of loans granted to members of the Executive Board, please see ‘Remuneration
report’.
ING Group Annual Report 2023 on Form 20-F 89
Information on the members of the Executive Board (and Management Board Banking) on 31 December 2023

ING Group Annual Report 2023 on Form 20-F 90
Supervisory Board
Roles and responsibilities
The Supervisory Board supervises and advises the Executive Board and oversees the activities of ING and the
business connected with it. The responsibility for supervising and advising the Executive Board is vested in
the members of the Supervisory Board collectively. The organisation, powers and modus operandi of the
Supervisory Board are set out in the Charter of the Supervisory Board, available on ing.com.
In performing their duties, members of the Supervisory Board are required to:
•Be guided by the interests of ING and the business connected with it, thereby carefully balancing the
interests of all stakeholders of ING and in this consideration give paramount importance to the
customer’s interest, as set out in the Dutch Banker’s Oath;
•Foster a culture focused on sustainable long-term value creation, financial and non-financial risk
awareness, compliance with ING’s risk appetite, responsible and ethical behaviour, and stimulate
openness and accountability within ING and its subsidiaries;
•Act without mandate and independent of any interest in the business of ING;
•Ensure that the Supervisory Board functions effectively.
The Articles of Association, the Management Board Charter and the Supervisory Board Charter outline which
resolutions of the Executive Board are subject to approval by the Supervisory Board.
In accordance with the Articles of Association, ING Group indemnifies the members of the Supervisory Board
as far as legally permitted against direct financial losses in connection with claims from third parties filed or
threatened to be filed against them by virtue of their service as a member of the Supervisory Board.
Composition and diversity
ING Group aims to have an adequate and balanced composition of its Supervisory Board, with a mix of
persons with knowledge, skills and executive experience, preferably gained in the banking sector, experience
in corporate governance of large stock-listed companies, and experience in the political and social
environment in which such companies operate. In the selection of the members of the Supervisory Board,
ING strives for a balance in nationality, gender, and educational and work background. In addition, there
should be a balance of experience and affinity with the nature and culture of the business of ING. We believe
that diverse leadership at the level of the Supervisory Board fosters a diversity of views and experiences and
facilitates independent opinions and sound decision-making, which has a positive impact on ING's business.
According to the Gender Diversity Act, ING is required to comply with a gender-diversity quota of one third
male and one third female for its Supervisory Board. In 2023, the Supervisory Board consisted of two third
male and one third female. We believe the Supervisory Board is also well balanced in terms of other relevant
diversity aspects. Also, the Supervisory Board had an international composition in 2023, with five persons of
Dutch nationality and four persons with other nationalities.
The Supervisory Board is responsible for selecting and nominating candidates for appointment or
reappointment to the Supervisory Board, among others based on the Supervisory Board profile, which is
available on ing.com. The Supervisory Board regularly assesses its composition.
ING believes that former members of the Executive Board can make a valuable contribution to the
Supervisory Board. Therefore, also taking into account the size of the Supervisory Board and ING’s wide
range of activities, they may become members of the Supervisory Board of ING Group, but not in the
position of chairperson or vice-chairperson. Former Executive Board members must wait at least one year
before becoming eligible for appointment to the Supervisory Board.
After a former member of the Executive Board has been appointed to the Supervisory Board, this member
may also be appointed to one of the Supervisory Board’s committees. Appointment to the Audit Committee
is only possible if the individual in question resigned from the Executive Board at least three years prior to
such appointment.
Appointment, suspension and dismissal
Members of the Supervisory Board are appointed, suspended and dismissed by the General Meeting.
For the appointment of Supervisory Board members, the Supervisory Board may draw up a binding list of
candidates, which may be rendered non-binding by the General Meeting. A resolution of the General
Meeting to render this list non-binding, or to suspend or dismiss Supervisory Board members without this
being proposed by the Supervisory Board, requires an absolute majority of the votes cast. Additionally, this
majority must represent more than half of the issued share capital. The quorum requirement cannot be
waived in a second general meeting. This ensures that such significant proposals of shareholders cannot be
adopted in a general meeting with a low attendance rate and can only be adopted with substantial support
of ING Group’s shareholders.
Candidates for appointment to the Supervisory Board are assessed by DNB and ECB for suitability and
reliability and must continue to meet these criteria while in function.
Term of appointment of the Supervisory Board members
As a general rule, Supervisory Board members step down from the Supervisory Board after the fourth
anniversary of their last appointment or reappointment. They are eligible for reappointment in the fourth
year after their initial appointment and, with explanation, also in the eighth and tenth years.
ING Group Annual Report 2023 on Form 20-F 91
The Supervisory Board may deviate from this general rule under special circumstances and with
explanation, for instance to maintain a balanced composition of the Supervisory Board and/or to preserve
valuable expertise and experience. The retirement schedule is available on ing.com.
Relevant positions pursuant to CRD IV / conflicting interests
Members of the Supervisory Board may hold other positions outside ING, including directorships, either paid
or unpaid. CRD IV restricts the total number of supervisory board positions or non-executive directorships
with predominantly commercial organisations that may be held by a Supervisory Board member to four, or
to two, if the Supervisory Board member also has an executive board position. The ECB may, under special
circumstances, permit a Supervisory Board member to fulfil an additional supervisory board position or non-
executive directorship. Positions with, inter alia, subsidiaries or qualified holdings are not taken into account
in the application of these restrictions. Such positions may not conflict with the interests of ING Group. It is
the responsibility of the individual member of the Supervisory Board and the Supervisory Board collectively
to ensure that the directorship duties are performed properly and are not affected by any other positions
that the individual may hold outside ING Group.
Members of the Supervisory Board are to report any conflict of interest (including potential conflicts of
interest) to the chairperson of the Supervisory Board (or, in the case of the chairperson, to the vice-
chairperson) and to the other Supervisory Board members, and shall provide all relevant information. The
Supervisory Board, excluding the member concerned, decides whether a conflict of interest exists.
In case of a conflict of interest, the relevant member of the Supervisory Board abstains from discussions and
decision-making on the topic or the transaction in relation to which they a conflict of interest with ING
Group.
Transactions involving actual or potential conflicts of interest
There were no transactions reported in 2023 in which there were conflicts of interest with Supervisory Board
members that are of material significance to ING Group and/or to the relevant board members.
If a member of the Supervisory Board obtains financial products and services, other than loans, which are
provided by ING Group subsidiaries in the ordinary course of business on terms that apply to employees, this
is not considered to be a material conflicting interest. Banking and financial products in which the granting
of credit is of a secondary nature, e.g. credit cards and overdrafts in current account are not considered a
loan for this purpose and are therefore not disclosed in the ‘Remuneration report’. For an overview of loans
granted to members of the Supervisory Board, see the ‘Remuneration report’.
Independence
All Supervisory Board members, with the exception of no more than one person, should qualify as
independent as defined in the best practice provision 2.1.8 of the Dutch Corporate Governance Code. The
members of the Supervisory Board are therefore requested to assess annually whether or not they are
independent as set out in the Dutch Corporate Governance Code and to confirm this in writing. On this basis,
the Supervisory Board confirms that all members of the Supervisory Board are to be regarded as
independent on 31 December 2023. On this date all members of the Supervisory Board were also to be
regarded as independent within the meaning of the NYSE listing standards.
Committees of the Supervisory Board
On 31 December 2023, the Supervisory Board had five committees: the Risk Committee, the Audit
Committee, the Nomination & Corporate Governance Committee, the Remuneration Committee, and the
ESG Committee (ad hoc).
Separate charters have been drawn up for the Risk Committee, the Audit Committee, the Nomination &
Corporate Governance Committee, and the Remuneration Committee. Terms of reference have been drawn
up for the ESG Committee. These charters and terms of reference are available on ing.com.
Remuneration and share ownership
Remuneration of the members of the Supervisory Board is determined by the General Meeting and does not
depend on the results of ING Group. Members of the Supervisory Board are permitted to hold shares in the
share capital of ING Group for long-term investment purposes. Details are given in the ‘Remuneration
report’. Transactions by members of the Supervisory Board in these shares need to comply with the ING
insider regulations, which are available on ing.com.
ING Group Annual Report 2023 on Form 20-F 92
Information on the members of the Supervisory Board on 31 December 2023

ING Group Annual Report 2023 on Form 20-F 93
B. Compensation
Remuneration report
While 2023 was a challenging year in many ways, ING fared remarkably
well, delivering stronger financial results and gaining more primary
customers than ever before. This is all the more notable given the
geopolitical and economic shocks and ongoing regional conflicts.
Needless to say, this affects many of our clients and the societies in
which we operate. Notwithstanding this adversity, we continued to
successfully execute our strategy, deliver exceptional results, and make
significant progress in various target areas.
Our view on remuneration
ING's remuneration approach is designed to enable us to attract, motivate and retain leaders with the
ability, experience, skills, values and behaviours to fulfil our role as a global bank, sustainably executing our
strategy while upholding our values and stakeholder interests. However, following the Dutch Banking Code,
total direct compensation of the Executive Board is below the market median of a peer group of comparable
companies.
In line with the remuneration principles that apply to all ING staff, the remuneration policies for the
Executive Board and Supervisory Board are designed to ensure that ING offers well-balanced remuneration
within ING's risk appetite and in fulfilment of our statutory obligations.
Stakeholder engagement
We see stakeholder engagement as a key element in the formulation of our remuneration policies.
At our 2020 AGM, 94.4 percent were in favour of our current Executive Board policy and 98.6 percent were in
favour of our current Supervisory Board policy. As part of the renewal process, the Supervisory Board
conducted a detailed review of these policies in 2023 to assess their continuing suitability.
The process entailed a comprehensive stakeholder engagement process with regulators, our shareholders,
customers, employees (Central Works Council), and society at large to take their views on the remuneration
policies into account. As always, we found engaging with our stakeholders to be very valuable and were
grateful for the level of feedback and support we received.
Noting the strong support from shareholders for our current policies, and on that basis their support of the
execution of our strategy within our regulatory framework, we are proposing that the fundamentals of the
current policies remain in place. There will, however, be limited changes proposed to our peer group
composition, enhanced transparency, and minor flexibility on items to execute. We will seek shareholder
approval for the proposed updated Executive Board and Supervisory Board remuneration policies at the
2024 AGM. The main themes mentioned by most stakeholders during the Executive Board remuneration
policy consultation and our responses were:
One of the key feedback items from stakeholders was the need for enhanced transparency around how
environmental, social and governance (ESG) matters are integrated into the Executive Board remuneration
policy, especially in the context of rapidly evolving developments for regulators and shareholders. ING's
selection of ESG measures is designed to support the delivery of our ESG objectives and align them to
regulatory expectations, both in terms of current and upcoming developments. We will continue to review
and expand on our sustainability targets for scope 3 emissions. We will also take a more data-driven
approach, where each year we will disclose retrospectively enhanced substantiation of non-financial
performance on a quantitative and qualitative basis for the Executive Board members. In addition, we will
continue to refine, adjust and enhance the robustness of our target-setting and performance assessment
approach for the purposes of determining variable remuneration for members of the Executive Board.
Stakeholders have also suggested that ING should disclose more quantifiable non-financial metrics on an
ex-ante, or at least, an ex-post basis. ING has both quantifiable and qualitative targets for non-financial
measures, which support a balanced performance assessment against these measures. ING’s objective is to
continue to have more quantifiable non-financial performance targets, which are always disclosed for the
Executive Board members in the relevant remuneration report on an ex-post basis. There are commercial
sensitivities that prohibit ING from disclosing the targets on an ex-ante basis.
Please note that the Supervisory Board received feedback from various stakeholders who are increasingly
concerned that, over the last few years, the actual total compensation of our Executive Board members has
ING Group Annual Report 2023 on Form 20-F 94
fallen behind our desired pay policy stance and positioning against our peer group. This is supported by the
benchmark results for comparable roles in organisations that are similar in size, operating in similar
geographies, and with whom we compete for talent. We will keep this issue of appropriate market pay
positioning for our Executive Board members under review.
Stakeholder feedback on the proposed policy changes for the Supervisory Board was positive, including on
the introduction of an annual indexation mechanism for Supervisory Board fees to enable more regular
adjustments in line with the wider workforce salary increase percentage. The Supervisory Board does not
directly influence the annual indexation factor, in line with the feedback we received from stakeholders. The
wider workforce salary increase percentage as an indexation factor aligns well with ING's profile of a leading
European universal bank with global activities and will bring the fee levels more in line with peers and with
those sufficient to attract and retain qualified (international) Supervisory Board members.
On behalf of the Supervisory Board, I would like to thank our stakeholders for their engagement and
feedback.
This report
This Remuneration report reflects the remuneration for the Supervisory Board and Executive Board
members. In preparing this report, we took notice of the draft (non-binding) 'Guidelines on the standardised
presentation of the remuneration report' from the European Commission (EC) as published in September
2022.
With respect to reporting on remuneration, our ambition is to continue to be at the forefront, providing
more information than is mandatory. For example, under the 2023 Executive Board remuneration section of
this report we have included the prescribed tables from the draft (non-binding) 'Guidelines on the
standardised presentation of the remuneration report' from the EC. We describe the key stakeholder
engagement process that we followed as part of the proposed updated Executive Board and Supervisory
Board remuneration policies. We now have a new visual on the total direct compensation position in relation
to the market median, as well as an improved visual for deferred shares.
A further example of enhanced transparency is our 'gender pay gap analysis', which can be found in the
'Social' section of the ING Annual Report, part of our new ESG chapter. In 2022, we conducted a global
analysis of gender pay for the first time, to provide a basis to structurally address any gaps using data from
2021. We repeated this analysis in 2023 with data from 2022, and expect to complete an analysis of 2023
and 2024, which will then be published in the 2024 Annual Report.
In addition to the broader benefits of a more gender-diverse senior management team – for our business,
employees, and customers, increasing the representation of women in senior management is foundational
to addressing our gender pay gap.
ING follows the guidelines laid out by the European Banking Authority, which collects benchmarking data on
the gender pay gap (i.e. the difference between the average remuneration of men and women) from banks
under its supervision, including ING, over the financial year 2023. ING already fulfils this requirement, having
begun collecting data on the gender pay globally in 2022 and publishing its unadjusted and adjusted global
gender pay gap in this report. As well as conducting a gender pay gap analysis globally, in 2023 ING also
carried out an analysis on a country and entity level, with the aim of being even more transparent.
I believe transparency on this subject is an important step in helping ING to advance diversity, inclusion and
belonging. We do realise that there is more to be done, especially on the underrepresentation of women in
leadership positions. However, some of the steps we have taken include increasing our target to at least 35
percent women in senior management by 2028, and introducing an additional target of at least 30 percent
women in the leadership pipeline by 2025. While these targets are not an end-goal in themselves, they are
important milestones to achieving true gender equity at the top. Our bank-wide gender equity action plan,
based on reliable data and proven solutions, is aimed at making sustainable and structural improvements.
Performance year 2023
ING has delivered strong results in 2023. We were able to continue to successfully execute our strategy by
increasing the number of customers, working to provide them with a superior customer experience, further
improving our digital offerings, and helping our clients in their sustainable transitions.
Our full-year 2023 net result was €7,287 million (up from €3,674 million in 2022) with a full-year return on
equity (ROE) of 14.8 percent (up from 7.2 percent in 2022). Both Retail and Wholesale Banking have
contributed positively. This result was driven by higher net interest income and our continued low risk costs,
reflecting our strong asset quality.
Retail Banking has grown the customer base by 750,000 primary customers to reach a total of 15.3 million,
with Germany, Spain and the Netherlands in particular contributing to this growth. It is clear our customers
value our services, as evidenced by our number one position in net promoter score (NPS) in five of our 10
retail markets. Wholesale Banking achieved an all-time high NPS of 72, reflecting the high satisfaction of our
clients across the globe.
Putting sustainability at the heart of what we do is one of the two key pillars of our strategy. We are proud
of the progress we are making, and how we are using our financing to contribute to the transition of our
customers. We continue to facilitate the transition to a low-carbon economy and support our clients in their
transitions.
In October, we published our annual Climate Report, which explains how our financing impacts climate
change, as well as how climate change impacts our business. It includes our progress on steering the 10
ING Group Annual Report 2023 on Form 20-F 95
most carbon-intensive sectors in our loan portfolio towards global climate goals. As you know, our Terra
approach is to engage with clients to help them make the transition, by helping them to assess climate risks
and take action to mitigate them.
We are currently on track to achieve our medium-term 2030 sector decarbonisation targets in four of our 10
Terra (sub)sectors. However, our commercial real estate and residential real estate (mortgages) portfolios in
the Netherlands are 'off track' compared to their respective sector alignment pathways. As we have just
expanded our commercial real-estate targets to also cover our Wholesale Banking book, and our oil & gas to
mid- and downstream, we will present our progress against this target in future reports.
Our Terra approach is also reflected in the targets of the Executive Board Members for 2024, to support the
transition of the most carbon-intensive sectors in Wholesale Banking, which are power generation, oil & gas,
cement, steel, automotive, aviation, shipping and commercial real estate, towards a better carbon
performance, in line with our 2030 decarbonisation targets. We have also reinforced our commitments to
support the energy transition by stepping up our renewable energy financing efforts.
The Supervisory Board has agreed that the Executive Board's performance was satisfactory in 2023. Based
on a thorough and balanced assessment of the performance of each Executive Board member against their
objectives, ING's results, their behaviour, and risk and compliance matters, the Supervisory Board decided to
award the following variable remuneration: 17 percent of the maximum 20 percent to the chief executive
officer; 18 percent of the maximum 20 percent to the chief financial officer; and 17 percent of the maximum
20 percent to the chief risk officer.
Under the Executive Board remuneration policy, the Supervisory Board is annually required to consider base
salary increases for members of the Executive Board, taking into account a range of factors. These include
salary increases of other employees within ING, the increase of general price indices, and market
competitiveness. In consideration of these factors, and given that no base salary increases were awarded to
members of the Executive Board in the last three years, the Supervisory Board has determined that an
increase is appropriate, awarding a salary increase of 4.0 percent to each of the Executive Board members.
For all other eligible staff, variable remuneration can be discretionary or collective and is awarded based on
criteria for the overall group, business line, and individual performance. At least half of these targets must
be non-financial. A considerable part of the variable remuneration is awarded based on collective
agreements. In 2023, the total amount awarded was €514.9 million, reflecting an 11.6 percent increase
against the total target variable remuneration pool.
In closing, I would like to thank all ING employees for their continuing support and dedication to ING, our
customers, and other stakeholders. It has not always been easy, yet they remain the power behind ING's
purpose.


Herna Verhagen
Chairperson of the Supervisory Board Remuneration Committee
ING Group Annual Report 2023 on Form 20-F 96
Remuneration report Executive Board
and Supervisory Board
About this report
This Remuneration report is based on the remuneration policies for the
Executive Board and Supervisory Board. This section of the report is the
Remuneration report as referred to in the Dutch Act implementing the
Shareholder Rights Directive II (SRD II). It will be presented to
shareholders at the 2024 AGM for an advisory vote. An explanation of
how the results of this vote are taken into account will be included in
the 2024 Remuneration report.
This Remuneration report includes under section 2023 Executive Board remuneration, further alignment
with prescribed tables from the draft (non-binding) ‘Guidelines on the standardised presentation of the
remuneration report’ from the European Commission. In addition, we describe the process of key
stakeholder engagement followed as part of the proposed updated Executive Board and Supervisory Board
remuneration policies.
2023 AGM
The 2022 Remuneration report was presented for an advisory vote at the AGM held on 24 April 2023
(hereafter called the 2023 AGM). The outcome was an advisory vote of 92.96 percent in favour. A number of
shareholders made comments with regard to the remuneration of the CEO which was comparatively
modest. In this year's report, the AGM's feedback is reflected by providing more transparency on addressing
ING's and the EB's target-setting, with more attention for the percentual increased key focus areas like
impact of customer satisfaction, sustainability and social impact.
We recognise that remuneration is an important and sensitive topic and that viewpoints on the topic may
vary for different stakeholder groups. The Supervisory Board is fully committed to ensuring that our
approach to remuneration achieves a balance of interests across different stakeholders. Stakeholder
engagement is a key element in the formulation of our remuneration policies. We have regular dialogues
with our stakeholders and in 2023 we performed an extensive round of dialogues specifically in preparation
for the renewal of our remuneration policies ahead of the 2024 AGM. The Supervisory Board will continue to
foster a transparent dialogue on remuneration and future policy amendments.
Board changes and business events in 2023
Tanate Phutrakul was reappointed as a member of the Executive Board at the 2023 AGM for another four-
year term lasting until the end of the 2027 AGM.
On 2 February 2023, it was announced that Hans Wijers had expressed the intention to hand over his duties
as chairperson and retire from the Supervisory Board for personal reasons. Prior to this, Mariana Gheorghe
had also expressed her intention to retire from the Supervisory Board at the end of the 2023 AGM. During
the 2023 AGM, shareholders approved the appointment of Karl Guha upon the departure of Hans Wijers as
the new chairperson of the Supervisory Board, and Alexandra Reich as a new member to the Supervisory
Board for a four-year term. In addition, shareholders approved the reappointment of Herna Verhagen and
Mike Rees to the Supervisory Board for another four-year term.
Main decisions on the remuneration of the Executive Board and
Supervisory Board for 2024
The following decisions were taken in relation to remuneration for 2024:
•Updates to the Executive Board and Supervisory Board remuneration policies will be proposed;
•Base salary of the Executive Board members from 1 January 2024 will be increased by 4.0 percent, see
'2024 Executive Board remuneration';
•The Supervisory Board fees will be indexed with an increase at 5.4 percent for 2024, subject to a positive
binding vote by the AGM on 22 April 2024 on the proposed updated Supervisory Board remuneration
policy, see '2024 Supervisory Board remuneration'.
ING Group Annual Report 2023 on Form 20-F 97
2023 Executive Board remuneration at a glance
Please see '2023 Executive Board performance evaluation' for more details on the Executive Board members' performance and variable remuneration outcomes
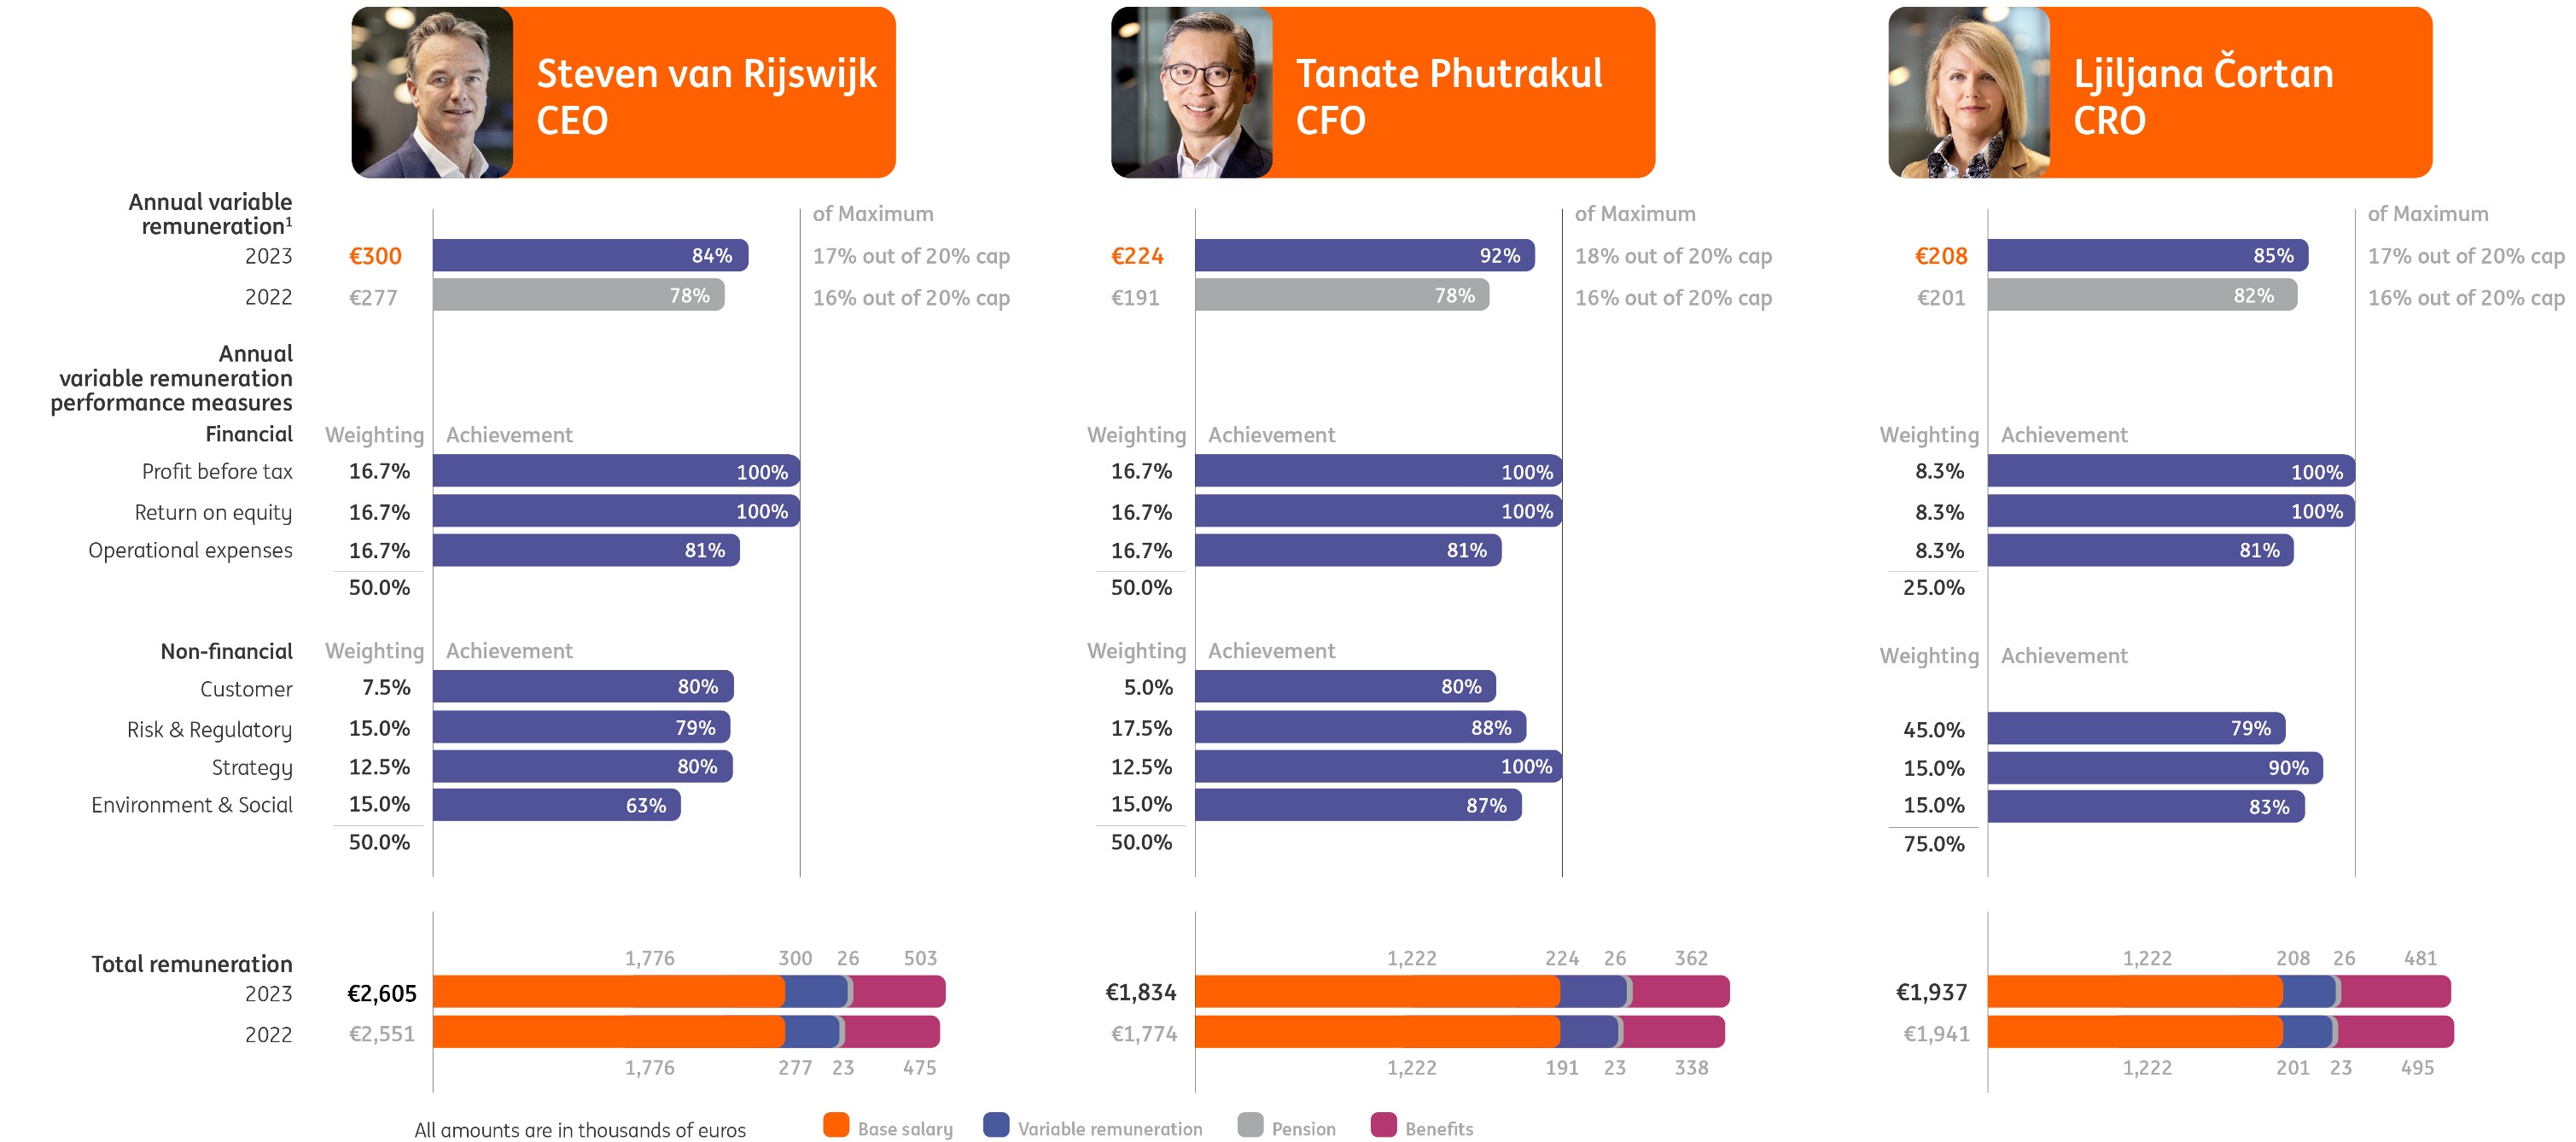
ING Group Annual Report 2023 on Form 20-F 98
Remuneration Executive Board
Executive Board remuneration policy
The Executive Board remuneration policy complies with applicable laws and regulations and is in line with
the remuneration principles that apply to all ING employees.
The Executive Board remuneration policy, which was adopted by shareholders during the 2020 AGM, is
disclosed in full on ing.com under the section ‘Remuneration’. During 2023, there was no deviation from the
procedure for the implementation of the Executive Board remuneration policy. In line with this policy, the
remuneration of the Executive Board members is designed to attract, motivate and retain leaders. Retention
is an important goal since this contributes to long-term performance. In addition, delivery of both financial
and non-financial KPIs, including ESG performance targets, contributes towards sustainable long-term value
creation for stakeholders.
SRD II requires listed companies to submit their remuneration policies to the AGM at least once every four
years. Should policy changes be proposed, our stakeholders need to be consulted first about the proposed
changes. An updated version of the policy will then be submitted for adoption by the General Meeting.
In 2023, ING engaged with its various stakeholders in an open dialogue on changes to the Executive Board
and Supervisory Board remuneration policy, and for 2024, policy updates are proposed. In 2024, ING's
Executive Board remuneration policy and Supervisory Board remuneration policy will be presented for
shareholder approval at the 2024 AGM. For further information on the updated policies, we refer to the letter
of the chairperson of the Supervisory Board Remuneration Committee.
Please note that the following paragraphs present a brief summary of the current applicable Executive
Board remuneration policy.
Total direct compensation
Total direct compensation is the total of fixed and variable remuneration, excluding benefits such as pension
and allowances.
Total direct compensation for the Executive Board members is determined and reviewed annually by the
Supervisory Board. In line with the Executive Board remuneration policy, the Executive Board’s total direct
compensation for 2023 was compared to a peer group as formulated in the Executive Board remuneration
policy. The peer group is based on five guiding principles, reflecting ING’s current profile, and is explained in
the Executive Board remuneration policy. In short, these principles are described in the next table.
Guiding principle | Short description |
Size | ING acknowledges the importance of including companies that are broadly comparable in terms of size and complexity |
Governance framework | ING is subject to the Dutch (financial services) regulatory framework and operates within a Dutch stakeholder environment |
Geography | ING is a leading European universal bank with a global presence and is headquartered in the Netherlands |
Talent market | ING is increasingly experiencing a cross-pollination of talent across sectors/industries, not limited to traditional banking competitors |
Balancing | ING acknowledges the importance of not losing sight of relevant peer companies that do not match on the other criteria |
In line with the Dutch Banking Code, the 2023 peer group consists of both financial and non-financial
companies, taking into account the relevant international context. In addition, the Supervisory Board
decided to exclude the UK and Switzerland from our peer group, due to different pay structures in their
financial sectors. Following an external and independent review in line with the Executive Board
remuneration policy in 2023, the current peer group composition remains unchanged and comprises:
ABN AMRO | Ahold Delhaize | BBVA | Deutsche Bank |
Aegon | ASML | Banco Santander | Intesa Sanpaolo |
NN Group | Heineken | BNP Paribas | Société Générale |
Rabobank | Philips | Crédit Agricole | UniCredit |
In line with the requirements laid out in the Dutch Banking Code, the actual earned total direct
compensation of members of the Executive Board under the Executive Board remuneration policy should be
below the market median of the peer group. The calculation of pay positioning of the Executive Board
members against the peer group is performed on this basis (i.e. actual fixed salary plus actual variable
remuneration). Based on the latest available survey data of actual total direct compensation earned, ING's
Executive Board members were all paid below the market median.
In the next visual, the total direct compensation position of each Executive Board member in relation to the
market median and market benchmarks is shown.
ING Group Annual Report 2023 on Form 20-F 99
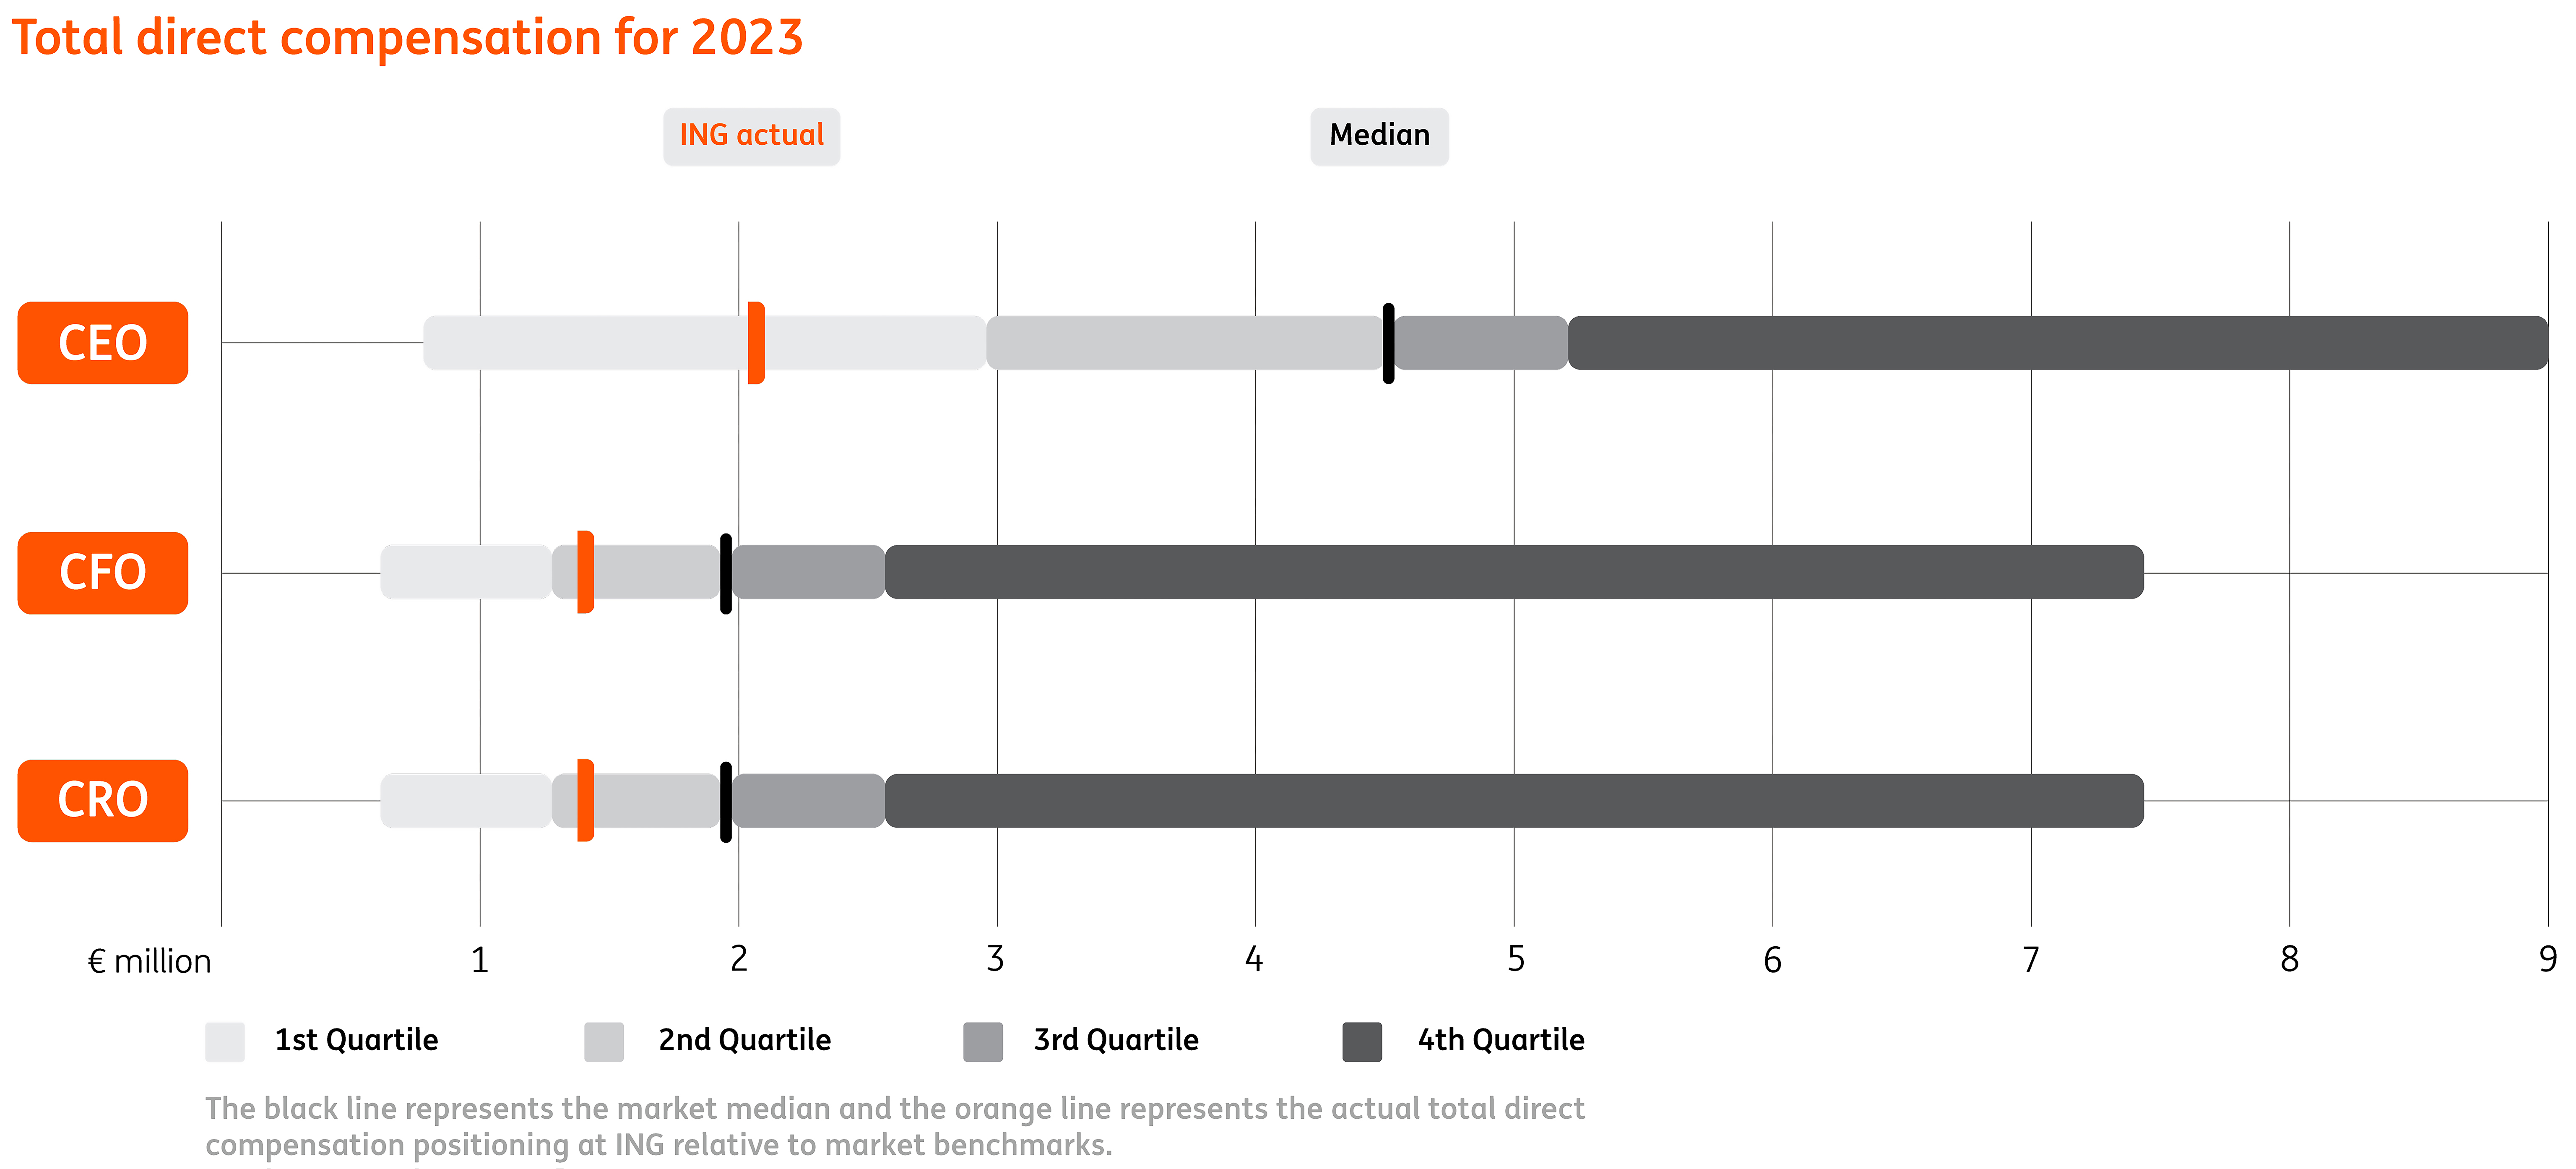
Fixed remuneration
The individual base salaries are set according to the role, responsibilities and experience of each Executive
Board member with reference to market practice. The Remuneration Committee reviews the individual base
salaries of the Executive Board members annually and proposes any changes to the Supervisory Board. The
Supervisory Board has the discretion to increase the individual base salaries. The below factors are given
consideration in determining their base salaries:
•the individual’s level of skill and performance;
•internal pay ratios and salary increases for other employees within ING;
•remuneration level at the external peer group;
•public indexation reference points (e.g. consumer price index);
•stakeholder views.
Variable remuneration
Variable remuneration for Executive Board members is limited to a maximum of 20 percent of base salary in
line with legislative requirements. The Executive Board remuneration policy provides for an at target variable
remuneration of 16 percent of base salary. At least 50 percent of this is based on non-financial performance
criteria. For the CRO, the non-financial performance criteria is 75 percent. If performance criteria are
exceeded, the Supervisory Board can increase the variable component to the maximum of 20 percent of
base salary. If performance is below target, the variable component will be decreased, potentially down to
zero.
The applicable performance criteria are based on ING’s strategy and priorities for the financial year, aiming
to drive sustainable outcomes for ING, including financial returns that correspond to shareholder returns in
the short- and longer term. The performance criteria therefore contribute to the long-term objectives of ING.
All variable remuneration is awarded fully in shares. There is a minimum holding period of five years from
the award date plus an additional holding year as of the vesting date. This combination (i.e. all shares plus a
long holding period) fosters alignment with shareholders and a focus on the long term.
The Supervisory Board predetermines the performance criteria for the Executive Board each year to ensure
alignment between ING's strategy, performance objectives and long-term interest. For further details on the
pay-out of variable remuneration, please see the Executive Board remuneration policy which is disclosed in
full on ing.com under the section ‘Remuneration’. Illustrated below is the pay-out scheme of variable
remuneration for Executive Board members.
ING Group Annual Report 2023 on Form 20-F 100
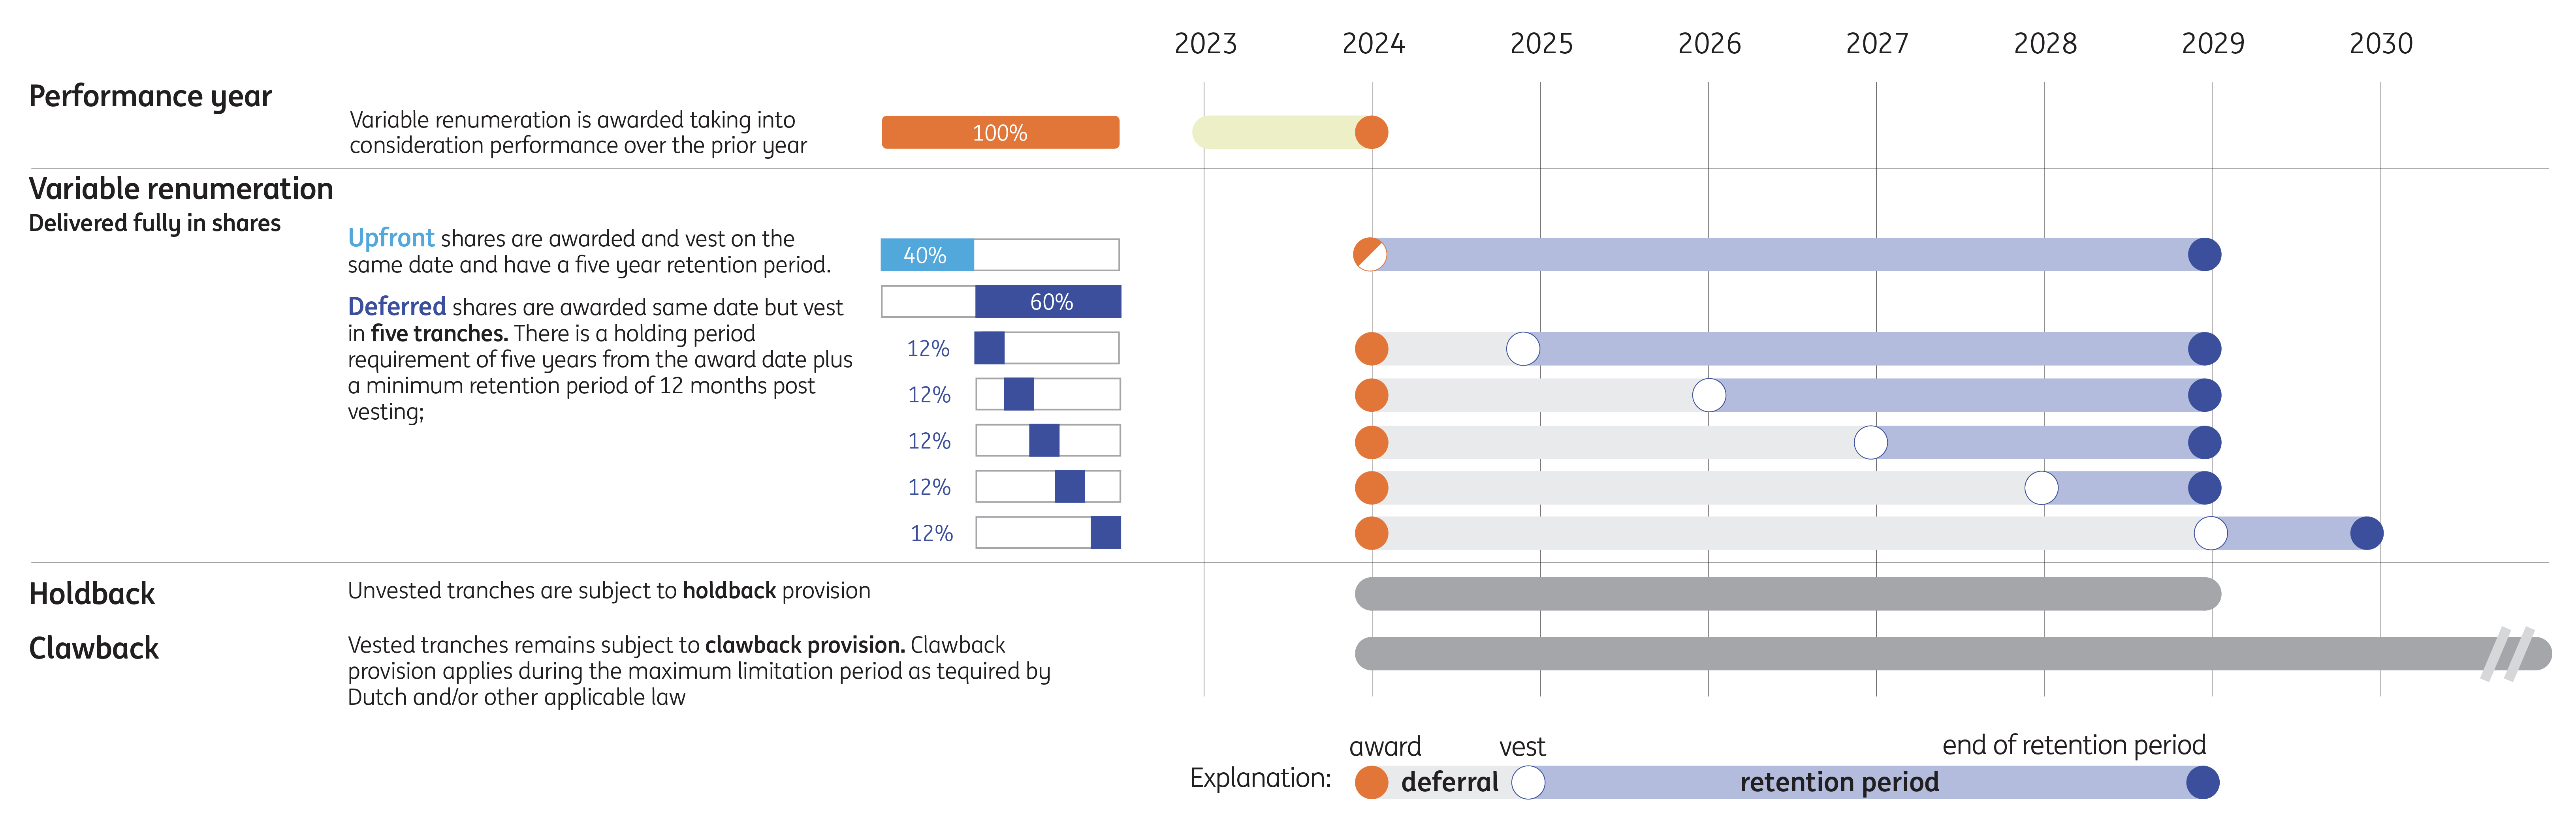
Pension
All members of the Executive Board participate in the Collective Defined Contribution pension plan, which is
accrued on an annual salary of up to €128,810 for 2023. This is the same as for all employees working in the
Netherlands without a supplementary pension scheme. Executive Board members are compensated for the
lack of pension accrual above this amount by means of an individual savings allowance (see 'Benefits'), to
be determined annually, on the same terms that apply to other participants in the Collective Defined
Contribution pension plan. The set-up of this compensation for the lack of pension accrual is in line with best
practices in the Netherlands.
Benefits
Executive Board members are eligible for additional benefits, such as:
•contributions individual savings plans;
•individual savings allowance (as explained under 'Pension' above);
•travel and accident insurance;
•other benefits:
•expatriate allowances (such as housing, school/tuition fees and international health insurances,
if applicable);
•banking and insurance benefits from ING (on the same terms as for other employees of ING in
the Netherlands);
ING Group Annual Report 2023 on Form 20-F 101
•tax and financial planning services to ensure compliance with the relevant legislative requirements;
•the use of either a company car or driver service.
Tenure
Members of the Executive Board are appointed by the General Meeting for a maximum term of four years.
They may be reappointed by the General Meeting in line with ING’s Articles of Association and applicable
rules and regulation. Executive Board members have a commission contract for an indefinite period. ING has
the option to terminate the contract if a member is not reappointed by the General Meeting, or if their
membership of the Executive Board is terminated. There is a three-month notice period for individual board
members and a six-month notice period for ING. During this time, the board member would, in principle,
continue to work and remains eligible for all agreed remuneration components.
In the event of an involuntary exit, Executive Board members are eligible for an exit arrangement. If
termination of the contract is based on mutual agreement, the Executive Board member is eligible for a
severance payment. These arrangements are subject to specific requirements (e.g. limited to a maximum of
one year of fixed base salary and under the condition that there should be no reward for failure). Should an
Executive Board member depart voluntarily or in circumstances involving fraud, gross negligence, wilful
misconduct or any activity detrimental to ING, no severance payment or award of variable remuneration
over the performance year will be made and outstanding deferrals will lapse.
Annual review of the Executive Board remuneration
In accordance with the Executive Board remuneration policy, the Supervisory Board annually determines
the actual remuneration for members of the Executive Board, based on advice from the Remuneration
Committee of the Supervisory Board.
The Remuneration Committee’s responsibilities include preparing the Supervisory Board for decisions
regarding the individual remuneration of members of the Executive Board. In performing its tasks, the
Remuneration Committee takes note of the views of individual Executive Board members with regard to the
amount and structure of their own remuneration. Remuneration proposals for individual Executive Board
members are drawn up in accordance with the Executive Board remuneration policy and cover the following
aspects: remuneration structure, external benchmark results based on an annual review and validation of
the Executive Board peer group, the amount of the fixed and variable remuneration components, the
performance criteria used and, if and when considered appropriate, stakeholder engagement and the pay
ratios within the company and its affiliated enterprises. In the performance of its tasks, the Remuneration
Committee works together with the Risk Committee.
The Executive Board variable remuneration proposals were determined based on scenario analysis
performed against different performance standards and payout levels including threshold, target and
maximum and presented to the Supervisory Board for consideration. In conclusion, the proposed variable
remuneration awards for the Executive Board members were considered fair and appropriate and in line
with legislative requirements of maximum of 20 percent of base salary. The scenario analysis provided no
issues or new insights that warranted further adjustments to the proposed variable remuneration awards
by the Supervisory Board.
Special employment conditions
In line with the Executive Board remuneration policy, the Supervisory Board may decide to temporarily
apply special employment conditions, for example to secure the recruitment of new Executive Board
members in exceptional circumstances, when this is necessary to serve the long-term interests and
sustainability of ING as a whole, or to assure its viability. In 2023, there were no such special employment
conditions granted.
ING Group Annual Report 2023 on Form 20-F 102
2023 Remuneration Executive Board
This section includes details of remuneration for Executive Board members relating to the period served on
the Executive Board in 2023.
In line with the Dutch Corporate Governance Code, ING calculates the internal ratio of the remuneration for
the chief executive officer (CEO) compared to the average remuneration of all ING staff. Using the CEO's
total remuneration (i.e., the total of fixed and variable remuneration, including benefits such as pension and
allowances) compared to the average remuneration for all ING staff, the ratio in 2023 was 1:24. The lower
ratio for 2023 compared to 2022 is mainly caused by the fact that the remuneration of the CEO remained
stable while the average remuneration of ING staff increased.
1. Internal ratio for CEO | All ING staff |
2023 | 1:24 |
2022 | 1:25 |
2021 | 1:28 |
2020 | 1:31 |
2019 | 1:27 |
Furthermore, we also calculated the average ratio of total remuneration for the chief financial officer (CFO)
and chief risk officer (CRO) compared to all ING staff. On that basis the average ratio in 2023 for the CFO and
CRO was 1:18, which is comparable to that of 2022.
Remuneration versus company performance and average employee
remuneration
Table 2 (on the next page) shows the development of directors’ remuneration (Executive Board and
Supervisory Board members), company performance and the average remuneration of an ING employee.
This is carried out by showing the development of the remuneration for Executive Board and Supervisory
Board members over the last five years presented in percentages.
With respect to the remuneration of the Supervisory Board, it should be noted that there is no link to
company performance in order to safeguard its independent role.
The relative performance of the company is presented on three different metrics over the last five years.
The metrics consist of:
•Retail primary relationships.
•Profit before tax for ING Group.
•Return on equity based on IFRS-EU equity.
Finally, we present the development of the remuneration on average (per employee). For this number, we
use the same data as for the internal ratio.
ING Group Annual Report 2023 on Form 20-F 103
2. Development of directors’ remuneration, company performance and employee remuneration ¹ | |||||||||||
Amount in thousands of euros unless otherwise stated | FY 2023 | FY 2023 vs FY 2022 | FY 2022 vs FY 2021 | FY 2021 vs FY 2020 | FY 2020 vs FY 2019 | FY 2019 vs FY 2018 | |||||
Directors' remuneration (Executive Board) 2, 3, 4, 5, 6 | |||||||||||
Steven van Rijswijk (CEO) | 2,076 | 23 | 1.1% | -24 | -1.2% | 578 | 38.6% | 100 | 7.2% | 195 | 16.2% |
Tanate Phutrakul (CFO) | 1,446 | 33 | 2.3% | -27 | -1.9% | 218 | 17.9% | - | - | - | - |
Ljiljana Čortan (CRO) | 1,430 | 7 | 0.5% | - | - | - | - | - | - | - | |
Company’s performance | |||||||||||
Retail primary relationships (in mln) | 15.3 | 0.7 | 5% | 0.3 | 2% | 0.4 | 3% | 0.6 | 5% | 0.8 | 7% |
Profit before Tax ING Group (in mln) | 10,492 | 4,990 | 91% | -1,280 | -19% | 2,973 | 78% | -3,025 | -44% | -4 | 0% |
Return on equity based on IFRS-EU equity | 14.8% | 7.6% | 106% | -2% | -22% | 4.4% | 92% | -4.6% | -49% | -1.8% | -4% |
Average employee remuneration 7 | |||||||||||
Average fixed and annual variable remuneration | 77 | 4.8 | 6.5% | 2.4 | 3.5% | 2.7 | 4% | - | - | - | - |
Directors remuneration (Supervisory Board) 8 | |||||||||||
Hans Wijers (chairperson) | 93 | - | - | 0.5 | 0.2% | -25 | -11.9% | 7 | 3.5% | 17 | 9.2% |
Karl Guha (chairperson) | 130 | - | - | - | - | - | - | - | - | - | - |
Mike Rees (vice-chairperson) | 151 | 12 | 8.8% | 10 | 7.8% | 0 | 0% | - | - | - | - |
Juan Colombás | 123 | 21 | 20.4% | 8 | 8.5% | - | - | - | - | - | - |
Mariana Gheorghe | 41 | - | - | 18 | 17.2% | -6 | -5.6% | -10 | -8.5% | 13 | 12.4% |
Margarete Haase | 118 | 6 | 4.9% | 8 | 7.7% | -1 | -1.0% | 7 | 7.1% | 35 | 55.6% |
Lodewijk Hijmans van den Bergh | 108 | 11 | 10.8% | - | - | - | - | - | - | - | - |
Herman Hulst | 108 | 8 | 7.5% | 5 | 5.0% | - | - | - | - | - | - |
Harold Naus | 98 | 6 | 6.0% | -3 | -2.9% | - | - | - | - | - | - |
Alexandra Reich | 78 | - | - | - | - | - | - | - | - | - | - |
Herna Verhagen | 108 | 6 | 5.4% | 2 | 2.0% | -21 | -17.4% | - | - | - | - |
1For consistency reasons, this table only makes a comparison between two full financial years in which the respective Executive Board or Supervisory Board member served in their role as board member.
2The remuneration of the Executive Board consists of base salary and variable remuneration (total direct compensation).
3Variable remuneration for the Executive Board is included in the year in which the performance was delivered i.e. prior to the year in which it is paid out.
4Fixed remuneration for the Executive Board did not change in 2019. The relative total compensation increase from 2018 to 2019 is fully attributable to the fact that no variable remuneration was awarded for performance year 2018.
5Fixed remuneration for Executive Board members is not linked to company performance but is predominantly based on a benchmark exercise. Total direct compensation of Executive Board members should stay below the median of the benchmark, in line with the Dutch
Banking Code. This has a mitigating effect on the correlation with company performance.
6The relative total compensation increase from 2020 to 2021 is mainly caused by the fact that no variable remuneration was awarded for the performance year 2020.
7In 2021, the methodology to calculate the average employee remuneration has been updated. Comparative for 2020 has been updated accordingly.
8There is no correlation between Supervisory Board remuneration and company performance. Supervisory Board members do not receive any variable remuneration. Their remuneration is based on fixed fees related to their role and number of meetings. The high fluctuations are
caused by role changes during the year and differences in the number of meetings.
ING Group Annual Report 2023 on Form 20-F 104
2023 Executive Board performance assessment and reward process
The Executive Board performance assessment and reward process includes a number of key steps. This
process serves as the foundation to determine the variable remuneration for Executive Board members.
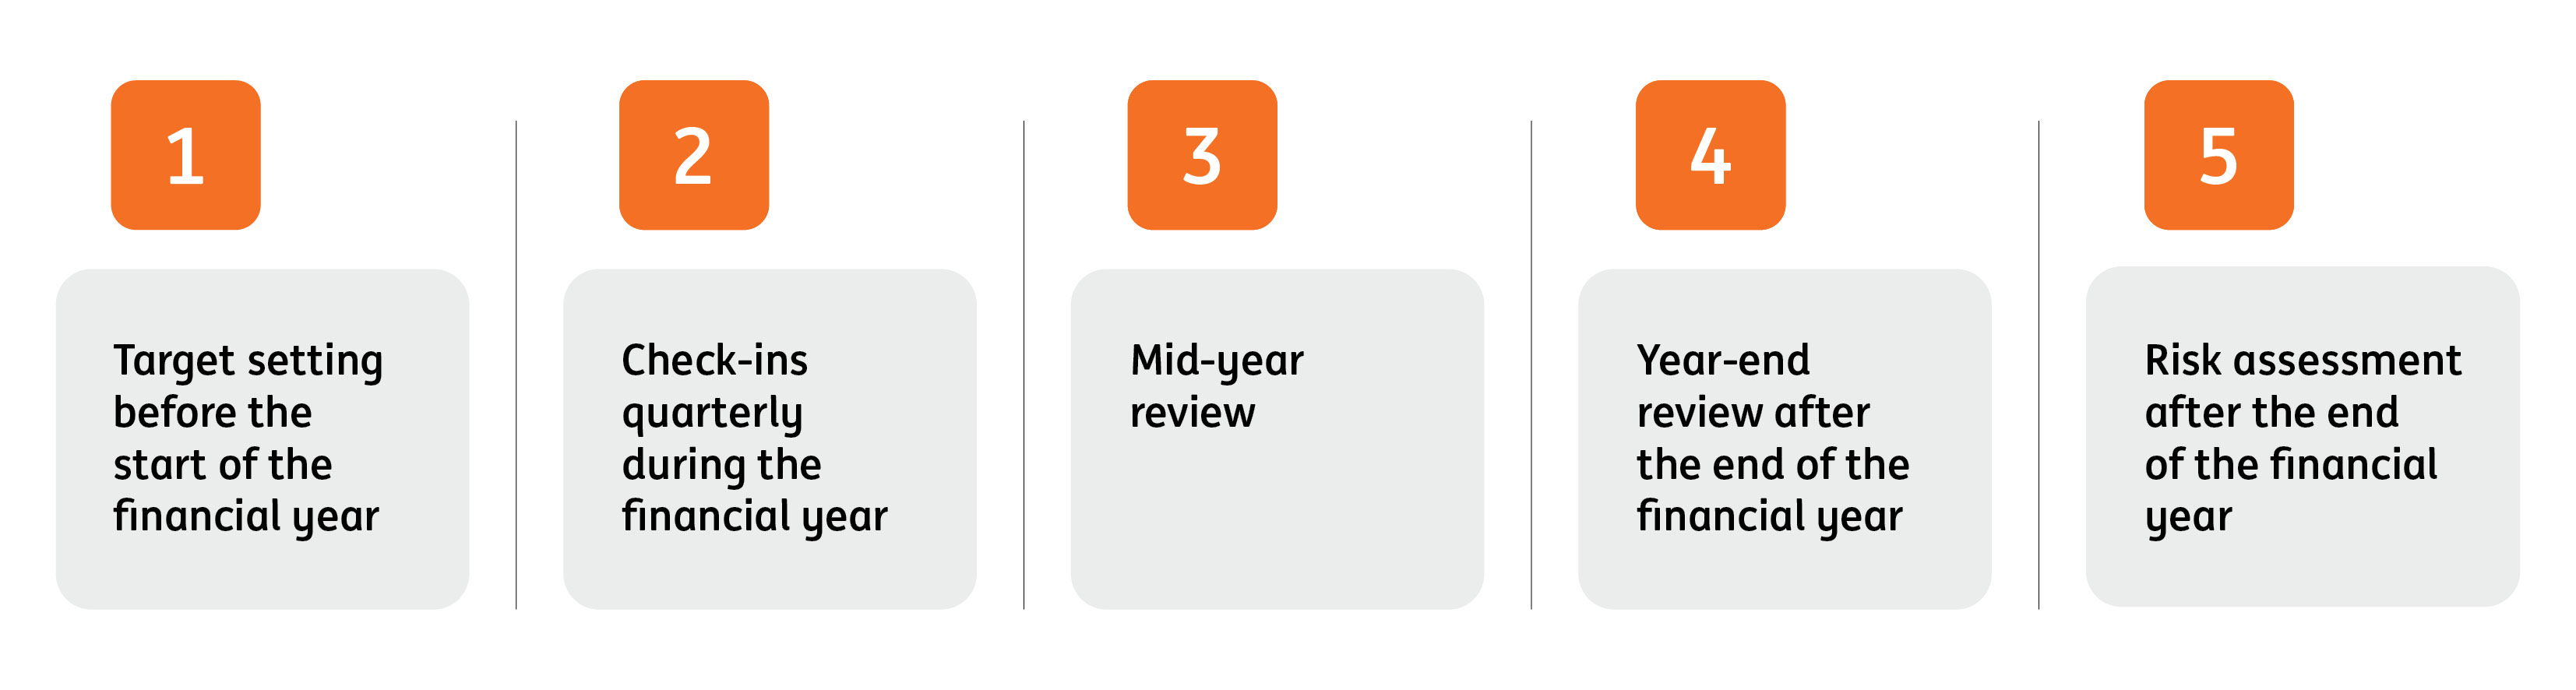
At the start of the performance year, the Supervisory Board approves the financial, non-financial and risk
performance targets applicable to the Executive Board members for that year:
•Financial performance target areas including profit-based and return-based targets;
•Non-financial performance target areas consisting of customer (except the CRO), risk & regulatory,
strategy, environment & social.
Each performance target area is weighted and when combined, all weightings total 100 percent. The Dutch
Remuneration Policy for Financial Enterprises Act (Wet Beloningsbeleid Financiële Ondernemingen, Wbfo)
specifies that at least 50 percent of variable remuneration metrics must be based on non-financial targets.
The CEO is aligned fully to Group performance, while for the CFO, it is a mix of both Group and functional
performance targets. The non-financial targets for the CRO are predominantly based on performance
targets that are linked to the function and role.
The applicable performance targets are based on ING's strategy, with customers and sustainability as the
core pillars. The performance targets for the Executive Board members reflect ING's priorities for the
financial year, aiming to drive sustainable outcomes, including financial returns that drive shareholder
returns in both the short and longer term. In addition, non-financial targets, including ESG-related targets,
are also taken into account and contribute towards long-term sustainable value for both ING and society.
ING's remuneration approach is strongly linked to a robust and transparent performance management
process which aims to reward sustainable performance.
The target areas, targets and weightings are included in the performance target cards for each Executive
Board member. The performance target card consists of both quantitative- and qualitative-based targets to
achieve a balanced and holistic assessment. Quantitative-based targets are measured primarily on a
formulaic basis where the expected target performance level must be achieved before the on-target pay-
out can be earned. Qualitative targets are clearly defined with descriptors of levels of what is expected of
the performance, such as speed of delivery, quality of delivery and ways of working. These are assessed
using a standard three-point rating scale which aligns with ING's Step Up Performance rating approach. The
overall outcome of the performance target card assessment described above is the starting point for
determining the variable remuneration of the Executive Board members.
Throughout the year, regular conversations take place between the Supervisory Board and the Executive
Board to review their performance. Progress against performance measures is formally tracked and
discussed at least twice a year in the mid-year and year-end reviews. The Nomination and Corporate
Governance Committee takes an active role in assessing the performance of individual Executive Board
members, and informs both the Risk Committee and the Remuneration Committee.
At the end of the year, the Risk Committee and Remuneration Committee provide input and assess the
performance of Executive Board members to determine the variable remuneration to be awarded. They
jointly advise the Supervisory Board on the recommendations to get final approval of the awards. This
follows a multi-step and integrated process that closely aligns with the way variable remuneration is
determined for the wider ING workforce. The process covers an assessment of their performance, based on
individual performance target cards. It includes targets and ranges agreed to at the beginning of the
performance year, along with risk assessments measured on an ex-ante and ex-post risk adjustment basis
(see also 'The comprehensive process around variable remuneration', under point 5).
The integrated performance assessment process for determining variable remuneration also takes into
account financial and operational performance, risk and compliance, as well as behaviour and conduct of
each Executive Board member. This is supported by a robust framework for considering risk and conduct,
which is in line with regulations. It includes the following elements:
•Performance hurdles – Executive Board members are only eligible for consideration of their variable
remuneration if both of the performance hurdles are met. This is in line with all employees who are
eligible for discretionary variable remuneration. See 'Performance hurdles' for further details.
•Risk and regulatory adjustments – Performance against risk and regulatory targets within the core
performance target cards are made, including an assessment of financial risk and non-financial risk
targets measured on an ex-ante basis. The targets and ranges are set at the beginning of the financial
year, taking into account ING’s risk appetite statement framework. Performance against these risk and
regulatory targets may lead to a downward or upward modification in variable remuneration.
•Additional risk adjustments – Further downward risk adjustments may also be made to variable
remuneration based on broader risk management performance not within risk appetite, including
additional ex-ante risk performance that needs to be considered and/or ex-post risk events that may
lead to a financial or reputational impact on ING. Finally, the Risk function assesses individual risk
ING Group Annual Report 2023 on Form 20-F 105
requirements that apply to Identified Staff, including Executive Board members, who are considered risk
takers, which can also lead to a downward adjustment in variable remuneration, also known as a risk
modifier. In the most serious of incidents, additional risk adjustments in the form of holdbacks or
clawbacks1 can also impact individual variable remuneration.
The CRO is responsible for recommending any risk adjustments to variable remuneration awards for the CEO
and CFO. The Risk Committee is responsible for recommending this for the CRO. The final decision is made
by the Supervisory Board. The Supervisory Board, based on the advice of the Remuneration Committee and
Risk Committee, decides on any risk adjustments (potentially to zero) to variable remuneration for Executive
Board members. As a final step in the process, in exceptional circumstances the Supervisory Board may
apply its discretion to adjust upwards or downwards the variable remuneration of Executive Board
members.
2023 Executive Board base salary
The base salary for all roles of the Executive Board remained unchanged for 2023 as disclosed in our 2022
Remuneration report.
ING Group Annual Report 2023 on Form 20-F 106
1 A holdback is the forfeiture of up to 100 percent of the awarded and unvested variable remuneration, and a clawback is an arrangement under which staff have to return ownership of up to 100 percent of the paid and/or vested variable remuneration.
2023 Executive Board performance evaluation
This section includes more details on the financial and non-financial performance of the Executive Board members. Key financial and non-financial achievements against the 2023 predefined target areas are summarised in
one table for each of the Executive Board members. This has been discussed and approved by the Supervisory Board. The non-financial, individual performance of each Executive Board member is further summarised in a
separate overview per board member in the following pages.
3. 2023 variable remuneration outcomes | ||||||||||||||
Target – Minimum | Target | Target – Maximum | Performance | Steven van Rijswijk (CEO) | Tanate Phutrakul (CFO) | Ljiljana Čortan (CRO) | ||||||||
Weighting | Assessment | Outcome | Weighting | Assessment | Outcome | Weighting | Assessment | Outcome | ||||||
Financial | Profit before tax | 5,500 | 6,875 | 8,250 | 10,492 | 16.7% | 100% | 17% | 16.7% | 100% | 17% | 8.3% | 100% | 8% |
Return on equity | 8.1% | 10.2% | 12.2% | 14.8% | 16.7% | 100% | 17% | 16.7% | 100% | 17% | 8.3% | 100% | 8% | |
Operational expenses | 12,187 | 11,606 | 11,026 | 11,564 | 16.7% | 81% | 14% | 16.7% | 81% | 14% | 8.3% | 81% | 7% | |
Non-financial | Customer | Performance against non-financial measures are organised around these target areas. Please see the following pages for more details on the non-financial performance of each Executive Board member. | 7.5% | 80% | 6% | 5% | 80% | 4% | NA | NA | NA | |||
Risk & Regulatory | 15% | 79% | 12% | 17.5% | 88% | 15% | 45% | 79% | 36% | |||||
Strategy | 12.5% | 80% | 10% | 12.5% | 100% | 13% | 15% | 90% | 14% | |||||
Environment & Social | 15% | 63% | 10% | 15% | 87% | 13% | 15% | 83% | 12% | |||||
Total | 100% | 84% | 100% | 92% | 100% | 85% | ||||||||
Final 2023 variable remuneration outcomes | 84% | 92% | 85% | |||||||||||
Payout out of 20 percent variable remuneration cap (16 percent is at target variable remuneration) | 17% | 18% | 17% | |||||||||||
* Due to rounding, percentages presented in the table may not add up precisely to the total percentages provided.
ING Group Annual Report 2023 on Form 20-F 107

ING Group Annual Report 2023 on Form 20-F 108

ING Group Annual Report 2023 on Form 20-F 109
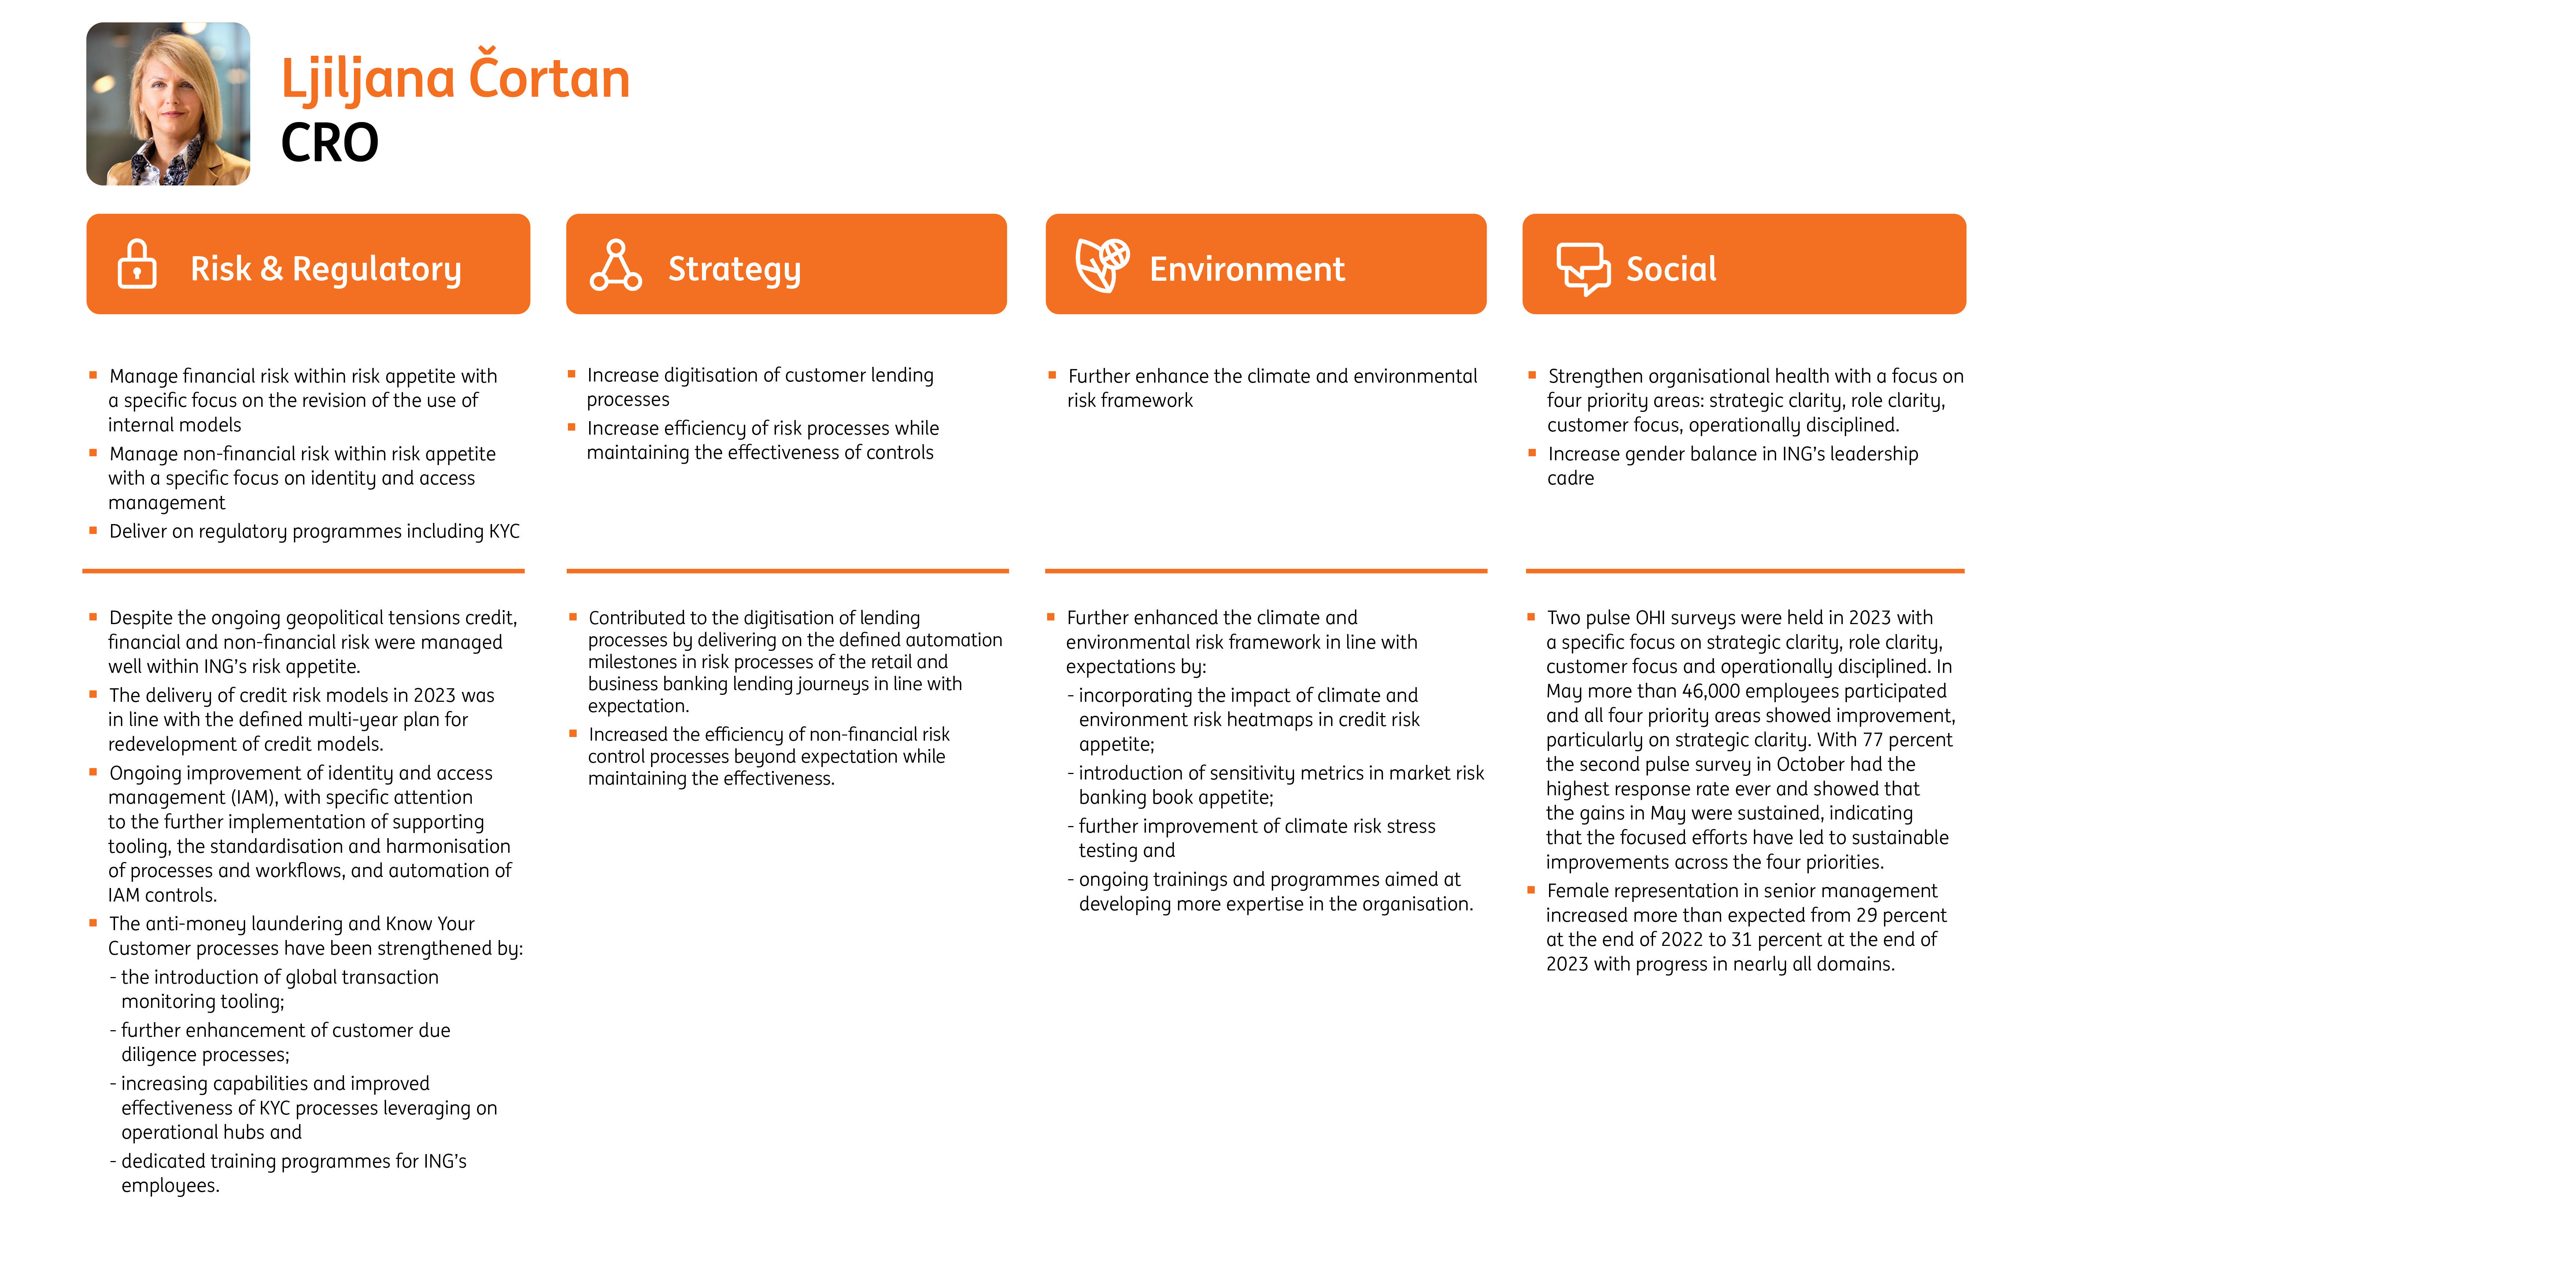
ING Group Annual Report 2023 on Form 20-F 110
2023 variable remuneration and total direct compensation outcomes
ING delivered exceptional results in 2023. Net profit almost doubled, with strong contributions from both
Retail and Wholesale Banking. This was driven by higher net interest income and our continued low risk
costs, reflecting our strong asset quality. In Retail Banking, the number of primary customers increased by
750,000 over the course of the year to reach a total of 15.3 million. Wholesale Banking achieved an all-time
high NPS score of 72 at year-end, driven by high satisfaction with our relationship managers' sector
knowledge, pro-activity, clear communication and their understanding of their clients' needs. Financially,
profit before tax rose to €10.5 billion, with the return on equity rising to 14.8 percent.
Looking at the progress of our climate alignment, we're currently on track to achieve our medium-term
2030 sector decarbonisation targets in four of our 10 Terra (sub)sectors and close to the target (less than
five percent deviation) for three (sub)sectors. We continue to facilitate the transition to a low-carbon
economy and support our clients in their transitions. In 2023, we mobilised €115 billion of financing for our
clients that contributes to their transition versus €101 billion in 2022, and we closed 792 sustainability
transactions.
The financial and capital results were well above the performance hurdles. Following this achievement, the
Supervisory Board conducted a thorough and balanced performance assessment. Based on the outcomes of
this and their overall achievements, the Supervisory Board concluded that the Executive Board members
delivered strong results in 2023.
Furthermore, the Supervisory Board considered whether any discretionary adjustment was required and
determined that both the financial and non-financial results speak for themselves in the current
environment. The Supervisory Board also considered the behaviour of the Executive Board members and
saw no reason to apply any discretionary adjustments.
In the final step, the Supervisory Board took into consideration the feedback of the CRO and Risk Committee
on risk and compliance matters. Here, there was no reason to apply any individual additional risk
adjustments in accordance with ING’s Remuneration Regulations Framework (IRRF). 2
Following this performance assessment process the resulting variable remuneration award for Steven van
Rijswijk is €299,565; for Tanate Phutrakul €224,104; and for Ljiljana Čortan €208,043. For the CEO, this
equates to a variable remuneration award at 17 percent out of the maximum 20 percent cap. For the CFO, it
represents 18 percent out of the maximum 20 percent cap, and for the CRO, it represents 17 percent out of
the maximum 20 percent cap (see table 3. '2023 variable remuneration outcomes').
As recognised in the profit or loss statement of 2023, the expenses for each Executive Board member (active
on 31 December 2023), relating to their role on the Executive Board, amount to €2.4 million for the CEO,
€1.8 million for the CFO and €1.8 million for the CRO. These amounts include deferred elements from
previous years, paid out in 2023.3
The following paragraphs (i.e. total direct compensation, pension costs and benefits) show the remuneration
awarded to individual Executive Board members with respect to the performance years 2023 and 2022. All
Executive Board remuneration is paid directly by ING.
ING Group Annual Report 2023 on Form 20-F 111
2 The IRRF consists of the most important regulatory requirements with respect to remuneration to which all remuneration policies of
majority-owned entities have to adhere. Furthermore, it consists of our general remuneration principles that apply to all staff globally
working under the responsibility of ING.
3 In addition, ING Group offers a Directors & Officers indemnity (see also Article 26 of our Articles of Association), under which genuine
expenses are provided.
4. 2023 variable remuneration outcomes | ||||||||||
1. Fixed remuneration | 2. Variable remuneration | 3. Extraordinary items | 4. Pension benefits | 5. Total remuneration | 6. Proportion of fixed and variable remuneration | |||||
Amounts in euros (rounded figures) | Base salary | Fees | Other benefits | One-year variable1 | Multi-year variable | |||||
Steven van Rijswijk (CEO) | 2023 | 1,776,300 | — | 503,300 | 299,600 | — | — | 26,100 | 2,605,200 | 88.5% / 11.5% |
2022 | 1,776,300 | — | 474,600 | 276,800 | — | — | 23,300 | 2,551,000 | 89.1% / 10.9% | |
Tanate Phutrakul (CFO) | 2023 | 1,221,700 | — | 362,300 | 224,100 | — | — | 26,100 | 1,834,200 | 87.8% / 12.2% |
2022 | 1,221,700 | — | 337,700 | 191,400 | — | — | 23,300 | 1,774,100 | 89.2% / 10.8% | |
Ljiljana Čortan (CRO) | 2023 | 1,221,700 | — | 481,400 | 208,000 | — | — | 26,100 | 1,937,200 | 89.3% / 10.7% |
2022 | 1,221,700 | — | 494,800 | 201,000 | — | — | 23,300 | 1,940,800 | 89.6% / 10.4% | |
1 The variable remuneration percentages over 2023 for the Executive Board members are as follows: CEO 17%, CFO 18% and CRO 17%. Thus the ratio between base salary and total direct compensation is as follows: CEO 85.6%, CFO 84.5% and CRO 85.5%.
Benefits
The individual members of the Executive Board receive benefits. The table below shows the breakdown of all
benefits paid in 2023.
5. Breakdown of benefits paid in 2023 | |||
Amounts in euros (rounded figures) | Steven van Rijswijk (CEO) | Tanate Phutrakul (CFO) | Ljiljana Čortan (CRO) |
Contribution individual savings plans | 62,200 | 42,800 | 42,800 |
Individual savings allowance | 367,200 | 243,600 | 243,600 |
Travel and accident insurance | 15,000 | 15,000 | 15,000 |
Other benefits1 | 58,800 | 60,900 | 180,100 |
1This includes expatriate allowances (such as housing, school/tuition fees and international health insurances, if applicable); banking
and insurance benefits from ING (on the same terms as for other employees of ING in the Netherlands); tax and financial planning
services to ensure compliance with the relevant legislative requirements; reimbursement of costs under the Directors & Officers
indemnity provided by ING; the use of a company car or driver service.
ING Group Annual Report 2023 on Form 20-F 112
Shares
Deferred shares are shares conditionally granted subject to a tiered vesting over a period of five years (for awards in 2023 and before), with the ultimate value of each deferred share based on ING’s share price on the vesting
date. This is conditional on there being no holdback. The main condition for vesting is that these shares require continued employment through vesting date. The table below details all share-based remuneration for the
Executive Board members. This new format is in line with the draft (non-binding) 'Guidelines on the standardised presentation of the remuneration report' from the European Commission. The main change is to provide more
detail of share-based remuneration processed during 2023, including new award grants, vesting events, any adjustments made to awards in year and also details of awards that are subject to retention obligations post
vesting during the year.
6. Share-based remuneration for Executive Board members | ||||||||||||||
The main conditions of share award plans | Information regarding the reported financial year | |||||||||||||
Opening balance | During the year | Closing balance | ||||||||||||
1. Specification of plan1 | 2. Performan ce period | 3. Grant/ offering date | 4. Vesting date | 5. End of retention period | 6A. Shares held at the beginning of the year | 6B. Shares subject to retention at the beginning of the year | 6C. Shares sold-to-cover2 | 7. Shares granted/ offered | 8. Shares vested | 9. Shares subject to a performance condition | 10. Shares granted/ offered and unvested at year-end | 11A. Shares subject to a retention period | 11B. Vested shares sold-to- cover2 | |
Steven van Rijswijk (CEO) | LSPP Deferred Shares Idnt | 2017 | 3/27/2018 | 3/27/2022 | 3/27/2023 | — | 179 | 167 | — | — | NA | — | — | — |
LSPP Deferred Shares Idnt | 2017 | 3/27/2018 | 3/27/2023 | 3/27/2024 | 346 | — | — | — | 346 | NA | — | 179 | 167 | |
LSPP Upfront Shares | 2017 | 5/10/2018 | 5/10/2018 | 5/10/2023 | — | 1,400 | 1,234 | — | — | NA | — | — | — | |
LSPP Deferred Shares Idnt | 2017 | 5/10/2018 | 5/11/2019 | 5/10/2023 | — | 415 | 375 | — | — | NA | — | — | — | |
LSPP Deferred Shares Idnt | 2017 | 5/10/2018 | 5/11/2020 | 5/10/2023 | — | 427 | 363 | — | — | NA | — | — | — | |
LSPP Deferred Shares Idnt | 2017 | 5/10/2018 | 5/11/2021 | 5/10/2023 | — | 419 | 371 | — | — | NA | — | — | — | |
LSPP Deferred Shares Idnt | 2017 | 5/10/2018 | 5/11/2022 | 5/11/2023 | — | 410 | 380 | — | — | NA | — | — | — | |
LSPP Deferred Shares Idnt | 2017 | 5/10/2018 | 5/11/2023 | 5/11/2024 | 790 | — | — | — | 790 | NA | — | 410 | 380 | |
LSPP Upfront Shares | 2019 | 5/11/2020 | 5/11/2020 | 5/11/2025 | — | 4,193 | 3,350 | — | — | NA | — | 4,193 | — | |
LSPP Deferred Shares Idnt | 2019 | 5/11/2020 | 5/11/2021 | 5/11/2025 | — | 1,241 | 1,022 | — | — | NA | — | 1,241 | — | |
LSPP Deferred Shares Idnt | 2019 | 5/11/2020 | 5/11/2022 | 5/11/2025 | — | 1,224 | 1,039 | — | — | NA | — | 1,224 | — | |
LSPP Deferred Shares Idnt | 2019 | 5/11/2020 | 5/11/2023 | 5/11/2025 | 2,263 | 0 | 0 | — | 2,263 | NA | — | 1,202 | 1,061 | |
LSPP Deferred Shares Idnt | 2019 | 5/11/2020 | 5/11/2024 | 5/11/2025 | 2,263 | — | — | — | — | NA | 2,263 | — | — | |
LSPP Deferred Shares Idnt | 2019 | 5/11/2020 | 5/11/2025 | 5/11/2026 | 2,263 | — | — | — | — | NA | 2,263 | — | — | |
LSPP Upfront Shares | 2021 | 5/9/2022 | 5/9/2022 | 5/9/2027 | — | 5,108 | 4,082 | — | — | NA | — | 5,108 | — | |
LSPP Deferred Shares Idnt | 2021 | 5/9/2022 | 5/11/2023 | 5/9/2027 | 2,757 | — | — | — | 2,757 | NA | — | 1,512 | 1,245 | |
LSPP Deferred Shares Idnt | 2021 | 5/9/2022 | 5/11/2024 | 5/9/2027 | 2,757 | — | — | — | — | NA | 2,757 | — | — | |
LSPP Deferred Shares Idnt | 2021 | 5/9/2022 | 5/11/2025 | 5/9/2027 | 2,757 | — | — | — | — | NA | 2,757 | — | — | |
LSPP Deferred Shares Idnt | 2021 | 5/9/2022 | 5/11/2026 | 5/11/2027 | 2,757 | — | — | — | — | NA | 2,757 | — | — | |
ING Group Annual Report 2023 on Form 20-F 113
6. Share-based remuneration for Executive Board members | ||||||||||||||
The main conditions of share award plans | Information regarding the reported financial year | |||||||||||||
Opening balance | During the year | Closing balance | ||||||||||||
1. Specification of plan1 | 2. Performan ce period | 3. Grant/ offering date | 4. Vesting date | 5. End of retention period | 6A. Shares held at the beginning of the year | 6B. Shares subject to retention at the beginning of the year | 6C. Shares sold-to-cover2 | 7. Shares granted/ offered | 8. Shares vested | 9. Shares subject to a performance condition | 10. Shares granted/ offered and unvested at year-end | 11A. Shares subject to a retention period | 11B. Vested shares sold-to- cover2 | |
LSPP Deferred Shares Idnt | 2021 | 5/9/2022 | 5/11/2027 | 5/11/2028 | 2,757 | — | — | — | — | NA | 2,757 | — | — | |
LSPP Upfront Shares | 2022 | 5/11/2023 | 5/11/2023 | 5/11/2028 | — | — | — | 8,718 | 8,718 | NA | — | 4,846 | 3,872 | |
LSPP Deferred Shares Idnt | 2022 | 5/11/2023 | 5/11/2024 | 5/11/2028 | — | — | — | 2,615 | — | NA | 2,615 | — | — | |
LSPP Deferred Shares Idnt | 2022 | 5/11/2023 | 5/11/2025 | 5/11/2028 | — | — | — | 2,615 | — | NA | 2,615 | — | — | |
LSPP Deferred Shares Idnt | 2022 | 5/11/2023 | 5/11/2026 | 5/11/2028 | — | — | — | 2,615 | — | NA | 2,615 | — | — | |
LSPP Deferred Shares Idnt | 2022 | 5/11/2023 | 5/11/2027 | 5/11/2028 | — | — | — | 2,615 | — | NA | 2,615 | — | — | |
LSPP Deferred Shares Idnt | 2022 | 5/11/2023 | 5/11/2028 | 5/11/2029 | — | — | — | 2,618 | — | NA | 2,618 | — | — | |
Total | 21,710 | 15,016 | 12,383 | 21,796 | 14,874 | 28,632 | 19,915 | 6,725 | ||||||
Tanate Phutrakul (CFO) | LSPP Deferred Unit Idnt (Equity settled) | 2016 | 3/27/2017 | 3/27/2023 | NULL | 485 | — | — | — | 485 | NA | — | 238 | 247 |
LSPP Deferred Unit Idnt (Equity settled) | 2017 | 3/27/2018 | 3/27/2023 | NULL | 397 | — | — | — | 397 | NA | — | 197 | 200 | |
LSPP Deferred Unit Idnt (Equity settled) | 2017 | 3/27/2018 | 3/27/2024 | NULL | 401 | — | — | — | — | NA | 401 | — | — | |
LSPP Deferred Shares Idnt | 2018 | 3/27/2019 | 3/27/2022 | 3/27/2023 | 0 | 117 | 110 | — | — | NA | — | — | — | |
LSPP Deferred Shares Idnt | 2018 | 3/27/2019 | 3/27/2023 | 3/27/2024 | 227 | — | — | — | 227 | NA | — | 117 | 110 | |
LSPP Deferred Shares Idnt | 2018 | 3/27/2019 | 3/27/2024 | 3/27/2025 | 227 | — | — | — | — | NA | 227 | — | — | |
LSPP Upfront Shares | 2019 | 5/11/2020 | 5/11/2020 | 5/11/2025 | — | 3,934 | 3,144 | — | — | NA | — | 3,934 | — | |
LSPP Deferred Shares Idnt | 2019 | 5/11/2020 | 5/11/2021 | 5/11/2025 | — | 1,164 | 959 | — | 0 | NA | — | 1,164.00 | 0 | |
LSPP Deferred Shares Idnt | 2019 | 5/11/2020 | 5/11/2022 | 5/11/2025 | — | 1,148 | 975 | — | — | NA | — | 1,148 | — | |
LSPP Deferred Shares Idnt | 2019 | 5/11/2020 | 5/11/2023 | 5/11/2025 | 2,123 | — | — | — | 2,123 | NA | — | 1,127 | 996 | |
LSPP Deferred Shares Idnt | 2019 | 5/11/2020 | 5/11/2024 | 5/11/2025 | 2,123 | — | — | — | 0 | NA | 2,123 | 0 | 0 | |
LSPP Deferred Shares Idnt | 2019 | 5/11/2020 | 5/11/2025 | 5/11/2026 | 2,124 | — | — | — | — | NA | 2,124 | — | — | |
LSPP Upfront Shares | 2021 | 5/9/2022 | 5/9/2022 | 5/9/2027 | — | 3,700 | 2,956 | — | — | NA | — | 3,700 | — | |
LSPP Deferred Shares Idnt | 2021 | 5/9/2022 | 5/11/2023 | 5/9/2027 | 1,997 | — | — | — | 1,997 | NA | — | 1,095 | 902 | |
LSPP Deferred Shares Idnt | 2021 | 5/9/2022 | 5/11/2024 | 5/9/2027 | 1,997 | — | — | — | — | NA | 1,997 | — | — | |
LSPP Deferred Shares Idnt | 2021 | 5/9/2022 | 5/11/2025 | 5/9/2027 | 1,997 | — | — | — | — | NA | 1,997 | — | — | |
LSPP Deferred Shares Idnt | 2021 | 5/9/2022 | 5/11/2026 | 5/9/2027 | 1,997 | — | — | — | 0 | NA | 1,997 | 0 | 0 | |
LSPP Deferred Shares Idnt | 2021 | 5/9/2022 | 5/11/2027 | 5/9/2028 | 1,997 | — | — | — | — | NA | 1,997 | — | — | |
LSPP Upfront Shares | 2022 | 5/11/2023 | 5/11/2023 | 5/11/2028 | — | — | — | 6,029 | 6,029 | NA | — | 3,351 | 2,678 | |
ING Group Annual Report 2023 on Form 20-F 114
6. Share-based remuneration for Executive Board members | ||||||||||||||
The main conditions of share award plans | Information regarding the reported financial year | |||||||||||||
Opening balance | During the year | Closing balance | ||||||||||||
1. Specification of plan1 | 2. Performan ce period | 3. Grant/ offering date | 4. Vesting date | 5. End of retention period | 6A. Shares held at the beginning of the year | 6B. Shares subject to retention at the beginning of the year | 6C. Shares sold-to-cover2 | 7. Shares granted/ offered | 8. Shares vested | 9. Shares subject to a performance condition | 10. Shares granted/ offered and unvested at year-end | 11A. Shares subject to a retention period | 11B. Vested shares sold-to- cover2 | |
LSPP Deferred Shares Idnt | 2022 | 5/11/2023 | 5/11/2024 | 5/11/2028 | — | — | — | 1,808 | 0 | NA | 1,808 | 0 | 0 | |
LSPP Deferred Shares Idnt | 2022 | 5/11/2023 | 5/11/2025 | 5/11/2028 | — | — | — | 1,808 | — | NA | 1,808 | — | — | |
LSPP Deferred Shares Idnt | 2022 | 5/11/2023 | 5/11/2026 | 5/11/2028 | — | — | — | 1,808 | — | NA | 1,808 | — | — | |
LSPP Deferred Shares Idnt | 2022 | 5/11/2023 | 5/11/2027 | 5/11/2028 | — | — | — | 1,808 | — | NA | 1,808 | — | — | |
LSPP Deferred Shares Idnt | 2022 | 5/11/2023 | 5/11/2028 | 5/11/2029 | — | — | — | 1,811 | — | NA | 1,811 | — | — | |
Total | 18,092 | 10,063 | 8,144 | 15,072 | 11,258 | 21,906 | 16,071 | 5,133 | ||||||
Ljiljana Čortan (CRO) | LSPP Upfront Shares | 2021 | 5/9/2022 | 5/9/2022 | 5/9/2027 | — | 4,478 | 1,936 | — | — | NA | — | 4,478 | — |
LSPP Deferred Shares Idnt | 2021 | 5/9/2022 | 5/11/2023 | 5/9/2027 | 1,924 | — | — | — | 1,924 | NA | — | 1,331 | 593 | |
LSPP Deferred Shares Idnt | 2021 | 5/9/2022 | 5/11/2024 | 5/9/2027 | 1,924 | — | — | — | — | NA | 1,924 | — | — | |
LSPP Deferred Shares Idnt | 2021 | 5/9/2022 | 5/11/2025 | 5/9/2027 | 1,924 | — | — | — | — | NA | 1,924 | — | — | |
LSPP Deferred Shares Idnt | 2021 | 5/9/2022 | 5/11/2026 | 5/11/2027 | 1,924 | — | — | — | — | NA | 1,924 | — | — | |
LSPP Deferred Shares Idnt | 2021 | 5/9/2022 | 5/11/2027 | 5/11/2028 | 1,925 | — | — | — | — | NA | 1,925 | — | — | |
LSPP Upfront Shares | 2022 | 5/11/2023 | 5/11/2023 | 5/11/2028 | — | — | — | 6,330 | 6,330 | NA | — | 4,419 | 1,911 | |
LSPP Deferred Shares Idnt | 2022 | 5/11/2023 | 5/11/2024 | 5/11/2028 | — | — | — | 1,899 | — | NA | 1,899 | — | — | |
LSPP Deferred Shares Idnt | 2022 | 5/11/2023 | 5/11/2025 | 5/11/2028 | — | — | — | 1,899 | — | NA | 1,899 | — | — | |
LSPP Deferred Shares Idnt | 2022 | 5/11/2023 | 5/11/2026 | 5/11/2028 | — | — | — | 1,899 | — | NA | 1,899 | — | — | |
LSPP Deferred Shares Idnt | 2022 | 5/11/2023 | 5/11/2027 | 5/11/2028 | — | — | — | 1,899 | — | NA | 1,899 | — | — | |
LSPP Deferred Shares Idnt | 2022 | 5/11/2023 | 5/11/2028 | 5/11/2029 | — | — | — | 1,899 | — | NA | 1,899 | — | — | |
Total | 9,621 | 4,478 | 1,936 | 15,825 | 8,254 | 17,192 | 10,228 | 2,504 | ||||||
ING Group Annual Report 2023 on Form 20-F 115
Loans and advances to Executive Board members
Executive Board members may obtain banking and insurance services from ING Group and its subsidiaries in
the ordinary course of their business and on terms that are customary in the sector. The Executive Board
members do not receive privileged financial services. On 31 December 2023, there were no loans or
advances outstanding to the Executive Board members.
ING shares held by Executive Board members
Executive Board members are encouraged to hold ING shares as a long-term investment to maintain
alignment with ING. The table below shows an overview of the shares held by members of the Executive
Board on 31 December 2023 and 2022.
7. ING shares held by Executive Board members | ||
Numbers of shares | 2023 | 2022 |
Steven van Rijswijk (CEO) | 92,394 | 84,245 |
Tanate Phutrakul (CFO) | 25,619 | 19,494 |
Ljiljana Čortan (CRO) | 10,228 | 4,478 |
ING Group Annual Report 2023 on Form 20-F 116
2024 Executive Board remuneration
Under the Executive Board remuneration policy, the Supervisory Board considers base salary increases annually for the Executive Board members and takes into account a range of factors including salary increases of other
employees within ING, increase of general price indices and market competitiveness. In consideration of these factors and that no base salary increases were awarded to the Executive Board members in the last three years,
the Supervisory Board has determined that an increase is appropriate. The Supervisory Board has awarded a salary increase of 4.0 percent to each of the Executive Board members. For 2024 the following target areas and
percentage weightings will be taken into account for the Executive Board members:
8. 2024 Target areas | CEO | CFO | CRO | ||
Weighting | Weighting | Weighting | |||
Financial | Profit before Tax | 16.7% | 16.7% | 8.3% | |
Return on Equity | 16.7% | 16.7% | 8.3% | ||
Operational Expenses | 16.7% | 16.7% | 8.3% | ||
50% | 50% | 25% | |||
Non-financial | Customer | •Increase number of primary customers, as it leads to deeper relationships, greater customer satisfaction and, ultimately, customers choosing ING for more of their financial needs; •Increase customer satisfaction of Retail and Wholesale customers by increasing NPS. | 7.5% | 5% | NA |
Risk & Regulatory | •Manage financial risk within risk appetite with a specific focus on the revision of the use of internal models; •Manage non-financial risk within risk appetite with a specific focus on identity and access management and operational resilience. •Deliver on regulatory programmes, including KYC. | 15% | 17.5% | 45% | |
Strategy | Execution of the digitalisation strategy by: •Increase digitisation and STP rate of customer processes; •Increase efficiency of risk and finance processes while maintaining the effectiveness of controls. | 12.5% | 12.5% | 15% | |
Environment & Social | •Environment: •Increase sustainable volume mobilised; •Support the transition of the most carbon-intensive sectors in Wholesale Banking (being Power Generation, Oil & Gas, Cement, Steel, Automotive, Aviation, Shipping and Commercial Real Estate) towards a better carbon performance, in line with our 2030 decarbonisation target; •Prepare for CSRD disclosure requirements; •Implementation of ESG risk assessment methodology following CSRD requirements. •Social: •Strengthen organisational health with a focus on four priority areas: strategic clarity, role clarity, customer focus, operationally disciplined; •Increase gender balance in ING's leadership cadre. | 15% | 15% | 15% | |
50% | 50% | 75% | |||
Total | 100% | 100% | 100% | ||
ING Group Annual Report 2023 on Form 20-F 117
Remuneration Supervisory Board
Supervisory Board remuneration policy
The Supervisory Board remuneration policy is disclosed in full on ing.com in the section ‘Remuneration’.
The Supervisory Board fees for 2023 remained the same as in 2022, as shown in the table below:
9. Supervisory Board remuneration structure | |
Amounts in euros | 2023 |
Annual remuneration | |
Chairperson | 125,000 |
Vice-chairperson | 95,000 |
Member | 70,000 |
Committee fees (annual amounts) | |
Committee chairperson | 20,000 |
Committee member | 10,000 |
Attendance fees (per meeting) | |
Attendance fee outside country of residence | 2,000 |
Attendance fee outside continent of residence | 7,500 |
All fees are paid fully in cash. No variable remuneration is provided to ensure that the Supervisory Board
members remain independent and can provide objective stewardship of ING, thereby contributing to the
long-term performance of the company. The Supervisory Board members are not eligible for retirement
benefits nor any other benefits in relation to their position on the Supervisory Board. Members of the
Supervisory Board are reimbursed for their travel and ING-related business expenses (such as
reimbursement of legal costs under the Directors & Officers indemnity provided by ING).
2023 Supervisory Board remuneration
The image on the right side shows the remuneration, including attendance fees for each Supervisory Board
member. All fees for the Supervisory Board are paid directly by ING.
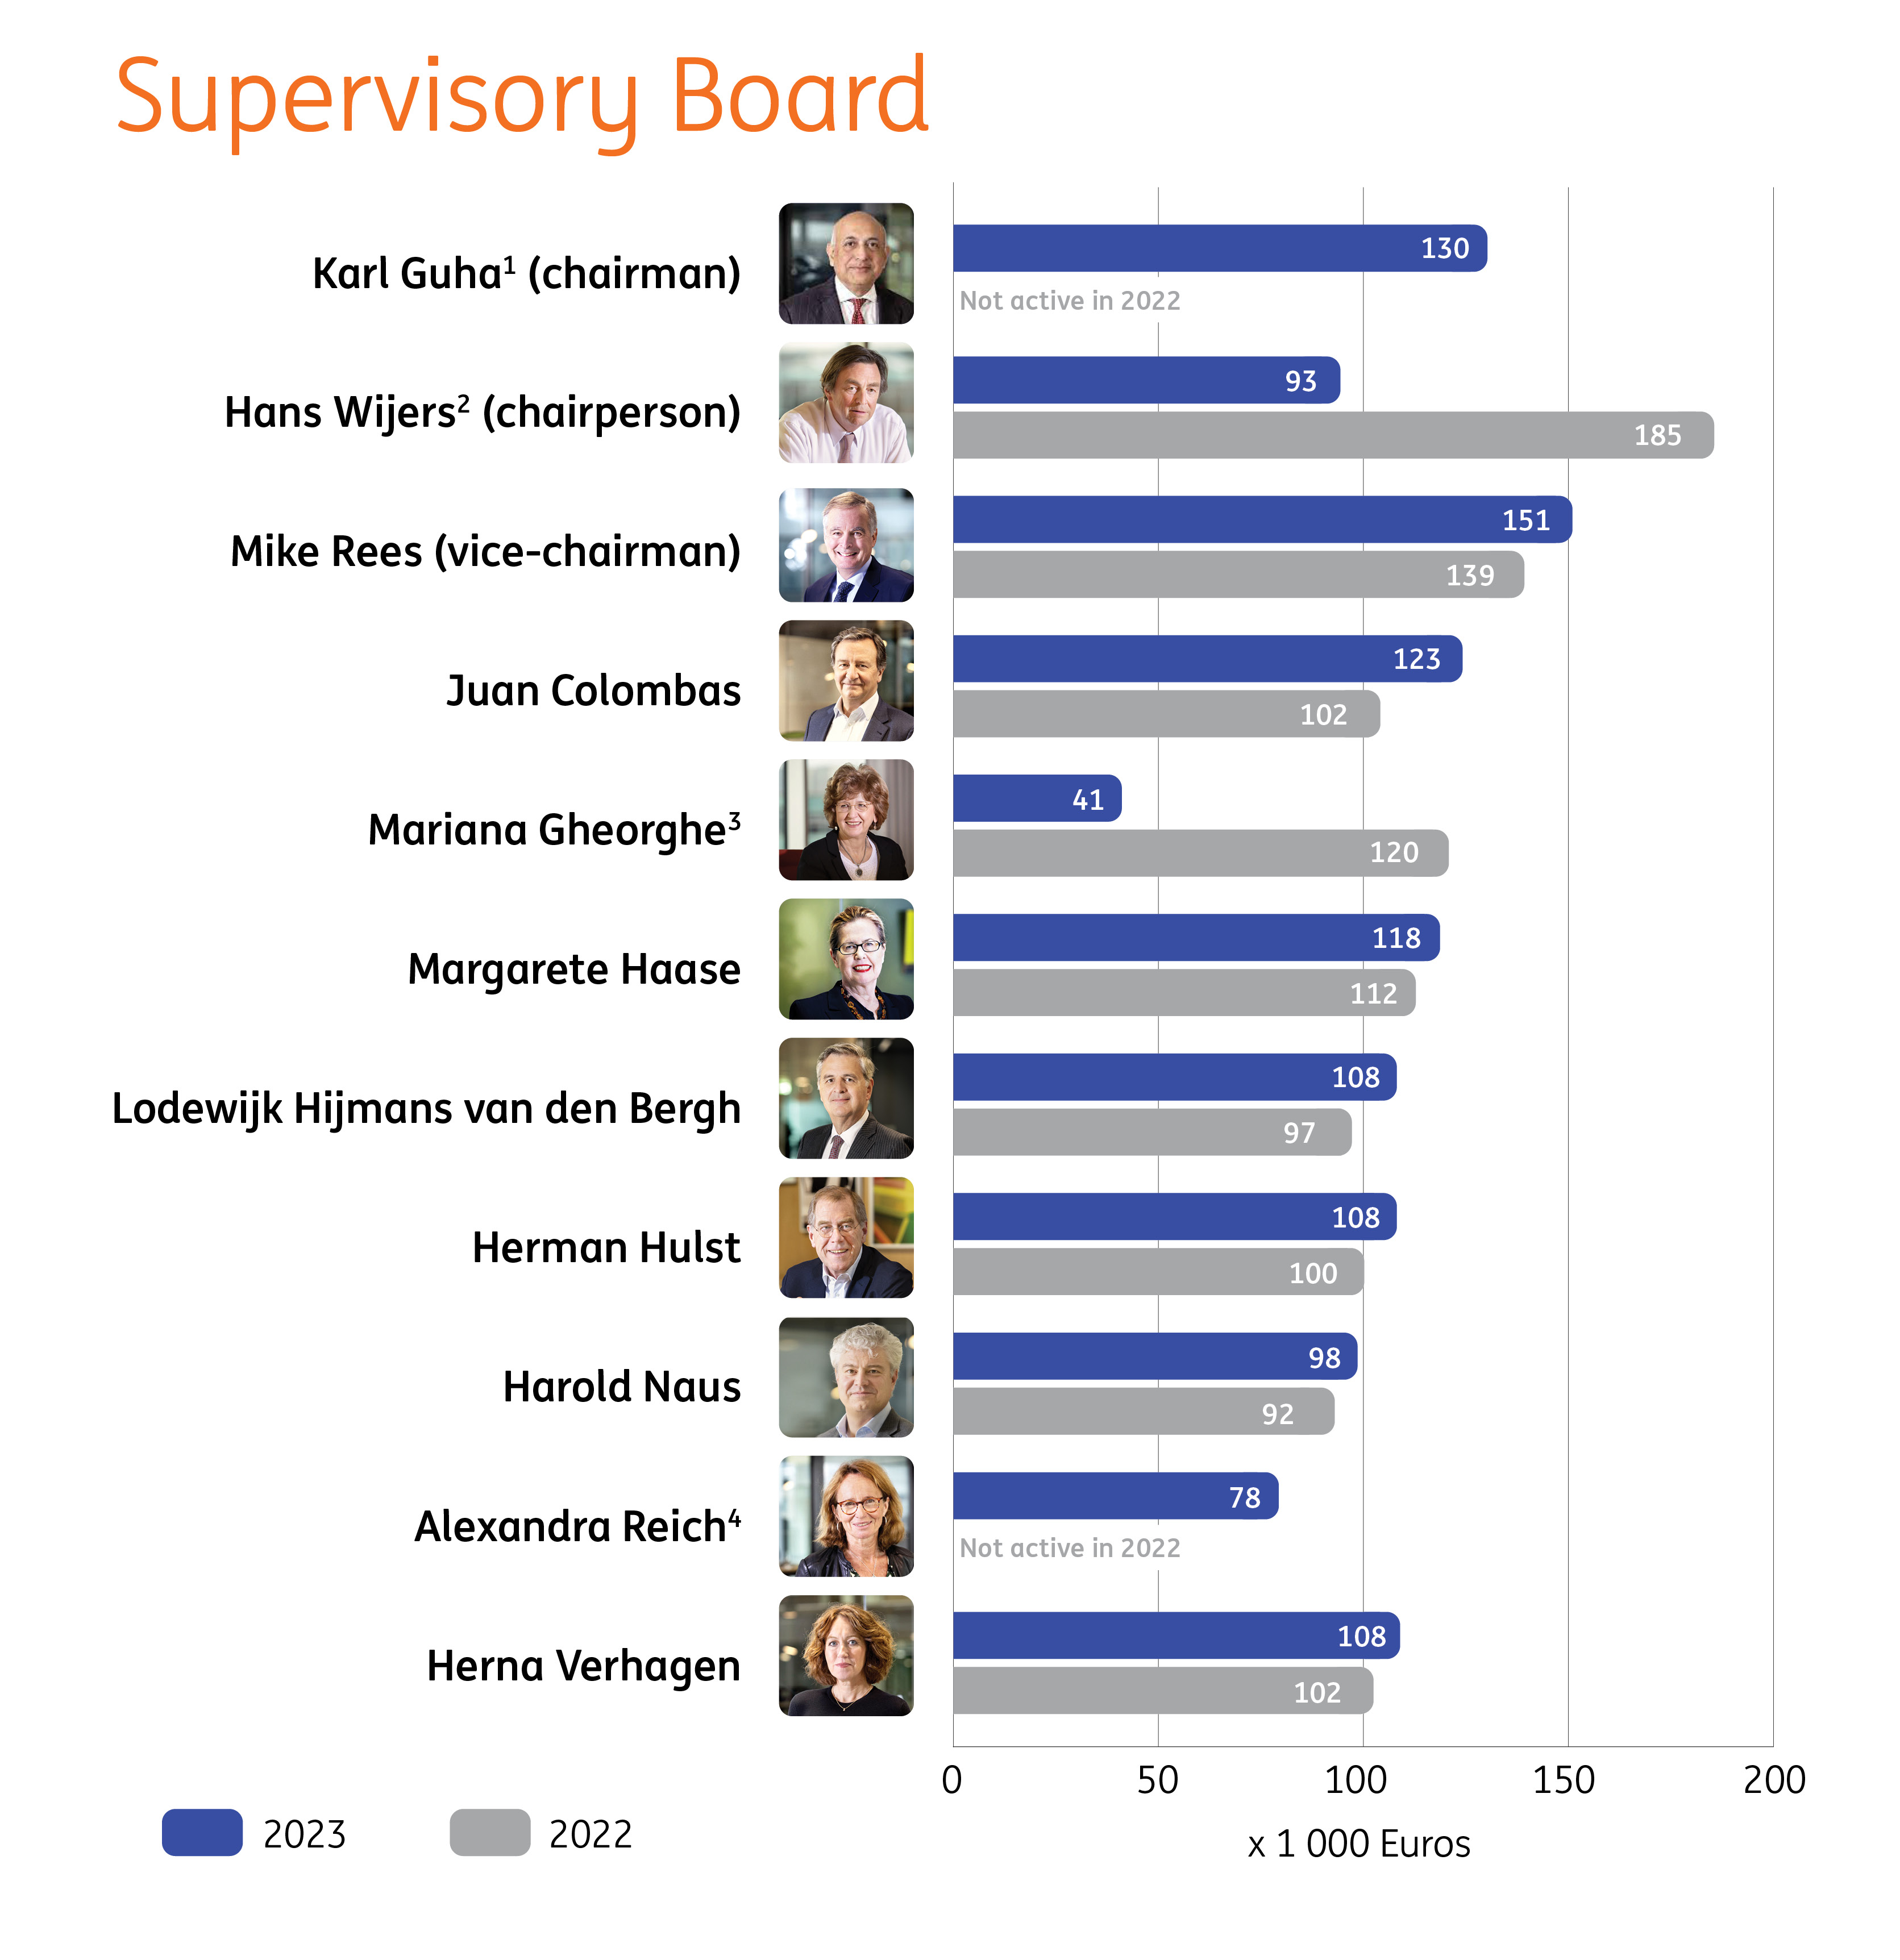
1Karl Guha was appointed to the Supervisory Board by the AGM on 24 April 2023 with effect from 1 July 2023.
2Hans Wijers retired on 30 June 2023. The remuneration figures for 2023 reflect a partial year as a member of the Supervisory Board.
3Mariana Gheorghe retired after the AGM on 24 April 2023. The remuneration figures for 2023 reflect a partial year as a member of the
Supervisory Board.
4Alexandra Reich was appointed to the Supervisory Board by the AGM on 24 April 2023 with effect from that date.
ING Group Annual Report 2023 on Form 20-F 118
Loans and advances to Supervisory Board members
Supervisory Board members may obtain banking and insurance services from ING and its subsidiaries in the
ordinary course of their business and on terms that are customary in the sector. The Supervisory Board
members do not receive privileged financial services. On 31 December 2023, there were no loans or
advances outstanding to Supervisory Board members.
ING shares held by Supervisory Board members
Supervisory Board members are permitted to hold ING shares as a long-term investment. The table below
shows the holdings by members of the Supervisory Board on 31 December 2023 and 2022.
10. ING shares held by Supervisory Board members | ||
Numbers of shares | 2023 | 2022 |
Herman Hulst | 3,650 | 3,650 |
Harold Naus | 1,645 | 1,645 |
2024 Supervisory Board remuneration
The Supervisory Board remuneration policy is aimed at enabling ING to attract qualified Supervisory Board
members with the ability, experience, skills, values and behaviours to deliver on ING's strategy and support
ING's purpose. The remuneration level should be aligned with responsibilities, time spent and the
remuneration level in the peer group. The level of fees and remuneration for the ING Supervisory Board has
not changed since 2016. Since then the demands on the Supervisory Board members have increased
significantly. The annual remuneration and committee fees of the Supervisory Board are significantly below
the median of our peer group.
An amended Supervisory Board remuneration policy will be presented for adoption by shareholders at the
2024 Annual General Meeting. This new policy will include the possibility of an annual indexation of the fees
of Supervisory Board members based on the salary increases for the wider workforce within ING.4 In line
with this, the annual remuneration and committee fees will be increased by 5.4 percent for the year 2024.
This indexation is subject to adoption at the 2024 Annual General Meeting of the new Supervisory Board
remuneration policy and would take effect retroactively from 1 January 2024. After the indexation increase,
the Supervisory Board remuneration will remain well below the market median. This results in the following
amounts:
11. Supervisory Board remuneration | |
Amounts in euros | 2024 |
Annual remuneration | |
Chairperson | 131,700 |
Vice-chairperson | 100,100 |
Member | 73,700 |
Committee fees (annual amounts) | |
Committee chairperson | 21,000 |
Committee member | 10,500 |
Attendance fees (per meeting) | |
Attendance fee outside country of residence | 2,000 |
Attendance fee outside continent of residence | 7,500 |
By annually indexing the Supervisory Board fees, ING will continue to progress towards paying its
Supervisory Board members just below the median bringing fee levels more in line with peers and with the
levels adequate to attract and retain qualified (international) Supervisory Board members.
ING Group Annual Report 2023 on Form 20-F 119
4 Included are all countries within the Eurozone where ING operates the full scope of banking services.
General information impacting all staff
FOR INFORMATION ONLY AT 2024 ING GROEP N.V. ANNUAL GENERAL MEETING (AGM)
The primary objective of ING’s remuneration principles is to attract, motivate and retain qualified expert
leaders as well as senior staff (including Executive Board members) and other highly qualified staff who
have the desired Orange Code values and behaviours, skills and knowledge to deliver on ING’s purpose in a
sustainable way.
The remuneration principles are an integral part of ING’s strategy and risk profile. They maintain a
sustainable balance between short- and long-term value creation and build on ING’s long-term
responsibility towards its employees, customers, shareholders and other stakeholders. Our approach to the
remuneration principles did not change in 2023.
Our remuneration principles apply to all staff and are embedded in ING’s Remuneration Regulations
Framework (IRRF) and our people offer (OPO). The OPO sets out ING’s differentiating offer as an employer in
the job market and states what we ask from our people in return. It gives guidance to our global people
practices, while supporting our strategy. The IRRF and OPO comply with relevant international and local
legislation and regulations.
In 'Social' under 'Unlocking our people's full potential', ING provides gender pay gap information.
Our remuneration principles
Our remuneration principles apply to all employees and comprise the following:
Aligned with business strategy ING’s remuneration principles are aligned with the business strategy and company goals. |
Creates long-term value ING’s remuneration principles contribute to long-term value creation and support a focus on the long-term interests of its stakeholders, including employees, customers and shareholders. |
Responsible and fair In line with our Orange Code values and behaviours, ING acts responsibly and treats staff fairly across the globe. |
Mitigates risk Risk management is an enabler of long-term value creation. ING ensures its remuneration principles are properly correlated with its risk profile and stakeholder interests. |
Performance driven ING operates a fair, objective and transparent performance management process linked to remuneration to steer and motivate all employees to deliver on its strategic goals, aiming to reward success and prevent rewarding for failure. |
Gender-neutral All staff members will be equally remunerated for equal work or work of equal value, irrespective of their gender. |
Sustainable ING supports the sustainable recruitment, engagement and retention of all employees. |
ING Group Annual Report 2023 on Form 20-F 120
Performance management
We aim to reward for success and avoid rewarding for failure. That is why ING’s remuneration approach is
strongly linked to a robust and transparent performance management process. Outcomes of performance
evaluations (including collective and individual risk assessments) provide input for remuneration.
Our people are a crucial enabler of our ‘Making the difference’ strategy, and we need to support them in
unlocking their full potential. An effective performance culture is necessary to help our people reach their
potential.
Step Up Performance Management is our global performance management approach applicable to almost
all employees. It aims to improve people’s individual performance, and thereby team performance and
ultimately ING's performance. Step Up Performance Management is one of our people practices that helps
to increase focus, alignment and transparency. We do this through continuous conversations between
managers, employees and teams. To support these conversations, there are three formal moments to
discuss performance during the year: target-setting, mid-year review and year-end evaluation.
For most countries, we evaluate performance according to two dimensions:
•Job: the impact employees have in their daily work on an individual and team level, based on job targets
and factors such as qualitative job description, dynamic planning and specific selected quantitative
priorities.
•Orange behaviours: we aim to boost productivity and steer personal development through the Orange
Behaviours. We expect all employees to act in line with ING’s Orange Code and the underlying behaviours
to deliver on ING's purpose in a sustainable way.
There are some countries (Australia, Poland and the Netherlands) that also have Stretch Ambition as a
performance dimension:
•Stretch ambitions: we ask people to set ambitions, describing how to contribute beyond their day-to-day
role, focusing on the main priorities and long-term success of ING.
All targets are agreed between the employee and their manager, as well as within management teams, to
ensure consistency across the organisation. ING uses three ratings to evaluate performance: excellent, well
done and improvement required.
Step Up Performance Management does not prescribe the targets employees should set. However, the
following regulatory requirements apply to specific groups:
•For employees eligible for variable remuneration, a minimum of 50 percent non-financial priorities.
•For all employees in control functions (Risk, Compliance and Audit), non-financial targets are
predominantly applied.
•For identified staff in risk-taking roles, risk mitigation measures may lead to a downwards adjustment of
the performance outcome and negatively affect variable remuneration (a risk modifier can be applied).
In order to further increase the effectiveness of our Step Up Performance Management approach, we are
currently refreshing the framework as we will mention under the section '2023 specifics'. From 2024, the
following changes will be implemented:
•We will make use of a five-point rating scale instead of a three-point scale to evaluate performance, as
this will allow for more nuanced performance evaluations and better differentiation.
•Performance will be evaluated based on Job and Orange Behaviours performance. The majority of the
countries will implement this change. By removing the Stretch Ambition as a performance dimension, we
will be able to focus more on fewer targets.
Total direct compensation
ING aims to provide a total direct compensation level for expected business and individual performance that
is, on average, at the median of the markets in which ING operates. ING's main reference market against
which we compare and benchmark our compensation levels consists of other European-headquartered
banks and financial services organisations that are comparable in terms of size, business mix and scope.
This reference market is reviewed annually so as to ensure our peer firms remain appropriate and our pay
levels market competitive.
The approach taken in determining the reference market is to i.) ensure that the pay strategy of the firms in
the peer group is comparable to ING's pay strategy, ii.) sound and defensible when explained to
stakeholders, iii.) reflective of similar company attributes and core competencies for talent, iv.) consistent
with business and financial scope characteristics, and v.) comprehensive enough to stand up over time to
changes in the market (e.g. M&A, divestiture, etc.). In addition to the core peer group, consisting of
European-headquartered banks and financial services organisations which applies to all countries in which
ING operates, ING has not only identified additional local banks and financial services organisations in order
to capture the local dynamics (including the local talent pool), but also technology firms that serve as a
secondary reference point for benchmarking certain tech roles.
Fixed remuneration represents a sufficiently high proportion, in line with the level of expertise and skills, and
allows a fully flexible variable remuneration award. Furthermore, the level of fixed remuneration allows
variable remuneration to be reduced to zero. Variable remuneration is performance-driven, subject to
regulatory caps, and prevents excessive risk-taking.
ING Group Annual Report 2023 on Form 20-F 121
The comprehensive process around variable remuneration
The awarding of variable remuneration, where applicable, is based on group, business line and individual
performance criteria unless local legislation prescribes otherwise. The criteria used to measure performance
is aligned with the business strategy, objectives, corporate culture, values and long-term interests of ING. In
all ING countries, we adhere to the applicable variable remuneration caps.
For Identified Staff (i.e. staff considered to have a material impact on ING’s risk profile), at least 40 percent of
variable remuneration is deferred over a period of four or five years (depending on the level of seniority)
with a tiered vesting schedule. Furthermore, at least 50 percent of variable remuneration is awarded in
equity (or equity-linked instruments unless local legislation prescribes otherwise). The deferral scheme and
instruments used to deliver variable remuneration awards align with ING's long-term performance and risk
management framework.
The award of discretionary variable remuneration is based on a clear, transparent and robust mechanism
for measuring performance and applying adjustments for ex-ante and ex-post risks (the Variable
Remuneration Accrual Model or VRAM). The VRAM construct follows a five-step process, as outlined below,
leading to risk-adjusted variable remuneration pools determined at a Group- and business-line level. The
2023 VRAM set-up was approved by the Management Board and Supervisory Board.
1.Target VR Pool baseline ('starting point') which is the aggregate of individual target variable
remuneration amounts for all eligible employees across ING.
2. Performance hurdles, which must be met in order to unlock the discretionary variable remuneration
pools. These are:
•The Common Equity Tier 1 (CET1) ratio must be at or above the threshold established by applicable
regulations;
•The return on equity (reported RoE)5 is equal to or higher than the percentage determined at the
beginning of each performance year by the Management Board Banking and the Supervisory Board.
In addition, where capital (CET1) is below risk appetite, a downward adjustment may be applied to reduce
the variable remuneration down to zero.
3. Financial and non-financial risk performance, which is an assessment against a balanced mix of
performance targets. Financial measures (e.g. profit, return on equity) are used to drive long-term growth,
financial strength and affordability. In addition, different types of non-financial performance measures
(e.g. customer, risk and regulatory, strategy, environment and social) are also taken into consideration.
Here, ING has a responsibility to society to take into account relevant environmental, social & governance
(ESG) matters when determining our remuneration policies. ESG is a key area of focus in the VRAM
scorecards where people, sustainability and regulatory commitments are used to provide a clear line
of sight into ING's ESG strategy, ambitions and targets, and encourage broader responsibility to support
real change from the wider workforce.
4. CEO discretion can be exercised to adjust the proposed variable remuneration pools. The CEO considers
several performance factors when making this decision. This discretion is checked by the Supervisory
Board and requires its approval.
5. Risk adjustments are the final and independent step in the process where there is an assessment made
by the CRO to risk-adjust the variable remuneration pools. Here, the CRO may recommend risk
adjustments to variable remuneration pools (and potentially down to zero) on a collective (e.g. at a group,
business line, entity and country level) and individual basis across additional ex-ante and ex-post risk
adjustment measures. All relevant financial and non-financial risks will be considered within this step,
both on a current and future risk basis (i.e. ex-ante risk adjustments), to ensure the VRAM outcome is
appropriate in the context of overall risk performance. In addition, ex-post risk adjustments, including
collective or one-off risk events, are a key element in the process of determining variable remuneration
pools. The ex-ante and/or ex-post risk adjustments require Supervisory Board approval, taking into
account the input of the Risk function and the advice of the Risk Committee and Remuneration
Committee.
The final risk-adjustment measure lies in the individual performance assessment itself. An employee’s
performance is extensively assessed before variable remuneration is awarded. Every manager carefully
assesses the performance delivered by their individual team members on the basis of pre-agreed
performance objectives and in line with the Step Up Performance Management framework. In addition,
managers have discretion to lower the proposed variable remuneration if risk-taking is perceived as
inappropriate. In this way, variable remuneration is aligned with any additional risks identified on an
individual basis during the performance year.
Additional risk requirements apply to Identified Staff who are considered risk-takers in accordance with
Capital Rights Directive (CRD). These risk requirements set the minimum standards to be met during the
performance year. Deviation from these standards may lead to a downward adjustment of the variable
remuneration, a so-called risk modifier. This process is run independently by the Risk function, and the CRO
is ultimately responsible for providing a recommendation to the Supervisory Board for decision making.
Finally, a post-award risk assessment can be applied. This assessment analyses whether any events or
findings occurred that should lead to a downward adjustment of variable remuneration, including for
previous years, by applying a holdback (i.e., in-year variable remuneration award reduction, forfeiture of up
ING Group Annual Report 2023 on Form 20-F 122
5 Annualised net result divided by average IFRS-EU shareholders' equity excluding reserved profits not included in CET1 capital.
to 100 percent of the awarded, but unvested, variable remuneration) or clawback (surrender of up to 100
percent of the paid or vested variable remuneration).
Shareholders’ mandate to exceed 100 percent variable remuneration cap
ING’s remuneration policies comply with international and local legislation and regulations. Under the Dutch
WBFO (which sets various requirements on remuneration), financial institutions are permitted to set a
variable remuneration cap higher than 100 percent (but not higher than 200 percent) of fixed remuneration
for employees outside of the European Economic Area (EEA), provided that the higher cap is approved by
shareholders and does not conflict with ING’s capital adequacy requirements.
At the 2021 AGM, shareholders approved to apply an increased maximum percentage of up to 200 percent
for employees outside the EEA for a period of five performance years until end-2026. For 2023, it was
applied to 34 employees worldwide. This mandate is used on an exceptional basis by ING and in 2020, 2021
and 2022 also applied to a limited number of employees worldwide.
2023 specifics
Following a full review of Step Up Performance Management (including employee surveys, leadership
interviews, market research, gap analysis), several changes were introduced in 2023 which will come into
full effect for all of ING Group employees as from performance year 2024. We have also embarked on a
project to improve the relationship between performance results and remuneration, focusing on more
transparent pay structures in order to provide employees with more confidence in pay fairness.
ING awards variable remuneration across the global organisation in line with our remuneration principles,
global and local legislation, regulations and market practices. The awarding of variable remuneration, where
applicable, is based on group, business line and individual performance criteria, both financial, non-financial
and risk-based, and comes in the form of both discretionary and collective variable remuneration.
Collective variable remuneration is based on collective labour agreements that are driven by regulation, law
and/or workers council agreements in various countries. Over the past years the total amount of collective
variable remuneration has been relatively stable and typically accounts for around 20 percent of the total
spend on variable remuneration.
In 2023, our capital base and liquidity remained strong. From a financial performance perspective, the
'underlying' financial results were also strong, among others due to higher liability NII, strong results in
Financial Markets and Treasury as well as lower risk costs, partially countered by higher salary increases and
higher bonus accruals. Non-financial performance (customer, ESG, strategic transformation programmes)
was largely as planned. From a risk perspective, both financial risk management and non-financial risk
performance was good leading to positive adjustments across most business lines. Overall, this resulted in a
risk-adjusted discretionary Group VR pool at €401.0 million, equating to an 8.8 percent increase against the
target discretionary VR baseline ('starting point') and 23.5 percent increase versus the previous performance
year.
The total actual amount of both discretionary and collective variable remuneration awarded to all eligible
employees globally for 2023 was €514.9 million (€113.8 million in collective variable remuneration),
compared to total staff expenses of €6,725 million. For 2022, the total amount was €426.6 million (€101.9
million in collective variable remuneration) on €6,152 million staff expenses.
In 2023, 19 employees, excluding members of the Management Board Banking, were awarded total annual
remuneration (including employer pension contributions and excluding severance payments made) of €1
million or more. Please see our CRR disclosure for further details on ing.com under the section ‘Annual
reports’.
ING Group Annual Report 2023 on Form 20-F 123
C.Board practices
For information regarding board practices, see Item 6.A.
Severance payments to members of the Executive Board
The contracts entered with the members of the Executive Board provide for severance payments that
become due upon termination of the applicable member’s contract, including if termination occurs in
connection with a public bid as defined in section 5:70 of the Dutch Financial Supervision Act. Severance
payments to the members of the Executive Board are limited to a maximum of one year’s fixed salary.
D. Employees
The average number of internal employees at a full time equivalent basis was 59,434 at the end of 2023, of
which 14,449 or 24%, were employed in the Netherlands. Substantially all of the Group’s Dutch employees
are subject to a collective labor agreement covering ING in the Netherlands.
The distribution of employees with respect to the Group’s continuing operations for the years 2023, 2022
and 2021 were as follows:
Number of employees | |||||||||
Netherlands | Rest of the world | Total | |||||||
2023 | 2022 | 2021 | 2023 | 2022 | 2021 | 2023 | 2022 | 2021 | |
Total average number of internal employees at full time equivalent basis | 14,449 | 14,488 | 15,138 | 44,985 | 43,081 | 42,523 | 59,434 | 57,569 | 57,660 |
The Group employs a number of temporary employees. The average number of temporary employees, not
included in the table above, at a full time equivalent basis was 3,817 at the end of 2023.
E.Share ownership
For information regarding share ownership, see Item 6.B of this Form 20-F, Note 46 'Related parties' and
Note 25 'Staff expenses' to the consolidated financial statements.
F.Disclosure of a registrant’s action to recover erroneously
awarded compensation
Not applicable.
Reference is made to Exhibit 97 to this Form 20-F for the policy on 'Clawback rules for erroneously awarded
variable remuneration for executive officers'.
ING Group Annual Report 2023 on Form 20-F 124
Item 7.Major shareholders and related party transactions
A. Major shareholders
ING Group ordinary shares are listed on the stock exchanges of Amsterdam (Euronext Amsterdam) and
Brussels (Euronext Brussels). ING Group American Depositary Shares (“ADSs”) are listed on the New York
Stock Exchange (NYSE). Options on ING Group ordinary shares or in the form of American depository
receipts (ADRs) are traded on the Euronext Amsterdam Derivative Markets and the Chicago Board Options
Exchange.
Major shareholders as filed with SEC
According to the U.S. Securities and Exchange Commission, shareholders in a company which have
registered a class of their equity securities under the Exchange Act, are required to file beneficial owner
reports if the ownership exceeds more than 5% of the outstanding shares of that class. The shareholder is
obliged to file Schedule 13D or 13G until their holdings drop below 5%.
To the best of our knowledge, as of 31 December 2023, no holder of ordinary shares or ADSs, other than
BlackRock Inc. held 5% or more of ING Group’s issued share capital.
On 29 January 2021, BlackRock, Inc. disclosed by way of a Schedule 13G filed with the SEC, beneficial
ownership of 289,185,500 ordinary shares of ING Group as of 31 December 2020, representing 7.4% of ING
Group’s issued share capital. On 1 February 2022, BlackRock, Inc. disclosed by way of a Schedule 13G filed
with the SEC, beneficial ownership of 292,129,468 ordinary shares of ING Group as of 31 December 2021,
representing 7.5% of ING Group’s issued share capital. On 11 February 2022, Capital Research Global
Investors disclosed by way of a Schedule 13G filed with the SEC, beneficial ownership of 224,540,855
ordinary shares of ING Group as of 31 December 2021, representing 5.8% of ING Group’s issued share
capital. On 1 February 2023, BlackRock, Inc. disclosed by way of a Schedule 13G filed with the SEC,
beneficial ownership of 259,211,756 ordinary shares of ING Group as of 31 December 2022, representing
7.0% of ING Group's issued share capital. On 13 February 2023, Capital Research Global Investors disclosed
by way of a Schedule 13G filed with the SEC, beneficial ownership of 57,557,399 ordinary shares of ING
Group as of 30 December 2022, representing 1.5% of ING Group's issued share capital. On 6 February
2024, BlackRock, Inc. disclosed by way of a Schedule 13G filed with the SEC, beneficial ownership of
255,592,935 ordinary shares of ING Group as of 31 December 2023, representing 7.3% of ING Group's
issued share capital.
Major shareholders as filed with AFM
Pursuant to section 5.3 of the Dutch Financial Supervision Act (“Major Holdings Rules”), any person who,
directly or indirectly, acquires or disposes of an interest in the voting rights and/or the capital of (in short)
a public limited company incorporated under the laws of the Netherlands with an official listing on a stock
exchange within the European Economic Area, as a result of which acquisition or disposal the percentage
of his voting rights or capital interest - whether through ownership of shares, American depositary
receipts (ADRs) or any other financial instrument, whether stock-settled or cash-settled, such as call or put
options, warrants, swaps or any other similar contract - reaches, exceeds or falls below the threshold
levels of 3%, 5%, 10%, 15%, 20%, 25%, 30%, 40%, 50%, 60%, 75% and 95% is required to provide updated
information on its holdings and are recorded in the Dutch AFM (Authority for the Financial Markets)
register (http://www.afm.nl/nl-en/professionals/registers/meldingenregisters/substantiele-deelnemingen).
This notification obligation also applies in respect of gross short positions that exceed the relevant
threshold levels.
In addition, any person who acquires or disposes of a net short position relating to the issued share capital
of ING Group, whether by a transaction in shares or ADRs, or by a transaction creating or relating to any
financial instrument where the effect or one of the effects of the transaction is to confer a financial
advantage on the person entering into that transaction in the event of a change in the price of such
shares or ADRs, is required to notify the AFM if, as a result of such acquisition or disposal, the person’s net
short position reaches, exceeds or falls below 0.1% of the issued share capital of ING Group and each 0.1%
above that. Each reported net short position equal to 0.5% of the issued share capital of ING Group and
any subsequent increase of that position by 0.1% will be made public via the short selling register on
afm.nl/en/.
Based on the AFM register as per 31 December 2023, shareholders with (potential) holdings of 3% or more
are Norges Bank (3.00% interest and voting rights reported on 17 August 2022), BlackRock Inc. (5.81%
interest and 7.10% voting rights reported on 11 August 2023), the Goldman Sachs Group Inc. (4.27%
interest and voting rights reported on 15 December 2023), Capital Research and Management Company
(5.01% voting rights and interest rights reported on 19 December 2023), and ING Group N.V. (4.37%
interest rights, no voting rights reported on 28 December 2023).
ING Group Annual Report 2023 on Form 20-F 125
As a result, other than based on information available from public filings available under the applicable
laws of any other jurisdiction, ING Groep N.V. is not aware of any changes in the ownership of ordinary
shares or ADSs between the thresholds levels mentioned in the previous sentence.
On 31 December 2023, ING Groep N.V. and its subsidiaries held 154,571,480 ordinary shares or ADSs,
representing 4.42% of ING Group’s issued share capital. ING Groep N.V. does not have voting rights in
respect of shares and ADSs it holds or which are held by its subsidiaries.
On 31 December 2023, no person is known to ING Groep N.V. to be the owner of more than 10% of the
ordinary shares or ADSs.
As of 31 December 2023, members of the Supervisory Board and their related third parties held 5,295
Ordinary Shares. Members of the Supervisory Board do not hold ING options.
As at 31 December 2023, members of the Executive Board and their related third parties held 128,241
ordinary shares.
Change of control matters
As at 31 December 2023 ING Groep N.V. was not a party to any material agreement that becomes
effective, or is required to be amended or terminated in case of a change of control of ING Groep N.V.
following a public bid as defined in the Dutch Financial Supervision Act. ING Groep N.V.’s subsidiaries may
have customary change of control arrangements included in agreements related to various business
activities, such as joint venture agreements, letters of credit and other credit facilities, ISDA-agreements,
hybrid capital and debt instruments, reinsurance contracts and futures and option trading agreements.
Following a change of control of ING Groep N.V. (as the result of a public bid or otherwise), such
agreements may be amended or terminated, leading, for example, to an obligatory transfer of the
interest in the joint venture, early repayment of amounts due, loss of credit facilities or reinsurance cover
and liquidation of outstanding futures and option trading positions.
As of 31 December 2023 ING Groep N.V. was not aware of any arrangements the operation of which may
result in a change of control of ING Groep N.V.
B. Related Party Transactions
In the normal course of business, ING Group enters into various transactions with related parties. Parties
are considered to be related if one party has the ability to control or exercise significant influence over the
other party in making financial or operating decisions. Related parties of ING Group include, among others,
its associates, joint ventures, key management personnel, and various defined benefit and contribution
plans. Transactions between related parties include rendering or receiving of services, leases, transfers
under finance arrangements and provisions of guarantees or collateral. There are no significant provisions
for doubtful debts or individually significant bad debt expenses recognised on outstanding balances with
related parties.
ING Group has entered into various transactions with related parties. For more information, reference is
made to Note 46 “Related parties” in the consolidated financial statements.
As described under “Item 6. Directors, Senior Management and Employees”, some members of the
Supervisory Board are current or former senior executives of leading multi-national corporations based
primarily in the Netherlands. ING Group may at any time have lending, investment banking or other
financial relationships with one or more of these corporations in the ordinary course of business on terms
which we believe are no less favorable to ING than those reached with unaffiliated parties of comparable
creditworthiness.
C. Interests of experts and counsel
This item does not apply to annual reports on Form 20-F.
ING Group Annual Report 2023 on Form 20-F 126
Item 8.Financial information
A.Consolidated statements and other financial information
Consolidated statements
For information regarding consolidated statements and other financial information, see Item 18 of this
Form 20-F.
Legal Proceedings
For a description of ING’s legal proceedings, see Note 42 'Legal proceedings' in the consolidated financial
statements.
Policy on dividend distribution
ING’s distribution policy is a pay-out ratio of 50% of resilient net profit and additional distributions in case
of structural excess capital. For detailed information on ING’s 2023 dividend, reference is made to Note 47
‘Capital Management’.
Cash distributions on ING Groups ordinary shares are generally paid in Euros. However, the Executive
Board may decide, with the approval of the Supervisory Board, to declare dividends in the currency of a
country other than the Netherlands in which the shares are traded. Amounts payable to holders of ADSs
that are paid to the Depositary in a currency other than dollars will be converted to dollars and subjected
to a charge by the Depositary for any expenses incurred by it in such conversion.
If the Executive Board has been designated as a body authorised to resolve to issue shares, it may decide,
with the approval of the Supervisory Board, that a distribution on ordinary shares shall be made in the
form of ordinary shares instead of cash or to determine that the holders of ordinary shares shall be given
the choice of receiving the distribution in cash or in the form of ordinary shares on such terms as the
Executive Board, with the approval of the Supervisory Board, may decide.
The right to dividends and distributions in respect of the ordinary shares will lapse if such dividends or
distributions are not claimed within five years following the day after the date on which they were made
available.
There are no legislative or other legal provisions currently in force in the Netherlands or arising under ING
Groups’ Articles of Association restricting the remittance of dividends to holders of ordinary shares, or
ADSs not resident in the Netherlands. Insofar as the laws of the Netherlands are concerned, cash
dividends paid in Euro may be transferred from the Netherlands and converted into any other currency,
except that for statistical purposes such payments and transactions must be reported by ING Group to
DNB and, further, no payments, including dividend payments, may be made to jurisdictions or persons,
that are subject to certain sanctions, adopted by the Government of the Netherlands, implementing
resolutions of the Security Council of the United Nations, or adopted by the European Union.
Dividends are subject to withholding taxes in the Netherlands as described under Item 10, “Additional
Information - Taxation - Netherlands Taxation”.
ING’s distribution policy may be changed at any time and there is no guarantee that any dividends or
other distributions will be made in accordance with the distribution policy in effect from time to time or at
all.
B. Significant changes
For information on subsequent events reference is made to Note 49 ‘Subsequent events’ of the
consolidated financial statements.
Since 31 December 2023, until the filing of this report, no other significant changes have occurred in the
financial statements of the Group included in “Item 18 Consolidated Financial Statements” of this
document.
ING Group Annual Report 2023 on Form 20-F 127
Item 9.The offer and listing
A.Offer and listing details
Ordinary Shares (nominal value EUR 0.01 per share) are traded on Euronext Amsterdam, the principal
trading market for the Ordinary Shares, under the symbol “INGA”. The Ordinary Shares are also listed on
the stock exchange of Euronext Brussels, under the symbol “INGA”. ADSs, representing an equal number
of Ordinary Shares, are traded on the New York Stock Exchange under the symbol “ING”.
B.Plan of distribution
This item does not apply to annual reports on Form 20-F.
C.Markets
For information regarding markets, see Item 9.A of this Form 20-F.
D.Selling shareholders
This item does not apply to annual reports on Form 20-F.
E.Dilution
This item does not apply to annual reports on Form 20-F.
F.Expenses of the issue
This item does not apply to annual reports on Form 20-F.
ING Group Annual Report 2023 on Form 20-F 128
Item 10.Additional information
A.Share capital
This item does not apply to annual reports on Form 20-F.
B.Memorandum and articles of association
For a description of ING’s memorandum and articles of association, please see Exhibit 2.1 “Description of
Securities Registered under Section 12 of the Exchange Act”, which is incorporated by reference herein.
Reference is made to Exhibit 1.1 to this Form 20-F for the articles of association.
C.Material contracts
There have been no material contracts outside the ordinary course of business to which ING Groep N.V. or
any of its subsidiaries is a party in the last two years.
D. Exchange controls
Cash distributions, if any, payable in Euros on Ordinary Shares and ADSs may be officially transferred from
the Netherlands and converted into any other currency without violating Dutch law, except that for
statistical purposes such payments and transactions must be reported by ING Groep N.V. to the Dutch
Central Bank and, further, no payments, including dividend payments, may be made to jurisdictions or
persons subject to certain sanctions, adopted by the government of the Netherlands or the European
Union.
E.Taxation
The following is a summary of certain Netherlands tax consequences, and the United States federal
income tax consequences, of the ownership of our Ordinary Shares or American Depositary Shares
(“ADSs”) by U.S. Shareholders (as defined below) who hold Ordinary Shares or ADSs as capital assets for
tax purposes.
For the purposes of this summary, a “U.S. Shareholder” is a beneficial owner of Ordinary Shares or ADSs
that is, for United States federal income tax purposes:
•an individual citizen or resident of the United States,
•a corporation organized under the laws of the United States or of any state of the United States, or any
entity taxable as United States corporation,
•an estate, the income of which is subject to United States federal income tax without regard to its
source, or
•a trust if a court within the United States is able to exercise primary supervision over the administration
of the trust and one or more United States persons have the authority to control all substantial
decisions of the trust.
Further, this summary is limited to U.S. Shareholders who are not, and are not deemed to be, a resident of
the Netherlands for Dutch tax purposes.
This summary is based on the United States Internal Revenue Code of 1986 and the laws of the
Netherlands, each as amended, their legislative history, existing and proposed regulations, published
rulings and court decisions, and the tax treaty between the United States and the Netherlands for the
Avoidance of Double Taxation and the Prevention of Fiscal Evasion with respect to Taxes on Income
(“Treaty”), all as applicable as of the date hereof. These laws are subject to change, possibly on a
retroactive basis. The information provided below is neither intended as tax advice nor purports to
describe all of the tax considerations that may be relevant to investors and prospective investors including
foreign, state or local tax consequences, estate and gift tax consequences, and tax consequences arising
under the Medicare contribution tax on net investment income or the alternative minimum tax. It should
not be read as extending to matters not specifically discussed, and investors should consult their own
advisors as to the tax consequences of their ownership and disposal of Ordinary Shares or ADSs. In
ING Group Annual Report 2023 on Form 20-F 129
particular, the summary does not take into account the specific circumstances of particular investors
(such as tax-exempt organizations, banks, insurance companies, dealers in securities, traders in securities
that elect to use a mark-to-market method of accounting for their securities holdings, investors whose
functional currency is not the U.S. dollar, investors that actually or constructively own 10% or more of the
combined voting power of the voting stock or of the total value of ING Groep N.V., investors that hold
Ordinary Shares or ADSs as part of a straddle or a hedging or conversion transaction or investors that
acquired or dispose of Ordinary Shares or ADSs as part of a wash sale for tax purposes, some of which
may be subject to special rules). If an entity or arrangement that is treated as a partnership for United
States federal income tax purposes holds the Ordinary Shares or ADSs, the United States federal income
tax treatment of a partner will generally depend on the status of the partner and the tax treatment of the
partnership. A partner in a partnership holding the Ordinary Shares or ADSs should consult its tax advisor
with regard to the United States federal income tax treatment of an investment in the Ordinary Shares or
ADSs.
Moreover, this summary does not discuss the Dutch tax treatment of a holder of Ordinary Shares or ADSs
that is an individual who receives income or capital gains derived from the Ordinary Shares and ADSs if
such income received or capital gains derived is attributable to the past, present or future employment
activities of such holder.
The summary is based in part upon the representations of the Depositary and the assumption that each
obligation in the Deposit Agreement and any related agreement will be performed in accordance with its
terms. In general, for United States federal income tax and Netherlands tax purposes, holders of ADSs will
be treated as the owners of the Ordinary Shares underlying the ADSs, and exchanges of Ordinary Shares
for ADSs, and exchanges of ADSs for Ordinary Shares, will not be subject to United States federal income
tax or Netherlands income tax. References to Ordinary Shares in this section include references to ADSs.
It is assumed, for purposes of this summary, that a U.S. Shareholder is eligible for the benefits of the
Treaty and that a U.S. Shareholder’s eligibility is not limited by the limitation on benefits provisions of the
Treaty.
Netherlands Taxation
Dutch dividend withholding tax
The Netherlands imposes a withholding tax on a distribution of a dividend at the statutory rate of 15%.
Dividends include:
1.dividends paid in cash and in kind;
2.deemed and constructive dividends;
3.the consideration for the repurchase or redemption of shares in excess of the qualifying average paid-
in capital unless such repurchase is made for temporary investment purposes or is exempt by law;
4.any (partial) repayment of paid-in capital not qualifying as capital for Dutch dividend withholding tax
purposes;
5.liquidation proceeds in excess of the qualifying average paid-in capital for Dutch dividend withholding
tax purposes; and
6.stock dividends up to their nominal value (unless distributed out of ING Groep N.V.’s qualifying paid-in
capital).
Reduction of Dutch dividend withholding tax based on Dutch law
Under certain circumstances, a reduction of Dutch dividend withholding tax can be obtained based on
Dutch law:
1.An exemption at source is available if the Dutch participation exemption applies and the Ordinary
Shares or ADSs are attributable to a business carried out in the Netherlands. To qualify for the Dutch
participation exemption, the U.S. Shareholder must generally hold at least 5.0 percent of our nominal
paid-in capital and meet certain other requirements.
2.An exemption at source is available for dividend distributions to certain qualifying corporate U.S.
Shareholders owning our Ordinary Shares or ADSs if such shareholder would have been able to apply
the Dutch participation exemption if it would have been resident of the Netherlands, unless such
shareholder holds the Ordinary Shares or ADSs with the primary aim or one of the primary aims to
avoid the levy of Dutch dividend withholding tax at the level of another person and the Ordinary Shares
or ADSs are not held for valid commercial reasons that reflect economic reality.
3.Certain tax exempt organizations (e.g. pension funds and excluding collective investment vehicles)
may be eligible for a refund of Dutch dividend withholding tax upon their request or in certain cases, an
exemption at source.
4.Upon request and under certain conditions, certain qualifying individual and corporate U.S
Shareholders of Ordinary Shares or ADSs which are not subject to personal or corporate income tax in
the Netherlands may request a refund of Dutch dividend withholding tax insofar the withholding tax
withheld on the gross dividend is higher than the personal or corporate income tax which would have
been due on the net dividend if they were resident or established in the Netherlands. This refund is
however not applicable when, based on the Treaty, the Dutch dividend withholding tax can be fully
credited in the United States by the U.S. Shareholder. However, it is unclear whether (i) which
ING Group Annual Report 2023 on Form 20-F 130
(financing) costs can be taken into account when determining the hypothetical personal or corporate
income tax due on the net income (ii) or how the Netherlands would determine whether, based on the
double taxation convention, a full credit is available in the country of residence of the holder for
purposes of this refund. See “United States Taxation—Taxes on dividends” for more information. The
provision in essence is intended to be a codification of certain judgments by both the European Free
Trade Association Court of Justice and the European Court of Justice that already indicated that in
certain circumstances a refund should be available prior to the introduction of the provision in Dutch
law. It is possible that this provision is an insufficient codification of these judgments and that based on
EU law a larger refund should be provided.
Reduction of Dutch dividend withholding tax based on the Treaty
Pursuant to the provisions of the Treaty, certain corporate U.S. Shareholders owning directly at least 10%
of our voting power are eligible for a reduction to 5% Dutch dividend withholding tax provided that the
U.S. Shareholder is the beneficial owner of the dividends received and does not have an enterprise or an
interest in an enterprise that is, in whole or in part, carried on through a permanent establishment or
permanent representative in the Netherlands to which the dividends are attributable. The Treaty also
provides for a dividend withholding tax exemption on dividends, but only for a shareholder owning directly
at least 80.0 percent of our voting power and meeting all other requirements.
Provided that certain conditions are met, under the Treaty dividends paid to qualifying exempt pension
trusts and other qualifying exempt organizations, as defined in the Treaty, are exempt from Dutch
dividend withholding tax. To obtain a refund of the tax withheld such qualifying exempt pension trusts are
required to file a request. Only if certain conditions are fulfilled, such qualifying exempt pension trusts
may be eligible for relief at source upon payment of the dividend. Qualifying exempt organizations (other
than qualifying exempt pension trusts) can only file for a refund of the tax withheld.
Anti-dividend stripping rules
Pursuant to the Dutch anti-dividend stripping rules, in the case of dividend-stripping, the 15% dividend
withholding tax cannot be reduced or refunded. Dividend-stripping is deemed to be present if the recipient
of a dividend is, contrary to what has been assumed above, not the beneficial owner thereof and is
entitled to a larger credit, reduction or refund of dividend withholding tax than the beneficial owner of the
dividends. Under these rules, a recipient of dividends will not be considered the beneficial owner thereof if
as a consequence of a combination of transactions a person other than the recipient wholly or partly
benefits from the dividends, whereby such person retains, whether directly or indirectly, an interest
similar to the shares on which the dividends were paid.
Credit for ING Groep N.V.
ING Groep N.V. may, with respect to certain dividends received from qualifying non-Netherlands
subsidiaries, credit taxes withheld from those dividends against the Netherlands withholding tax imposed
on certain qualifying dividends that are redistributed by ING Groep N.V., up to a maximum of the lesser of:
3% of the amount of qualifying dividends redistributed by ING Groep N.V.; and
3% of the gross amount of certain qualifying dividends received by ING Groep N.V.
The reduction is applied to the Dutch dividend withholding tax that ING Groep N.V. must pay to the Dutch
tax authorities and not to the Dutch dividend withholding tax that ING Groep N.V. must withhold.
Dutch conditional withholding tax
From 1 January 2024 onwards, in addition to Dutch dividend withholding tax, Dutch conditional
withholding tax may apply at a statutory rate of 25.8% on dividends and other (deemed) distributions to
certain affiliated (gelieerde) entities of ING Groep N.V. for the purpose of the Dutch Withholding Tax Act
2021 (Wet bronbelasting 2021).
The Dutch conditional withholding tax only applies on dividends and other (deemed) distributions to
entities that are resident (gevestigd), or have a permanent establishment to which the dividend or
distribution is attributable, in a jurisdiction that is listed in the yearly updated Dutch Regulation on low-
taxing states and non-cooperative jurisdictions for tax purposes (Regeling laagbelastende staten en niet-
coöperatieve rechtsgebieden voor belastingdoeleinden), and in certain deemed abusive situations.
An entity is generally affiliated within the meaning of the Dutch Withholding Tax Act 2021 if there is a
controlling relationship between such entity and ING Groep N.V.
Taxes on income and capital gains
Income and capital gains
Income and capital gains derived from the Ordinary Shares or ADSs by an individual or corporate U.S.
Shareholder are generally not subject to Netherlands income tax or corporation tax, unless:
1.such income and gains are attributable to a (deemed) permanent establishment or (deemed)
permanent representative in the Netherlands of the U.S. Shareholder; or
2.the shareholder is entitled to a share in the profits of an enterprise or (in case of a non-Dutch resident
corporate shareholder only) a co-entitlement to the net worth of an enterprise, that is effectively
managed in the Netherlands (other than by way of securities) and to which enterprise the Ordinary
Shares or ADSs are attributable; or
ING Group Annual Report 2023 on Form 20-F 131
3.such income and capital gains are derived from a direct, indirect or deemed substantial interest in the
share capital of ING Groep N.V. (such substantial interest not being a business asset), and in the case of
a non-Dutch resident corporate shareholder only, that substantial interest is being held with the
primary aim or one of the primary aims to avoid the levy of income tax from another person and is put
in place without valid economic reasons that reflect economic reality;
4.in case of a non-Dutch resident corporate shareholder, such shareholder is a resident of Aruba,
Curaçao or Saint Martin with a permanent establishment or permanent representative in Bonaire,
Eustatius or Saba to which the Ordinary Shares or ADS are attributable, while the profits of such
shareholder are taxable in the Netherlands pursuant to Article 17(3)(c) of the Dutch Corporate Tax Act
1969; or
5.in case of a non-Dutch resident individual, such individual derives income or capital gains from the
Ordinary Shares or ADSs that are taxable as benefits from ‘miscellaneous activities’ in the Netherlands
(‘resultaat uit overige werkzaamheden’, as defined in the Dutch Income Tax Act 2001), which includes
the performance of activities with respect to the Ordinary Shares or ADSs that exceed regular portfolio
management.
Substantial interest
Generally speaking, for Dutch tax purposes, an interest in the share capital of ING Groep N.V., should not
be considered a substantial interest if the holder of such interest, and, in case of an individual, his or her
spouse, registered partner, certain other relatives or certain persons sharing the holder’s household, alone
or together, does or do not hold, either directly or indirectly, the ownership of, or certain rights over,
shares or rights resembling shares representing 5% or more of the total issued and outstanding capital, or
the issued and outstanding capital of any class of shares, of ING Groep N.V.
Gift or inheritance tax
No Netherlands gift or inheritance tax will be imposed on the transfer or deemed transfer of the Ordinary
Shares or ADSs by way of a gift by or on the death of a U.S. Shareholder if, at the time of the gift or the
death of that shareholder, such shareholder is not a (deemed) resident of the Netherlands.
Netherlands inheritance or gift taxes (as the case may be) are due, however, if the transfer of the
Ordinary Shares or ADSs is construed as an inheritance or as a gift made by or on behalf of a person who,
at the time of the gift or death, is deemed to be a resident of the Netherlands. For the purposes of
Netherlands gift or inheritance tax, an individual of Dutch nationality is deemed to be a resident of the
Netherlands if he or she has been a resident thereof at any time during the ten years preceding the time
of the gift or death. For the purposes of Netherlands gift tax, any person is deemed to be a resident of the
Netherlands if he or she has resided therein at any time in the twelve months preceding the gift.
United States Taxation
Taxes on dividends
The tax treatment of owning Ordinary Shares or ADSs will depend in part on whether or not ING Groep N.V.
is classified as a passive foreign investment company, or PFIC, for United States federal income tax
purposes. Except as discussed below under “-PFIC Rules”, this discussion assumes that ING Groep N.V. is
not classified as a PFIC for United States federal income tax purposes.
Under the United States federal income tax laws, a U.S. Shareholder will be required to include in gross
income the gross amount of a cash dividend (including any Netherlands withholding tax withheld) as
ordinary income when the dividend is actually or constructively received by the U.S. Shareholder in the
case of Ordinary shares, or by the Depositary, in the case of ADSs. For this purpose, a “dividend” will
include any distribution paid by ING Groep N.V. with respect to the Ordinary Shares or ADSs, but only to
the extent such distribution is not in excess of ING Groep N.V.’s current and accumulated earnings and
profits as determined for United States federal income tax purposes. Distributions in excess of current and
accumulated earnings and profits, as determined for United States federal income tax purposes, will be
treated as a non-taxable return of capital to the extent of a U.S. Shareholder’s basis in the Ordinary Shares
or ADSs and thereafter as capital gain. Because ING Groep N.V. does not keep account of its earnings and
profits, as determined for United States federal income tax purposes, U.S. Shareholders should generally
expect to treat any distribution as a dividend for U.S. federal income tax purposes.
For foreign tax credit limitation purposes, dividends will generally be income from sources outside the
United States and will, depending on the circumstances of the U.S. Shareholder, generally be “passive”
income for purposes of computing the foreign tax credit allowable to the shareholder. However, if (a) we
are 50% or more owned, by vote or value, by United States persons and (b) at least 10% of our earnings
and profits are attributable to sources within the United States, then for foreign tax credit purposes, a
portion of our dividends would be treated as derived from sources within the United States. With respect
to any dividend paid for any taxable year, the United States source ratio of our dividends for foreign tax
credit purposes would be equal to the portion of our earnings and profits from sources within the United
States for such taxable year, divided by the total amount of our earnings and profits for such taxable year.
A dividend will not be eligible for the dividends-received deduction generally allowed to U.S. corporations
in respect of dividends received from other U.S. corporations. Dividends paid to a non-corporate U.S.
Shareholder that are considered qualified dividend income will be taxable to the shareholder at
preferential rates applicable to long-term capital gains provided that the shareholder holds the Ordinary
Shares or ADSs for more than 60 days during the 121-day period beginning 60 days before the ex-
dividend date and meets other holding period requirements. Dividends paid by ING Groep N.V. with
respect to the Ordinary Shares or ADSs generally will be qualified dividend income, provided that, in the
year that you receive the dividend, we are eligible for the benefits of the Treaty. We believe that we are
currently eligible for the benefits of the Treaty and we therefore expect that dividends on the Ordinary
ING Group Annual Report 2023 on Form 20-F 132
Shares or ADSs will be qualified dividend income, but there can be no assurance that we will continue to
be eligible for the benefits of the Treaty.
Subject to certain limitations, a U.S. Shareholder may generally deduct from income, or credit against its
United States federal income tax liability, the amount of any Netherlands withholding taxes withheld
under the Treaty and paid over to the Netherlands Tax Administration. However, the Netherlands
withholding tax may not be creditable unless a U.S. Shareholder is eligible for and elects to apply the
benefits of the Treaty. Even in such case, the Netherlands withholding tax will likely not be creditable
against the U.S. Shareholder’s United States tax liability to the extent that ING Groep N.V. is allowed to
reduce the amount of dividend withholding tax paid over to the Netherlands Tax Administration by
crediting withholding tax imposed on certain dividends paid to ING Groep N.V. In addition, special rules
apply in determining the foreign tax credit limitation with respect to dividends that are subject to
preferential rates. To the extent a reduction or refund of the tax withheld is available to a U.S. Shareholder
under Dutch law or under the Treaty, the amount of tax withheld that could have been reduced or is
refundable will not be eligible for credit against the U.S. Shareholder's United States federal income tax
liability. In addition, to the extent an amount of Dutch tax withheld is contingent on the availability of a
credit against the amount of income tax owed to another country, that amount of Dutch tax withheld will
not be eligible for a credit against the U.S. Shareholder's United States federal income tax liability. It is
unclear whether or how the Netherlands would apply this rule in determining whether, based on the
Treaty, a credit is available in the United States for purposes of the dividend withholding tax refund
provision described in Section IV under “Netherlands Taxation—Withholding tax on dividends—Reduction
of Dutch dividend withholding tax based on Dutch law”.
Since payments of dividends with respect to Ordinary Shares or ADSs will be made in Euros, a U.S.
Shareholder will generally be required to determine the amount of dividend income by translating the
Euro into U.S. dollars at the “spot rate” on the date the dividend is distributed, regardless of whether the
payment is in fact converted into U.S. dollars. Generally, any gain or loss resulting from currency
exchange fluctuations during the period from the date the dividend is distributed to the date such
payment is converted into U.S. dollars will be treated as ordinary income or loss and will not be eligible for
the special tax rate applicable to qualified dividend income. Such gain or loss will generally be income or
loss from sources within the United States for foreign tax credit limitation purposes.
Taxes on capital gains
Gain or loss on a sale or exchange of Ordinary Shares or ADSs by a U.S. Shareholder will generally be a
capital gain or loss for United States federal income tax purposes equal to the difference between the U.S.
dollar value of the amount that such U.S. Shareholder realizes and such U.S. Shareholder's tax basis,
determined in U.S. dollars, in the Ordinary Shares or ADSs. If such U.S. Shareholder has held the Ordinary
Shares or ADSs for more than one year, such gain or loss will generally be long-term capital gain or loss.
Long-term capital gain of a non-corporate U.S. Shareholder is generally taxed at preferential rates. In
general, gain or loss from a sale or exchange of Ordinary Shares or ADSs by a U.S. Shareholder will be
treated as income or loss from sources within the United States for foreign tax credit limitation purposes.
PFIC rules
ING Groep N.V. believes it is not a PFIC for United States federal income tax purposes, and it does not
expect to become a PFIC in the foreseeable future. However, this conclusion is a factual determination
that must be made annually and thus may be subject to change. It is therefore possible that we could
become a PFIC in a future taxable year.
If ING Groep N.V. were to be treated as a PFIC, unless a U.S. Shareholder made an effective election to be
taxed annually on a mark-to-market basis with respect to the Ordinary Shares or ADSs, any gain from the
sale or disposition of Ordinary Shares or ADSs by a U.S. Shareholder would be allocated ratably to each
year in the holder’s holding period and would be treated as ordinary income. Tax would be imposed on
the amount allocated to each year prior to the year of disposition at the highest rate in effect for that
year, and interest would be charged at the rate applicable to underpayments on the tax payable in
respect of the amount so allocated. The same rules would apply to “excess distributions”, defined
generally as any distributions in a single taxable year, other than the taxable year in which the U.S.
Shareholder's holding period in the shares or ADSs begins, exceeding 125% of the average annual
distribution made by ING Groep N.V. in respect of the Ordinary Shares or ADSs over the shorter of the
three preceding taxable years or the portion of the holder’s holding period that preceded the taxable year
in which the holder receives the distribution. Dividends received by a U.S. Shareholder will not be eligible
for the special tax rates applicable to qualified dividend income if ING Groep N.V. were a PFIC (or were to be
treated as a PFIC with respect to the shareholder) either in the taxable year of the distribution or the
preceding taxable year, but instead will be taxable at rates applicable to ordinary income. A U.S.
Shareholder who owns Ordinary Shares or ADSs during any year that ING Groep N.V. is a PFIC may be
required to file Internal Revenue Service Form 8621.
ING Group Annual Report 2023 on Form 20-F 133
F.Dividends and paying agents
This item does not apply to annual reports on Form 20-F.
G.Statement by experts
This item does not apply to annual reports on Form 20-F.
H.Documents on display
ING Groep N.V. is subject to the informational requirements of the Securities Exchange Act of 1934, as
amended. In accordance with these requirements, ING Groep N.V. files reports and other information with
the Securities and Exchange Commission (”SEC”). These materials, including this Annual Report and its
exhibits, may be inspected and copied on the SEC’s website at www.sec.gov. You may also inspect ING
Groep N.V.’s SEC reports and other information on the website of ING Groep N.V. (www.ing.com).
I.Subsidiary information
This item does not apply to annual reports on Form 20-F.
J.Annual Report to Security Holders
Not applicable.
ING Group Annual Report 2023 on Form 20-F 134
Item 11. Quantitative and Qualitative Disclosure of Market Risk
See “Item 5. Operating and Financial Review and Prospects – Factors Affecting Results of Operations” and
“Additional information - ING Group Risk Management” for these disclosures, including disclosures relating
to operational, compliance and other non-market-related risks.
ING Group Annual Report 2023 on Form 20-F 135
Item 12. Description of Securities Other Than Equity Securities
A.Debt securities
This item does not apply to annual reports on Form 20-F.
B.Warrants and rights
This item does not apply to annual reports on Form 20-F.
C.Other securities
This item does not apply to annual reports on Form 20-F.
D.American depositary shares
Fees and Charges Payable by a Holder of ADSs
JPMorgan Chase Bank, N.A., as ADR depositary, may collect fees for, among other things, the delivery and
surrender of ADSs directly from investors, or from intermediaries acting for them, depositing Ordinary
Shares or surrendering ADSs for the purpose of withdrawal.
ING Group Annual Report 2023 on Form 20-F 136
The charges of the ADR depositary payable which may be payable by investors are as follows:
Type of Service | ADR Depositary Actions | Fee Payable | ||
Depositing or substituting the underlying Ordinary Shares | Issuance of ADSs against the deposit of Ordinary Shares, including deposits and issuances in respect of: •share distributions, rights and other distributions. •a stock dividend or stock split. •a merger, exchange of securities or other transactions or events affecting the ADSs or the underlying Ordinary Shares. | $5.00 for each 100 ADSs (or portion thereof) issued, delivered or upon which a share distributive or elective distribution is made or offered. The ADR depositary may sell sufficient securities or property received in respect of share distributions, rights and other distributions prior to such deposit to pay such charge. | ||
Receiving or distributing cash dividends | Distribution of cash dividends or other cash distributions, or offering of elective cash/stock dividends. | $0.05 or less per ADS held. | ||
Selling or exercising rights | •additional ADRs resulting from a dividend or free distribution consisting of Ordinary Shares, or U.S dollars resulting from sales of Ordinary Shares received in a distribution. •Instruments representing rights to acquire additional ADRs as a result of distribution on Ordinary Shares, or U.S dollars resulting from sales of such rights. •other securities available to the ADR depositary resulting from any distribution on the deposited Ordinary Shares, or U.S dollars resulting from sales of such other securities. | An amount equal to the fee for the execution and delivery of ADSs which would have been charged as a result of the deposit of such securities. | ||
Withdrawing an underlying Ordinary Share | Acceptance of ADSs surrendered for withdrawal of deposited Ordinary Shares | $5.00 for each 100 ADSs (or portion thereof) reduced, cancelled or surrendered. | ||
Type of Service | ADR Depositary Actions | Fee Payable | ||
Transferring, splitting or grouping of ADRs | Registration, registration of transfer, combination and split-up of ADRs in the ADR register as evidenced by the ADRs surrendered or upon delivery of proper instruments of transfer | $1.50 per ADR. | ||
General depositary services, particularly those charged on an annual basis | Other services performed by the ADR depositary in administering the ADR program | $0.05 per ADS per calendar year (or portion thereof), which may be charged on a periodic basis during each calendar year against holders of the record date(s) set by the ADR depositary and shall be payable at the sole discretion of the ADR depositary by billing such holders or deducting such charge from one or more cash distributions. | ||
Reimbursement of fees, charges and expenses of the ADR depositary | The ADR depositary and/or any of its agents may incur fees, charges and expenses (including expenses incurred on behalf of holders of ADRs in connection with compliance with foreign exchange control regulations or any law or regulation relating to foreign investment) in connection with the servicing of the underlying Ordinary Shares or other deposited securities, the sale of securities (including, without limitation, deposited securities), the delivery of deposited securities or otherwise in connection with the ADR depositary’s compliance with applicable law, rule or regulation. | Fees and charges shall be assessed on a proportionate basis against holders of ADRs as of the record date or dates set by the ADR depositary and shall be payable at the sole discretion of the ADR depositary by billing such holders of ADRs or by deducting such charge from one or more cash dividends or other cash distributions. | ||
ING Group Annual Report 2023 on Form 20-F 137
Type of Service | ADR Depositary Actions | Fee Payable | ||
Other charges and expenses of the ADR depositary | The ADR depositary may incur charges and expenses on behalf of holders in connection with: •stock transfer or other taxes and other governmental charges. •SWIFT, cable, telex and facsimile transmission and delivery charges incurred at the request of persons •depositing, or holders of ADRs delivering underlying Ordinary Shares, ADRs or deposited securities. •transfer or registration fees for the registration or transfer of deposited securities. | Payable by holders or persons depositing Ordinary Shares. Payable by persons depositing, or holders of ADRs delivering underlying Ordinary Shares, Ads or deposited securities. Payable by persons depositing or withdrawing deposited securities. | ||
Fees and Payments made by the ADR depositary to ING
In consideration for acting as depositary, the ADR depositary has agreed to provide ING with certain
amounts on an annual basis. In the year ended 31 December 2023, the ADR depositary paid aggregate fees
and made other direct and indirect payments to ING in an amount of USD 8,006,079.
Under certain circumstances, including removal of the ADR depositary or termination of the ADR program
by ING, ING is required to repay the ADR depositary certain amounts reimbursed and/or expenses paid to or
on behalf of ING.
ING Group Annual Report 2023 on Form 20-F 138
PART II.
Item 13. Defaults, Dividend Arrearages
and Delinquencies
None.
Item 14. Material Modifications to the
Rights of Security Holders and Use of
Proceeds
None.
Item 15. Controls and Procedures
Internal control over financial reporting
Due to the listing of ING shares on the New York Stock Exchange, ING Group is required to comply with the
SEC regulations adopted pursuant to Section 404 of the Sarbanes-Oxley Act (SOX 404). These regulations
require that the Chief Executive Officer (“CEO”) and the Chief Financial Officer (“CFO”) of ING Group report
and certify on an annual basis on the effectiveness of ING Group’s internal control over financial reporting.
Moreover, the external auditors are required to provide an opinion on the effectiveness of ING Group’s
internal control over financial reporting.
SOX 404 activities are organised along the lines of the governance structure and involve the participation of
senior management across ING. Following the SOX 404 process, ING is in the position to publish an
unqualified statement that the Company’s internal control over financial reporting was effective as of 31
December 2023. The SOX 404 statement by the Executive Board is included on this page, followed by the
report of the external auditor as issued on Form 20-F.
Disclosure Controls and Procedures
The Company’s management, under the supervision and with the participation of the CEO and CFO, has
performed an evaluation of the effectiveness of the design and operation of the Company’s disclosure
controls and procedures. Based on that evaluation, the CEO and CFO concluded that the Company’s
disclosure controls and procedures were effective as of December 31, 2023, the end of the period covered
by the 2023 Form 20-F.
Report of the Executive Board on Internal Control Over Financial Reporting
The Executive Board is responsible for establishing and maintaining adequate internal control over financial
reporting. ING’s internal control over financial reporting is a process designed under the supervision of our
principal executive and principal financial officers to provide reasonable assurance regarding the reliability
of financial reporting and the preparation of financial statements for external purposes in accordance with
generally accepted accounting principles.
Our internal control over financial reporting includes those policies and procedures that:
•Pertain to the maintenance of records that, in reasonable detail, accurately and fairly reflect the
transactions and dispositions of assets of ING;
•Provide reasonable assurance that transactions are recorded as necessary to permit preparation of
financial statements in accordance with generally accepted accounting principles, and that our receipts
and expenditures are being made only in accordance with authorisations of our management and
directors; and
•Provide reasonable assurance regarding prevention or timely detection of unauthorised acquisition, use
or disposition of our assets that could have a material effect on our financial statements.
ING Group Annual Report 2023 on Form 20-F 139
Because of its inherent limitations, internal control over financial reporting may not prevent or detect
misstatements. Also, projections of any evaluation of effectiveness to future periods are subject to the risk
that controls may become inadequate because of changes in conditions, or that the degree of compliance
with the policies or procedures may deteriorate.
The Executive Board assessed the effectiveness of internal control over financial reporting as of 31
December 2023. In making this assessment, the Executive Board performed tests based on the criteria of
the Committee of Sponsoring Organizations of the Treadway Commission (“COSO”) in Internal Control –
Integrated Framework (2013 Framework). Based on the Executive Board’s assessment and those criteria, the
Executive Board concluded that the Company’s internal control over financial reporting was effective as of
31 December 2023.
Attestation Report of the Registered Public Accounting Firm
Our independent registered public accounting firm has audited and issued their report on ING’s internal
control over financial reporting, which appears on the page below.
Changes in Internal Controls over Financial Reporting
There have been no changes in the Company’s internal controls over financial reporting during the period
covered by this Annual Report that have materially affected or are reasonably likely to materially affect, our
internal control over financial reporting.
Report of Independent Registered Public Accounting Firm
To the Shareholders and the Supervisory Board ING Groep N.V.
Opinion on Internal Control Over Financial Reporting
We have audited ING Groep N.V. and subsidiaries’ (the Company) internal control over financial reporting as
of December 31, 2023, based on criteria established in Internal Control – Integrated Framework (2013)
issued by the Committee of Sponsoring Organizations of the Treadway Commission. In our opinion, the
Company maintained, in all material respects, effective internal control over financial reporting as of
December 31, 2023, based on criteria established in Internal Control – Integrated Framework (2013) issued by
the Committee of Sponsoring Organizations of the Treadway Commission.
We also have audited, in accordance with the standards of the Public Company Accounting Oversight Board
(United States) (PCAOB), the consolidated statements of financial position of the Company as of December
31, 2023 and 2022, the related consolidated statements of profit or loss, comprehensive income, changes in
equity, and cash flows for each of the years in the three-year period ended December 31, 2023, and the
related notes and specific disclosures described in Note 1 as being part of the consolidated financial
statements (collectively, the consolidated financial statements), and our report dated March 4, 2024
expressed an unqualified opinion on those consolidated financial statements.
Basis for Opinion
The Company’s management is responsible for maintaining effective internal control over financial
reporting and for its assessment of the effectiveness of internal control over financial reporting, included in
the accompanying Report of the Executive Board on Internal Control Over Financial Reporting. Our
responsibility is to express an opinion on the Company’s internal control over financial reporting based on
our audit. We are a public accounting firm registered with the PCAOB and are required to be independent
with respect to the Company in accordance with the U.S. federal securities laws and the applicable rules and
regulations of the Securities and Exchange Commission and the PCAOB.
We conducted our audit in accordance with the standards of the PCAOB. Those standards require that we
plan and perform the audit to obtain reasonable assurance about whether effective internal control over
financial reporting was maintained in all material respects. Our audit of internal control over financial
reporting included obtaining an understanding of internal control over financial reporting, assessing the risk
that a material weakness exists, and testing and evaluating the design and operating effectiveness of
internal control based on the assessed risk. Our audit also included performing such other procedures as we
considered necessary in the circumstances. We believe that our audit provides a reasonable basis for our
opinion.
Definition and Limitations of Internal Control Over Financial Reporting
A company’s internal control over financial reporting is a process designed to provide reasonable assurance
regarding the reliability of financial reporting and the preparation of financial statements for external
purposes in accordance with generally accepted accounting principles. A company’s internal control over
financial reporting includes those policies and procedures that (1) pertain to the maintenance of records
that, in reasonable detail, accurately and fairly reflect the transactions and dispositions of the assets of the
company; (2) provide reasonable assurance that transactions are recorded as necessary to permit
preparation of financial statements in accordance with generally accepted accounting principles, and that
receipts and expenditures of the company are being made only in accordance with authorizations of
management and directors of the company; and (3) provide reasonable assurance regarding prevention or
ING Group Annual Report 2023 on Form 20-F 140
timely detection of unauthorized acquisition, use, or disposition of the company’s assets that could have a
material effect on the financial statements.
Because of its inherent limitations, internal control over financial reporting may not prevent or detect
misstatements. Also, projections of any evaluation of effectiveness to future periods are subject to the risk
that controls may become inadequate because of changes in conditions, or that the degree of compliance
with the policies or procedures may deteriorate.
/s/ KPMG Accountants N.V.
Amstelveen, The Netherlands
March 4, 2024
Item 16A. Audit Committee Financial
Expert
The Supervisory Board has determined that Margarete Haase, who is a member of the Supervisory Board,
qualifies as an “audit committee financial expert” as defined by the SEC pursuant to section 407 of the
Sarbanes-Oxley Act of 2002. The Supervisory Board has further determined that Margarete Haase is
“independent”, as defined in Rule 10A-3 under the Securities Exchange Act of 1934. She was appointed as a
member of the Supervisory Board at the General Meeting in May 2017 and her appointment became
effective as per 1 May 2018, as decided by the Supervisory Board in January 2018. Margarete Haase is chair
of the Audit Committee.
Item 16B. Code of Ethics
Orange code and the global Code of Conduct
The Orange Code and the global Code of Conduct are the foundation of ING’s risk culture. The global Code of
Conduct defines the most essential conduct principles expected from ING employees in their daily activities,
to create additional risk awareness and better meet expectations stated in external rules and guidelines. In
2021, the global Code of Conduct has been embedded into our employees’ performance management cycle
to ensure continuous attention to the Global Code of Conduct, and dialogue on how to apply it in our daily
work practice.
The Orange Code is a declaration of who we are. It describes what we can expect from each other when we
turn up to work each day. It is a set of standards that we collectively value, strive to live up to, and invite
others to measure us by.
The Orange Code is the sum of two parts, the ING values and ING behaviours, with integrity being the
overarching principle. The ING values (being honest, prudent and responsible) are non-negotiable promises
we make to the world, principles we seek to stick to, no matter what. The ING behaviours (take it on and
make it happen, help others to be successful, and always be a step ahead) represent our way to
differentiate ourselves. The Orange Code is embedded in commitments we make to each other and the
standards by which we measure each other’s performance.
The ING Code of ethics are the ING Orange Code and the ING Global Code of Conduct and no waivers have
been granted for either of them.
The Orange Code applies to all employees worldwide, including the principal executive, financial and
accounting officers. The values and behaviours of the Orange Code are available on the ING website at
https://www.ing.jobs/global/careers/why-join/our-orange-code.htm.
In 2023, there were no amendments to the Orange Code. ING did not grant any waivers (including implicit
waivers) under the Orange Code to the principal executive, financial or accounting officers in 2023.
Orange Code Decision Making
To enhance risk awareness, support moral learning, and enable people to perform proper risk judgement,
the Orange Code Decision Making model (introduced globally as of 2017, approved by the MBB) aims to
ING Group Annual Report 2023 on Form 20-F 141
support our employees in dealing with dilemmas in a balanced and fair way, by using the OCDM-method
and/or having OCDM-dialogue sessions. This four-step approach supports balanced decision-making by
weighing the rights and interest of all stakeholders involved and also ensuring the necessary mitigating
measures where possible. ING’s Risk Culture&Behavioural Risk Department ensures awareness for and and
knowledge of OCDM in the countries and at global level, so that all can properly apply the model. Moreover,
the model has been embedded into other decision making processes, such as the data ethics governance
process and the global Product Approval and Review Process.
Conflicts of Interest
ING is committed to identify conflicts of interest and act on them. The Conflicts of Interest policy sets the
obligation to identify, assess and manage conflicts of interest when personal or organisational interests are
in conflict over the interest of our client(s), employees or other stakeholders. In 2022 the Conflicts of Interest
policy was revised and implemented to further align with the standards as defined by enterprise risk
management. The policy incorporates key requirements for both personal and organisational conflicts of
interest in line with the European Bank Authority Guidelines on Internal Governance. Next to the updated
policy, mandatory instructions on conflict of interest registers are implemented which provides instructions
to identify, assess, mitigate or prevent and record all structural and incidental conflicts of interest.
ING maintains a policy on Conflicts of Interests which applies to all employees worldwide, including the
principal executive, financial and accounting officers. A description of the policy on Conflicts of Interest is
available to view on the ING website at https://www.ing.com/About-us/Compliance/Conflicts-of-interest-
and-confidential-information.htm.
ING did not grant any waivers (including implicit waivers) under the Conflicts of Interest Policy to the
principal executive, financial or accounting officers in 2023.
Whistleblower
The programme launched in 2021 to enhance the global whistleblower process has been concluded. In 2022
whistleblowing enhancement activities have continued with an emphasis on increasing employee
awareness on misconduct reporting. Sanitized whistleblowing data has been shared within the organisation
to provide more transparency on the types of concerns employees do report and our rapidity of response. In
2023 an update of the whistleblower policy was approved adjusting the wording in line with European
regulatory standards and streamlining the process steps. Updated policy will be effective per start of 2024
on a concern by concern reported basis.
The Whistleblower Policy is available on the ING website at www.ing.com/About-us/Compliance/ING-Group-
Whistleblower-Policy.htm.
ING granted ING Türkiye a waiver and ING Bank Śląski S.A (Poland) a deviation, because local regulations in
both locations are stricter than the ING Whistleblower Policy. No further waivers or deviations were granted
(including implicit waivers) under the Whistleblower Policy to the principal executive, financial or accounting
officers in 2023.
Banker’s Oath
In the Netherlands, all employees of ING take the Bankers’ Oath (including ING's principal executive, financial
and accounting officers) and pledge this promise in a meaningful ceremony. The Oath came into force in
the Netherlands on 1 April 2015, as part of a joint approach from all banks, aimed at introducing social
regulations, a revised Dutch Banking Code implementing an oath with associated rules of conduct and
disciplinary law. This way the Dutch banks show society what they stand for and are accountable for, both
as individual banks and as a sector. In 2021, due to the Covid-19 pandemic, ING NL changed to virtual
Bankers’ Oath ceremonies via Teams, instead of the former physical ones, to ensure that all new employees
(around 400 a month) can still take the Bankers’ Oath in time and in a meaningful ceremony. Before taking
the Oath, an e-learning is followed and the importance of the Oath is discussed. Also, dilemmas that the
employees may come across in their daily work are shown, to ensure careful balancing of the interests of all
our stakeholders, in the decisions we make. In 2020 and 2021 the whole Bankers’ Oath programme for new
joiners was revised and updated, to ensure that all elements still align with the current developments, both
internally and externally.
In 2023, there were no amendments to the Banker's Oath. The ING NL Banker’s Oath Guidelines (last
reviewed in 2020) will be reviewed soon however (Q1 2024 expectedly). ING NL did grant temporary waivers
for the Banker's Oath, but not to any principal executives, financial and accounting officers in 2023 (unless
they were not in scope of the Banker’s Oath obligation according to ING NL’s Banker’s Oath Guidelines). The
text of the Banker’s Oath can be found here: https://www.ing.com/About-us/Corporate-governance/Dutch-
Banking-Code.htm.
Item 16C. Principal Accountant Fees
and Services
At the Annual General Meeting held on 23 April 2019, KPMG (KPMG Accountants N.V. in Amstelveen, the
years 2020 through 2023. This appointment includes the responsibility to provide an audit opinion on the
ING Group Annual Report 2023 on Form 20-F 142
financial statements and internal control over financial reporting on 31 December 2023 and to report on the
outcome of these audits to the Executive Board and the Supervisory Board.
At the Annual General Meeting held on 24 April 2023 KPMG was re-appointed as the external audit firm for
ING Group for the financial years 2024 and 2025 which will be the maximum term for KPMG as the external
auditor.
The external auditor may be questioned at the Annual General Meeting in relation to its audit opinion on the
financial statements. The external auditor will therefore attend and be entitled to address this meeting. The
external auditor attended the meetings of the Risk Committee and of the Audit Committee and attended
and addressed the 2022 Annual General Meeting, at which the external auditor provided an explanation on
the audit activities and the audit opinion.
The external auditor may only provide services to ING Group and its subsidiaries with the permission of the
Audit Committee, in line with the ING Group Policy on External Auditors’ Independence. All services were
approved by the Audit Committee.
More information on the ING Group Policy on External Auditors’ Independence is available on the website of
ING Group www.ing.com.
Audit fees
Audit fees were paid for audit and assurance services provided by the auditors. The services provided
include the audit of ING Group’s consolidated financial statements and Form 20-F. Moreover, these services
include the audits of the statutory financial statements of its subsidiaries. And, it includes assurance
services provided by the auditor regarding other filings for regulatory and supervisory purposes as well as
the review on interim financial statements. Furthermore, it includes the assurance services relating to
comfort letters issued in connection with prospectuses and reviews of SEC product filings.
Audit-related fees
Audit-related fees were paid for assurance and related services that are reasonably related to the
performance of the audit or review of the consolidated financial statements not reported under the audit
fee item above. These services consisted primarily of specific agreed-upon procedure engagements and
assurance engagements for third parties.
Tax fees
Over 2023 no tax fees were paid. Under the current ING Group Policy on External Auditors’ Independence
most tax services are prohibited. Some tax services are only allowed after specific approval under an
‘exception procedure’.
Reference is made to Note 27 ‘Audit fees’ in the consolidated financial statements for audit, audit-related,
tax and all other fees paid to the external auditors in 2023, 2022 and 2021.
Item 16D. Exemptions from the Listing
Standards for Audit Committees
Not applicable.
Item 16E. Purchases of Equity Securities
by the Issuer and Affiliated Purchasers
Share buyback programmes in 2023
On 2 November 2023, ING announced a share buyback programme for a maximum total amount of EUR
2,500 million. The share buyback programme commenced on 3 November 2023 and was completed on 7
February 2024. The purpose of the share buyback programme was to reduce the share capital of ING. It is a
next step in converging our CET1 ratio towards our target of around 12.5% by 2025.
On 11 May 2023, ING announced a share buyback programme for a maximum total amount of EUR 1,500
million. The share buyback programme was completed on 13 October 2023 for a total consideration of EUR
1,566 million. In total 104.41% of the announced total value of the programme of EUR 1,500 million was
purchased. The purchases exceeded 100% due to performance arrangements, including the average price
ING Group Annual Report 2023 on Form 20-F 143
per share, with our executing broker for the programme. The broker repurchased shares until the
performance arrangements were fulfilled. The total consideration for ING was limited to EUR 1,500 million.
The excess purchases above this amount were funded by the executing broker. Based on the total
programme period, the effective average price for ING was EUR 12.36. The purpose of the share buyback
programme was to reduce the share capital of ING and the shares have been cancelled in December 2023.
On 1 March 2023, ING announced a share buyback programme for a maximum total amount of EUR 50
million. The share buyback programme was executed by ING and completed on 2 March 2023 for a total
consideration of EUR 42 million. The purpose of the share repurchase programme was to meet obligations
under the share-based compensation plans. After fulfilling delivery obligations under the employee share-
based compensation scheme, the buyback programme had negligible impact on our CET1 ratio.
Share buyback programmes completed in 2022
On 3 November 2022, ING announced a share buyback programme for a maximum total amount of EUR
1,500 million. The programme was completed on 28 December 2022 for a total consideration of EUR
1,204 million. The remainder of the total amount of EUR 1,500 million, amounting to EUR 297 million or EUR
0.082 per share, has been paid to shareholders in cash on 16 January 2023. The total number of shares
repurchased under the programme is 107,032,745 ordinary shares. The purpose of the share buyback
programme is to reduce the share capital of ING. It is a next step in converging our CET1 ratio towards the
target of around 12.5% by 2025. These shares have been cancelled in March 2023.
On 6 May 2022, ING announced a share buyback programme for EUR 380 million. The programme
commenced on 12 May 2022 and was completed on 14 July 2022. The total number of shares repurchased
under the programme is 40,749,792 ordinary shares at an average price of EUR 9.41 for a total
consideration of EUR 383 million. The purpose of the share buyback programme was to reduce the share
capital of ING. These shares have been cancelled in November 2022.
On 1 October 2021, ING announced a share buyback programme under which it repurchases ordinary
shares of ING Groep, with a maximum total value of EUR 1,744 million and for a number of shares not
exceeding the authority granted by the general meeting of shareholders (10% of the issued shares). The
share buyback programme commenced on 5 October 2021 and was completed on 25 February 2022. The
total number of shares repurchased under the programme is 139,711,040 ordinary shares at an average
price of EUR 12.47 for a total consideration of EUR 1,742 million. The purpose of the share buyback
programme was to reduce the share capital of ING. These shares have been cancelled in July 2022.
General
All share buyback programmes have been approved by the ECB and were executed within the limitations of
the existing authority of a maximum of 10% of the issued shares as granted by the general meeting of
shareholders on 24 April 2023, 25 April 2022 and 26 April 2021 and in compliance with the Market Abuse
Regulation. For each buyback, ING entered into a non-discretionary arrangement with a financial
intermediary to conduct the buybacks, except for the share repurchase programme for the employee
share-based compensation plans which was executed by ING.
ING Groep N.V. has no other publicly announced plans or programmes to repurchase shares. In 2023, ING
Groep N.V. did not determine to terminate any publicly announced plans or programmes prior to expiration,
or determine that it intends not to make any further purchases under any publicly announced plans or
programmes.
There were no other purchases by us or any of our affiliated purchasers of any of our equity securities
registered pursuant to Section 12 of the Securities Exchange Act of 1934 during the fiscal years ended
December 31, 2023, 2022 and 2021.
ING Group Annual Report 2023 on Form 20-F 144
Purchases of Equity Securities by the Issuer and affiliated Purchasers | ||||
Month of purchase | Total number of shares purchased1 | Average price paid per share in EUR | Total number of shares purchased as part of publicly announced plans or programmes 2, 3, 4 | Maximum Value of shares that may yet be purchased under the plans or programmes in EUR million |
January 2023 | ||||
February 2023 | ||||
March 2023 | 3,155,748 | 13.18 | 3,155,748 | - |
April 2023 | ||||
May 2023 | 4,777,058 | 11.93 | 4,777,058 | 1,443 |
June 2023 | 7,366,865 | 12.08 | 7,366,865 | 1,354 |
July 2023 | 6,740,447 | 12.88 | 6,740,447 | 1,267 |
August 2023 | 82,066,015 | 13.11 | 82,066,015 | 191 |
September 2023 | 15,320,297 | 12.67 | 15,320,297 | - |
October 2023 | 5,046,819 | 12.59 | 5,046,819 | - |
November 2023 | 88,879,753 | 12.51 | 88,879,753 | 1,388 |
December 2023 | 64,815,771 | 13.42 | 64,815,771 | 518 |
Total | 278,168,773 | 12.90 | 278,168,773 | |
Of which: | ||||
Purchased in the open market | 278,168,773 | 12.90 | 278,168,773 | 518 |
Acquired through exercise of call options / settlement of forward contracts | n.a. | n.a. | n.a. | n.a. |
1The table excludes purchases on behalf of clients in ING Groep N.V. shares.
2On 1 March 2023, ING announced a share buyback programme for EUR 50 million. The programme was completed on 2 March 2023.
The total number of shares repurchased under the programme is 3,155,748 ordinary shares at an average price of EUR 13.18 per
share for a total consideration of EUR 42 million. The programme is executed by ING during a two day period. The purpose of the
share buyback programme was to meet obligations under the employee share-based compensation plans.
3On 11 May 2023, ING announced a share buyback programme for a maximum total amount of EUR 1,500 million. The programme
was completed on 13 October 2023. The total number of shares repurchased under the programme is 121,317,501 ordinary shares at
an average price of EUR 12.91 per share for a total consideration of EUR 1,566 million (effective average price for ING was EUR 12.36
per share after compensation received from the executing broker). The purchases exceeded 100% due to performance
arrangements, including the average price per share, with the executing broker for the programme. The excess purchases were
funded by the executing broker. The programme is executed by an intermediary to allow for purchases in the open market during
both open and closed periods. The purpose of the share buyback programme is to reduce the share capital of ING. The shares have
been cancelled in December 2023.
4On 2 November 2023, ING announced a share buyback programme for a maximum total amount of EUR 2,500 million. The share
buyback programme commenced on 3 November 2023 and was completed on 7 February 2024. The total number of shares
repurchased under the programme as per 31 December 2023 is 153,695,524 ordinary shares at an average price of EUR 12.90 per
share for a total consideration of EUR 1,982 million with EUR 518 million remaining and purchased in 2024. The programme is
executed by an intermediary to allow for purchases in the open market during both open and closed periods. The purpose of the
share buyback programme is to reduce the share capital of ING.
Item 16F. Changes in Registrant’s
Certifying Accountant
While there has been no change in ING’s certifying accountant during the most recent two financial years,
following a decision on 30 January 2024, on 5 February 2024 ING announced that the Board will propose to
the 2024 Annual General Meeting of Shareholders to appoint Deloitte Accountants BV (Deloitte), as the new
external audit firm for ING Group for the audit of the annual accounts for the financial years 2026 through
2029. The proposal to appoint Deloitte was the result of a thorough tender process overseen by the Audit
Committee of the Supervisory Board and in accordance with ING Group’s policy on the Auditors’
Independence. The change in auditors is being made based on European and Dutch legislation. Accordingly
the engagement of KPMG Accountants N.V. (KPMG), ING Group’s current auditor, cannot be renewed in
respect of financial year 2026.
During the two most recent financial years and any subsequent interim period, (1) KPMG has not issued any
reports on the financial statements of ING Group or on the effectiveness of internal control over financial
reporting that contained an adverse opinion or a disclaimer of opinion, nor were the auditors’ reports of
KPMG, qualified or modified as to uncertainty, audit scope, or accounting principles, (2) there has not been
any disagreement over any matter of accounting principles or practices, financial statement disclosure, or
auditing scope or procedures, which disagreements if not resolved to KPMG’s satisfaction would have
caused it to make reference to the subject matter of the disagreement in connection with its auditors’
reports, or any “reportable event” as described in Item 16F(a)(1)(v) of Form 20-F.
ING has provided KPMG with a copy of the foregoing disclosure and has requested that KPMG furnish ING
with a letter addressed to the SEC stating whether it agrees with such disclosure. A copy of the letter, dated
8 March 2024, is filed herewith as Exhibit 15.2.
During the fiscal years ended 31 December 2023 and 2022 and any subsequent interim period through 30
January 2024, neither ING nor anyone on its behalf has consulted with Deloitte regarding either (i) the
application of accounting principles to a specified transaction, either completed or proposed, or the type of
audit opinion that might be rendered with respect to the consolidated financial statements of ING, and
neither a written report nor oral advice was provided to ING that Deloitte concluded was an important factor
considered by ING in reaching a decision as to any accounting, auditing, or financial reporting issue; or (ii)
any matter that was the subject of a disagreement as that term is used in Item 16F(a)(1)(iv) of Form 20-F or
a “reportable event” as described in Item 16F(a)(1)(v) of Form 20-F.
ING Group Annual Report 2023 on Form 20-F 145
Item 16G. Corporate Governance
Dutch Corporate Governance Code, Banking Code and Dutch Tax
Governance Code
As ING Group is established and listed in the Netherlands, it must comply with Dutch laws and regulations
and is subject to the Dutch Corporate Governance Code (the DCGC).
The DCGC provides guidance for ING’s corporate governance structure and practices. ING supports the DCGC
and its principles to ensure sound corporate governance within its organisation. ING’s application of the
DCGC is described in the booklet ‘Application of the Dutch Corporate Governance Code by ING Groep N.V.
(FY2023) dated 7 March 2024, which is available on ing.com. The DCGC can be downloaded from the website
of the Corporate Governance Monitoring Committee (mccg.nl).
The Dutch Banking Code (the Banking Code) is only applicable to ING Bank, but ING Group voluntarily applies
the principles of the Banking Code on remuneration for its Executive Board members and senior
management. The Banking Code can be downloaded from the website of the Dutch Banking Association
(nvb.nl).
ING Group also voluntarily applies the principles of the Dutch Tax Governance Code.
Differences between Dutch and US corporate governance practices
ING Group qualifies as a foreign private issuer under the US Securities and Exchange Commission (SEC) rules
and is permitted to follow home-country practice in some circumstances, in lieu of certain corporate
governance standards required by the New York Stock Exchange (NYSE) applicable to US domestic
companies. Accordingly, ING Group must disclose in its Annual Report on Form 20-F any significant
differences between its corporate governance practices and those applicable to US companies under NYSE
listing standards. ING Group believes these differences are the following:
•ING Group has a two-tier board structure, in contrast to the one-tier board structure used by most US
companies. In the Netherlands, a public limited liability company with a two-tier board structure has an
executive board as its management body and a supervisory board that advises and supervises the
executive board. Supervisory board members are often former state or business leaders and sometimes
former members of the executive board. A member of the executive board or other officer or employee
of the company cannot simultaneously be a member of the supervisory board. The supervisory board
must approve specified decisions of the executive board.
•Under the DCGC, all members of the supervisory board, with the exception of not more than one person,
should be ‘independent’ as determined under the DCGC. However, the definition of ‘independent’ under
the DCGC differs in its details from the definition of ‘independent’ under the NYSE listing standards. All
members of ING’s Supervisory Board, are independent as determined under the DCGC.
•NYSE listing standards require a US company to have a compensation committee and a nominating/
corporate governance committee, each composed entirely of independent directors (as determined
under the NYSE listing standards). ING’s Nomination and Corporate Governance Committee and
Remuneration Committee are composed entirely of members of the Supervisory Board who are
independent as determined under the DCGC.
•NYSE listing standards require that, when a member of the audit committee of a US company serves on
four or more audit committees of public companies, the company should disclose (on its website, in its
annual proxy statement or in its annual report filed with the SEC) that the board of directors has
determined this simultaneous service would not impair the director’s service to the company. Dutch law
does not require the Supervisory Board to make such a determination.
•In contrast to the NYSE listing standards, the DCGC contains a ‘comply-or-explain’ principle, offering the
possibility of deviating from the DCGC. For any deviations by ING Group, please refer to the paragraph
‘Dutch Corporate Governance Code, Banking Code and Dutch Tax Governance Code’.
•NYSE listing standards require external auditors to be appointed by the audit committee. By contrast,
Dutch law requires ING Group’s external auditors to be appointed by the General Meeting and not by the
Audit Committee. The Audit Committee is responsible for preparing the Supervisory Board’s nomination
to the General Meeting for the appointment and remuneration of ING Group’s external auditor, and
annually evaluates the independence and functioning of, and developments in the relationship with, ING
Group’s external auditor and informs the Supervisory Board of its findings and proposed measures.
•Under NYSE listing standards, shareholders of US companies must be given the opportunity to vote (of
which the result is advisory in nature) on all equity compensation plans applicable to any employee,
director or other service provider of a company (or on material revisions thereto), with limited exceptions
set forth in the NYSE rules. Under Dutch law and the DCGC, binding shareholder approval is only required
for equity compensation plans (or changes thereto) for members of the executive board and supervisory
board, and not for equity compensation plans for other groups of employees.
ING Group Annual Report 2023 on Form 20-F 146
•The NYSE listing standards require certain transactions with related parties to be reviewed by a
company’s audit committee or another independent body of the board of directors for potential conflicts
of interest, and for the audit committee or other independent body to prohibit such a transaction if it
determines it to be inconsistent with the interests of the company and its shareholders. However, foreign
private issuers can rely on home country practice with respect to review and approval of related party
transactions. ING has adopted internal policies and procedures for the purposes of identifying, assessing,
and recording conflicts of interest, including with respect to whether related party transactions are on
customary or arm’s length terms. These policies and procedures are intended, if and to the extent
required under applicable law, prudential rules and other applicable guidelines, to enable the Executive
Board and Supervisory Board to assess the terms of these intended transactions.
Item 16H. Mine Safety Disclosure
Not applicable.
Item 16I. Disclosure Regarding Foreign
Jurisdictions that Prevent Inspections
Not applicable.
Item 16J. Insider trading policies
Item not applicable for 2023 Annual Report ING Groep N.V. on Form 20-F .
Item 16K. Cybersecurity
Introduction
Cybercrime remains a continuous threat to companies in general and to financial institutions in particular.
Both the frequency and the intensity of attacks continue to increase on a global scale. The sophistication
and implications of ransomware attacks are of particular concern in the threat landscape. Phishing or email-
based social engineering attacks, usually used to initiate ransomware/malware infection or plant an info/
password stealer for password reuse of valid accounts, or drive-by compromise attacks. Distributed denial of
service attacks, against financial sector and digital services operators are used for reputational damage and/
or extortion. There has been noticeable increase in supply chain attacks using compromised 3rd party
vendors as a delivery of attack vectors. This includes abusing cloud misconfigurations to gain access to
cloud infrastructure and application.
The continuous enhancement of the control environment to protect from- and detect and respond to-
distributed denial-of-service (DDoS), targeted attacks and more specific ransomware attacks is of the
highest priority.
Based on regular scenario analysis done in ING’s first line of defence, additional defensive controls continue
to be embedded in the organisation as part of the overall internal control framework and are continuously
re-assessed against existing and new threats.
The further digitalisation of banking services, increasing electronic exchange of information via different
consumer channels, use of and dependency on third-party vendors for services, and the implementation of
the EU Digital Operational Resilience Act (DORA) are likely to present ongoing cybercrime-resilience and IT-
security challenges, both in the short and medium-term. Criminal actors are targeting financial and
sensitive (payment) data, such as customer user credentials outside the traditional banking environment.
Sensitive (payment) or personal data can be obtained by criminals via social forums such as Facebook and
Linked-In.
IT and Cyber Risk Assessment and Reporting
To safeguard customer trust and to keep the bank secure the office of the Chief Information Security Officer
(CISO) is predicting, preventing, detecting, and responding to threats and incidents. Secure architecture,
engineering, and Identity and Access Management are preventive measures to define, implement and
review components that mitigate the risk of unauthorised access to IT systems and the data processed and
stored therein. Security detection and Response functionality is implemented to identify and provide timely
ING Group Annual Report 2023 on Form 20-F 147
alerts of malicious behaviour. Cyber threat assessments delivers awareness about new and existing threats
and vulnerabilities targeting ING infrastructure.
ING continues to invest in cybersecurity capabilities in all domains (prediction, prevention, detection,
response, and recovery).
Different types of cyberthreats are not only relevant for the financial industry, but are increasingly hitting its
supply chains. We are monitoring these Cybersecurity risks from our suppliers, via the Third-Party Cyber Risk
Management process. This process is part of the generic risk management framework as defined in the Non-
Financial Risk Framework Policies. These policies are detailed out in a set of Minimum Standards, amongst
which the Security Monitoring Minimum Standard and the Cyber Resilience Minimum Standard.
The policy documents (policies, minimum standards) identify inherent risks and contain objectives and
controls to mitigate identified inherent risks as well as a section on roles and responsibilities regarding IT
and controls.
The different processes for assessing, identifying, and managing material risks from cybersecurity threats
address the objectives as defined in the Information and Technology Risk Policy.
The Global CISO and key security positions are held by internal staff. ING Group IT Audit function is fully
internally staffed. The key controls in the risk management framework relevant for internal control over
financial reporting are being audited by an external auditor.
In addition, ING continues to strengthen its global cybercrime resilience through collaboration. with financial
industry peers, law enforcement authorities, government (e.g. National Cyber Security Centre) and Internet
Service Providers (ISPs).
Cybersecurity incidents
No material cybersecurity incidents or threats (including any with criminal intent meeting the ECB cyber
incident reporting thresholds) were identified on ING infrastructure in 2023.
However, in June 2023, customers of ING in Germany suffered a breach of a third-party bank account
switching service resulting in a customer data leak for private customers who, when opening a current
account with ING, used the German legal account change assistance ("Gesetzliche Kontowechselhilfe").
German banks are legally obliged to support private customers in moving their account from the old to the
new bank in this defined generic process. ING in Germany informed authorities and affected customers
about the incident and provided safety instructions and contact options to further protect personal
information.
We are currently not aware of any threats in our own environment that are likely to materialise in the near
future.
Cybersecurity Governance
ING's risk and control structure is based on the three lines of defence (“3 LoD”) model. The 3 LoD model aims
to provide a sound governance framework for financial and non-financial risk management by defining and
implementing three risk management ‘layers’, with distinct roles, execution and oversight responsibilities. In
1st LoD, the IT Risk department within the CISO domain acts as a 1st line entity to support ING's local IT
domains in managing, identifying, and dealing with IT and Cybersecurity Risk. Within each entity of ING,
local IT Risk and IT Security functions exist. The Corporate IT Risk Management department is the 2nd LoD
which objectively challenges the execution in the 1st LoD and 3rd LoD Corporate Audit Services (CAS)
provides an independent assessment of the internal controls.
For operational reporting of the risks, the 1st line of defence (LoD) uses dashboard tooling and IT Risk
Measurement Platform (ITRMP), enabling continuous management of its own control state. Material
deviations found by the 1st LoD or by 2nd LoD (through second-line monitoring, i.e. quality assurance, risk
assessments, etc.) or by the 3rd LoD (internal IT audits), are monitored by 2nd LoD and 3rd LoD to ensure
adequate mitigation of issues and risks by 1st LoD.
The Risk monitoring processes, as described, report the cybersecurity risks to the Bank non-financial risk
Committee on a quarterly basis. The 3LoD reports quarterly (CAS reports) to the Management Board
Banking, Executive Board and Audit Committee including relevant results, details of the key reports issued
during the quarter and the follow-up of reported findings. The 3LoD Annual Report to the Management
Banking Board, Executive Board and Audit Committee provides the relevant results of the CAS activities and
a CAS’ view on the adequacy and effectiveness of ING’s processes for controlling its activities and managing
its risk in all the areas of ING.
The Management Board Banking (MBB) and Executive Board (EB) of ING is informed of key IT / cybersecurity
risks on a quarterly basis via Non-Financial Risk updates, and IT risks are included as well in regular
Integrated Risk updates. In addition, the MBB is immediately informed of any material cybersecurity
incident after it occurred. The Risk Committee (RiCo) of ING’s Supervisory Board (SB) receives the
aforementioned Non-Financial Risk (NFR) update as well. Whenever a larger cyber incident occurs, this is in
principle also discussed in the RiCo and SB on an ad hoc basis.
Those quarterly reports are pre-discussed by the Bank Non-Financial Risk Committee, in which senior NFR/
Risk management is represented, before they are shared with the MBB/EB and RiCo.
ING Group Annual Report 2023 on Form 20-F 148
Relevant expertise
To ensure that the entire Workforce have appropriate competences and capabilities to fulfil their assigned
tasks and responsibilities, ING developed Global Job Profiles which are embedded in the Global Job
Architecture. These profiles describe in detail and regularly assess the maturity of the workforce on required
competences and capabilities as well as on behavioural aspects. Development gaps, if any, are identified
quickly, regularly reviewed, and closed when possible. Relevant training and certification are being offered
by the Tech academy or the local IT academies to help our employees develop further.
Every year ING enrols a mandatory cybersecurity e-learning to all countries, covering both in- and external
employees. The content is based on the basic cybersecurity topics, and it is mandatory during the year for
all new onboarded employees as well. The Management Board steers on 92% completeness (due to in/
outflow, maternity leaves, illness) this is proven realistic. During the year there are many global
(newsletters) and local (presentations) initiatives to cover the trending cybersecurity threat topics.
On an annual basis a Permanent Education Plan for the EB/MBB and SB is drafted in which topics related to
IT/digitalisation, including IT risk management are covered. Such sessions include, e.g. sessions on
Operational Resilience, Cyber, Cybersecurity/Ransomware, and digitalisation.
The members of supervisory and oversight bodies have a broad competency in the area of IT &
Cybersecurity. In the Management Board Banking of ING Bank, which has ING Groep as its sole shareholder,
a dedicated Chief Technology Officer role is embedded. Our current Chief Technology Officer (CTO) is
combining the CTO role on an ad interim basis with his COO role in the Management Board Banking of ING
Bank N.V. The Global Head of CISO reports directly to the CTO. The CTO a.i. is a highly experienced leader
with a broad and deep expertise in operations across wholesale and retail banking. In his previous role as
COO Wholesale Banking at ING he was responsible for the day-to-day operations and global transformation,
including the organisation and application of technology in the design and implementation of the customer
experience. The CTO a.i. therefore has a strong understanding of data, technology, the application of it in
ING’s operations and the risks related to it.
ING Global CISO is actively involving internal and external stakeholders on actions to manage cybersecurity
relevant measures and impacts. This includes staff, board members, customers, partners, suppliers,
governments, and regulators. Examples of active involvement are a yearly mandatory cybersecurity e-
learning, covering both in- and external employees, ING podcasts, webinars and round table sessions with
clients and suppliers, and on our websites we provide useful information to improve resilience for retail
customers.
ING Group Annual Report 2023 on Form 20-F 149
PART III.
Item 17. Consolidated Financial
Statements
Not applicable.
Item 18. Consolidated Financial
Statements
ING Group Annual Report 2023 on Form 20-F 150
Item 19. Exhibits
The following exhibits are filed as part of this Annual Report:
Exhibit 1.1 | |
Exhibit 2.1 | |
Exhibit 2.2 | |
Exhibit 2.3 | |
Exhibit 2.4 | |
Exhibit 2.5 | |
Exhibit 2.7 | |
Exhibit 2.8 | |
Exhibit 2.9 | |
Exhibit 2.10 | |
Exhibit 2.11 | |
Exhibit 2.12 | |
Exhibit 2.13 |
ING Group Annual Report 2023 on Form 20-F 151
Exhibit 2.14 | |
Exhibit 2.15 | |
Exhibit 2.16 | |
Exhibit 2.17 | |
Exhibit 8 | |
Exhibit 12.1 | |
Exhibit 12.2 |
Exhibit 13.1 | |
Exhibit 13.2 | |
Exhibit 15.1 | |
Exhibit 15.2 | |
Exhibit 97 | |
Exhibit 101 | Inline eXtensible Business Reporting Language (Inline XBRL) |
Exhibit 104 | Cover Page Interactive Datafile (embedded in Exhibit 101) |
ING Group Annual Report 2023 on Form 20-F 152
SIGNATURES
The registrant hereby certifies that it meets all the requirements for filing on Form 20-F and that it has duly
caused and authorised the undersigned to sign this annual report on its behalf.
ING Groep N.V.
(Registrant)
By:/s/T. Phutrakul
T. Phutrakul
Chief Financial Officer
Date: March 4, 2024
ING Group Annual Report 2023 on Form 20-F 153
Risk management
A series of tumultuous events this year impacted our operating
environment. These include concerns around financial institution
stability following the failure of some banks, and geopolitical
uncertainties due to the ongoing war in Ukraine and the Israel-Gaza
conflict. These conflicts have brought further disruptions to supply
chains and energy prices in an environment of already high inflation.
This section explains ING’s approach to monitoring, managing and
controlling risks.
As a global financial institution with a strong European base, offering banking services, ING is exposed to a
variety of risks. We manage these risks through a comprehensive risk management framework that
integrates risk management into strategic planning and daily business activities. This aims to safeguard
ING’s financial strength and reputation by promoting the identification, measurement and management of
risks at all levels of the organisation. Taking measured risks aligned with its risk appetite is core to ING’s
business.
The risk management function supports the EB in formulating the risk appetite, strategies, policies and
limits. It provides adequate steering, oversight, challenge and controls throughout ING on risk-related items.
This section sets out how ING manages its risks on a day-to-day basis. It explains how the risk management
function is embedded within the organisation based on the ‘three lines of defence’ model. It describes the
key risks that arise from ING’s business model and how these are managed by dedicated risk management
departments, with various specific areas of expertise. The section provides qualitative and quantitative risk
disclosures on solvency, credit, market, funding and liquidity, ESG, operational, IT, compliance, business and
model risks.
Basis of disclosures (*) The risk management section contains information relating to the nature and extent of the risks of financial instruments as required by International Financial Reporting Standards (IFRS) 7 'Financial Instruments: Disclosures'. These disclosures are an integral part of ING Group Consolidated financial statements and are indicated by the symbol (*). This is applicable for the chapters, paragraphs, graphs or tables within the risk management section that are indicated with this symbol in the respective headings or table header. This risk management section includes additional disclosures beyond those required by IFRS standards, such as certain legal and regulatory disclosures. Not all information in this section can be reconciled back to the primary financial statements and corresponding notes, as it has been prepared using risk data that differs to the accounting basis of measurement. Disclosures in accordance with Part Eight of the CRR2 and CRD V, and as required by the supervisory authority, are published in our ‘Additional Pillar III Report’, which can be found on our corporate website ing.com. | |||
Top and emerging risks
The risks listed below are defined as existing and emerging risks that could cause actual results to differ, in
some instances materially, from those anticipated. They may have a material impact on the reputation of
the company, introduce volatility in future operating results or impact ING’s medium- and long-term
strategy, including the ability to pay dividends, maintain appropriate levels of capital or meet liquidity and
funding targets. An emerging risk is defined as a new or unexpected risk that we don't have experience of
managing, and so need to proactively identify and monitor. The impact on the organisation is therefore
more difficult to assess than other risk factors. These risks are on top of other existing risks.
The topics have mainly emerged as part of the annual risk assessment that feeds into, among others, the
annual review of the Stress Testing Framework and the Risk Appetite Framework. The sequence in which the
risks are presented below is not indicative of their likelihood of occurrence or the potential magnitude of
their financial consequences.
The 2023 risk assessment confirmed our top and emerging risks. The top risks in 2023 relate to people risk,
geopolitical risk, cybercrime, and inflation risk. Climate change risk remains an emerging risk, and reflects
the impact that climate change may have on the financial position and/or reputation of ING.
ING Group Annual Report 2023 on Form 20-F 154
Geopolitical risk
Geopolitical risk was of the greatest concern for the MBB in 2023, and dedicated meetings were held on this
topic. ING developed a specific geopolitical risk assessment to complement the normal risk-assessment
process. This risk persisted throughout the year, mainly due to tensions between the US and China, relating
to Taiwan and deglobalisation. Other reasons were the ongoing war in Ukraine that persisted in 2023, and
the Israel-Gaza conflict.
China/Taiwan/US
China’s increased military presence in the South China Sea, technological advancements, and ongoing trade
tensions with the US have given rise to geopolitical tensions between these countries. Despite a common
interest in a good relationship, particularly across trade and supply chain, the countries also have areas of
conflict, like the Taiwan situation, and their relations have become more complex in recent years. China has
threatened to sell US Treasury bonds, and the US has blacklisted some Chinese technology companies.
There is growing concern that US-China trade tensions could escalate into further financial disconnection.
Such a conflict would cause significant disruption to global financial markets and the economy.
Deglobalisation
The period of Western-based liberalisation and globalisation is being challenged by a global trend towards
polarisation and more assertive political policies. The rise of nationalism, protectionism, populist movements
and anti-global sentiments in recent years has created an environment of increasing uncertainty. This could
potentially lead to a reversal or slowdown of globalisation.
The war in Ukraine
The war in Ukraine continued to pose a significant geopolitical risk in 2023. It has initiated a humanitarian
crisis and given rise to greater risk exposures, causing disruption to business and economic activity in the
region and worldwide. Following the invasion of Ukraine, the US, UK and EU initiated sanctions against
Russia in 2022. In response, the Russian Central Bank enforced liquidity and currency controls. For sanctions-
With the support by NATO membership countries for Ukraine in the form of financial and military aid,
neither side seeming likely to produce a conclusive victory in the near term, and a ceasefire or settlement
looking improbable, the uncertainty about the outcome of the war looks set to last in the longer term.
Remaining at risk for ING in December 2023 is €0.4 billion (2022: €0.3 billion) local equity and €1.3 billion
(2022: €2.5 billion) credit exposures booked outside of Russia. In Ukraine, our exposure was approximately
€600 million (2022: €500 million), mainly with liquidity facilities and other lending. Early in March 2022, we
announced a decision to not do new Russia-related business.
Israel-Gaza conflict
The Israel-Gaza conflict brings significant volatility to the region and disrupts broader efforts to enhance
cooperation between Israel and the Arab states. As the conflict continues to unfold, it poses a real threat to
stability in the wider Middle East, and could affect oil supplies and drive the price higher.
People risk
People risk, which can be translated into management of labour, including among others talent attraction
and retention, was the highest risk in the risk assessment in 2023. The main challenges were linked to the
salary and compensation demands coming from a high-inflation environment and subsequent rising cost of
living. This led to lengthy CLA negotiations in the Netherlands, creating employee uncertainty.
The other concern was the skill shortage in the labour market. The labour markets in general, and the
financial industry more so, face an intensified challenge to attract and keep eligible talent. Competition not
only comes from peers; new players like tech companies and start-ups entered the playing field and are
looking for similar profiles. On how ING mitigates the risks related to skill shortage, see 'Unlocking our
people's full potential' in 'ESG overview' under ‘Social’.
Climate and environmental risk
Climate-related and environmental risks are among the biggest threats the world is facing. They can impact
both ING and the global economy in various ways.
ING is aware of the risks associated with climate change and how these can impact customers and their
financial health. This includes physical risk and transition risk. Physical risk can be acute, such as floods and
wildfires, or chronic, such as increased temperature and rising sea levels. Transition risk can be driven by
policy, technological or market changes as we shift towards a low-carbon global economy, and potentially
lead to stranded assets.
Cybercrime and fraud
The further digitalisation of existing banking services, the introduction of new products, and evolving threats
against those services – combined with developing technology such as generative AI and deep fake – are
continuously presenting fraud-management challenges, both in the short and medium term.
Criminal actors are becoming more resourceful in targeting financial and sensitive (payment/personal) data,
such as customer user credentials outside the traditional banking environment. Criminals can obtain
sensitive (payment) or personal data via social forums such as WhatsApp, dark web shops, by screen
ING Group Annual Report 2023 on Form 20-F 155
scraping user credentials or through third-party data breaches. In 2023, these challenges increased further
with more sophisticated phishing attempts, improved social engineering fraud attempts, and high volumes
of scams through so-called authorised push-payment frauds. The increase in scams is a big concern for
financial institutions, with often devastating consequences for customers. While financial institutions have
limited means to prevent such authorised transactions, it is a priority to help prevent this type of fraud.
Inflation risk
Inflation rates remained exceptionally high across the globe in 2023, triggered by increases in labour costs
and high food and energy prices. Rises in inflation prompted an adjustment of monetary policy stances by
major central banks, leading to rising interest rates and tighter global financial conditions.
The mix of high inflation and rising interest rates led to the further deterioration of macro-financial
conditions, aggravating pre-existing vulnerabilities for both businesses and households, and ultimately
increasing banks’ credit risk. As such, ING still had management adjustments to its loan loss provisions in
place for this at year-end 2023.
Risk governance
Effective risk management requires company-wide risk governance. ING’s risk and control structure is based
on the ‘three-lines-of-defence’ governance model. Each line has a specific role and defined responsibilities,
with the execution of tasks being distinct from the control of these same tasks. The three lines work closely
together to identify, assess, mitigate and monitor risks.
This governance framework is designed in such a way that risk is managed in line with the risk appetite
approved by the MBB, the EB and the SB, and this approach is cascaded throughout ING.
The heads of ING’s banking business and support functions and the heads of the country units, or their
delegates, are the first line of defence. They have primary ownership, accountability and responsibility for
identifying, assessing, controlling and mitigating all financial and non-financial risks affecting their
businesses. They are also responsible for the completeness and accuracy of the financial statements and
risk reports, with respect to their areas of responsibility. The CTO is responsible and accountable for proper
security and controls of global applications and IT platforms servicing the bank, and implementing proper
processes. The COO domain builds bridges within ING, linking to almost every part of the bank. Its purpose is
to drive secure and efficient processes for customers and colleagues.
The second line of defence consists of oversight and specialised functions in risk management and
compliance. They (i) have co-responsibility for risk management, through articulating and translating the
risk appetite into methodologies and policies to support and monitor business management's control of risk;
(ii) objectively challenge risk management execution and control processes, and coordinate the reporting of
risks and controls by the first line of defence; (iii) advise on risk management and compliance, and have
decision-making power in relation to business activities that are judged to present unacceptable risks to ING;
and (iv) can set minimum requirements in terms of quality and quantity of global resourcing in the risk
management and compliance functions.
The internal audit function forms the third line of defence. It provides independent assurance to the Audit
Committee, the EB and the MBB on the quality and effectiveness of ING’s internal control, risk management,
governance and implemented systems and processes in both the first and second lines of defence. To
protect its independent nature, decisions regarding the appointment, reappointment or dismissal from
office as well as the remuneration package of the head of the internal audit function require SB approval.
Board-level risk oversight
Both the EB (for ING Group) and the MBB (for ING Bank) play an important role in managing and monitoring
our risk management framework:
•The SB is, for risk management purposes, advised mainly by the Risk Committee, which assists and
advises in monitoring the risk profile and approving the overarching risk appetite of the company as well
as the structure and effective operation of the internal risk management and control systems.
•The EB is responsible for managing risks associated with all activities of ING Group, whereas the MBB is
responsible for managing risks associated with all activities of ING Bank. The EB and MBB responsibilities
include ensuring that internal risk management and control systems are effective and that ING Group
and ING Bank comply with relevant legislation and regulations. On a regular basis, the EB and MBB report
on these issues and discuss the internal risk management and control systems with the SB. On a
quarterly basis, the EB and MBB report on ING’s risk profile versus its risk appetite to the Risk Committee,
explaining changes in the risk profile.
As a member of the EB and the MBB, the CRO is primarily responsible for: (i) supporting the Board in its
engagement with and oversight of the development of the risk appetite and risk appetite statements and
for translating the risk appetite into a risk limits structure, actively engaged in monitoring performance
relative to risk-taking and risk limit adherence; (ii) setting up the risk management framework and
overseeing the development and implementation of risk and compliance policies, processes, models,
compatible methodologies, including both forward-looking and backward-looking tools, ongoing
strengthening of risk management/people capabilities and reports, as necessary to ensure the effectiveness
of robust internal control and risk systems to fully support its strategic objectives and all of its risk-taking
activities; (iii) regularly providing comprehensive information on risks to the Management Board, the Risk
Committee and other relevant functions; and (iv) advising about the current risk profile, current state of the
ING Group Annual Report 2023 on Form 20-F 156
risk culture, utilisation against the established risk appetite, and limits, limit breaches and mitigation plans.
Executive level
The risk committees described below act within the overall risk policy and delegated authorities granted by
the MBB:
•The Global Credit and Trading Policy Committee (GCTP) discusses and approves policies, methodologies,
and procedures related to credit, trading, country, and reputation (such as environmental and social risk
or ESR) risks. The GCTP meets monthly. After the MBB and the GCTP, the Credit and Trading Risk
Committee (CTRC) is the highest-level body authorised to discuss and approve policies, methodologies,
and procedures related to credit and trading risk.
•The Global Credit Committee – Transaction Approval (GCC(TA)) discusses and approves transactions that
entail taking credit risk (including investment risk), country, legal, and environmental and social risk. The
GCC(TA) meets twice a week.
•The Asset and Liability Committee Bank (ALCO Bank) translates the strategy into a risk appetite and sets,
monitors and reviews the asset and liability objectives and risk management framework. Adequate
supervision and coordination of asset and liability management is essential for good risk management
and to serve customer and community needs by continued sound banking business. The MBB has
delegated this responsibility to the ALCO Bank.
•The Non-Financial Risk Committee Bank (NFRC Bank) is accountable for the design and maintenance of
the non-financial risk management framework, including operational risk management, compliance and
legal policies, minimum standards, procedures and guidelines, development of tools, methods, and key
parameters (including major changes) for risk identification, measurement, mitigating and monitoring/
reporting. NFRC Bank meetings are held at least quarterly.
•The Model Risk Management Committee (MoRMC) discusses and steers, on a monthly basis, the overall
model strategy. MoRMC discusses and approves policies and methodologies related to model risk
management.
•The Global Data Committee (GDC) oversees (identifies, measures, responds to change and monitors) the
Global Data function and its contribution to wider society. The GDC meets every two months.
Regional and business unit level
ING’s regional and/or business unit management have primary responsibility for the management of risks
(credit, market, funding and liquidity, operational, IT, compliance and model) that arise in their daily
operations. They are accountable for the implementation and execution of appropriate risk frameworks
affecting their businesses in compliance with procedures and processes at the corporate level. Where
necessary, the implementation is adapted to local requirements.
The regional and/or business unit (BU) head of risk are involved in these activities. The local (regional and BU)
head of risk is responsible for the analysis, monitoring and management of risks across the whole value
chain (from front to back office). The local risks are discussed in local risk committees that roll up to the key
risk committees at executive level. Local Client Integrity Risk Committees (CIRCs) assess client integrity risk,
and they have a final decision on client acceptance or client off-boarding, from a risk-based perspective, in
the areas of financial crime, Foreign Account Tax Compliance Act (FATCA), Common Reporting Standard
(CRS), and ESR.
Organisational structure
The CRO function is organised along the lines of a matrix structure integrating (i) the Global Risk functions,
(ii) the Regional/Country Risk functions at entity level, and (iii) the Risk Segments, with a uniform
methodology and terminology, aimed at ensuring a holistic view of all risks. Global Risk functions, organised
by risk types into risk domains (departments), are ultimately responsible and accountable for the functional
steering of the respective risk type globally, ensuring a uniform taxonomy and methodology is used for the
setting of the relevant risk appetite levels, further cascading risk appetite into detailed risk strategies and for
the effective monitoring and reporting of risks, on an individual and consolidated basis.
The following organisation chart illustrates the reporting lines in 2023 for the risk management
organisation. The fixed lines reflect hierarchical reporting lines, whereas the dotted lines are for the
functional reporting lines:
ING Group Annual Report 2023 on Form 20-F 157
 |
Risk policies, procedures and standards
ING has a framework of risk management policies, procedures and minimum standards in place to create
consistency throughout the organisation, and to define requirements that are binding for all business units.
The goal of the governance framework of the local business units is to align with ING’s framework and to
meet local (regulatory) requirements. Senior management is responsible for the implementation of and
adherence to policies, procedures and standards. Policies, procedures and standards are regularly reviewed
and updated via the relevant risk committees to reflect changes in requirements, markets, products and
practices.
Internal control framework
In its Enterprise Risk Management (ERM) Framework, ING explains its approach to mitigating risk outside
ING’s risk appetite. The internal control framework (ICF) translates regulations and internal requirements
into policies articulating specific risks and control objectives. These policies form the basis for translation into
process control standards, which are used by the business to support and promote an effective risk and
control environment. The ICF includes binding principles, definitions, process steps, and roles and
responsibilities to create consistent bank-wide policies and control standards.
Global policies and control standards are developed and maintained or updated within the ICF. These global
documents are designed by head-office functions and are to be adhered to by all ING entities and support
functions. In line with the ERM approach, ownership for policies will be with the second line of defence (2nd
LoD), while control standards are to be owned by the first line of defence (1st LoD). Global policy and control
standard documents are approved by relevant approval bodies (e.g. SB, EB, MBB and NFRC Bank).
The policies are based on the risk taxonomy, which is designed to prevent overlaps in policy control
objectives. The control standard owners are responsible for defining the key controls that mitigate the
critical and high inherent risks in the business processes.
Risk culture
At ING, we attach great importance to a sound risk culture, which is essential for performing our role in
society responsibly and in keeping the bank safe and secure. We determine our risk culture as the way in
which employees identify, understand, discuss and act on the many financial and non-financial risks we are
confronted with every day. We cover risk culture, ING's global Code of Conduct and behavioural risk
extensively in 'ESG overview, ‘Governance’.
Learning
In 2023, we continued to expand and strengthen our required learning curriculum. This is foundational
learning that is centrally created and rolled out to all staff across the bank. The topics covered in 2023 were
financial crime, customer centricity, cybersecurity and data protection. We continue to update our formats
for our learning to increase engagement and drive practical application of the knowledge gained by staff.
The curriculum is tracked centrally to monitor timely completion.
In addition to all staff modules, we continue to expand our learning offering on a range of risk topics and for
risk staff. Working with risk experts, the Risk Academy has built role-based learning plans for risk colleagues
which provide a wide selection of learning to support their professional development. These take the form of
a comprehensive offering of learning modules and learning channels that support employees in developing
their knowledge, skills and behaviours.
ING Group Annual Report 2023 on Form 20-F 158
Dutch Banker’s Oath
In the Netherlands, all employees are required to take the Banker's Oath and pledge this promise in a
meaningful ceremony. The Oath came into force in the Netherlands on 1 April 2015, as part of a joint
approach from all banks, aimed at introducing social regulations, a revised Dutch Banking Code
implementing an oath with associated rules of conduct and disciplinary law. This way, Dutch banks show
society what they stand for and are accountable for, both as individual banks and as a sector. In 2021, due
to the Covid-19 pandemic, ING in the Netherlands changed the live Banker's Oath ceremonies into virtual
ceremonies, to allow new employees (around 400 a month) to still take the oath in time and in a
meaningful ceremony. After 2021, this was continued and is now common practice at ING. Before taking the
oath, an e-learning and a challenge (discussing dilemmas) are mandatory, to stress the content and the
importance of the oath. It also show employees the dilemmas they may face in their daily work, and how to
carefully balance the interests of all our stakeholders in the decisions they make.
Remuneration
ING aims to align its remuneration policy with its risk profile and the interests of all stakeholders. For more
information on ING’s compensation and benefits policies, and its relation to the risk taken, see the Capital
Requirements Regulation (CRR) remuneration disclosure published on ing.com.
Risk cycle process
ING uses a step-by-step risk management approach to identify, manage and mitigate financial and non-
financial risks. The approach consists of a cycle of five recurring activities: risk identification, risk assessment,
risk control, risk monitoring and risk reporting. The cycle is designed to determine what the risks are, assess
which of these can really do harm, take mitigating measures to control these risks, monitor developments
to see if the measures taken are effective, and report the findings to management at all relevant levels to
enable them to take action when needed.
The cycle recurs in two ways. First, the identification, assessment, review and update of mitigating
measures are repeated periodically. Second, this periodic monitoring exercise may indicate emerging risks,
known risks that are changing, risk levels that are changing, or current control measures that are not
effective enough. Further analyses of these findings may then result in renewed and more frequent risk
identification, and/or assessment, and/or change of mitigating measures.
Risk identification
Risk identification is a joint effort of the business and the risk management functions. Its goal is to detect
potential new risks and determine changes in known risks. Regular risk identification is essential for effective
risk management. Potential risks that are not identified will not be controlled and monitored, and may lead
to surprises later. Known risks may have changed over time and, as a consequence, the existing mitigating
measures and monitoring may be inadequate or obsolete.
Risk identification is performed periodically. In case of material internal or external change, additional ad
hoc risk identification can be performed.
Risk assessment
Each identified risk is assessed qualitatively or quantitatively to determine its importance. This enables ING
to decide which of the identified risks need control measures and how strict or tolerant these measures
should be. Known risks are reassessed to detect any change in the risk level.
The importance of a risk is based on both the likelihood that the risk materialises and the subsequent
financial or reputational impact that may occur should the risk arise. Unlikely risks with a potentially high
impact need to be controlled. A risk that is likely to happen regularly but expected to have a modest
financial impact may not need to be mitigated if the consequences are accepted by management.
Risk control
Risks can be controlled by mitigating measures that lower the likelihood the risk occurs, lower the impact
when it occurs, or both. The ultimate measure to lower a risk is to stop the activity or service that causes the
risk (risk avoidance). Risk control and mitigation measures are defined and maintained both bank-wide and
at the local level.
Monitoring and reporting
ING monitors risk-control measures by checking if they are executed, complied with, and have the expected
mitigating effects, and by following the development of the risks and their risk levels. Risk reporting provides
senior and local management with the information they need to manage risks.
Risk appetite framework
The Risk Appetite Framework (RAF) is one of the key elements of the ERM framework. Its objective is to set
an appropriate risk appetite at a consolidated level across different risk categories and to allocate the risk
appetite throughout the organisation.
Policy
The RAF policy explains the setup of the overarching global risk appetite. Within the RAF, ING monitors a
range of financial and non-financial risk metrics with an aim to keep our risk profile in line with our risk
appetite while executing our strategy. ING’s RAF, which is approved by the SB, defines the desired risk profile
ING Group Annual Report 2023 on Form 20-F 159
that is to be integrated in the strategic decision-making and financial planning process. It is designed to be
able to withstand market volatility and stress, while meeting regulatory requirements. The framework,
including underlying metrics and assumptions, is regularly reviewed so that it remains relevant. The RAF
combines various financial and non-financial risk appetite statements (RAS) into a single, coordinated
approach, to provide the business with a clear overview of the relevant risks and the tools to manage them.
This view allows the EB, the MBB, and senior management to form an opinion on the adequacy of internal
risk management and control systems for the risks ING faces while pursuing its strategy.
Process
The RAF is focused on setting the risk appetite at the consolidated level and across the different risk
categories, and provides the principles for cascading this risk appetite down into the organisation. The RAF
and underlying limit allocation are reviewed on an annual basis, or more frequently if necessary, based on
their monthly review in the MBB and quarterly review in the EB and the SB. It is therefore a top-down
process, which bases itself on the ambition of the bank in terms of its risk profile, the regulatory
environment and the economic context. Limits that require SB approval are called boundaries, and the
underlying instruments supporting the boundaries require EB and MBB approval.
Step 1. Identify and assess ING’s key risks
The outcome of the risk-identification and risk-assessment process is used as the starting point for the
review of the RAF. Within this step, the risks ING faces when executing its strategy are identified in the
context of the current economic, political, social, regulatory and technological environment. The
assessment identifies whether the potential impact is material and if it is sufficiently controlled within ING’s
risk management function. It benchmarks the current risk framework against regulatory developments.
Known risks are reassessed, either to confirm likelihood and risk levels or to take account of potential
changes.
Step 2. Set risk appetite framework
Based on ING’s risk assessment and risk purpose, boundaries for the overarching risk frameworks are set.
Once the overarching risk appetite thresholds have been set and approved by EB/MBB and subsequently by
SB, the statements are translated into risk-type-specific statements and lower-level thresholds, which are
set and approved by senior risk committees, like ALCO Bank, GCTP, MoRM and Bank NFRC. Cascading is done
via several detailed risk appetite statements, which have been defined per risk type, the combination of
which is aimed at ensuring compliance with the overarching solvency, (credit) concentration, and funding
and liquidity RASs.
Examples of risk categories and their underlying risk metrics include:
•Solvency and profitability (e.g. CET1 ratio, MREL ratio and economic capital coverage ratio);
•Funding and liquidity (e.g. liquidity coverage ratio (LCR) and net stable funding ratio (NSFR));.
•Credit risk (e.g. exposure at default (EAD) and risk weighted assets (RWA));
•Market risk trading book (e.g. event risk and historical value at risk (HVaR));
•Market risk banking book (e.g. net interest income (NII) at risk and revaluation reserve at risk);
•Non-financial risk (e.g. capital-at-risk and management of audit issues);
•Compliance risk (e.g. key risk indicators on Financial Crime and Conduct);
•Business risk (e.g. economic capital);
•Model risk (e.g. number of unvalidated or inadequate pillar 1 models).
ING has started including climate risk in its RAF by, among other things, introducing climate risk as one of
the dimensions to determine sector concentration as part of the credit risk appetite statements. In the
coming years, ING will extend the inclusion of climate risk impact on other risk types with the aim of
ensuring that the potential risks stemming from, for example, transition risk and physical risk are properly
captured in the RAF.
Step 3. Cascade into statements per risk type and business unit
The bank-wide risk appetite is translated per risk type, which is further cascaded into the organisation. Risk
appetite statements are then translated into dedicated underlying risk limits that are used for the day-to-
day monitoring and management of ING’s risks. The risk appetite statements serve as input for the
quarterly planning process as well as for the establishment of key performance indicators and targets for
senior management. The next graph is an illustrative and non-exhaustive overview of the RAF.
ING Group Annual Report 2023 on Form 20-F 160

Step 4. Monitor and manage underlying risk limits
To verify that ING remains within the RAF, it reports the risk positions vis-à-vis their limits on a regular basis
to senior management committees. A monthly report is submitted to the MBB reflecting the exposure of
ING against the risk appetite. An extended report is submitted quarterly to the EB and the SB and its Risk
Committee. Moreover, every quarter the financial plan is checked for potential limit excess within a one-year
horizon, where in the strategic dialogue the MBB can take mitigating measures or make adjustments to the
dynamic plan.
Stress testing
Stress testing is an important risk management tool that provides input for strategic decisions and capital
planning. The purpose of stress testing is to assess the impact of plausible but severe stress scenarios on
ING’s capital and liquidity position. Stress tests provide complementary and forward-looking insights into the
vulnerabilities of certain portfolios, with regards to adverse macroeconomic circumstances, stressed
financial markets, and changes in the political and geopolitical climate. In addition to assessing P&L, capital
and liquidity positions of ING for a range of different scenarios, idiosyncratic risks are also included. The
outcomes of these stress tests help management get insight into the potential impact, and define actions to
mitigate this potential impact.
Types of stress tests
Within ING, we perform different types of stress tests. The most comprehensive type of stress tests are the
firm-wide scenario analyses, which involve setting scenario assumptions for all the relevant macroeconomic
and financial market variables in all countries relevant to ING. These assumptions usually follow a qualitative
narrative that provides a background to the scenario. In addition to firm-wide scenario analyses, ING
executes scenario analyses for specific countries or portfolios. Furthermore, sensitivity analyses are
performed, which focus on stressing one or more risk drivers; usually without an underlying scenario
narrative. Finally, ING performs reverse stress tests, which aim to determine scenarios that could lead to a
predefined severe adverse outcome.
Process
ING's stress-testing process consists of several stages:
•Risk identification and risk assessment: It identifies and assesses the risks ING or the relevant entity is
facing when executing its strategy based on the current and possible future economic, political,
regulatory and technological environment. It provides a description of the main risks and risk drivers
related to the nature of ING’s business, activities and vulnerabilities.
•Scenario definition and parameterisation: Based on the outcome of the previous step, a set of scenarios
is determined with the relevant scope and set of risk drivers for each scenario, as well as its severity, the
key assumptions and input parameters. The output of this phase includes a quantitative description of
the stress scenarios to be analysed, the relevant output metrics and, when applicable, a narrative
description.
•Impact calculation and aggregation: Based on the quantitative description of the stress scenarios
determined in the previous step, the impact is determined for the relevant scenario, scope and horizon.
The impact calculation and aggregation can be part of a recurring process or part of a specific process
set-up for one-off stress tests.
•Scenario reporting: For each stress test, a report is prepared after each calculation, which describes the
results of the scenario and gives a recap of the scenario with its main assumptions and parameters. The
stress-test report is sent to the relevant risk committees and/or senior management. It is complemented,
if needed, with advice for management action based on the stress-testing results.
•Scenario control and management assessment: Depending on the outcomes of the stress test and the
likelihood of the scenario, mitigating actions may be proposed. Mitigating actions may include, but are
not limited to, sales or transfers of assets and reductions of risk limits.
Methodology
Detailed and comprehensive models are used to calculate the impact of the scenarios. In these models,
statistical analysis is combined with expert opinion to make sure that the results adequately reflect the
scenario assumptions. The methodologies are granular and portfolio-specific, and use different
macroeconomic and market variables as input variables. The calculations are in line with our financial and
regulatory reporting frameworks. The stress-testing models are subject to review by Model Risk
management.
ING Group Annual Report 2023 on Form 20-F 161
Solvency risk
Introduction
Solvency risk is the risk of lacking sufficient capital to fulfil business objectives, regulatory requirements or
market expectations. An insolvent bank is unable to pay its debts and will be forced into bankruptcy.
The level and quality of capital is crucial for the resilience of individual banks. Banks are expected to assess
the risks they face and, in a forward-looking manner, ensure they identify and manage all material risks.
They must also make sure these risks are sufficiently covered by loss-absorbing capital to provide continuity
if unexpected risks materialise in times of stress. Given the interdependencies with other financial and non-
financial risks, this balancing act of capital adequacy needs to be done within a sound and integrated
management approach. It must coherently link and align all the moving parts of the bank with its long-term
business strategy.
Governance
ING's solvency risk governance is based on the three-lines-of-defence structure setting a clear division of
responsibilities as well as an independent risk-control challenge process.
Group Treasury (GT) Balance Sheet & Capital Management, as first line of defence, is responsible for
maintaining the adequate capitalisation of ING Group and ING Bank entities, to manage the risk associated
with ING’s business activities. This involves not only managing, planning and allocating capital within ING
Group, ING Bank and its various entities, but also helping to execute necessary capital market transactions,
term (capital) funding and risk management transactions. ING takes an integrated approach to assess the
adequacy of its capital position in relation to its risk profile and operating environment. This means GT's
Balance Sheet & Capital Management takes into account both regulatory and internal, economic-based
metrics and requirements, as well as the interests of key stakeholders, such as shareholders and rating
agencies.
Integrated Risk acts as second line of defence and is therefore responsible for all the risk topics within the
internal capital adequacy assessment process (ICAAP) framework. This starts with the annual risk
identification and risk-assessment process which functions as the starting point for the annual review of the
related building blocks. Integrated risk coordinates the annual review of the risk appetite framework and as
part of this proposes the solvency risk appetite. The output of the risk assessment is also used by Integrated
Risk for the annual review of ICAAP stress-test scenarios and the economic capital framework. By doing so,
Integrated Risk challenges the execution, management and control processes in relation to the business
activities.
As the third line of defence, Corporate Audit Services provides an ongoing independent and objective
assessment of the effectiveness of internal controls to mitigate risks embedded in ING’s business processes,
including risk management activities performed by both the first and second line of defence.
The SB remains ultimately responsible for overseeing ING’s overall ICAAP framework whereas the EB and
MBB are responsible for the functioning of the ICAAP processes by managing and executing them. Delegated
decision power is mandated towards ALCO Bank. As a sub-committee of ALCO Bank, the ICLAAP Committee
and Stress Test Council own delegated responsibilities concerning the ICAAP processes and brings together
expertise and knowledge from different key departments involved. It functions as an oversight body,
responsible for maintaining a sound and effective processes and ensuring that the different elements of the
ICAAP fit coherently together as an integral part of the institution’s overall management framework.
ICAAP framework
ING’s internal capital adequacy assessment process (ICAAP) framework aims to ensure that capital levels
remain adequate – both forward-looking and under adverse conditions, in terms of covering material risks-
to-capital from both a normative and an economic (internal) perspective. The assessment of ING’s capital
adequacy takes into account its business strategy and risk profile, market environment, and operating
macro environment. This implies that views of various stakeholders, such as regulators, shareholders,
investors, rating agencies, clients and customers play an important role.
The continued strength of ING’s capital position, the adequacy of the financial position, and risk
management effectiveness are essential to achieving the strategy. ING’s capital and funding strategy
determines the underlying ICAAP elements, and thereby contributes to ING's business continuity from
different perspectives.
Managing ING’s capital entails finding the right balance between supply and demand, while taking into
account market and macro circumstances. The process of balancing these strategic goals is captured in the
ICAAP framework. It is enabled by six building blocks and underlying elements facilitating the ICAAP. The
following building blocks have been defined in the ICAAP framework, which are applied for both the
‘normative’ and ‘economic’ perspective as defined in the ECB guide to ICAAP, published in November 2018:
•Risk identification and assessment;
•Risk appetite;
•Solvency stress testing;
•Planning and forecasting;
•Capital management;
•Continuity.
ING Group Annual Report 2023 on Form 20-F 162
Risk identification and assessment
ING’s capital management and solvency risk management starts with the risk-identification and risk-
assessment process. Its main purpose is to detect potential new risks and identify changes in the potential
impact of known risks. On an annual basis, ING performs a thorough review of its solvency risks or risks to
capital. Within this assessment, bottom-up assessments are combined with top-down assessments,
including a questionnaire and interviews with senior management. The results of the risk assessment are
discussed in ALCO Bank, which comprises of almost the full MBB. Once approved, the conclusions of the risk
assessment feed into the annual review of the risk appetite framework, the stress-testing framework, and
the economic capital framework. In addition to this annual process, ING also reassesses its risks as part of its
capital adequacy statement, a quarterly process to assess ING’s capital adequacy.
Risk appetite
As explained in the RAF section in the previous chapter, ING has established overarching solvency risk
boundaries. Boundaries are risk appetite statements that are essential for risk management activity, making
it of paramount importance to keep these boundaries within the defined level. The SB is responsible for
approving and monitoring the boundaries, which are complemented by a sequence of risk-type-specific
instruments (risk appetite statements). These underlying risk appetite statements are cascaded down into
the organisation, and dedicated risk thresholds are set that are used for the day-to-day monitoring and
management of ING’s risks. ING has solvency risk appetite statements in place for the following metrics:
CET1 ratio, total capital ratio, leverage ratio, total loss-absorbing capacity (TLAC), and minimum
requirement for own funds and eligible liabilities (MREL) based on RWA/leverage ratio and economic capital
adequacy.
Solvency stress testing
Solvency stress testing allows ING to examine the effect of plausible but severe stress scenarios on the
solvency position. It also provides insight into which entities or portfolios are vulnerable to certain types of
risks or scenarios. Solvency stress testing is an important tool in identifying, assessing, measuring, and
controlling risks to capital, providing a complementary and forward-looking perspective to other solvency
risk management tools. For solvency stress testing, ING follows the same steps described in the overall
section on stress testing.
ING distinguishes the following three types of stress test analysis:
•Sensitivity analysis: Assess the impact of a predefined shock in one or more risk drivers. The main
purpose of sensitivity analyses is to monitor the impact of this predefined (or standardised) shock over
time to get an understanding of how the risk profile of the bank has developed. In contrast with scenario
analyses, sensitivity analyses are built on a predefined set of shocks that don't necessarily relate to a
qualitative story line.
•Scenario analysis: Used to assess the impact of historical, statistical and/or hypothetical circumstances
on the financial position of ING. These stress tests often build on a qualitative scenario narrative and
reflect risk topics that are deemed relevant for ING given, for example, its business model or geographical
presence. To execute such a stress test, scenarios need to be determined that are dynamic and forward-
looking, and incorporate the occurrence of a string of events through time.
•Reverse stress testing: The purpose is to identify scenarios that could lead to a pre-defined outcome. This
could, for example, be a CET1 ratio or MREL to define the point at which the bank is considered not viable
anymore. The added value of reverse stress testing is to explore risk drivers and stress scenarios outside
the existing range.
The outcomes of solvency stress test analyses are taken into account in capital planning, but also for setting
risk appetite statements and the capital management buffer.
Planning and forecasting
The capital and funding plan is an integral part of the dynamic plan, ING’s financial and business planning
process. Its objective is to inform and advise the management on the capital development and need of ING
Group and ING Bank, under base case and adverse scenarios. It describes how ING shall finance the expected
capital constraints taking into consideration growth projections, capital and risk evolution, macro and
market conditions, both under the normative and economic perspective. The capital and funding plan is
discussed and approved by ALCO Bank and updated at least twice a year. Within these updates, ING takes
account of recent market and risk developments, and aims to ensure that capital planning adheres to the
solvency risk appetite set by the SB.
Capital management
Formulation of the CET1 target is a key element in solvency risk management. The target ratio, based on
the management buffer concept, enables ING’s senior management to steer, benchmark and assess the
bank’s current and future capital levels much more efficiently. The target level clearly supports trust-
building among ING’s key stakeholders (e.g. regulators, investors, and customers).
The capital management buffer aims to protect the interests of key stakeholders and plays an important
role in the overall capital adequacy governance. The rationale behind the buffer is that it provides an
additional cushion on top of the (local) regulatory minimum requirements (e.g. supervisory review and
evaluation process (SREP) requirements) to withstand a certain level of stress and facilitate awareness and
preparedness to take management actions. ING reviews its capital management buffer on a regular basis to
ING Group Annual Report 2023 on Form 20-F 163
Continuity
Risk events with high severity or significant deteriorations of economic and market conditions beyond ING’s
control could cause deviations from the business and capital plans, which may result in a potential capital
shortfall.
ING has therefore set up a continuity (safety) net of contingency and recovery planning. As part of this, ING
set up ongoing monitoring of relevant indicators with the aim of awareness and preparedness to act
proactively to ensure continuity. The intervention measures, which can be activated when deemed
necessary, consist of predefined RWA reduction measures, as well as direct capital-increasing measures.
The escalation mechanisms are defined, governed and detailed in the contingency and recovery plans.
Both plans aim to restore ING’s capital adequacy. Depending on the severity of the situation, the
contingency plan can be activated at this warning phase, as well as triggering further mitigating action and
formation of the contingency crisis teams. Further drops in capital levels trigger the alert phase for recovery
monitoring and/or the activation of the recovery plan and corresponding crisis teams.
Assessing capital adequacy: Capital Adequacy Statement (CAS)
The CAS is ING Group’s quarterly assessment of its capital adequacy and takes into account different
elements with respect to its capital position. The degree to which ING’s capital position is considered
adequate depends on a variety of internal and external drivers:
•Current supervisory requirements and (expected) requirements going forward;
•Current internal requirements and (expected) requirements going forward (economic capital/view);
•Coherence of the available capital with the (realisation of) strategic plans;
•The ability to meet internal and external requirements in the case of stressed events or should a risk
materialise.
The CAS assesses the adequacy of ING’s capital position in relation to the above-mentioned drivers and
states the extent to which the capital position consequently is considered as adequate. On a quarterly basis,
the CAS document is prepared. Additionally each year, the EB/MBB signs and provides a comprehensive
assessment of ING’s capital adequacy, supported by the ICAAP outcomes, in the form of a capital adequacy
statement.
Capital developments
ING’s profit-generating capacity was strong in 2023, despite a challenging geopolitical environment. After
dividend reserving in line with the distribution policy, we included €3.5 billion of profit to our capital base.
ING Group’s capital ratios increased compared to 2022, primarily due to higher net profit after dividend
reserving, coupled with lower risk-weighted assets. ING announced the distribution of an additional €1.5
billion and €2.5 billion as next steps to converge the CET1 ratio towards ING’s target of around 12.5% by
2025. In line with regulations, these additional distributions were fully reflected in ING's capital ratios at
year-end. Risk-weighted assets were mainly impacted by volume reduction in Russia-related exposure,
currency movements, improvement in book quality and model impacts. ING continues to maintain a strong
and high-quality capital level.
At the end of December 2023, ING Group had a CET1 ratio of 14.7% versus an overall SREP requirement
(including buffer requirements) of 10.98%. The Group’s Tier 1 ratio increased to 16.9%. The total capital
ratio increased from 19.4% to 19.8% compared to last year.
The leverage ratio was at 5.0% at the end of 2023, down from 5.1% at the end of 2022.
MREL and TLAC requirements
The minimum requirement for own fund and eligible liabilities (MREL) and total loss absorbing capacity
(TLAC) apply to ING Group at the consolidate level of the resolution group. TLAC and MREL provide additional
capacity to absorb losses and facilitate recapitalisation in the case of resolution. ING Group has a single
point of entry resolution strategy.
Intermediary MREL requirements were 27.79% on RWA and 5.97% on leverage exposure as of December
2023. ING meets these MREL requirements with an MREL ratio of 32.5% on RWA and 9.6% on leverage
exposure at the end of December 2023.
As of December 2023, TLAC requirements are 23.5% of RWA and 6.75% of leverage exposure. The available
TLAC capacity consists of own funds and senior debt instruments issued by ING Group. With a TLAC ratio of
32.5% on RWA and 9.6% on leverage exposure, ING comfortably meets the TLAC requirements.
ING Group Annual Report 2023 on Form 20-F 164
Credit risk
Introduction
Credit risk is the risk of loss from the default and/or credit rating deterioration of clients. Credit risks arise in
ING’s lending, financial markets and investment activities. The credit risk section provides information on
how ING measures, monitors and manages credit risk and gives an insight into the portfolio from a credit
risk perspective.
ING’s credit risk strategy is to maintain an internationally diversified loan and bond portfolio, while avoiding
large risk concentrations. The emphasis is on managing business developments within the defined credit
and concentration risk appetite. The aim is to support relationship banking activities, while maintaining
internal risk/reward guidelines and controls.
The Credit Risk department is responsible for setting the credit risk strategy for ING and aims to ensure
credit risk and credit restructuring are managed from an overarching point of view rather than per business
line. Furthermore, the Credit Risk Control Unit is responsible for the oversight and control of rating systems.
While the Credit Risk department has oversight of the Group credit risk strategy and risk appetite across
Retail Banking risk and Wholesale Banking risk, the head of Retail/Rest of World (RoW) Risk and head of
Wholesale Banking Risk aim to ensure the management of the risk within these business lines. Also refer to
the Risk governance and organisational structure in the introductory section of 'Risk management'.
The Credit Risk function encompasses the following activities:
•Providing consistent credit risk policies, systems and tools to manage the credit lifecycle of all activities;
•Measuring, monitoring and managing credit risks in the bank’s portfolio, including evaluation of scenario
and stress test results;
•Challenging and approving new and modified transactions and borrower reviews, including involvement
in the process of assigning risk ratings to indicate a clients's creditworthiness;
•Managing the levels of provisioning and risk costs, and advising on impairments.
Credit risk categories (*)
In the following table the different types of credit risk categories are described and a reconciliation with the
notes in the financial statements is also included:
Reconciliation between credit risk categories and financial position (*) | |||
Credit risk categories | Notes in the financial statements | ||
Lending risk: is the risk that the client (counterparty, corporate or individual) does not pay the principal interest or fees on a loan when they are due, or on demand for letters of credit (LCs) and guarantees provided by ING. | Note | 2 | Cash and balances with central banks |
Note | 3 | Loans and advances to banks | |
Note | 4 | Financial assets at fair value through profit or loss | |
Note | 5 | Financial assets at fair value through other comprehensive income | |
Note | 7 | Loans and advances to customers | |
Note | 41 | Contingent liabilities and commitments | |
Investment risk: is the credit default and risk rating migration risk that is associated with ING’s investments in bonds, commercial paper, equities, securitisations and other similar publicly traded securities. This can be viewed as the potential loss that ING may incur from holding a position in underlying securities whose issuer's credit quality deteriorates or defaults. | Note | 4 | Financial assets at fair value through profit or loss |
Note | 5 | Financial assets at fair value through other comprehensive income | |
Note | 6 | Debt securities | |
Money market risk: arises when ING places short-term deposits with a counterparty in order to manage excess liquidity. In the event of a counterparty default, ING may lose the deposit placed. | Note | 2 | Cash and balances with central banks |
Note | 3 | Loans and advances to banks | |
Note | 7 | Loans and advances to customers | |
Pre-settlement risk: arises when a client defaults on a transaction before settlement and ING must replace the contract by a trade with another counterparty at the then prevailing (possibly unfavourable) market price. This credit risk category is associated with derivatives transactions (exchange-traded derivatives, over- the-counter (OTC) derivatives and securities financing transactions). | Note | 4 | Financial assets at fair value through profit or loss |
Note | 14 | Financial liabilities at fair value through profit or loss | |
Note | 40 | Offsetting financial assets and liabilities | |
Settlement risk: arises when there is an exchange of value (funds or instruments) and receipt from its counterparty is not verified or expected until after ING has given irrevocable instructions to pay or has paid or delivered its side of the trade. The risk is that ING delivers but does not receive delivery from its counterparty. | Note | 4 | Financial assets at fair value through profit or loss |
Note | 11 | Other assets | |
Note | 14 | Financial liabilities at fair value through profit or loss | |
Note | 16 | Other liabilities | |
ING Group Annual Report 2023 on Form 20-F 165
Credit risk appetite and concentration risk framework (*)
The credit risk appetite and concentration risk framework is designed to prevent undesired high levels of
credit risk and credit concentrations within various levels of the ING portfolio. It is derived from the concepts
of boundaries and instruments as described in the ING Risk Appetite Framework (RAF).
Credit risk appetite is the maximum level of credit risk ING is willing to accept for growth and value creation.
The credit risk appetite is linked to the overall bank-wide RAF. The credit risk appetite is expressed in
quantitative and qualitative measures. Having a credit risk appetite provides:
•Clarity about the credit risks that ING is prepared to assume, target setting and prudent risk
management. Credit risk appetite is used as an input for Lending guidances which are made by sector
and/or location;
•Consistent communication to different stakeholders;
•Guidelines on how to align reporting and monitoring tools with the organisational structure and strategy;
•Alignment of business strategies and key performance indicators of business units with ING’s credit risk
appetite through dynamic planning.
The credit risk appetite is set at different levels and dimensions within ING. The credit risk appetite
framework specifies the scope and focus of the credit risk which ING takes and the composition of the credit
portfolio, including its concentration and diversification objectives in relation to business lines, locations,
sectors and products. The credit risk appetite framework has also been extended to embed climate risk
elements. The first steps towards introducing climate risk elements in the credit risk appetite framework
were taken in 2022 and these have further evolved and matured in 2023. The climate risk elements within
the credit risk appetite framework allow for more efficient steering of sector concentrations from a climate
risk perspective.
The credit concentration risk framework is composed of:
•Country risk concentration: Country risk is the risk that arises due to events in a specific country (or group
of countries). To manage the maximum country loss ING is willing to accept, boundaries are approved by
the SB. The estimated level is correlated to the risk rating assigned to a given country. Actual country
limits are set by means of country instruments, which are monitored monthly and updated, when
needed. For countries with elevated levels of geopolitical or severe economic cycle risk, monitoring is
performed on a more frequent basis with strict pipeline and exposure management.
•Single name and secondary risk concentration: ING has an established credit concentration risk
framework to identify, measure and monitor single name concentration including secondary risk. The
same concept of boundaries and instruments is applicable.
•Sector and product concentration risk are managed via the credit risk appetite framework.
Credit risk models (*)
Within ING, internal CRR-compliant models are used to determine probability of default (PD), exposure at
default (EAD) and loss given default (LGD) for regulatory and economic capital purposes. These models also
form the basis of ING’s IFRS 9 loan loss provisioning (see ‘IFRS 9 models’ below). Bank-wide, ING has
implemented approximately 100 credit risk models, for regulatory capital, economic capital and loan loss
provisioning purposes.
There are two main types of PD, EAD and LGD models used throughout the bank:
•Statistical models are created where a large set of default or detailed loss data is available. They are
characterised by sufficient data points to facilitate meaningful statistical estimation of the model
parameters. The model parameters are estimated with statistical techniques based on the data set
available.
•Hybrid models are statistical models supplemented with knowledge and experience of experts from risk
management and front-office staff, literature from rating agencies, supervisors and academics. These
models are only used for ‘low default portfolios’, where limited historical defaults exist.
Credit risk rating process (*)
The majority of risk ratings are based on a risk rating (PD) model that complies with the minimum
requirements detailed in CRR/CRDIV, ECB Supervisory Rules and European Banking Authority (EBA)
guidelines. This concerns all borrower types and segments.
ING’s PD rating models are based on a 1-22 internal risk rating scale (1 = highest rating; 22 = lowest rating)
referred to as the ‘master scale’, which roughly corresponds to the rating grades that are assigned by
external rating agencies, such as Standard & Poor’s, Moody’s and Fitch. For example, an ING rating of 1
corresponds to an S&P/Fitch rating of AAA and a Moody’s rating of Aaa; an ING rating of 2 corresponds to an
S&P/Fitch rating of AA+ and a Moody’s rating of Aa1, and so on.
The 22 internal risk rating grades are composed of the following categories:
•Investment grade (risk rating 1-10);
•Non-investment grade (risk rating 11-17);
•Performing Restructuring (risk rating 18-19);
•Non-performing (risk rating 20-22).
The first three categories (1-19) are risk ratings for performing loans. Ratings are calculated in IT systems
with internally developed models, based on manually or automatically fed data, or for part of the non-
performing loans set by the global or regional credit restructuring department. Under certain conditions, the
outcome of a manually fed model can be challenged through a rating appeal process. For securitisation
portfolios, the external ratings of the tranche in which ING has invested are leading indicators.
ING Group Annual Report 2023 on Form 20-F 166
Risk ratings assigned to clients are reviewed at least annually, with the performance of the underlying
models monitored regularly. Some of these models are global in nature, such as those for large corporates,
commercial banks, insurance companies, central governments, funds, fund managers, project finance and
leveraged companies. Other models are more regional or country-specific: there are PD models for small
and medium enterprises (SMEs) in the Netherlands, Belgium, Poland as well as residential mortgage and
consumer loan models in the various retail markets.
Rating models for Retail clients are predominantly statistically driven and automated, such that ratings can
be updated on a monthly basis. Rating models for large corporates, institutions and banks include both
statistical characteristics and manual input, with the ratings being manually updated at least annually.
More frequent reviews (e.g. quarterly) are performed where considered necessary, for example portfolios
and clients most at risk of being impacted by the Russian invasion of Ukraine and expected spillover effects.
In line with evolving regulatory expectations on models and emerging industry practices ING has embarked
a multi-year redevelopment process of its credit risk models. This is also in line with ING’s model governance
to ensure continuous improvement of models.
Credit risk systems
Credit risk tools and data standards
The acceptance, maintenance, measurement, management and reporting of credit risks at all levels of ING
are executed through single, common credit risk data standards using shared credit risk tools that support
standardised and transparent credit risk practices. ING has chosen to develop credit risk tools centrally with
the philosophy of using a single source of data in an integrated way. This includes applying a combination
of the ING policy, the regulatory environment in which we operate and the daily processes that are active
throughout the Group. Disciplined application in these three areas is essential for achieving high data quality
standards.
The credit risk control unit (CRCU), which is part of the Credit Risk department, manages the CRCU control
framework offering quality assurance on the regulatory areas of responsibility: the oversight and control of
rating systems. This framework leans on control execution in other teams such as model development in
Integrated Risk where the combination of these different teams is considered for the CRCU self-assessment.
ING’s credit exposure is mainly related to lending to individuals (also referred to as consumer lending, all
Retail) and businesses (referred to as business lending, both in Retail and Wholesale) followed by
investments in bonds and securitised assets, and money market (Wholesale). Loans to individuals are
mainly mortgage loans secured by residential property. Loans (including guarantees issued) to businesses
are often collateralised, but may be unsecured based on the internal analysis of the borrower’s
creditworthiness. Bonds in the investment portfolio are generally unsecured, but predominantly consist of
bonds issued by central governments and EU and/or OECD-based financial institutions. Secured bonds, such
as mortgage-backed securities and asset-backed securities are secured by the underlying diversified pool of
assets (commercial or residential mortgages, car loans and/or other assets) held by the securities issuer. For
money market, exposure is mainly deposits to central banks. The last major credit risk source involves pre-
settlement exposures which arise from trading activities, including derivatives, repurchase transactions and
securities lending/borrowing transactions. This is also commonly referred to as counterparty credit risk.
ING Group Annual Report 2023 on Form 20-F 167
Portfolio analysis per business line (*)
Outstandings per line of business (*)1, 2, 3 | |||||||||||
in € million | Wholesale Banking | Retail Benelux | Retail Challengers & Growth Markets | Corporate Line | Total | ||||||
Rating class | 2023 | 2022 | 2023 | 2022 | 2023 | 2022 | 2023 | 2022 | 2023 | 2022 | |
Investment grade | 1 (AAA) | ||||||||||
2-4 (AA) | |||||||||||
5-7 (A) | |||||||||||
8-10 (BBB) | |||||||||||
Non-Investment grade | 11-13 (BB) | ||||||||||
14-16 (B) | |||||||||||
17 (CCC) | |||||||||||
Performing Restructuring loans | 18 (CC) | ||||||||||
19 (C) | |||||||||||
Non-performing loans | 20-22 (D) | ||||||||||
Total | |||||||||||
Industry | |||||||||||
Private Individuals | |||||||||||
Central Banks | |||||||||||
Natural Resources | |||||||||||
Real Estate | |||||||||||
Commercial Banks | |||||||||||
Non-Bank Financial Institutions | |||||||||||
Central Governments | |||||||||||
Transportation & Logistics | |||||||||||
Utilities | |||||||||||
Food, Beverages & Personal Care | |||||||||||
Services | |||||||||||
General Industries | |||||||||||
Lower Public Administration | |||||||||||
Other | |||||||||||
Total | |||||||||||
ING Group Annual Report 2023 on Form 20-F 168
Outstandings per line of business (*) - continued1, 2, 3 | |||||||||||
in € million | Wholesale Banking | Retail Benelux | Retail Challengers & Growth Markets | Corporate Line | Total | ||||||
Region | 2023 | 2022 | 2023 | 2022 | 2023 | 2022 | 2023 | 2022 | 2023 | 2022 | |
Europe | Netherlands | ||||||||||
Belgium | |||||||||||
Germany | |||||||||||
Poland | |||||||||||
Spain | |||||||||||
United Kingdom | |||||||||||
Luxembourg | |||||||||||
France | |||||||||||
Rest of Europe | |||||||||||
America | |||||||||||
Asia | |||||||||||
Australia | |||||||||||
Africa | |||||||||||
Total | |||||||||||
1 Based on credit risk measurement contained in lending, pre-settlement, money market and investment activities. | |||||||||||
2 Based on the total amount of credit risk in the respective column using ING’s internal credit risk measurement methodologies. Economic sectors (industry) below 2% are not shown separately but grouped in Other. | |||||||||||
3 Geographical areas are based on country of residence, except for private individuals for which the geographical areas are based on the primary country of risk. | |||||||||||
Overall portfolio (*)
During 2023, ING’s portfolio size decreased by €6.5 billion (0.69 %) to €931.6 billion outstanding. Foreign
exchange rate changes had a negative impact on the portfolio growth, mainly in WB, decreasing total
outstanding by €4.6 billion, driven by the depreciation of the US dollar (-3.8 %) against the euro, Australian
dollar (-3.4 %) and Turkish lira (-42.1 %), partly compensated by the Polish zloty (+6.8 %).
Rating distribution (*)
Overall, the rating class distribution remained stable in 2023. The share of investment grade rating classes
increased from 76.2 % to 76.8 %, while the share of non-investment grade decreased from 21.7 % to 21.2 %.
Performing restructuring outstandings decreased from 0.8 % to 0.7 % of the total portfolio, whereas non-
performing loans increased from 1.2 % to 1.3 %. The decrease in AAA and the increase in AA was mainly due
to lower Central banks/Central Governments exposure in AAA-rated countries, partly driven by the
downgrade of the USA to AA rating.
With respect to the rating distribution within the business lines, in WB, investment grade remained at 81.2 %,
where non-investment grade exposures increased to 17.1 % (from 16.8 %) compared to 2022. Performing
Restructuring assets decreased from 1.0 % to 0.7 % of total Wholesale Banking assets. The share of non-
performing loans for WB remained stable at 1.0 %.
The non-investment grade portfolio of Retail Benelux increased from 28.9 % to 30.3 % of the portfolio, which
is explained primarily by rating migration in mortgages in Belgium. Performing restructuring remained flat
at 0.9 % whereas NPL improved to 1.8 % (from 1.9 %) in 2023.
In Retail Challengers & Growth Markets, the distribution across rating classes remained stable in 2023.
Overall share of investment grade increased from 75.2 % to 78.9 %. NPL increased to 1.2 % (from 1.0 %).
Industry (*)
The industry breakdown is presented in accordance with the NAICS definition. Total volume decreased in
2023 from €938.1 billion to €931.6 billion (-0.7 %), mainly witnessed in Netherlands (-2.3 %) and in
Luxembourg (-7.4 %) due to a decrease in outstanding at Central Banks. The largest part of our book in terms
of outstandings is in private individuals with 38.8 % (2022: 37.8 %). Private individuals accounted for 67 %
outstanding in Germany, 67 % in Spain, 66 % Australia and 55 % in the Netherlands. The increase in WB
ING Group Annual Report 2023 on Form 20-F 169
Private individuals is following the discontinuation of Retail Banking France which led to the transfer of the
Retail individuals portfolio from Retail Banking to Wholesale Banking.
Looking at sectors in the Business Lending portfolio, the most notable decrease in outstanding, next to
Central Banks, was in Natural Resources (-€4.2 billion).
Outstandings by economic sectors and geographical area (*) 1 | ||||||||||||||
in € million | Region | Total | ||||||||||||
Industry | Netherlands | Belgium | Germany | Poland | Spain | United Kingdom | Luxembourg | France | Rest of Europe | America | Asia | Australia | Africa | 2023 |
Private Individuals | ||||||||||||||
Central Banks | ||||||||||||||
Natural Resources | ||||||||||||||
Real Estate | ||||||||||||||
Commercial Banks | ||||||||||||||
Non-Bank Financial Institutions | ||||||||||||||
Central Governments | ||||||||||||||
Transportation & Logistics | ||||||||||||||
Utilities | ||||||||||||||
Food, Beverages & Personal Care | ||||||||||||||
Services | ||||||||||||||
General Industries | ||||||||||||||
Lower Public Administration | ||||||||||||||
Other | ||||||||||||||
Total | ||||||||||||||
Rating class | ||||||||||||||
Investment grade | ||||||||||||||
Non-Investment grade | ||||||||||||||
Performing restructuring | ||||||||||||||
NPL grade | ||||||||||||||
Total | ||||||||||||||
1 Geographical areas are based on country of residence, except for private individuals for which the geographical areas are based on the primary country of risk. | ||||||||||||||
ING Group Annual Report 2023 on Form 20-F 170
Outstandings by economic sectors and geographical area (*) 1 | ||||||||||||||
in € million | Region | Total | ||||||||||||
Industry | Netherlands | Belgium | Germany | Poland | Spain | United Kingdom | Luxembourg | France | Rest of Europe | America | Asia | Australia | Africa | 2022 |
Private Individuals | ||||||||||||||
Central Banks | ||||||||||||||
Natural Resources | ||||||||||||||
Real Estate | ||||||||||||||
Commercial Banks | ||||||||||||||
Non-Bank Financial Institutions | ||||||||||||||
Central Governments | ||||||||||||||
Transportation & Logistics | ||||||||||||||
Utilities | ||||||||||||||
Food, Beverages & Personal Care | ||||||||||||||
Services | ||||||||||||||
General Industries | ||||||||||||||
Lower Public Administration | ||||||||||||||
Other | ||||||||||||||
Total | ||||||||||||||
Rating class | ||||||||||||||
Investment grade | ||||||||||||||
Non-Investment grade | ||||||||||||||
Performing restructuring | ||||||||||||||
Non-performing loans | ||||||||||||||
Total | ||||||||||||||
1 Geographical areas are based on country of residence, except for private individuals for which the geographical areas are based on the primary country of risk. | ||||||||||||||
Portfolio analysis per geographical area (*)
The portfolio analysis per geographical area re-emphasises the international distribution of ING’s credit
portfolio. The share of the Netherlands in the overall portfolio (ex-Central Banks) reduced to 21.8 % (2022:
The most noticeable trend in the Netherlands was the decrease in exposure with central banks (-€4.2
billion). Outstandings to private individuals are at 63.9 % (2022: 62.5 %) of total outstandings (excl. Central
Banks). In Belgium, no substantial changes were observed in the portfolio.
In terms of rating distribution in individual countries, the total share of investment grade/non-investment
grade remains substantial for the Netherlands at 98.6 % (2022: 98.5 %) and in Belgium 96.6 % (2022: 96.3 %).
Performing restructuring grade assets remained flat in the Netherlands at 0.7 %, whereas Belgium
decreased from 0.8 % to 0.7 %. The NPL share decreased in 2023, from 0.8 % to 0.7 % in the Netherlands, and
from 2.8 % to 2.7 % in Belgium.
In Challengers & Growth Markets, ING has a sizeable residential mortgages portfolio in Germany, Australia,
Spain and Poland.
ING Group Annual Report 2023 on Form 20-F 171
The top five countries within Rest of Europe based on outstandings were: Italy (€18.7 billion), Romania
(€11.5 billion), Switzerland (€11.2 billion), Türkiye (€7.2 billion) and Ireland (€4.7 billion).
In Europe, outside the Benelux, rating distribution in most countries remained stable. The most noticeable
changes in rating distribution were observed in Rest of Europe, where the development of the Russian
portfolio caused a decrease into Performing Restructuring from 3.0 % to 2.3 %. Note the paragraph on
Russian exposures in section 'Risk management at ING Group'. Apart from Russia, noticeable changes
occurred in the UK, where NPL decreased from 1.2 % to 0.6 %.
In terms of rating distribution for the Americas region, an increase in NPL is observed to 1.5 % (from 0.8 %),
whereas in Asia, NPL decreased from 2.7 % to 2.0 %. In Africa, NPL increased from 3.0 % to 13.0 %, driven by
one well-covered file.
Credit risk mitigation (*)
ING uses various techniques and instruments to mitigate the credit risk associated with an exposure and to
reduce the losses incurred subsequent to a default by a customer. The most common terminology used in
ING for credit risk protection is ‘cover’. While a cover may be an important mitigant of credit risk and an
alternative source of repayment, generally it is ING’s practice to lend on the basis of the customer’s
creditworthiness rather than exclusively relying on the value of the cover.
Cover forms (*)
Within ING, there are two distinct forms of covers. First, where the asset has been pledged to ING as
collateral or security, ING has the right to liquidate it should the customer be unable to fulfil its financial
obligation. As such, the proceeds can be applied towards full or partial compensation of the customer's
outstanding exposure. This may be tangible (such as cash, securities, receivables, inventory, plant and
machinery, and mortgages on real estate properties) or intangible (such as patents, trademarks, contract
rights and licences). Second, where there is a third-party obligation, indemnification or undertaking (either
by contract and/or by law), ING has the right to claim from that third party an amount if the customer fails
on its obligations. The most common examples are guarantees, such as parent guarantees, export credit
insurances or third-party pledged mortgages. Insurance or reinsurance covers, including comprehensive
private risk insurance (CPRI) may be recognised as guarantees and effectively function in an equivalent
manner. ING accepts credit risk insurance companies and export credit agencies (ECAs) as cover providers.
Cover valuation methodology (*)
General guidelines for cover valuation are established with the objective of ensuring consistent application
within ING. These also require that the value of the cover is monitored on a regular basis. Covers are
revalued periodically and whenever there is reason to believe that the market is subject to significant
changes in conditions. The frequency of monitoring and revaluation depends on the type of cover.
The valuation method also depends on the type of covers. For asset collateral, the valuation sources can be
the customer’s balance sheet (e.g. inventory, machinery and equipment), nominal value (e.g. cash and
receivables), market value (e.g. securities and commodities), independent valuations (e.g. commercial real
estate) and market indices (e.g. residential real estate). For third-party obligations, the valuation is based on
the value that is attributed to the contract between ING and that third party.
Where collateral values are used in the calculation of stage 3 individual loan loss provisions, haircuts may be
applied to the valuation in specific circumstances, to sufficiently include all relevant factors impacting future
cash flows. ING applies haircuts to the collateral values of real estate, shipping and aviation assets that are
used in the calculation of the loss-given-default in recovery scenarios. The haircut reflects the risks of
adverse price developments between the moment of valuation of an asset and the actual settlement/cash
receipt.
Cover values (*)
This section provides insight into the types of cover and the extent to which exposures benefit from
collateral or guarantees. The disclosure differentiates between risk categories (lending, investment, money
market and pre-settlement). The most relevant types of cover include mortgages, financial collateral (cash
and securities) and guarantees. ING obtains cover that is eligible for credit risk mitigation under CRR/CRDIV,
as well as cover that is not eligible. Collateral covering financial market transactions is valued on a daily
basis, and as such not included in the following tables. To mitigate the credit risk arising from financial
markets transactions, the bank enters into legal agreements governing the exchange of financial collateral
(high-quality government bonds and cash).
The cover values are presented for the total portfolio of ING, both the performing and non-performing
portfolio. Our definition of non-performing is explained in detail in ‘Credit restructuring’ (below).
The next table gives an overview of the collateralisation of the ING’s total portfolio.
ING Group Annual Report 2023 on Form 20-F 172
Cover values including guarantees received (*) | ||||||||
in € million | Cover type and value | Collateralisation | ||||||
2023 | Outstandings | Mortgages | Financial Collateral | Guarantees | Other covers | No Cover | Partially covered | Fully covered |
Consumer lending | ||||||||
Business lending | ||||||||
Investment and money market | ||||||||
Total lending, investment and money market | ||||||||
of which NPL | ||||||||
Pre-settlement | ||||||||
Total Group | ||||||||
Cover values including guarantees received (*) | ||||||||
in € million | Cover type and value | Collateralisation | ||||||
2022 | Outstandings | Mortgages | Financial Collateral | Guarantees | Other covers | No Cover | Partially covered | Fully covered |
Consumer lending | ||||||||
Business lending | ||||||||
Investment and money market | ||||||||
Total lending, investment and money market | ||||||||
of which NPL | ||||||||
Pre-settlement | ||||||||
Total | ||||||||
Excluding the pre-settlement portfolio, 55.0 % (2022: 52.3 %) of ING’s outstandings were fully collateralised in
2023. Since investments traditionally do not require covers, the percentage for ‘no covers’ in this portfolio is
above 95 %. However, 99 % of the investment outstanding is investment grade. Improved economic
conditions in ING’s main markets contributed to improved collateral valuations, observed in consumer
lending.
Consumer lending portfolio (*)
The consumer lending portfolio accounts for 38.7 % (2022: 37.7 %) of ING’s total outstanding, primarily
consisting of residential mortgage loans and other consumer lending loans. As a result, most collateral
consists of mortgages. Mortgage values are collected in an internal central database and in most cases
external data is used to index the market value. A significant part of ING’s residential mortgage portfolio is in
the Netherlands (34.8 %), Germany (28.0 %), Belgium including Luxembourg (13.3 %) and Australia (10.9 %).
Note that the large increase in Financial Collateral and decrease in Other covers is related to a
reclassification of certain cover types.
Business lending portfolio (*)
Business lending accounts for 39.1 % (2022: 40.4 %) of ING’s total outstanding. Business lending presented in
this section does not include pre-settlement, investment and money market exposures.
ING Group Annual Report 2023 on Form 20-F 173
Credit quality (*)
Credit risk ratings | ||||
Regular | Watch List | Restructuring 1 | Non-performing 1 | |
Possible ratings | 1–19 | 1–19 | 11–20 | 20-22 |
Typical ratings | 1–14 | 15–17 | 18–20 | 20-22 |
Deterioration in risk | Not significant | Significant | Significant | Significant |
Significant intervention | Not required | Not required | Required | Required |
Account ownership | Front office | Front office | Front office | Front office |
Credit Risk Management | Regular | Regular | Credit Restructuring | Credit Restructuring |
Primary manager | Front office | Front office | Credit restructuring | Credit restructuring |
Accounting provisioning | Stage 1/2 | Stage 2 | Stage 2/3 | Stage 3 |
1 Restructuring can be performing and non-performing; reference is made to the Credit restructuring section. | ||||
Credit quality outstandings (*) | ||
in € million | 2023 | 2022 |
Performing not past due | ||
Business lending performing past due | ||
Consumer lending performing past due | ||
Non-performing | ||
Total lending and investment | ||
Money market | ||
Pre-settlement | ||
Total | ||
Past due obligations (*)
Retail Banking measures its portfolio in terms of payment arrears and determines on a monthly basis if
there are any significant changes in the level of arrears. This methodology is applicable to private
individuals, as well as business lending. An obligation is considered ‘past due’ if a payment of interest or
principal is more than one day late. ING aims to help its customers as soon as they are past due by
reminding them of their payment obligations. In its contact with the customers, ING aims to solve the
(potential) financial difficulties by offering a range of measures (e.g. payment arrangements, restructuring).
If the issues cannot be cured, for example because the customer is unable or unwilling to pay, the contract
is sent to the recovery unit. The facility is downgraded to risk rating 20 (non-performing) when the facility or
obligor – depending on the level at which the non-performing status is applied – is more than 90 days past
due and to risk rating 21 or 22 in case of an exit scenario.
ING has aligned the regulatory concept of non-performing with that of the definition of default. Hence, in
WB, obligors are classified as non-performing when a default trigger occurs:
•ING believes the borrower is unlikely to pay. The borrower has evidenced significant financial difficulty, to
the extent that it will have a negative impact on the future cash flows of the financial asset. The
following events could be seen as indicators of financial difficulty:
•The borrower (or third party) has started insolvency proceedings;
•A group company/co-borrower has NPL status;
•Indication of fraud (affecting the company’s ability to service its debt);
•There is doubt as to the borrower’s ability to generate stable and sufficient cash flows to service its
debt;
•Restructuring of debt.
•ING has granted concessions relating to the borrower’s financial difficulty, the effect of which is a
reduction in expected future cash flows of the financial asset below current carrying amount.
•The obligor has failed in the payment of principal, interest or fees, the total past due amount is above the
materiality threshold and this remains the case for more than 90 consecutive days.
Further, WB has an individual name approach, using early warning indicators to signal possible future issues
in debt service.
ING Group Annual Report 2023 on Form 20-F 174
Ageing analysis (past due but performing): Consumer lending portfolio by geographic area, outstandings (*) | |||||||||
in € million | 2023 | 2022 | |||||||
Region | Past due for 1–30 days | Past due for 31–60 days | Past due for 61–90 days | Total | Past due for 1–30 days | Past due for 31–60 days | Past due for 61–90 days | Total | |
Europe | Belgium | ||||||||
Germany | |||||||||
Poland | |||||||||
Netherlands | |||||||||
Luxembourg | |||||||||
Spain | |||||||||
Rest of Europe | |||||||||
America | |||||||||
Asia | |||||||||
Australia | |||||||||
Total | |||||||||
The past due but performing consumer lending outstanding increased by €66 million, mainly due to
increase in 31-60 (+€45 million) and 61-90 (+€22 million). The largest increase was observed in the
Netherlands (+€47 million) and Germany (+€31 million) mainly in the 1-30-day bucket; the largest decrease
was seen in Belgium (-€44 million) driven by the decrease in the 1-30 bucket.
Ageing analysis (past due but performing): Business lending portfolio by geographic area, outstandings (*) | ||||||||||
in € million | 2023 | 2022 | ||||||||
Region | Past due for 1–30 days | Past due for 31–60 days | Past due for 61–90 days | Total | Past due for 1–30 days | Past due for 31–60 days | Past due for 61–90 days | Past due for >90 days | Total | |
Europe | Belgium | |||||||||
United Kingdom | ||||||||||
Luxembourg | ||||||||||
Netherlands | ||||||||||
Poland | ||||||||||
France | ||||||||||
Germany | ||||||||||
Rest of Europe | ||||||||||
America | ||||||||||
Asia | ||||||||||
Australia | ||||||||||
Total | ||||||||||
Total past due but performing outstanding of business lending increased by €1.2 billion. Increase is observed
in the 1-30 days (€1.0 billion) past due bucket and in the 31-60 days (€0.5 billion), partly offset by a
decrease in the 61–90 days past due bucket (-€336 million), driven by the United Kingdom (-€383 million).
ING Group Annual Report 2023 on Form 20-F 175
Credit restructuring (*)
Global Credit Restructuring (GCR) is the dedicated and independent department that deals with non-
performing loans and loans that hold a reasonable probability that ING will end up with a loss, if no specific
action is taken. GCR handles accounts or portfolios requiring an active approach, which may include
renegotiation of terms and conditions and business or financial restructuring. The loans are managed by
GCR or by units in the various regions and business units. ING uses three distinct statuses to categorise the
management of clients with (perceived) deteriorating credit risk profiles, i.e. there is increasing doubt as to
the performance and the collectability of the client’s contractual obligations:
•Watch list: Usually, a client is first classified as watch list when there are concerns of any potential or
material deterioration in credit risk profile that may affect the ability of the client to adhere to its debt
service obligations or to refinance its existing loans. Watch list status requires more than usual attention,
increased monitoring and quarterly reviews. Some clients with a watch list status may develop into a
restructuring status or even a recovery status.
•Restructuring: A client is classified as restructuring when there are concerns about the client’s financial
stability, credit worthiness, and/or ability to repay, but where the situation does not require the
termination or acceleration of facilities or the liquidation of collateral. ING’s actions aim to maintain the
going concern status of the client by:
•restoring the client’s financial stability;
•supporting the client’s turnaround;
•restoring the balance between debt and equity; and
•restructuring the debt to a sustainable situation.
•Recovery: A client is classified as in recovery when ING and/or the client concludes that the client’s
financial situation cannot be restored and a decision is made to terminate the (credit) relationship or
even to enter into bankruptcy. ING prefers an amicable exit, but will enforce and liquidate the collateral
or claim under the guarantees if deemed necessary.
Watch list, restructuring and recovery accounts are reviewed at least quarterly by the front office, GCR and
the relevant credit risk management executives.
Forbearance (*)
Forbearance occurs when a client is unable to meet their financial commitments due to financial difficulties
they face or are about to face and ING grants concessions towards them. Forborne assets are assets in
respect of which forbearance measures have been granted.
Forbearance may enable clients experiencing financial difficulties to continue repaying their debt.
For business clients, ING mainly applies forbearance measures to support clients with fundamentally sound
business models that are experiencing temporary difficulties with the aim of maximising the client’s
repayment ability and therewith avoiding a default situation or helping the client to return to a performing
situation.
For ING retail units, clear criteria have been established to determine whether a client is eligible for the
forbearance process. Specific approval mandates are in place to approve the measures, as well as
procedures to manage, monitor and report the forbearance activities.
ING reviews the performance of forborne exposures at least quarterly, either on a case-by-case (business) or
on a portfolio (retail) basis.
All exposures are eligible for forbearance measures, i.e. both performing (risk ratings 1-19) and non-
performing (risk ratings 20-22) exposures. ING uses specific criteria to move forborne exposures from non-
performing to performing or to remove the forbearance statuses that are consistent with the corresponding
European Banking Authority (EBA) standards. An exposure is reported as forborne for a minimum of two
years. An additional one-year probation period is applied to forborne exposures that move from non-
performing back to performing.
Summary Forborne portfolio (*) | ||||||||
in € million | 2023 | 2022 | ||||||
Business line | Outstandin gs | Of which: performi ng | Of which: non- performing | % of total portfolio | Outstandin gs | Of which: performi ng | Of which: non- performing | % of total portfolio |
Wholesale Banking | ||||||||
Retail Banking | ||||||||
Total | ||||||||
ING Group Annual Report 2023 on Form 20-F 176
Summary Forborne portfolio by forbearance type (*) | ||||||||
in € million | 2023 | 2022 | ||||||
Forbearance type | Outstandin gs | Of which: performi ng | Of which: non- performing | % of total portfolio | Outstandin gs | Of which: performi ng | Of which: non- performing | % of total portfolio |
Loan modification | ||||||||
Refinancing | ||||||||
Total | ||||||||
As of 31 December 2023, ING’s total forborne assets decreased by €3.3 billion compared to 31 December
2022. WB decreased by €2.3 billion and Retail Banking decreased by €1.1 billion. The decreases are mainly
caused by passing the two-year probation period following the Covid-19 pandemic.
Wholesale Banking (*)
As of December 2023, WB forborne assets amounted to €6.1 billion (2022: €8.4 billion), which represented
Wholesale Banking: Forborne portfolio by geographical area (*) | |||||||
in € million | 2023 | 2022 | |||||
Region | Outstandings | Of which: performing | Of which: non- | Outstandings | Of which: performing | Of which: non- | |
performing | performing | ||||||
Europe | Netherlands | ||||||
Belgium | |||||||
Germany | |||||||
United Kingdom | |||||||
Italy | |||||||
Norway | |||||||
Poland | |||||||
Rest of Europe | |||||||
America | |||||||
Asia | |||||||
Australia | |||||||
Africa | |||||||
Total | |||||||
Wholesale Banking: Forborne portfolio by economic sector (*) | ||||||
in € million | 2023 | 2022 | ||||
Industry | Outstandings | Of which: performing | Of which: non- performing | Outstandings | Of which: performing | Of which: non- performing |
Natural Resources | ||||||
Real Estate | ||||||
Transportation & Logistics | ||||||
Food, Beverages & Personal Care | ||||||
Services | ||||||
Automotive | ||||||
Utilities | ||||||
General Industries | ||||||
Retail | ||||||
Chemicals, Health & Pharmaceuticals | ||||||
Builders & Contractors | ||||||
Other | ||||||
Total | ||||||
ING Group Annual Report 2023 on Form 20-F 177
The main concentration of forborne assets in a single country was in United States with 13.6 % (2022:
WB forborne assets decreased by €2.3 billion compared to 2022, also driven by passing the two-year
probation period following the Covid-19 pandemic. Decrease is mainly visible in the performing forborne
assets (-€2.0 billion), mainly in the industries Transportation & Logistics, Real Estate and Services. The
decrease was partial offset by an increase for Chemicals, Health and Pharmaceuticals, driven by a few large
individual clients.
WB's forborne assets are mainly concentrated in Real Estate, Food Beverages & Personal Care, Natural
Resources, Chemicals, Health & Pharmaceuticals, and Utilities.These five economic sectors accounted for
Retail Banking (*)
As of the end of December 2023, Retail Banking forborne assets totalled €7.0 billion, which represented 1.4 %
of the total Retail Banking portfolio. The majority of forborne exposures were in private individuals with
Retail Banking: Forborne portfolio by geographical area (*) | |||||||
in € million | 2023 | 2022 | |||||
Region | Outstandings | Of which: performing | Of which: non- | Outstandings | Of which: performing | Of which: non- | |
performing | performing | ||||||
Europe | Netherlands | ||||||
Belgium | |||||||
Germany | |||||||
Poland | |||||||
Türkiye | |||||||
Italy | |||||||
Romania | |||||||
Spain | |||||||
Rest of Europe | |||||||
America | |||||||
Asia | |||||||
Australia | |||||||
Africa | |||||||
Total | |||||||
The main concentration of forborne assets in a single country was in Belgium with 30.6 % (2022: 32.7 %) of
total Retail Banking forborne assets and 45.4 % (2022: 42.3 %) of the non-performing forborne assets. Next to
that, Netherlands had 21.1 % (2022: 35.0 %) of the total Retail forborne assets and Germany 18.6 %
(2022:10.0 %). The increase in Germany is driven by mortgages, where clients that choose for a repayment
percentage below a certain threshold, though contractually allowed, are conservatively considered forborn.
Non-performing loans (*)
ING’s loan portfolio is under constant review. Loans to obligors that are considered more than 90 days past
due and above applicable thresholds are reclassified as non-performing. For business lending portfolios,
there generally are reasons for declaring a loan non-performing prior to the obligor being 90 days past due.
These reasons include, but are not limited to, ING’s assessment of the customer’s perceived inability to meet
its financial obligations, or the customer filing for bankruptcy or bankruptcy protection.
The table below represents the breakdown by industry of credit risk outstandings that have been classified
as non-performing.
Non-performing Loans: outstandings by economic sector and business lines (*)1 | ||||||||
in € million | Wholesale Banking | Retail Benelux | Retail Challengers & Growth Markets | Total | ||||
Industry | 2023 | 2022 | 2023 | 2022 | 2023 | 2022 | 2023 | 2022 |
Private Individuals | ||||||||
Natural Resources | ||||||||
Food, Beverages & Personal Care | ||||||||
Transportation & Logistics | ||||||||
Services | ||||||||
Real Estate | ||||||||
General Industries | ||||||||
Builders & Contractors | ||||||||
Retail | ||||||||
Utilities | ||||||||
Chemicals, Health & Pharmaceuticals | ||||||||
Telecom | ||||||||
Other | ||||||||
Total | ||||||||
1 Based on lending and investment outstandings.
ING Group Annual Report 2023 on Form 20-F 178
Non-performing Loans: outstandings by economic sectors and geographical area (*) | ||||||||||||||
in € million | Region | Total | ||||||||||||
Industry | Netherlands | Belgium | Germany | Poland | Spain | United Kingdom | France | Luxembourg | Rest of Europe | America | Asia | Australia | Africa | 2023 |
Private Individuals | ||||||||||||||
Natural Resources | ||||||||||||||
Food, Beverages & Personal Care | ||||||||||||||
Transportation & Logistics | ||||||||||||||
Services | ||||||||||||||
Real Estate | ||||||||||||||
General Industries | ||||||||||||||
Builders & Contractors | ||||||||||||||
Retail | ||||||||||||||
Utilities | ||||||||||||||
Chemicals, Health & Pharmaceuticals | ||||||||||||||
Telecom | ||||||||||||||
Other | ||||||||||||||
Total | ||||||||||||||
Non-performing Loans: outstandings by economic sectors and geographical area (*) | ||||||||||||||
in € million | Region | Total | ||||||||||||
Industry | Netherlands | Belgium | Germany | Poland | Spain | United Kingdom | France | Luxembourg | Rest of Europe | America | Asia | Australia | Africa | 2022 |
Private Individuals | ||||||||||||||
Natural Resources | ||||||||||||||
Food, Beverages & Personal Care | ||||||||||||||
Transportation & Logistics | ||||||||||||||
Services | ||||||||||||||
Real Estate | ||||||||||||||
General Industries | ||||||||||||||
Builders & Contractors | ||||||||||||||
Retail | ||||||||||||||
Utilities | ||||||||||||||
Chemicals, Health & Pharmaceuticals | ||||||||||||||
Telecom | ||||||||||||||
Other | ||||||||||||||
Total | ||||||||||||||
ING Group Annual Report 2023 on Form 20-F 179
In 2023, the NPL portfolio stayed relatively flat at €11.7 billion. An increase in Challengers and Growth retail
(+€0.4 billion) was offset by decreases in Wholesale Banking (-€0.3 billion) and Retail Benelux (-€0.2 billion).
The increase in Challengers & Growth Markets was mainly witnessed in private individuals. In Wholesale
Banking, the decrease in the Natural Resources sector was partially compensated by an increase in Real
Estate sector, especially in the Americas. The top three countries by NPL outstanding are Belgium, the
Netherlands and the Americas.
Loan loss provisioning (*)
ING recognises loss allowances based on the expected credit loss (ECL) model of IFRS 9, which is designed to
be forward-looking. The IFRS 9 impairment requirements are applicable to on-balance sheet financial assets
measured at amortised cost or fair value through other comprehensive income (FVOCI), such as loans, debt
securities and lease receivables, as well as off-balance-sheet items such as undrawn loan commitments,
financial- and non-financial guarantees issued.
ING distinguishes between two types of calculation methods for credit loss allowances:
•Collective 12-month ECL (Stage 1) and collective lifetime ECL (Stage 2) for portfolios of financial
instruments, as well as collective lifetime ECL for credit-impaired exposures (Stage 3) below €1 million;
•Individual lifetime ECL for credit-impaired (Stage 3) financial instruments with exposures above €1
million.
IFRS 9 models (*)
ING's IFRS 9 models leverage on the internal rating-based (IRB) models (PD, LGD, EAD), which include certain
required conservatism. To include IFRS 9 requirements, such regulatory conservatism is removed from the
ECL parameters (PD, LGD and EAD). The IFRS 9 models apply two other types of adjustments to the IRB ECL
parameters: (i) to the economic outlook and (ii) for Stage 2 and Stage 3 assets only, to the lifetime horizon.
The IFRS 9 model parameters are estimated based on statistical techniques and supported by expert
judgement.
ING has aligned the definition of default for regulatory purposes with the definition of ‘credit-impaired’
financial assets under IFRS 9 (Stage 3). ING has also aligned its definition of default between IFRS9 and the
regulatory technical standards (RTS) and EBA guidelines. More information can be found in section 1.5.6 of
the consolidated financial statements.
Climate and environmental risks in IFRS 9 models (*)
Climate risk drivers (physical and transition risks) can reduce the ability of businesses and households to
fulfil their obligations due on existing lending contracts. These may also lead to depreciation/ erosion of
collateral values which would translate into higher credit losses and loan-to-value ratios in the lending
portfolio of ING.
At this point in time it is not yet possible to incorporate climate risk separately into IFRS 9 ECL models given
the lack of sufficient empirical historical data and data limitations in the risk assessments on client level.
Where climate and environmental factors have impacted the economy in the recent past or present, these
impacts will currently be implicitly embedded in ING's IFRS9 ECL models through the projected
macroeconomic indicators (e.g. indirectly via GDP growth and unemployment rates). We note however that
our ECL models are primarily sensitive to the short-term economic outlook as we use a three-year time
horizon for macroeconomic outlook, after which a mean reversion approach is applied.
With regard to our evaluation of climate-related matters, where such events have already occurred (e.g.
floods, stranded assets etc.), the impact of such events is individually assessed in the calculation of Stage 3
Individual provisions or management adjustments to ECL models. For example, we consider whether
affected assets have suffered from a significant increase in credit risk (or are credit impaired) and whether
the ECL is appropriate.
Over the near-term time horizon, ING plans to continue to refine its methodologies to evaluate climate risks.
ING is working on putting into practice quantitative methodologies for climate and environmental (C&E) risk
identification, materiality assessment and risk appetite setting. Refer to ESG risk paragraph for further
details on ESG risk management. Going forward, ING aims to continue to close the gaps on climate risk data,
which will enable us to embed climate risks eventually into the IFRS 9 ECL models.
ING Group Annual Report 2023 on Form 20-F 180
Reconciliation gross carrying amount (IFRS 9 eligible) and statement of financial position | ||||||||||||||
in € million | 2023 | 2022 | ||||||||||||
Gross Carrying Amount | Loan Loss Provisions | Cash and on-demand bank positions | Reverse Repurchase transactions | Cash collateral | Other | Statement of financial position | Gross Carrying Amount | Loan Loss Provisions | Cash and on-demand bank positions | Reverse Repurchase transactions | Cash collateral | Other | Statement of financial position | |
Amounts held at Central Banks | 90,602 | -5 | -794 | 410 | 90,214 | 88,349 | -12 | -1,170 | 448 | 87,614 | ||||
Loans and Advances to Banks | 5,835 | -30 | 2,381 | 5,251 | 3,063 | 209 | 16,709 | 8,796 | -37 | 2,851 | 19,395 | 3,679 | 420 | 35,104 |
Financial Instruments FVOCI Loans | 983 | -8 | -24 | 951 | 640 | -1 | 4 | 643 | ||||||
Financial Instruments FVOCI Debt securities | 38,323 | -13 | -30 | 38,281 | 28,752 | -21 | 364 | 29,095 | ||||||
Securities at Amortised Cost | 48,770 | -22 | -435 | 48,313 | 48,372 | -17 | -195 | 48,160 | ||||||
Loans and Advances to customers | 647,875 | -5,621 | 499 | 3,914 | 646 | 647,313 | 642,678 | -5,984 | 1,306 | 4,176 | 2,717 | 644,893 | ||
Total on-balance (IFRS 9 eligible) | 832,388 | -5,697 | 1,587 | 5,750 | 6,978 | 775 | 841,780 | 817,587 | -6,072 | 1,681 | 20,701 | 7,855 | 3,758 | 845,509 |
Guarantees and irrevocable facilities (IFRS 9 eligible) | 192,655 | -142 | 150,068 | -29 | ||||||||||
Total Gross Carrying Amount (IFRS 9 eligible) | 1,025,043 | -5,839 | 967,655 | -6,101 | ||||||||||
This table presents the reconciliation between the statement of financial position and the gross carrying
amounts used for calculating the expected credit losses. No expected credit loss is calculated for cash, on-
demand bank positions, reverse repurchase transactions, cash collateral received in respect of derivatives
and other. Therefore these amounts are not included in the total gross carrying amount (IFRS 9 eligible).
Other includes value adjustments on hedged items, deferred acquisition costs on residential mortgages and
a receivable which is offset against a liquidity facility.
ING Group changed its accounting policy for non-financial guarantees that are subject to contractual
indemnification rights (such as performance and other non-financial guarantees as well as letters of credit)
from IAS 37 principles to loan commitment accounting under IFRS 9. The re-scoping was triggered by the
introduction of IFRS 17 insurance contracts and results in reliable and more relevant information. The off-
balance-sheet IFRS 9 eligible guarantees and irrevocable facilities of 31 December 2022 have not been
restated to conform to current year presentation.
The table below describes the portfolio composition over the different IFRS 9 stages and rating classes. The
Stage 1 portfolio represents 91.5 % (2022: 91.5 %) of the total gross carrying amounts, mainly composed of
investment grade, while Stage 2 makes up 7.4 % (2022: 7.3 %) and Stage 3 makes up 1.2 % (2022: 1.2 %) of
the total gross carrying amounts, respectively.
ING Group Annual Report 2023 on Form 20-F 181
Gross carrying amount per IFRS 9 stage and rating class (*)1,2,3 | |||||||||
in € million | 12-month ECL (Stage 1) | Lifetime ECL not credit impaired (Stage 2) | Lifetime ECL credit impaired (Stage 3) | Total | |||||
2023 | |||||||||
Rating class | Gross Carrying Amount | Provisions | Gross Carrying Amount | Provisions | Gross Carrying Amount | Provisions | Gross Carrying Amount | Provisions | |
Investment grade | 1 (AAA) | ||||||||
2-4 (AA) | |||||||||
5-7 (A) | |||||||||
8-10 (BBB) | |||||||||
Non-Investment grade | 11-13 (BB) | ||||||||
14-16 (B) | |||||||||
17 (CCC) | |||||||||
Performing Restructuring | 18 (CC) | ||||||||
19 (C) | |||||||||
Non-performing loans | 20-22 (D) | ||||||||
Total | |||||||||
1 Compared to the credit risk portfolio, the differences are mainly undrawn committed amounts (€ outstandings but not in the gross carrying amounts. 2 Includes impact from change in accounting policy as disclosed in table Changes in gross carrying amounts and loan loss provisions. 3 Stage 3 lifetime credit impaired provision includes € | |||||||||
Gross carrying amount per IFRS 9 stage and rating class (*)1,2 | |||||||||
in € million | 12-month ECL (Stage 1) | Lifetime ECL not credit impaired (Stage 2) | Lifetime ECL credit impaired (Stage 3) | Total | |||||
2022 | |||||||||
Rating class | Gross Carrying Amount | Provisions | Gross Carrying Amount | Provisions | Gross Carrying Amount | Provisions | Gross Carrying Amount | Provisions | |
Investment grade | 1 (AAA) | ||||||||
2-4 (AA) | |||||||||
5-7 (A) | |||||||||
8-10 (BBB) | |||||||||
Non-Investment grade | 11-13 (BB) | ||||||||
14-16 (B) | |||||||||
17 (CCC) | |||||||||
Performing Restructuring | 18 (CC) | ||||||||
19 (C) | |||||||||
Non-performing loans | 20-22 (D) | ||||||||
Total | |||||||||
1 Compared to the credit risk portfolio, the differences are mainly undrawn committed amounts (€ settlement exposures) included in credit outstandings but not in the gross carrying amounts. 2 IAS 37 provisions are established for non-credit replacement guarantees not in the scope of IFRS 9. Total IAS 37 provisions (€ | |||||||||
ING Group Annual Report 2023 on Form 20-F 182
Changes in gross carrying amounts and loan loss provisions (*)
The table below provides a reconciliation by stage of the gross carrying amount and allowances for loans
and advances to banks and customers, including loan commitments and financial guarantees. The transfers
of financial instruments represent the impact of stage transfers upon the gross carrying/nominal amount
and associated allowance for ECL. This includes the net-remeasurement of ECL arising from stage transfers,
for example, moving from a 12-month (Stage 1) to a lifetime (Stage 2) ECL measurement basis.
The net-remeasurement line represents the changes in provisions for facilities that remain in the same
stage.
Please note the following comments with respect to the movements observed in the table below:
•The opening balance is impacted by a change in accounting policy following the adoption of IFRS 17,
more specifically for loans with death waivers that no longer meet the ‘solely payments of principal and
interest’ (SPPI) criterion (€-55 million loan loss provisions impact) which are no longer recorded at
amortised cost, and a change in policy for non-financial guarantees that are subject to contractual
indemnification rights which led to a reclassification of the existing IAS 37 provision (€109 million loan
loss provisions impact) and a remeasurement of these non-financial guarantees (€42 million loan loss
provisions impact). Reference is made to Note 1 'Basis of preparation and significant changes in the
current reporting period'.
•Stage 3 gross carrying amount increased slightly to €12.0 billion as at 31 December 2023 as new inflow
into NPL (credit impaired) in 2023 was only partly offset by repayments, derecognitions and write-offs.
Stage 3 provisions remained more or less flat at €3.9 billion.
•Stage 2 gross carrying amount increased by €0.1 billion from €75.4 billion (after changes in accounting
policies) as at 31 December 2022 to €75.5 billion as at 31 December 2023. An increase of Stage 2
exposure, driven by the implementation of an updated methodology for interest-only mortgages in the
Netherlands, was offset by outflow due to improved macro economic outlook, decrease of exposure due
to sales and repayments (including Russian exposure), forborne customers returning to Stage 1 after the
probation period has ended and other improved risk drivers. As a result, Stage 2 provisions also
decreased by €0.3 billion to €1.4 billion as of 31 December 2023.
ING Group Annual Report 2023 on Form 20-F 183
Changes in gross carrying amounts and loan loss provisions (*)1, 2 | ||||||||
in € million | 12-month ECL (Stage 1) | Lifetime ECL not credit impaired (Stage 2) | Lifetime ECL credit impaired (Stage 3) | Total | ||||
2023 | Gross carrying amount | Provisions | Gross carrying amount | Provisions | Gross carrying amount | Provisions | Gross carrying amount | Provisions |
Opening balance | ||||||||
Impact of changes in accounting policies | ||||||||
Adjusted Opening balance | ||||||||
Transfer into 12-month ECL (Stage 1) | - | - | - | - | - | |||
Transfer into lifetime ECL not credit impaired (Stage 2) | - | - | - | - | ||||
Transfer into lifetime ECL credit impaired (Stage 3) | - | - | - | - | ||||
Net remeasurement of loan loss provisions | - | - | - | |||||
New financial assets originated or purchased | ||||||||
Financial assets that have been derecognised | - | - | - | - | - | - | - | - |
Net drawdowns and repayments | - | - | - | - | ||||
Changes in models/risk parameters | ||||||||
Increase in loan loss provisions | - | - | ||||||
Write-offs | - | - | - | - | - | - | - | - |
Recoveries of amounts previously written off | ||||||||
Foreign exchange and other movements | - | - | ||||||
Closing balance | ||||||||
1 Stage 3 lifetime credit impaired provision includes € 2 The addition to the loan provision (in the consolidated statement of profit or loss) amounts to € on restructured financial assets. | ||||||||
ING Group Annual Report 2023 on Form 20-F 184
Changes in gross carrying amounts and loan loss provisions (*)1, 2 | ||||||||
in € million | 12-month ECL (Stage 1) | Lifetime ECL not credit impaired (Stage 2) | Lifetime ECL credit impaired (Stage 3)1 | Total | ||||
2022 | Gross carrying amount | Provisions | Gross carrying amount | Provisions | Gross carrying amount | Provisions | Gross carrying amount | Provisions |
Opening balance | ||||||||
Transfer into 12-month ECL (Stage 1) | - | - | - | - | - | |||
Transfer into lifetime ECL not credit impaired (Stage 2) | - | - | - | - | ||||
Transfer into lifetime ECL credit impaired (Stage 3) | - | - | - | - | ||||
Net remeasurement of loan loss provisions | ||||||||
New financial assets originated or purchased | ||||||||
Financial assets that have been derecognised | - | - | - | - | - | - | - | - |
Net drawdowns and repayments | - | - | - | |||||
Changes in models/risk parameters | - | |||||||
Increase in loan loss provisions | ||||||||
Write-offs | - | - | - | - | - | |||
Recoveries of amounts previously written off | ||||||||
Foreign exchange and other movements | - | - | - | |||||
Closing balance | ||||||||
1 Stage 3 Lifetime credit impaired provision includes € | ||||||||
2 The addition to the loan provision (in the consolidated statement of profit or loss) amounts to € losses on restructured financial assets. | ||||||||
ING Group Annual Report 2023 on Form 20-F 185
Exposure per stage, coverage ratio and stage ratio’s2 | ||||||
in € million | 2023 | 2022 | ||||
Balance sheet | Gross Carrying Amount | Loan loss provisions | Stage Ratio | Gross Carrying Amount | Loan loss provisions | Stage Ratio |
Loans and advances to banks (including central banks) | 96,436 | 34 | 97,146 | 49 | ||
Stage 1 | 95,935 | 4 | 99% | 95,788 | 9 | 99% |
Stage 2 | 494 | 17 | 1% | 1,339 | 20 | 1% |
Stage 3 | 6 | 13 | 0% | 20 | 20 | 0% |
Loans and advances to customers | 647,876 | 5,621 | 643,317 | 5,984 | ||
of which: Residential mortgages | 331,467 | 821 | 326,928 | 677 | ||
Stage 1 | 306,192 | 97 | 92% | 312,165 | 75 | 95% |
Stage 2 | 22,167 | 252 | 7% | 11,877 | 176 | 4% |
Stage 3 | 3,108 | 472 | 1% | 2,886 | 426 | 1% |
Of which: Consumer Lending (excl. Residential mortgages) | 25,954 | 1,004 | 26,348 | 990 | ||
Stage 1 | 22,081 | 177 | 85% | 23,101 | 184 | 88% |
Stage 2 | 2,743 | 198 | 11% | 2,145 | 223 | 8% |
Stage 3 | 1,131 | 629 | 4% | 1,102 | 583 | 4% |
Of which: Loans to public authorities | 19,068 | 11 | 17,272 | 17 | ||
Stage 1 | 18,083 | 4 | 95% | 15,977 | 4 | 93% |
Stage 2 | 691 | 2 | 4% | 1,120 | 7 | 6% |
Stage 3 | 294 | 5 | 2% | 175 | 6 | 1% |
Of which: Corporate lending | 271,387 | 3,785 | 272,769 | 4,300 | ||
Stage 1 | 232,401 | 185 | 86% | 227,167 | 279 | 83% |
Stage 2 | 32,178 | 921 | 12% | 38,497 | 1,225 | 14% |
Stage 3 | 6,808 | 2,679 | 3% | 7,105 | 2,795 | 3% |
Other IFRS 9 Eligible financial instruments1 | 280,731 | 184 | 227,192 | 67 | ||
Stage 1 | 262,941 | 50 | 94% | 211,025 | 29 | 93% |
Stage 2 | 17,181 | 46 | 6% | 15,746 | 27 | 7% |
Stage 3 | 609 | 88 | % | 421 | 11 | 0.2% |
Total Gross Carrying Amount (IFRS 9 eligible) | 1,025,043 | 5,839 | 967,655 | 6,101 | ||
1Includes Off balance sheet IFRS 9 eligible guarantees and irrevocable facilities. The comparatives (2022) were not adjusted for changes in accounting policies. Reference is made to Note 1 'Basis of preparation and significant changes in the current reporting period'. 2The exposure classification to residential mortgages, consumer lending and corporate lending is aligned to the regulatory definition | ||||||
ING Group Annual Report 2023 on Form 20-F 186
The table below provides the following information:
•Financial assets that were modified during the year (i.e. qualified as forborne) while they had a loss
allowance measured at an amount equal to lifetime ECL.
•Financial assets that were reclassified to stage 1 during the period.
Financial assets modified (*) | ||
in € million | 2023 | 2022 |
Financial assets modified during the period | ||
Amortised cost before modification | ||
Net modification results | - | - |
Financial assets modified since initial recognition | ||
Gross carrying amount at 31 December of financial assets for which loss allowance has changed to 12-month measurement during the period | ||
Macroeconomic scenarios and sensitivity analysis of key sources of estimation
uncertainty (*)
Methodology (*)
Our methodology in relation to the adoption and generation of macroeconomic scenarios is described in
this section. We continue to follow this methodology in generating our probability-weighted ECL, with
consideration of alternative scenarios and management adjustments supplementing this ECL where, in
management's opinion, the consensus forecast does not fully capture the extent of recent credit or
economic events. The macroeconomic scenarios are applicable to the whole ING portfolio in the scope of
IFRS 9 ECLs.
The IFRS 9 standard, with its inherent complexities and potential impact on the carrying amounts of our
assets and liabilities, represents a key source of estimation uncertainty. In particular, ING’s reportable ECL
numbers are sensitive to the forward-looking macroeconomic forecasts used as model inputs, the
probability-weights applied to each of the three scenarios, and the criteria for identifying a significant
increase in credit risk. As such, these crucial components require consultation and management judgement,
and are subject to extensive governance.
Baseline scenario (*)
As a baseline for IFRS 9, ING has adopted a market-neutral view combining consensus forecasts for
economic variables (GDP, unemployment) with market forwards (for interest rates, exchange rates and oil
prices). Input from a leading third-party service provider is used to complement the consensus with
consistent projections for variables for which there are no consensus estimates available (most notably
house prices and – for some countries - unemployment), to generate alternative scenarios, to convert
annual consensus information to a quarterly frequency and to ensure general consistency of the scenarios.
As the baseline scenario is consistent with the consensus view it can be considered as free from any bias.
The relevance and selection of macroeconomic variables is defined by the ECL models under credit risk
model governance. The scenarios are reviewed and challenged by two panels of ING experts. The first panel
consists of (economic) experts from Global Markets Research, risk and modelling, while the second panel
consists of relevant senior managers in ING.
Alternative scenarios and probability weights (*)
Two alternative scenarios are taken into account: an upside and a downside scenario. The alternative
scenarios have statistical characteristics as they are based on the forecast deviations of the leading third-
party service provider.
To understand the baseline level of uncertainty around any forecast, the leading third-party service provider
keeps track of all its deviations (so called forecast errors) of the past 20 years. The distribution of forecast
errors for GDP, unemployment, house prices and share prices is applied to the baseline forecast creating a
broad range of alternative outcomes. In addition, to understand the balance of risks facing the economy in
an unbiased way, the leading third-party service provider runs a survey with respondents from around the
world and across a broad range of industries. In this survey respondents put forward their views of key risks.
Following the survey results, the distribution of forecast errors (that is being used for determining the
scenarios) may be skewed.
For the downside scenario, ING has chosen for the 90th percentile of that distribution because this
corresponds with the way risk management earnings-at-risk is defined within the Group. The upside
scenario is represented by the 10th percentile of the distribution. The applicable percentiles of the
distribution imply a 20 percent probability for each alternative scenario. Consequently, the baseline scenario
has a 60 percent probability weighting. Please note that, given their technical nature, the downside and
upside scenarios are not based on an explicit specific narrative.
ING Group Annual Report 2023 on Form 20-F 187
Macroeconomic scenarios applied (*)
The macroeconomic scenarios applied in the calculation of loan loss provisions are based on the consensus
forecasts.
Baseline assumptions (*)
The general picture that the consensus conveys is that global economic growth is going through a weak
spell. Inflation has been coming down as energy prices have moderated, demand has weakened and
pandemic-related supply problems have eased. Higher interest rates play their part in slowing demand.
Although central banks could well be done with hiking interest rates – as inflation continues to fall – the
lagged impact of past monetary tightening is still feeding through to the real economy. This is expected to
cause GDP growth to come in even weaker in 2024, but pickup thereafter as the negative effects from tight
monetary policy and high inflation fade. The high-interest rate environment is currently causing corrections
in house prices, especially in markets where prices surged during the pandemic. Housing market corrections
are assumed to gradually decrease in strength.
The December 2023 consensus expects global output (as measured by the weighted average GDP growth
rate of ING's 25 main markets) to slow from 2.6 % in 2022, to 2.4 % in 2023 and 1.8 % in 2024. For 2025-2026,
economic growth is expected to pick up again to 2.3 % and 2.4 %.
The US economy outperformed expectations in 2023, driven by strong consumer spending and fiscal
support. Still, headwinds have been building up, in part driven by the much higher interest rates currently
experienced. While an outright recession is not expected, the consensus does foresee a marked slowdown in
economic activity in the US in 2024. After this, the US economy is expected to gather strength again in
2025. The consensus expects the growth rate of the US economy to fall from 2.2 % in 2023 to 0.9 % in 2024
and to recover to 2 % on average in 2025-2026.
The eurozone economy is facing broad stagnation as it deals with the impact of the war in Ukraine, energy
crisis, and higher interest rates. While inflation is coming down, the impact of last year’s purchasing power
shock is still being felt. Monetary tightening works with a lag, which will still affect economic activity next
year. Overall, the eurozone economy is forecasted to have grown by just 0.5 % in 2023, but Germany has
gone through recession reflecting its large (energy-intensive) manufacturing sector, and exposure to a
disappointing Chinese economy. For next year, the recovery is expected to be very modest as consensus
expects the eurozone to grow by only 0.8 % in 2024, before recovering to 1.4 % on average in 2025-2026.
Elsewhere in Europe, the outlook is mixed. In Poland, after an expected 0.4 % growth in 2023, the economy is
expected to recover by 2.5 % in 2024 led by household consumption growth. Wage growth is set to remain
strong while inflation has subsided substantially. The consensus expectation for Türkiye is to see growth
slow substantially in 2024 with unemployment remaining around 10 % for the foreseeable future. The
consensus sees economic growth in Türkiye slowing from 3.5 % in 2023, to 2.1 % in 2024 and increasing
again to 3.3 % on on average in 2025-2026. The Russian economy has started to recover from the 2022
recession, but growth is set to moderate after 1.7 % in 2023 to 1.2 % on average in 2024-2026.
2023 was supposed to be the year of a strong reopening for China, but growth did not meet expectations.
Weak global demand for goods has resulted in a weaker than expected industrial performance and the real
estate sector continues to be a source of concern. For the 2024-2026 period, economic growth is expected
to come in at only 4.2 % despite increased stimulus.
The global economic slowdown and tighter monetary policy continue to weigh on economic growth in
Australia. After growing by 1.7 % in 2023, the outlook sees a growth rate of 1.3 % for 2024 and some pick-up
to 2.4 % and 2.5 % for 2025-2026.Unemployment is expected to run up a little more, from 4.1 % in 2023 to
When compared to the December 2022 consensus forecast, used for the 2022 Annual Report, the December
2023 forecast assumes somewhat better economic circumstances in 2023 but weaker for 2024. The
forecast assumes to have Global GDP increased by 2.4 % in 2023 (compared to 1.3 % assumed before) and is
expected to grow by 1.8 % in 2024 (2.4 % assumed before). The upgrade for 2023 reflects the better than
expected economic performance of the US and eurozone as a recession on the back of the energy crisis was
avoided, while the downgrade for 2024 reflects the impact of substantial monetary tightening.
Alternative scenarios and risks (*)
Because of the possible consequences of geopolitical risks, uncertainty surrounding the forecasts was higher
in 2022. During 2023, the uncertainty level around the forecasts gradually decreased. To take this into
account, ING applies normal levels of dispersion in the alternative scenarios used for year-end 2023
provisioning. For year-end 2022 half-widened dispersion levels were used, by which the near-term
dispersion of the forward-looking distributions (from which the alternative scenarios are derived) was larger
than in normal times.
The baseline scenario assumes a further easing of inflation in 2024 and relatively resilient labour markets.
However, a longer period of weakness, due to even more concerning geopolitical tensions, persistent
elevated inflation and a slowdown in China could lead to a more protracted and deeper economic
slowdown. As such, the balance of risks to the baseline outlook is negative and the alternative scenarios
have a downward skew in line with the outcomes of the Global Risk Survey from a leading third-party
service provider. The downward skew remained stable compared to what has been applied for year-end
2022, continuing to reflect risks related to possible escalation of geopolitical tensions, a prolonged surge in
inflation and tightening monetary policy.
The downside scenario, though technical in nature, sees for most countries a recession in 2024.
Unemployment increases strongly in this scenario and house prices in most countries show outright falls.
ING Group Annual Report 2023 on Form 20-F 188
The downside scenario captures a possible escalation of geopolitical tensions, a prolonged surge in inflation
and further slowing in China.
The upside scenario – while equally technical in nature – reflects the possibility of a better economic outturn
if consumers spend more of their excess savings, geopolitical risks subside and China stimulus works out
more strongly than expected.
Management adjustments applied this year (*)
In times of volatility and uncertainty where portfolio quality and the economic environment are changing
rapidly, models alone may not be able to accurately predict losses. In these cases, management
adjustments can be applied to appropriately reflect ECL. Management adjustments can also be applied
where the impact of the updated macroeconomic scenarios is over- or under-estimated by the IFRS 9
models.
ING has internal governance frameworks and controls in place to assess the appropriateness of all
management adjustments, involving first- and second lines of defence.
Management adjustments to ECL models (*) | ||
in € million | 2023 | 2022 |
Economic sector based adjustments | ||
Inflation and interest rate increases / second-order impact adjustments | ||
Mortgage portfolio adjustments | ||
Other post model adjustments | - | |
Total management adjustments | ||
The economic sector-based adjustments of €36 million as of 31 December 2023 (€71 million as at 31
December 2022) fully relates to Business Banking clients that have benefited from Covid-19 related
government support programmes in the Netherlands. In line with 2022, it became clearer during 2023 that
the Covid-19 pandemic had less impact than expected on the number of defaults in related sectors with
relatively high tax debt to be repaid; the economic sector-based management adjustment has therefore
been partially released. The remaining management adjustment is related to sectors with relatively high tax
debt to be repaid and is expected to materialise with delayed effect. The €10 million adjustment on the
livestock farming sector in the Netherlands that was also included in December 2022, related to nitrogen
reduction targets has been fully released following improved risk metrics.
ING has performed further assessment for both WB and Retail Banking on the impact of second-order
effects. The second-order adjustments as at December 2022 captured a wider range of indirect effects such
as supply chain issues, staffing shortages and high energy prices. In 2023, the risks from high inflation and
rapidly increasing interest rates became more apparent compared to other indirect effects, causing a shift
in focus of this adjustment. This resulted in an overall adjustment for inflation and interest rate increases of
€351 million in total as at 31 December 2023, of which €138 million (31 December 2022: €164 million)
relates to Retail Banking segments and €213 million (31 December 2022: €170 million) to the Wholesale
Banking segment.
As the credit risk models in Retail Banking generally assume that inflation and interest rate increases risks
materialise via other risk drivers such as GDP and unemployment rates with a delay, an overlay approach
was determined. The methodology considers debt-to-income ratios and the percentage of loans that are
expected to reprice within one year to timely estimate the expected credit losses related to reduced
repayment capacity and affordability for private individuals and business clients in the Retail Banking
segment.
In Wholesale Banking, the IFRS 9 credit risk models mostly leverage on GDP growth as a generic
macroeconomic variable. High inflation and rapidly increasing interest rates however trigger economic
heterogeneity (i.e. some businesses benefit, while others suffer), as such the current circumstances are
expected to cause more defaults than normally predicted using GDP growth. A sector-based heatmap
approach was used to adjust the probability of default for clients in sectors that are expected to be
significantly impacted by high inflation and increased interest rates, including refinancing risk. The
adjustment is predominantly visible in the commercial real estate sector and reflected in Stage 1 and Stage
2.
The overall mortgage portfolio adjustment as at 31 December 2023 increased to €126 million (31 December
2022: €105 million), as an adjustment of €115 million has been recognised in 2023 following new insights
from a risk segmentation model that captures affordability, repayment and refinancing risk on performing
mortgage customers with a bullet loan in the Netherlands.
The mortgage portfolio adjustment that relates to significant increase of house prices was reduced to €11
million as at 31 December 2023, coming from €105 million as at December 2022. This decrease is reflecting
the decline in house prices in various countries, subsequent materialisation into increased model-based ECL
as well as an improved market outlook on the recovery value of residential real estate. ING still recognises a
management adjustment related to house prices in Stage 2 and Stage 3 on the mortgage portfolios in
Germany to maintain an appropriate level of ECL. The management adjustments are determined by
calculating the impact of lower house prices on loan-to-value (LTV) and loss given default (LGD).
Other post-model adjustments (PMAs) mainly relate to the impact of model redevelopment or recalibration
and periodic model assessment procedures that have not been incorporated in the ECL models yet; the
impact on total ECL can be positive or negative. These can result from both regular model maintenance and
ING’s multi-year programme to update ECL models for the definition of default. These adjustments will be
removed once updates to the specific models have been implemented. The change in balance compared to
ING Group Annual Report 2023 on Form 20-F 189
the previous reporting date is due to i) released PMAs because of model updates that have been
implemented, and ii) new PMAs recognised for new redevelopments and recalibrations.
Analysis on sensitivity (*)
The table below presents the analysis on the sensitivity of key forward-looking macroeconomic inputs used
in the ECL collective-assessment modelling process and the probability weights applied to each of the three
scenarios. The countries included in the analysis are the most significant geographic regions in ING and for
Wholesale Banking the US is the most significant in terms of both gross contribution to reportable ECL, and
sensitivity of ECL to forward-looking macroeconomics. Accordingly, ING considers these portfolios to present
the most significant risk of resulting in a material adjustment to the carrying amount of financial assets
within the next financial year. ING also observes that, in general, the WB business is more sensitive to the
impact of forward-looking macroeconomic scenarios.
The purpose of the sensitivity analysis is to enable the reader to understand the extent of the impact from
the upside and downside scenario on model-based reportable ECL.
In the table below, the real GDP is presented in percentage year-on-year change, the unemployment in
percentage of total labour force and the house price index (HPI) in percentage year-on-year change.
ING Group Annual Report 2023 on Form 20-F 190
Sensitivity analysis as at December 2023 (*) | |||||||
2024 | 2025 | 2026 | Un-weighted ECL (€ mln) | Probability -weighting | Reportable ECL (€ mln)1 | ||
Netherlands Upside scenario | Real GDP | ||||||
Unemployment | |||||||
HPI | |||||||
Baseline Scenario | Real GDP | ||||||
Unemployment | |||||||
HPI | |||||||
Downside scenario | Real GDP | - | - | ||||
Unemployment | |||||||
HPI | - | - | |||||
Germany Upside scenario | Real GDP | ||||||
Unemployment | |||||||
HPI | |||||||
Baseline Scenario | Real GDP | ||||||
Unemployment | |||||||
HPI | - | ||||||
Downside scenario | Real GDP | - | - | ||||
Unemployment | |||||||
HPI | - | - | |||||
Belgium Upside scenario | Real GDP | ||||||
Unemployment | |||||||
HPI | |||||||
Baseline Scenario | Real GDP | ||||||
Unemployment | |||||||
HPI | |||||||
Downside scenario | Real GDP | - | - | ||||
Unemployment | |||||||
HPI | - | ||||||
United States Upside scenario | Real GDP | ||||||
Unemployment | |||||||
HPI | |||||||
Baseline Scenario | Real GDP | ||||||
Unemployment | |||||||
HPI | - | ||||||
Downside scenario | Real GDP | - | - | - | |||
Unemployment | |||||||
HPI | - | - | - | ||||
1Excluding management adjustments. | |||||||
Sensitivity analysis as at December 2022 (*) | |||||||
2023 | 2024 | 2025 | Un-weighted ECL (€ mln) | Probability -weighting | Reportable ECL (€ mln)1 | ||
Netherlands Upside scenario | Real GDP | ||||||
Unemployment | |||||||
HPI | |||||||
Baseline Scenario | Real GDP | ||||||
Unemployment | |||||||
HPI | |||||||
Downside scenario | Real GDP | - | |||||
Unemployment | |||||||
HPI | - | - | |||||
Germany Upside scenario | Real GDP | ||||||
Unemployment | |||||||
HPI | |||||||
Baseline Scenario | Real GDP | - | |||||
Unemployment | |||||||
HPI | - | ||||||
Downside scenario | Real GDP | - | |||||
Unemployment | |||||||
HPI | - | - | - | ||||
Belgium Upside scenario | Real GDP | ||||||
Unemployment | |||||||
HPI | |||||||
Baseline Scenario | Real GDP | ||||||
Unemployment | |||||||
HPI | |||||||
Downside scenario | Real GDP | - | |||||
Unemployment | |||||||
HPI | - | ||||||
United States Upside scenario | Real GDP | ||||||
Unemployment | |||||||
HPI | |||||||
Baseline Scenario | Real GDP | ||||||
Unemployment | |||||||
HPI | |||||||
Downside scenario | Real GDP | - | |||||
Unemployment | |||||||
HPI | - | - | - | ||||
1 Excluding management adjustments. | |||||||
ING Group Annual Report 2023 on Form 20-F 191
When compared to the sensitivity analysis of 2022, the macroeconomic inputs for 2023 are somewhat
more favourable and for 2024 less favourable as the lagged impact of monetary tightening is still feeding
through to the real economy. The sensitivities for 2022 contain half-widened dispersion around the upside
and downside scenarios, whereas half-widened dispersion was removed for these scenarios for the 2023
sensitivity analysis following a continued decrease in forecast uncertainty.
On a total ING level, the unweighted model ECL for all collective provisioned clients in the upside scenario
was €2,510 million, in the baseline scenario €2,802 million and in the downside scenario €3,668 million. This
reconciles as follows to the reported ECLs:
Reconciliation of model (reportable) ECL to total ECL (*) | ||
in € million | 2023 | 2022 |
Total reportable collective provisions | ||
ECL from individually assessed impairments | ||
ECL from management adjustments | ||
Total ECL | ||
Criteria for identifying a significant increase in credit risk (SICR) (*)
All assets and off-balance-sheet items that are in scope of IFRS 9 impairment and which are subject to
collective ECL assessment are allocated a 12-month ECL if deemed to belong in Stage 1, or a lifetime ECL if
deemed to belong in Stages 2 or 3. An asset belongs in Stage 2 if it is considered to have experienced a
significant increase in credit risk since initial origination or purchase. ING considers the credit risk of an asset
to have significantly increased when either a threshold for absolute change in lifetime probability of default
(PD) or a relative change in lifetime PD is reached.
It should be noted that the lifetime PD thresholds are not the only drivers of stage allocation. An asset can
also change stages as a result of other triggers, such as having over 30 days arrears, being on a watch list or
being forborne. Refer to section 1.5.6 of Note 1 ‘Basis of preparation and significant accounting policies’ for
an exhaustive list. Furthermore, this analysis is rudimentary in the sense that other parameters would
change when an asset changes stages.
Absolute lifetime PD threshold
The absolute threshold is a fixed value calibrated per portfolio/segment and provides a fixed threshold that,
if exceeded by the difference between lifetime PD at reporting date and lifetime PD at origination, triggers
Stage 2 classification. The expert-based thresholds for the absolute change in lifetime PD vary between
75bps for Retail portfolios, 100bps for WB and 250bps for SMEs, based on the characteristics of the specific
portfolio. ING is in the process of refining the thresholds on a portfolio level. These have already been
implemented for part of the portfolio, resulting in calibrated instead of expert-based absolute lifetime PD
thresholds.
Relative lifetime PD threshold
The relative threshold defines a relative increase of the lifetime PD beyond which a given facility is classified
in Stage 2 because of significant increase in credit risk. The relative threshold is dependent on the individual
PD assigned to each facility at the moment of origination and a scaling factor calibrated in the model
development phase that is optimised depending on the observed default rates and overall average riskiness
of the portfolio. While the scaling factor is associated with a whole portfolio/segment, the PD at origination
is facility-specific and, in this sense, the relative threshold may differ facility by facility.
Ultimately the relative threshold provides a criterion to assess whether the ratio (i.e. increase) between
lifetime PD at reporting date and lifetime PD at origination date is deemed a significant increase in credit
risk. If the threshold is breached, SICR is identified and Stage 2 is assigned to the given facility.
The threshold for the relative change in lifetime PD is inversely correlated with the PD at origination; the
higher the PD at origination, the lower the threshold. The logic behind this is to allow facilities originated in
very favourable ratings to downgrade for longer without the need of a Stage 2 classification. In fact, it is
likely that such facilities will still be in favourable ratings even after a downgrade of a few notches. On the
contrary, facilities originated in already unfavourable ratings grades are riskier and even a single-notch
downgrade might represent a significant increase in credit risk and thus a tighter threshold will be in place.
Still, the relative threshold is relatively sensitive for investment grade assets while the absolute threshold
primarily affects non-investment grade assets.
Average threshold ratio
In the table below the average increase in PD at origination needed to be classified in Stage 2 is reported,
taking into account the PD at origination of the facilities included in each combination of asset class and
rating quality. In terms of rating quality, assets are divided into 'investment grade' and 'non-investment
grade' facilities. Rating 18 and 19 are not included in the table since facilities are not originated in these
ratings and they constitute a staging trigger of their own (i.e. if a facility is ever to reach rating 18 or 19 at
reporting date, it is classified in Stage 2). In the table, values are weighted by IFRS 9 exposure and shown for
both year-end 2022 and year-end 2023.
To represent the thresholds as a ratio (i.e. how much should the PD at origination increase in relative terms
to trigger Stage 2 classification) the absolute threshold is recalculated as a relative threshold for disclosure
purposes. Since breaching only relative or absolute threshold triggers Stage 2 classification, the minimum
between the relative and recalculated absolute threshold is taken as value of reference for each facility.
ING Group Annual Report 2023 on Form 20-F 192
Quantitative SICR thresholds (*) | ||||
2023 | 2022 | |||
Average threshold ratio | Investment grade (rating grade 1-10) | Non-investment grade (rating grade 11-17) | Investment grade (rating grade 1-10) | Non-investment grade (rating grade 11-17) |
Asset class category | ||||
Mortgages | ||||
Consumer Lending | ||||
Business Lending | ||||
Governments and Financial Institutions | ||||
Other Wholesale Banking | ||||
As it is apparent from the disclosures above, as per ING’s methodology, the threshold is tighter the higher
the riskiness at origination of the assets, illustrated by the difference between the average threshold applied
to investment grade facilities and non-investment grade facilities.
Sensitivity of ECL to PD lifetime PD thresholds
The setting of PD threshold bands requires management judgement and is a key source of estimation
uncertainty. On Group level, the total model ECL on performing assets, which is the ECL collective-
assessment without taking management adjustments into account, is €1,412 million. To demonstrate the
sensitivity of the ECL to these PD thresholds bands, hypothetically solely applying the upside scenario would
result in total model ECL on performing assets of €1,054 million and a decrease in the Stage 2 ratio by
-0.5 %-percentage point, while solely applying the downside scenario in our models would result in total
model ECL on performing assets of €2,290 million and an increase in the Stage 2 ratio by 3.8 %-point.
ING Group Annual Report 2023 on Form 20-F 193
Introduction (*)
Market risk is the risk that movements in market variables, such as interest rates, equity prices, foreign
exchange rates, credit spreads and real estate prices negatively impact the bank’s earnings, capital, market
value or liquidity position. Market risk either arises through positions in banking books or trading books. The
banking book positions are intended to be held for the long term (or until maturity) or for the purpose of
hedging other banking book positions. The trading book positions are typically held with the intention of
short-term trading or to hedge other positions in the trading book. This means that financial instruments in
the trading books should be free of trade restrictions. Policies and processes are in place to monitor the
inclusion of positions in either the trading or banking book as well as to monitor the transfer of risk between
the trading and banking books.
ING recognises the importance of sound market risk management and bases its market risk management
framework on the need to identify, assess, control and manage market risks. The approach consists of five
recurring activities: risk identification, risk assessment, risk control, risk monitoring and risk reporting.
Governance (*)
A governance framework has been established defining specific roles and responsibilities of business
management units, market risk management units, and internal approval bodies per activity.
Supervision of market risk falls under the responsibility of the EB/MBB and is delegated to the ALCO function,
where ALCO Bank is the highest approval authority and sets the market risk appetite. ALCO Bank monitors
ING’s adherence to the risk appetite for market risk and sets additional limits where appropriate. These limits
are cascaded through the organisation through lower level ALCOs. This ALCO structure facilitates top-down
risk management, limit setting, limit monitoring and control of market risk.
FR maintains a limit framework in line with ING’s Risk Appetite Framework. The businesses are responsible
for adhering to the limits which are reviewed on an annual basis and are ultimately approved by the ALCO
Bank. Limit excesses are reported to senior management in line with the ALM Risk Appetite Statement
Setting procedure and Market Risk in the Trading Book Framework, upon which the business needs to act
accordingly. To adhere to the established limit framework, ING implements hedging and risk mitigation
strategies that range from the use of traditional market instruments, such as interest rate swaps, to more
sophisticated hedging strategies.
The organisational structure facilitates top-down risk management by recognising that risk taking and risk
management occur to a large extent at the regional/local level. Bottom-up reporting from regional/local
units to head office units allows each management level to assess the market risks relevant at the
respective levels.
Several committees govern communication between the parties involved in market risk management:
•The Market Risk Model Committee (MRMC), is the dedicated authority for the approval of all funding &
liquidity risk, market risk (includes banking and trading risk), counterparty credit risk and business risk
models and parameters for ING Bank within its mandate delegated by ALCO Bank.
•The Valuation Model Committee approves pricing models for trading and banking books.
Financial Risk provides risk reporting to the EB and MBB, the ALCO Bank and the senior executive
management of related business functions.
The following sections elaborate on the various elements of the risk management framework for:
•Market risk economic capital;
•Market risk in banking books;
•Market risk in trading books.
Market risk economic capital
Market Risk Economic Capital (MREC) measures the capital ING must hold to protect itself against losses due
to market risks. MREC covers the entire balance sheet of ING Group, and includes market risk sub-types such
as: interest rate and basis risk, credit spread risk, customer behaviour risk, FX risk, equity risk and commodity
risk.
MREC is calculated as the 99.9 percent worst value loss that can be incurred from one-year shocks to the
underlying risk drivers. While aggregating the different economic capital market risk figures for the different
portfolios, diversification benefits are taken into account as it is not expected that all extreme market
movements will appear at the same moment.
ING makes a distinction between the trading and banking (non-trading) books. Positions in banking books
originate from the market risks inherent in commercial products that are sold to clients, Group Treasury
exposures, and from the investment of our own funds (core capital). Both the commercial products and the
products used to hedge related market risk exposures are intended to be held until maturity, or at least for
the long term.
ING Group Annual Report 2023 on Form 20-F 194
Risk transfer (*)
Market risks in the banking book are managed via the risk transfer process. In this process the interest rate,
FX, funding and liquidity risks are transferred from the commercial books through matched funding or
replication to Group Treasury, where centrally managed. The scheme below presents the transfer and
management process of market risks in the banking books.
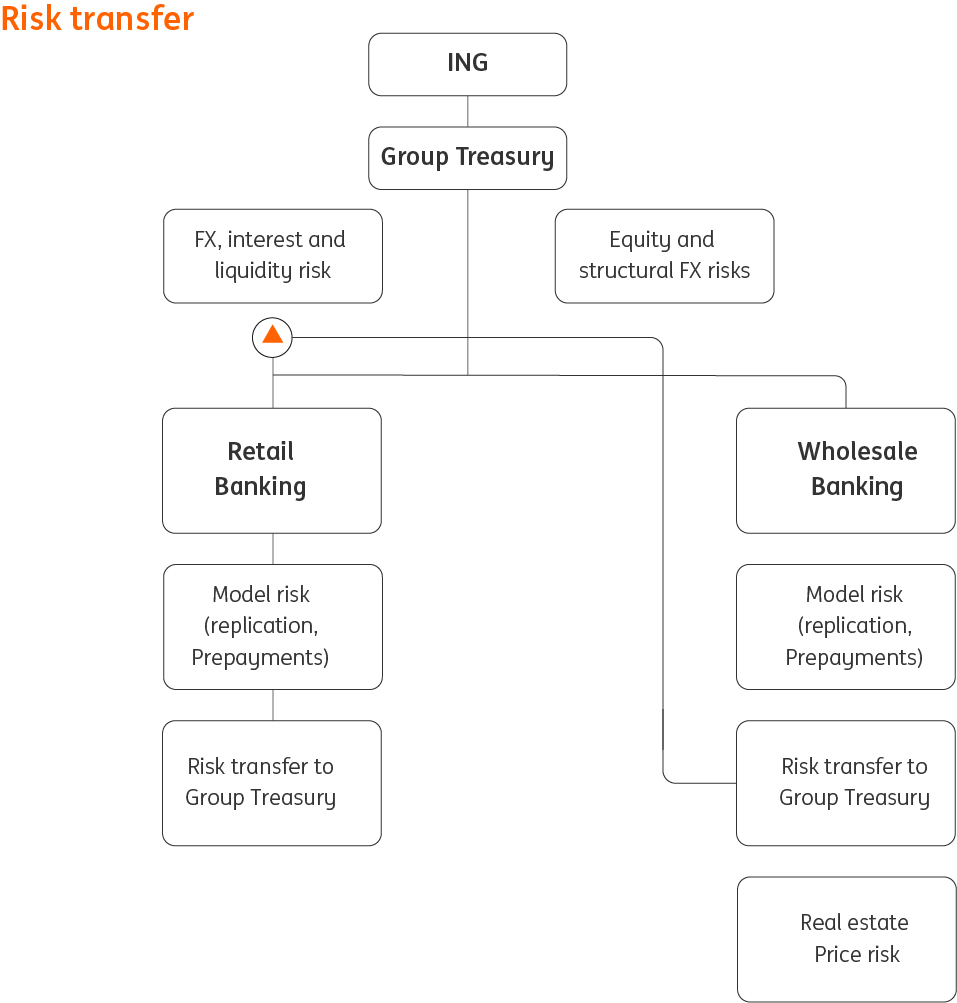 |
The main concepts and metrics used for measuring market risk in the banking book are described below per
risk type.
Interest rate risk in banking book (*)
Interest rate risk in the banking book is defined as the exposure of a bank’s earnings, capital, and market
value to adverse movements in interest rates originated from positions in the banking book.
Governance (*)
The management of interest rate risk follows the Interest Rate Risk in the Banking Book (IRRBB) framework
as approved by ALCO Bank. This framework describes roles, responsibilities, risk metrics, and the policies and
procedures related to interest rate risk management. Furthermore, ALCO Bank reviews and sets the risk
appetite for interest rate risk on an annual basis. The risk appetite is translated into limits for the interest
rate risk metrics.
As a result of this framework, ING centralises interest rate risk management from commercial books (that
capture the products sold to clients) to globally managed interest rate risk books. This enables a clear
demarcation between commercial business results and results based on unhedged interest rate positions.
ING distinguishes between three types of activities that generate interest rate risk in the banking book:
•Investment of own funds;
•Commercial business;
•Group Treasury exposures including strategic interest rate positions.
Group Treasury is responsible for managing the investment of own funds (core capital). Capital is invested
for longer periods to contribute to stable earnings within the risk appetite boundaries set by ALCO Bank. The
main objective is to maximise the economic value of the capital investment book while having stable
earnings.
Commercial activities can result in linear interest rate risk, for example, tenors and duration of new
production and re-pricing of assets differ from those of liabilities. Also, interest rate risk can arise from
customer behaviour and/or convexity risk, depending on the nature of the underlying product
characteristics.
Customer behaviour risk is defined as the potential future (value) loss due to deviations in the actual
behaviour of clients versus the modelled behaviour with respect to the embedded options in commercial
products. General sources of customer behaviour risk, among other things, include the state of the
ING Group Annual Report 2023 on Form 20-F 195
economy, competition, changes in regulation, legislation and tax regime, developments in the housing
market and interest rate developments.
From an interest rate risk perspective, commercial activities can typically be divided into the following main
product types: savings and current accounts (funds entrusted), demand deposits, mortgages and loans.
Savings and demand deposits are generally invested in such a way that both the value is hedged and the
sensitivity of the margin to market interest rates is minimised. The contractual nature of investments
(assets) implies that the adjustment to market rates (repricing of assets) is not immediate, therefore the
interest rate risk can arise with either positive or negative impact on the income. Interest rate risk is
modelled based on the stability of deposits and the pass-through rate. This takes account of different
elements, such as pricing strategies, volume developments and the level and shape of the yield curve.
Savings volumes are typically assumed to be relatively stable and less sensitive to rate changes.
Interest rate risk for mortgages arises due to prepayment or other embedded optionalities. In modelling this
risk, both interest-rate-dependent pre-payments and constant prepayments, are considered. Next to a
dependence on interest rates, modelled prepayments may include other effects such as loan-to-value,
seasonality and the reset date of the loan. In addition, the interest sensitivity of embedded offered rate
options may be considered.
Wholesale Banking loans typically do not experience interest-rate-dependent prepayment behaviour. These
portfolios are match-funded taking the constant prepayment model into account and typically do not
contain significant convexity risk. Wholesale Banking loans can have an all-in rate floor or a floor on a
reference rate.
Customer behaviour in relation to mortgages, loans, savings and demand deposits is modelled, based on
extensive research. However, the substantial change in the interest rate environment makes extensive
research more challenging than before and may increase model risk. Models are backtested and updated
when deemed necessary in an annual procedure. Model parameters and the resulting risk measures are
approved by (local) ALCO and are closely monitored on a monthly basis.
Linear risk transfers take place from commercial business books to the treasury book (Group Treasury), if
necessary, by using estimations of customer behaviour. The originating commercial business is ultimately
responsible for estimating customer behaviour, leaving convexity risk and (unexpected) customer behaviour
risk with the commercial business. Risk measurement and the risk transfer process take place at least
monthly. However, if deemed necessary, additional risk transfers can take place.
The commercial business manages the convexity risk that is the result of products that contain embedded
options, like mortgages. Here the convexity risk is defined as the optionality effects in the value due to
interest rate changes, excluding the first-order effects. In some cases, convexity risk is transferred from the
commercial books to treasury books using cap/floor contracts and swaptions.
In the following sections, the interest rate risk exposures in the banking books are presented. ING quantifies
risk measures from both earnings and value perspectives. Net interest income (NII)-at-Risk is used to provide
the earnings perspective and the net present value (NPV)-at-Risk figures provide the value perspective.
Please note that the interest rate risk that stems from the commercial business is assumed to be linearly
hedged but no additional corrective management actions are taken into account in the NPV-at-Risk
measure. In the NII-at-Risk measure, a more dynamic hedging process is taken into account.
During 2023, the following activities related to the risk measurement for IRRBB were performed:
•Annual review of the risk appetite for market risks in the banking book including further enhancements;
•Further assessment and development of sub-risk types, such as tenor basis risk, vega optionality risk and
client behaviour risk;
•Set up of standardised risk measurement related to global crisis risk;
•Annual review of the interest rates scenarios used for calculating NII-at-Risk and NPV-at-Risk;
•Annual savings/current account model updates;
•Annual update of parameters of prepayment models for market developments;
•Further enhancement of the IRRBB framework in relation to upcoming regulatory requirements (e.g.
anticipation on implementation and measurement of the upcoming regulatory metric NII SOT,
development of additional requirements coming forward from latest EBA guidelines);
•Further strengthening of customer behaviour risk and model risk frameworks
Net interest income (NII) at Risk (*)
The NII-at-Risk measures the impact of changing interest rates on the forecasted net interest income
(before tax) of the banking book, excluding the impacts of credit spread sensitivity, fees and fair value
impact. Future projected balance sheet developments are included in this risk metric. NII-at-Risk is a metric
that helps provide insight as to what extent ING's NII under alternative interest rates developments deviates
from what was assumed in our dynamic plan projections.
In its risk management, ING monitors the NII-at-Risk under a three-year timeframe. Interest rates are
stressed during the first year versus the prevailing curve, taking gradual changes over the first year. The rate
changes considered comprise both upward and downward scenarios, as well as parallel (equal movements
across the yield curve) and non-parallel scenarios.
The impact of changing interest rates on ING’s NII is predominantly caused by the following factors:
•Change in returns of (re-)investments of client deposits;
•Change in client deposit rates (mainly savings), (partially) tracking changes in market interest rates;
ING Group Annual Report 2023 on Form 20-F 196
•Change in the amortization profile of mortgages, due to an increase or decrease in expected
prepayments;
•Higher/lower returns of (re-)investments of capital investment;
•Open interest rate positions, leading to changes in return because of different market rates;
•Assumed volume development of the balance sheet in line with ING's dynamic plan.
For projecting the change in client deposit rates, ING uses a client rate model that describes the relation to
market interest rates and client deposit rates. The model is calibrated under a range of interest rate
scenarios. Per scenario the actual change in client deposit rates may deviate from this calibrated model. The
actual NII development of customer deposits may, indeed, differ from the provided scenarios, depending on,
amongst others, actual interest rate and savings client rate evolution, as well as changes to ING’s balance
sheet composition such as net deposit growth and relative share of savings deposits and non-remunerated
current accounts.
The NII-at-Risk figures in the table below reflect a parallel, linear interest rate movement during a year
('ramped') under the assumption of balance sheet developments in line with the ING's dynamic plan with a
time horizon of one year. The majority of the risk comes from fixed-rate positions, most notably non-
remunerated current accounts and variable-rate savings accounts.
the sensitivity of client assets and investments to rate changes. The investment of own funds only impacts
the earnings sensitivity marginally, as only a relatively small part has to be (re)invested within the one-year
horizon.
NII-at-Risk banking book per currency - year one (*) | ||||
in € million | 2023 | 2022 | ||
Ramped, unfloored | Ramped, unfloored | |||
parallel ▼ | parallel ▲ | parallel ▼ | parallel ▲ | |
By currency | ||||
Euro | - | - | ||
US dollar | - | - | ||
Other | - | - | ||
Total | - | - | ||
EUR ramped (unfloored) is at +/- 110bps in 1 year (2022: +/-100bps) | ||||
USD ramped (unfloored) is at +/- 110bps in 1 year (2022: +/-120bps) | ||||
The change in NII under a declining and upward interest rate scenarios may not be equal. This is due to
different expected reactions in prepayment behaviour of mortgages and different pricing developments of
commercial loans and deposits products (mainly savings). This is caused by embedded options, explicit or
implicit pricing floors and other (assumed) pricing factors.
Year-on-year variance analysis (*)
In our customer deposit composition current accounts decreased and term deposits increased. Over 2023
the one-year asset repricing versus liability repricing increased, leading to a higher NII-at-Risk.
In 2023 central banks tightened monetary conditions, a continuation of a trend started in 2022 to counter
high inflation. The interest rates, however, stabilised in the second half of the year as inflation started to
ease. ING applied a dynamic hedging process, by which interest rate risk was transferred from the business
to Group Treasury and subsequently hedged in the markets. This process mitigates interest rate risk
resulting in a lower sensitivity for rate changes of ING's NII. However, the main drivers of a potential change
of NII sensitivity are balance sheet developments, specifically relating to mortgages, loans and savings. In
the eurozone, mortgage production was impacted by an increase in interest rates. Next to the impact on
new production, the prepayment incentive generally decreased due to the increase in interest rates. The
funds entrusted volume did not change significantly. The impact of explicit and implicit floors on both rates
of client assets and savings phased out in the course of the year on the back of the interest rate increases.
Pre-existing hedges, as executed by Group Treasury, were also adjusted continuously throughout the year
to hedge any interest rate risk coming from higher interest rates. Furthermore, ING’s investment of own
funds took place against a lower duration reducing sensitivity. Excluding Model Risk, the total NII-at-Risk
remains relatively limited in comparison to ING’s total interest income.
Net Present Value (NPV) at Risk (*)
NPV-at-Risk measures the impact of changing interest rates on the value of the positions in the banking
book. The NPV-at-Risk is defined as the outcome of an instantaneous increase or decrease in interest rates
from applying currency-specific scenarios. The NPV-at-Risk asymmetry between the downward and upward
shock is mainly caused by convexity risk in the mortgage and savings portfolio.
The full value impact cannot be directly linked to the financial position or profit or loss account, as fair value
movements in banking books are not necessarily reported through the profit or loss account or through
other comprehensive income (OCI). The changes in value are expected to materialise over time in the profit
and loss account if interest rates develop according to forward rates throughout the remaining maturity of
the portfolio. The majority of the risk comes from the investments of own funds and from positions
exhibiting negative convexity due to embedded optionality (most notably variable rate savings rate and
fixed rate mortgages).
ING Group Annual Report 2023 on Form 20-F 197
NPV-at-Risk banking books per currency (*) | ||||
in € million | 2023 | 2022 | ||
unfloored | unfloored | |||
parallel ▼ | parallel ▲ | parallel ▼ | parallel ▲ | |
By currency | ||||
Euro | - | - | - | |
US dollar | - | - | ||
Other | - | - | ||
Total | - | - | ||
EUR ramped (unfloored) is at +/- 110bps (2022: +/-100bps) | ||||
USD ramped (unfloored) is at +/- 110bps (2022: +/-120bps) | ||||
Year-on-year variance analysis (*)
The overall NPV sensitivity remained limited in 2023, reflecting of proper risk transfer and hedging process.
The worst case scenario, parallel up, remained relatively unchanged. Most of the year-to-year move is
coming from mortgages, partly offset by savings and derivatives from hedging activities.
IBOR transition (*)
In line with the recommendations of the Financial Stability Board, a fundamental review of important
interest rates benchmarks has been undertaken. Some interest benchmarks have been reformed, while
others have or will be replaced by risk-free rates (RFR) and discontinued. USD LIBOR in its current form
ceased on 30 June 2023, whereas the cessation of GBP, CHF, JPY, and EUR LIBOR rates occurred on 31
December 2021.
To support these changes, the financial sector has issued several guidance papers and other initiatives to
help phase the transition.
To facilitate the transition away from USD LIBOR, for new USD contracts, ING started using the
recommended alternative rates based on SOFR in 2022. Also, during 2022 and 2023, ING sought to ensure
that existing loan and derivative contracts were either transitioned to alternative rates or transition
arrangements agreed, such as taking steps to ensure a large portion of the derivative portfolio was covered
by ISDA fallbacks. Despite extensive and timely communication on the desirability of fully agreeing
transition arrangements before 30 June 2023, some clients have agreed to complete the required work
before the first interest reset date after cessation. A limited number of clients in restructuring or those
subject to sanctions need to rely on existing fallback language or synthetic LIBOR.
Due to the discontinuation of this important rate, ING, its customers, and the financial services industry have
faced and continue to face a number of risks. These risks include legal, financial, operational, reputational
and conduct risk. Legal risks are related to any required changes to existing transactions. Financial risks may
arise due to declining liquidity and may impact a contract directly or the ability to hedge the risks in that
contract. Operational risks arise due to the requirement to adapt IT systems, trade reporting infrastructure
and operational processes. Conduct risk also plays a role, as renegotiation of loan contracts requires active
engagement from all parties to a contract and may lead to negotiations concentrated in a period close to
actual cessation. ING continues to work with the very limited number of clients that are yet to complete the
USD LIBOR transition.
The progress of the IBOR transitioning between 2018 and 2023 was tracked in the global ING IBOR
programme, governed by business line steering committees, which reported to a central IBOR steering
committee. The programme coordinated the actions necessary to manage the required changes to internal
processes and systems, including pricing, risk management, legal documentation, hedge arrangements, as
well as the impact on customers. The limited amount of remaining USD LIBOR contracts continues to be
monitored within the commercial business lines following the closure of the bank-wide IBOR programme in
November 2023. The ING Benchmark Committee continues to monitor market developments and reform
plans for other rates, to anticipate the impact on any related risks.
One such development concerns the plans published by the Polish National Working Group, which advises
the market to be ready for a cessation of WIBOR and WIBID reference rates at the end of 2027 (originally
expected in 2025, but in the last quarter of 2023 the cessation date was postponed to the end of 2027) with
the offering of financial products using the new benchmark (Warsaw Interest Rate Overnight or WIRON) to
progress gradually and no new products using WIBOR and WIBID beyond 1 July 2024. The WIBOR rates are
used in several of our lending and derivative products, and hence a project team has been established to
manage the transition. WIBOR transition is especially important for our Polish subsidiary ING Bank Slaski S.A.
with a significant amount of Polish zloty-denominated assets and liabilities including derivatives that are
continuously rebalanced to hedge the risk exposures.
The tables below summarise the approximate gross exposures of ING that have yet to transition related to
USD LIBOR and WIBOR. For WIBOR, as of 31 December 2023, they exclude exposures expiring before the
transition date 31 December 2027 and of 31 December 2022 they exclude exposures expiring before the
previously expected transition date 1 January 2025. Therefore, WIBOR exposures are not directly
comparable between 31 December 2023 and 31 December 2022 as a consequence of the recent
developments in the Polish National Working Group.
ING Group Annual Report 2023 on Form 20-F 198
Non derivative Financial instruments to transition to alternative benchmarks (*) | |||
in € million at 31 December 2023 | Financial Assets non- derivative | Financial Liabilities non-derivative | Off balance sheet commitments |
Carrying value | Carrying value | Nominal value | |
By benchmark rate | |||
USD LIBOR | |||
WIBOR | |||
Total | |||
Non derivative Financial instruments to transition to alternative benchmarks (*) | |||
in € million at 31 December 2022 | Financial Assets non- derivative | Financial Liabilities non-derivative | Off balance sheet commitments |
Carrying value | Carrying value | Nominal value | |
By benchmark rate | |||
USD LIBOR | |||
WIBOR | |||
Total | |||
The total of non-derivative financial assets linked to USD LIBOR is reduced from €30,040 million on 31
December 2022 to €915 million on 31 December 2023. The majority of the non-derivative financial assets
exposure on 31 December 2023 are related to contracts using synthetic USD LIBOR up until the transition to
SOFR is complete during 2024. In addition, ING reduced its committed undrawn credit facilities linked to USD
LIBOR from €7,644 million on 31 December 2022 to €9 million on 31 December 2023. The total of non-
derivative financial liabilities linked to USD LIBOR is reduced from €1,637 million on 31 December 2022 to
€16 million on 31 December 2023. The remaining non-derivative financial instruments linked to USD LIBOR
are expected to transition before the next interest rate reset date. Therefore, the remaining exposure to USD
LIBOR is expected to reduce further during the first half of 2024.
Derivative Financial instruments to transition to alternative benchmarks (*) | ||
31 December 2023 | 31 December 2022 | |
in € million | Nominal value | Nominal value |
By benchmark rate1 | ||
USD LIBOR | ||
WIBOR | ||
Total | ||
In addition to the amounts in the table above, ING transitioned the interest rate swaptions that referred to
the USD LIBOR ICE swap rate (nominal value on 31 December 2022: €10,810 million). The transition of these
contracts was in general governed by a specific ISDA protocol.
Derivative financial instruments linked to USD LIBOR were reduced from €495,318 million on 31 December
2022 to only €151 million on 31 December 2023. The majority of derivatives linked to USD LIBOR rates were
transacted with clearing houses and transitioned through a standardised exercise during the second quarter
of 2023. For non-centrally cleared derivatives, the main transition occurred using the ISDA IBOR fallback
arrangements. The majority of the remaining derivative financial instruments linked to USD LIBOR are
related to contracts using synthetic USD LIBOR and linked to non-derivative financial assets that are
expected to transition before the next interest rate reset date during 2024. Therefore, a steady reduction of
these last few USD LIBOR contracts is expected during the first half of 2024.
Given that IBOR reform may have various accounting implications, the International Accounting Standards
Board (IASB) has undertaken a two-phase project:
• Phase 1 addresses those issues that affect financial reporting before the replacement of an existing
benchmark. This allows ING to apply a set of temporary exceptions to continue hedge accounting even
when there is uncertainty about contractual cash flows arising from the reform. Under these temporary
exceptions, interbank offered rates are assumed to continue unaltered for the purposes of hedge
accounting until such time as the uncertainty is resolved.
• Phase 2 focuses on issues that may affect financial reporting when the existing benchmark rate is
reformed or replaced. Phase 2 amendments to IFRS relate mainly to accounting for changes in the basis for
determining the contractual cash flows of financial assets and liabilities due to the IBOR reform and impact
on hedge accounting when an existing benchmark rate is reformed or replaced with an alternative risk-free
rate.
Specifically, Phase 2 amendments require that the effective interest rate on debt financial instruments is
adjusted, and hedge accounting continues on transition to risk free rates, but only to the extent that the
modifications made to financial instruments are those necessary to implement the IBOR reform and that
the new basis for calculating cash flows is ‘economically equivalent’ to the previous basis. By applying these
mandatory amendments, ING Group avoids recognising modification gains and losses on debt instruments
that would otherwise be required in the absence of Phase 2 amendments (changes to debt instruments
resulting from IBOR reform are treated as a reset to the instrument’s variable interest rate). In addition, ING
Group avoids hedge accounting discontinuations when modifying both hedged items and hedging
instruments (and related hedge documentation) as a consequence of IBOR reform that would otherwise be
required in the absence of Phase 2 amendments.
ING Group Annual Report 2023 on Form 20-F 199
As explained above, Phase 1 and Phase 2 IBOR amendments to IFRS, amongst other changes, provide
specific hedge accounting reliefs that allow hedge accounting relationships to continue when IBOR Reform is
ongoing. Phase 1 reliefs cease to apply when uncertainty arising from IBOR reform is no longer present with
respect to the timing and amount of the IBOR-based cash flows of the relevant instruments. It is ING Group’s
policy to cease to apply Phase 1 reliefs when the applicable contract (either hedging instrument or hedged
item) is actually modified. As a result, for these hedge accounting relationships the applicable Phase 1 reliefs
ceased to apply and Phase 2 became applicable. Refer to section 1.5.4 of Note 1 ‘Basis of preparation and
material accounting policy information’ for more information on the Phase 1 and Phase 2 amendments.
Furthermore, hedging relationships are being amended to incorporate the new benchmark rates. During
2023, ING focused on USD LIBOR contracts and all hedging relationships have been amended to incorporate
the new benchmark rates and do no longer reference USD LIBOR rates.
On 31 December 2023, Phase 1 reliefs are applicable to WIBOR indexed fair value and cash flow hedge
accounting relationships as there is uncertainty arising from the WIBOR reform with respect to the timing
and the amount of the underlying cash flows that the Group is exposed to. Therefore, for WIBOR financial
instruments designated in hedge accounting the applicable Phase 1 reliefs will continue to apply until the
relevant contract is modified. At that point in time, Phase 2 reliefs will become applicable. For these affected
fair value and cash flow hedge relationships ING assumes that the WIBOR based cash flows from the
hedging instrument and hedged item will remain unaffected.
The same assumption is used to assess the likelihood of occurrence of the forecast transactions that are
subject to cash flow hedges. The hedged cash flows in cash flow hedges directly impacted by the WIBOR
reform still meet the highly probable requirement, assuming the WIBOR benchmark on which the hedged
cash flows are based is not altered as a result of the reform.
The total gross notional amounts of hedging instruments that are used in the ING's hedge accounting
relationships for which the Phase 1 amendments to IAS39 were applied are:
Notional amounts of Hedging instruments (*) | ||
31 December 2023 | 31 December 2022 | |
in € million | Nominal value | Nominal value |
By benchmark rate | ||
USD LIBOR | ||
WIBOR | ||
As at 31 December 2023, all USD LIBOR hedging relationships have been amended to incorporate the new
benchmark rates and do no longer reference USD LIBOR rates. At 31 December 2022 approximately 89 % of
the notional amounts for USD LIBOR had a maturity date beyond the transition date 30 June 2023.
Approximately 29 % of the notional amounts for WIBOR have a maturity date beyond the new transition
date 31 December 2027. At 31 December 2022, approximately 71 % of the notional amounts for WIBOR had
a maturity date beyond the previously expected transition date of 1 January 2025. The WIBOR amounts are
not directly comparable between 31 December 2023 and 31 December 2022 as a consequence of the
recent postponement of the cessation of WIBOR by the Polish National Working Group.
The notional amounts of the derivative hedging instruments provide a close approximation of the extent of
the risk exposure ING manages through these hedging relationships.
Credit spread risk in banking books (*)
Credit spread risk is defined as risk driven by the changes of the market price for credit risk, for liquidity and
potentially other characteristics of credit-risky instruments, which is not captured by another existing
prudential framework such as IRRBB or by expected credit/(jump-to-) default risk.
EBA guidelines
The updated guidelines on credit spread risk in the banking book (CSRBB) became effective on 31 December
2023. Following the EBA guidelines, the scope in terms of positions and metrics has been reviewed and
updated during 2023. Metrics used are NPV-at-Risk, NII-at-Risk and Market Value Changes-at Risk and view
the positions across different accounting treatments.
Governance
The management of credit spread risk follows the CSRBB framework as approved by ALCO Bank. This
framework describes roles, responsibilities, risk metrics, and the policies and procedures related to credit
spread risk management. Furthermore, ALCO Bank reviews and sets the risk appetite for credit spread risk
on an annual basis. The risk appetite is translated into limits for the risk metrics.
Foreign exchange (FX) risk in banking books (*)
FX exposures in banking books result from core banking business activities (business units doing business in
currencies other than their base currency), foreign currency investments in subsidiaries (including realised
net profit and loss), and strategic equity stakes in foreign currencies. The policy regarding these exposures is
briefly explained below.
ING Group Annual Report 2023 on Form 20-F 200
Governance – Core banking business (*)
Every business unit hedges the FX risk resulting from core banking business activities into its base currency
to prevent volatility in profit and loss. Consequently, assets and liabilities are matched in terms of currency,
within certain friction limits.
Governance – FX translation result (*)
ING’s strategy is to protect the CET1 ratio against adverse impact from FX rate fluctuations, while limiting
the volatility in the profit and loss account due to this CET1 hedging and limiting the RWA impact under the
regulatory framework. Hedge accounting is applied to the largest extent possible. Taking this into account,
the CET1 ratio hedge can be achieved by deliberately taking foreign currency positions equal to certain
target positions, such that the CET1 capital and risk-weighted assets are equally sensitive in relative terms
to changing FX rates.
Risk profile – FX translation result (*)
The following table presents the currency exposures in the banking books for the most important currencies
for the FX translation result. Positive figures indicate long positions in the respective currency. As a result of
the strategy to hedge the CET1 ratio an open structural FX exposure exists.
To measure the volatility of the CET1 ratio from FX rate fluctuations, different metrics are used including the
CET1 Ratio-at-Risk. The impact is controlled via the Solvency and Market Risk Banking Book RAS.
EBA Structural FX guidelines
In line with the EBA guidelines on Structural FX, upon permission from the competent authorities, certain
currency positions are being excluded from the calculation of net open currency positions under CRR article
352(2). The resulting impact is presented in the Pillar 3 disclosure.
Foreign currency exposures banking books (*) | ||||||
in € million | Foreign Investments | Hedges | Net exposures | |||
2023 | 2022 | 2023 | 2022 | 2023 | 2022 | |
US Dollar | - | - | ||||
Pound Sterling | - | - | ||||
Polish Zloty | - | - | ||||
Australian Dollar | - | - | ||||
Turkish Lira | ||||||
Chinese Yuan | - | |||||
Russian Rouble | ||||||
Romanian Leu | - | - | ||||
Thai Baht | - | - | ||||
Other currency | - | - | ||||
Total | - | - | ||||
*The FX sensitivity is expressed as the FX spot equivalent position.
Equity price risk in banking books (*)
Governance (*)
ING maintains a portfolio with substantial equity exposure in its banking books. Local offices are responsible
for the management of the equity investment positions. Financial Risk is responsible for monitoring the
regulatory capital for equity investments on a monthly basis and acts independently from ING/local
management when monitoring these positions.
Risk profile (*)
Equity price risk arises from the possibility that an equity security’s price will fluctuate, affecting the values
of the equity security itself as well as other instruments whose values react similarly to the particular
security, a defined basket of securities, or a securities index. ING’s equity exposure mainly consists of the
investments in associates and joint ventures of €1,509 million (2022: €1,500 million) and equity securities
held at fair value through other comprehensive income (FVOCI) of €1,885 million (2022: €1,887 million).The
value of equity securities held at FVOCI is directly linked to equity security prices with increases/decreases
being recognised in the revaluation reserve. Investments in associates and joint ventures are measured in
accordance with the equity method of accounting and the balance sheet value is therefore not directly
linked to equity security prices. The equity sensitivity is expressed as the equity position.
ING Group Annual Report 2023 on Form 20-F 201
Year-on-year variance analysis (*)
In 2023, the revaluation reserve equity securities decreased by €34 million from €1,187 million to €1,152
million mainly due to revaluation of the shares in Bank of Beijing with €-24 million. In 2023, the equity
securities at fair value through OCI decreased slightly by €2 million.
Revaluation reserve equity securities at fair value through other comprehensive income (*) | ||
in € million | 2023 | 2022 |
Positive re-measurement | ||
Negative re-measurement | - | - |
Total | ||
Market risk in trading books (*)
Within the trading portfolios, the positions are maintained in the financial markets. These positions are often
a result of transactions with clients and may benefit from short-term price movements. In 2023, ING
continued its strategy of undertaking trading activities to develop its client-driven franchise and deliver a
differentiating experience by offering multiple market and trading products.
Governance (*)
The Financial Markets Risk Committee (FMRC) is the market risk committee that, within the risk appetite set
by the ALCO Bank, sets the market risk limits both on an aggregated level and on a desk level. The FMRC has
delegated authority from ALCO Bank for the management of market risk related to all trading and banking
book activities within Financial Markets (FM). Financial Risk/ Trading Risk Management (FR/ TRM) advises both
FMRC and ALCO Bank on the market risk appetite of the trading activities.
With respect to the trading portfolios, TRM focuses on the management of market risks of Wholesale
Banking (mainly Financial Markets) as this is the only business line within ING where trading activities take
place. Trading activities include facilitation of client business and market making. TRM is responsible for the
development and implementation of trading risk policies and risk measurement methodologies, and for
reporting and monitoring risk exposures against approved trading limits. TRM also reviews trading mandates
and global limits, and performs the gatekeeper role in the product review process (PARP).
Risk measurement (*)
ING uses a comprehensive set of methodologies and techniques to measure market risk in trading books:
Value at Risk (VaR) and Stressed Value at Risk (SVaR), Incremental Risk Charge (IRC), and stress testing.
Systematic validation processes are in place to validate the accuracy and internal consistency of data and
parameters used for the internal models and modelling processes.
Value at Risk (*)
TRM uses the historical simulation VaR methodology (HVaR) as its primary risk measure. The HVaR for
market risk quantifies, with a one-sided confidence level of 99 percent, the maximum overnight loss that
could occur in the trading portfolio of ING due to changes in risk factors (e.g. interest rates, equity prices,
foreign exchange rates, credit spreads, implied volatilities) considering the positions remains unchanged for
a time period of one day.
Next to general market movements in these risk factors, HVaR also takes into account market data
movements for specific moves in, for example, the underlying issuer or securities. A single model which
diversifies general and specific risk is used. In general, a full revaluation approach is applied, while for a
limited number of linear trading positions and risk factors in commodity and equity risk classes a sensitivity-
based approach is applied. The potential impact of historical market movements on today’s portfolio is
estimated, based on equally weighted observed market movements of the previous year (260 business
days). When simulating potential movements in risk factors, depending on the risk factor type, either an
absolute or a relative shift is used.
The data used in the computations is updated daily. ING uses HVaR with a one-day horizon for internal risk
measurement, management control, and backtesting, and HVaR with a 10-day horizon for determining
regulatory capital. To compute HVaR with a 10-day horizon, the one-day risk factor shifts are scaled by the
square root of 10 and then used as an input for the revaluation. The same model is used for all legal entities
within ING with market risk exposure in the trading portfolio.
Limitations (*)
HVaR has some limitations: HVaR uses historical data to forecast future price behaviour, but future price
behaviour could differ substantially from past behaviour. Moreover, the use of a one-day holding period (or
10 days for regulatory capital calculations) assumes that all positions in the portfolio can be liquidated or
hedged in one day. In periods of illiquidity or market events, this assumption may not hold. Also, the use of
a 99 percent confidence level means that HVaR does not take into account any losses that occur beyond
this confidence level.
Backtesting (*)
Backtesting is a technique for the ongoing monitoring of the plausibility of the HVaR model in use. Although
HVaR models estimate potential future trading results, estimates are based on historical market data. In a
backtest, the actual daily trading result (excluding fees and commissions) is compared with the one-day
HVaR.
ING Group Annual Report 2023 on Form 20-F 202
In addition to using actual results for backtesting, ING also uses hypothetical results, which exclude the
effects of intraday trading, fees, and commissions. When an actual or a hypothetical loss exceeds the HVaR,
an ‘outlier’ occurs. Based on ING’s one-sided confidence level of 99 percent, an outlier is expected once in
every 100 business days.
On an overall level in 2023, there was one outlier for hypothetical P&L and zero outliers for actual P&L. The
hypothetical outliers occurred during the past year concentrated in the first quarter of 2023, mainly due to
the increased market volatility arising from major American banks being collapsed.
Stressed HVaR (*)
The stressed HVaR (SVaR) is intended to replicate the HVaR calculation that would be generated on the
bank’s current portfolio with inputs calibrated to the historical data from a continuous 12-month period of
significant financial stress relevant to the bank’s portfolio.
To calculate SVaR, ING uses the same model that is used for 1DHVaR, with a 10-day horizon. The data for
the historical stress period used currently includes the height of the credit crisis around the fall of Lehman
Brothers (2008-2009), and this choice is reviewed regularly. The historical data period is chosen so that it
gives the worst scenario loss estimates for the current portfolio. The same SVaR model is used for
management purposes and for regulatory purposes. The same SVaR model is used for all legal entities
within ING with market risk exposure in the trading portfolio.
Incremental risk charge (*)
The incremental risk charge (IRC) for ING is an estimate of the default and migration risks for credit products
(excluding securitisations) in the trading book, over a one-year capital horizon, with a 99.9% confidence
level. Trading positions (excluding securitisations) of ING, which are subject to specific interest rate risk
included in the internal model approach for market risk regulatory capital, are in scope of the IRC model. By
model choice, equity is excluded from the model. For the calculation of IRC, ING performs a Monte Carlo
simulation based on a multi-factor t-copula. In the multi-factor IRC model the supervisory asset correlations
are no longer applicable and the calibration of the correlations is based on historical market data. The rating
change is simulated for all issuers over the different liquidity horizons (i.e. time required to liquidate the
position or hedge all significant risks) within one year. Movements across different rating categories and
probabilities of default are governed by a credit-rating transition matrix. An internal transition matrix along
with internal LGDs is used, to comply with the consistency requirement. The financial impact is then
determined for the simulated migration to default, or for the simulated migration to a different rating
category, based on LGD or credit spread changes, respectively.
The liquidity horizon has been set to the regulatory minimum of three months for all positions in scope. ING
reviews the liquidity horizons on a yearly basis, based on a structured assessment of the time it takes to
liquidate the positions in the trading portfolio.
Stress testing and event risk (*)
Stress testing is a valuable risk management tool. In addition to the bank-wide stress test framework as
described in the stress-testing section, Trading Risk Management performs stress tests specific to the
trading book with various frequencies. ING went live with a new Trading Book Stress Testing model in 2023,
replacing the previously used Event Risk model. With the new model, the trading book stress tests evaluate
the impact on the bank’s trading book under severe but plausible stress scenarios, using full revaluation
approach. The framework is based on historical as well as hypothetical scenarios. The stress result is an
estimate of the profit and loss caused by a potential event and its worldwide impact for ING. The results of
the stress tests are used for decision-making aimed at maintaining a financially healthy going-concern
institution after a severe event occurs.
In stress scenarios, shocks are applied to prices (credit spreads, interest rates, equity, commodities, and FX
rates) and volatilities. Depending on the type of the stress test, additional scenario assumptions can be
made, for example on correlations, dividends, or recovery rates. The structural scenarios are defined to
cover market moves in various directions and capture different asset class correlations. Scenarios are
calculated using full revaluation approach. The worst scenarios are determined for each product line,
business line and super business line, and compared against limits.
Other trading controls
HVaR and event risk limits are the most important limits to control the trading portfolios. Additionally, limits
have been set on SVaR and IRC, and ING uses a variety of other controls to supplement these limits. Position
and sensitivity limits are used to prevent large concentrations in specific issuers, sectors, or countries.
Moreover, other risk limits are set with respect to the activities in complex derivatives trading. The market
risk of these products is controlled by product-specific limits and constraints.
Risk profile
The following chart shows the development of the overnight HVaR under a 99 percent confidence level and
a one-day horizon versus actual and hypothetical daily trading profits and losses. In calculation of the
hypothetical daily profit and loss, the trading position is kept constant and only the market movement is
taken into account. The overnight HVaR is presented for the ING trading portfolio for 2023.
ING Group Annual Report 2023 on Form 20-F 203
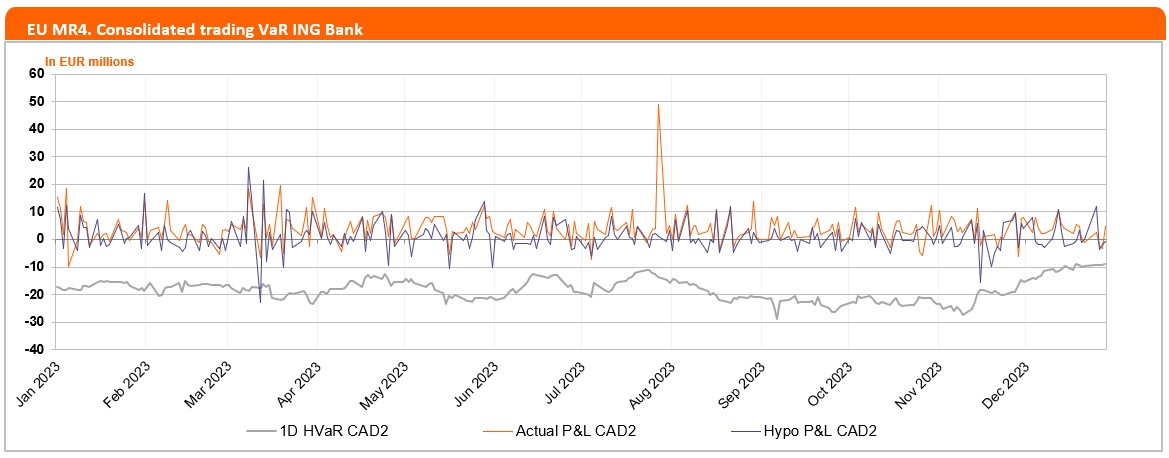
The risk figures in the above backtesting graph and in the table below relate to all trading books for which
the internal model approach is applied, i.e. all trading books, including credit exposure management books.
1d VaR for Internal Model Approach trading portfolios | ||||||||
in € million | Minimum | Maximum | Average | Year end | ||||
2023 | 2022 | 2023 | 2022 | 2023 | 2022 | 2023 | 2022 | |
Interest rate 1 | 6 | 1 | 23 | 17 | 15 | 9 | 8 | 13 |
Equity and commodity | 2 | 2 | 4 | 7 | 3 | 3 | 2 | 2 |
Foreign exchange | 1 | 1 | 8 | 22 | 3 | 4 | 2 | 3 |
Credit spread | 2 | 1 | 10 | 15 | 5 | 4 | 5 | 1 |
Diversification 2 | -8 | -9 | -8 | -5 | ||||
Total VaR 2 | 9 | 5 | 29 | 22 | 18 | 12 | 9 | 14 |
1For calculation of HVaR per risk class the full valuation is performed according to HVaR methodology using a set of scenario changes for the risk factors for the particular risk class, while risk factors for all other risk classes are kept unchanged. 2The total HVaR for the columns Minimum and Maximum cannot be calculated by taking the sum of the individual components since the minimum/maximum observations for both the individual markets as well as for total HVaR may occur on different dates. Therefore, diversification is not calculated for the minimum and maximum categories. | ||||||||
Average 1D/10D HVaR, 10D SVaR and IRC over 2023 has increased compared to 2022. The capital increase is
driven by an increase in market volatility following the US bank collapse from March 2023. The overall
average has increased in 2023, especially for interest rate which increased due to the US banking crisis. The
year end 1D HVaR has decreased from €14 million in 2022 to €9 million at period end of 2023, due to low
positions at year-end of 2023.
ING doesn’t calculate comprehensive risk capital charge and therefore it appears as N/A in the table below.
EU MR3: Internal Model Approach values for trading portfolios | ||
in € million | 2023 | 2022 |
VaR (10 day 99%) | ||
1 Maximum value | 84 | 79 |
2 Average value | 53 | 37 |
3 Minimum value | 25 | 15 |
4 Period end | 25 | 42 |
Stressed VaR (10 day 99%) | ||
5 Maximum value | 116 | 147 |
6 Average value | 82 | 77 |
7 Minimum value | 57 | 47 |
8 Period end | 69 | 65 |
Incremental Risk Charge (99.9%) | ||
9 Maximum value | 304 | 270 |
10 Average value | 151 | 113 |
11 Minimum value | 48 | 34 |
12 Period end | 108 | 76 |
Comprehensive Risk capital charge (99.9%) | ||
13 Maximum value | n/a | n/a |
14 Average value | n/a | n/a |
15 Minimum value | n/a | n/a |
16 Period end | n/a | n/a |
Regulatory capital
According to the Capital Requirements Regulation (CRR/CRD IV), regulatory capital (own funds requirements)
for market risk can be calculated using the standardised approach or an internal model approach. ING
received regulatory approval to use an internal model to determine the regulatory capital for the market
risk in all trading books of ING. Market risk capital of trading books is calculated according to the CRR, using
internal HVaR, SVaR, and IRC models, where diversification is taken into account. Capital for foreign
exchange risk from the banking books and for collective investment undertakings (CIUs) exposures in trading
ING Group Annual Report 2023 on Form 20-F 204
books are calculated using the standardised approach with fixed risk weights. ING does not have a
correlation trading portfolio or any other securitisations in the trading book.
Standardised approach
EU MR1: Market risk under Standardised Approach | ||
in € million | 2023 | 2022 |
RWA | RWA | |
Outright products | ||
1 Interest rate risk (general and specific) | 40 | 10 |
2 Equity risk (general and specific) | ||
3 Foreign exchange risk | 4,811 | 5,332 |
4 Commodity risk | ||
Options | ||
5 Simplified approach | ||
6 Delta-plus method | ||
7 Scenario approach | ||
8 Securitization (specific risk) | ||
9 Total | 4,851 | 5,342 |
The MRWA under standardised approach have decreased compared to 2023. In 2023, MRWA is calculated
for FX exposures, in line with the new CRR standardised approach that was introduced in 2022.
Internal model approach
Market risk regulatory capital has increased during 2023 compared to 2022. This mainly reflects higher
interest rate positions during 2023.
EU MR2-A: Market risk under Internal Model Approach | |||||
in € million | 2023 | 2022 | |||
RWA | Total own funds requirements | RWA | Total own funds requirements | ||
1 | VaR (higher of values a and b) | 2,508 | 201 | 2,732 | 219 |
(a) | Previous day’s VaR (VaRt-1) | 26 | 49 | ||
(b) | Multiplication factor (mc) x average of previous 60 working days (VaRavg) | 201 | 219 | ||
2 | SVaR (higher of values a and b) | 4,385 | 351 | 3,427 | 274 |
(a) | Latest available SVaR (SVaRt-1)) | 75 | 70 | ||
(b) | Multiplication factor (ms) x average of previous 60 working days (sVaRavg) | 351 | 274 | ||
3 | IRC (higher of values a and b) | 1,746 | 140 | 1,934 | 155 |
(a) | Most recent IRC measure | 108 | 76 | ||
(b) | 12 weeks average IRC measure | 140 | 155 | ||
4 | Comprehensive risk measure (higher of values a, b and c) | ||||
(a) | Most recent risk measure of comprehensive risk measure | ||||
(b) | 12 weeks average of comprehensive risk measure | ||||
(c) | Comprehensive risk measure - Floor | ||||
5 | Other | 810 | 65 | 516 | 41 |
6 | Total | 9,449 | 756 | 8,609 | 689 |
As part of the risk monitoring framework, TRM actively monitors the sensitivities of the trading portfolios.
Sensitivities measure the impact of movements in individual market risk factors (foreign exchange rates,
interest rates, credit spreads, equity and commodity prices) on profit and loss results of the trading
positions and portfolios.
The following tables show the five largest trading positions in terms of sensitivities to foreign exchange,
interest rate and credit spread risk factor movements. These largest exposures also reflect concentrations of
risk in FX risk per currency, interest rate risk per currency, and credit spread risk per country, rating and
sector. Due to the nature of the trading portfolios, positions in the portfolios can change significantly from
day to day, and sensitivities of the portfolios can change daily accordingly.
ING Group Annual Report 2023 on Form 20-F 205
Most important foreign exchange year-end trading positions (*) | |||
in € million | 2023 | 2022 | |
Foreign exchange | Foreign exchange | ||
Japanese Yen | US Dollar | - | |
Taiwan Dollar | - | Romanian Leu | |
Romanian Leu | Japanese Yen | ||
Chinese Yuan | Chinese Yuan | ||
Hong Kong Dollar | - | South Korean Won | |
Most important interest rate and credit spread sensitivities at year-end (*) | |||
in € thousand | 2023 | 2022 | |
Interest Rate (BPV) 1 | Interest Rate (BPV) 1 | ||
Euro | - | Euro | - |
Czech koruna | British Pound | - | |
Korean Won | - | US Dollar | - |
US Dollar | - | Taiwan Dollar | |
British Pound | - | Japanese Yen | |
Credit Spread (CSO1) 2 | Credit Spread (CSO1) 2 | ||
Germany | Netherlands | ||
Netherlands | United States | ||
Korea | - | Japan | |
Japan | France | ||
United Kingdom | Germany | ||
1Basis point value (BPV) measures the impact on value of a one basis point increase in interest rates. 2Credit Spread Sensitivity (CS01) measures the impact on value of a one basis point increase in credit spreads. Exposures to supranational institutions are not assigned to a specific country. | |||
Credit spread sensitivities per risk class and sector at year-end (*) | ||||
2023 | 2022 | |||
in € thousand | Corporate | Financial Institutions | Corporate | Financial Institutions |
Credit Spread (CSO1) 1 | ||||
Risk classes | ||||
1 (AAA) | - | |||
2–4 (AA) | - | - | ||
5–7 (A) | - | |||
8–10 (BBB) | - | |||
11–13 (BB) | - | |||
14–16 (B) | - | - | ||
17–22 (CCC and NPL) | - | - | - | |
Not rated | ||||
Total | - | |||
1Credit Spread Sensitivity (CS01) measures the impact on value of a 1 basis point increase in credit spreads. | ||||
ING Group Annual Report 2023 on Form 20-F 206
Introduction (*)
Funding and liquidity (F&L) risk is the risk that ING or one of its subsidiaries cannot meet their financial
liabilities upon their maturity date at a reasonable cost and in a timely manner. ING incorporates funding
and liquidity risk management in its business strategy, and has established a funding and liquidity risk
framework to manage these risks within predefined boundaries.
A high-level overview of the F&L framework is provided in the next figure.
Governance (*)
Funding and liquidity risk management within ING falls under the supervision of the ALCO Bank function,
which approves the funding and liquidity risk appetite and subsequently cascades it throughout the
organisation. ALCO Bank has delegated the responsibilities of the Internal Capital and Liquidity Adequacy
Assessment Process (ICLAAP) and documents, as per the ICLAAP framework of ING, to the ICLAAP
Committee. The ICLAAP Committee therefore focuses on technical liquidity documents and oversees
business processes and deliverables concerning the Internal Liquidity Adequacy Assessment Process
(ILAAP). The EB, MBB, and staff departments from the CRO and CFO domains, as well as Group Treasury,
have oversight of, and are responsible for, managing funding and liquidity risks.
ING’s funding and liquidity risk governance is based on the three-lines-of-defence structure. This sets a clear
division of responsibilities as well as an independent risk control challenge process. Group Treasury and the
business lines have the first-line-of-defence functions, which include management of ING’s (regulatory)
liquidity and funding position, maintaining access to the professional funding markets, and managing the
liquidity buffer. Financial Risk, as the second line of defence, is responsible for developing and maintaining
ING’s policies, standards and guidelines on F&L risk management, as well as for setting the F&L risk appetite
through stress testing and other risk measurement activities. The Finance function is responsible for
management information and regulatory reporting related to funding and liquidity risk management. As
the third line of defence, Corporate Audit Services is responsible for independently assessing the design,
effectiveness, and implementation of the Funding & Liquidity framework.
 |
Funding and liquidity management strategy and objectives (*)
The main objective of ING’s funding and liquidity risk management is to maintain sufficient liquidity to fund
the commercial activities of ING, both under normal and stressed market circumstances across various
locations, currencies, and tenors.
ING’s funding consists mainly of retail and corporate deposits contributing around 50 percent and 25
percent of total funding, respectively. These funding sources provide a relatively stable funding base. The
remainder of the required funding is attracted primarily through a combination of long-term and short-term
ING Group Annual Report 2023 on Form 20-F 207
professional funding. Group Treasury manages the professional funding in line with the F&L risk appetite,
with the aim of ensuring a sufficiently diversified and stable funding base.
Funding mix1 | ||
2023 | 2022 | |
Funding type | ||
Customer deposits (retail) | 52% | 51% |
Customer deposits (corporate) | 22% | 23% |
Lending/repurchase agreements | 7% | 6% |
Interbank | 2% | 6% |
CD/CP | 5% | 3% |
Long-term senior debt | 10% | 8% |
Subordinated debt | 2% | 2% |
Total | 100% | 100% |
1 Liabilities excluding trading securities and IFRS equity. | ||
ING Group long-term debt maturity profile by currency at year-end 2023 | ||||||||
in € billion (nominal amounts) | 2024 | 2025 | 2026 | 2027 | 2028 | 2029 | Beyond 2030 | Total |
Currency | ||||||||
EUR | 1.3 | 6.8 | 9.1 | 6.9 | 8.5 | 9.8 | 25.6 | 68.2 |
USD | 0.9 | 0.4 | 3.7 | 4.6 | 3.1 | 1.2 | 4.7 | 18.5 |
Other | 1.2 | 1.3 | 2.6 | 0.3 | 1.6 | 0.9 | 2.9 | 10.8 |
Total | 3.4 | 8.5 | 15.4 | 11.8 | 13.3 | 11.8 | 33.3 | 97.4 |
ING Group long-term debt maturity profile by currency at year-end 2022 | ||||||||
in € billion (nominal amounts) | 2023 | 2024 | 2025 | 2026 | 2027 | 2028 | Beyond 2029 | Total |
Currency | ||||||||
EUR | 4.8 | 1.2 | 6.9 | 5.4 | 5.7 | 8.5 | 28.9 | 61.4 |
USD | 2.8 | 1.0 | 0.4 | 3.8 | 3.1 | 3.7 | 4.5 | 19.2 |
Other | 1.2 | 1.3 | 1.3 | 2.2 | 0.4 | 1.1 | 1.8 | 9.2 |
Total | 8.8 | 3.4 | 8.6 | 11.3 | 9.2 | 13.3 | 35.2 | 89.9 |
ING identifies key drivers of short-term and future liquidity and funding needs on an ongoing basis through
the periodic risk identification process. Taking into consideration the identified risk drivers, ING regularly
assesses its current and future liquidity adequacy and, if deemed necessary, takes action to further improve
ING’s liquidity position and maintain sufficient counterbalancing capacity. A liquidity adequacy statement is
formulated on a quarterly basis to substantiate and reflect the management view on the current funding
and liquidity position as well as the potential future challenges. The quarterly liquidity adequacy statement
is an important part of ING’s ILAAP process.
Additionally, ING completes ad-hoc funding and liquidity assessments if deemed necessary. Following the
banking turmoil in March 2023, ING completed a lessons-learned deep-dive. This deep-dive included peer
and internal analysis of deposit structures and liquidity buffers, and a review of the influence of mobile
banking apps and social media on financial institutions. The F&L risk appetite subsequently incorporated
elements of this analysis, as well as the impacts of quantitative tightening, TLTRO III redemptions, increased
competition for savings in the higher-interest-rate-environment and potentially higher deposit outflows in
certain countries, in the 2023 review.
ING assesses its F&L adequacy through three lenses – stress, economic and normative:
•Through the stress lens, ING evaluates its ability to withstand periods of prolonged F&L stress for both
normative and economic requirements or limits under idiosyncratic, market-related, a combination of
idiosyncratic and market-related and climate risk scenarios, which lead to customer deposit outflows,
deterioration of access to funding markets, and lower liquidity value of counterbalancing capacity.
•Through the economic lens, ING assesses the extent to which its customers, professional counterparties
and investors are comfortable to provide deposits and funding in the tenors, currencies, and instruments
necessary to sustainably fund the business (intraday, short-term and long-term) in a going-concern
situation.
•Through the normative lens, ING ascertains that the bank is in the position to meet current and future
home and host regulatory requirements.
For each lens, ING has established a related set of risk appetite statements, which define ING’s risk appetite
commensurate with the principles of liquidity adequacy. These risk appetite statements are summarised in
the following illustration:
ING Group Annual Report 2023 on Form 20-F 208
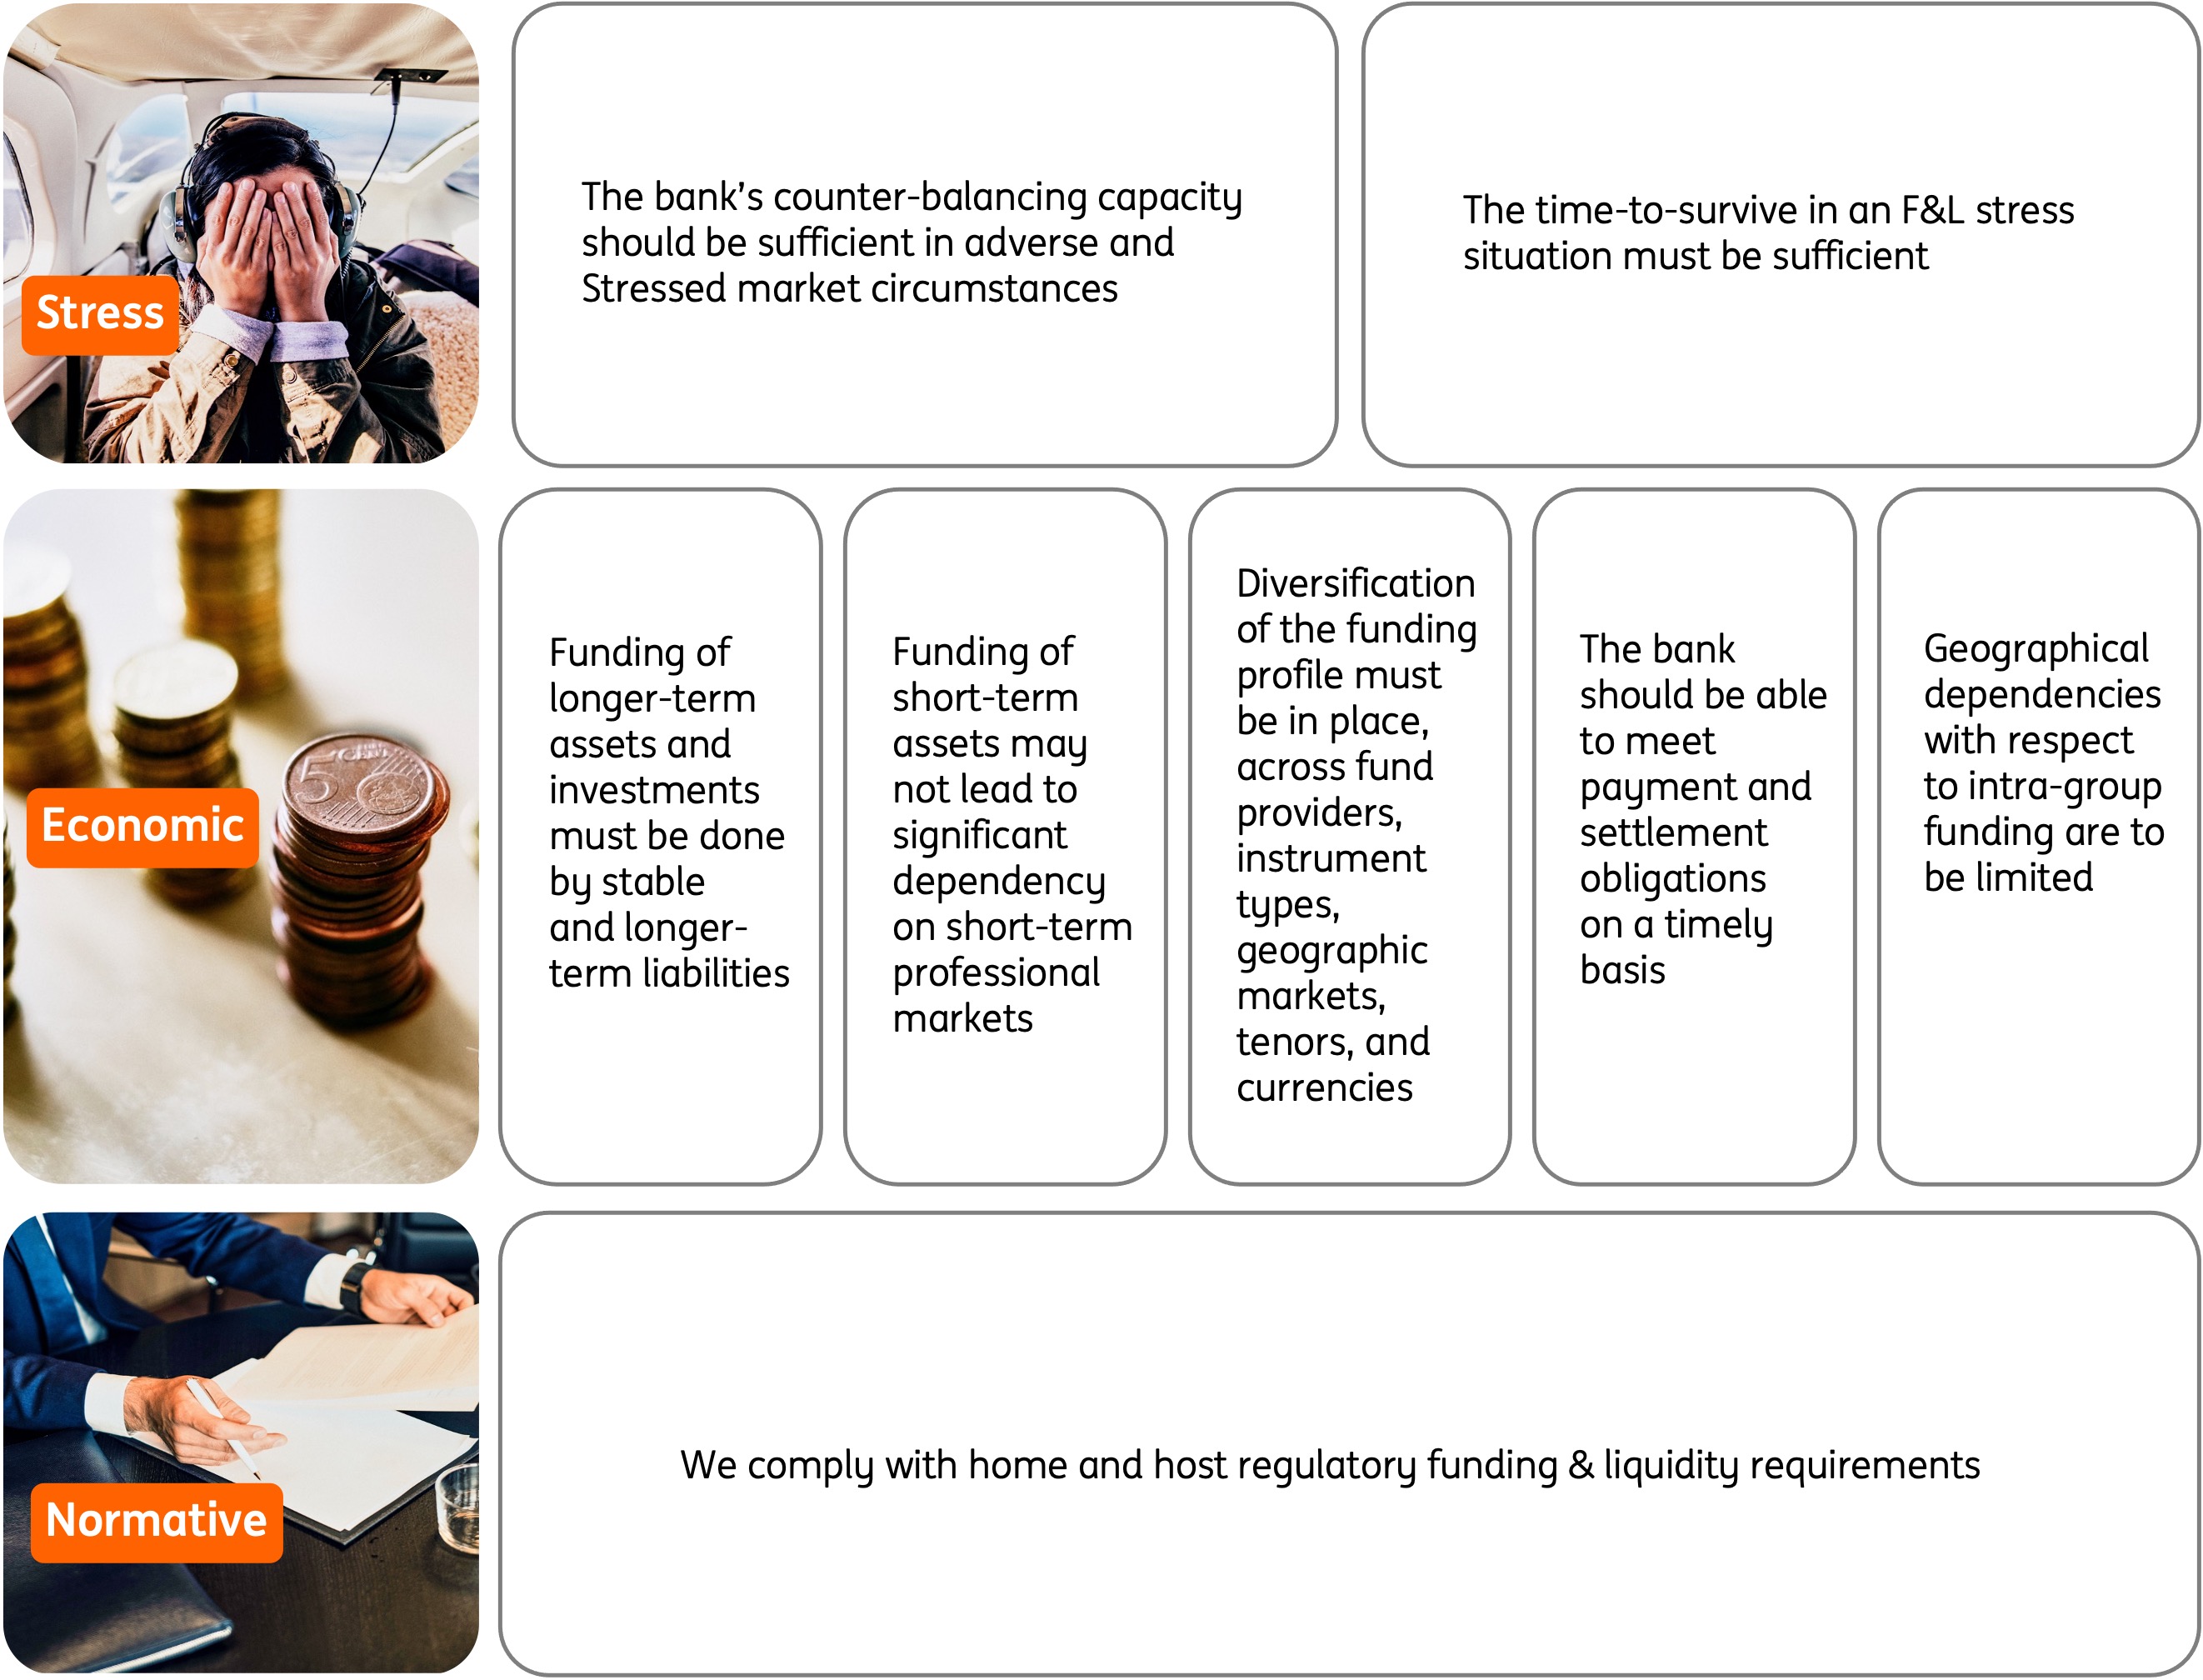 |
The F&L risk appetite statements are translated into a number of metrics with appropriate boundaries and
instruments, which are used to regularly measure and manage ING’s funding and liquidity risk. The risk
appetite with respect to the stress lens aims to have sufficient counterbalancing capacity under various
internally defined stress scenarios. Regarding the economic perspective, an internally defined stable funding
to loans (SFtL) ratio and stable funding surplus metric (supplemented by other metrics) is used to stimulate
a diversified funding base and to prevent overreliance on professional funding. Finally, the liquidity coverage
ratio (LCR) and the net stable funding ratio (NSFR) regulatory metrics are monitored in terms of both ING’s
risk appetite and normative requirements.
The macroeconomic and market environment are also important considerations in ING’s funding and
liquidity framework. The macroeconomic environment comprises various exogenous factors over which ING
has no control, but which may have a material impact on ING’s F&L position. The main macroeconomic
factors analysed on a regular basis include:
•Performance of global and local economic performance e.g. shifts in GDP, inflation rates, unemployment
rates, and public deficit/surplus;
•Developments and risks arising from geopolitical tensions and related trends;
•Monetary policy with a focus on the alternative monetary measures employed by central banks in
recent years as a result of the global energy crisis and the recent period of high inflation;
•Regulatory requirements; e.g. understanding the changing regulatory landscape as well as the impact of
ING’s actions on existing regulatory boundaries.
The strategic ambitions of ING, together with the design and execution of the funding plan, are assessed
under both current and projected market conditions. An emphasis is placed on understanding overall
market trends and developments, credit rating changes, and peer comparisons.
Liquidity stress-testing (*)
Funding and liquidity stress-testing forms part of the overall F&L framework. It allows ING to examine the
effects of exceptional but plausible future events on ING’s funding and liquidity position. It also provides
insight into which entities, business lines or portfolios are vulnerable to which types of risk drivers or
scenarios.
The stress-testing framework encompasses the funding and liquidity risks of the consolidated balance sheet
of ING Group, including all entities, business lines as well as on-, and off-balance-sheet positions. The net
liquidity position (NLP) is the main stress-testing measure and is measured at different time buckets.
The stress-testing framework considers idiosyncratic, market-wide, combined (idiosyncratic and market-
wide), and climate and environmental stress scenarios. The design of the framework is based on empirical
evidence supplemented by expert judgement. The framework can be extended to additional ad-hoc
scenarios. For example, it can be used as input for firm-wide stress testing and reverse stress testing.
Outcomes of the stress tests are considered in the key aspects of ING’s F&L risk framework and F&L risk
management, including:
•Risk Appetite Framework (through risk appetite statements);
•Risk identification and assessment;
•Monitoring of the liquidity and funding position;
•Business actions (if needed);
•Contingency funding plan;
ING Group Annual Report 2023 on Form 20-F 209
•Early-warning indicators.
The funding and liquidity stress-testing framework is also subject to regular internal validation by model
validation.
In line with supervisory expectations, ING’s liquidity position is stress tested on at least a monthly basis
using scenarios that form part of the F&L risk appetite statement. The results of all internal stress scenarios
are monitored and assessed on a regular basis. In addition, ad-hoc scenarios based on current economic
and market developments are run to determine their potential impacts on the funding and liquidity position
of ING. In 2023, this included stress test scenarios dedicated to the impact of rapid deposit outflows on the
bank, as well as a shutdown of short and long-term funding markets. The internal stress scenarios also serve
as input in the decision on additional contingency measures.
Contingent F&L risks are addressed in the contingency capital and funding plan with a focus on early-
warning indicators as well as organisation and planning of liquidity management in times of stress. The
contingency funding measures are developed in conjunction with the ING recovery plan and are reviewed
and tested on a regular basis
ING Group Annual Report 2023 on Form 20-F 210
Environmental, social and governance risk
Introduction
Environmental, social and governance (ESG) risk is not identified as an independent risk category/ risk type.
Rather, it is a set of drivers affecting the likelihood and severity of existing risk categories/ risk types. ESG risk
is an overarching set of risk drivers affecting:
•Financial risks: solvency risk, credit risk, market risk, funding & liquidity risk;
•Non-financial risks: operational risk, IT risk, reputational/litigation risk, compliance risk;
•Other overarching risks: model risk and business risk.
ESG risk is defined as any negative financial and/or non-financial impact on ING due to the present or future
impacts from ESG factors on and stemming from ING’s own operations – as well as its business activities as
a company, its counterparties, and any sourced processes. The ESG risk definition considers:
•ESG risk with regards to own operations: The risk of any negative financial and/or non-financial impact
due to an ESG factor causing damage to ING’s infrastructure, or due to an adverse reputational impact
resulting from non-compliance with ING’s commitments and ESG-related laws, regulations and
disclosures.
•ESG risk with regards to business activities: The risk of any negative financial and/or non-financial impact
due to an ESG factor causing damage to ING’s business activities (for example from lending to
counterparties, investment exposures, funding activities and sourcing processes).
ESG factors are defined as environmental, social or governance matters that may have a positive or
negative impact on the financial performance or solvency of an entity, sovereign or individuals.
•Environmental factors are related to the quality and functioning of the natural environment and of
natural systems, and include factors such as climate change, biodiversity and ecosystems, water and
marine resources, resource use and circular economy, and pollution. Environmental factors are defined
as environmental matters that may have a positive or negative impact on the financial performance or
solvency of an entity, sovereign or individual.
•Social factors are related to the rights, well-being and interests of people and communities, and include
factors such as (in)equality, health, employee empowerment, diversity and inclusion, employee and
customer health, safety and protection, inclusiveness, labour relations, human rights, workplace health
and safety, human capital and communities.
•Governance factors cover corporate governance practices, including executive leadership, executive
compensation, audits, internal controls, sound tax practices, board independence, shareholder rights,
ethical considerations, anti-corruption and bribery, sound risk management structures, organisation and
functioning of the management body, transparency with regards to disclosures of information rules and
practices and also the way in which companies or entities include environmental and social factors in
their policies and procedures.
Within environmental risks a further distinction is made between physical and transition risk.
•Physical risks refer to any negative financial and/or non-financial impact due to the physical effects of
environmental factors. Such physical effects include:
•Acute physical effects, which arise from:
•Climate-related (weather-related) hazards such as storms, floods, fires or heatwaves.
•Other environmental hazards related to biodiversity and ecosystems, water and marine resources,
resource use and circular economy and pollution, that may damage production facilities and
disrupt value chains.
•Chronic physical effects, which arise from longer-term trends (progressive shifts), such as
temperature changes, rising sea levels, reduced water availability, biodiversity loss and changes in
land and soil productivity.
•Transition risks refer to any negative financial and/or non-financial impact due to the effect of the
transition to a net-zero and more environmentally sustainable economy. The transition includes:
•Climate and environment related policy changes;
•Technological changes;
•Market sentiment and demand changes.
Governance
The ad hoc ESG committee is responsible for supervising ING’s ESG direction, endorsing and monitoring
progress, and advising the MBB on dilemmas. The ESG Sounding Board, comprised of senior leaders, guides
the development and implementation of ESG topics as well as reporting on progress. Further details on ESG
risk governance are provided in the section below.
ESG Risk Committee (ERC)
The ERC is a standing committee at ING involved in matters related to ESG risk. It is the primary oversight
committee for ESG risk matters such as ESG risk methodologies, ESG risk internal and external reporting, the
ESG risk framework, and the manner in which we address regulatory requirements related to ESG risk. The
ERC oversees the management of ESG risk for ING. The committee also facilitates cross-functional alignment
and decision-making on material operational issues (for risk types on which ESG risk has a material impact).
The ERC is established as a technical board, and is serving MBB and/or MBB delegated committees
(depending on the topic) as support in decision-making, and ensures that ESG risk related matters discussed
at the SB are executed and delivered on.
ING Group Annual Report 2023 on Form 20-F 211
The MBB delegated committees involved are the Global Credit and Trading Policy Committee (GCTP), Bank
Non-Financial Risk Committee (BNFRC), Model Risk Management Committee (MoRMC), Asset and Liability
Committee (ALCO), and Global Credit Committee Transaction Approvals (GCC- TA).
ESG Risk department
The ESG Risk department is a function that is part of ING's second line of defence. The head of ESG Risk
reports to the head of Integrated Risk, reporting directly to ING’s Chief Risk Officer (CRO). The ESG Risk
department, under the leadership of the head of ESG Risk, is responsible for adapting ING’s risk
management framework to account for ESG risk. The ESG Risk department challenges and provides
oversight on the implementation of ESG risk practices by the first line of defence.
The ESG Risk department is responsible for:
•Maintaining the ESG risk framework and related policies and mandatory instructions;
•Addressing the requirements of ESG risk regulations and supervisory guidance, such as the European
Central Bank's (ECB) guide on climate-related and environmental (C&E) risks;
•Setting ESG risk appetite;
•Identifying and assessing ESG risk;
•Monitoring and reporting ING’s ESG risk profile.
Environmental and social risk (ESR) team
The environmental and social risk (ESR) team is a Wholesale Banking risk function that's part of ING's second
line of defence (the first line being the business itself). The ESR team performs an advisory role to support
the deal principals, senior credit officers, and approval authorities on individual transactions/engagements.
The degree of the ESR team engagement in transactions is dependent upon (i) the risk profile of the client,
project or business engagement, (ii) ING’s exposure, and (iii) the risks screened. In some locations, an ESR
delegated adviser may be appointed if mutually agreed by the head of ESR and regional head. Such a role
would support the senior credit officer (SCO), who would be responsible for ESR in the region.
The ESR function encompasses the following activities:
•Create and maintain policies for sensitive industry sectors;
•Assess transactions for environmental and social risk;
•Monitor high-risk clients to assess compliance with sustainability criteria;
•Spread ESR awareness throughout ING;
•Participate in European and global advisory groups (e.g. OECD advisory group, steering committee to the
Equator Principles, Thun Group of Banks) to help bring all banks to the same high standard.
Managing ESG risk
The ESG risk framework assists in managing ESG risk effectively through the application of the risk
management process at varying levels of the organisation. The risk management cycle describes the
processes by which ING can identify, assess, measure, mitigate and monitor ESG risk integrated within the
existing risk types.
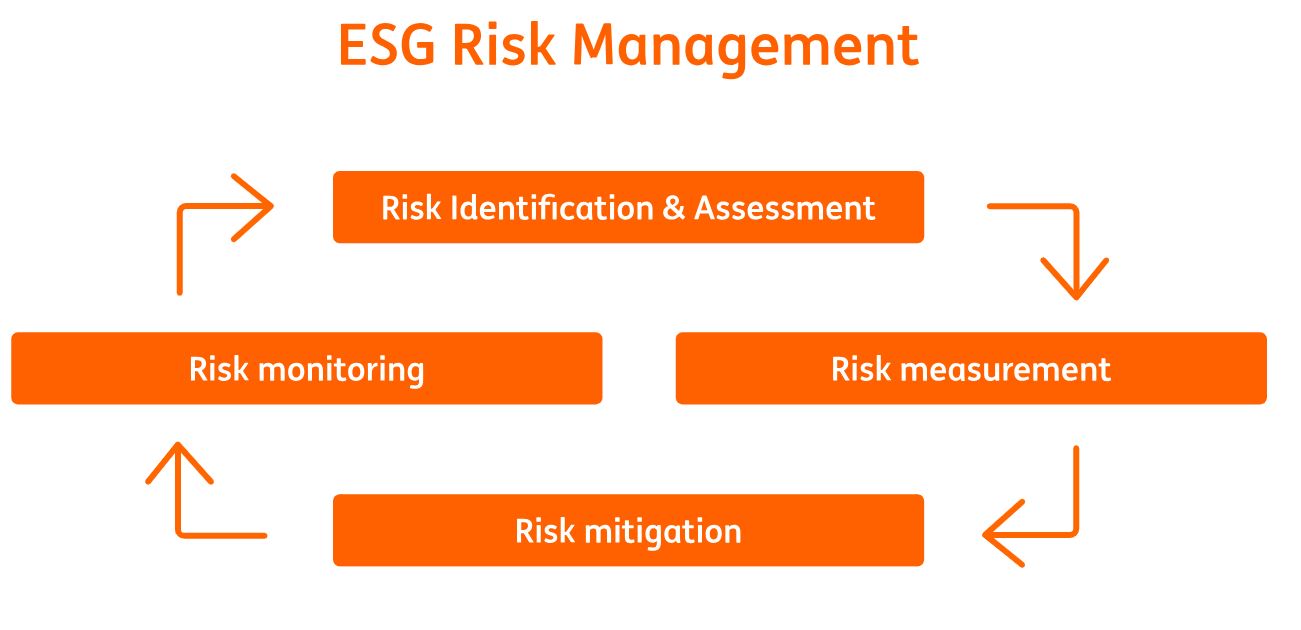
ESG factors (the drivers of ESG risk) can lead to a negative financial and/or non-financial impact through a
variety of transmission channels. Transmission channels refer to the causal chains that explain how the
various risk drivers impact institutions through their own operations or business activities (see the figure
below).
ING Group Annual Report 2023 on Form 20-F 212
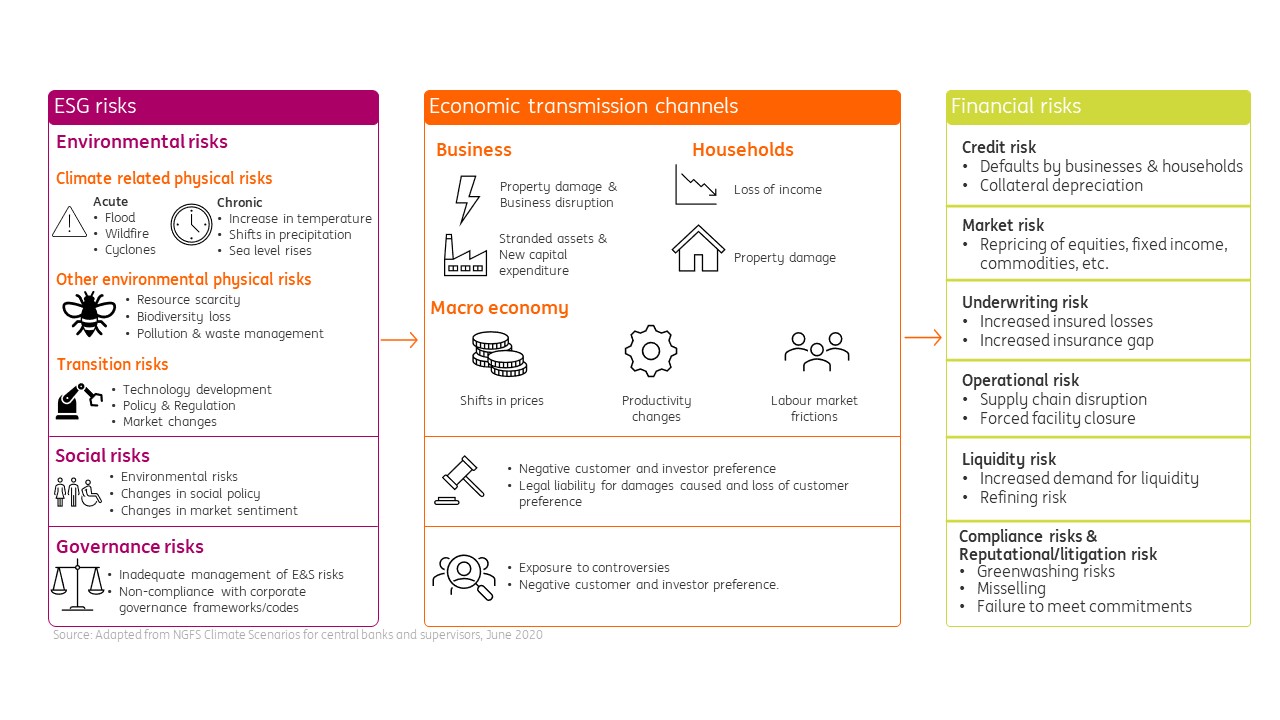
Risk identification
Managing ESG risks covers both physical risks (e.g. extreme weather events, soil degradation) and transition
risks (e.g. policy changes, shifts in market sentiment and consumer demand). The potential impacts that
physical and transition risks could have on households, businesses as well as on the macroeconomy can
translate into a range of financial risks for ING. The ESG risks can materialise through defaults of businesses
and households, increased volatility in equity and commodity markets, disruptions to banks' and customers'
operations, and litigation procedures. ING has identified the physical and transition risk transmission
channels for credit risk (for our Wholesale Banking, Business Banking, and mortgages portfolios separately),
market risk, operational risk, underwriting risk, compliance risk and liquidity risk.
Furthermore, the outcome of ING’s bank-wide risk identification and assessment process indicates that
climate risk is an emerging risk considering both its likelihood and impact. That means it has the potential to
significantly affect our performance but its impact on the organisation is more difficult to assess than other
risk drivers.
Risk measurement
ING measures its exposure to environmental risk by assessing and measuring risks through risk
quantification methodologies. The methodologies take into account qualitative and quantitative criteria and
different time horizons (short, medium and long-term). The definitions for short, medium and long-term
depend on the climate risk (physical or transition risk), the existing risk type (credit, market, operational,
compliance and liquidity) and the portfolio under consideration.
Quantification approaches for our Business Banking and Wholesale Banking portfolios include:
•Exposures towards companies excluded from EU Paris-aligned benchmarks;
•Exposures to the top-20 most carbon-intensive firms.
Quantification approaches for our immovable property portfolio include:
•Mapping of collateral values to physical risk hazards;
•Transition risk given the EPC label distribution of the portfolio.
Using various quantification approaches ING is able to identify and assess our material Environmental risks.
Different quantification approaches have been developed for the different business segments
Risk mitigation
The mitigation of the identified risks can be performed through several risk mitigating strategies, such as
reducing risk levels, avoiding risk, accepting risk or transferring the risk. The measures are embedded as part
of the updates of the existing policies and procedures in the different risk categories / risk types to mitigate
material ESG risk. Mitigation activities can be performed at a portfolio, client or transaction level and include,
but are not limited to:
•Engaging with high ESG risk counterparties to understand and support their mitigation plans. For
instance, the conditions that apply to loans based on the ESR outcome can play an important role in
helping clients improve their environmental and social performance, as well as ensuring their continued
compliance with our ESR policy;
•Setting the risk appetite statement (RAS) to limit the level of acceptable risks with consequence
management attached;
•Ensuring appropriate business continuity plans and insurance are in place to reduce the impact of more
frequent and severe weather events for both ING's own operations and business activities, thus reducing
the inherent risk.
Risk appetite
We used the outcomes of the C&E risk heatmap exercise to introduce climate risk elements in the credit risk
appetite from 2022 onwards. In 2023, we continued with the monitoring mechanism which was established
ING Group Annual Report 2023 on Form 20-F 213
for Wholesale Banking (WB) at the start of 2022, which limits growth of sub-sectors with a higher exposure
to C&E risks, while allowing for growth within the overall sector limit. In July 2022, this mechanism became
binding for WB sectors. For Business Banking (BB) sectors, a similar approach was used and the BB credit risk
appetite has been in a monitoring period since 2022. In addition, climate risk has been incorporated into the
2023 market risk banking book risk appetite, with the introduction of sensitivity metrics per climate risk
category.
Stress testing
ING’s climate stress-testing model leverages upon data gathered and models developed for the ECB Climate
Risk Stress Test, enhanced with internal climate risk stress test analysis. The risk coverage of the internal
climate risk stress test is the full credit portfolio reflecting both flood and transition risk. For transition risk, a
data-driven approach is developed to reflect the increase in the carbon price and therefore energy costs.
The analysis focuses on (i) energy performance certificate (EPC) level for mortgages and corporates secured
by real estate and (ii) NACE sector level for corporates not secured by real estate. For market risk, both the
banking and trading book are included. Other risks are covered as well, among others non-financial risk,
issuance risk, business risk, and model risk. The climate stress test shows a manageable impact on ING from
a financial perspective in the short-term as sufficient contingency measures are available to mitigate the
impact. The contractual maturity of ING’s financial assets including loans to business customers (Wholesale
Banking and Business Banking) is mostly short-term, except for loans to customers covered by immovable
property (Retail Banking residential mortgages). We have not analysed the potential impact for the medium
and long-term on ING’s capital position in ING’s climate stress test.
In addition, ING has developed the climate risk stress testing global procedure for ICAAP purposes to
formally integrate climate risk stress testing within the ING Group ICAAP stress-testing framework. Within
this document, guidance is provided on the minimum standards that need to be applied when climate risk
stress tests are developed, implemented, and executed. With these minimum standards, the ING Group
stress test framework has been extended with explicit requirements for ESG risk analyses. The document
currently focuses on physical risk and transition risk as these can be properly quantified within stress
testing. We aim to include other ESG risks later, and the same applies for the reflection of regulatory
requirements as this topic is still evolving
Risk monitoring
ESG risk information is reported on a periodic (at minimum annual) basis, to measure and monitor risk
exposure against the risk appetite and tolerance. Climate risk appetite is distributed on a monthly basis to
the MBB and senior management and reported quarterly via the management report to the GCTP. Physical
and transition risk results are reported semi-annually in ING Group’s additional pillar III report. The ESG risk
dashboard is reported to the MBB semi-annually.
Managing ESG risk in practice
ING’s ESR framework helps us make informed choices about how, where and who we do business with. In
2023, the ESR framework was updated to reflect several (minor) amendments following the last
comprehensive review that took place in June 2021. Among the updates are a clarification on the self-
declaration approach used for Business Banking and a new restriction on dedicated upstream oil and gas
financing. The next comprehensive review of the ESR framework will take place in 2024. For more
information about ESR at ING, please refer to our corporate website.
The ESR framework includes standards and best practice guidance for ESR-sensitive sectors. It includes
explicit restrictions on activities not in line with ING’s values and harmful to people and/or the environment,
which we do not want to finance.
The way the ESR framework is applied in practice differs per product type and segment. The most significant
potential environmental and social impacts come from large corporates within our Wholesale Banking
segment. However, mid-corporate clients and small and medium sized companies (referred to as the
Business Banking segment) undergo a (basic) screening process too. Lastly, the ESR framework minimum
requirements are also included in ING’s procurement policy and apply to the screening of suppliers of ING’s
global procurement activities.
The ESR framework is incorporated in ING’s KYC policy framework, meaning that the ESR client assessment is
part of the regular client on-boarding and review process. Next to that, the ESR framework prescribes a
dedicated ESR transaction assessment for corporate clients that helps us identify the level of risk. The
combination of the ESR client and ESR transactional assessments provide us with the total ESR outcome. If
the total ESR outcome is high risk, the transaction requires an ESR assessment and advice from the
dedicated ESR team.
While we have a robust ESR framework and made progress in enhancing the automation of the checks and
controls in the ESR assessment processes, we acknowledge that we need to improve our processes around
the ESR Framework and its implementation. We see room for improvement to further ensure adequacy and
completeness of data necessary to steer, manage, evidence, and monitor these risks at the level of
granularity needed.
Of all WB engagements in scope of the ESR framework in 2023, 84 percent were considered ESR low-risk
(2022: 84 percent), 6 percent ESR medium-risk (2022: 7 percent) and 10 percent ESR high-risk (2022: 9
percent). ESR high-risk cases require specialized advice from the global ESR team. Beyond these high-risk
cases, the ESR-team is also consulted on other types of engagements, such as trade-related requests,
medium-risk transactions and inquiries from the KYC department about the ESR client assessment.
Depending on the nature of the request, the ESR-team provides an advice on these cases too. The ESR
advice assesses the specific product offered and environmental and social impacts associated with it, the
sector, operating context and geography of the engagement and other relevant factors. Based on this in-
ING Group Annual Report 2023 on Form 20-F 214
depth research, an advice is given. The ESR advice is binding (on its conditions or its negative conclusion) to
the relevant approval mandate holder for the underlying credit risk. If the applicable mandate holder
disagrees with the ESR advice, it can be escalated to the Global Credit Committee (GCC) for a final decision.
The GCC is the only body that can overrule the ESR advice. Of the 371 ESR advices given in 2023, 50 percent
were positive, 34 percent positive subject to conditions and 16 percent negative. Conditions included in an
ESR advice could play an important role in helping clients improve their environmental and social
performance and transitioning and ensuring their continued compliance with our ESR policy.
The ESR team mainly focuses on Wholesale Banking transaction advice, including (support for) engagement
around ESR with clients, in some specific cases. In 2023, ESR visited several projects around the world as part
of the due diligence and engagement process. In addition, the team works on a continuous improvement of
the ESR framework, to cater for developments in the environmental and social space. ESR acts as a sparring
and training partner for multiple internal teams, such as risk, front-office, KYC, and other teams, so that ESR
knowledge is improved and spread.
ING Group Annual Report 2023 on Form 20-F 215
Non-financial risk
Introduction
Non-financial risk (NFR) is defined as the risk of financial loss, legal or regulatory sanctions, or reputational
damage due to inadequate or failing internal processes, people and systems, a failure to comply with laws,
regulations and standards, or external events.
Governance
The global head of NFR is responsible for developing the framework of NFR policies and standards within ING,
and for monitoring the quality of non-financial risk management in the ING entities. In addition to the global
steering provided through the framework, the bank’s Non-Financial Risk Committee (NFRC), chaired by the
Group chief risk officer, is the highest level of the non-financial risk committees within ING, and is mandated
by the MBB to opine on and approve non-financial risk matters, to monitor or verify whether appropriate
action is taken by responsible management, and endorse the non-financial risk appetite.
Non-financial risk management
Risk categories
ING categorises non-financial risks in the following areas:
•Compliance risk is the risk of ING's integrity being impaired, which can result in reputational damage,
legal or regulatory sanctions, or financial loss, due to a failure (or perceived failure) to comply with
applicable laws, regulations and standards. See more in 'Compliance risk'.
•Information (technology) risk is the risk of financial loss, regulatory sanctions or reputational damage
due to breaches of confidentiality, integrity or availability of information or a lack of information quality
within business processes and/or the supporting IT systems.
•Continuity risk is the risk of financial loss, regulatory sanctions or reputational damage due to business
disruptions (loss of people, processes, systems, data, premises).
•Control risk is the risks of financial loss, regulatory sanctions or reputational damage due to ineffective
organisational structures and governance procedures (including unclear roles and responsibilities and
inadequate reporting structure).
•Processing risk is the risk of financial loss, regulatory sanctions or reputational damage due to failed
(transaction) processing (input, execution, output) or failing process management.
•Unauthorised activity risk is the risk of financial loss, regulatory sanctions or reputational damage due to
employees performing outside the normal course of their business, intentionally giving unauthorised
approvals or overstepping their authority.
•Personal and physical security risk is the risk of financial loss, regulatory sanctions or reputational
damage due to criminal and environmental threats that might endanger the security or safety of ING
personnel at work, people in ING locations, ING assets or assets entrusted to ING, people at ING event
locations, or might have an impact on ING organisation's confidentiality, integrity or availability.
•Employment practice risk is the risk of financial loss, regulatory sanctions or reputational damage due to
acts that are inconsistent with employment, health and/or safety laws, regulations or agreements, from
payment of personal injury claims, or from diversity/discrimination events.
•Sourcing risk is the risk of financial loss, regulatory sanctions and/or reputational damage resulting from
sourced activities (both IT and non-IT, including intra-group sourcing) not staying within ING’s risk
appetite and not being executed as agreed (with captives or partners), including non-compliance with
internal or external regulations.
•Fraud is the deliberate abuse of procedures, systems, assets, data, products and/or services of ING by
those who intend to deceitfully or unlawfully benefit themselves and/or others. This definition of fraud is
specified in the following two categories of fraud:
Internal fraud: acts of fraud that involve at least one internal party performed by or in collusion with an ING
employee or agent with the consequence of financial loss, regulatory fines, litigation loss, business
disruption and/or reputational damage for ING.
External fraud: acts of fraud or scams by individuals and/or parties excluding ING staff (including
contractors), with the consequence of financial loss, regulatory fines, litigation loss, business disruption and/
or reputational damage for ING.
Measurement approach
ING uses an internal model in line with the advanced measurement approach (AMA) to determine the
regulatory and economic capital amounts necessary to cover potential losses resulting from non-financial
risks. This model calculates the non-financial risk exposure by combining a forward-looking and a backward-
looking view on non-financial risk events. ING reports the outcome of its AMA model quarterly. The CRR3
regulation (relating to new EU banking rules from the European Commission), set to come into force in
January 2025, will usher in the Standardized Approach, replacing the current AMA model. As it prepares to
implement this non-model-based formula to calculate regulatory operational risk capital, ING is re-
designing the internal model it uses for economic capital and stress testing purposes (Pillar II).
Main developments in 2023
Personal and physical security
The war in Ukraine continues to have a fundamental impact on the lives of our colleagues and their families,
and the way in which we conduct our Ukrainian operations. Yet the impact of the war on ING’s non-financial
ING Group Annual Report 2023 on Form 20-F 216
risk profile and on operational event losses continues to be limited, thanks to an extensive set of mitigating
measures ING has taken since the start of the war.
In Türkiye, the earthquake in February 2023 had a major impact on the nearly 600 ING employees and their
families working and living in the affected area, especially in and around Kahramanmaraş. Tragically, five
employees lost their lives in the disaster and four were injured. One local branch was destroyed and three
seriously damaged. The operational centre was spared, and has served as a shelter for those employees
and their families left homeless. The swift and coordinated response by local staff and our head office in
Istanbul focused primarily on supplying aid for the local ING community, but also on retrieving assets from
the affected branches. Despite serious disruption to local processes due to damaged infrastructure, the
impact to the non-financial risk profile remained limited.
Political and social developments in many societies around the globe have led to further polarisation and
protests against governmental and public institutions, impacting the security risk profile of ING Bank and its
employees. Various environmental activist groups, e.g. Extinction Rebellion, have protested at ING Bank
head office buildings and local branches in the Netherlands, calling on ING to stop financing the fossil-fuel
sector. To keep employees and clients safe, and ensure the continuation of business processes, security
controls at ING locations around the world are frequently assessed.
Cybercrime and fraud
The further digitalisation of banking services, increasing electronic exchange of information via different
consumer channels, use of and dependency on third-party vendors for services, and the implementation of
PSD2 present ongoing cybercrime resilience, fraud management, and IT-security challenges for companies
in general, and financial institutions in particular. Both the frequency and the intensity of attacks continue
to increase on a global scale. They are becoming more sophisticated too, with the use of artificial
intelligence, and the implications of ransomware attacks are a concern in the threat landscape.
The continuous enhancement of the control environment to protect from, and detect and respond to, e-
banking fraud, distributed denial-of-service (DDoS), targeted attacks, and more specific ransomware attacks
is of ING's highest priority. Based on regular scenario analysis done in ING’s first line of defence, additional
tools and controls continue to be embedded in the organisation, as part of the overall internal control
framework, and we are continuously reassessing these against existing and new threats, as well as the
changing modus operandi.
The introduction of new products and evolving threats against those services, combined with developing
technologies such as generative AI and deep fake, are continuously presenting short- and medium term
fraud management challenges. Cybercriminals are becoming more resourceful in targeting financial and
sensitive (payment/personal) data, such as customer user credentials outside the traditional banking
environment. For example, criminals can obtain sensitive payment or personal data via social forums such
as WhatsApp, dark web shops, by screen scraping user credentials, or through third-party data breaches.
In 2023, these challenges increased, with more sophisticated phishing attempts, improved social-
engineering fraud attempts, and high volumes of scams through so-called authorised push-payment frauds.
This increase in scams is a major concern for financial institutions, with often devastating consequences for
customers. While financial institutions have limited means to prevent such authorised transactions, it is a
priority to help prevent this type of fraud.
With legislation such as EBA PSD2, which requires payment service providers to establish a framework with
appropriate mitigation measures and control mechanisms, and the continuing emphasis on duty of care,
financial institutions are becoming increasingly responsible for losses incurred by clients. Institutions are
also taking on more of the burden of reclaiming these losses. Developments as seen in the UK by regulatory
changes as well as the upcoming PSD3 requirements, which amends and modernises PSD2, will impact
banks more significantly in this area, dramatically increasing banks’ exposure.
In addition, economic pressures in many of ING’s operating countries could be a factor in pushing customers
into fraudulent activity. We notice attempts, impact, and ING's increasing fraud losses in credit facilities,
often carried out with forged documentation. ING continues to strengthen its fraud resilience by partnering
with peers in the financial industry, as well as law-enforcement authorities and governments. We believe a
collaborative approach with other industries is the only way to tackle fraud effectively. ING’s global fraud
management team brings together skilled fraud-management experts from various domains, and is
responsible for making sure that ING's business and fraud strategy remains aligned on fraud threats, market
best practices, applicable law and legislation, risk appetite and operational targets.
Data risk management
Data, whether customer, financial, risk or other business – is core to ING’s purpose. Data leads to insights
and insights empower people to stay a step ahead in life, and in business. In 2023, ING’s Data Management
team worked to speed up how quickly we execute our data strategy, to ensure data quality, keep data safe
and secure, improve our data literacy, and simplify our data functions. This should enable and support
steering to right actions regarding data, including personal data protection, data security, data quality and
data ethics. Addressing emerging risks such as AI, most specifically generative AI, and societal concerns
around the ethical handling of customer data, are top priorities for ING.
Identity and access management (IAM)
IAM remains one of the focus areas of ING. It’s an important element in our control framework for
preventing and mitigating the risk of unauthorised access to IT systems, and the data processed and stored
in these systems. This is done by enforcing IAM global processes and controls, which are periodically
reviewed and tested. These processes and controls are supported by technologies, tooling, and practices
ING Group Annual Report 2023 on Form 20-F 217
managed by a dedicated IAM team in the Chief Information Security Office (CISO). The team focuses on
identifying improvements to address developments both inside and outside ING. In 2023, ING continued the
activities to improve in this area, with specific attention given to the further implementation of supporting
tooling, the standardisation and harmonisation of processes and workflows, and automation of IAM
controls. In 2023, ING identified areas for improvements, with specific attention given to the further
implementation of supporting tooling, the standardisation and harmonisation of processes and workflows,
and automation of IAM controls.
Operational resilience
Providing safe, secure and seamless services is at the heart of ING's strategy. Preventing disruptions and
ensuring a quick recovery from disruptions is an important element of that. In 2023, ING made further
progress with implementing its operational resilience framework. As part of this implementation, we are
mapping processes underlying our most critical business services. This includes the facilities, people, third-
and intragroup parties, data and technology that support those processes. These processes are then tested
against severe but plausible scenarios in an effort to identify weaknesses. This helps ING identify
opportunities to enhance its operational resilience. In addition, ING has started with the implementation of
the Digital Operational Resilience Act (DORA), which aims to further strengthen the digital operational
resilience of financial institutions.
ING Group Annual Report 2023 on Form 20-F 218
Compliance risk
Introduction
Compliance risk is defined as a threat posed to ING’s standing resulting from failure to act in line with
applicable laws and regulations, internal rules (including ING’s Orange Code and global Code of Conduct),
and/or societal expectations that apply to the bank's services and activities. A failure to adequately mitigate
compliance risk may lead to damage to ING’s reputation and/or legal/regulatory sanctions and/or financial
loss.
The mission of Compliance is to support ING in conducting its business activities in line with applicable laws
and regulations, taking into account ING’s internal code of conduct and societal expectations. Compliance
wants to drive compliance risk management by desire and design throughout the organisation, unleashing
the power of our data, risk expertise, and ING's workforce to keep the bank safe and sound, and help drive
new and sustainable ways of doing business.
Within ING, compliance risks are defined as those risks that are within the scope of the ING Compliance Risk
Catalogue. The following risk categories apply:
•Financial crime risk refers to the risks of the bank’s products and services being abused for illicit purpose
generating or disguising financial and/or economic crimes (FEC).
•Conduct risk refers to the compliance risks arising from potential or perceived misconduct by ING or its
employees towards its customers, market integrity, business partners, employees, and other
stakeholders including society at large.
•Organisational risk refers to the compliance risks arising from actual, potential or perceived flaws in the
way that ING is organised and structured including its regulatory and reporting framework.
•Data protection (personal data protection, data retention) risk refers to the personal data protection risk
of financial loss, (regulatory fines, reputational damage) due to not protecting the personal data rights of
individuals as required, and as to data retention risk, to having the records being destroyed too soon or
retained too long.
ESG-related compliance risks have been added as a new risk driver in the compliance risk catalogue. This is
taking place in close collaboration with internal stakeholders to make sure that roles and responsibilities
with regard to identifying, assessing, managing, and overseeing these risks are in line with ING's
organisation globally.
Governance
The Compliance organisation is part of ING’s second line of defence, where Group Compliance sets the
methodologies and minimum standards for the bank. Compliance for the business lines Wholesale Banking,
and Retail Banking / Rest of World together with Compliance in the Market Leaders countries and functional
lines in the countries along with relevant stakeholders from the first line of defence are responsible for the
execution of these standards, within the risk appetite set.
Compliance is tasked with instructing, advising, challenging and overseeing the first line of defence in how
they manage risks that are within the scope of the ING Compliance Risk Catalogue. Compliance also has an
active role in raising awareness (via training and communication), influencing and stimulating a sound
compliance risk culture. The risks in scope of the Compliance Risk Catalogue are outlined in the ING
Compliance Charter.
Compliance is headed by the chief compliance officer (CCO), who reports directly to the CRO. The CCO has
direct access to the Risk Committee of the Supervisory Board. The CCO and the chairperson of the Risk
Committee had regular bilateral consultations in 2023.
OneCompliance strategy
As a global bank in a fast-changing world we want to do the right thing to be safe, secure and compliant for
our customers and for society. We achieve this by living up to our OneCompliance strategy.
The OneCompliance strategy is a multi-year, global compliance strategy based on the Compliance Risk
Management Cycle, a framework that aims to help ING manage compliance risks consistently across the
organisation. In 2023, we further strengthened the operations of the Compliance Risk Management Cycle.
This resulted in improved processes around risk coverage and controls. At the same time in intuitive,
actionable and insightful management information with a global dashboard in place to take smart decisions
and keep oversight on both steering within risk appetite and on our global direction. As we operate in a
dynamic and challenging environment, we are continuously learning and improving while reaching a more
sustainable and mature level within the Compliance function.
Know your customer (KYC)
Know your customer and financial crime compliance continue to play a major role in making sure we only
engage and do business with people and entities that meet regulatory requirements. Knowing who we do
business with is vital to keeping ING safe, secure, and compliant. As part of our ongoing anti-money
laundering efforts, we continuously assess relationships with customers, and monitor and screen
transactions. It is our policy to review potentially unusual transactions and suspicious transactions and,
where applicable, report these to the relevant authorities.
We are continuously working to further strengthen the KYC processes across the bank as and where
required. This includes enhancing customer due diligence files and making structural improvements in
frameworks, processes, and systems.
ING Group Annual Report 2023 on Form 20-F 219
Global approach
ING takes a global approach in its KYC improvement activities. In 2023, we continued substituting local
technology with global technologies, completing the migration of transaction monitoring to the Global
Transaction Monitoring tooling and taking further steps in enhancing use of the global screening application.
We made further progress in migrating or moving KYC-related activities from local processing units to our
dedicated operational hubs, which offer dedicated expertise and processing capabilities. In 2023, we further
defined and refined the global way of working for the Customer Due Diligence (CDD), which enhances
effectiveness and efficiency, and aim to implement this in all processing hubs and other ING locations.
KYC policy framework
The KYC policy and related control standards (the KYC policy framework) set the minimum requirements
and control objectives for all ING entities to guard against involvement in financial crime activity. The
framework reflects relevant national and international laws, regulations, guidance documents, and
guidelines from national, European and international authorities, (supra)national risk assessments, and
industry standards. The framework is updated regularly with subsequent implementations at global scale.
Knowledge and behaviour
We believe all our people play a role in protecting our customers, the bank, and society against financial
crime and fraud. A sound risk culture requires us to act with integrity above all. We want to empower our
workforce with the skills and knowledge they need to fight financial crime, and encourage them to speak up
if they have concerns around managing financial crime risk.
As in previous years, we ran our (mandatory) training programme for KYC staff. This included continuing our
partnership with the Association of Certified Anti-Money Laundering Specialists (ACAMS), to develop and
provide tailored, certified training. The ACAMS training portfolio focuses on learning paths that provide
professional foundational skills or advanced expertise in a range of topics, including customer due diligence,
screening, transaction monitoring, and sanctions. New joiners at ING KYC departments complete a
combination of ACAMS and ING internal courses aimed at ensuring their knowledge and skills are up to
scratch. We updated our internal training programme following a yearly learning need analysis. In 2023, we
included product-specific courses on top of the training focusing on strengthening the risk-management
mindset.
Financial crime risk
Financial crime risk management aims to ensure that new and relevant financial crime trends and insights
as well as regulatory requirements are identified, tracked and actioned in a timely manner. In terms of
governance, the bank's NFRC, chaired by ING’s CRO, is the principal risk management forum where among
others, financial crime risks are discussed. This committee reviews and escalates, where appropriate, key
financial crime topics, threats and risks across ING to the Executive Board and Management Board Banking.
On KYC, the Global KYC Committee, chaired by ING's COO, is mandated by the MBB to steer, prioritise and
approve KYC-related topics undertaken across ING, and to oversee compliance with the relevant laws and
regulations and internal rules related to KYC. The day-to-day responsibility for the oversight of ING’s
compliance with our legal and regulatory obligations, in relation to financial crime risks, sits with the global
head of Financial Crime Compliance. This global head reports to ING’s chief compliance officer, with
oversight by the CRO.
We believe all our people have a key role to play in the fight against financial crime. Having a robust and
sound risk culture embedded in our day-to-day way of working is a foundational element of our financial
crime risk control environment. We define the accountabilities and responsibilities of our workforce in
accordance with the three-lines-of-defence model, considering our business, geographical and functional
structure.
As an organisation, we’re committed to meeting our legal and regulatory requirements and the standards
we also expect from ourselves. ING remains subject to (regulatory) investigations and scrutiny in certain
jurisdictions, and we’re committed to executing and implementing the identified enhancements required in
our wider Enhancement Programme (EP) and our financial crime risk framework in a sustainable way for the
longer-term.
Key risk management processes
ING strives to play its part in contributing to the safeguarding of the financial system against illicit financial
activity, in the context of heightened and changing regulatory expectations, and as financial crime risks
continue to evolve. To live up to our role as a global financial institution in combatting financial crime, we
believe it is essential to comply with anti-money laundering and counter-terrorism financing (AML/CTF) laws
and regulations, establish a reasonable and risk-based control framework to mitigate financial crime risk,
and to seek to provide useful information to relevant government agencies. We also believe it is important
to respond swiftly and proactively to new financial crime threats and techniques as well as relevant media
reporting.
To mitigate financial crime risks, we apply a framework of preventative and detective systems and controls,
underpinned by policy, procedures and related control standards across our global business in all locations
where we operate. In 2023, we remained focused on maturing our Financial Economic Crime Controls in the
context of the Enhancement Programme (EP) by continuing to strengthen our financial crime risk
management framework and supporting sustainable remediation of known issues. At the same time, we
acknowledged that the continuous maturing of the financial crime risk management framework, as well as
other developments such as regulatory and legislative changes, continued to require our attention and
commitment as the bank focused on operational effectiveness (OE). Through robust oversight and challenge
as the second line of defence, it is our goal to ensure that OE is demonstrably sustainable.
ING Group Annual Report 2023 on Form 20-F 220
In line with ING’s ambition to have a more data-driven, dynamic, and forward-looking systematic integrity
risk analysis (SIRA), in 2023 the SIRA introduced enhancements to the existing process and piloted a
proposed methodology. This will contribute to further enhanced insights into the financial crime integrity
risks ING may be exposed to. These developments improve the risk identification, reporting quality, and
management of these risks in accordance with our risk appetite across our global footprint.
Bribery and corruption
Bribery and corruption undermine business confidence and corporate integrity, hinders fair business
competition, and harms international trade. ING takes these risks seriously: bribery and corruption risks are
part of our non-financial risk framework and are in the design of our client and third-party due diligence,
and monitoring measures in our financial crime risk management framework. We have continued to
strengthen our ability to respond to bribery and corruption risks in key areas as part of our multi-year
maturity programme. This supports our zero-tolerance approach to bribery and corruption, meeting the
governance elements of our sustainability objectives.
Customer tax compliance
Compliance with customer tax-related regulations and reporting, obligations, under the Foreign Account Tax
Compliance Act (FATCA), the Common Reporting Standard (CRS), and Mandatory Disclosure Rules, aims to
ensure that ING is not involved in facilitating tax-related financial crime, such as tax evasion or aggressive
tax-avoidance schemes, on behalf of its customers. These obligations and customer tax integrity are of
utmost importance to ING. In 2023, we continued to mature its control framework and to improve the
quality of our reporting to tax authorities. We also remain proactive to legislative developments and aim at
timely preparation for new reporting obligations, such as those introduced by the 2024 Central Electronic
System of Payment Information (CESOP) regulation.
Sanctions
Russia’s invasion of Ukraine in 2022 fundamentally changed the global political landscape. It sparked a
worldwide response, with significant sanctions packages imposed against Russia and Belarus. In 2023, global
sanctions regimes have been increasingly active, creating a complex regulatory and legislative
environment. And an intensive focus on sanctions worldwide is expected to continue in coming years. This
has also led to an increasing focus of the EU, US, and other governments on the potential circumvention of
sanctions against Russia, and the roles of third countries and companies in facilitating any circumvention or
undermining the sanctions’ measures. Within the EU, there has been particular focus on the risk that some
EU-based businesses may be seeking to circumvent sanctions by exporting illicit goods, such as computer
products and electronics, to Russia via third countries. This has prompted a concerted effort by governments
to impose pressure on companies operating in these jurisdictions, and to stop the sanctions measures from
being sidestepped by targeted Russian parties.
The proliferation of sanctions has contributed to increased efforts in ensuring ING’s control framework
remains robust to mitigate against the bank’s sanctions risks. This has included applying greater scrutiny to
transactions alerted for heightened risk of non-compliance with applicable sanctions, as well as efforts
aimed at ensuring employees and customers are aware of the sanctions and potential circumvention risks.
Leveraging intelligence and internal data, work has also been completed to better understand the risks
associated with the export of illicit goods from the EU to Russia via third countries, and ING’s potential
exposure to the threat scenario.
ING’s policy generally prohibits relationships or transactions involving sanctioned persons and entities or
comprehensively sanctioned countries, territories and their governments. It sometimes also means that
ING’s risk appetite may be stricter than legal obligations, and we may choose not to support certain
customer relationships, business activities and transactions even if permitted by law. As a result of frequent
evaluation of the business from economic, strategic and risk-based perspectives, ING, with limited exception,
does not engage in business involving certain countries, including Cuba, Iran, North Korea, Sudan, Syria and
the Crimea region. ING has a policy not to enter into new relationships with clients from these countries and
processes are in place to discontinue existing relationships involving these countries.
Evolving financial crime landscape
Financial crime continues to evolve, whether through technology, new and sophisticated techniques used
by serious and organised criminals, or the results of geopolitical events. The pandemic and associated social
changes drove the unprecedented expansion of online and digital services. This in turn has prompted a
surge in technological developments and cyber-enabled financial crime. This widespread digitalisation of
the economy and artificial intelligence (AI) is leading to a reshaping of previously fixed ideas about methods
used to launder and finance terrorism. Criminal groups have been quick to adopt and misuse new
technologies, and are already harnessing the power of machine learning, AI, and anonymity-enhancing
technologies, such as virtual currencies and mixers, to commit criminal activities. Such developments also
enable criminal networks to become more agile, geographically interconnected and cohesive, using the new
tools and techniques to circumvent enhanced AML frameworks.
ING takes these threats seriously and believes in responding proactively to such developments. We invest in
new and innovative technological capabilities, and continue to enhance our cooperation with law-
enforcement agencies, industry bodies and regulators, and to develop intelligence and data-led
collaborative solutions to detect and disrupt financial crime. In this context, this may at times include
sharing information within ING to manage our financial crime risk exposure, in line with General Data
Protection Regulation requirements and local privacy laws and regulations.
Crimes against society
Society’s expectations with regard to financial institutions' accountability for safeguarding the integrity of
the financial system have also created an increasingly demanding environment. ING recognises that
ING Group Annual Report 2023 on Form 20-F 221
financial crimes have an adverse impact on individuals, communities, and the environment where they
occur. We are committed to conducting our global activities with integrity, and in line with our ethical and
social responsibilities. Geopolitical events and economic instability have contributed to rising inflation and
the cost-of-living crisis, leaving individuals and businesses vulnerable to criminal exploitation, such as
trafficking and corruption.
Labour and sexual exploitation remain the most common forms of human trafficking globally, and recent
geopolitical events will also have an impact on the nature and scale of the human trafficking threat. The
humanitarian crisis caused by Russia’s war in Ukraine has led to increased numbers of women with children
being trafficked. Mostly refugees, they are at higher risk of exploitation. Looking ahead, it is possible that
existing and future global events will lead to the migration of even more people. In 2023, knowledge on the
financial crime risks posed to financial institutions by illegal migration and adult sexual exploitation were
shared across ING through the KYC Academy’s online learning channel. ING is also participating in the
human trafficking working group being run by Europol’s Financial Intelligence Public Private Partnership.
Environmental crime is among the most profitable criminal enterprises and covers a wide range of unlawful
activities, including the illegal wildlife trade, the illegal extraction and trade of forestry and natural
resources, illegal waste and illegal fisheries crime. As well as interface with other crime types, including
corruption, trade-based fraud and human trafficking, there is also a convergence between environmental
crime and ESG. In 2023, ING continued with our membership of the United for Wildlife Financial Taskforce,
and with the United Nations working group on forestry crime, working with private, public and third sector
partners to detect illegal crimes in the wildlife and forestry trade.
EU AML/CFT legislative package
In mid-2021, the European Commission (EC) adopted a package of legislative proposals aimed at
strengthening anti-money laundering (AML) and counter-terrorism financing (CTF) rules. Although the
proposals are yet to be finalised, ING welcomes this harmonisation, which removes a degree of regulatory
complexity. ING has actively participated in workstreams and analyses prepared by banking associations
such as the Dutch Banking Association (NVB) and the European Banking Federations to assist us in assessing
the potential impact of the AML legislative package on the bank.
In September 2022, the Dutch Central Bank (DNB) published its report ‘From Recovery to Balance’ on the use
of risk-based approaches. Since then, ING has actively participated in roundtable workshops organised by
the NVB, which resulted in the creation of multiple ‘Industry Baselines’ on topics such as enhanced due
diligence (EDD) measures for European Commission (EC) high-risk third countries, and ongoing due diligence
on certain customer types. ING is in favour of these new baselines. They are a necessary step towards
fighting financial crime through the enhanced application of a risk-based approach (RBA): focusing efforts
on higher risks, while remaining within the boundaries of the applicable laws and regulations.
Public-private partnerships
To continue to be more effective in our effort to counter financial economic crime, we work closely with our
peers, regulators and law enforcement. This collaboration is of importance to ING. It is most visible through
our involvement in public private partnerships (PPPs) in our major markets, but also at an international level
– through our Group-level participation in networks such as Europol’s Financial Intelligence Public Private
Partnership. We recognise that our controls and risk management frameworks benefit from having a direct
dialogue with public partners as well as complementing our understanding of relevant and evolving financial
crime threats and risks. Sharing and applying these insights across the organisation helps us move beyond
technical compliance and enhances our ability to meet regulatory obligations and protect our customers.
In 2023, ING in the Netherlands continued working with the Financial Expertise Center and Fintell Alliance,
consisting of Dutch government agencies and three peer banks. Focused on priorities set there, we also
continued our involvement in Transaction Monitoring Netherlands (TMNL), where a consortium of Dutch
banks work on developing combined transaction monitoring. Both initiatives increase our understanding of
potential criminal modus operandi and money flows. Based on these insights, we can work more efficiently
and enhance our control framework. ING continues to be a part of the Anti-Financial Crime Alliance in
Germany.
Conduct compliance and ethics
Conduct compliance is the compliance risk that covers risks arising from potential or perceived misconduct
by ING or its employees towards its customers, market integrity, business partners, employees, and other
stakeholders. It includes customer protection and transparency (treating customers fairly), market conduct
(including market manipulation), anti-competitive conduct, conflicts of interest and ethics. Ethics risk
includes the Orange Code, Global Code of Conduct, as well as our whistleblower framework.
Treating customers fairly
As part of a further movement to align the global management of unfair customer treatment risk – already
aligned for the Markets in Financial Instruments Directive (MiFID) and the Insurance Distribution Directive
(IDD) products and based on local implementation for other products – we have launched an important
enhancement by creating the customer centricity policy (CCP), which was approved in July 2023. By setting
globally aligned standards based on the ING-aligned view on customer centricity, keeping the Orange Code
and Global Code of Conduct in mind, we now have standard global norms and risk management across all
jurisdictions, client segments and products. The level of customer protection is determined on the level of
client sophistication and related risks, with the highest level of protection for retail customers.
We aim to implement in 2024, when the global standards are tested against local legal requirements. We
anticipate, despite the standardisation, significant local differences in implementation due to the absence of
EU-wide aligned standards for some products, such as retail mortgages, while there will be more alignment
ING Group Annual Report 2023 on Form 20-F 222
in others, like financial instruments due to the MiFID. The changes also allow further simplification of
governance with the client protection and product approval committee (CPAC) now expanding its
responsibilities across all aspects of investments services, including advice/suitability.
Alongside the internally focused changes, the Sustainable Finance Disclosure Regulation (SFDR) has been
fully implemented. Further preparation is being done for activities relating to the EU retail investment
strategy as proposed by the EC, through which feedback is being shared to both industry and regulatory
bodies on, in our view, the best way to achieve the aim of the EC: an increased use of the EU Capital Markets
by its inhabitants. In addition, the implementation of the changes to the European Market Infrastructure
Regulation (EMIR) refit are ongoing.
An important area of focus is the management of compliance-related ESG risks. Greenwashing is a
significant risk, related to different aspects and potential root causes – ranging from outings, strategic
choices, or individual transactions. With the introduction of greenwashing prevention guidelines, based on
ING standards, external events, as well as regulatory guidance, the organisation is enhancing the
incorporation of greenwashing risk considerations in the way of doing business. Given that the
greenwashing definitions and risk management practices, as well as the regulatory framework, is still in
development we do expect significant changes going forward until market and society expectations are set.
In addition, further effort is made to mature the role of Compliance alongside the other risk domains in
relation to ESG risk management.
Market conduct
Market conduct risk stems from behaviour that can impact market integrity. As part of our work in 2022 to
strengthen our market conduct framework, global procedures on maintaining information barriers, insider
lists and communicating inside information were further improved across ING. In 2023, additional steps
have been made towards automating, standardising, and centralising our approach to personal account
dealing rules across the group. Furthermore, this year two new e-learnings have been designed on inside
information and detecting suspicious orders and transactions, with one already rolled out to targeted
employees.
Conflicts of interest
ING, being a large financial institution, is prone to multiple conflicts of interest, due to overlapping interests
of different stakeholders as businesses, employees, customers, shareholders, and society. ING has a policy
that aims to help to identify, assess, manage and mitigate or prevent (potential) conflicts of interest. It
maintains a global register of structural conflicts of interest with respective risk assessment and mitigating
measures in place.
Anti-competitive conduct
Competition law impacts all areas of ING's business. It is ING's policy to adhere to laws and regulations that
promote the functioning of markets and fair competition. In 2023, we revised the competition policy,
including related framework documents. It is aligned with the EBA guidelines on internal governance, setting
out principles on acceptable and unacceptable behaviours linked, in particular, to anti-trust practices. The
updated policy will come into effect in 2024.
Whistleblower
Further enhancements and standardisation to the whistleblower process are being made with the aim of
protecting the reporters of concerns, either through protection of identity, and/or by trying to prevent any
form of retaliation taking place. A global speak up programme is in place to harmonise the speak up
channels for undesirable behaviour. It aims to support reporters in choosing the appropriate channel,
ensuring a consistent reporter journey with the same levels of protection. Insights collection across certain
channels started to provide management anonymised oversight on the concerns raised, as well as
measuring follow-up on concerns that are found to be substantiated. If required, we continue to share
sanitised reports with the organisation to promote employees to speak up.
Data protection
ING is bound by European level and local data protection laws, which can differ from country to country. We
have a group-wide personal data protection policy, which aims to enable a consistent approach to our way
of processing personal data. This policy is implemented globally by all ING business entities and support
functions. In addition, we have implemented binding corporate rules within ING Group with the aim of
ensuring appropriate safeguards for our internal data transfers. Our approach can be summarised as `the
right people use the right data for the right purpose`.
Personal data
In line with the EU’s General Data Protection Regulation (GDPR) and other applicable data protection
requirements, we aim to process personal data for a specified business purpose in a fair and lawful manner,
observing the rights and liberties of data subjects in scope of our activities. We aim to perform data
protection impact assessments (DPIAs) and regular internal audits on the personal data processing that we
do for clients and employees, including ING’s technologies. Our staff is regularly trained on data protection,
both globally and locally, through training and awareness initiatives, for both general and targeted
audiences.
We strive to be transparent about what we do with the personal data of customers, employees, suppliers
and business partners, who we share personal data with and why. Our business entities, support functions,
as well as third parties that we engage with, must ensure that the data subject is granted a level of
protection equivalent to that guaranteed by the GDPR, especially if personal data is transferred outside of
the European economic area (EEA). Part of the data protection scope is that personal data is managed in a
ING Group Annual Report 2023 on Form 20-F 223
safe and secure manner, in line with current information security standards. More information can be found
in the privacy statement on our website (https://www.ing.com/Privacy-Statement.htm).
Data Protection Compliance department
In 2023, we established a new Data Protection Compliance department (DPC) within Group Compliance. This
combined second-line-of defence data protection responsibilities – previously split between Legal and
Compliance departments – into one team, leading to a solidified and empowered function. The Bank DPO
leads this team, reports to the CCO and has direct management board access. The DPC model is replicated
in ING’s local entities. The DPC team advises, challenges, and monitors that ING fulfils its GDPR and other
relevant obligations towards customers, employees, suppliers, and business partners with the aim of
keeping and processing (personal) data in a safe, compliant, and ethical manner. In the first line of defence,
a data protection executive is appointed who is accountable for data protection risk as well as the execution
of our data protection policy and standards. This executive has ultimate responsibility for the processing of
personal data in its ING entity and is supported by a data protection executive office.
Education
In 2023, to keep our staff informed and to increase awareness on compliance risks, we provided ING staff
worldwide with mandatory trainings on financial crime, including tax evasion and aggressive tax avoidance,
culture and ethics and data protection.
ING Group Annual Report 2023 on Form 20-F 224
Model risk
Introduction
Model risk is the risk that the financial or reputational position of ING is negatively impacted as a
consequence of the use of models. Model risk can arise from errors in the development, implementation,
use or interpretation of models, or from incomplete or wrong data etc., leading to inaccurate, non-
compliant or misinterpreted model outputs.
A model is defined as a quantitative method, system, or approach that applies statistical, economic,
financial or mathematical theories, techniques and assumptions to process input data into quantitative
estimates or whose inputs are partially or wholly qualitative or based on expert judgement.
Governance
The head of Model Risk Management (MoRM) reports to the ING Group chief risk officer. The Model Risk
Management Committee (MoRMC) is the dedicated authority within ING for model risk management. It is a
committee designated by the MBB and is chaired by the ING Group chief risk officer and vice-chaired by the
head of MoRM.
Model lines of defence
ING’s model risk and control structure is based on the three-model-lines-of-defence (MLoD) approach. This
approach aims to provide a sound governance framework for model risk management by defining and
implementing three different management layers with distinct roles and oversight responsibilities.
The composition and main activities within the three model lines of defence (MLoD):
•The first MLoD is composed of the model owners, model users, data management and model
development, and is accountable for the implementation of model risk controls which encompass model
development, implementation, and use of the models as well as monitoring of models’ performance.
•The second MLoD is composed of model validation and model risk oversight, which owns the model risk
management framework, proposes the model risk appetite, provides challenge to model risk
identification, and assessment and provides an independent validation of models used within ING.
•The third MLoD is the internal audit, reviewing the quality of model risk management execution in all
lines of defence and providing assurance over the first and second-line model risk management
activities.
 |
Model risk appetite (model RAS)
The model risk appetite is designed to determine the level of model risk ING is willing to accept in pursuit of
its strategic objectives. Current model RAS metrics are focused on the most important models for ING: credit
risk and other models with elevated supervisory attention. These metrics are reported to the MBB monthly.
ING Group Annual Report 2023 on Form 20-F 225
Model risk management (MoRM)
The MoRM policy framework comprises the total set of measures and tools put in place to manage model
risk. To enable setting model risk management standards that are proportionate to a model’s importance,
ING classifies models based on their materiality and reputational risk. The classification determines the
depth and extent of the applied model risk management activities, including model validation. Next to the
generic MoRM policy framework, dedicated model validation procedures are in place. These set the
validation standards for the key model types such as credit, market, liquidity, operational risk, IRRBB, KYC,
and other model categories. These procedures are continuously being enhanced to keep up to date with
regulatory, technical developments and industry trends.
On an aggregated level, model risk is monitored via analysis of data from the global model inventory,
collected across the bank to manage ING model's landscape. Insights are reported to the MoRMC and MBB,
so senior management can take well-informed decisions on acceptance or further mitigation of model risk.
Model lifecycle
The next figure provides a schematic overview of the model lifecycle, where orange represents the activities
of the first MLoD, grey represents the second MLoD and light grey is the third MLoD. The objectives of the
different processes are outlined below.
Initiation or change: The initiation of the development of a new model or change in an existing model can
be triggered by internal or external factors, such as business needs, regulation changes, new technologies,
and/or model validation findings.
Data collection is the process of defining and collecting data that meets the requirements for model
development. The process includes the definition of the data needed and assessment of data availability
and data quality.
Model development is a structured process that leads to a model that is consistent with the model owner
requirements, bank policy and relevant regulation where applicable.
Pre-approval validation is an independent assessment to determine whether a newly developed or
materially changed model is valid for its intended use. The approach to model validation is proportional to
the model risk and potential model risk as reflected in the ING model risk classification.
The objective of the model approval stage is to ensure models are formally approved by the designated
approval authority prior to deployment.
During the implementation stage, the model is deployed in a production environment, after completion of
required model testing and corresponding approval.
In the model use stage, the model is applied by the users for the specific purpose for which it was designed.
The model may only be used after formal approval.
The objective of model monitoring is to determine if the model is performing as expected by regularly
assessing model accuracy and/or predictive ability, considering internal or external developments that may
influence model performance. Model performance monitoring begins when a model is deployed for use, and
continues until the model has officially been decommissioned.
Periodic validation independently assesses, on a regular basis, whether a model is still valid for its intended
use, taking into consideration any internal or external changes since the last validation. The frequency of
periodic validation depends on the model risk, model type and applicable regulation.
A model that is/will no longer be used must be decommissioned.

ING Group Annual Report 2023 on Form 20-F 226
Business risk
Introduction
Business risk for ING has been defined as the exposure to value loss due to fluctuations in volumes/margins,
net fee and commission income, as well as expenses. It is the risk inherent to strategy decisions, internal
efficiency and the business environment. Business risk economic capital is calculated via the variance-
covariance methodology for these risks. This covers the risk that volume/margins, net fee and commission
income, operating expenses, and regulatory expenses/costs will deviate from the expected expenses and
incomes over the horizon of the relevant activities.
Governance and risk management
ING applies an explicit risk appetite statement regarding business risk, focusing on earnings stability and
diversification of the business mix. Diversification reduces the risk that volumes and/or margins will suddenly
drop due to unexpected changes in the business environment for certain markets and products. In addition,
the underlying risk types (expense risk, volume-margin risk, net fee and commission income risk, and
regulatory costs) are mitigated and managed differently. Expense risk is monitored and managed via the
financial performance of the bank and the local units. Through this process, the reported expense numbers
are compared quarterly with the projected cost/income ratio. Deviations from this ambition are monitored
as part of the financial projections discussed continuously within different parts of the organisation.
ING Group Annual Report 2023 on Form 20-F 227
Selected Statistical Information on Banking Operations
Reference is made to Note 1 ‘ Basis of preparation and material accounting policy information’ of the
Consolidated financial statements for information on Changes in accounting principles, estimates and
presentation of the consolidated financial statements and related notes.
The information in this section sets forth selected statistical information regarding the Group’s operations.
Information for 2023, 2022 and 2021 is set forth under IFRS-IASB. Unless otherwise indicated, average
balances, when used, are calculated from monthly data and the distinction between domestic and foreign is
based on the location of the office where the assets and liabilities are booked, as opposed to the domicile of
the customer. However, the Company believes that the presentation of these amounts based upon the
domicile of the customer would not result in material differences in the amounts presented in this section.
Average balances and interest rates
The following tables show the Group’s operations, average interest-earning assets and average interest-
bearing liabilities, together with average rates, for the periods indicated. The calculation of average balance
is based on balances as per month-end, while for certain products (such as Securities purchased/sold under
agreements to repurchase) balances can fluctuate substantially during the month. The interest income,
interest expense and average yield figures do not reflect interest income and expense on derivatives and
other interest income and expense not considered to be directly related to interest-bearing assets and
liabilities. These items are reflected in the corresponding interest income, interest expense and net interest
income figures in the consolidated financial statements. A reconciliation of the interest income, interest
expense and net interest income figures to the corresponding line items in the consolidated financial
statements is provided hereunder.
ASSETS | ||||||||||
Interest-earning assets | ||||||||||
2023 | 2022 | 2021 | ||||||||
Average balance | Interest income | Average yield % | Average balance | Interest income | Average yield % | Average balance | Interest income | Average yield % | ||
(EUR millions) | (EUR millions) | (EUR millions) | ||||||||
Time deposits with banks | ||||||||||
domestic | 2,620 | 111 | 4.3 | 3,574 | 52 | 1.4 | 2,818 | 33 | 1.2 | |
foreign | 1,236 | 256 | 20.7 | 2,603 | 197 | 7.6 | 3,718 | 41 | 1.1 | |
Loans and advances | ||||||||||
ASSETS | ||||||||||
Interest-earning assets | ||||||||||
2023 | 2022 | 2021 | ||||||||
Average balance | Interest income | Average yield % | Average balance | Interest income | Average yield % | Average balance | Interest income | Average yield % | ||
domestic | 184,864 | 6,548 | 3.5 | 186,808 | 4,617 | 2.5 | 186,022 | 4,313 | 2.3 | |
foreign | 461,351 | 20,287 | 4.4 | 467,736 | 12,666 | 2.7 | 438,174 | 9,437 | 2.2 | |
Securities purchased with agreements to resell | ||||||||||
domestic | 17,174 | 343 | 2.0 | 10,305 | 43 | 0.4 | 3,768 | 0 | 0.0 | |
foreign | 68,727 | 4,506 | 6.6 | 64,598 | 1,297 | 2.0 | 61,137 | 322 | 0.5 | |
Interest-earning securities1 | ||||||||||
domestic | 32,511 | 562 | 1.7 | 31,609 | 314 | 1.0 | 31,662 | 242 | 0.8 | |
foreign | 55,670 | 1,386 | 2.5 | 51,732 | 894 | 1.7 | 53,276 | 622 | 1.2 | |
Other interest-earning assets | ||||||||||
domestic | 56,611 | 2,720 | 4.8 | 65,895 | 444 | 0.7 | 50,713 | 13 | 0.0 | |
foreign | 61,658 | 2,118 | 3.4 | 66,298 | 407 | 0.6 | 71,055 | 56 | 0.1 | |
Total | 942,421 | 38,839 | 4.1 | 951,158 | 20,931 | 2.2 | 902,341 | 15,080 | 1.7 | |
Non-interest earning assets | 54,850 | 51,367 | 51,012 | |||||||
Derivatives assets | 30,215 | 32,480 | 23,505 | |||||||
Total assets | 1,027,486 | 1,035,005 | 976,857 | |||||||
Percentage of assets applicable to foreign operations | 67.8% | 67.7% | 68.9% | |||||||
Interest income on derivatives | 13,112 | 6,123 | 4,386 | |||||||
Other 2 | 448 | 1,319 | 1,585 | |||||||
Total interest income | 52,399 | 28,373 | 21,051 | |||||||
1Substantially all interest-earning securities held by the banking operations of the Company are taxable securities.
ING Group Annual Report 2023 on Form 20-F 228
2Other includes negative interest expense.
LIABILITIES | ||||||||||
Interest-bearing liabilities | ||||||||||
2023 | 2022 | 2021 | ||||||||
Average balance | Interest expense | Average yield | Average balance | Interest expense | Average yield | Average balance | Interest expense | Average yield | ||
(EUR millions) | % | (EUR millions) | % | (EUR millions) | % | |||||
Time deposits from banks | ||||||||||
domestic | 19,646 | 678 | 3.4 | 53,949 | -281 | -0.5 | 51,928 | 3 | 0.0 | |
foreign | 11,881 | 308 | 2.6 | 24,068 | -6 | 0.0 | 24,497 | 76 | 0.3 | |
Current accounts | ||||||||||
domestic | 97,084 | 1,025 | 1.1 | 107,971 | 361 | 0.3 | 98,236 | 110 | 0.1 | |
foreign | 135,088 | 362 | 0.3 | 155,087 | 98 | 0.1 | 144,706 | 19 | 0.0 | |
Time deposits 1 | ||||||||||
domestic | 39,054 | 1,977 | 5.1 | 31,224 | 567 | 1.8 | 12,508 | 35 | 0.3 | |
foreign | 43,111 | 1,876 | 4.4 | 9,239 | 349 | 3.8 | 5,926 | 90 | 1.5 | |
Savings deposits | ||||||||||
domestic | 108,789 | 901 | 0.8 | 101,489 | -311 | -0.3 | 97,862 | -324 | -0.3 | |
foreign | 234,282 | 3,148 | 1.3 | 233,412 | 895 | 0.4 | 257,796 | 482 | 0.2 | |
Securities sold under agreements to repurchase | ||||||||||
domestic | 1,085 | 478 | 44.1 | 972 | 38 | 3.9 | 3,205 | 0 | 0.0 | |
foreign | 64,905 | 4,314 | 6.6 | 60,127 | 1,205 | 2.0 | 55,300 | 133 | 0.2 | |
Commercial paper | ||||||||||
domestic | 13,159 | 484 | 3.7 | 7,425 | 42 | 0.6 | 2,712 | 3 | 0.1 | |
foreign | 22,099 | 1,193 | 5.4 | 14,050 | 245 | 1.7 | 12,873 | 23 | 0.2 | |
Short term debt | ||||||||||
domestic | 5,841 | 286 | 4.9 | 3,946 | 53 | 1.3 | 3,484 | 7 | 0.2 | |
foreign | 1,669 | 72 | 4.3 | 2,858 | 39 | 1.4 | 4,190 | 11 | 0.3 | |
Long term debt | ||||||||||
domestic | 62,233 | 1,750 | 2.8 | 55,501 | 1,268 | 2.3 | 55,511 | 1,167 | 2.1 | |
foreign | 19,106 | 549 | 2.9 | 16,310 | 257 | 1.6 | 14,490 | 168 | 1.2 | |
Subordinated liabilities | ||||||||||
domestic | 16,057 | 711 | 4.4 | 16,317 | 650 | 4.0 | 15,364 | 573 | 3.7 | |
foreign | 0.0 | 0 | 0 | 0.0 | ||||||
Other interest‑bearing liabilities | ||||||||||
domestic | 4,705 | 693 | 14.7 | 3,721 | 235 | 6.3 | 3,470 | 12 | 0.4 | |
foreign | 6,639 | 253 | 3.8 | 6,732 | 116 | 1.7 | 6,557 | 28 | 0.4 | |
LIABILITIES | ||||||||||
Interest-bearing liabilities | ||||||||||
2023 | 2022 | 2021 | ||||||||
Average balance | Interest expense | Average yield | Average balance | Interest expense | Average yield | Average balance | Interest expense | Average yield | ||
Total | 906,434 | 21,057 | 2.3 | 904,399 | 5,820 | 0.6 | 870,615 | 2,616 | 0.3 | |
Non-interest bearing liabilities | 37,365 | 38,995 | 30,839 | |||||||
Derivatives liabilities | 28,452 | 32,364 | 21,173 | |||||||
Total liabilities | 972,251 | 975,757 | 922,627 | |||||||
Group capital | 55,235 | 59,248 | 54,230 | |||||||
Total liabilities and capital | 1,027,486 | 1,035,005 | 976,857 | |||||||
Percentage of liabilities applicable to foreign operations | 58.8% | 57.3% | 60.4% | |||||||
Other interest expense: | ||||||||||
Interest expenses on derivatives | 14,927 | 6,522 | 3,305 | |||||||
other 2 | 253 | 1,438 | 1,130 | |||||||
Total interest expense | 36,237 | 13,780 | 7,051 | |||||||
Total net interest result | 16,162 | 14,593 | 14,000 | |||||||
1These captions do not include deposits from banks.
2Other includes negative interest income.
ING Group Annual Report 2023 on Form 20-F 229
Analysis of changes in net interest income
The following table allocates changes in the Group’s operations’ interest income and expense and net
interest result between changes in average balances and rates for the periods indicated. Changes due to a
combination of volume and rate have been allocated to changes in average volume. The net changes in
interest income, interest expense and net interest result, as calculated in this table, have been reconciled to
the changes in interest income, interest expense and net interest result in the consolidated financial
statements. See introduction to “Average Balances and Interest Rates” for a discussion of the differences
between interest income, interest expense and net interest result as calculated in the following table and as
set forth in the consolidated financial statements.
2023 over 2022 | 2022 over 2021 | ||||||
Increase (decrease) due to changes in | Increase (decrease) due to changes in | ||||||
Average volume | Average rate | Net change | Average volume | Average rate | Net change | ||
(EUR millions) | (EUR millions) | ||||||
Interest-earning assets | |||||||
Time deposits to banks | |||||||
domestic | -14 | 74 | 60 | 9 | 10 | 18 | |
foreign | -103 | 163 | 59 | -12 | 168 | 156 | |
Loans and advances | |||||||
domestic | -39 | 1,970 | 1,931 | -72 | 376 | 304 | |
foreign | -64 | 7,684 | 7,621 | 468 | 2,762 | 3,229 | |
Securities purchased with agreements to resell | |||||||
Domestic | 29 | 271 | 300 | 1 | 42 | 43 | |
foreign | 83 | 3,126 | 3,209 | 18 | 957 | 975 | |
Interest-earning securities | |||||||
Domestic | 9 | 239 | 248 | 0 | 72 | 72 | |
foreign | 68 | 425 | 493 | -18 | 290 | 272 | |
Other interest-earning assets | |||||||
domestic | -63 | 2,339 | 2,276 | 4 | 426 | 430 | |
foreign | -28 | 1,740 | 1,711 | -4 | 355 | 352 | |
Interest income | |||||||
domestic | -77 | 4,893 | 4,815 | -58 | 926 | 867 | |
foreign | -45 | 13,137 | 13,093 | 452 | 4,531 | 4,983 | |
Total | -122 | 18,030 | 17,908 | 394 | 5,457 | 5,851 | |
Other interest income | 6,118 | 1,471 | |||||
Total interest income | 24,026 | 7,322 | |||||
2023 over 2022 | 2022 over 2021 | ||||||
Increase (decrease) due to changes in | Increase (decrease) due to changes in | ||||||
Average volume | Average rate | Net change | Average volume | Average rate | Net change | ||
(EUR millions) | (EUR millions) | ||||||
Interest-bearing liabilities | |||||||
Time deposits from banks | |||||||
domestic | -55 | 1,014 | 958 | 0 | -284 | -284 | |
foreign | -55 | 369 | 314 | -1 | -80 | -82 | |
Demand deposits | |||||||
domestic | -36 | 700 | 664 | 11 | 241 | 251 | |
foreign | -13 | 276 | 263 | 1 | 78 | 79 | |
Time deposits | |||||||
domestic | 142 | 1,268 | 1,411 | 53 | 479 | 531 | |
foreign | 1,278 | 249 | 1,527 | 50 | 209 | 259 | |
Savings deposits | |||||||
domestic | 5 | 1,207 | 1,212 | 3 | 10 | 13 | |
foreign | 4 | 2,249 | 2,253 | -50 | 464 | 414 | |
Short term debt | |||||||
domestic | 25 | 208 | 233 | 1 | 45 | 46 | |
foreign | -16 | 49 | 33 | -4 | 31 | 28 | |
Securities sold under agreements to repurchase | |||||||
domestic | 4 | 435 | 440 | 0 | 38 | 38 | |
foreign | 96 | 3,013 | 3,109 | 12 | 1,060 | 1,072 | |
Commercial paper | |||||||
domestic | 33 | 409 | 442 | 4 | 35 | 40 | |
foreign | 140 | 809 | 949 | 2 | 220 | 222 | |
Long term debt | |||||||
domestic | 154 | 328 | 482 | 0 | 101 | 101 | |
foreign | 44 | 247 | 291 | 21 | 69 | 90 | |
Subordinated liabilities | |||||||
domestic | -10 | 71 | 61 | 36 | 41 | 76 | |
foreign | 0 | 0 | 0 | ||||
Other interest-bearing liabilities | |||||||
domestic | 62 | 396 | 458 | 1 | 221 | 222 | |
foreign | -2 | 138 | 136 | 1 | 87 | 88 | |
Interest expense | |||||||
domestic | 323 | 6,038 | 6,361 | 108 | 927 | 1,035 | |
foreign | 1,476 | 7,400 | 8,876 | 32 | 2,137 | 2,169 | |
Total | 1,799 | 13,438 | 15,237 | 140 | 3,064 | 3,204 | |
Other interest expense | 7,219 | 3,525 | |||||
ING Group Annual Report 2023 on Form 20-F 230
2023 over 2022 | 2022 over 2021 | ||||||
Increase (decrease) due to changes in | Increase (decrease) due to changes in | ||||||
Average volume | Average rate | Net change | Average volume | Average rate | Net change | ||
(EUR millions) | (EUR millions) | ||||||
Total interest expense | 22,456 | 6,729 | |||||
Net interest | |||||||
domestic | -401 | -1,146 | -1,546 | -166 | -1 | -167 | |
foreign | -1,521 | 5,738 | 4,217 | 420 | 2,394 | 2,814 | |
Net interest | -1,921 | 4,592 | 2,671 | 254 | 2,393 | 2,647 | |
Other net interest result | -1,101 | -2,054 | |||||
Net interest result | 1,570 | 593 | |||||
The following table shows the interest spread and net interest margin for the past two years.
2023 | 2022 | ||
Average rate | Average rate | ||
% | % | ||
Interest spread | |||
Domestic | 0.9 | 1.0 | |
Foreign | 2.2 | 1.8 | |
Total | 1.8 | 1.5 | |
Net interest margin | |||
Domestic | 0.3 | 0.7 | |
Foreign | 2.6 | 1.9 | |
Total | 1.9 | 1.5 | |
Investments in debt securities
The following tables show the weighted average yield of ING’s investments on debt securities measured at
amortised cost and fair value through other comprehensive income. The weighted average yield is
calculated as follows:
Nominal value * coupon rate * remaining maturity
Nominal value * remaining maturity
Weighted average yield | ||||
2023 | 1 year or less | Between 1 and 5 years | Between 5 and 10 years | Over 10 years |
Fair value through other comprehensive income | ||||
Government bonds | 2.26% | 3.80% | 2.81% | 3.48% |
Central Bank bonds | ||||
Sub-sovereign, Supranationals and Agencies | 3.98% | 2.74% | 2.29% | 3.41% |
Covered bonds | 1.86% | 2.15% | 2.37% | |
Corporate bonds | 3.66% | 0.38% | ||
Financial institutions bonds | 3.66% | 2.92% | 3.67% | |
ABS portfolio | 4.50% | 4.42% | 4.62% | |
1Since substantially all investment securities held by the banking operations of the Company are taxable securities, the yields are on
tax-equivalent basis.
Weighted average yield | ||||
2023 | 1 year or less | Between 1 and 5 years | Between 5 and 10 years | Over 10 years |
Securities at amortised cost | ||||
Government bonds | 2.73% | 2.96% | 1.82% | 4.43% |
Central Bank bonds | 0.04% | |||
Sub-sovereign, Supranationals and Agencies | 1.78% | 1.67% | 1.69% | 2.63% |
Covered bonds | 1.11% | 1.13% | 1.23% | |
Corporate bonds | 7.32% | 4.29% | 7.32% | |
Financial institutions bonds | 6.77% | 3.26% | 1.54% | |
ABS portfolio | 4.39% | 4.40% | 5.33% | 5.32% |
1Since substantially all investment securities held by the banking operations of the Company are taxable securities, the yields are on
tax-equivalent basis.
ING Group Annual Report 2023 on Form 20-F 231
Loan Portfolio
Loans and advances to banks and customers
Loans and advances to banks include all receivables from credit institutions, except for cash, current
accounts and deposits with other banks (including central banks). Loans and advances to customers
includes lending facilities to corporate and private customers encompass among others, loans, overdrafts
and finance lease receivables.
Maturities and sensitivity of loans to changes in interest rates
The following table analyses loans and advances to banks and customers by time remaining until maturity
as of 31 December 2023.
2023 | 1 year or less | 1 year to 5 years | 5 years through 15 years | After 15 years | Total |
By domestic offices: | |||||
Loans to banks | 8,982 | 445 | 26 | 0 | 9,453 |
Loans to public authorities | 194 | 308 | 553 | 15 | 1,070 |
Residential mortgages | 2,244 | 12,404 | 46,865 | 50,632 | 112,145 |
Other personal lending | 947 | 2,151 | 1,399 | 540 | 5,036 |
Corporate Lending | 22,462 | 29,792 | 10,165 | 258 | 62,677 |
Total domestic offices | 34,829 | 45,100 | 59,007 | 51,445 | 190,381 |
By foreign offices: | |||||
Loans to banks | 5,798 | 1,083 | 388 | 17 | 7,286 |
Loans to public authorities | 4,224 | 3,070 | 4,862 | 1,157 | 13,314 |
Residential mortgages | 12,649 | 48,806 | 84,717 | 71,189 | 217,361 |
Other personal lending | 8,968 | 14,988 | 5,414 | 2,165 | 31,535 |
Corporate Lending | 79,524 | 101,436 | 27,282 | 1,553 | 209,795 |
Total foreign offices | 111,163 | 169,383 | 122,664 | 76,081 | 479,291 |
Total gross loans and advances to banks and customers | 145,992 | 214,483 | 181,671 | 127,526 | 669,672 |
The following table analyzes loans and advances to banks and customers by interest rate sensitivity by
maturity as of 31 December 2023 for loans and advances due after one year.
Predetermined interest rates | Floating or adjustable interest rates 1 | |
Loans to banks | 367 | 1,591 |
Loans to public authorities | 6,586 | 3,380 |
Residential mortgages | 225,976 | 88,638 |
Other personal lending | 21,646 | 5,011 |
Corporate Lending | 52,786 | 117,700 |
Total | 307,361 | 216,319 |
1Loans that have an interest rate that remains fixed for more than one year and which can then be changed are classified as
“adjustable interest rates”.
Allowance for credit losses
The following table presents the movements in allocation of the provision for loan losses on loans accounted
for as loans and advances to banks and customers for 2023, 2022 and 2021 under IFRS-IASB.
Movements in allocation of the provision for loan losses on loans | |||
2023 | 2022 | 2021 | |
Balance on 1 January | 6,101 | 5,368 | 5,854 |
Impact of changes in accounting policies | 95 | ||
Write-offs | -1,111 | -1,130 | -854 |
Recoveries | 71 | 71 | 45 |
Net write-offs | -1,039 | -1,059 | -809 |
Additions and other adjustments (included in value Adjustments to receivables of the Banking operations) | 682 | 1,792 | 324 |
Balance on 31 December | 5,839 | 6,101 | 5,368 |
Average loans and advances to banks and customers | 671,424 | 670,013 | 644,853 |
Ratio of net charge‑offs to average loans and advances to banks and customers | 0.15% | 0.16% | 0.13% |
Ratio of allowance for credit losses to total loans and advances to banks and customers outstanding | 0.88% | 0.90% | 0.82% |
ING Group Annual Report 2023 on Form 20-F 232
Additions to loan loss provisions have decreased compared to 2022. Loan loss provisions are influenced by
developments in general macroeconomic conditions as well as certain individual exposures. Reference is
made to Note 1 ‘Basis of preparation and material accounting policy information’ and ‘Additional
information – Risk Management’ for detailed information on loan loss provisioning.
Deposits
Reference is made to ‘Additional information – Average balances and interest rates’ for detailed information
on average amount of and the average rate paid on deposit categories.
For the years ended 31 December 2023, 2022 and 2021 the aggregate amount of deposits by foreign
depositors in domestic offices was EUR 37,360 million, EUR 37,402 million and EUR 29,696 million
respectively.
Uninsured deposits
For the years ended 31 December 2023 and 2022 the amount of uninsured deposits, which were not
covered by DGS, was EUR 182,155 million and EUR 184,032 million, respectively.
Deposit guarantee schemes (DGS) reimburse a limited amount to compensate depositors whose bank has
failed. A fundamental principle underlying DGS is that they are funded entirely by banks, and that no
taxpayer funds are used. Under EU rules, the Deposit Guarantee Scheme (DGS) guarantees deposits up to a
maximum of EUR 100,000 per depositor in case of a bank failure.
On 31 December 2023, the amount of time deposits in excess of (local) deposit insurance regime and time
deposits which are otherwise uninsured is as follows:
Time deposits in excess on deposit insurance regime | Other uninsured Time deposits | |
(EUR millions) | (EUR millions) | |
3 months or less | 12,139 | 28,712 |
6 months or less but over 3 months | 2,661 | 6,641 |
12 months or less but over 6 months | 1,740 | 5,240 |
Over 12 months | 619 | 4,238 |
Total | 17,159 | 44,830 |
For further detailed information on deposits reference is made to Note 12 'Deposits from banks' and Note 13
'Customer deposits' of the consolidated financial statements.
ING Group Annual Report 2023 on Form 20-F 233
Contents
Consolidated financial statements
Notes to the consolidated financial statements
Notes to the consolidated statement of financial position
Notes to the consolidated statement of profit or loss
Segment reporting
ING Group Annual Report 2023 on Form 20-FF - 234
Additional notes to the consolidated financial statements
ING Group Annual Report 2023 on Form 20-FF - 235

To the Shareholders and the Supervisory Board ING Groep N.V.
Opinion on the consolidated Financial Statements
We have audited the accompanying consolidated statements of financial position of ING Groep N.V. and
subsidiaries (the Company) as of December 31, 2023 and 2022, the related consolidated statements of profit
or loss, comprehensive income, changes in equity, and cash flows for each of the years in the three‑year
period ended December 31, 2023, and the related notes and specific disclosures described in Note 1 as
being part of the consolidated financial statements (collectively, the consolidated financial statements). In our
opinion, the consolidated financial statements present fairly, in all material respects, the financial position of
the Company as of December 31, 2023 and 2022, and the results of its operations and its cash flows for each
of the years in the three‑year period ended December 31, 2023, in conformity with International Financial
Reporting Standards as issued by the International Accounting Standards Board.
We also have audited, in accordance with the standards of the Public Company Accounting Oversight Board
(United States) (PCAOB), the Company’s internal control over financial reporting as of December 31, 2023,
based on criteria established in Internal Control – Integrated Framework (2013) issued by the Committee of
Sponsoring Organizations of the Treadway Commission, and our report dated March 4, 2024 expressed an
unqualified opinion on the effectiveness of the Company’s internal control over financial reporting.
Basis for Opinion
These consolidated financial statements are the responsibility of the Company’s management. Our
responsibility is to express an opinion on these consolidated financial statements based on our audits. We are
a public accounting firm registered with the PCAOB and are required to be independent with respect to the
Company in accordance with the U.S. federal securities laws and the applicable rules and regulations of the
Securities and Exchange Commission and the PCAOB.
We conducted our audits in accordance with the standards of the PCAOB. Those standards require that we
plan and perform the audit to obtain reasonable assurance about whether the consolidated financial
statements are free of material misstatement, whether due to error or fraud. Our audits included performing
procedures to assess the risks of material misstatement of the consolidated financial statements, whether due
to error or fraud, and performing procedures that respond to those risks. Such procedures included
examining, on a test basis, evidence regarding the amounts and disclosures in the consolidated financial
statements. Our audits also included evaluating the accounting principles used and significant estimates
made by management, as well as evaluating the overall presentation of the consolidated financial statements.
We believe that our audits provide a reasonable basis for our opinion.
Critical Audit Matter
The critical audit matter communicated below is a matter arising from the current period audit of the
consolidated financial statements that was communicated or required to be communicated to the audit
committee and that: (1) relates to accounts or disclosures that are material to the consolidated financial
statements and (2) involved our especially challenging, subjective, or complex judgments. The
communication of a critical audit matter does not alter in any way our opinion on the consolidated financial
statements, taken as a whole, and we are not, by communicating the critical audit matter below, providing a
separate opinion on the critical audit matter or on the accounts or disclosures to which it relates.
Assessment of expected credit losses on loans and advances to customers and loans and advances
to banks
As discussed in the Credit Risk section on pages 165-193 and in Note 3 and Note 7 in the consolidated
financial statements, the loans and advances to customers amount to EUR 647 billion and loans and
advances to banks amount to EUR 17 billion as at 31 December 2023. These loans and advances are
measured at amortised cost, less expected credit losses (‘ECL’) of EUR 6 billion. Management estimated ECL
using three components: probability of default (‘PD’), loss given default (‘LGD’) and exposure at default
(‘EAD’). Management applied forward looking economic scenarios with associated weights. Relevant
macroeconomic factors include the gross domestic product (‘GDP’), house price index (‘HPI’) and
unemployment rate. The recent economic conditions are outside the bounds of historical experience used to
develop ECL model methodologies and result in greater uncertainties to estimate ECLs. These uncertainties
are addressed by judgemental overlays by management.
We identified the assessment of ECL on loans and advances to customers and loans and advances to banks
as a critical audit matter because of the significant and complex auditor judgment and specialised skills and
knowledge required to evaluate the following elements of the overall ECL estimate:
—The judgements used to develop the model-driven PD and LGD parameters.
—The determination of the amount and timing of expected future recovery cash flows for individual loan
provision assessments for impaired loans and the probability weights applied in the presence of more
than one recovery scenario.

KPMG Accountants N.V., a Dutch limited liability company registered with the trade register in the Netherlands under number 33263683, is a member firm of the global organization of independent member firms affiliated with KPMG International Limited, a private English company limited by guaranteeF -236
—The use of forward-looking macroeconomic forecasts in ECL, including GDP, HPI and unemployment
rate.
—The consistent identification and application of criteria for significant increase in credit risk (‘SICR’) in
the macroeconomic environment and geopolitical situation which remains uncertain.
—The determination of management overlays to the modelled ECL due to the continued uncertainty in
the macroeconomic outlook in the global economy combined with the delay in which the models
capture emerging risks.
The following are the primary procedures we performed to address this critical audit matter.
—We evaluated the design and tested the operating effectiveness of certain internal controls related to
the estimation of ECL for loans and advances to customers and loans and advances to banks. This
included controls relating to the selection of key assumptions (including PD, LGD and macroeconomic
forecasts), review and authorisation of model outputs, governance and monitoring of the ECL process,
determination of credit risk ratings, the estimation of future recovery cash flows of individual loan loss
provisions and associated scenario weights assigned and the determination of management overlays
to the modelled ECL.
—We involved credit risk professionals with specialised skills and knowledge who assisted in evaluating
the assumptions used to determine the PD and LGD parameters in models used by the Company to
determine the collective provisions, including the evaluation of the recalibrated and redeveloped credit
risk models. This included reperforming back-testing of certain models to evaluate the current model
performance and evaluation of the identification of SICR in loans by challenging the scope of
management’s criteria used in staging assessments, consistent application of the thresholds applied
within each criterion, and the ability of staging criteria to identify SICR prior to loans being credit
impaired. In addition, the credit risk professionals assisted in testing management overlays recorded,
including interest and inflation related overlays for both the wholesale banking and retail banking
portfolios and an overlay related to interest only residential mortgages in the Netherlands.
—We involved economic professionals with specialised skills and knowledge, who assisted in assessing
the Company’s methodology to determine the macroeconomic forecasts used in determining the ECL.
We tested the reasonableness of management’s forecasts against other external benchmarks and our
own internal forecasts.
—We involved corporate finance professionals with specialised skills and knowledge, who assisted in
assessing the methodologies, cash flows and collateral values used in expected future recovery cash
flow assessments of individual loan loss provisions for impaired loans and in challenging
management’s use of recovery scenarios and expected cash flows by comparing against industry
trends and comparable benchmarks and recalculating recovery amounts.
/s/ KPMG Accountants N.V.
We have served as the Company’s auditor since 2016.
Amstelveen, The Netherlands March 4, 2024
KPMG Accountants N.V., a Dutch limited liability company registered with the trade register in the Netherlands under number 33263683, is a member firm of the global organization of independent member firms affiliated with KPMG International Limited, a private English company limited by guaranteeF -237
Consolidated statement of financial position
As at 31 December
in EUR million | 2023 | 2022 | 2023 | 2022 | ||
Assets | Liabilities | |||||
Cash and balances with central banks 2 | Deposits from banks 12 | |||||
Loans and advances to banks 3 | Customer deposits 13 | |||||
Financial assets at fair value through profit or loss 4,6 | Financial liabilities at fair value through profit or loss 14 | |||||
– Trading assets | – Trading liabilities | |||||
– Non-trading derivatives | – Non-trading derivatives | |||||
– Designated as at fair value through profit or loss | – Designated as at fair value through profit or loss | |||||
– Mandatorily at fair value through profit or loss | Current tax liabilities | |||||
Financial assets at fair value through other comprehensive income 5,6 | Deferred tax liabilities 34 | |||||
Securities at amortised cost 6 | Provisions 15 | |||||
Loans and advances to customers 7 | Other liabilities 16 | |||||
Investments in associates and joint ventures 8 | Debt securities in issue 17 | |||||
Property and equipment 9 | Subordinated loans 18 | |||||
Intangible assets 10 | Total liabilities | |||||
Current tax assets | ||||||
Deferred tax assets 34 | Equity 19 | |||||
Other assets 11 | Share capital and share premium | |||||
Other reserves | - | - | ||||
Retained earnings | ||||||
Shareholders’ equity (parent) | ||||||
Non-controlling interests | ||||||
Total equity | ||||||
Total assets | Total liabilities and equity |
References relate to the accompanying notes. These are an integral part of the Consolidated financial statements.
ING Group Annual Report 2023 on Form 20-FF - 238
Consolidated statement of profit or loss
for the years ended 31 December
in EUR million | 2023 | 2022 | 2021 | 2023 | 2022 | 2021 | ||
Interest income using effective interest rate method | Addition to loan loss provisions | |||||||
Other interest income | Staff expenses 25 | |||||||
Total interest income | Other operating expenses 26 | |||||||
Total expenses | ||||||||
Interest expense using effective interest rate method | - | - | - | |||||
Other interest expense | - | - | - | Result before tax | ||||
Total interest expense | - | - | - | |||||
Taxation 34 | ||||||||
Net interest income 20 | Net result | |||||||
Fee and commission income | Net result attributable to: | |||||||
Fee and commission expense | - | - | - | Non-controlling interests | ||||
Net fee and commission income 21 | Shareholders of the parent | |||||||
Valuation results and net trading income 22 | - | |||||||
Investment income 23 | ||||||||
Share of result from associates and joint ventures 8 | ||||||||
Impairment of associates and joint ventures 8 | - | - | - | |||||
Result on disposal of group companies | - | in EUR | ||||||
Net result on derecognition of financial assets measured at amortised cost | - | Earnings per ordinary share 28 | ||||||
Other net income 24 | - | - | Basic earnings per ordinary share | |||||
Total income | Diluted earnings per ordinary share | |||||||
References relate to the accompanying notes. These are an integral part of the Consolidated financial statements.
ING Group Annual Report 2023 on Form 20-FF - 239
Consolidated statement of comprehensive income
for the years ended 31 December
in EUR million | 2023 | 2022 | 2021 |
Net result (before non-controlling interests) | |||
Other comprehensive income | |||
Items that will not be reclassified to the statement of profit or loss: | |||
Realised and unrealised revaluations property in own use | - | ||
Remeasurement of the net defined benefit asset/liability 33 | - | - | |
Net change in fair value of equity instruments at fair value through other comprehensive income | - | - | |
Change in fair value of own credit risk of financial liabilities at fair value through profit or loss | - | ||
Items that may subsequently be reclassified to the statement of profit or loss: | |||
Net change in fair value of debt instruments at fair value through other comprehensive income | - | - | |
Realised gains/losses on debt instruments at fair value through other comprehensive income reclassified to the statement of profit or loss | - | - | |
Changes in cash flow hedge reserve | - | - | |
Exchange rate differences 1 | - | ||
Share of other comprehensive income of associates and joint ventures and other income | - | ||
Total comprehensive income | |||
Comprehensive income attributable to: | |||
Non-controlling interests | - | - | |
Shareholders of the parent | |||
References relate to the accompanying notes. These are an integral part of the Consolidated financial
statements.
For the disclosure on the income tax effects on each component of the other comprehensive income,
reference is made to Note 34 'Taxation'.
ING Group Annual Report 2023 on Form 20-FF - 240
Consolidated statement of changes in equity
in EUR million | Share capital and share premium | Other reserves | Retained earnings | Shareholders' equity (parent) | Non- controlling interests | Total equity |
Balance as at 31 December 2022 | - | |||||
Impact of changes in accounting policies 1 | - | - | - | - | ||
Balance as at 1 January 2023 | - | |||||
Net change in fair value of equity instruments at fair value through other comprehensive income | - | - | - | - | ||
Net change in fair value of debt instruments at fair value through other comprehensive income | ||||||
Realised gains/losses on debt instruments at fair value through other comprehensive income reclassified to the statement of profit or loss | ||||||
Changes in cash flow hedge reserve | ||||||
Realised and unrealised revaluations property in own use | ||||||
Remeasurement of the net defined benefit asset/liability 33 | - | - | - | |||
Exchange rate differences | - | - | - | |||
Share of other comprehensive income of associates and joint ventures and other income | - | |||||
Change in fair value of own credit risk of financial liabilities at fair value through profit or loss | - | - | - | |||
Total amount recognised directly in other comprehensive income net of tax | - | |||||
Net result | ||||||
Total comprehensive income net of tax | ||||||
Dividends and other cash distribution 29 | - | - | - | - | ||
Share buyback programme | - | - | - | - | - | |
Changes in treasury shares | - | - | - | |||
Employee share plans | - | - | - | |||
Changes in the composition of the group and other changes | - | - | - | |||
Balance as at 31 December 2023 | - | |||||
1 Changes in policy following the adoption of IFRS 17 and change in policy for non-financial guarantees.
References relate to the accompanying notes. These are an integral part of the Consolidated financial
statements. Changes in individual Reserve components are presented in Note 19 'Equity'.
ING Group Annual Report 2023 on Form 20-FF - 241
Consolidated statement of changes in equity - continued
in EUR million | Share capital and share premium | Other reserves | Retained earnings | Shareholders' equity (parent) | Non- controlling interests | Total equity |
Balance as at 31 December 2021 | - | |||||
Impact IAS 29 on opening balance | - | |||||
Balance as at 1 January 2022 | ||||||
Net change in fair value of equity instruments at fair value through other comprehensive income | - | - | - | - | - | |
Net change in fair value of debt instruments at fair value through other comprehensive income | - | - | - | - | ||
Realised gains/losses on debt instruments at fair value through other comprehensive income reclassified to the statement of profit or loss | - | - | - | - | ||
Changes in cash flow hedge reserve | - | - | - | - | ||
Realised and unrealised revaluations property in own use | - | |||||
Remeasurement of the net defined benefit asset/liability 33 | - | - | - | |||
Exchange rate differences | - | |||||
Share of other comprehensive income of associates and joint ventures and other income | - | |||||
Change in fair value of own credit risk of financial liabilities at fair value through profit or loss | ||||||
Total amount recognised directly in other comprehensive income net of tax | - | - | - | - | - | |
Net result | ||||||
Total comprehensive income net of tax | - | - | ||||
Dividends and other cash distribution 29 | - | - | - | - | ||
Share buyback programme | - | - | - | - | ||
Changes in treasury shares | ||||||
Employee share plans | ||||||
Changes in the composition of the group and other changes | - | - | - | |||
Balance as at 31 December 2022 | - | |||||
References relate to the accompanying notes. These are an integral part of the Consolidated financial
statements. Changes in individual Reserve components are presented in Note 19 'Equity'.
ING Group Annual Report 2023 on Form 20-FF - 242
Consolidated statement of changes in equity - continued
in EUR million | Share capital and share premium | Other reserves | Retained earnings | Shareholders' equity (parent) | Non- controlling interests | Total equity |
Balance as at 31 December 2020 | ||||||
Net change in fair value of equity instruments at fair value through other comprehensive income | - | |||||
Net change in fair value of debt instruments at fair value through other comprehensive income | - | - | - | - | ||
Realised gains/losses on debt instruments at fair value through other comprehensive income reclassified to the statement of profit or loss | - | - | - | - | ||
Changes in cash flow hedge reserve | - | - | - | - | ||
Realised and unrealised revaluations property in own use | - | - | - | |||
Remeasurement of the net defined benefit asset/liability | ||||||
Exchange rate differences | - | |||||
Share of other comprehensive income of associates and joint ventures and other income | - | - | - | |||
Change in fair value of own credit risk of financial liabilities at fair value through profit or loss | ||||||
Total amount recognised directly in other comprehensive income net of tax | - | - | - | - | ||
Net result | ||||||
Total comprehensive income net of tax | - | - | ||||
Dividends | - | - | - | - | ||
Share buyback programme | - | - | - | - | ||
Changes in treasury shares | - | - | - | |||
Employee share plans | ||||||
Balance as at 31 December 2021 | - | |||||
Changes in individual Reserve components are presented in Note 19 'Equity'.
ING Group Annual Report 2023 on Form 20-FF - 243
Consolidated statement of cash flows
in EUR million, for the years ended 31 December | 2023 | 2022 | 2021 | |
Cash flows from operating activities | ||||
Result before tax | ||||
Adjusted for: | – Depreciation and amortisation | |||
– Addition to loan loss provisions | ||||
– Revaluations | - | - | ||
– Other non-cash items in Result before tax | - | |||
Taxation paid | - | - | - | |
Changes in: | – Loans and advances to banks, not available on demand | - | ||
– Deposits from banks, not payable on demand | - | - | ||
– Trading assets | - | - | - | |
– Trading liabilities | - | - | ||
– Loans and advances to customers | - | - | - | |
– Customer deposits | ||||
– Non–trading derivatives | - | |||
– Assets designated at fair value through profit or loss | - | |||
– Assets mandatorily at fair value through profit or loss | - | - | ||
– Other assets | - | - | ||
– Other financial liabilities at fair value through profit or loss | - | |||
– Provisions and other liabilities | - | - | ||
Net cash flow from/(used in) operating activities | - | - | - | |
Cash flows from investing activities | ||||
Investments and advances: | - Associates and joint ventures | - | - | - |
- Financial assets at fair value through other comprehensive income | - | - | - | |
- Securities at amortised cost | - | - | - | |
– Property and equipment | - | - | - | |
2023 | 2022 | 2021 | ||
– Other investments | - | - | - | |
Disposals and redemptions: | – Associates and joint ventures | |||
– Disposal of subsidiaries, net of cash disposed | ||||
- Financial assets at fair value through other comprehensive income | ||||
- Securities at amortised cost | ||||
– Property and equipment | ||||
– Other investments | ||||
Net cash flow from/(used in) investing activities | - | - | ||
Cash flows from financing activities 32 | ||||
Proceeds from debt securities | ||||
Repayments of debt securities | - | - | - | |
Proceeds from issuance of subordinated loans | ||||
Repayments of subordinated loans | - | - | - | |
Repayments of principal portion of lease liabilities | - | - | - | |
Purchase/sale of treasury shares | - | - | - | |
Dividends paid | - | - | - | |
Other financing | ||||
Net cash flow from/(used in) financing activities | ||||
Net cash flow | - | - | - | |
Cash and cash equivalents at beginning of year | ||||
Effect of exchange rate changes on cash and cash equivalents | - | - | - | |
Cash and cash equivalents at end of year | ||||
ING Group Annual Report 2023 on Form 20-FF - 244
Consolidated statement of cash flows - continued
Cash and cash equivalents | |||
in EUR million | 2023 | 2022 | 2021 |
Treasury bills and other eligible bills included in securities at AC | |||
Deposits from banks | - | - | - |
Loans and advances to banks | |||
Cash and balances with central banks | |||
Cash and cash equivalents at end of year | |||
Cash and cash equivalents includes deposits from banks and loans and advances to banks that are payable
on demand.
Included in Cash and cash equivalents are minimum mandatory reserve deposits held at various central
banks. Reference is made to Note 39 'Transfer of financial assets, assets pledged and received as collateral'
for restrictions on Cash and balances with central banks.
References relate to the accompanying notes. These are an integral part of the Consolidated financial
statements.
The table below presents the Interest and dividend received and paid.
in EUR million | 2023 | 2022 | 2021 |
Interest received | |||
Interest paid | - | - | - |
Dividend received 1 | |||
Dividend paid | - | - | - |
value through profit or loss, Financial assets at fair value through OCI, and from Investments in associates and joint ventures. Dividends
paid and received from trading positions have been included.
Dividends received from associates and joint ventures are included in investing activities, interest received,
interest paid and other dividends received are included in operating activities and dividend paid is included
in financing activities in the Consolidated statement of cash flows.
ING Group Annual Report 2023 on Form 20-FF - 245
1 Basis of preparation and material accounting policy information
1.1 Reporting entity and authorisation of the Consolidated financial statements
ING Groep N.V. is a company domiciled in Amsterdam, the Netherlands. Commercial Register of Amsterdam,
number 33231073. These Consolidated financial statements, as at and for the year ended 31 December
2023, comprise ING Groep N.V. (the Parent company) and its subsidiaries, together referred to as ING Group.
ING Group is a global financial institution with a strong European base, offering a wide range of retail and
wholesale banking services to customers in over 40 countries.
The ING Group Consolidated financial statements, as at and for the year ended 31 December 2023, were
authorised for issue in accordance with a resolution of the Executive Board on 4 March 2024. The Executive
Board has the power to amend the financial statements as long as these are not adopted by the General
Meeting of Shareholders. The General Meeting of the Shareholders may decide not to adopt the financial
statements, but may not amend these.
The ING Group Consolidated financial statements have been prepared in accordance with International
Financial Reporting Standards as issued by the International Accounting Standards Board for purposes of
reporting with the U.S. Securities and Exchange Commission (SEC), including financial information contained
in this Annual report on Form 20-F. The term ‘IFRS-IASB’ is used to refer to International Financial Reporting
Standards as issued by the International Accounting Standards Board, including the decisions ING Group
made with regard to the options available under IFRS-IASB.
The ING Group Consolidated financial statements have been prepared on a going concern basis and there
are no significant doubts about the ability of ING Group to continue as a going concern.
The Consolidated financial statements are presented in euros and rounded to the nearest million, unless
stated otherwise. Amounts may not add up due to rounding.
To improve transparency, reduce duplication and present related information in one place, certain
disclosures of the nature and extent of risks related to financial instruments required by IFRS 7 ‘Financial
instruments: Disclosures’ are included in the ‘Risk management’ section of the Annual Report.
These disclosures are an integral part of ING Group Consolidated financial statements and are indicated in
the ‘Risk management’ section by the symbol (*). Chapters, paragraphs, graphs or tables within the 'Risk
management' section that are indicated with this symbol in the respective headings or table header are
considered to be an integral part of the Consolidated financial statements.
The published 2023 Consolidated financial statements of ING Group are prepared in accordance with IFRS-
EU. IFRS-EU refers to International Financial Reporting Standards (‘IFRS’) as adopted by the European Union
(EU), including the decisions ING Group made with regard to the options available under IFRS as adopted by
the EU. IFRS-EU differs from IFRS-IASB in respect of certain paragraphs in IAS 39 ‘Financial Instruments:
Recognition and Measurement’ regarding hedge accounting for portfolio hedges of interest rate risk.
Under IFRS-EU, ING Group applies fair value hedge accounting for portfolio hedges of interest rate risk (fair
value macro hedges) in accordance with the EU carve-out version of IAS 39. Particularly, it is applied to
portfolio-based hedging strategies for retail lending (mortgages) and core deposits. Under the EU IAS 39
carve-out, hedge accounting may be applied, in respect of fair value macro hedges, to core deposits. In
addition, and in general to any hedge accounting relationship under the EU IAS 39 carve-out, the hedge
effectiveness requirements are less strict than under IFRS-IASB and hedge ineffectiveness is only recognised
when the revised estimate of the amount of cash flows in scheduled time buckets falls below the original
designated amount of that bucket and is not recognised when the revised amount of cash flows in
scheduled time buckets is more than the original designated amount. Under IFRS-IASB, hedge accounting
for fair value macro hedges cannot be applied to core deposits and ineffectiveness arises whenever the
revised estimate of the amount of cash flows in scheduled time buckets is either more or less than the
original designated amount of that bucket.
This information is prepared by reversing the hedge accounting impacts that are applied under the EU
‘carve-out’ version of IAS 39. Financial information under IFRS-IASB accordingly does not take account of the
possibility that had ING Group applied IFRS-IASB as its primary accounting framework it might have applied
alternative hedge strategies where those alternative hedge strategies could have qualified for IFRS-IASB
compliant hedge accounting. These decisions could have resulted in different shareholders’ equity and net
result amounts compared to those indicated in this Annual Report on Form 20-F.
ING Group Annual Report 2023 on Form 20-FF - 246
In 2023, forward interest rates decreased resulting in a negative EU IAS 39 carve out adjustment of EUR
-3,147 million (2022: EUR 8,451 million positive). The impact of the adjustment is mainly reflected in line
item 'Valuation results and net trading income' in the statement of profit or loss. A reconciliation between
IFRS-EU and IFRS-IASB is included below.
Both IFRS-EU and IFRS-IASB differ in several areas from accounting principles generally accepted in the
United States of America (US GAAP).
Reconciliation net result under IFRS-EU and IFRS-IASB | |||
in EUR million | 2023 | 2022 | 2021 |
In accordance with IFRS-EU (attributable to the shareholders of the parent) | |||
Adjustment of the EU IAS 39 carve-out | - | ||
Tax effect of the adjustment 1 | - | - | |
Effect of adjustment after tax | - | ||
In accordance with IFRS-IASB (attributable to the shareholders of the parent) | |||
Reconciliation shareholders’ equity under IFRS-EU and IFRS-IASB | |||
in EUR million | 2023 | 2022 | 2021 |
In accordance with IFRS-EU (attributable to the shareholders of the parent) | |||
Adjustment of the EU IAS 39 carve-out | - | ||
Tax effect of the adjustment 1 | - | - | |
Effect of adjustment after tax | - | ||
In accordance with IFRS-IASB Shareholders’ equity | |||
ING Group has consistently applied its accounting policies to all periods presented in these Consolidated
financial statements.
In 2023, ING Group updated the presentation in Note 13 'Customer deposits' to improve consistency and
ING Group had the following changes in accounting policies in the current reporting period:
IFRS 17 ‘Insurance Contracts’
IFRS 17, a new accounting standard for insurance contracts covering recognition and measurement,
presentation and disclosure requirements, became effective on 1 January 2023. IFRS 17 replaces IFRS 4
‘Insurance Contracts’, which allowed diversity in accounting practices for insurance contracts. IFRS 17
includes an optional scope exclusion for loans with death waivers.
ING Group does not have an insurance business, but on a limited basis sells insurance products as a broker
where it does not run the insurance risk, hence such contracts are not in scope of IFRS 17. However, ING
Group has a portfolio of loans with death waivers in the Netherlands with a net carrying amount of EUR 743
million at 1 January 2023. While IFRS 4 allowed separation of such contracts into two components in the
past (a loan in scope of IFRS 9 ‘Financial Instruments’ measured at amortised cost and an insurance contract
for the death waiver feature in scope of IFRS 4), IFRS 17 no longer allows such separation and requires such
instruments to be accounted for in their entirety using either IFRS 9 or IFRS 17.
ING Group chooses to apply IFRS 9 ’Financial Instruments’ to such loans with death waivers. As a result, this
portfolio no longer meets the ‘solely payments of principal and interest’ (SPPI) criterion. This causes the
portfolio to be measured at fair value through profit or loss instead of amortised cost from 1 January 2023.
This reclassification led to EUR -13 million impact on the opening total equity at 1 January 2023. Therefore,
the financial impact of IFRS 17 on ING Group is limited.
Accounting treatment of non-financial guarantees
ING Group changed its accounting policy for non-financial guarantees that are subject to contractual
indemnification rights (such as performance and other non-financial guarantees as well as letters of credit)
from IAS 37 principles to loan commitment accounting under IFRS 9. The re-scoping was triggered by the
introduction of IFRS 17 Insurance contracts and results in reliable and more relevant information,
particularly when credit risk is elevated as IFRS 9 expected credit losses model captures that risk earlier than
IAS 37. This voluntary policy change had a limited impact on ING’s opening total equity of EUR -33 million.
Other changes in IFRS effective in 2023
The following amendments to IFRS became effective in the current reporting period with no significant
impact for ING:
•Amendments to IAS 1 ‘Presentation of Financial Statements’: Disclosure of Accounting Policies (issued in
February 2021).
•Amendments to IAS 8 ‘Accounting Policies, Changes in Accounting Estimates and Errors’: Definition of
Accounting Estimates (issued in February 2021).
ING Group Annual Report 2023 on Form 20-FF - 247
1 Includes the effect of changes in tax rate
•Amendments to IAS 12 ‘Income Taxes’: Deferred Tax Related to Assets and Liabilities Arising From a
Single Transaction (issued in May 2021).
•Amendments to IAS 12 'Income Taxes': International Tax Reform - Pillar Two Model Rules. These
amendments allow ING Group to scope out Pillar Two model rules from the deferred tax recognition and
related disclosure requirements. More information on ING Group’s exposure to Pillar Two model rules is
included in Note 31 ‘Information on geographical areas'.
1.3.2 Upcoming changes in IFRS after 2023
The following published amendments are not mandatory for 2023 and have not been early adopted by ING
Group. The implementation of these amendments is expected to have no significant impact on ING Group's
Consolidated financial statements when they become effective.
Effective in 2024:
•Amendments to IFRS 16 'Leases': Lease Liability in a Sale and Leaseback (issued in September 2022).
•Amendments to IAS 1 ‘Presentation of Financial Statements’: Classification of Liabilities as Current or
Non-current (issued in January 2020).
•Amendments to IAS 7 'Statement of Cash flows' and IFRS 7 'Financial Instruments: Disclosures': Supplier
Finance Arrangements (issued in May 2023).
Effective in 2025:
•Amendments to IAS 21 'The Effects of Changes in Foreign Exchange Rates': Lack of Exchangeability
(issued in August 2023).
The preparation of the Consolidated financial statements requires management to make judgements in the
process of applying its accounting policies and to use estimates and assumptions. The estimates and
assumptions affect the reported amounts of the assets and liabilities and the amounts of the contingent
assets and contingent liabilities at the balance sheet date, as well as reported income and expenses for the
year. The actual outcome may differ from these estimates. The process of setting assumptions is subject to
internal control procedures and approvals.
ING Group has identified areas that require management to make significant judgements and use critical
accounting estimates and assumptions based on the information and financial data that may or may not
change in future periods. These areas are:
•Loan loss provisions (financial assets) (refer to Note 1.5.6 ‘Impairment of financial assets');
•The determination of the fair values of financial assets and liabilities (refer to Note 1.5.3 for ‘Fair values of
financial assets and liabilities’);
•Investment in associate - assessment of additional impairment losses or reversal of previous impairment
losses (refer to Note 1.10 ‘Investments in associates and joint ventures);
•Provisions (refer to Note 1.15 ‘Provisions, contingent liabilities and contingent assets’); and
•Accounting for Targeted Longer-Term Refinancing Operations (TLTRO) (refer to Note 1.5.8 ‘Accounting for
Targeted Longer-Term Refinancing Operations (TLTRO)').
ING Group applies IFRS 9 ‘Financial Instruments’ to the recognition, classification and measurement, and
derecognition of financial assets and financial liabilities and the impairment of financial assets. The Group
applies the requirements of IAS 39 ‘Financial Instruments: Recognition and Measurement’ for hedge
accounting purposes.
1.5.1 Recognition and derecognition of financial instruments
Recognition of financial assets
Financial assets are recognised in the balance sheet when ING Group becomes a party to the contractual
provisions of the instrument. For a regular way purchase or sale of a financial asset, trade date and
settlement date accounting is applied depending on the classification of the financial asset.
Derecognition of financial assets
Financial assets are derecognised when the rights to receive cash flows from the financial assets have
expired or where ING Group has transferred the rights to receive the cash flows from the financial asset or
assumed an obligation to pass on the cash flows and has transferred substantially all the risks and rewards
of the asset. If ING Group neither transfers nor retains substantially all the risks and rewards of ownership of
a financial asset, it derecognises the financial asset if it no longer has control over the asset. The difference
between the carrying amount of a financial asset that has been derecognised and the consideration
received is recognised in profit or loss.
Recognition of financial liabilities
Financial liabilities are recognised on the date that the entity becomes a party to the contractual provisions
of the instrument.
Derecognition of financial liabilities
Financial liabilities are derecognised when the obligation specified in the contract is discharged, cancelled or
expired. The difference between the carrying amount of a financial liability that has been extinguished and
the consideration paid is recognised in profit or loss.
ING Group Annual Report 2023 on Form 20-FF - 248
Financial assets
ING Group classifies its financial assets in the following measurement categories:
•those to be measured subsequently at fair value (either through OCI, or through profit or loss); and
•those to be measured at amortised cost (AC).
At initial recognition, ING Group measures a financial asset at its fair value plus, in the case of a financial
asset not at FVPL, transaction costs that are directly attributable to the acquisition of the financial asset.
Transaction costs of financial assets carried at fair value through profit or loss (FVPL) are expensed in the
statement of profit or loss.
Financial assets – Debt instruments
The classification depends on the entity’s business model for managing the financial assets and the
contractual terms of the cash flows at initial recognition.
Business models
Business models are classified as Hold to Collect (HtC), Hold to Collect and Sell (HtC&S) or Other depending
on how a portfolio of financial instruments as a whole is managed. ING Group’s business models are based
on the existing management structure of the bank, and refined based on an analysis of how businesses are
evaluated and reported, how their specific business risks are managed and on historic and expected future
sales. Sales are permissible in a HtC business model when these are due to an increase in credit risk, take
place close to the maturity date (where the proceeds from the sales approximate the collection of the
remaining contractual cash flows), are insignificant in value (both individually and in aggregate) or are
infrequent.
Contractual cash flows Solely Payments of Principal and Interest (SPPI)
The contractual cash flows of a financial asset are assessed to determine whether they represent SPPI.
Interest includes consideration for the time value of money, credit risk and for other basic lending risks such
as consideration for liquidity risk and costs associated with holding the financial asset for a particular period
of time. In addition, interest can include a profit margin that is consistent with a basic lending arrangement.
Financial assets with embedded derivatives are considered in their entirety when determining whether their
cash flows are SPPI.
In assessing whether the contractual cash flows are SPPI, ING Group considers the contractual terms of the
instrument. This includes assessing whether the financial asset contains a contractual term that could
change the timing or amount of contractual cash flows such that it would not meet this condition.
Based on the entity’s business model for managing the financial assets and the contractual terms of the
cash flows, there are three measurement categories into which ING Group classifies its debt instruments:
•Amortised Cost (AC):
Debt instruments that are held for collection of contractual cash flows under a HtC business model where
those cash flows represent SPPI are measured at AC. Interest income from these financial assets is
included in Interest income using the Effective Interest Rate (EIR) method. Any gain or loss arising on
derecognition is recognised directly in profit or loss. Impairment losses are presented as a separate line
item in the statement of profit or loss.
•FVOCI:
Debt instruments that are held for collection of contractual cash flows and for selling the financial assets
under a HtC&S business model, where the assets’ cash flows represent SPPI, are measured at FVOCI.
Movements in the carrying amount are recognised in OCI, except for the recognition of impairment gains
or losses, interest revenue and foreign exchange gains and losses which are recognised in profit or loss.
When the financial asset is derecognised, the cumulative gain or loss previously recognised in OCI is
reclassified from equity to profit or loss and presented in Investment income or Other net income, based
on the specific characteristics of the business model. Interest income from these financial assets is
included in Interest income using the EIR method. Impairment losses are presented as a separate line
item in the statement of profit or loss.
•FVPL:
Debt instruments that do not meet the criteria for AC or FVOCI are measured at FVPL. This includes debt
instruments that are held-for-trading (presented separately as Trading assets) and all other debt
instruments that do not meet the criteria for AC or FVOCI (presented separately as Mandatorily at FVPL).
ING Group may in some cases, on initial recognition, irrevocably designate a financial asset as classified
and measured at FVPL. This is the case where doing so eliminates or significantly reduces an accounting
mismatch that would otherwise arise on assets measured at AC or FVOCI. Fair value movements on
trading securities, trading loans and deposits (mainly reverse repo’s) are presented fully within valuation
result and net trading income, this also includes interest. The interest arising on financial assets
designated as at FVPL is recognised in profit or loss and presented within Interest income or Interest
expense in the period in which it arises. The interest arising on a debt instrument that is part of a hedge
relationship, but not subject to hedge accounting, is recognised in profit or loss and presented within
Interest income or Interest expense in the period in which it arises.
ING Group reclassifies debt instruments if, and only if, its business model for managing those financial
assets changes. Such changes in business models are expected to be very infrequent. There have been no
reclassifications during the reporting period.
ING Group Annual Report 2023 on Form 20-FF - 249
Financial assets – Equity instruments
All equity investments are measured at fair value. ING Group applies the fair value through OCI option to
investments which are considered strategic, consisting of investments that add value to ING Group’s core
banking activities.
There is no subsequent recycling of fair value gains and losses to profit or loss following the derecognition of
investments if elected to be classified and measured as FVOCI. However, the cumulative gain or loss is
transferred within equity to retained earnings on derecognition of such equity instruments. Dividends from
such investments continue to be recognised in profit or loss as Investment income when ING Group’s right to
receive payments is established. Impairment requirements are not applicable to equity investments
classified and measured as FVOCI.
Other remaining equity investments are measured at FVPL. All changes in the fair value are recognised in
Valuation result and Net trading income in the Consolidated statement of profit or loss.
Financial liabilities
Financial liabilities are classified and subsequently measured at AC, except for financial guarantee contracts,
derivatives and liabilities designated at FVPL. Financial liabilities classified and measured at FVPL are
presented as follows:
•the amount of change in the fair value that is attributable to changes in own credit risk of the liability
designated at FVPL is presented in OCI. Upon derecognition this Debit Valuation Adjustment (DVA) impact
does not recycle from OCI to profit or loss;
•the remaining amount of change in the fair value is presented in profit or loss in ‘Valuation results and
net trading income’. Interest on financial liabilities at FVPL is also recognised in the valuation result,
except for items voluntarily designated as FVPL for which interest is presented within ‘Interest income
(expense).
A financial guarantee contract is a contract that requires ING Group to make specified payments to
reimburse the holder for a loss it incurs because a specified debtor fails to make payment when due in
accordance with the original or modified terms of a debt instrument. Such a contract is initially recognised
at fair value and is subsequently measured at the higher of (a) the amount determined in accordance with
impairment provisions of IFRS 9 ‘Financial instruments’ (see section 'Impairment of financial assets') and (b)
the amount initially recognised less, when appropriate, cumulative amortisation recognised in accordance
with the revenue recognition principle of IFRS 15 ‘Revenue from contracts with customers’.
Securities sold subject to repurchase agreements (repos), securities lending and similar agreements
continue to be recognised in the Consolidated statement of financial position. The counterparty liability is
measured at FVPL (designated) and included in Other financial liabilities at FVPL if the asset is measured at
FVPL. Otherwise, the counterparty liability is included in Deposits from banks, Customer deposits, or Trading,
as appropriate.
Securities purchased under agreements to resell (reverse repos), securities borrowings and similar
agreements are not recognised in the Consolidated statement of financial position. The consideration paid
to purchase securities is recognised as Loans and advances to customers, Loans and advances to banks,
Other financial assets at FVPL or Trading assets, as appropriate. The difference between the sale and
repurchase price is treated as interest and amortised over the life of the agreement using the effective
interest method for instruments that are not measured at FVPL.
All financial assets and liabilities are recognised initially at fair value. The fair value of a financial instrument
on initial recognition is generally its transaction price (that is, the fair value of the consideration given or
received). However, if there is a material difference between the transaction price and the fair value of
financial instruments whose fair value is based on a valuation technique using significant unobservable
inputs, the entire day one difference (a ‘Day One Profit or Loss’) is deferred. ING Group defers the Day One
Profit or Loss relating to financial instruments classified as Level 3 and financial instruments with material
unobservable inputs into CVA which are not necessarily classified as Level 3. The deferred Day One Profit or
Loss is recognised in the statement of profit or loss over the life of the transaction until the transaction
matures, or until the significant unobservable inputs become observable, or until the significant
unobservable inputs become non-significant. In all other cases, ING Group recognises the difference as a
gain or loss at inception.
Subsequently, except for financial assets and financial liabilities measured at amortised cost, all the other
financial assets and liabilities are measured at fair value.
Fair value is defined as the price that would be received to sell an asset or paid to transfer a liability in an
orderly transaction between market participants at the measurement date. It assumes that market
participants would use and take into account the characteristics of the asset or liability when pricing the
asset or liability. Fair values of financial assets and liabilities are based on unadjusted quoted market prices
where available. Such quoted market prices are primarily obtained from exchange prices for listed financial
instruments. Where an exchange price is not available, quoted prices in an active market may be obtained
from independent market vendors, brokers, or market makers. In general, positions are valued at the bid
price for a long position and at the offer price for a short position or are valued at the price within the bid-
offer spread that is most representative of fair value in the circumstances. In some cases where positions
are marked at mid-market prices, a fair value adjustment is calculated.
For certain financial assets and liabilities, quoted market prices are not available. For such instruments, fair
value is determined using valuation techniques. These range from discounting of cash flows to various
ING Group Annual Report 2023 on Form 20-FF - 250
valuation models, where relevant pricing factors including the market price of underlying reference
instruments, market parameters (volatilities, correlations and credit ratings), and customer behaviour are
taken into account. ING Group maximises the use of market observable inputs and minimises the use of
unobservable inputs in determining the fair value. It can be subjective dependent on the significance of the
unobservable input to the overall valuation. All valuation techniques used are subject to internal review and
approval. Most data used in these valuation techniques are validated on a daily basis when possible.
When a group of financial assets and liabilities are managed on the basis of their net risk exposures, the fair
value of a group of financial assets and liabilities are measured on a net portfolio level.
To include credit risk in fair value, ING Group applies both Credit and Debit Valuation Adjustments (CVA, DVA,
also known as Bilateral Valuation Adjustments or BVA). Own issued debt and structured notes that are
designated at FVPL are adjusted for ING Group’s own credit risk by means of a DVA. To include the funding
risk, ING Group applies an additional ‘Funding Valuation Adjustment’ (FVA) to the uncollateralised derivatives
based on the market price of funding liquidity.ING Group also applies to certain positions other valuation
adjustments to arrive at the fair value: Bid-Offer adjustments, Model Risk Adjustments and Collateral
Valuation Adjustments (CollVA).
Significant judgements and critical accounting estimates and assumptions: •Even if market prices are available, when markets are less liquid there may be a range of prices for the same security from different price sources. Selecting the most appropriate price requires judgement and could result in different estimates of fair value. •Valuation techniques are subjective in nature and significant judgement is involved in establishing fair values for certain financial assets and liabilities. Valuation techniques involve various assumptions regarding pricing factors. The use of different valuation techniques and assumptions could produce significantly different estimates of fair value. •Price testing is performed to assess whether the process of valuation has led to an appropriate fair value of the position and to minimise the potential risks of economic losses due to incorrect or misused models. •Assessing whether a market is active, and whether an input is observable and significant, requires judgement. ING Group categorises its financial instruments that are either measured in the statement of financial position at fair value or of which the fair value is disclosed, into a three-level hierarchy based on the observability and significance of the valuation inputs. The use of different approaches to assess whether a market is active, whether an input is observable, and whether an unobservable input is significant could produce different classification within the fair value hierarchy as well as potentially different deferral of the Day One Profit or Loss. •Reference is made to Note 35 'Fair value of assets and liabilities ' and to the ‘Market risk’ paragraph in the ‘Risk management’ section of the Annual Report for the basis of the determination of the fair value of financial instruments and related sensitivities. | |||
IFRS 9 includes an accounting policy choice to defer the adoption of IFRS 9 hedge accounting and to
continue with hedge accounting under IAS 39. ING Group decided to exercise this accounting policy choice
and did not adopt IFRS 9 hedge accounting as of 1 January 2018.
Derivatives are initially recognised at fair value on the date on which a derivative contract is entered into
and are subsequently measured at fair value. Fair values are obtained from quoted market prices in active
markets, including market transactions and valuation techniques (such as discounted cash flow models and
option pricing models), as appropriate. All derivatives are carried as assets when their fair value is positive
and as liabilities when their fair value is negative. Fair value movements on derivatives are presented in
profit or loss in Valuation result and net trading income, except for derivatives in either a formal hedge
relationship and so-called economic hedges that are not in a formal hedge accounting relationship where a
component is presented separately in interest result in line with ING Group’s risk management strategy.
ING Group Annual Report 2023 on Form 20-FF - 251
Embedded derivatives are separated from financial liabilities and other non-financial contracts and
accounted for as a derivative if, and only if:
1.the economic characteristics and risks of the embedded derivative are not closely related to the
economic characteristics and risks of the host contract;
2.a separate instrument with the same terms as the embedded derivative would meet the definition of a
derivative; and
3.the combined instrument is not measured at fair value with changes in fair value reported in profit or
loss.
If an embedded derivative is separated, the host contract is accounted for as a similar free-standing
contract.
The method of recognising the resulting fair value gain or loss depends on whether the derivative is
designated as a hedging instrument, and if so, the nature of the item being hedged. ING Group designates
certain derivatives as hedges of the fair value of recognised assets or liabilities or firm commitments (fair
value hedge), hedges of highly probable future cash flows attributable to a recognised asset or liability or a
forecast transaction (cash flow hedge), or hedges of a net investment in a foreign operation. Hedge
accounting is used for derivatives designated in this way provided certain criteria are met.
At the inception of the transaction, ING Group documents the relationship between hedging instruments
and hedged items, its risk management objective, together with the methods selected to assess hedge
effectiveness. ING Group also documents its assessment, both at hedge inception and on an ongoing basis,
of whether the derivatives that are used in hedging transactions are highly effective in offsetting changes in
fair values or cash flows of the hedged items.
Fair value hedges
Changes in the fair value of derivatives that are designated and qualify as fair value hedges are recognised
in the statement of profit or loss, together with fair value adjustments to the hedged item attributable to
the hedged risk. If the hedge relationship no longer meets the criteria for hedge accounting, the cumulative
adjustment of the hedged item is, in the case of interest bearing instruments, amortised through the
statement of profit or loss over the remaining term of the original hedge or recognised directly when the
hedged item is derecognised. For non-interest bearing instruments, the cumulative adjustment of the
hedged item is recognised in the statement of profit or loss only when the hedged item is derecognised.
Cash flow hedges
The effective portion of changes in the fair value of derivatives that are designated and qualify as cash flow
hedges are recognised in the Other Comprehensive Income. The gain or loss relating to the ineffective
portion is recognised immediately in the statement of profit or loss. Amounts accumulated in the Other
Comprehensive Income are recycled to the statement of profit or loss in the periods in which the hedged
item affects net result. When a hedging instrument expires or is sold, or when a hedge no longer meets the
criteria for hedge accounting, any cumulative gain or loss existing in the Other Comprehensive Income at
that time remains in the Other Comprehensive Income and is recognised when the forecast transaction is
ultimately recognised in the statement of profit or loss. When a forecast transaction is no longer expected
to occur, the cumulative gain or loss that was reported in the Other Comprehensive Income is transferred
immediately to the statement of profit or loss.
Net investment hedges
Hedges of net investments in foreign operations are accounted for in a similar way to cash flow hedges. Any
gain or loss on the hedging instrument relating to the effective portion of the hedge is recognised in the
Other Comprehensive Income and the gain or loss relating to the ineffective portion is recognised
immediately in the statement of profit or loss. Gains and losses accumulated in the Other Comprehensive
Income are included in the statement of profit or loss when the foreign operation is disposed.
IBOR Transition – specific policies for hedges directly affected by IBOR reform
As explained in the ‘IBOR Transition’ paragraph of the ‘Risk management’ section, a fundamental review of
important interest rates benchmarks has been carried out, and it is still in process for some of them (for
instance, WIBOR).
Given that IBOR reform may have various accounting implications, the International Accounting Standards
Board (IASB) has undertaken a two-phase project. Phase 1 addresses those issues that affect financial
reporting before the replacement of an existing benchmark. Phase 1 amendments to IFRS were issued by
the IASB in 2019. Phase 2 focuses on issues that may affect financial reporting when the existing benchmark
rate is reformed or replaced. Phase 2 amendments to IFRS were issued by the IASB in 2020.
Phase 1 amendments to IFRS allow ING Group to apply a set of temporary exceptions to continue hedge
accounting even when there is uncertainty about contractual cash flows arising from the reform. Under
these temporary exceptions, interbank offered rates are assumed to continue unaltered for the purposes of
hedge accounting until such time as the uncertainty is resolved.
More specifically, the following temporary reliefs are part of the Phase 1 amendments:
•Highly probable requirement for cash flow hedges
When determining whether a forecast transaction is highly probable, it is assumed that the interest rate
benchmark on which the hedged cash flows are based is not altered as a result of the reform.
•Prospective assessment of hedge effectiveness
When performing the prospective assessment it is assumed that the interest rate benchmark on which
the hedged cash flows are based is not altered as a result of the reform.
ING Group Annual Report 2023 on Form 20-FF - 252
•Retrospective assessment of hedge effectiveness
When performing the retrospective assessment hedges are allowed to pass the assessment even if
actual results are outside the 80-125% range, during the period of uncertainty arising from the IBOR
reform.
•Designation of a component of an item as a hedged item
For hedges of the benchmark component of interest rate risk affected by the reform, the separately
identifiable requirement only needs to be demonstrated at the inception of such hedging relationships.
The amendments are relevant given that ING Group hedges and applies hedge accounting to benchmark
interest rate exposure part of IBOR reform. ING Group hedges are being progressively amended, where
necessary, to incorporate the new benchmark rates. Temporary exceptions under Phase 1 continued to be
relevant for ING Group as at 31 December 2023 (mainly for WIBOR hedges).
ING Group will completely cease to apply the amendments when this uncertainty is no longer present or
when the hedging relationship is discontinued. Refer to note ‘Risk management/ IBOR Transition’ for the
disclosures relating to the application of the amendments as part of Phase 1 and for more information
regarding the end of Phase 1 reliefs for ING Group’s hedging relationships.
Phase 2 amendments require that hedge accounting continues on transition to risk free rates provided that
the modifications made to financial instruments are those necessary to implement the IBOR Reform and
that the new basis for calculating cash flows is ‘economically equivalent’ to the previous basis. Particularly,
Phase 2 amendments allow the continuation of hedging relationships, subject to amending their
documentation to reflect changes in hedged instruments, hedging instruments, hedged risk, and/or the
method for measuring effectiveness during the transition to the new benchmark rates. During 2023, Phase 2
continued to be relevant for ING Group when ING actually transitioned its financial instruments (designated
in hedge accounting relationships) to the new benchmark rates (mainly, USD LIBOR).
More specifically, the following temporary reliefs are part of the Phase 2 amendments:
Relief from discontinuing hedging relationships
•Amendments in the hedge documentation as a consequence of changes required by the IBOR reform do
not result in the discontinuation of the hedge relationship nor the designation of a new hedge
relationship. The changes can be in form of designating an alternative benchmark rate as a hedged risk,
the description of the hedging instrument, the description of the hedged item, or the method to measure
the effectiveness.
•When the hedged item is amended as a consequence of the IBOR reform (or if the hedge has previously
been discontinued), amounts accumulated in the cash flow hedge reserve are deemed to be based on
the Risk-Free Rate (RFR). This results in the release of the cash flow hedge reserve to profit or loss in the
same period or periods in which the hedged cash flows that are now based on the RFR affect profit or
loss.
•When the items within a designated group of hedged items are amended as a consequence of the IBOR
reform, the hedging strategy remains and is not discontinued. As items within the hedged group
transition at different times from IBORs to RFRs, they are transferred to sub-groups of instruments that
reference RFRs as the hedged risk. The existing IBORs remain designated as the hedged risk for the other
sub-group of hedged items, until they are also updated to reference the new RFR. The usual hedge
accounting requirements are applied to the hedge relationship in its entirety.
•For the assessment of retrospective hedge effectiveness, the cumulative fair value changes may be reset
to zero when the exception to the retrospective assessment of the Phase 1 reliefs ends. This election is
made separately for each hedging relationship (i.e., on a hedge-by-hedge basis).
•Temporary relief from having to meet the separately identifiable requirement: a RFR is considered a
separately identifiable risk component if it is reasonably expected to meet the separately identifiable
requirement within 24 months from the date it is first designated as a non-contractually specified risk
component (i.e. when the entity first designates the RFR as a non-contractually specified risk
component). This relief applies to each RFR on a rate-by-rate basis.
Non-trading derivatives that do not qualify for hedge accounting
Derivative instruments that are used by ING Group as part of its risk management strategies, but which do
not qualify for hedge accounting under ING Group’s accounting policies, are presented as non-trading
derivatives. Non-trading derivatives are measured at fair value with changes in the fair value taken to the
statement of profit or loss.
Financial assets and financial liabilities are offset, and the net amount is reported in the statement of
financial position when ING Group has a current legally enforceable right to set off the recognised amounts
and intends to either settle on a net basis or to realise the asset and settle the liability simultaneously.
Offsetting is applied to certain derivatives for which the services of a central clearing house or broker are
used.
An Expected Credit Loss (ECL) model is applied to financial assets accounted for at AC or FVOCI such as
loans, debt securities and lease receivables, as well as off-balance sheet items such as undrawn loan
commitments, certain financial guarantees issued, and undrawn committed revolving credit facilities. Under
the ECL model, ING Group calculates the expected credit losses (ECL) by considering on a discounted basis
the cash shortfall it would incur in case of a default and multiplying the shortfall by the probability of a
default occurring. The ECL is the sum of the probability-weighted outcomes. The ECL estimates are unbiased
and include reasonable and supportable information about past events, current conditions, and forecasts of
ING Group Annual Report 2023 on Form 20-FF - 253
future economic conditions. ING Group’s approach leverages the Advanced Internal Ratings Based (AIRB)
models that are used for regulatory purposes. Adjustments are applied to make these models suitable for
determining ECL. ECL is recognised on the balance sheet as loan loss provisions (LLP).
Three-stage approach
Financial assets are classified in one of the below three stages at each reporting date. A financial asset can
move between stages during its lifetime. The stages are based on changes in credit quality since initial
recognition and defined as follows:
•Stage 1
Financial assets that have not had a significant increase in credit risk since initial recognition (i.e. no
Stage 2 or 3 triggers apply). Assets are classified as Stage 1 upon initial recognition (with the exception of
purchased or originated credit impaired (POCI) assets) and ECL is determined by the probability that a
default occurs in the next 12 months (12 months ECL);
•Stage 2
Financial assets showing a significant increase in credit risk since initial recognition. For assets in Stage 2
ECL reflects an estimate on the credit losses over the remaining maturity of the asset (lifetime ECL); or
•Stage 3
Financial assets that are credit-impaired. Also for these assets ECL is determined over the remaining
maturity of the asset.
Significant increase in credit risk
ING Group established a framework, incorporating quantitative and qualitative indicators, to identify and
assess significant increases in credit risk (SICR). This is used to determine the appropriate ECL Stage for each
financial asset.
The main determinate of SICR is a quantitative test, whereby the lifetime Probability of Default (PD) of an
asset at each reporting date is compared against its lifetime PD determined at the date of initial recognition.
If the delta is above pre-defined absolute or relative thresholds the item is considered to have experienced a
SICR. Furthermore, any facility which shows an increase of 200% between the PD at the date of initial
recognition and the lifetime PD at the reporting date (i.e. threefold increase in PD) must be classified as
Stage 2. This is considered a backstop within the quantitative assessment of SICR. Refer to ‘Criteria for
identifying a significant increase in credit risk’ in the ‘Risk Management’ section of the Annual Report for
more details on relative and absolute PD thresholds, including quantitative disclosures on those thresholds.
Consequently, if the above quantitative SICR thresholds are exceeded, the item moves from Stage 1 to Stage
2 (unless the item is credit-impaired). In these instances, items are no longer assigned a 12-month ECL and
instead are assigned a lifetime ECL. Items can return to Stage 1 if there is sufficient evidence that there is no
longer a significant increase in credit risk.
ING Group also relies on a number of qualitative indicators to identify and assess SICR. These include:
•Forbearance status;
•Watch List status;
•Intensive care management;
•Collective SICR assessment;
•Substandard Internal rating; and
•Arrears status (including 30 days past due used as a backstop).
An asset that is in Stage 2 will move back to Stage 1 when none of the above criteria are in place anymore.
However, if the asset was moved to Stage 2 based on the forbearance status, then the asset stays in Stage
2 for at least 24 months. If the asset was classified as Stage 2 due to 30 days past due trigger, then the
asset is moved back to Stage 1 only after three months from when the trigger no longer applies.
Credit-impaired financial assets (Stage 3)
Financial assets are assessed for credit-impairment at each reporting date and more frequently when
circumstances warrant further assessment. Evidence of credit-impairment includes arrears of over 90 days
on any material credit obligation, indications that the borrower is experiencing significant financial difficulty,
a breach of contract, bankruptcy or distressed restructuring. The definition of credit-impaired under IFRS 9
(Stage 3) is aligned with the definition of default used by ING Group for internal risk management purposes,
which is also the definition used for regulatory purposes.
An asset (other than a POCI asset) that is in Stage 3 will move back to Stage 2 when, as at the reporting
date, it is no longer considered to be credit-impaired subject to certain probation periods. The asset will
migrate back to Stage 1 when its credit risk at the reporting date is no longer considered to have increased
significantly since initial recognition.
Macroeconomic scenarios
ING Group has established a quarterly process whereby forward-looking macroeconomics scenarios and
probability weightings are developed for the purpose of ECL. ING Group applies data predominantly from a
leading service provider enriched with the internal ING Group view. A baseline, up-scenario and a down-
scenario are determined to reflect an unbiased and probability-weighted ECL amount. As a baseline
scenario, ING Group applies the market-neutral view combining consensus forecasts for economic variables
such as unemployment rates, GDP growth, house prices, commodity prices, and short-term interest rates.
Applying market consensus in the baseline scenario ensures unbiased estimates of the expected credit
losses.
The alternative scenarios are based on observed forecast errors in the past, adjusted for the risks affecting
the economy today and the forecast horizon. The probabilities assigned are based on the likelihoods of
ING Group Annual Report 2023 on Form 20-FF - 254
observing the three scenarios and are derived from confidence intervals on a probability distribution. The
forecasts for the economic variables are adjusted on a quarterly basis.
The probability weights applied to each of the three scenarios
ING Group uses three macroeconomic scenarios when determining IFRS 9 ECL (baseline, upside and
downside). Management approach used to determine the weights of each scenario and in selecting the
parts of the distribution of forecast errors from which the weights are derived and disclosed in the
‘Alternative scenarios and probability weights’ and the sensitivity analysis in the ‘Risk Management’ section
of the Annual Report.
Measurement of ECL
ING Group applies a collective assessment method to measure ECL for Stage 1, Stage 2, and certain Stage 3
assets. Other credit-impaired assets subject to ECL measurement apply the individual assessment method.
Collectively assessed assets (Stages 1 to 3)
For collective assessed assets, ING Group applies a model-based approach. ECL is determined by, expressed
simplistically, multiplying the probability of default (PD) with the loss given default (LGD) and exposure at
default (EAD), adjusted for the time value of money. Assets that are collectively assessed are grouped on
the basis of similar credit risk characteristics, taking into account loan type, industry, geographic location,
collateral type, past due status and other relevant factors. These characteristics are relevant to the
estimation of future cash flows for groups of such assets by being indicative of the debtors’ ability to pay all
amounts due according to the contractual terms of the assets being evaluated and the loss in case the
debtor is not able to pay all amounts due.
For Stage 3 assets the PD equals 100% and the LGD and EAD represent a lifetime view of the losses based on
characteristics of defaulted facilities.
For the purpose of ECL, ING Group’s expected credit loss models (PD, LGD, EAD) used for regulatory purposes
have been adjusted. These adjustments include removing embedded prudential conservatism (such as
floors) and converted through-the-cycle estimates to point-in-time estimates. The models assess ECL on the
basis of forward-looking macroeconomic forecasts and other inputs. For most financial assets, the expected
life is limited to the remaining maturity. For overdrafts and certain revolving credit facilities, such as credit
cards, the maturity is estimated based on historical data as these do not have a fixed term or repayment
schedule.
Individually assessed assets (Stage 3)
ING Group estimates ECL for individually significant credit-impaired financial assets within Stage 3 on an
individual basis. ECL for these Individually assessed assets are determined using the discounted expected
future cash flow method. To determine expected future cash flows, one or more scenarios are used. Each
scenario is analysed based on the probability of occurrence and includes forward looking information.
In determining the scenarios, all relevant factors impacting the future cash flows are taken into account.
These include expected developments in credit quality, business and economic forecasts, and estimates of
if/when recoveries will occur taking into account ING Group’s restructuring/recovery strategy.
The best estimate of ECL is calculated as the weighted-average of the shortfall (gross carrying amount
minus discounted expected future cash flow using the original EIR) per scenario, based on best estimates of
expected future cash flows. Recoveries can arise from, among others, repayment of the loan, collateral
recovery and the sale of the asset. Cash flows from collateral and other credit enhancements are included in
the measurement of ECL of the related financial asset when it is part of or integral to the contractual terms
of the financial asset and the credit enhancement is not recognised separately. For the individual
assessment, with granular (company or asset-specific) scenarios, specific factors can have a larger impact
on the future cash flows than macroeconomic factors.
When a financial asset is credit-impaired, interest is no longer recognised based on the accrual income
based on the gross carrying amount of the asset. Rather, interest income is calculated by applying the
original EIR to the AC of the asset, which is the gross carrying amount less the related loan loss provision.
Purchased or Originated Credit Impaired (POCI) assets
POCI assets are financial assets that are credit-impaired on initial recognition. Impairment on a POCI asset is
determined based on lifetime ECL from initial recognition. POCI assets are recognised initially at an amount
net of ECL and are measured at AC using a credit-adjusted effective interest rate. In subsequent periods any
changes to the estimated lifetime ECL are recognised in profit or loss. Favourable changes are recognised as
an impairment gain even if the lifetime ECL at the reporting date is lower than the estimated lifetime ECL at
origination.
Write-off and debt forgiveness
Loans and debt securities are written off (either partially or in full) when there is no reasonable expectation
of recovery and/or collectability of amounts due. The following events can lead to a write-off:
•After a restructuring has been completed and there is a high improbability of recovery of part of the
remaining loan exposure (including partial debt forgiveness);
•In a bankruptcy liquidation scenario;
•After divestment or sale of a credit facility at a discount; and
•Specific fraud cases with no recourse options.
ING Group Annual Report 2023 on Form 20-FF - 255
When a loan is uncollectable, it is written off against the related loan loss provision. Subsequent recoveries
of amounts previously written off are recognised in ‘Addition to loan loss provisions’ in the Consolidated
statement of profit or loss.
Debt forgiveness (or debt settlement) involves write-off but additionally involves the forgiveness of a legal
obligation, in whole or in part. This means that ING Group forfeits the legal right to recover the debt. As a
result, the financial asset needs to be derecognised.
Presentation of ECL
ECL for financial assets measured at AC are deducted from the gross carrying amount of the assets. For
debt instruments at FVOCI, the ECL is recognised in OCI, instead of deducted the carrying amount of the
asset. ECL also reflects any credit losses related to the portion of the loan commitment that is expected to
be drawn down over the remaining life of the instrument. The ECL on issued financial guarantee contracts,
in scope of IFRS 9 and not measured at FVPL, are recognised as liabilities and presented in Other provisions.
ECL are presented in profit or loss in Addition to loan loss provision.
Significant judgements and critical accounting estimates and assumptions: The calculation of ECL requires a number of judgements and estimates. In particular: •ING Group makes various assumptions about the risk of default, the credit loss rates in case of a default and expected future cash flows. For collective provisions, ING Group applies significant judgement when estimating modelled parameters such as PD, LGD and EAD, including the selection and calibration of relevant models. For Stage 3 individual provisioning, the determination and probabilities of restructuring and recovery scenarios as well as the amount and timing of expected future cash flows may be particularly subjective. •Forward-looking macroeconomic scenarios used in impairment assessments are uncertain in nature. The use of alternate forward-looking macroeconomic scenarios can produce significantly different estimates of ECL. This is demonstrated in the sensitivity analysis in the ‘Risk Management’ section of the Annual Report, where the un-weighted ECL under each of the three scenarios for some significant portfolios is disclosed. | |||
•When determining whether the credit risk on a financial asset has increased significantly (criteria for identifying a significant increase in credit risk), ING Group considers reasonable and supportable information to compare the risk of default occurring at reporting date with the risk of a default occurring at initial recognition of the financial asset. Whilst judgement is required in applying a PD rating to each financial asset, there is significant judgement used in determining the Stage allocation PD banding thresholds. The process of comparing a financial asset’s PD with the PD banding thresholds determines its ECL Stage. Assets in Stage 1 are allocated a 12-month ECL, and those in Stage 2 are allocated a lifetime ECL, and the difference is often significant. As such, the judgement made in assigning financial asset PDs and the PD banding thresholds constitute a significant judgement. Analysis of the sensitivity associated with the assessment of significant increase in credit risk is presented in the ‘Risk Management’ section of the Annual Report. •Judgement is exercised in management’s evaluation of whether there is objective evidence that exposures are credit-impaired. •To reflect the risks that are not properly captured by the ECL models, a number of management adjustments to the model-based ECL were necessary as at 31 December 2023, which required significant judgement. Reference is made to the ‘Management adjustments applied this year’ paragraph in the ‘Risk management’ section of the Annual Report. | |||
In certain circumstances ING Group grants borrowers postponement, reduction of loan principal and/or
interest payments on a temporary period of time to maximise collection opportunities, and if possible, avoid
default, foreclosure, or repossession. When such postponement, reduction of loan principal and/or interest
payments is executed based on credit concerns it is also referred to as forbearance (refer to the ‘Risk
Management’ section of the Annual Report for more details) and requires analysis on whether the
contractual terms have been substantially modified or not. A similar assessment is needed when
contractual terms are modified for other reasons than forbearance.
ING Group determines whether there has been a substantial modification using both quantitative and
qualitative factors. If the modification results in a substantial modification of the terms of the loan, the
original loan is derecognised and a new loan is recognised at fair value at the modification date. In case of a
non-substantial modification, a modification gain or loss is recognised in profit or loss.
ING Group participates in Targeted Longer-Term Refinancing Operations (TLTRO III). ING Group considers
TLTRO funding provided by the ECB to banks to be on market terms on the basis that the ECB has
ING Group Annual Report 2023 on Form 20-FF - 256
established a separate market with TLTRO programmes. They have specific terms which are different from
other sources of funding available to banks, including those provided by the ECB. Consequently, the rate
under TLTRO is considered to be a market conforming rate and TLTRO funding is recognised fully as a
financial liability.
ING Group interprets the whole rate set by the ECB under TLTRO as a floating rate on the financial liability,
being the market rate for each specific period in time. This results in discrete rates for discrete interest
periods over the life of TLTRO. The change in the applicable rate between interest periods is seen as a
change in the floating rate and is accounted for prospectively. Similarly, if the ECB announces changes in
the rate for the amounts already drawn under the existing TLTRO, then such changes also represent a
change in a floating rate. Following this, such changes lead to the recognition of an increased/decreased
interest in the relevant period of life of the exposure, rather than by the recognition of an immediate
modification gain or loss at the moment of the change of terms by the ECB. If the change relates to the
periods already passed, the impact for those past periods is recognised in profit or loss immediately.
Furthermore, the change in the TLTRO rate driven by changes in expectations of meeting the targets
impacts interest income. As a result, interest income which relates to the period that already passed until
the moment when the change in expectations occurs, is recognised as a catch up adjustment in
Consolidated statement of profit or loss. This change occurs only when ING Group has a reasonable
expectation that the lending targets will be met.
ING Group views ‘reasonable expectation’ in case of TLTRO funding as a high hurdle. This is the moment
when it becomes highly probable, i.e. the probability of meeting the lending targets is substantially greater
than the probability that it will not. As a result, if interest income is recognised during the period based on
the expectation of meeting the targets, there should only be a limited possibility that the interest may need
to be reversed in future reporting periods.. Reference is made to note 12 ‘Deposits from banks’ and to note
20 ‘Net interest income’ for the presentation of ING Group’s participation in TLTRO programmes.
Significant judgements: Significant management judgement is exercised in determining the accounting treatment of TLTRO transactions. In particular, ING Group applied judgement in: •assessing and concluding that in ING Group’s view the rate under TLTRO is considered to be a market conforming rate and, hence, accounting for TLTRO in accordance with IFRS 9; •selecting accounting policies regarding the calculation of the effective interest rate under TLTRO. | |||
ING Group comprises ING Groep N.V. (the Parent Company), ING Bank N.V. and all other subsidiaries.
Subsidiaries are entities controlled by ING Groep N.V. Control exists if ING Groep N.V. is exposed to or has
rights to variable returns and has the ability to affect those returns through the power over the subsidiary.
For interests in structured entities, the existence of control requires judgement as these entities are
designed so that voting or similar rights are not the dominant factor in deciding who controls the entity. This
judgement includes, for example, the involvement in the design of the structured entity, contractual
arrangements that give rights to direct the structured entities relevant activities and commitment to ensure
that the structured entity operates as designed.
Transactions between ING Groep N.V. and its subsidiaries are eliminated on consolidation. Reference is
made to Note 44 'Principal subsidiaries, investments in associates and joint ventures' for a list of principal
subsidiaries and their statutory place of incorporation and a description of ING's activities involving
structured entities is included in Note 45 'Structured entities'.
A list containing the information referred to in Section 379 (1), Book 2 of the Dutch Civil Code has been filed
with the office of the Commercial Register of Amsterdam, in accordance with Section 379 (5), Book 2 of the
Dutch Civil Code.
ING Groep N.V. and its Dutch group companies are subject to legal restrictions regarding the amount of
dividends they can pay to their shareholders. The Dutch Civil Code contains the restriction that dividends
can only be paid up to an amount equal to the excess of the company’s own funds over the sum of the
paid-up capital and reserves required by law. Certain Group companies are also subject to other restrictions
in certain countries, in addition to the restrictions on the amount of funds that may be transferred in the
form of dividends, or otherwise, to the parent company.
Furthermore, in addition to the restrictions in respect of minimum capital requirements that are imposed by
industry regulators in the countries in which the subsidiaries operate, other limitations exist in certain
countries.
An operating segment is a distinguishable component of ING Group, engaged in providing products or
services, whose operating results are regularly reviewed by the Executive Board of ING Group and the
Management Board Banking (together the Chief Operating Decision Maker (CODM)) to make decisions about
resources to be allocated to the segments and assess its performance. A geographical area is a
distinguishable component of ING Group engaged in providing products or services within a particular
economic environment that is subject to risks and returns that differ from those of segments operating in
other economic environments.
ING Group Annual Report 2023 on Form 20-FF - 257
The CODM reviews and assesses ING Group's performance primarily by line of business. As a result, ING
identified five operating segments which are also disclosed as reportable segments. Additionally, the CODM
receives information by geographical area based on the location of the office from which transactions are
originated.
Since the second quarter of 2022, Türkiye has been considered a hyperinflationary economy for accounting
purposes. As ING Group has a subsidiary in Türkiye, ING Group has applied IAS 29 ‘Financial Reporting in
Hyperinflationary Economies’ to its operations since 2022 as if the economy in Türkiye had always been
hyperinflationary. Given that ING Group presents its results in EUR, comparatives do not get restated. As a
result, 2021 comparatives were not impacted by IAS 29, while 2022 comparatives show the impact of the
first-time application of IAS 29, as well as the effect for 2022. IAS 29 continued to be relevant for ING’s
operations in Türkiye in 2023. Under IAS 29, the results of the operations in Türkiye should be stated in
terms of the current purchasing power at the reporting date. For that, the consumer price index (CPI) as
determined by the Turkish Statistical Institute was used. The CPI for Türkiye (2003=100) at 31 December
2023 was 1,859.38 and at 31 December 2022 was 1,128.45 (movement 2023: 64.77 %; movement 2022:
comprehensive income and the balance sheet has been recognised in the statement of profit or loss within
‘Other net income’ as a ‘Net monetary gain or loss’. The net monetary loss for the period represents the loss
of purchasing power by the net monetary position (monetary assets exceeding monetary liabilities) of ING
Türkiye.
After the application of the above restatement procedures in Turkish Lira under IAS 29, the financial position
and the results for the period of ING Türkiye are translated and presented in EUR at the exchange rate on 31
December 2023. For the statement of comprehensive income this is in contrast with the usual translation
procedures where items of comprehensive income are translated at the exchange rate at the date of
transaction. Furthermore, ING Group selected to present both the restatement effect resulting from
restating ING Group’s interest in the equity of ING Türkiye as required by IAS 29, and the translation effect
from translating at a closing rate that differs from the previous closing rate, in the Currency translation
Functional and presentation currency
Items included in the financial statements of each of ING Group’s entities are measured using the currency
of the primary economic environment in which the entity operates (the functional currency). The
Consolidated financial statements are presented in euros, which is ING Group’s presentation currency.
Transactions and balances
Foreign currency transactions are translated into the functional currency using the exchange rate prevailing
at the date of the transactions. Exchange rate differences resulting from the settlement of such
transactions and from the translation at year-end exchange rates of monetary assets and liabilities
denominated in foreign currencies are recognised in the statement of profit or loss, except when deferred in
equity as part of qualifying cash flow hedges or qualifying net investment hedges.
Non-monetary items that are measured in terms of historical cost in a foreign currency are translated using
the exchange rate at the date of the transaction.
Exchange rate differences on non-monetary items, measured at fair value through profit or loss, are
reported as part of the fair value gain or loss. Non-monetary items are retranslated at the date the fair
value is determined. Exchange rate differences on non-monetary items measured at fair value through
other comprehensive income are included in other comprehensive income and get accumulated in the
revaluation reserve in equity.
Exchange rate differences in the statement of profit or loss are generally included in ‘Valuation results and
net trading income’. Reference is made to Note 22 ‘Valuation results and net trading income’, which
discloses the amounts included in the statement of profit or loss. Exchange rate differences relating to the
disposal of debt and FVPL equity securities are considered to be an inherent part of the capital gains and
losses recognised in Investment income. As mentioned below, in Group companies relating to the disposals
of group companies, any exchange rate difference deferred in equity is recognised in the statement of profit
or loss in ‘Result on disposal of group companies’. Reference is also made to Note 19 ‘Equity’, which discloses
the amounts included in the statement of profit or loss.
Group companies
The results and financial positions of all group companies that have a functional currency different from the
presentation currency are translated into the presentation currency as follows:
•Assets and liabilities are translated at the closing rate at the date of the statement of financial position;
•Income and expenses are translated at average exchange rates (unless this average is not a reasonable
approximation of the cumulative effect of the rates prevailing on the transaction dates, in which case
income and expenses are translated at the dates of the transactions). However, under hyperinflation
accounting, income and expenses of ING Türkiye are translated at the closing rate; and
•All resulting exchange rate differences are recognised in a separate component of equity.
On consolidation, exchange rate differences arising from the translation of a monetary item that forms part
of the net investment in a foreign operation, and of borrowings and other instruments designated as
hedges of such investments, are taken to shareholders’ equity. When a foreign operation is sold, the
corresponding exchange rate differences are recognised in the statement of profit or loss as part of the gain
or loss on sale.
ING Group Annual Report 2023 on Form 20-FF - 258
Goodwill and fair value adjustments arising from the acquisition of a foreign operation are treated as assets
and liabilities of the foreign operation and translated at the exchange rate prevailing at the balance sheet
Associates are all entities over which ING Group has significant influence but not control. Significant
influence is the ability to participate in the financial and operating policies of the investee. It generally
results from a shareholding of between 20% and 50% of the voting rights or through situations including,
but not limited to one or more of the following:
•Representation on the board of directors;
•Participation in the policymaking process; and
•Interchange of managerial personnel.
Joint ventures are entities over which ING Group has joint control.
Investments in associates and joint ventures are initially recognised at cost and subsequently accounted for
using the equity method of accounting.
ING Group’s investment in associates and joint ventures (net of any accumulated impairment loss) includes
goodwill identified on acquisition. ING Group’s share of its associates and joint ventures post-acquisition
profits or losses is recognised in the statement of profit or loss, and its share of post-acquisition changes in
reserves is recognised in equity. The cumulative post-acquisition changes are adjusted against the carrying
amount of the investment. When ING Group’s share of losses in an associate or joint venture equals or
exceeds its interest in the associate or joint venture, including any long-term interests in the associate like
uncollateralised loans that are neither planned nor likely to be settled in the foreseeable future, ING Group
does not recognise further losses, unless it has incurred obligations or made payments on behalf of the
associate or joint venture.
Unrealised gains on transactions between ING Group and its associates and joint ventures are eliminated to
the extent of ING Group’s interest in the associates and joint ventures. Unrealised losses are also eliminated
unless they provide evidence of an impairment of the asset transferred. Accounting policies of associates
and joint ventures have been changed where necessary to ensure consistency with the policies adopted by
ING Group.
The recoverable amount, being the higher of fair value less cost of disposal and value in use, of the
investment in associate and joint venture is determined when there is an indication of potential (reversal of)
impairment. An impairment loss is recognised when the carrying amount of the investment exceeds its
recoverable amount. Goodwill on acquisitions of interests in associates and joint ventures is not tested
separately for impairment, but is assessed as part of the carrying amount of the investment. An impairment
loss is subsequently reversed if there is indication of a reversal and there is a change in the estimates used
to determine the recoverable amount. An impairment loss is reversed to the extent that the recoverable
amount exceeds its carrying amount, but cannot exceed the original impairment loss.
The reporting dates of certain associates and joint ventures can differ from the reporting date of the Group,
but by no more than three months..
Significant judgements and critical accounting estimates and assumptions: Identification of impairment indicators as well as indicators of potential reversal of previous impairments of ING Group’s investment in TMBThanachart Bank Public Company Limited (hereafter: TTB), an associate, requires significant judgement. When there is objective evidence of impairment or indicators that prior period impairment losses no longer exist or may have decreased, value in use (VIU) needs to be determined. Estimation of VIU involves significant estimates and management assumptions. Please refer to note 8 ‘Investments in associates and joint ventures’. | |||
Property in own use
Land and buildings held for own use are stated at fair value at the balance sheet date. Depreciation is
recognised on a straight-line basis over the estimated useful life (in general 20 –50 years ). On disposal, the
related revaluation reserve is transferred to retained earnings.
Equipment
Equipment is stated at cost less accumulated depreciation and any impairment losses. The cost of the
assets is depreciated on a straight line basis over their estimated useful lives, which are generally as follows:
for data processing equipment two years to five years , and four years to ten years for fixtures and fittings.
Disposals of property and equipment
The difference between the proceeds on disposal and net carrying value is recognised in the statement of
profit or loss under Other net income.
Right-of-use assets
ING Group as the lessee
A lessee is required to recognise a right-of-use asset representing its right to use the underlying leased asset
and a corresponding liability representing its obligation to make lease payments at the date at which the
leased asset is available for use by ING Group. Each lease payment is allocated between the repayment of
ING Group Annual Report 2023 on Form 20-FF - 259
the liability and finance cost. The finance costs are charged to profit or loss over the lease period so as to
produce a constant periodic rate of interest on the remaining balance of the liability for each period. The
right-of-use asset is depreciated over the shorter of the asset’s useful life and the lease term on a straight-
line basis.
Assets and liabilities arising from a lease are initially measured on a present value basis. Lease liabilities
include the net present value of the following lease payments:
•Fixed payments (including in-substance fixed payments), less any lease incentives receivable;
•Variable lease payments that are based on an index or a rate;
•Amounts expected to be payable by the lessee under residual value guarantees;
•The exercise price of a purchase option if the lessee is reasonably certain to exercise that option; and
•Payments of penalties for terminating the lease, if the lease term reflects the lessee exercising that
option.
The lease payments are discounted using the interest rate implicit in the lease. If that rate cannot be readily
determined, the lessee’s incremental borrowing rate is used, being the rate that the lessee would have to
pay to borrow the funds necessary to obtain an asset of similar value in a similar economic environment
with similar terms and conditions.
Right-of-use assets are measured at cost comprising the amount of the initial measurement of the lease
liability, any lease payments made at or before the commencement date less any lease incentives received
and any initial direct costs and restoration costs.
The right-of-use asset is included in the statement of financial position line-item ‘Property and equipment’,
the lease liability is included in the statement of financial position line-item ‘Other liabilities’. Refer to Note 9
‘Property and equipment’ and to Note 16 ‘Other liabilities’.
Subsequent to initial recognition, the right-of-use asset amortises using a straight-line method to the
income statement over the life of the lease. The lease liability increases for the accrual of interest and
decrease when payments are made. Any remeasurement of the lease liability due to a lease modification
or other reassessment results in a corresponding adjustment to the carrying amount of the right-of-use
asset.
When ING Group acts as a lessor, a distinction should be made between finance leases and operating leases.
For ING Group as a lessor these are mainly finance leases and are therefore not included in 'Property and
equipment'. Instead, the present value of the lease payments is recognised as a receivable under Loans and
advances to customers or Loans and advances to banks. The difference between the gross receivable and
the present value of the receivable is unearned finance lease income. Lease income is recognised over the
term of the lease using the net investment method (before tax), which reflects a constant periodic rate of
return.
Impairment of goodwill and other non-financial assets
ING Group assesses at each reporting period, whether there is an indication that a non-financial asset may
be impaired. Irrespective of whether there is an indication of impairment, intangible assets with an indefinite
useful life, including goodwill acquired in a business combination, and intangible assets not yet available for
use, are tested annually for impairment. Goodwill is allocated to groups of cash generating units (CGUs) for
the purpose of impairment testing. These groups of CGUs represent the lowest level at which goodwill is
monitored for internal management purposes. Goodwill is tested for impairment by comparing the carrying
value of the group of CGUs to the recoverable amount of that group of CGUs. Impairment of goodwill, if
applicable, is included in the statement of profit or loss in Other operating expenses and is not subsequently
reversed.
Computer software
Computer software that has been purchased or generated internally for own use is stated at cost less
amortisation and any impairment losses. Amortisation is calculated on a straight-line basis over its useful
Income tax on the result for the year consists of current and deferred tax. Income tax is recognised in the
statement of profit or loss but it is recognised directly in equity if the tax relates to items that are recognised
directly in equity.
Uncertain tax positions are assessed continually by ING Group and in case it is probable that there will be a
cash outflow, a current tax liability is recognised.
Deferred income tax
Deferred income tax is provided in full, using the liability method, for temporary differences arising between
the tax basis of assets and liabilities and their carrying amounts in the Consolidated statement of financial
position. Deferred income tax is determined using tax rates (and laws) that have been enacted or
substantively enacted at the balance sheet date and are expected to apply when the related deferred
ING Group Annual Report 2023 on Form 20-FF - 260
income tax asset is realised or the deferred income tax liability is settled. Deferred tax assets and liabilities
are not discounted.
Deferred tax assets are recognised when it is probable that future taxable profit will be available against
which the temporary differences can be utilised. Deferred income tax is provided for temporary differences
arising from investments in subsidiaries and associates, except where the timing of the reversal of the
temporary difference is controlled by ING Group and it is probable that the difference will not reverse in the
foreseeable future. The tax effects of income tax losses available for carry forward are recognised as an
asset where it is probable that future taxable profits will be available against which these losses can be
utilised.
Fair value remeasurements of debt and equity instruments measured at FVOCI and cash flow hedges are
recognised directly in equity. Deferred tax related to this fair value remeasurement is also recognised
directly in equity and is subsequently recognised in the statement of profit or loss together with the
A provision is a present obligation arising from past events, the settlement of which is expected to result in
an outflow of resources embodying economic benefits, however the timing or the amount is uncertain.
Provisions are discounted when the effect of the time value of money is significant using a pre-tax discount
rate.
Reorganisation provisions include employee termination benefits when ING Group is demonstrably
committed to either terminate the employment of current employees according to a detailed formal plan
without possibility of withdrawal, or providing termination benefits as a result of an offer made to
encourage voluntary redundancy.
A liability is recognised for a levy when the activity that triggers payment, as identified by the relevant
legislation, occurs. For a levy that is triggered upon reaching a minimum threshold, the liability is recognised
only upon reaching the specified minimum threshold.
A contingent liability is a possible obligation that arises from past events and whose existence will be
confirmed only by the occurrence or non-occurrence of one or more uncertain future events not wholly
within the control of ING Group; or a present obligation that arises from past events but is not recognised
because it is either not probable that an outflow of economic benefits will be required to settle the
obligation or the amount of the obligation cannot be measured reliably. Contingent liabilities are not
recognised in the statement of financial position, but are rather disclosed in the notes unless the possibility
of the outflow of economic benefits is remote.
A contingent asset is a possible asset that arises from past events and whose existence will be confirmed
only by the occurrence or non-occurrence of one or more uncertain future events not wholly within the
control of ING Group. Contingent assets are recognised in the statement of financial position only when
realisation of the income that arises from such an asset is virtually certain. Contingent assets are disclosed
in the notes when an inflow of economic benefits is probable.
Significant judgements and critical accounting estimates and assumptions: The recognition and measurement of provisions is an inherently uncertain process involving using judgement to determine when a present obligation exists and estimates regarding probability, amounts and timing of cash flows. ING Group may become involved in governmental, regulatory, arbitration and legal proceedings and investigations and may be subject to third party claims. With or without reference to the above, ING Group may also offer compensation to certain of its customers. Judgement is required to assess whether a present obligation exists and to estimate the probability of an unfavourable outcome and the amount of potential loss. The degree of uncertainty and the method of making the accounting estimate depends on the individual case, its nature and complexity. Such cases are usually one of a kind. For the assessment of related provisions ING Group consults with internal and external legal experts. Even taking into consideration legal experts’ advice, the probability of an outflow of economic benefits can still be uncertain and the provision recognised can remain sensitive to the assumptions used. Reference is made to Note 15 'Provisions'. For proceedings where it is not possible to make a reliable estimate of the expected financial effect, that could result from the ultimate resolution of the proceedings, no provision is recognised, however disclosure is included in the financial statements, where relevant. Reference is made to Note 42 'Legal proceedings'. Critical accounting estimates and assumptions for the reorganisation provision are in estimating the amounts and timing of cash flows as the announced transformation initiatives are implemented over a period of several years. Reference is made to Note 15 'Provisions'. | |||
1.16 Irrevocable Payment Commitments on contributions to SRF and DGS
ING makes contributions to the Single Resolution Fund (SRF) and Deposit Guarantee Schemes (DGS). The
annual contributions are paid in cash or, in some cases, partly using Irrevocable Payment Commitments
(IPCs) that become payable if and when called. Cash contributions are accounted for as levies as described
in section 1.15 above while IPCs are disclosed as contingent liabilities in Note 41 Contingent liabilities and
commitments. Cash collateral posted on IPCs to the SRF is accounted for as an interest bearing financial
asset at amortised cost. Government bonds posted as collateral on IPCs to DGS continue to be recognised as
ING Group Annual Report 2023 on Form 20-FF - 261
Defined benefit plans
The net defined benefit asset or liability recognised in the statement of financial position in respect of
defined benefit pension plans is the fair value of the plan assets less the present value of the defined benefit
obligation at the balance sheet date.
Changes in plan assets include mainly:
•Return on plan assets are recognised as staff costs in the statement of profit or loss. It is determined
using a high quality corporate bond rate (identical to the discount rate used in determining the defined
benefit obligation) at the start of the reporting period; and
•Remeasurements which are recognised in Other comprehensive income.
The defined benefit obligation is calculated by internal and external independent qualified actuaries through
actuarial models and calculations using the projected unit credit method. This method considers expected
future payments required to settle the obligation resulting from employee service in the current and prior
periods, discounted using a high quality corporate bond rate. Inherent in these actuarial models are
assumptions including discount rates, rates of increase in future salary and benefit levels, mortality rates,
consumer price index and the expected level of indexation. The assumptions are based on available market
data as well as management expectations and are updated regularly.
Changes in the defined benefit obligation include mainly:
•Service cost which is recognised as staff costs in the statement of profit or loss;
•Interest expenses are recognised as staff costs in the Statement of profit or loss. It is determined using a
high quality corporate bond rate at the start of the period;
•Remeasurements which are recognised in Other comprehensive income (equity) and not recycled to the
Statement of profit or loss;
•Any past service cost relating to a plan amendment is recognised in profit or loss in the period of the plan
amendment; and
•Gains and losses on curtailments and settlements are recognised in the Statement of profit or loss when
the curtailment or settlement occurs.
The recognition of a net defined benefit asset in the Consolidated statement of financial position is limited
to the present value of any economic benefits available in the form of refunds from the plans or reductions
in future contributions to the plans.
Defined contribution plans
For defined contribution plans, ING Group pays contributions to publicly or privately administered pension
insurance plans on a mandatory, contractual or voluntary basis. ING Group has no further payment
obligations once the contributions have been paid. The contributions are recognised as staff expenses in the
profit or loss when they are due. Prepaid contributions are recognised as an asset to the extent that a cash
refund or a reduction in the future payments is available.
Other post-employment obligations
Some group companies provide other post-employment benefits to former employees. The entitlement to
these benefits is usually conditional on the employee remaining in service up to retirement age and the
completion of a minimum service period. The expected costs of these benefits are accrued over the period
Treasury shares (own equity instruments bought back by ING Group or its subsidiaries) are deducted from
Equity (Other reserves). No gain or loss is recognised in the statement of profit or loss when purchasing,
selling or cancelling these shares. Treasury shares are not taken into account when calculating earnings per
ordinary share or dividend per ordinary share as they are not considered to be outstanding.
Treasury shares can be purchased by ING as part of a share buyback programme. If a share buyback is
executed by a broker and the agreement with the broker is irrevocable, ING has a contractual obligation to
purchase its own shares that is unavoidable once it signs the agreement with the broker. This is the moment
when ING recognises a financial liability measured at the present value of the redemption amount with a
corresponding reduction in equity (Retained earnings). During the share buyback programme, ING settles
this liability for the actual purchase price paid for the shares bought on a daily basis. Actual shares bought
back and held by ING are presented as Treasury shares within Other reserves in equity.
Interest
Interest income and expense are recognised in the statement of profit or loss using the effective interest
method. The effective interest method is a method of calculating the amortised cost of a financial asset or a
financial liability and of allocating the interest income or interest expense over the relevant period. The
effective interest rate is the rate that exactly discounts estimated future cash payments or receipts through
the expected life of the financial instrument or, when appropriate, a shorter period to the net carrying
amount of the financial asset or financial liability. When calculating the effective interest rate, ING Group
estimates cash flows considering all contractual terms of the financial instrument (for example, prepayment
options) but does not consider future credit losses.
The calculation includes all fees and points paid or received between parties to the contract that are an
integral part of the effective interest rate, transaction costs and all other premiums or discounts. Once a
financial asset or a group of similar financial assets has been written down as a result of an impairment loss,
ING Group Annual Report 2023 on Form 20-FF - 262
interest income is recognised using the rate of interest used to discount the future cash flows for the
purpose of measuring the impairment loss.
Interest results on instruments classified at Amortised Cost, assets measured at FVOCI and derivatives in a
formal hedge accounting relationship is presented in ‘Interest income (expense) using effective interest rate
method’. Interest result on financial assets and liabilities voluntarily designated as at FVPL and derivatives in
so called economic hedges and instruments designated at fair value are presented in ‘Other interest income
(expense)’. Interest result on all other financial assets and liabilities at FVTPL is recognised in ‘Valuation
results and net trading income’.
Fees and commissions
Fees and commissions are generally recognised as the service is provided. Loan commitment fees for loans
that are likely to be drawn down are deferred (together with related direct costs) and recognised as an
adjustment to the effective interest rate on the loan. Loan syndication fees are recognised as income when
the performance obligation has been satisfied based on the particular contract and ING Group has retained
no part of the loan package for itself or has retained a part at the same effective interest rate as the other
participants. Commission and fees arising from negotiating, or participating in the negotiation of, a
transaction for a third party – such as the arrangement of the acquisition of shares or other securities or the
purchase or sale of businesses – are recognised on completion of the underlying transaction. Portfolio and
other management advisory and service fees are recognised based on the applicable service contracts as
the service is provided. Asset management fees related to investment funds and investment contract fees
are recognised on a pro-rata basis over the period the service is provided. The same principle is applied for
wealth management, financial planning and custody services that are continuously provided over an
extended period of time. Fees received and paid between banks for payment services are classified as
commission income and expenses.
Lease income
The proceeds from leasing out assets under operating leases are recognised on a straight-line basis over the
life of the lease agreement. Lease payments received in respect of finance leases when ING Group is the
lessor are divided into an interest component (recognised as interest income) and a repayment component
Expenses are recognised in the statement of profit or loss as incurred or when a decrease in future
economic benefits related to a decrease in an asset or an increase in a liability has arisen that can be
measured reliably. Fee and commission expenses are generally a result from a contract with ING service
providers in order to perform the service for ING Group’s customers. Costs are generally presented as
‘Commission expenses’ if they are specific, incremental, directly attributable and identifiable to generate
commission income.
Share-based payments
ING Group only engages in share-based payment transactions with its staff and directors. Share-based
payment expenses are recognised as a staff expense over the vesting period. A corresponding increase in
equity is recognised for equity-settled share-based payment transactions. A liability is recognised for cash-
settled share-based payment transactions. The fair value of equity-settled share-based payment
transactions are measured at the grant date, and the fair value of cash-settled share-based payment
transactions are measured at each balance sheet date. Rights granted will remain valid until the expiry
date, even if the share based payment scheme is discontinued. The rights are subject to certain conditions,
Earnings per ordinary share is calculated on the basis of the weighted average number of ordinary shares
outstanding. In calculating the weighted average number of ordinary shares outstanding:
•Own shares held by group companies are deducted from the total number of ordinary shares in issue;
•The computation is based on daily averages; and
•In case of exercised warrants, the exercise date is taken into consideration.
Diluted earnings per share data are computed as if all convertible instruments outstanding at year-end
were exercised at the beginning of the period. It is also assumed that ING Group uses the assumed proceeds
thus received to buy its own shares against the average market price in the financial year. The net increase
in the number of shares resulting from the exercise is added to the average number of shares used to
The statement of cash flows is prepared in accordance with the indirect method, distinguishing cash flows
from operating, investing and financing activities. In the net cash flow from operating activities, the result
before tax is adjusted for those items in the statement of profit or loss and changes in items per the
statement of financial position, which do not result in actual cash flows during the year.
For the purposes of the statement of cash flows, Cash and cash equivalents include deposits from banks and
loans and advances to banks that are on demand. Furthermore, it includes treasury bills and other eligible
bills shorter than three months. Investments qualify as a cash equivalent if they are readily convertible to a
known amount of cash and are subject to an insignificant risk of changes in value.
Cash flows arising from foreign currency transactions are translated into the functional currency using the
exchange rates at the date of the cash flows.
ING Group Annual Report 2023 on Form 20-FF - 263
The net cash flow shown in respect of Loans and advances to customers relates only to transactions
involving actual payments or receipts. The Addition to loan loss provision which is deducted from the item
Loans and advances to customers in the statement of financial position has been adjusted accordingly from
the result before tax and is shown separately in the statement of cash flows.
The difference between the Net cash flow in accordance with the statement of cash flows and the change
between the opening and closing balance of Cash and cash equivalents in the statement of financial
position is due to exchange rate differences and is presented separately in the cash flow statement.
Liabilities arising from financing activities are debt securities, lease liabilities and subordinated loans.
The condensed parent company financial statements of ING Groep N.V. are prepared using the recognition
ING Group Annual Report 2023 on Form 20-FF - 264
Notes to the Consolidated statement of financial position
Cash and balances with central banks | ||
in EUR million | 2023 | 2022 |
Amounts held at central banks 1 | ||
Cash and bank balances | ||
1 Amounts held at central banks include an amount of EUR -5 million (2022: EUR -12 million) of Loan loss provisions.
Amounts held at central banks reflect on demand balances. The movement reflects ING’s active liquidity
management.
Reference is made to Note 39 'Transfer of financial assets, assets pledged and received as collateral' for
restrictions on amounts held at central banks.
Loans and advances to banks | ||||||
Netherlands | Rest of the world | Total | ||||
in EUR million | 2023 | 2022 | 2023 | 2022 | 2023 | 2022 |
Loans and advances to banks | ||||||
Loan loss provisions | - | - | - | - | - | - |
Loans and advances mainly include balances of reverse repurchase transactions, term loans and cash
collateral transactions. For more information on the balance of reverse repurchase transactions refer to
Note 4 'Financial assets at fair value through profit or loss' . Reference is made to Note 7 'Loans and
advances to customers' for information on finance lease receivables included in Loans and advances to
banks.
As at 31 December 2023 and at 31 December 2022, all loans and advances to banks are non-subordinated.
Financial assets at fair value through profit or loss | ||
in EUR million | 2023 | 2022 |
Trading assets | ||
Non-trading derivatives | ||
Designated at fair value through profit or loss | ||
Mandatorily measured at fair value through profit or loss | ||
(Reverse) repurchase transactions
Financial assets at fair value through profit or loss includes securities lending and sales and repurchase
transactions with securities. At ING, these types of transactions are recognised in several lines in the
statement of financial position depending on business model assessment and counterparty. Furthermore,
for repurchase agreements the gross amount of assets must be considered together with the gross amount
of related liabilities, which are presented separately on the statement of financial position since IFRS does
not always allow netting of these positions in the statement of financial position.
Securities purchased under agreements to resell (reverse repos), securities borrowings and similar
agreements are not recognised in the consolidated statement of financial position as the counterparty
continues to be exposed to substantially all risks and rewards of the transferred security. Based on the
business model assessment and counterparty, the consideration paid to purchase securities is recognised as
Loans and advances to customers, Loans and advances to banks, financial assets mandatorily at FVPL or
Trading assets.
Securities sold subject to repurchase agreements (repos), securities lending and similar agreements
continue to be recognised in the consolidated statement of financial position as ING Group continues to be
exposed to substantially all risks and rewards of the transferred financial asset. The counterparty liability is
designated and measured at FVPL if the asset is measured at FVPL. Otherwise, the counterparty liability is
included in Deposits from banks, Customer deposits or Trading.
Reference is made to Note 39 'Transfer of financial assets, assets pledged and received as collateral' for
information on transferred assets which were not derecognised.
ING Group Annual Report 2023 on Form 20-FF - 265
of financial position:
Exposure to (reverse) repurchase agreements | ||
in EUR million | 2023 | 2022 |
Reverse repurchase transactions | ||
Loans and advances to banks | ||
Loans and advances to customers | ||
Trading assets, loans and receivables | ||
Loans and receivables mandatorily measured at fair value through profit or loss | ||
Repurchase transactions | ||
Deposits from banks | ||
Customer deposits | ||
Trading liabilities, funds on deposit | ||
Funds entrusted designated and measured at fair value through profit or loss | ||
Trading assets
Trading assets by type | ||
in EUR million | 2023 | 2022 |
Equity securities | ||
Debt securities | ||
Derivatives | ||
Loans and receivables | ||
Trading assets include assets that are closely related to servicing the needs of the clients of ING Group. ING
offers institutional clients, corporate clients, and governments, products that are traded on the financial
markets. A significant part of the derivatives in the trading portfolio is related to servicing corporate clients
in their risk management to hedge for example currency or interest rate exposures. In addition, ING provides
its customers access to equity and debt markets for issuing their own equity or debt securities (securities
underwriting).
Reference is made to Note 14 'Financial liabilities at fair value through profit or loss' for information on
trading liabilities.
Non-trading derivatives
Non-trading derivatives by type | ||
in EUR million | 2023 | 2022 |
Derivatives used in | ||
- fair value hedges | ||
- cash flow hedges | ||
- hedges of net investments in foreign operations | ||
Other non-trading derivatives | ||
Reference is made to Note 36 'Derivatives and hedge accounting' for information on derivatives designated
in hedge accounting.
Other non-trading derivatives mainly includes interest rate swaps and foreign exchange currency swaps for
which no hedge accounting is applied.
Designated at fair value through profit or loss
Designated at fair value through profit or loss by type | ||
in EUR million | 2023 | 2022 |
Debt securities | ||
Loans and receivables | ||
‘Financial assets designated at fair value through profit or loss’ is partly economically hedged by credit
derivatives. The hedges do not meet the criteria for hedge accounting and the loans and debt securities are
recorded at fair value to avoid an accounting mismatch. The maximum credit exposure of the loans and
receivables and debt securities included in ‘Financial assets designated at fair value through profit or loss’
approximates its carrying value and amounts to EUR 5,775 million (2022: EUR 6,159 million). In 2023, the
change in fair value of these loans and debt securities amounts EUR -48 million (2022: EUR 357 million).
ING has mitigated the credit risk exposure on some of the portfolio. The cost at initial recognition of the
financial assets designated at fair value through profit or loss that are economically hedged by credit
derivatives is EUR 3,181 million (31 December 2022: EUR 3,051 million and the cumulative change in fair
value attributable to changes in credit risk is EUR 150 million (31 December 2022: EUR 150 million).
The notional value of the related credit derivatives is EUR 3,679 million (2022: EUR 3,370 million).The
cumulative change in fair value of the credit derivatives since the financial assets were first designated,
ING Group Annual Report 2023 on Form 20-FF - 266
amounts to EUR -119 million (2022: EUR 3 million) and the change for the current year is EUR -122 million
(2022: EUR 72 million).
The changes in fair value attributable to changes in credit risk have been calculated by determining the
changes in credit spread implicit in the fair value of loans and bonds issued by entities with similar credit
characteristics.
Mandatorily at fair value through profit or loss
Mandatorily at fair value through profit or loss by type | ||
in EUR million | 2023 | 2022 |
Equity securities | ||
Debt securities | ||
Loans and receivables | ||
Equity securities are individually insignificant for ING Group. For debt securities total exposure reference is
made to Note 6 'Debt securities'. Loans and receivables include mainly reverse repurchase agreements.
Following the implementation of IFRS 17 on 1 January 2023, a portfolio of loans with death waivers has
been reclassified from financial assets measured at amortised cost to financial assets mandatorily
measured at fair value through profit or loss (31 December 2023: EUR 538 million). For further information
on the change in accounting policies, reference is made to Note 1 'Basis of preparation and material
Financial assets at fair value through other comprehensive income by type | ||
in EUR million | 2023 | 2022 |
Equity securities | ||
Debt securities 1 | ||
Loans and advances 1 | ||
1 Debt securities include an amount of EUR -13 million (2022: EUR -21 million) and the Loans and advances includes EUR -8 million
(2022: EUR -1 million) of Loan loss provisions.
Exposure to equity securities
Equity securities designated as at fair value through other comprehensive income | ||||
Carrying value | Carrying value | Dividend income | Dividend income | |
in EUR million | 2023 | 2022 | 2023 | 2022 |
Investment in Bank of Beijing | ||||
Other Investments | ||||
As at 31 December 2023 ING holds approximately 13 % (2022: 13 %) of the shares of Bank of Beijing, a bank
listed on the stock exchange of Shanghai. Bank of Beijing stake is part of the Corporate Line segment. As per
regulatory requirements set by China Banking and Insurance Regulatory Commission, ING, as a shareholder
holding more than 5% or more of the shares, is required to supply additional capital when necessary. No
request for additional capital was received in 2023 (2022: nil).
Changes in fair value through other comprehensive income
The following table presents changes in financial assets at fair value through other comprehensive income.
Changes in fair value through other comprehensive income financial assets | ||||||
FVOCI equity securities | FVOCI debt instruments 1 | Total | ||||
in EUR million | 2023 | 2022 | 2023 | 2022 | 2023 | 2022 |
Opening balance as at 1 January | ||||||
Additions | ||||||
Amortisation | - | - | ||||
Transfers and reclassifications | ||||||
Changes in unrealised revaluations 2 | - | - | - | |||
Impairments | - | - | ||||
Reversals of impairments | ||||||
Disposals and redemptions | - | - | - | - | - | - |
Exchange rate differences | - | - | ||||
Changes in the composition of the group and other changes | - | - | ||||
Closing balance | ||||||
1Fair value through other comprehensive income debt instruments includes both debt securities and loans and advances.
2Changes in unrealised revaluations of FVOCI debt instruments include changes on hedged items which are recognized in the
ING Group Annual Report 2023 on Form 20-FF - 267
FVOCI equity securities
Exchange rate differences of EUR -100 million (31 December 2022: EUR -39 million) are mainly related to the
stake in Bank of Beijing following the depreciation of CNY versus EUR. Furthermore in 2023, changes in
unrealised revaluations of equity securities are mainly related to the revaluation of the stake in Bank of
Beijing of EUR 77 million following changes in share price (31 December 2022: EUR -49 million).
In 2022, disposals of EUR 492 million mainly relate to the sale in the second quarter of HQLA eligible equity
instruments triggered by the changing interest rate environment and deteriorating market sentiment. This
portfolio was built up in early 2021 (additions in 2021: EUR 499 million) and was a relatively small part of the
HQLA portfolio. This was a diversified buy-and-hold portfolio aimed at generating stable dividend income
stream.
FVOCI debt instruments
In 2022, interest rates in both short and longer tenors increased significantly which resulted in changes in
unrealised revaluations of debt securities of EUR -3,230 million. During 2023 interest rates decreased
resulting in unrealised revaluations of EUR 657 million.
Reference is made to Note 6 'Debt securities' for details on ING Group’s total exposure to debt securities.
position:
Exposure to debt securities | ||
in EUR million | 2023 | 2022 |
Debt securities at fair value through other comprehensive income | ||
Debt securities at amortised cost | ||
Debt securities at fair value through other comprehensive income and amortised cost | ||
Trading assets | ||
Debt securities at fair value through profit or loss | ||
Total debt securities at fair value through profit or loss | ||
ING Group’s total exposure to debt securities (excluding debt securities held in the trading portfolio) of EUR
Debt securities by type of exposure | ||||||||
Debt Securities at FVPL | Debt Securities at FVOCI | Debt Securities at AC | Total | |||||
in EUR million | 2023 | 2022 | 2023 | 2022 | 2023 | 2022 | 2023 | 2022 |
Government bonds | ||||||||
Central bank bonds 1 | ||||||||
Sub-sovereign, Supranationals and Agencies | ||||||||
Covered bonds | ||||||||
Corporate bonds | ||||||||
Financial institutions' bonds | ||||||||
ABS portfolio | ||||||||
Loan loss provisions | - | - | - | - | - | - | ||
Debt securities portfolio | ||||||||
1In 2023 Central bank bonds have been included as a separate type of exposure. These bonds were previously included in Financial
Institutions bonds. The prior period has been updated for consistency and comparability.
Loans and advances to customers by type | ||||||
Netherlands | Rest of the world | Total | ||||
in EUR million | 2023 | 2022 | 2023 | 2022 | 2023 | 2022 |
Loans and advances to public authorities | ||||||
Residential mortgages | ||||||
Other personal lending | ||||||
Corporate Lending | ||||||
Loan loss provisions | - | - | - | - | - | - |
For details on credit quality and loan loss provisioning, refer to ‘Risk management – Credit risk’ paragraphs
‘Credit quality’ and 'Loan loss provisioning'.
ING Group Annual Report 2023 on Form 20-FF - 268
As at 31 December 2023 EUR 647,120 million (2022: EUR 644,697 million) of loans and advances to
customers are non-subordinated.
follows:
Finance lease receivables 1 | ||
in EUR million | 2023 | 2022 |
Maturities of gross investment in finance lease receivables | ||
- within 1 year | ||
- between 1-2 years | ||
- between 2-3 years | ||
- between 3-4 years | ||
- between 4-5 years | ||
- more than 5 years | ||
Unearned future finance income on finance leases | - | - |
Net investment in finance leases | ||
Included in Loans and advances to banks | ||
Included in Loans and advances to customers | ||
1The total loan loss provision of EUR 160 million (2022: EUR 160 million) for finance lease receivables is classified into the following loan
loss provision stages: Stage 1: EUR 6 million (2022: EUR 9 million), Stage 2: EUR 14 million (2022: EUR 28 million) and Stage 3: EUR 139
million (2022: EUR 123 million).
The finance lease receivables mainly relate to the financing of equipment and real estate and are mainly
part of corporate lending. To a lesser extent, the finance lease receivables relate to real estate for third
parties, where ING is the lessor. Interest income in 2023 on finance lease receivables amounts to EUR 429
million (2022: EUR 292 million).
Investments in associates and joint ventures | |||||||
in EUR million 2023 | Interest held (%) | Fair value of listed invest- ments | Balance sheet value | Total assets | Total liabilities | Total income | Total expenses |
TMBThanachart Bank Public Company Limited | |||||||
Other investments in associates and joint ventures | |||||||
Investments in associates and joint ventures | |||||||
in EUR million 2022 | Interest held (%) | Fair value of listed invest- ments | Balance sheet value | Total assets | Total liabilities | Total income | Total expenses |
TMBThanachart Bank Public Company Limited | |||||||
Other investments in associates and joint ventures | |||||||
TMBThanachart Bank Public Company Limited
ING Group has a 23 % investment in TMBThanachart Bank Public Company Limited (hereafter: TTB), a bank
listed on the Stock Exchange of Thailand. TTB is providing products and services to Wholesale, Small and
Medium Enterprise (SME), and Retail customers. TTB is accounted for as an investment in associate based on
the size of ING shareholding and representation on the Board. TTB is part of the Corporate Line segment.
Other investments in associates and joint ventures
Included in Other investments in associates and joint ventures are mainly financial services and (non)
financial technology funds or vehicles operating predominantly in Europe, and represents a number of
associates and joint ventures that are individually not significant to ING Group.
Significant influence for associates in which the interest held is below 20%, is based on the combination of
ING Group’s financial interest and other arrangements, such as participation in the Board of Directors.
The associates and joint ventures of ING are subject to legal and regulatory restrictions regarding the
amount of dividends they can pay to ING. These restrictions are for example dependent on the laws in the
country of incorporation for declaring dividends or as a result of minimum capital requirements that are
imposed by industry regulators in the countries in which the associates and joint ventures operate.
ING Group Annual Report 2023 on Form 20-FF - 269
In addition, the associates and joint ventures also consider other factors in determining the appropriate
levels of equity needed. These factors and limitations include, but are not limited to, rating agency and
regulatory views, which can change over time.
Changes in Investments in associates and joint ventures | ||
in EUR million | 2023 | 2022 |
Opening balance as at 1 January | ||
Additions | ||
Revaluations | - | |
Share of results | ||
Dividends received | - | - |
Disposals | - | - |
Impairments | - | - |
Exchange rate differences | - | |
Other | ||
Closing balance | ||
Share of results from associates and joint ventures of EUR 149 million (2022: EUR 92 million) as included in
the table above is mainly attributable to results of TTB of EUR 107 million (2022: EUR 81 million).
Impairments and reversal thereof
Out of EUR 192 million total impairment losses in 2022, EUR 165 million related to TTB. As per 31 December
2023 there were no triggers for additional impairment of TTB. Equally, indicators that would support a
potential reversal of previous impairment losses on TTB were not yet consistently observed during 2023.
Accumulated impairments of EUR 395 million (2022: EUR 395 million) have been recognised.
Property and equipment by type | ||
in EUR million | 2023 | 2022 |
Property in own use | ||
Equipment: | ||
- Data processing equipment | ||
- Other equipment | ||
Right- of- use assets: | ||
- ROU property | ||
- ROU cars | ||
- ROU other leases | ||
Changes in property and equipment | ||||||||
Property in own use | Equipment | Right-of-use assets | Total | |||||
in EUR million | 2023 | 2022 | 2023 | 2022 | 2023 | 2022 | 2023 | 2022 |
Opening balance as at 1 January | ||||||||
Additions | ||||||||
Transfers | - | - | - | - | - | - | - | - |
Depreciation | - | - | - | - | - | - | - | - |
Impairments1 | - | - | - | - | - | - | - | - |
Reversals of impairments 1 | ||||||||
Remeasurements | ||||||||
Disposals | - | - | - | - | - | - | - | - |
Exchange rate differences | - | - | - | |||||
Closing balance | ||||||||
Cost price | ||||||||
Accumulated depreciation | - | - | - | - | - | - | - | - |
Accumulated impairments | - | - | - | - | - | - | - | - |
Accumulated revaluation surplus | ||||||||
Accumulated remeasurement | ||||||||
Net carrying value | ||||||||
1 (Reversals of) impairments of property and equipment are presented as Other operating expenses in the statement of Profit or Loss.
ING considers valuations from third-party experts in determining the fair values of property in own use. The
vast majority of the land and buildings are appraised during 2023. Property in own use purchase costs
ING Group Annual Report 2023 on Form 20-FF - 270
amounted to EUR 753 million (2022: EUR 847 million). Cost or the purchase price less accumulated
depreciation and impairments would have been EUR 350 million (2022: EUR 368 million) had property in
own use been valued at cost instead of at fair value.
The reported impairment losses of EUR -41 million (2022: EUR -35 million) mainly result from changes in the
post-pandemic way of working through downscaling of physical office spaces and closure of branches for
commercial reasons.
Changes in intangible assets | ||||||||
Goodwill | Software | Other | Total | |||||
in EUR million | 2023 | 2022 | 2023 | 2022 | 2023 | 2022 | 2023 | 2022 |
Opening balance as at 1 January | ||||||||
Opening balance adjustment 1 | ||||||||
Additions | ||||||||
Capitalised expenses | ||||||||
Amortisation | - | - | - | - | ||||
Impairments 1 2 | - | - | - | - | - | |||
Exchange rate differences | - | |||||||
Disposals | - | - | - | - | ||||
Changes in the composition of the group and other changes | ||||||||
Closing balance | ||||||||
Gross carrying amount | ||||||||
Accumulated amortisation | - | - | - | - | - | - | ||
Accumulated impairments | - | - | - | - | - | - | ||
Net carrying value | ||||||||
1In 2022, the allocated goodwill to Türkiye cash generating unit after first being adjusted for hyperinflation accounting for EUR 25
million, was fully impaired for the amount of EUR 32 million (based on discount rate 24.04 % and terminal growth rate 10.40 % as per
1 January 2022). Türkiye is part of the Retail Other segment.
2Impairments of intangible assets are presented within Other operating expenses in the statement of Profit or Loss.
Goodwill
Goodwill allocation to group of CGUs | |||||
in EUR million | Method used for recoverable amount | Discount rate | Terminal growth rate | Goodwill | Goodwill |
Group of CGU’s | 2023 | 2022 | |||
Retail Netherlands | Value in use | ||||
Retail Germany | Value in use | ||||
Retail Poland | Value in use | ||||
Retail Romania | Value in use | ||||
Impairment testing
Goodwill is tested for impairment annually in the fourth quarter by comparing the recoverable amount of
each goodwill-carrying CGU with its carrying amount. The key assumptions used in the calculation of the
recoverable amounts are included in the table above. Furthermore, ING Group tests goodwill whenever a
triggering event is identified.
At the annual impairment test in the fourth quarter, the recoverable amount exceeds the carrying value of
the CGUs as at 31 December 2023 and therefore no impairment is required (31 December 2022: EUR 32
million for Türkiye CGU).
Methodology
In line with IFRS, the recoverable amount is determined as the higher of the fair value less costs of disposal
and Value in Use (VIU). The VIU calculation is based on a Dividend Discount model using three year
management approved plans, updated for expected changes in the macroeconomic environment. When
estimating the VIU of a CGU, local conditions and requirements determine the capital requirements,
discount rates, and terminal growth rates. These local conditions and requirements determine the ability to
upstream excess capital and profits to ING Group. The discount rate calculation includes other inputs such as
equity market premium, country risk premium, and long term inflation which are based on market sources
and management’s judgement. The long term growth rate is based on the long term inflation rate obtained
from market sources. The impacts of climate risk are included to the extent that they are observable in
discount rates and assets prices.
Sensitivity of key assumptions
Key assumptions in the goodwill impairment test model are the projected locally available cash flows (based
on local capital requirements and projected profits), discount rates (cost of equity), and long-term growth
rates.
ING Group Annual Report 2023 on Form 20-FF - 271
The recoverable amounts of the CGUs are sensitive to the above key assumptions. A decrease in the
available cash flows of 10 %, an increase in the discount rate of 1 percent point or a reduction of future
growth rate to zero are considered reasonably possible changes in key assumptions. If the aforementioned
changes occur to one of the above key assumptions holding the other key assumptions constant, goodwill
of the remaining CGUs will continue to be recoverable.
Software
Software includes internally developed software amounting to EUR 628 million (2022: EUR 540 million).
Software is reviewed for indicators of impairment. Irrespective of whether there is an indication of
impairment, software under development is tested annually for impairment. In 2023, individually
immaterial items were impaired for an amount of EUR 5 million (31 December 2022: 22 million).
Other assets by type | ||
in EUR million | 2023 | 2022 |
Net defined benefit assets | ||
Investment properties | ||
Property development and obtained from foreclosures | ||
Prepayments | ||
Accrued assets | ||
Amounts to be settled | ||
Other | ||
Disclosures in respect of Net defined benefit assets are provided in Note 33 'Pensions and other post-
employment benefits'.
Amounts to be settled include primarily transactions not settled at the balance sheet date. The nature of
these transaction is short term and they are expected to settle shortly after the closing date of the balance
sheet.
Other relates to various receivables in the normal course of business, amongst others, short term
Deposits from banks by type | ||||||
Netherlands | Rest of the world | Total | ||||
in EUR million | 2023 | 2022 | 2023 | 2022 | 2023 | 2022 |
Non-interest bearing | ||||||
Interest bearing | ||||||
Deposits from banks includes non-subordinated deposits and reverse repurchase transactions, for more
information on reverse repurchase transaction refer to Note 4 'Financial assets at fair value through profit or
loss'.
Deposits from banks includes ING’s participation in the Targeted Longer-Term Refinancing Operations
(TLTRO) of EUR 6.0 billion (2022: EUR 36.0 billion). In 2023, EUR 30.0 billion of ING's TLTRO III participation was
repaid.
For the details of the applicable rates and impact on net interest income reference is made to Note 20 'Net
interest income'.
Customer deposits 1 | ||
in EUR million | 2023 | 2022 |
Current accounts / Overnight deposits | ||
Savings accounts | ||
Time deposits | ||
Other | ||
1 ING changed the presentation of customer deposits as of 2023. The comparative figure for 2022 has been updated accordingly.
Current accounts / Overnight deposits, Saving accounts and Time deposits include balances with individuals,
respectively EUR 107,711 million (2022: EUR 124,067 million), EUR 305,743 million (2022: EUR
ING Group Annual Report 2023 on Form 20-FF - 272
Customer deposits by type | ||||||
Netherlands | Rest of the world | Total | ||||
in EUR million | 2023 | 2022 | 2023 | 2022 | 2023 | 2022 |
Non-interest bearing | ||||||
Interest bearing 1 | ||||||
1Interest bearing includes current accounts which are not remunerated, however ING holds the contractual right to revise.
Financial liabilities at fair value through profit or loss | ||
in EUR million | 2023 | 2022 |
Trading liabilities | ||
Non-trading derivatives | ||
Designated at fair value through profit or loss | ||
Trading liabilities
Trading liabilities by type | ||
in EUR million | 2023 | 2022 |
Equity securities | ||
Debt securities | ||
Funds on deposit | ||
Derivatives | ||
Non-trading derivatives
Non-trading derivatives by type | ||
in EUR million | 2023 | 2022 |
Derivatives used in: | ||
- fair value hedges | ||
- cash flow hedges | ||
- hedges of net investments in foreign operations | ||
Other non-trading derivatives | ||
Reference is made to Note 36 'Derivatives and hedge accounting' for information on derivatives used for
hedge accounting.
Other non-trading derivatives mainly includes interest rate swaps and foreign currency swaps for hedging
purposes, but for which no hedge accounting is applied.
Designated at fair value through profit or loss
Designated at fair value through profit or loss by type | ||
in EUR million | 2023 | 2022 |
Debt securities | ||
Funds entrusted | ||
Subordinated liabilities | ||
As at 31 December 2023, the change in the fair value of financial liabilities designated at fair value through
profit or loss attributable to changes in credit risk is EUR -34 million (2022: EUR -75 million) on a cumulative
basis. This change has been determined as the amount of change in fair value of the financial liability that is
not attributable to changes in market conditions that gave rise to market risk (i.e. mainly interest rate risk
based on yield curves).
The amount that ING Group is contractually required to pay at maturity to the holders of financial liabilities
designated at fair value through profit or loss excluding repurchase agreements (part of funds entrusted) is
EUR 9,957 million (2022: EUR 8,408 million).
Funds entrusted include mainly repurchase agreements. For more information on repurchase transactions
refer to Note 4 'Financial assets at fair value through profit or loss'.
ING Group Annual Report 2023 on Form 20-FF - 273
Provisions by type 1 | ||
in EUR million | 2023 | 2022 |
Reorganisation provisions | ||
Litigation provisions | ||
Other provisions | ||
Loan loss provisions for guarantees | ||
1 In 2023, the table was updated to present the IFRS 9 loan loss provisions for guarantees separately. The comparatives for 2022
have been updated accordingly.
Changes in provisions | ||||||||
Reorganisation | Litigation | Other provisions 2 | Total | |||||
in EUR million | 2023 | 2022 | 2023 | 2022 | 2023 | 2022 | 2023 | 2022 |
Opening balance as at 1 January | ||||||||
Additions 1 | ||||||||
Interest | - | - | ||||||
Releases 1 | - | - | - | - | - | - | - | - |
Utilised | - | - | - | - | - | - | - | - |
Exchange rate differences | - | - | - | - | ||||
Other changes | - | - | - | - | - | |||
Closing balance | ||||||||
1Additions to provisions and unused amounts released are presented in Note 26 'Other operating expenses' in the Statement of Profit
or Loss.
2In 2023, the table was updated to exclude the IFRS 9 loan loss provisions for guarantees. The comparatives for 2022 have been
updated accordingly.
As at 31 December 2023, amounts expected to be settled within 12 months in provisions amount to EUR
amounts and timing of cash flows required to settle the obligation.
Reorganisation provisions
In 2023, the additions to the reorganisation provisions mainly relate to restructuring activities in Belgium,
Poland and the Netherlands. The additions in 2022 mainly relate to the discontinuation of retail banking
activities in France and the restructuring of the branch network and retail advice organisation in the
Netherlands, as well as to restructuring activities in Belgium.
These initiatives are implemented over a period of several years and the estimate of the reorganisation
provisions is inherently uncertain.
Litigation provisions
Reference is made to Note 42 'Legal proceedings' for developments in litigation provisions.
Other provisions
In 2023 ING Group voluntarily changed its accounting policy for non-financial guarantees that are subject to
contractual indemnification rights from IAS 37 principles to loan commitment accounting under IFRS 9. The
change from IAS 37 to IFRS 9 resulted in derecognition of the existing IAS 37 provision of EUR 109 million as
per 1 January 2023 and recognition of a provision for Expected credit losses of EUR 151 million for non-
financial guarantees as per 1 January 2023 (EUR 42 million pre-tax impact on Equity at the beginning of
2023). This change is included in Other changes in the movement table.
For details and changes on loan loss provisioning, refer to ‘Risk management – Credit risk’ paragraph 'Loan
loss provisioning'. For details on the IFRS change, refer to Note 1.3.1 'Changes in IFRS effective in 2023'.
In 2022, the additions and releases include EUR 138 million and EUR 141 million respectively related to IAS
37 off balance facilities that in 2023 are included in IFRS 9 loan loss provisions.
The additions to the Other provisions in 2022 include EUR 75 million which relates to the provision for the
compensation of Dutch retail customers for past interest charges that did not sufficiently track market rates
and largely reflects the impact of interest-on-interest compensation. This is in addition to the provision of
EUR 180 million recognised in 2021.
ING Group Annual Report 2023 on Form 20-FF -274
Other liabilities by type | ||
In EUR million | 2023 | 2022 |
Net defined benefit liability | ||
Other post-employment benefits | ||
Other staff-related liabilities | ||
Share-based payment plan liabilities | ||
Other taxation and social security contributions | ||
Rents received in advance | ||
Costs payable | ||
Amounts to be settled | ||
Lease liabilities | ||
Other | ||
Disclosures in respect of Net defined benefit liabilities are provided in Note 33 'Pensions and other post-
employment benefits'.
Other staff-related liabilities includes vacation leave provisions, jubilee provisions, disability/illness provisions
and liabilities related with variable compensations.
As of 2023, ING decided to no longer issue shares in order to fund obligations arising from share-based
employee incentive programmes but buy back shares from the market. Reference is made to Note 19
'Equity' for further information.
Amounts to be settled includes primarily transactions not settled at the balance sheet date. The nature of
these transactions is short term and have settled after the closing date of the balance sheet.
Lease liabilities relate to right-of-use assets. Disclosures in respect to right-of-use assets are provided in
Note 9 'Property and equipment'. The total cash outflow for leases in 2023 was EUR 291 million (2022: EUR
The line other relates mainly to amounts payable to customers which also includes the remaining EUR
Debt securities in issue relates to debentures and other issued debt securities with either fixed interest rates
or interest rates based on floating interest rate levels, such as certificates of deposit and accepted bills
issued by ING Group, except for subordinated items. Debt securities in issue does not include debt securities
presented as Financial liabilities at fair value through profit or loss. ING Group does not have debt securities
that are issued on terms other than those available in the normal course of business.
Debt securities in issue – maturities | ||
In EUR million | 2023 | 2022 |
Fixed rate debt securities | ||
Within 1 year | ||
More than 1 year but less than 2 years | ||
More than 2 years but less than 3 years | ||
More than 3 years but less than 4 years | ||
More than 4 years but less than 5 years | ||
More than 5 years | ||
Total fixed rate debt securities | ||
Floating rate debt securities | ||
Within 1 year | ||
More than 1 year but less than 2 years | ||
More than 2 years but less than 3 years | ||
More than 3 years but less than 4 years | ||
More than 4 years but less than 5 years | ||
More than 5 years | ||
Total floating rate debt securities | ||
Total debt securities | ||
Reference is made to Note 32 'Changes in liabilities arising from financing activities' for further information
on issuances, redemptions and non-cash movements.
ING Group Annual Report 2023 on Form 20-FF -275
Subordinated loans | ||
In EUR million | 2023 | 2022 |
Subordinated loans | ||
Subordinated loans are bonds issued by ING Groep N.V. and ING Bank N.V. to raise Tier 1 and Tier 2 (CRD IV
eligible) capital. Under IFRS these bonds are classified as liabilities and for regulatory purposes, they are
considered capital.
In 2023 ING Groep N.V. issued in February EUR 500 million 5.00 % Fixed Rate Subordinated Tier 2 Notes, GBP
Convertible Capital Securities.
In 2023 ING Groep N.V. redeemed in March USD 1,250 million 4.70 % Fixed Subordinated Tier 2 notes, in April
EUR 1 billion 3.00 % Fixed Subordinated Tier 2 notes on the first call dates.
In 2023 ING Bank N.V. redeemed in September USD 810 million 5.80 % Fixed Rate Subordinated Tier 2 notes.
Reference is made to Note 32 'Changes in liabilities arising from financing activities' for further information
on issuances and redemptions.
The average interest rate on subordinated loans is 4.44 % (2022: 4.01 %). The interest expense during the
year 2023 was EUR 708 million (2022: EUR 648 million).
Total equity | |||
In EUR million | 2023 | 2022 | 2021 |
Share capital and share premium | |||
- Share capital | |||
- Share premium | |||
Other reserves | |||
- Revaluation reserve: Equity securities at FVOCI | |||
- Revaluation reserve: Debt instruments at FVOCI | - | - | |
- Revaluation reserve: Cash flow hedge | - | - | - |
- Revaluation reserve: Credit liability | - | ||
- Revaluation reserve: Property in own use | |||
- Net defined benefit asset/liability remeasurement reserve | - | - | - |
- Currency translation reserve | - | - | - |
- Share of associates and joint ventures and other reserves | |||
- Treasury shares | - | - | - |
- | - | - | |
Retained earnings | |||
Shareholders’ equity (parent) | |||
Non-controlling interests | |||
Total equity | |||
Adjustments for hyperinflation
ING applies IAS 29 ‘Hyperinflation’ on its investment in Türkiye since 2022. The IAS 29 indexation impact on
equity was EUR 54 million (2022: EUR 100 million including a one-off impact of EUR 64 million) of which EUR
million) in retained earnings, EUR 3 million (2022: EUR -17 million) in revaluation reserves and EUR -234
million (2022: EUR -331 million) in profit or loss.
ING Group Annual Report 2023 on Form 20-FF -276
Share capital and share premium
Share capital | ||||||
Ordinary shares (par value EUR | ||||||
Number x 1,000 | In EUR million | |||||
2023 | 2022 | 2021 | 2023 | 2022 | 2021 | |
Authorised share capital | ||||||
Unissued share capital | ||||||
Issued share capital | ||||||
Changes in issued share capital | ||
Ordinary shares (par value EUR | ||
Number x 1,000 | In EUR million | |
Issued share capital as at 31 December 2020 | ||
Issue of shares | ||
Issued share capital as at 31 December 2021 | ||
Issue of shares | ||
Cancellation of shares | - | - |
Issued share capital as at 31 December 2022 | ||
Issue of shares | ||
Cancellation of shares | - | - |
Issued share capital as at 31 December 2023 | ||
In 2023, ING Groep N.V. issued 0.0 million ordinary shares (2022: 2.9 million and in 2021: 3.4 million ordinary
shares). In 2022 and 2021, shares were issued in order to fund obligations arising from share-based
employee incentive programmes. As from 2023 these shares are repurchased from the market. The
cancellation of shares relate to the shares purchased under the share buyback programmes (reference is
made to 'Ordinary shares held by ING Group (treasury shares)').
As at 31 December 2023 ING Groep N.V. has issued USD 7,750 million (2022: USD 6,750 million) Perpetual
Additional Tier 1 Contingent Convertible Capital Securities which can, in accordance with their terms and
conditions, convert by operation of law into ordinary shares if the conditions to such a conversion are
fulfilled. As a result of this conversion, the issued share capital can increase by up to 864 million (2022: 750
million) ordinary shares. Reference is made to Note 18 'Subordinated loans'.
Ordinary shares
All ordinary shares are registered. No share certificates have been issued. The par value of ordinary shares is
EUR 0.01 . The authorised ordinary share capital of ING Groep N.V. currently consists of 9,142 million
ordinary shares. As at 31 December 2023, 3,498 million ordinary shares were issued and fully paid.
Ordinary shares held by ING Group (Treasury shares)
As at 31 December 2023, 154.6 million ordinary shares (2022: 107.4 million and 2021: 128.3 million) of ING
Groep N.V. with a par value of EUR 0.01 are held by ING Groep N.V. or its subsidiaries.
Share premium | |||
In EUR million | 2023 | 2022 | 2021 |
Opening balance | |||
Issue of shares | |||
Closing balance | |||
The increase in share premium in prior years, is a result of the issuance of ordinary shares related to share-
based employee incentive programmes. As from 2023 these shares are repurchased from the market.
Other reserves
Revaluation reserves
Changes in revaluation reserve: Equity securities and Debt instruments at FVOCI | ||||||
Equity securities at FVOCI | Debt instruments at FVOCI | |||||
In EUR million | 2023 | 2022 | 2021 | 2023 | 2022 | 2021 |
Opening balance | - | |||||
Unrealised revaluations | - | - | - | - | ||
Realised gains/losses transferred to the statement of profit or loss | - | - | ||||
Realised revaluations transferred to retained earnings | ||||||
Closing balance | - | - | ||||
ING Group Annual Report 2023 on Form 20-FF -277
Equity securities at FVOCI
In 2023, the unrealised revaluation of EUR -35 million (2022: EUR -118 million and 2021: EUR 94 million)
includes revaluation of shares in Bank of Beijing for EUR -24 million (2022: EUR -86 million and 2021: EUR 38
million).
Changes in cash flow hedge and credit liability reserve | ||||||
Cash flow hedge | Credit liability | |||||
In EUR million | 2023 | 2022 | 2021 | 2023 | 2022 | 2021 |
Opening balance | - | - | - | - | ||
Changes in credit liability reserve | - | |||||
Unrealised revaluations | - | - | ||||
Realised revaluations transferred to retained earnings | - | |||||
Closing balance | - | - | - | - | ||
Cash flow hedge
ING mainly hedges floating rate lending with interest rate swaps. Due to a decrease in forward interest rates
in 2023, the interest rate swaps had a positive revaluation of EUR 997 million which is recognised in the cash
flow hedge reserve.
Changes in Property in own use reserve | |||
In EUR million | 2023 | 2022 | 2021 |
Opening balance | |||
Impact IAS 29 on opening balance1 | - | ||
Unrealised revaluations | - | ||
Realised revaluations transferred to retained earnings | - | - | - |
Closing balance | |||
1 Impact of application of hyperinflation accounting under IAS 29.
Net defined benefit asset/liability remeasurement reserve
Reference is made to Note 33 'Pensions and other post-employment benefits'.
Currency translation reserve
Changes in currency translation reserve | |||
In EUR million | 2023 | 2022 | 2021 |
Opening balance | - | - | - |
Impact IAS 29 on opening balance1 | |||
Unrealised revaluations | - | - | |
Realised gains/losses transferred to the statement of profit or loss | |||
Exchange rate differences | - | ||
Closing balance | - | - | - |
1 Impact of application of hyperinflation accounting under IAS 29.
Unrealised revaluations relates to changes in the value of hedging instruments that are designated as net
investment hedges. The hedging strategy is to protect the CET1 ratio against adverse impact from exchange
rate fluctuations. The net decrease of unrealised revaluations and Exchange rate differences of EUR -132
million is related to several currencies including USD (EUR -238 million), TRY (EUR 11 million including EUR
(EUR -42 million), RUB (EUR -70 million), THB (EUR -13 million), CNY (EUR -16 million) and other currencies
(EUR 11 million).
Share of associates and joint ventures and other reserves
Changes in share of associates, joint ventures and other reserves | |||
In EUR million | 2023 | 2022 | 2021 |
Opening balance | |||
Result for the year | |||
Transfer to/from retained earnings | - | - | |
Closing balance | |||
The Share of associates, joint ventures and other reserves includes non-distributable profits from associates
and joint ventures of EUR 815 million (2022: EUR 797 million and 2021: EUR 738 million). Other reserves
includes a statutory reserve of EUR 1,602 million (2022: EUR 2,264 million and 2021: EUR 2,103 million)
related to the former Stichting Regio Bank and the former Stichting Vakbondsspaarbank SPN and a legal
reserve of EUR 628 million (2022: EUR 540 million and 2021: EUR 573 million) related to internally developed
software. The transfer to retained earnings of EUR -892 million includes the release of the Regio bank and
Vakbondsspaarbank SPN reserve of EUR -998 million against regulatory expenses which are recognised in
the statement of profit or loss.
ING Group Annual Report 2023 on Form 20-FF -278
Treasury shares
Changes in treasury shares | ||||||
In EUR million | Number x 1,000 | |||||
2023 | 2022 | 2021 | 2023 | 2022 | 2021 | |
Opening balance | - | - | - | |||
Purchased/sold for trading purposes | - | - | - | |||
Purchased under staff share plans | - | |||||
Distributed under staff share plans | - | |||||
Purchased Share buyback programme | - | - | - | |||
Cancelled Share buyback programme | - | - | ||||
Closing balance | - | - | - | |||
In 2023 ING Group initiated three share buyback programmes. On 1 March 2023, ING announced a share
buyback programme for a maximum total amount of EUR 50 million. The share buyback programme was
completed by 7 March 2023. In total, 3 million shares have been repurchased at an average price of EUR
programme was to meet obligations under the share-based compensation plans.
The second programme of EUR 1,500 million, commencing on 12 May 2023 and completed by October
2023. A total of 121 million shares have been repurchased at an average price of EUR 12.91 per share
(effective price for ING was EUR 12.36 per share after compensation received from the executing broker).
The shares have been cancelled in December 2023.
Third programme of EUR 2,500 million, commencing on 3 November 2023. As per 31 December 2023 154
million shares have been repurchased at an average price of EUR 12.90 per share and for a total
consideration of EUR 1,982 million. The programme was completed by February 2024. In total 195 million
shares have been repurchased at an average price of EUR 12.87 per share (effective price for ING was EUR
these shares in April 2024.
In March 2023 107 million shares (EUR 1,201 million), purchased in 2022, were cancelled.
Retained earnings
Changes in retained earnings | |||
In EUR million | 2023 | 2022 | 2021 |
Opening balance | |||
Impact on opening balance1 | - | - | |
Transfer to/from other reserves | - | ||
Result for the year | |||
Dividend and other distributions | - | - | - |
Employee share plans | - | ||
Changes in composition of the group and other changes | - | - | - |
Closing balance | |||
1 In 2023, changes in policy following the adoption of IFRS 17 and change in policy for non-financial guarantees. 2022: impact of
application of hyperinflation accounting under IAS 29.
Dividend and other distributions
In 2023, a cash dividend of EUR 2,668 million (2022: EUR 2,178 million and 2021: EUR 1,288 million) and
other cash distributions of EUR 0 million (2022 EUR 1,171 million and 2021: EUR 1,054 million) were paid to
the shareholders of ING Group. For further information, reference is made to Note 29 'Dividend per ordinary
share'.
Other changes
Other changes includes an amount of EUR -3,217 million (2022: EUR -1,983 million; 2021: EUR -140 million),
which corresponds to the purchase and cancellation of treasury shares purchased under the share buyback
programmes.
Ordinary shares - Restrictions with respect to dividend and repayment of capital
The following equity components cannot be freely distributed: Revaluation reserves, Net defined benefit
asset/liability remeasurement reserve, Currency translation reserve, Share of associates and joint ventures
reserve and Other reserves including the reserve related to the former Stichting Regio Bank and the former
Stichting Vakbondsspaarbank SPN.
ING Groep N.V. is subject to legal restrictions regarding the amount of dividends it can pay to the holders of
its ordinary shares. Pursuant to the Dutch Civil Code, dividends can only be paid up to an amount equal to
the excess of the company’s own funds over the sum of the paid-up capital and reserves required by law.
Moreover, ING Groep N.V.’s ability to pay dividends is dependent on the dividend payment ability of its
subsidiaries, associates and joint ventures. ING Groep N.V. is legally required to create a non-distributable
ING Group Annual Report 2023 on Form 20-FF -279
reserve insofar as profits of its subsidiaries, associates and joint ventures are subject to dividend payment
restrictions which apply to those subsidiaries, associates and joint ventures themselves.
Non distributable reserves, determined in accordance with the financial reporting requirements included in
Part 9 of Book 2 of the Dutch Civil Code, from ING Group’s subsidiaries, associates and joint ventures are as
follows:
Non-distributable reserves | |||
In EUR million | 2023 | 2022 | 2021 |
ING Bank | |||
Other | |||
Non-distributable reserves | |||
In addition to the legal and regulatory restrictions on distributing dividends from subsidiaries, associates and
joint ventures to ING Groep N.V. there are various other considerations and limitations that are taken into
account in determining the appropriate levels of equity in the Group’s subsidiaries, associates and joint
ventures. These considerations and limitations include, but are not restricted to, minimum capital
requirements that are imposed by industry regulators in the countries in which the subsidiaries, associates
and joint ventures operate, or other limitations which may exist in certain countries and may or may not be
temporary in nature. It is not possible to disclose a reliable quantification of these limitations. Without
prejudice to the authority of the Executive Board to allocate profits to reserves and to the fact that the
ordinary shares are the most junior securities issued by ING Groep N.V., no specific dividend payment
restrictions with respect to ordinary shares exist. Refer to Note 47 'Capital management' for further details
of the minimal capital requirements and dividend policy of ING Group.
Furthermore, ING Groep N.V. is subject to legal restrictions with respect to repayment of capital to holders of
ordinary shares. Pursuant to the Dutch Civil Code, capital may only be repaid if none of ING Groep N.V.’s
creditors opposes such a repayment within two months following the announcement of a resolution to that
effect.
Cumulative preference shares (not issued)
Pursuant to the Articles of Association of ING Groep N.V. the authorised cumulative preference share capital
consists of 4.6 billion cumulative preference shares, of which none have been issued. The par value of these
cumulative preference shares is EUR 0.01 . A right to acquire cumulative preference shares has been granted
to Stichting Continuïteit ING (ING Continuity Foundation).
The cumulative preference shares rank before the ordinary shares in entitlement to dividend and to
distributions upon liquidation of ING Groep N.V.
The dividend on the cumulative preference shares will be equal to a percentage, calculated on the amount
compulsorily paid up or yet to be paid up. This percentage shall be equal to the average of the euro short-
term rate (€STR) as calculated by the European Central Bank during the financial year for which the
distribution is made; this percentage being weighted on the basis of the number of days for which it applies,
and increased by 2.585 percentage points.
If, and to the extent that the profit available for distribution is not sufficient to pay the dividend referred to
above in full, the shortfall will be made up from the reserves insofar as possible. If, and to the extent that,
the dividend distribution cannot be made from the reserves, the profits earned in subsequent years shall
first be used to make up the shortfall before any distribution may be made on shares of any other category.
ING Groep N.V.’s Articles of Association make provision for the cancellation of cumulative preference shares.
Upon cancellation of cumulative preference shares and upon liquidation of ING Groep N.V., the amount paid
up on the cumulative preference shares will be repaid together with the accrued dividend as well as any
dividend shortfall in preceding years, insofar as this shortfall has not yet been made up. No specific dividend
payment restrictions with respect to the cumulative preference shares exist.
ING Group Annual Report 2023 on Form 20-FF -280
Notes to the Consolidated statement of profit or loss
Net interest income | ||||||||
in EUR million | 2023 | 2022 | 2021 | 2023 | 2022 | 2021 | ||
Interest income on loans | Interest expense on deposits from banks | |||||||
Interest income on financial assets at fair value through OCI | Interest expense on customer deposits | |||||||
Interest income on debt securities at amortised cost | Interest expense on debt securities in issue | |||||||
Interest income on non-trading derivatives (hedge accounting) | Interest expense on subordinated loans | |||||||
Negative interest on liabilities | Negative interest on assets | |||||||
Total interest income using effective interest rate method | Interest expense on non-trading derivatives (hedge accounting) | |||||||
Total interest expense using effective interest rate method | ||||||||
Interest income on financial assets at fair value through profit or loss | ||||||||
Interest income on non-trading derivatives (no hedge accounting) | Interest expense on financial liabilities at fair value through profit or loss | |||||||
Interest income other | Interest expense on non-trading derivatives (no hedge accounting) | |||||||
Total other interest income | Interest expense on lease liabilities | |||||||
Total interest income | Interest expense other | |||||||
Total other interest expense | ||||||||
Total interest expense | ||||||||
Net interest income | ||||||||
Total net interest income amounts to EUR 16,162 million (2022: EUR 14,593 million; 2021: EUR 14,000
million). Net interest income was affected by reversing the hedge accounting impacts that are applied
under EU ‘IAS 39 carve-out’ with an impact of EUR 187 million (2022: EUR 836 million). The net increase,
without the IAS 39 carve out impact, is EUR 1,382 million. The increasing net interest income for 2023 and
2022 is a reflection of the interest rates during the period which repriced faster on the asset side compared
to the liability side of the balance sheet. In 2022 an one-off adjustment was recorded in interest income on
loans regarding the credit moratoria in Poland (EUR -343 million).
Due to prevalent rates during the comparative years, Negative interest on liabilities includes the ECB funding
rate benefit from the TLTRO III programme of EUR 314 million in 2022 (2021: EUR 808 million), while for 2023
Interest expense on deposits from banks includes interest paid under the TLTRO III programme of EUR
This was driven by the following applicable TLTRO III rates applicable for ING Group: -100 bps throughout the
entire 2021 and the first half of 2022 until 23 June 2022; -37 bps, -36 bps, -29 bps between 23 June 2022
and 22 November 2022 for ING's participation in series 3,4 and 7 of TLTRO III, respectively; 150 bps between
22 November 2022 and 21 December 2022; 200 bps from 21 December 2022 until 8 February 2023; 250 bps
between 8 February 2023 and 22 March 2023; 300 bps between 22 March 2023 and May 2023 and
increased to 400 bps during the period May to December 2023.
ING Group Annual Report 2023 on Form 20-FF -281
Net fee and commission income | |||
in EUR million | 2023 | 2022 | 2021 |
Fee and commission income | |||
Payment Services | |||
Securities business | |||
Insurance and other broking | |||
Portfolio management | |||
Lending business | |||
Financial guarantees and other commitments | |||
Other | |||
Total fee and commission income | |||
Fee and commission expenses | |||
Payment Services | |||
Securities business | |||
Distribution of products | |||
Other | |||
Total fee and commission expenses | |||
Net fee and commission income | |||
Payment services fees are earned for providing services for deposit accounts and cards, cash management
and transaction processing including interchange. Securities fees and commissions are fees for securities
brokerage and securities underwriting. Portfolio management fees include fees earned for asset
management activities, fiduciary and related activities in which ING holds or invests assets on behalf of its
customers. Fees and commissions from Lending (syndication) business include income earned for lending
advisory, origination, underwriting and loan commitments which are not part of the effective interest rate.
Financial guarantees and other commitments fees and commissions are earned from bank guarantees,
letters of credit and other trade finance related products, factoring and leasing. Fees paid for distribution of
products are all fees paid for the distribution of ING’s products and services through external providers.
Reference is made to Note 30 'Segments' which includes net fee and commission income, as reported to the
Executive Board and the Management Board Banking, disaggregated by line of business and by
geographical segment.
Valuation results and net trading income | |||
in EUR million | 2023 | 2022 | 2021 |
Securities trading results | - | ||
Derivatives trading results | - | ||
Other trading results | |||
Change in fair value of derivatives relating to | |||
– fair value hedges | - | - | |
– cash flow hedges (ineffective portion) | |||
– other non-trading derivatives | - | ||
Change in fair value of assets and liabilities (hedged items) | - | ||
Valuation results on assets and liabilities designated at FVPL (excluding trading) | - | - | |
Foreign exchange transactions results | |||
- | |||
In general, the fair value movements are influenced by changes in the market conditions, such as stock
prices, credit spreads, interest rates and currency exchange rates. In 2023, the financial markets were
characterised by elevated levels of volatility. In the first quarter of the year, the markets worldwide were
shaken by the demise of SVB bank and the stress surrounding Credit Suisse, fuelling uncertainty around
possible additional defaults. Furthermore, the ongoing interest rate hikes by the central banks in Europe and
the US led to a fast increase in rates worldwide. Toward the end of the year, the probability increased for
interest rates going down, which has been reflected in the forward interest rates. In 2022, the market was
affected by a significant increase in interest rates volatility, interest-rate hikes across EU and US, and a
steady fall of the EUR value and appreciation of USD, while in 2021 the market recovered from the Covid-19
pandemic, stabilised and returned to pre-pandemic levels. This resulted in a negative EU IAS39 carve out
adjustment of EUR -4,642 million in 2023 compared to a positive adjustment in 2022 (EUR 10,713 million)
and in 2021 (EUR 1,218 million) which was the result of sharply increased interest rates.
Securities trading results includes the results of market making in instruments such as government
securities, equity securities, corporate debt securities, money-market instruments. Derivatives trading
results includes the results of derivatives such as interest rate swaps, options, futures, and forward
contracts. Trading gains and losses relating to trading securities still held as at 31 December 2023 amount
to EUR 160 million (2022: EUR -157 million; 2021: EUR -268 million). The majority of the risks involved in
security and currency trading are economically hedged with derivatives. The securities trading results are
partly offset by results on these derivatives. The result of these derivatives is included in Derivatives trading
results.
ING Group Annual Report 2023 on Form 20-FF -282
Other trading results include the results of trading loans and funds entrusted.
Foreign exchange transactions results include gains and losses from spot and forward contracts, options,
futures, and translated foreign currency assets and liabilities. The result on currency trading is included in
foreign exchange transactions results.
Net trading income relates to trading assets and trading liabilities which include assets and liabilities that
are classified under IFRS as Trading but are closely related to servicing the needs of the clients of ING. ING
offers products that are traded on the financial markets to institutional clients, corporate clients, and
governments. ING’s trading books are managed based on internal limits and comprise a mix of products
with results which could be offset. A significant part of the derivatives in the trading portfolio are related to
servicing corporate clients in their risk management to hedge for example currency or interest rate
exposures. From a risk perspective, the gross amount of trading assets must be considered together with
the gross amount of trading liabilities, which are presented separately on the statement of financial
position. However, IFRS does not always allow netting of these positions in the statement of financial
position. Reference is made to Note 4 'Financial assets at fair value through profit or loss' and Note 14
'Financial liabilities at fair value through profit or loss' for information on trading assets and trading liabilities
respectively.
‘Valuation results and net trading income’ include the fair value movements on derivatives (used for both
hedge accounting and economically hedging exposures) as well as the changes in the fair value of assets
and liabilities included in hedging relationships as hedged items. During 2023, the interest-rate movements
significantly affected the fair value changes of other non-trading derivatives as well as the fair value
changes of both the derivatives and the hedged items designated in fair value hedges. Reference is made to
Note 36 'Derivatives and hedge accounting' for information on derivatives used for hedge accounting.
Furthermore, derivatives trading results is also impacted by fair value movements arising from changes in
credit spreads (CVA and DVA), bid offer spreads, model risk and incremental cost of funding on derivatives
(FVA and CollVA). Refer to Note 35 'Fair value of assets and liabilities' for information on these valuation
adjustments.
Valuation results on assets and liabilities designated at fair value through profit or loss (excluding trading)’
include fair value changes on financial assets and financial liabilities driven by changed market conditions.
Refer to Note 4 'Financial assets at fair value through profit or loss' and to Note 14 'Financial liabilities at fair
value through profit or loss'.
In addition, ‘Valuation results on assets and liabilities designated at fair value through profit or loss
(excluding trading)’ include fair value adjustments on own issued notes amounting to EUR -230 million
(2022: EUR 745 million; 2021: EUR 65 million).
Investment income | |||
in EUR million | 2023 | 2022 | 2021 |
Dividend income | |||
Realised gains/losses on disposal of debt instruments measured at FVOCI | - | ||
Income from and fair value gains/losses on investment properties | - | ||
In 2023, 2022 and 2021 dividend income mainly consists of dividend received from ING’s equity stake in
Bank of Beijing.
In 2023, Other net income of EUR -147 million (2022: EUR -56 million; 2021: EUR 236 million) includes EUR
-244 million (2022: EUR -333 million) net monetary loss reflecting the IAS 29 hyperinflation impact in Türkiye
related to the indexation of Türkiye's statement of financial position and statement of profit or loss with an
offsetting effect in the currency translation reserve. Furthermore, it includes the positive recovery of
defaulted receivables of EUR 25 million (2022 EUR 32 million; 2021 EUR 25 million).
In 2022, other net income includes the proceeds of the agreement with Boursorama after our exit from the
retail banking market in France of EUR 125 million and a gain of EUR 67 million from a legacy entity in Retail
Belgium.
In 2021, other net income included the recognition of EUR 72 million relating to a better than expected
recovery of the insolvency of a financial institution in the Netherlands and EUR 34 million proceeds of the
agreement with Raiffeisenbank due to the withdrawal from the retail banking market in the Czech Republic.
ING Group Annual Report 2023 on Form 20-FF -283
Staff expenses | |||
in EUR million | 2023 | 2022 | 2021 |
Salaries | |||
Pension costs and other staff-related benefit costs | |||
Social security costs | |||
Share-based compensation arrangements | |||
External employees | |||
Education | |||
Other staff costs | |||
Share-based compensation arrangements include EUR 31 million (2022: EUR 25 million; 2021: EUR 29
million) relating to equity-settled share-based payment arrangements and EUR 0 million (2022: EUR 1
million; 2021: EUR 2 million) relating to cash-settled share-based payment arrangements.
Number of employees | |||||||||
Netherlands | Rest of the world | Total | |||||||
2023 | 2022 | 2021 | 2023 | 2022 | 2021 | 2023 | 2022 | 2021 | |
Total average number of internal employees at full time equivalent basis | |||||||||
Remuneration of senior management, Executive Board and Supervisory Board
Reference is made to Note 46 'Related parties'.
Share plans
ING grants various types of share awards, namely deferred shares, performance shares and upfront shares,
which form part of the variable remuneration offering via the Long-term Sustainable Performance Plan
(LSPP). The entitlement to the LSPP share awards is granted conditionally. If the participant remains in
employment for an uninterrupted period between the grant date and the vesting date, the entitlement
becomes unconditional, with the exception of the upfront shares which are immediately vested upon grant.
Upfront and deferred shares awarded to the Management Board members of ING Group as well as identified
staff, have a retention obligation that must be adhered to upon vesting, typically a minimum retention of 12
months applies. ING has the authority to apply a holdback to awarded but unvested shares and a clawback
to vested shares
The share awards granted in 2023 relate to the performance year 2022. In 2023, 52,693 share awards
(2022: 55,651 ; 2021: 0 ) were granted to the members of the Executive Board of ING Groep N.V., and 172,103
share awards (2022: 137,506 ; 2021: 123,750 ) were granted to the Management Board Banking. To senior
management and other employees 3,244,951 share awards (2022: 2,913,926 ; 2021: 3,267,372 ) were
granted.
In 2022 and 2021, the obligations with regard to share plans are funded by newly issued shares at the
discretion of ING Group. As of 2023, shares are bought back from the market to fund share plans.
Changes in share awards | ||||||
Share awards (in numbers) | Weighted average grant date fair values (in euros) | |||||
2023 | 2022 | 2021 | 2023 | 2022 | 2021 | |
Opening balance as at 1 January | ||||||
Granted | ||||||
Vested | - | - | - | |||
Forfeited | - | - | - | |||
Closing balance | ||||||
As at 31 December 2023, the share awards consists of 3,897,800 share awards (2022: 3,201,579 ; 2021:
The fair value of share awards granted is recognised as an expense under Staff expenses and is allocated
over the vesting period of the share awards. The fair value calculation takes into account the current share
prices, expected volatilities and the dividend yield of ING shares.
As at 31 December 2023, total unrecognised compensation costs related to share awards amount to EUR 15
million (2022: EUR 13 million; 2021: EUR 13 million). These costs are expected to be recognised over a
weighted average period of 2.0 years (2022: 1.9 years; 2021: 1.7 years).
ING Group Annual Report 2023 on Form 20-FF -284
Other operating expenses | |||
in EUR million | 2023 | 2022 | 2021 |
Regulatory costs | |||
Audit and non-audit services | |||
IT related expenses | |||
Advertising and public relations | |||
External advisory fees | |||
Office expenses | |||
Travel and accommodation expenses | |||
Contributions and subscriptions | |||
Postal charges | |||
Depreciation of property and equipment | |||
Amortisation of intangible assets | |||
(Reversals of) impairments of property and equipment | |||
(Reversals of) impairments of intangible assets | |||
Addition to / (unused amounts reversed of) provision for reorganisations | |||
Addition to / (unused amounts reversed of) other provisions | |||
Other | |||
Reference is made to Note 9 'Property and equipment' for (reversals of) impairments of property and
equipment and Note 10 'Intangible assets' for (reversals of) impairments of intangible assets.
For further information on addition to (unused amounts reversed of) provision for reorganisations refer to
Note 15 'Provisions' and for further information on addition to (unused amounts reversed of) other
provisions refer to Note 15 'Provisions' and Note 42 'Legal proceedings'.
Regulatory costs
Regulatory costs represent contributions to the Deposit Guarantee Schemes (DGS), the Single Resolution
Fund (SRF), local bank taxes and local resolution funds. Included in Regulatory costs for 2023, are
contributions to DGS of EUR 320 million (2022: EUR 425 million; 2021: EUR 435 million) mainly related to the
Netherlands, Germany, Belgium and Poland and contributions to the SRF and local resolution funds of EUR
million from EUR 470 million in 2022 to EUR 472 million (2021: EUR 522 million).
In 2022, ING Bank Slaski, together with seven other Polish banks, established an Institutional Protection
Scheme (IPS). The fund can be used to ensure the liquidity and solvency of each of its participants, and to
assist in the resolution of participating and non-participating banks. The contribution by ING amounts to EUR
nil for 2023 (2022: EUR 99 million and is recognized as regulatory costs (DGS).
Total audit and non-audit services include the following fees for services provided by the Group’s auditor.
Fees of Group’s auditors | |||
in EUR million | 2023 | 2022 | 2021 |
Audit fees | |||
Audit related fees | |||
Total1 | |||
1 The Group’s auditors did not provide any non-audit services.
Fees as disclosed in the table above relate to the network of the Group’s auditors and are the total expected
audit fees for the period excluding VAT.
Earnings per ordinary share | |||||||||
Weighted average number | |||||||||
of ordinary shares outstanding | |||||||||
Amount | during the period | Per ordinary share | |||||||
(in EUR million) | (in millions) | (in EUR) | |||||||
2023 | 2022 | 2021 | 2023 | 2022 | 2021 | 2023 | 2022 | 2021 | |
Basic earnings | |||||||||
Basic earnings from continuing operations | |||||||||
Effect of dilutive instruments: | |||||||||
Share plans | |||||||||
Diluted earnings | |||||||||
Diluted earnings from continuing operations | |||||||||
ING Group Annual Report 2023 on Form 20-FF -285
Earnings per ordinary share is calculated on the basis of the weighted average number of ordinary shares
outstanding. In calculating the weighted average number of ordinary shares outstanding, own shares held
by group companies (including share buyback programmes) are deducted from the total number of
ordinary shares in issue.
Dilutive instruments
Diluted earnings per share is calculated as if the share plans outstanding at the end of the period had been
exercised at the beginning of the period and assuming that the cash received from dilutive instruments (if
any) is used to buy own shares against the average market price during the period. The net increase in the
number of shares resulting from exercising share plans is added to the average number of shares used for
the calculation of diluted earnings per share.
Dividends to shareholders of the parent | ||
Per ordinary share (in EUR) | Total (in EUR million) | |
Dividends on ordinary shares: | ||
In respect of 2021 | ||
- Interim dividend, paid October 2021 | ||
- Final dividend | ||
Total dividend in respect of 2021 | ||
In respect of 2022 | ||
- Interim dividend, paid August 2022 | ||
- Final dividend, paid May 2023 | ||
Total dividend in respect of 2022 | ||
In respect of 2023 | ||
- Interim dividend declared, paid August 2023 | ||
- Final dividend declared | ||
Total dividend in respect of 2023 | ||
On 24 April 2023, the Annual General Meeting of shareholders ratified the total dividend of EUR 0.559 per
ordinary share of which EUR 0.17 per share was paid as an interim cash dividend during August 2022. The
final dividend of EUR 0.389 per ordinary share was paid entirely in cash.
In 2023, no other cash distributions were paid to shareholders of ING Group (2022: EUR 1,171 million, EUR
ING Groep N.V. is required to withhold tax of 15 % on dividends paid.
Reference is made to Note 19 'Equity' for further information on share buyback programmes and other
distributions.
30 Segments
ING Group’s segments are based on the internal reporting structure by lines of business.
The Executive Board of ING Group and the Management Board Banking (together the Chief Operating
Decision Maker (CODM)) set the performance targets, approve and monitor the budgets prepared by the
business lines. Business lines formulate strategic, commercial, and financial plans in conformity with the
strategy and performance targets set by the CODM.
Recognition and measurement of segment results are in line with the accounting policies as described in
Note 1 'Basis of preparation and material accounting policy information'. The results for the period for each
reportable segment are after intercompany and intersegment eliminations and are those reviewed by the
CODM to assess performance of the segments. Corporate expenses are allocated to business lines based on
time spent by head office personnel, the relative number of staff, or on the basis of income, expenses and/or
assets of the segment.
ING Group Annual Report 2023 on Form 20-FF -286
segments:
Specification of the main sources of income of each of the segments by line of business | |
Segments by line of business | Main source of income |
Retail Netherlands (Market Leaders) | Income from retail and private banking activities in the Netherlands, including the Business Banking segments. The main products offered are current and savings accounts, business lending, mortgages and other consumer lending. |
Retail Belgium (Market Leaders) | Income from retail and private banking activities in Belgium and Luxembourg, including the Business Banking segments. The main products offered are similar to those in the Netherlands. |
Retail Germany (Challengers and Growth Markets) | Income from retail and private banking activities in Germany, including the Business Banking segments. The main products offered are similar to those in the Netherlands. |
Retail Other (Challengers and Growth Markets) | Income from retail banking activities in the rest of the world, including the Business Banking segments in specific geographies. The main products offered are similar to those in the Netherlands. |
Wholesale Banking | Income from wholesale banking activities. The main products are: lending, payments & cash management, working capital solutions, trade finance, financial markets, corporate finance and treasury. |
Specification of geographical split of the segments | |
Geographical split of the segments | Main countries |
The Netherlands | |
Belgium | Including Luxembourg |
Germany 1,4 | |
Other Challengers 1,2,4 | Australia, Italy, Spain and Portugal |
Growth Markets 2,3,4 | Poland, Romania and Türkiye |
Wholesale Banking Rest of World 4 | UK, Ireland & Middle East, Americas, Asia and other countries in Europe |
Other 3 | Corporate Line |
1 Retail Banking Austria (included in Germany) and Retail Banking Czech Republic (included in Other Challengers) up to and including
2021, after which ING left the retail markets.
2 In 2022, ING discontinued its retail activities in France and the Philippines.
3 In 2023, there was a change in the governance over the Asian stakes, which resulted in their transfer from Retail Banking Growth
Markets to Other (Corporate Line). Comparatives have been adjusted.
4 As from 2023, Wholesale Banking in France as well as Wholesale Banking in the Philippines are recorded in Wholesale Banking Rest of
World. Previously these financials were reported in Other Challengers and Growth Markets respectively. Comparatives have been
adjusted. As from 2022, Wholesale Banking Austria as well as Wholesale Banking Czech Republic are recorded in Wholesale Banking
Rest of World. Previously these financials were reported in Germany and Other Challengers respectively.
ING Group monitors and evaluates the performance of ING Group at a consolidated level and by segment.
The Executive Board and the Management Board Banking consider this to be relevant to an understanding
of the Group’s financial performance, because it allows investors to understand the primary method used
by management to evaluate the Group’s operating performance and make decisions about allocating
resources.
In addition, ING Group believes that the presentation of results in accordance with IFRS-EU helps investors
compare its segment performance on a meaningful basis by highlighting result before tax attributable to
ongoing operations and the profitability of the segment businesses. IFRS-EU result is derived by including
the impact of the IFRS-EU ‘IAS 39 carve out’ adjustment.
The IFRS-EU ‘IAS 39 carve-out’ adjustment relates to fair value portfolio hedge accounting strategies for the
mortgage and savings portfolios in the Benelux, Germany and Other Challengers that are not eligible under
IFRS-IASB. As no hedge accounting is applied to these mortgage and savings portfolios under IFRS-IASB, the
fair value changes of the derivatives are not offset by fair value changes of the hedge items (mortgages and
savings).
The segment reporting in the annual report on Form 20-F has been prepared in accordance with
International Financial Reporting Standards as issued by the EU (IFRS-EU) and reconciled to International
Financial Reporting Standards as issued by the International Accounting Standards Board (IFRS-IASB) for
consistency with the other financial information contained in this report. The difference between the
accounting standards is reflected in the Wholesale Banking segment, and in the geographical split of the
segments in the Netherlands, Belgium, Germany and Other Challengers.
Reference is made to Note 1 'Basis of preparation and material accounting policy information' for a
reconciliation between IFRS-EU and IFRS-IASB. Corporate expenses are allocated to business lines based on
time spent by head office personnel, the relative number of staff, or on the basis of income, expenses and/or
assets of the segment.
ING Group reconciles the total segment results to the total result using Corporate Line. The Corporate Line
reflects capital management activities, as ING Group applies a system of capital charging for its banking
operations in order to create a comparable basis for the results of business units globally, irrespective of the
business units’ book equity and the currency they operate in.
As from 2022, results in the Corporate Line have been impacted by the application of hyperinflation
accounting in the consolidation of our subsidiary in Türkiye (IAS 29).
Following a change in governance, the Asian stakes (our investments in Bank of Beijing and TMBThanachart
Bank (TTB)) are reported in Corporate Line as of 2023 (with a profit before tax of €185 million), whereas
previously they were reported in Retail Other. Comparable data have been adjusted accordingly.
ING Group Annual Report 2023 on Form 20-FF -287
Furthermore, Corporate Line includes certain other income and expenses that are not allocated to the
banking businesses.
Total income for Corporate Line in 2023 amounted to EUR 450 million compared with EUR 84 million in 2022.
This included a hyperinflation accounting impact of EUR -179 million in 2023 versus EUR -279 million in
2022. Excluding hyperinflation accounting impact, total income rose by EUR 266 million, mainly attributable
to higher income from Treasury activities and because 2022 had included EUR -165 million impact for
impairments on our stake in TTB.
Operating expenses for Corporate Line were EUR 542 million, 1.3 % up from EUR 535 million in 2022.
Expenses in 2023 included a hyperinflation impact of EUR 48 million and EUR 51 million that was
provisioned, while 2022 had included a hyperinflation impact of EUR 30 million and a EUR 32 million
impairment loss related to the goodwill allocated to Türkiye.
The information presented in this note is in line with the information presented to the Executive Board of
ING Group and Management Board Banking.
This note does not provide information on the types of products and services from which each reportable
segment derives its revenues, as this is not reported internally and is therefore not readily available.
ING Group Annual Report 2023 on Form 20-FF -288
Reconciliation between IFRS-IASB and IFRS-EU income, expense and net result | |||||||||||||||
12 month period | 2023 | 2022 | 2021 | ||||||||||||
in EUR million | Income | Expenses | Taxation | Non- controlling interests | Net result 1 | Income | Expenses | Taxation | Non- controlling interests | Net result1 | Income | Expenses | Taxation | Non- controlling interests | Net result1 |
Net result IFRS-IASB attributable to equity holder of the parent | |||||||||||||||
Remove impact of: | |||||||||||||||
Adjustment of the EU 'IAS 39 carve out' 2 | - | - | - | - | - | - | |||||||||
Result IFRS-EU 2 | |||||||||||||||
1Net result, after tax and non-controlling interests.
2ING prepares the Form 20-F in accordance with IFRS-IASB. This information is prepared by reversing the hedge accounting impacts that applied under the EU 'carve-out' version of IAS 39. For the IFRS-EU result, the impact of the carve-out is re-instated as this is the measure at
which management monitors the business.
ING Group Total | |||||||||||
12 month period | 2023 | 2022 | 2021 | ||||||||
ING Bank | Other | Total ING Group | ING Bank | Other | Total ING Group | ING Bank | Other | Total ING Group | |||
Income | |||||||||||
– Net interest income | |||||||||||
– Net fee and commission income | |||||||||||
– Total investment and other income | - | ||||||||||
Total income | |||||||||||
Expenditure | |||||||||||
– Operating expenses | - | ||||||||||
– Addition to loan loss provisions | |||||||||||
Total expenses | - | ||||||||||
Result before taxation | |||||||||||
Taxation | |||||||||||
Non-controlling interests | |||||||||||
Net result IFRS-EU | |||||||||||
Adjustment of the EU 'IAS 39 carve out' | - | - | |||||||||
Net result IFRS-IASB | |||||||||||
ING Group Annual Report 2023 on Form 20-FF -289
Segments by line of business | |||||||||||||||||||||
12 month period | 2023 | 2022 | 2021 | ||||||||||||||||||
in EUR million | Retail Nether- lands | Retail Belgium | Retail Germany | Retail Other | Wholesale Banking | Corporate Line | Total | Retail Nether- lands | Retail Belgium | Retail Germany | Retail Other 1,2 | Wholesale Banking | Corporate Line 1 | Total | Retail Nether- lands | Retail Belgium | Retail Germany 3 | Retail Other 1,2,3 | Wholesale Banking | Corporate Line 1 | Total |
Income | |||||||||||||||||||||
– Net interest income | |||||||||||||||||||||
– Net fee and commission income | - | - | |||||||||||||||||||
– Total investment and other income | - | - | - | - | |||||||||||||||||
Total income | |||||||||||||||||||||
Expenditure | |||||||||||||||||||||
– Operating expenses | |||||||||||||||||||||
– Addition to loan loss provisions | - | - | |||||||||||||||||||
Total expenses | |||||||||||||||||||||
Result before taxation | - | - | - | ||||||||||||||||||
Taxation | |||||||||||||||||||||
Non-controlling interests | |||||||||||||||||||||
Net result IFRS-EU | - | - | - | ||||||||||||||||||
Adjustment of the EU 'IAS 39 carve out' | - | - | |||||||||||||||||||
Net result IFRS-IASB | - | - | - | - | |||||||||||||||||
1 In 2023, there was a change in the governance over the Asian stakes, which resulted in their transfer from Retail Other to Corporate Line. Historical figures have been adjusted.
2 In 2022, ING discontinued its retail activities in France and the Philippines.
3 In 2021, ING exited from the retail banking markets in Austria and the Czech Republic.
ING Group Annual Report 2023 on Form 20-FF -290
Geographical split of the segments | ||||||||||||||||||||||||
12 month period | 2023 | 2022 | 2021 | |||||||||||||||||||||
in EUR million | Nether- lands | Belgium | Ger- many | Other Challen gers | Growth markets | Wholesale Banking Rest of World | Other | Total | Nether- lands | Belgium | Ger- many | Other Challen gers 1,3 | Growth markets 1,2,3 | Wholesale Banking Rest of World 1 | Other 2 | Total | Nether- lands | Belgium | Ger- many 4 | Other Challen gers 1,3,4 | Growth markets 1,2,3 | Wholesale Banking Rest of World 1 | Other 2 | Total |
– Net interest income | ||||||||||||||||||||||||
– Net fee and commission income | - | - | ||||||||||||||||||||||
– Total investment and other income | - | - | - | - | ||||||||||||||||||||
Total income | ||||||||||||||||||||||||
Expenditure | ||||||||||||||||||||||||
– Operating expenses | ||||||||||||||||||||||||
– Addition to loan loss provisions | - | - | ||||||||||||||||||||||
Total expenses | ||||||||||||||||||||||||
Result before taxation | - | - | - | |||||||||||||||||||||
Retail Banking | ||||||||||||||||||||||||
Wholesale Banking | ||||||||||||||||||||||||
Corporate Line | - | - | - | - | - | - | ||||||||||||||||||
Result before taxation | - | - | - | |||||||||||||||||||||
Taxation | ||||||||||||||||||||||||
Non-controlling interests | ||||||||||||||||||||||||
Net result IFRS-EU | - | - | - | |||||||||||||||||||||
Adjustment of the EU 'IAS 39 carve out' | - | - | - | - | - | - | ||||||||||||||||||
Net result IFRS-IASB | - | - | - | - | - | |||||||||||||||||||
1As from 2023, Wholesale Banking in France as well as Wholesale Banking in the Philippines are recorded in Wholesale Banking Rest of World. Previously the financials of Wholesale Banking in France and Wholesale Banking in the Philippines were reported in Other Challengers
and Growth Markets respectively. Historical figures have been adjusted.
2In 2023, there was a change in the governance over the Asian stakes, which resulted in their transfer form Growth Markets to Other (Corporate Line). Historical figures have been adjusted.
3In 2022, ING discontinued its retail activities in France and the Philippines.
44 In 2021, ING exited from the retail banking markets in Austria (included in Germany) and the Czech Republic (included in Other Challengers).
ING Group Annual Report 2023 on Form 20-FF -291
ING Group’s business lines operate in different geographical areas: the Netherlands, Belgium, Germany, Rest
of Europe and Rest of the World. The geographical analyses are based on the location of the office from
which the transactions are originated and do not include countries where ING only has representation
offices. The Netherlands is ING Group’s country of domicile.
In order to increase ING Group’s tax transparency, additional financial information on a per country basis
has been included in this disclosure: Tax paid represents all income tax paid to and/or received from tax
authorities in the current year, irrespective of the fiscal year to which these payments or refunds relate.
Total assets by country does not include intercompany balances and reconciles to the total assets in the
consolidated statement of financial position of ING Group. At the date when these financial statements
were authorized for issue, the Netherlands has implemented new legislation, based on an OECD legislative
framework, to ensure that large multinational groups with their head office in the Netherlands pay income
tax at a minimum effective tax rate of 15% in all the countries they are present in, applicable from 2024 and
onwards. Countries in which ING operates that have an effective tax rate below 15 % will be subject to an
additional top-up tax.
ING Group expects to be subject to top-up tax in relation to its operations in Switzerland, Ireland, Bulgaria
and United Arab Emirates, in which countries the statutory tax rate is below 15
country applies a special tax rate for certain profit components that reduces its effective tax rate to below
ING Group has applied a temporary mandatory relief from deferred tax accounting for the impacts of the
top-up tax and accounts for it as a current tax when it is incurred. If the top-up tax had been applied in
2023, the total top up tax that had to be paid by ING Group would have amounted to approximately EUR 4
million.
The table below provide additional information, for the years 2023, 2022 and 2021 respectively, on names
of principal subsidiaries and branches, nature of main activities and average number of employees on a full
time equivalent basis by country/tax jurisdiction.
ING Group Annual Report 2023 on Form 20-FF -292
Additional information by country | |||||||||||||||||||||
Geographical area | Country/Tax jurisdiction | Name of principal subsidiary | Main (banking) activity | Average number of employees at full time equivalent basis | Total income | Total assets | Result before tax | Taxation | Tax paid | ||||||||||||
2023 | 2022 | 2021 | 2023 | 2022 | 2021 | 2023 | 2022 | 2021 | 2023 | 2022 | 2021 | 2023 | 2022 | 2021 | 2023 | 2022 | 2021 | ||||
Netherlands | Netherlands | ING Bank N.V. | Wholesale / Retail | ||||||||||||||||||
Belgium | Belgium 5 | ING België N.V. | Wholesale / Retail | - | |||||||||||||||||
Luxembourg | ING Luxembourg S.A. | Wholesale / Retail | |||||||||||||||||||
Germany | Germany 5 | ING DiBa A.G. | Wholesale / Retail | - | - | ||||||||||||||||
Rest of Europe | Poland 1 | ING Bank Slaski S.A | Wholesale / Retail | - | |||||||||||||||||
Spain | Branch of ING Bank N.V. | Wholesale / Retail | |||||||||||||||||||
Italy | Branch of ING Bank N.V. | Wholesale / Retail | |||||||||||||||||||
Romania 1 | Branch of ING Bank N.V. | Wholesale / Retail | |||||||||||||||||||
Türkiye | ING Bank A.S. | Wholesale / Retail | - | - | - | ||||||||||||||||
UK | Branch of ING Bank N.V. | Wholesale | |||||||||||||||||||
Switzerland | Branch of ING Bank N.V. | Wholesale | |||||||||||||||||||
France 2,4 | Branch of ING Bank N.V. | Wholesale | - | - | - | ||||||||||||||||
Ireland | Branch of ING Bank N.V. | Wholesale | |||||||||||||||||||
Czech Republic 3 | Branch of ING Bank N.V. | Wholesale | - | ||||||||||||||||||
Hungary | Branch of ING Bank N.V. | Wholesale | |||||||||||||||||||
Russia | ING Bank (Eurasia) Z.A.O. | Wholesale | - | ||||||||||||||||||
Slovakia 1 | Branch of ING Bank N.V. | Wholesale | - | ||||||||||||||||||
Portugal | Branch of ING Bank N.V. | Wholesale | |||||||||||||||||||
Ukraine | PJSC ING Bank Ukraine | Wholesale | |||||||||||||||||||
Bulgaria | Branch of ING Bank N.V. | Wholesale | |||||||||||||||||||
Austria 3 | Branch of ING Bank N.V. | Wholesale | - | - | |||||||||||||||||
1Includes significant number of FTEs in relation to global services provided.
2Public subsidies received, as defined in article 89 of the CRD IV, amounts to EUR 0.2 million (2022: EUR 0.1 million; 2021: EUR 0.0 million).
3In 2021, ING exited from the retail banking markets in Austria and the Czech Republic.
4In 2022, ING exited from the retail banking markets in France and the Philippines.
5Result before tax is impacted by the EU 'IAS 39' carve out adjustment.
ING Group Annual Report 2023 on Form 20-FF -293
Additional information by country (continued) | |||||||||||||||||||||
Geographical area | Country/Tax jurisdiction | Name of principal subsidiary | Main (banking) activity | Average number of employees at full time equivalent basis | Total income | Total assets | Result before tax | Taxation | Tax paid | ||||||||||||
2023 | 2022 | 2021 | 2023 | 2022 | 2021 | 2023 | 2022 | 2021 | 2023 | 2022 | 2021 | 2023 | 2022 | 2021 | 2023 | 2022 | 2021 | ||||
Rest of the World | Australia | ING Bank (Australia) Ltd. | Wholesale / Retail | ||||||||||||||||||
USA | ING Financial Holdings Corp. | Wholesale | |||||||||||||||||||
Singapore | Branch of ING Bank N.V. | Wholesale | |||||||||||||||||||
Japan | Branch of ING Bank N.V. | Wholesale | - | ||||||||||||||||||
South Korea | Branch of ING Bank N.V. | Wholesale | - | ||||||||||||||||||
Hong Kong | Branch of ING Bank N.V. | Wholesale | - | - | - | - | - | ||||||||||||||
Taiwan | Branch of ING Bank N.V. | Wholesale | - | - | - | - | |||||||||||||||
China | Branch of ING Bank N.V. | Wholesale | - | - | - | ||||||||||||||||
Philippines 1,4 | Branch of ING Bank N.V. | Wholesale | - | - | - | ||||||||||||||||
United Arab Emirates | Branch of ING Bank N.V. | Wholesale | - | - | - | - | - | ||||||||||||||
Sri Lanka | Branch of ING Hubs B.V. | Global services | |||||||||||||||||||
Brazil | ING ADMINISTRAÇÃO LTDA. | In run-off / liquidation | |||||||||||||||||||
Mexico | ING Consulting, S.A. de C.V. | In run-off / liquidation | - | - | |||||||||||||||||
Canada | Payvision Canada Services Ltd. | Dissolved in 2023 | |||||||||||||||||||
Macau | Payvision Macau Ltd. | Liquidated in 2022 | |||||||||||||||||||
Indonesia | PT ING Securities Indonesia | Liquidated in 2022 | |||||||||||||||||||
Malaysia | Branch of ING Bank N.V. | Closed in 2022 | - | ||||||||||||||||||
Mauritius | ING Mauritius Investment I | Liquidated in 2022 | |||||||||||||||||||
Colombia | ING Capital Colombia S.A.S. | Dissolved in 2021 | |||||||||||||||||||
Total | |||||||||||||||||||||
1 Includes significant number of FTEs in relation to global services provided.
4 In 2022, ING exited from the retail banking markets in France and the Philippines.
ING Group Annual Report 2023 on Form 20-FF -294
2023
The higher tax charge of 32 % in the Netherlands (compared to the statutory rate of 25.8 %) is mainly caused
by the non-deductible Dutch bank tax (EUR 189 million) and other non-deductible expenses.
The lower tax charge in Spain is caused by a tax refund (EUR 43 million) regarding previous years.
ING continued reducing Russian-related exposure during 2023. In 2023, the local results on a stand-alone
basis were positively impacted by releases of loan loss provisions following improved macroeconomic
indicators and decrease in exposures following sales and repayments. For further information, reference is
made to Risk management.
The lower negative tax charge reported for ING Türkiye with respect to its loss is mainly caused by the non
deductibility for tax purposes of the accounting loss based on hyperinflation accounting.
2022
The higher tax charge of 29 % in the Netherlands (compared to the statutory rate of 25.8 %) is mainly caused
by the non-deductible Dutch bank tax (EUR 179 million) and the non-deductible impairments regarding
goodwill ING Türkiye (EUR 32 million) and TTB (EUR 165 million).
The higher positive tax charge of Türkiye combined with its accounting loss based on hyperinflation
accounting is mainly caused by the non deductibility of this loss for tax purposes.
Since the Russian invasion of Ukraine, our strategy is no new business with Russian clients, including
Russian-owned entities outside of Russia, and to get existing Russia-related credit exposures repaid as
quickly as possible. These exposures are booked in various countries and totalled EUR 6.7 billion, published
on 4 March 2022. Remaining at risk for ING Group at year-end 2022 is EUR 0.3 billion local equity and EUR
credit exposures declined significantly, as we recognised EUR 0.5 billion risk costs related to these exposures.
The local results on a standalone basis were higher compared to 2021. This was driven by the high local
interest-rate environment and increased rouble inflow from existing, predominantly non-Russian, clients.
Under local law and banking regulations, ING Russia must accept these rouble inflows. Furthermore, the
local result before tax expressed in EUR (EUR 128 million) was positively impacted by the appreciation of the
rouble against the euro for an amount of EUR 80 million throughout 2022. Going forward, we will continue
to actively reduce our Russia-related credit exposure.
The higher tax charge in Poland is mainly caused by non-deductible regulatory and other costs.
2021
The higher tax charge of 31 % in the Netherlands (compared to the statutory rate of 25 %) is mainly caused
by the non-deductible Dutch bank tax (EUR 260 million) and the impairments on deferred tax assets
regarding Payvision and Yolt (EUR 26 million tax).
The lower tax charge in Austria is caused by previously not recognised tax losses (EUR -10 million tax).
The higher tax charge in Poland is mainly caused by non-deductible regulatory- and other costs.
Additional notes to the Consolidated financial statements
Changes in liabilities arising from financing activities | ||||||||
Debt securities in issue | Subordinated Loans | Lease liabilities | Total Liabilities from financing activities | |||||
in EUR million | 2023 | 2022 | 2023 | 2022 | 2023 | 2022 | 2023 | 2022 |
Opening balance | ||||||||
Cashflows: | ||||||||
Additions | ||||||||
Redemptions / Disposals | - | - | - | - | - | - | - | - |
Non cash changes: | ||||||||
Amortisation | ||||||||
Other | ||||||||
Changes in unrealised revaluations | - | - | - | |||||
Foreign exchange movement | - | - | - | - | - | |||
Closing balance | ||||||||
Part of Debt securities in issue and subordinated loans are subject to fair value hedge accounting. Hence,
changes in unrealised revaluations represent fair value adjustments to the hedged item attributable to the
hedged interest rate risk. Reference is made to the paragraph 'fair value hedge accounting' in Note 36
Most group companies sponsor defined contribution pension plans. The assets of all ING Group’s defined
contribution plans are held in independently administered funds. Contributions, including the defined
contribution plan in the Netherlands, are principally determined as a percentage of remuneration. These
plans do not give rise to provisions in the statement of financial position, other than relating to short-term
timing differences included in other assets and in other liabilities.
ING Group Annual Report 2023 on Form 20-FF -295
ING Group maintains defined benefit retirement plans in some countries. These plans provide benefits that
are related to the remuneration and service of employees upon retirement. The benefits in some of these
plans are subject to various forms of indexation. The indexation is, in some cases, at the discretion of
management; in other cases it is dependent upon the sufficiency of plan assets.
Annual contributions are paid to the funds at a rate necessary to adequately finance the accrued liabilities
of the plans calculated in accordance with local legal requirements. Plans in all countries are designed to
comply with applicable local regulations governing investments and funding levels.
ING Group provides other post-employment benefits to certain former employees. These post-employment
benefits are primarily discounts on ING products.
Defined contribution plans
ING, as part of the labour agreements with its employees, sponsors a number of defined contribution plans.
ING’s obligation is limited to contributions which are agreed in advance and also includes employee
contributions. The most significant plans are in the Netherlands and Belgium. The employer's contribution is
recognised as an expense which amounted for 2023 EUR 391 million (2022: EUR 364 million).
Defined benefit retirement plans
Statement of financial position - Net defined benefit asset/liability
Plan assets and defined benefit obligation per country | ||||||
Plan assets | Defined benefit obligation | Funded Status | ||||
in EUR million | 2023 | 2022 | 2023 | 2022 | 2023 | 2022 |
The Netherlands | - | - | ||||
United States | ||||||
United Kingdom | ||||||
Belgium | ||||||
Other countries | - | - | ||||
Funded status (Net defined benefit asset/liability) | ||||||
Presented as: | ||||||
- Other assets | ||||||
- Other liabilities | - | - | ||||
The most recent (actuarial) valuations of the plan assets and the present value of the defined benefit
obligation were carried out as at 31 December 2023. The present value of the defined benefit obligation, and
the related current service cost and past service cost, were determined using the projected unit credit
method.
Changes in fair value of plan assets | ||
in EUR million | 2023 | 2022 |
Opening balance as at 1 January | ||
Interest income | ||
Remeasurements: Return on plan assets excluding amounts included in interest income | - | - |
Employer's contribution | ||
Participants contributions | ||
Benefits paid | - | - |
Exchange rate differences | - | |
Closing balance | ||
Actual return on the plan assets | - | |
As at 31 December 2023 the defined benefit plans did not hold any direct investments in ING Groep N.V.
(2022: nil). During 2023 and 2022 there were no purchases or sales of assets between ING and the pension
funds.
ING does not manage the pension funds and thus receives no compensation for fund management. The
pension funds have not engaged ING in any swap or derivative transactions to manage the risk of the
pension funds.
No plan assets are expected to be returned to ING Group during 2024.
ING Group Annual Report 2023 on Form 20-FF -296
Changes in the present value of the defined benefit obligation and other post-employment benefits for the
period were as follows:
Changes in defined benefit obligation and other post-employment benefits | ||||
Defined benefit obligation | Other post- employment benefits | |||
in EUR million | 2023 | 2022 | 2023 | 2022 |
Opening balance as at 1 January | ||||
Current service cost | ||||
Interest cost | ||||
Remeasurements: Actuarial gains and losses arising from changes in demographic assumptions | - | |||
Remeasurements: Actuarial gains and losses arising from changes in financial assumptions | - | - | ||
Participants’ contributions | ||||
Benefits paid | - | - | - | - |
Past service cost | - | |||
Effect of curtailment or settlement | ||||
Exchange rate differences | - | - | ||
Closing balance | ||||
Changes in the net defined benefit assets/liability remeasurement reserve | ||
in EUR million | 2023 | 2022 |
Opening balance as at 1 January | - | - |
Remeasurement of plan assets | - | - |
Actuarial gains and losses arising from changes in demographic assumptions | ||
Actuarial gains and losses arising from changes in financial assumptions | - | |
Taxation and Exchange rate differences | ||
Total Other comprehensive income movement for the year | - | - |
Closing balance | - | - |
In 2023, EUR -8 million (2022: EUR -947 million) remeasurements of plan assets, that is recognised as a loss
in other comprehensive income, is driven by yield changes on investments.
The EUR 127 million (2022: EUR 882 million) actuarial gains arising from changes in financial assumptions in
the calculation of the defined benefit obligation are mainly due to an increase in interest yield curves.
The accumulated amount of remeasurements recognised directly in Other comprehensive income is EUR
-397 million(EUR -317 million after tax) as at 31 December 2023 (2022: EUR -289 million; EUR -232 million
after tax).
Amounts recognised in the statement of profit or loss related to pension and other staff-related benefits are
as follows:
Pension and other staff-related benefit costs | |||||||||
Net defined benefit asset/liability | Other post-employment benefits | Total | |||||||
in EUR million | 2023 | 2022 | 2021 | 2023 | 2022 | 2021 | 2023 | 2022 | 2021 |
Current service cost | |||||||||
Past service cost | - | ||||||||
Net Interest cost | - | - | - | - | - | - | |||
Effect of curtailment or settlement | - | - | |||||||
Defined benefit plans | |||||||||
Defined contribution plans | |||||||||
Pension and other post employment benefits | |||||||||
Other staff related benefits | - | ||||||||
Pension and other staff-related benefits | |||||||||
Determination of the net defined benefit asset/liability
The net defined benefit asset/liability is reviewed and adjusted annually. The assumptions used in the
determination of the net defined benefit asset/liability and the Other post-employment benefits include
discount rates, mortality rates, expected rates of salary increases (excluding promotion increases), and
indexation. The rates used for salary developments, interest discount factors, and other adjustments reflect
country-specific conditions.
The key assumption in the determination of the net defined benefit asset/liability is the discount rate. The
discount rate is the weighted average of the discount rates that are applied in different regions where ING
Group has defined benefit pension plans (weighted by the defined benefit obligation). The discount rate is
based on a methodology that uses market yields on high quality corporate bonds of the specific regions
with durations matching the pension liabilities as key input. Market yields of high quality corporate bonds
reflect the yield on corporate bonds with an AA rating for durations where such yields are available. An
extrapolation is applied in order to determine the yield to the longer durations for which no AA-rated
corporate bonds are available. As a result of the limited availability of long-duration AA-rated corporate
bonds, extrapolation is an important element of the determination of the discount rate. The weighted
ING Group Annual Report 2023 on Form 20-FF -297
average discount rate applied for net defined benefit asset/liability for 2023 was 4.0 % (2022: 4.3 %) based on
the pension plan in the Netherlands, Germany, Belgium, the United States of America, and the United
Kingdom. The average discount rate applied for Other post-employment benefits in 2023 was 5.2 % (2022:
Sensitivity analysis of key assumptions
ING performs sensitivity analyses on the most significant assumptions: discount rates, mortality, expected
rate of salary increase, and indexation. The sensitivity analysis has been carried out under the assumption
that the changes occurred at the end of the reporting period.
The sensitivity analysis calculates the financial impact on the defined benefit obligation of an increase or
decrease of the weighted averages of each significant actuarial assumption, all other assumptions held
constant. In practice, this is unlikely to occur, and some changes of the assumptions may be correlated.
Changes to mortality, expected rate of salary increase, and indexation would have no material impact on
the defined benefit obligation. The most significant impact would be from a change in the discount rate. An
increase or decrease in the discount rate of 1.0 % creates an impact on the defined benefit obligation of EUR
Expected cash flows
ING Group’s subsidiaries should fund the cost of the entitlements expected to be earned on a yearly basis.
For 2024, the expected contributions to defined benefit pension plans are EUR 58 million.
The benefit payments for defined benefit and other post-employment benefits expected to be made by the
plan between 2024-2028 are estimated to be between EUR 133 million and EUR 150 million per year. From
2028 to 2032 the total payments made by the plan are expected to be EUR 738 million.
Statement of financial position – Deferred tax
Deferred taxes are recognised on all temporary differences under the liability method using tax rates
applicable in the jurisdictions in which ING Group is subject to taxation.
Changes in deferred tax | ||||||
in EUR million 2023 | Net liability (-) Net asset (+) opening balance | Change through equity | Change through net result | Exchange rate difference s | Changes in the composition of the group and other changes | Net liability (-) Net asset (+) ending balance |
Financial assets at FVOCI | - | - | - | |||
Financial assets and liabilities at FVPL | - | - | ||||
Depreciation | - | - | - | |||
Cash flow hedges | - | |||||
Pension and post-employment benefits | - | - | - | - | ||
Other provisions | - | - | ||||
Loans and advances | - | - | ||||
Unused tax losses carried forward | - | - | ||||
Other | - | - | - | - | ||
Total | - | - | - | |||
Presented in the statement of financial position as: | ||||||
– Deferred tax liabilities | - | - | ||||
– Deferred tax assets | ||||||
- | - | |||||
The above table shows netted deferred tax amounts related to right-of-use assets and lease liabilities
included in the row ‘Other’, and includes a deferred tax amount for right-of-use assets of EUR 195 million
(2022: EUR 205 million and 2021: EUR 220 million) and a deferred tax amount for lease liabilities of EUR 217
million (2022: EUR 231 million and 2021: EUR 252 million).
The changes in Deferred tax on financial assets and liabilities at FVPL in 2023 amounting to EUR 1,264
million (2022: EUR-3,493 million) is mainly driven by interest yield developments related to derivatives that
are under IFRS-EU used in portfolio based hedging strategies for retail mortgages and savings. These
portfolio hedging strategies are not allowed under IFRS-IASB and is referred to as the EU IAS39 carve out
adjustment for which we refer to Note 1.2.2 Reconciliation between IFRS-EU and IFRS-IASB.
ING Group Annual Report 2023 on Form 20-FF -298
The deferred tax on cash flow hedges relate to floating rate lending with interest rate swaps. Due to
decreased (longer-term) interest rate yield curve in 2023 there was a positive revaluation of the cash flow
hedge through other comprehensive income. This resulted in a decline in the deferred tax asset by EUR
-251 million compared to the increase in deferred tax assets in 2022 by EUR 875 million due to the increase
in the interest yield curve. The deferred tax asset in cash flow hedges decreased from EUR 752 million in
2022 to EUR 502 million in 2023.
The deferred tax on Loans and advances changes through net result in 2023 EUR -140 million (2022: EUR
The deferred tax changes through equity - Other in 2023 of EUR 13 million (2022:EUR -123 million) is due to
FX developments following the USD depreciation and the application of IAS 29 Hyperinflation in Türkiye, and
also due to the decline in the Credit liability Reserve due to credit spread tightening.
Changes in deferred tax | ||||||
in EUR million 2022 | Net liability (-) Net asset (+) opening balance | Change through equity | Change through net result | Exchange rate differences | Changes in the composition of the group and other changes | Net liability (-) Net asset (+) ending balance |
Financial assets at FVOCI | - | - | ||||
Financial assets and liabilities at FVPL | - | - | ||||
Depreciation | - | - | - | - | ||
Cash flow hedges | - | |||||
Pension and post-employment benefits | - | - | - | - | ||
Other provisions | - | |||||
Loans and advances | - | |||||
Unused tax losses carried forward | - | |||||
Other | - | - | - | - | ||
Total | - | - | - | |||
Presented in the statement of financial position as: | ||||||
– deferred tax liabilities | - | - | ||||
– deferred tax assets | ||||||
- | ||||||
Deferred tax in connection with unused tax losses carried forward | ||
in EUR million | 2023 | 2022 |
Total unused tax losses carried forward | ||
Unused tax losses carried forward not recognised as a deferred tax asset | ||
Unused tax losses carried forward recognised as a deferred tax asset | ||
Average tax rate | ||
Deferred tax asset | ||
Total unused tax losses carried forward analysed by expiry terms | ||||
No deferred tax | Deferred tax | |||
in EUR million | 2023 | 2022 | 2023 | 2022 |
Within 1 year | ||||
More than 1 year but less than 5 years | ||||
More than 5 years but less than 10 years | ||||
More than 10 years but less than 20 years | ||||
Unlimited | ||||
The above-mentioned deferred tax asset of EUR 209 million (2022: EUR 365 million) and the related unused
tax losses carried forward exclude the recapture of tax losses originated in the United Kingdom previously
deducted in the Netherlands for the amount of EUR 0 million (2022: EUR 37 million).
Deferred tax assets are recognised for temporary deductible differences, for tax losses carried forward and
unused tax credits only to the extent that realisation of the related tax benefit is probable.
Breakdown of certain net deferred tax asset positions by jurisdiction | ||
in EUR million | 2023 | 2022 |
Poland | ||
France | ||
Slovakia | ||
China | ||
Australia | ||
Hong Kong | ||
United States of America | ||
Türkiye | ||
Taiwan | ||
ING Group Annual Report 2023 on Form 20-FF -299
The table above includes a breakdown of certain net deferred tax asset positions by jurisdiction for which
the utilisation of the deferred tax asset is dependent on future taxable profits in excess of the profits arising
from the reversal of existing taxable temporary differences whilst the related entities have incurred losses in
either the current or the preceding year.
In 2023, ING Bank Slaski (Poland) realised a tax profit following the value changes of the cash flow hedge
derivatives which are settled net via a central clearing party, whereas in 2022 and 2021 ING Bank Slaski
incurred a tax loss following the large value changes of the cash flow hedge derivatives. This tax loss can be
carried forward for five years. Based on a taxable profit forecast, ING considers it probable that the future
taxable profits will compensate for this tax loss carry forward position. Based on this a remaining deferred
tax asset on unused tax losses carried forward, as per 31 December 2023: EUR 120 million (2022: EUR 224
million) is recognised. The remaining net deferred tax asset in Poland of EUR 124 million (2022: EUR
through profit and loss.
Recognition is based on the fact that it is probable that the entity will have taxable profits and/or can utilise
tax planning opportunities before expiration of the deferred tax assets. Changes in circumstances in future
periods may adversely impact the assessment of the recoverability. The uncertainty of the recoverability is
taken into account in establishing the deferred tax assets.
At 31 December 2022 and 2023, ING Group had no significant temporary differences associated with the
parent company’s investments in subsidiaries and associates as any economic benefit from those
investments will not be taxable at parent company level.
Statement of profit or loss – Taxation
Taxation by type | |||||||||
Netherlands | Rest of the world | Total | |||||||
in EUR million | 2023 | 2022 | 2021 | 2023 | 2022 | 2021 | 2023 | 2022 | 2021 |
Current taxation | |||||||||
Deferred taxation | - | - | - | ||||||
Reconciliation of the weighted average statutory income tax rate to ING Group’s effective income tax rate | |||
in EUR million | 2023 | 2022 | 2021 |
Result before tax from continuing operations | |||
Weighted average statutory tax rate | |||
Weighted average statutory tax amount | |||
Permanent differences affecting current tax | |||
Participation exemption | - | - | - |
Other income not subject to tax | - | - | - |
Expenses not deductible for tax purposes | |||
Current tax from previously unrecognised amounts | |||
State and local taxes | |||
Adjustments to prior periods | - | - | - |
Differences affecting deferred tax | |||
Impact on deferred tax from change in tax rates | |||
Deferred tax benefit from previously unrecognised amounts | - | - | - |
Write-off/reversal of deferred tax assets | |||
Effective tax amount | |||
Effective tax rate | |||
The weighted average statutory tax rate in 2023 (22.7 %) was lower than the rate of 2022 (27.5 %).
The effective tax rate of 27.5 % in 2023 is higher than the weighted average statutory tax rate. This is
mainly caused by the impact in 2023 of the following non-deductible items for income tax purposes:
hyperinflation accounting loss in Türkiye, interest expenses, bank- and local taxes in various countries.
Adjustments to prior periods mainly relates to a tax refund in Spain regarding previous years.
The weighted average statutory tax rate in 2022 (27.5 %) was higher than the rate of 24.7 % in 2021.
The effective tax rate of 29.6 % in 2022 was higher than the weighted average statutory tax rate. This is
mainly caused by the impact in 2022 of the following non-deductible items income tax purposes:
hyperinflation accounting loss in Türkiye, impairments on TTB, and interest expenses in various countries.
The effective tax rate of 27.5 % in 2021 was significantly higher than the weighted average statutory tax
rate. This is mainly caused by a high amount of expenses non-deductible for tax purposes like the non-
ING Group Annual Report 2023 on Form 20-FF -300
deductible bank tax and a tax charge caused by the recapture of tax losses originated in the United
Kingdom but previously deducted in the Netherlands.
Equity - Other comprehensive income
Income tax related to components of other comprehensive income | |||
in EUR million | 2023 | 2022 | 2021 |
Unrealised revaluations financial assets at fair value through other comprehensive income and other revaluations | - | ||
Realised gains/losses transferred to the statement of profit or loss (reclassifications from equity to profit or loss) | - | ||
Changes in cash flow hedge reserve | - | ||
Remeasurement of the net defined benefit asset/liability | - | ||
Changes in fair value of own credit risk of financial liabilities at fair value through profit or loss | - | ||
Exchange rate differences and other | - | - | |
Total income tax related to components of other comprehensive income | - | ||
a) Valuation Methods
The estimated fair values represent the price that would be received to sell an asset or paid to transfer a
liability in an orderly transaction between market participants at the measurement date. It is a market-
based measurement, which is based on assumptions that market participants would use and takes into
account the characteristics of the asset or liability that market participants would take into account when
pricing the asset or liability.
Fair values of financial assets and liabilities are based on quoted prices in active market where available.
When such quoted prices are not available, the fair value is determined by using valuation techniques.
In 2023, the financial markets were characterised by elevated levels of volatility. In the first quarter of the
year, the markets worldwide were shaken by the demise of SVB bank and the stress surrounding Credit
Suisse, fuelling uncertainty around possible additional defaults. Furthermore, the ongoing interest rate hikes
by the central banks in Europe and the US led to a fast increase in rates worldwide. Towards the end of the
year, the probability increased for interest rates to go down, which has been reflected in the forward
interest rates. Additionally, geopolitical risk increased with the Israel-Gaza conflict adding to the risk arising
from the ongoing Russia-Ukraine war.
Financial assets and liabilities, including Level 3, are valued using agreed methodologies, targeting the most
appropriate estimate of fair value..
b) Valuation control framework
The valuation control framework covers the product approval process (PARP), pricing, market data
assessment and independent price verification (IPV), valuation adjustments, model use, fair value hierarchy
and day one profit or loss. Valuation processes are governed by various governance bodies, including Local
Parameter Committees, Global Valuation and Impairment Committee, Market Data Committee and
Valuation Model Committee. All relevant committees meet on a regular basis (monthly/quarterly), where
agenda covers the aforementioned valuation controls.
The Global Valuation and Impairment Committee is responsible for the oversight and the approval of the
outcome of impairments (other than loan loss provisions) and valuation processes. It oversees the quality
and coherence of valuation methodologies and performance. The Valuation Model Committee is responsible
for the approval of all valuation models used for the Fair valuation (IFRS) and Prudent Valuation (CRR) of
positions measured at fair value. The Local Parameter Committee discusses the valuation results and
monitors the performance of the valuation activities carried out on local or regional level. The Global
Financial Markets Parameter Committee reviews the consolidated valuation outcome and resulting P&L for
Financial Market products, targeting a globally consistent treatment across Financial Market. The Market
Data Committee is responsible for the approval of the market data used in valuation.
c) Valuation Adjustments
Valuation adjustments are an integral part of the fair value. They are the adjustments to the output from a
valuation technique in order to appropriately determine a fair value in accordance with IFRS13. ING
considers various fair value adjustments including Bid-Offer adjustments, Model Risk adjustments, Bilateral
Valuation Adjustments (BVA, consisting of Credit Valuation Adjustments or CVA, and Debit valuation
Adjustments or DVA), Collateral Valuation Adjustment (CollVA) and Funding Valuation Adjustment (FVA).
For financial instruments where the fair value at initial recognition is based on one or more significant
unobservable inputs, a difference between the transaction price and the fair value resulting from the
internal valuation process can occur. Such difference is referred to as Day One Profit or Day One Loss
(hereafter: DOP). ING defers material Day One Profit or Loss of instruments with significant unobservable
valuation inputs, which are the financial instruments classified as Level 3 and financial instruments with
material unobservable inputs into CVA which are not necessarily classified as Level 3. The DOP is amortised
over the life of the instrument, or until the significant unobservable inputs become observable, or until the
significant unobservable inputs become non-significant. Both the impact on the profit and loss in 2023 and
the DOP reserve is disclosed in the below table.
ING Group Annual Report 2023 on Form 20-FF -301
Deferred Day One Profit or Loss Reserve
The table below summarizes the movement in the aggregate DOP not recognised when financial
instruments were initially recognised, because of the use of valuation techniques for which not all the inputs
were market observable data.
Deferred day one profit or loss reserve 1 | ||
in EUR million | 2023 | 2022 |
Opening balance at 1 January | - | - |
DOP deferred on new transactions during the period | - | - |
DOP recognised in the statement of profit or loss during the period | ||
•of which release | ||
•of which amortisation and exchange differences | ||
Closing balance at 31 December | - | - |
The following table presents the models reserves for financial assets and liabilities.
Valuation adjustment reserves on financial assets and liabilities | ||
in EUR million | 2023 | 2022 |
Deferred Day One Profit or Loss | - | - |
Own credit adjustments | ||
Bid/Offer | - | - |
Model Risk | - | - |
CVA | - | - |
DVA 2 | ||
CollVA | - | - |
FVA | - | - |
Total Valuation Adjustments | - | - |
Own Credit Adjustment
Own issued debt and structured notes that are designated at fair value through profit or loss are adjusted
for ING`s own credit risk by means of DVA.
Bid-Offer Adjustment
For positions priced based upon mid-market input parameters, Bid-Offer adjustments are required in order
to reflect the valuation of that position based on bid price or offer price. In practice this adjustment accounts
for the difference in valuation from ‘mid to bid’ and ‘mid to offer’ for long and short exposures respectively.
In principle assets are valued at the bid prices and liabilities are valued at the offer price. For certain assets
or liabilities, where a market quoted price is not available, the price used is the fair value that is most
representative within the bid-offer spread.
Model Risk Adjustment
Financial instruments that are valued using a valuation model can be subject to model risk. Model risk is the
risk of possible financial loss resulting from pricing model or model-based parameter deficiencies and/or
uncertainties.
Bilateral Valuation Adjustments (Credit and Debit Valuation Adjustments)
Bilateral Valuation Adjustment is the valuation adjustment reflecting the counterparty credit risk of
derivative contracts. It has a bilateral nature, where both the counterparty’s credit risk (i.e. Credit Valuation
Adjustment or CVA) and ING’s own credit risk (Debit Valuation Adjustment or DVA) are taken into account:
•CVA is the fair value adjustment applicable to derivative instruments to account for the possibility that
the counterparty defaults (i.e. it is the market value of the counterparty’s credit risk).
•DVA is the fair value adjustment applicable to derivative instruments to account for the possibility that
ING defaults (i.e. it is the market value of ING’s credit risk).
The calculation of CVA and DVA on derivatives is based on their expected exposures, the counterparties’ and
ING’s risk of default, taking into account the collateral agreements as well as netting agreements. The
counterparties’ risk of default is measured by probability of default and expected loss given default, which is
based on market information including credit default swap (CDS) spreads. Where counterparty CDS spreads
are not available, relevant proxy spreads are used. Additionally, wrong-way risk (which occurs when the
probability of default by the counterparty increases (decreases) when ING’s exposure to the counterparty
increases (decreases)) and right-way risk (which occurs when the probability of default by the counterparty
increases (decreases) when ING’s exposure to the counterparty decreases (increases)) are included in the
adjustment.
Collateral Valuation Adjustment (CollVA)
Collateral Valuation Adjustment is a fair valuation adjustment applied on derivative instruments to capture
specific features of CSA (Credit Support Annex) with a counterparty that the regular OIS discounting
framework does not capture. Non-standard CSA features may include deviations in relation to the
currencies in which ING posts or receives collateral, deviations in remuneration rate on collateral which may
pay lower or higher rate than overnight rate or even no interest at all; other deviations can be posting
securities rather than cash as collateral, etc.
Funding Valuation Adjustment (FVA)
Funding Valuation Adjustment (FVA) is a fair valuation adjustment applied on derivative instruments to
address the asymmetry in funding costs or funding benefits between collateralized and uncollateralized
ING Group Annual Report 2023 on Form 20-FF -302
derivatives portfolios. This adjustment is based on the expected exposure profiles of the uncollateralized or
partially collateralized OTC derivatives and market-based funding spreads.
d) Fair value hierarchy
ING Group has categorised its financial instruments that are either measured in the statement of financial
position at fair value or of which the fair value is disclosed, into a three level hierarchy based on the
observability of the valuation inputs. Highest priority is retained to unadjusted quoted prices in active
markets for identical assets or liabilities and the lowest priority to valuation techniques supported by
unobservable inputs.
Transfers into and transfers out of fair value hierarchy levels are made on a quarterly basis at the end of the
reporting period.
Level 1 – (Unadjusted) quoted prices in active markets
This category includes financial instruments whose fair value is determined directly by reference to
(unadjusted) quoted prices in an active market. A financial instrument is regarded as quoted in an active
market if quoted prices are readily and regularly available from an exchange, dealer markets, brokered
markets, or principal to principal markets. Those prices represent actual and regularly occurring market
transactions with sufficient frequency and volume to provide pricing information on an ongoing basis.
Transfers out of Level 1 into Level 2 or Level 3 occur when ING Group establishes that markets are no longer
active and therefore (unadjusted) quoted prices no longer provide reliable pricing information.
Level 2 – Valuation technique supported by observable inputs
This category includes financial instruments whose fair value is based on market observable inputs, either
directly or indirectly, other than quoted prices included within Level 1. The fair value for financial
instruments in this category can be determined by reference to quoted prices for similar instruments in
active markets, quoted prices for identical or similar instruments in markets that are not active, inputs other
than quoted prices that are observable or market-corroborated inputs. ING analyses how the prices are
derived and determines whether the prices are liquid tradable prices or model-based consensus prices
taking various data as inputs.
For financial instruments that do not have a reference price available, fair value is determined using a
valuation technique (e.g., a model), where inputs in the model are taken from an active market or are
observable, such as interest rates and yield curves observable at commonly quoted intervals, implied
volatilities, and credit spreads.
Instruments, where inputs are unobservable are classified in this category, provided that the impact of
those unobservable inputs on the overall valuation is insignificant. The notion of significant is particularly
relevant for the distinction between Level 2 and Level 3 assets and liabilities, as the significance assessment
of the valuation input on the entire fair value measurement will determine whether the instrument should
be classified as Level 2 or Level 3. Expert judgement is required on the significance assessment approach.
Level 3 – Valuation technique supported by unobservable inputs
This category includes financial instruments whose fair value is determined using a valuation technique for
which a significant part of the overall valuation is driven by unobservable valuation inputs. Where valuation
inputs are unobservable, the Group must use the best information available to value the instruments. This
may require internally derived inputs taking into account market participants assumptions that are
reasonably available, including assumptions on the risk inherent in a particular valuation technique used to
measure fair value and the risk inherent in the inputs to the valuation technique. Unobservable inputs may
include, among others, volatility, correlation, spreads to discount rates, default rates, recovery rates,
prepayment rates, and certain credit spreads.
ING Group Annual Report 2023 on Form 20-FF -303
The fair values of the financial instruments were determined as follows:
Methods applied in determining fair values of financial assets and liabilities (carried at fair value) | ||||||||
Level 1 | Level 2 | Level 3 | Total | |||||
in EUR million | 2023 | 2022 | 2023 | 2022 | 2023 | 2022 | 2023 | 2022 |
Financial Assets | ||||||||
Financial assets at fair value through profit or loss | ||||||||
- Equity securities | ||||||||
- Debt securities | ||||||||
- Derivatives | ||||||||
- Loans and receivables | ||||||||
Financial assets at fair value through other comprehensive income | ||||||||
- Equity securities | ||||||||
- Debt securities | ||||||||
- Loans and receivables | ||||||||
Financial liabilities | ||||||||
Financial liabilities at fair value through profit or loss | ||||||||
– Debt securities | ||||||||
– Deposits | ||||||||
– Trading securities | ||||||||
– Derivatives | ||||||||
The following methods and assumptions were used by ING Group to estimate the fair value of the financial
instruments:
Equity securities
Instrument description: Equity securities include stocks and shares, corporate investments and private
equity investments.
Valuation: If available, the fair values of publicly traded equity securities and private equity securities are
based on quoted market prices. In absence of active markets, fair values are estimated by analysing the
investee’s financial position, result, risk profile, prospect, price, earnings comparisons and revenue multiples.
Additionally, reference is made to valuations of peer entities where quoted prices in active markets are
available. For equity securities best market practice will be applied using the most relevant valuation
method. All non-listed equity investments, including investments in private equity funds, are subject to a
standard review framework which ensures that valuations reflect the fair values.
Fair value hierarchy: The majority of equity securities are publicly traded and quoted prices are readily and
regularly available. Hence, these securities are classified as Level 1. Equity securities which are not traded in
active markets mainly include corporate investments, fund investments and other equity securities and are
classified as Level 3.
Debt securities
Instrument description: Debt securities include government bonds, financial institutions bonds and Asset-
backed securities (ABS).
Valuation: Where available, fair values for debt securities are generally based on quoted market prices.
Quoted market prices are obtained from an exchange market, dealer, broker, industry group, pricing service,
or regulatory service. The quoted prices from non-exchange sources are reviewed on their tradability of
market prices. If quoted prices in an active market are not available, fair value is based on an analysis of
available market inputs, which includes consensus prices obtained from one or more pricing services.
Furthermore, fair values are determined by valuation techniques discounting expected future cash flows
using market interest rate curves, referenced credit spreads, maturity of the investment, and estimated
prepayment rates where applicable.
Fair value hierarchy: Government bonds and financial institutions bonds are generally traded in active
markets, where quoted prices are readily and regularly available and are hence, classified as Level 1. The
remaining positions are classified as Level 2 or Level 3. Asset backed securities for which no active market is
available and a wide discrepancy in quoted prices exists, are classified as Level 3.
Derivatives
Instrument description: Derivatives contracts can either be exchange-traded or over the counter (OTC).
Derivatives include interest rate derivatives, FX derivatives, Credit derivatives, Equity derivatives and
commodity derivatives.
Valuation: The fair value of exchange-traded derivatives is determined using quoted market prices in an
active market and are classified as Level 1 of the fair value hierarchy. For instruments that are not actively
traded, fair values are estimated based on valuation techniques. OTC derivatives and derivatives trading in
an inactive market are valued using valuation techniques. The valuation techniques and inputs depend on
the type of derivatives and the nature of the underlying instruments. The principal techniques used to value
these instruments are based on (amongst others) discounted cash flows, option pricing models and Monte
Carlo simulations. These valuation models calculate the present value of expected future cash flows, based
on ‘no-arbitrage’ principles. The models are commonly used in the financial industry and inputs to the
validation models are determined from observable market data where possible. Certain inputs may not be
observable in the market, but can be determined from observable prices via valuation model calibration
procedures. These inputs include prices available from exchanges, dealers, brokers or providers of pricing,
yield curves, credit spreads, default rates, recovery rates, dividend rates, volatility of underlying interest
ING Group Annual Report 2023 on Form 20-FF -304
rates, equity prices, and foreign currency exchange rates and reference is made to quoted prices, recently
executed trades, independent market quotes and consensus data, where available.
For uncollateralised OTC derivatives, ING applies Credit Valuation Adjustment to correctly reflect the
counterparty credit risk in the valuation and Debit Valuation Adjustments to reflect the credit risk of ING for
its counterparty. In addition, for these derivatives ING applies Funding Valuation Adjustment. See sections
CVA/DVA and FVA in section c) Valuation Adjustments for more details regarding the calculation.
Fair value hierarchy: The majority of the derivatives are priced using observable inputs and are classified as
Level 2. Derivatives for which the input cannot be implied from observable market data are classified as
Level 3.
Loans and receivables
Instrument description: Loans and receivables are non-derivative financial assets with fixed or determinable
payments that are not quoted in an active market. Loans and receivables carried at fair value includes
trading loans, being securities lending and similar agreement comparable to collateralised lending,
syndicated loans, loans expected to be sold and receivables with regards to reverse repurchase
transactions.
Valuation: The fair value of loans and receivables is generally estimated by discounting expected future cash
flows using a discount rate that reflects credit risk, liquidity, and other current market conditions. The fair
value of mortgage loans is estimated by taking into account prepayment behaviour.
Fair value hierarchy: Loans and receivables are predominantly classified as Level 2. Loans and receivables
for which current market information about similar assets to use as observable, corroborated data for all
significant inputs into a valuation model is not available, are classified as Level 3.
Financial liabilities at fair value through profit and loss
Instrument description: Financial liabilities at fair value through profit and loss include debt securities, debt
instruments, primarily comprised of structured notes, which are held at fair value under the fair value
option. Besides that, it includes derivative contracts and repurchase agreements.
Valuation: The fair values of securities in the trading portfolio and other liabilities at fair value through profit
or loss are based on quoted market prices, where available. For those securities not actively traded, fair
values are estimated based on internal discounted cash flow valuation techniques using interest rates and
credit spreads that apply to similar instruments.
Fair value hierarchy: The majority of the derivatives and debt instruments are classified as Level 2.
Derivatives and debt instruments for which the input cannot be derived from observable market data are
classified as Level 3.
e) Transfers between Level 1 and 2
As a consequence of change in observable inputs, ING recorded an EUR 2.4 billion transfer from Level 2 to
Level 1 in debt securities measured at fair value through other comprehensive income. Furthermore, EUR
f) Level 3: Valuation techniques and inputs used
Financial assets and liabilities in Level 3 include both assets and liabilities for which the fair value was
determined using (i) valuation techniques that incorporate unobservable inputs as well as (ii) quoted prices
which have been adjusted to reflect that the market was not actively trading at or around the balance sheet
date. Unobservable inputs are inputs which are based on ING’s own assumptions about the factors that
market participants would use in pricing an asset or liability, developed based on the best information
available in the circumstances. Unobservable inputs may include volatility, correlation, spreads to discount
rates, default rates and recovery rates, prepayment rates, and certain credit spreads. Valuation techniques
that incorporate unobservable inputs are sensitive to the inputs used.
Of the total amount of financial assets classified as Level 3 as at 31 December 2023 of EUR 9.1 billion
(31 December 2022: EUR 7.5 billion), an amount of EUR 7.0 billion (76.7 %) (31 December 2022: EUR 2.2
billion, being 29.2 %) is based on unadjusted quoted prices in inactive markets. As ING does not generally
adjust quoted prices using its own inputs, there is no significant sensitivity to ING’s own unobservable inputs.
Furthermore, Level 3 financial assets includes approximately EUR 0.3 billion (31 December 2022: EUR 4.2
billion) which relates to financial assets that are part of structures that are designed to be fully neutral in
terms of market risk. Such structures include various financial assets and liabilities for which the overall
sensitivity to market risk is insignificant. Whereas the fair value of individual components of these structures
may be determined using different techniques and the fair value of each of the components of these
structures may be sensitive to unobservable inputs, the overall sensitivity is by design not significant.
The remaining EUR 1.8 billion (31 December 2022: EUR 1.1 billion) of the fair value classified in Level 3
financial assets is established using valuation techniques that incorporates certain inputs that are
unobservable.
Of the total amount of financial liabilities classified as Level 3 as at 31 December 2023 of EUR 0.7 billion
(31 December 2022: EUR 0.7 billion), an amount of EUR 0.4 billion (50.0 %) (31 December 2022: EUR 0.02
billion, being 2.5 %) is based on unadjusted quoted prices in inactive markets. As ING does not generally
adjust quoted prices using its own inputs, there is no significant sensitivity to ING’s own unobservable inputs.
Furthermore, Level 3 financial liabilities includes approximately EUR 0.3 billion (31 December 2022: EUR 0.6
billion) which relates to financial liabilities that are part of structures that are designed to be fully neutral in
terms of market risk. As explained above, the fair value of each of the components of these structures may
be sensitive to unobservable inputs, but the overall sensitivity is by design not significant.
The remaining EUR 0.1 billion (31 December 2022: EUR 0.1 billion of the fair value classified in Level 3
financial liabilities is established using valuation techniques that incorporates certain inputs that are
unobservable.
ING Group Annual Report 2023 on Form 20-FF -305
The table below provides a summary of the valuation techniques, key unobservable inputs and the lower
and upper range of such unobservable inputs, by type of Level 3 asset/liability. The lower and upper range
mentioned in the overview represent the lowest and highest variance of the respective valuation input as
actually used in the valuation of the different financial instruments. Amounts and percentages stated are
unweighted. The range can vary from period to period subject to market movements and change in Level 3
position. Lower and upper bounds reflect the variability of Level 3 positions and their underlying valuation
inputs in the portfolio, but do not adequately reflect their level of valuation uncertainty. For valuation
uncertainty assessment, reference is made to section Sensitivity analysis of unobservable inputs (Level 3).
ING Group Annual Report 2023 on Form 20-FF -306
Valuation techniques and range of unobservable inputs (Level 3) | ||||||||||
Assets | Liabilities | Valuation techniques | Significant unobservable inputs | Lower range | Upper range | |||||
In EUR million | 2023 | 2022 | 2023 | 2022 | 2023 | 2022 | 2023 | 2022 | ||
At fair value through profit or loss | ||||||||||
Debt securities | Price based | Price (%) | ||||||||
Price (price per share) | ||||||||||
Present value techniques | Credit spread (bps) | |||||||||
Price (%) | n.a. | n.a. | ||||||||
Equity securities | Price based | Price (price per share) | ||||||||
Loans and advances | Price based | Price (%) | ||||||||
Present value techniques | Credit spread (bps) | |||||||||
(Reverse) repo's | Present value techniques | Interest rate (%) | n.a. | n.a. | ||||||
Structured notes | Price based | Price (%) | ||||||||
Option pricing model | Equity volatility (%) | |||||||||
Equity/Equity correlation | ||||||||||
Equity/FX correlation | - | - | ||||||||
Dividend yield (%) | ||||||||||
Present value techniques | Credit spreads (bps) | |||||||||
Derivatives | ||||||||||
– Rates | Option pricing model | Interest rate volatility (bps) | ||||||||
Present value techniques | Reset spread (%) | n.a. | n.a. | |||||||
Interest rate (%) | n.a. | n.a. | ||||||||
Prepayment rate (%) | ||||||||||
– FX | Option pricing model | Implied volatility (%) | ||||||||
– Credit | Present value techniques | Credit spread (bps) | ||||||||
Price based | Price (%) | |||||||||
– Equity | Option pricing model | Equity volatility (%) | ||||||||
Equity/Equity correlation | ||||||||||
Equity/FX correlation | - | - | ||||||||
Dividend yield (%) | ||||||||||
Price based | Price (%) | n.a | n.a | |||||||
– Other | Option pricing model | Commodity volatility (%) | ||||||||
At fair value through other comprehensive income | ||||||||||
– Loans and advances | Present value techniques | Prepayment rate (%) | n.a. | n.a. | ||||||
Price based | Price (%) | |||||||||
– Equity | Present value techniques | Credit spread (bps) | ||||||||
Interest rate (%) | ||||||||||
Price based | Price (%) | n.a | n.a | |||||||
Price based | Other (EUR) | n.a | n.a | |||||||
Total | ||||||||||
ING Group Annual Report 2023 on Form 20-FF -307
Price
For securities where market prices are not available, fair value is measured by comparison with observable
pricing data from similar instruments. Prices of 0% are distressed to the point that no recovery is expected,
while prices significantly in excess of 100% or par are expected to pay a yield above current market rates.
Credit spreads
Credit spread is the premium above a benchmark interest rate required by the market participant to accept
a lower credit quality. Higher credit spreads indicate lower credit quality and a lower value of an asset.
Volatility
Volatility is a measure for variation of the price of a financial instrument or other valuation input over time.
Volatility is one of the key inputs in option pricing models. Typically, the higher the volatility, the higher
value of the option. Volatility varies by the underlying reference (equity, commodity, foreign currency and
interest rates), by strike, and maturity of the option. The minimum level of volatility is 0% and there is no
theoretical maximum.
Correlation
Correlation is a measure of dependence between two underlying references which is relevant for valuing
derivatives and other instruments having more than one underlying reference. High positive correlation
(close to 1) indicates strong positive (statistical) relationship, where underliers move, everything else equal,
into the same direction. The same holds for a high negative correlation.
Interest rate
An interest rate is the amount of interest due per period, as a proportion of the amount lent, deposited, or
borrowed.
Reset spread
Reset spreads are key inputs to mortgage linked prepayment swaps valuation. Reset spread is the future
spread at which mortgages will re-price at interest rate reset dates.
Dividend yield
Dividend yield is an important input for equity option pricing models showing how much dividends a
company is expected to pay out each year relative to its share price. Dividend yields are generally expressed
as an annualised percentage of share price.
Prepayment rate
Prepayment rate is a key input to mortgage and loan valuation. Prepayment rate is the estimated rate at
which mortgage borrowers will repay their mortgages early, e.g. 5% per year. Prepayment rate and reset
spread are key inputs to mortgage linked prepayment swaps valuation.
ING Group Annual Report 2023 on Form 20-FF -308
Level 3: Changes during the period
Changes in Level 3 Financial assets | ||||||||||||
Trading assets | Non-trading derivatives | Financial assets mandatorily at FVPL | Financial assets designated at FVPL | Financial assets at FVOCI | Total | |||||||
In EUR million | 2023 | 2022 | 2023 | 2022 | 2023 | 2022 | 2023 | 2022 | 2023 | 2022 | 2023 | 2022 |
Opening balance as at 1 January | ||||||||||||
Realised gain/loss recognised in the statement of profit or loss during the period 1 | - | - | - | - | - | |||||||
Revaluation recognised in other comprehensive income during the period 2 | - | - | - | - | ||||||||
Purchase of assets | ||||||||||||
Sale of assets | - | - | - | - | - | - | - | - | - | - | - | - |
Maturity/settlement | - | - | - | - | - | - | - | - | - | - | - | |
Reclassifications | - | - | ||||||||||
Transfers into Level 3 | - | |||||||||||
Transfers out of Level 3 | - | - | - | - | - | - | - | |||||
Exchange rate differences | - | - | - | - | - | - | ||||||
Changes in the composition of the group and other changes | - | - | ||||||||||
Closing balance | ||||||||||||
1Net gains/losses were recorded as ‘Valuation results and net trading income’ in the statement of profit or loss. The total amounts includes EUR 316 million (2022: EUR -171 million) of unrealised gains and losses recognised in the statement of profit or loss.
2Revaluation recognised in other comprehensive income is included on the line ‘Net change in fair value of debt instruments at fair value through other comprehensive income’.
In 2023, transfers into and out of Level 3 of financial assets mandatorily at fair value mainly relate to (long
term) reverse repurchase transactions for which the valuation being significantly impacted by unobservable
inputs and no longer significantly impacted by unobservable inputs, respectively.
In 2023, the transfer into Level 3 trading assets is mainly driven by debt securities that are part of a
structure transferred into level 3 due to market illiquidity which decreased observability for an input.
In 2022, the transfers into Level 3 mainly consisted of (non) trading derivatives that were transferred to
Level 3 as a result of the valuation being significantly impacted by unobservable inputs. Furthermore, it
relates to debt obligations of which the valuation is being significantly impacted by unobservable inputs.
Following the implementation of IFRS 17 on 1 January 2023, a portfolio of loans with death waivers has
been reclassified from financial assets measured at amortised cost to financial assets mandatorily
measured at fair value through profit or loss as shown in reclassifications. For further information on the
change in accounting policies, reference is made to Note 1 'Basis of preparation and material accounting
policy information'.
In 2022, following the enhancement of the significance assessment, transfers into and out of Level 3 of
financial assets mandatorily at fair value mainly relate to a portfolio of securitization loans. Furthermore,
transfers out of Level 3 relate to two syndicated deals due to the unobservable parameters were
insignificant.
In 2022, transfers into level 3 financial assets designated at fair value relate to government bonds of which
the valuation being significantly impacted by unobservable inputs.
ING Group Annual Report 2023 on Form 20-FF -309
Changes in Level 3 Financial liabilities | ||||||||
Trading liabilities | Non-trading derivatives | Financial liabilities designated as at fair value through profit or loss | Total | |||||
in EUR million | 2023 | 2022 | 2023 | 2022 | 2023 | 2022 | 2023 | 2022 |
Opening balance as at 1 January | ||||||||
Realised gain/loss recognised in the statement of profit or loss during the period1 | - | - | - | |||||
Additions | ||||||||
Redemptions | - | - | - | - | - | - | - | |
Maturity/settlement | - | - | - | - | - | - | - | - |
Transfers into Level 3 | ||||||||
Transfers out of Level 3 | - | - | - | - | - | - | - | |
Exchange rate differences | - | - | ||||||
Closing balance | ||||||||
1Net gains/losses were recorded as ‘Valuation results and net trading income’ in the statement of profit or loss. The total amount
includes EUR 72 million (2022: EUR 179 million) of unrealised gains and losses recognised in the statement of profit or loss.
In 2023, financial liabilities transfers into and out of Level 3 mainly consisted of structured notes, measured
as designated at fair value through profit or loss. The structured notes were transferred out of Level 3 as the
valuation was no longer impacted by significantly unobservable inputs.
In 2022, the transfers into Level 3 mainly consisted of non-trading derivatives that were transferred to Level
3 as a result of the valuation being significantly impacted by unobservable inputs.
g) Recognition of unrealised gains and losses in Level 3
Amounts recognised in the statement of profit or loss relating to unrealised gains and losses during the year
that relates to Level 3 assets and liabilities are included in the line item ‘Valuation results and net trading
income’ in the statement of profit or loss.
h) Level 3: Sensitivity analysis of unobservable inputs
Where the fair value of a financial instrument is determined using inputs which are unobservable and which
have a more than insignificant impact on the fair value of the instrument, the actual value of those inputs at
the balance date may be drawn from a range of reasonably possible alternatives. In line with market
practice the upper and lower bounds of the range of alternative input values reflect a level of valuation
certainty. The actual levels chosen for the unobservable inputs in preparing the financial statements are
consistent with the valuation methodology used for fair valued financial instruments.
In practice valuation uncertainty is measured and managed per exposure to individual valuation inputs (i.e.
risk factors) at portfolio level across different product categories. Where the disclosure looks at individual
Level 3 inputs, the actual valuation adjustments may also reflect the benefits of portfolio offsets.
This disclosure does not attempt to indicate or predict future fair value movement. The numbers in isolation
give limited information as in most cases these Level 3 assets and liabilities should be seen in combination
with other instruments (for example as a hedge) that are classified as Level 2.
possible impact of a change of unobservable inputs in the fair value of financial instruments where
unobservable inputs are significant to the valuation is as follows:
Sensitivity analysis of Level 3 instruments | ||||
Positive fair value movements from using reasonable possible alternatives | Negative fair value movements from using reasonable possible alternatives | |||
in EUR million | 2023 | 2022 | 2023 | 2022 |
Equity (equity derivatives, structured notes) | - | - | ||
Interest rates (Rates derivatives, FX derivatives) | - | |||
Credit (Debt securities, Loans, structured notes, credit derivatives) | - | - | ||
Loans and advances | - | - | ||
- | - | |||
The following table presents the estimated fair values of the financial instruments not measured at fair
value in the statement of financial position.
ING Group Annual Report 2023 on Form 20-FF -310
Methods applied in determining fair values of financial assets and liabilities (carried at amortised cost) | ||||||||||||
Carrying Amount | Carrying amount presented as fair value1 | Level 1 | Level 2 | Level 3 | Total fair value | |||||||
in EUR million | 2023 | 2022 | 2023 | 2022 | 2023 | 2022 | 2023 | 2022 | 2023 | 2022 | 2023 | 2022 |
Financial Assets | ||||||||||||
Loans and advances to banks | ||||||||||||
Loans and advances to customers | ||||||||||||
Securities at amortised cost | ||||||||||||
Financial liabilities | ||||||||||||
Deposits from banks | ||||||||||||
Customer deposits | ||||||||||||
Debt securities in issue | ||||||||||||
Subordinated loans | ||||||||||||
1 In accordance with IFRS and for the purpose of this disclosure, the carrying amount of financial instruments with an immediate on demand feature is presented as fair value
The aggregation of the fair values presented above does not represent, and should not be construed as
representing, the underlying value of ING Group. These fair values were calculated for disclosure purposes
only. The carrying amount of financial instruments presented in the above table includes, when applicable,
the fair value hedge adjustment, this explains why (for these cases) the carrying amount approximates fair
value.
Loans and advances to banks
For short term receivables from banks carrying amounts represent a reasonable estimate of the fair value.
The fair value of long term receivables from banks is estimated by discounting expected future cash flows
using a discount rate based on specific available market data, such as interest rates and appropriate
spreads that reflects current credit risk or quoted bonds.
Loans and advances to customers
For short term loans carrying amounts represent a reasonable estimate of the fair value. The fair value of
long term loans is estimated by discounting expected future cash flows using a discount rate that reflects
current credit risk, current interest rates, and other current market conditions where applicable. The fair
value of mortgage loans is estimated by taking into account prepayment behaviour. Loans with similar
characteristics are aggregated for calculation purposes.
Securities at amortised cost
Where available, fair values for debt securities are generally based on quoted market prices. Quoted market
prices are obtained from an exchange market, dealer, broker, industry group, pricing service, or regulatory
service. The quoted prices from non-exchange sources are reviewed on their tradability of market prices. If
quoted prices in an active market are not available, fair value is based on an analysis of available market
inputs, which includes consensus prices obtained from one or more pricing services. Furthermore, fair values
are determined by valuation techniques discounting expected future cash flows using market interest rate
curves, referenced credit spreads, maturity of the investment, and estimated prepayment rates where
applicable.
Deposits from banks
For short term payables to banks carrying amounts represent a reasonable estimate of the fair value. The
fair value of long term payables to banks is estimated by discounting expected future cash flows using a
discount rate based on available market interest rates and appropriate spreads that reflects ING’s own
credit risk.
Customer deposits
In the current interest rate environment there is significant embedded value in our on-demand deposits,
therefore providing a natural hedge against the impact from rising rates on financial assets. However, for
the purpose of this disclosure and in accordance with IFRS, the carrying amounts of deposits with an
ING Group Annual Report 2023 on Form 20-FF -311
immediate on demand feature is presented as fair value.The fair value of deposits with fixed contractual
terms has been estimated based on discounting future cash flows using the interest rates currently
applicable to deposits of similar maturities.
Debt securities in issue
The fair value of debt securities in issue is generally based on quoted market prices, or if not available, on
estimated prices by discounting expected future cash flows using a current market interest rate and credit
spreads applicable to the yield, credit quality and maturity.
Subordinated loans
The fair value of publicly traded subordinated loans are based on quoted market prices when available.
Where no quoted market prices are available, fair value of the subordinated loans is estimated using
discounted cash flows based on interest rates and credit spreads that apply to similar instruments.
Use of derivatives
ING uses derivatives for economic hedging purposes to manage its asset and liability portfolios and
structural risk positions. The primary objective of ING’s hedging activities is to manage the risks which arises
from structural imbalances in the duration and other profiles of its assets and liabilities. The objective of
economic hedging is to enter into positions with an opposite risk profile to an identified risk exposure to
reduce that exposure. The main risks which are being hedged are interest rate risk and foreign currency
exchange rate risk. These risks are primarily hedged with interest rate swaps, cross currency swaps and
foreign exchange forwards/swaps.
ING uses credit derivatives to manage its economic exposure to credit risk, including total return swaps and
credit default swaps, to sell or buy protection for credit risk exposures in the loan, investment, and trading
portfolios. Hedge accounting is not applied in relation to these credit derivatives.
Hedge accounting
Derivatives that qualify for hedge accounting under IFRS are classified and accounted for in accordance with
the nature of the instrument hedged and the type of IFRS hedge accounting model that is applicable. The
three models applicable under IFRS are: fair value hedge accounting, cash flow hedge accounting, and
hedge accounting of a net investment in a foreign operation. How and to what extent these models are
applied are described under the relevant headings below. The company’s detailed accounting policies for
these three hedge models are set out in paragraph 1.5 ‘Financial instruments’ of Note 1 ‘Basis of preparation
and material accounting policy information’.
IBOR transition
Reference is made to the note 'Risk management/ IBOR Transition' for information on how ING is managing
the transition to alternative benchmark rates and ING's progress in completing the transition with respect to
derivatives in hedge accounting relationships.
Fair value hedge accounting
ING’s fair value hedges principally consist of interest rate swaps that are used to protect against changes in
the fair value of fixed-rate instruments due to movements in market interest rates. ING’s approach to
manage market risk, including interest rate risk, is discussed in ‘Risk management –Market risk’. ING’s
exposure to interest rate risk is disclosed in paragraph ‘Interest rate risk in banking book’.
ING Group designates specific non-contractual risk components of hedged items. This is usually determined
by designating benchmark interest rates such as EURIBOR, SOFR, SONIA or TONAR, between others, because
the fair value of a fixed-rate instrument varies directly in response to changes in its benchmark interest rate.
By using derivative financial instruments to hedge exposures to changes in interest rates, ING also exposes
itself to credit risk of the derivative counterparty, which is not offset by the hedged item. ING minimises
counterparty credit risk in derivative instruments by clearing most of the derivatives through Central
Clearing Counterparties. In addition, ING only enters into transactions with high-quality counterparties and
requires posting collateral.
ING Group applies fair value hedge accounting on micro level in which one hedged item is hedged with one
or multiple hedging instruments. Micro fair value hedge accounting is mainly applied on issued debt
securities and purchased debt instruments for hedging interest rate risk.
Before fair value hedge accounting is applied, ING determines whether an economic relationship between
the hedged item and the hedging instrument exists based on an evaluation of the quantitative
characteristics of these items and the hedged risk that is supported by quantitative analysis. ING considers
whether the critical terms of the hedged item and hedging instrument closely align when assessing the
presence of an economic relationship. ING evaluates whether the fair value of the hedged item and the
hedging instrument respond similarly to similar risks. In addition, ING is mainly using regression analysis to
assess whether the hedging instrument is expected to be and has been highly effective in offsetting
changes in the fair value of the hedged item.
ING Group Annual Report 2023 on Form 20-FF -312
Gross carrying value of derivatives designated under fair value hedge accounting | ||||
in EUR million | Assets 2023 | Liabilities 2023 | Assets 2022 | Liabilities 2022 |
As at 31 December | ||||
Hedging instrument on interest rate risk | ||||
– Interest rate swaps | ||||
– Other interest derivatives | ||||
The derivatives used for fair value hedge accounting are included in the statement of financial position line-
item ‘Financial assets at fair value through profit or loss – Non-trading derivatives’ for EUR 716 million (2022:
EUR 836 million) respectively ‘Financial liabilities at fair value through profit or loss – Non-trading derivatives’
EUR 113 million (2022: EUR 244 million). The difference between the gross carrying value as presented in the
table and the net carrying value as presented in the statement of financial position is due to offsetting with
other derivatives and collaterals paid or received.
For our main currencies the average fixed rate for interest rate swaps used in fair value hedge accounting
are 2.76 % (2022: 2.75 %) for EUR and 3.93 % (2022: 3.86 %) for USD.
the maturity of the instruments. The net notional amounts presented in the table are a combination of
payer (-) and receiver (+) swaps.
Maturity derivatives designated in fair value hedging | |||||||||
in EUR million | |||||||||
As at 31 December 2023 | Less than 1 month | 1 to 3 months | 3 to 12 months | 1 to 2 years | 2 to 3 years | 3 to 4 years | 4 to 5 years | >5 years | Total |
Hedging instrument on interest rate risk | |||||||||
– Interest rate swaps | - | ||||||||
– Other interest derivatives | - | - | - | - | - | - | - | - | |
As at 31 December 2022 | |||||||||
Hedging instrument on interest rate risk | |||||||||
- Interest rate swaps | - | ||||||||
– Other interest derivatives | - | - | - | - | - | - | - | - | - |
Gains and losses on derivatives designated under fair value hedge accounting are recognised in the
statement of profit or loss. The effective portion of the fair value change on the hedged item is also
recognised in the statement of profit or loss in 'Valuation results and net trading income'. As a result, only
the net accounting ineffectiveness has an impact on the net result.
ING Group Annual Report 2023 on Form 20-FF -313
Hedged items included in a fair value hedging relationship | |||||||
Carrying amount of the hedged items | Accumulated amount of fair value hedge adjustment on the hedged item included in the carrying amount of the hedged item | Change in fair value of the hedged item for measuring ineffectiveness for the period | Change in fair value hedging instruments for the period | Hedge ineffectiveness recognised in the statement of profit or loss gain (+) / loss (-) | |||
in EUR million | Assets | Liabilities | Assets | Liabilities | |||
As at 31 December 2023 | |||||||
Interest rate risk | |||||||
– Amounts due from banks | |||||||
– Debt securities at fair value through other comprehensive income | n/a | ||||||
– Loans at FVOCI | n/a | ||||||
– Loans and advances to customers | |||||||
– Debt instruments at amortised cost | - | ||||||
– Debt securities in issue | - | - | |||||
– Subordinated loans | - | - | |||||
– Amounts due to banks | |||||||
– Customer deposits and other funds on deposit | - | ||||||
– Discontinued hedges | - | ||||||
Total | - | - | - | - | |||
As at 31 December 2022 | |||||||
Interest rate risk | |||||||
– Amounts due from banks | |||||||
– Debt securities at fair value through other comprehensive income | n/a | - | |||||
– Loans at FVOCI | n/a | ||||||
– Loans and advances to customers | - | - | |||||
– Debt instruments at amortised cost | - | - | |||||
– Debt securities in issue | - | ||||||
– Subordinated loans | - | ||||||
– Amounts due to banks | |||||||
– Customer deposits and other funds on deposit | |||||||
– Discontinued hedges | - | ||||||
Total | - | - | - | - | |||
During 2023, the interest rate movements significantly affected the fair value changes of both the
derivatives and the hedged items designated in fair value hedges. However, no material hedging
relationship was discontinued as a result of the interest rate movements in 2023. Refer to note 22 ‘Valuation
results and net trading income'. In addition, the increase in hedged items is due to higher volumes in loans
and advances and debt securities designated in hedge accounting.
ING Group Annual Report 2023 on Form 20-FF -314
The main sources of ineffectiveness are:
•differences in maturities of the hedged item(s) and hedging instrument(s);
•different interest rate curves applied to discount the hedged item(s) and hedging instrument(s);
•differences in timing of cash flows of the hedged item(s) and hedging instrument(s).
There were no other sources of significant ineffectiveness in these hedging relationships.
Cash flow hedge accounting
ING applies cash flow hedge accounting on micro and macro level. ING’s cash flow hedges mainly consist of
interest rate swaps and cross-currency swaps that are used to protect against the exposure to variability in
future cash flows on non-trading assets and liabilities that bear interest at variable rates or are expected to
be refunded or reinvested in the future. The amounts and timing of future cash flows, representing both
principal and interest flows, are projected for each portfolio of financial assets and liabilities, based on
contractual terms and other variables including estimates of prepayments. These projected cash flows form
the basis for identifying the notional amount subject to interest rate risk or foreign currency exchange rate
risk that is designated under cash flow hedge accounting.
ING’s approach to manage market risk, including interest rate risk and foreign currency exchange rate risk, is
discussed in ‘Risk management – Credit risk and Market risk’. ING determines the amount of the exposures
to which it applies hedge accounting by assessing the potential impact of changes in interest rates and
foreign currency exchange rates on the future cash flows from its floating-rate assets and liabilities. This
assessment is performed using analytical techniques.
As noted above for fair value hedges, by using derivative financial instruments to hedge exposures to
changes in interest rates and foreign currency exchange rates, ING exposes itself to credit risk of the
derivative counterparty, which is not offset by the hedged items. This exposure is managed similarly to that
for fair value hedges.
Gains and losses on the effective portions of derivatives designated under cash flow hedge accounting are
recognised in Other Comprehensive Income. Interest cash flows on these derivatives are recognised in the
statement of profit or loss in ‘Net interest income’ consistent with the manner in which the forecasted cash
flows affect net result. The gains and losses on ineffective portions of such derivatives are recognised
immediately in the statement of profit or loss in ‘Valuation results and net trading income’.
ING determines an economic relationship between the cash flows of the hedged item and the hedging
instrument based on an evaluation of the quantitative characteristics of these items and the hedged risk
that is supported by quantitative analysis. ING considers whether the critical terms of the hedged item and
hedging instrument closely align when assessing the presence of an economic relationship. ING evaluates
whether the cash flows of the hedged item and the hedging instrument respond similarly to the hedged
risk, such as the benchmark interest rate of foreign currency. In addition, a regression analysis is performed
to assess whether the hedging instrument is expected to be and has been highly effective in offsetting
changes in the fair value of the hedged item.
ING uses the following derivative financial instruments in a cash flow hedge accounting relationship:
Gross carrying value of derivatives used for cash flow hedge accounting | ||||
Assets | Liabilities | Assets | Liabilities | |
in EUR million | 2023 | 2023 | 2022 | 2022 |
As at 31 December | ||||
Hedging instrument on interest rate risk | ||||
– Interest rate swaps | ||||
Hedging instrument on FX rate risk | ||||
– Cross currency swaps | ||||
Hedging instrument on combined interest and FX rate risk | ||||
– Cross currency interest rate swaps | ||||
The derivatives used for cash flow hedge accounting are included in the statement of financial position line-
item ‘Financial assets at fair value through profit or loss – Non-trading derivatives’ EUR 440 million (2022:
EUR 814 million) respectively ‘Financial liabilities at fair value through profit or loss – Non-trading derivatives’
EUR 458 million (2022: EUR 1,275 million). The difference between the gross carrying value as presented in
the table and the net carrying value as presented in the statement of financial position is due to offsetting
with other derivatives and collaterals paid or received.
For the main currencies the average fixed rate for interest rate swaps used in cash flow hedge accounting
are 1.26 % (2022: 0.51 %) for EUR, 4.09 % (2022: 3.27 %) for PLN, 4.33 % (2022: 1.96 %) for USD and 2.80 %
(2022: 1.28 %) for AUD. The average currency exchange rates for cross currency swaps used in cash flow
hedge accounting is for EUR/USD 0.98 (2022: 0.99 ) and for EUR/AUD 1.58 (2022: 1.58 ).
The following table shows the net notional amount of derivatives designated in cash flow hedging split into
the maturity of the instruments. The net notional amounts presented in the table are a combination of
payer (+) and receiver (-) swaps.
ING Group Annual Report 2023 on Form 20-FF -315
Maturity derivatives designated in cash flow hedging | |||||||||
in EUR million | |||||||||
As at 31 December 2023 | Less than 1 month | 1 to 3 months | 3 to 12 months | 1 to 2 years | 2 to 3 years | 3 to 4 years | 4 to 5 years | >5 years | Total |
Hedging instrument on interest rate risk | |||||||||
– Interest rate swaps | - | - | - | - | - | - | - | - | |
Hedging instrument on FX rate risk | |||||||||
– Cross currency swaps | - | - | - | - | |||||
Hedging instrument on combined interest and FX rate risk | |||||||||
– Cross currency interest rate swaps | - | - | - | - | |||||
As at 31 December 2022 | |||||||||
Hedging instrument on interest rate risk | |||||||||
– Interest rate swaps | - | - | - | - | - | - | - | - | - |
Hedging instrument on combined interest and FX rate risk | |||||||||
– Cross currency interest rate swaps | - | - | - | - | - | - | - | ||
income:
ING Group Annual Report 2023 on Form 20-FF -316
Cash flow hedging – impact of hedging instruments on the statement of profit or loss and other comprehensive income | ||||||
in EUR million | Change in value of hedged item used for calculating hedge ineffectiveness for the period | Carrying amount cash flow hedge reserve at the end of the reporting period1 | Amount reclassified from CFH reserve to profit or loss 2 | Cash flow is no longer expected to occur | Change in value of hedging instrument recognised in OCI for the period | Hedge ineffectiveness recognised in the statement of profit or loss, gain (+) / loss (-) |
As at 31 December 2023 | ||||||
Interest rate risk on: | ||||||
– Floating rate lending | - | - | ||||
– Floating rate borrowing | - | |||||
– Other | ||||||
– Discontinued hedges | - | |||||
Total interest rate risk | - | - | - | |||
FX rate risk on: | ||||||
– Floating rate lending | - | - | ||||
– Floating rate borrowing | - | - | ||||
– Other | ||||||
– Discontinued hedges | - | |||||
Total FX risk | - | - | - | |||
Combined interest and FX rate risk on: | ||||||
– Floating rate lending | - | - | ||||
– Floating rate borrowing | ||||||
– Other | ||||||
– Discontinued hedges | - | |||||
Total combined interest and FX risk | - | - | ||||
Total cash flow hedge | - | - | - | |||
As at 31 December 2022 | ||||||
Interest rate risk on: | ||||||
– Floating rate lending | - | |||||
– Floating rate borrowing | - | - | ||||
– Other | - | - | ||||
– Discontinued hedges | - | |||||
Total interest rate risk | - | - | - | |||
Combined interest and FX rate risk on: | ||||||
– Floating rate lending | - | - | - | |||
– Floating rate borrowing | - | - | ||||
– Other | - | - | ||||
– Discontinued hedges | - | |||||
Total combined interest and FX risk | - | - | - | - | ||
Total cash flow hedge | - | - | - | |||
1The carrying amount is the gross amount, excluding tax adjustments.
2The amounts are reclassified to Net interest income - interest income and/or expense on non-trading derivatives (hedge accounting).
ING Group Annual Report 2023 on Form 20-FF -317
The increase in the carrying amount of the cash flow hedge reserve is driven by the interest rate
movements. No material hedging relationship was discontinued as a result of the interest rate movements
in 2023.
The main sources of ineffectiveness for cash flow hedges are:
•differences in timing of cash flows of the hedged item(s) and hedging instrument(s);
•mismatches in reset frequency between hedged item and hedging instrument.
Movement cash flow hedge reserve | ||
in EUR million | 2023 | 2022 |
Opening balance | - | - |
Value changes recognised in OCI | - | |
Amounts recycled to profit or loss | - | - |
Income tax | - | |
Exchange rate and other changes | - | |
Adjustment for non controlling interest | - | |
Movement for the year | - | |
Ending balance | - | - |
Hedges of net investments in foreign operations
A foreign currency exposure arises from a net investment in subsidiaries that have a different functional
currency from the presentation currency of ING. The risk arises from the fluctuation in spot exchange rates
between the functional currency of the subsidiaries and ING’s presentation currency, which causes the
amount of the net investment to vary in the consolidated financial statements of ING. This risk may have a
significant impact on ING’s financial statements. ING’s policy is to hedge these exposures only when not
doing so it is expected to have a significant impact on the regulatory capital ratios of ING and its
subsidiaries.
ING’s net investment hedges principally consist of derivatives (including currency forwards and swaps) and
non-derivative financial instruments such as foreign currency denominated funding. When the hedging
instrument is foreign currency denominated debt, ING assesses effectiveness by comparing past changes in
the carrying amount of the debt that are attributable to a change in the spot rate with past changes in the
investment in the foreign operation due to movement in the spot rate (the offset method).
Gains and losses on the effective portions of derivatives designated under net investment hedge accounting
are recognised in Other Comprehensive Income. The balance in equity is recognised in the statement of
profit or loss when the related foreign subsidiary is disposed. The gains and losses on ineffective portions are
recognised immediately in the statement of profit or loss in 'Valuation results and net trading income'.
ING has the following derivative financial instruments used for net investment hedging:
Gross carrying value of derivatives used for net investment hedging | ||||
Assets | Liabilities | Assets | Liabilities | |
in EUR million | 2023 | 2023 | 2022 | 2022 |
As at 31 December | ||||
– FX forwards and Cross currency swaps | ||||
The derivatives used for net investment hedge accounting are included in the statement of financial position
line-item ‘Financial assets at fair value through profit or loss – Non-trading derivatives’ EUR 100 million
(2022: EUR 119 million) respectively ‘Financial liabilities at fair value through profit or loss – Non trading
derivatives’ EUR 92 million (2022: EUR 83 million).
For ING’s main currencies the average exchange rates used in net investment hedge accounting for 2023
are EUR/USD 1.08 (2022: 1.06 ), EUR/PLN 4.54 (2022: 4.68 ), EUR/AUD 1.63 (2022: 1.52 ) and EUR/THB 37.65
(2022: 36.87 ).
The following table shows the notional amount of derivatives designated in net investment hedging split
into the maturity of the instruments:
ING Group Annual Report 2023 on Form 20-FF -318
Maturity derivatives designated in net investment hedging | |||||||||
in EUR million | |||||||||
As at 31 December 2023 | Less than 1 month | 1 to 3 months | 3 to 12 months | 1 to 2 years | 2 to 3 years | 3 to 4 years | 4 to 5 years | >5 years | Total |
– FX forwards and cross currency swaps | - | - | - | - | |||||
As at 31 December 2022 | |||||||||
– FX forwards and Cross currency swaps | - | - | - | - | |||||
The effect of the net investment hedge accounting in the statement of profit or loss and other
comprehensive income is as follows:
Net investment hedge accounting – Impact on statement of profit or loss and other comprehensive income | |||||
in EUR million | |||||
As at 31 December 2023 | Change in value of hedged item used for calculating hedge ineffectiveness for the period | Carrying amount net investment hedge reserve at the end of the reporting period1 | Hedged item affected statement of profit or loss | Change in value of hedging instrument recognised in OCI | Hedge ineffectiveness recognised in the statement of profit or loss, gain(+) / Loss(-) |
Investment in foreign operations | - | ||||
Discontinued hedges | |||||
As at 31 December 2022 | |||||
Investment in foreign operations | - | ||||
Discontinued hedges | - | ||||
1The carrying amount is the gross amount, excluding tax adjustments.
Amounts presented in these tables by contractual maturity are the amounts as presented in the statement
of financial position and are discounted cash flows. Reference is made to ‘Risk Management – Funding and
liquidity risk’.
ING Group Annual Report 2023 on Form 20-FF -319
Assets by contractual maturity | |||||||
in EUR million | |||||||
2023 | Less than 1 month 1 | 1-3 months | 3-12 months | 1-5 years | Over 5 years | Maturity not applicable | Total |
Cash and balances with central banks | |||||||
Loans and advances to banks | |||||||
Financial assets at fair value through profit or loss | |||||||
– Trading assets | |||||||
– Non-trading derivatives | |||||||
– Mandatorily at fair value through profit or loss | |||||||
– Designated as at fair value through profit or loss | |||||||
Financial assets at fair value through other comprehensive income | |||||||
– Equity securities | |||||||
– Debt securities | |||||||
– Loans and advances | |||||||
Securities at amortised cost | |||||||
Loans and advances to customers | |||||||
Other assets 2 | |||||||
Total assets | |||||||
2022 | |||||||
Cash and balances with central banks | |||||||
Loans and advances to banks | |||||||
Financial assets at fair value through profit or loss | |||||||
– Trading assets | |||||||
– Non-trading derivatives | |||||||
– Mandatorily at fair value through profit or loss | |||||||
– Designated as at fair value through profit or loss | |||||||
Financial assets at fair value through other comprehensive income | |||||||
– Equity securities | |||||||
– Debt securities | |||||||
– Loans and advances | |||||||
Securities at amortised cost | |||||||
Loans and advances to customers | |||||||
Other assets 2 | |||||||
Total assets | |||||||
1 Includes assets on demand.
2 Includes assets such as current and deferred tax assets as presented in the consolidated statement of the financial position. Additionally, assets are included in that position where maturities are not applicable such as property and equipment and investments in associates and
joint ventures. Due to their nature non-financial assets consist mainly of assets expected to be recovered after more than 12 months.
ING Group Annual Report 2023 on Form 20-FF -320
The tables below include all liabilities and off-balance sheet commitments by maturity based on
contractual, undiscounted cash flows. These balances are included in the maturity analysis as follows:
•Perpetual liabilities are included in the column ‘Maturity not applicable’.
•Derivative liabilities are included on a net basis if cash flows are settled net. For other derivative liabilities
the contractual gross cash flow payable is included.
•Undiscounted future coupon interest on financial liabilities payable is included in a separate line and in
the relevant maturity bucket.
•Non-financial liabilities are included based on a breakdown of the amounts per statement of financial
position, per expected maturity.
•Loans and other credit-related commitments are classified on the basis of the earliest date they can be
drawn down.
ING Group’s expected cash flows on some financial liabilities vary significantly from contractual cash flows.
Principal differences are in demand deposits from customers that are expected to remain stable or increase
and in unrecognised loan commitments that are not all expected to be drawn down immediately. Reference
is made to the liquidity risk paragraph in ‘Risk Management – Funding and liquidity risk’ for a description on
how liquidity risk is managed.
ING Group Annual Report 2023 on Form 20-FF -321
Liabilities and off-balance sheet commitments by maturity | ||||||||
in EUR million | ||||||||
2023 | Less than 1 month 1 | 1–3 months | 3–12 months | 1–5 years | Over 5 years | Maturity not applicable | Adjustment 2 | Total |
Deposits from banks | ||||||||
Customer deposits | ||||||||
Financial liabilities at fair value through profit or loss | ||||||||
– Other trading liabilities | - | |||||||
– Trading derivatives | - | |||||||
– Non-trading derivatives | - | |||||||
– Designated at fair value through profit or loss | - | |||||||
Debt securities in issue | - | |||||||
Subordinated loans | - | |||||||
Lease liabilities | - | |||||||
Financial liabilities | - | |||||||
Other liabilities 3 | ||||||||
Total liabilities | - | |||||||
Coupon interest due on financial liabilities | ||||||||
Contingent liabilities in respect of | ||||||||
– Discounted bills | ||||||||
– Guarantees | ||||||||
– Irrevocable letters of credit | ||||||||
Guarantees issued by ING Groep N.V. | ||||||||
Irrevocable facilities | ||||||||
1 Includes liabilities on demand.
2 This column reconciles the contractual undiscounted cash flows on financial liabilities to the statement of financial position values. The adjustments mainly relate to the impact of discounting and fair value hedge adjustments, and for derivatives, to the fact that the contractual
cash flows are presented on a gross basis (unless the cash flows are actually settled net).
3 Includes Other liabilities, Current and deferred tax liabilities, and Provisions as presented in the Consolidated statement of financial position.
ING Group Annual Report 2023 on Form 20-FF -322
Liabilities and off-balance sheet commitments by maturity | ||||||||
in EUR million | ||||||||
2022 | Less than 1 month 1 | 1–3 month | 3–12 months | 1–5 years | Over 5 years | Maturity not applicable | Adjustment 2 | Total |
Deposits from banks | - | |||||||
Customer deposits | - | |||||||
Financial liabilities at fair value through profit or loss | ||||||||
– Other trading liabilities | - | |||||||
– Trading derivatives | ||||||||
– Non-trading derivatives | ||||||||
– Designated at fair value through profit or loss | - | |||||||
Debt securities in issue | - | |||||||
Subordinated loans | - | |||||||
Lease liabilities | - | |||||||
Financial liabilities | ||||||||
Other liabilities 3 | ||||||||
Total liabilities | ||||||||
Coupon interest due on financial liabilities | ||||||||
Contingent liabilities in respect of | ||||||||
– Discounted bills | ||||||||
– Guarantees | ||||||||
– Irrevocable letters of credit | ||||||||
– other | ||||||||
Guarantees issued by ING Groep N.V. | ||||||||
Irrevocable facilities4 | ||||||||
1Includes liabilities on demand.
2This column reconciles the contractual undiscounted cash flows on financial liabilities to the statement of financial position values. The adjustments mainly relate to the impact of discounting and fair value hedge adjustments, and for derivatives, to the fact that the contractual
cash flows are presented on a gross basis (unless the cash flows are actually settled net).
3Includes Other liabilities, Current and deferred tax liabilities, and Provisions as presented in the Consolidated statement of financial position.
ING Group Annual Report 2023 on Form 20-FF -323
Financial assets pledged as collateral
The financial assets pledged as collateral consist primarily of Loans and advances to customers pledged to
secure Debt securities in issue, deposits from the Dutch Central Bank and other banks, as well as debt
securities used in securities lending or sale and repurchase transactions. They serve to secure margin
accounts and are used for other purposes required by law. Pledges are generally conducted under terms
that are usual and customary for collateralised transactions including standard sale and repurchase
agreements, securities lending and borrowing and derivatives margining. The financial assets pledged are as
follows:
Financial assets pledged as collateral | ||
in EUR million | 2023 | 2022 |
Banks | ||
– Cash and balances with central banks | ||
– Loans and advances to banks | ||
Financial assets at fair value through profit or loss | ||
Financial assets at fair value through OCI | ||
Securities at amortised cost | ||
Loans and advances to customers | ||
Other assets | ||
In 2023 the financial assets pledged as collateral reduced due to the partial repayment of ING's TLTRO III. In
addition, in some jurisdictions ING Bank N.V. has an obligation to maintain a reserve with central banks. As
at 31 December 2023, the minimum mandatory reserve deposits with various central banks amount to EUR
Financial assets received as collateral
The financial assets received as collateral that can be sold or repledged in absence of default by the owner
of the collateral consists of securities obtained through reverse repurchase transactions and securities
borrowing transactions.
These transactions are generally conducted under standard market terms for most repurchase transactions
and the recipient of the collateral has unrestricted right to sell or repledge it, provided that the collateral (or
equivalent collateral) is returned to the counterparty at term.
Financial assets received as collateral | ||
in EUR million | 2023 | 2022 |
Total received collateral available for sale or repledge at fair value | ||
– equity securities | ||
– debt securities | ||
of which sold or repledged at fair value | ||
– equity securities | ||
– debt securities | ||
Transfer of financial assets
The majority of ING's financial assets that have been transferred, but do not qualify for derecognition are
debt and equity instruments used in securities lending or sale and repurchase transactions.
Transfer of financial assets not qualifying for derecognition | ||||||||
Securities lending | Sale and repurchase | |||||||
Equity | Debt | Equity | Debt | |||||
in EUR million | 2023 | 2022 | 2023 | 2022 | 2023 | 2022 | 2023 | 2022 |
Transferred assets at carrying amount | ||||||||
Financial assets at fair value through profit or loss | ||||||||
Financial assets at fair value through other comprehensive income | ||||||||
Loans and advances to customers | ||||||||
Securities at amortised cost | ||||||||
Associated liabilities at carrying amount1 | ||||||||
Financial liabilities at fair value through profit or loss | n/a | n/a | n/a | n/a | ||||
1The table includes the associated liabilities which are reported after offsetting, compared to the gross positions of the encumbered
The table above does not include assets transferred to consolidated securitisation entities as the related
assets remain recognised in the consolidated statement of financial position. Transferred financial assets
that are derecognised in their entirety are mentioned in Note 45 'Structured entities'.
ING Group Annual Report 2023 on Form 20-FF -324
The following tables include information about rights to offset and the related arrangements. The amounts
included consist of all recognised financial instruments that are presented net in the statement of financial
position under the IFRS netting criteria (legal right to offset and intention to settle net or to realise the asset
and settle the liability simultaneously) and amounts presented gross in the statement of financial position
but subject to enforceable master netting arrangements or similar arrangements.
At ING Group amounts that are offset mainly relate to derivatives transactions, sale and repurchase
agreements, securities lending agreements and cash pooling arrangements. A significant portion of
offsetting is applied to OTC derivatives which are cleared through central clearing parties.
Related amounts not set off in the statement of financial position include transactions where:
•The counterparty has an offsetting exposure and a master netting or similar arrangement is in place with
a right to set off only in the event of default, insolvency or bankruptcy, or the offsetting criteria are
otherwise not satisfied, and
•In the case of derivatives and securities lending or sale and repurchase agreements, cash and non-cash
collateral has been received or pledged to cover net exposure in the event of a default or other
predetermined events. The effect of over-collateralisation is excluded.
The net amounts resulting after set off are not intended to represent ING’s actual exposure to counterparty
risk, as risk management employs a number of credit risk mitigation strategies in addition to netting and
collateral arrangements. Reference is made in the Risk Management Credit risk’ section ‘Credit risk
mitigation'.
ING Group Annual Report 2023 on Form 20-FF -325
Financial assets subject to offsetting, enforceable master netting arrangements and similar agreements | |||||||||
in EUR million 2023 | Gross amounts of recognised financial assets | Gross amounts of recognised financial liabilities offset in the statement of financial position | Net amounts of financial assets presented in the statement of financial position | Related amounts not offset in the statement of financial position | Net amount | Amounts not subject to enforceable netting arrangements | Statement of financial position total ¹ | ||
Financial instruments | Cash and financial instruments received as collateral | ||||||||
Statement of financial position line item | Financial instrument | ||||||||
Loans and advances to banks 2 | Reverse repurchase, securities borrowing and similar agreements | - | |||||||
Other | |||||||||
- | |||||||||
Financial assets at fair value through profit or loss | |||||||||
Trading and Non-trading | Reverse repurchase, securities borrowing and similar agreements | - | |||||||
Derivatives 3 | - | ||||||||
- | |||||||||
Loans and advances to customers 4 | Reverse repurchase, securities borrowing and similar agreements | ||||||||
Cash pools | - | ||||||||
- | |||||||||
Other items where offsetting is applied in the statement of financial position 5 | - | ||||||||
Total financial assets | - | ||||||||
1‘The statement of financial position total’ is the sum of ‘Net amounts of financial assets presented in the statement of financial position’ and ’Amounts not subject to enforceable master netting arrangements’.
2At 31 December 2023, the total amount of ‘Loans and advances to banks’ excluding repurchase agreements is EUR 11,458 million which is not subject to offsetting.
3Derivative assets and derivative liabilities include certain exchange traded future and option positions with the same underlying.
4At 31 December 2023, the total amount of ‘Loans and advances to customers’ excluding repurchase agreements is EUR 646,814 million of which the net cash pool position of EUR 1,616 million is subject to offsetting. Cash pools mainly relate to our subsidiary Bank Mendes Gans.
5Other items mainly include amounts to be settled with Central Clearing Counterparties regarding securities and derivatives transactions and is included in ‘Other Assets – Amounts to be settled’ for EUR 3,869 million in the statement of financial position of which EUR 695 million
is subject to offsetting as at 31 December 2023.
ING Group Annual Report 2023 on Form 20-FF -326
Financial assets subject to offsetting, enforceable master netting arrangements and similar agreements | |||||||||
in EUR million 2022 | Gross amounts of recognised financial assets | Gross amounts of recognised financial liabilities offset in the statement of financial position | Net amounts of financial assets presented in the statement of financial position | Related amounts not offset in the statement of financial position | Net amount | Amounts not subject to enforceable netting arrangements | Statement of financial position total ¹ | ||
Financial instruments | Cash and financial instruments received as collateral | ||||||||
Statement of financial position line item | Financial instrument | ||||||||
Loans and advances to banks 2 | Reverse repurchase, securities borrowing and similar agreements | ||||||||
Other | - | ||||||||
Financial assets at fair value through profit or loss | |||||||||
Trading and Non-trading | Reverse repurchase, securities borrowing and similar agreements | - | |||||||
Derivatives | - | ||||||||
- | |||||||||
Loans and advances to customers 3 | Reverse repurchase, securities borrowing and similar agreements | ||||||||
Cash pools | - | ||||||||
- | |||||||||
Other items where offsetting is applied in the statement of financial position 4 | - | ||||||||
Total financial assets | - | ||||||||
1‘The statement of financial position total’ is the sum of ‘Net amounts of financial assets presented in the statement of financial position’ and ’Amounts not subject to enforceable master netting arrangements’.
2At 31 December 2022, the total amount of ‘Loans and advances to banks’ excluding repurchase agreements is EUR 15,709 million which is not subject to offsetting.
3At 31 December 2022, the total amount of ‘Loans and advances to customers’ excluding repurchase agreements is EUR 643,587 million of which the net cash pool position of EUR 1,404 million is subject to offsetting. Cash pools mainly relate to our subsidiary Bank Mendes Gans.
4Other items mainly include amounts to be settled with Central Clearing Counterparties regarding securities and derivatives transactions and is included in ‘Other Assets – Amounts to be settled’ for EUR 5,191 million in the statement of financial position of which EUR 851 million
is subject to offsetting as at 31 December 2022.
ING Group Annual Report 2023 on Form 20-FF -327
Financial liabilities subject to offsetting, enforceable master netting arrangements and similar agreements | |||||||||
in EUR million 2023 | Related amounts not offset in the statement of financial position | Amounts not subject to enforceable netting arrangements | Statement of financial position total ¹ | ||||||
Gross amounts of recognised financial liabilities | Gross amounts of recognised financial assets offset in the statement of financial position | Net amounts of financial liabilities presented in the statement of financial position | Financial instruments | Cash and financial instruments pledged as collateral | Net amount | ||||
Statement of financial position line item | Financial instrument | ||||||||
Deposits from banks 2 | Repurchase, securities lending and similar agreements | - | |||||||
Other | - | ||||||||
- | |||||||||
Customer deposits 4 | Repurchase, securities lending and similar agreements | ||||||||
Cash pools | - | ||||||||
- | |||||||||
Financial liabilities at fair value through profit or loss | |||||||||
Trading and Non-trading | Repurchase, securities lending and similar agreements | - | - | ||||||
Derivatives 3 | - | ||||||||
- | |||||||||
Other items where offsetting is applied in the statement of financial position 5 | - | ||||||||
Total financial liabilities | - | ||||||||
1‘The statement of financial position total’ is the sum of ‘Net amounts of financial liabilities presented in the statement of financial position’ and ’Amounts not subject to enforceable master netting arrangements’.
2At 31 December 2023, the total amount of ‘Deposits from banks’ excluding repurchase agreements is EUR 21,193 million of which EUR 0 million is subject to offsetting.
3Derivative assets and derivative liabilities include certain exchange traded future and option positions with the same underlying.
4At 31 December 2023, the total amount of ‘Customers deposits’ excluding repurchase agreements is EUR 650,179 million of which the net cash pool position of EUR 15,116 million is subject to offsetting. Cash pools mainly relate to our subsidiary Bank Mendes Gans.
5Other items mainly include amounts to be settled with Central Clearing Counterparties regarding securities and derivatives transactions and is included in ‘Other Liabilities – Amounts to be settled’ for EUR 6,509 million in the statement of financial position of which EUR 512
million is subject to offsetting as at 31 December 2023.
ING Group Annual Report 2023 on Form 20-FF -328
Financial liabilities subject to offsetting, enforceable master netting arrangements and similar agreements | |||||||||
in EUR million 2022 | Related amounts not offset in the statement of financial position | Amounts not subject to enforceable netting arrangements | Statement of financial position total ¹ | ||||||
Gross amounts of recognised financial liabilities | Gross amounts of recognised financial assets offset in the statement of financial position | Net amounts of financial liabilities presented in the statement of financial position | Financial instruments | Cash and financial instruments pledged as collateral | Net amount | ||||
Statement of financial position line item | Financial instrument | ||||||||
Deposits from banks 2 | Repurchase, securities lending and similar agreements | ||||||||
Other | |||||||||
Customer deposits 3 | Repurchase, securities lending and similar agreements | ||||||||
Cash pools | - | ||||||||
- | |||||||||
Financial liabilities at fair value through profit or loss | |||||||||
Trading and Non-trading | Repurchase, securities lending and similar agreements | - | |||||||
Derivatives | - | ||||||||
- | |||||||||
Other items where offsetting is applied in the statement of financial position 4 | - | ||||||||
Total financial liabilities | - | ||||||||
1‘The statement of financial position total’ is the sum of ‘Net amounts of financial liabilities presented in the statement of financial position’ and ’Amounts not subject to enforceable master netting arrangements’.
2At 31 December 2022, the total amount of ‘Deposits from banks’ excluding repurchase agreements is EUR 52,823 million of which EUR 0 million is subject to offsetting.
3At 31 December 2022, the total amount of ‘Customers deposits’ excluding repurchase agreements is EUR 640,740 million of which the net cash pool position of EUR 13,362 million is subject to offsetting. Cash pools mainly relate to our subsidiary Bank Mendes Gans.
4Other items mainly include amounts to be settled with Central Clearing Counterparties regarding securities and derivatives transactions and is included in ‘Other Liabilities – Amounts to be settled’ for EUR 6,715 million in the statement of financial position of which EUR 100
ING Group Annual Report 2023 on Form 20-FF -329
In the normal course of business, ING Group is party to activities where risks are not reflected in whole or in
part in the consolidated financial statements. In response to the needs of its customers, the Group offers
financial products related to loans. These products include traditional off-balance sheet credit-related
financial instruments.
Contingent liabilities and commitments | ||
in EUR million | 2023 | 2022 |
Contingent liabilities in respect of | ||
– Guarantees | ||
– Irrevocable letters of credit | ||
– Other | ||
Guarantees issued by ING Groep N.V. | ||
Irrevocable facilities | ||
Guarantees relate both to credit and non-credit substitute guarantees. Credit substitute guarantees are
guarantees given by ING Group in respect of credit granted to customers by a third party. Many of them are
expected to expire without being drawn on and therefore do not necessarily represent future cash outflows.
Irrevocable letters of credit mainly secure payments to third parties for a customer’s foreign and domestic
trade transactions in order to finance a shipment of goods. ING Group’s credit risk in these transactions is
limited since these transactions are collateralised by the commodity shipped and are of a short duration.
Other contingent liabilities include acceptances of bills and are of a short-term nature. Other contingent
liabilities also include contingent liabilities resulting from the operations of the Real Estate business including
obligations under development and construction contracts.
Irrevocable facilities mainly constitute unused portions of irrevocable credit facilities granted to corporate
clients. Many of these facilities are for a fixed duration and bear interest at a floating rate. ING Group’s credit
risk and interest rate risk in these transactions is limited. The unused portion of irrevocable credit facilities is
partly secured by customers’ assets or counter-guarantees by the central governments and other public
sector entities under the regulatory requirements. Irrevocable facilities also include commitments made to
purchase securities to be issued by governments and private issuers.
As at 31 December 2023, ING Groep N.V. guarantees various US dollar debentures (that mature between
2024 and 2036) which were issued by a subsidiary of Voya Financial Inc. In accordance with the
Shareholder’s agreement, the net exposure of ING Groep N.V. as at 31 December 2023 was nil , as the
outstanding principal amount of the US dollar debentures was fully covered with collateral of EUR 205
million(2022: EUR 344 million) pledged by Voya Financial Inc
In addition to the items included in contingent liabilities, ING Group has issued certain guarantees as
participant in collective arrangements of national banking funds and as a participant in required collective
guarantee schemes which apply in different countries.
ING Bank N.V. provided a guarantee to the German Deposit Guarantee Fund (‘Einlagensicherungsfonds’ or
ESF) under section 5 (10) of the by-laws of this fund, where ING Bank N.V. indemnifies the Association of
German Banks Berlin against any losses it might incur as result of actions taken with respect to ING
Germany. The ESF is a voluntary collective guarantee scheme for retail savings and deposits in excess of EUR
100,000.
ING uses Irrevocable Payment Commitments (IPCs) for a part of its contributions to the Single Resolution
Fund (SRF). ING Group has EUR 346 million of IPCs outstanding to the SRF as at 31 December 2023 (31
December 2022: EUR 283 million). Of these, EUR 63 million of IPCs were provided to the SRF during 2023
(2022: EUR 57 million). No IPCs were called by the SRF in 2023 (2022: nil). Cash collateral provided to the SRF
is equal to the outstanding amount of IPCs.
ING also uses IPCs for a part of its contributions to the Deposit Guarantee Scheme in Germany. Contingent
liabilities for such outstanding IPCs amount to EUR 273 million as at 31 December 2023 (31 December 2022:
EUR 237 million). Of these, EUR 36 million of IPCs were provided to the DGS during 2023 (2022: EUR 31
million). No IPCs were called by the DGS in 2023 (2022: nil). ING posted government bonds as collateral for
the total nominal amount of EUR 319 million as at 31 December 2023 (31 December 2022: EUR 259 million).
Furthermore we refer to Note 42 'Legal proceedings' for any contingent liabilities in respect of legal
proceedings.
ING Group and its consolidated subsidiaries are involved in governmental, regulatory, arbitration and legal
proceedings and investigations in the Netherlands and in a number of foreign jurisdictions, including the
U.S., involving claims by and against them which arise in the ordinary course of their businesses, including in
connection with their activities as lenders, broker-dealers, underwriters, issuers of securities and investors
and their position as employers and taxpayers. In certain of such proceedings, very large or indeterminate
amounts are sought, including punitive and other damages. While it is not feasible to predict or determine
the ultimate outcome of all pending or threatened governmental, regulatory, arbitration and legal
ING Group Annual Report 2023 on Form 20-FF -330
proceedings and investigations, ING is of the opinion that some of the proceedings and investigations set
out below may have or have in the recent past had a significant effect on the financial position, profitability
or reputation of the ING and/or the ING and its consolidated subsidiaries.
Settlement agreement: On 4 September 2018, ING announced that it had entered into a settlement
agreement with the Dutch Public Prosecution Service relating to previously disclosed investigations
regarding various requirements for client on-boarding and the prevention of money laundering and corrupt
practices. Following the entry into the settlement agreement, ING has experienced heightened scrutiny
from authorities in various countries. ING is also aware, including as a result of media reports, that other
parties may, among other things, seek to commence legal proceedings against ING in connection with the
subject matter of the settlement. Certain parties filed requests with the Court of Appeal in The Netherlands
to reconsider the prosecutor’s decision to enter into the settlement agreement with ING and not to
prosecute ING or (former) ING employees. In December 2020, the Court of Appeal issued its final ruling. In
this ruling the prosecutors' decision to enter into the settlement agreement with ING was upheld, making
the settlement final. However, in a separate ruling, the Court ordered the prosecution of ING’s former CEO.
Litigation by investors: In February 2024, ING and certain (former) board members were served with a writ
of summons for litigation in The Netherlands on behalf of investors who claim to have suffered financial
losses in connection with ING's disclosures on historic shortcomings in its financial economic crime policies,
related risk management and control systems, the investigation by and settlement with the Dutch
authorities in 2018 and related risks for ING. We do not agree with the allegations and will defend ourselves
against these and the claimed damages of around EUR 500 million. We follow IFRS rules for taking legal
provisions and would disclose material amounts in that regard if and when applicable - which currently is
not the case.
Findings regarding AML processes: As previously disclosed, after its September 2018 settlement with Dutch
authorities concerning anti-money laundering matters, and in the context of significantly increased
attention on the prevention of financial economic crime, ING has experienced heightened scrutiny by
authorities in various countries. The interactions with such regulatory and judicial authorities have included,
and can be expected to continue to include, onsite visits, information requests, investigations and other
enquiries. Such interactions, as well as ING’s internal assessments in connection with its global
enhancement programme, have in some cases resulted in satisfactory outcomes, and also have resulted in,
and may continue to result in, findings, or other conclusions which may require appropriate remedial
actions by ING, or may have other consequences. ING intends to continue to work in close cooperation with
authorities as it seeks to improve its management of non-financial risks in terms of policies, tooling,
monitoring, governance, knowledge and behaviour.
In January 2022, a Luxembourg investigating judge informed ING Luxembourg that he intends to instruct
the relevant prosecutor to prepare a criminal indictment regarding alleged shortcomings in the AML process
at ING Luxembourg. Although this matter still remains at an early procedural stage and it is currently not
possible to determine how this matter will be resolved or the timing of any such resolution, ING does not
expect a financial outcome of this matter to have a material effect.
ING's subsidiary Payvision is the subject of a criminal investigation by Dutch authorities regarding money
laundering and various requirements of the Dutch act on Anti-Money Laundering and Counter Terrorist
Financing, focusing on the period from 1 January 2015 up to and including April 2020. Payvision is
cooperating with such ongoing investigation. In October 2021, the phasing out of Payvision was announced.
The phasing out of activities and the transfer of customers to a new service provider were completed in
2022. At the request of Payvision, its license has been withdrawn. It is currently not feasible to determine
how the ongoing investigation may be resolved or the timing of any such resolution, nor to estimate reliably
the possible timing, scope or amounts of any resulting fines, penalties and/or other outcome.
ING continues to take steps to enhance its management of compliance risks and embed stronger awareness
across the whole organisation. These steps are part of the global KYC programme and set of initiatives,
which includes enhancing KYC files and working on various structural improvements in compliance policies,
tooling, monitoring, governance, knowledge and behaviour.
Tax cases: Because of the geographic spread of its business, ING may be subject to tax audits, investigations
and procedures in numerous jurisdictions at any point in time. Although the Issuer believes that it has
adequately provided for all its tax positions, the ultimate resolution of these audits, investigations and
procedures is uncertain and may result in liabilities which are materially different from the amounts
recognised.
Litigation regarding products of a former subsidiary in Mexico: Proceedings in which ING is involved include
complaints and lawsuits concerning the performance of certain interest sensitive products that were sold by
a former subsidiary of ING in Mexico.
Claims regarding accounts with predecessors of ING Bank Türkiye: ING Bank Türkiye has received
numerous claims from (former) customers of legal predecessors of ING Bank Türkiye. The claims are based
on offshore accounts held with these banks, which banks were seized by the Savings Deposit Insurance Fund
(“SDIF”) prior to the acquisition of ING Bank Türkiye in 2007 from OYAK. Pursuant to the acquisition contract,
ING can claim compensation from SDIF if a court orders ING to pay amounts to the offshore account holders.
SDIF has made payments to ING pursuant to such compensation requests, but filed various lawsuits to
receive those amounts back. These lawsuits are ongoing in favour of ING Bank Türkiye. In April 2022 the
Turkish Supreme Court decided that the prescription period for the offshore account holders’ compensation
claims starts on the transfer date of the account holders to the offshore accounts. The exact impact of this
decision on the ongoing cases is not clear yet. At this moment it is not possible to assess the outcome of
these procedures nor to provide an estimate of the (potential) financial effect of these claims.
ING Group Annual Report 2023 on Form 20-FF -331
Interest rate derivatives claims: In the past a uniform recovery framework for Dutch SME clients with
interest rate derivatives was established by a committee of independent experts appointed by the Dutch
Ministry of Finance. In the context of this recovery framework most claims have been settled, however ING is
still involved in several legal proceedings in the Netherlands with respect to interest rate derivatives that
were sold to clients in connection with floating interest rate loans in order to hedge the interest rate risk of
the loans. These proceedings are based on several legal grounds, depending on the facts and circumstances
of each specific case, inter alia alleged breach of duty of care, insufficient information provided to the clients
on the product and its risks and other elements related to the interest rate derivatives that were sold to
clients. In some cases, the court has ruled in favour of the claimants and awarded damages, annulled the
interest rate derivative or ordered repayment of certain amounts to the claimants.
Interest surcharges claims: ING received complaints and was involved in litigation with certain individuals in
the Netherlands regarding increases in interest surcharges with respect to several credit products, including
but not limited to commercial property. ING has reviewed the relevant product portfolio. The provision
previously taken has been reversed for certain of these complaints. All claims are dealt with individually.
Thus far, the courts have ruled in favour of ING in each case, ruling that ING was allowed to increase the
interest surcharge based upon the essential obligations in the contract. In a relevant case the Dutch
Supreme Court ruled in favor of another Dutch bank, addressing the question whether or not a bank is
allowed to increase interest surcharges unilaterally. The Supreme Court ruled affirmatively and referred the
case to the Court of Appeal in The Hague. The Court of Appeal also ruled in favour of the Dutch bank in
October 2022 and this ruling has been confirmed by the Supreme Court in its ruling of 22 December 2023.
ING will continue to deal with all claims individually. In the last pending case against ING, the Court of Appeal
dismissed all claims in its ruling of 9 January 2024. The time limit for lodging a cassation appeal at the
Supreme Court expires on 9 April 2024.
Mortgage expenses claims: ING Spain has received claims and is involved in procedures with customers
regarding reimbursement of expenses associated with the formalisation of mortgages. In most first instance
court proceedings the expense clause of the relevant mortgage contract has been declared null and ING
Spain has been ordered to reimburse all or part of the applicable expenses. Since 2018, the Spanish Supreme
Court and the European Court of Justice have issued rulings setting out which party should bear notary,
registration, agency, and stamp duty costs. In January 2021, the Spanish Supreme Court ruled that
valuation costs of mortgages, signed prior to 16 June 2019, the date the new mortgage law entered into
force, should be borne by the bank. Media attention for the statute of limitations applicable to the right to
claim reimbursement of costs resulted in an increased number of claims at the beginning of 2021. In June
2021, the Supreme Court published a press release informing of its decision to ask the European Court of
Justice for a preliminary ruling regarding the criteria that should be applied to determine the date from
which the action for claiming the reimbursement of mortgage expenses is considered to be expired. Two
other preliminary rulings that were submitted by Catalunya courts also related to the limitation period. In
January 2024, the European Court of Justice ruled on one of the complaints filed by the Catalunya Provincial
Court. The European Court of Justice determined that the limitation period for the judicial claim for
reimbursement of expenses cannot begin to run from a Supreme Court decision declaring the clause null
and void, nor from the moment of the payment of the expenses. The European Court of Justice indicated
that it is up to national case-law to determine the criterion that should be applied for the calculation of the
limitation period, so uncertainty remains until the Supreme Court unifies the case-law. Currently, ING is
reviewing the strategy in order to address the latest developments.
ING Spain was also included, together with other Spanish banks, in three class actions filed by customer
associations. In one of the class actions an agreement was reached with the association. In another class
action ING filed an appeal asking the Spanish Court of Appeal to determine that the ruling of the court of
first instance is only applicable to the consumers that were part of the case. The National Court has revoked
the ruling and declared that the consumers will not be able to initiate an action for compensation based on
the first instance ruling, as the claimant association intended. This last decision is not yet final, as it has
been appealed in the Supreme Court. A provision has been established in the past and has been adjusted
where appropriate.
Imtech claims: In the Netherlands, the trustees in the bankruptcy of Imtech N.V. (“Imtech”) claimed in
September 2018 from various financing parties, including ING, payment of what the security agent has
collected following bankruptcy or intends to collect, repayment of all that was repaid to the financing
parties, as well as compensation for the repayment of a bridge financing, provided by ING and another
bank. This matter was settled by all Imtech financiers, including ING, and the Imtech trustees in October
2023.
In January 2018, ING Bank received a claim from Stichting ImtechClaim.nl and Imtech Shareholders Action
Group B.V. on behalf of certain (former) shareholders of Imtech. Furthermore, in March 2018, ING Bank
received another claim on the same subject matter from the Dutch Association of Stockholders (Vereniging
van Effectenbezitters, “VEB”). In June 2022, VEB reiterated and further substantiated its claim in a letter to
ING. Each of the claimants allege inter alia that shareholders were misled by the prospectus of the rights
issues of Imtech in July 2013 and October 2014. ING Bank, being one of the underwriters of the rights issues,
is held liable by the claimants for the damages that investors in Imtech would have suffered. ING Bank
responded to the claimants denying any and all responsibility in relation to the allegations made in the
relevant letters. ING (and the other underwriting banks) received a tolling letter (stuitingsbrief) from
Stichting Imtechclaim.nl, Imtech Shareholders Action Group B.V. and individual shareholders in December
2022, in connection with the allegations made in their original claim letter of January 2018. At this moment
it is not possible to assess the outcome of these claims nor to provide an estimate of the (potential) effect of
these claims.
Claims regarding mortgage loans in Swiss franc in Poland: ING Poland is a defendant in several lawsuits
with retail customers who took out mortgage loans indexed to the Swiss franc. Such customers have alleged
that the mortgage loan contract contains abusive clauses. One element that the court is expected to
consider in determining whether such contracts contain abusive clauses is whether the rules to determine
the exchange rate used for the conversion of the loan from Polish zloty to Swiss franc are unambiguous and
ING Group Annual Report 2023 on Form 20-FF -332
verifiable. In December 2020, the Polish Financial Supervision Authority (PFSA) proposed that lenders offer
borrowers voluntary out-of-court settlements on foreign-currency mortgage disputes, with mortgages
indexed to Swiss franc serving as a reference point. In February 2021, ING Poland announced its support for
this initiative and in October 2021 began offering the settlements to the borrowers following the PFSA’s
proposal. The Polish Supreme Court was expected to provide further clarity on this topic in a ruling
scheduled for November 2021, however the court’s session on this matter was postponed and the date of
the next session has not yet been announced. In October 2022, a hearing of the European Court of Justice
("CJEU") was held inter alia on the question whether, after cancellation of a contract regarding a Swiss franc
loan by a court, banks may still charge interests for the amount borrowed under such loan prior to
cancellation.
On 15 June 2023, the CJEU issued a ruling. It ruled that under EU law when a loan agreement indexed to the
Swiss franc is declared null and void, banks cannot claim any remuneration (i.e. interest) for the duration the
principal amount was available to the customer. The customer, however, may assert claims against banks in
addition to reimbursement of interest and instalments previously paid to the bank. ING has recorded a
portfolio provision.
Certain Consumer Credit Products: In October 2021, ING announced that it would offer compensation to its
Dutch retail customers in connection with certain revolving consumer loans with variable interest rates that
allegedly did not sufficiently follow market rates. This announcement was made in response to several
rulings by the Dutch Institute for Financial Disputes (Kifid) regarding similar products at other banks. ING has
recognized a provision of EUR 180 million in 2021 for compensation and costs in connection with this
matter. On 22 December 2021, ING announced that it reached an agreement with the Dutch Consumers’
Association (Consumentenbond) on the compensation methodology for revolving credits. Based on a Kifid
ruling regarding similar products, ING has amended its previously announced compensation scheme by also
compensating interest on interest. In the third quarter of 2022, ING increased its provision for this matter by
EUR 75 million. In the fourth quarter of 2022, ING and the Dutch Consumers’ Association reached an
agreement on the compensation of customers who have had an overdraft facility or a revolving credit card
with a variable interest rate. ING has started compensating such customers in line with Kifid rulings about
revolving credits including ‘interest-on-interest’-effect in these cases. The compensation process is taking
more time than expected. Timelines for compensation vary depending on customer and product
segmentation and are dependent on the availability of data.
Climate litigation: In January 2024, Friends of the Earth Netherlands (Milieudefensie) announced that it
holds ING liable for alleged contribution to climate change and threatens to initiate legal proceedings
against ING. If necessary, we will defend our science-based climate approach in court.
Acquisitions and divestments
There were no significant acquisitions in 2023, 2022 or 2021, and there was no significant divestment in
2023.
Divestments 2022
ING announced at 13 December 2022 that it has sold their interest (80 %) in Intersoftware Holding BV to the
Sky Group/ DIAS and realised a transaction result of EUR 11.0 million which consists of a profit of EUR 7.0 on
sale of InterSoftware Holding BV and the release of the redemption liability of EUR 3.0 million.
Divestments 2021
In 2021 ING decided to discontinue the Czech Retail Banking activities entailing the closure of retail
customer accounts /mutual funds and the sale of assets comprising the related government bond portfolio.
The discontinuation of the Czech retail Banking activities in 2021 resulted in EUR 2.5 billion saving accounts
being transferred to Raiffeisenbank and the government bond portfolio with a carrying amount of EUR 0.5
billion being sold.
At 12 July 2021, ING announced that it has reached an agreement to transfer ING’s Retail Banking
operations in Austria to Bank99. Under the terms of the agreement, approximately EUR 1.7 billion of savings
deposits and approximately EUR 1.0 billion of mortgages, approximately EUR 0.4 billion other personal
lending and approximately EUR 0.4 billion loans to banks of ING Austria have been transferred to Bank99. In
December 2021 the transaction was completed and a loss on disposal of EUR 26 million was realised. In
2022 some final closing activities resulted in an additional loss of EUR 1 million. ING Austria was included in
the segment Retail Challengers & Growth Markets.
In 2021, ING and the board of Makelaarsland agreed to continue Makelaarsland independently. The new
board will take over all clients and employees, and services to clients will continue unchanged. The negative
result on disposal of group companies from this management buyout amounted to approximately EUR 3
million.
On 28 October 2021 ING announced that its subsidiary Payvision will start phasing out its services as a
payment service provider and acquirer. In 2021, Payvision recognised an impairment loss of intangible
assets of EUR 44 million, mainly with respect to Brand, IT and Customer relationships and an impairment
loss of the deferred tax asset of EUR 14 million.
In December 2021 ING announced that it will leave the retail banking market in France in order to sharpen
the focus of its business portfolio. ING and Boursorama (a subsidiary of Société Générale) signed an
agreement to offer attractive services to retail customers of ING in France. The exit was finalized end of
ING Group Annual Report 2023 on Form 20-FF -333
2022. ING’s departure from the France retail banking market resulted in transferring EUR 9.7 billion saving
accounts to Boursorama. ING will continue its Wholesale Banking activities in France, with a focus on
strengthening its position and the ambition to be the go-to bank for sustainable finance.
For the majority of ING’s principal subsidiaries, ING Groep N.V. has control because it either directly or
indirectly owns more than half of the voting power. For subsidiaries in which the interest held is below 50%,
control exists based on the combination of ING’s financial interest and its rights from other contractual
arrangements which result in control over the operating and financial policies of the entity.
For each of the subsidiaries listed, the voting rights held equal the proportion of ownership interest and
consolidation by ING is based on the majority of ownership.
For the principal investments in associates and joint ventures ING Group has significant influence but not
control. Significant influence generally results from a shareholding of between 20% and 50% of the voting
rights, but also the ability to participate in the financial and operating policies through situations including,
but not limited to one or more of the following:
•Representation on the board of directors;
•Participation in the policymaking process; and
•Interchange of managerial personnel.
place of incorporation or primary place of business are as follows:
Principal subsidiaries, investments in associates and joint ventures | ||||
Proportion of ownership and interest held by the group | ||||
2023 | 2022 | |||
Subsidiary | Statutory place of Incorporation | Country of operation | ||
ING Bank N.V. | Amsterdam | the Netherlands | ||
Bank Mendes Gans N.V. | Amsterdam | the Netherlands | ||
ING Belgium S.A./N.V. | Brussels | Belgium | ||
ING Luxembourg S.A. | Luxembourg City | Luxembourg | ||
ING-DiBa AG | Frankfurt am Main | Germany | ||
ING Bank Slaski S.A.1 | Katowice | Poland | ||
ING Financial Holdings Corporation | Delaware | United States of America | ||
ING Bank A.S. | Istanbul | Türkiye | ||
ING Bank (Australia) Ltd | Sydney | Australia | ||
ING Commercial Finance B.V. | Amsterdam | the Netherlands | ||
ING Groenbank N.V. | Amsterdam | the Netherlands | ||
Investments in associates and joint ventures | ||||
TMBThanachart Bank Public Company Ltd2 | Bangkok | Thailand | ||
1The shares of the non-controlling interest stake of 25 % are listed on the Warsaw Stock Exchange, for summarised financial
information we refer to Note 31 'Information on geographical areas'.
2Reference is made to Note 8 'Investment in associates and joint ventures'.
ING Group’s activities involve transactions with various structured entities (SE) in the normal course of its
business. A structured entity is an entity that has been designed so that voting or similar rights are not the
dominant factor in deciding who controls the entity, such as when any voting rights relate to administrative
tasks only and the relevant activities are directed by means of contractual arrangements. ING Group’s
involvement in these entities varies and includes both debt financing and equity financing of these entities
as well as other relationships. Based on its accounting policies, ING establishes whether these involvements
result in no significant influence, significant influence, joint control or control over the structured entity.
The structured entities over which ING can exercise control are consolidated. ING may provide support to
these consolidated structured entities as and when appropriate. However, this is fully reflected in the
consolidated financial statements of ING Group as all assets and liabilities of these entities are included and
off-balance sheet commitments are disclosed.
ING Group Annual Report 2023 on Form 20-FF -334
ING’s activities involving structured entities are explained below in the following categories:
1.Consolidated ING originated securitisation programmes;
2.Consolidated ING originated Covered bond programme (CBC);
3.Consolidated ING sponsored Securitisation programme (Mont Blanc);
4.Unconsolidated Securitisation programme; and
5.Other structured entities.
1. Consolidated ING originated securitisation programmes
ING Group enters into liquidity management securitisation programmes in order to obtain funding and
improve liquidity. Within the programme ING Group sells ING originated assets to a structured entity. The
underlying exposures include residential mortgages and SME loans in the Netherlands, Belgium, Spain, Italy,
Australia and Germany.
The structured entity issues securitised notes (traditional securitisations) which are eligible collateral for
central bank liquidity purposes. In most programmes ING Group acts as investor of the securitised notes. ING
Group continues to consolidate these structured entities if it is deemed to control the entities.
The structured entity issues securitisation notes in two or more tranches, of which the senior tranche
obtains a high rating (AAA or AA) by a rating agency. The retained tranche can subsequently be used by ING
Group as collateral in the money market for secured borrowings.
ING Group originated various securitisations, as at 31 December 2023, these consisted of approximately EUR
(2022: EUR 1 billion) were issued externally. The underlying exposures are residential mortgages and SME
loans. Apart from the third party funding, these securitisations did not impact ING Group’s Consolidated
statement of financial position and profit or loss.
In 2023, there are no non-controlling interests as part of the securitisation structured entities that are
significant to ING Group. ING Group for the majority of the securitisation vehicles provides the funding for
the entity except for EUR 2 billion (2022: EUR 1 billion).
In addition ING Group originated various securitisations for liquidity management optimisation purposes
which consist of senior secured portfolio loans issued to ING subsidiaries in Germany. The underlying
exposures were senior loans to large corporations and financial institutions, and real estate finance loans,
mainly in the Netherlands. As at 31 December 2023, all securitized loans are redeemed (2022: EUR 444
million).
2. Consolidated ING originated covered bond programme (CBC)
ING Group has entered into a covered bond programme. Under the covered bond programme ING issues
bonds. The payment of interest and principal is guaranteed by the ING administered structured entities, ING
Covered Bond Company B.V., and ING SB Covered Bond Company B.V. In order for these entities to fulfil their
guarantee, ING legally transfers mainly Dutch mortgage loans originated by ING. Furthermore, ING offers
protection against deterioration of the mortgage loans. The entities are consolidated by ING Group.
Covered bond programme | ||
Fair value pledged mortgage loans | ||
in EUR million | 2023 | 2022 |
Dutch Covered Bond Companies | ||
In addition, subsidiaries of ING in Germany, Belgium, Poland and Australia also issued covered bonds with
pledged mortgages loans of approximately EUR 29,950 million (2022: EUR 24,880 million) in total.
For the covered bond programme, third-party investors in securities issued by the structured entity have
recourse to the assets of the entity and to the assets of ING Group.
3. Consolidated ING sponsored Securitisation programme (Mont Blanc)
In the normal course of business, ING Group structures financing transactions for its clients by assisting
them in obtaining sources of liquidity by selling the clients’ receivables or other financial assets to a Special
Purpose Vehicle (SPV). The senior positions in these transactions may be funded by the ING administered
multi seller Asset Backed Commercial Paper (ABCP) conduit Mont Blanc Capital Corp. (rated A-1/P-1). Mont
Blanc Capital Corp. funds itself externally in the ABCP markets.
In its role as administrative agent, ING Group facilitates these transactions by acting as administrative
agent, swap counterparty and liquidity provider to Mont Blanc Capital Corp. ING Group also provides support
facilities (i.e. liquidity) backing the transactions funded by the conduit. The types of asset currently in the
Mont Blanc conduit include trade receivables, consumer finance receivables, car leases and residential
mortgages.
ING Group supports the commercial paper programmes by providing Mont Blanc Capital Corp. with short-
term liquidity facilities. Once drawn these facilities bear normal credit risk.
The liquidity facilities, provided to Mont Blanc are EUR 2,268 million (2022: EUR 2,446 million). The drawn
liquidity amount is nil as at 31 December 2023 (2022: nil ).
ING Group Annual Report 2023 on Form 20-FF -335
The standby liquidity facilities are reported under irrevocable facilities. All facilities, which vary in risk profile,
are granted to the Mont Blanc Capital Corp. subject to normal ING Group credit and liquidity risk analysis
procedures. The fees received for services provided and for facilities are charged subject to market
conditions.
4. Unconsolidated Securitisation programme
In 2013 ING transferred financial assets (mortgage loans) for an amount of approximately EUR 2 billion to a
special purpose vehicle (SPV). The transaction resulted in full derecognition of the financial assets from ING’s
statement of financial position. Following this transfer ING continues to have two types of on-going
involvement in the transferred assets: as counterparty to the SPE of a non-standard interest rate swap,
which is recognized as a non-trading derivative and as servicer of the transferred assets. ING has an option
to unwind the transaction by redeeming all notes at their principal outstanding amount, in the unlikely
event of changes in accounting and/or regulatory requirements that significantly impact the transaction.
The fair value of the swap held by ING at 31 December 2023 amounted to EUR -26 million(2022: EUR
-40 million); fair value changes on this swap recognised in the statement of profit or loss in 2023 were EUR
statement of profit or loss in 2023 amounted to EUR 1 million (2022: EUR 1 million). The cumulative income
recognised in profit or loss since derecognition amounts to EUR 19 million (2022: EUR 18 million).
5. Other structured entities
In the normal course of business, ING Group enters into transactions with structured entities as
counterparty. Predominantly in its structured finance operations, ING can be instrumental in facilitating the
creation of these structured entity counterparties. These entities are generally not included in the
consolidated financial statements of ING Group, as ING facilitates these transactions as administrative agent
by providing structuring, accounting, funding, lending, and operation services.
ING Group offers various investment fund products to its clients. ING Group does not invest in these
investment funds for its own account nor acts as the fund manager.
In the normal course of business, ING Group enters into various transactions with related parties. Parties are
considered to be related if one party has the ability to control or exercise significant influence over the other
party in making financial or operating decisions. Related parties of ING Group include, among others, its
associates, joint ventures, key management personnel, and various defined benefit and contribution plans.
For post-employment benefit plans, reference is made to Note 33 'Pensions and other post-employment
benefits' Transactions between related parties include rendering or receiving of services, leases, transfers
under finance arrangements and provisions of guarantees or collateral. All transactions with related parties
took place at conditions customary in the market. There are no significant provisions for doubtful debts or
individually significant bad debt expenses recognised on outstanding balances with related parties.
Associates and joint ventures
Transactions with ING Group’s main associates and joint ventures | ||||
Associates | Joint ventures | |||
in EUR million | 2023 | 2022 | 2023 | 2022 |
Assets | ||||
Liabilities | ||||
Off-balance sheet commitments | ||||
Income received | ||||
Expenses paid | ||||
Assets, liabilities, commitments, and income related to Associates and joint ventures result from
transactions which are executed as part of the normal Banking business. Dividends received by associates
and joint ventures are included in Note 8 'Investment in associates and joint ventures'.
ING Group Annual Report 2023 on Form 20-FF -336
The Executive Board of ING Groep N.V., the Management Board Banking and the Supervisory Board are
considered Key Management personnel of ING Group. In 2023 and 2022, the three members of the
Executive Board of ING Groep N.V. were also members of the Management Board Banking.
Transactions with key management personnel, including their compensation are included in the tables
below.
Key management personnel compensation (Executive Board and Management Board Banking) | |||
2023 in EUR thousands | Executive Board of ING Groep N.V. | Management Board Banking 1 | Total |
Fixed Compensation | |||
– Base salary | |||
– Collective fixed allowances 2 | |||
– Pension costs | |||
– Severance benefits | |||
Variable compensation | |||
– Upfront cash | |||
– Upfront shares | |||
– Deferred cash | |||
– Deferred shares | |||
– Other emoluments 3 | |||
Total compensation | |||
1Excluding members of the Management Board Banking that are also members of the Executive Board of ING Groep N.V.
2The collective fixed allowances consist of two savings allowances applicable to employees in the Netherlands; an individual savings
allowance of 3.5 % and a collective savings allowance to compensate for loss of pension benefits with respect to salary in excess of
EUR 128,810 .
3This includes expatriate allowances (such as housing, school/tuition fees and international health insurances, if applicable); banking
and insurance benefits from ING (on the same terms as for other employees of ING in the Netherlands); tax and financial planning
services to ensure compliance with the relevant legislative requirements; reimbursement of costs under the Directors & Officers
indemnity provided by ING; the use of a company car or driver service.
Key management personnel compensation (Executive Board and Management Board Banking) | |||
2022 in EUR thousands | Executive Board of ING Groep N.V. | Management Board Banking 1 | Total |
Fixed Compensation | |||
– Base salary | |||
– Collective fixed allowances 2 | |||
– Pension costs | |||
– Severance benefits | |||
Variable compensation | |||
– Upfront cash | |||
– Upfront shares | |||
– Deferred cash | |||
– Deferred shares | |||
– Other emoluments 3 | |||
Total compensation | |||
1Excluding members of the Management Board Banking that are also members of the Executive Board of ING Groep N.V.
2The collective fixed allowances consist of two savings allowances applicable to employees in the Netherlands; an individual savings
allowance of 3.5 % and a collective savings allowance to compensate for loss of pension benefits with respect to salary in excess of
EUR 114,866 .
3This includes amongst others: housing, school/tuition fees, international health insurance, relocation costs and tax and financial
planning.
ING indemnifies the members of the EB against direct financial losses in connection with claims from third
parties filed, or threatened to be filed, against them by virtue of their service as a member of the EB, as far
as permitted by law, on the conditions laid down in the Articles of Association and their commission
contract. ING has taken out liability insurance for the members of the EB.
In accordance with the Articles of Association ING indemnifies the members of the Supervisory Board as far
as legally permitted against direct financial losses in connection with claims from third parties filed or
threatened to be filed against them by virtue of their service as a member of the Supervisory Board.
Key management personnel compensation is generally included in Staff expenses in the statement of profit
or loss. The total remuneration of the Executive Board and Management Board Banking is disclosed in the
table above. Under IFRS, certain components of variable remuneration are not recognised in the statement
of profit or loss directly, but are allocated over the vesting period of the award. The comparable amount
recognised in Staff expenses in 2023 relating to the fixed expenses of 2023 and the vesting of variable
remuneration of earlier performance years, is EUR 14 million in 2023 (2022: EUR 14 million).
ING Group Annual Report 2023 on Form 20-FF -337
The table below shows the total of fixed remuneration, expense allowances and attendance fees for the
Supervisory Board in 2023 and 2022.
Key management personnel compensation (Supervisory Board) | ||
in EUR thousands | 2023 | 2022 |
Total compensation | ||
Loans and advance to key management personnel
As at 31 December 2023 Loans and advances outstanding to key management personnel amounted to EUR
amounted to EUR 30 thousand (2022: EUR 62 thousand).
These loans and advances and loan commitments (1) were made in the ordinary course of business, (2)
were granted on conditions that are comparable to those of loans and advances granted to all employees
and (3) did not involve more than the normal risk of collectability or present other unfavourable features.
Loans and advances to members of the Executive Board and Management Board Banking are compliant
with the standards set out in the DNB guidelines for loans to officers and directors of a regulated entity,
such as ING.
Deposits outstanding to key management personnel
As at 31 December 2023 Deposits outstanding from key management personnel amounted to EUR 13.9
million (2022: EUR 11.5 million). Total interest paid in 2023 on these deposits amounted to EUR
ING shares held by key management personnel
Number of ING Groep N.V. shares to key management personnel | ||
ING Groep N.V. shares | ||
in numbers | 2023 | 2022 |
Executive Board members | ||
Management Board Banking | ||
Supervisory Board members | ||
Total number of shares | ||
Objectives
Group Treasury (“GT”) Balance Sheet & Capital Management, is responsible for maintaining the adequate
capitalisation of ING Group and ING Bank entities, to manage the risk associated with ING’s business
activities. This involves not only managing, planning and allocating capital within ING Group, ING Bank and
its various entities, but also helping to execute necessary capital market transactions, term (capital) funding
and risk management transactions. ING takes an integrated approach to assess the adequacy of its capital
position in relation to its risk profile and operating environment. This means GT Balance Sheet & Capital
Management takes into account both regulatory and internal, economic based metrics and requirements as
well as the interests of key stakeholders such as shareholders and rating agencies. ING manages capital
using the IFRS-EU equity position as a basis.
ING applies the following main capital definitions:
•Common equity Tier 1 capital (CET1) - is defined as shareholders’ equity less regulatory adjustments.
CET1 capital divided by risk-weighted assets equals the CET1 ratio.
•Tier 1 capital – is defined as CET1 capital plus Additional Tier 1 (hybrid) securities and other regulatory
adjustments. Tier 1 capital divided by risk-weighted assets equals the Tier 1 capital ratio.
•Total capital – is Tier 1 capital plus subordinated Tier 2 liabilities and regulatory adjustments. Total capital
divided by risk-weighted assets equals the Total capital ratio.
•CET1 ratio target – is built on the CET1 requirements specified for ING, potential increase in the regulatory
requirement of the Countercyclical Buffer, the potential impact of a standardised and pre-determined
stress scenario and general uncertainties.
•Leverage ratio (LR) – is defined as Tier 1 capital divided by the leverage exposure.
•Total Loss Absorbing Capacity (TLAC) – is Total capital plus senior unsecured bonds and amortisations.
TLAC ratios are based on both risk-weighted assets and leverage exposure.
•Minimum Required Eligible Liabilities (MREL) – is Total capital plus senior unsecured bonds and
amortisations. MREL ratios are based on both risk-weighted assets and leverage exposure.
Capital developments
ING’s capital position remained strong despite the challenging geopolitical environment. At both the
consolidated and entity level, ING has sufficient buffers to withstand various stressed scenarios.
ING’s CET1 target level of around 12.50 % is well above the prevailing Maximum Distributable Amount (MDA)
level of 10.98 %, implying a management buffer of about 150 basis points.
ING Group’s capital ratios at the end of the year increased compared to 2022 primarily due to higher net
profit after dividend reserving, coupled with lower risk-weighted assets. Besides the regular 50 % dividend
distribution, ING distributed an additional EUR 1.5 billion and EUR 2.5 billion as next steps to converge the
ING Group Annual Report 2023 on Form 20-FF -338
CET1 ratio towards ING’s CET1 target by 2025. Risk-weighted assets were mainly impacted by volume
reduction in Russia-related exposure, currency movements, improvement in book quality and model
impacts.
ING Groep N.V. has a CET1 ratio of 14.7 % at 31 December 2023 versus an overall SREP requirement
(including buffer requirements) of 10.98 %. The Group’s Tier 1 ratio increased to 16.9 %. The Total capital ratio
increased from 19.4 % to 19.8 % compared to last year.
ING Group capital position according to CRR II / CRD V | ||
in EUR million | 2023 | 2022 |
Shareholders’ equity 1 | ||
Interim profits not included in CET1 capital 2 | - | - |
- Other adjustments | - | - |
Regulatory adjustments | - | - |
Available common equity Tier 1 capital | ||
Additional Tier 1 securities 3 | ||
Regulatory adjustments additional Tier 1 | ||
Available Tier 1 capital | ||
Supplementary capital Tier 2 bonds 4 | ||
Regulatory adjustments Tier 2 | - | |
Available Total capital | ||
Risk weighted assets | ||
Common equity Tier 1 ratio | ||
Tier 1 ratio | ||
Total capital ratio | ||
1Shareholders' equity is determined in accordance with IFRS-EU.
2All T2 securities are CRR/CRD V-compliant for 2023.
In accordance with the applicable regulation, credit and operational risk models used in the capital ratios
calculations are not audited.
Distribution
ING’s distribution policy is a pay-out ratio of 50 % of resilient net profit. Resilient net profit is defined as net
profit adjusted for significant items not linked to the normal course of business. The 50% pay-out may be in
the form of cash, or a combination of cash and share repurchases, with the majority in cash. Additional
distributions to be considered periodically, taking into account alternative opportunities, macro-economic
circumstances and the outcome of our capital planning.
For 2023, the resilient net profit amounts to EUR 7,520 million (IFRS-EU net result: 7,287 million), of which
EUR 3,760 million was reserved for distribution outside of CET1 capital reflecting ING’s distribution policy of a
related to hyperinflation accounting according to IAS 29 in the consolidation of our subsidiary in Türkiye and
the impairment of the goodwill allocated to Türkiye.
Following ING’s distribution policy of a 50 % pay-out ratio on resilient net profit:
•A final dividend over 2022 of EUR 0.389 per share was paid was paid in May 2023.
•An interim dividend over 2023 of EUR 0.350 per share was paid on 14 August 2023.
•The Board has proposed to pay a final cash dividend over 2023 of EUR 0.756 per share. This is subject to
the approval by shareholders at the Annual General Meeting in April 2024.
In addition to this, ING announced an additional EUR 1.5 billion and EUR 2.5 billion distribution in 2023:
•An additional distribution of EUR 1.5 billion, by means of a share buyback programme, was announced
on 11 May 2023. Between 11 May 2023 and 13 October 2023, 121.3 million of ordinary shares have been
repurchased with a total consideration of EUR 1,566 million.
•An additional distribution of EUR 2.5 billion, by means of a share buyback programme, was announced
on 2 November 2023. Between 3 November 2023 and 5 February 2024, 194.8 million of ordinary shares
have been repurchased with a total consideration of EUR 2,508 million.
Processes for managing capital
GT Balance Sheet & Capital Management ensures adherence to ING’s solvency risk appetite statements by
planning and executing capital management transactions. The ongoing assessment and monitoring of
capital adequacy is embedded in the capital planning process as part of the ICAAP framework. As part of the
dynamic business planning process, ING prepares a capital and funding plan on a regular basis for all its
material businesses and assesses continuously the timing, need and feasibility for capital management
actions in scope of its execution strategy. Sufficient financial flexibility should be preserved to meet
important financial objectives. Risk appetite statements are at the foundation of the capital plan and are
cascaded to the different businesses in line with ING’s risk management framework. Contingency capital
measures and early warning indicators are in place in conjunction with ING’s contingency and recovery plan
to support the strategy in times of stress.
ING Group Annual Report 2023 on Form 20-FF -339
Adverse planning and stress testing, which reflect the outcome of the annual risk assessment, are integral
components of ING’s risk and capital management framework. It allows to (i) identify and assess potential
vulnerabilities in ING’s businesses, business model, portfolios or operating environment; (ii) understand the
sensitivities of the core assumptions used in ING’s strategic and capital plan; and (iii) improve decision-
making and business steering through balancing risk and return following a forward looking and prudent
management approach.
Regulatory requirements
Capital adequacy and the use of required regulatory capital are based on the guidelines developed by the
Basel Committee on Banking Supervision (The Basel Committee) and the European Union Directives, as
implemented by the Dutch Central Bank and the ECB for supervisory purposes. In 2010, the Basel Committee
issued new solvency and liquidity requirements that superseded Basel II, implemented in the EU via CRR /
CRD. In accordance with the CRR the minimum Pillar 1 capital requirements applicable to ING Group are: a
CET1 ratio of 4.5 %, a Tier 1 ratio of 6.0 % and a Total capital ratio of 8.0 % of risk-weighted assets.
The overall SREP CET1 requirement (including buffer requirements) for ING Group at a consolidated level
increased during 2023 due to changes in the Countercyclical Buffer and was 10.98 % at the end of December
2023. This requirement is the sum of a 4.5 % Pillar I requirement, a 0.98 % Pillar II requirement, a 2.5 %
Capital Conservation Buffer (CCB), a 0.50 % Countercyclical Buffer (CCyB) and a 2.5 % O-SII (Other
Systemically Important Institutions) buffer that is set separately for Dutch systemic banks by the Dutch
Central Bank (De Nederlandsche Bank). This requirement excludes the Pillar II guidance, which is not
disclosed.
The Maximum Distributable Amount (MDA) trigger level stood at 10.98 % in 4Q2023 for CET1, 12.81 % for Tier
1 Capital and 15.25 % for Total Capital. These MDA levels are in line with the application of Art.104a in CRD V,
which allows ING to partly fulfill the total Pillar II requirement (1.75 %) with Additional Tier 1 and Tier 2
capital. As per 1 January 2024, the Pillar II requirement is 1.65 %. As per 1 January 2023 a MDA requirement
on the leverage ratio of 3.5 % applies to ING Group. In the event that ING Group breaches an MDA level, ING
may face restrictions on dividend payments, coupons on AT1 securities and payment of variable
remuneration.
Ratings
ING’s credit ratings and outlook are shown in the table below. Each of these ratings reflects only the view of
the applicable rating agency at the time the rating was issued, and any explanation of the significance of a
rating may be obtained only from the rating agency.
Main credit ratings of ING at 31 December 2023 | |||
S&P | Moody’s | Fitch | |
ING Groep N.V. | |||
Issuer rating | |||
Long-term | A- | n/a | A+ |
Short-term | A-2 | n/a | F1 |
Outlook | Stable | Stable 1) | Stable |
Senior unsecured rating | A- | Baa1 | A+ |
1 Outlook refers to the senior unsecured rating.
A security rating is not a recommendation to buy, sell or hold securities and each rating should be
evaluated independently of other ratings. There is no assurance that any credit rating will remain in effect
for any given period of time or that a rating will not be lowered, suspended or withdrawn entirely by the
rating agency if, in the rating agency’s judgment, circumstances so warrant. ING accepts no responsibility
for the accuracy or reliability of the ratings.
ING Group Annual Report 2023 on Form 20-FF -340
48 Condensed financial information of the parent company
as at 31 December before appropriation of result
in EUR million | 2023 | 2022 | 2023 | 2022 | ||
Assets | Equity | |||||
Investments in group companies | Share capital | |||||
Fixed assets | Share premium | |||||
Legal and statutory reserves | - | - | ||||
Receivables from group companies 1 | Other reserves | |||||
Other assets | Unappropriated result | |||||
Current assets | Total equity | |||||
Liabilities | ||||||
Subordinated loans | ||||||
Debenture loans | ||||||
Other non-current liabilities | ||||||
Non-current liabilities | ||||||
Amounts owed to group companies | ||||||
Other liabilities | ||||||
Current liabilities | ||||||
Total assets | Total equity and liabilities |
1 Receivables from Group companies include EUR 16,330 million subordinated loans provided by ING Groep N.V. to ING Bank N.V. (2022: EUR 16,441 million).
ING Group Annual Report 2023 on Form 20-FF -341
for the years ended 31 December
in EUR million | 2023 | 2022 | 2021 |
Staff expenses | |||
Other expenses | |||
Total expenses | |||
Interest and other financial income | |||
Valuation results | - | ||
Interest and other financial expenses | - | - | - |
Net interest and other financial income | |||
Result before tax | - | ||
Taxation | |||
Result after tax | - | ||
Result from (disposal of) group companies and participating interests after taxation | |||
Net result |
ING Group Annual Report 2023 on Form 20-FF -342
in EUR million | Share capital | Share premium | Legal and statutory reserves | Other reserves | Unappropriated results | Total |
Balance as at 31 December 2022 | - | |||||
Realised and unrealised revaluations of equity securities | - | - | - | |||
Unrealised revaluations debt instruments and other revaluations | ||||||
Realised gains/losses transferred to the statement of profit or loss | ||||||
Changes in cash flow hedge reserve | ||||||
Change in fair value of own credit risk of financial liabilities at fair value through profit or loss | - | - | ||||
Realised and unrealised revaluations property in own use | ||||||
Remeasurement of the net defined benefit asset/liability | - | - | ||||
Exchange rate differences and other | - | - | ||||
Total amount recognised directly in equity | ||||||
Net result | ||||||
Total comprehensive income net of tax | ||||||
Transfer from Unappropriated result | - | |||||
Dividends and other distributions | - | - | ||||
Share buyback | - | - | - | |||
Changes in treasury shares | - | - | ||||
Employee share plans | - | - | ||||
Changes in the composition of the group and other changes | - | - | ||||
Balance as at 31 December 2023 | - |
ING Group Annual Report 2023 on Form 20-FF -343
Parent company condensed statement of changes in equity - continued
in EUR million | Share capital | Share premium | Legal and statutory reserves | Other reserves | Unappropriated results | Total |
Balance as at 31 December 2021 | ||||||
Realised and unrealised revaluations of equity securities | - | - | - | |||
Unrealised revaluations debt instruments and other revaluations | - | - | ||||
Realised gains/losses transferred to the statement of profit or loss | - | - | ||||
Changes in cash flow hedge reserve | - | - | ||||
Change in fair value of own credit risk of financial liabilities at fair value through profit or loss | ||||||
Realised and unrealised revaluations property in own use | - | - | ||||
Remeasurement of the net defined benefit asset/liability | - | - | ||||
Exchange rate differences and other | - | |||||
Total amount recognised directly in equity | - | - | - | |||
Net result | ||||||
Total comprehensive income net of tax | - | - | ||||
Transfer from Unappropriated result | - | |||||
Dividends and other cash distributions | - | - | - | |||
Share buyback programme | - | - | - | |||
Changes in treasury shares | ||||||
Employee share plans | ||||||
Changes in the composition of the group and other changes | - | - | ||||
Balance as at 31 December 2022 | - |
ING Group Annual Report 2023 on Form 20-FF -344
Parent company condensed statement of changes in equity - continued
in EUR million | Share capital | Share premium | Legal and statutory reserves | Other reserves | Unappropriated results | Total |
Balance as at 31 December 2020 | ||||||
Realised and unrealised revaluations of equity securities | - | |||||
Unrealised revaluations debt instruments and other revaluations | - | - | ||||
Realised gains/losses transferred to the statement of profit or loss | - | - | ||||
Changes in cash flow hedge reserve | - | - | ||||
Change in fair value of own credit risk of financial liabilities at fair value through profit or loss | ||||||
Realised and unrealised revaluations property in own use | - | - | ||||
Remeasurement of the net defined benefit asset/liability | ||||||
Exchange rate differences and other | ||||||
Total amount recognised directly in equity | - | - | ||||
Net result | ||||||
Total comprehensive income net of tax | - | |||||
Transfer from Unappropriated result | - | |||||
Dividends and other cash distributions | - | - | - | |||
Share buyback programme | - | - | ||||
Changes in treasury shares | - | - | ||||
Employee share plans | ||||||
Balance as at 31 December 2021 |
ING Group Annual Report 2023 on Form 20-FF -345
for the years ended 31 December
in EUR million | 2023 | 2022 | 2021 | 2023 | 2022 | 2021 | ||||
Cash flows from operating activities | Cash flows from financing activities | |||||||||
Result before tax | - | Proceeds from debt securities | ||||||||
Adjusted for: | – non-cash items in Result before tax | Repayments of debt securities | - | - | ||||||
Taxation paid | Proceeds from issuance of subordinated loans | |||||||||
Changes in: | – Net change in Loans and advances to/from banks, not available/payable on demand | - | - | - | Repayments of subordinated loans | - | - | - | ||
– Other | - | - | Purchase of treasury shares (share buyback programme) | - | - | - | ||||
Net cash flow from/(used in) operating activities | - | - | - | Dividends paid | - | - | - | |||
Other financing | ||||||||||
Cash flows from investing activities | Net cash flow from/(used in) financing activities | - | ||||||||
Disposals and redemptions: | – dividends received from group companies | |||||||||
– securities at amortised cost | Net cash flow | - | ||||||||
Net cash flow from/(used in) investing activities | ||||||||||
Cash and cash equivalents at beginning of year | ||||||||||
Effect of exchange rate changes on cash and cash equivalents | - | |||||||||
Cash and cash equivalents at end of year | ||||||||||
ING Group Annual Report 2023 on Form 20-FF -346
Subordinated loans | Debenture loans | |||
in EUR million | 2023 | 2022 | 2023 | 2022 |
Less than 1 year | ||||
1 to 2 years | ||||
2 to 3 years | ||||
3 to 4 years | ||||
4 to 5 years | ||||
Longer than 5 years | ||||
Maturity not applicable | ||||
As at 31 December 2023 ING Groep N.V. has issued USD 7,750 million (2022: USD 6,750 million) Perpetual
Additional Tier 1 Contingent Convertible Capital Securities which can, in accordance with their terms and
conditions, convert by operation of law into ordinary shares if the conditions to such a conversion are
fulfilled. As a result of this conversion, the issued share capital can increase by up to 864 million (2022: 750
million) ordinary shares. Reference is made to the ING Group Consolidated financial statements, Note 18
'Subordinated loans' and Note 19 'Equity'.
There are no subsequent events to report other than those already disclosed in Note 42 'Legal proceedings'
ING Group Annual Report 2023 on Form 20-FF -347