UNITED STATES SECURITIES AND EXCHANGE COMMISSION
WASHINGTON, D.C. 20549
FORM
(Mark One)
For the quarterly period ended
OR
For the transition period from to
Commission File Number
(Exact name of registrant as specified in its charter) |
| ||
(State or other jurisdiction of incorporation or organization) |
| (I.R.S. Employer Identification Number) |
(Address of principal executive offices) | (Zip Code) |
Registrant’s telephone number, including area code: |
(Former name, former address and former fiscal year, if changed since last report)
Securities registered pursuant to Section 12(b) of the Act:
Title of each class | Trading Symbol(s) | Name of each exchange on which registered |
Indicate by check mark whether the registrant (1) has filed all reports required to be filed by Section 13 or 15(d) of the Securities Exchange Act of 1934 during the preceding 12 months (or for such shorter period that the registrant was required to file such reports), and (2) has been subject to such filing requirements for the past 90 days.
Indicate by check mark whether the registrant has submitted electronically every Interactive Data File required to be submitted pursuant to Rule 405 of Regulation S-T (§ 232.405 of this chapter) during the preceding 12 months (or for such shorter period that the registrant was required to submit such files).
Indicate by check mark whether the registrant is a large accelerated filer, an accelerated filer, a non-accelerated filer, a smaller reporting company, or an emerging growth company. See the definitions of “large accelerated filer”, “accelerated filer”, “smaller reporting company”, and “emerging growth company” in Rule 12b-2 of the Exchange Act.
Accelerated filer ☐ | Emerging growth company | |
Non-accelerated filer ☐ | Smaller reporting company |
If an emerging growth company, indicate by check mark if the registrant has elected not to use the extended transition period for complying with any new or revised financial accounting standards provided pursuant to Section 13(a) of the Exchange Act. ☐
Indicate by check mark whether the registrant is a shell company (as defined in Rule 12b-2 of the Exchange Act). Yes
APPLICABLE ONLY TO CORPORATE ISSUERS
Indicate the number of shares outstanding of each of the issuer’s classes of common stock, as of the latest practical date. The number of shares outstanding of the issuer’s common stock as of May 7, 2024: common stock, no par value
INTERNATIONAL SEAWAYS, INC.
CONDENSED CONSOLIDATED BALANCE SHEETS
DOLLARS IN THOUSANDS
(UNAUDITED)
March 31, 2024 |
| December 31, 2023 | ||||
ASSETS | ||||||
Current Assets: | ||||||
Cash and cash equivalents | $ | | $ | | ||
Short-term investments | | | ||||
Voyage receivables, net of allowance for credit losses of $ | ||||||
including unbilled receivables of $ | | | ||||
Other receivables | | | ||||
Inventories | | | ||||
Prepaid expenses and other current assets | | | ||||
Current portion of derivative asset | | | ||||
Total Current Assets | | | ||||
Vessels and other property, less accumulated depreciation of $ | | | ||||
Vessels construction in progress | | | ||||
Deferred drydock expenditures, net | | | ||||
Operating lease right-of-use assets | | | ||||
Pool working capital deposits | | | ||||
Long-term derivative asset | | | ||||
Other assets | | | ||||
Total Assets | $ | | $ | | ||
LIABILITIES AND EQUITY | ||||||
Current Liabilities: | ||||||
Accounts payable, accrued expenses and other current liabilities | $ | | $ | | ||
Current portion of operating lease liabilities | | | ||||
Current installments of long-term debt | | | ||||
Total Current Liabilities | | | ||||
Long-term operating lease liabilities | | | ||||
Long-term debt | | | ||||
Other liabilities | | | ||||
Total Liabilities | | | ||||
Commitments and contingencies | ||||||
Equity: | ||||||
Capital - | ||||||
shares issued and outstanding | | | ||||
Retained earnings | | | ||||
| | |||||
Accumulated other comprehensive loss | ( | ( | ||||
Total Equity | | | ||||
Total Liabilities and Equity | $ | | $ | | ||
See notes to condensed consolidated financial statements
1
INTERNATIONAL SEAWAYS, INC.
CONDENSED CONSOLIDATED STATEMENTS OF OPERATIONS
DOLLARS IN THOUSANDS, EXCEPT PER SHARE AMOUNTS
(UNAUDITED)
Three Months Ended March 31, | ||||||
2024 | 2023 | |||||
Shipping Revenues: | ||||||
Pool revenues, including $ | ||||||
from companies accounted for by the equity method | $ | | $ | | ||
Time charter revenues | | | ||||
Voyage charter revenues | | | ||||
| | |||||
Operating Expenses: | ||||||
Voyage expenses | | | ||||
Vessel expenses | | | ||||
Charter hire expenses | | | ||||
Depreciation and amortization | | | ||||
General and administrative | | | ||||
Third-party debt modification fees | | | ||||
Gain on disposal of vessels and other assets, net | ( | ( | ||||
Total operating expenses | | | ||||
Income from vessel operations | | | ||||
Other income | | | ||||
Income before interest expense and income taxes | | | ||||
Interest expense | ( | ( | ||||
Income before income taxes | | | ||||
Income tax benefit | | | ||||
Net income | $ | | $ | | ||
Weighted Average Number of Common Shares Outstanding: | ||||||
Basic | | | ||||
Diluted | | | ||||
Per Share Amounts: | ||||||
Basic net income per share | $ | | $ | | ||
Diluted net income per share | $ | | $ | | ||
See notes to condensed consolidated financial statements
2
INTERNATIONAL SEAWAYS, INC.
CONDENSED CONSOLIDATED STATEMENTS OF COMPREHENSIVE INCOME
DOLLARS IN THOUSANDS
(UNAUDITED)
Three Months Ended March 31, | ||||||
2024 | 2023 | |||||
Net income | $ | | $ | | ||
Other comprehensive income/(loss), net of tax: | ||||||
Net change in unrealized income/(losses) on cash flow hedges | | ( | ||||
Defined benefit pension and other postretirement benefit plans: | ||||||
Net change in unrecognized prior service costs | | ( | ||||
Net change in unrecognized actuarial losses | | ( | ||||
Other comprehensive income/(loss), net of tax | | ( | ||||
Comprehensive income | $ | | $ | | ||
See notes to condensed consolidated financial statements
3
INTERNATIONAL SEAWAYS, INC.
CONDENSED CONSOLIDATED STATEMENTS OF CASH FLOWS
DOLLARS IN THOUSANDS
(UNAUDITED)
Three Months Ended March 31, | ||||||
2024 | 2023 | |||||
Cash Flows from Operating Activities: | ||||||
Net income | $ | | $ | | ||
Items included in net income not affecting cash flows: | ||||||
Depreciation and amortization | | | ||||
Amortization of debt discount and other deferred financing costs | | | ||||
Deferred financing costs write-off | | | ||||
Stock compensation | | | ||||
Earnings of affiliated companies | | | ||||
Other – net | ( | ( | ||||
Items included in net income related to investing and financing activities: | ||||||
Gain on disposal of vessels and other assets, net | ( | ( | ||||
Payments for drydocking | ( | ( | ||||
Insurance claims proceeds related to vessel operations | | | ||||
Changes in operating assets and liabilities: | ||||||
Decrease in receivables | | | ||||
Decrease in deferred revenue | ( | ( | ||||
Net change in inventories, prepaid expenses and other current assets, accounts | ||||||
payable, accrued expenses and other current and long-term liabilities | ( | ( | ||||
Net cash provided by operating activities | | | ||||
Cash Flows from Investing Activities: | ||||||
Expenditures for vessels, vessel improvements and vessels under construction, including deposits for acquisitions | ( | ( | ||||
Proceeds from disposal of vessels and other property, net | | | ||||
Expenditures for other property | ( | ( | ||||
Investments in short-term time deposits | ( | ( | ||||
Proceeds from maturities of short-term time deposits | | | ||||
Pool working capital deposits | ( | | ||||
Net cash used in investing activities | ( | ( | ||||
Cash Flows from Financing Activities: | ||||||
Repayments of debt | ( | ( | ||||
Proceeds from sale and leaseback financing, net of issuance and deferred financing costs | | | ||||
Payments on sale and leaseback financing and finance lease | ( | ( | ||||
Payments of deferred financing costs | ( | ( | ||||
Cash dividends paid | ( | ( | ||||
Cash paid to tax authority upon vesting or exercise of stock-based compensation | ( | ( | ||||
Net cash used in financing activities | ( | ( | ||||
Net increase/(decrease) in cash and cash equivalents | | ( | ||||
Cash and cash equivalents at beginning of year | | | ||||
Cash and cash equivalents at end of period | $ | | $ | | ||
See notes to condensed consolidated financial statements
4
INTERNATIONAL SEAWAYS, INC.
CONDENSED CONSOLIDATED STATEMENTS OF CHANGES IN EQUITY
DOLLARS IN THOUSANDS
(UNAUDITED)
Retained | Accumulated | |||||||||||
Earnings / | Other | |||||||||||
(Accumulated | Comprehensive | |||||||||||
Capital | Deficit) | Income/(loss) | Total | |||||||||
For the three months ended | ||||||||||||
Balance at January 1, 2024 | $ | | $ | | $ | ( | $ | | ||||
Net income | | | | | ||||||||
Other comprehensive income | | | | | ||||||||
Dividends declared | | ( | | ( | ||||||||
Forfeitures of vested restricted stock awards and exercised stock options | ( | | | ( | ||||||||
Compensation relating to restricted stock awards | | | | | ||||||||
Compensation relating to restricted stock units awards | | | | | ||||||||
Compensation relating to stock option awards | | | | | ||||||||
Balance at March 31, 2024 | $ | | $ | | $ | ( | $ | | ||||
Balance at January 1, 2023 | $ | | $ | ( | $ | | $ | | ||||
Net income | | | | | ||||||||
Other comprehensive loss | | | ( | ( | ||||||||
Dividends declared | | ( | | ( | ||||||||
Forfeitures of vested restricted stock awards and exercised stock options | ( | | | ( | ||||||||
Compensation relating to restricted stock awards | | | | | ||||||||
Compensation relating to restricted stock units awards | | | | | ||||||||
Compensation relating to stock option awards | | | | | ||||||||
Balance at March 31, 2023 | $ | | $ | | $ | | $ | | ||||
See notes to condensed consolidated financial statements
5
INTERNATIONAL SEAWAYS, INC.
NOTES TO CONDENSED CONSOLIDATED FINANCIAL STATEMENTS
(UNAUDITED)
Note 1 — Basis of Presentation:
The accompanying unaudited condensed consolidated financial statements include the accounts of International Seaways, Inc. (“INSW”), a Marshall Islands corporation, and its wholly owned subsidiaries. Unless the context indicates otherwise, references to “INSW”, the “Company”, “we”, “us” or “our”, refer to International Seaways, Inc. and its subsidiaries. As of March 31, 2024, the Company’s operating fleet consisted of
The accompanying unaudited condensed consolidated financial statements have been prepared in accordance with generally accepted accounting principles for interim financial information and with the instructions to Form 10-Q and Article 10 of Regulation S-X. They do not include all of the information and notes required by generally accepted accounting principles in the United States. In the opinion of management, all adjustments (consisting of normal recurring accruals) considered necessary for a fair presentation of the results have been included. Operating results for the three months ended March 31, 2024 are not necessarily indicative of the results that may be expected for the year ending December 31, 2024.
The condensed consolidated balance sheet as of December 31, 2023 has been derived from the audited financial statements at that date but does not include all of the information and notes required by generally accepted accounting principles in the United States for complete financial statements. For further information, refer to the consolidated financial statements and notes thereto included in the Company’s Annual Report on Form 10-K for the year ended December 31, 2023.
All intercompany balances and transactions within INSW have been eliminated. Investments in 50% or less owned affiliated companies, in which INSW exercises significant influence, are accounted for by the equity method.
Note 2 — Significant Accounting Policies:
For a description of all of the Company’s material accounting policies, see Note 2, “Summary of Significant Accounting Policies,” to the Company’s consolidated financial statements as of and for the year ended December 31, 2023 included in the Company’s Annual Report on Form 10-K. The following is a summary of any changes or updates to the Company’s critical accounting policies for the current period:
Concentration of Credit Risk — The allowance for credit losses is recognized as an allowance or contra-asset and reflects our best estimate of probable losses inherent in the voyage receivables balance. Activity for allowance for credit losses is summarized as follows:
(Dollars in thousands) | Allowance for Credit Losses - | ||
Balance at December 31, 2023 | $ | | |
Provision for expected credit losses | | ||
Balance at March 31, 2024 | $ | |
During the three months ended March 31, 2024 and 2023, the Company did not have any individual customers who accounted for 10% or more of its revenues apart from the pools in which it participates. The pools in which the Company participates accounted in aggregate for
6
INTERNATIONAL SEAWAYS, INC.
NOTES TO CONDENSED CONSOLIDATED FINANCIAL STATEMENTS
(UNAUDITED)
Deferred finance charges — Finance charges, excluding original issue discount, incurred in the arrangement of new debt and/or amendments resulting in the modification of existing debt are deferred and amortized to interest expense on either an effective interest method or straight-line basis over the term of the related debt. Unamortized deferred finance charges of $
Interest expense relating to the amortization of deferred financing charges amounted to $
Vessels construction in progress — Interest costs are capitalized to vessels during the period that vessels are under construction. Interest capitalized totaled $
Recently Issued Accounting Standards — The Financial Accounting Standards Board (“FASB”) Accounting Standards Codification is the sole source of authoritative GAAP other than United States Securities and Exchange Commission (“SEC”) issued rules and regulations that apply only to SEC registrants. The FASB issues Accounting Standards Updates (“ASU”) to communicate changes to the codification.
In November 2023, the FASB issued ASU No. 2023-07, Improvements to Reportable Segment Disclosures. This guidance is expected to improve financial reporting by providing additional information about a public company’s significant segment expenses and more timely and detailed segment information reporting throughout the fiscal year. This guidance requires annual and interim period disclosure of significant segment expenses that are provided to the chief operating decision maker (“CODM”) as well as interim disclosures for all reportable segments’ profit or loss. It also requires disclosure of the title and position of the CODM and an explanation of how the CODM uses the reported measures of segment profit or loss in assessing segment performance and deciding how to allocate resources. The amendments in ASU 2023-07 are effective for all public entities for fiscal years beginning after December 15, 2023, and interim periods within fiscal years beginning after December 15, 2024 and will apply retrospectively to all prior periods presented in the financial statements. We are currently evaluating the impact of the new guidance on the disclosures to our consolidated financial statements.
Note 3 — Earnings per Common Share:
Basic earnings per common share is computed by dividing earnings, after the deduction of dividends and undistributed earnings allocated to participating securities, by the weighted average number of common shares outstanding during the period.
The computation of diluted earnings per share assumes the issuance of common stock for all potentially dilutive stock options and restricted stock units not classified as participating securities. Participating securities are defined by ASC 260, Earnings Per Share, as unvested share-based payment awards that contain non-forfeitable rights to dividends or dividend equivalents and are included in the computation of earnings per share pursuant to the two-class method.
Weighted average shares of unvested restricted common stock considered to be participating securities totaled
7
INTERNATIONAL SEAWAYS, INC.
NOTES TO CONDENSED CONSOLIDATED FINANCIAL STATEMENTS
(UNAUDITED)
Reconciliations of the numerator of the basic and diluted earnings per share computations are as follows:
Three Months Ended March 31, | ||||||
(Dollars in thousands) | 2024 | 2023 | ||||
Net income allocated to: | ||||||
Common Stockholders | $ | | $ | | ||
Participating securities | | | ||||
$ | | $ | | |||
For the three months ended March 31, 2024 and 2023 earnings per share calculations, there were
Note 4 — Business and Segment Reporting:
The Company has
Information about the Company’s reportable segments as of and for the three months ended March 31, 2024 and 2023 follows:
Crude | Product | |||||||||||
(Dollars in thousands) | Tankers | Carriers | Other | Totals | ||||||||
Three months ended March 31, 2024: | ||||||||||||
Shipping revenues | $ | | $ | | $ | | $ | | ||||
Time charter equivalent revenues | | | | | ||||||||
Depreciation and amortization | | | | | ||||||||
Gain on disposal of vessels and other assets, net | ( | ( | | ( | ||||||||
Adjusted income from vessel operations | | | | | ||||||||
Adjusted total assets at March 31, 2024 | | | | | ||||||||
Expenditures for vessels and vessel improvements | | | | | ||||||||
Payments for drydocking | | | | | ||||||||
Three months ended March 31, 2023: | ||||||||||||
Shipping revenues | $ | | $ | | $ | | $ | | ||||
Time charter equivalent revenues | | | | | ||||||||
Depreciation and amortization | | | | | ||||||||
Gain on disposal of vessels and other assets, net | | ( | | ( | ||||||||
Adjusted income/(loss) from vessel operations | | | ( | | ||||||||
Adjusted total assets at March 31, 2023 | | | | | ||||||||
Expenditures for vessels and vessel improvements | | | | | ||||||||
Payments for drydocking | | | | | ||||||||
8
INTERNATIONAL SEAWAYS, INC.
NOTES TO CONDENSED CONSOLIDATED FINANCIAL STATEMENTS
(UNAUDITED)
Reconciliations of time charter equivalent (“TCE”) revenues of the segments to shipping revenues as reported in the condensed statements of operations follow:
Three Months Ended March 31, | ||||||
(Dollars in thousands) | 2024 | 2023 | ||||
Time charter equivalent revenues | $ | | $ | | ||
Add: Voyage expenses | | | ||||
Shipping revenues | $ | | $ | | ||
Consistent with general practice in the shipping industry, the Company uses time charter equivalent revenues, which represent shipping revenues less voyage expenses, as a measure to compare revenue generated from a voyage charter to revenue generated from a time charter. Time charter equivalent revenues, a non-GAAP measure, provide additional meaningful information in conjunction with shipping revenues, the most directly comparable GAAP measure, because it assists Company management in making decisions regarding the deployment and use of its vessels and in evaluating their financial performance.
Reconciliations of total adjusted income from vessel operations of the segments to income before income taxes, as reported in the condensed consolidated statements of operations follow:
Three Months Ended March 31, | ||||||
(Dollars in thousands) | 2024 | 2023 | ||||
Total adjusted income from vessel operations of all segments | $ | | $ | | ||
General and administrative expenses | ( | ( | ||||
Third-party debt modification fees | | ( | ||||
Gain on disposal of vessels and other assets, net | | | ||||
Consolidated income from vessel operations | | | ||||
Other income | | | ||||
Interest expense | ( | ( | ||||
Income before income taxes | $ | | $ | | ||
Reconciliations of total assets of the segments to amounts included in the condensed consolidated balance sheets follow:
(Dollars in thousands) | March 31, 2024 | March 31, 2023 | ||||
Adjusted total assets of all segments | $ | | $ | | ||
Corporate unrestricted cash and cash equivalents | | | ||||
Restricted cash | | | ||||
Short-term investments | | | ||||
Other unallocated amounts | | | ||||
Consolidated total assets | $ | | $ | | ||
Note 5 — Vessels:
Impairment of Vessels and Other Property
During the three months ended March 31, 2024, the Company gave consideration as to whether events or changes in circumstances had occurred since December 31, 2023, that could indicate that the carrying amounts of the vessels in the Company’s fleet may not be recoverable. The Company determined that no held-for-sale or held-for-use impairment indicators existed for the Company’s vessels as of March 31, 2024.
9
INTERNATIONAL SEAWAYS, INC.
NOTES TO CONDENSED CONSOLIDATED FINANCIAL STATEMENTS
(UNAUDITED)
Vessel Acquisitions and Construction Commitments
On February 23, 2024, the Company entered into agreements to acquire
In March 2024 the Company declared options to build
Disposal/Sales of Vessels
On March 18, 2024, the Company entered into a memorandum of agreement for the sale of 2009-built MR Product Carrier for net proceeds of approximately $
During the quarter ended March 31, 2023, the Company delivered a 2008-built MR to the buyer and recognized a gain of $
Note 6 — Variable Interest Entities (“VIEs”):
Unconsolidated VIEs
As of March 31, 2024, all of the
The following table presents the carrying amounts of assets and liabilities in the condensed consolidated balance sheet related to the unconsolidated VIEs as of March 31, 2024:
(Dollars in thousands) | Condensed | |||||
Pool working capital deposits | $ | | ||||
In accordance with accounting guidance, the Company evaluated its maximum exposure to loss related to these unconsolidated VIEs by assuming a complete loss of the Company’s investment in these VIEs. The table below compares the Company’s liability in the condensed consolidated balance sheet to the maximum exposure to loss at March 31, 2024:
(Dollars in thousands) | Condensed | Maximum Exposure to | ||||
Other Liabilities | $ | – | $ | | ||
10
INTERNATIONAL SEAWAYS, INC.
NOTES TO CONDENSED CONSOLIDATED FINANCIAL STATEMENTS
(UNAUDITED)
In addition, as of March 31, 2024, the Company had approximately $
Note 7 — Fair Value of Financial Instruments, Derivatives and Fair Value Disclosures:
The estimated fair values of the Company’s financial instruments, other than derivatives that are not measured at fair value on a recurring basis, categorized based upon the fair value hierarchy, are as follows:
(Dollars in thousands) | March 31, 2024 | December 31, 2023 | Fair Value Level | ||||||
Cash and cash equivalents | $ | | $ | | Level 1 | ||||
Short-term investments (1) | | | Level 1 | ||||||
$750 Million Facility Term Loan (2) | ( | ( | Level 2 | ||||||
ING Credit Facility (2) | ( | ( | Level 2 | ||||||
Ocean Yield Lease Financing (2) | ( | ( | Level 2 | ||||||
BoComm Lease Financing (3) | ( | ( | Level 2 | ||||||
Toshin Lease Financing (3) | ( | ( | Level 2 | ||||||
Hyuga Lease Financing (3) | ( | ( | Level 2 | ||||||
Kaiyo Lease Financing (3) | ( | ( | Level 2 | ||||||
Kaisha Lease Financing (3) | ( | ( | Level 2 | ||||||
| (1) | Short-term investments consist of time deposits with original maturities of between 91 and 180 days. |
| (2) | Floating rate debt – the fair value of floating rate debt has been determined using level 2 inputs and is considered to be equal to the carrying value since it bears a variable interest rate, which is reset every three months. |
| (3) | Fixed rate debt – the fair value of fixed rate debt has been determined using level 2 inputs by discounting the expected cash flows of the outstanding debt. |
Derivatives
At March 31, 2024, the Company was party to amortizing interest rate swap agreements with major financial institutions participating in the $
11
INTERNATIONAL SEAWAYS, INC.
NOTES TO CONDENSED CONSOLIDATED FINANCIAL STATEMENTS
(UNAUDITED)
Derivatives are recorded on a net basis by counterparty when a legal right of offset exists. The Company had the following amounts recorded on a net basis by transaction in the accompanying unaudited condensed consolidated balance sheets related to the Company’s use of derivatives as of March 31, 2024 and December 31, 2023:
(Dollars in thousands) | Current portion of derivative asset | Long-term derivative | Other | ||||||
March 31, 2024: | |||||||||
Derivatives designated as hedging instruments: | |||||||||
Interest rate swaps | $ | | $ | | $ | | |||
Total | $ | | $ | | $ | | |||
December 31, 2023: | |||||||||
Derivatives designated as hedging instruments: | |||||||||
Interest rate swaps | $ | | $ | | $ | | |||
Total | $ | | $ | | $ | | |||
The following tables present information with respect to gains and losses on derivative positions reflected in the condensed consolidated statements of operations or in the condensed consolidated statements of comprehensive income.
The effect of cash flow hedging relationships recognized in other comprehensive income excluding amounts reclassified from accumulated other comprehensive income/(loss) for the three months ended March 31, 2024 and 2023 follows:
Three Months Ended March 31, | ||||||
(Dollars in thousands) | 2024 | 2023 | ||||
Derivatives designated as hedging instruments: | ||||||
Interest rate swaps | $ | | $ | ( | ||
Total other comprehensive income/(loss) | $ | | $ | ( | ||
The effect of the Company’s cash flow hedging relationships on the condensed consolidated statement of operations for the three months ended March 31, 2024 and 2023 follows:
Three Months Ended March 31, | ||||||
(Dollars in thousands) | 2024 | 2023 | ||||
Derivatives designated as hedging instruments: | ||||||
Interest rate swaps | $ | ( | $ | ( | ||
Discontinued hedging instruments: | ||||||
Interest rate swap | ( | ( | ||||
Total interest expense | $ | ( | $ | ( | ||
See Note 11, “Accumulated Other Comprehensive Income,” for disclosures relating to the impact of derivative instruments on accumulated other comprehensive income/(loss).
12
INTERNATIONAL SEAWAYS, INC.
NOTES TO CONDENSED CONSOLIDATED FINANCIAL STATEMENTS
(UNAUDITED)
The following table presents the fair values, which are pre-tax, for assets and liabilities measured on a recurring basis:
(Dollars in thousands) | March 31, 2024 | December 31, 2023 | Fair Value Level | ||||||
Derivative Assets (interest rate swaps) | $ | | $ | | Level 2(1) | ||||
| (1) | For the interest rate swaps, fair values are derived using valuation models that utilize the income valuation approach. These valuation models take into account contract terms such as maturity, as well as other inputs such as interest rate yield curves and creditworthiness of the counterparty and the Company. |
Note 8 — Debt:
Debt consists of the following:
(Dollars in thousands) | March 31, 2024 |
| December 31, 2023 | |||
$750 Million Facility Term Loan, due 2027, net of unamortized deferred finance costs of $ | $ | | $ | | ||
ING Credit Facility, due 2026, net of unamortized deferred finance costs of $ | | | ||||
Ocean Yield Lease Financing, due 2031, net of unamortized deferred finance costs of $ | | | ||||
BoComm Lease Financing, due 2030, net of unamortized deferred finance costs of $ | | | ||||
Toshin Lease Financing, due 2031, net of unamortized deferred finance costs of $ | | | ||||
Hyuga Lease Financing, due 2031, net of unamortized deferred finance costs of $ | | | ||||
Kaiyo Lease Financing, due 2030, net of unamortized deferred finance costs of $ | | | ||||
Kaisha Lease Financing, due 2030, net of unamortized deferred finance costs of $ | | | ||||
| | |||||
Less current portion | ( | ( | ||||
Long-term portion | $ | | $ | | ||
Capitalized terms used hereafter have the meaning given in these condensed consolidated financial statements or in the respective transaction documents referred to below, including subsequent amendments thereto.
ING Credit Facility
On April 18, 2024, the Company prepaid the outstanding principal balance of $
$750 Million Credit Facility
On April 26, 2024, the Company, International Seaways Operating Corporation (the “Borrower”) and certain of their subsidiaries entered into a second amendment that amended and extended the $
Immediately prior to the closing of the second amendment, the $
13
INTERNATIONAL SEAWAYS, INC.
NOTES TO CONDENSED CONSOLIDATED FINANCIAL STATEMENTS
(UNAUDITED)
(the “$
The $
Debt Covenants
Interest Expense
Total interest expense before the impact of capitalized interest, including amortization of issuance and deferred financing costs, commitment, administrative and other fees for all of the Company’s debt facilities for the three months ended March 31, 2024 and 2023 was $
Note 9 — Taxes:
As of March 31, 2024, the Company believes it will qualify for an exemption from U.S. federal income taxes under Section 883 of the U.S. Internal Revenue Code of 1986, as amended (the “Code”) and U.S. Treasury Department regulations for the 2024 calendar year, so long as less than 50 percent of the total value of the Company’s stock is held by one or more shareholders who own 5% or more of the Company’s stock for more than half of the days of 2024.
The Company reviews its provisions for uncertain tax positions relating to freight taxes in various tax jurisdictions on a regular basis and may update its assessment of its tax positions based on available information at that time. Such information may include additional legal advice as to the applicability of freight taxes in relevant jurisdictions. Freight tax regulations are subject to change and interpretation; therefore, the amounts recorded by the Company may change accordingly. There were no changes in such reserve recorded during the three months ended March 31, 2024 and 2023.
Additionally, a number of countries, including some in which certain of the Company’s subsidiaries are domiciled, have drafted or are actively considering drafting legislation to implement the Organization for Economic Cooperation and Development's (“OECD”) international tax framework, including the Pillar Two Model Rules. These model rules call for a minimum global tax of 15% on large
14
INTERNATIONAL SEAWAYS, INC.
NOTES TO CONDENSED CONSOLIDATED FINANCIAL STATEMENTS
(UNAUDITED)
multinational enterprises with possible application from January 1, 2024 or later, depending on implementation by the individual countries in which the Company is domiciled. As currently enacted, the Pillar Two Model Rules have no impact on the Company’s consolidated financial statements in 2024, however, the Company is monitoring these developments and evaluating the necessary steps it can take to minimize the impact, if any, to the Company’s consolidated financial statements and operations going forward.
Note 10 — Capital Stock and Stock Compensation:
The Company accounts for stock-based compensation expense in accordance with the fair value method required by ASC 718, Compensation – Stock Compensation. Such fair value method requires share-based payment transactions to be measured according to the fair value of the equity instruments issued.
Director Compensation – Restricted Common Stock
On February 19, 2024, Mr. Nadim Qureshi resigned from the Board of Directors of the Company. Mr. Qureshi’s resignation was not the result of any disagreement with the Company or the Board on any matter relating to the Company’s operations, policies or practices. In connection with his resignation, the Board approved the accelerated vesting of the
Management Compensation
Stock Options
There were
Restricted Stock Units
During the three months ended March 31, 2024, the Company granted
During the three months ended March 31, 2024, the Company also granted
Dividends
15
INTERNATIONAL SEAWAYS, INC.
NOTES TO CONDENSED CONSOLIDATED FINANCIAL STATEMENTS
(UNAUDITED)
On
On
Share Repurchases
In connection with the settlement of vested restricted stock units and the exercise of stock options, the Company repurchased
Note 11 — Accumulated Other Comprehensive Income:
The components of accumulated other comprehensive loss, net of related taxes, in the condensed consolidated balance sheets follow:
(Dollars in thousands) | March 31, 2024 |
| December 31, 2023 | |||
Unrealized gains on derivative instruments | $ | | $ | | ||
Items not yet recognized as a component of net periodic benefit cost (pension plans) | ( | ( | ||||
| $ | ( | $ | ( | ||
The changes in the balances of each component of accumulated other comprehensive income/(loss), net of related taxes, during the three months ended March 31, 2024 and 2023 follow:
(Dollars in thousands) | Unrealized gains on cash flow hedges | Items not yet recognized as a component of net periodic benefit cost | Total | ||||||
Balance as of December 31, 2023 | $ | | $ | ( | $ | ( | |||
Current period change, excluding amounts reclassified | |||||||||
from accumulated other comprehensive loss | | | | ||||||
Amounts reclassified from accumulated other comprehensive loss | ( | — | ( | ||||||
Balance as of March 31, 2024 | $ | | $ | ( | $ | ( | |||
Balance as of December 31, 2022 | $ | | ( | | |||||
Current period change, excluding amounts reclassified | |||||||||
from accumulated other comprehensive income | ( | ( | ( | ||||||
Amounts reclassified from accumulated other comprehensive income | ( | — | ( | ||||||
Balance as of March 31, 2023 | $ | | $ | ( | $ | | |||
16
INTERNATIONAL SEAWAYS, INC.
NOTES TO CONDENSED CONSOLIDATED FINANCIAL STATEMENTS
(UNAUDITED)
Amounts reclassified out of each component of accumulated other comprehensive income/(loss) follow:
Three Months Ended March 31, | ||||||||
(Dollars in thousands) | 2024 | 2023 | Statement of Operations | |||||
Reclassifications of gains on cash flow hedges: | ||||||||
Interest rate swaps entered into by the Company's subsidiaries | ( | ( | Interest expense | |||||
Reclassifications of losses on discontinued hedging instruments | ||||||||
Interest rate swap entered into by the Company's subsidiaries | ( | ( | Interest expense | |||||
Total before and net of tax | $ | ( | $ | ( | ||||
At March 31, 2024, the Company expects that it will reclassify $
See Note 7, “Fair Value of Financial Instruments, Derivatives and Fair Value Disclosures,” for additional disclosures relating to derivative instruments.
Note 12 — Revenue:
Revenue Recognition
The majority of the Company’s contracts for pool revenues, time charter revenues, and voyage charter revenues are accounted for as lease revenue under ASC 842. The Company’s contracts with pools are short term which are cancellable with up to
Lightering services provided by the Company’s Crude Tanker Lightering Business, and voyage charter contracts that do not meet the definition of a lease are accounted for as service revenues under ASC 606. In accordance with ASC 606, revenue is recognized when a customer obtains control of or consumes promised services. The amount of revenue recognized reflects the consideration to which the Company expects to be entitled to receive in exchange for these services.
17
INTERNATIONAL SEAWAYS, INC.
NOTES TO CONDENSED CONSOLIDATED FINANCIAL STATEMENTS
(UNAUDITED)
The following tables present the Company’s revenues from leases accounted for under ASC 842 and revenues from services accounted for under ASC 606 for the three months ended March 31, 2024 and 2023:
Crude | Product | ||||||||
(Dollars in thousands) | Tankers | Carriers | Totals | ||||||
Three months ended March 31, 2024: | |||||||||
Revenues from leases | |||||||||
$ | | $ | | $ | | ||||
| | | |||||||
Voyage charter revenues from non-variable lease payments | | | | ||||||
Revenues from services | |||||||||
Voyage charter revenues from lightering services | | — | | ||||||
Total shipping revenues | $ | | $ | | $ | | |||
Three months ended March 31, 2023: | |||||||||
Revenues from leases | |||||||||
$ | | $ | | $ | | ||||
| | | |||||||
Voyage charter revenues from non-variable lease payments | | | | ||||||
Voyage charter revenues from variable lease payments | – | | | ||||||
Revenues from services | |||||||||
Voyage charter revenues from lightering services | | — | | ||||||
Total shipping revenues | $ | | $ | | $ | | |||
Contract Balances
The following table provides information about receivables, contract assets and contract liabilities from contracts with customers, and significant changes in contract assets and liabilities balances, associated with revenue from services accounted for under ASC 606. Balances related to revenues from leases accounted for under ASC 842 are excluded from the table below.
(Dollars in thousands) | Voyage receivables - Billed receivables | Contract assets (Unbilled voyage receivables) | Contract liabilities (Deferred revenues and off hires) | ||||||
Opening balance as of January 1, 2024 | $ | | $ | | $ | | |||
Closing balance as of March 31, 2024 | | | | ||||||
We receive payments from customers based on the schedule established in our contracts. Contract assets relate to our conditional right to consideration for our completed performance obligations under contracts and decrease when the right to consideration becomes unconditional or payments are received. Contract liabilities include payments received in advance of performance under contracts and are recognized when performance under the respective contract has been completed. Deferred revenues allocated to unsatisfied performance obligations will be recognized over time as the services are performed.
Performance Obligations
All of the Company’s performance obligations are generally transferred to customers over time. The expected duration of services is less than one year. There were no material adjustments in revenues from performance obligations satisfied in previous periods recognized during the three months ended March 31, 2024 and 2023.
Costs to Obtain or Fulfill a Contract
As of March 31, 2024, there were
18
INTERNATIONAL SEAWAYS, INC.
NOTES TO CONDENSED CONSOLIDATED FINANCIAL STATEMENTS
(UNAUDITED)
European Union’s Emissions Trading System
Commencing January 1, 2024, the European Union’s Emissions Trading System (“EU ETS”) was extended to cover Carbon dioxide (“CO2”) emissions from ships over 5,000 gross tons entering EU ports. The EU ETS covers (a) 50% of emissions from voyages either starting in or ending in an EU port, and (b) 100% of emissions from voyages between two EU ports or emissions generated while a ship is within an EU port.
Shipping companies will have to surrender EU ETS emissions allowances (“EUA”) for each ton of reported CO2 emissions in the scope of the EU ETS. There is a phase-in period for the regulations, as allowances will have to be submitted for 40% of 2024 emissions, 70% of 2025 emissions and 100% of emissions for 2026 and subsequent years. Beginning in 2026, the scope of the EU ETS will also be expanded to include Methane (“CH4”) and Nitrus oxide (“N2O”).
EUAs are valued based upon a market approach utilizing prices published on an EUA market index. The value of the EUAs to be provided to the Company pursuant to the terms of its agreements with the charterers of its vessels and the commercial pools in which it participates is included in shipping revenues in the condensed consolidated statements of operations. The value of the EUA obligations incurred by the Company under the EU ETS while its vessels are on-hire is included in voyage expenses, or in vessel expenses while its vessels are off-hire, in the condensed consolidated statements of operations.
EUAs held by the Company are intended to be used to settle its EUA obligations and are accounted for as intangible assets. The Company did not hold any EUAs as of March 31, 2024. EUAs relating to 2024 emissions are required to be surrendered to the EU authorities in September 2025.
The following table presents the components of the non-cash revenues and expenses recognized for EUAs earned and incurred during the three months ended March 31, 2024:
(Dollars in thousands) | |||
Pool revenues | $ | | |
Time charter revenues | | ||
Total shipping revenues | $ | | |
Voyage expenses | $ | | |
The value of EUAs due to the Company from its charterers or commercial pools in which it participates, and the value of the EUAs the Company is obligated to surrender to the EU authorities is $
Note 13 — Leases:
As permitted under ASC 842, the Company has elected not to apply the provisions of ASC 842 to short term leases, which include: (i) tanker vessels chartered-in where the duration of the charter was one year or less at inception; (ii) workboats employed in the Crude Tankers Lightering business which have a lease term of 12-months or less; and (iii) short term leases of office and other space.
19
INTERNATIONAL SEAWAYS, INC.
NOTES TO CONDENSED CONSOLIDATED FINANCIAL STATEMENTS
(UNAUDITED)
Contracts under which the Company is a Lessee
The Company currently has
Three Months Ended March 31, | ||||||
(Dollars in thousands) | 2024 | 2023 | ||||
Operating lease cost | ||||||
Vessel assets | ||||||
Charter hire expenses | $ | | $ | | ||
Finance lease cost | ||||||
Vessel assets | ||||||
Amortization of right-of-use assets | | | ||||
Interest on lease liabilities | | | ||||
Office and other space | ||||||
General and administrative | | | ||||
Voyage expenses | | | ||||
Short-term lease cost | ||||||
Vessel assets (1) | ||||||
Charter hire expenses | | | ||||
Total lease cost | $ | | $ | | ||
| (1) | Excludes vessels spot chartered-in under operating leases and employed in the Crude Tankers Lightering business for periods of less than |
Supplemental cash flow information related to leases was as follows:
Three Months Ended March 31, | ||||||
(Dollars in thousands) | 2024 | 2023 | ||||
Cash paid for amounts included in the measurement of lease liabilities | ||||||
Operating cash flows used for operating leases | $ | | $ | | ||
Finance cash flows used for finance leases | | | ||||
Supplemental balance sheet information related to leases was as follows:
(Dollars in thousands) | March 31, 2024 | December 31, 2023 | ||||
Operating lease right-of-use assets | $ | | $ | | ||
Current portion of operating lease liabilities | $ | ( | $ | ( | ||
Long-term operating lease liabilities | ( | ( | ||||
Total operating and finance lease liabilities | $ | ( | $ | ( | ||
Weighted average remaining lease term - operating leases | ||||||
Weighted average discount rate - operating leases | ||||||
20
INTERNATIONAL SEAWAYS, INC.
NOTES TO CONDENSED CONSOLIDATED FINANCIAL STATEMENTS
(UNAUDITED)
1. Charters-in of vessel assets:
As of March 31, 2024, the Company has a commitment to time charter-in one LR1 through to June 2025. The minimum lease liabilities and related number of operating days under this operating lease as of March 31, 2024 are as follows:
(Dollars in thousands) | Amount | Operating Days | |||
2024 | $ | | |||
2025 | | ||||
Total lease payments (lease component only) | | ||||
less imputed interest | ( | ||||
Total operating lease liabilities | $ | | |||
2. Office and other space:
The Company has operating leases for offices and a lightering workboat dock space. These leases have expiry dates ranging from December 2024 to May 2033. The lease for the workboat dock space contains renewal options executable by the Company for periods through December 2027. We have determined that the options through December 2024 are reasonably certain to be executed by the Company, and accordingly the options are included in the lease liability and right of use asset calculations for such lease.
Payments of lease liabilities for office and other space as of March 31, 2024 are as follows:
(Dollars in thousands) | Amount | ||
2024 | $ | | |
2025 | | ||
2026 | | ||
2027 | | ||
2028 | | ||
Thereafter | | ||
Total lease payments | | ||
less imputed interest | ( | ||
Total operating lease liabilities | $ | |
Contracts under which the Company is a Lessor
See Note 12, “Revenue,” for discussion on the Company’s revenues from operating leases accounted for under ASC 842.
The future minimum contracted revenues, before the deduction of brokerage commissions, expected to be received on non-cancelable time charters for
(Dollars in thousands) | Amount | Revenue Days | |||
2024 | $ | | |||
2025 | | ||||
2026 | | ||||
2027 | | ||||
2028 | | ||||
Thereafter | | ||||
Future minimum revenues | $ | | |||
21
INTERNATIONAL SEAWAYS, INC.
NOTES TO CONDENSED CONSOLIDATED FINANCIAL STATEMENTS
(UNAUDITED)
Future minimum contracted revenues do not include the Company’s share of time charters entered into by the pools in which it participates or profit-sharing above the base rate on the newbuild dual-fuel LNG VLCCs. Revenues from a time charter are not generally received when a vessel is off-hire, including time required for normal periodic maintenance of the vessel. In arriving at the minimum future charter revenues, an estimated time off-hire to perform periodic maintenance on each vessel has been deducted, although there is no assurance that such estimate will be reflective of the actual off-hire in the future.
In April 2024, the Company entered into non-cancelable time charter agreements with durations ranging from
Note 14 — Contingencies:
INSW’s policy for recording legal costs related to contingencies is to expense such legal costs as incurred.
Multi-Employer Plans
The Merchant Navy Officers Pension Fund (“MNOPF”) is a multi-employer defined benefit pension plan covering British crew members that served as officers on board INSW’s vessels (as well as vessels of other owners). The trustees of the plan have indicated that, under the terms of the High Court ruling in 2005, which established the liability of past employers to fund the deficit on the Post 1978 section of MNOPF, calls for further contributions may be required if additional actuarial deficits arise or if other employers liable for contributions are not able to pay their share in the future. As the amount of any such assessment cannot be reasonably estimated,
The Merchant Navy Ratings Pension Fund (“MNRPF”) is a multi-employer defined benefit pension plan covering British crew members that served as ratings (seamen) on board INSW’s vessels (as well as vessels of other owners) more than
Spin-Off Related Agreements
On November 30, 2016, INSW was spun off from OSG as a separate publicly traded company. In connection with the spin-off, INSW and OSG entered into several agreements, including a separation and distribution agreement, an employee matters agreement and a transition services agreement. While most of the obligations under those agreements were subsequently fulfilled, certain provisions (including in particular mutual indemnification provisions under the separation and distribution agreement and the employee matters agreement) continue in force.
Legal Proceedings Arising in the Ordinary Course of Business
The Company is a party, as plaintiff or defendant, to various suits in the ordinary course of business for monetary relief arising principally from personal injuries, wrongful death, collision or other casualty and to claims arising under charter parties and other
22
INTERNATIONAL SEAWAYS, INC.
NOTES TO CONDENSED CONSOLIDATED FINANCIAL STATEMENTS
(UNAUDITED)
contract disputes. A substantial majority of such personal injury, wrongful death, collision or other casualty claims against the Company are covered by insurance (subject to deductibles not material in amount). Each of the claims involves an amount which, in the opinion of management, should not be material to the Company’s financial position, results of operations and cash flows.
In late July 2023, one of the Company’s vessels was arrested in connection with a commercial dispute arising earlier in 2023. Although the vessel was subsequently released, the arresting parties continue to seek approximately $
23
INTERNATIONAL SEAWAYS, INC.
ITEM 2. MANAGEMENT’S DISCUSSION AND ANALYSIS OF FINANCIAL CONDITION AND RESULTS OF OPERATIONS
FORWARD-LOOKING STATEMENTS
This Quarterly Report on Form 10-Q contains forward-looking statements. Such forward-looking statements represent the Company’s reasonable expectation with respect to future events or circumstances based on various factors and are subject to various risks and uncertainties and assumptions relating to the Company’s operations, financial results, financial condition, business, prospects, growth strategy and liquidity. Accordingly, there are or will be important factors, many of which are beyond the control of the Company, that could cause the Company’s actual results to differ materially from those indicated in these statements. Undue reliance should not be placed on any forward-looking statements and consideration should be given to the following factors when reviewing any such statement. Such factors include, but are not limited to:
| ● | the highly cyclical nature of INSW’s industry; |
| ● | fluctuations in the market value of vessels; |
| ● | declines in charter rates, including spot charter rates or other market deterioration; |
| ● | an increase in the supply of vessels without a commensurate increase in demand; |
| ● | the impact of adverse weather and natural disasters, including the continuing drought in Panama, reducing water levels in the Panama Canal and thereby decreasing the daily number of vessels permitted to transit the canal, resulting in delays crossing the canal or extending their voyages by going around Cape Horn; |
| ● | the adequacy of INSW’s insurance to cover its losses, including in connection with maritime accidents or spill events; |
| ● | constraints on capital availability; |
| ● | changing economic, political and governmental conditions in the United States and/or abroad and general conditions in the oil and natural gas industry; |
| ● | the impact of changes in fuel prices; |
| ● | acts of piracy on ocean-going vessels; |
| ● | terrorist attacks and international hostilities and instability, including attacks against merchant vessels in the Red Sea and the Gulf of Aden by Iran-backed Houthi militants based in Yemen; |
| ● | the war between Russia and Ukraine could adversely affect INSW’s business; |
| ● | the impact of public health threats and outbreaks of other highly communicable diseases, including COVID-19; |
| ● | the effect of the Company’s indebtedness on its ability to finance operations, pursue desirable business opportunities and successfully run its business in the future; |
| ● | an event occurs that causes the rights issued under the A&R Rights Agreement adopted by the Company on April 11, 2023 to become exercisable; |
| ● | the Company’s ability to generate sufficient cash to service its indebtedness and to comply with debt covenants; |
| ● | the Company’s ability to make capital expenditures to expand the number of vessels in its fleet, and to maintain all of its vessels and to comply with existing and new regulatory standards; |
| ● | the availability and cost of third-party service providers for technical and commercial management of the Company’s fleet; |
| ● | the Company’s ability to renew its time charters when they expire or to enter into new time charters; |
| ● | termination or change in the nature of the Company’s relationship with any of the commercial pools in which it participates and the ability of such commercial pools to pursue a profitable chartering strategy; |
| ● | competition within the Company’s industry and INSW’s ability to compete effectively for charters with companies with greater resources; |
| ● | the loss of a large customer or significant business relationship; |
| ● | the Company’s ability to realize benefits from its past acquisitions or acquisitions or other strategic transactions it may make in the future; |
| ● | increasing operating costs and capital expenses as the Company’s vessels age, including increases due to limited shipbuilder warranties or the consolidation of suppliers; |
| ● | the Company’s ability to replace its operating leases on favorable terms, or at all; |
| ● | changes in credit risk with respect to the Company’s counterparties on contracts; |
24
INTERNATIONAL SEAWAYS, INC.
| ● | the failure of contract counterparties to meet their obligations; |
| ● | the Company’s ability to attract, retain and motivate key employees; |
| ● | work stoppages or other labor disruptions by employees of INSW or other companies in related industries; |
| ● | unexpected drydock costs; |
| ● | the potential for technological innovation to reduce the value of the Company’s vessels and charter income derived therefrom; |
| ● | the impact of an interruption in or failure of the Company’s information technology and communication systems upon the Company’s ability to operate; |
| ● | seasonal variations in INSW’s revenues; |
| ● | government requisition of the Company’s vessels during a period of war or emergency; |
| ● | the Company’s compliance with complex laws, regulations and in particular, environmental laws and regulations, including those relating to ballast water treatment and the emission of greenhouse gases and air contaminants, including from marine engines; |
| ● | legal, regulatory or market measures to address climate change, including proposals to restrict emissions of greenhouse gases (“GHGs”) and other sustainability initiatives, could have an adverse impact on the Company’s business and results of operations; |
| ● | increasing scrutiny and changing expectations from investors, lenders, and other market participants with respect to our Environmental, Social and Governance policies; |
| ● | any non-compliance with the U.S. Foreign Corrupt Practices Act of 1977 or other applicable regulations relating to bribery or corruption; |
| ● | the impact of litigation, government inquiries and investigations; |
| ● | governmental claims against the Company; |
| ● | the arrest of INSW’s vessels by maritime claimants; |
| ● | changes in laws, including governing tax laws, treaties or regulations, including those relating to environmental and security matters; |
| ● | changes in worldwide trading conditions, including the impact of tariffs, trade sanctions, boycotts and other restrictions on trade; and |
| ● | Pending and future tax law changes may result in significant additional taxes to INSW. |
The Company assumes no obligation to update or revise any forward-looking statements. Forward-looking statements in this Quarterly Report on Form 10-Q and written and oral forward-looking statements attributable to the Company or its representatives after the date of this Quarterly Report on Form 10-Q are qualified in their entirety by the cautionary statement contained in this paragraph and in other reports hereafter filed by the Company with the Securities and Exchange Commission.
INTRODUCTION
This Management’s Discussion and Analysis, which should be read in conjunction with our accompanying condensed consolidated financial statements and notes thereto, provides a discussion and analysis of our business, current developments, financial condition, cash flows and results of operations as of March 31, 2024 and for the three months ended March 31, 2024 and 2023. It is organized as follows:
| ● | General. This section provides a general description of our business, which we believe is important in understanding the results of our operations, financial condition and potential future trends. |
| ● | Operations & Oil Tanker Markets. This section provides an overview of industry operations and dynamics that have an impact on the Company’s financial position and results of operations. |
25
INTERNATIONAL SEAWAYS, INC.
| ● | Critical Accounting Estimates and Policies. This section identifies any updates to those accounting policies that are considered important to our results of operations and financial condition, require significant judgment and involve significant management estimates. |
| ● | Results from Vessel Operations. This section provides an analysis of our results of operations presented on a business segment basis. In addition, a brief description of significant transactions and other items that affect the comparability of the results is provided, if applicable. |
| ● | Liquidity and Sources of Capital. This section provides an analysis of our cash flows, outstanding debt and commitments. Included in the analysis of our outstanding debt is a discussion of the amount of financial capacity available to fund our ongoing operations and future commitments as well as a discussion of the Company’s planned and/or already executed capital allocation activities. |
| ● | Risk Management. This section provides a general overview of how the interest rate, currency and fuel price volatility risks are managed by the Company. |
This Quarterly Report on Form 10-Q includes industry data and forecasts that we have prepared based, in part, on information obtained from industry publications and surveys. Third-party industry publications, surveys and forecasts generally state that the information contained therein has been obtained from sources believed to be reliable. In addition, certain statements regarding our market position in this report are based on information derived from internal market studies and research reports. Unless we state otherwise, statements about the Company’s relative competitive position in this report are based on our management’s beliefs, internal studies and management’s knowledge of industry trends.
General:
We are a provider of ocean transportation services for crude oil and refined petroleum products. We operate our vessels in the International Flag market. Our business includes two reportable segments: Crude Tankers and Product Carriers. For both the three months ended March 31, 2024 and 2023, we derived 54% of our TCE revenues from our Product Carriers segment. Revenues from our Crude Tankers segment constituted the balance of our TCE revenues in the 2024 and 2023 periods.
As of March 31, 2024, the Company’s operating fleet consisted of 73 wholly-owned or lease financed and time chartered-in vessels aggregating 8.8 million deadweight tons (“dwt”). In addition to our operating fleet of 73 vessels, six LR1 newbuilds are scheduled for delivery to the Company between the second half of 2025 and third quarter of 2026, bringing the total operating and newbuild fleet to 79 vessels. Our fleet includes VLCC, Suezmax and Aframax crude tankers and LR2, LR1 and MR product carriers.
The Company’s revenues are highly sensitive to patterns of supply and demand for vessels of the size and design configurations owned and operated by the Company and the trades in which those vessels operate. Rates for the transportation of crude oil and refined petroleum products from which the Company earns a substantial majority of its revenues are determined by market forces such as the supply and demand for oil, the distance that cargoes must be transported, and the number of vessels expected to be available at the time such cargoes need to be transported. The demand for oil shipments is significantly affected by the state of the global economy, levels of U.S. domestic and international production and OPEC exports. The number of vessels available to transport cargo is affected by newbuilding deliveries and by the removal of existing vessels from service, principally through storage, recycling or conversions. The Company’s revenues are also affected by its vessel employment strategy, which seeks to achieve the optimal mix of spot (voyage charter) and long-term (time or bareboat charter) charters. Because shipping revenues and voyage expenses are significantly affected by the mix between voyage charters and time charters, the Company measures the performance of its fleet of vessels based on TCE revenues. Management makes economic decisions based on anticipated TCE rates and evaluates financial performance based on TCE rates achieved. In order to take advantage of market conditions and optimize economic performance, management employs all of the Company’s LR1 product carriers, which currently participate in the Panamax International Pool, in the transportation of crude oil cargoes.
Our revenues are derived predominantly from spot market voyage charters and our vessels are predominantly employed in the spot market via market-leading commercial pools. We derived approximately 89% of our total TCE revenues in the spot market for the
26
INTERNATIONAL SEAWAYS, INC.
three months ended March 31, 2024, compared with 96% for the three months ended March 30, 2023. The future minimum revenues, before reduction for brokerage commissions, expected to be received on non-cancelable time charters for three VLCCs, two Suezmaxes, one Aframax, and six MRs, as of March 31, 2024 are as follows:
(Dollars in millions) | Amount(1) | ||
2024 | $ | 85.3 | |
2025 | 82.4 | ||
2026 | 47.9 | ||
2027 | 34.0 | ||
2028 | 34.0 | ||
Thereafter | 41.0 | ||
Future minimum revenues | $ | 324.6 | |
| (1) | Future minimum contracted revenues do not include the Company’s share of time charters entered into by the pools in which it participates or profit-sharing above the base rate on the newbuild dual-fuel LNG VLCCs. In arriving at the minimum future charter revenues, an estimated time off-hire to perform periodic maintenance on each vessel has been deducted, although there is no assurance that such estimate will be reflective of the actual off-hire in the future. |
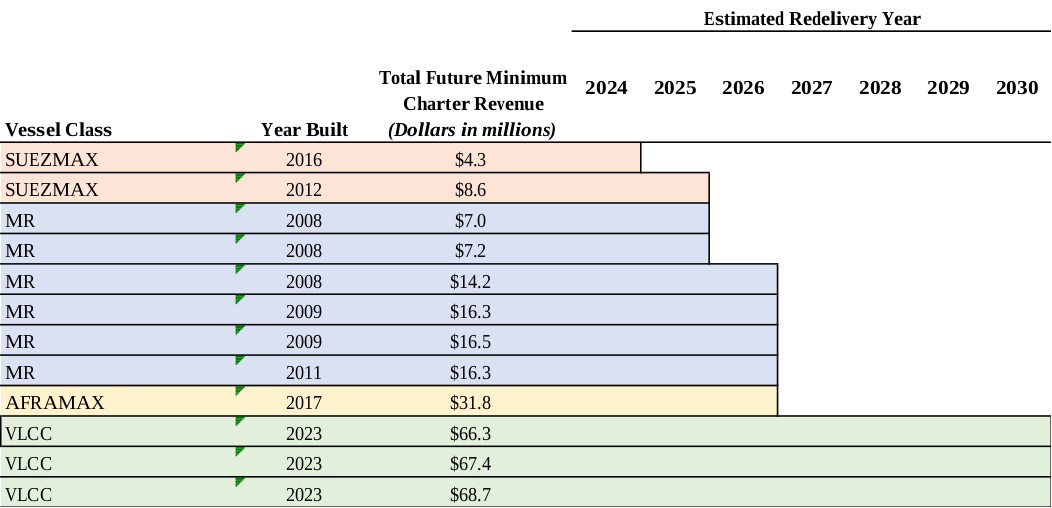
In April 2024, the Company entered into non-cancelable time charter agreements with durations ranging from 32 to 34 months for two 2009-built MRs and one 2014-built LR2. The future minimum contracted revenues, before the deduction of brokerage commissions, expected to be received under these agreements is approximately $86.0 million. All three vessels are expected to be delivered to their charterers before the end of the third quarter of 2024, after the completion of their scheduled drydocks.
27
INTERNATIONAL SEAWAYS, INC.
Operations and Oil Tanker Markets:
The International Energy Agency (“IEA”) estimates global oil consumption for the first quarter of 2024 at 102.0 million barrels per day (“b/d”), up 1.6% from the same quarter in 2023. The estimate for global oil consumption for 2024 is 103.2 million b/d, an increase of 1.2% over the 2023 estimate of 102.0 million b/d. OECD demand in 2024 is estimated to decrease 0.2% to 45.7 million b/d, while non-OECD demand is estimated to increase by 2.3% to 57.5 million b/d.
Global oil production in the first quarter of 2024 was 101.3 million b/d, a decrease of 1.0 million b/d from the first quarter of 2023. OPEC crude oil production averaged 26.5 million b/d in the first quarter of 2024, a decrease of 0.2 million b/d from the fourth quarter of 2023, and a decrease of 2.3 million b/d from the first quarter of 2023. Non-OPEC production increased by 1.2 million b/d to 69.3 million b/d in the first quarter of 2024 compared with the first quarter of 2023. Oil production in the U.S. in the first quarter of 2024 decreased by 5.2% to 12.5 million b/d compared to the fourth quarter of 2023 and by 0.3% from the first quarter of 2023.
U.S. refinery throughput increased by 0.1 million b/d to 15.9 million b/d in the first quarter of 2024 compared with the fourth quarter of 2023. U.S. crude oil imports in the first quarter of 2024 increased by 0.4 million b/d to 6.6 million b/d compared with the first quarter of 2023, with imports from OPEC countries decreasing by 0.1 million b/d and imports from non-OPEC countries increasing by 0.5 million b/d.
China’s crude oil imports increased 0.7% in the first quarter of 2024 from the first quarter of 2023, although imports in March 2024, at 11.55 million b/d, were down 6.2% from the previous March 2023 levels.
Total OECD commercial inventories ended the first quarter of 2024 down 41 million barrels of crude and 39 million barrels of products (3.0% and 2.7%, respectively), compared with the first quarter of 2023.
During the first quarter of 2024, the tanker fleet of vessels over 10,000 dwt increased, net of vessels recycled, by 1.9 million dwt as the crude fleet increased by 1.2 million dwt, all in the Aframax fleet. The product carrier fleet increased by 0.6 million dwt, with MRs growing 0.4 million dwt. Year-over-year, the size of the tanker fleet increased by 9.3 million dwt with the VLCCs, Suezmaxes, Aframaxes, and MRs increasing by 3.3 million dwt, 0.5 million dwt, 3.4 million dwt, and 2.1 million dwt, respectively. The LR1/Panamax fleet remained unchanged.
During the first quarter of 2024, the tanker orderbook increased by 11.9 million dwt overall compared with the fourth quarter of 2023. The crude tanker orderbook increased by 10.5 million dwt. The VLCC orderbook increased by 7.1 million dwt, while the Suezmax and Aframax orderbooks increased by 3.1 million dwt and 0.2 million dwt respectively. The product carrier orderbook increased by 1.4 million dwt, with increases in the LR1 and MR sectors of 0.2 million dwt and 1.3 million dwt respectively. Year-over-year, the total tanker orderbook increased by 33.2 million dwt, with increases in VLCC, Suezmaxes, Aframaxes, Panamaxes and LR1s of 8.8 million dwt, 10.5 million dwt, 6.3 million dwt, 2.2 million dwt and 5.3 million dwt, respectively.
Crude tanker rates remained strong, albeit at similar levels as in the fourth quarter of 2023, remaining significantly over 10-year average rates and cash breakeven levels, reflecting the continuing impact of the disruptions in trade flows on tanker demand. Clean product tanker rates strengthened during the quarter. Subsequent to the end of the first quarter of 2024, rates have softened somewhat due to reduced Chinese imports of crude oil and reduced exports of clean products from the U.S. Gulf.
Update on Critical Accounting Estimates and Policies:
The Company’s consolidated financial statements are prepared in accordance with accounting principles generally accepted in the United States, which require the Company to make estimates in the application of its accounting policies based on the best assumptions, judgments and opinions of management. For a description of all of the Company’s material accounting policies, see Note 3, “Summary of Significant Accounting Policies,” to the Company’s consolidated financial statements as of and for the year ended December 31, 2023 included in the Company’s Annual Report on Form 10-K. See Note 2, “Significant Accounting Policies,” to the accompanying condensed consolidated financial statements for any changes or updates to the Company’s critical accounting policies for the current period.
28
INTERNATIONAL SEAWAYS, INC.
Results from Vessel Operations:
During the first quarter of 2024, income from vessel operations decreased by $30.9 million to $154.4 million from $185.3 million in the first quarter of 2023. Such decrease resulted principally from a quarter-over-quarter decrease in TCE revenues, a gain on the disposal of a vessel recognized in the prior year’s quarter, and increased vessel expenses and depreciation and amortization in the current quarter primarily related to the delivery of three dual-fuel LNG VLCCs during the first half of 2023.
TCE revenues in the first quarter of 2024 decreased by $12.4 million, or 4%, to $270.9 million from $283.3 million in the first quarter of 2023. This decrease reflects (i) an aggregate $20.2 million days-based decline in the LR1 and MR sectors due to a smaller time chartered-in LR1 portfolio during the current quarter and the sales of three MRs between March 2023 and December 2023, (ii) a net $7.4 million rates-based decrease resulting from lower average daily rates earned across all of INSW’s fleet sectors, with the exception of the MR and LR2 fleets, partially offset by (iii) a $11.2 million days-based increase in the VLCC fleet relating to the delivery of three dual-fuel LNG VLCC newbuilds, and (iv) a $3.4 million increase attributable to the Company’s Lightering business.
See Note 4, “Business and Segment Reporting,” to the accompanying condensed consolidated financial statements for additional information on the Company’s segments, including reconciliations of (i) time charter equivalent revenues to shipping revenues and (ii) adjusted income from vessel operations for the segments to income before income taxes, as reported in the condensed consolidated statements of operations.
29
INTERNATIONAL SEAWAYS, INC.
Crude Tankers
Three Months Ended March 31, | ||||||
(Dollars in thousands, except daily rate amounts) | 2024 | 2023 | ||||
TCE revenues | $ | 123,962 | $ | 129,285 | ||
Vessel expenses | (30,513) | (25,028) | ||||
Charter hire expenses | (3,508) | (2,490) | ||||
Depreciation and amortization | (20,049) | (17,226) | ||||
Adjusted income from vessel operations (a) | $ | 69,892 | $ | 84,541 | ||
Average daily TCE rate | $ | 46,991 | $ | 54,390 | ||
Average number of owned vessels (b) | 21.0 | 18.0 | ||||
Average number of vessels chartered-in | 9.1 | 9.3 | ||||
Number of revenue days (c) | 2,638 | 2,377 | ||||
Number of ship-operating days: (d) | ||||||
Owned vessels | 1,911 | 1,621 | ||||
Vessels bareboat chartered-in under leases (e) | 819 | 833 | ||||
Vessels spot chartered-in under leases (f) | 7 | — | ||||
| (a) | Adjusted income from vessel operations by segment is before general and administrative expenses, third-party debt modification fees and gain on disposal of vessels and other property, net. |
| (b) | The average is calculated to reflect the addition and disposal of vessels during the period. |
| (c) | Revenue days represent ship-operating days less days that vessels were not available for employment due to repairs, drydock or lay-up. Revenue days are weighted to reflect the Company’s interest in chartered-in vessels. |
| (d) | Ship-operating days represent calendar days. |
| (e) | Represents VLCCs and Aframaxes that secured lease financing arrangements during the periods presented. Between March and July 2023 the Company purchased the three remaining Aframaxes that it had been bareboat chartering-in under the purchase options contained in such charters, and accordingly, such vessels are not included in this category for the three months ended March 31, 2024. |
| (f) | The Company’s Crude Tankers Lightering business spot chartered-in one vessel under a lease during the three months ended March 31, 2024 for a full service lightering job. |
30
INTERNATIONAL SEAWAYS, INC.
The following table provides a breakdown of TCE rates achieved for the three months ended March 31, 2024 and 2023, between spot and fixed earnings and the related revenue days. The information in this table is based, in part, on information provided by the commercial pools in which the segment’s vessels participate and excludes commercial pool fees/commissions averaging approximately $1,232 and $1,266 per day for the three months ended March 31, 2024 and 2023, respectively, as well as activity in the Crude Tankers Lightering business and revenue and revenue days for which recoveries were recorded by the Company under its loss of hire insurance policies. The fixed earnings rates in the table are net of broker/address commissions.
2024 | 2023 | |||||||||||
Spot Earnings | Fixed Earnings | Spot Earnings | Fixed Earnings | |||||||||
Three Months Ended March 31, | ||||||||||||
VLCC: | ||||||||||||
Average rate | $ | 44,736 | $ | 40,917 | $ | 46,371 | $ | 48,118 | ||||
Revenue days | 863 | 273 | 780 | 112 | ||||||||
Suezmax: | ||||||||||||
Average rate | $ | 44,666 | $ | 30,987 | $ | 58,191 | $ | 31,402 | ||||
Revenue days | 998 | 183 | 996 | 131 | ||||||||
Aframax(1): | ||||||||||||
Average rate | $ | 40,913 | $ | 38,500 | $ | 50,756 | $ | — | ||||
Revenue days | 222 | 91 | 330 | — | ||||||||
| (1) | During the three months ended March 31, 2023, one of the Company’s Aframaxes was employed on a transitional voyage in the spot market outside of its ordinary course operations in the Dakota Tankers’ Aframax Pool. Such transitional voyage is excluded from the table above. |
During the first quarter of 2024, TCE revenues for the Crude Tankers segment decreased by $5.3 million, or 4%, to $124.0 million from $129.3 million in the first quarter of 2023. Such decrease principally resulted from an aggregate rates-based decrease in the Suezmax, VLCC and Aframax fleets of $20.5 million due to lower average daily blended rates in these sectors. This decrease was offset by (i) a $11.2 million days-based increase in the VLCC fleet, which reflected the delivery of three dual-fuel LNG VLCC newbuilds between March 2023 and May 2023, and (ii) a $3.4 million increase in the Crude Tankers Lightering business.
Vessel expenses increased by $5.5 million to $30.5 million in the first quarter of 2024 from $25.0 million in the first quarter of 2023. Such increase principally reflects the impact of the VLCC newbuild deliveries described above. Charter hire expenses increased by $1.0 million quarter-over-quarter due to increased charter hire expense in the Crude Tankers Lightering business, which primarily reflects charter hire incurred in conjunction with a full-service lightering job during the current quarter and an increased daily rate on one of the workboats being chartered-in by the Company. Depreciation and amortization increased by $2.8 million to $20.0 million in the current quarter from $17.2 million in the first quarter of 2023 principally as a result of the commencement of depreciation on the Company’s three dual-fuel LNG VLCC newbuilds.
Excluding depreciation and amortization and general and administrative expenses, operating income for the Crude Tankers Lightering business was $7.8 million for the first quarter of 2024 compared with $6.0 million for the first quarter of 2023. The increase reflects (i) higher average rates earned per lightering operation in the first quarter of 2024 compared with the first quarter of 2023 and (ii) increased activity levels period-over-period, with 128 service support only lighterings and one full-service lightering job (which was completed in April 2024) being performed during the three months ended March 31, 2024 compared to the 122 service support only lighterings that were performed during the three months ended March 31, 2023.
31
INTERNATIONAL SEAWAYS, INC.
Product Carriers
Three Months Ended March 31, | ||||||
(Dollars in thousands, except daily rate amounts) | 2024 | 2023 | ||||
TCE revenues | $ | 146,966 | $ | 154,035 | ||
Vessel expenses | (32,868) | (33,741) | ||||
Charter hire expenses | (3,140) | (6,310) | ||||
Depreciation and amortization | (14,104) | (12,294) | ||||
Adjusted income from vessel operations | $ | 96,854 | $ | 101,690 | ||
Average daily TCE rate | $ | 39,807 | $ | 37,726 | ||
Average number of owned vessels | 38.0 | 39.8 | ||||
Average number of vessels chartered-in | 5.0 | 7.9 | ||||
Number of revenue days | 3,692 | 4,083 | ||||
Number of ship-operating days: | ||||||
Owned vessels | 3,458 | 3,582 | ||||
Vessels bareboat chartered-in under leases (a) | 364 | 450 | ||||
Vessels time chartered-in under leases | 91 | 264 | ||||
| (a) | Represents MRs that secured lease financing arrangements during the three months ended March 31, 2024 and an LR2 and MRs that secured lease financing arrangements during the three months ended March 31, 2023. |
The following table provides a breakdown of TCE rates achieved for the three months ended March 31, 2024 and 2023, between spot and fixed earnings and the related revenue days. The information in this table is based, in part, on information provided by the commercial pools in which the segment’s vessels participate and excludes commercial pool fees/commissions averaging approximately $898 and $787 per day for the three months ended March 31, 2024 and 2023, respectively, as well as revenue and revenue days for which recoveries were recorded by the Company under its loss of hire insurance policies. The fixed earnings rates in the table are net of broker/address commissions.
2024 | 2023 | |||||||||||
Spot Earnings | Fixed Earnings | Spot Earnings | Fixed Earnings | |||||||||
Three Months Ended March 31, | ||||||||||||
LR2: | ||||||||||||
Average rate | $ | 51,027 | $ | — | $ | — | $ | 19,108 | ||||
Revenue days | 91 | — | — | 90 | ||||||||
LR1(1): | ||||||||||||
Average rate | $ | 66,310 | $ | — | $ | 70,838 | $ | — | ||||
Revenue days | 571 | — | 800 | — | ||||||||
MR(2): | ||||||||||||
Average rate | $ | 37,969 | $ | 21,696 | $ | 31,468 | $ | 18,434 | ||||
Revenue days | 2,546 | 465 | 3,087 | 90 | ||||||||
| (1) | In order to take advantage of market conditions and optimize economic performance, during the 2024 and 2023 periods, management employed all of the Company’s LR1 product carriers, which operate in the Panamax International pool, exclusively in the transportation of crude oil cargoes. During the three months ended March 31, 2024, one LR1 was employed on a transitional voyage in the spot market outside of its ordinary course operations in the Panamax International pool. Such transitional voyage is excluded from the table above. |
| (2) | During the three months ended March 31, 2023 one MR was employed on a transitional voyage in the spot market outside of its ordinary course operations in Norden’s MR Pool due to a change in technical management. Such transitional voyage is excluded from the table above. |
32
INTERNATIONAL SEAWAYS, INC.
During the first quarter of 2024, TCE revenues for the Product Carriers segment decreased by $7.0 million, or 5%, to $147.0 million from $154.0 million in the first quarter of 2023. The reduction in TCE revenues was primarily as a result of (i) a $14.7 million days-based decrease in the LR1 fleet sector which reflects a 173-day net decrease in time-chartered in days, (ii) a $5.5 million days-based decline in the MR sector, which reflects the sales of three MRs between March 2023 and December 2023 and (iii) a $3.4 million rates-based decrease in the LR1 sector due to lower average daily rates earned in the current quarter. Partially offsetting such decreases was (iv) a $16.6 million aggregate rates-based increase in the MR and LR2 sectors due to higher average daily blended rates earned in the first quarter of 2024.
Vessel expenses decreased by $0.9 million to $32.9 million in the first quarter of 2024 from $33.7 million in the first quarter of 2023. Such decrease reflects the MR sales referenced above. Charter hire expenses decreased by $3.2 million to $3.1 million in the current quarter from $6.3 million in the first quarter of 2023, primarily as a result of the quarter-over-quarter decrease in time chartered-in LR1 days described above. Depreciation and amortization increased by $1.8 million to $14.1 million in the current quarter from $12.3 million in the prior year’s quarter. Such increase resulted primarily from increased drydock amortization, offset by the impact of the sales of the MR vessels referenced above.
General and Administrative Expenses
During the first quarter of 2024, general and administrative expenses increased by $1.1 million to $12.4 million from $11.2 million in the first quarter of 2023. The primary driver for such increase was higher legal fees of $0.7 million, principally incurred in connection with a commercial dispute. See Note 14, “Contingencies,” to the accompanying condensed consolidated financial statements for additional information.
Other Income
Other income was $3.0 million for the three months ended March 31, 2024 compared with $4.3 million for the three months ended March 31, 2023. Other income in the current period includes $3.0 million of interest income earned on invested cash compared to $4.1 million of interest income earned during the first quarter of 2023. The quarter-over-quarter decrease reflects the impact of a lower average balance of invested cash during the three months ended March 31, 2024, attributable to the significant deleveraging initiatives completed during 2023. Both periods also reflect net actuarial gains and currency losses associated with the retirement benefit obligation in the United Kingdom.
Interest Expense
The components of interest expense are as follows:
Three Months Ended March 31, | ||||||
(Dollars in thousands) | 2024 | 2023 | ||||
Interest before items shown below | $ | 15,326 | $ | 20,741 | ||
Interest cost on defined benefit pension obligation | 205 | 330 | ||||
Impact of interest rate hedge derivatives | (2,425) | (2,384) | ||||
Capitalized interest | (219) | (1,740) | ||||
Interest expense | $ | 12,887 | $ | 16,947 | ||
Interest expense decreased during the first quarter of 2024 compared to the first quarter of 2023 as a result of (i) a reduction in the average outstanding principal balance under the $750 Million Term Loan Facility and (ii) the repayment in full of the COSCO Lease financing in July 2023, partially offset by post-delivery interest expense related to the BoComm Lease Financing. See Note 8, “Debt,” in the accompanying condensed consolidated financial statements for further information on the Company’s debt facilities.
33
INTERNATIONAL SEAWAYS, INC.
Taxes
The Company believes it will qualify for an exemption from U.S. federal income taxes under Section 883 of the U.S. Internal Revenue Code of 1986, as amended (the “Code”) and U.S. Treasury Department regulations for the 2024 calendar year, so long as less than 50 percent of the total value of the Company’s stock is held by one or more shareholders who own 5% or more of the Company’s stock for more than half of the days of 2024. There can be no assurance at this time that INSW will continue to qualify for the Section 883 exemption beyond calendar year 2024. Should the Company not qualify for the exemption in the future, INSW will be subject to U.S. federal income taxation of 4% of its U.S. source shipping income on a gross basis without the benefit of deductions. Shipping income that is attributable to transportation that begins or ends, but that does not both begin and end, in the U.S. will be considered to be 50% derived from sources within the United States. Shipping income attributable to transportation that both begins and ends in the U.S. would be considered to be 100% derived from sources within the United States, but INSW does not and cannot engage in transportation that gives rise to such income.
EBITDA and Adjusted EBITDA
EBITDA represents net income before interest expense, income taxes and depreciation and amortization expense. Adjusted EBITDA consists of EBITDA adjusted for the impact of certain items that we do not consider indicative of our ongoing operating performance. EBITDA and Adjusted EBITDA are presented to provide investors with meaningful additional information that management uses to monitor ongoing operating results and evaluate trends over comparative periods. EBITDA and Adjusted EBITDA do not represent, and should not be considered a substitute for, net income or cash flows from operations determined in accordance with GAAP. EBITDA and Adjusted EBITDA have limitations as analytical tools, and should not be considered in isolation, or as a substitute for analysis of our results reported under GAAP. Some of the limitations are:
| ● | EBITDA and Adjusted EBITDA do not reflect our cash expenditures, or future requirements for capital expenditures or contractual commitments; |
| ● | EBITDA and Adjusted EBITDA do not reflect changes in, or cash requirements for, our working capital needs; and |
| ● | EBITDA and Adjusted EBITDA do not reflect the significant interest expense, or the cash requirements necessary to service interest or principal payments, on our debt. |
While EBITDA and Adjusted EBITDA are frequently used by companies as a measure of operating results and performance, neither of those items as prepared by the Company is necessarily comparable to other similarly titled captions of other companies due to differences in methods of calculation.
The following table reconciles net income, as reflected in the condensed consolidated statements of operations, to EBITDA and Adjusted EBITDA:
Three Months Ended March 31, | ||||||
(Dollars in thousands) | 2024 | 2023 | ||||
Net income | $ | 144,490 | $ | 172,633 | ||
Income tax benefit | — | (1) | ||||
Interest expense | 12,887 | 16,947 | ||||
Depreciation and amortization | 34,153 | 29,548 | ||||
EBITDA | 191,530 | 219,127 | ||||
Third-party debt modification fees | — | 407 | ||||
Gain on disposal of vessels and other assets, net | (51) | (10,748) | ||||
Write-off of deferred financing costs | — | 166 | ||||
Adjusted EBITDA | $ | 191,479 | $ | 208,952 | ||
34
INTERNATIONAL SEAWAYS, INC.
Liquidity and Sources of Capital:
Our business is capital intensive. Our ability to successfully implement our strategy is dependent on the continued availability of capital on attractive terms. In addition, our ability to successfully operate our business to meet near-term and long-term debt repayment obligations is dependent on maintaining sufficient liquidity.
Liquidity
As of March 31, 2024, we had total liquidity on a consolidated basis of $625.9 million comprised of $139.5 million of cash, $75.0 million of short-term investments, and $411.4 million of undrawn revolver capacity.
Working capital at March 31, 2024 and December 31, 2023 was $310.0 million and $269.4 million, respectively. Current assets are highly liquid, consisting principally of cash, interest-bearing deposits, short-term investments consisting of time deposits with original maturities of between 91 and 180 days and receivables. Current liabilities include current installments of long-term debt of $127.5 million and $127.4 million at March 31, 2024 and December 31, 2023, respectively.
The Company’s cash and cash equivalents increased by $12.7 million during the three months ended March 31, 2024. This increase principally reflects $156.4 million of cash provided by operating activities. Such cash inflows were principally offset by:
| ● | $64.7 million of cash dividends paid to shareholders; |
| ● | $31.7 million in regularly scheduled principal amortization of the Company’s secured debt facilities and lease financing arrangements; |
| ● | $26.4 million in expenditures for vessels and other property including $23.2 million deposits for vessel acquisitions. |
| ● | $15.0 million net increase in cash invested in short-term investments. |
Our cash and cash equivalents balances generally exceed Federal Deposit Insurance Corporation insured limits. We place our cash and cash equivalents in what we believe to be credit-worthy financial institutions. In addition, certain of our money market accounts invest in U.S. Treasury securities or other obligations issued or guaranteed by the U.S. government or its agencies, floating rate and variable demand notes of U.S. and foreign corporations, commercial paper rated in the highest category by Moody’s Investor Services and Standard & Poor’s, certificates of deposit and time deposits, asset-backed securities, and repurchase agreements.
As of March 31, 2024, we had total debt outstanding (net of original issue discount and deferred financing costs) of $691.7 million and net debt to total capitalization of 21.0%, compared with 23.8% at December 31, 2023.
Sources, Uses and Management of Capital
With strong market conditions continuing in 2024 to date, we have (i) used incremental liquidity generated from operations and the proceeds from disposal of older tonnage at strong prices to invest in renewing and growing the fleet, (ii) enhanced our balance sheet and liquidity position, and (iii) continued to make substantial returns to shareholders.
In addition to future operating cash flows, our other future sources of funds are proceeds from issuances of equity securities, additional borrowings as permitted under our loan agreements and proceeds from the opportunistic sales of our vessels. Our current uses of funds are to fund working capital requirements, maintain the quality of our vessels, purchase vessels, pay newbuilding construction costs, comply with international shipping standards and environmental laws and regulations, repay or repurchase our outstanding loan facilities, pay a regular quarterly cash dividend, and from time to time, repurchase shares of our common stock and pay supplemental cash dividends.
The following is a summary of the significant capital allocation and strategic fleet optimization activities the Company executed so far during 2024 and sources of capital the Company has at its disposal for future use as well as the Company’s current commitments for future uses of capital:
35
INTERNATIONAL SEAWAYS, INC.
On February 28, 2024, the Company’s Board of Directors declared a regular quarterly cash dividend of $0.12 per share of common stock and a supplemental cash dividend of $1.20 per share of common stock. Both dividends totaling $64.7 million were paid on March 28, 2024 to stockholders of record as of March 14, 2024. On May 7, 2024, the Company’s Board of Directors declared a regular quarterly cash dividend of $0.12 per share of common stock and a supplemental dividend of $1.63 per share of common stock. Both dividends will be paid on June 26, 2024 to stockholders of record as of June 12, 2024.
In continuation of our strategic fleet optimization program, in February 2024, we entered into agreements for the en bloc purchase of four 2015-built and two 2014-built MR Product Carriers for an aggregate purchase price of $232 million. Eighty-five percent of the purchase price consideration will be funded from available liquidity and the balance of 15% with the issuance of common stock. Three of the six vessels were delivered between April and early May 2024, and delivery of the remaining three MRs is expected to be completed by the end of the second quarter of 2024. A registration statement on Form S-3 was filed with the SEC on April 29, 2024 to register the shares that will be issued in conjunction with these vessel acquisitions and facilitate sellers’ ability to offer and sell or otherwise dispose of the shares of common stock issued to them under this transaction.
In March 2024, we entered into an agreement for the sale of one 2009-built MR for net proceeds of approximately $23 million after fees and commissions. The vessel was delivered to the buyer in April 2024 and the Company recognized a gain on the sale.
In March 2024 we also declared options to build two additional dual-fuel ready LNG 73,600 dwt LR1 Product Carriers at the same shipyard where our other four newbuild LR1s are currently under construction. The six LR1s are scheduled for delivery between the second half of 2025 and the third quarter of 2026 for an aggregate cost of approximately $347 million, which will be paid for through a combination of long-term financing and available liquidity.
In April 2024, we opportunistically locked in $86 million of minimum future charter revenues (before reduction for brokerage commissions) on non-cancelable time charters with durations ranging from 32 to 34 months for two 2009-built MRs and one 2014-built LR2. All three vessels are expected to be delivered to their charterers before the end of the third quarter of 2024, after the completion of their scheduled drydocks.
Further building on our liquidity enhancing, deleveraging and financing diversification initiatives, we have executed the following transactions:
| ● | On April 18, 2024, we prepaid the $20.3 million outstanding principal balance under the ING Credit Facility. |
| ● | On April 26, 2024, we entered into an agreement to amend and extend our existing $750 Million Credit Facility, under which the Company had a remaining term loan balance of $94.6 million and undrawn revolver capacity of $257.4 million at March 31, 2024. The new agreement consists of a $500 million revolving credit facility (the “$500 Million Revolving Credit Facility”) that matures in January 2030. Under the terms of the $500 Million Revolving Credit Facility, capacity is reduced on a quarterly basis by approximately $12.8 million each quarter, based on a 20-year age-adjusted profile of the collateral vessels. The $500 Million Revolving Credit Facility bears an interest rate based on term SOFR plus the Applicable Margin (each as defined in the credit agreement). The Applicable Margin is 1.85% and is subject to similar sustainability-linked features as included in the $750 Million Credit Facility, which could impact the margin by five basis points, that are aimed at reducing the carbon footprint, target expenditures toward energy efficiency improvements and maintaining a safety record above the industry average. At the time of closing, after $94.6 million was drawn on the new revolver, our overall undrawn revolver capacity increased by $148 million to $559.4 million. |
By entering into the $500 Million Revolving Credit Facility we have (i) eliminated $19.5 million in mandatory quarterly debt repayments since the balance drawn on closing is not required to be repaid until Maturity, (ii) reduced cash break evens by over $3,000 per day, (iii) extended the maturity profile of the facility from 2027 to 2030, and (iv) reduced future interest expense through a margin reduction of over 85 basis points.
As of March 31, 2024, the Company has contractual commitments for the construction of six dual-fuel ready LR1s, the acquisition of six MRs, and the purchase and installation of three ballast water treatment systems and 11 mewis ducts, and the final outstanding installment payments due for five ballast water treatment systems that had been installed as of March 31, 2024. The Company’s debt
36
INTERNATIONAL SEAWAYS, INC.
service commitments and aggregate purchase commitments for vessel construction and betterments as of March 31, 2024, are presented in the Aggregate Contractual Obligations Table below.
Outlook
Our strong balance sheet, as evidenced by a substantial level of liquidity, 30 unencumbered vessels as of March 31, 2024, and diversified financing sources with debt maturities spread out between 2030 and 2031, positions us to support our operations over the next twelve months as we continue to advance our vessel employment strategy, which seeks to achieve an optimal mix of spot (voyage charter) and long-term (time charter) charters. Our balance sheet strength and diverse fleet position us to continue pursuing our disciplined capital allocation strategy of fleet renewal, incremental debt reduction and returns to shareholders and pursue potential strategic opportunities that may arise within the diverse sectors in which we operate.
Off-Balance Sheet Arrangements
Pursuant to an agreement between INSW and the trustees of the OSG Ship Management (UK) Ltd. Retirement Benefits Plan (the “Scheme”), INSW guarantees the obligations of INSW Ship Management UK Ltd., a subsidiary of INSW, to make payments to the Scheme.
Aggregate Contractual Obligations
A summary of the Company’s long-term contractual obligations as of March 31, 2024 follows:
Beyond | |||||||||||||||||||||
(Dollars in thousands) | 2024 | 2025 | 2026 | 2027 | 2028 | 2028 | Total | ||||||||||||||
$750 Million Facility Term Loan - floating rate(1) | $ | 60,213 | $ | 38,308 | $ | — | $ | — | $ | — | $ | — | $ | 98,521 | |||||||
ING Credit Facility - floating rate(2) | 2,702 | $ | 3,461 | 17,884 | — | — | — | 24,047 | |||||||||||||
Ocean Yield Lease Financing - floating rate(3) | 39,788 | $ | 51,185 | 50,793 | 49,868 | 47,208 | 201,166 | 440,008 | |||||||||||||
BoComm Lease Financing - fixed rate(4) | 17,902 | $ | 23,761 | 23,761 | 23,762 | 23,827 | 166,034 | 279,047 | |||||||||||||
Toshin Lease Financing - fixed rate(4) | 1,665 | $ | 2,160 | 2,160 | 2,151 | 2,223 | 6,934 | 17,293 | |||||||||||||
Hyuga Lease Financing - fixed rate(4) | 1,889 | $ | 2,232 | 2,232 | 2,232 | 2,160 | 6,416 | 17,161 | |||||||||||||
Kaiyo Lease Financing - fixed rate(4) | 1,688 | $ | 2,250 | 2,410 | 2,214 | 2,214 | 4,341 | 15,117 | |||||||||||||
Kaisha Lease Financing - fixed rate(4) | 1,688 | $ | 2,437 | 2,225 | 2,214 | 2,214 | 4,501 | 15,279 | |||||||||||||
Operating lease obligations(5) | |||||||||||||||||||||
Time Charter-ins | 9,488 | 5,624 | — | — | — | — | 15,112 | ||||||||||||||
Office and other space |
| 952 | 1,093 | 1,113 | 1,077 | 1,077 | 4,754 | 10,066 | |||||||||||||
Vessel and vessel betterment commitments(6) | 246,864 | 139,517 | 162,088 | — | — | — | 548,469 | ||||||||||||||
Total | $ | 384,839 | $ | 272,028 | $ | 264,666 | $ | 83,518 | $ | 80,923 | $ | 394,146 | $ | 1,480,120 |
| (1) | Amounts shown include contractual interest obligations of floating rate debt estimated based on the applicable margin for the $750 Million Facility Term Loan of 2.45%, plus the fixed rate stated in the related interest rate swaps of 2.84%. |
| (2) | Amounts shown include contractual interest obligations of outstanding floating rate debt estimated based on the applicable margin, plus credit adjustment spread of 0.26% and plus the effective three-month SOFR rate as of March 31, 2024 of 5.30% for the ING Credit Facility. |
| (3) | Amounts shown include contractual interest obligations on $304.6 million of outstanding floating rate debt estimated based on the applicable margin for the Ocean Yield Lease Financing of 4.05% plus 0.26% of credit adjustment spread and the fixed rate stated in the interest rate swaps (assigned for accounting purposes) of 2.84% on $215.9 million of notional principal amount outstanding and the effective three-month SOFR rate as of March 31, 2024 of 5.27% for the remaining outstanding principal under the Ocean Yield Lease Financing. |
| (4) | Amounts shown include contractual implicit interest obligations of the lease financing under the bareboat charters. |
37
INTERNATIONAL SEAWAYS, INC.
| (5) | As of March 31, 2024, the Company had charter-in commitments for one vessel on a lease that is accounted for as an operating lease. The full amounts due under office and other space leases are discounted and reflected on the Company’s consolidated condensed balance sheet as lease liabilities with corresponding right of use asset balances. |
| (6) | Represents the Company’s commitments for the purchase and installation of three ballast water treatment systems and 11 mewis duct systems, the remaining commitment for the construction of six dual-fuel ready LR1s, and the remaining cash commitment for the purchase of six MRs. |
Risk Management:
The Company is exposed to market risk from changes in interest rates, which could impact its results of operations and financial condition. The Company manages this exposure to market risk through its regular operating and financing activities and, when deemed appropriate, through the use of derivative financial instruments. To manage its interest rate risk exposure associated with changes in variable interest rate payments due on its credit facilities in a cost-effective manner, the Company, from time-to-time, enters into interest rate swap, collar or cap agreements, in which it agrees to exchange various combinations of fixed and variable interest rates based on agreed upon notional amounts or to receive payments if floating interest rates rise above a specified cap rate. The Company uses such derivative financial instruments as risk management tools and not for speculative or trading purposes. In addition, derivative financial instruments are entered into with a diversified group of major financial institutions in order to manage exposure to nonperformance on such instruments by the counterparties.
Available Information
The Company makes available free of charge through its internet website, www.intlseas.com, its Annual Report on Form 10-K, quarterly reports on Form 10-Q, current reports on Form 8-K and amendments to these reports filed or furnished pursuant to Section 13(a) or 15(d) of the Securities Exchange Act of 1934, as amended (the “Exchange Act”), as soon as reasonably practicable after the Company electronically files such material with, or furnishes it to, the Securities and Exchange Commission.
The public may also read and copy any materials the Company files with the SEC at the SEC’s Public Reference Room at 100 F Street, N.E. Washington D.C. 20549 (information on the operation of the Public Reference Room is available by calling the SEC at 1-800-SEC-0330). The SEC also maintains a web site that contains reports, proxy and information statements, and other information regarding issuers that file electronically with the SEC at https://www.sec.gov.
The Company also makes available on its website, its corporate governance guidelines, its Code of Business Conduct and Ethics, insider trading policy, anti-bribery and corruption policy, incentive compensation recoupment policy, and charters of the Audit Committee, the Human Resources and Compensation Committee and the Corporate Governance and Risk Assessment Committee of the Board of Directors. The Company is required to disclose any amendment to a provision of its Code of Business Conduct and Ethics. The Company intends to use its website as a method of disseminating this disclosure, as permitted by applicable SEC rules. Any such disclosure will be posted to the Company website within four business days following the date of any such amendment. Neither our website nor the information contained on that site, or connected to that site, is incorporated by reference into this Quarterly Report on Form 10-Q.
38
INTERNATIONAL SEAWAYS, INC.
ITEM 4. CONTROLS AND PROCEDURES
Disclosure Controls and Procedures
As of the end of the period covered by this Quarterly Report on Form 10-Q, an evaluation was performed under the supervision and with the participation of the Company’s management, including the Chief Executive Officer (“CEO”) and Chief Financial Officer (“CFO”), of the effectiveness of the design and operation of the Company’s disclosure controls and procedures as defined in Rules 13a-15(e) and 15d-15(e) under the Exchange Act. Based on that evaluation, the Company’s management, including the CEO and CFO, concluded that the Company’s current disclosure controls and procedures were effective as of March 31, 2024 to ensure that information required to be disclosed by the Company in the reports the Company files or submits under the Exchange Act is (i) recorded, processed, summarized and reported, within the time periods specified in the Securities and Exchange Commission’s rules and forms and (ii) accumulated and communicated to the Company’s management, including the CEO and CFO, as appropriate to allow timely decisions regarding required disclosure.
Changes in Internal Control over Financial Reporting
There was no change in the Company’s internal control over financial reporting during the three months ended March 31, 2024 that has materially affected, or is reasonably likely to materially affect, the Company’s internal control over financial reporting.
PART II – OTHER INFORMATION
Item 1. Legal Proceedings
See Note 14, “Contingencies,” to the accompanying condensed consolidated financial statements for a description of the current legal proceedings, which is incorporated by reference in this Part II, Item 1.
Item 1A. Risk Factors
You should carefully consider the factors discussed in Part I, Item 1A. “Risk Factors” in our 2023 Form 10-K. The risks described in that document are not the only risks facing us. Additional risks and uncertainties not currently known to us or that we currently deem to be immaterial also may materially adversely affect our business, financial condition and/or operating results.
Item 2. Unregistered Sales of Equity Securities and Use of Proceeds
No stock repurchases were made during the three months ended March 31, 2024 other than shares withheld to cover tax withholding liabilities relating to the exercise of stock options and the vesting of outstanding restricted stock units held by certain numbers of management.
See Note 10, “Capital Stock and Stock Compensation,” to the accompanying condensed consolidated financial statements for additional information about the stock repurchase plan and a description of shares withheld to cover the cost of stock options exercised by certain members of management and tax withholding liabilities relating to the vesting of previously-granted equity awards to certain members of management, which is incorporated by reference in this Part II, Item 2.
Item 4. Mine Safety Disclosures
Not applicable.
39
INTERNATIONAL SEAWAYS, INC.
Item 5. Other Information
Insider Trading Arrangements and Policies
During the first quarter of 2024, none of our directors or executive officers
Item 6. Exhibits
**10.1 | ||
*10.2 | ||
*10.3 | ||
*10.4 | ||
*10.5 | ||
**31.1 |
| Certification of Chief Executive Officer pursuant to Rule 13a-14(a) and 15d-14(a), as amended. |
**31.2 | Certification of Chief Financial Officer pursuant to Rule 13a-14(a) and 15d-14(a), as amended. | |
**32 | ||
*99.2 | ||
EX-101.INS | Inline XBRL Instance Document | |
EX-101.SCH | Inline XBRL Taxonomy Extension Schema | |
EX-101.CAL | Inline XBRL Taxonomy Extension Calculation Linkbase | |
EX-101.DEF | Inline XBRL Taxonomy Extension Definition Linkbase | |
EX-101.LAB | Inline XBRL Taxonomy Extension Label Linkbase | |
EX-101.PRE | Inline XBRL Taxonomy Extension Presentation Linkbase | |
EX-104 | Cover Page Interactive Data File (formatted as inline XBRL and contained in Exhibit 101) |
40
INTERNATIONAL SEAWAYS, INC.
SIGNATURES
Pursuant to the requirements of the Securities Exchange Act of 1934, the Registrant has duly caused this report to be signed on its behalf by the undersigned thereunto duly authorized.
INTERNATIONAL SEAWAYS, INC. | |
(Registrant) | |
Date: May 8, 2024 | /s/ Lois K. Zabrocky |
Lois K. Zabrocky | |
Chief Executive Officer | |
Date: May 8, 2024 | /s/ Jeffrey D. Pribor |
Jeffrey D. Pribor | |
Chief Financial Officer |
41