UNITED STATES
SECURITIES AND EXCHANGE COMMISSION
Washington, DC 20549
FORM 10-K
| (Mark One) | |||||
| ANNUAL REPORT PURSUANT TO SECTION 13 OR 15(d) OF THE SECURITIES EXCHANGE ACT OF 1934 | |||||
For the Fiscal Year Ended | |||||
| or | |||||
| TRANSITION REPORT PURSUANT TO SECTION 13 OR 15(d) OF THE SECURITIES EXCHANGE ACT OF 1934 | |||||
| For the transition period from to | |||||
Commission File Number 1-13045
_________________________________________________________

(Exact name of Registrant as Specified in Its Charter)
(State or other jurisdiction of incorporation)
(Address of principal executive offices)
(I.R.S. Employer Identification No.)
(Zip Code)
(Registrant’s telephone number, including area code)
Securities registered pursuant to Section 12(b) of the Act:
| Title of Each Class | Trading Symbols(s) | Name of Exchange on Which Registered | ||||||||||||
Securities registered pursuant to Section 12(g) of the Act: None
Indicate by check mark if the registrant is a well-known seasoned issuer, as defined in Rule 405 of the Securities Act. Yes ☒ No ☐
Indicate by check mark if the registrant is not required to file reports pursuant to Section 13 or Section 15(d) of the Act. Yes ☐ No ☒
Indicate by check mark whether the registrant: (1) has filed all reports required to be filed by Section 13 or 15(d) of the Securities Exchange Act of 1934 during the preceding 12 months (or for such shorter period that the registrant was required to file such reports), and (2) has been subject to such filing requirements for the past 90 days. Yes ☒ No ☐
Indicate by check mark whether the registrant has submitted electronically, every Interactive Data File required to be submitted pursuant to Rule 405 of Regulation S-T during the preceding 12 months (or for such shorter period that the registrant was required to submit such files). Yes ☒ No ☐
Indicate by check mark whether the registrant is a large accelerated filer, an accelerated filer, a non-accelerated filer, smaller reporting company, or an emerging growth company. See the definitions of “large accelerated filer,” “accelerated filer”, “smaller reporting company” and “emerging growth company” in Rule 12b-2 of the Exchange Act. (Check one):
☒ | Accelerated filer | ☐ | |||||||||
| Non-accelerated filer | ☐ | Smaller reporting company | |||||||||
| Emerging growth company | |||||||||||
Indicate by check mark whether the registrant has filed a report on and attestation to its management’s assessment of the effectiveness of its internal control over financial reporting under Section 404(b) of the Sarbanes-Oxley Act (15 U.S.C. 7262(b)) by the registered public accounting firm that prepared or issued its audit report. Yes ☒ No ☐
If securities are registered pursuant to Section 12(b) of the Act, indicate by check mark whether the financial statements of the registrant included in the filing reflect the correction of an error to previously issued financial statements. ☐
Indicate by check mark whether any of those error corrections are restatements that required a recovery analysis of incentive-based compensation received by any of the registrant’s executive officers during the relevant recovery period pursuant to § 240.10D-1(b). ☐
Indicate by check mark whether the registrant is a shell company (as defined in Rule 12b-2 of the Exchange Act). Yes ☐ No ☒
As of June 30, 2023, the aggregate market value of the Common Stock of the registrant held by non-affiliates of the registrant was approximately $16.1 billion based on the closing price on the New York Stock Exchange on such date.
Number of shares of the registrant’s Common Stock at February 16, 2024: 292,275,668
DOCUMENTS INCORPORATED BY REFERENCE

IRON MOUNTAIN INCORPORATED
2023 FORM 10-K ANNUAL REPORT
TABLE OF CONTENTS
| PART I | 01 | ITEM 1. | |||||||||
09 | ITEM 1A. | ||||||||||
| ITEM 1B. | |||||||||||
| ITEM 1C. | |||||||||||
| ITEM 2. | |||||||||||
| ITEM 3. | |||||||||||
| ITEM 4. | |||||||||||
| PART II | ITEM 5. | ||||||||||
| ITEM 6. | |||||||||||
| ITEM 7. | |||||||||||
| ITEM 7A. | |||||||||||
| ITEM 8. | |||||||||||
| ITEM 9. | |||||||||||
| ITEM 9A. | |||||||||||
| ITEM 9B. | |||||||||||
| ITEM 9C. | |||||||||||
| PART III | ITEM 10. | ||||||||||
| ITEM 11. | |||||||||||
| ITEM 12. | |||||||||||
| ITEM 13. | |||||||||||
| ITEM 14. | |||||||||||
| PART IV | ITEM 15. | ||||||||||
| ITEM 16. | |||||||||||
ii
References in this Annual Report on Form 10-K for the year ended December 31, 2023 (this "Annual Report") to "the Company", "Iron Mountain", "we", "us" or "our" include Iron Mountain Incorporated, a Delaware corporation, and its predecessor, as applicable, and its consolidated subsidiaries, unless the context indicates otherwise.
CAUTIONARY NOTE REGARDING FORWARD-LOOKING STATEMENTS
We have made statements in this Annual Report that constitute "forward-looking statements" as that term is defined in the Private Securities Litigation Reform Act of 1995 and other securities laws. These forward-looking statements concern our current expectations regarding our future results from operations, economic performance, financial condition, goals, strategies, investment objectives, plans and achievements. These forward-looking statements are subject to various known and unknown risks, uncertainties and other factors, and you should not rely upon them except as statements of our present intentions and of our present expectations, which may or may not occur. When we use words such as "believes", "expects", "anticipates", "estimates", "plans", "intends", "pursue", "will" or similar expressions, we are making forward-looking statements. Although we believe that our forward-looking statements are based on reasonable assumptions, our expected results may not be achieved, and actual results may differ materially from our expectations. In addition, important factors that could cause actual results to differ from expectations include, among others:
•our ability or inability to execute our strategic growth plan, including our ability to invest according to plan, grow our businesses (including through joint ventures or other co-investment vehicles), incorporate alternative technologies (including artificial intelligence ("AI")) into our offerings, achieve satisfactory returns on new product offerings, continue our revenue management, expand and manage our global operations, complete acquisitions on satisfactory terms, integrate acquired companies efficiently and transition to more sustainable sources of energy;
•changes in customer preferences and demand for our storage and information management services, including as a result of the shift from paper and tape storage to alternative technologies that require less physical space;
•the costs of complying with and our ability to comply with laws, regulations and customer requirements, including those relating to data privacy and cybersecurity issues, as well as fire and safety and environmental standards;
•the impact of attacks on our internal information technology ("IT") systems, including the impact of such incidents on our reputation and ability to compete and any litigation or disputes that may arise in connection with such incidents;
•our ability to fund capital expenditures;
•the impact of our distribution requirements on our ability to execute our business plan;
•our ability to remain qualified for taxation as a real estate investment trust for United States federal income tax purposes ("REIT");
•changes in the political and economic environments in the countries in which we operate and changes in the global political climate;
•our ability to raise debt or equity capital and changes in the cost of our debt;
•our ability to comply with our existing debt obligations and restrictions in our debt instruments;
•the impact of service interruptions or equipment damage and the cost of power on our data center operations;
•the cost or potential liabilities associated with real estate necessary for our business;
•unexpected events, including those resulting from climate change or geopolitical events, could disrupt our operations and adversely affect our reputation and results of operations;
•failures to implement and manage new IT systems;
•other trends in competitive or economic conditions affecting our financial condition or results of operations not presently contemplated; and
•the other risks described in our periodic reports filed with the SEC, including under the caption "Risk Factors" in Part I, Item 1A of this Annual Report.
Except as required by law, we undertake no obligation to update any forward-looking statements appearing in this report.
iii
PART I
ITEM 1. BUSINESS.
BUSINESS OVERVIEW
We help organizations around the world protect their information, reduce storage costs, comply with regulations, facilitate corporate disaster recovery and better use their information and IT infrastructure for business advantages, regardless of its format, location or life cycle stage. We do this by storing physical records and data backup media, offering information management solutions and providing data center space for enterprise-class colocation and hyperscale deployments. We offer comprehensive records and information management services and data management services, along with the expertise and experience to address complex storage and information management challenges such as rising storage rental costs, legal and regulatory compliance and disaster recovery requirements. We provide secure and reliable data center facilities to protect digital information and ensure the continued operation of our customers’ IT infrastructure, with reliable and flexible deployment options. Our asset lifecycle management ("ALM") business allows us to provide end-to-end asset lifecycle services for hyperscale, corporate data center and corporate end-user device assets.
Founded in an underground facility near Hudson, New York in 1951, Iron Mountain Incorporated, a Delaware corporation ("IMI"), has more than 225,000 customers in a variety of industries in 60 countries around the world, as of December 31, 2023. We currently serve customers across an array of market verticals - commercial, legal, financial, healthcare, insurance, life sciences, energy, business services, entertainment and government organizations, including more than 90% of the Fortune 1000. As of December 31, 2023, we employed approximately 27,000 people. We are listed on the New York Stock Exchange (the "NYSE") and are a constituent of the Standard & Poor’s 500 Index and the Morgan Stanley Capital International ("MSCI") REIT index. As of December 31, 2023, we were number 641 on the Fortune 1000.
We have been organized and have operated as a REIT beginning with our taxable year ended December 31, 2014.
BUSINESS STRATEGY
OVERVIEW
Our company has been a market leader in the physical ecosystem supporting information storage and retrieval, as most businesses have relied on paper documents or computer tapes to store their valuable information. Over time, customers are increasing their digital information, with the new information storage ecosystem being a hybrid of physical and digital media. We are a different company to the one we have been in our past. The strategic journey we are on is driving this change and our focus remains on the four pillars outlined below to continue to grow and evolve our business.
Continued revenue growth in physical storage through revenue management actions as well as volume growth achieved in faster growing markets and our consumer business, as well as complementary business growth | •We are establishing and enhancing leadership positions in higher-growth markets such as central and eastern Europe, Latin America, Asia, the Middle East and Africa. •We continue to identify, acquire, incubate and scale complementary businesses and products to support our long-term growth objectives and drive solid returns on invested capital. These opportunities include our digital services and our ALM, Entertainment Services, Fine Arts and Consumer Storage (each as defined below) businesses. | ||||
Utilizing our global scale as well as over 70 years of customer trust to deliver differentiated data center offerings | •We have made significant progress in scaling our Global Data Center Business through acquisitions and organic growth, with 26 operating data centers across 21 global markets, either directly or through unconsolidated joint ventures. •As of December 31, 2023, approximately 93% of our data center capacity was leased. With total potential capacity of 861 megawatts ("MW") in land and buildings currently owned or operated by us, we are among the largest global data center operators. | ||||
IRON MOUNTAIN 2023 FORM 10-K | 1 | |||||||
Establishing and maintaining a leadership position in critical digital infrastructure as well as developing and offering new products and services that allow our customers to achieve reliable and secure information management solutions in an increasingly hybrid physical and digital world | •We are positioned to take advantage of the secular growth trends of the changing nature of digital infrastructure. We continue to scale our digital solutions business to complement our existing offerings in records and information management, in addition to expanding our existing leadership capabilities in our ALM, including enterprise secure IT asset disposition, and data center businesses in order to respond to our customers’ growing interest and need to react to environmental, social and corporate governance considerations. This full suite of complementary businesses puts Iron Mountain in a unique position to cross sell our products and services to our customers. •Our customers are faced with navigating a more complex regulatory environment, and one in which hybrid physical and digital solutions have become the norm. Our strategy is underpinned by our persistent focus on best-in-class customer experience, as we continue to seek innovative solutions to help our customers progress on their journey from physical storage to a digital ecosystem. | ||||
| Increased investment in our growth agenda, our business and customer-centric solutions | •We have established an investment strategy to fuel our growth. The investments we outlined in our plan for Project Matterhorn (as defined below) have been informed by our established leadership position in the physical storage business, our expanding services such as Global Digital Solutions and ALM and our significant progress in the Global Data Center Business. | ||||
PROJECT MATTERHORN
In September 2022, we announced a global program designed to accelerate the growth of our business ("Project Matterhorn"). Project Matterhorn investments focus on transforming our operating model to a global operating model. Project Matterhorn focuses on the formation of a solution-based sales approach that is designed to allow us to optimize our shared services and best practices to better serve our customers' needs. We are investing to accelerate growth and to capture a greater share of the large, global addressable markets in which we operate. We expect to incur approximately $150.0 million in costs annually related to Project Matterhorn from 2023 through 2025. Costs are comprised of (1) restructuring costs, which include (i) site consolidation and other related exit costs, (ii) employee severance costs and (iii) certain professional fees associated with these activities and (2) other transformation costs, which include professional fees such as project management costs and costs for third party consultants who are assisting in the enablement our growth initiatives. Total costs related to Project Matterhorn during the years ended December 31, 2023 and 2022 were approximately $175.2 million and $41.9 million, respectively.
BUSINESS SEGMENTS
The amount of revenues derived from our business segments and other relevant data, including financial information about geographic areas and product and service lines, for the years ended December 31, 2023, 2022 and 2021, are set forth in Note 11 to Notes to Consolidated Financial Statements included in this Annual Report.
| GLOBAL RIM BUSINESS | ||
The Global Records and Information Management ("Global RIM") Business segment includes several distinct offerings.
Records Management, stores physical records and provides information services, vital records services, courier operations, and the collection, handling and disposal of sensitive documents ("Records Management") for customers in 60 countries around the globe. As of December 31, 2023, we stored approximately 731.5 million cubic feet of hardcopy records.
Data Management, provides storage and rotation of backup computer media as part of corporate disaster recovery plans, including service and courier operations, server and computer backup services and related services offerings ("Data Management").
Global Digital Solutions, develops, implements and supports comprehensive storage and information management solutions for the complete lifecycle of our customers’ information, including the management of physical records, conversion of documents to digital formats and digital storage of information ("Global Digital Solutions").
Secure Shredding, includes the scheduled pick-up of office records that customers accumulate in specially designed secure containers we provide and is a natural extension of our hardcopy records management operations, completing the lifecycle of a record. Through a combination of shredding facilities and mobile shredding units consisting of custom built trucks, we are able to offer secure shredding services to our customers.
Entertainment Services, entertainment and media services which help industry clients store, safeguard and deliver physical media of all types, and provides digital content repository systems that house, distribute, and archive key media assets ("Entertainment Services").
2 | IRON MOUNTAIN 2023 FORM 10-K | |||||||
Consumer Storage, provides on-demand, valet storage for consumers ("Consumer Storage") utilizing data analytics and machine learning to provide effective customer acquisition and a convenient and seamless consumer storage experience.
| GLOBAL DATA CENTER BUSINESS | ||
The Global Data Center Business segment provides enterprise-class data center facilities and hyperscale-ready capacity to protect mission-critical assets and ensure the continued operation of our customers’ IT infrastructure with secure, reliable and flexible data center options. The world’s most heavily regulated organizations have trusted us with their data centers for over 15 years, and as of December 31, 2023, five of the top 10 global cloud providers were Iron Mountain Data Center customers.
| CORPORATE AND OTHER | ||
Corporate and Other consists primarily of our Fine Arts and ALM businesses and other corporate items ("Corporate and Other").
Fine Arts, provides technical expertise in the handling, installation and storing of art ("Fine Arts").
ALM, provides hyperscale and corporate IT infrastructure managers with services and solutions that enable the decommissioning, data erasure, processing and disposition or sale of IT hardware and component assets. ALM services are enabled by: secure logistics, chain of custody and complete asset traceability practices, environmentally-responsible asset processing and recycling, and data sanitization and asset refurbishment services that enable value recovery through asset remarketing. In addition, ALM also offers workplace IT asset management services including storage, configuration, deployment, device support and end-of-life disposition for employee IT devices. Our ALM services focus on protecting and eradicating customer data while maintaining strong, auditable and transparent chain of custody practices.
Corporate and Other also includes costs related to executive and staff functions, including finance, human resources and IT, which benefit the enterprise as a whole.
IRON MOUNTAIN 2023 FORM 10-K | 3 | |||||||
BUSINESS ATTRIBUTES
Our business has the following attributes:
Large, Diversified, Global Business  | The world’s most heavily regulated organizations trust us with the storage of their records. Our mission-critical storage offerings and related services generated approximately $5.5 billion in annual revenue in 2023. Our business has a highly diverse customer base of more than 225,000 customers - with no single customer accounting for more than approximately 1% of revenue during the year ended December 31, 2023 - and operates in 60 countries globally. This presents a significant cross-sell opportunity for our expanding solutions, including digital, data center and ALM. 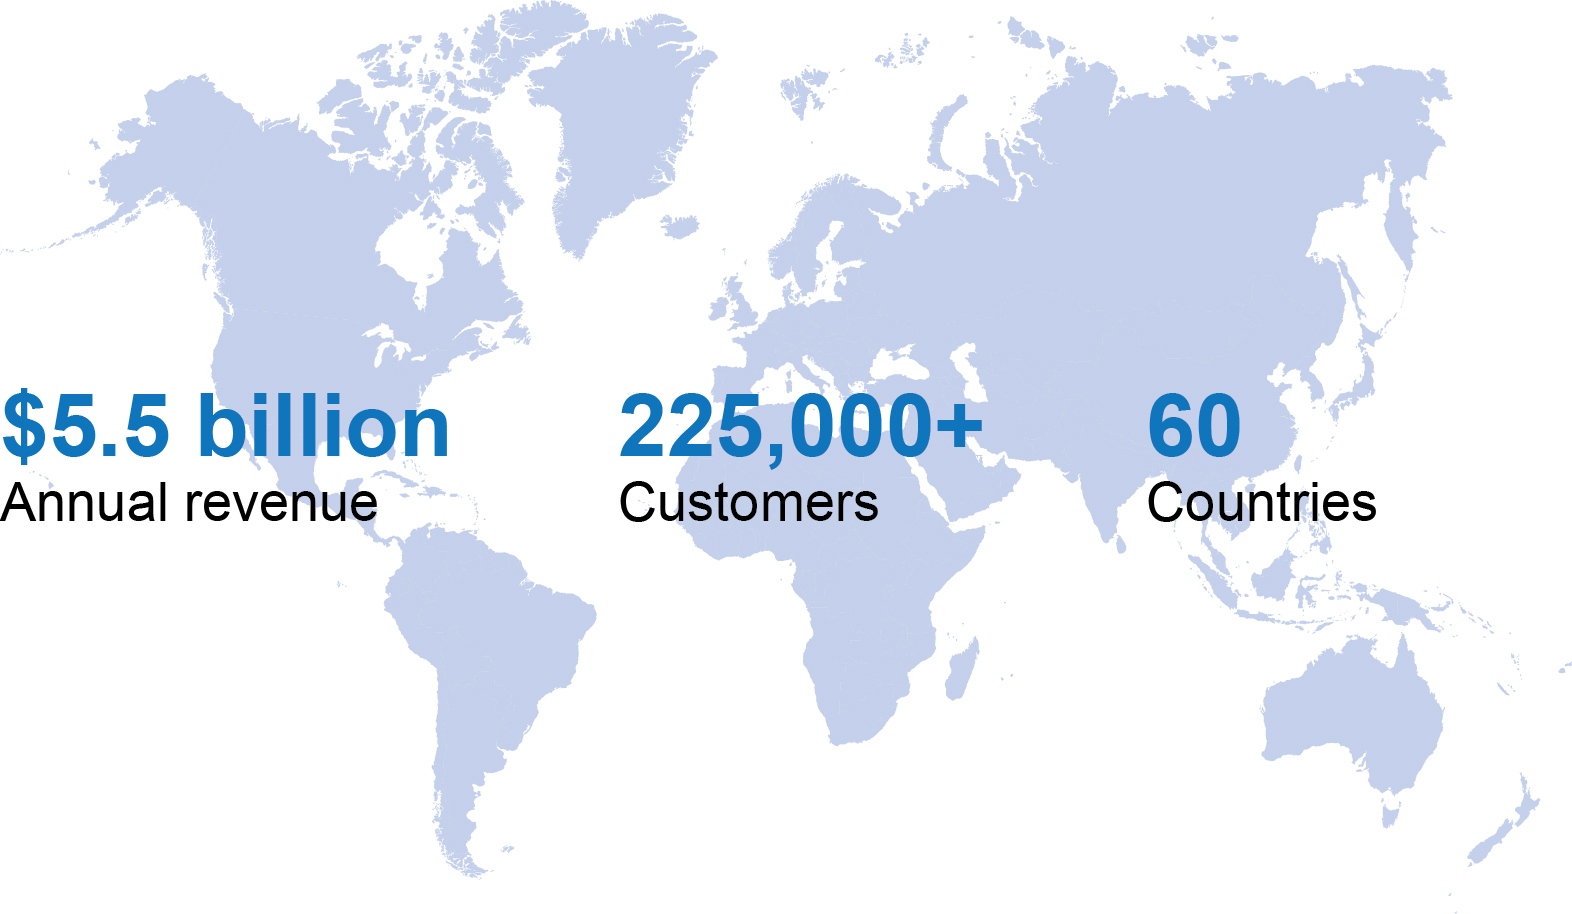 | ||||
Recurring, Durable Revenue Stream  | We generate a majority of our revenues from contracted storage rental fees, via agreements that generally range from one to five years in length. Historically, in our Records Management business, we have seen strong customer retention (of approximately 98%) and solid physical records retention; more than 50% of physical records that entered our facilities approximately 15 years ago are still with us today. We have also seen strong customer retention in our Global Data Center Business. | ||||
Comprehensive Information Management Solution  | As an S&P 500 REIT with approximately 1,400 locations globally and with offerings spanning physical storage, digitization solutions and digital storage, we are positioned to provide a holistic offering to our customers. We are able to cater to our customers’ physical and digital needs and to help guide their digital transformation journey. | ||||
Significant Owner and Operator of Real Estate  | We operate approximately 98 million square feet of real estate worldwide. Our owned real estate footprint spans to over 23 million square feet. | ||||
Limited Revenue Cyclicality  | Historically, economic downturns have not significantly affected our storage rental business. Due to the durability of our total global physical volumes, the success of our revenue management initiatives, and the growth of our Global Data Center Business, we believe we can continue to grow organic storage rental revenue over time. | ||||
Shifting Revenue Mix  | We have identified a number of areas where we see opportunity for growth as we position ourselves to unlock greater value for our customers. These business lines, including Global Data Center, ALM and Consumer Storage, represent markets with strong secular growth. | ||||
4 | IRON MOUNTAIN 2023 FORM 10-K | |||||||
In addition, our Global Data Center Business has the following attributes:
Large Data Center Platform with Significant Expansion Opportunity  | As of December 31, 2023, we had 250 MW of leasable capacity with an additional 611 MW under construction or held for development. | ||||
Differentiated Compliance and Security  | We offer comprehensive compliance support and physical and cyber security. Our Security-in-Depth approach to security includes a combination of technical and human security measures, and experienced senior military and public sector security leaders oversee our security. As of December 31, 2023, our data centers comply with one of the most comprehensive compliance programs in the industry, including enterprise-wide certified ISO 14001 and 50001 environmental and energy management systems. We also report globally on service organizational controls, as well as global ISO 27001 certification, and PCI-DSS compliance, and meet FISMA HIGH and FedRAMP controls in the United States. | ||||
Efficient Access and Flexibility  | We have the ability to provide customers with a range of deployment options from one cabinet to an entire building, leveraging our global portfolio of hyperscale-ready and underground data centers. We also provide access to numerous carriers, cloud providers and peering exchanges with migration support. | ||||
100% Green Powered Data Centers  | As of December 31, 2023, our Global Data Center platform continues to match 100% of its consumption with renewable electricity procurement and benefits from low power usage effectiveness ("PUE"). As of October 2023, we are in the top 30 of the Environmental Protection Agency's National Top 100 Partners list, with green power comprising 94% of our company-wide U.S. electricity use. We offer the Green Power Pass, which allows customers to include the power they consume at any Iron Mountain data centers as green power in their CDP, RE100, GRI or other sustainability reporting. | ||||
COMPETITION
We compete with thousands of storage and information management services providers around the world, as well as storage and information management services managed and operated internally by organizations. We believe that competition for records and information customers is based on price, reputation and reliability, quality and security of storage, quality of service and scope and scale of technology. While the majority of our competitors operate in only one market or region, we believe we provide a differentiated global offering that competes effectively in these areas.
We also compete with numerous data center developers, owners and operators, many of whom own properties similar to ours in some of the same metropolitan areas where our facilities are located. We believe that competition for data center customers is based on availability of power, security considerations, location, connectivity and rental rates, and we generally believe we compete effectively in each of these areas. Additionally, we believe our strong brand, global footprint and excellent commercial relationships enable us to compete successfully and provide significant cross-sell opportunities with our existing customer base.
Similarly, in our ALM business, we compete with both hyperscalers and individual corporate clients who manage their own asset recycling and management, as well as external competitors.
HUMAN CAPITAL MANAGEMENT
EMPLOYEES
As of December 31, 2023, we employed approximately 10,500 employees in the United States and approximately 16,500 employees outside of the United States. As of December 31, 2023, approximately 400 employees were represented by unions in North America and approximately 725 employees were represented by unions in Latin America. All union employees are currently under renewed labor agreements or operating under an extension agreement.
IRON MOUNTAIN 2023 FORM 10-K | 5 | |||||||
BENEFIT PROGRAMS
We provide our employees with benefits that are designed to support their overall physical, financial, emotional and social well-being. These benefits vary by location but generally include health and welfare benefits, paid time off, and programs to support financial security. Additionally, employees are able to access emotional well-being resources through global employee assistance programs. Certain unionized employees receive benefits through unions and are not eligible to participate in our benefit programs. In addition to base compensation and other usual benefits, a significant portion of full-time employees participate in some form of incentive-based compensation program that provides payments based on revenues, profits or attainment of specific objectives for the unit in which they work.
COMPANY CULTURE
We recognize that an inspired culture is foundational to how we deliver on our purpose and create sustained growth and value for our shareholders. Iron Mountain's culture is deeply rooted in its enduring values: Act with Integrity, Own Safety and Security, Build Customer Value, Take Ownership and Promote Inclusion and Teamwork. While Iron Mountain is a culture of learning, collaboration, diversity and well-being, we know that culture overall comes down to what it feels like to work at Iron Mountain. This is why we celebrate and recognize our employees who consistently demonstrate Iron Mountain's values in measurable ways while inspiring others to do the same. We commit significant resources to sustaining a culture that enables voice and innovation, and facilitates trust, engagement, belonging and performance. We regularly survey our employees on a range of topics to measure our engagement and effectiveness and to obtain their views. In addition, we use data to gain insight to the global distribution of our employees, where they work, how they work and cost to serve. We use all of this information to drive increased employee engagement and success, as well as to refine our approach.
DIVERSITY, EQUITY AND INCLUSION
We continue to prioritize diversity, equity, and inclusion ("DEI") as core principles of our corporate strategic goals.
Our Global DEI Council is made up of the Executive Leadership Team and is chaired by Iron Mountain President and CEO Bill Meaney. The Global DEI Council supports our DEI strategy and initiatives, monitors the progress of DEI initiatives and enterprise goals, ensures accountability based on identifiable measures and goals and communicates DEI progress to stakeholders.
In June 2023, we committed to investing in the growth and wellbeing of our female leaders (Directors and VPs) by funding a comprehensive development program, Women in Leadership ("WiL"). WiL is specifically designed to support women in their career progression and prepare them for critical leadership roles.
We also formally expanded our investment in our Employee Resource Groups ("ERGs") to elevate their impact and reach. Our ERGs support Iron Mountain’s DEI strategy by fostering a sense of belonging for their colleagues, increasing talent attraction, retention, and development efforts and being supportive partners.
Iron Mountain scored 90% on the Human Rights Campaign’s Corporate Equality Index for LGBTQ+ and placed as a top scorer on the 2023 Disability Equality Index. We also received the JPMorgan Chase Strategic Diverse Gold Supplier Award for our commitment to supplier diversity, and the contributions of our very own supplier diversity program where we exceeded our target of $70 million in supplier diversity spend during fiscal 2023. In July 2023, Bill Meaney was named among the best CEOs for diversity in a large company by Comparably, a ZoomInfo Technologies company that collects data on wage equity and company culture. In addition, Iron Mountain was named among Comparably's 2023 Best Companies for Women and Best Companies for Diversity.
COMMUNITY INVOLVEMENT
We are committed to integrating responsible and sustainable practices throughout our organization to help our operations have a positive impact on the environment and the communities in which we operate. We aim to give back to the communities where we live and work, and believe that this commitment helps in our efforts to attract and retain employees. We offer philanthropic support to our global community through our Living Legacy Initiative, which is our commitment to help preserve and make accessible cultural and historical information and artifacts. We encourage volunteerism in the communities in which we live and work through our Moving Mountains volunteer program, offering paid time off for employees to help community-based and civic-minded organizations.
6 | IRON MOUNTAIN 2023 FORM 10-K | |||||||
INSURANCE
For strategic risk transfer purposes, we maintain a comprehensive insurance program with insurers that we believe to be reputable and which have adequate capitalization in amounts that we believe to be appropriate. Property insurance is purchased on a comprehensive basis, including flood and earthquake (including excess coverage), subject to certain policy conditions, sublimits and deductibles. Property is insured based upon the replacement cost of real and personal property, including leasehold improvements, business income loss and extra expense. Other types of insurance that we carry, which are also subject to certain policy conditions, sublimits and deductibles, include medical, workers’ compensation, general liability, umbrella, automobile, professional, cyber, warehouse legal liability and directors’ and officers’ liability policies.
GOVERNMENT REGULATION
We are required to comply with numerous laws and regulations covering a wide variety of subject matters which may have a material effect on our capital expenditures, earnings and competitive position.
For example, some of our currently and formerly owned or leased properties were previously used by entities other than us for industrial or other purposes, or were affected by waste generated from nearby properties, that involved the use, storage, generation and/or disposal of hazardous substances and wastes, including petroleum products. In some instances, this prior use involved the operation of underground storage tanks or the presence of asbestos-containing materials. Where we are aware of environmental conditions that require remediation, we undertake appropriate activity, in accordance with all legal requirements. Although we have from time to time conducted limited environmental investigations and remedial activities at some of our former and current facilities, we have not undertaken environmental reviews of all of our properties. We therefore may be potentially liable for environmental costs and may be unable to sell, rent, mortgage or use contaminated real estate owned or leased by us. Under various federal, state and local environmental laws, we may be liable for environmental compliance and remediation costs to address contamination, if any, located at owned and leased properties as well as damages arising from such contamination, whether or not we know of, or were responsible for, the contamination, or the contamination occurred while we owned or leased the property. Environmental conditions for which we might be liable may also exist at properties that we may acquire in the future. In addition, future regulatory action and environmental laws may impose costs for environmental compliance that do not exist today.
We transfer a portion of our risk of financial loss due to currently undetected environmental matters by purchasing an environmental impairment liability insurance policy, which covers all owned and leased locations. Coverage is provided for both liability and remediation costs.
In addition, we are subject to numerous laws and regulations relating to data privacy and cybersecurity, which are complex, change frequently and have tended to become more stringent over time. We have an established privacy compliance framework and devote substantial resources, and may in the future have to devote significant additional resources, to facilitate compliance with these laws and regulations, and to investigate, defend or remedy actual or alleged violations or breaches. Any failure by us to comply with, or remedy any violations or breaches of, these laws and regulations could negatively impact our operations, result in the imposition of fines and penalties, liability and litigation, significant costs and expenses and reputational harm.
For more information about laws and regulations that could affect our business, see "Item 1A. Risk Factors" included in this Annual Report.
SUSTAINABILITY
At Iron Mountain, we are using our influence and expertise to drive innovations that will not only protect and elevate the power of our customers’ work, but make a lasting, positive impact on people, planet, and performance. Our four focus areas, where we can deliver uniquely through owned operations and customers' enablement, are safeguarding our customers’ information, empowering employees, serving our communities, and protecting the environment.
Iron Mountain is committed to sustainable growth, and this is highlighted through initiatives and targets within the company. We have successfully achieved seven of the ambitious sustainability goals we set in 2021 to address our environmental footprint, corporate philanthropy, volunteerism and DEI practices. We are committed to reach net zero greenhouse gas emissions by 2040. As an employer, we are committed to the safety and well-being of our employees and strive to cultivate a culture of inclusion that values diverse perspectives across our global workforce. Iron Mountain and its employees also make a social impact in the communities in which we operate through charitable giving and volunteerism.
Our work continues to receive recognition. In 2023, Iron Mountain received the Low Carbon Hero Award recognizing our efforts to implement social and technical practices to reduce our carbon footprint. Also in 2023, Iron Mountain joined EV100 and is committed to electrifying 100% of our company cars and 50% of our vans by 2030. With operations in 60 countries, Iron Mountain was recognized as the most international committed fleet in the 2023 EV100 Annual Report.
IRON MOUNTAIN 2023 FORM 10-K | 7 | |||||||
Iron Mountain is committed to transparent reporting on our sustainability efforts and we leverage widely adopted reporting frameworks to report annually on our results. Our annual sustainability report, aligned with the Global Reporting Initiative framework, highlights our progress against key measures of success for our community, environment and people. In addition, we continue to work to further align our reporting with the recommendations of the Financial Stability Board’s Task Force on Climate-related Financial Disclosures to disclose climate-related financial risks and opportunities, and in 2022 we completed our first climate scenario analysis. The process brought together our most senior leaders from across all business units and functions to explore the potential impacts of climate change related to several different warming scenarios. The analysis resulted in the identification of seven strategic themes where Iron Mountain should focus its future discussions regarding climate resilience, which include physical impacts, business strategy and innovation, and reputational and societal risks.
We are a member of the FTSE4Good Index, MSCI World ESG Index, MSCI World Climate Change Index and MSCI USA ESG Select Index, each of which include companies that meet globally recognized corporate responsibility standards. A copy of our sustainability responsibility report is available on the "Who we are" section of our website, www.ironmountain.com, under the heading "Sustainability". We are not including the information contained on or available through our website as part of, or incorporating such information by reference into, this Annual Report.
 | |||||
STRONG ENVIRONMENTAL FOCUS •Iron Mountain provides a Green Power Pass solution in the Data Center market to help customers manage their carbon footprint. •A part of RE100 and EV100 Initiatives - commitment to use renewable energy sources for 100% of our worldwide electricity by 2040 and convert 100% of our company cars and 50% of our vans to electric vehicles by 2030. •Founding signatory of the 24/7 Carbon Free Energy (CFE) compact. As of 2023, Iron Mountain has over 130 locations across the United States with the ability to track and match renewable energy usage on an hourly basis. •85% of our global electricity use was from renewable sources in 2022. •Reduced Scope 1 and 2 greenhouse gas (GHG) emissions by 32% compared to our 2016 baseline as part of our net zero by 2040 commitment. •Received 90% or greater on the Human Rights Campaign Corporate Equality Index every year since 2018. | |||||
 | |||||
INTERNET WEBSITE
Our Internet address is www.ironmountain.com. Under the "Investors" section on our website, we make available, free of charge, our Annual Reports on Form 10-K, our Quarterly Reports on Form 10-Q, our Current Reports on Form 8-K and amendments to those reports filed or furnished pursuant to Section 13(a) or 15(d) of the Securities Exchange Act of 1934 (the "Exchange Act") as soon as reasonably practicable after such forms are filed with or furnished to the SEC. We are not including the information contained on or available through our website as a part of, or incorporating such information by reference into, this Annual Report. Copies of our corporate governance guidelines, code of ethics and the charters of our audit, compensation, finance, nominating and governance, risk and safety, and technology committees are available on the "Investors" section of our website, www.ironmountain.com, under the heading "Corporate Governance".
8 | IRON MOUNTAIN 2023 FORM 10-K | |||||||
ITEM 1A. RISK FACTORS.
We face many risks. If any of the events or circumstances described below actually occur, we and our businesses, financial condition or results of operations could suffer, and the trading price of our debt or equity securities could decline. Our current and potential investors should consider the following risks and the information contained under the heading "Cautionary Note Regarding Forward-Looking Statements" before deciding to invest in our securities.
BUSINESS RISKS
Failure to execute our strategic growth plan may adversely impact our financial condition and results of operations.
As part of our strategic growth plan, including Project Matterhorn, we expect to invest in our existing businesses, including records and information management storage and services businesses in our higher-growth markets, data centers, ALM business and other complementary businesses, and in new businesses, business strategies, products, services, technologies and geographies. These initiatives may involve significant risks and uncertainties, including:
•our inability to maintain relationships with key customers and suppliers or to execute on our plan to incorporate the digitization of our customers’ records and new digital information technologies into our offerings;
•failure to achieve satisfactory returns on new product offerings, acquired companies, joint ventures, growth initiatives, or other investments, particularly in markets where we do not currently operate or have a substantial presence;
•our inability to identify suitable companies to acquire, invest in or partner with;
•our inability to complete acquisitions or investments on satisfactory terms;
•our inability to structure acquisitions or investments in a manner that complies with our debt covenants and is consistent with our leverage ratio goals;
•challenges in managing costs to offset the impact of inflationary pressure;
•increased demands on our management, operating systems, internal controls and financial and physical resources and, if necessary, our inability to successfully expand our infrastructure;
•incurring additional debt necessary to acquire suitable companies or make other growth investments if we are unable to pay the purchase price or make the investment out of working capital or the issuance of our common stock or other equity securities;
•our inability to manage the budgeting, forecasting and other process control issues presented by future growth, particularly with respect to new lines of business;
•insufficient revenues to offset expenses and liabilities associated with new investments; and
•our inability to attract, develop and retain skilled employees to lead and support our strategic growth plan, particularly in new businesses, technologies, products or offerings outside our core competencies.
Our new ventures are inherently risky and we can provide no assurance that such strategies and offerings will be successful in achieving the desired returns within a reasonable timeframe, if at all, and that they will not adversely affect our business, reputation, financial condition, and operating results.
If stored records and tapes become less active our service revenue growth and profits from related services may decline.
Our Records Management and Data Management service revenue growth is being negatively impacted by declining activity rates as stored records and tapes are becoming less active and more archival. The amount of information available to customers digitally or in their own information systems has been steadily increasing in recent years, and we believe this trend will continue. As a result, our customers are less likely than they have been in the past to retrieve records and rotate tapes, thereby reducing their activity levels. At the same time, many of our costs related to records and tape related services remain relatively fixed. In addition, our reputation for providing secure information storage is critical to our success, and actions to manage cost structure, such as outsourcing certain transportation, security or other functions, could negatively impact our reputation and adversely affect our business, and, if we are unable to appropriately align our cost structure with decreased levels of service activity, our operating results could be adversely affected.
IRON MOUNTAIN 2023 FORM 10-K | 9 | |||||||
Our customers may shift from paper and tape storage to alternative technologies that may shift our revenue mix away from storage revenue.
We derive substantial revenues from rental fees for the storage of physical records and computer backup media and from storage related services. Storage volume and/or demand for our traditional storage related services may decline as our customers adopt alternative storage technologies or as retention requirements evolve, which may require significantly less space than traditional physical records and tape storage. While volumes in our Global RIM Business segment were relatively steady in 2023 and we expect them to remain relatively consistent in the near term, we can provide no assurance that our customers will continue to store most or a portion of their records as paper documents or as tapes, or that the paper documents or tapes they do store with us will require our storage related services at the same levels as they have in the past. A significant shift by our customers to storage of data through non-paper or non-tape-based technologies, whether now existing or developed in the future, could adversely affect our businesses. In addition, the digitization of records may shift our revenue mix from the more predictable storage revenue to service revenue, which is inherently more volatile.
We and our customers are subject to laws and governmental regulations relating to data privacy and cybersecurity, and our customers’ demands in this area are increasing. This may cause us to incur significant expenses and non-compliance with such regulations and demands could harm our business.
We and our customers are subject to numerous laws and regulations relating to data privacy and cybersecurity. These regulations are complex, change frequently and have tended to become more stringent over time. In addition, a growing number of regulatory bodies have adopted data breach notification requirements and increased enforcement of regulations regarding the use, access, accuracy and security of personal information. Finally, as a result of the continued emphasis on information security and instances in which personal information has been compromised, our customers are requesting that we take increasingly sophisticated measures to enhance security and comply with data privacy regulations, and that we assume higher liability under our contracts.
We have an established privacy compliance framework and devote substantial resources, and may in the future have to devote significant additional resources, to facilitate compliance with global laws and regulations, our customers’ data privacy, data residency and security demands, and to investigate, defend or remedy actual or alleged violations or breaches. Any failure by us to comply with, or remedy any violations or breaches of, laws and regulations or customer requirements could negatively impact our operations, result in the imposition of fines and penalties, contractual liability and litigation, significant costs and expenses and reputational harm.
Expansion into Digital and ALM services means that our privacy and security risk profile is increasing. In particular, we are hosting increasing volumes of customer digital data, including sensitive and confidential data, and disposing of customer data-bearing devices. This may result in increased regulatory exposure, contractual liability and security expectations from customers. Finally, emerging artificial intelligence ("AI") regulations, increasing use of AI and generative AI tools and their integration into our businesses may require additional resources and create additional compliance and cybersecurity risks.
Attacks on our internal IT systems could damage our reputation, cause us to lose revenues, and adversely affect our business, financial condition and results of operations.
Our reputation for providing secure information storage to customers is critical to the success of our business. Our reputation or brand, and specifically, the trust our customers place in us, could be negatively impacted in the event of perceived or actual failures by us to store information securely. Although we seek to prevent and detect attempts by unauthorized users to gain access to our IT systems, and incur significant costs to do so, our IT and network infrastructure has in the past been and may in the future be vulnerable to attacks by hackers, including state-sponsored organizations with significant financial and technological resources, breaches due to employee error, fraud or malice or other disruptions (including, but not limited to, computer viruses and other malware, denial of service, and ransomware), which may involve a breach requiring us to notify regulators, clients or employees and enlist identity theft protection. Moreover, until we have migrated businesses we acquire onto our IT systems or ensured compliance with our information technology security standards, we have in the past and may in the future face additional risks because of the continued use of predecessor IT systems. We utilize remote work arrangements and outsource certain support services, including cloud storage systems and cloud computing services, to third parties, which has in the past and may in the future subject our IT and other sensitive information to additional risk. A successful breach of the security of our IT systems could lead to theft or misuse of our customers’ proprietary or confidential information or our employees’ personal information and result in third party claims against us, regulatory penalties, and reputational harm. Although we maintain insurance coverage for various cybersecurity risks, there is no guarantee that all costs or losses incurred will be fully insured. Damage to our reputation could make us less competitive, which could negatively impact our business, financial condition and results of operations.
Failure to successfully integrate acquired businesses could negatively impact our balance sheet and results of operations.
Strategic acquisitions are an important element of our growth strategy and the success of any acquisition we make depends in part on our ability to integrate the acquired business and realize anticipated synergies. The process of integrating acquired businesses, particularly in new markets or for new offerings, may involve unforeseen difficulties and may require a disproportionate amount of our management’s attention and our financial and other resources.
10 | IRON MOUNTAIN 2023 FORM 10-K | |||||||
For example, the success of our significant acquisitions depends, in large part, on our ability to realize the anticipated benefits, including cost savings or revenue acceleration from combining the acquired businesses with ours. To realize these anticipated benefits, we must be able to successfully integrate our business and the acquired businesses, and this integration is complex and time-consuming. We may encounter challenges in the integration process including the following:
•challenges and difficulties associated with managing our larger, more complex, company;
•conforming standards, controls, procedures and policies, business cultures and compensation and benefits structures between the two businesses;
•consolidating corporate and administrative infrastructures;
•coordinating geographically dispersed organizations;
•retaining critical acquired talent;
•potential unknown liabilities and unforeseen expenses or delays associated with an acquisition; and
•our ability to deliver on our strategy going forward.
Further, our acquisitions subject us to liabilities (including tax liabilities) that may exist at an acquired company, some of which may be unknown. Although we and our advisors conduct due diligence on the businesses we acquire, there can be no guarantee that we are aware of all liabilities of an acquired company. These liabilities, and any additional risks and uncertainties related to an acquired company not known to us or that we may deem immaterial or unlikely to occur at the time of the acquisition, could negatively impact our future business, financial condition and results of operations.
We can give no assurance that we will ultimately be able to effectively integrate and manage the operations of any acquired business or realize anticipated synergies. The failure to successfully integrate the cultures, operating systems, procedures and information technologies of an acquired business could have a material adverse effect on our financial condition and results of operations.
Our future growth depends in part upon our ability to continue to effectively manage and execute on revenue management.
Over the past several years, our organic revenue growth has been positively impacted by our ability to effectively introduce, expand and monitor revenue management. If we are not able to continue and effectively manage pricing, our results of operations could be adversely affected and we may not be able to execute on our strategic growth plan.
Our customer contracts may not always limit our liability and may sometimes contain terms that could subject us to significant liability or lead to disputes in contract interpretation.
Our customer contracts typically contain standardized provisions limiting our liability regarding the services we perform and the loss or destruction of, or damage to, records, information, or other items stored with us; however, some of our contracts with large customers and some of the contracts assumed in our acquisitions contain no such limits or contain non-standard limits. We can provide no assurance that our limitation of liability provisions will be enforceable in all instances or, if enforceable, that they would otherwise protect us from liability. In the past, we have had relatively few disputes with our customers regarding the terms of their customer contracts, and most disputes to date have not been material, but we can provide no assurance that we will not have material disputes in the future. Moreover, as we expand our operations into new businesses, including digital solutions, ALM, and the storage of valuable items, and respond to customer demands for higher limitation of liability, our exposure to contracts with higher or no limitations of liability and disputes with customers over contract interpretation may increase. Although we maintain a comprehensive insurance program, we can provide no assurance that we will be able to maintain insurance policies on acceptable terms or with high enough coverage amounts to cover losses to us in connection with customer contract disputes.
IRON MOUNTAIN 2023 FORM 10-K | 11 | |||||||
As a global company, we are subject to the unique risks of operating in many countries.
As of December 31, 2023, we operated in 60 countries. The global nature of our business and our growth strategy, which includes continued acquisitions and investments in countries where we do not currently operate, is subject to numerous risks, including:
•fluctuations of currency exchange rates in the markets in which we operate;
•the impact of laws and regulations that apply to us in countries in which we operate or have made investments; in particular, we are subject to sanctions and anti-corruption laws, such as the Foreign Corrupt Practices Act and the United Kingdom Bribery Act, and, although we have implemented internal controls, policies and procedures and training to deter prohibited practices, our employees, partners, contractors or agents may violate or circumvent such policies and the law;
•costs and difficulties associated with managing global operations, including cross-border sales;
•the volatility of certain economies in which we operate;
•political uncertainties and changes in the global political climate or other global events, such as trade wars or global pandemics, which may create additional risk in relation to our global operations, which may become more pronounced as we consolidate operations across countries and need to move data across borders;
•the risk that business partners upon whom we depend for technical assistance or management and acquisition expertise in some markets will not perform as expected;
•difficulties attracting and retaining local management and key employees to operate our business in certain countries; and
•cultural differences and differences in business practices and operating standards, as well as risks and challenges in expanding into countries where we have no prior operational experience.
If we fail to meet our commitment to transition to more renewable and sustainable sources of energy, it may negatively impact our ability to attract and retain customers, employees and investors who focus on this commitment. Furthermore, changes to environmental laws and standards may increase the cost to operate some of our businesses. This could impact our results of operations, our competitiveness and the trading value of our stock.
We have made a commitment to prioritize sustainable energy practices, reduce our carbon footprint and transition to more renewable and sustainable sources of energy, particularly in our Global Data Center Business. We have made progress towards reducing our carbon footprint, but if we are not successful in continuing this reduction or if our customers, employees and investors are not satisfied with our sustainability efforts, it may negatively impact our ability to attract and retain customers, employees and investors who focus on this commitment. This could negatively impact our results of operations and the trading of our stock.
Furthermore, changes in environmental laws in any jurisdiction in which we operate could increase compliance costs or impose limitations on our operations. For example, our emergency generators at our data centers are subject to regulations and permit requirements governing air pollutants, and the heating, ventilation and air conditioning and fire suppression systems at some of our data centers and data management locations may include ozone-depleting substances that are subject to regulation. While environmental regulations do not normally impose material costs upon operations at our facilities, unexpected events, equipment malfunctions, human error and changes in law or regulations, among other factors, could result in unexpected costs, which could be material.
Our use of joint ventures or other co-investment vehicles could expose us to additional risks and liabilities, including our reliance on joint venture or other co-investment vehicles partners who may have economic and business interests that are inconsistent with our business interests and our lack of sole decision-making authority.
As part of our growth strategy, particularly in connection with our international and data center expansion, we currently, and may in the future, co-invest with third parties using joint ventures or other co-investment vehicles. These ventures can result in our holding non-controlling interests in, or having responsibility for managing the affairs of, a property or portfolio of properties, business, partnership, joint venture or other entity. In connection with our pursuit or entrance into any such venture, we may be subject to additional risks, including:
•our ability to sell our interests in the venture may be limited by the venture agreement;
•we may not have the right to exercise sole decision-making authority regarding the properties, business, partnership, venture or other entity;
•we may be liable for the venture's failure to comply with applicable law despite only having a non-controlling interest in the venture;
•if our partners become bankrupt or fail to fund their share of required capital contributions, we may choose or be required to contribute unplanned capital; and
•our partners may have economic, tax or other interests or goals that are inconsistent with our interests or goals, and that could affect our ability to negotiate satisfactory venture terms, to operate the property or business or maintain our qualification for taxation as a REIT.
Each of these factors may result in returns on these investments being less than we expect or in losses, and our financial and operating results may be adversely affected.
12 | IRON MOUNTAIN 2023 FORM 10-K | |||||||
Significant costs or disruptions at our data centers could adversely affect our business, financial condition and results of operations.
Our Global Data Center Business depends on providing customers with highly reliable facilities, power infrastructure and operations solutions, and we will need to retain and hire qualified personnel to manage our data centers. Service interruptions or significant equipment damage could result in difficulty maintaining service-level commitment obligations that we owe to certain of our customers. Service interruptions or equipment damage may occur at one or more of our data centers because of numerous factors, including: human error; equipment failure; physical, electronic and cyber security breaches; fire, hurricane, flood, earthquake and other natural disasters; water damage; fiber cuts; extreme temperatures; power loss or telecommunications failure; war, terrorism and any related conflicts or similar events worldwide; and sabotage and vandalism.
We purchase significant amounts of electricity and water for cooling from suppliers that are subject to environmental laws, regulations and permit requirements. These environmental requirements are subject to material change, which could result in increases in our suppliers’ compliance costs that may be passed through to us or otherwise constrain the availability of such resources. In addition, climate change may increase the likelihood that our data centers are affected by some of these factors.
While these risks could impact our overall business, they could have a more significant impact on our Global Data Center Business, where we have service-level commitment obligations to certain of our customers. As a result, service interruptions or significant equipment damage at our data centers could result in difficulty maintaining service-level commitments to these customers and potential claims related to such failures. Because our data centers are critical to many of our customers’ businesses, service interruptions or significant equipment damage at our data centers could also result in lost profits or other indirect or consequential damages to our customers, which could in turn result in contractual liability to our customers or impair our ability to obtain and retain customers, which would adversely affect both our ability to generate revenue and our results of operations.
We also rely on third party telecommunications carriers to provide internet connectivity to our customers. These carriers may elect not to offer or to restrict their services within our data centers or may elect to discontinue such services. Furthermore, carriers may face business difficulties, which could affect their ability to provide telecommunications services or the quality of such services. If connectivity is interrupted or terminated, our financial condition and results of operations may be adversely affected. Events such as these may also impact our reputation as a data center provider which could adversely affect our results of operations.
Our Global Data Center Business is susceptible to regional costs of power, power shortages, planned or unplanned power outages and limitations on the availability of adequate power resources. We rely on third parties to provide power to our data centers. We are therefore subject to an inherent risk that such third parties may fail to deliver such power in adequate quantities or on a consistent basis. If the power delivered to our data centers is insufficient or interrupted, we would be required to provide power through the operation of our on-site generators, generally at a significantly higher operating cost. Additionally, global fluctuations in the price of power can increase the cost of energy, and we may be limited in our ability to, or may not always choose to, pass these increased costs on to our customers.
We face additional risks in expanding our Global Data Center Business, including the significant amount of capital required.
Expanding our Global Data Center Business requires significant capital commitments. In addition, we may be required to commit significant operational and financial resources in connection with the organic growth of our Global Data Center Business, generally 12 to 24 months in advance of securing customer contracts, and we may not have enough customer demand to support these data centers when they are built.
We are currently experiencing rising construction costs which reflect the increase in cost of labor and raw materials, as well as supply chain and logistical challenges. Additional or unexpected disruptions to our supply chain, continued inflationary pressures or high interest rates, or changes in customer requirements could significantly affect the cost or timing of our planned expansion projects and interfere with our ability to meet commitments to customers who have contracted for space in new data centers under construction.
All construction-related data center projects require us to carefully select, manage, and rely on the experience of one or more design firms, general contractors, and associated subcontractors during the design and construction process, and to obtain critical government permits and authorizations. Should a design firm, general contractor, significant subcontractor, or key supplier experience financial or operational problems during the design or construction process or fail to perform properly, or should we be unable to obtain, or experience delays in obtaining, all necessary zoning, land-use, building, occupancy and other governmental permits and authorizations, we could experience significant delays, increased costs to complete the project, penalties under customer preleases and other negative impacts to the expected return on our committed capital.
There can be no assurance we will have sufficient customer demand to support the data centers we have acquired, or that we will not be adversely affected by the risks noted above under "Significant costs or disruptions at our data centers could adversely affect our business, financial condition and results of operations", which could make it difficult for us to realize expected returns on our investments, if any.
IRON MOUNTAIN 2023 FORM 10-K | 13 | |||||||
Our ALM business may be subject to additional risks, including those related to its client and geographic concentration, government trade policies, and macroeconomic conditions.
A significant portion of the revenue from our ALM business is derived from a limited number of clients and tied to cyclical projects involving the decommissioning and destruction of IT assets and the disposition of components of such assets to purchasers in concentrated geographies. Though we generally enter into long-term contracts with such clients, the volume of work we perform for specific clients may vary over the life of each contract due to various factors including changes in client behavior or macroeconomic conditions impacting the availability of new IT assets in the marketplace. There can be no assurance that we will be able to retain our current volumes, existing clients or that, if we were to lose one or more of our significant clients, we would be able to replace such clients with clients that generate a comparable amount of revenue. Further, many of the purchasers of the decommissioned IT asset components are geographically concentrated, particularly within mainland China. If governments enact trade policies that restrict the export of IT assets into China or other markets in which we sell decommissioned IT asset components, or increase the enforcement of such policies, then the revenue from the sale of these assets may be negatively impacted. Additionally, uncertain macroeconomic conditions, particularly within mainland China, may reduce our purchasers’ demand for the IT asset components that we sell, thereby reducing our revenues and earnings.
Failure to comply with certain regulatory and contractual requirements under our United States Government contracts could adversely affect our revenues, operating results and financial position and reputation.
Having the United States Government as a customer subjects us to certain regulatory and contractual requirements. Failure to comply with these requirements could subject us to investigations, price reductions, up to treble damages, and civil penalties. Noncompliance with certain regulatory and contractual requirements could also result in us being suspended or debarred from future United States Government contracting. We may also face private derivative securities claims because of adverse government actions. Any of these outcomes could have a material adverse effect on our revenues, operating results, financial position and reputation.
We may be subject to certain costs and potential liabilities associated with the real estate required for our business.
As of December 31, 2023, we operated approximately 1,400 facilities worldwide, including approximately 600 in the United States, and face special risks attributable to the real estate we own or lease. Such risks include:
•acquisition and occupancy costs that make it difficult to meet anticipated margins and difficulty locating suitable facilities due to a relatively small number of available buildings having the desired characteristics in some real estate markets;
•increases in rent expense and property taxes as a result of the increasing demand for industrial real estate;
•uninsured losses or damage to our facilities due to an inability to obtain full coverage on a cost-effective basis for some casualties, such as fires, hurricanes and earthquakes, or any coverage for certain losses, such as losses from riots or terrorist activities;
•inability to use our real estate holdings effectively and costs associated with vacating or consolidating facilities if the demand for physical storage were to diminish;
•liability under environmental laws for the costs of investigation and cleanup of contaminated real estate owned or leased by us, whether or not (i) we know of, or were responsible for, the contamination, or (ii) the contamination occurred while we owned or leased the property; and
•costs of complying with fire protection and safety standards.
Some of our current and formerly owned or leased properties were previously used by entities other than us for industrial or other purposes, or were affected by waste generated from nearby properties, that involved the use, storage, generation and/or disposal of hazardous substances and wastes, including petroleum products. In some instances, this prior use involved the operation of underground storage tanks or the presence of asbestos-containing materials. Where we are aware of environmental conditions that require remediation, we undertake appropriate activity, in accordance with all legal requirements. Although we have from time to time conducted limited environmental investigations and remedial activities at some of our former and current facilities, we have not undertaken an environmental review of all of our properties, including those we have acquired. We therefore may be potentially liable for environmental costs like those discussed above and may be unable to sell, rent, mortgage or use contaminated real estate owned or leased by us. Environmental conditions for which we might be liable may also exist at properties that we may acquire in the future. In addition, future regulatory action and environmental laws may impose costs for environmental compliance that do not exist today.
14 | IRON MOUNTAIN 2023 FORM 10-K | |||||||
Unexpected events, including those resulting from climate change or geopolitical events, could disrupt our operations and adversely affect our reputation and results of operations.
Unexpected events, including fires or explosions at our facilities, war or other military conflict, terrorist activities, natural disasters such as earthquakes and wildfires, unplanned power outages, supply disruptions, failure of equipment or systems, and severe weather events, such as droughts, heat waves, hurricanes, and flooding, could adversely affect our reputation and results of operations through physical damage to our facilities and equipment and through physical damage to, or disruption of, local infrastructure. During the past several years, we have seen an increase in the frequency and intensity of severe weather events and we expect this trend to continue due to climate change. Some of our key facilities worldwide are vulnerable to severe weather events, and global weather pattern changes may also pose long-term risks of physical impacts to our business. Our customers rely on us to securely store and timely retrieve their critical information, and, while we maintain disaster recovery and business continuity plans that would be implemented in these situations, these unexpected events could result in customer service disruption, physical damage to one or more key operating facilities and the information stored in those facilities, the closure of one or more key operating facilities or the disruption of information systems, each of which could negatively impact our reputation and results of operations. In addition, these unexpected events could negatively impact our reputation if such events result in adverse publicity, governmental investigations or litigation or if customers do not otherwise perceive our response to be adequate.
Fluctuations in commodity prices may affect our operating revenues and results of operations.
Our operating revenues and results of operations are impacted by significant changes in commodity prices. In particular, our secure shredding operations generate revenue from the sale of shredded paper for recycling. Further, significant declines in the cost of paper may continue to negatively impact our revenues and results of operations, and increases in other commodity prices, including steel, may negatively impact our results of operations.
Failure to manage and adequately implement our new IT systems could negatively affect our business.
We rely on IT infrastructure, including hardware, networks, software, people and processes, to provide information to support assessments and conclusions about our operating performance. We are in the process of upgrading a number of our IT systems, including consolidating our existing finance operations platforms, and we face risks relating to these transitions. For example, we may incur greater costs than we anticipate training our personnel on the new systems, we may experience service disruptions or errors in accurately capturing data or retaining our records, and we may be delayed in meeting our various reporting obligations. There can be no assurance that we will manage our IT systems and implement these new systems as planned or that we will do so without disruptions to our operations, which could have an adverse effect on our business, financial condition, results of operations and cash flows.
RISKS RELATED TO OUR INDEBTEDNESS
Our indebtedness could adversely affect our financial health and prevent us from fulfilling our obligations under our various debt instruments.
As of December 31, 2023, our total long-term debt was approximately $12,034.6 million, stockholders equity was approximately $211.6 million and we had cash and cash equivalents of approximately $222.8 million. Our indebtedness could have important consequences to our current and potential investors. These risks include:
•inability to satisfy our obligations with respect to our various debt instruments;
•inability to make borrowings to fund future working capital, capital expenditures and strategic growth opportunities, including acquisitions, further organic development of, and investment into, our Global Data Center Business, ALM and Fine Arts businesses and other service offerings, and other general corporate requirements, including possible required repurchases, redemptions or prepayments of our various indebtedness;
•limits on our distributions to stockholders; in this regard if these limits prevented us from satisfying our REIT distribution requirements, we could fail to remain qualified for taxation as a REIT or, if these limits do not jeopardize our qualification for taxation as a REIT but do nevertheless prevent us from distributing 100% of our REIT taxable income, we will be subject to federal corporate income tax, and potentially a nondeductible excise tax, on the retained amounts;
•limits on future borrowings under our existing or future credit arrangements, which could affect our ability to pay our indebtedness or to fund our other liquidity needs;
•inability to generate sufficient funds to cover required interest payments;
•restrictions on our ability to refinance our indebtedness on commercially reasonable terms;
•limits on our flexibility in planning for, or reacting to, changes in our business and the information management services industry; and
•inability to adjust to adverse economic conditions that could place us at a disadvantage to our competitors with less debt and who, therefore, may be able to take advantage of opportunities that our indebtedness prevents us from pursuing.
Certain of our indebtedness, including indebtedness under our credit agreement, is paid at floating interest rates, and as a result, our interest expense or the cost of our debt may increase due to rising interest rates or changes to benchmark rates.
IRON MOUNTAIN 2023 FORM 10-K | 15 | |||||||
Restrictive debt covenants may limit our ability to pursue our growth strategy.
Our Credit Agreement and our indentures contain covenants restricting or limiting our ability to, among other things:
•incur additional indebtedness;
•pay dividends or make other restricted payments;
•make asset dispositions;
•create or permit liens;
•sell, transfer or exchange assets;
•guarantee certain indebtedness;
•make acquisitions and other investments; and
•enter into partnerships, joint ventures and co-investment vehicles.
These restrictions and our long-term commitment to maintain our leverage ratio may adversely affect our ability to pursue our acquisition and other growth strategies, including our strategic growth plan.
We may not have the ability to raise the funds necessary to finance the repurchase of outstanding senior notes upon a change of control event as required by our indentures.
Upon the occurrence of a "change of control", as defined in our indentures, we will be required to offer to repurchase all of our outstanding senior notes. However, it is possible that we will not have sufficient funds at the time of a change of control to make the required repurchase of any outstanding notes or that restrictions in our Credit Agreement will not allow such repurchases. Certain important corporate events, however, such as leveraged recapitalizations that would increase the level of our indebtedness, would not constitute a "change of control" under our indentures.
IMI is a holding company, and, therefore, its ability to make payments on its various debt obligations depends in large part on the operations of its subsidiaries.
IMI is a holding company; substantially all of its assets consist of the equity in its subsidiaries, and substantially all of its operations are conducted by its direct and indirect consolidated subsidiaries. As a result, its ability to make payments on its debt obligations will be dependent upon the receipt of sufficient funds from its subsidiaries, whose ability to distribute funds may be limited by local capital requirements, joint venture and co-investment vehicle structures and other applicable restrictions. However, our various debt obligations are guaranteed, on a joint and several and full and unconditional basis, by IMI’s U.S. subsidiaries that represent the substantial majority of its U.S. operations.
RISKS RELATED TO OUR TAXATION AS A REIT
If we fail to remain qualified for taxation as a REIT, we will be subject to tax at corporate income tax rates and will not be able to deduct distributions to stockholders when computing our taxable income.
We have elected to be taxed as a REIT for federal income tax purposes beginning with our 2014 taxable year. We believe that our organization and method of operation comply with the rules and regulations promulgated under the Internal Revenue Code of 1986, as amended (the "Code"), such that we will continue to qualify for taxation as a REIT. However, we can provide no assurance that we will remain qualified for taxation as a REIT. We also have invested in a subsidiary that has elected to be taxed as a REIT and therefore must independently satisfy all REIT qualification requirements, and we may in the future invest in other such subsidiaries. If such subsidiary REIT were to fail to qualify as a REIT, it may cause us to fail to remain qualified for taxation as a REIT. If we fail to remain qualified for taxation as a REIT, including as a result of a cascading failure of any subsidiary REIT to remain qualified as a REIT, we will be subject to federal income taxation at corporate income tax rates unless certain relief provisions apply.
Qualification for taxation as a REIT involves the application of highly technical and complex provisions of the Code to our operations, as well as various factual determinations concerning matters and circumstances not entirely within our control. There are limited judicial or administrative interpretations of applicable REIT provisions of the Code.
If, in any taxable year, we fail to remain qualified for taxation as a REIT and are not entitled to relief under the Code:
•we will not be allowed a deduction for distributions to stockholders in computing our taxable income;
•we will be subject to federal and state income tax on our taxable income at regular corporate income tax rates; and
•we would not be eligible to elect REIT status again until the fifth taxable year that begins after the first year for which we failed to qualify for taxation as a REIT.
Any such corporate tax liability could be substantial and would reduce the amount of cash available for other purposes. If we fail to remain qualified for taxation as a REIT, we may need to borrow additional funds or liquidate some investments to pay any additional tax liability. Accordingly, funds available for investment and distributions to stockholders could be reduced.
16 | IRON MOUNTAIN 2023 FORM 10-K | |||||||
As a REIT, failure to make required distributions would subject us to federal corporate income tax.
We expect to continue paying regular quarterly distributions; however, the amount, timing and form of our regular quarterly distributions will be determined, and will be subject to adjustment, by our board of directors. To remain qualified for taxation as a REIT, we are generally required to distribute at least 90% of our REIT taxable income (determined without regard to the dividends paid deduction and excluding net capital gain) each year, or in limited circumstances, the following year, to our stockholders. Generally, we expect to distribute all or substantially all of our REIT taxable income. If our cash available for distribution falls short of our estimates, we may be unable to maintain distributions that approximate our REIT taxable income and may fail to remain qualified for taxation as a REIT. In addition, our cash flows from operations may be insufficient to fund required distributions as a result of nondeductible expenditures or as a result of differences in timing between the actual receipt of income and the payment of expenses and the recognition of income and expenses for federal income tax purposes.
To the extent that we satisfy the 90% distribution requirement but distribute less than 100% of our REIT taxable income, we will be subject to federal corporate income tax on our undistributed taxable income. In addition, we will be subject to a 4% nondeductible excise tax on our undistributed taxable income if the actual amount that we distribute to our stockholders for a calendar year is less than the minimum amount specified under the Code.
We may be required to borrow funds, sell assets or raise equity to satisfy our REIT distribution requirements, to comply with asset ownership tests or to fund capital expenditures, future growth and expansion initiatives.
In order to satisfy our REIT distribution requirements and maintain our qualification and taxation as a REIT, or to fund capital expenditures, future growth and expansion initiatives, we may need to borrow funds, sell assets or raise equity, even if our financial condition or the then-prevailing market conditions are not favorable for these borrowings, sales or offerings. Furthermore, the REIT distribution requirements and our commitment to investors on dividend growth may result in increasing our financing needs to fund capital expenditures, future growth and expansion initiatives, which would increase our indebtedness. An increase in our outstanding debt could lead to a downgrade of our credit ratings, which could negatively impact our ability to access credit markets. Further, certain of our current debt instruments limit the amount of indebtedness we and our subsidiaries may incur. Additional financing, therefore, may be unavailable, more expensive or restricted by the terms of our outstanding indebtedness. For a discussion of risks related to our substantial level of indebtedness, see "Risks Related to Our Indebtedness".
Complying with REIT requirements may limit our flexibility, cause us to forgo otherwise attractive opportunities that we would otherwise pursue to execute our strategic growth plan, or otherwise reduce our income and amounts available for distribution to our stockholders.
To remain qualified for taxation as a REIT, we must satisfy tests concerning, among other things, the sources of our income, the nature and diversification of our assets and the amounts we distribute to our stockholders. Thus, compliance with these tests may require us to refrain from certain activities and may hinder our ability to make certain attractive investments, including the purchase of non-REIT qualifying operations or assets, the expansion of non-real estate activities, and investments in the businesses to be conducted by our taxable REIT subsidiaries ("TRSs"), and, to that extent, limit our opportunities and our flexibility to change our business strategy and execute on our strategic growth plan. This may restrict our ability to acquire certain businesses, enter into joint ventures or co-investment vehicles, or acquire minority interests of companies. Furthermore, acquisition opportunities in domestic and international markets may be adversely affected if we need or require the target company to comply with some REIT requirements prior to closing.
We conduct a significant portion of our business activities, including our information management services businesses and several of our international operations, through domestic and foreign TRSs. Under the Code, no more than 20% of the value of the assets of a REIT may be represented by securities of one or more TRSs. Similar rules apply to other nonqualifying assets. These limitations may affect our ability to make additional investments in non-REIT qualifying operations or assets or in international operations through TRSs.
If we fail to comply with specified asset ownership tests applicable to REITs as measured at the end of any calendar quarter, we generally must correct such failure within 30 days after the end of the applicable calendar quarter or qualify for statutory relief provisions to avoid losing our qualification for taxation as a REIT. As a result, we may be required to liquidate assets or to forgo our pursuit of otherwise attractive investments or executing on portions of our strategic growth plan. These actions may reduce our income and amounts available for distribution to our stockholders.
As a REIT, we are limited in our ability to fund distribution payments using cash generated through our TRSs.
Our ability to receive distributions from our TRSs is limited by the rules with which we must comply to maintain our qualification for taxation as a REIT. In particular, at least 75% of our gross income for each taxable year as a REIT must be derived from real estate, which generally includes gross income from providing customers with secure storage space or colocation or wholesale data center space. Consequently, no more than 25% of our gross income may consist of dividend income from our TRSs and other nonqualifying types of income. Thus, our ability to receive distributions from our TRSs may be limited, which may impact our ability to fund distributions to our stockholders using cash flows from our TRSs. Specifically, if our TRSs become highly profitable, we might become limited in our ability to receive net income from our TRSs in an amount required to fund distributions to our stockholders commensurate with that profitability.
IRON MOUNTAIN 2023 FORM 10-K | 17 | |||||||
In addition, a significant amount of our income and cash flows from our TRSs is generated from our international operations. In many cases, there are local withholding taxes and currency controls that may impact our ability or willingness to repatriate funds to the United States to help satisfy REIT distribution requirements.
Our extensive use of TRSs, including for certain of our international operations, may cause us to fail to remain qualified for taxation as a REIT.
Our operations include an extensive use of TRSs. The net income of our TRSs is not required to be distributed to us, and income that is not distributed to us generally is not subject to the REIT income distribution requirement. However, there may be limitations on our ability to accumulate earnings in our TRSs and the accumulation or reinvestment of significant earnings in our TRSs could result in adverse tax treatment. In particular, if the accumulation of cash in our TRSs causes (i) the fair market value of our securities in our TRSs to exceed 20% of the fair market value of our assets or (ii) the fair market value of our securities in our TRSs and other nonqualifying assets to exceed 25% of the fair market value of our assets, then we will fail to remain qualified for taxation as a REIT. Further, a substantial portion of our operations are conducted overseas, and a material change in foreign currency rates could also affect the value of our foreign holdings in our TRSs, negatively impacting our ability to remain qualified for taxation as a REIT.
Even if we remain qualified for taxation as a REIT, some of our business activities are subject to corporate level income tax and foreign taxes, which will continue to reduce our cash flows, and we will have potential deferred and contingent tax liabilities.
Even if we remain qualified for taxation as a REIT, we may be subject to some federal, state, local and foreign taxes, including taxes on any undistributed income, and state, local or foreign income, franchise, property and transfer taxes. In addition, we could in certain circumstances be required to pay an excise or penalty tax, which could be significant in amount, in order to utilize one or more relief provisions under the Code to maintain our qualification for taxation as a REIT.
A portion of our business is conducted through TRSs because certain of our business activities could generate nonqualifying REIT income as currently structured and operated. The income of our domestic TRSs will continue to be subject to federal and state corporate income taxes. In addition, our international assets and operations will continue to be subject to taxation in the foreign jurisdictions where those assets are held or those operations are conducted. Any of these taxes would decrease our earnings and our available cash.
We will also be subject to a federal corporate level income tax at the highest regular corporate income tax rate on gain recognized from a sale of a REIT asset where our basis in the asset is determined by reference to the basis of the asset in the hands of a C corporation (such as an asset that we hold in one of our qualified REIT subsidiaries ("QRSs") following the liquidation or other conversion of a former TRS). This tax is generally applicable to any disposition of such an asset during the five-year period after the date we first owned the asset as a REIT asset, to the extent of the built-in-gain based on the fair market value of such asset on the date we first held the asset as a REIT asset. In addition, any depreciation recapture income that we recognize because of accounting method changes that we make in connection with our acquisition activities will be fully subject to this tax.
Complying with REIT requirements may limit our ability to hedge effectively and increase the cost of our hedging and may cause us to incur tax liabilities.
The REIT provisions of the Code limit our ability to hedge assets, liabilities, revenues and expenses. Generally, income from hedging transactions that we enter into to manage risk of interest rate changes with respect to borrowings made or to be made by us to acquire or carry real estate assets and income from certain currency hedging transactions related to our non-United States operations, as well as income from qualifying counteracting hedges, do not constitute "gross income" for purposes of the REIT gross income tests. To the extent that we enter into other types of hedging transactions, the income from those transactions is likely to be treated as nonqualifying income for purposes of the REIT gross income tests. As a result of these rules, we may need to limit our use of advantageous hedging techniques or implement those hedges through our TRSs. This could increase the cost of our hedging activities because our TRSs would be subject to tax on income or gains resulting from hedges entered into by them and may expose us to greater risks associated with changes in interest rates or exchange rates than we would otherwise want to bear. In addition, hedging losses in any of our TRSs generally will not provide any tax benefit, except for being carried forward for possible use against future income or gain in the TRSs.
Distributions payable by REITs generally do not qualify for preferential tax rates.
Dividends payable by United States corporations to noncorporate stockholders, such as individuals, trusts and estates, are generally eligible for reduced United States federal income tax rates applicable to "qualified dividends". Distributions paid by REITs generally are not treated as "qualified dividends" under the Code, and the reduced rates applicable to such dividends do not generally apply. However, for tax years beginning before 2026, REIT dividends paid to noncorporate stockholders that meet specified holding period requirements are generally taxed at an effective tax rate lower than applicable ordinary income tax rates due to the availability of a deduction under the Code for specified forms of income from passthrough entities. More favorable rates will nevertheless continue to apply to regular corporate "qualified" dividends, which may cause some investors to perceive that an investment in a REIT is less attractive than an investment in a non-REIT entity that pays dividends, thereby reducing the demand and market price of our common stock.
18 | IRON MOUNTAIN 2023 FORM 10-K | |||||||
The ownership and transfer restrictions contained in our certificate of incorporation may not protect our qualification for taxation as a REIT, could have unintended antitakeover effects and may prevent our stockholders from receiving a takeover premium.
In order for us to remain qualified for taxation as a REIT, no more than 50% of the value of outstanding shares of our capital stock may be owned, beneficially or constructively, by five or fewer individuals at any time during the last half of each taxable year. In addition, rents from "affiliated tenants" will not qualify as qualifying REIT income if we own 10% or more by vote or value of the customer, whether directly or after application of attribution rules under the Code. Subject to certain exceptions, our certificate of incorporation prohibits any stockholder from owning, beneficially or constructively, more than (i) 9.8% in value of the outstanding shares of all classes or series of our capital stock or (ii) 9.8% in value or number, whichever is more restrictive, of the outstanding shares of any class or series of our capital stock. We refer to these restrictions collectively as the "ownership limits" and we included them in our certificate of incorporation to facilitate our compliance with REIT tax rules. The constructive ownership rules under the Code are complex and may cause the outstanding stock owned by a group of related individuals or entities to be deemed to be constructively owned by one individual or entity. As a result, the acquisition of less than 9.8% of our outstanding common stock (or the outstanding shares of any class or series of our capital stock) by an individual or entity could cause that individual or entity or another individual or entity to own constructively in excess of the relevant ownership limits. Any attempt to own or transfer shares of our common stock or of any of our other capital stock in violation of these restrictions may result in the shares being automatically transferred to a charitable trust or may be void. Even though our certificate of incorporation contains the ownership limits, there can be no assurance that these provisions will be effective to prevent our qualification for taxation as a REIT from being jeopardized, including under the affiliated tenant rule. Furthermore, there can be no assurance that we will be able to monitor and enforce the ownership limits. If the restrictions in our certificate of incorporation are not effective and, as a result, we fail to satisfy the REIT tax rules described above, then, absent an applicable relief provision, we will fail to remain qualified for taxation as a REIT.
In addition, the ownership and transfer restrictions could delay, defer or prevent a transaction or a change in control that might involve a premium price for our stock or otherwise be in the best interest of our stockholders. As a result, the overall effect of the ownership and transfer restrictions may be to render more difficult or discourage any attempt to acquire us, even if such acquisition may be favorable to the interests of our stockholders.
Legislative or other actions affecting REITs could have a negative effect on us or our stockholders.
At any time, the federal or state income tax laws governing REITs, the administrative interpretations of those laws, or local laws impacting our REIT structure for our international operations may be amended. Federal, state and local tax laws are constantly under review by persons involved in the legislative process, the United States Internal Revenue Service, the United States Department of the Treasury and state and local taxing authorities. Changes to the tax laws, regulations and administrative interpretations or local laws governing our international operations, which may have retroactive application, could adversely affect us. In addition, some of these changes could have a more significant impact on us as compared to other REITs due to the nature of our business and our substantial use of TRSs, particularly non-United States TRSs, or how we have structured our operations outside the United States to comply with REIT qualification requirements. We cannot predict with certainty whether, when, in what forms, or with what effective dates, the tax laws, regulations, administrative interpretations or local laws applicable to us may be changed or if such laws would impact our ability to remain qualified for taxation as a REIT or the costs of doing so.
GENERAL RISK FACTORS
Our cash distributions are not guaranteed and may fluctuate.
As a REIT, we are generally required to distribute at least 90% of our REIT taxable income to our stockholders. Furthermore, we are committed to growing our dividends, and have stated this publicly.
Our board of directors, in its sole discretion, will determine, on a quarterly basis, the amount of cash to be distributed to our stockholders based on a number of factors including, but not limited to, our results of operations, cash flow and capital requirements, economic conditions, tax considerations, borrowing capacity and other factors, including debt covenant restrictions that may impose limitations on cash payments, future acquisitions and divestitures, any stock repurchase program and general market demand for our space and related services. Consequently, our distribution levels may fluctuate and we may not be able to meet our public commitments with respect to dividend growth.
Our business could be adversely impacted if there are deficiencies in our disclosure controls and procedures or internal control over financial reporting.
The design and effectiveness of our disclosure controls and procedures and internal control over financial reporting may not prevent all errors, misstatements or misrepresentations. While management will continue to review the effectiveness of our disclosure controls and procedures and internal control over financial reporting, there can be no guarantee that our internal control over financial reporting will be effective in accomplishing all control objectives all of the time. Furthermore, our disclosure controls and procedures and internal control over financial reporting with respect to entities that we do not control or manage may be substantially more limited than those we maintain with respect to the subsidiaries that we have controlled or managed over the course of time. Deficiencies, including any material weakness, in our internal control over financial reporting which may occur in the future could result in misstatements of our results of operations, restatements of our financial statements, a decline in our stock price, or otherwise materially adversely affect our business, reputation, results of operations, financial condition or liquidity.
IRON MOUNTAIN 2023 FORM 10-K | 19 | |||||||
We face competition for customers.
We compete with multiple businesses in all geographic areas where we operate; our current or potential customers may choose to use those competitors instead of us. In addition, if we are successful in winning record storage customers from competitors, the process of moving their stored records into our facilities is often costly and time consuming. We also compete, in some of our business lines, with our current and potential customers’ internal storage and information management services capabilities and their cloud-based alternatives. These organizations may not begin or continue to use us for their future storage and information management service needs.
The performance of our businesses relies on our ability to attract, develop, and retain talented personnel, while controlling our labor costs.
We are highly dependent on skilled and qualified personnel to operate our businesses. Furthermore, our contracts with the United States Government require us to use personnel with security clearances, and we may not be successful or may experience delays in attracting, training or retaining qualified personnel with the requisite skills or security clearances. The failure to attract and retain qualified employees or to effectively control our labor costs could negatively affect our competitive position and operating results. Our ability to control labor costs and attract qualified personnel is subject to numerous external factors, including prevailing wages, labor shortages, the impact of legislation or regulations governing wages and hours, labor relations, immigration, healthcare and other benefits, other employment-related costs and the hiring practices of our competitors.
ITEM 1B. UNRESOLVED STAFF COMMENTS.
None.
ITEM 1C. CYBERSECURITY.
RISK MANAGEMENT AND STRATEGY
We maintain a robust information security program that is designed to protect our information and the information of our customers. Our information security program is based on a recognized cybersecurity framework established by the National Institute of Standards and Technology (“NIST”) and establishes controls to mitigate critical areas of cybersecurity risk. Our information security program has adopted all elements of the NIST cybersecurity framework, including the six functions of identify, protect, detect, respond, recover and govern, as well as each of the categories and control groups thereunder. This does not imply that we meet any particular technical standards, specifications, or requirements, but only that we use the NIST framework as a guide to ensure our information security program is designed to manage cybersecurity risks relevant to our business. Among other things, the cybersecurity controls in our information security program address information access rights, incident monitoring and response processes, information technology system configuration, network security, security architecture planning, mobile device security and compliance with information security policy requirements and protocols. These cybersecurity controls are designed to oversee, identify and mitigate risks from all cybersecurity threats, including those arising from our use of third-party service providers. Our cybersecurity controls are evaluated regularly by our internal information security team and we engage a third party examiner to assess the maturity of our information security program against the NIST cybersecurity framework no less frequently than bi-annually. Additionally, our information security program is assessed periodically by a federal regulator in the United States as part of its routine audit of the Company. In addition to our internal assessments, we also assess our third-party service providers on a regular basis using a risk-based approach that assigns a risk calculation to each such service provider. Results of our assessments are tracked and evaluated to ensure these third parties comply with our cybersecurity standards.
Our reputation for providing secure information storage to customers is critical to the success of our business, and protecting against material cyber risks is an integral part of maintaining that reputation. A successful cybersecurity breach could lead to theft or misuse of our or our customers’ proprietary or confidential information or our employees’ personal information and result in third-party claims against us, regulatory penalties and reputational harm. As part of our information security program, we also actively monitor emerging cyber attack patterns to develop custom detection capabilities and mitigation techniques to protect against material risk of cybersecurity threats. Upon encountering a cybersecurity incident, our information security team responds using our detailed cyber security incident response plan (“CSIRP”), which is based on industry best practices, relevant legal requirements and our contractual commitments. Among other things, the CSIRP sets forth the specific criteria used to assess a cybersecurity incident, mitigate risks of adverse consequences associated with any such incident, protocols to escalate the management of the incident and the process to inform our executive management team and any impacted functions of our business. All cybersecurity incidents are assessed to determine whether disclosure is required pursuant to any contractual or regulatory requirements and any material cybersecurity incident is also reported to our board of directors (our “Board”). To date, our information security program has been successful in protecting against risks from cybersecurity threats, and we have not had any cybersecurity incidents that have materially affected or are reasonably likely to materially affect our business strategy, results of operations or financial condition.
20 | IRON MOUNTAIN 2023 FORM 10-K | |||||||
Our risk management organization, which is led by our Chief Risk Officer, manages our information security program along with enterprise risk management, business continuity, internal audit and physical security. Our risk management team routinely reports on cybersecurity matters to our executive management team and our Board. Our Chief Information Security Officer, who reports directly to our Chief Risk Officer, leads a dedicated information security team that manages our information security program. The information security team is made primarily of full-time employees; however, we routinely engage consultants to provide supplemental labor and additional expertise in specific areas on an as-needed basis. Our information security team is organized based on industry best practices in alignment with NIST recommendations. All of the leaders in our information security team have over 10 years of cybersecurity experience and most of our information security staff maintain cybersecurity program certifications such as CMU Cybersecurity Executive Certification, ISACA Certifications (CISSP & CISM) and other relevant vendor certifications. Our information security team also regularly undergoes continuing education to ensure our implementation of best-in-class techniques.
GOVERNANCE
Our Board reviews and discusses significant risks with executive management, including cybersecurity risk, that affect us. Although our executive management team and our Board work together on risk matters, our Board has the ultimate oversight authority over all enterprise risks, including cybersecurity risk. Our Board reserves the right to, and periodically does consult with third-party advisors and experts to assist our Board in understanding and anticipating future cybersecurity threats and trends. The risk and safety committee of our Board (the “RSC”) is specifically tasked with reviewing and monitoring cybersecurity and information security risk, as well as the risk management strategies, systems and policies and processes implemented, established and reported on by our executive management team. The RSC is also primarily responsible for assisting our Board with oversight of our enterprise risk management program. As part of the risk management team, our Chief Information Security Officer reports key performance indicators of our information security program to the RSC at least three times a year to facilitate the committee’s oversight of the effectiveness of the program through objective measurements, including metrics regarding software patching, IT asset management, cyber incident management and cybersecurity training. Reports by our Chief Information Security Officer also include detailed information on the activities of our cyber incident response team to allow for analysis of trends and the identification of any control gaps that require remediation.
Our executive management team, with oversight from our Board, is responsible for our enterprise risk management process and the day-to-day supervision and mitigation of enterprise risks, including cybersecurity risk. Our enterprise risk management program includes our executive management team receiving regular reports from our operations personnel. Our executive management team has established an enterprise risk committee (the "ERC"), which is chaired by our Chief Risk Officer and is otherwise comprised of each of our other executive vice presidents. The ERC oversees our risk and compliance activities to ensure that management has appropriate policies, structures and systems in place for managing risks of the business, including cybersecurity risk. Our executive management team reviews and prioritizes significant risks, allocates resources for risk mitigation. Our Chief Risk Officer and other members of our risk management team provide reports at each meeting of the RSC on areas of potential risks to us, including cybersecurity risk. We also maintain a business information security committee (the "ISC") with employee representation across geographies, business lines and business functions. The ISC includes a cross functional group of our employees with expertise and responsibilities in areas such as operations, digital product solutions, information technology, compliance, security, finance, privacy, internal audit and legal risk mitigation. The ISC is managed by our Chief Information Security Officer and meets regularly to receive updates on our cybersecurity posture, emerging risks and new cybersecurity capabilities. Members of the ISC act as points of contact during incident response activities to provide oversight and logistical support to the information security team.
ITEM 2. PROPERTIES.
As of December 31, 2023, we conducted operations through 1,145 leased facilities and 232 owned facilities. Our facilities are divided among our reportable segments and Corporate and Other as follows: Global RIM Business (1,287), Global Data Center Business (30) and Corporate and Other (60). These facilities contain a total of approximately 98.0 million square feet of space. A breakdown of owned and leased facilities by country (and by state within the United States) is listed below:
IRON MOUNTAIN 2023 FORM 10-K | 21 | |||||||
| LEASED | OWNED | TOTAL | |||||||||||||||||||||||||||||||||||||||||||||||||||||||||||||||||||||
| COUNTRY/STATE | NUMBER | SQUARE FEET | NUMBER | SQUARE FEET | NUMBER | SQUARE FEET | |||||||||||||||||||||||||||||||||||||||||||||||||||||||||||||||||
| North America | |||||||||||||||||||||||||||||||||||||||||||||||||||||||||||||||||||||||
| United States (Including Puerto Rico) | |||||||||||||||||||||||||||||||||||||||||||||||||||||||||||||||||||||||
| Alabama | 3 | 305,168 | — | — | 3 | 305,168 | |||||||||||||||||||||||||||||||||||||||||||||||||||||||||||||||||
| Arizona | 7 | 436,657 | 6 | 1,207,281 | 13 | 1,643,938 | |||||||||||||||||||||||||||||||||||||||||||||||||||||||||||||||||
| Arkansas | 2 | 63,604 | — | — | 2 | 63,604 | |||||||||||||||||||||||||||||||||||||||||||||||||||||||||||||||||
| California | 76 | 7,339,160 | 9 | 942,356 | 85 | 8,281,516 | |||||||||||||||||||||||||||||||||||||||||||||||||||||||||||||||||
| Colorado | 5 | 274,461 | 4 | 484,490 | 9 | 758,951 | |||||||||||||||||||||||||||||||||||||||||||||||||||||||||||||||||
| Connecticut | 5 | 312,797 | 3 | 527,666 | 8 | 840,463 | |||||||||||||||||||||||||||||||||||||||||||||||||||||||||||||||||
| Delaware | 2 | 197,840 | 2 | 162,721 | 4 | 360,561 | |||||||||||||||||||||||||||||||||||||||||||||||||||||||||||||||||
| District of Columbia | 1 | 1,670 | — | — | 1 | 1,670 | |||||||||||||||||||||||||||||||||||||||||||||||||||||||||||||||||
| Florida | 34 | 2,814,690 | 1 | 119,374 | 35 | 2,934,064 | |||||||||||||||||||||||||||||||||||||||||||||||||||||||||||||||||
| Georgia | 12 | 940,981 | 2 | 129,611 | 14 | 1,070,592 | |||||||||||||||||||||||||||||||||||||||||||||||||||||||||||||||||
| Idaho | 1 | 45,000 | — | — | 1 | 45,000 | |||||||||||||||||||||||||||||||||||||||||||||||||||||||||||||||||
| Illinois | 13 | 1,210,705 | 7 | 1,309,975 | 20 | 2,520,680 | |||||||||||||||||||||||||||||||||||||||||||||||||||||||||||||||||
| Indiana | 5 | 328,516 | — | — | 5 | 328,516 | |||||||||||||||||||||||||||||||||||||||||||||||||||||||||||||||||
| Iowa | 2 | 145,138 | 1 | 14,200 | 3 | 159,338 | |||||||||||||||||||||||||||||||||||||||||||||||||||||||||||||||||
| Kansas | 4 | 569,161 | — | — | 4 | 569,161 | |||||||||||||||||||||||||||||||||||||||||||||||||||||||||||||||||
| Kentucky | 2 | 64,000 | 4 | 418,760 | 6 | 482,760 | |||||||||||||||||||||||||||||||||||||||||||||||||||||||||||||||||
| Louisiana | 4 | 388,475 | — | — | 4 | 388,475 | |||||||||||||||||||||||||||||||||||||||||||||||||||||||||||||||||
| Maine | — | — | 1 | 95,000 | 1 | 95,000 | |||||||||||||||||||||||||||||||||||||||||||||||||||||||||||||||||
| Maryland | 19 | 1,996,017 | 1 | 19,001 | 20 | 2,015,018 | |||||||||||||||||||||||||||||||||||||||||||||||||||||||||||||||||
| Massachusetts | 10 | 572,979 | 6 | 933,102 | 16 | 1,506,081 | |||||||||||||||||||||||||||||||||||||||||||||||||||||||||||||||||
| Michigan | 15 | 953,486 | 1 | 39,502 | 16 | 992,988 | |||||||||||||||||||||||||||||||||||||||||||||||||||||||||||||||||
| Minnesota | 9 | 788,916 | — | — | 9 | 788,916 | |||||||||||||||||||||||||||||||||||||||||||||||||||||||||||||||||
| Mississippi | 3 | 201,300 | — | — | 3 | 201,300 | |||||||||||||||||||||||||||||||||||||||||||||||||||||||||||||||||
| Missouri | 13 | 1,598,233 | 1 | 25,120 | 14 | 1,623,353 | |||||||||||||||||||||||||||||||||||||||||||||||||||||||||||||||||
| Montana | 3 | 38,548 | — | — | 3 | 38,548 | |||||||||||||||||||||||||||||||||||||||||||||||||||||||||||||||||
| Nebraska | 1 | 34,560 | 2 | 266,733 | 3 | 301,293 | |||||||||||||||||||||||||||||||||||||||||||||||||||||||||||||||||
| Nevada | 9 | 227,840 | 1 | 107,041 | 10 | 334,881 | |||||||||||||||||||||||||||||||||||||||||||||||||||||||||||||||||
| New Hampshire | 1 | 2,188 | 1 | 146,467 | 2 | 148,655 | |||||||||||||||||||||||||||||||||||||||||||||||||||||||||||||||||
| New Jersey | 30 | 3,510,808 | 8 | 2,476,635 | 38 | 5,987,443 | |||||||||||||||||||||||||||||||||||||||||||||||||||||||||||||||||
| New Mexico | 2 | 114,473 | — | — | 2 | 114,473 | |||||||||||||||||||||||||||||||||||||||||||||||||||||||||||||||||
| New York | 20 | 1,066,410 | 10 | 970,800 | 30 | 2,037,210 | |||||||||||||||||||||||||||||||||||||||||||||||||||||||||||||||||
| North Carolina | 20 | 958,889 | 1 | 97,000 | 21 | 1,055,889 | |||||||||||||||||||||||||||||||||||||||||||||||||||||||||||||||||
| Ohio | 12 | 893,853 | 3 | 242,087 | 15 | 1,135,940 | |||||||||||||||||||||||||||||||||||||||||||||||||||||||||||||||||
| Oklahoma | 4 | 196,044 | — | — | 4 | 196,044 | |||||||||||||||||||||||||||||||||||||||||||||||||||||||||||||||||
| Oregon | 12 | 438,586 | — | — | 12 | 438,586 | |||||||||||||||||||||||||||||||||||||||||||||||||||||||||||||||||
| Pennsylvania | 21 | 2,629,959 | 3 | 2,062,761 | 24 | 4,692,720 | |||||||||||||||||||||||||||||||||||||||||||||||||||||||||||||||||
| Puerto Rico | 4 | 223,089 | 1 | 54,352 | 5 | 277,441 | |||||||||||||||||||||||||||||||||||||||||||||||||||||||||||||||||
| Rhode Island | 1 | 94,968 | — | — | 1 | 94,968 | |||||||||||||||||||||||||||||||||||||||||||||||||||||||||||||||||
| South Carolina | 4 | 168,636 | 2 | 214,238 | 6 | 382,874 | |||||||||||||||||||||||||||||||||||||||||||||||||||||||||||||||||
| Tennessee | 5 | 256,743 | 4 | 63,909 | 9 | 320,652 | |||||||||||||||||||||||||||||||||||||||||||||||||||||||||||||||||
| Texas | 39 | 2,654,205 | 19 | 1,838,880 | 58 | 4,493,085 | |||||||||||||||||||||||||||||||||||||||||||||||||||||||||||||||||
| Utah | 2 | 78,148 | 1 | 90,553 | 3 | 168,701 | |||||||||||||||||||||||||||||||||||||||||||||||||||||||||||||||||
| Vermont | 1 | 35,200 | — | — | 1 | 35,200 | |||||||||||||||||||||||||||||||||||||||||||||||||||||||||||||||||
| Virginia | 16 | 1,346,372 | 4 | 375,791 | 20 | 1,722,163 | |||||||||||||||||||||||||||||||||||||||||||||||||||||||||||||||||
| Washington | 8 | 716,411 | 4 | 180,228 | 12 | 896,639 | |||||||||||||||||||||||||||||||||||||||||||||||||||||||||||||||||
| West Virginia | 2 | 105,502 | — | — | 2 | 105,502 | |||||||||||||||||||||||||||||||||||||||||||||||||||||||||||||||||
| Wisconsin | 5 | 379,857 | 1 | 10,655 | 6 | 390,512 | |||||||||||||||||||||||||||||||||||||||||||||||||||||||||||||||||
| Total United States | 469 | 37,720,243 | 114 | 15,626,289 | 583 | 53,346,532 | |||||||||||||||||||||||||||||||||||||||||||||||||||||||||||||||||
| Canada | 40 | 2,846,203 | 15 | 1,713,060 | 55 | 4,559,263 | |||||||||||||||||||||||||||||||||||||||||||||||||||||||||||||||||
| Total North America | 509 | 40,566,446 | 129 | 17,339,349 | 638 | 57,905,795 | |||||||||||||||||||||||||||||||||||||||||||||||||||||||||||||||||
22 | IRON MOUNTAIN 2023 FORM 10-K | |||||||
| LEASED | OWNED | TOTAL | |||||||||||||||||||||||||||||||||||||||||||||||||||||||||||||||||||||
| COUNTRY/STATE | NUMBER | SQUARE FEET | NUMBER | SQUARE FEET | NUMBER | SQUARE FEET | |||||||||||||||||||||||||||||||||||||||||||||||||||||||||||||||||
| International | |||||||||||||||||||||||||||||||||||||||||||||||||||||||||||||||||||||||
| Argentina | 2 | 134,753 | 4 | 298,864 | 6 | 433,617 | |||||||||||||||||||||||||||||||||||||||||||||||||||||||||||||||||
| Australia | 41 | 3,010,051 | 1 | 13,885 | 42 | 3,023,936 | |||||||||||||||||||||||||||||||||||||||||||||||||||||||||||||||||
| Austria | 1 | 2,691 | 1 | 58,771 | 2 | 61,462 | |||||||||||||||||||||||||||||||||||||||||||||||||||||||||||||||||
| Bahrain | 2 | 33,659 | — | — | 2 | 33,659 | |||||||||||||||||||||||||||||||||||||||||||||||||||||||||||||||||
| Belgium | 4 | 234,635 | — | — | 4 | 234,635 | |||||||||||||||||||||||||||||||||||||||||||||||||||||||||||||||||
| Brazil | 38 | 2,699,755 | 6 | 291,280 | 44 | 2,991,035 | |||||||||||||||||||||||||||||||||||||||||||||||||||||||||||||||||
| Bulgaria | 1 | 68,889 | — | — | 1 | 68,889 | |||||||||||||||||||||||||||||||||||||||||||||||||||||||||||||||||
| Chile | 2 | 3,692 | 17 | 667,790 | 19 | 671,482 | |||||||||||||||||||||||||||||||||||||||||||||||||||||||||||||||||
| China Mainland (including China - Hong Kong S.A.R., China-Taiwan and China-Macau S.A.R.) | 53 | 2,044,506 | 1 | 20,721 | 54 | 2,065,227 | |||||||||||||||||||||||||||||||||||||||||||||||||||||||||||||||||
| Colombia | 18 | 783,980 | — | — | 18 | 783,980 | |||||||||||||||||||||||||||||||||||||||||||||||||||||||||||||||||
| Croatia | 1 | 26,049 | 1 | 36,447 | 2 | 62,496 | |||||||||||||||||||||||||||||||||||||||||||||||||||||||||||||||||
| Cyprus | 2 | 51,118 | 2 | 46,246 | 4 | 97,364 | |||||||||||||||||||||||||||||||||||||||||||||||||||||||||||||||||
| Czech Republic | 7 | 138,788 | — | — | 7 | 138,788 | |||||||||||||||||||||||||||||||||||||||||||||||||||||||||||||||||
| Denmark | 3 | 161,361 | — | — | 3 | 161,361 | |||||||||||||||||||||||||||||||||||||||||||||||||||||||||||||||||
| Egypt | 3 | 113,506 | 1 | 163,611 | 4 | 277,117 | |||||||||||||||||||||||||||||||||||||||||||||||||||||||||||||||||
| England | 68 | 5,128,168 | 18 | 598,009 | 86 | 5,726,177 | |||||||||||||||||||||||||||||||||||||||||||||||||||||||||||||||||
| Estonia | 1 | 38,861 | — | — | 1 | 38,861 | |||||||||||||||||||||||||||||||||||||||||||||||||||||||||||||||||
| Eswatini | 3 | 6,997 | — | — | 3 | 6,997 | |||||||||||||||||||||||||||||||||||||||||||||||||||||||||||||||||
| Finland | 4 | 96,956 | — | — | 4 | 96,956 | |||||||||||||||||||||||||||||||||||||||||||||||||||||||||||||||||
| France | 27 | 2,094,071 | 12 | 936,486 | 39 | 3,030,557 | |||||||||||||||||||||||||||||||||||||||||||||||||||||||||||||||||
| Germany | 17 | 852,231 | 3 | 308,504 | 20 | 1,160,735 | |||||||||||||||||||||||||||||||||||||||||||||||||||||||||||||||||
| Greece | 9 | 771,863 | — | — | 9 | 771,863 | |||||||||||||||||||||||||||||||||||||||||||||||||||||||||||||||||
| Hungary | 7 | 350,590 | — | — | 7 | 350,590 | |||||||||||||||||||||||||||||||||||||||||||||||||||||||||||||||||
| India | 81 | 3,702,063 | — | — | 81 | 3,702,063 | |||||||||||||||||||||||||||||||||||||||||||||||||||||||||||||||||
| Indonesia | 18 | 527,746 | 2 | 58,965 | 20 | 586,711 | |||||||||||||||||||||||||||||||||||||||||||||||||||||||||||||||||
| Ireland | 4 | 345,962 | 3 | 158,558 | 7 | 504,520 | |||||||||||||||||||||||||||||||||||||||||||||||||||||||||||||||||
| Jordan | 1 | 107,639 | — | — | 1 | 107,639 | |||||||||||||||||||||||||||||||||||||||||||||||||||||||||||||||||
| Kuwait | 2 | 11,626 | — | — | 2 | 11,626 | |||||||||||||||||||||||||||||||||||||||||||||||||||||||||||||||||
| Latvia | 2 | 37,868 | — | — | 2 | 37,868 | |||||||||||||||||||||||||||||||||||||||||||||||||||||||||||||||||
| Lesotho | 1 | 2,583 | — | — | 1 | 2,583 | |||||||||||||||||||||||||||||||||||||||||||||||||||||||||||||||||
| Lithuania | 2 | 70,041 | — | — | 2 | 70,041 | |||||||||||||||||||||||||||||||||||||||||||||||||||||||||||||||||
| Malaysia | 11 | 507,622 | — | — | 11 | 507,622 | |||||||||||||||||||||||||||||||||||||||||||||||||||||||||||||||||
| Mexico | 10 | 454,982 | 8 | 585,885 | 18 | 1,040,867 | |||||||||||||||||||||||||||||||||||||||||||||||||||||||||||||||||
| Morocco | 8 | 705,230 | — | — | 8 | 705,230 | |||||||||||||||||||||||||||||||||||||||||||||||||||||||||||||||||
| The Netherlands | 6 | 474,559 | — | — | 6 | 474,559 | |||||||||||||||||||||||||||||||||||||||||||||||||||||||||||||||||
| New Zealand | 6 | 413,959 | — | — | 6 | 413,959 | |||||||||||||||||||||||||||||||||||||||||||||||||||||||||||||||||
| Northern Ireland | 3 | 129,083 | — | — | 3 | 129,083 | |||||||||||||||||||||||||||||||||||||||||||||||||||||||||||||||||
| Norway | 4 | 155,323 | — | — | 4 | 155,323 | |||||||||||||||||||||||||||||||||||||||||||||||||||||||||||||||||
| Oman | 2 | 77,758 | — | — | 2 | 77,758 | |||||||||||||||||||||||||||||||||||||||||||||||||||||||||||||||||
| Peru | 2 | 47,265 | 10 | 433,770 | 12 | 481,035 | |||||||||||||||||||||||||||||||||||||||||||||||||||||||||||||||||
| Philippines | 12 | 422,919 | — | — | 12 | 422,919 | |||||||||||||||||||||||||||||||||||||||||||||||||||||||||||||||||
| Poland | 19 | 802,133 | — | — | 19 | 802,133 | |||||||||||||||||||||||||||||||||||||||||||||||||||||||||||||||||
| Romania | 8 | 490,155 | — | — | 8 | 490,155 | |||||||||||||||||||||||||||||||||||||||||||||||||||||||||||||||||
| Saudi Arabia | 7 | 400,687 | — | — | 7 | 400,687 | |||||||||||||||||||||||||||||||||||||||||||||||||||||||||||||||||
| Scotland | 3 | 139,722 | 3 | 324,751 | 6 | 464,473 | |||||||||||||||||||||||||||||||||||||||||||||||||||||||||||||||||
| Serbia | 2 | 106,540 | — | — | 2 | 106,540 | |||||||||||||||||||||||||||||||||||||||||||||||||||||||||||||||||
| Singapore | 8 | 489,049 | 2 | 186,956 | 10 | 676,005 | |||||||||||||||||||||||||||||||||||||||||||||||||||||||||||||||||
| Slovakia | 5 | 172,769 | — | — | 5 | 172,769 | |||||||||||||||||||||||||||||||||||||||||||||||||||||||||||||||||
| South Africa | 15 | 462,543 | — | — | 15 | 462,543 | |||||||||||||||||||||||||||||||||||||||||||||||||||||||||||||||||
| South Korea | 8 | 257,233 | — | — | 8 | 257,233 | |||||||||||||||||||||||||||||||||||||||||||||||||||||||||||||||||
| Spain | 20 | 511,793 | 5 | 211,954 | 25 | 723,747 | |||||||||||||||||||||||||||||||||||||||||||||||||||||||||||||||||
| Sweden | 8 | 1,047,265 | — | — | 8 | 1,047,265 | |||||||||||||||||||||||||||||||||||||||||||||||||||||||||||||||||
| Switzerland | 12 | 283,857 | — | — | 12 | 283,857 | |||||||||||||||||||||||||||||||||||||||||||||||||||||||||||||||||
| Thailand | 4 | 319,645 | 2 | 105,487 | 6 | 425,132 | |||||||||||||||||||||||||||||||||||||||||||||||||||||||||||||||||
IRON MOUNTAIN 2023 FORM 10-K | 23 | |||||||
| LEASED | OWNED | TOTAL | |||||||||||||||||||||||||||||||||||||||||||||||||||||||||||||||||||||
| COUNTRY/STATE | NUMBER | SQUARE FEET | NUMBER | SQUARE FEET | NUMBER | SQUARE FEET | |||||||||||||||||||||||||||||||||||||||||||||||||||||||||||||||||
| International (continued) | |||||||||||||||||||||||||||||||||||||||||||||||||||||||||||||||||||||||
| Turkey | 9 | 683,641 | — | — | 9 | 683,641 | |||||||||||||||||||||||||||||||||||||||||||||||||||||||||||||||||
| Ukraine | 10 | 208,050 | — | — | 10 | 208,050 | |||||||||||||||||||||||||||||||||||||||||||||||||||||||||||||||||
| United Arab Emirates | 7 | 695,118 | 1 | 434,442 | 8 | 1,129,560 | |||||||||||||||||||||||||||||||||||||||||||||||||||||||||||||||||
| Vietnam | 2 | 54,829 | — | — | 2 | 54,829 | |||||||||||||||||||||||||||||||||||||||||||||||||||||||||||||||||
| Total International | 636 | 34,166,427 | 103 | 5,941,382 | 739 | 40,107,809 | |||||||||||||||||||||||||||||||||||||||||||||||||||||||||||||||||
| Total | 1,145 | 74,732,873 | 232 | 23,280,731 | 1,377 | 98,013,604 | |||||||||||||||||||||||||||||||||||||||||||||||||||||||||||||||||
The leased facilities typically have initial lease terms of five to 10 years with one or more renewal options. In addition, some of the leases contain either a purchase option or a right of first refusal upon the sale of the property. We believe that the space available in our facilities is adequate to meet our current needs, although future growth may require that we lease or purchase additional real property.
Our total building utilization and total racking utilization as of December 31, 2023 in Records Management and Data Management are as follows:
RECORDS MANAGEMENT(1) | DATA MANAGEMENT | |||||||||||||||||||
| BUILDING UTILIZATION | RACKING UTILIZATION | BUILDING UTILIZATION | RACKING UTILIZATION | |||||||||||||||||
| 77% | 83% | 41% | 62% | |||||||||||||||||
(1)Total building utilization and total racking utilization for Records Management includes the utilization for Global Digital Solutions and Consumer Storage.
See Note 2.j. to Notes to Consolidated Financial Statements included in this Annual Report for information regarding our minimum annual lease commitments as a lessee.
See Schedule III—Schedule of Real Estate and Accumulated Depreciation in this Annual Report for information regarding the cost, accumulated depreciation and encumbrances associated with our owned real estate.
The following table sets forth a summary of the lease expirations for leases in place related to our Global Data Center Business, for which we are the lessor, as of December 31, 2023. The information set forth in the table assumes that tenants exercise no renewal options and all early termination rights.
| YEAR | NUMBER OF LEASES EXPIRING | TOTAL MEGAWATTS EXPIRING | PERCENTAGE OF TOTAL MEGAWATTS EXPIRING | ANNUALIZED TOTAL CONTRACT RENT EXPIRING (IN THOUSANDS) | PERCENTAGE OF TOTAL CONTRACT VALUE ANNUALIZED RENT | |||||||||||||||||||||||||||
| 2024 | 935 | 19.5 | 4.5 | % | $ | 65,564 | 10.9 | % | ||||||||||||||||||||||||
| 2025 | 346 | 36.4 | 8.4 | % | 86,659 | 14.5 | % | |||||||||||||||||||||||||
| 2026 | 242 | 23.3 | 5.4 | % | 52,198 | 8.7 | % | |||||||||||||||||||||||||
| 2027 | 59 | 9.7 | 2.2 | % | 24,459 | 4.1 | % | |||||||||||||||||||||||||
| 2028 | 64 | 58.2 | 13.4 | % | 74,435 | 12.4 | % | |||||||||||||||||||||||||
| 2029 | 15 | 24.6 | 5.7 | % | 24,250 | 4.0 | % | |||||||||||||||||||||||||
| 2030 | 5 | 48.6 | 11.2 | % | 53,808 | 9.0 | % | |||||||||||||||||||||||||
| Thereafter | 23 | 213.5 | 49.2 | % | 217,790 | 36.4 | % | |||||||||||||||||||||||||
| Total | 1,689 | 433.8 | 100.0 | % | $ | 599,163 | 100.0 | % | ||||||||||||||||||||||||
24 | IRON MOUNTAIN 2023 FORM 10-K | |||||||
ITEM 3. LEGAL PROCEEDINGS.
We are involved in litigation from time to time in the ordinary course of business. A portion of the defense and/or settlement costs associated with such litigation is covered by various commercial liability insurance policies purchased by us and, in limited cases, indemnification from third parties. In the opinion of management, no material legal proceedings are pending to which we, or any of our properties, are subject.
ITEM 4. MINE SAFETY DISCLOSURES.
None.
IRON MOUNTAIN 2023 FORM 10-K | 25 | |||||||
PART II
ITEM 5. MARKET FOR REGISTRANT'S COMMON EQUITY, RELATED STOCKHOLDER MATTERS AND ISSUER PURCHASES OF EQUITY SECURITIES.
Our common stock is traded on the NYSE under the symbol "IRM". The closing price of our common stock on the NYSE on February 16, 2024 was $67.98. As of February 16, 2024, there were 3,083 holders of record of our common stock. See Note 9 to Notes to Consolidated Financial Statements included in this Annual Report for additional information on dividends declared on our common stock.
UNREGISTERED SALES OF EQUITY SECURITIES AND USE OF PROCEEDS
We did not sell any unregistered equity securities during the three months ended December 31, 2023, nor did we repurchase any shares of our common stock during the three months ended December 31, 2023.
ITEM 6. [RESERVED.]
ITEM 7. MANAGEMENT'S DISCUSSION AND ANALYSIS OF FINANCIAL CONDITION AND RESULTS OF OPERATIONS.
The following discussion should be read in conjunction with the Consolidated Financial Statements and Notes thereto and the other financial and operating information included elsewhere in this Annual Report.
This discussion contains "forward-looking statements" as that term is defined in the Private Securities Litigation Reform Act of 1995 and in other securities laws. See "Cautionary Note Regarding Forward-Looking Statements" on page iii of this Annual Report and "Item 1A. Risk Factors" beginning on page 9 of this Annual Report.
IRON MOUNTAIN 2023 FORM 10-K | 27 | |||||||
OVERVIEW
PROJECT MATTERHORN
In September 2022, we announced Project Matterhorn, a global program designed to accelerate the growth of our business. Project Matterhorn investments focus on transforming our operating model to a global operating model. Project Matterhorn focuses on the formation of a solution-based sales approach that is designed to allow us to optimize our shared services and best practices to better serve our customers' needs. We are investing to accelerate growth and to capture a greater share of the large, global addressable markets in which we operate. We expect to incur approximately $150.0 million in costs annually related to Project Matterhorn from 2023 through 2025. Costs are comprised of (1) restructuring costs, which include (i) site consolidation and other related exit costs, (ii) employee severance costs and (iii) certain professional fees associated with these activities and (2) other transformation costs, which include professional fees such as project management costs and costs for third party consultants who are assisting in the enablement our growth initiatives. The following chart presents (in thousands) total Restructuring and other transformation costs related to Project Matterhorn from the inception of Project Matterhorn through December 31, 2023 and for the years ended December 31, 2023 and 2022:
| From the Inception of Project Matterhorn through December 31, 2023 | ||

| For the Year ended December 31, 2023 | ||

| For the Year ended December 31, 2022 | ||

GENERAL
RESULTS OF OPERATIONS - KEY TRENDS
•Our organic storage rental revenue growth is primarily driven by revenue management in our Global RIM Business segment, where we expect volume to be relatively stable in the near term, as well as by growth in our Global Data Center Business segment, primarily driven by lease commencements.
•Our organic service revenue growth is primarily due to increases in our service activity. We expect organic service revenue growth in 2024 to benefit from our new and existing digital offerings and ALM, as well as our traditional services.
•We expect continued total revenue and Adjusted EBITDA growth in 2024 as a result of our focus on new product and service offerings, innovation, customer solutions and market expansion in line with our Project Matterhorn objectives.
Our revenues consist of storage rental revenues as well as service revenues and are reflected net of sales and value-added taxes. Storage rental revenues, which are considered a key driver of financial performance for the storage and information management services industry, consist primarily of recurring periodic rental charges related to the storage of materials or data (generally on a per unit basis) that are typically retained by customers for many years and of revenues associated with our data center operations. Service revenues include charges for related service activities, the most significant of which include: (1) the handling of records, including the addition of new records, temporary removal of records from storage, refiling of removed records, customer termination and permanent withdrawal fees, project revenues and courier operations consisting primarily of the pickup and delivery of records upon customer request; (2) destruction services, consisting primarily of (i) secure shredding of sensitive documents and the subsequent sale of shredded paper for recycling, the price of which can fluctuate from period to period, and (ii) the decommissioning, data erasure, processing and disposition or sale of IT hardware and component assets; (3) digital solutions, including the scanning, imaging and document conversion services of active and inactive records, and consulting services; and (4) data center services, including set up, monitoring and support of our customers' assets which are protected in our data center facilities, and special project services, including data center fitout. Our Records Management and Data Management service revenue growth is being negatively impacted by declining activity rates as stored records and tapes are becoming less active and more archival. While customers continue to store their records and tapes with us, they are less likely than they have been in the past to retrieve records for research and other purposes, thereby reducing service activity levels.
Cost of sales (excluding depreciation and amortization) consists primarily of labor, including wages and benefits for field personnel, facility occupancy costs (including rent and utilities), transportation expenses (including vehicle leases and fuel), other product cost of sales and other equipment costs and supplies. Of these, labor and facility occupancy costs are the most significant. Selling, general and administrative expenses consist primarily of wages and benefits for management, administrative, IT, sales, account management and marketing personnel, as well as expenses related to communications, travel, professional fees, bad debts, training, office equipment and supplies.
28 | IRON MOUNTAIN 2023 FORM 10-K | |||||||
Cost of sales (excluding depreciation and amortization) and Selling, general and administrative expenses for the year ended December 31, 2023 consists of the following:
| COST OF SALES | SELLING, GENERAL AND ADMINISTRATIVE EXPENSES | |||||||
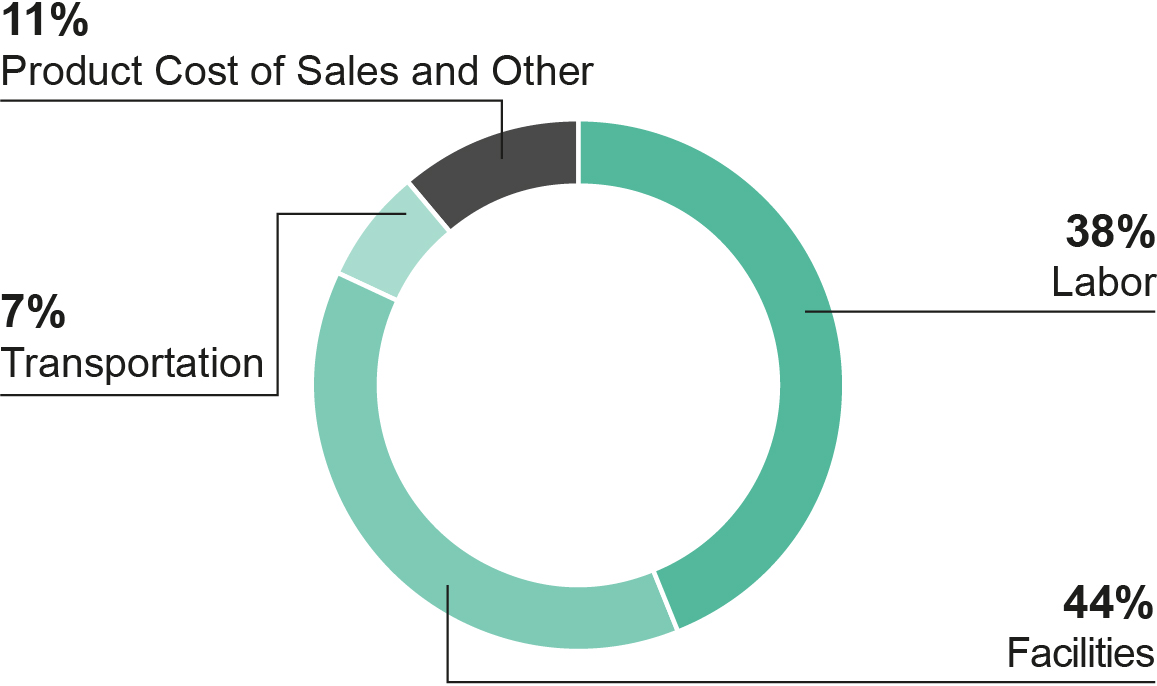 | 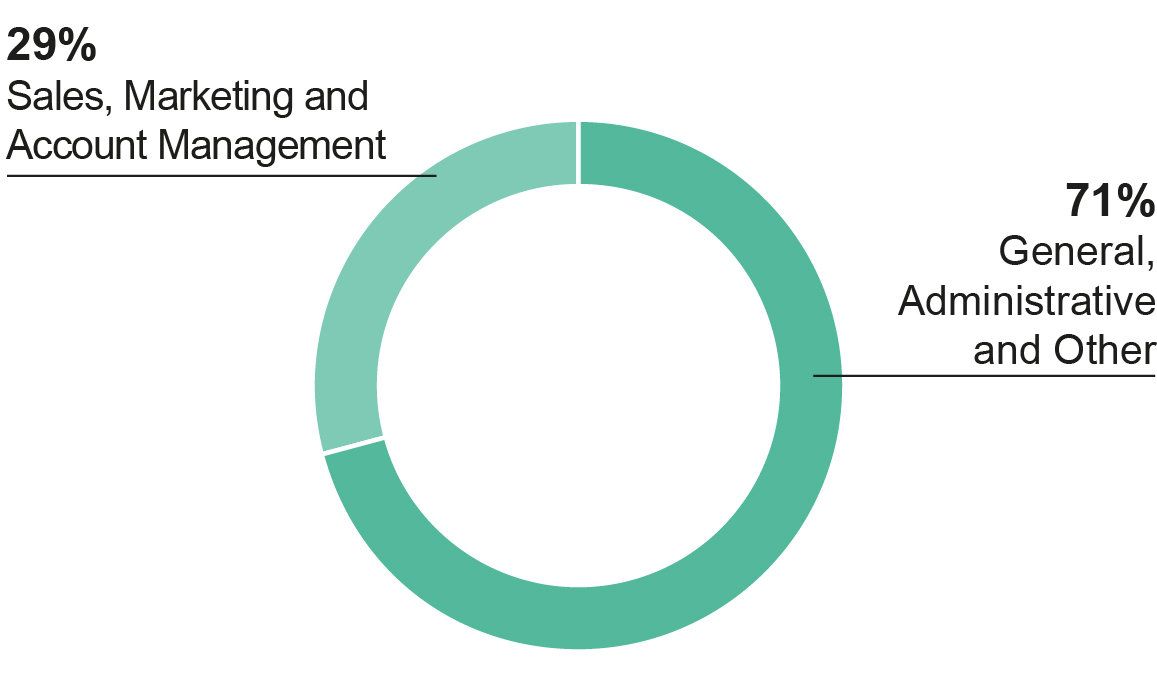 | |||||||
Trends in facility occupancy costs are impacted by: •the total number of facilities we occupy; •the mix of properties we own versus properties we lease; •fluctuations in per square foot occupancy costs; and •the levels of utilization of these properties. Trends in total wages and benefits in dollars and as a percentage of total revenue are influenced by: •changes in headcount and compensation levels; •achievement of incentive compensation targets; •workforce productivity; and •variability in costs associated with medical insurance and workers’ compensation. The expansion of our international businesses has impacted the major cost of sales components and selling, general and administrative expenses. •Our international operations are more labor intensive relative to revenue than our operations in North America and, therefore, labor costs are a higher percentage of international operational revenue. •The overhead structure of our expanding international operations has generally not achieved the same level of overhead leverage as our North American operations, which has resulted in an increase in selling, general and administrative expenses as a percentage of revenue as our international operations become a larger percentage of our consolidated results. | |||||
Our depreciation and amortization charges result primarily from depreciation related to storage systems, which include racking structures, buildings, building and leasehold improvements and computer systems hardware and software. Amortization relates primarily to customer and supplier relationship intangible assets, Contract Costs (as defined below in Critical Accounting Estimates) and data center lease-based intangible assets. Both depreciation and amortization are impacted by the timing of acquisitions.
Our consolidated revenues and expenses are subject to the net effect of foreign currency translation related to our operations outside the United States. It is difficult to predict the future fluctuations of foreign currency exchange rates and how those fluctuations will impact our Consolidated Statements of Operations. As a result of the relative size of our international operations, these fluctuations may be material on individual balances. Our revenues and expenses from our international operations are generally denominated in the local currency of the country in which they are derived or incurred. Therefore, the impact of currency fluctuations on our operating income and operating margin is partially mitigated. In order to provide a framework for assessing how our underlying businesses performed excluding the effect of foreign currency fluctuations, we compare the percentage change in the results from one period to another period in this report using constant currency presentation. The constant currency growth rates are calculated by translating the 2022 results at the 2023 average exchange rates. Constant currency growth rates are a non-GAAP measure.
IRON MOUNTAIN 2023 FORM 10-K | 29 | |||||||
The following table is a comparison of underlying average exchange rates of the foreign currencies that had the most significant impact on our United States dollar-reported revenues and expenses:
| PERCENTAGE OF UNITED STATES DOLLAR- REPORTED REVENUE FOR THE YEAR ENDED DECEMBER 31, | AVERAGE EXCHANGE RATES FOR THE YEAR ENDED DECEMBER 31, | PERCENTAGE STRENGTHENING / (WEAKENING) OF FOREIGN CURRENCY | |||||||||||||||||||||||||||
| 2023 | 2022 | 2023 | 2022 | ||||||||||||||||||||||||||
| Australian dollar | 2.6 | % | 2.8 | % | $ | 0.664 | $ | 0.695 | (4.5) | % | |||||||||||||||||||
| Brazilian real | 1.8 | % | 1.8 | % | $ | 0.200 | $ | 0.194 | 3.1 | % | |||||||||||||||||||
| British pound sterling | 7.2 | % | 6.5 | % | $ | 1.243 | $ | 1.237 | 0.5 | % | |||||||||||||||||||
| Canadian dollar | 5.1 | % | 5.3 | % | $ | 0.741 | $ | 0.769 | (3.6) | % | |||||||||||||||||||
| Euro | 6.6 | % | 7.0 | % | $ | 1.081 | $ | 1.054 | 2.6 | % | |||||||||||||||||||
The percentage of United States dollar-reported revenues for all other foreign currencies was 12.7% for both of the years ended December 31, 2023 and 2022.
30 | IRON MOUNTAIN 2023 FORM 10-K | |||||||
NON-GAAP MEASURES
ADJUSTED EBITDA
We define Adjusted EBITDA as net income (loss) before interest expense, net, provision (benefit) for income taxes, depreciation and amortization (inclusive of our share of Adjusted EBITDA from our unconsolidated joint ventures), and excluding certain items we do not believe to be indicative of our core operating results, specifically:
| EXCLUDED | |||||
•Acquisition and Integration Costs (as defined below) •Restructuring and other transformation •(Gain) loss on disposal/write-down of property, plant and equipment, net (including real estate) | •Other expense (income), net •Stock-based compensation expense | ||||
Adjusted EBITDA Margin is calculated by dividing Adjusted EBITDA by total revenues. We also show Adjusted EBITDA and Adjusted EBITDA Margin for each of our reportable segments under "Results of Operations – Segment Analysis" below.
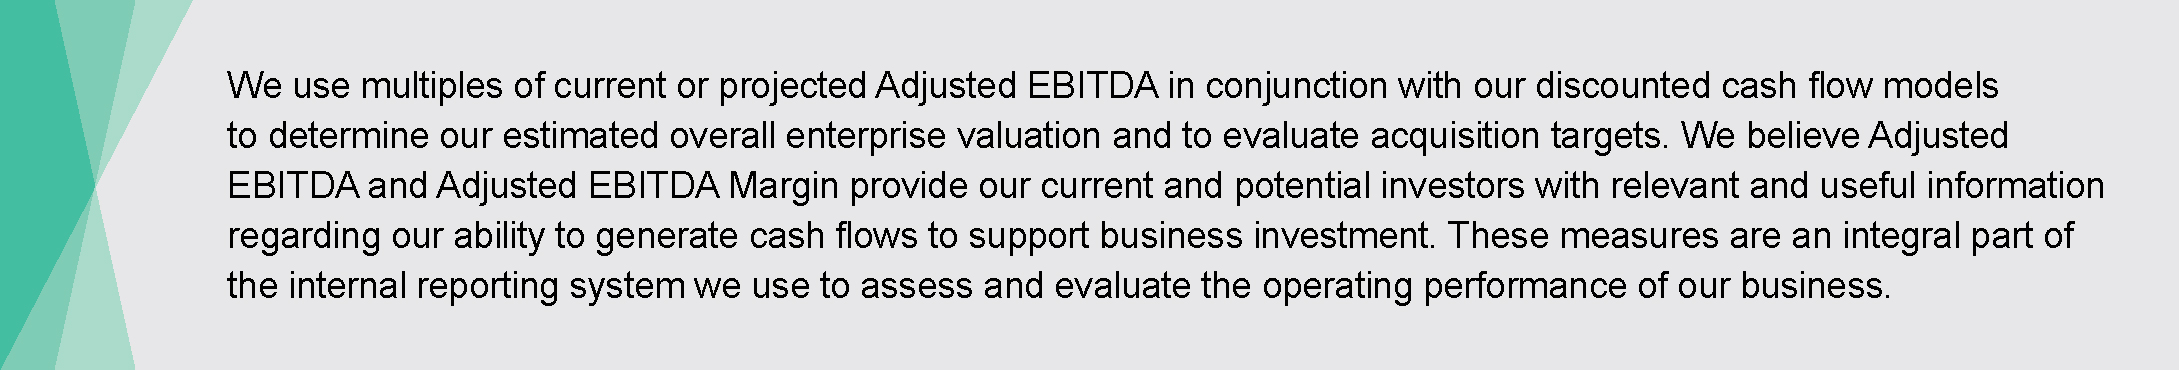
Adjusted EBITDA excludes both interest expense, net and the provision (benefit) for income taxes. These expenses are associated with our capitalization and tax structures, which we do not consider when evaluating the operating profitability of our core operations. Adjusted EBITDA does not include depreciation and amortization expenses, in order to eliminate the impact of capital investments, which we evaluate by comparing capital expenditures to incremental revenue generated and as a percentage of total revenues. Adjusted EBITDA and Adjusted EBITDA Margin should be considered in addition to, but not as a substitute for, other measures of financial performance reported in accordance with accounting principles generally accepted in the United States of America ("GAAP"), such as operating income, net income (loss) or cash flows from operating activities.
RECONCILIATION OF NET INCOME (LOSS) TO ADJUSTED EBITDA (IN THOUSANDS):
| YEAR ENDED DECEMBER 31, | |||||||||||
| 2023 | 2022 | ||||||||||
| Net Income (Loss) | $ | 187,263 | $ | 562,149 | |||||||
| Add/(Deduct): | |||||||||||
| Interest expense, net | 585,932 | 488,014 | |||||||||
| Provision (benefit) for income taxes | 39,943 | 69,489 | |||||||||
| Depreciation and amortization | 776,159 | 727,595 | |||||||||
Acquisition and Integration Costs(1) | 25,875 | 47,746 | |||||||||
Restructuring and other transformation | 175,215 | 41,933 | |||||||||
| (Gain) loss on disposal/write-down of property, plant and equipment, net (including real estate) | (12,825) | (93,268) | |||||||||
Other expense (income), net, excluding our share of losses (gains) from our unconsolidated joint ventures(2) | 98,891 | (83,268) | |||||||||
| Stock-based compensation expense | 73,799 | 56,861 | |||||||||
| Our share of Adjusted EBITDA reconciling items from our unconsolidated joint ventures | 11,425 | 9,806 | |||||||||
| Adjusted EBITDA | $ | 1,961,677 | $ | 1,827,057 | |||||||
(1)Represent operating expenditures directly associated with the closing and integration activities of our business acquisitions that have closed, or are highly probable of closing, and include (i) advisory, legal and professional fees to complete business acquisitions and (ii) costs to integrate acquired businesses into our existing operations, including move, severance and system integration costs (collectively, "Acquisition and Integration Costs").
(2)Includes foreign currency transaction losses (gains), net, debt extinguishment expense and other, net. See Note 2.v. to Notes to Consolidated Financial Statements included in this Annual Report for additional information regarding the components of Other expense (income), net.
IRON MOUNTAIN 2023 FORM 10-K | 31 | |||||||
ADJUSTED EPS
We define Adjusted EPS as reported earnings per share fully diluted from net income (loss) attributable to Iron Mountain Incorporated (inclusive of our share of adjusted losses (gains) from our unconsolidated joint ventures) and excluding certain items, specifically:
| EXCLUDED | |||||||||||||||||
•Acquisition and Integration Costs •Restructuring and other transformation •Amortization related to the write-off of certain customer relationship intangible assets •(Gain) loss on disposal/write-down of property, plant and equipment, net (including real estate) | •Other expense (income), net •Stock-based compensation expense •Non-cash amortization related to derivative instruments •Tax impact of reconciling items and discrete tax items | ||||||||||||||||
We do not believe these excluded items to be indicative of our ongoing operating results, and they are not considered when we are forecasting our future results. We believe Adjusted EPS is of value to our current and potential investors when comparing our results from past, present and future periods.
RECONCILIATION OF REPORTED EPS—FULLY DILUTED FROM NET INCOME (LOSS) ATTRIBUTABLE TO IRON MOUNTAIN INCORPORATED TO ADJUSTED EPS—FULLY DILUTED FROM NET INCOME (LOSS) ATTRIBUTABLE TO IRON MOUNTAIN INCORPORATED:
| YEAR ENDED DECEMBER 31, | |||||||||||
| 2023 | 2022 | ||||||||||
| Reported EPS—Fully Diluted from Net Income (Loss) Attributable to Iron Mountain Incorporated | $ | 0.63 | $ | 1.90 | |||||||
| Add/(Deduct): | |||||||||||
| Acquisition and Integration Costs | 0.09 | 0.16 | |||||||||
Restructuring and other transformation | 0.60 | 0.14 | |||||||||
| Amortization related to the write-off of certain customer relationship intangible assets | — | 0.02 | |||||||||
| (Gain) loss on disposal/write-down of property, plant and equipment, net (including real estate) | (0.04) | (0.31) | |||||||||
Other expense (income), net, excluding our share of losses (gains) from our unconsolidated joint ventures | 0.34 | (0.28) | |||||||||
| Stock-based compensation expense | 0.25 | 0.19 | |||||||||
Non-cash amortization related to derivative instruments(1) | 0.07 | 0.03 | |||||||||
Tax impact of reconciling items and discrete tax items(2) | (0.12) | (0.08) | |||||||||
| Income (Loss) Attributable to Noncontrolling Interests | 0.01 | 0.02 | |||||||||
Adjusted EPS—Fully Diluted from Net Income (Loss) Attributable to Iron Mountain Incorporated(3) | $ | 1.82 | $ | 1.79 | |||||||
(1)Relates to the amortization of the excluded component of our cross-currency swap agreements, which is recognized on a straight-line basis as a component of Interest expense, net in our Consolidated Statements of Operations.
(2)The differences between our effective tax rates and our structural tax rate (or adjusted effective tax rates) for the years ended December 31, 2023 and 2022 are primarily due to (i) the reconciling items above, which impact our reported net income (loss) before provision (benefit) for income taxes but have an insignificant impact on our reported provision (benefit) for income taxes and (ii) other discrete tax items. Our structural tax rate for purposes of the calculation of Adjusted EPS for the years ended December 31, 2023 and 2022 was 12.3% and 15.2%, respectively.
(3)Columns may not foot due to rounding.
32 | IRON MOUNTAIN 2023 FORM 10-K | |||||||
FFO (NAREIT) AND FFO (NORMALIZED)
Funds from operations ("FFO") is defined by the National Association of Real Estate Investment Trusts as net income (loss) excluding depreciation on real estate assets, losses and gains on sale of real estate, net of tax, and amortization of data center leased-based intangibles ("FFO (Nareit)"). We calculate our FFO measures, including FFO (Nareit), adjusting for our share of reconciling items from our unconsolidated joint ventures. FFO (Nareit) does not give effect to real estate depreciation because these amounts are computed, under GAAP, to allocate the cost of a property over its useful life. Because values for well-maintained real estate assets have historically increased or decreased based upon prevailing market conditions, we believe that FFO (Nareit) provides investors with a clearer view of our operating performance. Our most directly comparable GAAP measure to FFO (Nareit) is net income (loss).
We modify FFO (Nareit), as is common among REITs seeking to provide financial measures that most meaningfully reflect their particular business ("FFO (Normalized)"). Our definition of FFO (Normalized) excludes certain items included in FFO (Nareit) that we believe are not indicative of our core operating results, specifically:
| EXCLUDED | |||||
•Acquisition and Integration Costs •Restructuring and other transformation •(Gain) loss on disposal/write-down of property, plant and equipment, net (excluding real estate) •Other expense (income), net | •Stock-based compensation expense •Non-cash amortization related to derivative instruments •Real estate financing lease depreciation •Tax impact of reconciling items and discrete tax items | ||||
RECONCILIATION OF NET INCOME (LOSS) TO FFO (NAREIT) AND FFO (NORMALIZED) (IN THOUSANDS):
| YEAR ENDED DECEMBER 31, | |||||||||||
| 2023 | 2022 | ||||||||||
| Net Income (Loss) | $ | 187,263 | $ | 562,149 | |||||||
| Add/(Deduct): | |||||||||||
Real estate depreciation(1) | 322,045 | 307,895 | |||||||||
(Gain) loss on sale of real estate, net of tax(2) | (16,656) | (94,059) | |||||||||
Data center lease-based intangible assets amortization(3) | 22,322 | 16,955 | |||||||||
| Our share of FFO (Nareit) reconciling items from our unconsolidated joint ventures | 2,226 | — | |||||||||
| FFO (Nareit) | 517,200 | 792,940 | |||||||||
| Add/(Deduct): | |||||||||||
| Acquisition and Integration Costs | 25,875 | 47,746 | |||||||||
Restructuring and other transformation | 175,215 | 41,933 | |||||||||
| Loss (gain) on disposal/write-down of property, plant and equipment, net (excluding real estate) | 4,307 | 1,564 | |||||||||
Other expense (income), net, excluding our share of losses (gains) from our unconsolidated joint ventures | 98,891 | (83,268) | |||||||||
| Stock-based compensation expense | 73,799 | 56,861 | |||||||||
| Non-cash amortization related to derivative instruments | 21,097 | 9,100 | |||||||||
| Real estate financing lease depreciation | 12,019 | 13,197 | |||||||||
Tax impact of reconciling items and discrete tax items(4) | (35,307) | (25,190) | |||||||||
| Our share of FFO (Normalized) reconciling items from our unconsolidated joint ventures | (374) | 2,874 | |||||||||
| FFO (Normalized) | $ | 892,722 | $ | 857,757 | |||||||
(1)Includes depreciation expense related to owned real estate assets (land improvements, buildings, building improvements, leasehold improvements and racking), excluding depreciation related to real estate financing leases.
(2)Tax expense associated with the gain on sale of real estate for the years ended December 31, 2023 and 2022 was approximately $0.5 million and $0.8 million, respectively.
(3)Includes amortization expense for Data Center In-Place Leases and Data Center Tenant Relationships as defined in Note 2.m. to Notes to Consolidated Financial Statements included in this Annual Report.
(4)Represents the tax impact of (i) the reconciling items above, which impact our reported net income (loss) before provision (benefit) for income taxes but has an insignificant impact on our reported provision (benefit) for income taxes and (ii) other discrete tax items. Discrete tax items resulted in a (benefit) provision for income taxes of $(18.1) million and $(11.9) million for the years ended December 31, 2023 and 2022, respectively.
IRON MOUNTAIN 2023 FORM 10-K | 33 | |||||||
CRITICAL ACCOUNTING ESTIMATES
Our discussion and analysis of our financial condition and results of operations are based upon our Consolidated Financial Statements, which have been prepared in accordance with GAAP. The preparation of these financial statements requires us to make estimates, judgments and assumptions that affect the reported amounts of assets, liabilities, revenues and expenses, and related disclosure of contingent assets and liabilities at the date of the financial statements and for the period then ended. On an ongoing basis, we evaluate the estimates used. We base our estimates on historical experience, actuarial estimates, current conditions and various other assumptions that we believe to be reasonable under the circumstances. These estimates form the basis for making judgments about the carrying values of assets and liabilities and are not readily apparent from other sources. Actual results may differ from these estimates. The following should be read in conjunction with Note 2 to Notes to Consolidated Financial Statements included in this Annual Report, which provides a summary of our significant accounting policies. Our critical accounting estimates include the following, which are listed in no particular order:
REVENUE RECOGNITION
Revenue is recognized when or as control of promised goods or services is transferred to the customer, in an amount that reflects the consideration we expect to be entitled to in exchange for those goods or services. See Note 2.s. to Notes to Consolidated Financial Statements included in this Annual Report for additional details on our revenue recognition policies. Revenue for all our lines of business, with the exception of storage revenues in our Global Data Center Business (which is subject to Accounting Standards Codification ("ASC") Topic 842, Leases), is recognized in accordance with ASC 606, Revenue from Contracts with Customers ("ASC 606"), the application of which requires that we make significant judgments related to performance obligations and the transfer of control to the customer.
We have determined that the majority of our contracts contain series performance obligations which qualify to be recognized under a practical expedient available in ASC 606 known as the "right to invoice". This determination allows variable consideration in such contracts to be allocated to and recognized in the period to which the consideration relates, which is typically the period in which it is billed, rather than requiring estimation of variable consideration at the inception of the contract.
The costs associated with the initial movement of customer records into physical storage and certain commissions are considered costs to obtain or fulfill customer contracts (collectively, "Contract Costs"). Contract Costs are generally amortized over a three year term, which we have determined is consistent with the transfer of the underlying performance obligations to which the assets relate. Different determinations on term length would result in differences in the amount and timing of amortization expense recognized.
ACCOUNTING FOR ACQUISITIONS
Part of our growth strategy has been to acquire businesses. The purchase price of each acquisition is determined after due diligence of the target business, market research, strategic planning and the forecasting of expected future results and synergies. Estimated future results and expected synergies are subject to revisions as we integrate each acquisition and attempt to leverage resources.
Accounting for acquisitions of a business has resulted in the capitalization of the cost in excess of the estimated fair value of the net assets acquired in each of these acquisitions as goodwill. We estimate the fair values of the assets acquired in each acquisition as of the date of acquisition and these estimates are subject to adjustment based on the final assessments of the fair value of intangible assets (primarily customer and supplier relationship and data center lease-based intangible assets), property, plant and equipment (primarily building, building improvements, leasehold improvements, data center infrastructure and racking structures), operating leases, contingencies and income taxes (primarily deferred income taxes). See Note 3 to Notes to Consolidated Financial Statements included in this Annual Report for a description of recent acquisitions.
Determining the fair values of the net assets acquired requires management’s judgment and often involves the use of assumptions with respect to future cash inflows and outflows, discount rates and market data, among other items. As it relates to our data center acquisitions, the fair values of the net assets acquired requires management’s judgment and often involves the use of assumptions with respect to (i) certain economic costs (as described more fully in Note 2.m. to Notes to Consolidated Financial Statements included in this Annual Report) avoided by acquiring a data center operation with active tenants that would have otherwise been incurred if the data center operation was purchased vacant, (ii) market rental rates and (iii) expectations of lease renewals and extensions. Due to the inherent uncertainty of future events, actual values of net assets acquired could be different from our estimated fair values and could have a material impact on our financial statements.
34 | IRON MOUNTAIN 2023 FORM 10-K | |||||||
Of the net assets acquired in our acquisitions, the fair value of owned buildings, including building improvements, customer and supplier relationship and data center lease-based intangible assets, racking structures and operating leases are generally the most common and most significant. For significant acquisitions or acquisitions involving new markets or new products, we generally use third parties to assist us in estimating the fair value of owned buildings, including building improvements, customer and supplier relationship and lease-based intangible assets and market rental rates for acquired operating leases. For acquisitions that are not significant or do not involve new markets or new products, we generally use third parties to assist us in estimating the fair value of acquired owned buildings, including building improvements, and market rental rates for acquired operating leases. When not using third party appraisals of the fair value of acquired net assets, the fair value of acquired customer and supplier relationship intangible assets, above and below market in-place operating leases, and racking structures is determined internally. We use discounted cash flow models to determine the fair value of customer and supplier relationship intangible assets, which requires a significant amount of judgment by management, including estimating expected lives of the relationships, expected future cash flows and discount rates. The fair value of above and below market in-place operating leases is determined internally using a discounted cash flow model, utilizing the difference in cash flows between the contractual lease payments over the remaining lease term and estimated market rental rates on comparable assets at the time of the acquisition. The fair value of acquired racking structures is determined internally by taking current estimated replacement cost at the date of acquisition for the quantity of racking structures acquired, discounted to take into account the quality (e.g. age, material and type) of the racking structures. We determine the fair value of tangible data center assets using an estimated replacement cost at the date of acquisition, then discounting for age, economic and functional obsolescence.
The fair value of the Deferred Purchase Obligation associated with the ITRenew Transaction (each as defined in Note 3 to Notes to Consolidated Financial Statements included in this Annual Report) was determined utilizing a Monte-Carlo simulation model and takes into account our forecasted projections as it relates to the underlying performance of the business. The Monte-Carlo simulation model incorporates assumptions as to expected gross profits over the applicable achievement period, including adjustments for the volatility of timing and amount of the associated revenue and costs, as well as discount rates that account for the risk of the underlying arrangement and overall market risks.
Our estimates of fair value are based upon assumptions believed to be reasonable at that time but which are inherently uncertain and unpredictable. Assumptions may be incomplete or inaccurate, and unanticipated events and circumstances may occur, which may affect the accuracy of such assumptions. Total property, plant and equipment acquired in our 2023 acquisitions was approximately $140.7 million.
IMPAIRMENT OF TANGIBLE AND INTANGIBLE ASSETS
ASSETS SUBJECT TO DEPRECIATION OR AMORTIZATION
We review long-lived assets and finite-lived intangible assets for impairment whenever events or changes in circumstances indicate the carrying amount of such assets may not be recoverable. Examples of events or circumstances that may be indicative of impairment include, but are not limited to:
•A significant decrease in the market price of an asset;
•A significant change in the extent or manner in which a long-lived asset is being used or in its physical condition;
•A significant adverse change in legal factors or in the business climate that could affect the value of the asset;
•An accumulation of costs significantly greater than the amount originally expected for the acquisition or construction of an asset;
•A current-period operating or cash flow loss combined with a history of operating or cash flow losses or a projection or forecast that demonstrates continuing losses associated with the use of a long-lived asset; and
•A current expectation that, more likely than not, an asset will be sold or otherwise disposed of significantly before the end of its previously estimated useful life.
If events indicate the carrying value of such assets may not be recoverable, recoverability of these assets is determined by comparing the sum of the forecasted undiscounted net cash flows of the operation to which the assets relate to their carrying amount. The operations are generally distinguished by the business segment and geographic region in which they operate. If it is determined that we are unable to recover the carrying amount of the assets, the long-lived assets are written down, on a pro rata basis, to fair value. Fair value is determined based on discounted cash flows or appraised values, depending upon the nature of the assets.
We did not record impairment charges for any of our long-lived assets or finite-lived intangibles during the years ended December 31, 2023 and 2022.
IRON MOUNTAIN 2023 FORM 10-K | 35 | |||||||
GOODWILL AND OTHER INDEFINITE-LIVED INTANGIBLE ASSETS NOT SUBJECT TO AMORTIZATION
Goodwill and intangible assets with indefinite lives are not amortized but are reviewed annually for impairment, or more frequently if impairment indicators arise. Other than goodwill, we currently have no intangible assets that have indefinite lives and which are not amortized. See Note 2.l. to Notes to Consolidated Financial Statements included in this Annual Report for additional details on our goodwill and other indefinite-lived intangible assets policies.
We have selected October 1 as our annual goodwill impairment review date. We have performed our annual goodwill impairment review as of October 1, 2023 and 2022. We concluded that as of October 1, 2023 and 2022, goodwill was not impaired.
Our reporting units at which level we performed our goodwill impairment analysis as of October 1, 2023 were as follows:
•North American Records and Information Management reporting unit ("North America RIM") •Europe Records and Information Management reporting unit ("Europe RIM") •Middle East, North Africa, Turkey and South Africa Records Information Management reporting unit ("MENATSA RIM") •Latin America Records and Information Management reporting unit ("Latin America RIM") | •Asia, Australia and New Zealand Records and Information Management reporting unit ("APAC RIM") •Entertainment Services •Global Data Center •Fine Arts •ALM | ||||
See Note 2.l. to Notes to Consolidated Financial Statements included in this Annual Report for a description of our reporting units.
Based on our goodwill impairment analysis as of October 1, 2023, all of our reporting units had estimated fair values exceeding their carrying values by greater than 30%. The Global Data Center and ALM reporting units represented approximately $1,058.4 million, or 21.1%, of our consolidated goodwill balance at December 31, 2023, and their fair values are most sensitive to changes in our assumptions. The following is a summary of the Global Data Center and ALM reporting units including the goodwill balance (in thousands), the percentage by which the fair value of the reporting units exceeded their carrying values and certain key assumptions used by us in determining the fair value of the reporting units as of October 1, 2023:
| REPORTING UNIT | GOODWILL BALANCE AT OCTOBER 1, 2023 | PERCENTAGE BY WHICH THE FAIR VALUE OF THE REPORTING UNIT EXCEEDED THE REPORTING UNIT CARRYING VALUE AS OF OCTOBER 1, 2023 | KEY ASSUMPTIONS IN THE FAIR VALUE OF REPORTING UNIT MEASUREMENT AS OF OCTOBER 1, 2023 | ||||||||||||||||||||||||||||||||
| DISCOUNT RATE | AVERAGE ANNUAL ADJUSTED EBITDA MARGIN USED IN DISCOUNTED CASH FLOW | AVERAGE ANNUAL CAPITAL EXPENDITURES AS PERCENTAGE OF REVENUE(1) | TERMINAL GROWTH RATE(2) | ||||||||||||||||||||||||||||||||
| Global Data Center | $447,931 | 31.2% | 9.0% | 45.0% | 19.7% | 4.0% | |||||||||||||||||||||||||||||
| ALM | 579,054 | 37.7% | 16.5% | 13.6% | 1.2% | 3.5% | |||||||||||||||||||||||||||||
(1)For purposes of our goodwill impairment analysis, the term "capital expenditures" includes both growth investment and recurring capital expenditures. The capital expenditure assumptions in our goodwill impairment analysis for our Global Data Center reporting unit include significant growth investment in the next three years.
(2)Terminal growth rates are applied after year 10 of our discounted cash flow analysis.
The fair values of our reporting units are generally determined using a combined approach based on the present value of future cash flows (the "Discounted Cash Flow Model") and market multiples (the "Market Approach"). There are inherent uncertainties and judgments involved when determining the fair value of the reporting units for purposes of our annual goodwill impairment testing. The following includes supplemental information to the table above for the Global Data Center and ALM reporting units where the estimated fair value exceeded their respective carrying values by approximately 31.2% and 37.7% as of October 1, 2023. The fair value of our Global Data Center reporting unit was determined using a combined Discounted Cash Flow Model and Market Approach, while the fair value of our ALM reporting unit was determined using a Discounted Cash Flow Model approach. We do not use a Market Approach when determining the fair value of our ALM reporting unit given a lack of directly comparable publicly traded guideline companies to ALM. The success of these businesses and the achievement of certain key assumptions developed by management and used in the Discounted Cash Flow Model are contingent upon various factors including, but not limited to, (i) achieving growth from existing customers, (ii) sales to new customers, (iii) increased market penetration, (iv) accuracy in the timing and costs of capital investments related to expansions and (v) market pricing trends of IT hardware and component assets.
36 | IRON MOUNTAIN 2023 FORM 10-K | |||||||
GLOBAL DATA CENTER
Our Global Data Center Business operates 26 data centers across 21 global markets, either directly or through unconsolidated joint ventures. We provide enterprise-class data center facilities and hyperscale-ready capacity to protect mission-critical assets and ensure the continued operation of our customers’ IT infrastructure with secure, reliable and flexible data center options. Data centers are highly specialized and secure assets that serve as centralized repositories of server, storage and network equipment. They are capital intensive and designed to provide the space, power, cooling and network connectivity necessary to efficiently operate mission-critical IT equipment. The demand for data center infrastructure is being driven by many factors, but most importantly by significant growth in data as well as an increased demand for outsourcing. In order to attract and retain customers, as well as sustain growth in our existing and new markets, we must have the capability to tailor our facilities and invest capital to meet our customers’ needs. Our estimate of fair value reflects the expected growth in each of our data center markets along with the corresponding capital investments required to meet demand.
ALM
Our ALM business provides hyperscale and corporate IT infrastructure managers with services and solutions that enable the decommissioning, data erasure, processing and disposition or sale of IT hardware and component assets. ALM services are enabled by: (i) secure logistics, chain of custody and complete asset traceability practices; (ii) environmentally-responsible asset processing and recycling; and (iii) data sanitization and asset refurbishment services that enable value recovery through asset remarketing. The assumptions we used in determining fair value reflect the ongoing and anticipated expansion of these services, the maintenance and further development of the supplier relationships required to expand this business and meet customer demand and decommissioning schedules of our supplier's IT hardware and component assets, as well as demand for such assets at that time. The assumptions used also reflect the continued stabilization and improvement in market pricing for IT hardware and component assets from pricing observed as compared to recent history.
KEY ASSUMPTIONS
Key factors that could reasonably be expected to have a negative impact on the estimated fair value of these reporting units and potentially result in impairment charges include, but are not limited to: (i) a deterioration in general economic conditions, (ii) significant adverse changes in regulatory factors or in the business climate and (iii) adverse actions or assessment by regulators, all of which could result in adverse changes to the key assumptions used in valuing the reporting units. The inability to meet the assumptions used in the Discounted Cash Flow Model and Market Approach for each of the reporting units, or future adverse market conditions not currently known, could lead to a fair value that is less than the carrying value in any one of our reporting units.
The Discounted Cash Flow Model incorporates significant assumptions including future revenue growth rates, operating margins, discount rates and capital expenditures. The Market Approach requires us to make assumptions related to EBITDA multiples. Changes in economic and operating conditions impacting these assumptions or changes in multiples could result in goodwill impairments in future periods. In conjunction with our annual goodwill impairment reviews, we reconcile the sum of the valuations of all of our reporting units to our market capitalization as of such dates.
Although we believe we have sufficient historical and projected information available to us to test for goodwill impairment, it is possible that actual results could differ from the estimates used in our impairment tests. Of the key assumptions that impact the goodwill impairment test, the expected future cash flows and discount rate are among the most sensitive and are considered to be critical assumptions, as changes to these estimates could have an effect on the estimated fair value of each of our reporting units. We have assessed the sensitivity of these assumptions on each of our reporting units as of October 1, 2023.
We noted that, based on the estimated fair value of all of our reporting units determined as of October 1, 2023:
•a hypothetical decrease of 10% in the expected annual future cash flows of these reporting units, with all other assumptions unchanged, would have decreased the estimated fair value of our reporting units as of October 1, 2023 by a range of approximately 7.7% to 11.5% but would not, however, have resulted in the carrying value of any of our reporting units exceeding their estimated fair value; and
•a hypothetical increase of 100 basis points in the discount rate, with all other assumptions unchanged, would have decreased the estimated fair value of our reporting units as of October 1, 2023 by a range of approximately 2.7% to 15.4% but would not, however, have resulted in the carrying value of any of our reporting units exceeding their estimated fair value.
At December 31, 2023, no factors were identified that would alter the conclusions of our October 1, 2023 goodwill impairment analysis. In making this assessment, we considered a number of factors including operating results, business plans, anticipated future cash flows, transactions and marketplace data. There are inherent uncertainties related to these factors and our judgment in applying them to the analysis of goodwill impairment.
IRON MOUNTAIN 2023 FORM 10-K | 37 | |||||||
INCOME TAXES
As a REIT, we are generally permitted to deduct from our federal taxable income the dividends we pay to our stockholders. The income represented by such dividends is not subject to federal taxation at the entity level but is taxed, if at all, at the stockholder level. The income of our domestic TRSs, which hold our domestic operations that may not be REIT-compliant as currently operated and structured, is subject, as applicable, to federal and state corporate income tax. In addition, we and our subsidiaries continue to be subject to foreign income taxes in other jurisdictions in which we have business operations or a taxable presence, regardless of whether assets are held or operations are conducted through subsidiaries disregarded for federal income tax purposes or TRSs. We will also be subject to a separate corporate income tax on any gains recognized on the sale or disposition of any asset previously owned by a C corporation during a five-year period after the date we first owned the asset as a REIT asset that are attributable to "built-in gains" with respect to that asset on that date. We will also be subject to a built-in gains tax on our depreciation recapture recognized into income as a result of accounting method changes in connection with our acquisition activities. If we fail to remain qualified for taxation as a REIT, we will be subject to federal income tax at regular corporate income tax rates. Even if we remain qualified for taxation as a REIT, we may be subject to some federal, state, local and foreign taxes on our income and property in addition to taxes owed with respect to our TRS operations. In particular, while state income tax regimes often parallel the federal income tax regime for REITs, many states do not completely follow federal rules and some do not follow them at all. See Note 10 to Notes to Consolidated Financial Statements included in this Annual Report for additional details on our tax policies.
Accounting for income taxes requires the recognition of deferred tax assets and liabilities for the expected future tax consequences of temporary differences between the tax and financial reporting bases of assets and liabilities and for loss and credit carryforwards. We measure deferred tax assets and liabilities using enacted tax rates expected to be applied to taxable income in the years in which those temporary differences and carryforwards are expected to be recovered or settled. The effect on deferred tax assets and liabilities as a result of a change in tax rates is recognized in income in the period that the change is enacted. Valuation allowances are provided when recovery of deferred tax assets does not meet the more likely than not standard as defined in GAAP. Valuation allowances would be reversed as a reduction to the provision for income taxes if related deferred tax assets are deemed realizable based on changes in facts and circumstances relevant to the recoverability of the asset.
At December 31, 2023, we have federal net operating loss carryforwards of $109.6 million, which can be carried forward indefinitely, of which $88.7 million is expected to be realized to reduce future federal taxable income. We have assets for foreign net operating losses of $133.5 million, with various expiration dates (and in some cases no expiration date), subject to a valuation allowance of approximately 73.8%. If actual results differ unfavorably from certain of our estimates used, we may not be able to realize all or part of our net deferred income tax assets and additional valuation allowances may be required. Although we believe our estimates are reasonable, no assurance can be given that our estimates reflected in the tax provisions and accruals will equal our actual results. These differences could have a material impact on our income tax provision and operating results in the period in which such determination is made.
The evaluation of an uncertain tax position is a two-step process. The first step is a recognition process whereby we determine whether it is more likely than not that a tax position will be sustained upon examination, including resolution of any related appeals or litigation processes, based on the technical merits of the position. The second step is a measurement process whereby a tax position that meets the more likely than not recognition threshold is calculated to determine the amount of benefit to recognize in the financial statements. The tax position is measured as the largest amount of benefit that is greater than 50% likely of being realized upon ultimate settlement.
We are subject to income taxes in the United States and numerous foreign jurisdictions. We are subject to examination by various tax authorities in jurisdictions in which we have business operations or a taxable presence. We regularly assess the likelihood of additional assessments by tax authorities and provide for these matters as appropriate. As of December 31, 2023 and 2022, we had approximately $23.6 million and $27.8 million, respectively, of reserves related to uncertain tax positions. The reversal of these reserves will be recorded as a reduction of our income tax provision if sustained. Although we believe our tax estimates are appropriate, the final determination of tax audits and any related litigation could result in changes in our estimates.
During 2021, as a result of the enactment of a tax law and the closing of various acquisitions, we concluded that it is no longer our intention to reinvest our undistributed earnings of our foreign TRSs indefinitely outside the United States. As a REIT, future repatriation of incremental undistributed earnings of our foreign subsidiaries will not be subject to federal or state income tax, with the exception of foreign withholding taxes. However, such future repatriations may require distributions to our stockholders in accordance with REIT distribution rules, and any such distribution may then be taxable, as appropriate, at the stockholder level. We expect to provide for foreign withholding taxes on the current and future earnings of all of our foreign subsidiaries as the result of such reassessment.
38 | IRON MOUNTAIN 2023 FORM 10-K | |||||||
RESULTS OF OPERATIONS
The following information summarizes our results of operations for the year ended December 31, 2023 compared to the year ended December 31, 2022. For a discussion of our results for the year ended December 31, 2022 compared to the year ended December 31, 2021, see "Item 7. Management's Discussion and Analysis of Financial Condition and Results of Operations" included in our Annual Report on Form 10-K filed with the SEC on February 23, 2023.
COMPARISON OF YEAR ENDED DECEMBER 31, 2023 TO YEAR ENDED DECEMBER 31, 2022
(IN THOUSANDS):
| YEAR ENDED DECEMBER 31, | DOLLAR CHANGE | PERCENTAGE CHANGE | |||||||||||||||||||||
| 2023 | 2022 | ||||||||||||||||||||||
| Revenues | $ | 5,480,289 | $ | 5,103,574 | $ | 376,715 | 7.4 | % | |||||||||||||||
| Operating Expenses | 4,558,511 | 4,053,703 | 504,808 | 12.5 | % | ||||||||||||||||||
| Operating Income | 921,778 | 1,049,871 | (128,093) | (12.2) | % | ||||||||||||||||||
| Other Expenses, Net | 734,515 | 487,722 | 246,793 | 50.6 | % | ||||||||||||||||||
| Net Income (Loss) | 187,263 | 562,149 | (374,886) | (66.7) | % | ||||||||||||||||||
| Net Income (Loss) Attributable to Noncontrolling Interests | 3,029 | 5,168 | (2,139) | (41.4) | % | ||||||||||||||||||
| Net Income (Loss) Attributable to Iron Mountain Incorporated | $ | 184,234 | $ | 556,981 | $ | (372,747) | (66.9) | % | |||||||||||||||
Adjusted EBITDA(1) | $ | 1,961,677 | $ | 1,827,057 | $ | 134,620 | 7.4 | % | |||||||||||||||
Adjusted EBITDA Margin(1) | 35.8 | % | 35.8 | % | |||||||||||||||||||
(1)See "Non-GAAP Measures—Adjusted EBITDA" in this Annual Report for the definitions of Adjusted EBITDA and Adjusted EBITDA Margin, reconciliation of Net Income (Loss) to Adjusted EBITDA and a discussion of why we believe these non-GAAP measures provide relevant and useful information to our current and potential investors.
IRON MOUNTAIN 2023 FORM 10-K | 39 | |||||||
REVENUES
Total revenues consist of the following (in thousands):
| YEAR ENDED DECEMBER 31, | PERCENTAGE CHANGE | ||||||||||||||||||||||||||||||||||||||||
| 2023 | 2022 | DOLLAR CHANGE | ACTUAL | CONSTANT CURRENCY(1) | IMPACT OF ACQUISITIONS | ORGANIC GROWTH(2) | |||||||||||||||||||||||||||||||||||
| Storage Rental | $ | 3,370,645 | $ | 3,034,023 | $ | 336,622 | 11.1 | % | 11.2 | % | 0.7 | % | 10.5 | % | |||||||||||||||||||||||||||
| Service | 2,109,644 | 2,069,551 | 40,093 | 1.9 | % | 2.2 | % | 0.6 | % | 1.6 | % | ||||||||||||||||||||||||||||||
| Total Revenues | $ | 5,480,289 | $ | 5,103,574 | $ | 376,715 | 7.4 | % | 7.6 | % | 0.7 | % | 6.9 | % | |||||||||||||||||||||||||||
(1)Constant currency growth rate, which is a non-GAAP measure, is calculated by translating the 2022 results at the 2023 average exchange rates.
(2)Our organic revenue growth rate, which is a non-GAAP measure, represents the year-over-year growth rate of our revenues excluding the impact of business acquisitions, divestitures and foreign currency exchange rate fluctuations. Our organic revenue growth rate includes the impact of acquisitions of customer relationships.
TOTAL REVENUES
For the year ended December 31, 2023, the increase in reported revenue was primarily driven by organic storage rental revenue growth. Foreign currency exchange rate fluctuations decreased our reported revenue growth rate by 0.2% in the year ended December 31, 2023 compared to the prior year period.
STORAGE RENTAL REVENUE AND SERVICE REVENUE
Primary factors influencing the change in reported storage rental revenue and reported service revenue for the year ended December 31, 2023 compared to the year ended December 31, 2022 include the following:
STORAGE RENTAL REVENUE | •organic storage rental revenue growth driven by increased volume in faster growing markets and our Global Data Center Business segment and revenue management; and •a decrease of $2.5 million due to foreign currency exchange rate fluctuations. | ||||
SERVICE REVENUE | •organic service revenue growth driven by increased service activity levels in our Global RIM Business, partially offset by service revenue declines in our ALM business as a result of component price declines, partially offset by increased volume; and •a decrease of $6.1 million due to foreign currency exchange rate fluctuations. | ||||
40 | IRON MOUNTAIN 2023 FORM 10-K | |||||||
OPERATING EXPENSES
COST OF SALES
Cost of sales (excluding depreciation and amortization) consists of the following expenses (in thousands):
| YEAR ENDED DECEMBER 31, | PERCENTAGE CHANGE | % OF CONSOLIDATED REVENUES | PERCENTAGE CHANGE (FAVORABLE)/ UNFAVORABLE | ||||||||||||||||||||||||||||||||||||||||||||
| 2023 | 2022 | DOLLAR CHANGE | ACTUAL | CONSTANT CURRENCY | 2023 | 2022 | |||||||||||||||||||||||||||||||||||||||||
| Labor | $ | 891,351 | $ | 807,220 | $ | 84,131 | 10.4 | % | 10.6 | % | 16.3 | % | 15.8 | % | 0.5 | % | |||||||||||||||||||||||||||||||
| Facilities | 1,028,765 | 884,930 | 143,835 | 16.3 | % | 16.3 | % | 18.8 | % | 17.3 | % | 1.5 | % | ||||||||||||||||||||||||||||||||||
| Transportation | 158,737 | 157,298 | 1,439 | 0.9 | % | 1.5 | % | 2.9 | % | 3.1 | % | (0.2) | % | ||||||||||||||||||||||||||||||||||
| Product Cost of Sales and Other | 278,947 | 339,672 | (60,725) | (17.9) | % | (17.5) | % | 5.1 | % | 6.7 | % | (1.6) | % | ||||||||||||||||||||||||||||||||||
| Total Cost of sales | $ | 2,357,800 | $ | 2,189,120 | $ | 168,680 | 7.7 | % | 7.9 | % | 43.0 | % | 42.9 | % | 0.1 | % | |||||||||||||||||||||||||||||||
Primary factors influencing the change in reported Cost of sales for the year ended December 31, 2023 compared to the year ended December 31, 2022 include the following:
•an increase in labor costs driven by an increase in service activity, primarily within our Global RIM Business;
•an increase in facilities expenses driven by increases in rent expense, reflecting the impact from our sale-leaseback activity during the years ended December 31, 2022 and 2023, as well as increases in utilities costs;
•a decrease in product cost of sales in our ALM business as a result of component price declines, partially offset by increased volume; and
•a decrease of $4.0 million due to foreign currency exchange rate fluctuations.
IRON MOUNTAIN 2023 FORM 10-K | 41 | |||||||
SELLING, GENERAL AND ADMINISTRATIVE EXPENSES
Selling, general and administrative expenses consists of the following expenses (in thousands):
| YEAR ENDED DECEMBER 31, | PERCENTAGE CHANGE | % OF CONSOLIDATED REVENUES | PERCENTAGE CHANGE (FAVORABLE)/ UNFAVORABLE | ||||||||||||||||||||||||||||||||||||||||||||
| DOLLAR CHANGE | |||||||||||||||||||||||||||||||||||||||||||||||
| 2023 | 2022 | ACTUAL | CONSTANT CURRENCY | 2023 | 2022 | ||||||||||||||||||||||||||||||||||||||||||
| General, Administrative and Other | $ | 873,195 | $ | 839,844 | $ | 33,351 | 4.0 | % | 4.2 | % | 15.9 | % | 16.5 | % | (0.6) | % | |||||||||||||||||||||||||||||||
| Sales, Marketing and Account Management | 363,092 | 300,733 | 62,359 | 20.7 | % | 20.6 | % | 6.6 | % | 5.9 | % | 0.7 | % | ||||||||||||||||||||||||||||||||||
| Total Selling, general and administrative expenses | $ | 1,236,287,000 | $ | 1,140,577,000 | $ | 95,710 | 8.4 | % | 8.5 | % | 22.6 | % | 22.4 | % | 0.2 | % | |||||||||||||||||||||||||||||||
Primary factors influencing the change in reported Selling, general and administrative expenses for the year ended December 31, 2023 compared to the year ended December 31, 2022 include the following:
•an increase in general, administrative and other expenses, primarily driven by recent acquisitions;
•an increase in sales, marketing and account management expenses, driven by higher compensation expense, primarily reflecting increased headcount; and
•a decrease of $1.7 million due to foreign currency exchange rate fluctuations.
DEPRECIATION AND AMORTIZATION
Our depreciation and amortization charges result primarily from depreciation related to storage systems, which include racking structures, buildings, building and leasehold improvements and computer systems hardware and software. Amortization relates primarily to customer and supplier relationship intangible assets, Contract Costs and data center lease-based intangible assets. Both depreciation and amortization are impacted by the timing of acquisitions.
Depreciation expense increased $46.9 million, or 9.8%, on a reported dollar basis for the year ended December 31, 2023 compared to the year ended December 31, 2022. See Note 2.i. to Notes to Consolidated Financial Statements included in this Annual Report for additional information regarding the useful lives over which our property, plant and equipment is depreciated.
Amortization expense increased $1.7 million, or 0.7%, on a reported dollar basis for the year ended December 31, 2023 compared to the year ended December 31, 2022.
ACQUISITION AND INTEGRATION COSTS
Acquisition and Integration Costs for the years ended December 31, 2023 and 2022 was approximately $25.9 million and $47.7 million, respectively.
RESTRUCTURING AND OTHER TRANSFORMATION
Restructuring and other transformation costs for the years ended December 31, 2023 and 2022 were approximately $175.2 million and $41.9 million, respectively, and related to operating expenses associated with the implementation of Project Matterhorn.
42 | IRON MOUNTAIN 2023 FORM 10-K | |||||||
GAIN ON DISPOSAL/WRITE-DOWN OF PROPERTY, PLANT AND
EQUIPMENT, NET
EQUIPMENT, NET
| YEAR ENDED DECEMBER 31, | ||||||||||||||
| 2023 | 2022 | |||||||||||||
Gain on disposal/write-down of property, plant and equipment, net | $12.8 million | $93.3 million | ||||||||||||
| The gains primarily consist of: | •Gains associated with sale and sale-leaseback transactions of approximately $19.5 million, of which approximately $18.5 million relates to a sale-leaseback transaction of a facility in Singapore during the first quarter of 2023. These gains are partially offset by losses related to the disposal of assets associated with facility consolidations. | •Gains associated with sale and sale-leaseback transactions of approximately $94.5 million, of which (i) approximately $49.0 million relates to sale and sale-leaseback transactions of 11 facilities and parcels of land in the United States during the second quarter of 2022, (ii) approximately $17.0 million relates to sale-leaseback transactions of two facilities in the United States and one in Canada during the third quarter of 2022 and (iii) approximately $28.5 million relates to sale and sale-leaseback transactions of 12 facilities and one parcel of land in the United States and one facility in the United Kingdom during the fourth quarter of 2022. | ||||||||||||
OTHER EXPENSES, NET
INTEREST EXPENSE, NET
Interest expense, net increased $97.9 million to $585.9 million in the year ended December 31, 2023 from $488.0 million in the year ended December 31, 2022. The increase is primarily due to higher average debt outstanding during the year ended December 31, 2023 compared to the prior year period as well as an increase in our weighted average interest rate. Our weighted average interest rate, inclusive of the fees associated with our outstanding letters of credit, was 5.6% and 5.1% at December 31, 2023 and 2022, respectively. See Note 7 to Notes to Consolidated Financial Statements included in this Annual Report for additional information regarding our indebtedness.
OTHER EXPENSE (INCOME), NET
Other expense (income), net consists of the following (in thousands):
| YEAR ENDED DECEMBER 31, | DOLLAR CHANGE | |||||||||||||||||||
| DESCRIPTION | 2023 | 2022 | ||||||||||||||||||
Foreign currency transaction losses (gains), net(1) | $ | 36,799 | $ | (61,684) | $ | 98,483 | ||||||||||||||
| Debt extinguishment expense | — | 671 | (671) | |||||||||||||||||
Other, net(2) | 71,841 | (8,768) | 80,609 | |||||||||||||||||
Other expense (income), net | $ | 108,640 | $ | (69,781) | $ | 178,421 | ||||||||||||||
(1)We recorded net foreign currency transaction losses of $36.8 million in the year ended December 31, 2023, based on period-end exchange rates. These losses resulted primarily from the impact of changes in the exchange rate of the British pound sterling against the United States dollar compared to December 31, 2022 on our intercompany balances with and between certain of our subsidiaries.
(2)Other, net for the year ended December 31, 2023 consists primarily of a loss of approximately $38.0 million associated with the remeasurement to fair value of our previously held equity interest in the Clutter JV. See the Investments section of Liquidity and Capital Resources for additional information. We also recognized losses on our equity method investments and the change in value of the Deferred Purchase Obligation.
IRON MOUNTAIN 2023 FORM 10-K | 43 | |||||||
PROVISION (BENEFIT) FOR INCOME TAXES
Our effective tax rates for the years ended December 31, 2023 and 2022 were 17.6% and 11.0%, respectively. Our effective tax rate is subject to variability in the future due to, among other items: (i) changes in the mix of income between our QRSs and our TRSs, as well as among the jurisdictions in which we operate, (ii) tax law changes, (iii) volatility in foreign exchange gains and losses, (iv) the timing of the establishment and reversal of tax reserves, (v) our ability to utilize net operating losses that we generate and (vi) the taxability or deductibility of significant transactions.
The primary reconciling items between the federal statutory tax rate of 21.0% and our overall effective tax rate were:
| YEAR ENDED DECEMBER 31, | ||||||||
| 2023 | 2022 | |||||||
The benefits derived from the dividends paid deduction of $39.3 million and the differences in the tax rates to which our foreign earnings are subject of $6.9 million. In addition, there were gains and losses recorded in Other expense (income), net for which there was no tax impact. | The benefits derived from the dividends paid deduction of $82.6 million and the differences in the tax rates to which our foreign earnings are subject of $22.2 million. In addition, there were gains and losses recorded in Other expense (income), net and Gain (loss) on disposal/write-down of property, plant and equipment, net during the period for which there were insignificant tax impacts. | |||||||
As a REIT, we are entitled to a deduction for dividends paid, resulting in a substantial reduction of federal income tax expense. As a REIT, substantially all of our income tax expense will be incurred based on the earnings generated by our foreign subsidiaries and our domestic TRSs.
We are subject to income taxes in the United States and numerous foreign jurisdictions. We are subject to examination by various tax authorities in jurisdictions in which we have business operations or a taxable presence. We regularly assess the likelihood of additional assessments by tax authorities and provide for these matters as appropriate. Although we believe our tax estimates are appropriate, the final determination of tax audits and any related litigation could result in changes in our estimates.
44 | IRON MOUNTAIN 2023 FORM 10-K | |||||||
NET INCOME (LOSS) AND ADJUSTED EBITDA
The following table reflects the effect of the foregoing factors on our net income (loss) and Adjusted EBITDA (in thousands):
| YEAR ENDED DECEMBER 31, | DOLLAR CHANGE | PERCENTAGE CHANGE | |||||||||||||||||||||
| 2023 | 2022 | ||||||||||||||||||||||
| Net Income (Loss) | $ | 187,263 | $ | 562,149 | $ | (374,886) | (66.7) | % | |||||||||||||||
| Net Income (Loss) as a percentage of Revenue | 3.4 | % | 11.0 | % | |||||||||||||||||||
| Adjusted EBITDA | $ | 1,961,677 | $ | 1,827,057 | $ | 134,620 | 7.4 | % | |||||||||||||||
| Adjusted EBITDA Margin | 35.8 | % | 35.8 | % | |||||||||||||||||||
Adjusted EBITDA Margin for the year ended December 31, 2023 was consistent with the prior year, driven by improved service revenue trends, revenue management and ongoing cost containment measures, offset by lower Adjusted EBITDA Margin in our ALM business. | ↑ INCREASED BY $134.6 MILLION OR 7.4% Adjusted EBITDA | ||||
IRON MOUNTAIN 2023 FORM 10-K | 45 | |||||||
SEGMENT ANALYSIS
See the discussion of Business Segments under Item I and Note 11 to Notes to Consolidated Financial Statements, both included in this Annual Report, for a description of our reportable segments.
GLOBAL RIM BUSINESS (IN THOUSANDS)
| YEAR ENDED DECEMBER 31, | PERCENTAGE CHANGE | ||||||||||||||||||||||||||||||||||||||||
| 2023 | 2022 | DOLLAR CHANGE | ACTUAL | CONSTANT CURRENCY | IMPACT OF ACQUISITIONS | ORGANIC GROWTH | |||||||||||||||||||||||||||||||||||
| Storage Rental | $ | 2,834,352 | $ | 2,606,721 | $ | 227,631 | 8.7 | % | 9.0 | % | 0.4 | % | 8.6 | % | |||||||||||||||||||||||||||
| Service | 1,827,424 | 1,688,394 | 139,030 | 8.2 | % | 8.6 | % | (0.5) | % | 9.1 | % | ||||||||||||||||||||||||||||||
| Segment Revenue | $ | 4,661,776 | $ | 4,295,115 | $ | 366,661 | 8.5 | % | 8.8 | % | — | % | 8.8 | % | |||||||||||||||||||||||||||
| Segment Adjusted EBITDA | $ | 2,027,037 | $ | 1,887,589 | $ | 139,448 | |||||||||||||||||||||||||||||||||||
| Segment Adjusted EBITDA Margin | 43.5 | % | 43.9 | % | |||||||||||||||||||||||||||||||||||||
SEGMENT ANALYSIS: GLOBAL RIM BUSINESS (IN MILLIONS)
| Storage Rental Revenue | Service Revenue | Segment Revenue | Segment Adjusted EBITDA | |||||||||||||||||||||||
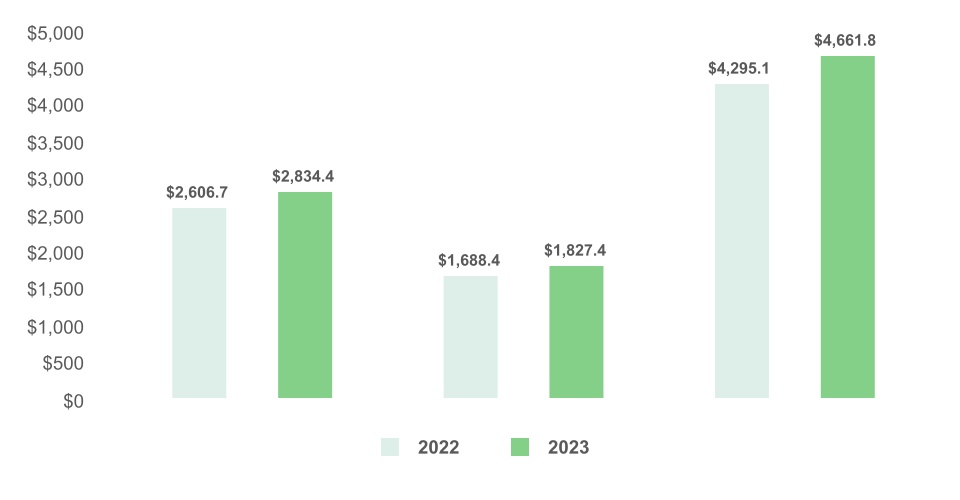
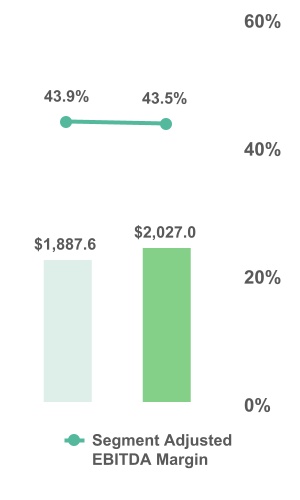
Primary factors influencing the change in revenue and Adjusted EBITDA Margin in our Global RIM Business segment for the year ended December 31, 2023 compared to the year ended December 31, 2022 include the following:
•organic storage rental revenue growth driven by revenue management;
•organic service revenue growth primarily driven by increases in our traditional service activity levels and growth in our Global Digital Solutions business;
•a decrease in revenue of $11.9 million due to foreign currency exchange rate fluctuations; and
•a 40 basis point decrease in Adjusted EBITDA Margin primarily driven by an increase in compensation and other employee-related costs and higher facilities costs, partially offset by revenue management.
46 | IRON MOUNTAIN 2023 FORM 10-K | |||||||
GLOBAL DATA CENTER BUSINESS (IN THOUSANDS)
| YEAR ENDED DECEMBER 31, | PERCENTAGE CHANGE | IMPACT OF ACQUISITIONS | ORGANIC GROWTH | ||||||||||||||||||||||||||||||||||||||
| 2023 | 2022 | DOLLAR CHANGE | ACTUAL | CONSTANT CURRENCY | |||||||||||||||||||||||||||||||||||||
| Storage Rental | $ | 474,066 | $ | 372,208 | $ | 101,858 | 27.4 | % | 26.4 | % | 3.0 | % | 23.4 | % | |||||||||||||||||||||||||||
| Service | 20,960 | 28,917 | (7,957) | (27.5) | % | (28.2) | % | (0.3) | % | (27.9) | % | ||||||||||||||||||||||||||||||
| Segment Revenue | $ | 495,026 | $ | 401,125 | $ | 93,901 | 23.4 | % | 22.4 | % | 2.7 | % | 19.7 | % | |||||||||||||||||||||||||||
| Segment Adjusted EBITDA | $ | 215,945 | $ | 175,622 | $ | 40,323 | |||||||||||||||||||||||||||||||||||
| Segment Adjusted EBITDA Margin | 43.6 | % | 43.8 | % | |||||||||||||||||||||||||||||||||||||
SEGMENT ANALYSIS: GLOBAL DATA CENTER BUSINESS (IN MILLIONS)
| Storage Rental Revenue | Service Revenue | Segment Revenue | Segment Adjusted EBITDA | ||||||||||||||||||||
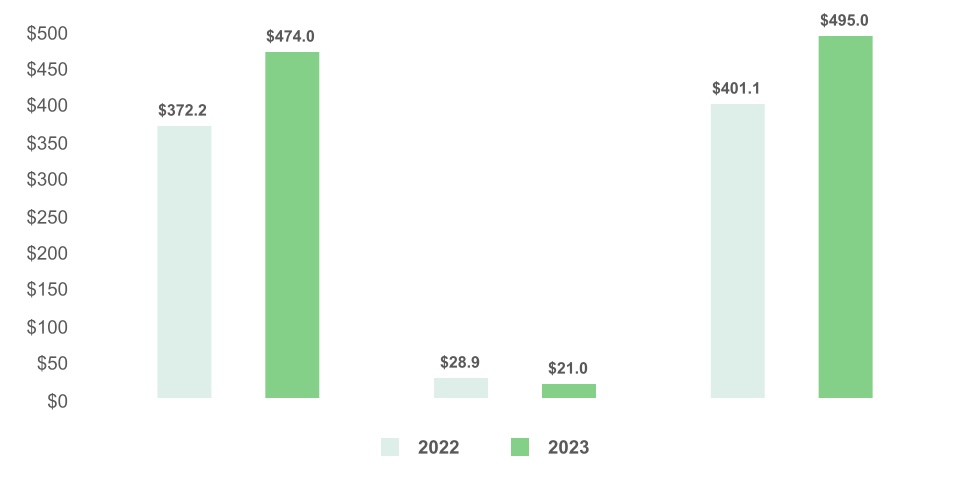
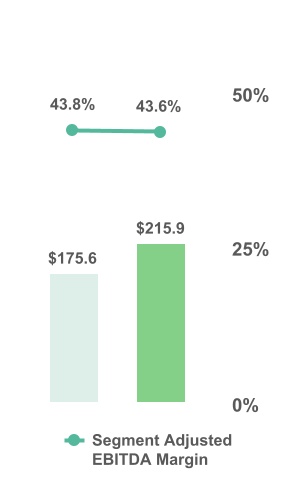
Primary factors influencing the change in revenue and Adjusted EBITDA Margin in our Global Data Center Business segment for the year ended December 31, 2023 compared to the year ended December 31, 2022 include the following:
•organic storage rental revenue growth from leases that commenced during 2023 and in prior periods, improved pricing and higher pass-through power costs, partially offset by churn of 570 basis points;
•an increase in Adjusted EBITDA primarily driven by organic storage rental revenue growth; and
•a 20 basis point decrease in Adjusted EBITDA Margin reflecting higher pass-through power costs, partially offset by ongoing cost management and a decline in lower margin project revenue.
IRON MOUNTAIN 2023 FORM 10-K | 47 | |||||||
CORPORATE AND OTHER (IN THOUSANDS)
| YEAR ENDED DECEMBER 31, | PERCENTAGE CHANGE | IMPACT OF ACQUISITIONS | ORGANIC GROWTH | ||||||||||||||||||||||||||||||||||||||
| 2023 | 2022 | DOLLAR CHANGE | ACTUAL | CONSTANT CURRENCY | |||||||||||||||||||||||||||||||||||||
| Storage Rental | $ | 62,227 | $ | 55,094 | $ | 7,133 | 12.9 | % | 12.7 | % | 4.6 | % | 8.1 | % | |||||||||||||||||||||||||||
| Service | 261,260 | 352,240 | (90,980) | (25.8) | % | (25.8) | % | 5.3 | % | (31.1) | % | ||||||||||||||||||||||||||||||
| Revenue | $ | 323,487 | $ | 407,334 | $ | (83,847) | (20.6) | % | (20.6) | % | 5.2 | % | (25.8) | % | |||||||||||||||||||||||||||
| Adjusted EBITDA | $ | (281,305) | $ | (236,154) | $ | (45,151) | |||||||||||||||||||||||||||||||||||
Primary factors influencing the change in revenue and Adjusted EBITDA in Corporate and Other for the year ended December 31, 2023 compared to the year ended December 31, 2022 include the following:
•a decrease in service revenue in our ALM business as a result of component price declines, which we expect to improve from current levels, partially offset by increased volume; and
•a decrease in Adjusted EBITDA driven by the flow through of service revenue declines in our ALM business.
48 | IRON MOUNTAIN 2023 FORM 10-K | |||||||
LIQUIDITY AND CAPITAL RESOURCES
GENERAL
We expect to meet our short-term and long-term cash flow requirements through cash generated from operations, cash on hand, borrowings under our Credit Agreement (as defined below), as well as other potential financings (such as the issuance of debt). Our cash flow requirements, both in the near and long term, include, but are not limited to, capital expenditures, the repayment of outstanding debt, shareholder dividends, potential business acquisitions and normal business operation needs.
PROJECT MATTERHORN
As disclosed above, in September 2022, we announced Project Matterhorn. We estimate that the implementation of Project Matterhorn will result in costs of approximately $150.0 million per year from 2023 through 2025. During the years ended December 31, 2023 and 2022, we incurred approximately $175.2 million and $41.9 million, respectively, of Restructuring and other transformation costs related to Project Matterhorn, which are comprised of (1) restructuring costs, which include (i) site consolidation and other related exit costs, (ii) employee severance costs and (iii) certain professional fees associated with these activities and (2) other transformation costs, which include professional fees such as project management costs and costs for third party consultants who are assisting in the enablement our growth initiatives.
CASH FLOWS
The following is a summary of our cash balances and cash flows (in thousands) as of and for the years ended December 31,
| 2023 | 2022 | ||||||||||
| Cash Flows from Operating Activities | $ | 1,113,567 | $ | 927,695 | |||||||
| Cash Flows from Investing Activities | (1,444,356) | (1,660,423) | |||||||||
| Cash Flows from Financing Activities | 425,666 | 639,207 | |||||||||
| Cash and Cash Equivalents, End of Year | 222,789 | 141,797 | |||||||||
A. CASH FLOWS FROM OPERATING ACTIVITIES
For the year ended December 31, 2023, net cash flows provided by operating activities increased by $185.9 million compared to the prior year period primarily due to an increase in cash from working capital of $211.9 million, primarily related to the timing of accounts receivable collections, partially offset by a decrease in net income (excluding non-cash charges) of $26.0 million.
B. CASH FLOWS FROM INVESTING ACTIVITIES
Our significant investing activities during the year ended December 31, 2023 included cash paid for capital expenditures of $1,339.2 million. Additional details of our capital spending are included in the "Capital Expenditures" section below.
C. CASH FLOWS FROM FINANCING ACTIVITIES
Our significant financing activities during the year ended December 31, 2023 included:
•Net proceeds of approximately $990.0 million associated with the issuance of the 7% Notes due 2029 (as defined below).
•Net proceeds of approximately $1,181.0 million associated with the borrowing of the Term Loan B due 2031 (as defined below), which were used to repay outstanding borrowings under the Revolving Credit Facility (as defined below).
•Payment of dividends in the amount of $737.7 million on our common stock.
IRON MOUNTAIN 2023 FORM 10-K | 49 | |||||||
CAPITAL EXPENDITURES
We present two categories of capital expenditures: (1) Growth Investment Capital Expenditures and (2) Recurring Capital Expenditures with the following sub-categories: (i) Data Center; (ii) Real Estate; (iii) Innovation and Other (for Growth Investment Capital Expenditures only); and (iv) Non-Real Estate (for Recurring Capital Expenditures only).
GROWTH INVESTMENT CAPITAL EXPENDITURES:
•Data Center: Expenditures primarily related to investments in the construction of data center facilities (including the acquisition of land), as well as investments to drive revenue growth, expand capacity or achieve operational or cost efficiencies.
•Real Estate: Expenditures primarily related to investments in land, buildings, building improvements, leasehold improvements and racking structures to grow our revenues, extend the useful life of an asset or achieve operational or cost efficiencies.
•Innovation and Other: Discretionary capital expenditures for significant new products and services as well as computer hardware and software to support new products and services or to achieve operational or cost efficiencies. Integration costs of acquisitions are also included.
RECURRING CAPITAL EXPENDITURES:
•Data Center: Expenditures related to the replacement of equivalent components and overall maintenance of existing data center assets.
•Real Estate: Expenditures primarily related to the replacement of components of real estate assets such as buildings, building improvements, leasehold improvements and racking structures.
•Non-Real Estate: Expenditures primarily related to the replacement of containers and shred bins, warehouse equipment, fixtures, computer hardware, or third-party or internally-developed software assets that support the maintenance of existing revenues or avoidance of an increase in costs.
The following table presents our capital spend for 2023 and 2022 organized by the type of the spending as described above.
NATURE OF CAPITAL SPEND (IN THOUSANDS) | 2023 | 2022 | |||||||||||||||
| Growth Investment Capital Expenditures: | |||||||||||||||||
| Data Center | $ | 964,198 | $ | 592,875 | |||||||||||||
| Real Estate | 201,036 | 181,285 | |||||||||||||||
| Innovation and Other | 81,135 | 45,371 | |||||||||||||||
| Total Growth Investment Capital Expenditures | 1,246,369 | 819,531 | |||||||||||||||
| Recurring Capital Expenditures: | |||||||||||||||||
| Data Center | 17,198 | 17,008 | |||||||||||||||
| Real Estate | 58,465 | 60,354 | |||||||||||||||
| Non-Real Estate | 64,743 | 65,134 | |||||||||||||||
| Total Recurring Capital Expenditures | 140,406 | 142,496 | |||||||||||||||
| Total Capital Spend (on accrual basis) | 1,386,775 | 962,027 | |||||||||||||||
| Net increase (decrease) in prepaid capital expenditures | 14,174 | (2,270) | |||||||||||||||
| Net (increase) decrease in accrued capital expenditures | (61,726) | (84,379) | |||||||||||||||
| Total Capital Spend (on cash basis) | $ | 1,339,223 | $ | 875,378 | |||||||||||||
Excluding capital expenditures associated with potential future acquisitions, we expect total capital expenditures of approximately $1,500.0 million for the year ending December 31, 2024. Of this, we expect capital expenditures for growth investment of approximately $1,350.0 million, and recurring capital expenditures of approximately $150.0 million.
DIVIDENDS
See Note 9 to Notes to Consolidated Financial Statements included in this Annual Report for information on dividends.
50 | IRON MOUNTAIN 2023 FORM 10-K | |||||||
FINANCIAL INSTRUMENTS AND DEBT
Financial instruments that potentially subject us to credit risk consist principally of cash and cash equivalents (including money market funds and time deposits) and accounts receivable. The only significant concentrations of liquid investments as of December 31, 2023 are related to cash and cash equivalents held in money market funds. See Note 2.g. to Notes to the Consolidated Financial Statements included in this Annual Report for information on our money market funds.
Long-term debt as of December 31, 2023 is as follows (in thousands):
| DECEMBER 31, 2023 | |||||||||||||||||
DEBT (INCLUSIVE OF DISCOUNT) | UNAMORTIZED DEFERRED FINANCING COSTS | CARRYING AMOUNT | |||||||||||||||
| Revolving Credit Facility | $ | — | $ | (4,621) | $ | (4,621) | |||||||||||
| Term Loan A | 228,125 | — | 228,125 | ||||||||||||||
| Term Loan B due 2026 | 659,298 | (2,498) | 656,800 | ||||||||||||||
| Term Loan B due 2031 | 1,191,000 | (13,026) | 1,177,974 | ||||||||||||||
| Virginia 3 Term Loans | 101,218 | (4,641) | 96,577 | ||||||||||||||
| Virginia 4/5 Term Loans | 16,338 | (5,892) | 10,446 | ||||||||||||||
| Australian Dollar Term Loan | 197,743 | (482) | 197,261 | ||||||||||||||
| UK Bilateral Revolving Credit Facility | 178,239 | — | 178,239 | ||||||||||||||
37/8% GBP Senior Notes due 2025 (the "GBP Notes") | 509,254 | (1,763) | 507,491 | ||||||||||||||
47/8% Senior Notes due 2027 (the "47/8% Notes due 2027") | 1,000,000 | (5,332) | 994,668 | ||||||||||||||
51/4% Senior Notes due 2028 (the "51/4% Notes due 2028") | 825,000 | (5,019) | 819,981 | ||||||||||||||
| 5% Senior Notes due 2028 (the "5% Notes due 2028") | 500,000 | (3,316) | 496,684 | ||||||||||||||
| 7% Senior Notes due 2029 (the "7% Notes due 2029") | 1,000,000 | (10,813) | 989,187 | ||||||||||||||
47/8% Senior Notes due 2029 (the "47/8% Notes due 2029") | 1,000,000 | (8,318) | 991,682 | ||||||||||||||
51/4% Senior Notes due 2030 (the "51/4% Notes due 2030") | 1,300,000 | (9,903) | 1,290,097 | ||||||||||||||
41/2% Senior Notes due 2031 (the "41/2% Notes") | 1,100,000 | (8,917) | 1,091,083 | ||||||||||||||
| 5% Senior Notes due 2032 (the "5% Notes due 2032") | 750,000 | (11,206) | 738,794 | ||||||||||||||
55/8% Senior Notes due 2032 (the "55/8% Notes") | 600,000 | (4,985) | 595,015 | ||||||||||||||
| Real Estate Mortgages, Financing Lease Liabilities and Other | 519,907 | (403) | 519,504 | ||||||||||||||
| Accounts Receivable Securitization Program | 358,500 | (317) | 358,183 | ||||||||||||||
| Total Long-term Debt | 12,034,622 | (101,452) | 11,933,170 | ||||||||||||||
| Less Current Portion | (120,670) | — | (120,670) | ||||||||||||||
| Long-term Debt, Net of Current Portion | $ | 11,913,952 | $ | (101,452) | $ | 11,812,500 | |||||||||||
See Note 7 to Notes to Consolidated Financial Statements included in this Annual Report for additional information regarding our long-term debt.
CREDIT AGREEMENT
Our credit agreement (the "Credit Agreement") consists of a revolving credit facility (the "Revolving Credit Facility"), a term loan A facility (the "Term Loan A") and two term loan B facilities (the "Term Loan B due 2026" and the "Term Loan B due 2031").
The Revolving Credit Facility enables IMI and certain of its subsidiaries to borrow an aggregate outstanding amount not to exceed $2,250.0 million in United States dollars and (subject to sublimits) Canadian dollars. Additionally, the Credit Agreement permits us to incur incremental indebtedness thereunder by adding new term loans or revolving loans or by increasing the principal amount of any existing loans thereunder. The Revolving Credit Facility and the Term Loan A are scheduled to mature on March 18, 2027, at which point all obligations become due. On March 18, 2022, we borrowed the full amount of the Term Loan A of $250.0 million. The Term Loan A is to be paid in quarterly installments in an amount equal to $3.1 million per quarter. Iron Mountain Information Management, LLC ("IMIM"), a wholly-owned subsidiary of IMI, is the borrower under the Term Loan B due 2026, which has a principal amount of $700.0 million. The Term Loan B due 2026, which matures on January 2, 2026, was issued at 99.75% of par. Principal payments on the Term Loan B due 2026 are to be paid in quarterly installments of $1.8 million.
In December 2023, we entered into the Term Loan B due 2031 in the principal amount of $1,200.0 million, of which IMIM borrowed the full amount. The Term Loan B due 2031 was issued at 99.25% of par and matures on January 31, 2031. The aggregate net proceeds of approximately $1,181.0 million, after paying commissions to the joint lead arrangers and net of the original issue discount, were used to repay outstanding borrowings under the Revolving Credit Facility. The Term Loan B due 2031 is an incremental term loan under the Credit Agreement. Beginning in the first quarter of 2024, the Term Loan B due 2031 is to be paid in quarterly installments of $3.0 million.
IRON MOUNTAIN 2023 FORM 10-K | 51 | |||||||
IMI and certain subsidiaries of IMI that represent the substantial majority of our operations in the United States, Canada and the United Kingdom guarantee all obligations under the Credit Agreement. The capital stock or other equity interests of our United States subsidiaries representing the substantial majority of our United States operations, and up to 66% of the capital stock or other equity interests of most of our first-tier foreign subsidiaries, are pledged to secure all obligations under the Credit Agreement, together with all intercompany obligations (including promissory notes) of subsidiaries owed to us or to one of our United States subsidiary guarantors. In addition, Iron Mountain Canada Operations ULC has pledged 66% of the capital stock of its subsidiaries, and all intercompany obligations (including promissory notes) owed to or held by it, to secure obligations under the Credit Agreement (collectively, the “Credit Agreement Collateral”).
The interest rate on borrowings under the Revolving Credit Facility varies depending on our choice of interest rate benchmark and currency options, plus an applicable margin, which varies based on our consolidated leverage ratio. The Term Loan A bears interest at the Secured Overnight Financing Rate ("SOFR") plus a credit spread adjustment of 0.1% plus 1.75%. Due to the discontinuance of the London Interbank Offered Rate ("LIBOR") reference rate on June 30, 2023, we transitioned the Term Loan B due 2026 from an interest rate of LIBOR plus 1.75% to a synthetic LIBOR rate plus 1.75%, effective July 1, 2023. The Term Loan B due 2031 bears interest at the SOFR plus 2.25%. Additionally, the Credit Agreement requires the payment of a commitment fee on the unused portion of the Revolving Credit Facility, which fee ranges from 0.2% to 0.3% based on our consolidated leverage ratio.
As of December 31, 2023, we had no outstanding borrowings under the Revolving Credit Facility and $228.1 million, $659.8 million and $1,200.0 million outstanding under the Term Loan A, the Term Loan B due 2026 and the Term Loan B due 2031, respectively. As of December 31, 2023, we had various outstanding letters of credit totaling $4.8 million under the Revolving Credit Facility. The remaining amount available for borrowing under the Revolving Credit Facility as of December 31, 2023, which is based on IMI’s leverage ratio, the last 12 months' earnings before interest, taxes, depreciation and amortization and rent expense ("EBITDAR"), other adjustments as defined in the Credit Agreement and current external debt, was $2,245.2 million (which amount represents the maximum availability as of such date). Available borrowings under the Revolving Credit Facility are subject to compliance with our indenture covenants as discussed below. The interest rates in effect under the Term Loan A, the Term Loan B due 2026 and the Term Loan B due 2031 as of December 31, 2023 were 7.2%, 5.2% and 7.6%, respectively.
VIRGINIA CREDIT AGREEMENTS
VIRGINIA 3 CREDIT AGREEMENT
On August 31, 2023, Iron Mountain Data Centers Virginia 3, LLC, a wholly-owned subsidiary of IMI, entered into a credit agreement (the "Virginia 3 Credit Agreement") in order to partially finance the construction of a data center facility in Virginia. The Virginia 3 Credit Agreement consists of a term loan facility and a letter of credit facility. We have the option to borrow, in the form of term loans, an aggregate outstanding amount not to exceed $275.0 million (the "Virginia 3 Term Loans"). The Virginia 3 Term Loans bear interest at the SOFR plus 2.50%. The Virginia 3 Credit Agreement requires the payment of a commitment fee on any unused commitments at a rate of 0.75%. The Virginia 3 Credit Agreement is secured by the equity interests and assets of Iron Mountain Data Centers Virginia 3, LLC. The Virginia 3 Credit Agreement is scheduled to mature on August 31, 2026, at which point all obligations will become due. We have two one-year options that allow us to extend the maturity date beyond August 31, 2026, subject to the conditions specified in the Virginia 3 Credit Agreement. As of December 31, 2023, we have $101.2 million in outstanding borrowings in Virginia 3 Term Loans with a weighted average interest rate of 6.2%.
VIRGINIA 4/5 CREDIT AGREEMENT
On October 31, 2022, Iron Mountain Data Centers Virginia 4/5 Subsidiary, LLC, a wholly-owned subsidiary of Iron Mountain Data Centers Virginia 4/5 JV, LP, entered into a credit agreement (the "Virginia 4/5 Credit Agreement") in order to finance the construction of two data center facilities in Virginia. The Virginia 4/5 Credit Agreement consists of a term loan facility and a letter of credit facility. We have the option to borrow, in the form of term loans, an aggregate outstanding amount not to exceed approximately $205.0 million (the "Virginia 4/5 Term Loans"). The Virginia 4/5 Term Loans bear interest at SOFR plus a credit spread adjustment of 0.1% plus 1.625%. The Virginia 4/5 Credit Agreement requires the payment of a commitment fee on any unused commitments at a rate of 0.4875%. The Virginia 4/5 Credit Agreement is secured by the equity interests and assets of Iron Mountain Data Centers Virginia 4/5 Subsidiary, LLC. The Virginia 4/5 Credit Agreement is scheduled to mature on October 31, 2025, at which point all obligations will become due. We have two one-year options that allow us to extend the maturity date beyond October 31, 2025, subject to the conditions specified in the Virginia 4/5 Credit Agreement, including the lender's consent. As of December 31, 2023, we have $16.3 million in outstanding borrowings in Virginia 4/5 Term Loans with a weighted average interest rate of 6.1%.
52 | IRON MOUNTAIN 2023 FORM 10-K | |||||||
MAY 2023 OFFERING
On May 15, 2023, Iron Mountain Incorporated completed a private offering of (in thousands):
| SERIES OF NOTES | AGGREGATE PRINCIPAL AMOUNT | MATURITY DATE | INTEREST PAYMENT DUE | PAR CALL DATE(1) | ||||||||||
7% Notes due 2029 | $ | 1,000,000 | February 15, 2029 | February 15 and August 15 | August 15, 2025 | |||||||||
(1)We may redeem the 7% Notes due 2029 at any time, at our option, in whole or in part. Prior to the par call date, we may redeem the 7% Notes due 2029 at the redemption price or make-whole premium specified in the indenture governing the 7% Notes due 2029, together with accrued and unpaid interest to, but excluding, the redemption date. On or after the par call date, we may redeem the 7% Notes due 2029 at a price equal to 100% of the principal amount being redeemed, together with accrued and unpaid interest to, but excluding, the redemption date.
The 7% Notes due 2029 were issued at 100% of par. The total net proceeds of approximately $990.0 million from the issuance of the 7% Notes due 2029, after deducting the initial purchasers' commissions, were used to repay outstanding borrowings under the Revolving Credit Facility.
AUSTRALIAN DOLLAR TERM LOAN
Iron Mountain Australia Group Pty, Ltd., a wholly owned subsidiary of IMI, has an AUD term loan with an original principal balance of 350.0 million Australian dollars ("AUD Term Loan"). All indebtedness associated with the AUD Term Loan was issued at 99% of par. Principal payments on the AUD Term Loan are to be paid in quarterly installments in an aggregate amount of 7.7 million Australian dollars per year. The AUD Term Loan bears interest at BBSY (an Australian benchmark variable interest rate) plus 3.625%. The AUD Term Loan is guaranteed by Iron Mountain Australia Group Pty, Ltd. and certain other Australian subsidiaries (the "Australia Group Guarantors") and by the guarantors of the Credit Agreement. The AUD Term Loan is secured by the capital stock and assets of the Australia Group Guarantors and by the Credit Agreement Collateral. The AUD Term Loan is scheduled to mature on September 30, 2026, at which point all obligations become due.
As of December 31, 2023, we had 292.4 million Australian dollars ($199.2 million based upon the exchange rate between the United States dollar and the Australian dollar as of December 31, 2023) outstanding on the AUD Term Loan. The interest rate in effect under the AUD Term Loan was 8.0% and 6.9% as of December 31, 2023 and 2022, respectively.
UK BILATERAL REVOLVING CREDIT FACILITY
Iron Mountain (UK) PLC ("IM UK") and Iron Mountain (UK) Data Centre Limited, wholly owned subsidiaries of IMI (collectively, the "UK Borrowers"), have a British pounds sterling Revolving Credit Facility (the "UK Bilateral Revolving Credit Facility"). The maximum amount permitted to be borrowed under the UK Bilateral Revolving Credit Facility is 140.0 million British pounds sterling, which was fully drawn as of December 31, 2023. We have the option to request additional commitments of up to 125.0 million British pounds sterling, subject to conditions specified in the UK Bilateral Revolving Credit Facility. IMI and subsidiaries of IMI that represent the substantial majority of our operations in the United States and the United Kingdom guarantee all obligations under the UK Bilateral Revolving Credit Facility. The UK Bilateral Revolving Credit Facility is secured by certain properties in the United Kingdom.
On September 19, 2023, the UK Borrowers amended the UK Bilateral Revolving Credit Facility to extend the maturity date from September 24, 2024 to September 24, 2025. The interest rate in effect under the UK Bilateral Revolving Credit Facility was 7.3% as of December 31, 2023.
ACCOUNTS RECEIVABLE SECURITIZATION PROGRAM
We participate in an accounts receivable securitization program (the "Accounts Receivable Securitization Program") involving several of our wholly-owned subsidiaries and certain financial institutions. Under the Accounts Receivable Securitization Program, certain of our subsidiaries sell substantially all of their United States accounts receivable balances to our wholly-owned special purpose entities, Iron Mountain Receivables QRS, LLC and Iron Mountain Receivables TRS, LLC (the "Accounts Receivable Securitization Special Purpose Subsidiaries"). The Accounts Receivable Securitization Special Purpose Subsidiaries use the accounts receivable balances to collateralize loans obtained from certain financial institutions. The Accounts Receivable Securitization Special Purpose Subsidiaries are consolidated subsidiaries of IMI. IMIM retains the responsibility of servicing the accounts receivable balances pledged as collateral for the Accounts Receivable Securitization Program and IMI provides a performance guaranty. The maximum availability allowed is limited by eligible accounts receivable, as defined under the terms of the Accounts Receivable Securitization Program. The Accounts Receivable Securitization Program is secured by a substantial majority of our net receivables in the United States.
On June 8, 2023, we amended the Accounts Receivable Securitization Program to increase the maximum borrowing capacity from $325.0 million to $360.0 million. As of December 31, 2023, we had $358.5 million outstanding under the Accounts Receivable Securitization Program. The interest rate in effect under the Accounts Receivable Securitization Program was 6.4% as of December 31, 2023. Commitment fees at a rate of 35 basis points are charged on amounts made available but not borrowed under the Accounts Receivable Securitization Program.
IRON MOUNTAIN 2023 FORM 10-K | 53 | |||||||
CASH POOLING
Certain of our subsidiaries participate in cash pooling arrangements (the "Cash Pools") to help manage global liquidity requirements. We utilize the following Cash Pools: (i) two Cash Pools with Bank Mendes Gans, an independently operated wholly owned subsidiary of ING Group, one of which we use to manage global liquidity requirements for our QRSs and the other for our TRSs, (ii) two Cash Pools with JP Morgan Chase Bank, N.A. ("JPM"), one of which we use to manage liquidity requirements for our QRSs in the Asia Pacific region and the other for our TRSs in the Asia Pacific region and (iii) two Cash Pools with JPM, one of which we use to manage liquidity requirements for our QRSs in the Europe, Middle East, and Africa regions and the other for our TRSs in the Europe, Middle East, and Africa regions.
Under each of the Cash Pools, cash deposited by participating subsidiaries with certain financial institutions is pledged as security against the debit balances of other participating subsidiaries with legal rights of offset provided to the financial institutions. Therefore, such amounts are presented in our Consolidated Balance Sheets on a net basis. Each subsidiary receives interest on the cash balances held on deposit or pays interest on its debit balances based on an applicable rate as defined in the Cash Pools.
LETTERS OF CREDIT
As of December 31, 2023, we had outstanding letters of credit totaling $38.8 million, of which $4.8 million reduce our borrowing capacity under the Revolving Credit Facility (as described above). The letters of credit expire at various dates between January 2024 and March 2025.
DEBT COVENANTS
The Credit Agreement, our bond indentures and other agreements governing our indebtedness contain certain restrictive financial and operating covenants, including covenants that restrict our ability to complete acquisitions, pay cash dividends, incur indebtedness, make investments, sell assets and take other specified corporate actions. The covenants do not contain a rating trigger. Therefore, a change in our debt rating would not trigger a default under the Credit Agreement, our bond indentures or other agreements governing our indebtedness. The Credit Agreement requires that we satisfy a net total lease adjusted leverage ratio and a fixed charge coverage ratio on a quarterly basis, and our bond indentures require that, among other things, we satisfy a leverage ratio (not lease adjusted) or a fixed charge coverage ratio (not lease adjusted), as a condition to taking actions such as paying dividends and incurring indebtedness.
The Credit Agreement uses EBITDAR-based calculations and the bond indentures use earnings before interest, taxes, depreciation and amortization ("EBITDA") based calculations as the primary measures of financial performance for purposes of calculating leverage and fixed charge coverage ratios. The EBITDAR- and EBITDA-based leverage calculations include our consolidated subsidiaries, other than those we have designated as "Unrestricted Subsidiaries" as defined in the Credit Agreement and bond indentures. Generally, the Credit Agreement and the bond indentures use a trailing four fiscal quarter basis for purposes of the relevant calculations and require certain adjustments and exclusions for purposes of those calculations, which make the calculation of financial performance for purposes of those calculations under the Credit Agreement and bond indentures not directly comparable to Adjusted EBITDA as presented herein. These adjustments can be significant. For example, the calculation of financial performance under the Credit Agreement and certain of our bond indentures includes (subject to specified exceptions and caps) adjustments for non-cash charges and for expected benefits associated with (i) completed acquisitions, (ii) certain executed lease agreements associated with our data center business that have yet to commence and (iii) restructuring and other strategic initiatives. The calculation of financial performance under our other bond indentures includes, for example, adjustments for non-cash charges and for expected benefits associated with (i) completed acquisitions, and (ii) events that are extraordinary, unusual or non-recurring.
Our leverage and fixed charge coverage ratios under the Credit Agreement as of December 31, 2023 are as follows:
| DECEMBER 31, 2023 | MAXIMUM/MINIMUM ALLOWABLE | |||||||
| Net total lease adjusted leverage ratio | 5.1 | Maximum allowable of 7.0 | ||||||
| Fixed charge coverage ratio | 2.4 | Minimum allowable of 1.5 | ||||||
We are in compliance with our leverage and fixed charge coverage ratios under the Credit Agreement, our bond indentures and other agreements governing our indebtedness as of December 31, 2023. Noncompliance with these leverage and fixed charge coverage ratios would have a material adverse effect on our financial condition and liquidity.
___________________________________________________________________________________________________
Our ability to pay interest on or to refinance our indebtedness depends on our future performance, working capital levels and capital structure, which are subject to general economic, financial, competitive, legislative, regulatory and other factors which may be beyond our control. There can be no assurance that we will generate sufficient cash flow from our operations or that future financings will be available on acceptable terms or in amounts sufficient to enable us to service or refinance our indebtedness or to make necessary capital expenditures.
54 | IRON MOUNTAIN 2023 FORM 10-K | |||||||
DERIVATIVE INSTRUMENTS
INTEREST RATE SWAP AGREEMENTS
We utilize interest rate swap agreements designated as cash flow hedges to limit our exposure to changes in interest rates on a portion of our floating rate indebtedness. Certain of our interest rate swap agreements have notional amounts that will increase with the underlying hedged transaction. Under our interest rate swap agreements, we receive variable rate interest payments associated with the notional amount of each interest rate swap, based upon the one-month SOFR, in exchange for the payment of fixed interest rates as specified in the interest rate swap agreements. Our interest rate swap agreements are marked to market at the end of each reporting period, representing the fair values of the interest rate swap agreements, and any changes in fair value are recognized as a component of Accumulated other comprehensive items, net. Unrealized gains are recognized as assets, while unrealized losses are recognized as liabilities.
In April 2023, in anticipation of the discontinuance of the LIBOR reference rate on June 30, 2023, we terminated interest rate swap agreements with notional amounts totaling $350.0 million that were indexed to the one-month LIBOR benchmark rate. The terminated swap agreements had associated unrealized gains at the termination date of approximately $10.1 million. These gains are included in Accumulated other comprehensive items, net and will be reclassified into earnings as reductions to interest expense from the termination date through March 2024, the original maturity date of these interest rate swap agreements.
As of December 31, 2023 and 2022, we have approximately $520.0 million and $354.8 million, respectively, in notional value outstanding on our interest rate swap agreements, with maturity dates ranging from October 2025 through February 2026.
CROSS-CURRENCY SWAP AGREEMENTS
We utilize cross-currency interest rate swaps to hedge the variability of exchange rate impacts between the United States dollar and the Euro. As of December 31, 2023 and 2022, we have approximately $509.2 million and $469.2 million, respectively, in notional value outstanding on cross-currency interest rate swaps, with maturity dates ranging from August 2024 through February 2026.
We have designated these cross-currency swap agreements as hedges of net investments in certain of our Euro denominated subsidiaries and they require an exchange of the notional amounts at maturity. These cross-currency swap agreements are marked to market at the end of each reporting period, representing the fair values of the cross-currency swap agreements, and any changes in fair value are recognized as a component of Accumulated other comprehensive items, net. Unrealized gains are recognized as assets while unrealized losses are recognized as liabilities. The excluded component of our cross-currency swap agreements is recorded in Accumulated other comprehensive items, net and amortized to interest expense on a straight-line basis.
See Note 6 to Notes to Consolidated Financial Statements included in this Annual Report for additional information on our derivative instruments.
ACQUISITIONS
See Note 3 to Notes to Consolidated Financial Statements included in this Annual Report for information regarding our acquisitions.
WEB WERKS
On July 7, 2023, we made our final contractual investment in the Web Werks JV (as defined below) of approximately 3,750.0 million Indian rupees (or approximately $45.3 million, based upon the exchange rate between the United States dollar and Indian rupee on the closing date of this investment) (the "Web Werks Transaction"). As a result of the Web Werks Transaction, our interest in the Web Werks JV increased to 63.39%, we assumed control of its board of directors and the financial results of the Web Werks JV are now consolidated within our Global Data Center Business segment. We recognized noncontrolling interests of approximately $78.6 million based upon the fair value attributable to these interests at the time of the Web Werks Transaction, of which approximately $18.1 million of the noncontrolling interests were determined to be a current liability and included as a component of Accrued expenses and other current liabilities on our Consolidated Balance Sheet at December 31, 2023.
CLUTTER
On June 29, 2023, in order to further expand our on-demand consumer storage business, we acquired 100% of the outstanding shares of Clutter Intermediate, Inc. and control of all assets of the Clutter JV (collectively, "Clutter") for total consideration of $60.6 million (the “Clutter Acquisition”). The financial results of the Clutter JV are now consolidated within our Global RIM Business segment. In October 2023, we sold 15% of the equity interests in Clutter to certain former stakeholders of the Clutter JV for total consideration of $7.5 million, which represents the fair value attributable to these interests, which is included as a component of Redeemable Noncontrolling Interests on our Consolidated Balance Sheet at December 31, 2023.
IRON MOUNTAIN 2023 FORM 10-K | 55 | |||||||
REGENCY TECHNOLOGIES
On January 3, 2024, in order to expand our ALM business, we acquired RSR Partners, LLC (doing business as Regency Technologies), an IT asset disposition services provider with operations throughout the United States, for an initial purchase price of approximately $200.0 million, with $125.0 million paid at closing, funded by borrowings under the Revolving Credit Facility, and the remaining amount to be paid in 2025 (the "Regency Transaction"). The agreement for the Regency Transaction also includes potential performance-based contingent consideration, which would be payable in 2027, if earned.
INVESTMENTS
See Note 5 to Notes to Consolidated Financial Statements included in this Annual Report for information regarding our joint ventures.
CLUTTER JOINT VENTURE
In February 2022, the joint venture formed by MakeSpace Labs, Inc. and us (the "MakeSpace JV") entered into an agreement with Clutter, Inc. pursuant to which the equityholders of the MakeSpace JV contributed their ownership interests in the MakeSpace JV, and Clutter, Inc.’s shareholders contributed their ownership interests in Clutter, Inc., to create a newly formed venture (the "Clutter JV"). In exchange for our 49.99% interest in the MakeSpace JV, we received an approximate 27% interest in the Clutter JV (the "Clutter Transaction"). As a result of the Clutter Transaction, we recognized a gain related to our contributed interest in the MakeSpace JV of approximately $35.8 million, which was recorded to Other, net, a component of Other expense (income), net, during the year ended December 31, 2022.
On June 29, 2023, we completed the Clutter Acquisition. In connection with the Clutter Acquisition, our previously held approximately 27% interest in the Clutter JV was remeasured to fair value at the closing date of the Clutter Acquisition. As a result, we recognized a loss of approximately $38.0 million to Other, net, a component of Other expense (income), net, during the second quarter of 2023.
WEB WERKS JOINT VENTURE
In April 2021, we closed on an agreement to form a joint venture (the "Web Werks JV") with the shareholders of Web Werks India Private Limited, a colocation data center provider in India. During the years ended December 31, 2022 and 2021, we made two investments totaling approximately 7,500.0 million Indian rupees (or approximately $96.2 million, based upon the exchange rates between the United States dollar and Indian rupee on the closing date of each investment) in exchange for a noncontrolling interest in the form of convertible preference shares in the Web Werks JV. In July 2023, we made our final contractual investment in the Web Werks JV, as described above.
JOINT VENTURE SUMMARY
The following joint venture is accounted for as an equity method investment and is presented as a component of Other within Other assets, net in our Consolidated Balance Sheets. The carrying value and equity interest in our joint venture at December 31, 2023 is as follows (in thousands):
| DECEMBER 31, 2023 | |||||||||||
| CARRYING VALUE | EQUITY INTEREST | ||||||||||
| Joint venture with AGC Equity Partners | $ | 57,874 | 20.00 | % | |||||||
NET OPERATING LOSSES
At December 31, 2023, we have federal net operating loss carryforwards of $109.6 million which can be carried forward indefinitely, of which $88.7 million is expected to be realized to reduce future federal taxable income. We have assets for foreign net operating losses of $133.5 million, with various expiration dates (and in some cases no expiration date), subject to a valuation allowance of approximately 73.8%.
56 | IRON MOUNTAIN 2023 FORM 10-K | |||||||
ITEM 7A. QUANTITATIVE AND QUALITATIVE DISCLOSURES ABOUT MARKET RISK.
CREDIT RISK
Financial instruments that potentially subject us to credit risk consist principally of cash and cash equivalents (including money market funds and time deposits) and accounts receivable. The only significant concentrations of liquid investments as of December 31, 2023 related to cash and cash equivalents held in money market funds. As per our risk management investment policy, we limit exposure to concentration of credit risk by limiting the amount invested in any one mutual fund to a maximum of 1% of the fund's total assets or in any one financial institution to a maximum of $75.0 million. As of December 31, 2023, our cash and cash equivalents balance was $222.8 million.
INTEREST RATE RISK
Given the recurring nature of our revenues and the long-term nature of our asset base, we have the ability and the preference to use long-term, fixed interest rate debt to finance our business at attractive rates, thereby helping to preserve our long-term returns on invested capital. Occasionally, we may use interest rate swaps as a tool to maintain our targeted level of fixed rate debt.
As of December 31, 2023, we had $2,459.6 million of variable rate debt outstanding with a weighted average variable interest rate of approximately 7.8%, and $9,575.0 million of fixed rate debt outstanding. As of December 31, 2023, approximately 79.6% of our total debt outstanding was fixed. If the weighted average variable interest rate on our variable rate debt had increased by 1%, our net income for the year ended December 31, 2023 would have been reduced by approximately $20.7 million.
See Note 6 to Notes to Consolidated Financial Statements included in this Annual Report for a discussion on our interest rate swaps and Note 7 to Notes to Consolidated Financial Statements included in this Annual Report for a discussion of our long-term indebtedness, including the fair values of such indebtedness as of December 31, 2023.
CURRENCY RISK
Our international investments may be subject to risks and uncertainties related to fluctuations in currency valuation. Our reporting currency is the United States dollar. However, our international revenues and expenses are generated in the currencies of the countries in which we operate, primarily the British pound sterling, Euro, Canadian dollar, Brazilian real and the Australian dollar. Declines in the value of the local currencies in which we are paid relative to the United States dollar will cause revenues in United States dollar terms to decrease and dollar-denominated liabilities to increase in local currency. The impact of currency fluctuations on our earnings is mitigated by the fact that most operating and other expenses are also incurred and paid in the local currency. We also have several intercompany obligations with and between certain of our subsidiaries of differing functional currencies, resulting in foreign transaction gains or losses based on period-end exchange rates.
We have adopted and implemented a number of strategies to mitigate the risks associated with fluctuations in foreign currency exchange rates. One strategy is to finance certain of our international subsidiaries with debt that is denominated in local currencies, thereby providing a natural hedge. In determining the amount of any such financing, we take into account local tax considerations, among other factors. Another strategy we utilize is for IMI or IMIM to borrow in foreign currencies to hedge our intercompany financing activities. In addition, on occasion, we enter into currency swaps to temporarily or permanently hedge an overseas investment, such as a major acquisition, to lock in certain transaction economics. IM UK has financed a portion of its capital needs through the issuance of the GBP Notes and through borrowings under the UK Bilateral Revolving Credit Facility, each of which are denominated in British pounds sterling. Our Australian business has financed a portion of its capital needs through direct borrowings in Australian dollars under the AUD Term Loan. This creates a tax efficient natural currency hedge.
We have entered into cross-currency swap agreements to hedge the variability of exchange rate impacts between the United States dollar and the Euro. These cross-currency swap agreements are designated as a hedge of net investment against certain of our Euro denominated subsidiaries and require an exchange of the notional amounts at maturity. These cross-currency swap agreements are marked to market at the end of each reporting period, representing the fair values of the cross-currency swap agreements, and any changes in fair value are recognized as a component of Accumulated other comprehensive items, net. Unrealized gains are recognized as assets, which are recorded as either a component of (i) Prepaid expenses and other or (ii) Other within Other assets, net, while unrecognized losses are recognized as liabilities, which are recorded as either a component of (i) Accrued expenses and other current liabilities or (ii) Other long-term liabilities in our Consolidated Balance Sheets.
See Note 6 to Notes to Consolidated Financial Statements included in this Annual Report for a discussion on our cross-currency swap agreements.
IRON MOUNTAIN 2023 FORM 10-K | 57 | |||||||
The impact of devaluation or depreciating currency on an entity depends on the residual effect on the local economy and the ability of an entity to raise prices and/or reduce expenses. Due to our constantly changing currency exposure and the potential substantial volatility of currency exchange rates, we cannot predict the effect of exchange fluctuations on our business. The effect of a change in foreign currency exchange rates on our net investment in foreign subsidiaries is reflected in the "Accumulated Other Comprehensive Items, net" component of equity. A 10% depreciation in year-end 2023 functional currencies, relative to the United States dollar, would result in a reduction in our equity of approximately $422.0 million.
ITEM 8. FINANCIAL STATEMENTS AND SUPPLEMENTARY DATA.
The information required by this item is included in Item 15(a) of this Annual Report.
ITEM 9. CHANGES IN AND DISAGREEMENTS WITH ACCOUNTANTS ON ACCOUNTING AND FINANCIAL DISCLOSURE.
None.
58 | IRON MOUNTAIN 2023 FORM 10-K | |||||||
ITEM 9A. CONTROLS AND PROCEDURES.
DISCLOSURE CONTROLS AND PROCEDURES
The term "disclosure controls and procedures" is defined in Rules 13a-15(e) and 15d-15(e) of the Exchange Act. These rules refer to the controls and other procedures of a company that are designed to ensure that information is recorded, processed, accumulated, summarized, communicated and reported to management, including its principal executive and principal financial officers, as appropriate to allow timely decisions regarding what is required to be disclosed by a company in the reports that it files under the Exchange Act. As of December 31, 2023 (the "Evaluation Date"), we carried out an evaluation, under the supervision and with the participation of our management, including our chief executive officer and chief financial officer, of the effectiveness of our disclosure controls and procedures. Based upon that evaluation, our chief executive officer and chief financial officer concluded that, as of the Evaluation Date, our disclosure controls and procedures are effective.
MANAGEMENT’S REPORT ON INTERNAL CONTROL OVER FINANCIAL REPORTING
Our management, with the participation of our principal executive officer and principal financial officer, is responsible for establishing and maintaining adequate internal control over financial reporting as defined in Rules 13a-15(f) and 15d-15(f) of the Exchange Act. Our internal control system is designed to provide reasonable assurance to our management and board of directors regarding the preparation and fair presentation of published financial statements. Due to their inherent limitations, internal control over financial reporting may not prevent or detect misstatements. Projections of any evaluation of effectiveness to future periods are subject to the risks that controls may become inadequate because of changes in conditions or that the degree of compliance with policies or procedures may deteriorate. Under the supervision and with the participation of our management, including our chief executive officer and chief financial officer, we conducted an evaluation of the effectiveness of our internal control over financial reporting based on the framework in Internal Control—Integrated Framework (2013) issued by the Committee of Sponsoring Organizations of the Treadway Commission. Based on this evaluation, our management concluded that our internal control over financial reporting was effective as of December 31, 2023.
The effectiveness of our internal control over financial reporting has been audited by Deloitte & Touche LLP, an independent registered public accounting firm, as stated in their report which is included in this Annual Report.
IRON MOUNTAIN 2023 FORM 10-K | 59 | |||||||
REPORT OF INDEPENDENT REGISTERED PUBLIC ACCOUNTING FIRM
To the shareholders and the Board of Directors of Iron Mountain Incorporated
OPINION ON INTERNAL CONTROL OVER FINANCIAL REPORTING
We have audited the internal control over financial reporting of Iron Mountain Incorporated and subsidiaries (the "Company") as of December 31, 2023, based on criteria established in Internal Control — Integrated Framework (2013) issued by the Committee of Sponsoring Organizations of the Treadway Commission (COSO). In our opinion, the Company maintained, in all material respects, effective internal control over financial reporting as of December 31, 2023, based on criteria established in Internal Control — Integrated Framework (2013) issued by COSO.
We have also audited, in accordance with the standards of the Public Company Accounting Oversight Board (United States) (PCAOB), the consolidated financial statements as of and for the year ended December 31, 2023, of the Company and our report dated February 22, 2024, expressed an unqualified opinion on those financial statements.
BASIS FOR OPINION
The Company’s management is responsible for maintaining effective internal control over financial reporting and for its assessment of the effectiveness of internal control over financial reporting, included in the accompanying Management's Report on Internal Control over Financial Reporting. Our responsibility is to express an opinion on the Company’s internal control over financial reporting based on our audit. We are a public accounting firm registered with the PCAOB and are required to be independent with respect to the Company in accordance with the U.S. federal securities laws and the applicable rules and regulations of the Securities and Exchange Commission and the PCAOB.
We conducted our audit in accordance with the standards of the PCAOB. Those standards require that we plan and perform the audit to obtain reasonable assurance about whether effective internal control over financial reporting was maintained in all material respects. Our audit included obtaining an understanding of internal control over financial reporting, assessing the risk that a material weakness exists, testing and evaluating the design and operating effectiveness of internal control based on the assessed risk, and performing such other procedures as we considered necessary in the circumstances. We believe that our audit provides a reasonable basis for our opinion.
DEFINITION AND LIMITATIONS OF INTERNAL CONTROL OVER FINANCIAL REPORTING
A company’s internal control over financial reporting is a process designed to provide reasonable assurance regarding the reliability of financial reporting and the preparation of financial statements for external purposes in accordance with generally accepted accounting principles. A company’s internal control over financial reporting includes those policies and procedures that (1) pertain to the maintenance of records that, in reasonable detail, accurately and fairly reflect the transactions and dispositions of the assets of the company; (2) provide reasonable assurance that transactions are recorded as necessary to permit preparation of financial statements in accordance with generally accepted accounting principles, and that receipts and expenditures of the company are being made only in accordance with authorizations of management and directors of the company; and (3) provide reasonable assurance regarding prevention or timely detection of unauthorized acquisition, use, or disposition of the company’s assets that could have a material effect on the financial statements.
Because of its inherent limitations, internal control over financial reporting may not prevent or detect misstatements. Also, projections of any evaluation of effectiveness to future periods are subject to the risk that controls may become inadequate because of changes in conditions, or that the degree of compliance with the policies or procedures may deteriorate.
/s/ DELOITTE & TOUCHE LLP
Boston, Massachusetts
February 22, 2024
60 | IRON MOUNTAIN 2023 FORM 10-K | |||||||
CHANGES IN INTERNAL CONTROL OVER FINANCIAL REPORTING
Our management, with the participation of our principal executive officer and principal financial officer, is responsible for establishing and maintaining adequate internal control over financial reporting as defined in Rules 13a-15(f) and 15d-15(f) of the Exchange Act. Our internal control system is designed to provide reasonable assurance to our management and board of directors regarding the preparation and fair presentation of published financial statements.
There were no changes in our internal control over financial reporting (as defined in Rule 13a-15(f) of the Exchange Act) during the quarter ended December 31, 2023 that have materially affected, or are reasonably likely to materially affect, our internal control over financial reporting.
ITEM 9B. OTHER INFORMATION.
On November 7, 2023 , Mr. Edward Greene , our Executive Vice President, Chief Human Resources Officers , adopted a 10b5-1 trading plan 16,308 shares of our common stock between February 23, 2024 and March 8, 2024.
This arrangement is intended to satisfy the affirmative defense conditions of Rule 10b5-1(c) under the Securities Exchange Act of 1934.
ITEM 9C. DISCLOSURE REGARDING FOREIGN JURISDICTIONS THAT PREVENT INSPECTIONS.
Not applicable.
IRON MOUNTAIN 2023 FORM 10-K | 61 | |||||||
PART III
ITEM 10. DIRECTORS, EXECUTIVE OFFICERS AND CORPORATE GOVERNANCE.
The information required by Item 10 is incorporated by reference to our Proxy Statement.
ITEM 11. EXECUTIVE COMPENSATION.
The information required by Item 11 is incorporated by reference to our Proxy Statement.
ITEM 12. SECURITY OWNERSHIP OF CERTAIN BENEFICIAL OWNERS AND MANAGEMENT AND RELATED STOCKHOLDER MATTERS.
The information required by Item 12 is incorporated by reference to our Proxy Statement.
ITEM 13. CERTAIN RELATIONSHIPS AND RELATED TRANSACTIONS, AND DIRECTOR INDEPENDENCE.
The information required by Item 13 is incorporated by reference to our Proxy Statement.
ITEM 14. PRINCIPAL ACCOUNTANT FEES AND SERVICES.
The information required by Item 14 is incorporated by reference to our Proxy Statement.
IRON MOUNTAIN 2023 FORM 10-K | 63 | |||||||
PART IV
ITEM 15. EXHIBITS AND FINANCIAL STATEMENT SCHEDULES.
(a)Financial Statements filed as part of this report:
| PAGE | |||||
| IRON MOUNTAIN INCORPORATED | |||||
Report of Independent Registered Public Accounting Firm (PCAOB ID No. | |||||
Consolidated Balance Sheets, December 31, 2023 and 2022 | |||||
Consolidated Statements of Operations, Years Ended December 31, 2023, 2022 and 2021 | |||||
Consolidated Statements of Comprehensive Income (Loss), Years Ended December 31, 2023, 2022 and 2021 | |||||
Consolidated Statements of Equity, Years Ended December 31, 2023, 2022 and 2021 | |||||
Consolidated Statements of Cash Flows, Years Ended December 31, 2023, 2022 and 2021 | |||||
(b)Exhibits filed as part of this report: As listed in the Exhibit Index following the Financial Statement Schedule III-Schedule of Real Estate and Accumulated Depreciation.
IRON MOUNTAIN 2023 FORM 10-K | 65 | |||||||
REPORT OF INDEPENDENT REGISTERED PUBLIC ACCOUNTING FIRM
To the shareholders and the Board of Directors of Iron Mountain Incorporated
OPINION ON THE FINANCIAL STATEMENTS
We have audited the accompanying consolidated balance sheets of Iron Mountain Incorporated and subsidiaries (the "Company") as of December 31, 2023 and 2022, the related consolidated statements of operations, comprehensive income (loss), equity, and cash flows, for each of the three years in the period ended December 31, 2023, and the related notes and the schedule listed in the Index at Item 15 (collectively referred to as the "financial statements"). In our opinion, the financial statements present fairly, in all material respects, the financial position of the Company as of December 31, 2023 and 2022, and the results of its operations and its cash flows for each of the three years in the period ended December 31, 2023, in conformity with accounting principles generally accepted in the United States of America.
We have also audited, in accordance with the standards of the Public Company Accounting Oversight Board (United States) (PCAOB), the Company's internal control over financial reporting as of December 31, 2023, based on criteria established in Internal Control — Integrated Framework (2013) issued by the Committee of Sponsoring Organizations of the Treadway Commission and our report dated February 22, 2024, expressed an unqualified opinion on the Company's internal control over financial reporting.
BASIS FOR OPINION
These financial statements are the responsibility of the Company's management. Our responsibility is to express an opinion on the Company's financial statements based on our audits. We are a public accounting firm registered with the PCAOB and are required to be independent with respect to the Company in accordance with the U.S. federal securities laws and the applicable rules and regulations of the Securities and Exchange Commission and the PCAOB.
We conducted our audits in accordance with the standards of the PCAOB. Those standards require that we plan and perform the audit to obtain reasonable assurance about whether the financial statements are free of material misstatement, whether due to error or fraud. Our audits included performing procedures to assess the risks of material misstatement of the financial statements, whether due to error or fraud, and performing procedures that respond to those risks. Such procedures included examining, on a test basis, evidence regarding the amounts and disclosures in the financial statements. Our audits also included evaluating the accounting principles used and significant estimates made by management, as well as evaluating the overall presentation of the financial statements. We believe that our audits provide a reasonable basis for our opinion.
CRITICAL AUDIT MATTERS
The critical audit matter communicated below is a matter arising from the current-period audit of the financial statements that was communicated or required to be communicated to the audit committee and that (1) relates to accounts or disclosures that are material to the financial statements and (2) involved our especially challenging, subjective, or complex judgments. The communication of critical audit matters does not alter in any way our opinion on the financial statements, taken as a whole, and we are not, by communicating the critical audit matter below, providing a separate opinion on the critical audit matter or on the accounts or disclosures to which it relates.
66 | IRON MOUNTAIN 2023 FORM 10-K | |||||||
GOODWILL - ASSET LIFECYCLE MANAGEMENT REPORTING UNIT - REFER TO NOTE 2.L. TO THE FINANCIAL STATEMENTS
CRITICAL AUDIT MATTER DESCRIPTION
The Company’s evaluation of goodwill for impairment involves the comparison of the fair value of the reporting unit to its carrying value. The Company determined the fair value of the Asset Lifecycle Management reporting unit based on the present value of future cash flows (the "Discounted Cash Flow Model"). The determination of the fair value using the Discounted Cash Flow Model requires management to make significant assumptions related to future revenue growth rates, operating margins, and discount rates. Changes in economic and operating conditions impacting these assumptions could result in goodwill impairment in future periods. The goodwill balance allocated to the Asset Lifecycle Management reporting unit was $579 million as of October 1, 2023 (goodwill impairment testing date). The fair value of the Asset Lifecycle Management reporting unit exceeded its carrying value as of the measurement date and, therefore, no impairment was recognized.
We identified the evaluation of goodwill for the Asset Lifecycle Management reporting unit for impairment as a critical audit matter because of the significant judgments made by management to estimate the fair value of the Asset Lifecycle Management reporting unit. Performing audit procedures to evaluate the reasonableness of management’s estimates and assumptions related to selection of the discount rate and forecasts of future revenue and operating margin of the Asset Lifecycle Management reporting unit required a high degree of auditor judgment and an increased extent of effort, including the need to involve our fair value specialists.
HOW THE CRITICAL AUDIT MATTER WAS ADDRESSED IN THE AUDIT
Our audit procedures related to testing the reasonableness of key assumptions within the Discounted Cash Flow Model of the Asset Lifecycle Management reporting unit. The key assumptions include future revenue growth rates, operating margins, and the selection of the discount rate. We performed the following procedures as part of the audit:
•We evaluated management’s ability to accurately forecast by comparing actual results to management’s historical forecasts.
•We evaluated the reasonableness of the revenue growth rates and operating margins presented within management’s Discounted Cash Flow Model by comparing it to (1) historical results, (2) internal communications to management and the Board of Directors, and (3) forecasted information included in Company press releases and industry reports in which Asset Lifecycle Management operates.
•With the assistance of our fair value specialists, we evaluated the discount rate, including testing the underlying source information and the mathematical accuracy of the calculation, and developing a range of independent estimates and comparing that to the discount rate selected by management.
•We tested the effectiveness of controls over the evaluation of goodwill for impairment, including those over the Discounted Cash Flow Model and discount rate.
/s/ DELOITTE & TOUCHE LLP
February 22, 2024
We have served as the Company’s auditor since 2002.
IRON MOUNTAIN 2023 FORM 10-K | 67 | |||||||
CONSOLIDATED BALANCE SHEETS
(IN THOUSANDS, EXCEPT SHARE AND PER SHARE DATA)
| DECEMBER 31, | |||||||||||
| 2023 | 2022 | ||||||||||
| ASSETS | |||||||||||
| Current Assets: | |||||||||||
| Cash and cash equivalents | $ | $ | |||||||||
Accounts receivable (less allowances of $ | |||||||||||
| Prepaid expenses and other | |||||||||||
| Total Current Assets | |||||||||||
| Property, plant and equipment | |||||||||||
| Less—Accumulated depreciation | ( | ( | |||||||||
| Property, Plant and Equipment, net | |||||||||||
| Other Assets, Net: | |||||||||||
| Goodwill | |||||||||||
| Customer and supplier relationships and other intangible assets | |||||||||||
| Operating lease right-of-use assets | |||||||||||
| Other | |||||||||||
| Total Other Assets, Net | |||||||||||
| Total Assets | $ | $ | |||||||||
| LIABILITIES AND EQUITY | |||||||||||
| Current Liabilities: | |||||||||||
| Current portion of long-term debt | $ | $ | |||||||||
| Accounts payable | |||||||||||
| Accrued expenses and other current liabilities (includes current portion of operating lease liabilities) | |||||||||||
| Deferred revenue | |||||||||||
| Total Current Liabilities | |||||||||||
| Long-term Debt, net of current portion | |||||||||||
| Long-term Operating Lease Liabilities, net of current portion | |||||||||||
| Other Long-term Liabilities | |||||||||||
| Deferred Income Taxes | |||||||||||
| Commitments and Contingencies | |||||||||||
| Redeemable Noncontrolling Interests | |||||||||||
| Equity: | |||||||||||
| Iron Mountain Incorporated Stockholders’ Equity: | |||||||||||
Preferred stock (par value $ | |||||||||||
Common stock (par value $ | |||||||||||
| Additional paid-in capital | |||||||||||
| (Distributions in excess of earnings) earnings in excess of distributions | ( | ( | |||||||||
| Accumulated other comprehensive items, net | ( | ( | |||||||||
| Total Iron Mountain Incorporated Stockholders’ Equity | |||||||||||
| Noncontrolling Interests | |||||||||||
| Total Equity | |||||||||||
| Total Liabilities and Equity | $ | $ | |||||||||
The accompanying notes are an integral part of these consolidated financial statements.
68 | IRON MOUNTAIN 2023 FORM 10-K | |||||||
CONSOLIDATED STATEMENTS OF OPERATIONS
(IN THOUSANDS, EXCEPT PER SHARE DATA)
| YEAR ENDED DECEMBER 31, | |||||||||||||||||
| 2023 | 2022 | 2021 | |||||||||||||||
| Revenues: | |||||||||||||||||
| Storage rental | $ | $ | $ | ||||||||||||||
| Service | |||||||||||||||||
| Total Revenues | |||||||||||||||||
| Operating Expenses: | |||||||||||||||||
| Cost of sales (excluding depreciation and amortization) | |||||||||||||||||
| Selling, general and administrative | |||||||||||||||||
| Depreciation and amortization | |||||||||||||||||
| Acquisition and Integration Costs | |||||||||||||||||
Restructuring and other transformation | |||||||||||||||||
| (Gain) loss on disposal/write-down of property, plant and equipment, net | ( | ( | ( | ||||||||||||||
| Total Operating Expenses | |||||||||||||||||
| Operating Income (Loss) | |||||||||||||||||
Interest Expense, Net (includes Interest Income of $ | |||||||||||||||||
Other Expense (Income), Net | ( | ( | |||||||||||||||
| Net Income (Loss) Before Provision (Benefit) for Income Taxes | |||||||||||||||||
| Provision (Benefit) for Income Taxes | |||||||||||||||||
| Net Income (Loss) | |||||||||||||||||
| Less: Net income (loss) attributable to noncontrolling interests | |||||||||||||||||
| Net Income (Loss) Attributable to Iron Mountain Incorporated | $ | $ | $ | ||||||||||||||
| Earnings (Losses) Per Share Attributable to Iron Mountain Incorporated: | |||||||||||||||||
| Basic | $ | $ | $ | ||||||||||||||
| Diluted | $ | $ | $ | ||||||||||||||
| Weighted Average Common Shares Outstanding: | |||||||||||||||||
| Basic | |||||||||||||||||
| Diluted | |||||||||||||||||
The accompanying notes are an integral part of these consolidated financial statements.
IRON MOUNTAIN 2023 FORM 10-K | 69 | |||||||
CONSOLIDATED STATEMENTS OF COMPREHENSIVE INCOME (LOSS)
(IN THOUSANDS)
YEAR ENDED DECEMBER 31, | |||||||||||||||||
| 2023 | 2022 | 2021 | |||||||||||||||
| Net Income (Loss) | $ | $ | $ | ||||||||||||||
| Other Comprehensive Income (Loss): | |||||||||||||||||
| Foreign Currency Translation Adjustment | ( | ( | |||||||||||||||
| Change in Fair Value of Derivative Instruments | ( | ||||||||||||||||
| Reclassifications from Accumulated Other Comprehensive Items, net | ( | ||||||||||||||||
| Total Other Comprehensive Income (Loss) | ( | ( | |||||||||||||||
| Comprehensive Income (Loss) | |||||||||||||||||
| Comprehensive Income (Loss) Attributable to Noncontrolling Interests | |||||||||||||||||
| Comprehensive Income (Loss) Attributable to Iron Mountain Incorporated | $ | $ | $ | ||||||||||||||
The accompanying notes are an integral part of these consolidated financial statements.
70 | IRON MOUNTAIN 2023 FORM 10-K | |||||||
CONSOLIDATED STATEMENTS OF EQUITY
(IN THOUSANDS, EXCEPT SHARE DATA)
IRON MOUNTAIN INCORPORATED STOCKHOLDERS’ EQUITY | ||||||||||||||||||||||||||||||||||||||||||||||||||
COMMON STOCK | ADDITIONAL PAID-IN CAPITAL | (DISTRIBUTIONS IN EXCESS OF EARNINGS) EARNINGS IN EXCESS OF DISTRIBUTIONS | ACCUMULATED OTHER COMPREHENSIVE ITEMS, NET | NONCONTROLLING INTERESTS | REDEEMABLE NONCONTROLLING INTERESTS | |||||||||||||||||||||||||||||||||||||||||||||
| TOTAL | SHARES | AMOUNTS | ||||||||||||||||||||||||||||||||||||||||||||||||
| Balance, December 31, 2020 | $ | $ | $ | $ | ( | $ | ( | $ | $ | |||||||||||||||||||||||||||||||||||||||||
| Issuance of shares under employee stock purchase plan and option plans and stock-based compensation | — | — | — | — | ||||||||||||||||||||||||||||||||||||||||||||||
| Changes in equity related to redeemable noncontrolling interests | ( | — | — | ( | — | — | — | |||||||||||||||||||||||||||||||||||||||||||
| Parent cash dividends declared | ( | — | — | — | ( | — | — | — | ||||||||||||||||||||||||||||||||||||||||||
| Other comprehensive (loss) income | ( | — | — | — | — | ( | ( | ( | ||||||||||||||||||||||||||||||||||||||||||
| Net income (loss) | — | — | — | — | ||||||||||||||||||||||||||||||||||||||||||||||
| Noncontrolling interests equity contributions | — | — | — | — | — | — | — | |||||||||||||||||||||||||||||||||||||||||||
| Noncontrolling interests dividends | — | — | — | — | — | — | — | ( | ||||||||||||||||||||||||||||||||||||||||||
| Purchase of noncontrolling interests | — | — | — | — | — | |||||||||||||||||||||||||||||||||||||||||||||
| Redemption of noncontrolling Interests | — | — | — | — | — | — | — | ( | ||||||||||||||||||||||||||||||||||||||||||
| Balance, December 31, 2021 | ( | ( | ||||||||||||||||||||||||||||||||||||||||||||||||
| Issuance and net settlement of shares under employee stock purchase plan and option plans and stock-based compensation | — | — | — | — | ||||||||||||||||||||||||||||||||||||||||||||||
| Changes in equity related to noncontrolling interests | — | — | — | — | ( | |||||||||||||||||||||||||||||||||||||||||||||
| Parent cash dividends declared | ( | — | — | — | ( | — | — | — | ||||||||||||||||||||||||||||||||||||||||||
| Other comprehensive (loss) income | ( | — | — | — | — | ( | ( | |||||||||||||||||||||||||||||||||||||||||||
| Net income (loss) | — | — | — | — | ||||||||||||||||||||||||||||||||||||||||||||||
| Noncontrolling interests equity contributions and related costs | ( | — | — | ( | — | — | ||||||||||||||||||||||||||||||||||||||||||||
| Noncontrolling interests dividends | — | — | — | — | — | — | — | ( | ||||||||||||||||||||||||||||||||||||||||||
| Redemption of noncontrolling Interests | ( | — | — | — | — | — | ( | — | ||||||||||||||||||||||||||||||||||||||||||
| Balance, December 31, 2022 | ( | ( | ||||||||||||||||||||||||||||||||||||||||||||||||
| Issuance and net settlement of shares under employee stock purchase plan and option plans and stock-based compensation | — | — | — | — | ||||||||||||||||||||||||||||||||||||||||||||||
| Changes in equity related to redeemable noncontrolling interests | — | — | — | — | — | ( | ||||||||||||||||||||||||||||||||||||||||||||
| Parent cash dividends declared | ( | — | — | — | ( | — | — | — | ||||||||||||||||||||||||||||||||||||||||||
| Other comprehensive income (loss) | — | — | — | — | — | ( | ||||||||||||||||||||||||||||||||||||||||||||
| Net income (loss) | — | — | — | — | — | |||||||||||||||||||||||||||||||||||||||||||||
| Noncontrolling interests equity contributions and related costs | ( | — | — | ( | — | — | — | |||||||||||||||||||||||||||||||||||||||||||
| Noncontrolling interests dividends | — | — | — | — | — | — | — | ( | ||||||||||||||||||||||||||||||||||||||||||
| Redemption and purchase of noncontrolling interests | — | — | — | — | — | — | — | |||||||||||||||||||||||||||||||||||||||||||
| Balance, December 31, 2023 | $ | $ | $ | $ | ( | $ | ( | $ | $ | |||||||||||||||||||||||||||||||||||||||||
The accompanying notes are an integral part of these consolidated financial statements.
IRON MOUNTAIN 2023 FORM 10-K | 71 | |||||||
CONSOLIDATED STATEMENTS OF CASH FLOWS
(IN THOUSANDS)
YEAR ENDED DECEMBER 31, | |||||||||||||||||
| 2023 | 2022 | 2021 | |||||||||||||||
| Cash Flows from Operating Activities: | |||||||||||||||||
| Net income (loss) | $ | $ | $ | ||||||||||||||
| Adjustments to reconcile net income (loss) to cash flows from operating activities: | |||||||||||||||||
| Depreciation | |||||||||||||||||
Amortization (includes amortization of deferred financing costs and discounts of $ | |||||||||||||||||
| Revenue reduction associated with amortization of customer inducements and data center above- and below-market leases | |||||||||||||||||
| Stock-based compensation expense | |||||||||||||||||
| (Benefit) provision for deferred income taxes | ( | ( | |||||||||||||||
| (Gain) loss on disposal/write-down of property, plant and equipment, net | ( | ( | ( | ||||||||||||||
| Loss (gain) on divestments and deconsolidations | ( | ||||||||||||||||
| Gain associated with the remeasurement of the Deferred Purchase Obligation | ( | ||||||||||||||||
| Loss (gain) associated with the Clutter transactions | ( | ||||||||||||||||
| Foreign currency transactions and other, net | ( | ( | |||||||||||||||
| (Increase) decrease in assets | ( | ( | ( | ||||||||||||||
| Increase (decrease) in liabilities | ( | ||||||||||||||||
| Cash Flows from Operating Activities | |||||||||||||||||
| Cash Flows from Investing Activities: | |||||||||||||||||
| Capital expenditures | ( | ( | ( | ||||||||||||||
| Cash paid for acquisitions, net of cash acquired | ( | ( | ( | ||||||||||||||
| Acquisition of customer relationships | ( | ( | |||||||||||||||
| Customer inducements | ( | ( | ( | ||||||||||||||
| Contract costs | ( | ( | ( | ||||||||||||||
| Net proceeds from IPM Divestment | |||||||||||||||||
| Investments in joint ventures and other investments | ( | ( | ( | ||||||||||||||
| Proceeds from sales of property and equipment and other, net | |||||||||||||||||
| Cash Flows from Investing Activities | ( | ( | ( | ||||||||||||||
| Cash Flows from Financing Activities: | |||||||||||||||||
| Repayment of revolving credit facility, term loan facilities and other debt | ( | ( | ( | ||||||||||||||
| Proceeds from revolving credit facility, term loan facilities and other debt | |||||||||||||||||
| Net proceeds from sales of senior notes | |||||||||||||||||
| Debt financing and equity contribution from noncontrolling interests | |||||||||||||||||
| Debt repayment and equity distribution to noncontrolling interests | ( | ( | ( | ||||||||||||||
| Repurchase of noncontrolling interest | ( | ( | ( | ||||||||||||||
| Parent cash dividends | ( | ( | ( | ||||||||||||||
| Net (payments) proceeds associated with employee stock-based awards | ( | ( | |||||||||||||||
| Other, net | ( | ( | |||||||||||||||
| Cash Flows from Financing Activities | ( | ||||||||||||||||
| Effect of Exchange Rates on Cash and Cash Equivalents | ( | ( | ( | ||||||||||||||
| Increase (decrease) in Cash and Cash Equivalents | ( | ||||||||||||||||
| Cash and Cash Equivalents, Beginning of Year | |||||||||||||||||
| Cash and Cash Equivalents, End of Year | $ | $ | $ | ||||||||||||||
| Supplemental Information: | |||||||||||||||||
| Cash Paid for Interest | $ | $ | $ | ||||||||||||||
| Cash Paid for Income Taxes, Net | $ | $ | $ | ||||||||||||||
| Non-Cash Investing and Financing Activities: | |||||||||||||||||
| Financing Leases and Other | $ | $ | $ | ||||||||||||||
| Accrued Capital Expenditures | $ | $ | $ | ||||||||||||||
| Deferred Purchase Obligations and Other Deferred Payments | $ | $ | $ | ||||||||||||||
| Dividends Payable | $ | $ | $ | ||||||||||||||
The accompanying notes are an integral part of these consolidated financial statements.
72 | IRON MOUNTAIN 2023 FORM 10-K | |||||||
NOTES TO CONSOLIDATED FINANCIAL STATEMENTS
DECEMBER 31, 2023
(In thousands, except share and per share data)
1. NATURE OF BUSINESS
The accompanying financial statements represent the consolidated accounts of Iron Mountain Incorporated, a Delaware corporation ("IMI"), and its subsidiaries ("we" or "us").
We help organizations around the world protect their information, reduce storage costs, comply with regulations, facilitate corporate disaster recovery and better use their information and information technology ("IT") infrastructure for business advantages, regardless of its format, location or life cycle stage. We do this by storing physical records and data backup media, offering information management solutions and providing data center space for enterprise-class colocation and hyperscale deployments. We offer comprehensive records and information management services and data management services, along with the expertise and experience to address complex storage and information management challenges such as rising storage rental costs, legal and regulatory compliance and disaster recovery requirements. We provide secure and reliable data center facilities to protect digital information and ensure the continued operation of our customers’ IT infrastructure, with reliable and flexible deployment options. Our asset lifecycle management ("ALM") business allows us to provide end-to-end asset lifecycle services for hyperscale, corporate data center and corporate end-user device assets.
In September 2022, we announced a global program designed to accelerate the growth of our business ("Project Matterhorn"). See Note 13.
We have been organized and have operated as a real estate investment trust for United States federal income tax purposes ("REIT") beginning with our taxable year ended December 31, 2014.
2. SUMMARY OF SIGNIFICANT ACCOUNTING POLICIES
A. PRINCIPLES OF CONSOLIDATION
The accompanying financial statements reflect our financial position, results of operations, comprehensive income (loss), equity and cash flows on a consolidated basis. The accompanying financial statements include the results of those entities over which we have a controlling financial interest and we are deemed to be the primary beneficiary. All intercompany transactions and account balances have been eliminated.
B. USE OF ESTIMATES
The preparation of financial statements in conformity with accounting principles generally accepted in the United States of America ("GAAP") requires us to make estimates, judgments and assumptions that affect the reported amounts of assets, liabilities, revenues and expenses, and the related disclosure of contingent assets and liabilities at the date of the financial statements and for the period then ended. On an ongoing basis, we evaluate the estimates used. We base our estimates on historical experience, actuarial estimates, current conditions and various other assumptions that we believe to be reasonable under the circumstances. These estimates form the basis for making judgments about the carrying values of assets and liabilities and are not readily apparent from other sources. Actual results may differ from these estimates.
C. CHANGES IN PRESENTATION
Certain items previously reported under specific financial statement captions have been reclassified to conform to the current year presentation.
D. FOREIGN CURRENCY
IRON MOUNTAIN 2023 FORM 10-K | 73 | |||||||
Part IV
IRON MOUNTAIN INCORPORATED
NOTES TO CONSOLIDATED FINANCIAL STATEMENTS (CONTINUED)
DECEMBER 31, 2023
(In thousands, except share and per share data)
2. SUMMARY OF SIGNIFICANT ACCOUNTING POLICIES (CONTINUED)
E. CASH AND CASH EQUIVALENTS
F. ALLOWANCE FOR DOUBTFUL ACCOUNTS AND CREDIT MEMO RESERVES
We maintain an allowance for doubtful accounts and a credit memo reserve for estimated losses resulting from the potential inability of our customers to make required payments and potential disputes regarding billing and service issues. We evaluate and monitor the collectability of accounts receivable based on a combination of factors, including historical loss experience, assessments of trends in our aged receivables and credit memo activity, the location of our businesses, the composition of our customer base, our product and service lines, potential future macroeconomic factors, including natural disasters, and reasonable and supportable forecasts for expected future collectability of our outstanding receivables. Continued adjustments will be made, as it becomes evident, should there be any material change to reasonable and supportable forecasts that may impact our likelihood of collection. Our highly diverse global customer base, with no single customer accounting for more than approximately 1% of revenue during the years ended December 31, 2023, 2022 and 2021, limits our exposure to concentration of credit risk. Additionally, we write off uncollectible balances as circumstances warrant, generally no later than one year past due.
The rollforward of the allowance for doubtful accounts and credit memo reserves is as follows:
YEAR ENDED DECEMBER 31, | BALANCE AT BEGINNING OF THE YEAR | CREDIT MEMOS CHARGED TO REVENUE | ALLOWANCE FOR BAD DEBTS CHARGED TO EXPENSE | DEDUCTIONS AND OTHER(1) | BALANCE AT END OF THE YEAR | |||||||||||||||||||||||||||
| 2023 | $ | $ | $ | $ | ( | $ | ||||||||||||||||||||||||||
| 2022 | ( | |||||||||||||||||||||||||||||||
| 2021 | ( | |||||||||||||||||||||||||||||||
(1)Primarily consists of the issuance of credit memos, the write-off of accounts receivable and the impact associated with currency translation adjustments.
G. CONCENTRATIONS OF CREDIT RISK
74 | IRON MOUNTAIN 2023 FORM 10-K | |||||||
Part IV
IRON MOUNTAIN INCORPORATED
NOTES TO CONSOLIDATED FINANCIAL STATEMENTS (CONTINUED)
DECEMBER 31, 2023
(In thousands, except share and per share data)
2. SUMMARY OF SIGNIFICANT ACCOUNTING POLICIES (CONTINUED)
H. PREPAID EXPENSES AND ACCRUED EXPENSES
Prepaid expenses totaled $126,904 and $114,130 as of December 31, 2023 and 2022, respectively. There were no other items greater than 5% of total current assets included within Prepaid expenses and other as of December 31, 2023 and 2022.
Accrued expenses and other current liabilities with items greater than 5% of total current liabilities are shown separately and consist of the following:
| DECEMBER 31, | ||||||||||||||
| DESCRIPTION | 2023 | 2022 | ||||||||||||
| Interest | $ | $ | ||||||||||||
| Deferred purchase obligations, purchase price holdbacks and other | ||||||||||||||
| Dividends | ||||||||||||||
| Operating lease liabilities | ||||||||||||||
| Other | ||||||||||||||
| Accrued expenses and other current liabilities | $ | $ | ||||||||||||
I. PROPERTY, PLANT AND EQUIPMENT
Property, plant and equipment are stated at cost and depreciated using the straight-line method with the following useful lives (in years):
| DESCRIPTION | RANGE | ||||
| Buildings and building improvements | |||||
| Leasehold improvements | |||||
| Racking | |||||
| Warehouse equipment/vehicles | |||||
| Furniture and fixtures | |||||
| Computer hardware and software | |||||
Property, plant and equipment (including financing leases in the respective categories), at cost, consist of the following:
| DECEMBER 31, | ||||||||||||||
| DESCRIPTION | 2023 | 2022 | ||||||||||||
| Land | $ | $ | ||||||||||||
| Buildings and building improvements | ||||||||||||||
| Leasehold improvements | ||||||||||||||
| Racking | ||||||||||||||
| Warehouse equipment/vehicles | ||||||||||||||
| Furniture and fixtures | ||||||||||||||
| Computer hardware and software | ||||||||||||||
| Construction in progress | ||||||||||||||
| Property, plant and equipment | $ | $ | ||||||||||||
Minor maintenance costs are expensed as incurred. Major improvements which extend the life, increase the capacity or improve the safety or the efficiency of property owned are capitalized and depreciated. Major improvements to leased buildings are capitalized as leasehold improvements and depreciated.
IRON MOUNTAIN 2023 FORM 10-K | 75 | |||||||
Part IV
IRON MOUNTAIN INCORPORATED
NOTES TO CONSOLIDATED FINANCIAL STATEMENTS (CONTINUED)
DECEMBER 31, 2023
(In thousands, except share and per share data)
2. SUMMARY OF SIGNIFICANT ACCOUNTING POLICIES (CONTINUED)
CAPITALIZED INTEREST
| YEAR ENDED DECEMBER 31, | ||||||||||||||||||||
| 2023 | 2022 | 2021 | ||||||||||||||||||
| Capitalized interest | $ | $ | $ | |||||||||||||||||
INTERNAL USE SOFTWARE
We develop various software applications for internal use. Computer software costs associated with internal use software are expensed as incurred until certain capitalization criteria are met. Third party consulting costs, as well as payroll and related costs for employees directly associated with, and devoting time to, the development of internal use computer software projects (to the extent time is spent directly on the project) are capitalized. Capitalization of costs, including costs incurred for upgrades and enhancements that provide additional functionality to our existing software, generally begins during the application development stage of the project, which occurs after it is probable that the project will be completed and used to perform the function intended. Capitalization ends when the asset is ready for its intended use. Capitalized internal use software costs are depreciated on a straight-line basis over the expected useful life of the software, commencing when the software is ready for its intended use. Computer software costs that are capitalized are periodically evaluated for impairment.
During the years ended December 31, 2023, 2022 and 2021, capitalized costs associated with the development of internal use computer software projects are as follows:
| YEAR ENDED DECEMBER 31, | |||||||||||||||||
| 2023 | 2022 | 2021 | |||||||||||||||
| Capitalized costs associated with the development of internal use computer software projects | $ | $ | $ | ||||||||||||||
ASSET RETIREMENT OBLIGATIONS
76 | IRON MOUNTAIN 2023 FORM 10-K | |||||||
Part IV
IRON MOUNTAIN INCORPORATED
NOTES TO CONSOLIDATED FINANCIAL STATEMENTS (CONTINUED)
DECEMBER 31, 2023
(In thousands, except share and per share data)
2. SUMMARY OF SIGNIFICANT ACCOUNTING POLICIES (CONTINUED)
J. LEASES
We lease facilities for certain warehouses, data centers and office space. We also have land leases, including those on which certain facilities are located. The majority of our leased facilities are classified as operating leases that, on average, have initial lease terms of to 10 years, with one or more lease renewal options to extend the lease term. Our lease renewal option terms generally range from to five years . The exercise of the lease renewal option is at our sole discretion and may contain fixed rent, fair market value based rent or Consumer Price Index rent escalation clauses. We include option periods in the lease term when our failure to renew the lease would result in an economic disincentive, thereby making it reasonably certain that we will renew the lease. We recognize straight line rental expense over the life of the lease and any fair market value or Consumer Price Index rent escalations are recognized as variable lease expense in the period in which the obligation is incurred. In addition, we lease certain vehicles and equipment. Vehicle and equipment leases typically have lease terms ranging from to seven years .
We account for all leases, both operating and financing, in accordance with Accounting Standards Codification ("ASC") Topic 842, Leases ("ASC 842"). Our accounting policy provides that leases with an initial term of 12 months or less will not be included within the lease right-of-use assets and lease liabilities recognized on our Consolidated Balance Sheets. We recognize the lease payments for those leases with an initial term of 12 months or less in our Consolidated Statements of Operations on a straight-line basis over the lease term.
The lease right-of-use assets and related lease liabilities are classified as either operating or financing. Lease right-of-use assets are calculated as the net present value of future payments plus any capitalized initial direct costs less any tenant improvements or lease incentives. Lease liabilities are calculated as the net present value of future payments. In calculating the present value of the lease payments, we utilize the rate stated in the lease (in the limited circumstances when such rate is explicitly stated) or, if no rate is explicitly stated, we utilize a rate that reflects our securitized incremental borrowing rate by geography for the lease term. We account for nonlease components (which include common area maintenance, taxes, and insurance) with the related lease component. Any variable nonlease components are not included within the lease right-of-use asset and lease liability on our Consolidated Balance Sheets, and instead, are reflected as an expense in the period incurred.
Operating and financing lease right-of-use assets and lease liabilities as of December 31, 2023 and 2022 are as follows:
| DECEMBER 31, | ||||||||||||||
| DESCRIPTION | 2023 | 2022 | ||||||||||||
| Assets: | ||||||||||||||
Operating lease right-of-use assets(1) | $ | $ | ||||||||||||
| Liabilities: | ||||||||||||||
| Current | ||||||||||||||
| $ | $ | |||||||||||||
| Long-term | ||||||||||||||
| Operating lease liabilities | $ | $ | ||||||||||||
(1)At December 31, 2023 and 2022, these assets are comprised of approximately 99 1
(2)At December 31, 2023, these assets are comprised of approximately 68 % real estate related assets and 32 % non-real estate related assets. At December 31, 2022, these assets are comprised of approximately 64 % real estate related assets and 36 % non-real estate related assets.
(3)Financing lease right-of-use assets, current financing lease liabilities and long-term financing lease liabilities are included within Property, Plant and Equipment, Net, Current portion of long-term debt and Long-term Debt, net of current portion, respectively, within our Consolidated Balance Sheets.
IRON MOUNTAIN 2023 FORM 10-K | 77 | |||||||
Part IV
IRON MOUNTAIN INCORPORATED
NOTES TO CONSOLIDATED FINANCIAL STATEMENTS (CONTINUED)
DECEMBER 31, 2023
(In thousands, except share and per share data)
2. SUMMARY OF SIGNIFICANT ACCOUNTING POLICIES (CONTINUED)
The components of the lease expense for the years ended December 31, 2023, 2022 and 2021 are as follows:
| YEAR ENDED DECEMBER 31, | ||||||||||||||||||||
| DESCRIPTION | 2023 | 2022 | 2021 | |||||||||||||||||
Operating lease cost(1) | $ | $ | $ | |||||||||||||||||
| Financing lease cost: | ||||||||||||||||||||
| Depreciation of financing lease right-of-use assets | $ | $ | $ | |||||||||||||||||
| Interest expense for financing lease liabilities | ||||||||||||||||||||
Weighted average remaining lease terms and discount rates as of December 31, 2023 and 2022 are as follows:
| DECEMBER 31, 2023 | DECEMBER 31, 2022 | ||||||||||||||||||||||
| OPERATING LEASES | FINANCING LEASES | OPERATING LEASES | FINANCING LEASES | ||||||||||||||||||||
| Remaining Lease Term | |||||||||||||||||||||||
| Discount Rate | % | % | % | % | |||||||||||||||||||
The estimated minimum future lease payments (receipts) as of December 31, 2023 are as follows:
| YEAR | OPERATING LEASES(1) | SUBLEASE INCOME | FINANCING LEASES(1) | |||||||||||||||||
| 2024 | $ | $ | ( | $ | ||||||||||||||||
| 2025 | ( | |||||||||||||||||||
| 2026 | ( | |||||||||||||||||||
| 2027 | ( | |||||||||||||||||||
| 2028 | ( | |||||||||||||||||||
| Thereafter | ( | |||||||||||||||||||
| Total minimum lease payments (receipts) | $ | ( | ||||||||||||||||||
| Less amounts representing interest or imputed interest | ||||||||||||||||||||
| Present value of lease obligations | $ | $ | ||||||||||||||||||
At December 31, 2023, we had four leases which we have signed but which have not yet commenced and are not included in our lease obligation table above. The total undiscounted minimum lease payments for these leases are approximately $239,146 and have lease terms that range from 14 to 25 years. Each of these leases is expected to commence during 2024.
78 | IRON MOUNTAIN 2023 FORM 10-K | |||||||
Part IV
IRON MOUNTAIN INCORPORATED
NOTES TO CONSOLIDATED FINANCIAL STATEMENTS (CONTINUED)
DECEMBER 31, 2023
(In thousands, except share and per share data)
2. SUMMARY OF SIGNIFICANT ACCOUNTING POLICIES (CONTINUED)
Other information: Supplemental cash flow information relating to our leases for the years ended December 31, 2023, 2022 and 2021 is as follows:
| YEAR ENDED DECEMBER 31, | ||||||||||||||||||||
| CASH PAID FOR AMOUNTS INCLUDED IN MEASUREMENT OF LEASE LIABILITIES: | 2023 | 2022 | 2021 | |||||||||||||||||
| Operating cash flows used in operating leases | $ | $ | $ | |||||||||||||||||
| Operating cash flows used in financing leases (interest) | ||||||||||||||||||||
| Financing cash flows used in financing leases | ||||||||||||||||||||
| NON-CASH ITEMS: | ||||||||||||||||||||
| Operating lease modifications and reassessments | $ | $ | $ | |||||||||||||||||
| New operating leases (including acquisitions and sale-leaseback transactions) | ||||||||||||||||||||
K. LONG-LIVED ASSETS
We review long-lived assets for impairment whenever events or changes in circumstances indicate the carrying amount of such assets may not be recoverable. Recoverability of these assets is determined by comparing the sum of the forecasted undiscounted net cash flows of the operation to which the assets relate to their carrying amount. The operations are generally distinguished by the business segment and geographic region in which they operate. If it is determined that we are unable to recover the carrying amount of the assets, the long-lived assets are written down, on a pro rata basis, to fair value. Fair value is determined based on discounted cash flows or appraised values, depending upon the nature of the assets. Long-lived assets, including finite-lived intangible assets, are amortized over their useful lives. Annually, or more frequently if events or circumstances warrant, we assess whether a change in the lives over which long-lived assets, including finite-lived intangible assets, are amortized is necessary.
IRON MOUNTAIN 2023 FORM 10-K | 79 | |||||||
Part IV
IRON MOUNTAIN INCORPORATED
NOTES TO CONSOLIDATED FINANCIAL STATEMENTS (CONTINUED)
DECEMBER 31, 2023
(In thousands, except share and per share data)
2. SUMMARY OF SIGNIFICANT ACCOUNTING POLICIES (CONTINUED)
Gain on disposal/write-down of property, plant and equipment, net for the years ended December 31, 2023, 2022 and 2021 is as follows:
| YEAR ENDED DECEMBER 31, | |||||||||||
| 2023 | 2022 | 2021 | |||||||||
| Gain on disposal/write-down of property, plant and equipment, net | $ | $ | $ | ||||||||
The gains primarily consist of(1): | •Gains associated with sale and sale-leaseback transactions of approximately $ | •Gains associated with sale and sale-leaseback transactions of approximately $ | •Gains associated with sale and sale-leaseback transactions of approximately $ | ||||||||
L. GOODWILL AND OTHER INDEFINITE-LIVED INTANGIBLE ASSETS
Goodwill and intangible assets with indefinite lives are not amortized but are reviewed annually for impairment, or more frequently if impairment indicators arise. Other than goodwill, we currently have no intangible assets that have indefinite lives and which are not amortized.
We test goodwill annually on October 1, and more frequently if impairment indicators arise that would require an interim test. We have performed our annual goodwill impairment review as of October 1, 2023, 2022 and 2021. We concluded that as of October 1, 2023, 2022 and 2021, goodwill was not impaired.
80 | IRON MOUNTAIN 2023 FORM 10-K | |||||||
Part IV
IRON MOUNTAIN INCORPORATED
NOTES TO CONSOLIDATED FINANCIAL STATEMENTS (CONTINUED)
DECEMBER 31, 2023
(In thousands, except share and per share data)
2. SUMMARY OF SIGNIFICANT ACCOUNTING POLICIES (CONTINUED)
REPORTING UNITS AS OF OCTOBER 1, 2022
Our reporting units at which level we performed our goodwill impairment analysis as of October 1, 2022 were as follows:
•North America Records and Information Management ("North America RIM") •Europe and South Africa Records and Information Management ("ESA RIM") •Middle East, North Africa and Turkey Information Management ("MENAT RIM") •Latin America Records and Information Management ("Latin America RIM") | •Asia Pacific Records and Information Management ("APAC RIM") •Entertainment Services •Global Data Center •Fine Arts •ALM | ||||
There were no changes to the composition of our reporting units between October 1, 2022 and December 31, 2022.
GOODWILL BY REPORTING UNIT AS OF DECEMBER 31, 2022
The carrying value of goodwill, net for each of our reporting units described above as of December 31, 2022 is as follows:
| SEGMENT | REPORTING UNIT | CARRYING VALUE AS OF DECEMBER 31, 2022 | ||||||
| Global RIM Business | North America RIM | $ | ||||||
| ESA RIM | ||||||||
| MENAT RIM | ||||||||
| Latin America RIM | ||||||||
| APAC RIM | ||||||||
| Entertainment Services | ||||||||
| Global Data Center Business | Global Data Center | |||||||
| Corporate and Other | Fine Arts | |||||||
| ALM | ||||||||
| Total | $ | |||||||
IRON MOUNTAIN 2023 FORM 10-K | 81 | |||||||
Part IV
IRON MOUNTAIN INCORPORATED
NOTES TO CONSOLIDATED FINANCIAL STATEMENTS (CONTINUED)
DECEMBER 31, 2023
(In thousands, except share and per share data)
2. SUMMARY OF SIGNIFICANT ACCOUNTING POLICIES (CONTINUED)
2023 REPORTING UNIT CHANGES
During 2023, as a result of the realignment of our global managerial structure, we reassessed the composition of our reporting units. The realignment of our global managerial structure did not change the composition of our reportable segments (as described and defined in Note 11). The reassessment resulted in the following changes to our reporting units: (i) our South Africa business, which was previously managed with our other businesses in Europe as part of our former ESA RIM reporting unit, is now managed as part of our former MENAT RIM reporting unit and these will comprise our "MENATSA RIM" reporting unit and (ii) our other businesses in Europe are now managed as our "Europe RIM" reporting unit.
There were no changes to our other reporting units. We have reassigned goodwill associated with the reporting units impacted by the realignment on a relative fair value basis, where appropriate. The fair value of each of our new reporting units was determined based on the application of a combined weighted average approach of preliminary fair value multiples of revenue and earnings and discounted cash flow techniques. These fair values represent our best estimate and preliminary assessment of goodwill allocations to each of the new reporting units on a relative fair value basis. We have completed an interim goodwill impairment analysis before and after the reporting unit changes, and we have concluded that the goodwill associated with each of our reporting units was not impaired.
REPORTING UNITS AS OF OCTOBER 1, 2023
Our reporting units at which level we performed our goodwill impairment analysis as of October 1, 2023 were as follows:
•North America RIM •Europe RIM •MENATSA RIM •Latin America RIM •APAC RIM | •Entertainment Services •Global Data Center •Fine Arts •ALM | ||||
There were no changes to the composition of our reporting units between October 1, 2023 and December 31, 2023.
GOODWILL BY REPORTING UNIT AS OF DECEMBER 31, 2023
The carrying value of goodwill, net for each of our reporting units described above as of December 31, 2023 is as follows:
| SEGMENT | REPORTING UNIT | CARRYING VALUE AS OF DECEMBER 31, 2023 | ||||||
| Global RIM Business | North America RIM | $ | ||||||
| Europe RIM | ||||||||
| MENATSA RIM | ||||||||
| Latin America RIM | ||||||||
| APAC RIM | ||||||||
| Entertainment Services | ||||||||
| Global Data Center Business | Global Data Center | |||||||
| Corporate and Other | Fine Arts | |||||||
| ALM | ||||||||
| Total | $ | |||||||
82 | IRON MOUNTAIN 2023 FORM 10-K | |||||||
Part IV
IRON MOUNTAIN INCORPORATED
NOTES TO CONSOLIDATED FINANCIAL STATEMENTS (CONTINUED)
DECEMBER 31, 2023
(In thousands, except share and per share data)
2. SUMMARY OF SIGNIFICANT ACCOUNTING POLICIES (CONTINUED)
The fair value of our reporting units has generally been determined using a combined approach based on the present value of future cash flows (the "Discounted Cash Flow Model") and market multiples (the "Market Approach").
The Discounted Cash Flow Model incorporates significant assumptions including future revenue growth rates, operating margins, discount rates and capital expenditures. | The Market Approach requires us to make assumptions related to Adjusted EBITDA (as defined in Note 11) multiples. | ||||
Changes in economic and operating conditions impacting these assumptions or changes in multiples could result in goodwill impairments in future periods. In conjunction with our annual goodwill impairment reviews, we reconcile the sum of the valuations of all of our reporting units to our market capitalization as of such dates.
The changes in the carrying value of goodwill attributable to each reportable segment for the years ended December 31, 2023 and 2022 are as follows:
| GLOBAL RIM BUSINESS | GLOBAL DATA CENTER BUSINESS | CORPORATE AND OTHER | TOTAL CONSOLIDATED | ||||||||||||||||||||
| Goodwill balance, net of accumulated amortization, as of December 31, 2021 | $ | $ | $ | $ | |||||||||||||||||||
| Tax deductible goodwill acquired during the year | |||||||||||||||||||||||
| Non-tax deductible goodwill acquired during the year | |||||||||||||||||||||||
Fair value and other adjustments(1) | ( | ( | |||||||||||||||||||||
| Currency effects | ( | ( | ( | ( | |||||||||||||||||||
| Goodwill balance, net of accumulated amortization, as of December 31, 2022 | |||||||||||||||||||||||
| Tax deductible goodwill acquired during the year | |||||||||||||||||||||||
| Non-tax deductible goodwill acquired during the year | |||||||||||||||||||||||
| Fair value and other adjustments | ( | ||||||||||||||||||||||
| Currency effects | |||||||||||||||||||||||
Goodwill balance, net of accumulated amortization, as of December 31, 2023 | $ | $ | $ | $ | |||||||||||||||||||
| Accumulated Goodwill Impairment Balance as of December 31, 2022 | $ | $ | $ | $ | |||||||||||||||||||
| Accumulated Goodwill Impairment Balance as of December 31, 2023 | $ | $ | $ | $ | |||||||||||||||||||
(1) This amount primarily represents an adjustment to goodwill as a result of the deconsolidation of certain businesses, as described in Note 4.
M. FINITE-LIVED INTANGIBLE ASSETS AND LIABILITIES
I. CUSTOMER AND SUPPLIER RELATIONSHIP INTANGIBLE ASSETS
Customer and supplier relationship intangible assets, which are acquired through either business combinations or acquisitions of customer relationships, are generally amortized over periods ranging from 10 to 30 years. Customer and supplier relationship intangible assets are recorded based upon estimates of their fair value.
IRON MOUNTAIN 2023 FORM 10-K | 83 | |||||||
Part IV
IRON MOUNTAIN INCORPORATED
NOTES TO CONSOLIDATED FINANCIAL STATEMENTS (CONTINUED)
DECEMBER 31, 2023
(In thousands, except share and per share data)
2. SUMMARY OF SIGNIFICANT ACCOUNTING POLICIES (CONTINUED)
II. CUSTOMER INDUCEMENTS
Payments that are made to a customer in order to terminate the customer’s storage of records with its current records management vendor ("Permanent Withdrawal Fees"), or direct payments to a customer for which no distinct benefit is received in return, are collectively referred to as "Customer Inducements". Customer Inducements are treated as a reduction of the transaction price over the associated contract terms, which range from to 10 years, and are included in storage and service revenue in the accompanying Consolidated Statements of Operations. If the customer terminates its relationship with us, the unamortized carrying value of the Customer Inducement intangible asset is charged to revenue. However, in the event of such termination, we generally collect, and record as revenue, Permanent Withdrawal Fees that generally equal or exceed the amount of the unamortized Customer Inducement intangible asset.
III. DATA CENTER INTANGIBLE ASSETS AND LIABILITIES
Finite-lived intangible assets associated with our Global Data Center Business consist of the following:
DATA CENTER IN-PLACE LEASE INTANGIBLE ASSETS AND DATA CENTER TENANT RELATIONSHIP INTANGIBLE ASSETS
Data center in-place lease intangible assets ("Data Center In-Place Leases") and data center tenant relationship intangible assets ("Data Center Tenant Relationships") reflect the value associated with acquiring a data center operation with active tenants as of the date of acquisition. The value of Data Center In-Place Leases is determined based upon an estimate of the economic costs (such as lost revenues, tenant improvement costs, commissions, legal expenses and other costs to acquire new data center leases) avoided by acquiring a data center operation with active tenants. Data Center In-Place Leases are amortized over the weighted average remaining term of the acquired data center leases. The value of Data Center Tenant Relationships is determined based upon an estimate of the economic costs avoided upon lease renewal of the acquired tenants, based upon expectations of lease renewal. Data Center Tenant Relationships are amortized over the weighted average remaining anticipated life of the relationship with the acquired tenant.
DATA CENTER ABOVE-MARKET AND BELOW-MARKET IN-PLACE LEASE INTANGIBLE ASSETS
Data center above-market in-place lease intangible assets ("Data Center Above-Market Leases") and data center below-market in-place lease intangible assets ("Data Center Below-Market Leases") are recorded at the net present value of the difference between (i) the contractual amounts to be paid pursuant to each in-place lease and (ii) management’s estimate of the fair market lease rates for each corresponding in-place lease. Data Center Above-Market Leases and Data Center Below-Market Leases are amortized over the remaining non-cancellable term of the acquired in-place lease to storage revenue.
84 | IRON MOUNTAIN 2023 FORM 10-K | |||||||
Part IV
IRON MOUNTAIN INCORPORATED
NOTES TO CONSOLIDATED FINANCIAL STATEMENTS (CONTINUED)
DECEMBER 31, 2023
(In thousands, except share and per share data)
2. SUMMARY OF SIGNIFICANT ACCOUNTING POLICIES (CONTINUED)
The gross carrying amount and accumulated amortization of our finite-lived intangible assets as of December 31, 2023 and 2022, respectively, are as follows:
| DECEMBER 31, 2023 | DECEMBER 31, 2022 | ||||||||||||||||||||||
| DESCRIPTION | GROSS CARRYING AMOUNT | ACCUMULATED AMORTIZATION | NET CARRYING AMOUNT | GROSS CARRYING AMOUNT | ACCUMULATED AMORTIZATION | NET CARRYING AMOUNT | |||||||||||||||||
| Assets: | |||||||||||||||||||||||
Customer and supplier relationship intangible assets(1) | $ | $ | ( | $ | $ | $ | ( | $ | |||||||||||||||
Customer inducements(1) | ( | ( | |||||||||||||||||||||
Data center lease-based intangible assets(1)(2) | ( | ( | |||||||||||||||||||||
Third-party commissions asset and other(3) | ( | ( | |||||||||||||||||||||
| Liabilities: | |||||||||||||||||||||||
Data center below-market leases(4) | $ | $ | ( | $ | $ | $ | ( | $ | |||||||||||||||
(1)Included in Customer and supplier relationship and other intangible assets in the accompanying Consolidated Balance Sheets.
(2)Data center lease-based intangible assets includes Data Center In-Place Leases, Data Center Tenant Relationships and Data Center Above-Market Leases.
(3)Included in Other (within Other Assets, Net) in the accompanying Consolidated Balance Sheets.
(4)Included in Other long-term liabilities in the accompanying Consolidated Balance Sheets.
Amortization expense associated with finite-lived intangible assets, revenue reduction associated with the amortization of Customer Inducements and net revenue reduction associated with the amortization of Data Center Above-Market Leases and Data Center Below-Market Leases for the years ended December 31, 2023, 2022 and 2021 is as follows:
| YEAR ENDED DECEMBER 31, | ||||||||||||||||||||
| 2023 | 2022 | 2021 | ||||||||||||||||||
| Amortization expense included in depreciation and amortization associated with: | ||||||||||||||||||||
| Customer and supplier relationship intangible assets | $ | $ | $ | |||||||||||||||||
| Data center in-place leases and tenant relationships | ||||||||||||||||||||
| Third-party commissions asset and other | ||||||||||||||||||||
| Revenue reduction associated with amortization of: | ||||||||||||||||||||
| Customer inducements and data center above-market and below-market leases | $ | $ | $ | |||||||||||||||||
Estimated amortization expense for existing finite-lived intangible assets (excluding Contract Costs, as defined and disclosed in Note 2.s.) is as follows:
| ESTIMATED AMORTIZATION | ||||||||||||||
| YEAR | INCLUDED IN DEPRECIATION AND AMORTIZATION | REVENUE REDUCTION ASSOCIATED WITH CUSTOMER INDUCEMENTS AND DATA CENTER ABOVE-MARKET AND BELOW-MARKET LEASES | ||||||||||||
| 2024 | $ | $ | ||||||||||||
| 2025 | ||||||||||||||
| 2026 | ||||||||||||||
| 2027 | ||||||||||||||
| 2028 | ||||||||||||||
| Thereafter | ||||||||||||||
IRON MOUNTAIN 2023 FORM 10-K | 85 | |||||||
Part IV
IRON MOUNTAIN INCORPORATED
NOTES TO CONSOLIDATED FINANCIAL STATEMENTS (CONTINUED)
DECEMBER 31, 2023
(In thousands, except share and per share data)
2. SUMMARY OF SIGNIFICANT ACCOUNTING POLICIES (CONTINUED)
N. DEFERRED FINANCING COSTS
O. DERIVATIVE INSTRUMENTS AND HEDGING ACTIVITIES
P. FAIR VALUE MEASUREMENTS
Entities are permitted under GAAP to elect to measure certain financial instruments and certain other items at either fair value or cost. We have elected the cost measurement option in all circumstances where we had an option.
Our financial assets or liabilities that are carried at fair value are required to be measured using inputs from the three levels of the fair value hierarchy. A financial asset or liability’s classification within the hierarchy is determined based on the lowest level input that is significant to the fair value measurement. The three levels of the fair value hierarchy are as follows:
Level 1—Inputs are unadjusted quoted prices in active markets for identical assets or liabilities that we have the ability to access at the measurement date.
Level 2—Inputs include quoted prices for similar assets and liabilities in active markets, quoted prices for identical or similar assets or liabilities in markets that are not active, inputs other than quoted prices that are observable for the asset or liability (i.e., interest rates, yield curves, etc.), and inputs that are derived principally from or corroborated by observable market data by correlation or other means (market corroborated inputs).
86 | IRON MOUNTAIN 2023 FORM 10-K | |||||||
Part IV
IRON MOUNTAIN INCORPORATED
NOTES TO CONSOLIDATED FINANCIAL STATEMENTS (CONTINUED)
DECEMBER 31, 2023
(In thousands, except share and per share data)
2. SUMMARY OF SIGNIFICANT ACCOUNTING POLICIES (CONTINUED)
The assets and liabilities carried at fair value and measured on a recurring basis as of December 31, 2023 and 2022, respectively, are as follows:
FAIR VALUE MEASUREMENTS AT DECEMBER 31, 2023 USING | ||||||||||||||||||||||||||
DESCRIPTION | TOTAL CARRYING VALUE AT DECEMBER 31, 2023 | QUOTED PRICES IN ACTIVE MARKETS (LEVEL 1) | SIGNIFICANT OTHER OBSERVABLE INPUTS (LEVEL 2) | SIGNIFICANT UNOBSERVABLE INPUTS (LEVEL 3) | ||||||||||||||||||||||
Money Market Funds(1) | $ | $ | $ | $ | ||||||||||||||||||||||
Time Deposits(1) | ||||||||||||||||||||||||||
| Trading Securities | (2) | (3) | ||||||||||||||||||||||||
Derivative Assets(4) | ||||||||||||||||||||||||||
Derivative Liabilities(4) | ||||||||||||||||||||||||||
Deferred Purchase Obligations(5) | ||||||||||||||||||||||||||
| FAIR VALUE MEASUREMENTS AT DECEMBER 31, 2022 USING | ||||||||||||||||||||||||||
| DESCRIPTION | TOTAL CARRYING VALUE AT DECEMBER 31, 2022 | QUOTED PRICES IN ACTIVE MARKETS (LEVEL 1) | SIGNIFICANT OTHER OBSERVABLE INPUTS (LEVEL 2) | SIGNIFICANT UNOBSERVABLE INPUTS (LEVEL 3) | ||||||||||||||||||||||
Money Market Funds(1) | $ | $ | $ | $ | ||||||||||||||||||||||
Time Deposits(1) | ||||||||||||||||||||||||||
| Trading Securities | (2) | (3) | ||||||||||||||||||||||||
Derivative Assets(4) | ||||||||||||||||||||||||||
Derivative Liabilities(4) | ||||||||||||||||||||||||||
Deferred Purchase Obligations(5) | ||||||||||||||||||||||||||
(1)Money market funds and time deposits are measured based on quoted prices for similar assets and/or subsequent transactions.
(2)Certain trading securities are measured at fair value using quoted market prices.
(3)Certain trading securities are measured based on inputs other than quoted market prices that are observable.
(4)Derivative assets and liabilities include (i) interest rate swap agreements, and (ii) cross-currency swap agreements to hedge the variability of exchange rate impacts between the United States dollar and the Euro and certain of our Euro denominated subsidiaries. Our derivative financial instruments are measured using industry standard valuation models using market-based observable inputs, including interest rate curves, forward and spot prices for currencies and implied volatilities. Credit risk is also factored into the determination of the fair value of our derivative financial instruments. See Note 6 for additional information on our derivative financial instruments.
(5)Primarily relates to the fair value of the Deferred Purchase Obligation associated with the ITRenew Transaction (each as defined in Note 3), which was determined utilizing a Monte Carlo model and takes into account our forecasted projections as it relates to the underlying performance of the business. The Monte Carlo simulation model incorporates assumptions as to expected gross profits over the applicable achievement period, including adjustments for the volatility of timing and amount of the associated revenue and costs, as well as discount rates that account for the risk of the underlying arrangement and overall market risks. Any material change to these assumptions may result in a significantly higher or lower fair value of the Deferred Purchase Obligation. During the fourth quarter of 2022, we recorded a change in the estimated fair value of the Deferred Purchase Obligation as described in Note 2.v. The change in value of the Deferred Purchase Obligation during the year ended December 31, 2023 was driven by the accretion of the obligation to present value.
There were no material items that were measured at fair value on a non-recurring basis for the years ended December 31, 2023 and 2022 other than (i) the reporting units as presented in our goodwill impairment analysis (as disclosed in Note 2.l.); (ii) assets acquired and liabilities assumed through our acquisitions (as disclosed in Note 3); (iii) the redemption value of recently acquired noncontrolling interests and previously held equity interests (both as disclosed in Note 3); (iv) contributions to our equity method investments; and (v) the fair value of our retained investment of our deconsolidated businesses (as described in Note 4), all of which are based on Level 3 inputs.
IRON MOUNTAIN 2023 FORM 10-K | 87 | |||||||
Part IV
IRON MOUNTAIN INCORPORATED
NOTES TO CONSOLIDATED FINANCIAL STATEMENTS (CONTINUED)
DECEMBER 31, 2023
(In thousands, except share and per share data)
2. SUMMARY OF SIGNIFICANT ACCOUNTING POLICIES (CONTINUED)
Q. REDEEMABLE NONCONTROLLING INTERESTS
Certain unaffiliated third parties own noncontrolling interests in certain of our consolidated subsidiaries. The underlying agreements between us and our noncontrolling interest shareholders for these subsidiaries contain provisions under which the noncontrolling interest shareholders can require us to purchase their respective interests in such subsidiaries at certain times and at a purchase price as stipulated in the underlying agreements (generally at fair value). These put options make these noncontrolling interests redeemable and, therefore, these noncontrolling interests are classified as temporary equity outside of stockholders’ equity. Redeemable noncontrolling interests are reported at the higher of their redemption value or the noncontrolling interest holders’ proportionate share of the underlying subsidiaries net carrying value. Increases or decreases in the redemption value of the noncontrolling interest are offset against Additional Paid-in Capital.
When our noncontrolling interests become mandatorily redeemable, they are included as a component of either Accrued expenses and other current liabilities or Other long-term liabilities on our Consolidated Balance Sheets, depending on the timing of the redemption.
R. ACCUMULATED OTHER COMPREHENSIVE ITEMS, NET
The changes in Accumulated other comprehensive items, net for the years ended December 31, 2023, 2022 and 2021 are as follows:
FOREIGN CURRENCY TRANSLATION AND OTHER ADJUSTMENTS | CHANGE IN FAIR VALUE OF DERIVATIVE INSTRUMENTS | TOTAL | |||||||||||||||
| Balance as of December 31, 2020 | $ | ( | $ | ( | $ | ( | |||||||||||
| Other comprehensive (loss) income: | |||||||||||||||||
| Foreign currency translation and other adjustments | ( | — | ( | ||||||||||||||
| Change in fair value of derivative instruments | — | ||||||||||||||||
| Total other comprehensive (loss) income | ( | ( | |||||||||||||||
| Balance as of December 31, 2021 | ( | ( | |||||||||||||||
| Other comprehensive (loss) income: | |||||||||||||||||
| Foreign currency translation and other adjustments | ( | — | ( | ||||||||||||||
| Change in fair value of derivative instruments | — | ||||||||||||||||
| Total other comprehensive (loss) income | ( | ( | |||||||||||||||
| Balance as of December 31, 2022 | ( | ( | |||||||||||||||
| Other comprehensive income (loss): | |||||||||||||||||
| Foreign currency translation and other adjustments | — | ||||||||||||||||
| Change in fair value of derivative instruments | — | ( | ( | ||||||||||||||
| Reclassifications from Accumulated Other Comprehensive Items, net | — | ( | ( | ||||||||||||||
| Total other comprehensive income (loss) | ( | ||||||||||||||||
| Balance as of December 31, 2023 | $ | ( | $ | $ | ( | ||||||||||||
88 | IRON MOUNTAIN 2023 FORM 10-K | |||||||
Part IV
IRON MOUNTAIN INCORPORATED
NOTES TO CONSOLIDATED FINANCIAL STATEMENTS (CONTINUED)
DECEMBER 31, 2023
(In thousands, except share and per share data)
2. SUMMARY OF SIGNIFICANT ACCOUNTING POLICIES (CONTINUED)
S. REVENUES
Our revenues consist of storage rental revenues as well as service revenues and are reflected net of sales and value-added taxes. Storage rental revenues, which are considered a key driver of financial performance for the storage and information management services industry, consist primarily of recurring periodic rental charges related to the storage of materials or data (generally on a per unit basis) that are typically retained by customers for many years and of revenues associated with our data center operations. Service revenues include charges for related service activities, the most significant of which include: (1) the handling of records, including the addition of new records, temporary removal of records from storage, refiling of removed records, customer termination and permanent withdrawal fees, project revenues and courier operations consisting primarily of the pickup and delivery of records upon customer request; (2) destruction services, consisting primarily of (i) secure shredding of sensitive documents and the subsequent sale of shredded paper for recycling, the price of which can fluctuate from period to period, and (ii) the decommissioning, data erasure, processing and disposition or sale of IT hardware and component assets; (3) digital solutions, including the scanning, imaging and document conversion services of active and inactive records, and consulting services; and (4) data center services, including set up, monitoring and support of our customers' assets which are protected in our data center facilities, and special project services, including data center fitout.
We account for our revenue in accordance with ASC 606, Revenue from Contracts with Customers ("ASC 606"), with the exception of our data center revenue, as described below. Customers are generally billed monthly based on contractually agreed-upon terms, and storage rental and service revenues are recognized in the month the respective storage rental or service is provided, in line with the transfer of control to the customer. When storage rental fees or services are billed in advance, amounts related to future storage rental or prepaid service contracts are accounted for as deferred revenue and recognized upon the transfer of control to the customer, generally ratably over the contract term. Customer contracts generally include promises to provide monthly recurring storage and related services that are essentially the same over time and have the same pattern of transfer of control to the customer; therefore, most performance obligations represent a promise to deliver a series of distinct services over time (as determined for purposes of ASC 606, a "series"). For those contracts that qualify as a series, we apply the "right to invoice" practical expedient as we have a right to consideration from the customer in an amount that corresponds directly with the value of the underlying performance obligation transferred to the customer to date. Additionally, each purchasing decision is fully in the control of the customer; therefore, consideration beyond the current reporting period is variable and allocated to the specific period to which the consideration relates, which is consistent with the practical expedient. Revenue from product sales, the significant majority of which are shred paper and IT asset sales, is recognized at the point in time at which control transfers to the customer, which is generally upon shipment.
Our Global Data Center Business features storage rental provided to the customer at contractually specified rates over a fixed contractual period. The revenue related to the storage component of our Global Data Center Business is recognized on a straight-line basis over the contract term in accordance with ASC 842. The revenue related to the service component of our Global Data Center Business is recognized in the period the related services are provided.
From time to time, we make payments to entities that are also customers under a revenue contract. These payments are primarily comprised of (i) Customer Inducements and (ii) payments to customers of our ALM business under revenue sharing arrangements for the remarketing of the customer's disposed IT assets. Customer Inducements do not represent payments for a distinct service, and, as such, are treated as a reduction of the transaction price over periods ranging from to 10 years. Payments for disposed IT assets are for a distinct good and, as such, are expensed as cost of sales in the period the revenue share is known or estimable.
The costs associated with the initial movement of customer records into physical storage and certain commissions are considered costs to fulfill or obtain customer contracts (collectively, "Contract Costs"). The following describes our significant Contract Costs:
INTAKE COSTS (AND ASSOCIATED DEFERRED REVENUE)
The costs of the initial intake of customer records into physical storage ("Intake Costs") are deferred and amortized as a component of depreciation and amortization in our Consolidated Statements of Operations generally over three years , consistent with the transfer of the performance obligation to the customer to which the asset relates. In instances where such Intake Costs are billed to the customer, the associated revenue is deferred and recognized over the same three-year period.
IRON MOUNTAIN 2023 FORM 10-K | 89 | |||||||
Part IV
IRON MOUNTAIN INCORPORATED
NOTES TO CONSOLIDATED FINANCIAL STATEMENTS (CONTINUED)
DECEMBER 31, 2023
(In thousands, except share and per share data)
2. SUMMARY OF SIGNIFICANT ACCOUNTING POLICIES (CONTINUED)
COMMISSIONS
Certain commission payments that are directly associated with the fulfillment of long-term contracts are capitalized and amortized as a component of depreciation and amortization in our Consolidated Statements of Operations generally over three years , consistent with the transfer of the performance obligation to the customer to which the asset relates. We also apply the practical expedient to expense certain commission payments as incurred when the amortization period for those commission payments is one year or less.
Contract Costs, which are included as a component of Other within Other Assets, Net as of December 31, 2023 and 2022 are as follows:
| DECEMBER 31, 2023 | DECEMBER 31, 2022 | |||||||||||||||||||||||||||||||||||||
| DESCRIPTION | GROSS CARRYING AMOUNT | ACCUMULATED AMORTIZATION | NET CARRYING AMOUNT | GROSS CARRYING AMOUNT | ACCUMULATED AMORTIZATION | NET CARRYING AMOUNT | ||||||||||||||||||||||||||||||||
| Intake Costs asset | $ | $ | ( | $ | $ | $ | ( | $ | ||||||||||||||||||||||||||||||
| Commissions asset | ( | ( | ||||||||||||||||||||||||||||||||||||
Amortization expense associated with the Intake Costs and Commissions assets for the years ended December 31, 2023, 2022 and 2021 are as follows:
| YEAR ENDED DECEMBER 31, | ||||||||||||||||||||
| DESCRIPTION | 2023 | 2022 | 2021 | |||||||||||||||||
| Intake Costs asset | $ | $ | $ | |||||||||||||||||
| Commissions asset | ||||||||||||||||||||
Estimated amortization expense for Contract Costs is as follows:
| YEAR | ESTIMATED AMORTIZATION | |||||||
| 2024 | $ | |||||||
| 2025 | ||||||||
| 2026 | ||||||||
Deferred revenue liabilities are reflected as follows in our Consolidated Balance Sheets:
| DECEMBER 31, | |||||||||||||||||
| DESCRIPTION | LOCATION IN BALANCE SHEET | 2023 | 2022 | ||||||||||||||
| Deferred revenue - Current | Deferred revenue | $ | $ | ||||||||||||||
| Deferred revenue - Long-term | Other Long-term Liabilities | ||||||||||||||||
DATA CENTER LESSOR CONSIDERATIONS
Our Global Data Center Business features storage rental provided to customers at contractually specified rates over a fixed contractual period. Our data center revenue contracts are accounted for in accordance with ASC 842. ASC 842 provides a practical expedient which allows lessors to account for nonlease components with the related lease component if both the timing and pattern of transfer are the same for nonlease components and the lease component, and the lease component, if accounted for separately, would be classified as an operating lease. The single combined component is accounted for under ASC 842 if the lease component is the predominant component and is accounted for under ASC 606 if the nonlease components are the predominant components. We have elected to take this practical expedient. Our data center revenue contracts may contain Consumer Price Index rent escalation clauses. Consumer Price Index rent escalation clauses are considered variable lease payments and are recognized as income in the period earned.
90 | IRON MOUNTAIN 2023 FORM 10-K | |||||||
Part IV
IRON MOUNTAIN INCORPORATED
NOTES TO CONSOLIDATED FINANCIAL STATEMENTS (CONTINUED)
DECEMBER 31, 2023
(In thousands, except share and per share data)
2. SUMMARY OF SIGNIFICANT ACCOUNTING POLICIES (CONTINUED)
Storage rental revenue associated with our Global Data Center Business for the years ended December 31, 2023, 2022 and 2021 are as follows:
| YEAR ENDED DECEMBER 31, | ||||||||||||||||||||
| 2023 | 2022 | 2021 | ||||||||||||||||||
| Storage rental revenue | $ | $ | $ | |||||||||||||||||
The revenue related to the service component of our Global Data Center Business is recognized in the period the related services are provided.
The future minimum lease payments we expect to receive under non-cancellable data center operating leases for which we are the lessor, excluding month to month leases, for the next five years are as follows:
| YEAR | FUTURE MINIMUM LEASE PAYMENTS | |||||||
| 2024 | $ | |||||||
| 2025 | ||||||||
| 2026 | ||||||||
| 2027 | ||||||||
| 2028 | ||||||||
T. STOCK-BASED COMPENSATION
We record stock-based compensation expense, utilizing the straight-line method, for the cost of stock options, restricted stock units ("RSUs"), and performance units ("PUs") (together, "Employee Stock-Based Awards").
RETIREMENT ELIGIBLE CRITERIA
For our Employee Stock-Based Awards made on or after March 1, 2022, we have included the following retirement provision:
•Upon an employee’s retirement on or after attaining age 55 with at least five years of service, if the sum of (i) the award recipient’s age at retirement and (ii) the award recipient’s years of service with us totals at least 65, the award recipient is entitled to continued vesting of any outstanding Employee Stock-Based Awards, provided that their retirement occurs on or after a minimum of six months from the grant date (the "Retirement Criteria").
•Accordingly, (i) grants of Employee Stock-Based Awards to an employee who has met the Retirement Criteria on or before the date of grant, or will meet the Retirement Criteria before the six month anniversary in the year of the grant, will be expensed over six months from the date of grant and (ii) grants of Employee Stock-Based Awards to employees who will meet the Retirement Criteria during the award’s normal vesting period will be expensed between the date of grant and the date upon which the award recipient meets the Retirement Criteria.
•Stock options and RSUs granted to award recipients who meet the Retirement Criteria will be delivered to the award recipient based upon the original vesting schedule. If an award recipient retires and has met the Retirement Criteria, stock options will remain exercisable until the original expiration date of the stock options. PUs granted to award recipients who meet the Retirement Criteria will be delivered in accordance with the original vesting schedule of the applicable PU award and remain subject to the same performance conditions.
IRON MOUNTAIN 2023 FORM 10-K | 91 | |||||||
Part IV
IRON MOUNTAIN INCORPORATED
NOTES TO CONSOLIDATED FINANCIAL STATEMENTS (CONTINUED)
DECEMBER 31, 2023
(In thousands, except share and per share data)
2. SUMMARY OF SIGNIFICANT ACCOUNTING POLICIES (CONTINUED)
Stock-based compensation expense for Employee Stock-Based Awards included in the accompanying Consolidated Statements of Operations for the years ended December 31, 2023, 2022 and 2021 is as follows:
| YEAR ENDED DECEMBER 31, | |||||||||||||||||
| 2023 | 2022 | 2021 | |||||||||||||||
| Stock-based compensation expense | $ | $ | $ | ||||||||||||||
| Stock-based compensation expense, after tax | |||||||||||||||||
The substantial majority of stock-based compensation expense for Employee Stock-Based Awards is included in Selling, general and administrative expenses in the accompanying Consolidated Statements of Operations.
STOCK OPTIONS
Options are generally granted with exercise prices equal to the market price of the stock on the date of grant; however, in certain instances, options are granted at exercise prices greater than the market price of the stock on the date of grant. We issue options that become exercisable ratably over a period three years from the date of grant and have a contractual life of 10 years from the date of grant, unless the holder’s employment is terminated sooner. Our non-employee directors are considered employees for purposes of our stock option plans and stock option reporting.
Our equity compensation plans generally provide that, upon a vesting change in control (as defined in each plan), any unvested options and other awards granted thereunder shall vest immediately if an employee is terminated as a result of the change in control or terminates their own employment for good reason (as defined in each plan). On January 20, 2015, our stockholders approved the adoption of the Iron Mountain Incorporated 2014 Stock and Cash Incentive Plan, as amended (the "2014 Plan").
In May 2021, our stockholders approved an amendment to the 2014 Plan to (i) increase the number of shares of our common stock authorized for issuance thereunder by 8,000,000 from 12,750,000 to 20,750,000 , (ii) extend the termination date of the 2014 Plan from May 24, 2027 to May 12, 2031, (iii) provide that, other than in specified circumstances, no equity-based award will vest before the first anniversary of the date of grant and (iv) provide that dividends and dividend equivalents are not paid with respect to stock options or stock appreciation rights.
A total of 20,750,000 shares of common stock have been reserved for grants of options and other rights under our various stock incentive plans, including the 2014 Plan. The number of shares available for grant under our various stock incentive plans at December 31, 2023 was 6,204,098 .
The fair value of stock options granted in 2023, 2022 and 2021 was $10.98 , $7.44 and $3.23 per share, respectively. These values were estimated on the date of grant using the Black-Scholes option pricing model. The assumptions used for stock option grants in the years ended December 31, 2023, 2022 and 2021 are as follows:
| YEAR ENDED DECEMBER 31, | ||||||||||||||||||||
| STOCK OPTION GRANT ASSUMPTIONS | 2023 | 2022 | 2021 | |||||||||||||||||
Expected volatility(1) | % | % | % | |||||||||||||||||
Risk-free interest rate(2) | % | % | % | |||||||||||||||||
Expected dividend yield(3) | % | % | % | |||||||||||||||||
Expected life(4) | ||||||||||||||||||||
(1)Expected volatility is calculated utilizing daily historical volatility over a period that equates to the expected life of the option.
(2)Risk-free interest rate is based on the United States Treasury interest rates whose term is consistent with the expected life (estimated period of time outstanding) of the stock options.
(3)Expected dividend yield is considered in the option pricing model and represents our annualized expected per share dividends over the trade price of our common stock at the date of grant.
(4)Expected life of the stock options granted is estimated using the historical exercise behavior of employees.
92 | IRON MOUNTAIN 2023 FORM 10-K | |||||||
Part IV
IRON MOUNTAIN INCORPORATED
NOTES TO CONSOLIDATED FINANCIAL STATEMENTS (CONTINUED)
DECEMBER 31, 2023
(In thousands, except share and per share data)
2. SUMMARY OF SIGNIFICANT ACCOUNTING POLICIES (CONTINUED)
A summary of stock option activity for the year ended December 31, 2023 is as follows:
| OPTIONS | WEIGHTED AVERAGE EXERCISE PRICE | WEIGHTED AVERAGE REMAINING CONTRACTUAL TERM (YEARS) | AGGREGATE INTRINSIC VALUE | ||||||||||||||||||||
| Outstanding at December 31, 2022 | $ | ||||||||||||||||||||||
| Granted | |||||||||||||||||||||||
| Exercised | ( | ||||||||||||||||||||||
| Outstanding at December 31, 2023 | $ | $ | |||||||||||||||||||||
| Options exercisable at December 31, 2023 | $ | $ | |||||||||||||||||||||
| Options expected to vest | $ | $ | |||||||||||||||||||||
RESTRICTED STOCK UNITS
Our RSUs generally have a vesting period of three years from the date of grant. However, RSUs granted to our non-employee directors vest immediately upon grant. All RSUs accrue dividend equivalents associated with the underlying stock as we declare dividends. Dividends will generally be paid to holders of RSUs in cash upon the vesting date of the associated RSU and will be forfeited if the RSU does not vest. The fair value of RSUs is the excess of the market price of our common stock at the date of grant over the holder's purchase price (which is typically zero).
The fair value of RSUs vested during the years ended December 31, 2023, 2022 and 2021 are as follows:
| YEAR ENDED DECEMBER 31, | |||||||||||||||||
| 2023 | 2022 | 2021 | |||||||||||||||
| Fair value of RSUs vested | $ | $ | $ | ||||||||||||||
A summary of RSU activity for the year ended December 31, 2023 is as follows:
| RSUs | WEIGHTED-AVERAGE GRANT-DATE FAIR VALUE | ||||||||||
| Non-vested at December 31, 2022 | $ | ||||||||||
| Granted | |||||||||||
| Vested | ( | ||||||||||
| Forfeited | ( | ||||||||||
| Non-vested at December 31, 2023 | $ | ||||||||||
PERFORMANCE UNITS
The PUs we issue vest based on our performance against predefined operational performance and relative total shareholder return based targets over a three-year performance period. The vesting is subject to a minimum level of return on invested capital in the third year of the performance period, and the number of PUs earned is based on certain metrics determined at the outset of the performance period.
IRON MOUNTAIN 2023 FORM 10-K | 93 | |||||||
Part IV
IRON MOUNTAIN INCORPORATED
NOTES TO CONSOLIDATED FINANCIAL STATEMENTS (CONTINUED)
DECEMBER 31, 2023
(In thousands, except share and per share data)
2. SUMMARY OF SIGNIFICANT ACCOUNTING POLICIES (CONTINUED)
For grants issued in 2023 and 2022, the number of PUs earned is based on:
•either (i) the revenue performance for each year averaged at the end of the three-year performance period, or (ii) if (a) absolute total shareholder return is positive at the end of the three-year performance period and (b) a predetermined revenue hurdle is achieved in the third year of the performance period, then the revenue performance achieved in the third year of the performance period; and
•the total return on our common stock relative to the Morgan Stanley Capital International (“MSCI”) United States REIT Index.
For grants issued in 2021, the number of PUs earned is based on:
•the revenue performance for each year averaged at the end of the three-year performance period;
•the revenue exit rate of new products in the last quarter of the three-year performance period; and
•the total return on our common stock relative to the MSCI United States REIT Index.
The number of PUs earned for grants made in 2023 and 2022 will range from 0 350 0 % to 200 %.
All of our PUs will be settled in shares of our common stock and are subject to cliff vesting three years from the date of the original PU grant. As detailed above, PUs granted are subject to the Retirement Criteria. PUs are generally expensed over the three-year performance period, unless they are granted to a recipient who meets the Retirement Criteria, for which expense will be recognized as described above. PUs granted to recipients who meet the Retirement Criteria will continue to vest and be delivered in accordance with the original vesting schedule of the applicable PU award and remain subject to the same performance conditions.
All PUs accrue dividend equivalents associated with the underlying stock as we declare dividends. Dividends will generally be paid to holders of PUs in cash upon the settlement date of the associated PU and will be forfeited if the PU does not vest.
During the years ended December 31, 2023, 2022 and 2021, we issued 641,412 , 435,675 and 488,953 PUs, respectively. We forecast the likelihood of achieving the predefined targets for our PUs in order to calculate the expected PUs to be earned. We record a compensation charge based on either the forecasted PUs to be earned (during the performance period) or the actual PUs earned (at the three-year anniversary of the grant date) over the vesting period for each of the awards. The fair value of PUs based on our performance against predefined targets is the excess of the market price of our common stock at the date of grant over the purchase price (which is typically zero). For PUs earned based on a market condition, we utilize a Monte Carlo simulation to fair value these awards at the date of grant.
The fair value of earned PUs that vested during the years ended December 31, 2023, 2022 and 2021 is as follows:
| YEAR ENDED DECEMBER 31, | |||||||||||||||||
| 2023 | 2022 | 2021 | |||||||||||||||
| Fair value of earned PUs that vested | $ | $ | $ | ||||||||||||||
A summary of PU activity for the year ended December 31, 2023 is as follows:
| ORIGINAL PU AWARDS | PU ADJUSTMENT(1) | TOTAL PU AWARDS | WEIGHTED-AVERAGE GRANT-DATE FAIR VALUE | ||||||||||||||||||||
| Non-vested at December 31, 2022 | ( | $ | |||||||||||||||||||||
| Granted | |||||||||||||||||||||||
Prior year grant adjustments for performance(1) | |||||||||||||||||||||||
| Vested | ( | ( | |||||||||||||||||||||
| Forfeited | ( | ( | |||||||||||||||||||||
| Non-vested at December 31, 2023 | ( | $ | |||||||||||||||||||||
(1)Represents an increase or decrease in the number of original PUs awarded based on either the final performance criteria or market condition achievement at the end of the performance period of such PUs.
94 | IRON MOUNTAIN 2023 FORM 10-K | |||||||
Part IV
IRON MOUNTAIN INCORPORATED
NOTES TO CONSOLIDATED FINANCIAL STATEMENTS (CONTINUED)
DECEMBER 31, 2023
(In thousands, except share and per share data)
2. SUMMARY OF SIGNIFICANT ACCOUNTING POLICIES (CONTINUED)
EMPLOYEE STOCK PURCHASE PLAN
As of December 31, 2023, unrecognized compensation cost related to the unvested portion of our Employee Stock-Based Awards, inclusive of our estimated achievement of the performance metrics, was $61,799 and is expected to be recognized over a weighted-average period of 1.9 years.
We issue shares of our common stock for the exercises of stock options, and the vesting of RSUs, PUs and shares of our common stock under our ESPP from unissued reserved shares.
U. ACQUISITION AND INTEGRATION COSTS
V. OTHER EXPENSE (INCOME), NET
Other expense (income), net for the years ended December 31, 2023, 2022 and 2021 consists of the following:
| YEAR ENDED DECEMBER 31, | |||||||||||||||||
| 2023 | 2022 | 2021 | |||||||||||||||
Foreign currency transaction losses (gains), net(1) | $ | $ | ( | $ | ( | ||||||||||||
| Debt extinguishment expense | |||||||||||||||||
| ( | ( | ||||||||||||||||
Other expense (income), net | $ | $ | ( | $ | ( | ||||||||||||
(1)The gain or loss on foreign currency transactions, calculated as the difference between the historical exchange rate and the exchange rate at the applicable measurement date, includes gains or losses primarily related to (i) certain foreign currency denominated intercompany obligations of our foreign subsidiaries to us and between our foreign subsidiaries, which are not considered permanently invested, and (ii) borrowings in certain foreign currencies under the Revolving Credit Facility (as defined in Note 7).
(2)Other, net for the year ended December 31, 2023 consists primarily of a loss of approximately $38,000 associated with the remeasurement to fair value of our previously held equity interest in the Clutter JV (as defined and discussed in Note 5), as well as losses on our equity method investments and the change in value of the Deferred Purchase Obligation.
(3)Other, net for the year ended December 31, 2022 consists primarily of (i) a gain of approximately $93,600 associated with the remeasurement of the Deferred Purchase Obligation to the present value of our best estimate of fair value and (ii) a gain of approximately $35,800 associated with the Clutter Transaction (as defined in Note 5), partially offset by (iii) a loss of approximately $105,800 associated with the OSG Deconsolidation (as defined in Note 4) and (iv) losses on our equity method investments.
(4)Other, net for the year ended December 31, 2021 consists primarily of (i) a gain of approximately $179,000 associated with our IPM Divestment (as defined in Note 4) and (ii) a gain of approximately $20,300 associated with the loss of control and related deconsolidation, as of May 18, 2021, of one of our wholly-owned Netherlands subsidiaries, for which we had value-added tax liability exposure that was recorded in 2019, partially offset by (iii) losses on our equity method investments.
IRON MOUNTAIN 2023 FORM 10-K | 95 | |||||||
Part IV
IRON MOUNTAIN INCORPORATED
NOTES TO CONSOLIDATED FINANCIAL STATEMENTS (CONTINUED)
DECEMBER 31, 2023
(In thousands, except share and per share data)
2. SUMMARY OF SIGNIFICANT ACCOUNTING POLICIES (CONTINUED)
W. INCOME TAXES
Accounting for income taxes requires the recognition of deferred tax assets and liabilities for the expected future tax consequences of temporary differences between the tax and financial reporting bases of assets and liabilities and for loss and credit carryforwards. Valuation allowances are provided when recovery of deferred tax assets does not meet the more likely than not standard as defined in GAAP. We have elected to recognize interest and penalties associated with uncertain tax positions as a component of the Provision (benefit) for income taxes in the accompanying Consolidated Statements of Operations.
X. INCOME (LOSS) PER SHARE—BASIC AND DILUTED
The calculation of basic and diluted income (loss) per share for the years ended December 31, 2023, 2022 and 2021 is as follows:
| YEAR ENDED DECEMBER 31, | |||||||||||||||||
| 2023 | 2022 | 2021 | |||||||||||||||
| Net Income (Loss) | $ | $ | $ | ||||||||||||||
| Less: Net Income (Loss) Attributable to Noncontrolling Interests | |||||||||||||||||
| Net Income (Loss) Attributable to Iron Mountain Incorporated (utilized in numerator of Earnings Per Share calculation) | $ | $ | $ | ||||||||||||||
| Weighted-average shares—basic | |||||||||||||||||
| Effect of dilutive potential stock options | |||||||||||||||||
| Effect of dilutive potential RSUs and PUs | |||||||||||||||||
| Weighted-average shares—diluted | |||||||||||||||||
| Net Income (Loss) Per Share Attributable to Iron Mountain Incorporated: | |||||||||||||||||
| Basic | $ | $ | $ | ||||||||||||||
| Diluted | $ | $ | $ | ||||||||||||||
| Antidilutive stock options, RSUs and PUs, excluded from the calculation | |||||||||||||||||
Y. NEW ACCOUNTING PRONOUNCEMENTS
RECENTLY ADOPTED ACCOUNTING PRONOUNCEMENTS
In December 2021, the Financial Accounting Standards Board ("FASB") issued Accounting Standards Update ("ASU") No. 2021-08, Business Combinations (Topic 805), Accounting for Contract Assets and Contract Liabilities from Contracts with Customers ("ASU 2021-08"). ASU 2021-08 requires that an entity recognize and measure contract assets and contract liabilities acquired in a business combination in accordance with ASU 2014-09 and for the related revenue contracts in accordance with ASU 2014-09 as if it had originated the contracts. We adopted ASU 2021-08 on January 1, 2023 on a prospective basis, and there was no material impact on our consolidated financial statements.
96 | IRON MOUNTAIN 2023 FORM 10-K | |||||||
Part IV
IRON MOUNTAIN INCORPORATED
NOTES TO CONSOLIDATED FINANCIAL STATEMENTS (CONTINUED)
DECEMBER 31, 2023
(In thousands, except share and per share data)
2. SUMMARY OF SIGNIFICANT ACCOUNTING POLICIES (CONTINUED)
OTHER AS YET ADOPTED ACCOUNTING PRONOUNCEMENTS
In December 2023, the FASB issued ASU No. 2023-09, Income Taxes (Topic 740), Improvements to Income Tax Disclosures ("ASU 2023-09") to provide disaggregated income tax disclosures on the rate reconciliation and income taxes paid. Further, certain requirements related to uncertain tax positions and unrecognized deferred tax liabilities are eliminated. The amendments in this update should be applied on a prospective basis, with retrospective application permitted. ASU 2023-09 will be effective for us on January 1, 2025, with early adoption permitted. We do not expect ASU 2023-09 to have a material impact on our consolidated financial statements.
In November 2023, the FASB issued ASU No. 2023-07, Improvements to Reportable Segments Disclosures ("ASU 2023-07") to provide more detail in the disclosures for reportable segments. The main provisions of ASU 2023-07 requires (i) enhanced disclosures about significant segment expenses, (ii) extension of certain annual disclosures to interim periods and (iii) certain qualitative information on the chief operating decision maker. The amendments in this update will be effective for us on January 1, 2024, with early adoption permitted. We do not expect ASU 2023-07 to have a material impact on our consolidated financial statements.
In March 2020, the FASB issued ASU No. 2020-04, Reference Rate Reform (Topic 848) ("ASU 2020-04"). ASU 2020-04 provides optional expedients and exceptions for applying GAAP to contracts, hedging relationships, and other transactions, for a limited period of time, to ease the potential burden of recognizing the effects of reference rate reform on financial reporting. The amendments in ASU 2020-04 apply to contracts, hedging relationships and other transactions that reference the London Inter-Bank Offered Rate ("LIBOR") or another reference rate expected to be discontinued due to the global transition away from LIBOR and certain other interbank offered rates. Under ASU 2020-04, an entity could elect to apply the amendments beginning March 12, 2020 through December 31, 2022. In December 2022, the FASB issued ASU No. 2022-06, Reference Rate Reform (Topic 848), Deferral of the Sunset Date of Topic 848 ("ASU 2022-06") to defer the sunset date of Topic 848 from December 31, 2022 to December 31, 2024, after which entities will no longer be permitted to apply the relief in Topic 848. We are currently evaluating these amendments as they relate to our contracts, hedging relationships and other transactions that reference LIBOR, as well as the impact of ASU 2020-04 and ASU 2022-06 on our consolidated financial statements, but we do not expect the impact to be material.
3. ACQUISITIONS
We account for acquisitions using the acquisition method of accounting, and, accordingly, the assets and liabilities acquired are recorded at their estimated fair values and the results of operations for each acquisition have been included in our consolidated results from their respective acquisition dates.
A. ACQUISITIONS COMPLETED DURING THE YEAR ENDED DECEMBER 31, 2023
WEB WERKS
On July 7, 2023, we made our final contractual investment in the Web Werks JV (as defined in Note 5) of approximately 3,750,000 Indian rupees (or approximately $45,300 , based upon the exchange rate between the United States dollar and Indian rupee on the closing date of this investment) (the "Web Werks Transaction"). As a result of the Web Werks Transaction, our interest in the Web Werks JV increased to 63.39 %, we assumed control of its board of directors and the financial results of the Web Werks JV are now consolidated within our Global Data Center Business segment. We recognized noncontrolling interests of approximately $78,600 based upon the fair value attributable to these interests at the time of the Web Werks Transaction, of which approximately $18,100 of the noncontrolling interests were determined to be a current liability and included as a component of Accrued expenses and other current liabilities on our Consolidated Balance Sheet at December 31, 2023.
IRON MOUNTAIN 2023 FORM 10-K | 97 | |||||||
Part IV
IRON MOUNTAIN INCORPORATED
NOTES TO CONSOLIDATED FINANCIAL STATEMENTS (CONTINUED)
DECEMBER 31, 2023
(In thousands, except share and per share data)
3. ACQUISITIONS (CONTINUED)
CLUTTER
On June 29, 2023, in order to further expand our on-demand consumer storage business, we acquired 100 % of the outstanding shares of Clutter Intermediate, Inc. and control of all assets of the Clutter JV (collectively, "Clutter") for total consideration of $60,600 (the “Clutter Acquisition”). The financial results of the Clutter JV are now consolidated within our Global RIM Business segment. In October 2023, we sold 15 % of the equity interests in Clutter to certain former stakeholders of the Clutter JV for a total consideration of $7,500 , which represents the fair value attributable to these interests, which is included as a component of Redeemable Noncontrolling Interests on our Consolidated Balance Sheet at December 31, 2023.
B. ACQUISITIONS CLOSED SUBSEQUENT TO DECEMBER 31, 2023
REGENCY TECHNOLOGIES
On January 3, 2024, in order to expand our ALM business, we acquired RSR Partners, LLC (doing business as Regency Technologies), an IT asset disposition services provider with operations throughout the United States, for an initial purchase price of approximately $200,000 , with $125,000 paid at closing, funded by borrowings under the Revolving Credit Facility, and the remaining amount to be paid in 2025 (the "Regency Transaction"). The agreement for the Regency Transaction also includes potential performance-based contingent consideration, which would be payable in 2027, if earned. We will record a preliminary purchase price allocation for the assets acquired and liabilities assumed in connection with the Regency Transaction based on their estimated fair values as of the acquisition date. Given the Regency Transaction recently closed, the preliminary purchase price allocation is still in process and is incomplete as of this filing date.
C. ACQUISITIONS COMPLETED DURING THE YEAR ENDED DECEMBER 31, 2022
ITRENEW
On January 25, 2022, in order to expand our ALM operations, we acquired an approximately 80 % interest in ITRenew at an agreed upon purchase price of $725,000 , subject to certain working capital adjustments at, and subsequent to, the closing (the "ITRenew Transaction"). At closing, we paid $748,846 and acquired $30,720 of cash on hand, for a net purchase price of $718,126 for the ITRenew Transaction. The acquisition agreement provides us the option to purchase, and provides the shareholders of ITRenew the option to sell, the remaining approximately 20 % interest in ITRenew as follows: (i) approximately 16 % on or after the second anniversary of the ITRenew Transaction and (ii) approximately 4 % on or after the third anniversary of the ITRenew Transaction (collectively, the "Remaining Interests"). The total payments for the Remaining Interests, based on the achievement of certain targeted performance metrics, will be no less than $200,000 and no more than $531,000 (the "Deferred Purchase Obligation"). From January 25, 2022, we consolidate 100 % of the revenues and expenses associated with this business. The current and long-term portions of the Deferred Purchase Obligation are reflected as components of Accrued expenses and other current liabilities and Other long-term liabilities, respectively, in our Consolidated Balance Sheets at December 31, 2023 and December 31, 2022, and, accordingly, we have not reflected any non-controlling interests associated with the ITRenew Transaction as the Remaining Interests have non-substantive equity interest rights. Subsequent increases or decreases in the fair value estimate of the Deferred Purchase Obligation are included as a component of Other expense (income), net in our Consolidated Statements of Operations until the Deferred Purchase Obligation is settled or paid. See Note 2.v.
98 | IRON MOUNTAIN 2023 FORM 10-K | |||||||
Part IV
IRON MOUNTAIN INCORPORATED
NOTES TO CONSOLIDATED FINANCIAL STATEMENTS (CONTINUED)
DECEMBER 31, 2023
(In thousands, except share and per share data)
3. ACQUISITIONS (CONTINUED)
The unaudited consolidated pro forma financial information (the "Pro Forma Financial Information") below summarizes the combined results of Iron Mountain and ITRenew on a pro forma basis as if the ITRenew Transaction had occurred on January 1, 2021. The Pro Forma Financial Information is presented for informational purposes and is not necessarily indicative of the results of operations that would have been achieved if the acquisition had taken place on January 1, 2021. The Pro Forma Financial Information, for the periods presented, includes purchase accounting adjustments (including amortization of acquired customer and supplier intangible assets and depreciation of acquired property, plant and equipment) and related tax effects. Through December 31, 2022, we and ITRenew collectively incurred $59,370 of operating expenditures to complete the ITRenew Transaction (including advisory and professional fees). These operating expenditures have been reflected within the results of operations in the Pro Forma Financial Information as if they were incurred on January 1, 2021.
| YEAR ENDED DECEMBER 31, | |||||||||||
| 2022 | 2021 | ||||||||||
| Total Revenues | $ | $ | |||||||||
| Income from Continuing Operations | |||||||||||
In addition to our acquisition of ITRenew, we completed certain other acquisitions during the years ended December 31, 2023, 2022 and 2021. The Pro Forma Financial Information does not reflect these acquisitions due to the insignificant impact of these acquisitions on our consolidated results of operations.
XDATA PROPERTIES
On October 5, 2022, in order to further expand our data center operations in Europe, we completed the acquisition of XData Properties S.L.U., a data center colocation space and solutions provider with a data center in Spain, which we accounted for as an asset acquisition, for (i) cash consideration of 78,900 Euros (or approximately $78,200 , based upon the exchange rate between the Euro and the United States dollar on the closing date of this acquisition), subject to adjustments, and (ii) up to 10,000 Euros (or approximately $9,900 , based upon the exchange rate between the Euro and the United States dollar on the closing date of this acquisition) of additional consideration, payable based on the achievement of certain power connection milestones through December 2024.
D. ACQUISITIONS COMPLETED DURING THE YEAR ENDED DECEMBER 31, 2021
On September 15, 2021, in order to further expand our records management operations in the Middle East and North Africa, we acquired Information Fort, LLC, a records and information management provider, for approximately $90,300 .
On September 23, 2021, in order to further enhance our data center operations in Germany, we completed the acquisition of assets of a Frankfurt data center for approximately 77,900 Euros (or approximately $91,300 , based upon the exchange rate between the Euro and the United States dollar on the closing date of this acquisition).
In addition to the transactions noted above, during the year ended December 31, 2021, in order to enhance our existing operations in the United Kingdom and Indonesia and to expand our operations into Morocco, we completed the acquisition of two records management companies and one art storage company for total cash consideration of approximately $45,100 .
IRON MOUNTAIN 2023 FORM 10-K | 99 | |||||||
Part IV
IRON MOUNTAIN INCORPORATED
NOTES TO CONSOLIDATED FINANCIAL STATEMENTS (CONTINUED)
DECEMBER 31, 2023
(In thousands, except share and per share data)
3. ACQUISITIONS (CONTINUED)
E. PURCHASE PRICE ALLOCATION
A summary of the cumulative consideration paid and the allocation of the purchase price paid for all of our acquisitions (including asset acquisitions) in each respective year is as follows:
| 2023 | 2022 | 2021 | |||||||||||||||||||||||||||
| TOTAL | ITRENEW | OTHER FISCAL YEAR 2022 ACQUISITIONS | TOTAL | TOTAL | |||||||||||||||||||||||||
Cash Paid (gross of cash acquired)(1) | $ | $ | $ | $ | $ | ||||||||||||||||||||||||
Fair Value of Noncontrolling Interests(2) | |||||||||||||||||||||||||||||
Fair Value of Previously Held Equity Interest(2) | |||||||||||||||||||||||||||||
Deferred Purchase Obligation, Purchase Price Holdbacks and Other(3) | |||||||||||||||||||||||||||||
| Settlement of Pre-Existing Relationships | |||||||||||||||||||||||||||||
| Total Consideration | |||||||||||||||||||||||||||||
Fair Value of Identifiable Assets Acquired and Liabilities Assumed: | |||||||||||||||||||||||||||||
Cash and Cash Equivalents | |||||||||||||||||||||||||||||
Accounts Receivable, Prepaid Expenses and Other Assets | |||||||||||||||||||||||||||||
| Property, Plant and Equipment | |||||||||||||||||||||||||||||
Customer and Supplier Relationship Intangible Assets(4) | |||||||||||||||||||||||||||||
| Other Intangible Assets | |||||||||||||||||||||||||||||
| Operating Lease Right-of-Use Assets | |||||||||||||||||||||||||||||
| Debt Assumed | ( | ( | |||||||||||||||||||||||||||
| Accounts Payable, Accrued Expenses and Other Liabilities | ( | ( | ( | ( | ( | ||||||||||||||||||||||||
| Operating Lease Liabilities | ( | ( | ( | ( | ( | ||||||||||||||||||||||||
| Deferred Income Taxes | ( | ( | ( | ( | ( | ||||||||||||||||||||||||
| Total Fair Value of Identifiable Net Assets Acquired | |||||||||||||||||||||||||||||
Goodwill Initially Recorded | $ | $ | $ | $ | $ | ||||||||||||||||||||||||
(1)Cash paid for acquisitions, net of cash acquired in our Consolidated Statements of Cash Flows includes contingent and other payments of $2,930 , $581 and $0 for the years ended December 31, 2023, 2022 and 2021, respectively, related to acquisitions made in the years prior to 2023, 2022 and 2021, respectively.
(2)The fair values of the noncontrolling interests and the previously held equity interest were determined to be the respective interest’s proportionate share of the fair value of net assets acquired as of the acquisition date.
(3)In 2022, Deferred purchase obligation, purchase price holdbacks and other includes $275,100 related to the original fair value estimate of the Deferred Purchase Obligation for the Remaining Interests.
(4)The weighted average lives of customer and supplier relationship intangible assets associated with acquisitions in 2023, 2022 and 2021 were four years , 12 years and 11 years, respectively.
Allocations of the purchase price for acquisitions are based on estimates of the fair value of the net assets acquired and are subject to adjustment upon the finalization of the purchase price allocations. The accounting for business combinations requires estimates and judgments regarding expectations for future cash flows of the acquired business, and the allocations of those cash flows to identifiable tangible and intangible assets, in determining the assets acquired and liabilities assumed. The fair values assigned to tangible and intangible assets acquired and liabilities assumed, including contingent consideration, are based on management’s best estimates and assumptions, as well as other information compiled by management, including valuations that utilize customary valuation procedures and techniques. The estimates and assumptions underlying the initial valuations are subject to the collection of information necessary to complete the valuations within the measurement periods, which are up to one year from the respective acquisition dates.
100 | IRON MOUNTAIN 2023 FORM 10-K | |||||||
Part IV
IRON MOUNTAIN INCORPORATED
NOTES TO CONSOLIDATED FINANCIAL STATEMENTS (CONTINUED)
DECEMBER 31, 2023
(In thousands, except share and per share data)
3. ACQUISITIONS (CONTINUED)
4. DIVESTMENTS AND DECONSOLIDATIONS
OSG RECORDS MANAGEMENT (EUROPE) LIMITED DECONSOLIDATION
On March 24, 2022, as a result of our loss of control, we deconsolidated the businesses included in our acquisition of OSG, excluding Ukraine ("OSG Deconsolidation"). We recognized a loss of approximately $105,800 associated with the deconsolidation to Other expense (income), net in the first quarter of 2022 representing the difference between the net asset value prior to the deconsolidation and the subsequent remeasurement of the retained investment to a fair value of zero. We have concluded that the deconsolidation does not meet the criteria to be reported as discontinued operations in our consolidated financial statements, as it does not represent a strategic shift that will have a major effect on our operations and financial results.
INTELLECTUAL PROPERTY MANAGEMENT BUSINESS DIVESTMENT
On June 7, 2021, we sold our Intellectual Property Management ("IPM") business, which we predominantly operated in the United States, for total gross consideration of approximately $215,400 (the "IPM Divestment"). As a result of the IPM Divestment, we recorded a gain on sale of approximately $179,000 to Other expense (income), net during the year ended December 31, 2021, representing the excess of the fair value of the consideration received over the sum of the carrying value of the IPM business. We have concluded that the IPM Divestment does not meet the criteria to be reported as discontinued operations in our consolidated financial statements, as our decision to divest this business does not represent a strategic shift that will have a major effect on our operations and financial results.
5. INVESTMENTS
CLUTTER JOINT VENTURE
In February 2022, the joint venture formed by MakeSpace Labs, Inc. and us (the "MakeSpace JV") entered into an agreement with Clutter, Inc. pursuant to which the equityholders of the MakeSpace JV contributed their ownership interests in the MakeSpace JV, and Clutter, Inc.’s shareholders contributed their ownership interests in Clutter, Inc., to create a newly formed venture (the "Clutter JV"). In exchange for our 49.99 % interest in the MakeSpace JV, we received an approximate 27 % interest in the Clutter JV (the "Clutter Transaction"). As a result of the Clutter Transaction, we recognized a gain related to our contributed interest in the MakeSpace JV of approximately $35,800 , which was recorded to Other, net, a component of Other expense (income), net, during the year ended December 31, 2022.
On June 29, 2023, we completed the Clutter Acquisition. In connection with the Clutter Acquisition, our previously held approximately 27 % interest in the Clutter JV was remeasured to fair value at the closing date of the Clutter Acquisition. As a result, we recognized a loss of approximately $38,000 to Other, net, a component of Other expense (income), net, during the second quarter of 2023.
IRON MOUNTAIN 2023 FORM 10-K | 101 | |||||||
Part IV
IRON MOUNTAIN INCORPORATED
NOTES TO CONSOLIDATED FINANCIAL STATEMENTS (CONTINUED)
DECEMBER 31, 2022
(In thousands, except share and per share data)
5. INVESTMENTS (CONTINUED)
WEB WERKS JOINT VENTURE
In April 2021, we closed on an agreement to form a joint venture (the "Web Werks JV") with the shareholders of Web Werks India Private Limited, a colocation data center provider in India. During the years ended December 31, 2022 and 2021, we made two 7,500,000 96,200
JOINT VENTURE SUMMARY
The joint ventures referred to above are accounted for as equity method investments and are presented as a component of Other within Other assets, net in our Consolidated Balance Sheets. The carrying values and equity interests in our joint ventures at December 31, 2023 and 2022 are as follows:
| DECEMBER 31, 2023 | DECEMBER 31, 2022 | |||||||||||||||||||||||||
| CARRYING VALUE | EQUITY INTEREST | CARRYING VALUE | EQUITY INTEREST | |||||||||||||||||||||||
Web Werks JV | $ | % | $ | % | ||||||||||||||||||||||
| Joint venture with AGC Equity Partners (the "Frankfurt JV") | % | % | ||||||||||||||||||||||||
| Clutter JV | % | % | ||||||||||||||||||||||||
6. DERIVATIVE INSTRUMENTS AND HEDGING ACTIVITIES
Derivative instruments we are party to include: (i) interest rate swap agreements (which are designated as cash flow hedges) and (ii) cross-currency swap agreements (which are designated as net investment hedges).
INTEREST RATE SWAP AGREEMENTS DESIGNATED AS CASH FLOW HEDGES
We utilize interest rate swap agreements designated as cash flow hedges to limit our exposure to changes in interest rates on a portion of our floating rate indebtedness. Certain of our interest rate swap agreements have notional amounts that will increase with the underlying hedged transaction. Under our interest rate swap agreements, we receive variable rate interest payments associated with the notional amount of each interest rate swap, based upon the one-month Secured Overnight Financing Rate (“SOFR”), in exchange for the payment of fixed interest rates as specified in the interest rate swap agreements. Our interest rate swap agreements are marked to market at the end of each reporting period, representing the fair values of the interest rate swap agreements, and any changes in fair value are recognized as a component of Accumulated other comprehensive items, net. Unrealized gains are recognized as assets, while unrealized losses are recognized as liabilities.
In April 2023, in anticipation of the discontinuance of the LIBOR reference rate on June 30, 2023, we terminated interest rate swap agreements with notional amounts totaling $350,000 that were indexed to the one-month LIBOR benchmark rate. The terminated swap agreements had associated unrealized gains at the termination date of approximately $10,100 . These gains are included in Accumulated other comprehensive items, net and will be reclassified into earnings as reductions to interest expense from the termination date through March 2024, the original maturity date of these interest rate swap agreements.
As of December 31, 2023 and 2022, we have approximately $520,000 and $354,800 , respectively, in notional value outstanding on our interest rate swap agreements, with maturity dates ranging from October 2025 through February 2026.
102 | IRON MOUNTAIN 2023 FORM 10-K | |||||||
Part IV
IRON MOUNTAIN INCORPORATED
NOTES TO CONSOLIDATED FINANCIAL STATEMENTS (CONTINUED)
DECEMBER 31, 2023
(In thousands, except share and per share data)
6. DERIVATIVE INSTRUMENTS AND HEDGING ACTIVITIES (CONTINUED)
CROSS-CURRENCY SWAP AGREEMENTS DESIGNATED AS A HEDGE OF NET INVESTMENT
We utilize cross-currency interest rate swaps to hedge the variability of exchange rate impacts between the United States dollar and the Euro. As of December 31, 2023 and 2022, we have approximately $509,200 and $469,200 , respectively, in notional value outstanding on cross-currency interest rate swaps, with maturity dates ranging from August 2024 through February 2026.
We have designated these cross-currency swap agreements as hedges of net investments in certain of our Euro denominated subsidiaries and they require an exchange of the notional amounts at maturity. These cross-currency swap agreements are marked to market at the end of each reporting period, representing the fair values of the cross-currency swap agreements, and any changes in fair value are recognized as a component of Accumulated other comprehensive items, net. Unrealized gains are recognized as assets while unrealized losses are recognized as liabilities. The excluded component of our cross-currency swap agreements is recorded in Accumulated other comprehensive items, net and amortized to interest expense on a straight-line basis.
The fair value of derivative instruments recognized in our Consolidated Balance Sheets as of December 31, 2023 and 2022, by derivative instrument, are as follows:
DERIVATIVE INSTRUMENTS(1) | DECEMBER 31, 2023 | DECEMBER 31, 2022 | ||||||||||||||||||||||||
| Assets | Liabilities | Assets | Liabilities | |||||||||||||||||||||||
| Interest rate swap agreements | $ | $ | ( | $ | $ | |||||||||||||||||||||
Net Investment Hedges(3) | ||||||||||||||||||||||||||
| Cross-currency swap agreements | ( | |||||||||||||||||||||||||
(1)Our derivative assets are included as a component of (i) Prepaid expenses and other or (ii) Other within Other assets, net and our derivative liabilities are included as a component of (i) Accrued expenses and other current liabilities or (ii) Other long-term liabilities in our Consolidated Balance Sheets. As of December 31, 2023, $6,359 is included within Other assets, $2,496 is included within accrued expenses and other liabilities, and $3,273 is included within Other long-term liabilities. As of December 31, 2022, $2,606 is included within Prepaid expenses and other, $48,790 is included within Other assets and $489 is included within Other long-term liabilities.
(2)As of December 31, 2023, cumulative net gains recorded within Accumulated other comprehensive items, net associated with our interest rate swap agreements are $2,472 , which include $2,528 related to our terminated interest rate swap agreements.
(3)As of December 31, 2023, cumulative net gains recorded within Accumulated other comprehensive items, net associated with our cross-currency swap agreements are $32,459 , which include $30,197 related to the excluded component of our cross-currency swap agreements.
Unrealized (losses) gains recognized in Accumulated other comprehensive items, net during the years ending December 31, 2023, 2022 and 2021, by derivative instrument, are as follows:
| YEAR ENDED DECEMBER 31, | ||||||||||||||||||||
| DERIVATIVE INSTRUMENTS | 2023 | 2022 | 2021 | |||||||||||||||||
| Cash Flow Hedges | ||||||||||||||||||||
| Interest rate swap agreements | $ | ( | $ | $ | ||||||||||||||||
| Net Investment Hedges | ||||||||||||||||||||
| Cross-currency swap agreements | ( | |||||||||||||||||||
| Cross-currency swap agreements (excluded component) | ||||||||||||||||||||
IRON MOUNTAIN 2023 FORM 10-K | 103 | |||||||
Part IV
IRON MOUNTAIN INCORPORATED
NOTES TO CONSOLIDATED FINANCIAL STATEMENTS (CONTINUED)
DECEMBER 31, 2023
(In thousands, except share and per share data)
6. DERIVATIVE INSTRUMENTS AND HEDGING ACTIVITIES (CONTINUED)
Gains (losses) recognized in Net income during the years ending December 31, 2023, 2022 and 2021, by derivative instrument, are as follows:
| YEAR ENDED DECEMBER 31, | |||||||||||||||||||||||
| DERIVATIVE INSTRUMENTS | Location of gain (loss) | 2023 | 2022 | 2021 | |||||||||||||||||||
| Cash Flow Hedges | |||||||||||||||||||||||
| Interest rate swap agreements | Interest expense | $ | $ | $ | |||||||||||||||||||
| Net Investment Hedges | |||||||||||||||||||||||
| Cross-currency swap agreements (excluded component) | Interest expense | ( | ( | ||||||||||||||||||||
104 | IRON MOUNTAIN 2023 FORM 10-K | |||||||
Part IV
IRON MOUNTAIN INCORPORATED
NOTES TO CONSOLIDATED FINANCIAL STATEMENTS (CONTINUED)
DECEMBER 31, 2023
(In thousands, except share and per share data)
7. DEBT
Long-term debt is as follows:
| DECEMBER 31, 2023 | DECEMBER 31, 2022 | ||||||||||||||||||||||||||||||||||||||||||||||||||||
| DEBT (INCLUSIVE OF DISCOUNT) | UNAMORTIZED DEFERRED FINANCING COSTS | CARRYING AMOUNT | FAIR VALUE | DEBT (INCLUSIVE OF DISCOUNT) | UNAMORTIZED DEFERRED FINANCING COSTS | CARRYING AMOUNT | FAIR VALUE | ||||||||||||||||||||||||||||||||||||||||||||||
Revolving Credit Facility(1) | $ | $ | ( | $ | ( | $ | $ | $ | ( | $ | $ | ||||||||||||||||||||||||||||||||||||||||||
Term Loan A(1) | |||||||||||||||||||||||||||||||||||||||||||||||||||||
Term Loan B due 2026(1)(2) | ( | ( | |||||||||||||||||||||||||||||||||||||||||||||||||||
Term Loan B due 2031(1)(3) | ( | ||||||||||||||||||||||||||||||||||||||||||||||||||||
Virginia 3 Term Loans(5) | ( | ||||||||||||||||||||||||||||||||||||||||||||||||||||
Virginia 4/5 Term Loans(5) | ( | ||||||||||||||||||||||||||||||||||||||||||||||||||||
Australian Dollar Term Loan (4)(5) | ( | ( | |||||||||||||||||||||||||||||||||||||||||||||||||||
UK Bilateral Revolving Credit Facility(5) | |||||||||||||||||||||||||||||||||||||||||||||||||||||
37/8% GBP Senior Notes due 2025 (the "GBP Notes")(6)(8)(9) | ( | ( | |||||||||||||||||||||||||||||||||||||||||||||||||||
47/8% Senior Notes due 2027 (the “47/8% Notes due 2027")(6)(7)(8) | ( | ( | |||||||||||||||||||||||||||||||||||||||||||||||||||
51/4% Senior Notes due 2028 (the “51/4% Notes due 2028")(6)(7)(8) | ( | ( | |||||||||||||||||||||||||||||||||||||||||||||||||||
5% Senior Notes due 2028 (the “5% Notes due 2028")(6)(7)(8) | ( | ( | |||||||||||||||||||||||||||||||||||||||||||||||||||
7% Senior Notes due 2029 (the "7% Notes due 2029")(6)(7)(8) | ( | ||||||||||||||||||||||||||||||||||||||||||||||||||||
47/8% Senior Notes due 2029 (the “47/8% Notes due 2029")(6)(7)(8) | ( | ( | |||||||||||||||||||||||||||||||||||||||||||||||||||
51/4% Senior Notes due 2030 (the “51/4% Notes due 2030")(6)(7)(8) | ( | ( | |||||||||||||||||||||||||||||||||||||||||||||||||||
41/2% Senior Notes due 2031 (the “41/2% Notes")(6)(7)(8) | ( | ( | |||||||||||||||||||||||||||||||||||||||||||||||||||
5% Senior Notes due 2032 (the “5% Notes due 2032")(6)(8)(10) | ( | ( | |||||||||||||||||||||||||||||||||||||||||||||||||||
55/8% Senior Notes due 2032 (the “55/8% Notes")(6)(7)(8) | ( | ( | |||||||||||||||||||||||||||||||||||||||||||||||||||
Real Estate Mortgages, Financing Lease Liabilities and Other(11) | ( | ( | |||||||||||||||||||||||||||||||||||||||||||||||||||
Accounts Receivable Securitization Program(12) | ( | ( | |||||||||||||||||||||||||||||||||||||||||||||||||||
| Total Long-term Debt | ( | ( | |||||||||||||||||||||||||||||||||||||||||||||||||||
| Less Current Portion | ( | ( | ( | ( | |||||||||||||||||||||||||||||||||||||||||||||||||
| Long-term Debt, Net of Current Portion | $ | $ | ( | $ | $ | $ | ( | $ | |||||||||||||||||||||||||||||||||||||||||||||
(1)The capital stock or other equity interests of our United States subsidiaries representing the substantial majority of our United States operations, and up to 66 % of the capital stock or other equity interests of most of our first-tier foreign subsidiaries, are pledged to secure these debt instruments, together with all intercompany obligations (including promissory notes) of subsidiaries owed to us or to one of our United States subsidiary guarantors. In addition, Iron Mountain Canada Operations ULC has pledged 66 % of the capital stock of its subsidiaries, and all intercompany obligations (including promissory notes) owed to or held by it, to secure the Revolving Credit Facility. The fair value (Level 2 and Level 3 of fair value hierarchy described at Note 2.p.) of these debt instruments approximates the carrying value (as borrowings under these debt instruments are based on current variable market interest rates (plus a margin that is subject to change based on our consolidated leverage ratio), as of December 31, 2023 and 2022 (collectively, the “Credit Agreement Collateral”).
(2)The amount of debt for the Term Loan B due 2026 (as defined below) reflects an unamortized original issue discount of $452 and $677 as of December 31, 2023 and 2022, respectively.
(3)The amount of debt for the Term Loan B due 2031 (as defined below) reflects an unamortized original issue discount of $9,000 as of December 31, 2023.
(4)The amount of debt for the AUD Term Loan reflects an unamortized original issue discount of $1,452 and $1,982 as of December 31, 2023 and 2022, respectively.
IRON MOUNTAIN 2023 FORM 10-K | 105 | |||||||
Part IV
IRON MOUNTAIN INCORPORATED
NOTES TO CONSOLIDATED FINANCIAL STATEMENTS (CONTINUED)
DECEMBER 31, 2023
(In thousands, except share and per share data)
7. DEBT (CONTINUED)
(5)The fair value (Level 2 of fair value hierarchy described at Note 2.p.) of this debt instrument approximates the carrying value as borrowings under this debt instrument are based on a current variable market interest rate.
(6)The fair values (Level 2 of fair value hierarchy described at Note 2.p.) of these debt instruments are based on quoted market prices for comparable notes on December 31, 2023 and 2022, respectively.
(7)Collectively, the "Parent Notes". IMI is the direct obligor on the Parent Notes, which are fully and unconditionally guaranteed, on a senior basis, by IMI’s United States subsidiaries that represent the substantial majority of our United States operations (the "Note Guarantors"). These guarantees are joint and several obligations of the Note Guarantors. The remainder of our subsidiaries do not guarantee the Parent Notes.
(8)Collectively, the "Unregistered Notes". The Unregistered Notes have not been registered under the Securities Act of 1933, as amended (the "Securities Act"), or under the securities laws of any other jurisdiction. Unless they are registered, the Unregistered Notes may be offered only in transactions that are exempt from registration under the Securities Act or the securities laws of any other jurisdiction.
(9)Iron Mountain (UK) PLC ("IM UK") is the direct obligor on the GBP Notes, which are fully and unconditionally guaranteed, on a senior basis, by IMI and the Note Guarantors. These guarantees are joint and several obligations of IMI and the Note Guarantors. The remainder of our subsidiaries do not guarantee the GBP Notes.
(10)Iron Mountain Information Management Services, Inc. ("IMIM Services") is the direct obligor on the 5 % Notes due 2032, which are fully and unconditionally guaranteed, on a senior basis, by IMI and the Note Guarantors. These guarantees are joint and several obligations of IMI and the Note Guarantors. The remainder of our subsidiaries do not guarantee the 5 % Notes due 2032.
(11)We believe the fair value (Level 2 of fair value hierarchy described at Note 2.p.) of this debt approximates its carrying value as these borrowings are based on current market interest rates. This debt includes the following:
| DECEMBER 31, 2023 | DECEMBER 31, 2022 | ||||||||||
Real estate mortgages(1) | $ | $ | |||||||||
Financing lease liabilities(2) | |||||||||||
Other notes and other obligations(3) | |||||||||||
| $ | $ | ||||||||||
(1)Bear interest at approximately 3.6 50,000
(2)Bear a weighted average interest rate of 6.1 % and 5.2 % at December 31, 2023 and 2022.
(3)These notes and other obligations, which were assumed by us as a result of certain acquisitions bear a weighted average interest rate of 8.5 % and 10.1 % at December 31, 2023 and 2022.
(12) The Accounts Receivable Securitization Special Purpose Subsidiaries are the obligors under this program. We believe the fair value (Level 2 of fair value hierarchy described at Note 2.p.) of this debt approximates its carrying value as borrowings under this debt instrument are based on a current variable market interest rate.
A. CREDIT AGREEMENT
Our credit agreement (the "Credit Agreement") consists of a revolving credit facility (the "Revolving Credit Facility"), a term loan A facility (the "Term Loan A") and two term loan B facilities (the "Term Loan B due 2026" and the "Term Loan B due 2031").
The Revolving Credit Facility enables IMI and certain of its subsidiaries to borrow an aggregate outstanding amount not to exceed $2,250,000 in United States dollars and (subject to sublimits) Canadian dollars. Additionally, the Credit Agreement permits us to incur incremental indebtedness thereunder by adding new term loans or revolving loans or by increasing the principal amount of any existing loans thereunder. The Revolving Credit Facility and the Term Loan A are scheduled to mature on March 18, 2027, at which point all obligations become due. On March 18, 2022, we borrowed the full amount of the Term Loan A of $250,000 . The Term Loan A is to be paid in quarterly installments in an amount equal to $3,125 per quarter. Iron Mountain Information Management, LLC ("IMIM"), a wholly-owned subsidiary of IMI, is the borrower under the Term Loan B due 2026, which has a principal amount of $700,000 . The Term Loan B due 2026, which matures on January 2, 2026, was issued at 99.75 % of par. Principal payments on the Term Loan B due 2026 are to be paid in quarterly installments of $1,750 .
In December 2023, we entered into the Term Loan B due 2031 in the principal amount of $1,200,000 , of which IMIM borrowed the full amount. The Term Loan B due 2031 was issued at 99.25 % of par and matures on January 31, 2031. The aggregate net proceeds of approximately $1,181,000 , after paying commissions to the joint lead arrangers and net of the original issue discount, were used to repay outstanding borrowings under the Revolving Credit Facility. The Term Loan B due 2031 is an incremental term loan under the Credit Agreement. Beginning in the first quarter of 2024, the Term Loan B due 2031 is to be paid in quarterly installments of $3,000 .
106 | IRON MOUNTAIN 2023 FORM 10-K | |||||||
Part IV
IRON MOUNTAIN INCORPORATED
NOTES TO CONSOLIDATED FINANCIAL STATEMENTS (CONTINUED)
DECEMBER 31, 2023
(In thousands, except share and per share data)
7. DEBT (CONTINUED)
IMI and certain subsidiaries of IMI that represent the substantial majority of our operations in the United States, Canada and the United Kingdom guarantee all obligations under the Credit Agreement. The interest rate on borrowings under the Revolving Credit Facility varies depending on our choice of interest rate benchmark and currency options, plus an applicable margin, which varies based on our consolidated leverage ratio. The Term Loan A bears interest at the SOFR plus a credit spread adjustment of 0.1 % plus 1.75 %. Due to the discontinuance of the LIBOR reference rate on June 30, 2023, we transitioned the Term Loan B due 2026 from an interest rate of LIBOR plus 1.75 % to a synthetic LIBOR rate plus 1.75 %, effective July 1, 2023. The Term Loan B due 2031 bears interest at the SOFR plus 2.25 %. Additionally, the Credit Agreement requires the payment of a commitment fee on the unused portion of the Revolving Credit Facility, which fee ranges from 0.2 % to 0.3 % based on our consolidated leverage ratio.
As of December 31, 2023, we had no outstanding borrowings under the Revolving Credit Facility and $228,125 , $659,750 and $1,200,000 outstanding under the Term Loan A, the Term Loan B due 2026 and the Term Loan B due 2031, respectively. As of December 31, 2023, we had various outstanding letters of credit totaling $4,821 under the Revolving Credit Facility. The remaining amount available for borrowing under the Revolving Credit Facility as of December 31, 2023, which is based on IMI’s leverage ratio, the last 12 months' earnings before interest, taxes, depreciation and amortization and rent expense ("EBITDAR"), other adjustments as defined in the Credit Agreement and current external debt, was $2,245,179 (which amount represents the maximum availability as of such date). Available borrowings under the Revolving Credit Facility are subject to compliance with our indenture covenants as discussed below. The interest rate in effect under the Term Loan A as of December 31, 2023 and 2022 was 7.2 % and 6.2 %, respectively. The interest rate in effect under the Term Loan B due 2026 as of December 31, 2023 and 2022 was 5.2 % and 4.8 %, respectively. The interest rate in effect under the Term Loan B due 2031 as of December 31, 2023 was 7.6 %
REVOLVING CREDIT FACILITY $ | TERM LOAN A $ | TERM LOAN B DUE 2026 $ | TERM LOAN B DUE 2031 $ | ||||||||||||||||||||||||||
Outstanding borrowings $ | Aggregate outstanding principal amount $ | Aggregate outstanding principal amount $ | Aggregate outstanding principal amount $ | ||||||||||||||||||||||||||
| As of December 31, 2023 | Interest rate | Interest rate | Interest rate | ||||||||||||||||||||||||||
| As of December 31, 2023 | As of December 31, 2023 | As of December 31, 2023 | |||||||||||||||||||||||||||
B. VIRGINIA CREDIT AGREEMENTS
VIRGINIA 3 CREDIT AGREEMENT
On August 31, 2023, Iron Mountain Data Centers Virginia 3, LLC, a wholly-owned subsidiary of IMI, entered into a credit agreement (the "Virginia 3 Credit Agreement") in order to partially finance the construction of a data center facility in Virginia. The Virginia 3 Credit Agreement consists of a term loan facility and a letter of credit facility. We have the option to borrow, in the form of term loans, an aggregate outstanding amount not to exceed $ | MAXIMUM AMOUNT $ OUTSTANDING BORROWINGS $ Interest rate As of December 31, 2023 | ||||||||||||||||
IRON MOUNTAIN 2023 FORM 10-K | 107 | |||||||
Part IV
IRON MOUNTAIN INCORPORATED
NOTES TO CONSOLIDATED FINANCIAL STATEMENTS (CONTINUED)
DECEMBER 31, 2023
(In thousands, except share and per share data)
7. DEBT (CONTINUED)
VIRGINIA 4/5 CREDIT AGREEMENT
On October 31, 2022, Iron Mountain Data Centers Virginia 4/5 Subsidiary, LLC, a wholly-owned subsidiary of Iron Mountain Data Centers Virginia 4/5 JV, LP, entered into a credit agreement (the "Virginia 4/5 Credit Agreement") in order to finance the construction of | MAXIMUM AMOUNT $ OUTSTANDING BORROWINGS $ Interest rate As of December 31, 2023 | ||||||||||||||||
C. NOTES ISSUED UNDER INDENTURES
Each series of notes shown below (i) is effectively subordinated to all of our secured indebtedness, including under the Credit Agreement, to the extent of the value of the collateral securing such indebtedness, (ii) ranks pari passu in right of payment with each other and with debt outstanding under the Credit Agreement, the senior notes shown below and other "senior debt" we incur from time to time and (iii) is structurally subordinated to all liabilities of our subsidiaries that do not guarantee such series of notes.
The key terms of our indentures are as follows:
| SENIOR NOTES | AGGREGATE PRINCIPAL AMOUNT | DIRECT OBLIGOR | MATURITY DATE | CONTRACTUAL INTEREST RATE | INTEREST PAYMENTS DUE | PAR CALL DATE(1) | ||||||||||||||||||||||||||||||||
| GBP Notes | £ | IM UK | November 15, 2025 | 37/8% | May 15 and November 15 | November 15, 2022 | ||||||||||||||||||||||||||||||||
47/8% Notes due 2027 | $ | IMI | September 15, 2027 | 47/8% | March 15 and September 15 | September 15, 2025 | ||||||||||||||||||||||||||||||||
51/4% Notes due 2028 | $ | IMI | March 15, 2028 | 51/4% | March 15 and September 15 | March 15, 2025 | ||||||||||||||||||||||||||||||||
| 5% Notes due 2028 | $ | IMI | July 15, 2028 | 5% | January 15 and July 15 | July 15, 2025 | ||||||||||||||||||||||||||||||||
| 7% Notes due 2029 | $ | IMI | February 15, 2029 | 7% | February 15 and August 15 | August 15, 2025 | ||||||||||||||||||||||||||||||||
47/8% Notes due 2029 | $ | IMI | September 15, 2029 | 47/8% | March 15 and September 15 | September 15, 2027 | ||||||||||||||||||||||||||||||||
51/4% Notes due 2030 | $ | IMI | July 15, 2030 | 51/4% | January 15 and July 15 | July 15, 2028 | ||||||||||||||||||||||||||||||||
41/2% Notes | $ | IMI | February 15, 2031 | 41/2% | February 15 and August 15 | February 15, 2029 | ||||||||||||||||||||||||||||||||
| 5% Notes due 2032 | $ | IMIM Services | July 15, 2032 | 5% | May 15 and November 15 | July 15, 2027 | ||||||||||||||||||||||||||||||||
55/8% Notes | $ | IMI | July 15, 2032 | 55/8% | January 15 and July 15 | July 15, 2029 | ||||||||||||||||||||||||||||||||
(1)We may redeem the notes at any time, at our option, in whole or in part. Prior to the par call date, we may redeem the notes at the redemption price or make-whole premium specified in the applicable indenture, together with accrued and unpaid interest to, but excluding, the redemption date. On or after the par call date, we may redeem the notes at a price equal to 100 % of the principal amount being redeemed, together with accrued and unpaid interest to, but excluding, the redemption date.
Each of the indentures for the notes provides that we must repurchase, at the option of the holders, the notes at 101 % of their principal amount, plus accrued and unpaid interest, upon the occurrence of a "Change of Control", which is defined in each respective indenture. Except for required repurchases upon the occurrence of a Change of Control or in the event of certain asset sales, each as described in the respective indenture, we are not required to make sinking fund or redemption payments with respect to any of the notes.
108 | IRON MOUNTAIN 2023 FORM 10-K | |||||||
Part IV
IRON MOUNTAIN INCORPORATED
NOTES TO CONSOLIDATED FINANCIAL STATEMENTS (CONTINUED)
DECEMBER 31, 2023
(In thousands, except share and per share data)
7. DEBT (CONTINUED)
MAY 2023 OFFERING
On May 15, 2023, IMI completed a private offering of:
| SERIES OF NOTES | AGGREGATE PRINCIPAL AMOUNT | ||||
| $ | |||||
The 7 % Notes due 2029 were issued at 100 % of par. The total net proceeds of approximately $990,000 from the issuance of the 7 % Notes due 2029, after deducting the initial purchasers' commissions, were used to repay outstanding borrowings under the Revolving Credit Facility.
D. AUSTRALIAN DOLLAR TERM LOAN
Iron Mountain Australia Group Pty, Ltd., a wholly-owned subsidiary of IMI, has an AUD term loan with an original principal balance of 350,000 Australian dollars ("AUD Term Loan"). All indebtedness associated with the AUD Term Loan was issued at 99 % of par. Principal payments on the AUD Term Loan are to be paid in quarterly installments in an aggregate amount of 7,695 Australian dollars per year. The AUD Term Loan bears interest at BBSY (an Australian benchmark variable interest rate) plus 3.625 %. The AUD Term Loan is guaranteed by Iron Mountain Australia Group Pty, Ltd. and certain other Australian subsidiaries (the "Australia Group Guarantors") and by the guarantors of the Credit Agreement. The AUD Term Loan is secured by the capital stock and assets of the Australia Group Guarantors and by the Credit Agreement Collateral. The AUD Term Loan is scheduled to mature on September 30, 2026, at which point all obligations become due.
As of December 31, 2023, we had | OUTSTANDING BORROWINGS AU$ | ||||||||||||||||
Interest rate | |||||||||||||||||
| As of December 31, 2023 | |||||||||||||||||
E. UK BILATERAL REVOLVING CREDIT FACILITY
IM UK and Iron Mountain (UK) Data Centre Limited, wholly owned subsidiaries of IMI (collectively, the "UK Borrowers"), have a British pounds sterling Revolving Credit Facility (the "UK Bilateral Revolving Credit Facility"). The maximum amount permitted to be borrowed under the UK Bilateral Revolving Credit Facility is On September 19, 2023, the UK Borrowers amended the UK Bilateral Revolving Credit Facility to extend the maturity date from September 24, 2024 to September 24, 2025. The UK Bilateral Revolving Credit Facility was fully drawn as of December 31, 2023. The interest rate in effect under the UK Bilateral Revolving Credit Facility was | MAXIMUM AMOUNT £ OPTIONAL ADDITIONAL COMMITMENTS £ Interest rate As of December 31, 2023 | ||||||||||||||||
IRON MOUNTAIN 2023 FORM 10-K | 109 | |||||||
Part IV
IRON MOUNTAIN INCORPORATED
NOTES TO CONSOLIDATED FINANCIAL STATEMENTS (CONTINUED)
DECEMBER 31, 2023
(In thousands, except share and per share data)
7. DEBT (CONTINUED)
F. ACCOUNTS RECEIVABLE SECURITIZATION PROGRAM
We participate in an accounts receivable securitization program (the "Accounts Receivable Securitization Program") involving several of our wholly-owned subsidiaries and certain financial institutions. Under the Accounts Receivable Securitization Program, certain of our subsidiaries sell substantially all of their United States accounts receivable balances to our wholly-owned special purpose entities, Iron Mountain Receivables QRS, LLC and Iron Mountain Receivables TRS, LLC (the "Accounts Receivable Securitization Special Purpose Subsidiaries"). The Accounts Receivable Securitization Special Purpose Subsidiaries use the accounts receivable balances to collateralize loans obtained from certain financial institutions. The Accounts Receivable Securitization Special Purpose Subsidiaries are consolidated subsidiaries of IMI. The Accounts Receivable Securitization Program is accounted for as a collateralized financing activity, rather than a sale of assets, and therefore: (i) accounts receivable balances pledged as collateral are presented as assets and borrowings are presented as liabilities on our Consolidated Balance Sheets, (ii) our Consolidated Statements of Operations reflect the associated charges for bad debt expense related to pledged accounts receivable (a component of selling, general and administrative expenses) and reductions to revenue due to billing and service related credit memos issued to customers and related reserves, as well as interest expense associated with the collateralized borrowings and (iii) receipts from customers related to the underlying accounts receivable are reflected as operating cash flows and borrowings and repayments under the collateralized loans are reflected as financing cash flows within our Consolidated Statements of Cash Flows. IMIM retains the responsibility of servicing the accounts receivable balances pledged as collateral for the Accounts Receivable Securitization Program and IMI provides a performance guaranty. The maximum availability allowed is limited by eligible accounts receivable, as defined under the terms of the Accounts Receivable Securitization Program. The Accounts Receivable Securitization Program is secured by a substantial majority of our net receivables in the United States.
On June 8, 2023, we amended the Accounts Receivable Securitization Program to increase the maximum borrowing capacity from $ | MAXIMUM AMOUNT $ | ||||||||||
OUTSTANDING BORROWINGS $ Interest rate As of December 31, 2023 | |||||||||||
G. CASH POOLING
Certain of our subsidiaries participate in cash pooling arrangements (the "Cash Pools") to help manage global liquidity requirements. We utilize the following Cash Pools: (i) two Cash Pools with Bank Mendes Gans, an independently operated wholly-owned subsidiary of ING Group, one two Cash Pools with JP Morgan Chase Bank, N.A. ("JPM"), one two Cash Pools with JPM, one
Under each of the Cash Pools, cash deposited by participating subsidiaries with certain financial institutions is pledged as security against the debit balances of other participating subsidiaries with legal rights of offset provided to the financial institutions. Therefore, such amounts are presented in our Consolidated Balance Sheets on a net basis. Each subsidiary receives interest on the cash balances held on deposit or pays interest on its debit balances based on an applicable rate as defined in the Cash Pools.
The net cash position balances as of December 31, 2023 and 2022 are reflected as Cash and cash equivalents in our Consolidated Balance Sheets.
110 | IRON MOUNTAIN 2023 FORM 10-K | |||||||
Part IV
IRON MOUNTAIN INCORPORATED
NOTES TO CONSOLIDATED FINANCIAL STATEMENTS (CONTINUED)
DECEMBER 31, 2023
(In thousands, except share and per share data)
7. DEBT (CONTINUED)
H. LETTERS OF CREDIT
As of December 31, 2023, we had outstanding letters of credit totaling $38,791 , of which $4,821 reduce our borrowing capacity under the Revolving Credit Facility (as described above). The letters of credit expire at various dates between January 2024 and March 2025.
I. DEBT COVENANTS
The Credit Agreement, our bond indentures and other agreements governing our indebtedness contain certain restrictive financial and operating covenants, including covenants that restrict our ability to complete acquisitions, pay cash dividends, incur indebtedness, make investments, sell assets and take other specified corporate actions. The covenants do not contain a rating trigger. Therefore, a change in our debt rating would not trigger a default under the Credit Agreement, our bond indentures or other agreements governing our indebtedness. The Credit Agreement requires that we satisfy a net total lease adjusted leverage ratio and a fixed charge coverage ratio on a quarterly basis, and our bond indentures require that, among other things, we satisfy a leverage ratio (not lease adjusted) or a fixed charge coverage ratio (not lease adjusted), as a condition to taking actions such as paying dividends and incurring indebtedness.
The Credit Agreement uses EBITDAR-based calculations and the bond indentures use EBITDA-based calculations as the primary measures of financial performance for purposes of calculating leverage and fixed charge coverage ratios. The EBITDAR- and EBITDA-based leverage calculations include our consolidated subsidiaries, other than those we have designated as "Unrestricted Subsidiaries" as defined in the Credit Agreement and bond indentures. Generally, the Credit Agreement and the bond indentures use a trailing four fiscal quarter basis for purposes of the relevant calculations and require certain adjustments and exclusions for purposes of those calculations, which make the calculation of financial performance for purposes of those calculations under the Credit Agreement and bond indentures not directly comparable to Adjusted EBITDA as presented herein. We are in compliance with our leverage and fixed charge coverage ratios under the Credit Agreement, our bond indentures and other agreements governing our indebtedness as of December 31, 2023. Noncompliance with these leverage and fixed charge coverage ratios would have a material adverse effect on our financial condition and liquidity.
J. MATURITIES OF LONG-TERM DEBT (GROSS OF DISCOUNTS) ARE AS FOLLOWS:
| YEAR | AMOUNT | |||||||
| 2024 | $ | |||||||
| 2025 | ||||||||
| 2026 | ||||||||
| 2027 | ||||||||
| 2028 | ||||||||
| Thereafter | ||||||||
| Net Discounts | ( | |||||||
| Net Deferred Financing Costs | ( | |||||||
| Total Long-term Debt (including current portion) | $ | |||||||
IRON MOUNTAIN 2023 FORM 10-K | 111 | |||||||
Part IV
IRON MOUNTAIN INCORPORATED
NOTES TO CONSOLIDATED FINANCIAL STATEMENTS (CONTINUED)
DECEMBER 31, 2023
(In thousands, except share and per share data)
8. COMMITMENTS AND CONTINGENCIES
A. PURCHASE COMMITMENTS
We have certain contractual obligations related to purchase commitments which require minimum payments as follows:
| YEAR | PURCHASE COMMITMENTS(1) | |||||||
| 2024 | $ | |||||||
| 2025 | ||||||||
| 2026 | ||||||||
| 2027 | ||||||||
| 2028 | ||||||||
| Thereafter | ||||||||
| $ | ||||||||
(1)Purchase commitments (i) include obligations related principally to software maintenance and support services and (ii) exclude our operating and financing lease obligations (see Note 2.j.) and our deferred purchase obligations (see Note 2.p.).
In addition to the above, as of December 31, 2023, we have contractual commitments of approximately $740,000 for future construction costs associated with the expansion of our Global Data Center Business that are expected to be incurred over the next to two years .
B. SELF-INSURED LIABILITIES
We are self-insured up to certain limits for costs associated with workers’ compensation claims, vehicle accidents, property and general business liabilities and benefits paid under employee healthcare and short-term disability programs. At December 31, 2023 and 2022, there were $42,495 and $46,663 , respectively, of self-insurance accruals reflected in Accrued expenses on our Consolidated Balance Sheets. The measurement of these costs requires the consideration of historical cost experience and judgments about the present and expected levels of cost per claim. We account for these costs primarily through actuarial methods, which develop estimates of the undiscounted liability for claims incurred, including those claims incurred but not reported. These methods provide estimates of future claim costs based on claims incurred as of the balance sheet date.
C. LITIGATION—GENERAL
112 | IRON MOUNTAIN 2023 FORM 10-K | |||||||
Part IV
IRON MOUNTAIN INCORPORATED
NOTES TO CONSOLIDATED FINANCIAL STATEMENTS (CONTINUED)
DECEMBER 31, 2023
(In thousands, except share and per share data)
9. STOCKHOLDERS' EQUITY MATTERS
Our board of directors has adopted a dividend policy under which we have paid, and in the future intend to pay, quarterly cash dividends on our common stock. The amount and timing of future dividends will continue to be subject to the approval of our board of directors, in its sole discretion, and to applicable legal requirements.
In 2021, 2022 and 2023, our board of directors declared the following dividends:
| DECLARATION DATE | DIVIDEND PER SHARE | RECORD DATE | TOTAL AMOUNT | PAYMENT DATE | ||||||||||||||||||||||
| February 24, 2021 | $ | March 15, 2021 | $ | April 6, 2021 | ||||||||||||||||||||||
| May 6, 2021 | June 15, 2021 | July 6, 2021 | ||||||||||||||||||||||||
| August 5, 2021 | September 15, 2021 | October 6, 2021 | ||||||||||||||||||||||||
| November 4, 2021 | December 15, 2021 | January 6, 2022 | ||||||||||||||||||||||||
| February 24, 2022 | March 15, 2022 | April 6, 2022 | ||||||||||||||||||||||||
| April 28, 2022 | June 15, 2022 | July 6, 2022 | ||||||||||||||||||||||||
| August 4, 2022 | September 15, 2022 | October 4, 2022 | ||||||||||||||||||||||||
| November 3, 2022 | December 15, 2022 | January 5, 2023 | ||||||||||||||||||||||||
| February 23, 2023 | March 15, 2023 | April 5, 2023 | ||||||||||||||||||||||||
| May 4, 2023 | June 15, 2023 | July 6, 2023 | ||||||||||||||||||||||||
| August 3, 2023 | September 15, 2023 | October 5, 2023 | ||||||||||||||||||||||||
| November 2, 2023 | December 15, 2023 | January 4, 2024 | ||||||||||||||||||||||||
On February 22, 2024, we declared a dividend to our stockholders of record as of March 15, 2024 of $0.65 per share, payable on April 4, 2024.
During the years ended December 31, 2023, 2022 and 2021, we declared dividends in an aggregate and per share amount, based on the weighted average number of common shares outstanding during each respective year, as follows:
| YEAR ENDED DECEMBER 31, | |||||||||||||||||
| 2023 | 2022 | 2021 | |||||||||||||||
| Declared distributions | $ | $ | $ | ||||||||||||||
| Amount per share each distribution represents based on weighted average number of common shares outstanding | |||||||||||||||||
IRON MOUNTAIN 2023 FORM 10-K | 113 | |||||||
Part IV
IRON MOUNTAIN INCORPORATED
NOTES TO CONSOLIDATED FINANCIAL STATEMENTS (CONTINUED)
DECEMBER 31, 2023
(In thousands, except share and per share data)
9. STOCKHOLDERS’ EQUITY MATTERS (CONTINUED)
For federal income tax purposes, distributions to our stockholders are generally treated as nonqualified ordinary dividends (potentially eligible for the lower effective tax rates available for "qualified REIT dividends"), qualified ordinary dividends or return of capital. The United States Internal Revenue Service requires historical C corporation earnings and profits to be distributed prior to any REIT distributions, which may affect the character of each distribution to our stockholders, including whether and to what extent each distribution is characterized as a qualified or nonqualified ordinary dividend. In addition, certain of our distributions qualify as capital gain distributions. For the years ended December 31, 2023, 2022 and 2021, the dividends we paid on our common shares were classified as follows:
| YEAR ENDED DECEMBER 31, | |||||||||||||||||
| 2023 | 2022 | 2021 | |||||||||||||||
| Nonqualified ordinary dividends | % | % | % | ||||||||||||||
Qualified ordinary dividends(1) | % | % | % | ||||||||||||||
Capital gains(2)(3) | % | % | % | ||||||||||||||
| Return of capital | % | % | % | ||||||||||||||
| % | % | % | |||||||||||||||
(1)Dividends paid during the years ended December 31, 2023 and 2021 which were classified as qualified ordinary dividends for federal income tax purposes primarily related to the distribution of historical C corporation earnings and profits during the years ended December 31, 2023 and 2021. None of the dividends paid during the year ended December 31, 2022 were classified as qualified ordinary dividends for federal income tax purposes.
(2)During the year ended December 31, 2022, the percentage of our dividends that was classified as a capital gain was primarily related to the sale of land and buildings in the United States and Canada.
10. INCOME TAXES
We have been organized and have operated as a REIT effective beginning with our taxable year that ended on December 31, 2014. As a REIT, we are generally permitted to deduct from our federal taxable income the dividends we pay to our stockholders. The income represented by such dividends is not subject to federal taxation at the entity level but is taxed, if at all, at the stockholder level. The income of our domestic TRSs, which hold our domestic operations that may not be REIT-compliant as currently operated and structured, is subject, as applicable, to federal and state corporate income tax. In addition, we and our subsidiaries continue to be subject to foreign income taxes in other jurisdictions in which we have business operations or a taxable presence, regardless of whether assets are held or operations are conducted through subsidiaries disregarded for federal income tax purposes or TRSs. We will also be subject to a separate corporate income tax on any gains recognized on the sale or disposition of any asset previously owned by a C corporation during a five-year period after the date we first owned the asset as a REIT asset that are attributable to "built-in gains" with respect to that asset on that date. We will also be subject to a built-in gains tax on our depreciation recapture recognized into income as a result of accounting method changes in connection with our acquisition activities. If we fail to remain qualified for taxation as a REIT, we will be subject to federal income tax at regular corporate income tax rates. Even if we remain qualified for taxation as a REIT, we may be subject to some federal, state, local and foreign taxes on our income and property in addition to taxes owed with respect to our TRS operations. In particular, while state income tax regimes often parallel the federal income tax regime for REITs, many states do not completely follow federal rules and some do not follow them at all.
114 | IRON MOUNTAIN 2023 FORM 10-K | |||||||
Part IV
IRON MOUNTAIN INCORPORATED
NOTES TO CONSOLIDATED FINANCIAL STATEMENTS (CONTINUED)
DECEMBER 31, 2023
(In thousands, except share and per share data)
10. INCOME TAXES (CONTINUED)
The significant components of our deferred tax assets and deferred tax liabilities as of December 31, 2023 and 2022 are presented below:
| DECEMBER 31, | |||||||||||
2023(1) | 2022 | ||||||||||
| Deferred Tax Assets: | |||||||||||
| Accrued liabilities and other adjustments | $ | $ | |||||||||
| Net operating loss carryforwards | |||||||||||
| Valuation allowance | ( | ( | |||||||||
| Deferred Tax Liabilities: | |||||||||||
| Other assets, principally due to differences in amortization | ( | ( | |||||||||
| Plant and equipment, principally due to differences in depreciation | ( | ( | |||||||||
| Other | ( | ( | |||||||||
| ( | ( | ||||||||||
| Net deferred tax liability | $ | ( | $ | ( | |||||||
(1)Prior to 2023, certain of our non-United States tax loss carryforwards were determined to have a remote possibility of realization and therefore were not reported in the table above. In connection with the implementation of the OECD (as defined below) global minimum tax initiative known as Pillar Two (as defined below), any existing deferred taxes not disclosed in our 2023 financial statements will not be available in the future to reduce tax otherwise due under Pillar Two. Accordingly, beginning in 2023, we are disclosing in the above table the tax effects of these non-United States tax loss carryforwards offset with a full valuation allowance.
The deferred tax assets and deferred tax liabilities as of December 31, 2023 and 2022 are presented below:
| DECEMBER 31, | |||||||||||
| 2023 | 2022 | ||||||||||
| Noncurrent deferred tax assets (Included in Other, a component of Other assets, net) | $ | $ | |||||||||
| Deferred income taxes | ( | ( | |||||||||
At December 31, 2023, we have federal net operating loss carryforwards of $109,624 , which can be carried forward indefinitely, of which $88,728 is expected to be realized to reduce future federal taxable income. We have assets for foreign net operating losses of $133,536 , with various expiration dates (and in some cases no expiration date), subject to a valuation allowance of approximately 73.8 %. If actual results differ unfavorably from certain of our estimates used, we may not be able to realize all or part of our net deferred income tax assets and additional valuation allowances may be required. Although we believe our estimates are reasonable, no assurance can be given that our estimates reflected in the tax provisions and accruals will equal our actual results. These differences could have a material impact on our income tax provision and operating results in the period in which such determination is made.
IRON MOUNTAIN 2023 FORM 10-K | 115 | |||||||
Part IV
IRON MOUNTAIN INCORPORATED
NOTES TO CONSOLIDATED FINANCIAL STATEMENTS (CONTINUED)
DECEMBER 31, 2023
(In thousands, except share and per share data)
10. INCOME TAXES (CONTINUED)
A rollforward of the valuation allowance is as follows:
| YEAR ENDED DECEMBER 31, | BALANCE AT BEGINNING OF THE YEAR | CHARGED (CREDITED) TO EXPENSE(2) | OTHER INCREASES/(DECREASES)(1)(2) | BALANCE AT END OF THE YEAR | ||||||||||||||||||||||
| 2023 | $ | $ | $ | $ | ||||||||||||||||||||||
| 2022 | ( | ( | ||||||||||||||||||||||||
| 2021 | ( | |||||||||||||||||||||||||
(1)Other decreases and increases in valuation allowances are primarily related to changes in foreign currency exchange rates.
(2)Prior to 2023, certain of our non-United States tax loss carryforwards were determined to have a remote possibility of realization and therefore were not reported in the table above. In connection with the implementation of the OECD global minimum tax initiative known as Pillar Two, any existing deferred taxes not disclosed in our 2023 financial statements will not be available in the future to reduce tax otherwise due under Pillar Two. Accordingly, beginning in 2023, we are disclosing in the above table the tax effects of these non-United States tax loss carryforwards offset with a full valuation allowance.
The components of net income (loss) before provision (benefit) for income taxes for the years ended December 31, 2023, 2022 and 2021 are as follows:
| YEAR ENDED DECEMBER 31, | |||||||||||||||||
| 2023 | 2022 | 2021 | |||||||||||||||
| United States | $ | $ | $ | ||||||||||||||
| Canada | |||||||||||||||||
| Other Foreign | |||||||||||||||||
| Net income (loss) before provision (benefit) for income taxes | $ | $ | $ | ||||||||||||||
The provision (benefit) for income taxes for the years ended December 31, 2023, 2022 and 2021 consist of the following components:
| YEAR ENDED DECEMBER 31, | |||||||||||||||||
| 2023 | 2022 | 2021 | |||||||||||||||
| Federal—current | $ | $ | $ | ||||||||||||||
| Federal—deferred | ( | ( | |||||||||||||||
| State—current | |||||||||||||||||
| State—deferred | ( | ( | ( | ||||||||||||||
| Foreign—current | |||||||||||||||||
| Foreign—deferred | ( | ( | |||||||||||||||
| Provision (Benefit) for Income Taxes | $ | $ | $ | ||||||||||||||
116 | IRON MOUNTAIN 2023 FORM 10-K | |||||||
Part IV
IRON MOUNTAIN INCORPORATED
NOTES TO CONSOLIDATED FINANCIAL STATEMENTS (CONTINUED)
DECEMBER 31, 2023
(In thousands, except share and per share data)
10. INCOME TAXES (CONTINUED)
A reconciliation of total income tax expense and the amount computed by applying the current federal statutory tax rate of 21.0
| YEAR ENDED DECEMBER 31, | |||||||||||||||||
| 2023 | 2022 | 2021 | |||||||||||||||
Computed "expected" tax provision | $ | $ | $ | ||||||||||||||
| Changes in income taxes resulting from: | |||||||||||||||||
| Tax adjustment relating to REIT | ( | ( | ( | ||||||||||||||
| State taxes, net of federal tax benefit | ( | ||||||||||||||||
| Increase (decrease) in valuation allowance (net of operating losses) | ( | ||||||||||||||||
| Withholding taxes | |||||||||||||||||
| (Reversal) reserve accrual and audit settlements, net of federal tax benefit | ( | ||||||||||||||||
| Change in valuation of acquisition contingencies | ( | ||||||||||||||||
| Foreign tax rate differential | |||||||||||||||||
| Disallowed foreign interest, Subpart F income, and other foreign taxes | ( | ||||||||||||||||
| Other, net | |||||||||||||||||
| Provision (Benefit) for Income Taxes | $ | $ | $ | ||||||||||||||
Our effective tax rates for the years ended December 31, 2023, 2022 and 2021 were 17.6 %, 11.0 % and 28.0 %, respectively. Our effective tax rate is subject to variability in the future due to, among other items: (i) changes in the mix of income between our QRSs and our TRSs, as well as among the jurisdictions in which we operate, (ii) tax law changes, (iii) volatility in foreign exchange gains and losses, (iv) the timing of the establishment and reversal of tax reserves, (v) our ability to utilize net operating losses that we generate and (vi) the taxability or deductibility of significant transactions.
The primary reconciling items between the federal statutory tax rate of 21.0 % and our overall effective tax rate were:
| YEAR ENDED DECEMBER 31, | ||||||||
| 2023 | 2022 | 2021 | ||||||
The benefits derived from the dividends paid deduction of $ | The benefits derived from the dividends paid deduction of $ | The benefits derived from the dividends paid deduction of $ | ||||||
As a REIT, we are entitled to a deduction for dividends paid, resulting in a substantial reduction of federal income tax expense. As a REIT, substantially all of our income tax expense will be incurred based on the earnings generated by our foreign subsidiaries and our domestic TRSs.
IRON MOUNTAIN 2023 FORM 10-K | 117 | |||||||
Part IV
IRON MOUNTAIN INCORPORATED
NOTES TO CONSOLIDATED FINANCIAL STATEMENTS (CONTINUED)
DECEMBER 31, 2023
(In thousands, except share and per share data)
10. INCOME TAXES (CONTINUED)
During 2021, as a result of the enactment of a tax law and the closing of various acquisitions, we concluded that it is no longer our intention to reinvest our undistributed earnings of our foreign TRSs indefinitely outside the United States. As a REIT, future repatriation of incremental undistributed earnings of our foreign subsidiaries will not be subject to federal or state income tax, with the exception of foreign withholding taxes. However, such future repatriations may require distributions to our stockholders in accordance with REIT distribution rules, and any such distribution may then be taxable, as appropriate, at the stockholder level. We expect to provide for foreign withholding taxes on the current and future earnings of all of our foreign subsidiaries as the result of such reassessment.
The Organization for Economic Co-operation and Development (the "OECD"), an international association comprised of 38 countries, including the United States, has issued proposals that change long-standing tax principles, including on a global minimum tax initiative. In December 2022, the European Union member states agreed to implement the OECD’s Base Erosion and Profit Shifting 2.0 Pillar Two global corporate minimum tax rate of 15% ("Pillar Two"). The agreement affirms that all member states must adopt the directive by December 31, 2023. The rules will therefore be first applicable for periods beginning after December 31, 2023. While the United States has not yet adopted the Pillar Two rules, various other governments around the world are enacting legislation. Considering we do not have material operations in jurisdictions with tax rates lower than the Pillar Two minimum, these rules are not expected to materially impact our effective tax rate, corporate tax liabilities or cash tax liabilities. There remains uncertainty as to the final Pillar Two model rules. We will continue to monitor United States and global legislative action related to Pillar Two for potential impacts.
The evaluation of an uncertain tax position is a two-step process. The first step is a recognition process whereby we determine whether it is more likely than not that a tax position will be sustained upon examination, including resolution of any related appeals or litigation processes, based on the technical merits of the position. The second step is a measurement process whereby a tax position that meets the more likely than not recognition threshold is calculated to determine the amount of benefit to recognize in the financial statements. The tax position is measured as the largest amount of benefit that is greater than 50% likely of being realized upon ultimate settlement.
A summary of tax years that remain subject to examination by major tax jurisdictions is as follows:
| TAX YEARS | TAX JURISDICTION | |||||||
| See Below | United States—Federal and State | |||||||
| 2020 to present | United Kingdom | |||||||
| 2016 to present | Canada | |||||||
The normal statute of limitations for United States federal tax purposes is three years from the date the tax return is filed; however, the statute of limitations may remain open for periods longer than three years in instances where a federal tax examination is in progress. The 2022, 2021 and 2020 tax years remain subject to examination for United States federal tax purposes as well as net operating loss carryforwards utilized in these years. The normal statute of limitations for state purposes is between three to five years. However, certain of our state statute of limitations remain open for periods longer than this when audits are in progress.
We are subject to income taxes in the United States and numerous foreign jurisdictions. We are subject to examination by various tax authorities in jurisdictions in which we have business operations or a taxable presence. We regularly assess the likelihood of additional assessments by tax authorities and provide for these matters as appropriate. As of December 31, 2023, we had $23,570 of reserves related to uncertain tax positions, of which $20,488 and $3,082 is included in other long-term liabilities and deferred income taxes, respectively, in the accompanying Consolidated Balance Sheet. As of December 31, 2022, we had $27,753 of reserves related to uncertain tax positions, of which $24,671 and $3,082 is included in other long-term liabilities and deferred income taxes, respectively, in the accompanying Consolidated Balance Sheet. Although we believe our tax estimates are appropriate, the final determination of tax audits and any related litigation could result in changes to our estimates.
118 | IRON MOUNTAIN 2023 FORM 10-K | |||||||
Part IV
IRON MOUNTAIN INCORPORATED
NOTES TO CONSOLIDATED FINANCIAL STATEMENTS (CONTINUED)
DECEMBER 31, 2023
(In thousands, except share and per share data)
10. INCOME TAXES (CONTINUED)
A rollforward of unrecognized tax benefits is as follows:
| Gross tax contingencies—January 1, 2021 | $ | ||||
| Gross additions based on tax positions related to the current year | |||||
| Gross additions for tax positions of prior years | |||||
| Gross reductions for tax positions of prior years | ( | ||||
| Lapses of statutes | ( | ||||
| Settlements | ( | ||||
| Gross tax contingencies—December 31, 2021 | |||||
| Gross additions based on tax positions related to the current year | |||||
| Gross additions for tax positions of prior years | |||||
| Gross reductions for tax positions of prior years | ( | ||||
| Acquired unrecognized tax benefits | |||||
| Lapses of statutes | ( | ||||
| Gross tax contingencies—December 31, 2022 | |||||
| Gross additions based on tax positions related to the current year | |||||
| Gross additions for tax positions of prior years | |||||
| Gross reductions for tax positions of prior years | ( | ||||
| Lapses of statutes | ( | ||||
| Gross tax contingencies—December 31, 2023 | $ | ||||
The reversal of the reserves of $23,570 as of December 31, 2023 will be recorded as a reduction of our income tax provision, if sustained. We believe that it is reasonably possible that an amount up to approximately $3,722 of our unrecognized tax positions may be recognized by the end of 2024 as a result of a lapse of statute of limitations or upon closing and settling significant audits in various worldwide jurisdictions.
IRON MOUNTAIN 2023 FORM 10-K | 119 | |||||||
Part IV
IRON MOUNTAIN INCORPORATED
NOTES TO CONSOLIDATED FINANCIAL STATEMENTS (CONTINUED)
DECEMBER 31, 2023
(In thousands, except share and per share data)
11. SEGMENT INFORMATION
As of December 31, 2023, our two reportable segments are described as follows:
(1)Global Records and Information Management ("Global RIM") Business includes several distinct offerings:
(i)Records Management, which stores physical records and provides information services, vital records services, courier operations, and the collection, handling and disposal of sensitive documents ("Records Management") for customers in 60 countries around the globe.
(ii)Data Management, which provides storage and rotation of backup computer media as part of corporate disaster recovery plans, including service and courier operations, server and computer backup services and related services offerings ("Data Management").
(iii)Global Digital Solutions, which develops, implements and supports comprehensive storage and information management solutions for the complete lifecycle of our customers’ information, including the management of physical records, conversion of documents to digital formats and digital storage of information.
(iv)Secure Shredding, which includes the scheduled pick-up of office records that customers accumulate in specially designed secure containers we provide and is a natural extension of our hardcopy records management operations, completing the lifecycle of a record. Through a combination of shredding facilities and mobile shredding units consisting of custom built trucks, we are able to offer secure shredding services to our customers.
(v)Entertainment Services, which help entertainment and media services clients store, safeguard and deliver physical media of all types, and provides digital content repository systems that house, distribute, and archive key media assets.
(vi)Consumer Storage, which provides on-demand, valet storage for consumers utilizing data analytics and machine learning to provide effective customer acquisition and a convenient and seamless consumer storage experience.
(2)Global Data Center Business, which provides enterprise-class data center facilities and hyperscale-ready capacity to protect mission-critical assets and ensure the continued operation of our customers’ IT infrastructure, with secure, reliable and flexible data center options.
The remaining activities of our business consist primarily of our Fine Arts and ALM businesses and other corporate items ("Corporate and Other").
(i)Fine Arts provides technical expertise in the handling, installation and storing of art.
(ii)ALM provides hyperscale and corporate IT infrastructure managers with services and solutions that enable the decommissioning, data erasure, processing and disposition or sale of IT hardware and component assets. ALM services are enabled by: secure logistics, chain of custody and complete asset traceability practices, environmentally-responsible asset processing and recycling, and data sanitization and asset refurbishment services that enable value recovery through asset remarketing. In addition, ALM also offers workplace IT asset management services including storage, configuration, deployment, device support and end-of-life disposition for employee IT devices. Our ALM services focus on protecting and eradicating customer data while maintaining strong, auditable and transparent chain of custody practices.
(iii)Corporate and Other also includes costs related to executive and staff functions, including finance, human resources and IT, which benefit the enterprise as a whole.
120 | IRON MOUNTAIN 2023 FORM 10-K | |||||||
Part IV
IRON MOUNTAIN INCORPORATED
NOTES TO CONSOLIDATED FINANCIAL STATEMENTS (CONTINUED)
DECEMBER 31, 2023
(In thousands, except share and per share data)
11. SEGMENT INFORMATION (CONTINUED)
An analysis of our business segment information and reconciliation to the accompanying Consolidated Financial Statements is as follows:
| GLOBAL RIM BUSINESS | GLOBAL DATA CENTER BUSINESS | CORPORATE AND OTHER | TOTAL CONSOLIDATED | ||||||||||||||||||||
| As of and for the Year Ended December 31, 2023 | |||||||||||||||||||||||
| Total Revenues | $ | $ | $ | $ | |||||||||||||||||||
| Storage Rental | |||||||||||||||||||||||
| Service | |||||||||||||||||||||||
| Depreciation and Amortization | |||||||||||||||||||||||
| Depreciation | |||||||||||||||||||||||
| Amortization | |||||||||||||||||||||||
| Adjusted EBITDA | ( | ||||||||||||||||||||||
Total Assets(1) | |||||||||||||||||||||||
| Expenditures for Segment Assets | |||||||||||||||||||||||
| Capital Expenditures | |||||||||||||||||||||||
| Cash Paid for Acquisitions, Net of Cash Acquired | ( | ||||||||||||||||||||||
| Acquisitions of Customer Relationships, Customer Inducements and Contract Costs | |||||||||||||||||||||||
| As of and for the Year Ended December 31, 2022 | |||||||||||||||||||||||
| Total Revenues | $ | $ | $ | $ | |||||||||||||||||||
| Storage Rental | |||||||||||||||||||||||
| Service | |||||||||||||||||||||||
| Depreciation and Amortization | |||||||||||||||||||||||
| Depreciation | |||||||||||||||||||||||
| Amortization | |||||||||||||||||||||||
| Adjusted EBITDA | ( | ||||||||||||||||||||||
Total Assets(1) | |||||||||||||||||||||||
| Expenditures for Segment Assets | |||||||||||||||||||||||
| Capital Expenditures | |||||||||||||||||||||||
| Cash Paid for Acquisitions, Net of Cash Acquired | ( | ||||||||||||||||||||||
| Acquisitions of Customer Relationships, Customer Inducements and Contract Costs | |||||||||||||||||||||||
| As of and for the Year Ended December 31, 2021 | |||||||||||||||||||||||
| Total Revenues | $ | $ | $ | $ | |||||||||||||||||||
| Storage Rental | |||||||||||||||||||||||
| Service | |||||||||||||||||||||||
| Depreciation and Amortization | |||||||||||||||||||||||
| Depreciation | |||||||||||||||||||||||
| Amortization | |||||||||||||||||||||||
| Adjusted EBITDA | ( | ||||||||||||||||||||||
Total Assets(1) | |||||||||||||||||||||||
| Expenditures for Segment Assets | |||||||||||||||||||||||
| Capital Expenditures | |||||||||||||||||||||||
| Cash Paid for Acquisitions, Net of Cash Acquired | |||||||||||||||||||||||
| Acquisitions of Customer Relationships, Customer Inducements and Contract Costs | |||||||||||||||||||||||
(1)Excludes all intercompany receivables or payables and investment in subsidiary balances.
IRON MOUNTAIN 2023 FORM 10-K | 121 | |||||||
Part IV
IRON MOUNTAIN INCORPORATED
NOTES TO CONSOLIDATED FINANCIAL STATEMENTS (CONTINUED)
DECEMBER 31, 2023
(In thousands, except share and per share data)
11. SEGMENT INFORMATION (CONTINUED)
The accounting policies of the reportable segments are the same as those described in Note 2. Adjusted EBITDA for each segment is defined as net income (loss) before interest expense, net, provision (benefit) for income taxes, depreciation and amortization (inclusive of our share of Adjusted EBITDA from our unconsolidated joint ventures), and excluding certain items we do not believe to be indicative of our core operating results, specifically:
| EXCLUDED | |||||
•Acquisition and Integration Costs •Restructuring and other transformation •(Gain) loss on disposal/write-down of property, plant and equipment, net (including real estate) | •Other expense (income), net •Stock-based compensation expense | ||||
Internally, we use Adjusted EBITDA as the basis for evaluating the performance of, and allocating resources to, our operating segments.
A reconciliation of Net Income (Loss) to Adjusted EBITDA on a consolidated basis for the years ended December 31, 2023, 2022 and 2021 is as follows:
| YEAR ENDED DECEMBER 31, | |||||||||||||||||
| 2023 | 2022 | 2021 | |||||||||||||||
| Net Income (Loss) | $ | $ | $ | ||||||||||||||
| Add/(Deduct): | |||||||||||||||||
| Interest expense, net | |||||||||||||||||
| Provision (benefit) for income taxes | |||||||||||||||||
| Depreciation and amortization | |||||||||||||||||
| Acquisition and Integration Costs | |||||||||||||||||
Restructuring and other transformation | |||||||||||||||||
| (Gain) loss on disposal/write-down of property, plant and equipment, net (including real estate) | ( | ( | ( | ||||||||||||||
Other expense (income), net, excluding our share of losses (gains) from our unconsolidated joint ventures(1) | ( | ( | |||||||||||||||
| Stock-based compensation expense | |||||||||||||||||
| Our share of Adjusted EBITDA reconciling items from our unconsolidated joint ventures | |||||||||||||||||
| Adjusted EBITDA | $ | $ | $ | ||||||||||||||
(1)Includes foreign currency transaction losses (gains), net, debt extinguishment expense and other, net.
122 | IRON MOUNTAIN 2023 FORM 10-K | |||||||
Part IV
IRON MOUNTAIN INCORPORATED
NOTES TO CONSOLIDATED FINANCIAL STATEMENTS (CONTINUED)
DECEMBER 31, 2023
(In thousands, except share and per share data)
11. SEGMENT INFORMATION (CONTINUED)
Information as to our operations in different geographical areas for the years ended December 31, 2023, 2022 and 2021 is as follows:
| YEAR ENDED DECEMBER 31, | |||||||||||||||||
| 2023 | 2022 | 2021 | |||||||||||||||
| Revenues: | |||||||||||||||||
| United States | $ | $ | $ | ||||||||||||||
| United Kingdom | |||||||||||||||||
| Canada | |||||||||||||||||
| Australia | |||||||||||||||||
| Remaining Countries | |||||||||||||||||
| Long-lived Assets: | |||||||||||||||||
| United States | $ | $ | $ | ||||||||||||||
| United Kingdom | |||||||||||||||||
| Canada | |||||||||||||||||
| Australia | |||||||||||||||||
| Remaining Countries | |||||||||||||||||
Information as to our revenues by product and service lines by segment for the years ended December 31, 2023, 2022 and 2021 is as follows:
| GLOBAL RIM BUSINESS | GLOBAL DATA CENTER BUSINESS | CORPORATE AND OTHER | TOTAL CONSOLIDATED | ||||||||||||||||||||
| For the Year Ended December 31, 2023 | |||||||||||||||||||||||
Records Management(1) | $ | $ | $ | $ | |||||||||||||||||||
Data Management(1) | |||||||||||||||||||||||
Information Destruction(1)(2)(3) | |||||||||||||||||||||||
Data Center(1) | |||||||||||||||||||||||
| For the Year Ended December 31, 2022 | |||||||||||||||||||||||
Records Management(1) | $ | $ | $ | $ | |||||||||||||||||||
Data Management(1) | |||||||||||||||||||||||
Information Destruction(1)(2)(3) | |||||||||||||||||||||||
Data Center(1) | |||||||||||||||||||||||
| For the Year Ended December 31, 2021 | |||||||||||||||||||||||
Records Management(1) | $ | $ | $ | $ | |||||||||||||||||||
Data Management(1) | |||||||||||||||||||||||
Information Destruction(1)(2)(3) | |||||||||||||||||||||||
Data Center(1) | |||||||||||||||||||||||
(1)Each of these offerings has a component of revenue that is storage rental related and a component that is service related, except for information destruction, which does not have a storage rental component.
(2)Information destruction revenue for our Global RIM Business includes secure shredding services.
(3)Information destruction revenue for Corporate and Other includes product revenue from our ALM business.
IRON MOUNTAIN 2023 FORM 10-K | 123 | |||||||
Part IV
IRON MOUNTAIN INCORPORATED
NOTES TO CONSOLIDATED FINANCIAL STATEMENTS (CONTINUED)
DECEMBER 31, 2023
(In thousands, except share and per share data)
12. RELATED PARTY TRANSACTIONS
In October 2020, in connection with the formation of the Frankfurt JV, we entered into agreements whereby we earn various fees, including (i) special project revenue and (ii) property management and construction and development fees for services we are providing to the Frankfurt JV (the "Frankfurt JV Agreements").
In March 2019, in connection with the formation of the MakeSpace JV, we entered into a storage and service agreement with the MakeSpace JV to provide certain storage and related services to the MakeSpace JV (the "MakeSpace Agreement"). In February 2022, in connection with the formation of the Clutter JV, we terminated the MakeSpace Agreement and entered into a storage and service agreement with the Clutter JV to provide certain storage and related services to the Clutter JV (the "Clutter Agreement"). On June 29, 2023, we completed the Clutter Acquisition and terminated the Clutter Agreement.
Revenue recognized in the accompanying Consolidated Statements of Operations under these agreements for the years ended December 31, 2023, 2022 and 2021 is as follows (approximately):
| YEAR ENDED DECEMBER 31, | |||||||||||||||||
| 2023 | 2022 | 2021 | |||||||||||||||
Frankfurt JV Agreements(1) | $ | $ | $ | ||||||||||||||
MakeSpace Agreement and Clutter Agreement(2) | |||||||||||||||||
(1)Revenue associated with the Frankfurt JV Agreements is presented as a component of our Global Data Center Business segment.
During the years ended December 31, 2023, 2022 and 2021, the Company had no other related party transactions.
13. RESTRUCTURING AND OTHER TRANSFORMATION
PROJECT MATTERHORN
In September 2022, we announced Project Matterhorn. Project Matterhorn investments focus on transforming our operating model to a global operating model. Project Matterhorn focuses on the formation of a solution-based sales approach that is designed to allow us to optimize our shared services and best practices to better serve our customers' needs. We are investing to accelerate growth and to capture a greater share of the large, global addressable markets in which we operate. We expect to incur approximately $150,000 in costs annually related to Project Matterhorn from 2023 through 2025. Costs are comprised of (1) restructuring costs, which include (i) site consolidation and other related exit costs, (ii) employee severance costs and (iii) certain professional fees associated with these activities and (2) other transformation costs, which include professional fees such as project management costs and costs for third party consultants who are assisting in the enablement our growth initiatives.
Restructuring and other transformation related to Project Matterhorn included in the accompanying Consolidated Statements of Operations for the years ended December 31, 2023 and 2022 and from the inception of Project Matterhorn through December 31, 2023 is as follows:
YEAR ENDED DECEMBER 31, 2023 | YEAR ENDED DECEMBER 31, 2022 | FROM INCEPTION THROUGH DECEMBER 31, 2023 | |||||||||
| Restructuring | $ | $ | $ | ||||||||
| Other transformation | |||||||||||
Restructuring and other transformation | $ | $ | $ | ||||||||
There were no Restructuring and other transformation costs related to Project Matterhorn for the year ended December 31, 2021.
124 | IRON MOUNTAIN 2023 FORM 10-K | |||||||
Part IV
IRON MOUNTAIN INCORPORATED
NOTES TO CONSOLIDATED FINANCIAL STATEMENTS (CONTINUED)
DECEMBER 31, 2023
(In thousands, except share and per share data)
13. RESTRUCTURING AND OTHER TRANSFORMATION (CONTINUED)
Restructuring costs for Project Matterhorn, included as a component of Restructuring and other transformation in the accompanying Consolidated Statements of Operations, by segment, for the years ended December 31, 2023 and 2022 and from the inception of Project Matterhorn through December 31, 2023 are as follows:
YEAR ENDED DECEMBER 31, 2023 | YEAR ENDED DECEMBER 31, 2022 | FROM INCEPTION THROUGH DECEMBER 31, 2023 | |||||||||
| Global RIM Business | $ | $ | $ | ||||||||
| Global Data Center Business | |||||||||||
| Corporate and Other | |||||||||||
| Total restructuring costs | $ | $ | $ | ||||||||
Other transformation costs for Project Matterhorn, included as a component of Restructuring and other transformation in the accompanying Consolidated Statements of Operations, by segment, for the years ended December 31, 2023 and 2022 and from the inception of Project Matterhorn through December 31, 2023 are as follows:
YEAR ENDED DECEMBER 31, 2023 | YEAR ENDED DECEMBER 31, 2022 | FROM INCEPTION THROUGH DECEMBER 31, 2023 | |||||||||
| Global RIM Business | $ | $ | $ | ||||||||
| Global Data Center Business | |||||||||||
| Corporate and Other | |||||||||||
| Total other transformation costs | $ | $ | $ | ||||||||
A rollforward of the accrued restructuring costs and accrued other transformation costs, which are included as components of Accrued expenses and other current liabilities in our Consolidated Balance Sheets for December 31, 2022 through December 31, 2023 is as follows:
| RESTRUCTURING | OTHER TRANSFORMATION | TOTAL RESTRUCTURING AND OTHER TRANSFORMATION | ||||||||||||||||||
| Balance as of December 31, 2022 | $ | $ | $ | |||||||||||||||||
| Amounts accrued | ||||||||||||||||||||
| Payments | ( | ( | ( | |||||||||||||||||
| Balance as of December 31, 2023 | $ | $ | $ | |||||||||||||||||
PROJECT SUMMIT
In October 2019, we announced Project Summit, our global program designed to better position us for future growth and achievement of our strategic objectives. We expanded Project Summit during the first quarter of 2020 to include additional opportunities to streamline our business and operations, as well as accelerated the timing of certain opportunities previously identified. As of December 31, 2021, we completed Project Summit.
The implementation of Project Summit resulted in total restructuring costs of approximately $450,000 that primarily consisted of: (i) employee severance costs, (ii) internal costs associated with the development and implementation of Project Summit initiatives, (iii) professional fees, primarily related to third party consultants who assisted with the design and execution of various initiatives as well as project management activities and (iv) system implementation and data conversion costs.
IRON MOUNTAIN 2023 FORM 10-K | 125 | |||||||
Part IV
IRON MOUNTAIN INCORPORATED
NOTES TO CONSOLIDATED FINANCIAL STATEMENTS (CONTINUED)
DECEMBER 31, 2023
(In thousands, except share and per share data)
13. RESTRUCTURING AND OTHER TRANSFORMATION (CONTINUED)
Restructuring costs for Project Summit, included as a component of Restructuring and other transformation in the accompanying Consolidated Statement of Operations, for the year ended December 31, 2021 and from the inception of Project Summit through December 31, 2021, are as follows:
| YEAR ENDED DECEMBER 31, 2021 | FROM INCEPTION OF PROJECT SUMMIT THROUGH DECEMBER 31, 2021 | |||||||||||||
| Employee severance | $ | $ | ||||||||||||
| Professional fees and other | ||||||||||||||
Total restructuring costs | $ | $ | ||||||||||||
As Project Summit was completed as of December 31, 2021, there were no
Restructuring costs for Project Summit included in the accompanying Consolidated Statement of Operations by segment for the year ended December 31, 2021 and from the inception of Project Summit through December 31, 2021 are as follows:
| YEAR ENDED DECEMBER 31, 2021 | FROM INCEPTION OF PROJECT SUMMIT THROUGH DECEMBER 31, 2021 | |||||||||||||
| Global RIM Business | $ | $ | ||||||||||||
| Global Data Center Business | ||||||||||||||
| Corporate and Other | ||||||||||||||
Total restructuring costs | $ | $ | ||||||||||||
126 | IRON MOUNTAIN 2023 FORM 10-K | |||||||
Part IV
IRON MOUNTAIN INCORPORATED
SCHEDULE III—SCHEDULE OF REAL ESTATE AND ACCUMULATED DEPRECIATION
DECEMBER 31, 2023
(Dollars in thousands)
Schedule III - Schedule of Real Estate and Accumulated Depreciation ("Schedule III") reflects the cost and associated accumulated depreciation for the real estate facilities that are owned. The gross cost included in Schedule III includes the cost for land, land improvements, buildings, building improvements and racking. Schedule III does not reflect the 1,145 leased facilities in our real estate portfolio. In addition, Schedule III does not include any value for financing leases for property that is classified as land, buildings and building improvements in our consolidated financial statements.
The following table presents a reconciliation of the gross amount of real estate assets, as presented in Schedule III below, to the sum of the historical book value of land, buildings and building improvements, racking and construction in progress as disclosed in Note 2.i. to Notes to Consolidated Financial Statements as of December 31, 2023:
| Gross Amount of Real Estate Assets, As Reported on Schedule III | $ | ||||
| Add (Deduct) Reconciling Items: | |||||
Book value of racking included in leased facilities(1) | |||||
Book value of financing leases(2) | |||||
Book value of construction in progress(3) | |||||
Book value of other | |||||
| Total Reconciling Items | |||||
Gross Amount of Real Estate Assets, As Disclosed in Note 2.i. | $ | ||||
(1)Represents the gross book value of racking installed in our 1,145 leased facilities, which is included in historical book value of racking in Note 2.i., but excluded from Schedule III.
(2)Represents the gross book value of buildings and building improvements that are subject to financing leases, which are included in the historical book value of building and building improvements in Note 2.i., but excluded from Schedule III.
(3)Represents the gross book value of non-real estate assets that are included in the historical book value of construction in progress assets in Note 2.i. The historical book value of real estate assets associated with owned buildings that were related to construction in progress as of December 31, 2023 is included in Schedule III.
The following table presents a reconciliation of the accumulated depreciation of real estate assets, as presented in Schedule III below, to the total accumulated depreciation for all property, plant and equipment presented on our Consolidated Balance Sheet as of December 31, 2023:
| Accumulated Depreciation of Real Estate Assets, As Reported on Schedule III | $ | ||||
| Add (Deduct) Reconciling Items: | |||||
Accumulated Depreciation - non-real estate assets(1) | |||||
Accumulated Depreciation - racking in leased facilities(2) | |||||
Accumulated Depreciation - financing leases(3) | |||||
Accumulated Depreciation - other | |||||
| Total Reconciling Items | |||||
| Accumulated Depreciation, As Reported on Consolidated Balance Sheet | $ | ||||
(1)Represents the accumulated depreciation of non-real estate assets that is included in the total accumulated depreciation of property, plant and equipment on our Consolidated Balance Sheet, but excluded from Schedule III as the assets to which this accumulated depreciation relates are not considered real estate assets associated with owned buildings.
(2)Represents the accumulated depreciation of racking as of December 31, 2023 installed in our 1,145 leased facilities, which is included in total accumulated depreciation of property, plant and equipment on our Consolidated Balance Sheet, but excluded from Schedule III, as disclosed in Footnote 1 to Schedule III.
(3)Represents the accumulated depreciation of buildings and building improvements as of December 31, 2023 that are subject to financing leases, which is included in the total accumulated depreciation of property, plant and equipment on our Consolidated Balance Sheet, but excluded from Schedule III, as disclosed in Footnote 1 to Schedule III.
IRON MOUNTAIN 2023 FORM 10-K | 127 | |||||||
Part IV
IRON MOUNTAIN INCORPORATED
SCHEDULE III—SCHEDULE OF REAL ESTATE AND ACCUMULATED DEPRECIATION (CONTINUED)
DECEMBER 31, 2023
(Dollars in thousands)
| (A) | (B) | (C) | (D) | (E) | (F) | |||||||||||||||||||||||||||||||||||||||||||||
| REGION/COUNTRY/ STATE/CAMPUS ADDRESS | FACILITIES(1) | ENCUMBRANCES | INITIAL COST TO COMPANY(1) | COST CAPITALIZED SUBSEQUENT TO ACQUISITION(1)(2) | GROSS AMOUNT CARRIED AT CLOSE OF CURRENT PERIOD(1)(11) | ACCUMULATED DEPRECIATION AT CLOSE OF CURRENT PERIOD(1)(2)(11) | DATE OF CONSTRUCTION OR ACQUIRED(3) | LIFE ON WHICH DEPRECIATION IN LATEST INCOME STATEMENT IS COMPUTED | ||||||||||||||||||||||||||||||||||||||||||
| North America | ||||||||||||||||||||||||||||||||||||||||||||||||||
| United States (Including Puerto Rico) | ||||||||||||||||||||||||||||||||||||||||||||||||||
| 1420 North Fiesta Blvd, Gilbert, Arizona | $ | $ | $ | $ | $ | 2001 | Up to | |||||||||||||||||||||||||||||||||||||||||||
| 4802 East Van Buren, Phoenix, Arizona | 2019 | Up to | ||||||||||||||||||||||||||||||||||||||||||||||||
| 615 North 48th Street, Phoenix, Arizona | 2018 | (5) | Up to | |||||||||||||||||||||||||||||||||||||||||||||||
| 2955 S. 18th Place, Phoenix, Arizona | 2007 | Up to | ||||||||||||||||||||||||||||||||||||||||||||||||
| 4449 South 36th St, Phoenix, Arizona | 2012 | Up to | ||||||||||||||||||||||||||||||||||||||||||||||||
| 8521 E. Princess Drive, Scottsdale, Arizona | 2018 | (5) | Up to | |||||||||||||||||||||||||||||||||||||||||||||||
| 600 Burning Tree Rd, Fullerton, California | 2002 | Up to | ||||||||||||||||||||||||||||||||||||||||||||||||
| 21063 Forbes St, Hayward, California | 2019 | (10) | Up to | |||||||||||||||||||||||||||||||||||||||||||||||
| 1025 North Highland Ave, Los Angeles, California | 1988 | Up to | ||||||||||||||||||||||||||||||||||||||||||||||||
| 1010 - 1006 North Mansfield, Los Angeles, California | 2014 | Up to | ||||||||||||||||||||||||||||||||||||||||||||||||
| 1350 West Grand Ave, Oakland, California | 1997 | Up to | ||||||||||||||||||||||||||||||||||||||||||||||||
| 1760 North Saint Thomas Circle, Orange, California | 2002 | Up to | ||||||||||||||||||||||||||||||||||||||||||||||||
| 1915 South Grand Ave, Santa Ana, California | 2001 | Up to | ||||||||||||||||||||||||||||||||||||||||||||||||
| 2680 Sequoia Dr, South Gate, California | 2002 | Up to | ||||||||||||||||||||||||||||||||||||||||||||||||
| 336 Oyster Point Blvd, South San Francisco, California | 2019 | (10) | Up to | |||||||||||||||||||||||||||||||||||||||||||||||
| 3576 N. Moline, Aurora, Colorado | 2001 | Up to | ||||||||||||||||||||||||||||||||||||||||||||||||
| 5151 E. 46th Ave, Denver, Colorado | 2014 | Up to | ||||||||||||||||||||||||||||||||||||||||||||||||
| 11333 E 53rd Ave, Denver, Colorado | 2001 | Up to | ||||||||||||||||||||||||||||||||||||||||||||||||
| 4300 Brighton Boulevard, Denver, Colorado | 2017 | Up to | ||||||||||||||||||||||||||||||||||||||||||||||||
128 | IRON MOUNTAIN 2023 FORM 10-K | |||||||
Part IV
IRON MOUNTAIN INCORPORATED
SCHEDULE III—SCHEDULE OF REAL ESTATE AND ACCUMULATED DEPRECIATION (CONTINUED)
DECEMBER 31, 2023
(Dollars in thousands)
| (A) | (B) | (C) | (D) | (E) | (F) | |||||||||||||||||||||||||||||||||||||||||||||||||||||||||
| REGION/COUNTRY/ STATE/CAMPUS ADDRESS | FACILITIES(1) | ENCUMBRANCES | INITIAL COST TO COMPANY(1) | COST CAPITALIZED SUBSEQUENT TO ACQUISITION(1)(2) | GROSS AMOUNT CARRIED AT CLOSE OF CURRENT PERIOD(1)(11) | ACCUMULATED DEPRECIATION AT CLOSE OF CURRENT PERIOD(1)(2)(11) | DATE OF CONSTRUCTION OR ACQUIRED(3) | LIFE ON WHICH DEPRECIATION IN LATEST INCOME STATEMENT IS COMPUTED | ||||||||||||||||||||||||||||||||||||||||||||||||||||||
| North America (continued) | ||||||||||||||||||||||||||||||||||||||||||||||||||||||||||||||
| United States (Including Puerto Rico) (continued) | ||||||||||||||||||||||||||||||||||||||||||||||||||||||||||||||
| 20 Eastern Park Rd, East Hartford, Connecticut | $ | $ | $ | $ | $ | 2002 | Up to | |||||||||||||||||||||||||||||||||||||||||||||||||||||||
| Kennedy Road, Windsor, Connecticut | 2001 | Up to | ||||||||||||||||||||||||||||||||||||||||||||||||||||||||||||
| 1400 Johnson Way, New Castle, Delaware | 2023 | (10) | Up to | |||||||||||||||||||||||||||||||||||||||||||||||||||||||||||
| 150-200 Todds Ln, Wilmington, Delaware | 2002 | Up to | ||||||||||||||||||||||||||||||||||||||||||||||||||||||||||||
| 3501 Electronics Way, West Palm Beach, Florida | 2001 | Up to | ||||||||||||||||||||||||||||||||||||||||||||||||||||||||||||
| 5319 Tulane Drive SW, Atlanta, Georgia | 2002 | Up to | ||||||||||||||||||||||||||||||||||||||||||||||||||||||||||||
| 6111 Live Oak Parkway, Norcross, Georgia | 2017 | Up to | ||||||||||||||||||||||||||||||||||||||||||||||||||||||||||||
| 2425 South Halsted St, Chicago, Illinois | 2006 | Up to | ||||||||||||||||||||||||||||||||||||||||||||||||||||||||||||
| 1301 S. Rockwell St, Chicago, Illinois | 1999 | Up to | ||||||||||||||||||||||||||||||||||||||||||||||||||||||||||||
| 2604 West 13th St, Chicago, Illinois | 2001 | Up to | ||||||||||||||||||||||||||||||||||||||||||||||||||||||||||||
| 2211 W. Pershing Rd, Chicago, Illinois | 2001 | Up to | ||||||||||||||||||||||||||||||||||||||||||||||||||||||||||||
| 2255 Pratt Blvd, Elk Grove, Illinois | 2000 | Up to | ||||||||||||||||||||||||||||||||||||||||||||||||||||||||||||
| 4175 Chandler Dr Opus No. Corp, Hanover Park, Illinois | 2014 | Up to | ||||||||||||||||||||||||||||||||||||||||||||||||||||||||||||
| 2600 Beverly Drive, Lincoln, Illinois | 2015 | Up to | ||||||||||||||||||||||||||||||||||||||||||||||||||||||||||||
| 6090 NE 14th Street, Des Moines, Iowa | 2003 | Up to | ||||||||||||||||||||||||||||||||||||||||||||||||||||||||||||
| South 7th St, Louisville, Kentucky | Various | Up to | ||||||||||||||||||||||||||||||||||||||||||||||||||||||||||||
| 26 Parkway Drive (fka 133 Pleasant), Scarborough, Maine | 2015 | (10) | Up to | |||||||||||||||||||||||||||||||||||||||||||||||||||||||||||
| 8928 McGaw Ct, Columbia, Maryland | 1999 | Up to | ||||||||||||||||||||||||||||||||||||||||||||||||||||||||||||
IRON MOUNTAIN 2023 FORM 10-K | 129 | |||||||
Part IV
IRON MOUNTAIN INCORPORATED
SCHEDULE III—SCHEDULE OF REAL ESTATE AND ACCUMULATED DEPRECIATION (CONTINUED)
DECEMBER 31, 2023
(Dollars in thousands)
| (A) | (B) | (C) | (D) | (E) | (F) | |||||||||||||||||||||||||||||||||||||||||||||
| REGION/COUNTRY/ STATE/CAMPUS ADDRESS | FACILITIES(1) | ENCUMBRANCES | INITIAL COST TO COMPANY(1) | COST CAPITALIZED SUBSEQUENT TO ACQUISITION(1)(2) | GROSS AMOUNT CARRIED AT CLOSE OF CURRENT PERIOD(1)(11) | ACCUMULATED DEPRECIATION AT CLOSE OF CURRENT PERIOD(1)(2)(11) | DATE OF CONSTRUCTION OR ACQUIRED(3) | LIFE ON WHICH DEPRECIATION IN LATEST INCOME STATEMENT IS COMPUTED | ||||||||||||||||||||||||||||||||||||||||||
| North America (continued) | ||||||||||||||||||||||||||||||||||||||||||||||||||
| United States (Including Puerto Rico) (continued) | ||||||||||||||||||||||||||||||||||||||||||||||||||
| 120 Hampden St, Boston, Massachusetts | $ | $ | $ | $ | $ | 2002 | Up to | |||||||||||||||||||||||||||||||||||||||||||
| 32 George St, Boston, Massachusetts | 1991 | Up to | ||||||||||||||||||||||||||||||||||||||||||||||||
| 3435 Sharps Lot Rd, Dighton, Massachusetts | 1999 | Up to | ||||||||||||||||||||||||||||||||||||||||||||||||
| 77 Constitution Boulevard, Franklin, Massachusetts | 2014 | Up to | ||||||||||||||||||||||||||||||||||||||||||||||||
| Bearfoot Road, Northboro, Massachusetts | Various | Up to | ||||||||||||||||||||||||||||||||||||||||||||||||
| 6601 Sterling Dr South, Sterling Heights, Michigan | 2002 | Up to | ||||||||||||||||||||||||||||||||||||||||||||||||
| 3140 Ryder Trail South, Earth City, Missouri | 2004 | Up to | ||||||||||||||||||||||||||||||||||||||||||||||||
| Leavenworth St/18th St, Omaha, Nebraska | Various | Up to | ||||||||||||||||||||||||||||||||||||||||||||||||
| 4105 North Lamb Blvd, Las Vegas, Nevada | 2002 | Up to | ||||||||||||||||||||||||||||||||||||||||||||||||
| 17 Hydro Plant Rd, Milton, New Hampshire | 2001 | Up to | ||||||||||||||||||||||||||||||||||||||||||||||||
| 3003 Woodbridge Avenue, Edison, New Jersey | 2018 | (5) | Up to | |||||||||||||||||||||||||||||||||||||||||||||||
| 811 Route 33, Freehold, New Jersey | Various | Up to | ||||||||||||||||||||||||||||||||||||||||||||||||
| 51-69 & 77-81 Court St, Newark, New Jersey | 2015 | Up to | ||||||||||||||||||||||||||||||||||||||||||||||||
| 560 Irvine Turner Blvd, Newark, New Jersey | 2015 | Up to | ||||||||||||||||||||||||||||||||||||||||||||||||
| 231 Johnson Ave, Newark, New Jersey | 2015 | Up to | ||||||||||||||||||||||||||||||||||||||||||||||||
| 650 Howard Avenue, Somerset, New Jersey | 2006 | Up to | ||||||||||||||||||||||||||||||||||||||||||||||||
| 100 Bailey Ave, Buffalo, New York | 1998 | Up to | ||||||||||||||||||||||||||||||||||||||||||||||||
130 | IRON MOUNTAIN 2023 FORM 10-K | |||||||
Part IV
IRON MOUNTAIN INCORPORATED
SCHEDULE III—SCHEDULE OF REAL ESTATE AND ACCUMULATED DEPRECIATION (CONTINUED)
DECEMBER 31, 2023
(Dollars in thousands)
| (A) | (B) | (C) | (D) | (E) | (F) | |||||||||||||||||||||||||||||||||||||||||||||
| REGION/COUNTRY/ STATE/CAMPUS ADDRESS | FACILITIES(1) | ENCUMBRANCES | INITIAL COST TO COMPANY(1) | COST CAPITALIZED SUBSEQUENT TO ACQUISITION(1)(2) | GROSS AMOUNT CARRIED AT CLOSE OF CURRENT PERIOD(1)(11) | ACCUMULATED DEPRECIATION AT CLOSE OF CURRENT PERIOD(1)(2)(11) | DATE OF CONSTRUCTION OR ACQUIRED(3) | LIFE ON WHICH DEPRECIATION IN LATEST INCOME STATEMENT IS COMPUTED | ||||||||||||||||||||||||||||||||||||||||||
| North America (continued) | ||||||||||||||||||||||||||||||||||||||||||||||||||
| United States (Including Puerto Rico) (continued) | ||||||||||||||||||||||||||||||||||||||||||||||||||
| 1368 County Rd 8, Farmington, New York | $ | $ | $ | $ | $ | 1998 | Up to | |||||||||||||||||||||||||||||||||||||||||||
| County Rd 10, Linlithgo, New York | 2001 | Up to | ||||||||||||||||||||||||||||||||||||||||||||||||
| Ulster Ave/Route 9W, Port Ewen, New York | 2001 | Up to | ||||||||||||||||||||||||||||||||||||||||||||||||
| Binnewater Rd, Rosendale, New York | Various | Up to | ||||||||||||||||||||||||||||||||||||||||||||||||
| 220 Wavel St, Syracuse, New York | 1997 | Up to | ||||||||||||||||||||||||||||||||||||||||||||||||
| 826 Church Street, Morrisville, North Carolina | 2017 | Up to | ||||||||||||||||||||||||||||||||||||||||||||||||
| 1275 East 40th, Cleveland, Ohio | 1999 | Up to | ||||||||||||||||||||||||||||||||||||||||||||||||
| 7208 Euclid Avenue, Cleveland, Ohio | 2001 | Up to | ||||||||||||||||||||||||||||||||||||||||||||||||
| 3366 South Tech Boulevard, Miamisburg, Ohio | 2018 | (5) | Up to | |||||||||||||||||||||||||||||||||||||||||||||||
| Branchton Rd, Boyers, Pennsylvania | Various | Up to | ||||||||||||||||||||||||||||||||||||||||||||||||
| 800 Carpenters Crossings, Folcroft, Pennsylvania | 2000 | Up to | ||||||||||||||||||||||||||||||||||||||||||||||||
| Las Flores Industrial Park, Rio Grande, Puerto Rico | 2001 | Up to | ||||||||||||||||||||||||||||||||||||||||||||||||
| 1061 Carolina Pines Road, Columbia, South Carolina | 2016 | (10) | Up to | |||||||||||||||||||||||||||||||||||||||||||||||
| 2301 Prosperity Way, Florence, South Carolina | 2016 | (10) | Up to | |||||||||||||||||||||||||||||||||||||||||||||||
| Mitchell Street, Knoxville, Tennessee | Various | Up to | ||||||||||||||||||||||||||||||||||||||||||||||||
| 6005 Dana Way, Nashville, Tennessee | 2000 | Up to | ||||||||||||||||||||||||||||||||||||||||||||||||
| Capital Parkway, Carrollton, Texas | 2015 | (10) | Up to | |||||||||||||||||||||||||||||||||||||||||||||||
| 1800 Columbian Club Dr, Carrolton, Texas | 2013 | Up to | ||||||||||||||||||||||||||||||||||||||||||||||||
IRON MOUNTAIN 2023 FORM 10-K | 131 | |||||||
Part IV
IRON MOUNTAIN INCORPORATED
SCHEDULE III—SCHEDULE OF REAL ESTATE AND ACCUMULATED DEPRECIATION (CONTINUED)
DECEMBER 31, 2023
(Dollars in thousands)
| (A) | (B) | (C) | (D) | (E) | (F) | |||||||||||||||||||||||||||||||||||||||||||||
| REGION/COUNTRY/ STATE/CAMPUS ADDRESS | FACILITIES(1) | ENCUMBRANCES | INITIAL COST TO COMPANY(1) | COST CAPITALIZED SUBSEQUENT TO ACQUISITION(1)(2) | GROSS AMOUNT CARRIED AT CLOSE OF CURRENT PERIOD(1)(11) | ACCUMULATED DEPRECIATION AT CLOSE OF CURRENT PERIOD(1)(2)(11) | DATE OF CONSTRUCTION OR ACQUIRED(3) | LIFE ON WHICH DEPRECIATION IN LATEST INCOME STATEMENT IS COMPUTED | ||||||||||||||||||||||||||||||||||||||||||
| North America (continued) | ||||||||||||||||||||||||||||||||||||||||||||||||||
| United States (Including Puerto Rico) (continued) | ||||||||||||||||||||||||||||||||||||||||||||||||||
| 1905 John Connally Dr, Carrolton, Texas | $ | $ | $ | $ | $ | 2000 | Up to | |||||||||||||||||||||||||||||||||||||||||||
| 13425 Branchview Ln, Dallas, Texas | 2001 | Up to | ||||||||||||||||||||||||||||||||||||||||||||||||
| 1819 S. Lamar St, Dallas, Texas | 2000 | Up to | ||||||||||||||||||||||||||||||||||||||||||||||||
| 2000 Robotics Place Suite B, Fort Worth, Texas | 2002 | Up to | ||||||||||||||||||||||||||||||||||||||||||||||||
| 1202 Ave R, Grand Prairie, Texas | 2003 | Up to | ||||||||||||||||||||||||||||||||||||||||||||||||
| 6203 Bingle Rd, Houston, Texas | 2001 | Up to | ||||||||||||||||||||||||||||||||||||||||||||||||
| 2600 Center Street, Houston, Texas | 2000 | Up to | ||||||||||||||||||||||||||||||||||||||||||||||||
| 5707 Chimney Rock, Houston, Texas | 2002 | Up to | ||||||||||||||||||||||||||||||||||||||||||||||||
| 5249 Glenmont Ave, Houston, Texas | 2000 | Up to | ||||||||||||||||||||||||||||||||||||||||||||||||
| 15333 Hempstead Hwy, Houston, Texas | 2004 | Up to | ||||||||||||||||||||||||||||||||||||||||||||||||
| 5757 Royalton Dr, Houston, Texas | 2000 | Up to | ||||||||||||||||||||||||||||||||||||||||||||||||
| 9601 West Tidwell, Houston, Texas | 2001 | Up to | ||||||||||||||||||||||||||||||||||||||||||||||||
| 7800 Westpark, Houston, Texas | 2015 | (10) | Up to | |||||||||||||||||||||||||||||||||||||||||||||||
| 1665 S. 5350 West, Salt Lake City, Utah | 2002 | Up to | ||||||||||||||||||||||||||||||||||||||||||||||||
| 11052 Lakeridge Pkwy, Ashland, Virginia | 1999 | Up to | ||||||||||||||||||||||||||||||||||||||||||||||||
| 11660 Hayden Road, Manassas, Virginia | 2020 | Up to | ||||||||||||||||||||||||||||||||||||||||||||||||
| 3725 Thirlane Rd. N.W., Roanoke, Virginia | 2015 | (10) | Up to | |||||||||||||||||||||||||||||||||||||||||||||||
| 22445 Randolph Dr, Sterling, Virginia | 2005 | Up to | ||||||||||||||||||||||||||||||||||||||||||||||||
| 307 South 140th St, Burien, Washington | 1999 | Up to | ||||||||||||||||||||||||||||||||||||||||||||||||
| 6600 Hardeson Rd, Everett, Washington | 2002 | Up to | ||||||||||||||||||||||||||||||||||||||||||||||||
132 | IRON MOUNTAIN 2023 FORM 10-K | |||||||
Part IV
IRON MOUNTAIN INCORPORATED
SCHEDULE III—SCHEDULE OF REAL ESTATE AND ACCUMULATED DEPRECIATION (CONTINUED)
DECEMBER 31, 2023
(Dollars in thousands)
| (A) | (B) | (C) | (D) | (E) | (F) | |||||||||||||||||||||||||||||||||||||||||||||||||||||||||
| REGION/COUNTRY/ STATE/CAMPUS ADDRESS | FACILITIES(1) | ENCUMBRANCES | INITIAL COST TO COMPANY(1) | COST CAPITALIZED SUBSEQUENT TO ACQUISITION(1)(2) | GROSS AMOUNT CARRIED AT CLOSE OF CURRENT PERIOD(1)(11) | ACCUMULATED DEPRECIATION AT CLOSE OF CURRENT PERIOD(1)(2)(11) | DATE OF CONSTRUCTION OR ACQUIRED(3) | LIFE ON WHICH DEPRECIATION IN LATEST INCOME STATEMENT IS COMPUTED | ||||||||||||||||||||||||||||||||||||||||||||||||||||||
| North America (continued) | ||||||||||||||||||||||||||||||||||||||||||||||||||||||||||||||
| United States (Including Puerto Rico) (continued) | ||||||||||||||||||||||||||||||||||||||||||||||||||||||||||||||
| 1201 N. 96th St, Seattle, Washington | $ | $ | $ | $ | $ | 2001 | Up to | |||||||||||||||||||||||||||||||||||||||||||||||||||||||
| 4330 South Grove Road, Spokane, Washington | 2015 | Up to | ||||||||||||||||||||||||||||||||||||||||||||||||||||||||||||
| 12021 West Bluemound Road, Wauwatosa, Wisconsin | 1999 | Up to | ||||||||||||||||||||||||||||||||||||||||||||||||||||||||||||
| $ | $ | $ | $ | $ | ||||||||||||||||||||||||||||||||||||||||||||||||||||||||||
IRON MOUNTAIN 2023 FORM 10-K | 133 | |||||||
Part IV
IRON MOUNTAIN INCORPORATED
SCHEDULE III—SCHEDULE OF REAL ESTATE AND ACCUMULATED DEPRECIATION (CONTINUED)
DECEMBER 31, 2023
(Dollars in thousands)
| (A) | (B) | (C) | (D) | (E) | (F) | |||||||||||||||||||||||||||||||||||||||||||||
| REGION/COUNTRY/ STATE/CAMPUS ADDRESS | FACILITIES(1) | ENCUMBRANCES | INITIAL COST TO COMPANY(1) | COST CAPITALIZED SUBSEQUENT TO ACQUISITION(1)(2) | GROSS AMOUNT CARRIED AT CLOSE OF CURRENT PERIOD(1)(11) | ACCUMULATED DEPRECIATION AT CLOSE OF CURRENT PERIOD(1)(2)(11) | DATE OF CONSTRUCTION OR ACQUIRED(3) | LIFE ON WHICH DEPRECIATION IN LATEST INCOME STATEMENT IS COMPUTED | ||||||||||||||||||||||||||||||||||||||||||
| North America (continued) | ||||||||||||||||||||||||||||||||||||||||||||||||||
| Canada | ||||||||||||||||||||||||||||||||||||||||||||||||||
| One Command Court, Bedford | $ | $ | $ | $ | $ | 2000 | Up to | |||||||||||||||||||||||||||||||||||||||||||
| 195 Summerlea Road, Brampton | 2000 | Up to | ||||||||||||||||||||||||||||||||||||||||||||||||
| 10 Tilbury Court, Brampton | 2000 | Up to | ||||||||||||||||||||||||||||||||||||||||||||||||
| 8825 Northbrook Court, Burnaby | 2001 | Up to | ||||||||||||||||||||||||||||||||||||||||||||||||
| 8088 Glenwood Drive, Burnaby | 2005 | Up to | ||||||||||||||||||||||||||||||||||||||||||||||||
| 5811 26th Street S.E., Calgary | 2000 | Up to | ||||||||||||||||||||||||||||||||||||||||||||||||
| 3905-101 Street, Edmonton | 2000 | Up to | ||||||||||||||||||||||||||||||||||||||||||||||||
| 68 Grant Timmins Drive, Kingston | 2016 | Up to | ||||||||||||||||||||||||||||||||||||||||||||||||
| 3005 Boul. Jean-Baptiste Deschamps, Lachine | 2000 | Up to | ||||||||||||||||||||||||||||||||||||||||||||||||
| 1655 Fleetwood, Laval | 2000 | Up to | ||||||||||||||||||||||||||||||||||||||||||||||||
| 4005 Richelieu, Montreal | 2000 | Up to | ||||||||||||||||||||||||||||||||||||||||||||||||
| 1209 Algoma Rd, Ottawa | 2000 | Up to | ||||||||||||||||||||||||||||||||||||||||||||||||
| 1650 Comstock Rd, Ottawa | ( | 2017 | Up to | |||||||||||||||||||||||||||||||||||||||||||||||
| 235 Edson Street, Saskatoon | 2008 | Up to | ||||||||||||||||||||||||||||||||||||||||||||||||
| 610 Sprucewood Ave, Windsor | 2007 | Up to | ||||||||||||||||||||||||||||||||||||||||||||||||
| $ | $ | $ | $ | $ | ||||||||||||||||||||||||||||||||||||||||||||||
| $ | $ | $ | $ | $ | ||||||||||||||||||||||||||||||||||||||||||||||
134 | IRON MOUNTAIN 2023 FORM 10-K | |||||||
Part IV
IRON MOUNTAIN INCORPORATED
SCHEDULE III—SCHEDULE OF REAL ESTATE AND ACCUMULATED DEPRECIATION (CONTINUED)
DECEMBER 31, 2023
(Dollars in thousands)
| (A) | (B) | (C) | (D) | (E) | (F) | |||||||||||||||||||||||||||||||||||||||||||||
| REGION/COUNTRY/ STATE/CAMPUS ADDRESS | FACILITIES(1) | ENCUMBRANCES | INITIAL COST TO COMPANY(1) | COST CAPITALIZED SUBSEQUENT TO ACQUISITION(1)(2) | GROSS AMOUNT CARRIED AT CLOSE OF CURRENT PERIOD(1)(11) | ACCUMULATED DEPRECIATION AT CLOSE OF CURRENT PERIOD(1)(2)(11) | DATE OF CONSTRUCTION OR ACQUIRED(3) | LIFE ON WHICH DEPRECIATION IN LATEST INCOME STATEMENT IS COMPUTED | ||||||||||||||||||||||||||||||||||||||||||
| Europe | ||||||||||||||||||||||||||||||||||||||||||||||||||
| Gewerbeparkstr. 3, Vienna, Austria | $ | $ | $ | $ | $ | 2010 | Up to | |||||||||||||||||||||||||||||||||||||||||||
| Stupničke Šipkovine 62, Zagreb, Croatia | 2003 | Up to | ||||||||||||||||||||||||||||||||||||||||||||||||
| Kratitirion 9 Kokkinotrimithia Industrial District, Nicosia, Cyprus | 2003 | Up to | ||||||||||||||||||||||||||||||||||||||||||||||||
| Karyatidon 1, Agios Sylas Industrial Area (3rd), Limassol, Cyprus | ( | 2018 | Up to | |||||||||||||||||||||||||||||||||||||||||||||||
| G2-B, Engineering Square IDG Developer’s Area, 6th Oct City Giza, Egypt | ( | 2021 | (7) | Up to | ||||||||||||||||||||||||||||||||||||||||||||||
| 65 Egerton Road, Birmingham, England | 2003 | Up to | ||||||||||||||||||||||||||||||||||||||||||||||||
| Otterham Quay Lane, Gillingham, England | 2004 | Up to | ||||||||||||||||||||||||||||||||||||||||||||||||
| Kemble Industrial Park, Kemble, England | 2003 | Up to | ||||||||||||||||||||||||||||||||||||||||||||||||
| Gayton Road, Kings Lynn, England | 2003 | Up to | ||||||||||||||||||||||||||||||||||||||||||||||||
| 17 Broadgate, Oldham, England | 2008 | Up to | ||||||||||||||||||||||||||||||||||||||||||||||||
| Harpway Lane, Sopley, England | 2004 | Up to | ||||||||||||||||||||||||||||||||||||||||||||||||
| Unit 1A Broadmoor Road, Swindon, England | 2006 | Up to | ||||||||||||||||||||||||||||||||||||||||||||||||
| Jeumont-Schneider, Champagne Sur Seine, France | 2003 | Up to | ||||||||||||||||||||||||||||||||||||||||||||||||
| Bat I-VII Rue de Osiers, Coignieres, France | ( | 2016 | (4) | Up to | ||||||||||||||||||||||||||||||||||||||||||||||
| 26 Rue de I Industrie, Fergersheim, France | 2016 | (4) | Up to | |||||||||||||||||||||||||||||||||||||||||||||||
| Bat A, B, C1, C2, C3 Rue Imperiale, Gue de Longroi, France | 2016 | (4) | Up to | |||||||||||||||||||||||||||||||||||||||||||||||
| Le Petit Courtin Site de Dois, Gueslin, Mingieres, France | ( | 2016 | (4) | Up to | ||||||||||||||||||||||||||||||||||||||||||||||
| ZI des Sables, Morangis, France | 2004 | Up to | ||||||||||||||||||||||||||||||||||||||||||||||||
IRON MOUNTAIN 2023 FORM 10-K | 135 | |||||||
Part IV
IRON MOUNTAIN INCORPORATED
SCHEDULE III—SCHEDULE OF REAL ESTATE AND ACCUMULATED DEPRECIATION (CONTINUED)
DECEMBER 31, 2023
(Dollars in thousands)
| (A) | (B) | (C) | (D) | (E) | (F) | |||||||||||||||||||||||||||||||||||||||||||||
| REGION/COUNTRY/ STATE/CAMPUS ADDRESS | FACILITIES(1) | ENCUMBRANCES | INITIAL COST TO COMPANY(1) | COST CAPITALIZED SUBSEQUENT TO ACQUISITION(1)(2) | GROSS AMOUNT CARRIED AT CLOSE OF CURRENT PERIOD(1)(11) | ACCUMULATED DEPRECIATION AT CLOSE OF CURRENT PERIOD(1)(2)(11) | DATE OF CONSTRUCTION OR ACQUIRED(3) | LIFE ON WHICH DEPRECIATION IN LATEST INCOME STATEMENT IS COMPUTED | ||||||||||||||||||||||||||||||||||||||||||
| Europe (continued) | ||||||||||||||||||||||||||||||||||||||||||||||||||
| 45 Rue de Savoie, Manissieux, Saint Priest, France | $ | $ | $ | ( | $ | $ | 2016 | (4) | Up to | |||||||||||||||||||||||||||||||||||||||||
| Heinrich Lanz Alee 47, Frankfurt, Germany | 2021 | (8) | Up to | |||||||||||||||||||||||||||||||||||||||||||||||
| Gutenbergstrabe 55, Hamburg, Germany | 2016 | (4) | Up to | |||||||||||||||||||||||||||||||||||||||||||||||
| Brommer Weg 1, Wipshausen, Germany | 2006 | Up to | ||||||||||||||||||||||||||||||||||||||||||||||||
| Warehouse and Offices 4 Springhill, Cork, Ireland | 2014 | Up to | ||||||||||||||||||||||||||||||||||||||||||||||||
| 17 Crag Terrace, Dublin, Ireland | 2001 | Up to | ||||||||||||||||||||||||||||||||||||||||||||||||
| Damastown Industrial Park, Dublin, Ireland | 2012 | Up to | ||||||||||||||||||||||||||||||||||||||||||||||||
| Howemoss Drive, Aberdeen, Scotland | Various | Up to | ||||||||||||||||||||||||||||||||||||||||||||||||
| Nettlehill Road, Houston Industrial Estate, Livingston, Scotland | 2001 | Up to | ||||||||||||||||||||||||||||||||||||||||||||||||
| Av Madrid s/n Poligono Industrial Matillas, Alcala de Henares, Spain | 2014 | Up to | ||||||||||||||||||||||||||||||||||||||||||||||||
| Calle Bronce, 37, Chiloeches, Spain | 2010 | Up to | ||||||||||||||||||||||||||||||||||||||||||||||||
| Calle del Mar Egeo, 4, 28830, San Fernando de Hanares, Madrid, Spain | 2022 | (9) | Up to | |||||||||||||||||||||||||||||||||||||||||||||||
| Ctra M.118 , Km.3 Parcela 3, Madrid, Spain | 2001 | Up to | ||||||||||||||||||||||||||||||||||||||||||||||||
| Plot No. S10501 & S10506 Jebel Ali Free Zone Authority, United Arab Emirates | ( | 2021 | (7) | Up to | ||||||||||||||||||||||||||||||||||||||||||||||
| Abanto Ciervava, Spain | ( | Various | Up to | |||||||||||||||||||||||||||||||||||||||||||||||
| $ | $ | $ | $ | $ | ||||||||||||||||||||||||||||||||||||||||||||||
136 | IRON MOUNTAIN 2023 FORM 10-K | |||||||
Part IV
IRON MOUNTAIN INCORPORATED
SCHEDULE III—SCHEDULE OF REAL ESTATE AND ACCUMULATED DEPRECIATION (CONTINUED)
DECEMBER 31, 2023
(Dollars in thousands)
| (A) | (B) | (C) | (D) | (E) | (F) | |||||||||||||||||||||||||||||||||||||||||||||
| REGION/COUNTRY/ STATE/CAMPUS ADDRESS | FACILITIES(1) | ENCUMBRANCES | INITIAL COST TO COMPANY(1) | COST CAPITALIZED SUBSEQUENT TO ACQUISITION(1)(2) | GROSS AMOUNT CARRIED AT CLOSE OF CURRENT PERIOD(1)(11) | ACCUMULATED DEPRECIATION AT CLOSE OF CURRENT PERIOD(1)(2)(11) | DATE OF CONSTRUCTION OR ACQUIRED(3) | LIFE ON WHICH DEPRECIATION IN LATEST INCOME STATEMENT IS COMPUTED | ||||||||||||||||||||||||||||||||||||||||||
| Latin America | ||||||||||||||||||||||||||||||||||||||||||||||||||
| Amancio Alcorta 2396, Buenos Aires, Argentina | $ | $ | $ | ( | $ | $ | Various | Up to | ||||||||||||||||||||||||||||||||||||||||||
| Azara 1245, Buenos Aires, Argentina | ( | 1998 | Up to | |||||||||||||||||||||||||||||||||||||||||||||||
| Spegazzini, Ezeiza, Buenos Aires, Argentina | ( | 2012 | Up to | |||||||||||||||||||||||||||||||||||||||||||||||
| Av Ernest de Moraes 815, Bairro Fim do Campo, Jarinu, Brazil | ( | 2016 | (4) | Up to | ||||||||||||||||||||||||||||||||||||||||||||||
| Rua Peri 80, Jundiai, Brazil | ( | 2016 | (4) | Up to | ||||||||||||||||||||||||||||||||||||||||||||||
| Francisco de Souza e Melo, Rio de Janerio, Brazil | Various | Up to | ||||||||||||||||||||||||||||||||||||||||||||||||
| Hortolandia, Sao Paulo, Brazil | ( | 2014 | Up to | |||||||||||||||||||||||||||||||||||||||||||||||
| El Taqueral 99, Santiago, Chile | Various | Up to | ||||||||||||||||||||||||||||||||||||||||||||||||
| Panamericana Norte 18900, Santiago, Chile | Various | Up to | ||||||||||||||||||||||||||||||||||||||||||||||||
| Avenida Prolongacion del Colli 1104, Guadalajara, Mexico | 2002 | Up to | ||||||||||||||||||||||||||||||||||||||||||||||||
| Privada Las Flores No. 25 (G3), Guadalajara, Mexico | 2004 | Up to | ||||||||||||||||||||||||||||||||||||||||||||||||
| Tula KM Parque de Las, Huehuetoca, Mexico | 2016 | (4) | Up to | |||||||||||||||||||||||||||||||||||||||||||||||
| Carretera Pesqueria Km2.5(M3), Monterrey, Mexico | 2004 | Up to | ||||||||||||||||||||||||||||||||||||||||||||||||
| Lote 2, Manzana A, (T2& T3), Toluca, Mexico | 2002 | Up to | ||||||||||||||||||||||||||||||||||||||||||||||||
| Prolongacion de la Calle 7 (T4), Toluca, Mexico | 2007 | Up to | ||||||||||||||||||||||||||||||||||||||||||||||||
| Panamericana Sur, KM 57.5, Lima, Peru | Various | Up to | ||||||||||||||||||||||||||||||||||||||||||||||||
| Av. Elmer Faucett 3462, Lima, Peru | Various | Up to | ||||||||||||||||||||||||||||||||||||||||||||||||
| Calle Los Claveles-Seccion 3, Lima, Peru | 2010 | Up to | ||||||||||||||||||||||||||||||||||||||||||||||||
| $ | $ | $ | $ | $ | ||||||||||||||||||||||||||||||||||||||||||||||
IRON MOUNTAIN 2023 FORM 10-K | 137 | |||||||
Part IV
IRON MOUNTAIN INCORPORATED
SCHEDULE III—SCHEDULE OF REAL ESTATE AND ACCUMULATED DEPRECIATION (CONTINUED)
DECEMBER 31, 2023
(Dollars in thousands)
| (A) | (B) | (C) | (D) | (E) | (F) | |||||||||||||||||||||||||||||||||||||||||||||
| REGION/COUNTRY/ STATE/CAMPUS ADDRESS | FACILITIES(1) | ENCUMBRANCES | INITIAL COST TO COMPANY(1) | COST CAPITALIZED SUBSEQUENT TO ACQUISITION(1)(2) | GROSS AMOUNT CARRIED AT CLOSE OF CURRENT PERIOD(1)(11) | ACCUMULATED DEPRECIATION AT CLOSE OF CURRENT PERIOD(1)(2)(11) | DATE OF CONSTRUCTION OR ACQUIRED(3) | LIFE ON WHICH DEPRECIATION IN LATEST INCOME STATEMENT IS COMPUTED | ||||||||||||||||||||||||||||||||||||||||||
| Asia | ||||||||||||||||||||||||||||||||||||||||||||||||||
| Warehouse No 4, Shanghai, China | $ | $ | $ | $ | $ | 2013 | Up to | |||||||||||||||||||||||||||||||||||||||||||
| Jalan Karanggan Muda Raya No 59, Bogor, Indonesia | 2017 | Up to | ||||||||||||||||||||||||||||||||||||||||||||||||
| Jl. Amd Projakal KM 5.5 Rt 46, Kel. Graha Indah, Kec. Balikpapan Utara, Indonesia | ( | 2021 | Up to | |||||||||||||||||||||||||||||||||||||||||||||||
| 1 Serangoon North Avenue 6, Singapore | 2018 | (6) | Up to | |||||||||||||||||||||||||||||||||||||||||||||||
| 2 Yung Ho Road, Singapore | 2016 | (4) | Up to | |||||||||||||||||||||||||||||||||||||||||||||||
| IC1 69 Moo 2, Soi Wat Namdaeng, Bangkok, Thailand | 2016 | (4) | Up to | |||||||||||||||||||||||||||||||||||||||||||||||
| $ | $ | $ | $ | $ | ||||||||||||||||||||||||||||||||||||||||||||||
| Australia | ||||||||||||||||||||||||||||||||||||||||||||||||||
| 8 Whitestone Drive, Austins Ferry, Australia | 2012 | Up to | ||||||||||||||||||||||||||||||||||||||||||||||||
| $ | $ | $ | $ | $ | ||||||||||||||||||||||||||||||||||||||||||||||
| Total | $ | $ | $ | $ | $ | |||||||||||||||||||||||||||||||||||||||||||||
(1)The above information only includes the real estate facilities that are owned. The gross cost includes the cost for land, land improvements, buildings, building improvements and racking. The listing does not reflect the 1,145 leased facilities in our real estate portfolio. In addition, the above information does not include any value for financing leases for property that is classified as land, buildings and building improvements in our consolidated financial statements.
(2)Amount includes cumulative impact of foreign currency translation fluctuations.
(3)Date of construction or acquired represents the date we constructed the facility or acquired the facility through purchase or acquisition.
(4)Property was acquired in connection with our acquisition of Recall Holdings Limited.
(5)Property was acquired in connection with our acquisition of IO Data Centers, LLC.
(6)Property was acquired in connection with our acquisition of Credit Suisse International and Credit Suisse AG.
(7)Property was acquired in connection with our acquisition of Information Fort, LLC.
(8)Property was acquired in connection with the Frankfurt data center acquisition.
(9)Property was acquired in connection with our acquisition of XData Properties, S.L.U.
(10)This date represents the date the categorization of the property was changed from a leased facility to an owned facility.
138 | IRON MOUNTAIN 2023 FORM 10-K | |||||||
Part IV
IRON MOUNTAIN INCORPORATED
SCHEDULE III—SCHEDULE OF REAL ESTATE AND ACCUMULATED DEPRECIATION (CONTINUED)
DECEMBER 31, 2023
(Dollars in thousands)
(11)The following tables present the changes in gross carrying amount of real estate owned and accumulated depreciation for the years ended December 31, 2023 and 2022:
| YEAR ENDED DECEMBER 31, | ||||||||||||||
| GROSS CARRYING AMOUNT OF REAL ESTATE | 2023 | 2022 | ||||||||||||
| Gross amount at beginning of period | $ | $ | ||||||||||||
| Additions during period: | ||||||||||||||
| Acquisitions | ||||||||||||||
| Discretionary capital projects | ||||||||||||||
| Foreign currency translation fluctuations | ( | |||||||||||||
| Deductions during period: | ||||||||||||||
| Cost of real estate sold, disposed or written-down | ( | ( | ||||||||||||
Other adjustments(1) | ( | ( | ||||||||||||
| ( | ( | |||||||||||||
| Gross amount at end of period | $ | $ | ||||||||||||
(1)For the years ended December 31, 2023 and 2022, this includes the cost of racking associated with the facilities sold as part of the sale-leaseback transactions.
| YEAR ENDED DECEMBER 31, | ||||||||||||||
| ACCUMULATED DEPRECIATION | 2023 | 2022 | ||||||||||||
| Gross amount of accumulated depreciation at beginning of period | $ | $ | ||||||||||||
| Additions during period: | ||||||||||||||
| Depreciation | ||||||||||||||
| Foreign currency translation fluctuations | ( | |||||||||||||
| Deductions during period: | ||||||||||||||
| Amount of accumulated depreciation for real estate assets sold, disposed or written-down | ( | ( | ||||||||||||
Other adjustments(1) | ( | ( | ||||||||||||
| ( | ( | |||||||||||||
| Gross amount of end of period | $ | $ | ||||||||||||
(1)For the years ended December 31, 2023 and 2022, this includes the accumulated depreciation of racking associated with the facilities sold as part of the sale-leaseback transactions.
The aggregate cost of our real estate assets for federal tax purposes at December 31, 2023 was approximately $4,841,210 .
ITEM 16. FORM 10-K SUMMARY.
Not applicable.
IRON MOUNTAIN 2023 FORM 10-K | 139 | |||||||
INDEX TO EXHIBITS
Certain exhibits indicated below are incorporated by reference to documents we have filed with the SEC. Each exhibit marked by a pound sign (#) is a management contract or compensatory plan.
140 | IRON MOUNTAIN 2023 FORM 10-K | |||||||
| EXHIBIT | ITEM | |||||||
| 10.8 | Fourth Amendment to the Iron Mountain Incorporated 2002 Stock Incentive Plan. (#) (Incorporated by reference to the Company’s Current Report on Form 8‑K dated December 10, 2008.) | |||||||
| 10.9 | Fifth Amendment to the Iron Mountain Incorporated 2002 Stock Incentive Plan. (#) (Incorporated by reference to the Company’s Current Report on Form 8‑K dated June 9, 2010.) | |||||||
| 10.10 | Sixth Amendment to the Iron Mountain Incorporated 2002 Stock Incentive Plan. (#) (Incorporated by reference to the Company’s Quarterly Report on Form 10‑Q for the quarter ended June 30, 2011.) | |||||||
| 10.11 | Iron Mountain Incorporated 2013 Employee Stock Purchase Plan. (#) (Incorporated by reference to Appendix A to the Company's Proxy Statement for the Annual Meeting of Stockholders, filed with the SEC on April 24, 2013.) | |||||||
| 10.12 | First Amendment to the Iron Mountain Incorporated 2013 Employee Stock Purchase Plan. (#) (Incorporated by reference to the Company's Current Report on Form 8-K dated May 17, 2021.) | |||||||
| 10.13 | Iron Mountain Incorporated 2014 Stock and Cash Incentive Plan. (#) (Incorporated by reference to Annex C to the Iron Mountain Incorporated Proxy Statement for the Special Meeting of Stockholders, filed with the SEC on December 23, 2014.) | |||||||
| 10.14 | First Amendment to the Iron Mountain Incorporated 2014 Stock and Cash Incentive Plan. (#) (Incorporated by reference to the Company’s Current Report on Form 8-K dated May 23, 2017.) | |||||||
| 10.15 | Second Amendment to the Iron Mountain Incorporated 2014 Stock and Cash Incentive Plan. (#) (Incorporated by reference to the Company’s Quarterly Report on Form 10-Q for the quarter ended September 30, 2018.) | |||||||
| 10.16 | Third Amendment to the Iron Mountain Incorporated 2014 Stock and Cash Incentive Plan. (#) (Incorporated by reference to the Company's Current Report on Form 8-K dated May 17, 2021.) | |||||||
| 10.17 | Form of Iron Mountain Incorporated Amended and Restated Non‑Qualified Stock Option Agreement. (#) (Incorporated by reference to the Company’s Annual Report on Form 10‑K for the year ended December 31, 2004.) | |||||||
| 10.18 | Form of Iron Mountain Incorporated Incentive Stock Option Agreement. (#) (Incorporated by reference to the Company’s Annual Report on Form 10‑K for the year ended December 31, 2004.) | |||||||
| 10.19 | Form of Iron Mountain Incorporated 1995 Stock Incentive Plan Non‑Qualified Stock Option Agreement (version 1). (#) (Incorporated by reference to the Company’s Annual Report on Form 10‑K for the year ended December 31, 2004.) | |||||||
| 10.20 | Form of Iron Mountain Incorporated 1995 Stock Incentive Plan Amended and Restated Iron Mountain Non‑Qualified Stock Option Agreement. (#) (Incorporated by reference to the Company’s Annual Report on Form 10‑K for the year ended December 31, 2004.) | |||||||
| 10.21 | Form of Iron Mountain Incorporated 1995 Stock Incentive Plan Incentive Stock Option Agreement. (#) (Incorporated by reference to the Company’s Annual Report on Form 10‑K for the year ended December 31, 2004.) | |||||||
| 10.22 | Form of Iron Mountain Incorporated 1995 Stock Incentive Plan Non‑Qualified Stock Option Agreement (version 2). (#) (Incorporated by reference to the Company’s Annual Report on Form 10‑K for the year ended December 31, 2004.) | |||||||
| 10.23 | Form of Iron Mountain Incorporated 2002 Stock Incentive Plan Stock Option Agreement (version 2B). (#) (Incorporated by reference to the Company’s Annual Report on Form 10‑K for the year ended December 31, 2013.) | |||||||
| 10.24 | Form of Performance Unit Agreement pursuant to the Iron Mountain Incorporated 2002 Stock Incentive Plan (version 3). (#) (Incorporated by reference to the Company’s Quarterly Report on Form 10‑Q for the quarter ended March 31, 2013.) | |||||||
| 10.25 | Form of Performance Unit Agreement pursuant to the Iron Mountain Incorporated 2002 Stock Incentive Plan (version 20). (#) (Incorporated by reference to the Company’s Quarterly Report on Form 10‑Q for the quarter ended March 31, 2013.) | |||||||
| 10.26 | Form of Performance Unit Agreement pursuant to the Iron Mountain Incorporated 2002 Stock Incentive Plan (version 21). (#) (Incorporated by reference to the Company’s Current Report on Form 8‑K dated March 19, 2014.) | |||||||
| 10.27 | Form of Restricted Stock Unit Agreement pursuant to the Iron Mountain Incorporated 2002 Stock Incentive Plan (version 3). (#) (Incorporated by reference to the Company’s Quarterly Report on Form 10‑Q for the quarter ended June 30, 2012.) | |||||||
| 10.28 | Form of Restricted Stock Unit Agreement pursuant to the Iron Mountain Incorporated 2002 Stock Incentive Plan (version 12). (#) (Incorporated by reference to the Company’s Annual Report on Form 10-K for the year ended December 31, 2017.) | |||||||
| 10.29 | Form of Restricted Stock Unit Agreement pursuant to the Iron Mountain Incorporated 2014 Stock and Cash Incentive Plan (version 1). (#) (Incorporated by reference to the Company’s Annual Report on Form 10 K for the year ended December 31, 2014.) | |||||||
| 10.30 | Form of Restricted Stock Unit Agreement pursuant to the Iron Mountain Incorporated 2014 Stock and Cash Incentive Plan (version 2). (#) (Incorporated by reference to the Company’s Annual Report on Form 10-K for the year ended December 31, 2017.) | |||||||
| 10.31 | Form of Restricted Stock Unit Agreement pursuant to the Iron Mountain Incorporated 2014 Stock and Cash Incentive Plan (version 3). (#) (Incorporated by reference to the Company’s Quarterly Report on Form 10-Q for the quarter ended March 31, 2019.) | |||||||
| 10.32 | Form of Restricted Stock Unit Agreement pursuant to the Iron Mountain Incorporated 2014 Stock and Cash Incentive Plan (version 4). (#) (Incorporated by reference to the Company’s Annual Report on Form 10‑K for the year ended December 31, 2021.) | |||||||
| 10.33 | ||||||||
IRON MOUNTAIN 2023 FORM 10-K | 141 | |||||||
| EXHIBIT | ITEM | |||||||
| 10.34 | Form of Stock Option Agreement pursuant to the Iron Mountain Incorporated 2014 Stock and Cash Incentive Plan (version 1). (#) (Incorporated by reference to the Company’s Annual Report on Form 10‑K for the year ended December 31, 2014.) | |||||||
| 10.35 | Form of Stock Option Agreement pursuant to the Iron Mountain Incorporated 2014 Stock and Cash Incentive Plan (version 2). (#) (Incorporated by reference to the Company’s Annual Report on Form 10-K for the year ended December 31, 2017.) | |||||||
| 10.36 | Form of Stock Option Agreement pursuant to the Iron Mountain Incorporated 2014 Stock and Cash Incentive Plan (version 3). (#) (Incorporated by reference to the Company’s Quarterly Report on Form 10-Q for the quarter ended March 31, 2019.) | |||||||
| 10.37 | Form of Stock Option Form of Stock Option Agreement pursuant to the Iron Mountain Incorporated 2014 Stock and Cash Incentive Plan (version 4). (#) (Incorporated by reference to the Company's Annual Report on Form 10-K for the year ended December 31, 2019.) | |||||||
| 10.38 | Form of Stock Option Agreement pursuant to the Iron Mountain Incorporated 2014 Stock and Cash Incentive Plan (version 5). (#) (Incorporated by reference to the Company’s Annual Report on Form 10‑K for the year ended December 31, 2021.) | |||||||
| 10.39 | Form of Performance Unit Agreement pursuant to the Iron Mountain Incorporated 2014 Stock and Cash Incentive Plan (version 1). (#) (Incorporated by reference to the Company’s Annual Report on Form 10‑K for the year ended December 31, 2016.) | |||||||
| 10.40 | Form of Performance Unit Agreement pursuant to the Iron Mountain Incorporated 2014 Stock and Cash Incentive Plan (version 2). (#) (Incorporated by reference to the Company’s Annual Report on Form 10‑K for the year ended December 31, 2016.) | |||||||
| 10.41 | Form of Performance Unit Agreement pursuant to the Iron Mountain Incorporated 2014 Stock and Cash Incentive Plan (version 3). (#) (Incorporated by reference to the Company’s Annual Report on Form 10-K for the year ended December 31, 2017.) | |||||||
| 10.42 | Form of Performance Unit Agreement pursuant to the Iron Mountain Incorporated 2014 Stock and Cash Incentive Plan (version 4). (#) (Incorporated by reference to the Company’s Quarterly Report on Form 10-Q for the quarter ended March 31, 2019.) | |||||||
| 10.43 | Form of Performance Unit Agreement pursuant to the Iron Mountain Incorporated 2014 Stock and Cash Incentive Plan (version 5). (#) (Incorporated by reference to the Company’s Annual Report on Form 10‑K for the year ended December 31, 2021.) | |||||||
| 10.44 | ||||||||
| 10.45 | ||||||||
| 10.46 | Change in Control Agreement, dated September 8, 2008, between the Company and Ernest W. Cloutier. (#) (Incorporated by reference to the Company’s Quarterly Report on Form 10‑Q for the quarter ended March 31, 2014.) | |||||||
| 10.47 | Employment Offer Letter, dated November 30, 2012, from the Company to William L. Meaney. (#) (Incorporated by reference to the Company’s Current Report on Form 8‑K dated December 3, 2012.) | |||||||
| 10.48 | Contract of Employment with Iron Mountain, between Patrick Keddy and Iron Mountain (UK) Ltd., effective as of April 2, 2015. (#) (Incorporated by reference to the Company’s Annual Report on Form 10‑K for the year ended December 31, 2015.) | |||||||
| 10.49 | Ernest Cloutier Secondment Letter, dated March 27, 2017. (#) (Incorporated by reference to the Company’s Quarterly Report on Form 10‑Q for the quarter ended March 31, 2017.) | |||||||
| 10.50 | Ernest Cloutier Separation Agreement, dated August 6, 2021. (#) (Incorporated by reference to the Company's Quarterly Report on Form 10-Q for the quarter ended September 30, 2021.) | |||||||
| 10.51 | ||||||||
| 10.52 | Iron Mountain Incorporated Director Deferred Compensation Plan. (#) (Incorporated by reference to the Company’s Annual Report on Form 10‑K for the year ended December 31, 2007.) | |||||||
| 10.53 | The Iron Mountain Companies Severance Plan. (#) (Incorporated by reference to the Company’s Current Report on Form 8‑K, dated March 13, 2012.) | |||||||
| 10.54 | Amended and Restated Severance Plan Severance Program No. 1. (#) (Incorporated by reference to the Company’s Quarterly Report on Form 10‑Q for the quarter ended March 31, 2012.) | |||||||
| 10.55 | First Amendment to Amended and Restated Severance Plan Severance Program No. 1. (#) (Incorporated by reference to the Company’s Annual Report on Form 10‑K for the year ended December 31, 2012.) | |||||||
| 10.56 | Second Amendment to The Iron Mountain Companies Severance Plan Severance Program No. 1. (#) (Incorporated by reference to the Company’s Current Report on Form 8‑K dated December 19, 2014.) | |||||||
| 10.57 | Severance Program No. 2. (#) (Incorporated by reference to the Company’s Current Report on Form 8‑K dated December 3, 2012.) | |||||||
| 10.58 | Credit Agreement, dated as of June 27, 2011, as amended and restated as of August 21, 2017, among the Company, Iron Mountain Information Management, LLC, certain other subsidiaries of the Company party thereto, the lenders and other financial institutions party thereto, JPMorgan Chase Bank, N.A., Toronto Branch, as Canadian Administrative Agent, and JPMorgan Chase Bank, N.A., as Administrative Agent. (Incorporated by reference to the Company’s Current Report on Form 8‑K dated August 21, 2017.) | |||||||
142 | IRON MOUNTAIN 2023 FORM 10-K | |||||||
IRON MOUNTAIN 2023 FORM 10-K | 143 | |||||||
SIGNATURES
Pursuant to the requirements of Section 13 or 15(d) of the Securities Exchange Act of 1934, the registrant has duly caused this report to be signed on its behalf by the undersigned, thereunto duly authorized.
| IRON MOUNTAIN INCORPORATED | ||||||||||||||
| By: | /s/ DANIEL BORGES | |||||||||||||
Daniel Borges Senior Vice President, Chief Accounting Officer (Principal Accounting Officer) | ||||||||||||||
Dated: February 22, 2024
Pursuant to the requirements of the Securities Exchange Act of 1934, this report has been signed below by the following persons on behalf of the registrant and in the capacities and on the dates indicated.
| NAME | TITLE | DATE | ||||||||||||
| /s/ WILLIAM L. MEANEY | President and Chief Executive Officer and Director (Principal Executive Officer) | February 22, 2024 | ||||||||||||
| William L. Meaney | ||||||||||||||
| /s/ BARRY A. HYTINEN | Executive Vice President and Chief Financial Officer (Principal Financial Officer) | February 22, 2024 | ||||||||||||
| Barry A. Hytinen | ||||||||||||||
| /s/ DANIEL BORGES | Senior Vice President, Chief Accounting Officer (Principal Accounting Officer) | February 22, 2024 | ||||||||||||
| Daniel Borges | ||||||||||||||
| /s/ JENNIFER M. ALLERTON | Director | February 22, 2024 | ||||||||||||
| Jennifer M. Allerton | ||||||||||||||
| /s/ PAMELA M. ARWAY | Director | February 22, 2024 | ||||||||||||
| Pamela M. Arway | ||||||||||||||
| /s/ CLARKE H. BAILEY | Director | February 22, 2024 | ||||||||||||
| Clarke H. Bailey | ||||||||||||||
| /s/ KENT P. DAUTEN | Director | February 22, 2024 | ||||||||||||
| Kent P. Dauten | ||||||||||||||
| /s/ MONTE E. FORD | Director | February 22, 2024 | ||||||||||||
| Monte E. Ford | ||||||||||||||
| /s/ ROBIN L. MATLOCK | Director | February 22, 2024 | ||||||||||||
| Robin L. Matlock | ||||||||||||||
144 | IRON MOUNTAIN 2023 FORM 10-K | |||||||
| NAME | TITLE | DATE | ||||||||||||
| /s/ WENDY J. MURDOCK | Director | February 22, 2024 | ||||||||||||
| Wendy J. Murdock | ||||||||||||||
| /s/ WALTER C. RAKOWICH | Director | February 22, 2024 | ||||||||||||
| Walter. C. Rakowich | ||||||||||||||
| /s/ DOYLE R. SIMONS | Director | February 22, 2024 | ||||||||||||
| Doyle R. Simons | ||||||||||||||
| /s/ THEODORE R. SAMUELS | Director | February 22, 2024 | ||||||||||||
| Theodore R. Samuels | ||||||||||||||
IRON MOUNTAIN 2023 FORM 10-K | 145 | |||||||