Table of Contents
REGISTRATION STATEMENT PURSUANT TO SECTION 12(b) OR 12(g) OF THE SECURITIES EXCHANGE ACT OF 1934 |
ANNUAL REPORT PURSUANT TO SECTION 13 OR 15(d) OF THE SECURITIES EXCHANGE ACT OF 1934 For the fiscal year ended |
TRANSITION REPORT PURSUANT TO SECTION 13 OR 15(d) OF THE SECURITIES EXCHANGE ACT OF 1934 |
SHELL COMPANY REPORT PURSUANT TO SECTION 13 OR 15(d) OF THE SECURITIES EXCHANGE ACT OF 1934 |
Title of Each Class |
Trading Symbol(s) |
Name of Each Exchange On Which Registered | ||
(one American depositary share representing two Class A ordinary shares, par value US$0.00002 per share) |
(The Nasdaq Global Select Market) | |||
The Stock Exchange of Hong Kong Limited |
Class A ordinary shares (excluding 39,198,170 Class A ordinary shares, which consisted of shares issued to the depositary bank for bulk issuance of ADSs reserved for future issuances upon the exercise or vesting of awards granted under our share incentive plans and shares repurchased but not yet cancelled) and |
| ☒ | Accelerated filer | ☐ | ||||||
Non-accelerated filer |
☐ | Emerging growth company | ||||||
| † | The term “new or revised financial accounting standard” refers to any update issued by the Financial Accounting Standards Board to its Accounting Standards Codification after April 5, 2012. |
International Financial Reporting Standards as issued by the International Accounting Standards Board ☐ |
Other ☐ |
Table of Contents
TABLE OF CONTENT
i
Table of Contents
INTRODUCTION
Unless otherwise indicated or the context otherwise requires, references in this annual report to:
| • | “ADSs” are to our American depositary shares, each of which represents two Class A ordinary shares; |
| • | “CCASS” are to the Central Clearing and Settlement System established and operated by Hong Kong Securities Clearing Company Limited, a wholly-owned subsidiary of Hong Kong Exchange and Clearing Limited; |
| • | “China” or the “PRC” are to the People’s Republic of China; |
| • | “CSRC” are to the China Securities Regulatory Commission; |
| • | “HFCAA” are to the Holding Foreign Companies Accountable Act, which was enacted on December 18, 2020, signed into law on December 29, 2022 and amended by the Consolidated Appropriations Act, 2023; |
| • | “HK$” or “Hong Kong dollars” or “HK dollars” are to Hong Kong dollars, the lawful currency of Hong Kong; |
| • | “Hong Kong” or “HK” or “Hong Kong S.A.R.” are to the Hong Kong Special Administrative Region of the PRC; |
| • | “Hong Kong Listing Rules” are to the Rules Governing the Listing of Securities on The Stock Exchange of Hong Kong Limited, as amended or supplemented from time to time; |
| • | “Hong Kong Share Registrar” are to Computershare Hong Kong Investor Services Limited; |
| • | “Hong Kong Stock Exchange” are to The Stock Exchange of Hong Kong Limited; |
| • | “JD Health” are to JD Health International Inc., a consolidated subsidiary of our company and the shares of which are listed on the Main Board of the Hong Kong Stock Exchange (Stock Code: 6618 (HKD counter) and 86618 (RMB counter)), and, except where the context otherwise requires, its subsidiaries and the consolidated variable interest entities and their subsidiaries; |
| • | “JD Industrials” are to JINGDONG Industrials, Inc. (formerly known as JD Industrial Technology Inc. and renamed as in March 2023), a consolidated subsidiary of our company and, except where the context otherwise requires, its subsidiaries and the consolidated variable interest entities and their subsidiaries; |
| • | “JD Logistics” are to JD Logistics, Inc., a consolidated subsidiary of our company and the shares of which are listed on the Main Board of the Hong Kong Stock Exchange (Stock Code: 2618), and, except where the context otherwise requires, its subsidiaries and the consolidated variable interest entities and their subsidiaries; |
| • | “JD Property” are to JINGDONG Property, Inc. (formerly known as JD Property Group Corporation and renamed as in March 2023), a consolidated subsidiary of our company and, except where the context otherwise requires, its subsidiaries and the consolidated variable interest entities and their subsidiaries; |
| • | “Main Board” are to the stock market (excluding the option market) operated by the Hong Kong Stock Exchange which is independent from and operated in parallel with the GEM of the Hong Kong Stock Exchange; |
| • | “ordinary shares” are to our Class A and Class B ordinary shares, par value US$0.00002 per share; |
| • | “PCAOB” are to the Public Company Accounting Oversight Board of the United States; |
| • | “SEC” are to the United States Securities and Exchange Commission; |
1
Table of Contents
| • | “SFO” are to the Securities and Futures Ordinance (Chapter 571 of the Laws of Hong Kong), as amended or supplemented from time to time; and |
| • | “we,” “us,” “our company” or “our” are to JD.com, Inc., its subsidiaries, and, in the context of describing our operations and consolidated financial information, the consolidated variable interest entities and their subsidiaries. The consolidated variable interest entities include, among others, Beijing Jingdong 360 Degree E-Commerce Co., Ltd., Jiangsu Yuanzhou E-Commerce Co., Ltd., Xi’an Jingdong Xincheng Information Technology Co., Ltd., Jiangsu Jingdong Bangneng Investment Management Co., Ltd., and Suqian Juhe Digital Enterprise Management Co., Ltd. References to the consolidated variable interest entities may include their subsidiaries, depending on the context as appropriate. The consolidated variable interest entities are PRC companies conducting operations in the Chinese mainland, and their financial results have been consolidated into our consolidated financial statements under U.S. GAAP for accounting purposes. JD.com, Inc. is a holding company with no operations of its own. We do not have any equity ownership in the consolidated variable interest entities. |
Summary of Risk Factors
An investment in our ADSs or Class A ordinary shares involves significant risks. Below is a summary of material risks we face, organized under relevant headings. The operational risks associated with being based in and having operations in the Chinese mainland also apply to operations in Hong Kong and Macau. While entities and businesses in Hong Kong and Macau operate under different sets of laws from the Chinese mainland, the legal risks associated with being based in and having operations in the Chinese mainland could apply to our operations in Hong Kong and Macau, if the laws applicable to the Chinese mainland become applicable to entities and businesses in Hong Kong and Macau in the future. These risks are discussed more fully in “Item 3.D. Key Information—Risk Factors.”
Risks Related to Our Business
Risks and uncertainties relating to our business include, but are not limited to, the following:
| • | If we are unable to manage our growth or execute our strategies effectively, our business and prospects may be materially and adversely affected. See “Item 3.D. Key Information—Risk Factors—Risks Related to Our Business—If we are unable to manage our growth or execute our strategies effectively, our business and prospects may be materially and adversely affected” on page 26 for details; |
| • | We incurred net losses in the past and we may not be able to maintain profitability in the future. See “Item 3.D. Key Information—Risk Factors—Risks Related to Our Business—We incurred net losses in the past and we may not be able to maintain profitability in the future” on page 26 for details; |
| • | If we are unable to provide superior customer experience, our business and reputation may be materially and adversely affected. See “Item 3.D. Key Information—Risk Factors—Risks Related to Our Business—If we are unable to provide superior customer experience, our business and reputation may be materially and adversely affected” on page 26 for details; |
| • | Uncertainties relating to the growth and profitability of the retail industry in China in general, and the online retail industry in particular, could adversely affect our revenues and business prospects. See “Item 3.D. Key Information—Risk Factors—Risks Related to Our Business—Uncertainties relating to the growth and profitability of the retail industry in China in general, and the online retail industry in particular, could adversely affect our business, prospects and results of operations” on page 27 for details; |
| • | Any harm to our JD brand or reputation may materially and adversely affect our business and results of operations. See “Item 3.D. Key Information—Risk Factors—Risks Related to Our Business—Any harm to our JD brand or reputation may materially and adversely affect our business and results of operations” on page 28 for details; |
| • | If we are unable to offer products that attract purchases from new and existing customers, our business, financial condition and results of operations may be materially and adversely affected. See “Item 3.D. Key Information—Risk Factors—Risks Related to Our Business—If we are unable to offer products that attract purchases from new and existing customers, our business, financial condition and results of operations may be materially and adversely affected” on page 28 for details; |
2
Table of Contents
| • | If we are unable to manage our nationwide fulfillment infrastructure efficiently and effectively, our business prospects and results of operations may be materially and adversely affected. See “Item 3.D. Key Information—Risk Factors—Risks Related to Our Business—If we are unable to manage our nationwide fulfillment infrastructure efficiently and effectively, our business prospects and results of operations may be materially and adversely affected” on page 29 for details; |
| • | We face intense competition. We may not be able to maintain or may lose market share and customers if we fail to compete effectively. See “Item 3.D. Key Information—Risk Factors—Risks Related to Our Business—We face intense competition. We may not be able to maintain or may lose market share and customers if we fail to compete effectively” on page 29 for details; |
| • | Our expansion into new product categories and substantial increase in the number of products may expose us to new challenges and more risks. See “Item 3.D. Key Information—Risk Factors—Risks Related to Our Business—Our expansion into new product categories and substantial increase in the number of products may expose us to new challenges and more risks” on page 30 for details; |
| • | If we fail to manage our inventory effectively, our results of operations, financial condition and liquidity may be materially and adversely affected. See “Item 3.D. Key Information—Risk Factors—Risks Related to Our Business—If we fail to manage our inventory effectively, our results of operations, financial condition and liquidity may be materially and adversely affected” on page 30 for details; |
| • | Failure to protect confidential information of our customers and network against security breaches could damage our reputation and brand and substantially harm our business and results of operations. See “Item 3.D. Key Information—Risk Factors—Risks Related to Our Business—Failure to protect confidential information of our customers and network against security breaches could damage our reputation and brand and substantially harm our business and results of operations” on page 40 for details; |
| • | Our business is subject to complex and evolving Chinese and international laws and regulations regarding data privacy and cybersecurity. See “Item 3.D. Key Information—Risk Factors—Risks Related to Our Business—Our business is subject to complex and evolving Chinese and international laws and regulations regarding data privacy and cybersecurity.” on page 41 for details; |
| • | The approval of the CSRC or other PRC government authorities may be required in connection with our offshore offerings under PRC law, and, if required, we cannot predict whether or for how long we will be able to obtain such approval. See “Item 3.D. Key Information—Risk Factors—Risks Related to Our Business—The approval of and/or filing with the CSRC or other PRC government authorities may be required in connection with our offshore offerings under PRC law, and, if required, we cannot predict whether or for how long we will be able to obtain such approval or complete such filing” on page 56 for details; |
| • | The PCAOB had historically been unable to inspect our auditor in relation to their audit work performed for our financial statements and the inability of the PCAOB to conduct inspections of our auditor in the past has deprived our investors with the benefits of such inspections. See “Item 3.D. Key Information—Risk Factors—Risks Related to Our Business—The PCAOB had historically been unable to inspect our auditor in relation to their audit work performed for our financial statements and the inability of the PCAOB to conduct inspections of our auditor in the past has deprived our investors with the benefits of such inspections” on page 57 for details; and |
| • | Our ADSs may be prohibited from trading in the United States under the HFCAA in the future if the PCAOB is unable to inspect or investigate completely auditors located in China. The delisting of the ADSs, or the threat of their being delisted, may materially and adversely affect the value of your investment. See “Item 3.D. Key Information—Risk Factors—Risks Related to Our Business—Our ADSs may be prohibited from trading in the United States under the HFCAA in the future if the PCAOB is unable to inspect or investigate completely auditors located in China. The delisting of the ADSs, or the threat of their being delisted, may materially and adversely affect the value of your investment” on page 57 for details. |
3
Table of Contents
Risks Related to Our Corporate Structure
Risks and uncertainties relating to our corporate structure include, but are not limited to, the following:
| • | We are a Cayman Islands holding company with no equity ownership in the consolidated variable interest entities and we conduct certain of our operations through the consolidated variable interest entities, with which we have maintained contractual arrangements. Investors in our ADSs or Class A ordinary shares thus are not purchasing equity interest in the consolidated variable interest entities in China but instead are purchasing equity interest in a Cayman Islands holding company. If the PRC government determines that the contractual agreements that constituting part of the consolidated variable interest entities the structure do not comply with PRC laws and regulations, or if these laws and regulations change or are interpreted differently in the future, we could be subject to severe penalties or be forced to relinquish our interests in those operations. Our holding company, the consolidated variable interest entities and investors of our company face uncertainty about potential future actions by the PRC government that could affect the enforceability of the contractual arrangements with the consolidated variable interest entities and, consequently, significantly affect the financial performance of the consolidated variable interest entities and our company as a whole. The PRC regulatory authorities could disallow the variable interest entities structure, which would likely result in a material adverse change in our operations, and our ADSs or Class A ordinary shares may decline significantly in value. See “Item 3.D. Key Information—Risk Factors—Risks Related to Our Corporate Structure—If the PRC government determines that the contractual arrangements constituting part of the consolidated variable interest entities structure do not comply with PRC laws and regulations, or if these laws and regulations change or are interpreted differently in the future, we could be subject to severe penalties or be forced to relinquish our interests in those operations” on page 59 for details; |
| • | Any failure by the consolidated variable interest entities or their shareholders to perform their obligations under the contractual arrangements with them would have a material and adverse effect on our business. See “Item 3.D. Key Information—Risk Factors—Risks Related to Our Corporate Structure—Any failure by the consolidated variable interest entities or their shareholders to perform their obligations under our contractual arrangements with them would have a material and adverse effect on our business” on page 62 for details; and |
| • | The shareholders of the consolidated variable interest entities may have potential conflicts of interest with us, which may materially and adversely affect our business and financial condition. See “Item 3.D. Key Information—Risk Factors—Risks Related to Our Corporate Structure—The shareholders of the consolidated variable interest entities may have potential conflicts of interest with us, which may materially and adversely affect our business and financial condition” on page 62 for details. |
Risks Related to Doing Business in China
We are also subject to risks and uncertainties relating to doing business in China in general, including, but are not limited to, the following:
| • | PRC government has significant authority in regulating our operations and may influence our operations. It may exert more oversight and control over offerings conducted overseas by, and/or foreign investment in, China-based issuers, which could significantly limit or completely hinder our ability to offer or continue to offer securities to investors. Implementation of industry-wide regulations in this nature may cause the value of such securities to significantly decline. See “Item 3.D. Key Information—Risk Factors—Risks Related to Doing Business in China—The PRC government’s significant oversight over our business operation could result in a material adverse change in our operations and the value of our ADSs and Class A ordinary shares” on page 69 for details; |
| • | Changes in China’s or global economic, political or social conditions or government policies could have a material and adverse effect on our business and operations. See “Item 3.D. Key Information—Risk Factors—Risks Related to Doing Business in China—Changes in China’s or global economic, political or social conditions or government policies could have a material and adverse effect on our business and operations” on page 66 for details; |
4
Table of Contents
| • | Uncertainties with respect to the legal system in the Chinese mainland could adversely affect us. Certain laws and regulations in the Chinese mainland can evolve quickly, which bring risks and uncertainties to their interpretation and enforcement. Administrative and court proceedings in the Chinese mainland may be protracted. Some government policies and internal rules may not be published on a timely manner. These risks and uncertainties may make it difficult for us to meet or comply with requirements under the applicable laws and regulations. See “Item 3.D. Key Information—Risk Factors—Risks Related to Doing Business in China—Uncertainties with respect to the legal system in the Chinese mainland could adversely affect us” on page 66 for details; |
| • | We are subject to consumer protection laws that could require us to modify our current business practices and incur increased costs. See “Item 3.D. Key Information—Risk Factors—Risks Related to Doing Business in China—We are subject to consumer protection laws that could require us to modify our current business practices and incur increased costs” on page 66 for details; |
| • | We may be adversely affected by the complexity and changes in PRC regulation of internet-related business and companies. See “Item 3.D. Key Information—Risk Factors—Risks Related to Doing Business in China—We may be adversely affected by the complexity and changes in PRC regulation of internet-related business and companies such as e-commerce business and internet platforms” on page 67 for details; and |
| • | The funds in our PRC subsidiaries or the consolidated variable interest entities in the Chinese mainland may not be available to fund operations or for other use outside of the Chinese mainland if our holding company, our subsidiaries, or the consolidated variable interest entities do not comply with applicable laws or regulations on cash transfers. Although currently there are not equivalent or similar requirements in Hong Kong on cash transfers in, or out of, our Hong Kong entities, if certain requirements in the Chinese mainland were to become applicable to cash transfers in and out of Hong Kong entities in the future, the funds in our Hong Kong entities, likewise, may not be available to fund operations or for other use outside of Hong Kong. See “Item 3.D. Key Information—Risk Factors—Risks Related to Doing Business in China—We may rely on dividends and other distributions on equity paid by our PRC subsidiaries to fund any cash and financing requirements we may have, and any limitation on the ability of our PRC subsidiaries to make payments to us could have a material and adverse effect on our ability to conduct our business” on page 63 and “Item 3.D. Key Information—Risk Factors—Risks Related to Doing Business in China—Governmental regulation of currency conversion may limit our ability to utilize our revenues effectively and affect the value of your investment” on page 71 for details. |
Risks Related to Our ADSs and Class A Ordinary Shares
In addition to the risks described above, we are subject to general risks relating to our ADSs and Class A ordinary shares, including the following:
| • | The trading price of our ADSs and Class A ordinary shares have been and are likely to continue to be volatile, which could result in substantial losses to holders of our Class A ordinary shares and/or ADSs. See “Item 3.D. Key Information—Risk Factors—Risks Related to Our ADSs and Class A Ordinary Shares—The trading price of our ADSs and Class A ordinary shares have been and are likely to continue to be volatile, which could result in substantial losses to holders of our Class A ordinary shares and/or ADSs” on page 76 for details; |
| • | We adopt different practices as to certain matters as compared with many other companies listed on the Hong Kong Stock Exchange. See “Item 3.D. Key Information—Risk Factors—Risks Related to Our ADSs and Class A Ordinary Shares—We adopt different practices as to certain matters as compared with many other companies listed on the Hong Kong Stock Exchange” on page 77 for details; |
| • | We cannot guarantee that any share repurchase program will be fully consummated or that any share repurchase program will enhance long-term shareholder value, and share repurchases could increase the volatility of the price of our Class A ordinary shares and/or ADSs and could diminish our cash reserves. See “Item 3.D. Key Information—Risk Factors—Risks Related to Our ADSs and Class A Ordinary Shares—We cannot guarantee that any share repurchase program will be fully consummated or that any share repurchase program will enhance long-term shareholder value, and share repurchases could increase the volatility of the price of our Class A ordinary shares and/or ADSs and could diminish our cash reserves” on page 77 for details; and |
5
Table of Contents
| • | If securities or industry analysts do not publish research or publish inaccurate or unfavorable research about our business, the market price for our Class A ordinary shares and/or ADSs and trading volume could decline. See “Item 3.D. Key Information—Risk Factors—Risks Related to Our ADSs and Class A Ordinary Shares—If securities or industry analysts do not publish research or publish inaccurate or unfavorable research about our business, the market price for our Class A ordinary shares and/or ADSs and trading volume could decline” on page 78 for details. |
6
Table of Contents
FORWARD-LOOKING INFORMATION
This annual report on Form 20-F contains forward-looking statements that reflect our current expectations and views of future events. These statements are made under the “safe harbor” provisions of the U.S. Private Securities Litigation Reform Act of 1995. You can identify these forward-looking statements by terminology such as “may,” “will,” “expect,” “anticipate,” “aim,” “estimate,” “intend,” “plan,” “believe,” “is/are likely to,” “future,” “potential,” “continue” or other similar expressions. We have based these forward-looking statements largely on our current expectations and projections about future events and financial trends that we believe may affect our financial condition, results of operations, business strategy and financial needs. These forward-looking statements include statements relating to, among other things:
| • | our goals and strategies; |
| • | our future business development, financial conditions and results of operations; |
| • | the expected growth of the retail and online retail markets in China; |
| • | our expectations regarding demand for and market acceptance of our products and services; |
| • | our expectations regarding our relationships with customers, suppliers and third-party merchants; |
| • | our plans to invest in our fulfillment infrastructure and technology platform as well as new business initiatives; |
| • | competition in our industry; and |
| • | government policies and regulations relating to our industry. |
We would like to caution you not to place undue reliance on these forward-looking statements and you should read these statements in conjunction with the risk factors disclosed in “Item 3.D. Key Information—Risk Factors.” Those risks are not exhaustive. We operate in a rapidly evolving environment. New risks emerge from time to time and it is impossible for our management to predict all risk factors, nor can we assess the impact of all factors on our business or the extent to which any factor, or combination of factors, may cause actual results to differ from those contained in any forward-looking statement. We do not undertake any obligation to update or revise the forward-looking statements except as required under applicable law. You should read this annual report and the documents that we reference in this annual report completely and with the understanding that our actual future results may be materially different from what we expect.
Our reporting currency is the Renminbi, or RMB. This annual report contains translations of RMB and Hong Kong dollar amounts into U.S. dollars at specific rates solely for the convenience of the reader. Unless otherwise stated, all translations of RMB and Hong Kong dollars into U.S. dollars and from U.S. dollars into RMB in this annual report were made at a rate of RMB7.0999 to US$1.00 and HK$7.8109 to US$1.00, the respective exchange rates on December 29, 2023 set forth in the H.10 statistical release of the Federal Reserve Board. We make no representation that any RMB, Hong Kong dollar or U.S. dollar amounts referred to in this annual report could have been, or could be, converted into U.S. dollars, RMB or Hong Kong dollars, as the case may be, at any particular rate or at all.
7
Table of Contents
PART I
| Item 1. | Identity of Directors, Senior Management and Advisers |
Not applicable.
| Item 2. | Offer Statistics and Expected Timetable |
Not applicable.
| Item 3. | Key Information |
Our Organizational Structure
The following diagram illustrates our corporate structure, including our principal subsidiaries and the consolidated variable interest entities as of March 31, 2024:
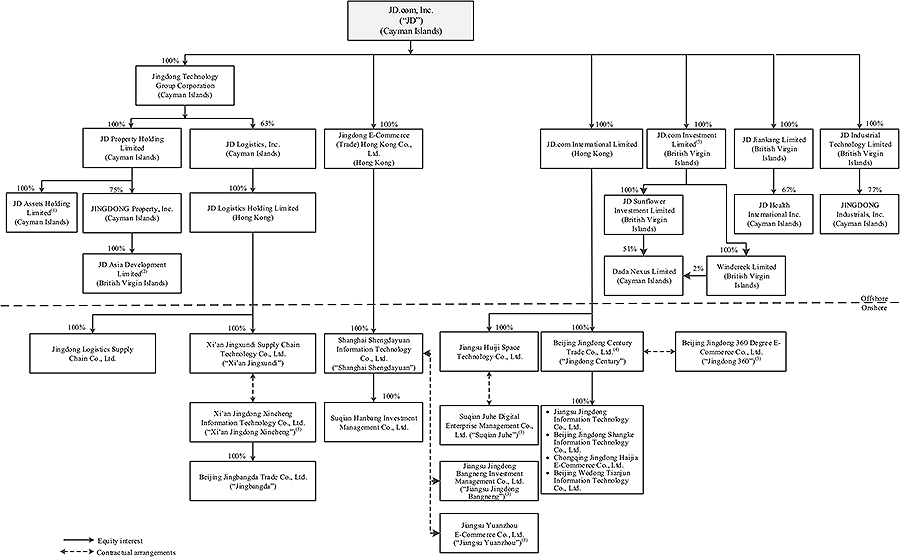
Notes:
| (1) | JD Assets Holding Limited has 65 subsidiaries holding, directly or indirectly, non-logistics properties. |
| (2) | JD Asia Development Limited has 499 subsidiaries holding, directly or indirectly, logistics properties. |
| (3) | Jingdong 360, Jiangsu Yuanzhou, Xi’an Jingdong Xincheng, Jiangsu Jingdong Bangneng and Suqian Juhe are the significant consolidated variable interest entities with which we have contractual arrangements. Suqian Juhe is 45% owned by Mr. Richard Qiangdong Liu, 30% owned by Ms. Yayun Li and 25% owned by Ms. Pang Zhang. Each of Jingdong 360, Jiangsu Yuanzhou, Xi’an Jingdong Xincheng and Jiangsu Jingdong Bangneng is 45% owned by Mr. Qin Miao, 30% owned by Ms. Yayun Li and 25% owned by Ms. Pang Zhang. Mr. Richard Qiangdong Liu is our chairman of board of directors, Mr. Qin Miao is a vice president of our company, Ms. Yayun Li is chief executive officer of JD Technology, a significant investee of our company, and Ms. Pang Zhang is our chief human resources officer. |
| (4) | Jingdong Century has 269 subsidiaries that engage in retail business. |
8
Table of Contents
| (5) | JD.com Investment Limited has 79 subsidiaries that hold, directly or indirectly, the companies invested by us. |
| * | The diagram above omits our equity investees that are insignificant individually and in the aggregate. |
Our Holding Company Structure and Contractual Arrangements with the Consolidated Variable Interest Entities
JD.com, Inc. is not an operating company but a Cayman Islands holding company with no equity ownership in the consolidated variable interest entities, but maintains contractual arrangements with the consolidated variable interest entities and is considered the primary beneficiary of these entities, whose financial results are consolidated in JD.com, Inc.’s consolidated financial statements under the U.S. GAAP for accounting purposes. The contractual arrangements may not be as effective as direct equity ownership in the consolidated variable interest entities, and the government authorities may challenge the enforceability of these contractual arrangements. We conduct our operations in the Chinese mainland through (i) our PRC subsidiaries and (ii) the consolidated variable interest entities with which we have maintained contractual arrangements. The laws and regulations in the Chinese mainland restrict and impose conditions on foreign investment in certain value-added telecommunication services and certain other restricted services related to our businesses, such as domestic document delivery services. Accordingly, we operate these businesses in the Chinese mainland through the consolidated variable interest entities, and such structure is used to provide investors with exposure to foreign investment in China-based companies where laws and regulations in the Chinese mainland prohibit or restrict direct foreign investment in certain operating companies, and rely on contractual arrangements among our PRC subsidiaries, the consolidated variable interest entities and their shareholders to control the business operations of the consolidated variable interest entities. The external revenues contributed by the consolidated variable interest entities accounted for 6.2%, 6.9% and 7.8% of our total revenues for the years of 2021, 2022 and 2023, respectively. As used in this annual report, “we,” “us,” “our company” and “our” refers to JD.com, Inc., its subsidiaries, and, in the context of describing our operations and consolidated financial information, the consolidated variable interest entities in China, including Beijing Jingdong 360 Degree E-Commerce Co., Ltd., or Jingdong 360, which was established in April 2007 and holds our ICP license as an internet information provider and operates our www.jd.com website; Jiangsu Yuanzhou E-Commerce Co., Ltd., or Jiangsu Yuanzhou, which was established in September 2010 and primarily engages in the business of selling books, audio and video products; Xi’an Jingdong Xincheng Information Technology Co., Ltd., or Xi’an Jingdong Xincheng, which was established in June 2017 and primarily provides technology and consulting services relating to logistics services; Jiangsu Jingdong Bangneng Investment Management Co., Ltd., or Jiangsu Jingdong Bangneng, which was established in August 2015 and primarily engages in business of investment management; and Suqian Juhe Digital Enterprise Management Co., Ltd., or Suqian Juhe, which was established in June 2020 and primarily provides enterprise management services. The consolidated variable interest entities are PRC companies conducting operations in the Chinese mainland, and their financial results have been consolidated into our consolidated financial statements under U.S. GAAP for accounting purposes. JD.com, Inc. is a holding company with no operations of its own. We do not have any equity ownership in the consolidated variable interest entities. Investors in our ADSs or Class A ordinary shares are not purchasing equity interest in the consolidated variable interest entities in the Chinese mainland but instead are purchasing equity interest in a holding company incorporated in the Cayman Islands, and may never directly hold equity interests in the consolidated variable interest entities in the Chinese mainland.
A series of contractual agreements, including loan agreements, exclusive purchase option agreements, exclusive technology consulting and services agreements or exclusive business cooperation agreements, as applicable, intellectual property rights license agreement, equity pledge agreements, powers of attorney, business cooperation agreement and business operations agreements, have been entered into by and among our subsidiaries, the consolidated variable interest entities and their respective shareholders. Terms contained in each set of contractual arrangements with the consolidated variable interest entities and their respective shareholders are substantially similar. As a result of the contractual arrangements, we are considered the primary beneficiary of these companies and have consolidated the financial results of these companies in our consolidated financial statements under the U.S. GAAP for accounting purposes. Neither JD.com, Inc. nor its investors has an equity ownership in, direct foreign investment in, or control through such ownership or investment of, the consolidated variable interest entities, and the contractual arrangements are not equivalent to an equity ownership in the business of the consolidated variable interest entities. For more details of these contractual arrangements, see “Item 4.C. Information on the Company—Organizational Structure—The Consolidated Variable Interest Entities.”
9
Table of Contents
However, the contractual arrangements may not be as effective as direct ownership in providing us with control over the consolidated variable interest entities and we may incur substantial costs to enforce the terms of the arrangements. In addition, these agreements have not been tested in courts of the Chinese mainland. See “Item 3.D. Key Information—Risk Factors—Risks Related to Our Corporate Structure—We rely on contractual arrangements with the consolidated variable interest entities and their owners for a portion of our business operations, which may not be as effective as direct ownership in providing operational control” and “Item 3.D. Key Information—Risk Factors—Risks Related to Our Corporate Structure—The shareholders of the consolidated variable interest entities may have potential conflicts of interest with us, which may materially and adversely affect our business and financial condition.”
Our corporate structure is subject to risks associated with the contractual arrangements with the consolidated variable interest entities. If the PRC government determines that the contractual arrangements constituting part of the consolidated variable interest entities structure do not comply with PRC laws and regulations, or if these laws and regulations change or are interpreted differently in the future, we could be subject to severe penalties or be forced to relinquish our interests in those operations. The PRC regulatory authorities could disallow the variable interest entities structure, which would likely result in a material adverse change in our operations, and our ADSs or Class A ordinary shares may decline significantly in value or become worthless. Our holding company, our PRC subsidiaries and the consolidated variable interest entities, and investors of our company face uncertainty about potential future actions by the PRC government that could affect the enforceability of the contractual arrangements with the consolidated variable interest entities and, consequently, significantly affect the financial performance of the consolidated variable interest entities and our company as a whole. For a detailed description of the risks associated with our corporate structure, please refer to risks disclosed under “Item 3.D. Key Information—Risk Factors—Risks Related to Our Corporate Structure.” Specifically, there are also substantial uncertainties regarding the interpretation and application of current and future PRC laws, regulations and rules regarding the status of the rights of our Cayman Islands holding company with respect to its contractual arrangements with the consolidated variable interest entities and their shareholders. It is uncertain whether any new PRC laws or regulations relating to variable interest entity structures will be adopted or if adopted, what they would provide. If we or any of the consolidated variable interest entities is found to be in violation of any existing or future PRC laws or regulations, or fail to obtain or maintain any of the required permits or approvals, the PRC regulatory authorities would have broad discretion to take action in dealing with such violations or failures. See “Item 3.D. Key Information—Risk Factors—Risks Related to Our Corporate Structure—If the PRC government determines that the contractual arrangements constituting part of the consolidated variable interest entities structure do not comply with PRC laws and regulations, or if these laws and regulations change or are interpreted differently in the future, we could be subject to severe penalties or be forced to relinquish our interests in those operations” and “—Our current corporate structure and business operations may be affected by the PRC Foreign Investment Law.”
Risks and Uncertainties Relating to Doing Business in China
We face various risks and uncertainties related to doing business in the Chinese mainland. Our business operations are primarily conducted in the Chinese mainland, and we are subject to complex and evolving laws and regulations in the Chinese mainland. For example, we face risks associated with regulatory approvals on offshore offerings, antimonopoly regulatory actions, and oversight on cybersecurity and data privacy, as well as the lack of inspection by the PCAOB, on our auditor, which may impact our ability to conduct certain businesses, accept foreign investments, or list on a United States stock exchange. These risks could result in a material adverse change in our operations and the value of our ADSs and Class A ordinary shares, significantly limit or completely hinder our ability to continue to offer securities to investors, or cause the value of such securities to significantly decline. As of the date of this annual report, regulatory actions related to data security or anti-monopoly concerns in Hong Kong do not have a material impact on our ability to conduct business, accept foreign investment in the future, continue to list on a United States stock exchange or maintain our listing status on the Hong Kong Stock Exchange. However, new regulatory actions related to data security or anti-monopoly concerns in Hong Kong may be taken in the future, and such regulatory actions may have a material impact on our ability to conduct business, accept foreign investment, continue to list on a United States stock exchange or maintain our listing status on the Hong Kong Stock Exchange. For a detailed description of risks related to doing business in China, please refer to risks disclosed under “Item 3.D. Key Information—Risk Factors—Risks Related to Doing Business in China.”
PRC government has significant authority in regulating our operations and may influence our operations. It may exert more oversight and control over offerings conducted overseas by, and/or foreign investment in, China-based issuers, which could significantly limit or completely hinder our ability to offer or continue to offer securities to investors. Implementation of industry-wide regulations in this nature may cause the value of such securities to significantly decline. For more details, see “Item 3.D. Key Information—Risk Factors—Risks Related to Doing Business in China—The PRC government’s significant oversight over our business operation could result in a material adverse change in our operations and the value of our ADSs and Class A ordinary shares.”
10
Table of Contents
Risks and uncertainties arising from the PRC legal system, including risks and uncertainties regarding the enforcement of laws and quickly evolving rules and regulations in the Chinese mainland, could result in a material adverse change in our operations and the value of our ADSs and Class A ordinary shares. For more details, see “Item 3.D. Key Information—Risk Factors—Risks Related to Doing Business in China—Uncertainties with respect to the legal system in the Chinese mainland could adversely affect us” and “—We may be adversely affected by the complexity and changes in PRC regulation of internet-related business and companies such as e-commerce business and internet platforms.”
The Holding Foreign Companies Accountable Act
Pursuant to the HFCAA, if the SEC determines that we have filed audit reports issued by a registered public accounting firm that has not been subject to inspections by the PCAOB for two consecutive years, the SEC will prohibit our shares or ADSs from being traded on a national securities exchange or in the over-the-counter trading market in the United States. On December 16, 2021, the PCAOB issued a report to notify the SEC of its determination that the PCAOB was unable to inspect or investigate completely registered public accounting firms headquartered in the Chinese mainland and Hong Kong, including our auditor. In May 2022, the SEC conclusively listed us as a Commission-Identified Issuer under the HFCAA following the filing of the annual report on Form 20-F for the fiscal year ended December 31, 2021. On December 15, 2022, the PCAOB issued a report that vacated its December 16, 2021 determination and removed the Chinese mainland and Hong Kong from the list of jurisdictions where it is unable to inspect or investigate completely registered public accounting firms. For this reason, we were not identified as a Commission-Identified Issuer under the HFCAA after we filed our annual report on Form 20-F for the fiscal year ended December 31, 2022 and do not expect to be identified so after we file this annual report on Form 20-F. Each year, the PCAOB will determine whether it can inspect and investigate completely audit firms in the Chinese mainland and Hong Kong, among other jurisdictions. If PCAOB determines in the future that it no longer has full access to inspect and investigate completely accounting firms in the Chinese mainland and Hong Kong and we continue to use an accounting firm headquartered in one of these jurisdictions to issue an audit report on our financial statements filed with the Securities and Exchange Commission, we would be identified as a Commission-Identified Issuer following the filing of the annual report on Form 20-F for the relevant fiscal year. There can be no assurance that we would not be identified as a Commission-Identified Issuer for any future fiscal year, and if we were so identified for two consecutive years, we would become subject to the prohibition on trading under the HFCAA. For more details, see “Item 3.D. Key Information—Risk Factors—Risks Related to Our Business—The PCAOB had historically been unable to inspect our auditor in relation to their audit work performed for our financial statements and the inability of the PCAOB to conduct inspections of our auditor in the past has deprived our investors with the benefits of such inspections” and “Item 3.D. Key Information—Risk Factors—Risks Related to Our Business—Our ADSs may be prohibited from trading in the United States under the HFCAA in the future if the PCAOB is unable to inspect or investigate completely auditors located in China. The delisting of the ADSs, or the threat of their being delisted, may materially and adversely affect the value of your investment.”
Permissions Required from the PRC Authorities for Our Operations
We conduct our business primarily through our PRC subsidiaries and the consolidated variable interest entities in China. Our operations in China are governed by PRC laws and regulations. As of the date of this annual report, our PRC subsidiaries and the consolidated variable interest entities have obtained the necessary licenses and permits from the PRC government authorities, including, among others, ICP licenses, Courier Service Operation Permits and Practicing License for Medical Institutions, except as disclosed in “Item 3.D. Key Information—Risk Factors—Risks Related to Doing Business in China—We may be adversely affected by the complexity and changes in PRC regulation of internet-related business and companies such as e-commerce business and internet platforms.” Given the uncertainties of interpretation and implementation of laws and regulations and the enforcement practice by government authorities, we may be required to obtain additional licenses, permits, filings or approvals for our business and operations in the future.
11
Table of Contents
Furthermore, in connection with our previous issuance of securities to foreign investors, under current PRC laws, regulations and regulatory rules, as of the date of this annual report, we, our PRC subsidiaries and the consolidated variable interest entities, (i) are not required to obtain permissions from the China Securities Regulatory Commission, or the CSRC, (ii) are not required to file an application for cybersecurity review by the Cyberspace Administration of China, or the CAC, as advised by Shihui Partners, our PRC legal counsel, and (iii) have not been asked to obtain or were denied such permissions by any PRC authority.
If (i) we do not receive or maintain any permissions or approvals, (ii) we inadvertently concluded that certain permissions or approvals have been acquired or are not required, or (iii) applicable laws, regulations or interpretations thereof change and we become subject to the requirement of additional permissions or approvals in the future, we cannot assure you that we will be able to obtain such permissions or approvals in a timely manner, or at all, and such approvals may be rescinded even if obtained. Any such circumstance could subject us to penalties, including fines, suspension of business and revocation of required licenses, which could materially and adversely affect our business, financial condition and results of operations.
However, the PRC government has promulgated certain regulations and rules to exert more oversight and control over offerings that are conducted overseas and/or foreign investment in China-based issuers. On February 17, 2023, the CSRC released the Trial Administrative Measures of Overseas Securities Offering and Listing by Domestic Companies and five supporting guidelines, or, collectively, the Trial Measures, which came into effect on March 31, 2023. According to the Trial Measures, domestic companies in the Chinese mainland that directly or indirectly offer or list their securities in an overseas market are required to file with the CSRC. In addition, an overseas-listed company must also submit the filing with respect to its follow-on offerings, issuance of convertible corporate bonds and exchangeable bonds, and other equivalent offering activities, within a specific time frame requested under the Trial Measures. Therefore, we will be required to file with the CSRC for our overseas offering of equity and equity linked securities in the future within the applicable scope of the Trial Measures. For more detailed information, see “Item 3.D. Key Information—Risk Factors—Risks Related to Doing Business in China—The approval of and/or filing with the CSRC or other PRC government authorities may be required in connection with our offshore offerings under PRC law, and, if required, we cannot predict whether or for how long we will be able to obtain such approval or complete such filing.”
Cash and Asset Flows through Our Organization
JD.com, Inc. is a holding company with no operations of its own. We conduct our operations in the Chinese mainland primarily through our subsidiaries and the consolidated variable interest entities in the Chinese mainland. As a result, although other means are available for us to obtain financing at the holding company level, JD.com, Inc.’s ability to pay dividends to the shareholders and investors of the ADSs and to service any debt it may incur may depend upon dividends paid by our PRC subsidiaries and license and service fees paid by the consolidated variable interest entities. If any of our subsidiaries incurs debt on its own behalf in the future, the instruments governing such debt may restrict its ability to pay dividends to JD.com, Inc. In addition, our PRC subsidiaries are permitted to pay dividends to JD.com, Inc. only out of their retained earnings, if any, as determined in accordance with PRC accounting standards and regulations. Further, our PRC subsidiaries and the consolidated variable interest entities are required to make appropriations to certain statutory reserve funds or may make appropriations to certain discretionary funds, which are not distributable as cash dividends except in the event of a solvent liquidation of the companies. For more details, see “Item 5.B. Operating and Financial Review and Prospects—Liquidity and Capital Resources—Holding Company Structure.”
Our board of directors has complete discretion on whether to distribute dividends subject to our current memorandum and articles of association and certain restrictions under Cayman Islands law. In addition, our shareholders may, by ordinary resolution, declare dividends, but no dividend shall exceed the amount recommended by our board of directors. Under Cayman Islands law, a Cayman Islands company may pay a dividend out of either profit or share premium account, provided that in no circumstances may a dividend be paid if this would result in the company being unable to pay its debts as they fall due in the ordinary course of business. See “Item 8.A. Financial Information—Consolidated Statements and Other Financial Information—Dividend Policy” for details.
As a Cayman Islands exempted company and offshore holding company, we are permitted under PRC laws and regulations to provide funding to our wholly foreign-owned subsidiaries in the Chinese mainland only through loans or capital contributions, subject to the approval of government authorities and limits on the amount of capital contributions and loans. In addition, our wholly foreign-owned subsidiaries in the Chinese mainland may provide RMB funding to their respective subsidiaries only through capital contributions and entrusted loans, and to the consolidated variable interest entities only through entrusted loans. See “Introduction—Summary of Risk Factors—Risks Related to Our Corporate Structure,” “Item 5.B. Operating and Financial Review—Liquidity and Capital Resources” and “Item 3.D. Key Information—Risk Factors—Risks Related to Our Corporate Structure—PRC regulation of loans to and direct investment in PRC entities by offshore holding companies and governmental control of currency conversion may delay or prevent us from making loans to our PRC subsidiaries and the consolidated variable interest entities or making additional capital contributions to our wholly foreign-owned subsidiaries in the Chinese mainland, which could materially and adversely affect our liquidity and our ability to fund and expand our business.”
12
Table of Contents
Under PRC laws and regulations, our PRC subsidiaries and the consolidated variable interest entities are subject to certain restrictions with respect to paying dividends or otherwise transferring any of their net assets to us. Remittance of dividends by a wholly foreign-owned enterprise out of the Chinese mainland is also subject to examination by the banks designated by State Administration of Foreign Exchange, or SAFE. The amounts restricted include the paid-in capital and the statutory reserve funds of our PRC subsidiaries and the net assets of the consolidated variable interest entities in which we have no legal ownership, totaling RMB46.4 billion, RMB58.2 billion and RMB67.6 billion (US$9.5 billion) as of December 31, 2021, 2022 and 2023, respectively. Furthermore, cash transfers from our PRC subsidiaries and the consolidated variable interest entities to entities outside of the Chinese mainland are subject to PRC governmental regulations on currency conversion. As a result, the funds in our PRC subsidiaries or the consolidated variable interest entities in the Chinese mainland may not be available to fund operations or for other use outside of the Chinese mainland if our holding company, our subsidiaries, or the consolidated variable interest entities do not comply with applicable laws or regulations on such currency conversion. As of the date of this annual report, there are not equivalent or similar requirements in Hong Kong on cash transfers in, or out of, our Hong Kong entities. However, if certain requirements were to become applicable to cash transfers in and out of Hong Kong entities in the future, the funds in our Hong Kong entities may not be available to fund operations or for other use outside of Hong Kong. For risks relating to the fund flows of our operations in China, see “Item 3.D. Key Information—Risk Factors—Risks Related to Doing Business in China—We may rely on dividends and other distributions on equity paid by our PRC subsidiaries to fund any cash and financing requirements we may have, and any limitation on the ability of our PRC subsidiaries to make payments to us could have a material and adverse effect on our ability to conduct our business.” and “Item 3.D. Key Information—Risk Factors—Risks Related to Doing Business in China—Govermental regulation of currency conversion may limit our ability to utilize our revenues effectively and affect the value of your investment.”
Under PRC law, JD.com, Inc. may provide funding to our PRC subsidiaries only through capital contributions or loans, and to the PRC consolidated variable interest entities only through loans, subject to satisfaction of applicable government registration that we are not able to make direct capital contribution.
Our company has established a centralized cash management policy to direct how funds are transferred between JD.com, Inc., our subsidiaries and the consolidated variable interest entities and their subsidiaries to improve the efficiency and ensure the security of cash management. Our management has established a series of manuals and policies on funds management, bank accounts management, financing activities and safe handling of cash and assets, which apply to all of our subsidiaries and the consolidated variable interest entities and their subsidiaries. We and our consolidated subsidiaries that are listed on the Hong Kong Stock Exchange have also established respective centralized cash management accounts within certain entities, under which funds are transferred and dispatched to each subsidiary or consolidated variable interest entity under central command. The major offshore entities outside of the Chinese mainland with the function of centralized cash management are JD.com, Inc. (our holding company), JD.com International Limited (our intermediate holding company), JD Logistics, Inc., and JD Health International Inc. (both of which are our subsidiaries). In addition, the major entities within the Chinese mainland with similar functions are Beijing Jingdong Century Trade Co., Ltd. (a primary beneficiary of the consolidated variable interest entities), Beijing Jingbangda Trade Co., Ltd. (a consolidated variable interest entity), and Beijing Jingdong Jiankang Co., Ltd. (a primary beneficiary of the consolidated variable interest entities). The centralized cash management function in these entities lead to high-volume and high-frequency cash transferred and dispatched to the remaining consolidated subsidiaries and consolidated variable interest entities. We have complied with the applicable laws and regulations for the operation of such cash centralized management accounts and completed necessary registration and approval procedures with governmental authorities. Every fund transfer within our group goes through an appropriate review and approval process depending on the nature and amount of the transfer under our cash management policy.
13
Table of Contents
For the years ended December 31, 2021, 2022 and 2023, JD.com, Inc. provided loans of RMB20.9 billion to, and received repayment of RMB7.4 billion and RMB12.6 billion (US$1.8 billion) from, respectively, our intermediate holding companies through our day-to-day centralized cash management activities. Please refer to the line item “Loans (provided to)/settled by internal companies” in the “Parent” column of the tables titled “Financial Information Related to the Consolidated Variable Interest Entities—Selected Condensed Consolidated Cash Flows Information” for the years ended December 31, 2021, 2022 and 2023 on pages 23–25 for the detail figures.
Our day-to-day centralized cash management activities also cover the cash flow of the consolidated variable interest entities. For the years ended December 31, 2021, the consolidated variable interest entities received funding by loans from our intermediate holding companies of RMB11.7 billion. For the years ended December 31, 2022 and 2023, the consolidated variable interest entities repaid RMB3.2 billion and RMB3.3 billion (US$0.5 billion) to our intermediate holding companies. Please refer to the line item “Net proceeds from/(repayment to) internal companies” in the “Consolidated Variable Interest Entities” column of the tables titled “Financial Information Related to the Consolidated Variable Interest Entities—Selected Condensed Consolidated Cash Flows Information” for the years ended December 31, 2021, 2022 and 2023 on pages 23–25 for the detail figures. The consolidated variable interest entities received repayment of loans of RMB1.1 billion from, provided funding of RMB11.3 billion to, and received repayment of loans of RMB4.8 billion (US$0.7 billion) from our intermediate holding companies for the years ended December 31, 2021, 2022 and 2023, respectively. Please refer to the line item “Loans (provided to)/settled by internal companies” in the “Consolidated Variable Interest Entities” column of the tables titled “Financial Information Related to the Consolidated Variable Interest Entities—Selected Condensed Consolidated Cash Flows Information” for the years ended December 31, 2021, 2022 and 2023 on pages 23–25 for the detail figures.
In May 2022, our board of directors approved a special cash dividend of US$0.63 per ordinary share, or US$1.26 per ADS, to holders of ordinary shares and holders of ADSs, respectively. The aggregate amount of the special dividend was approximately US$2.0 billion. In March 2023, our board of directors approved a cash dividend of US$0.31 per ordinary share, or US$0.62 per ADS, to holders of ordinary shares and holders of ADSs. The aggregate amount of the cash dividend was approximately US$1.0 billion. In March 2024, our board of directors approved an annual cash dividend for the year ended December 31, 2023 of US$0.38 per ordinary share, or US$0.76 per ADS, to holders of ordinary shares and holders of ADSs. The aggregate amount of the dividend will be approximately US$1.2 billion. In addition, we have adopted an annual dividend policy, under which we may choose to declare and distribute a cash dividend each year, at an amount determined in relation to our financial performance in the previous fiscal year, among other factors. The determination to make dividend distributions in any particular year will be made at the discretion of our board of directors based upon factors such as our results of operations, cash flow, financial condition, business strategies and prospects, capital requirements, regulatory constraints to the extent relevant, availability of foreign currency and other considerations that the board deems relevant. See “Item 8.A. Financial Information—Consolidated Statements and Other Financial Information—Dividend Policy.” For PRC and United States federal income tax considerations of an investment in our ADSs, see “Item 10.E. Additional Information—Taxation.”
| A. | Selected Financial Data |
The following table presents the selected consolidated financial information of our company. The selected consolidated statements of operations data for the years ended December 31, 2021, 2022 and 2023, selected consolidated balance sheets data as of December 31, 2022 and 2023, selected consolidated cash flow data for the years ended December 31, 2021, 2022 and 2023 have been derived from our audited consolidated financial statements, which are included in this annual report.
The selected consolidated statements of operations data for the years ended December 31, 2019 and 2020, selected consolidated balance sheets data as of December 31, 2019, 2020 and 2021 and selected consolidated cash flow data for the years ended December 31, 2019 and 2020 have been derived from our audited consolidated financial statements not included in this annual report. Our historical results do not necessarily indicate results expected for any future periods. The selected consolidated financial data should be read in conjunction with, and are qualified in their entirety by reference to, our audited consolidated financial statements and related notes and “Operating and Financial Review and Prospects” below. Our consolidated financial statements are prepared and presented in accordance with U.S. GAAP.
14
Table of Contents
| For the Year Ended December 31, | ||||||||||||||||||||||||
| 2019 | 2020 | 2021 | 2022 | 2023 | ||||||||||||||||||||
| RMB | RMB | RMB | RMB | RMB | US$ | |||||||||||||||||||
| (in millions, except for share, per share and per ADS data) | ||||||||||||||||||||||||
| Selected Consolidated Statements of Operations Data: |
||||||||||||||||||||||||
| Net Revenues(1): |
||||||||||||||||||||||||
| Net product revenues |
510,734 | 651,879 | 815,655 | 865,062 | 871,224 | 122,709 | ||||||||||||||||||
| Net service revenues |
66,154 | 93,923 | 135,937 | 181,174 | 213,438 | 30,062 | ||||||||||||||||||
|
|
|
|
|
|
|
|
|
|
|
|
|
|||||||||||||
| Total net revenues |
576,888 | 745,802 | 951,592 | 1,046,236 | 1,084,662 | 152,771 | ||||||||||||||||||
|
|
|
|
|
|
|
|
|
|
|
|
|
|||||||||||||
| Cost of revenues |
(492,467 | ) | (636,694 | ) | (822,526 | ) | (899,163 | ) | (924,958 | ) | (130,277 | ) | ||||||||||||
| Fulfillment |
(36,968 | ) | (48,700 | ) | (59,055 | ) | (63,011 | ) | (64,558 | ) | (9,093 | ) | ||||||||||||
| Marketing |
(22,234 | ) | (27,156 | ) | (38,743 | ) | (37,772 | ) | (40,133 | ) | (5,653 | ) | ||||||||||||
| Research and development |
(14,619 | ) | (16,149 | ) | (16,332 | ) | (16,893 | ) | (16,393 | ) | (2,309 | ) | ||||||||||||
| General and administrative |
(5,490 | ) | (6,409 | ) | (11,562 | ) | (11,053 | ) | (9,710 | ) | (1,368 | ) | ||||||||||||
| Impairment of goodwill |
— | — | — | — | (3,143 | ) | (443 | ) | ||||||||||||||||
| Impairment of long-lived assets |
— | — | — | — | (2,025 | ) | (285 | ) | ||||||||||||||||
| Gain on sale of development properties |
3,885 | 1,649 | 767 | 1,379 | 2,283 | 322 | ||||||||||||||||||
|
|
|
|
|
|
|
|
|
|
|
|
|
|||||||||||||
| Income from operations(2)(3) |
8,995 | 12,343 | 4,141 | 19,723 | 26,025 | 3,665 | ||||||||||||||||||
|
|
|
|
|
|
|
|
|
|
|
|
|
|||||||||||||
| Other income/(expense): |
||||||||||||||||||||||||
| Share of results of equity investees |
(1,738 | ) | 4,291 | (4,918 | ) | (2,195 | ) | 1,010 | 142 | |||||||||||||||
| Interest expense |
(725 | ) | (1,125 | ) | (1,213 | ) | (2,106 | ) | (2,881 | ) | (406 | ) | ||||||||||||
| Others, net(4) |
7,161 | 35,310 | (590 | ) | (1,555 | ) | 7,496 | 1,056 | ||||||||||||||||
|
|
|
|
|
|
|
|
|
|
|
|
|
|||||||||||||
| Income/(loss) before tax |
13,693 | 50,819 | (2,580 | ) | 13,867 | 31,650 | 4,457 | |||||||||||||||||
| Income tax expenses |
(1,803 | ) | (1,482 | ) | (1,887 | ) | (4,176 | ) | (8,393 | ) | (1,182 | ) | ||||||||||||
|
|
|
|
|
|
|
|
|
|
|
|
|
|||||||||||||
| Net income/(loss) |
11,890 | 49,337 | (4,467 | ) | 9,691 | 23,257 | 3,275 | |||||||||||||||||
|
|
|
|
|
|
|
|
|
|
|
|
|
|||||||||||||
| Net loss attributable to non-controlling interests shareholders |
(297 | ) | (75 | ) | (923 | ) | (697 | ) | (910 | ) | (128 | ) | ||||||||||||
| Net income attributable to mezzanine equity classified as non-controlling interests shareholders |
3 | 7 | 16 | 8 | — | — | ||||||||||||||||||
|
|
|
|
|
|
|
|
|
|
|
|
|
|||||||||||||
| Net income/(loss) attributable to the Company’s ordinary shareholders |
12,184 | 49,405 | (3,560 | ) | 10,380 | 24,167 | 3,403 | |||||||||||||||||
|
|
|
|
|
|
|
|
|
|
|
|
|
|||||||||||||
| Net income/(loss) per share |
||||||||||||||||||||||||
| Basic |
4.18 | 16.35 | (1.15 | ) | 3.32 | 7.69 | 1.08 | |||||||||||||||||
| Diluted |
4.11 | 15.84 | (1.15 | ) | 3.21 | 7.61 | 1.07 | |||||||||||||||||
| Net income/(loss) per ADS(5) |
||||||||||||||||||||||||
| Basic |
8.37 | 32.70 | (2.29 | ) | 6.64 | 15.37 | 2.17 | |||||||||||||||||
| Diluted |
8.21 | 31.68 | (2.29 | ) | 6.42 | 15.23 | 2.14 | |||||||||||||||||
| Weighted average number of shares: |
||||||||||||||||||||||||
| Basic |
2,912,637,241 | 3,021,808,985 | 3,107,436,665 | 3,125,571,110 | 3,144,233,160 | 3,144,233,160 | ||||||||||||||||||
| Diluted |
2,967,321,803 | 3,109,024,030 | 3,107,436,665 | 3,180,886,136 | 3,170,542,396 | 3,170,542,396 | ||||||||||||||||||
| (1) | Our net revenues include net product revenues and net service revenues. Product sales is further divided into sales of electronics and home appliances products and sales of general merchandise products. Net revenues from electronics and home appliances products include revenues from sales of computer, communication and consumer electronics products as well as home appliances. Net revenues from general merchandise products mainly include revenues from sales of food, beverage and fresh produce, baby and maternity products, furniture and household goods, cosmetics and other personal care items, pharmaceutical and healthcare products, industrial products, books, automobile accessories, apparel and footwear, bags and jewelry. Net service revenues are further divided into revenues from online marketplace and marketing and revenues from logistics and other services. The following table breaks down our total net revenues by these categories, by amounts and as percentages of total net revenues: |
15
Table of Contents
| For the Year Ended December 31, | ||||||||||||||||||||||||||||||||||||||||||||
| 2019 | 2020 | 2021 | 2022 | 2023 | ||||||||||||||||||||||||||||||||||||||||
| RMB | % | RMB | % | RMB | % | RMB | % | RMB | US$ | % | ||||||||||||||||||||||||||||||||||
| (in millions, except for percentages) | ||||||||||||||||||||||||||||||||||||||||||||
| Electronics and home appliances revenues |
328,703 | 57.0 | 400,927 | 53.8 | 492,592 | 51.8 | 515,945 | 49.3 | 538,799 | 75,888 | 49.7 | |||||||||||||||||||||||||||||||||
| General merchandise revenues |
182,031 | 31.5 | 250,952 | 33.6 | 323,063 | 33.9 | 349,117 | 33.4 | 332,425 | 46,821 | 30.6 | |||||||||||||||||||||||||||||||||
|
|
|
|
|
|
|
|
|
|
|
|
|
|
|
|
|
|
|
|
|
|
|
|||||||||||||||||||||||
| Net product revenues |
510,734 | 88.5 | 651,879 | 87.4 | 815,655 | 85.7 | 865,062 | 82.7 | 871,224 | 122,709 | 80.3 | |||||||||||||||||||||||||||||||||
|
|
|
|
|
|
|
|
|
|
|
|
|
|
|
|
|
|
|
|
|
|
|
|||||||||||||||||||||||
| Marketplace and marketing revenues |
42,680 | 7.4 | 53,473 | 7.2 | 72,118 | 7.6 | 81,970 | 7.8 | 84,726 | 11,933 | 7.8 | |||||||||||||||||||||||||||||||||
| Logistics and other service revenues |
23,474 | 4.1 | 40,450 | 5.4 | 63,819 | 6.7 | 99,204 | 9.5 | 128,712 | 18,129 | 11.9 | |||||||||||||||||||||||||||||||||
|
|
|
|
|
|
|
|
|
|
|
|
|
|
|
|
|
|
|
|
|
|
|
|||||||||||||||||||||||
| Net service revenues |
66,154 | 11.5 | 93,923 | 12.6 | 135,937 | 14.3 | 181,174 | 17.3 | 213,438 | 30,062 | 19.7 | |||||||||||||||||||||||||||||||||
|
|
|
|
|
|
|
|
|
|
|
|
|
|
|
|
|
|
|
|
|
|
|
|||||||||||||||||||||||
| Total net revenues |
576,888 | 100.0 | 745,802 | 100.0 | 951,592 | 100.0 | 1,046,236 | 100.0 | 1,084,662 | 152,771 | 100.0 | |||||||||||||||||||||||||||||||||
|
|
|
|
|
|
|
|
|
|
|
|
|
|
|
|
|
|
|
|
|
|
|
|||||||||||||||||||||||
| (2) | Includes share-based compensation expenses as follows: |
| For the Year Ended December 31, | ||||||||||||||||||||||||
| 2019 | 2020 | 2021 | 2022 | 2023 | ||||||||||||||||||||
| RMB | RMB | RMB | RMB | RMB | US$ | |||||||||||||||||||
| (in millions) | ||||||||||||||||||||||||
| Cost of revenues |
(82 | ) | (98 | ) | (102 | ) | (143 | ) | (133 | ) | (19 | ) | ||||||||||||
| Fulfillment |
(440 | ) | (646 | ) | (882 | ) | (930 | ) | (697 | ) | (98 | ) | ||||||||||||
| Marketing |
(259 | ) | (347 | ) | (586 | ) | (631 | ) | (426 | ) | (60 | ) | ||||||||||||
| Research and development |
(1,340 | ) | (1,400 | ) | (1,781 | ) | (1,557 | ) | (859 | ) | (121 | ) | ||||||||||||
| General and administrative |
(1,574 | ) | (1,665 | ) | (5,783 | ) | (4,287 | ) | (2,689 | ) | (379 | ) | ||||||||||||
|
|
|
|
|
|
|
|
|
|
|
|
|
|||||||||||||
| Total |
(3,695 | ) | (4,156 | ) | (9,134 | ) | (7,548 | ) | (4,804 | ) | (677 | ) | ||||||||||||
|
|
|
|
|
|
|
|
|
|
|
|
|
|||||||||||||
| (3) | Includes amortization of business cooperation arrangement and intangible assets resulting from assets and business acquisitions as follows: |
| For the Year Ended December 31, | ||||||||||||||||||||||||
| 2019 | 2020 | 2021 | 2022 | 2023 | ||||||||||||||||||||
| RMB | RMB | RMB | RMB | RMB | US$ | |||||||||||||||||||
| (in millions) | ||||||||||||||||||||||||
| Fulfillment |
(165 | ) | (193 | ) | (220 | ) | (392 | ) | (414 | ) | (58 | ) | ||||||||||||
| Marketing |
(637 | ) | (692 | ) | (854 | ) | (868 | ) | (880 | ) | (124 | ) | ||||||||||||
| Research and development |
(99 | ) | (99 | ) | (104 | ) | (271 | ) | (305 | ) | (43 | ) | ||||||||||||
| General and administrative |
(308 | ) | (309 | ) | (309 | ) | (161 | ) | (128 | ) | (18 | ) | ||||||||||||
|
|
|
|
|
|
|
|
|
|
|
|
|
|||||||||||||
| Total |
(1,209 | ) | (1,293 | ) | (1,487 | ) | (1,692 | ) | (1,727 | ) | (243 | ) | ||||||||||||
|
|
|
|
|
|
|
|
|
|
|
|
|
|||||||||||||
| (4) | Interest income was included in Others, net since 2021, and the presentation of prior years was also updated to conform to current presentation. |
| (5) | Each ADS represents two Class A ordinary shares. |
16
Table of Contents
| For the Year Ended December 31, | ||||||||||||||||||||||||
| 2019 | 2020 | 2021 | 2022 | 2023 | ||||||||||||||||||||
| RMB | RMB | RMB | RMB | RMB | US$ | |||||||||||||||||||
| (in millions) | ||||||||||||||||||||||||
| Selected Consolidated Balance Sheets Data: |
||||||||||||||||||||||||
| Cash and cash equivalents |
36,971 | 86,085 | 70,767 | 78,861 | 71,892 | 10,126 | ||||||||||||||||||
| Restricted cash |
2,941 | 4,434 | 5,926 | 6,254 | 7,506 | 1,057 | ||||||||||||||||||
| Short-term investments |
24,603 | 60,577 | 114,564 | 141,095 | 118,254 | 16,656 | ||||||||||||||||||
| Accounts receivable, net |
6,191 | 7,112 | 11,900 | 20,576 | 20,302 | 2,859 | ||||||||||||||||||
| Inventories, net |
57,932 | 58,933 | 75,601 | 77,949 | 68,058 | 9,586 | ||||||||||||||||||
| Property, equipment and software, net |
20,654 | 22,597 | 32,944 | 55,080 | 70,035 | 9,864 | ||||||||||||||||||
| Land use rights, net |
10,892 | 11,125 | 14,328 | 33,848 | 39,563 | 5,572 | ||||||||||||||||||
| Operating lease right-of-use assets |
8,644 | 15,484 | 19,987 | 22,267 | 20,863 | 2,938 | ||||||||||||||||||
| Investment in equity investees |
35,576 | 58,501 | 63,222 | 57,641 | 56,746 | 7,993 | ||||||||||||||||||
| Marketable securities and other investments |
21,417 | 44,085 | 24,248 | 14,360 | 80,840 | 11,386 | ||||||||||||||||||
| Other non-current assets |
6,806 | 8,316 | 16,644 | 16,021 | 14,522 | 2,045 | ||||||||||||||||||
| Total assets |
259,724 | 422,288 | 496,507 | 595,250 | 628,958 | 88,586 | ||||||||||||||||||
| Short-term debts |
— | — | 4,368 | 12,146 | 5,034 | 709 | ||||||||||||||||||
| Accounts payable |
90,428 | 106,818 | 140,484 | 160,607 | 166,167 | 23,404 | ||||||||||||||||||
| Accrued expenses and other |
||||||||||||||||||||||||
| current liabilities |
24,656 | 30,035 | 34,468 | 42,570 | 43,533 | 6,132 | ||||||||||||||||||
| Unsecured senior notes |
6,912 | 12,854 | 9,386 | 10,224 | 10,411 | 1,466 | ||||||||||||||||||
| Long-term borrowings |
3,139 | 2,936 | — | 20,009 | 31,555 | 4,444 | ||||||||||||||||||
| Operating lease liabilities |
8,717 | 15,763 | 20,386 | 22,666 | 21,431 | 3,018 | ||||||||||||||||||
| Total liabilities |
159,099 | 200,669 | 249,723 | 321,127 | 332,578 | 46,842 | ||||||||||||||||||
| Total mezzanine equity |
15,964 | 17,133 | 1,212 | 590 | 614 | 86 | ||||||||||||||||||
| Total JD.com, Inc. shareholders’ equity |
81,856 | 187,543 | 208,911 | 213,366 | 231,858 | 32,657 | ||||||||||||||||||
| Number of outstanding ordinary shares |
2,924,315,263 | 3,103,499,039 | 3,110,791,649 | 3,135,679,247 | 3,137,663,915 | 3,137,663,915 | ||||||||||||||||||
17
Table of Contents
| For the Year Ended December 31, | ||||||||||||||||||||||||
| 2019 | 2020 | 2021 | 2022 | 2023 | ||||||||||||||||||||
| RMB | RMB | RMB | RMB | RMB | US$ | |||||||||||||||||||
| (in millions) | ||||||||||||||||||||||||
| Selected Consolidated Cash Flows Data: |
||||||||||||||||||||||||
| Net cash provided by operating activities |
24,781 | 42,544 | 42,301 | 57,819 | 59,521 | 8,383 | ||||||||||||||||||
| Net cash used in investing activities |
(25,349 | ) | (57,811 | ) | (74,248 | ) | (54,026 | ) | (59,543 | ) | (8,386 | ) | ||||||||||||
| Net cash provided by/(used in) financing activities |
2,572 | 71,072 | 19,503 | 1,180 | (5,808 | ) | (818 | ) | ||||||||||||||||
| Effect of exchange rate changes on cash, cash equivalents and restricted cash |
406 | (5,082 | ) | (1,498 | ) | 3,490 | 125 | 17 | ||||||||||||||||
|
|
|
|
|
|
|
|
|
|
|
|
|
|||||||||||||
| Net increase/(decrease) in cash, cash equivalents and restricted cash |
2,410 | 50,723 | (13,942 | ) | 8,463 | (5,705 | ) | (804 | ) | |||||||||||||||
|
|
|
|
|
|
|
|
|
|
|
|
|
|||||||||||||
| Cash, cash equivalents, and restricted cash at beginning of year, including cash and cash equivalents classified within assets held for sale |
37,502 | 39,912 | 90,635 | 76,693 | 85,156 | 11,994 | ||||||||||||||||||
| Less: cash, cash equivalents, and restricted cash classified within assets held for sale at beginning of year |
— | — | 116 | — | 41 | 6 | ||||||||||||||||||
|
|
|
|
|
|
|
|
|
|
|
|
|
|||||||||||||
| Cash, cash equivalents, and restricted cash at beginning of year |
37,502 | 39,912 | 90,519 | 76,693 | 85,115 | 11,988 | ||||||||||||||||||
|
|
|
|
|
|
|
|
|
|
|
|
|
|||||||||||||
| Cash, cash equivalents and restricted cash at end of year, including cash and cash equivalents classified within assets held for sale |
39,912 | 90,635 | 76,693 | 85,156 | 79,451 | 11,190 | ||||||||||||||||||
| Less: cash, cash equivalents, and restricted cash classified within assets held for sale at end of year |
— | 116 | — | 41 | 53 | 7 | ||||||||||||||||||
|
|
|
|
|
|
|
|
|
|
|
|
|
|||||||||||||
| Cash, cash equivalents and restricted cash at end of year |
39,912 | 90,519 | 76,693 | 85,115 | 79,398 | 11,183 | ||||||||||||||||||
|
|
|
|
|
|
|
|
|
|
|
|
|
|||||||||||||
18
Table of Contents
Financial Information Related to the Consolidated Variable Interest Entities
The following table presents the condensed consolidating schedule of financial position for the consolidated variable interest entities and their subsidiaries (collectively, Consolidated Variable Interest Entities or VIEs) and other entities as of the dates presented.
Selected Condensed Consolidated Statements of Income Information
| For the Year Ended December 31, 2023 | ||||||||||||||||||||||||
| Parent | Other Subsidiaries |
Primary Beneficiaries of Consolidated Variable Interest Entities |
Consolidated Variable Interest Entities |
Eliminations | Consolidated Total |
|||||||||||||||||||
| (RMB in millions) | ||||||||||||||||||||||||
| Net revenues |
— | 1,119,133 | 745,180 | 145,795 | (925,446 | ) | 1,084,662 | |||||||||||||||||
| Third-party revenues |
— | 991,705 | 7,817 | 85,140 | — | 1,084,662 | ||||||||||||||||||
| Inter-company revenues |
— | 127,428 | 737,363 | 60,655 | (925,446 | ) | — | |||||||||||||||||
| Cost of revenues |
— | (947,261 | ) | (690,707 | ) | (130,540 | ) | 843,550 | (924,958 | ) | ||||||||||||||
| Fulfillment |
— | (91,646 | ) | (12,982 | ) | (4,584 | ) | 44,654 | (64,558 | ) | ||||||||||||||
| Marketing |
(4 | ) | (35,231 | ) | (17,495 | ) | (3,970 | ) | 16,567 | (40,133 | ) | |||||||||||||
| Research and development |
— | (15,662 | ) | (16,345 | ) | (4,853 | ) | 20,467 | (16,393 | ) | ||||||||||||||
| General and administrative |
(204 | ) | (4,881 | ) | (2,794 | ) | (2,039 | ) | 208 | (9,710 | ) | |||||||||||||
| Impairment of goodwill |
— | (3,143 | ) | — | — | — | (3,143 | ) | ||||||||||||||||
| Impairment of long-lived assets |
— | (2,025 | ) | — | — | — | (2,025 | ) | ||||||||||||||||
| Gain on sale of development properties |
— | 2,283 | — | — | — | 2,283 | ||||||||||||||||||
|
|
|
|
|
|
|
|
|
|
|
|
|
|||||||||||||
| Income/(loss) from operations |
(208 | ) | 21,567 | 4,857 | (191 | ) | — | 26,025 | ||||||||||||||||
|
|
|
|
|
|
|
|
|
|
|
|
|
|||||||||||||
| Income from subsidiaries and VIEs |
24,967 | 10,305 | 1,066 | — | (36,338 | ) | — | |||||||||||||||||
| Other income/(expense), net |
(591 | ) | (1,328 | ) | 4,367 | 3,177 | — | 5,625 | ||||||||||||||||
|
|
|
|
|
|
|
|
|
|
|
|
|
|||||||||||||
| Income before tax |
24,168 | 30,544 | 10,290 | 2,986 | (36,338 | ) | 31,650 | |||||||||||||||||
| Income tax expenses |
(1 | ) | (6,889 | ) | (1,020 | ) | (483 | ) | — | (8,393 | ) | |||||||||||||
|
|
|
|
|
|
|
|
|
|
|
|
|
|||||||||||||
| Net income |
24,167 | 23,655 | 9,270 | 2,503 | (36,338 | ) | 23,257 | |||||||||||||||||
|
|
|
|
|
|
|
|
|
|
|
|
|
|||||||||||||
19
Table of Contents
| For the Year Ended December 31, 2022 | ||||||||||||||||||||||||
| Parent | Other Subsidiaries |
Primary Beneficiaries of Consolidated Variable Interest Entities |
Consolidated Variable Interest Entities |
Eliminations | Consolidated Total |
|||||||||||||||||||
| (RMB in millions) | ||||||||||||||||||||||||
| Net revenues |
— | 1,074,639 | 719,883 | 134,516 | (882,802 | ) | 1,046,236 | |||||||||||||||||
| Third-party revenues |
— | 967,244 | 6,326 | 72,666 | — | 1,046,236 | ||||||||||||||||||
| Inter-company revenues |
— | 107,395 | 713,557 | 61,850 | (882,802 | ) | — | |||||||||||||||||
| Cost of revenues |
— | (905,349 | ) | (664,233 | ) | (119,868 | ) | 790,287 | (899,163 | ) | ||||||||||||||
| Fulfillment |
— | (92,643 | ) | (13,890 | ) | (4,229 | ) | 47,751 | (63,011 | ) | ||||||||||||||
| Marketing |
(2 | ) | (31,312 | ) | (24,083 | ) | (3,622 | ) | 21,247 | (37,772 | ) | |||||||||||||
| Research and development |
— | (18,184 | ) | (16,688 | ) | (5,370 | ) | 23,349 | (16,893 | ) | ||||||||||||||
| General and administrative |
(331 | ) | (3,640 | ) | (4,347 | ) | (2,903 | ) | 168 | (11,053 | ) | |||||||||||||
| Gain on sale of development properties |
— | 1,379 | — | — | — | 1,379 | ||||||||||||||||||
|
|
|
|
|
|
|
|
|
|
|
|
|
|||||||||||||
| Income/(loss) from operations |
(333 | ) | 24,890 | (3,358 | ) | (1,476 | ) | — | 19,723 | |||||||||||||||
|
|
|
|
|
|
|
|
|
|
|
|
|
|||||||||||||
| Income from subsidiaries and VIEs |
10,667 | 502 | 17,785 | — | (28,954 | ) | — | |||||||||||||||||
| Other income/(expense), net |
48 | (11,491 | ) | 3,599 | 2,780 | (792 | ) | (5,856 | ) | |||||||||||||||
|
|
|
|
|
|
|
|
|
|
|
|
|
|||||||||||||
| Income before tax |
10,382 | 13,901 | 18,026 | 1,304 | (29,746 | ) | 13,867 | |||||||||||||||||
| Income tax expenses |
(2 | ) | (4,097 | ) | 90 | (167 | ) | — | (4,176 | ) | ||||||||||||||
|
|
|
|
|
|
|
|
|
|
|
|
|
|||||||||||||
| Net income |
10,380 | 9,804 | 18,116 | 1,137 | (29,746 | ) | 9,691 | |||||||||||||||||
|
|
|
|
|
|
|
|
|
|
|
|
|
|||||||||||||
| For the Year Ended December 31, 2021 | ||||||||||||||||||||||||
| Parent | Other Subsidiaries |
Primary Beneficiaries of Consolidated Variable Interest Entities |
Consolidated Variable Interest Entities |
Eliminations | Consolidated Total |
|||||||||||||||||||
| (RMB in millions) | ||||||||||||||||||||||||
| Net revenues |
— | 984,998 | 676,041 | 117,419 | (826,866 | ) | 951,592 | |||||||||||||||||
| Third-party revenues |
— | 887,340 | 5,128 | 59,124 | — | 951,592 | ||||||||||||||||||
| Inter-company revenues |
— | 97,658 | 670,913 | 58,295 | (826,866 | ) | — | |||||||||||||||||
| Cost of revenues |
— | (837,268 | ) | (621,811 | ) | (104,564 | ) | 741,117 | (822,526 | ) | ||||||||||||||
| Fulfillment |
— | (80,833 | ) | (18,225 | ) | (4,657 | ) | 44,660 | (59,055 | ) | ||||||||||||||
| Marketing |
(4 | ) | (32,954 | ) | (23,997 | ) | (3,108 | ) | 21,320 | (38,743 | ) | |||||||||||||
| Research and development |
— | (17,155 | ) | (13,473 | ) | (5,420 | ) | 19,716 | (16,332 | ) | ||||||||||||||
| General and administrative |
(465 | ) | (6,282 | ) | (2,511 | ) | (2,357 | ) | 53 | (11,562 | ) | |||||||||||||
| Gain on sale of development properties |
— | 767 | — | — | — | 767 | ||||||||||||||||||
|
|
|
|
|
|
|
|
|
|
|
|
|
|||||||||||||
| Income/(loss) from operations |
(469 | ) | 11,273 | (3,976 | ) | (2,687 | ) | — | 4,141 | |||||||||||||||
|
|
|
|
|
|
|
|
|
|
|
|
|
|||||||||||||
| Income/(loss) from subsidiaries and VIEs |
(2,708 | ) | (4,774 | ) | 12,037 | — | (4,555 | ) | — | |||||||||||||||
| Other income/(expense), net |
(376 | ) | (8,555 | ) | 2,558 | (348 | ) | — | (6,721 | ) | ||||||||||||||
|
|
|
|
|
|
|
|
|
|
|
|
|
|||||||||||||
| Income/(loss) before tax |
(3,553 | ) | (2,056 | ) | 10,619 | (3,035 | ) | (4,555 | ) | (2,580 | ) | |||||||||||||
| Income tax expenses |
(7 | ) | (1,716 | ) | (130 | ) | (34 | ) | — | (1,887 | ) | |||||||||||||
|
|
|
|
|
|
|
|
|
|
|
|
|
|||||||||||||
| Net income/(loss) |
(3,560 | ) | (3,772 | ) | 10,489 | (3,069 | ) | (4,555 | ) | (4,467 | ) | |||||||||||||
|
|
|
|
|
|
|
|
|
|
|
|
|
|||||||||||||
20
Table of Contents
| As of December 31, 2023 | ||||||||||||||||||||||||
| Parent | Other Subsidiaries |
Primary Beneficiaries of Consolidated Variable Interest Entities |
Consolidated Variable Interest Entities |
Eliminations | Consolidated Total |
|||||||||||||||||||
| (RMB in millions) | ||||||||||||||||||||||||
| Assets |
||||||||||||||||||||||||
| Cash and cash equivalents |
4,788 | 24,563 | 31,664 | 10,877 | — | 71,892 | ||||||||||||||||||
| Restricted cash |
— | 2,871 | 4,607 | 28 | — | 7,506 | ||||||||||||||||||
| Short-term investments |
2,843 | 59,775 | 53,304 | 2,332 | — | 118,254 | ||||||||||||||||||
| Accounts receivable, net |
— | 13,863 | 360 | 6,079 | — | 20,302 | ||||||||||||||||||
| Inventories, net |
— | 22,270 | 41,895 | 3,893 | — | 68,058 | ||||||||||||||||||
| Internal balance |
53,088 | 89,387 | 29,178 | — | (171,653 | ) | — | |||||||||||||||||
| Investment in equity investees |
— | 32,994 | 4,635 | 19,898 | (781 | ) | 56,746 | |||||||||||||||||
| Investments in subsidiaries and consolidated VIEs |
188,817 | 56,577 | 43,355 | — | (288,749 | ) | — | |||||||||||||||||
| Marketable securities and other investments |
— | 24,160 | 56,572 | 108 | — | 80,840 | ||||||||||||||||||
| Property, equipment and software, net |
— | 57,669 | 1,833 | 10,533 | — | 70,035 | ||||||||||||||||||
| Operating lease right-of-use assets |
— | 10,241 | 52 | 13,558 | (2,988 | ) | 20,863 | |||||||||||||||||
| Prepayments and other assets |
154 | 85,170 | 15,269 | 13,995 | (126 | ) | 114,462 | |||||||||||||||||
|
|
|
|
|
|
|
|
|
|
|
|
|
|||||||||||||
| Total assets |
249,690 | 479,540 | 282,724 | 81,301 | (464,297 | ) | 628,958 | |||||||||||||||||
|
|
|
|
|
|
|
|
|
|
|
|
|
|||||||||||||
| Liabilities |
||||||||||||||||||||||||
| Short-term debts |
— | 2,442 | — | 2,592 | — | 5,034 | ||||||||||||||||||
| Accounts payable |
— | 53,008 | 102,207 | 10,952 | — | 166,167 | ||||||||||||||||||
| Internal balance |
— | 82,263 | 57,964 | 31,426 | (171,653 | ) | — | |||||||||||||||||
| Operating lease liabilities |
— | 10,168 | 38 | 14,050 | (2,825 | ) | 21,431 | |||||||||||||||||
| Unsecured senior notes |
10,536 | — | — | — | (125 | ) | 10,411 | |||||||||||||||||
| Long-term borrowings |
7,083 | 22,072 | — | 2,400 | — | 31,555 | ||||||||||||||||||
| Accrued expenses and other liabilities |
213 | 64,272 | 20,060 | 13,435 | — | 97,980 | ||||||||||||||||||
|
|
|
|
|
|
|
|
|
|
|
|
|
|||||||||||||
| Total liabilities |
17,832 | 234,225 | 180,269 | 74,855 | (174,603 | ) | 332,578 | |||||||||||||||||
|
|
|
|
|
|
|
|
|
|
|
|
|
|||||||||||||
| Convertible redeemable non-controlling interests |
— | 614 | — | — | — | 614 | ||||||||||||||||||
|
|
|
|
|
|
|
|
|
|
|
|
|
|||||||||||||
| Total shareholders’ equity |
231,858 | 244,701 | 102,455 | 6,446 | (289,694 | ) | 295,766 | |||||||||||||||||
|
|
|
|
|
|
|
|
|
|
|
|
|
|||||||||||||
| Total liabilities, mezzanine equity and shareholders’ equity |
249,690 | 479,540 | 282,724 | 81,301 | (464,297 | ) | 628,958 | |||||||||||||||||
|
|
|
|
|
|
|
|
|
|
|
|
|
|||||||||||||
21
Table of Contents
| As of December 31, 2022 | ||||||||||||||||||||||||
| Parent | Other Subsidiaries |
Primary Beneficiaries of Consolidated Variable Interest Entities |
Consolidated Variable Interest Entities |
Eliminations | Consolidated Total |
|||||||||||||||||||
| (RMB in millions) | ||||||||||||||||||||||||
| Assets |
||||||||||||||||||||||||
| Cash and cash equivalents |
5,029 | 38,158 | 30,534 | 5,140 | — | 78,861 | ||||||||||||||||||
| Restricted cash |
— | 1,922 | 4,282 | 50 | — | 6,254 | ||||||||||||||||||
| Short-term investments |
— | 43,264 | 96,270 | 1,561 | — | 141,095 | ||||||||||||||||||
| Accounts receivable, net |
— | 15,530 | 271 | 4,775 | — | 20,576 | ||||||||||||||||||
| Inventories, net |
— | 28,004 | 45,783 | 4,162 | — | 77,949 | ||||||||||||||||||
| Internal balance |
63,708 | 79,466 | 32,310 | 4,543 | (180,027 | ) | — | |||||||||||||||||
| Investment in equity investees |
— | 35,857 | 4,454 | 18,111 | (781 | ) | 57,641 | |||||||||||||||||
| Investments in subsidiaries and consolidated VIEs |
162,015 | 26,109 | 56,680 | — | (244,804 | ) | — | |||||||||||||||||
| Marketable securities and other investments |
— | 10,601 | 952 | 2,807 | — | 14,360 | ||||||||||||||||||
| Property, equipment and software, net |
— | 43,576 | 2,012 | 9,492 | — | 55,080 | ||||||||||||||||||
| Operating lease right-of-use assets |
— | 8,508 | 2,049 | 13,809 | (2,099 | ) | 22,267 | |||||||||||||||||
| Prepayments and other assets |
308 | 92,560 | 14,710 | 13,712 | (123 | ) | 121,167 | |||||||||||||||||
|
|
|
|
|
|
|
|
|
|
|
|
|
|||||||||||||
| Total assets |
231,060 | 423,555 | 290,307 | 78,162 | (427,834 | ) | 595,250 | |||||||||||||||||
|
|
|
|
|
|
|
|
|
|
|
|
|
|||||||||||||
| Liabilities |
||||||||||||||||||||||||
| Short-term debts |
— | 10,282 | 1,730 | 134 | — | 12,146 | ||||||||||||||||||
| Accounts payable |
— | 51,536 | 99,374 | 9,697 | — | 160,607 | ||||||||||||||||||
| Internal balance |
— | 68,251 | 78,686 | 33,038 | (179,975 | ) | — | |||||||||||||||||
| Operating lease liabilities |
— | 8,508 | 2,094 | 14,215 | (2,151 | ) | 22,666 | |||||||||||||||||
| Unsecured senior notes |
10,347 | — | — | — | (123 | ) | 10,224 | |||||||||||||||||
| Long-term borrowings |
6,965 | 10,644 | — | 2,400 | — | 20,009 | ||||||||||||||||||
| Accrued expenses and other liabilities |
382 | 62,885 | 17,139 | 15,069 | — | 95,475 | ||||||||||||||||||
|
|
|
|
|
|
|
|
|
|
|
|
|
|||||||||||||
| Total liabilities |
17,694 | 212,106 | 199,023 | 74,553 | (182,249 | ) | 321,127 | |||||||||||||||||
|
|
|
|
|
|
|
|
|
|
|
|
|
|||||||||||||
| Convertible redeemable non-controlling interests |
— | 590 | — | — | — | 590 | ||||||||||||||||||
|
|
|
|
|
|
|
|
|
|
|
|
|
|||||||||||||
| Total shareholders’ equity |
213,366 | 210,859 | 91,284 | 3,609 | (245,585 | ) | 273,533 | |||||||||||||||||
|
|
|
|
|
|
|
|
|
|
|
|
|
|||||||||||||
| Total liabilities, mezzanine equity and shareholders’ equity |
231,060 | 423,555 | 290,307 | 78,162 | (427,834 | ) | 595,250 | |||||||||||||||||
|
|
|
|
|
|
|
|
|
|
|
|
|
|||||||||||||
22
Table of Contents
Selected Condensed Consolidated Cash Flows Information
| For the Year Ended December 31, 2023 | ||||||||||||||||||||||||
| Parent | Other Subsidiaries |
Primary Beneficiaries of Consolidated Variable Interest Entities |
Consolidated Variable Interest Entities |
Eliminations | Consolidated Total |
|||||||||||||||||||
| (RMB in millions) | ||||||||||||||||||||||||
| Net cash provided by/(used in) operating activities |
(765 | ) | 43,657 | 75,882 | 3,291 | (62,544 | ) | 59,521 | ||||||||||||||||
|
|
|
|
|
|
|
|
|
|
|
|
|
|||||||||||||
| Cash flows from investing activities |
||||||||||||||||||||||||
| (Increase)/decrease in short-term investments, net |
(2,833 | ) | (15,281 | ) | 42,415 | (722 | ) | — | 23,579 | |||||||||||||||
| Increase in long-term investments, net |
— | (19,924 | ) | (55,000 | ) | — | — | (74,924 | ) | |||||||||||||||
| Prepayments and investments in equity investees |
— | (555 | ) | (597 | ) | (230 | ) | — | (1,382 | ) | ||||||||||||||
| Loans settled by internal companies |
12,633 | 36,177 | 3,266 | 4,804 | (56,880 | ) | — | |||||||||||||||||
| Cash paid for property, equipment, software and construction in progress |
— | (10,487 | ) | (448 | ) | (4,096 | ) | — | (15,031 | ) | ||||||||||||||
| Other investing activities |
— | 3,543 | (9,501 | ) | 3,568 | 10,605 | 8,215 | |||||||||||||||||
|
|
|
|
|
|
|
|
|
|
|
|
|
|||||||||||||
| Net cash provided by/(used in) investing activities |
9,800 | (6,527 | ) | (19,865 | ) | 3,324 | (46,275 | ) | (59,543 | ) | ||||||||||||||
|
|
|
|
|
|
|
|
|
|
|
|
|
|||||||||||||
| Cash flows from financing activities |
||||||||||||||||||||||||
| Capital injection from non-controlling interest shareholders |
— | 1,835 | — | — | — | 1,835 | ||||||||||||||||||
| Increase/(decrease) in borrowings, net |
— | 2,458 | (1,800 | ) | 2,455 | — | 3,113 | |||||||||||||||||
| Net repayment to internal companies |
— | (17,437 | ) | (36,177 | ) | (3,266 | ) | 56,880 | — | |||||||||||||||
| Cash paid for dividends. |
(6,741 | ) | (45,859 | ) | (16,685 | ) | — | 62,544 | (6,741 | ) | ||||||||||||||
| Other financing activities |
(2,464 | ) | 9,043 | 100 | (89 | ) | (10,605 | ) | (4,015 | ) | ||||||||||||||
|
|
|
|
|
|
|
|
|
|
|
|
|
|||||||||||||
| Net cash used in financing activities |
(9,205 | ) | (49,960 | ) | (54,562 | ) | (900 | ) | 108,819 | (5,808 | ) | |||||||||||||
|
|
|
|
|
|
|
|
|
|
|
|
|
|||||||||||||
| Effect of exchange rate changes on cash, cash equivalents and restricted cash |
(71 | ) | 196 | — | — | — | 125 | |||||||||||||||||
|
|
|
|
|
|
|
|
|
|
|
|
|
|||||||||||||
| Net increase/(decrease) in cash, cash equivalents and restricted cash |
(241 | ) | (12,634 | ) | 1,455 | 5,715 | — | (5,705 | ) | |||||||||||||||
| Cash, cash equivalents and restricted cash at beginning of year |
5,029 | 40,121 | 34,816 | 5,190 | — | 85,156 | ||||||||||||||||||
|
|
|
|
|
|
|
|
|
|
|
|
|
|||||||||||||
| Cash, cash equivalents and restricted cash at end of year, including cash and cash equivalents classified within assets held for sale |
4,788 | 27,487 | 36,271 | 10,905 | — | 79,451 | ||||||||||||||||||
| Less: cash, cash equivalents and restricted cash classified within assets held for sale at end of year |
— | 53 | — | — | — | 53 | ||||||||||||||||||
|
|
|
|
|
|
|
|
|
|
|
|
|
|||||||||||||
| Cash, cash equivalents and restricted cash at end of year |
4,788 | 27,434 | 36,271 | 10,905 | — | 79,398 | ||||||||||||||||||
|
|
|
|
|
|
|
|
|
|
|
|
|
|||||||||||||
23
Table of Contents
| For the Year Ended December 31, 2022 | ||||||||||||||||||||||||
| Parent | Other Subsidiaries |
Primary Beneficiaries of Consolidated Variable Interest Entities |
Consolidated Variable Interest Entities |
Eliminations | Consolidated Total |
|||||||||||||||||||
| (RMB in millions) | ||||||||||||||||||||||||
| Net cash provided by/(used in) operating activities |
(509 | ) | (168,260 | ) | 246,606 | 5,434 | (25,452 | ) | 57,819 | |||||||||||||||
|
|
|
|
|
|
|
|
|
|
|
|
|
|||||||||||||
| Cash flows from investing activities |
||||||||||||||||||||||||
| (Increase)/decrease in short-term investments, net |
1 | 6,383 | (25,800 | ) | 4,218 | — | (15,198 | ) | ||||||||||||||||
| Prepayments and investments in equity investees |
— | (6,313 | ) | (4,344 | ) | (305 | ) | 6,461 | (4,501 | ) | ||||||||||||||
| Loans (provide to)/settled by internal companies |
7,426 | 200,620 | 3,205 | (11,291 | ) | (199,960 | ) | — | ||||||||||||||||
| Cash paid for property, equipment, software and construction in progress |
— | (12,820 | ) | (142 | ) | (4,705 | ) | — | (17,667 | ) | ||||||||||||||
| Other investing activities |
— | (18,025 | ) | (292 | ) | 7,585 | (5,928 | ) | (16,660 | ) | ||||||||||||||
|
|
|
|
|
|
|
|
|
|
|
|
|
|||||||||||||
| Net cash provided by/(used in) investing activities |
7,427 | 169,845 | (27,373 | ) | (4,498 | ) | (199,427 | ) | (54,026 | ) | ||||||||||||||
|
|
|
|
|
|
|
|
|
|
|
|
|
|||||||||||||
| Cash flows from financing activities |
||||||||||||||||||||||||
| Capital injection from non-controlling interest shareholders |
— | 7,870 | — | 150 | — | 8,020 | ||||||||||||||||||
| Increase in borrowings, net |
3,558 | 5,478 | 300 | 2,534 | — | 11,870 | ||||||||||||||||||
| Net proceeds from/(repayment to) internal companies |
— | 3,865 | (200,620 | ) | (3,205 | ) | 199,960 | — | ||||||||||||||||
| Dividend paid to shareholders of JD.com, Inc. |
(13,087 | ) | — | — | — | (13,087 | ) | |||||||||||||||||
| Other financing activities |
(780 | ) | (25,293 | ) | (3,684 | ) | (785 | ) | 24,919 | (5,623 | ) | |||||||||||||
|
|
|
|
|
|
|
|
|
|
|
|
|
|||||||||||||
| Net cash provided by/(used in) financing activities |
(10,309 | ) | (8,080 | ) | (204,004 | ) | (1,306 | ) | 224,879 | 1,180 | ||||||||||||||
|
|
|
|
|
|
|
|
|
|
|
|
|
|||||||||||||
| Effect of exchange rate changes on cash, cash equivalents and restricted cash |
1,003 | 2,487 | — | — | — | 3,490 | ||||||||||||||||||
|
|
|
|
|
|
|
|
|
|
|
|
|
|||||||||||||
| Net increase/(decrease) in cash, cash equivalents and restricted cash |
(2,388 | ) | (4,008 | ) | 15,229 | (370 | ) | — | 8,463 | |||||||||||||||
| Cash, cash equivalents and restricted cash at beginning of year |
7,417 | 44,129 | 19,587 | 5,560 | — | 76,693 | ||||||||||||||||||
|
|
|
|
|
|
|
|
|
|
|
|
|
|||||||||||||
| Cash, cash equivalents and restricted cash at end of year, including cash and cash equivalents classified within assets held for sale |
5,029 | 40,121 | 34,816 | 5,190 | — | 85,156 | ||||||||||||||||||
| Less: cash, cash equivalents and restricted cash classified within assets held for sale at end of year |
— | 41 | — | — | — | 41 | ||||||||||||||||||
|
|
|
|
|
|
|
|
|
|
|
|
|
|||||||||||||
| Cash, cash equivalents and restricted cash at end of year |
5,029 | 40,080 | 34,816 | 5,190 | — | 85,115 | ||||||||||||||||||
|
|
|
|
|
|
|
|
|
|
|
|
|
|||||||||||||
24
Table of Contents
| For the Year Ended December 31, 2021 | ||||||||||||||||||||||||
| Parent | Other Subsidiaries |
Primary Beneficiaries of Consolidated Variable Interest Entities |
Consolidated Variable Interest Entities |
Eliminations | Consolidated Total |
|||||||||||||||||||
| (RMB in millions) | ||||||||||||||||||||||||
| Net cash provided by/(used in) operating activities |
(411 | ) | 64,468 | (23,349 | ) | 1,593 | — | 42,301 | ||||||||||||||||
|
|
|
|
|
|
|
|
|
|
|
|
|
|||||||||||||
| Cash flows from investing activities |
||||||||||||||||||||||||
| (Increase)/decrease in short-term investments, net |
3,357 | (27,948 | ) | (28,500 | ) | (1,231 | ) | — | (54,322 | ) | ||||||||||||||
| Prepayments and investments in equity investees |
— | (6,356 | ) | — | (5,220 | ) | — | (11,576 | ) | |||||||||||||||
| Loans (provided to)/settled by internal companies |
(20,900 | ) | (72,034 | ) | (873 | ) | 1,122 | 92,685 | — | |||||||||||||||
| Cash paid for property, equipment, software and construction in progress |
— | (8,900 | ) | (948 | ) | (4,582 | ) | — | (14,430 | ) | ||||||||||||||
| Other investing activities |
3,147 | 1,157 | 368 | (178 | ) | 1,586 | 6,080 | |||||||||||||||||
|
|
|
|
|
|
|
|
|
|
|
|
|
|||||||||||||
| Net cash used in investing activities |
(14,396 | ) | (114,081 | ) | (29,953 | ) | (10,089 | ) | 94,271 | (74,248 | ) | |||||||||||||
|
|
|
|
|
|
|
|
|
|
|
|
|
|||||||||||||
| Cash flows from financing activities |
||||||||||||||||||||||||
| Capital injection from non-controlling interest shareholders |
— | 27,600 | — | 62 | — | 27,662 | ||||||||||||||||||
| Increase/(decrease) in short-term borrowings, net |
— | (249 | ) | 1,500 | (100 | ) | — | 1,151 | ||||||||||||||||
| Net proceeds from internal companies |
— | 19,778 | 61,190 | 11,717 | (92,685 | ) | — | |||||||||||||||||
| Repayment of unsecured senior notes |
(3,246 | ) | — | — | — | — | (3,246 | ) | ||||||||||||||||
| Other financing activities |
62 | (4,472 | ) | — | (68 | ) | (1,586 | ) | (6,064 | ) | ||||||||||||||
|
|
|
|
|
|
|
|
|
|
|
|
|
|||||||||||||
| Net cash provided by/(used in) financing activities |
(3,184 | ) | 42,657 | 62,690 | 11,611 | (94,271 | ) | 19,503 | ||||||||||||||||
|
|
|
|
|
|
|
|
|
|
|
|
|
|||||||||||||
| Effect of exchange rate changes on cash, cash equivalents and restricted cash |
(136 | ) | (1,362 | ) | — | — | — | (1,498 | ) | |||||||||||||||
|
|
|
|
|
|
|
|
|
|
|
|
|
|||||||||||||
| Net increase/(decrease) in cash, cash equivalents and restricted cash |
(18,127 | ) | (8,318 | ) | 9,388 | 3,115 | — | (13,942 | ) | |||||||||||||||
| Cash, cash equivalents and restricted cash at beginning of year, including cash and cash equivalents classified within assets held for sale |
25,544 | 52,447 | 10,199 | 2,445 | — | 90,635 | ||||||||||||||||||
| Less: cash, cash equivalents and restricted cash classified within assets held for sale at beginning of year |
— | 116 | — | — | — | 116 | ||||||||||||||||||
| Cash, cash equivalents and restricted cash at beginning of year |
25,544 | 52,331 | 10,199 | 2,445 | — | 90,519 | ||||||||||||||||||
|
|
|
|
|
|
|
|
|
|
|
|
|
|||||||||||||
| Cash, cash equivalents and restricted cash at end of year |
7,417 | 44,129 | 19,587 | 5,560 | — | 76,693 | ||||||||||||||||||
|
|
|
|
|
|
|
|
|
|
|
|
|
|||||||||||||
25
Table of Contents
| B. | Capitalization and Indebtedness |
Not applicable.
| C. | Reasons for the Offer and Use of Proceeds |
Not applicable.
| D. | Risk Factors |
Risks Related to Our Business
If we are unable to manage our growth or execute our strategies effectively, our business and prospects may be materially and adversely affected.
Our business has continued to grow in recent years, and we expect continued growth in our business and revenues. We plan to further invest in technologies, expand our fulfillment infrastructure and increase our product and service offerings. For example, in 2023, we recruited new employees in connection with the expansion of our fulfillment infrastructure and strengthening of our supply chain-based technology and service capability. We will continue to invest resources in training, managing and motivating our workforce. We also plan to continue to build our warehouses and establish new fulfillment facilities in additional locations across China, including smaller, less developed areas. In addition, as we continue to increase our product and service offerings, we will need to work with a large number of new suppliers and third-party merchants efficiently and establish and maintain mutually beneficial relationships with our existing and new suppliers and third-party merchants. To support our growth, we also plan to implement a variety of new and upgraded managerial, operating, financial and human resource systems, procedures and controls. All these efforts will require significant managerial, financial and human resources. We cannot assure you that we will be able to effectively manage our growth or to implement all these systems, procedures and control measures successfully or that our new business initiatives will be successful. If we are not able to manage our growth or execute our strategies effectively, our expansion may not be successful and our business and prospects may be materially and adversely affected.
We incurred net losses in the past and we may not be able to maintain profitability in the future.
We had net loss of RMB4,467 million and net income of RMB9,691 million and RMB23,257 million (US$3,275 million) in 2021, 2022 and 2023, respectively. We had retained earnings of RMB33,805 million, RMB29,304 million and RMB44,051 million (US$6,205 million) as of December 31, 2021, 2022 and 2023, respectively.
We cannot assure you that we will be able to generate net income in the future. Our ability to achieve and maintain profitability depends in large part on our ability to increase our gross margin by obtaining more favorable terms from our suppliers as our business further grows in scale, managing our product mix, expanding our online marketplace and offering value-added services with higher margins. Accordingly, we intend to continue to invest for the foreseeable future in our technology platform and fulfillment infrastructure to support an even larger selection of products and to offer additional value-added services. As a result of the foregoing, we may not be able to maintain our profitability in the future.
If we are unable to provide superior customer experience, our business and reputation may be materially and adversely affected.
The success of our business hinges on our ability to provide superior customer experience, which in turn depends on a variety of factors. These factors include our ability to continue to offer authentic products at competitive prices, source products to respond to customer demands, maintain the quality of our products and services, attract and regulate third-party merchants on our online marketplace, and provide timely and reliable delivery, flexible payment options and superior after-sales service.
26
Table of Contents
We rely primarily on our own fulfillment infrastructure, and to a lesser extent on third-party couriers, to deliver our products. Interruptions or failures in our delivery services or third-party couriers could prevent the timely or successful delivery of our products. These interruptions may be due to unforeseen events that are beyond our control or the control of our third-party couriers, such as inclement weather, natural disasters, virus outbreaks, transportation disruptions or labor unrest. If our products are not delivered on time or are delivered in a damaged state, customers may refuse to accept our products and have less confidence in our services. Furthermore, our own delivery personnel and those of third-party couriers act on our behalf and, in most instances, interact with our customers personally. We maintain cooperation arrangements with a number of third-party couriers to deliver our products to our customers in those areas not covered by our own fulfillment infrastructure and for a portion of our bulky item deliveries, and we need to effectively manage these third-party service providers to ensure the quality of customer services. We have in the past received customer complaints from time to time regarding our delivery and return and exchange services. In addition, we have opened our fulfillment infrastructure by offering logistics services to third parties. If we are not able to manage our logistics services successfully, opening these services to third parties could divert the resources available to our retail business and affect customer experience. Any failure to provide high-quality delivery services to our customers may negatively impact the shopping experience of our customers, damage our reputation and cause us to lose customers. In certain instances, our customers may be referred to our affiliates when using our services. Even though we do not necessarily have control over these affiliates, any negative customer experience associated with them may adversely affect our brand and reputation.
We operate 24-7 customer service centers in Suqian, Wuhan, Chengdu and Datong, handling all kinds of customer queries and complaints regarding our products and services. As of December 31, 2023, we had over 16,000 customer service representatives at these centers. There is no assurance that we will be able to maintain a low turnover rate of existing employees and provide sufficient training to new employees to meet our standards of customer service or that an influx of less experienced personnel will not dilute the quality of our customer service. If our customer service representatives fail to provide satisfactory service, or if waiting times are too long due to the high volume of calls from customers at peak times, our brand and customer loyalty may be adversely affected. In addition, any negative publicity or poor feedback regarding our customer service may harm our brand and reputation and in turn cause us to lose customers and market share.
Uncertainties relating to the growth and profitability of the retail industry in China in general, and the online retail industry in particular, could adversely affect our business, prospects and results of operations.
We generate the majority of our revenues from online retail. While online retail has existed in China since the 1990s, only recently have certain large online retail companies become profitable. The long-term viability and prospects of various online retail business models in China remain relatively untested. Our future results of operations will depend on numerous factors affecting the development of the online retail industry in China, which may be beyond our control. These factors include:
| • | the growth of internet, broadband, personal computer and mobile penetration and usage in China, and the rate of any such growth; |
| • | the consumers’ trust and confidence level towards online retail in China, as well as changes in customer demographics and consumer tastes and preferences; |
| • | the selection, price and popularity of products as well as promotions that we and our competitors offer online; |
| • | whether alternative retail channels or business models that better address the needs of consumers emerge in China; and |
| • | the development of fulfillment, payment and other ancillary services associated with online purchases. |
A decline in the popularity of online shopping in general, or any failure by us to adapt our mobile apps and websites and to improve the online shopping experience of our customers in response to trends and consumer requirements, may adversely affect our net revenues and business prospects.
Furthermore, the retail industry is very sensitive to macroeconomic changes, and retail purchases tend to decline during recessionary periods. The majority of our net revenues are derived from retail sales in China. Many factors outside of our control, including inflation and deflation, currency exchange rate fluctuation, volatility of stock and property markets, interest rates, tax rates and other government policies and unemployment rates can adversely affect consumer confidence and spending, which could in turn materially and adversely affect our growth and profitability. Unfavorable developments in domestic and international politics, including military conflicts, political turmoil and social instability, may also adversely affect consumer confidence and reduce spending, which could in turn materially and adversely affect our growth and profitability.
27
Table of Contents
Any harm to our JD brand or reputation may materially and adversely affect our business and results of operations.
We believe that the recognition and reputation of our JD (京东) brand among our customers, suppliers and third-party merchants have contributed significantly to the growth and success of our business. Maintaining and enhancing the recognition and reputation of our brand are critical to our business and competitiveness. Many factors, some of which are beyond our control, are important to maintaining and enhancing our brand. These factors include our ability to:
| • | provide a compelling shopping experience to customers; |
| • | maintain the popularity, attractiveness, diversity, quality and authenticity of the products we offer; |
| • | maintain the efficiency, reliability and quality of our fulfillment services; |
| • | maintain or improve customers’ satisfaction with our after-sale services; |
| • | support third-party merchants to provide satisfactory customer experience through our online marketplace; |
| • | increase brand awareness through marketing and brand promotion activities; and |
| • | preserve our reputation and goodwill in the event of any negative publicity, including those on customer service, customer and supplier relationships, internet security, product quality, price or authenticity, or other issues affecting us or other online retail businesses in China. |
A public perception that non-authentic, counterfeit or defective goods are sold on our mobile apps and websites or that we or third-party service providers do not provide satisfactory customer service, even if factually incorrect or based on isolated incidents, could damage our reputation, diminish the value of our brand, undermine the trust and credibility we have established and have a negative impact on our ability to attract new customers or retain our current customers. If we are unable to maintain our reputation, enhance our brand recognition or increase positive awareness of our websites, products and services, as well as products sold by third-party merchants through our online marketplace, it may be difficult to maintain and grow our customer base, and our business and growth prospects may be materially and adversely affected.
Any actual or alleged illegal activities by our employees (including our senior management) could subject us to liability or negative publicity. These activities may also affect our employees’ ability or willingness to continue to serve our company or dedicate their full time and efforts to our company and negatively affect our brand and reputation, resulting in an adverse effect on our business, operating results and financial condition.
If we are unable to offer products that attract purchases from new and existing customers, our business, financial condition and results of operations may be materially and adversely affected.
Our future growth depends on our ability to continue to attract purchases from new customers and existing customers. Constantly changing consumer preferences have affected and will continue to affect the retail industry, in particular the online retail industry. We must stay abreast of emerging consumer preferences and anticipate product trends that will appeal to existing and potential customers. We have been making progress in leveraging artificial intelligence, or AI, technologies to generate personalized recommendations to customers for products in which they may be interested. Each product page typically has recommendations of similar products or other products that are often purchased together with that product. In addition, our mobile apps and websites make recommendations to customers according to a comprehensive dataset compiled based on customers’ shopping behavior. Our ability to make individually tailored recommendations is dependent on our business intelligence system, which tracks, collects and analyzes our users’ browsing and purchasing behavior, to provide accurate and reliable information. Our customers choose to purchase products on our mobile apps and websites due in part to the attractive prices that we offer, and they may choose to shop elsewhere if we cannot match the prices offered by other websites or by physical stores, or if we cannot maintain a steady supply of products they desire. If our customers cannot find their desired products on our mobile apps and websites at attractive prices, they may lose interest in us and visit our mobile apps and websites less frequently or even stop visiting our mobile apps and websites altogether, which in turn may materially and adversely affect our business, financial condition and results of operations.
28
Table of Contents
If we are unable to manage our nationwide fulfillment infrastructure efficiently and effectively, our business prospects and results of operations may be materially and adversely affected.
We believe that our own nationwide fulfillment infrastructure, consisting of strategically located warehouses and delivery and pickup stations, is essential to our success. As of December 31, 2023, our warehouse network covered almost all counties and districts across China, consisting of over 1,600 warehouses operated by us and over 2,000 cloud warehouses operated by third-party warehouse owner-operators under JD Logistics Open Warehouse Platform. As of December 31, 2023, our warehouse network had an aggregate gross floor area of over 32 million square meters, including the gross floor area of the cloud warehouses under JD Logistics Open Warehouse Platform. Our comprehensive fulfillment facilities covered almost all the counties and districts across China, and we had 425,469 warehouse and delivery personnel as of December 31, 2023. We are constructing our warehouses to increase our storage capacity and to restructure and reorganize our fulfillment workflow and processes. We also plan to continue the establishment of fulfillment facilities at additional locations, including those smaller and less developed areas, to further enhance our ability to deliver products to customers directly ourselves. As we continue to add fulfillment and warehouse capability and expand our reach to those smaller, less-developed areas, our fulfillment network becomes increasingly complex and challenging to operate. We cannot assure you that we will be able to acquire land use rights and set up warehouses, or lease suitable facilities for the delivery stations, on commercially acceptable terms or at all. Moreover, the order density in those smaller, less developed areas may not be sufficient to allow us to operate our own delivery network in a cost-efficient manner. We may not be able to recruit a sufficient number of qualified employees in connection with the expansion of our fulfillment infrastructure. In addition, the expansion of our fulfillment infrastructure may strain our managerial, financial, operational and other resources. If we fail to manage such expansion successfully, our growth potential, business and results of operations may be materially and adversely affected. Even if we manage the expansion of our fulfillment infrastructure successfully, it may not give us the competitive advantage that we expect if improved third-party fulfillment services become widely available at reasonable prices to retailers in China.
We face intense competition. We may not be able to maintain or may lose market share and customers if we fail to compete effectively.
The retail industry in China, in particular the online retail industry, is intensely competitive. We compete for customers, orders, products and third-party merchants. Our current or potential competitors include major e-commerce companies in China that offer a wide range of general merchandise product categories, major traditional retailers in China that are moving into online retailing, online retail companies in China focused on specific product categories, and physical retail stores including big-box stores that also aim to offer a one-stop shopping experience. See “Item 4.B Information on the Company—Business Overview—Competition.” In addition, new and enhanced technologies may increase the competition in the retail industry. New competitive business models may appear, for example based on new forms of social media or social commerce.
Increased competition may reduce our margins and market share and impact brand recognition, or result in significant losses. When we set prices, we have to consider how competitors have set prices for the same or similar products. When they cut prices or offer additional benefits to compete with us, we may have to lower our own prices or offer additional benefits or risk losing market share, either of which could harm our financial condition and results of operations.
Some of our current or future competitors may have longer operating histories, greater brand recognition, better supplier relationships, larger customer bases, higher penetration in certain regions or greater financial, technical or marketing resources than we do. Those smaller companies or new entrants may be acquired by, receive investment from or enter into strategic relationships with well-established and well-financed companies or investors which would help enhance their competitive positions. Some of our competitors may be able to secure more favorable terms from suppliers, devote greater resources to marketing and promotional campaigns, adopt more aggressive pricing or inventory policies and devote substantially more resources to their websites, mobile apps and systems development than us. We cannot assure you that we will be able to compete successfully against current or future competitors, and competitive pressures may have a material and adverse effect on our business, financial condition and results of operations.
29
Table of Contents
Our expansion into new product categories and substantial increase in the number of products may expose us to new challenges and more risks.
Since our inception, we have expanded our product offerings to include a wide range of products including apparel and footwear, bags, watches, jewelry, household goods, cosmetics, personal care products, baby and maternity products, food and beverages, fresh produce, fitness equipment, autoparts, pharmaceutical products, nutritional supplements, healthcare equipment, industrial products, and books and virtual goods. Expansion into diverse new product categories and substantially increased number of products and stock keeping units involves new risks and challenges. Our lack of familiarity with new products and lack of relevant customer data relating to such products may make it more difficult for us to anticipate customer demand and preferences. We may misjudge customer demand, resulting in inventory buildup and possibly inventory write-down. It may also make it more difficult for us to inspect and control quality and ensure proper handling, storage and delivery in new product categories. We may experience higher return rates on new products, receive more customer complaints about them and face costly product liability claims as a result of selling them, which would harm our brand and reputation as well as our financial performance. Furthermore, we may not have much purchasing power in new categories of products and we may not be able to negotiate favorable terms with suppliers. We may need to price aggressively to gain market share or remain competitive in new categories. It may be difficult for us to achieve profitability in the new product categories and our profit margin, if any, may be lower than we anticipate, which would adversely affect our overall profitability and results of operations. We cannot assure you that we will be able to recoup our investments in introducing these new product categories.
If we fail to manage our inventory effectively, our results of operations, financial condition and liquidity may be materially and adversely affected.
Our scale and business model require us to manage a large volume of inventory effectively. We depend on our demand forecasts for various kinds of products to make purchase decisions and to manage our inventory. Demand for products, however, can change significantly between the time inventory is ordered and the date by which we target to sell it. Demand may be affected by seasonality, new product launches, changes in product cycles and pricing, product defects, changes in consumer spending patterns, changes in consumer tastes with respect to our products and other factors, and our customers may not order products in the quantities that we expect. In addition, when we begin selling a new product, it may be difficult to establish supplier relationships, determine appropriate product selection, and accurately forecast demand. The acquisition of certain types of inventory may require significant lead time and prepayment, and they may not be returnable.
As of December 31, 2021, 2022 and 2023, our net inventories amounted to RMB75,601 million, RMB77,949 million, and RMB68,058 million (US$9,586 million), respectively. Our annual inventory turnover days were 30.3 days in 2021, 33.2 days in 2022, and 30.3 days in 2023. Annual inventory turnover days are the quotient of average inventory over the immediately preceding five quarters, up to and including the last quarter of the annual period, to cost of revenues of retail business for that annual period, and then multiplied by 360 days. As we plan to continue expanding our product offerings, we expect to include more products in our inventory, which will make it more challenging for us to manage our inventory effectively and will put more pressure on our warehousing system.
If we fail to manage our inventory effectively, we may be subject to a heightened risk of inventory obsolescence, a decline in inventory values, and significant inventory write-downs or write-offs. In addition, we may be required to lower sale prices in order to reduce inventory level, which may lead to lower gross margins. High inventory levels may also require us to commit substantial capital resources, preventing us from using that capital for other important purposes. Any of the above may materially and adversely affect our results of operations and financial condition.
On the other hand, if we underestimate demand for our products, or if our suppliers fail to supply quality products in a timely manner, we may experience inventory shortages, which might result in missed sales, diminished brand loyalty and lost revenues, any of which could harm our business and reputation.
30
Table of Contents
If we are unable to conduct our marketing activities cost-effectively, our results of operations and financial condition may be materially and adversely affected.
We have incurred significant expenses on a variety of different marketing and brand promotion efforts designed to enhance our brand recognition and increase sales of our products. Our brand promotion and marketing activities may not be well received by customers and may not result in the levels of product sales that we anticipate. We incurred RMB38,743 million, RMB37,772 million, and RMB40,133 million (US$5,653 million) of marketing expenses, representing 4.1%, 3.6% and 3.7% of our total net revenues, in 2021, 2022 and 2023, respectively. Marketing approaches and tools in the consumer products market in China are evolving. This further requires us to enhance our marketing approaches and experiment with new marketing methods to keep pace with industry developments and customer preferences. Failure to refine our existing marketing approaches or to introduce new marketing approaches in a cost-effective manner could reduce our market share, cause our net revenues to decline and negatively impact our profitability.
If we fail to manage and expand our relationships with suppliers, or otherwise fail to procure products on favorable terms, our business and growth prospects may suffer.
We source products from third-party suppliers for our retail business. We had over 50,000 suppliers as of December 31, 2023. Our suppliers include domestic and cross-border manufacturers, distributors and resellers. Maintaining strong relationships with these suppliers is important to the growth of our business. In particular, we depend significantly on our ability to procure products from suppliers on favorable pricing terms. We typically enter into one-year framework agreements with suppliers on an annual basis, and these framework agreements do not ensure the availability of products or the continuation of particular pricing practices or payment terms beyond the end of the contractual term. In addition, our agreements with suppliers typically do not restrict the suppliers from selling products to other buyers. We cannot assure you that our current suppliers will continue to sell products to us on commercially acceptable terms, or at all, after the term of the current agreement expires. Even if we maintain good relationships with our suppliers, their ability to supply products to us in sufficient quantity and at competitive prices may be adversely affected by economic conditions, labor actions, regulatory or legal decisions, customs and import restrictions, natural disasters or other causes. In the event that we are not able to purchase merchandise at favorable prices, our revenues and cost of revenues may be materially and adversely affected. In the event any distributor or reseller does not have authority from the manufacturer to sell certain products to us, such distributor or reseller may cease selling such products to us at any time. In addition, our annual accounts payable turnover days for retail business were 45.3 days in 2021, 52.5 days in 2022, and 53.2 days in 2023, respectively. Annual accounts payable turnover days are the quotient of average accounts payable for retail business over the immediately preceding five quarters, up to and including the last quarter of the annual period, to cost of revenues of retail business for that annual period, and then multiplied by 360 days. If our suppliers cease to provide us with favorable payment terms, our requirements for working capital may increase and our operations may be materially and adversely affected. We will also need to establish new supplier relationships to ensure that we have access to a steady supply of products on favorable commercial terms. If we are unable to develop and maintain good relationships with suppliers that would allow us to obtain a sufficient amount and variety of authentic and quality merchandise on acceptable commercial terms, it may inhibit our ability to offer sufficient products sought by our customers, or to offer these products at competitive prices. Any adverse developments in our relationships with suppliers could materially and adversely affect our business and growth prospects. Any disputes with suppliers could adversely affect our reputation and subject us to damages and negative publicity. In addition, as part of our growth strategy, we plan to further expand our product offerings. If we fail to attract new suppliers to sell their products to us due to any reason, our business and growth prospects may be materially and adversely affected.
Any interruption in the operation of our regional fulfillment centers, front distribution centers, other additional warehouses, delivery stations or pickup stations for an extended period may have an adverse impact on our business.
Our ability to process and fulfill orders accurately and provide high-quality customer service depends on the smooth and safe operation of our regional fulfillment centers, front distribution centers, other additional warehouses, and our delivery and pickup stations. Our fulfillment infrastructure may be vulnerable to damage caused by fire, flood, power outage, telecommunications failure, break-ins, earthquake, human error and other events. If any of our regional fulfillment centers were to operate at a lower capacity or rendered incapable of operations, then we may be unable to fulfill any orders in a timely manner or at all in any of the provinces that rely on that center. In addition, those events that could damage our fulfillment infrastructure, such as fire and flood, may also result in damages to our inventory stored in or delivered through our fulfillment infrastructure, and in such event, we would incur losses as a result. We do not carry business interruption insurance other than in connection with the fixed business premises of our 7FRESH business, and the occurrence of any of the foregoing risks could have a material adverse effect on our business, prospects, financial condition and results of operations.
31
Table of Contents
Safe operations are critical to us. Our operations of warehouses and delivery services are also subject to various laws and regulations on safety, such as the Work Safety Law which requires, among other things, that the production and operation entities in emerging industries and fields such as platform economy shall, based on the characteristics of their respective industries and fields, establish, improve and implement a responsibility system for the work safety of employees, as well as strengthen the education and training on work safety for employees. See “Item 4.B. Business Overview—Regulations—Regulations Relating to Product Quality, Consumer Protection and Operation Safety” for more details. If we fail to ensure safety in the operations of our fulfillment infrastructure or road transportation, we may suffer from the adverse impact of accidents happened in our workspace or in transit, which could result in personal injury and loss of property and subject us to fines, penalties or mandatory corrective measures imposed by government authorities for violation of laws and regulations on safety. The occurrence of such accidents could materially and adversely affect our business, reputation, financial condition and results of operations.
We may not be able to recoup the investments we make to expand and upgrade our fulfillment and technology capabilities.
We have invested significant resources in expanding and will continue to expand our fulfillment infrastructure and upgrade our technology platform. We also paid significant amounts for upgrading our technology platform during the same periods. We expect to continue to invest in our fulfillment and technology capabilities for a number of years. We also intend to continue to add resources to our fulfillment infrastructure and upgrade our technology platform as we focus on expanding our product selection and offering new services. We are likely to recognize the costs associated with these investments earlier than some of the anticipated benefits, and the return on these investments may be lower, or may develop more slowly, than we expect. We may not be able to recover our capital expenditures or investments, in part or in full, or the recovery of these capital expenditures or investments may take longer than expected. As a result, the carrying value of the related assets may be subject to an impairment charge, which could adversely affect our financial condition and results of operation.
Moreover, our heavy investment in building our own fulfillment infrastructure may put us at a competitive disadvantage against those competitors who primarily rely on third-party fulfillment services and focus their investment on improving other aspects of their businesses. We have designed our own fulfillment infrastructure to satisfy our business and operation requirements and to accommodate our fast growth, but there is no guarantee that we will be successful in meeting our objectives or that our own fulfillment structure will function more effectively and efficiently than third-party solutions.
We use third-party couriers to deliver some orders, and our third-party merchants use couriers to deliver a significant number of orders. If these couriers fail to provide reliable delivery services, our business and reputation may be materially and adversely affected.
We maintain cooperation arrangements with a number of third-party couriers to deliver our products to our customers in those areas not covered by our own fulfillment infrastructure, particularly in smaller and less developed areas. We may also use third-party service providers to ship products from our regional fulfillment centers or front distribution centers to delivery stations or to deliver bulky item products. Third-party merchants also use third-party couriers if they do not make use of our delivery services. Interruptions to or failures in these third parties’ delivery services could prevent the timely or proper delivery of our products to customers. These interruptions may be due to events that are beyond our control or the control of these delivery companies, such as inclement weather, natural disasters, virus outbreaks, transportation disruptions or labor unrest. In addition, if our third-party couriers fail to comply with applicable rules and regulations in China, our delivery services may be materially and adversely affected. We may not be able to find alternative delivery companies to provide delivery services in a timely and reliable manner, or at all. Delivery of our products could also be affected or interrupted by the merger, acquisition, insolvency or government shut-down of the delivery companies we engage to make deliveries, especially those local companies with relatively small business scales. If our products are not delivered in proper condition or on a timely basis, our business and reputation may be materially and adversely affected.
32
Table of Contents
Our online marketplace is subject to risks associated with third-party merchants.
We do not have as much control over the storage and delivery of products sold on our online marketplace as we do over the products that we sell directly ourselves. Many of our third-party merchants use their own facilities to store their products, and many of them use their own or third-party delivery systems to deliver their products to our customers, which makes it more difficult for us to ensure that our customers get the same high-quality service for all products sold on our mobile apps and websites. If any third-party merchant does not control the quality of the products that it sells on our mobile apps and websites, fails to timely deliver the products to customers, delivers products that are faulty or materially different from description, sells counterfeit or unlicensed products, or sells products without licenses or permits as required by the laws and regulations even though we have requested such licenses or permits in our standard form contract with the third-party merchant, the reputation of our online marketplace and our JD brand may be materially and adversely affected and we could face claims to hold us liable for the losses. Moreover, despite our efforts to prevent it, some products sold on our online marketplace may compete with the products we sell directly, which may cannibalize our online retail. In addition, the supplier relationships, customer acquisition dynamics and other requirements for our online marketplace may not be the same as those for our online retail operations, which may complicate the management of our business. In order for our online marketplace to be successful, we must continue to identify and attract third-party merchants, and we may not be successful in this regard.
Failure to deal effectively with any fictitious transactions or other fraudulent conduct would materially and adversely affect our business, financial condition and results of operations.
We may face risks with respect to fraudulent activities on our online marketplace. Although we have implemented various measures to detect and reduce the occurrence of fraudulent activities on our marketplace, there can be no assurance that such measures will be effective in combating fraudulent transactions or improving overall satisfaction among third-party merchants and customers. In addition to fraudulent transactions with legitimate customers, sellers may also engage in fictitious or “phantom” transactions with themselves or collaborators in order to artificially inflate their own ratings on our online marketplace, reputation and search results rankings. This activity may harm other sellers by enabling the perpetrating seller to be favored over legitimate sellers, and may harm our customers by deceiving them into believing that a seller is more reliable or trusted than the seller actually is. This activity may also result in inflated transaction volume from our online marketplace. Moreover, illegal, fraudulent or collusive activities by our employees, such as fraud, bribery or corruption, could also subject us to liability or negative publicity or cause losses. Although we have internal controls and policies with regard to the review and approval of sales activities and other relevant matters, we cannot assure you that such controls and policies will prevent fraud or illegal activity by our employees. For example, Dada announced on January 8, 2024 and March 5, 2024 that, during its routine internal audit process, certain suspicious practices were identified that may cast doubt on certain revenues from its online advertising and marketing services. See “—Strategic alliances, investments or acquisitions may have a material and adverse effect on our business, reputation, results of operations and financial condition.”Negative publicity and user sentiment generated as a result of actual or alleged fraudulent or deceptive conduct on our platform or by our employees would severely diminish consumer confidence in us, reduce our ability to attract new or retain current third-party merchants and customers, damage our reputation and diminish the value of our brand names, and materially and adversely affect our business, financial condition and results of operations.
Strategic alliances, investments or acquisitions may have a material and adverse effect on our business, reputation, results of operations and financial condition.
We may enter into strategic alliances with various third parties to facilitate the achievement of our business purposes from time to time. Strategic alliances with third parties could subject us to a number of risks, including risks associated with sharing proprietary information, non-performance by the counterparty, and an increase in expenses incurred in establishing new strategic alliances, any of which may materially and adversely affect our business. We may have little ability to control or monitor their actions. To the extent the third parties suffer negative publicity or harm to their reputations from events relating to their business, we may also suffer negative publicity or harm to our reputation by virtue of our association with such third parties.
33
Table of Contents
In addition, we have in the past invested in or acquired additional assets, technologies or businesses that are complementary to our existing business, such as:
| a. | our investments in and acquisition of Dada Nexus Limited, or Dada, a Nasdaq-listed company and a leading local on-demand delivery and retail platform in China; |
| b. | our acquisition of |
| • | Yihaodian marketplace platform assets from Wal-Mart Stores, Inc., or Walmart, a NYSE-listed company, including the Yihaodian brand, mobile apps and websites, |
| • | Jiangsu Five Star Appliance Co., Ltd., or Jiangsu Five Star, one of the leading offline retailers of home appliances and consumer electronics in China, |
| • | Kuayue-Express Group Co., LTD., or Kuayue-Express, a renowned modern integrated express transportation enterprise specializing in “limited-time express service” in China, |
| • | China Logistics Property Holdings Co., Ltd., or CNLP, a company formerly listed on the Hong Kong Stock Exchange primarily engaged in the leasing of storage facilities and the related management services in the PRC, and |
| • | Deppon Logistics Co., Ltd, or Deppon, an integrated, customer-centered logistics company providing a wide range of solutions including Less-Than-Truckload (LTL) transportation, Full Truck Load (FTL) transportation, delivery services, and warehousing management listed on the Shanghai Stock Exchange; and |
| c. | our investments in |
| • | Yonghui Superstores Co., Ltd., or Yonghui, a company listed on the Shanghai Stock Exchange and a leading hypermarket and supermarket operator in China, |
| • | Dalian Wanda Commercial Properties Co., Ltd., or Wanda Commercial Properties, a leading developer, owner and operator of commercial properties in China, |
| • | ATRenew Inc. (formerly known as AiHuiShou International Co. Ltd.), or ATRenew, a NYSE-listed company which operates an online second-hand consumer electronics trading platform, and |
| • | Xingsheng Preference Electronic Business Limited, or Xingsheng, a leading community group buying e-commerce platform that serves community families with fresh foods and daily necessities. |
See “Item 4.A. Information on the Company—History and Development of the Company—Our Major Investments.” We expect to continue to evaluate and consider a wide array of potential strategic transactions as part of our overall business strategy, including business combinations, acquisitions and dispositions of businesses, technologies, services, products and other assets, as well as strategic investments, joint ventures and alliances.
If we are presented with appropriate opportunities, we may continue to do so in the future. Investments or acquisitions and the subsequent integration of new assets and businesses into our own would require significant attention from our management and could result in a diversion of resources from our existing business, which in turn could have an adverse effect on our business operations. The costs of identifying and consummating investments and acquisitions may be significant. We may also incur significant expenses in obtaining necessary approvals from government authorities in China and elsewhere in the world. In addition, investments and acquisitions could result in the use of substantial amounts of cash, potentially dilutive issuances of equity securities and exposure to potential unknown liabilities of the acquired business. The cost and duration of integrating newly acquired businesses could also materially exceed our expectations. Any such negative developments could have a material adverse effect on our business, financial condition and results of operations.
Our financial results could be adversely affected by our investments or acquisitions. The investments and acquired assets or businesses may not generate the financial results we expect. They could result in occurrence of significant investments and goodwill impairment charges, and amortization expenses for other intangible assets. As of December 31, 2023, we had net intangible assets of RMB6.9 billion (US$1.0 billion) and goodwill of RMB20 billion (US$2.8 billion). In the event that a decline in fair value below the carrying value of our equity method investments is other-than-temporary, or the carrying amount of a reporting unit to which goodwill is allocated exceeds its fair value, we may have to record actual or potential impairment charges of investments in equity investees or intangible assets and goodwill recorded in connection with invested businesses. If the investments that we account for using the equity method were in a loss position, we would pick up their loss in our consolidated statement of operations. We may continue to incur impairment charges in connection with our investments or acquisitions and pick up the losses by our equity investments, which could depress our profitability and have a material adverse impact on our financial results. We measure long-term investments other than equity method investments at fair value through earnings, which could vary significantly year to year. We recorded losses of RMB7.3 billion, RMB4.1 billion and RMB0.9 billion (US$0.1 billion) resulting from the fair value change in long-term investments in 2021, 2022 and 2023, respectively.
34
Table of Contents
In addition, we may be subject to risks associated with actual or alleged fictitious transactions or other fraudulent conduct, as well as non-compliant actions, by any company we acquire or invest in. We may have limited experience in these acquired business or investments, and these acquired companies or investees may not adopt our protocols and policies appropriately. As such, we cannot assure you that our protocols and policies will prevent these fraudulent conducts or non-compliant actions. These and other risks could also lead to negative publicity, litigation, government inquiries, investigations or actions against the companies we invest in or acquire, or even against our other businesses, and may force us to incur significant additional expenses and allocate significant management and human resources to rectify or improve these companies’ corporate governance standards or internal controls and systems. For example, Dada announced on January 8, 2024 and March 5, 2024 that, during its routine internal audit process, certain suspicious practices were identified that may cast doubt on certain revenues from its online advertising and marketing services. In response, the audit committee of Dada’s board of directors, with the assistance of independent professional advisers, initiated an independent review, which was substantially completed in March 2024. On January 10, 2024, Dada and certain of its former executives were named as defendants in a putative securities class action in the U.S. District Court for the Central District of California. Plaintiff alleges that the defendants made misleading statements or omissions regarding Dada’s business operations and financials. The Court has appointed Lead Plaintiff, who is scheduled to file an amended complaint by June 4, 2024. As this case remains in its preliminary stage, we are currently unable to predict the timing, outcome, or consequences of this action.
We may be subject to legal, regulatory and/or administrative proceedings.
We may be subject to litigation and regulatory proceedings inside and outside China relating to third-party and principal intellectual property infringement claims, contract disputes involving third-party merchants and consumers on our platforms, consumer protection claims, claims relating to data and privacy protection, employment related cases, cross-border payment and settlement disputes, internet advertising and other matters in the ordinary course of our business. As we routinely enter into business contracts with our suppliers, third-party merchants and consumers on our platform, we have been and may continue to be involved in legal proceedings arising from contract disputes or other civil disputes, including being named as a co-defendant in lawsuits filed against our suppliers by third parties. For example, in July and August 2019, two lawsuits were filed against us. The plaintiffs in these two lawsuits are seeking damages in an aggregate amount of approximately RMB3.5 billion. We believe these lawsuits are without merit and we are defending ourselves vigorously. However, there is uncertainty regarding the timing or ultimate resolution of these two lawsuits and the other legal proceedings in which we are involved. In addition, In 2017, we filed an antitrust lawsuit against Zhejiang Tmall Online Co., Ltd., Zhejiang Tmall Technology Co., Ltd. and Alibaba Group Holding Limited for employing unfair means to force merchants to choose one platform between Alibaba’s Tmall and us. On December 29, 2023, the Beijing Higher People’s Court issued a judgment, ruling that Alibaba’s behavior had abused its market-dominating power and constituted monopolistic behavior, ordering Alibaba to pay a damage of over RMB1.0 billion. The counterparties had appealed, and the case is in second-instance stage.
We anticipate that we will continue to be subject to legal, regulatory and/or administrative proceedings in the future incidental to our ordinary course of business. There can be no assurance that we will be able to prevail in our defense or reverse any unfavorable judgment, ruling or decision against us. In addition, we may decide to enter into settlements that may adversely affect our results of operations and financial condition.
35
Table of Contents
As our business expands, including across jurisdictions, we may encounter a variety of these claims, including those brought against us pursuant to anti-monopoly or unfair competitions laws or involving higher amounts of alleged damages. Laws, rules and regulations may vary in their scope and overseas laws and regulations may impose requirements that are more stringent than, or which conflict with, those in China. We have acquired and may acquire companies that may become subject to litigation, as well as regulatory proceedings. In addition, in connection with litigation or regulatory proceedings we may be subject to in various jurisdictions, we may be prohibited by laws, regulations or government authorities in one jurisdiction from complying with subpoenas, orders or other requests from courts or regulators of other jurisdictions, including those relating to data held in or with respect to persons in these jurisdictions. Our failure or inability to comply with the subpoenas, orders or requests could subject us to fines, penalties or other legal liability, which could have a material adverse effect on our reputation, business, results of operations and the trading price of our Class A ordinary shares and/or ADSs.
As publicly-listed companies, we and our publicly-listed subsidiaries may face additional exposure to claims and lawsuits, including securities law class actions, other federal securities law litigation and regulatory inquiries and investigations. We and our publicly-listed subsidiaries will need to defend against these actions, including any appeals should our initial defense be successful. The litigation process may utilize a material portion of our cash resources and divert management’s attention away from the day-to-day operations of our company, all of which could harm our business. There can be no assurance that we will prevail in any of these cases, and any adverse outcome of these cases could have a material adverse effect on our reputation, business and results of operations. In addition, although we have obtained directors’ and officers’ liability insurance, the insurance coverage may not be adequate to cover our obligations to indemnify our directors and officers, fund a settlement of litigation in excess of insurance coverage or pay an adverse judgment in litigation. Certain of our directors may be subject to alleged class actions due to their current or previous directorships in other listed companies. Our directors and executive officers may also face litigation or proceedings (including alleged or future securities class action) unrelated to their respective capacity as a director or executive officer of our company, and such litigation or proceedings may adversely affect our public image and reputation.
The existence of litigation, claims, investigations and proceedings may harm our reputation, limit our ability to conduct our business in the affected areas and adversely affect the trading price of our Class A ordinary shares and/or ADSs. The outcome of any claims, investigations and proceedings is inherently uncertain, and in any event defending against these claims could be both costly and time-consuming, and could significantly divert the efforts and resources of our management and other personnel. An adverse determination in any litigation, investigation or proceeding could cause us to pay damages, incur legal and other costs, limit our ability to conduct business or require us to change the manner in which we operate.
Our success depends on the continuing and collaborative efforts of our management team, and our business may be severely disrupted if we lose their services.
Our success heavily depends upon the continued services of our management. In particular, we rely on the expertise and experience of Mr. Richard Qiangdong Liu, our chairman, and our executive officers. If one or more of our senior management were unable or unwilling to continue in their present positions, we might not be able to replace them easily or at all, and our business, financial condition and results of operations may be materially and adversely affected. If any of our senior management joins a competitor or forms a competing business, we may lose customers, suppliers, know-how and key professionals and staff members. Our senior management has entered into employment agreements and confidentiality and non-competition agreements with us. However, if any dispute arises between our officers and us, we may have to incur substantial costs and expenses in order to enforce such agreements in China or we may be unable to enforce them at all. In addition, we do not have key-man insurance for any of our executive officers or other key personnel. Events or activities attributed to our executive officers or other key personnel, and related publicity, whether or not justified, may affect their ability or willingness to continue to serve our company or dedicate their full time and efforts to our company and negatively affect our brand and reputation, resulting in an adverse effect on our business, operating results and financial condition.
36
Table of Contents
If we are unable to recruit, train and retain qualified personnel or sufficient workforce while controlling our labor costs, our business may be materially and adversely affected.
Our future success depends, to a significant extent, on our ability to recruit, train and retain qualified personnel, particularly technical, fulfillment, marketing and other operational personnel with experience. Our experienced mid-level managers are instrumental in implementing our business strategies, executing our business plans and supporting our business operations and growth. The effective operation of our managerial and operating systems, fulfillment infrastructure, customer service center and other back office functions also depends on the hard work and quality performance of our management and employees. Since our industry is characterized by high demand and intense competition for talent and labor, we can provide no assurance that we will be able to attract or retain qualified staff or other highly skilled employees that we will need to achieve our strategic objectives. Our fulfillment infrastructure is labor intensive and requires a substantial number of blue-collar workers, and these positions tend to have higher than average turnover. As of December 31, 2023, we employed a total of 425,469 warehouse and delivery personnel. We have observed an overall tightening of the labor market and an emerging trend of shortage of labor supply. Failure to obtain stable and dedicated warehousing, delivery personnel and other labor support may lead to underperformance of these functions and cause disruption to our business. Labor costs in China have increased with China’s economic development, particularly in the large cities where we operate our regional fulfillment centers and more generally in the urban areas where we maintain our delivery and pickup stations. Because we operate our own fulfillment infrastructure, which requires a large and rapidly growing work force, our cost structure is more vulnerable to labor costs than that of many of our competitors, which may put us at a competitive disadvantage. Therefore, to maintain and enhance our competitiveness, we may from time to time need to adjust certain elements of our operations in response to evolving economic conditions and business needs. These adjustments, however, may not be sufficient to allow us to address the various challenges we face or improve our results of operations and financial performance as expected. Furthermore, if the compensation package offered is not competitive in the market, we may not be able to provide sufficient incentives to or maintain stable and dedicated warehousing, delivery personnel and other labor support. Any failure to address these risks and uncertainties could materially and adversely affect our results of operations and financial performance and our prospects of achieving profitability. In addition, our ability to train and integrate new employees into our operations may also be limited and may not meet the demand for our business growth on a timely fashion, or at all, and rapid expansion may impair our ability to maintain our corporate culture.
We may have conflicts of interest with our subsidiaries that are stand-alone public companies.
Certain of our subsidiaries have become stand-alone public companies. On December 8, 2020, shares of JD Health, our consolidated subsidiary, commenced trading on the Main Board of the Hong Kong Stock Exchange under the stock code “6618.” On May 28, 2021, shares of JD Logistics, our consolidated subsidiary, commenced trading on the Main Board of the Hong Kong Stock Exchange under the stock code “2618.” On March 30, 2023, each of JD Property and JD Industrials, through their respective joint sponsors, submitted a listing application form (Form A1) to the Hong Kong Stock Exchange to apply for the listing of, and permission to deal in, their respective shares on the Main Board of the Hong Kong Stock Exchange. There is no assurance as to whether or when any of the proposed listings may take place.
We currently offer different types of support to JD Health, JD Logistics, JD Property and JD Industrials to facilitate the marketing and implementation of their services. We have entered into and may, in the future, enter into various transactions and agreements with these subsidiaries. JD Health and JD Logistics have, and JD Property and JD Industrials are expected to have after any of them becomes a stand-alone public company in Hong Kong, their respective audit committee, each consisting of independent non-executive directors, to review and approve all proposed connected transactions as defined in the listing rules of the Hong Kong Stock Exchange, including any transactions between us and any of these subsidiaries, as applicable. We have an audit committee, consisting of independent directors, to review and approve all material related party transactions, including any material transactions between us and any of these subsidiaries, as applicable. We believe that the transactions and agreements that we have entered into with these subsidiaries are on terms that are negotiated on an arm’s length basis.
In addition, we may acquire or invest in publicly traded companies from time to time. For example, following the closing of our share subscription with Dada, a Nasdaq-listed company and a leading local on-demand retail and delivery platform in China, on February 28, 2022, we held approximately 52% of Dada’s issued and outstanding shares and began to consolidate the financial results of Dada into ours. On July 26, 2022, JD Logistics completed the acquisition of more than 50% equity interest in Deppon, a Shanghai Stock Exchange-listed company and an integrated, customer-centered logistics company providing a wide range of solutions including Less-Than-Truckload (LTL) transportation, Full Truck Load (FTL) transportation, delivery services, and warehousing management. As a result, Deppon has become a subsidiary of JD Logistics, and its financial results, except for that of certain excluded business, have been consolidated into JD Logistics’s consolidated financial statements.
37
Table of Contents
However, as we remain a controlling shareholder of these stand-alone public companies, we may from time to time make strategic decisions that we believe are in the best interests of our business and shareholders as a whole, which may create conflicts of interest with these companies, such as resolution of any dispute arising from the agreements, allocation of business opportunities, and employee recruiting and retention between us and these companies. We may not be able to resolve all potential misalignments in interests with these public companies and the existence of such misalignments in interests may affect the results of operation of these companies, which may, in turn, affect our results of operations as a whole. The conflicts of interest described above may also arise when we acquire or invest in other publicly traded companies from time to time.
We may incur liability or become subject to administrative penalties for counterfeit or unauthorized products sold on our mobile apps and websites, or for products sold on our mobile apps and websites or content posted on our mobile apps and websites that infringe on third-party intellectual property rights, or for other misconduct.
We sourced our products from over 50,000 suppliers as of December 31, 2023. Third-party merchants on our online marketplace are separately responsible for sourcing the products they sell on our mobile apps and websites. Although we have adopted measures to verify the authenticity and authorization of products sold on our mobile apps and websites and avoid potential infringement of third-party intellectual property rights in the course of sourcing and selling products, we may not always be successful. As part of our cross-border e-commerce business, we source products outside of China and allow overseas brands or partners to sell their products through our online marketplace, which could make it more difficult for us to verify the authenticity and authorization of products sold.
In the event that counterfeit, unauthorized or infringing products are sold on our mobile apps and websites or infringing content is posted on our mobile apps and websites, we could face claims that we should be held liable. We have in the past received claims alleging our infringement of third parties’ rights. Irrespective of the validity of such claims, we could incur significant costs and efforts in either defending against or settling such claims. If there is a successful claim against us, we might be required to pay substantial damages or refrain from further sale of the products. Potential liability under PRC law if we negligently participated or assisted in infringement activities associated with counterfeit goods includes injunctions to cease infringing activities, rectification, compensation, administrative penalties and even criminal liability. Moreover, such third-party claims or administrative penalties could result in negative publicity and our reputation could be severely damaged. Any of these events could have a material and adverse effect on our business, results of operations or financial condition.
Under our standard form agreements, we require suppliers or third-party merchants to indemnify us for any losses we suffer or any costs that we incur due to any products we source from these suppliers or any products sold by these third-party merchants. However, not all of our agreements with suppliers and third-party merchants have such terms, and for those agreements that have such terms, we may not be able to successfully enforce our contractual rights and may need to initiate costly and lengthy legal proceedings in China to protect our rights. See “—Risks Related to Doing Business in China—We may be adversely affected by the complexity and changes in PRC regulation of internet-related business and companies.”
We may be subject to product liability claims.
The products sold by us through our online retail business may be defective. As a result, sales of such products could expose us to product liability claims relating to personal injury or property damage and may require product recalls or other actions. Third parties subject to such injury or damage may bring claims or legal proceedings against us as the retailer of the product. Although we would have legal recourse against the manufacturer of such products under PRC law, attempting to enforce our rights against the manufacturer may be expensive, time-consuming and ultimately futile. In addition, we do not currently maintain any third-party liability insurance or product liability insurance in relation to products we sell. As a result, any material product liability claim or litigation could have a material and adverse effect on our business, financial condition and results of operations. Even unsuccessful claims could result in the expenditure of funds and managerial efforts in defending them and could have a negative impact on our reputation.
38
Table of Contents
JD Logistics may need to raise more capital, which could dilute our equity stake or impose debt service obligations on JD Logistics, if such capital is available at all.
In April 2017, we opened up our fulfillment infrastructure to third-parties and established a new business group, JD Logistics, to provide integrated supply chain solutions and logistics services to third-party businesses across a wide range of industries. JD Logistics has experienced rapid growth since its inception and has raised capital in both private and public share offerings. On May 28, 2021, shares of JD Logistics commenced trading on the Main Board of the Hong Kong Stock Exchange under the stock code “2618.” As of December 31, 2023, we hold approximately 63% of the outstanding shares of JD Logistics. The development of a logistics business is capital intensive, and JD Logistics may require additional capital resources in the future. JD Logistics may seek to obtain a credit facility or sell additional equity or debt securities. The sale of additional equity securities could result in dilution of our equity stake in JD Logistics, and the investors may have a strategy or objectives different from ours with respect to JD Logistics or impose conditions that could restrict the operations of JD Logistics. The incurrence of indebtedness would result in increased debt service obligations and could result in operating and financial covenants that would restrict its operations. It is uncertain whether financing will be available in amounts or on terms acceptable, if at all.
The proper functioning of our technology platform is essential to our business. Any failure to maintain the satisfactory performance of our websites, mobile apps and systems could materially and adversely affect our business and reputation.
The satisfactory performance, reliability and availability of our technology platform are critical to our success and our ability to attract and retain customers and provide quality customer service. Almost all of our sales of products are made online through our mobile apps and websites, and the fulfillment services we provide to third-party merchants are related to sales of their products through our mobile apps and websites. Any system interruptions caused by telecommunications failures, computer viruses, hacking or other attempts to harm our systems that result in the unavailability or slowdown of our mobile apps and websites or reduced order fulfillment performance could reduce the volume of products sold and the attractiveness of product offerings on our mobile apps and websites. Our servers may also be vulnerable to computer viruses, physical or electronic break-ins and similar disruptions, which could lead to system interruptions, website slowdown or unavailability, delays or errors in transaction processing, loss of data or the inability to accept and fulfill customer orders. Security breaches, computer viruses and hacking attacks have become more prevalent in our industry. Because of our brand recognition in the online retail industry in China, we believe we are a particularly attractive target for such attacks. We have experienced in the past, and may experience in the future, such attacks and unexpected interruptions. We can provide no assurance that our current security mechanisms will be sufficient to protect our IT systems from any third-party intrusions, viruses or hacker attacks, information or data theft or other similar activities. Any such future occurrences could reduce customer satisfaction, damage our reputation and result in a material decrease in our revenue.
Additionally, we must continue to upgrade and improve our technology platform to support our business growth, and failure to do so could impede our growth. However, we cannot assure you that we will be successful in executing these system upgrades and improvement strategies or when the execution of these system upgrades and improvement strategies will be effective. In particular, our systems may experience interruptions during upgrades, and the new technologies or infrastructures may not be fully integrated with the existing systems on a timely basis, or at all. In addition, we experience surges in online traffic and orders associated with promotional activities and holiday seasons, such as June 18 and November 11, which can put additional demands on our technology platform at specific times. If our existing or future technology platform does not function properly, it could cause system disruptions and slow response times, affecting data transmission, which in turn could materially and adversely affect our business, financial condition and results of operations.
Any deficiencies in China’s internet infrastructure could impair our ability to sell products over our mobile apps and websites, which could cause us to lose customers and harm our operating results.
Almost all of our sales of products are made online through our mobile apps and websites, and the fulfillment services we provide to third-party merchants are related to sales of their products through our mobile apps and websites. Our business depends on the performance and reliability of the internet infrastructure in China. The availability of our mobile apps and websites depends on telecommunications carriers and other third-party providers for communications and storage capacity, including bandwidth and server storage, among other things. If we are unable to enter into and renew agreements with these providers on acceptable terms, or if any of our existing agreements with such providers are terminated as a result of our breach or otherwise, our ability to provide our services to our customers could be adversely affected. Almost all access to the internet in China is maintained through state-owned telecommunication carriers under administrative control, and we obtain access to end-user networks operated by such telecommunications carriers and internet service providers to give customers access to our mobile apps and websites. We have experienced service interruptions in the past, which were typically caused by service interruptions at the underlying external telecommunications service providers, such as the internet data centers and broadband carriers from which we receive services. Service interruptions prevent consumers from accessing our mobile apps and websites and placing orders, and frequent interruptions could frustrate customers and discourage them from attempting to place orders, which could cause us to lose customers and harm our operating results.
39
Table of Contents
If we fail to adopt new technologies or adapt our websites, mobile apps and systems to changing customer requirements or emerging industry standards, or if our efforts to invest in the development of new technologies are unsuccessful or ineffective, our business may be materially and adversely affected.
To remain competitive, we must continue to enhance and improve the responsiveness, functionality and features of our mobile apps and websites. The industries we operate in are characterized by rapid technological evolution, changes in customer requirements and preferences, frequent introductions of new products and services embodying new technologies and the emergence of new industry standards and practices, any of which could render our existing technologies and systems obsolete. Our success will depend, in part, on our ability to identify, develop, acquire or license leading technologies useful in our business, and respond to technological advances and emerging industry standards and practices, such as mobile internet, in a cost-effective and timely way. In recent years, we invested in the development of many new technologies and business initiatives, such as AI, big data and cloud. The development of websites, mobile apps and other proprietary technologies entails significant technical and business risks. We cannot assure you that we will be able to successfully develop or effectively use new technologies, recoup the costs of developing new technologies or adapt our websites, mobile apps, proprietary technologies and systems to meet customer requirements or emerging industry standards. If we are unable to develop technologies successfully or adapt in a cost-effective and timely manner in response to changing market conditions or customer requirements, whether for technical, legal, financial or other reasons, our business, prospects, financial condition and results of operations may be materially and adversely affected.
Customer growth and activity on mobile devices depends upon effective use of mobile operating systems, networks and standards that we do not control.
A significant portion of the purchases made by our customers are through mobile devices. To optimize the mobile shopping experience, we are somewhat dependent on our customers downloading our specific mobile apps for their particular devices as opposed to accessing our sites from an internet browser on their mobile device. As new mobile devices and platforms are released, it is difficult to predict the problems we may encounter in developing applications for these alternative devices and platforms, and we may need to devote significant resources to the development, support and maintenance of such applications. In addition, our future growth and our results of operations could suffer if we experience difficulties in the future in integrating our mobile apps into mobile devices or if problems arise with our relationships with providers of mobile operating systems or mobile app download stores, if our apps receive unfavorable treatment compared to competing apps on the download stores, or if we face increased costs to distribute or have customers use our mobile apps. We are further dependent on the interoperability of our sites with popular mobile operating systems that we do not control, such as iOS and Android, and any changes in such systems that degrade the functionality of our sites or give preferential treatment to competitive products could adversely affect the usage of our sites on mobile devices. In the event that it is more difficult for our customers to access and use our sites on their mobile devices, or if our customers choose not to access or to use our sites on their mobile devices or to use mobile products that do not offer access to our sites, our customer growth could be harmed and our business, financial condition and operating results may be adversely affected.
Failure to protect confidential information of our customers and network against security breaches could damage our reputation and brand and substantially harm our business and results of operations.
A significant challenge to the online retail industry is the secure storage of confidential information and its secure transmission over public networks. Almost all of the orders and some of the payments for products we offer are made through our websites and our mobile apps. In addition, some online payments for our products are settled through third-party online payment services. We also share certain personal information about our customers with third-party couriers, such as their names, addresses, phone numbers and transaction records. In addition, with the rapid development of our AI, big data and cloud technologies and services, we have accumulated a large volume of data, which covers customer’s browsing and consumption behavior information, product manufacturing and sales information, warehousing and distribution information, customer service information, among others. We also formed strategic partnerships with some leading mobile internet companies to leverage their powerful big data resources, massive user bases and AI-driven technologies. Maintaining complete security for the storage and transmission of confidential information on our technology platform is essential to maintaining our operating efficiency and customer confidence as well as complying with the applicable laws and standards.
40
Table of Contents
We have adopted security policies and measures, including encryption technology, to protect our proprietary data and customer information. However, advances in technology, the expertise of hackers, improper use or sharing of data, new discoveries in the field of cryptography or other events or developments could result in a compromise or breach of the technology that we use to protect confidential information. We may not be able to prevent third parties, especially hackers or other individuals or entities engaging in similar activities, from illegally obtaining such confidential or private information we hold as a result of our customers’ visits to our websites and use of our mobile apps. Such individuals or entities obtaining our customers’ confidential or private information may further engage in various other illegal activities using such information. In addition, we have limited control or influence over the security policies or measures adopted by business partners including strategic partners or third-party providers of online payment services through which some of our customers may choose to make payment for purchases. The third-party couriers we use may also violate their confidentiality obligations and disclose or use information about our customers illegally. Any negative publicity on our websites’ or mobile apps’ safety or privacy protection mechanisms and policies, and any claims asserted against us or fines imposed upon us as a result of actual or perceived failures, could have a material and adverse effect on our public image, reputation, financial condition and results of operations. We have experienced breaches of our information security measures in the past due to external causes beyond our control, such as a leak of user account information from the China Software Developer Network (CSDN) in 2011, although none of the past breaches individually or in the aggregate was material to our business or operations. We cannot assure you that similar events will not occur in the future. If we give third parties greater access to our technology platform in the future as part of providing more technology services to third-party merchants and others, it may become more challenging for us to ensure the security of our systems. Any compromise of our information security or the information security measures of our third-party couriers or third-party online payment service providers or other business partners could have a material and adverse effect on our reputation, business, prospects, financial condition and results of operations. Practices regarding the collection, use, storage, transmission and security of personal information by companies operating over the internet and mobile platforms are under increased public scrutiny.
Significant capital and other resources may be required to protect against information security breaches or to alleviate problems caused by such breaches or to comply with our privacy policies or privacy-related legal obligations. The resources required may increase over time as the methods used by hackers and others engaged in online criminal activities are increasingly sophisticated and constantly evolving. Any failure or perceived failure by us to prevent information security breaches or to comply with privacy policies or privacy-related legal obligations, or any compromise of security that results in the unauthorized release or transfer of personally identifiable information or other customer data, could cause our customers to lose trust in us and could expose us to legal claims. Any perception by the public that online transactions or the privacy of user information are becoming increasingly unsafe or vulnerable to attacks could inhibit the growth of online retail and other online services generally, which may reduce the number of orders we receive.
Our business is subject to complex and evolving Chinese and international laws and regulations regarding data privacy and cybersecurity.
As the regulations regarding data privacy and cybersecurity are quickly evolving in China and globally, we may become subject to new laws and regulations applying to the solicitation, collection, processing or use of personal or consumer information that could affect how we store, process and share data with our customers, suppliers and third-party merchants.
On June 10, 2021, the Standing Committee of the National People’s Congress promulgated the PRC Data Security Law, which took effect in September 2021. The Data Security Law, among others, provides for a security review procedure for the data activities that may affect national security. Furthermore, the Cybersecurity Review Measures (2020), which became effective on June 1, 2020, set forth the cybersecurity review mechanism for critical information infrastructure operators, and provided that critical information infrastructure operators who intend to purchase internet products and services that affect or may affect national security shall be subject to a cybersecurity review. On July 30, 2021, the state council promulgated the Regulations on Protection of Critical Information Infrastructure, which became effective on September 1, 2021. Pursuant to the Regulations on Protection of Critical Information Infrastructure, critical information infrastructure shall mean an important network facility and information system in important industries such as, among others, public communications and information services, as well as other important network facilities and information systems that may seriously endanger national security, the national economy, the people’s livelihood, or the public interests in the event of damage, loss of function, or data leakage. In addition, the administration departments for each critical industry and sector shall be responsible to formulate eligibility criteria and determine the critical information infrastructure operator in the respective industry or sector. Furthermore, the exact scope of “critical information infrastructure operators” under the current regulatory regime remains unclear, and the PRC government authorities may have wide discretion in the interpretation and enforcement of these laws. Therefore, it is uncertain whether we would be deemed as a critical information operator under PRC law.
41
Table of Contents
On December 28, 2021, the CAC, the National Development and Reform Commission, or NDRC, the Ministry of Industry and Information Technology, or MIIT, and several other PRC government authorities jointly issued the Cybersecurity Review Measures, which took effect on February 15, 2022 and replaced the Cybersecurity Review Measures (2020). Such Measures further restate and expand the applicable scope of the cybersecurity review. Pursuant to the Cybersecurity Review Measures, critical information infrastructure operators that procure internet products and services and network platform operators engaging in data processing activities must be subject to the cybersecurity review if their activities affect or may affect national security. Since the Cybersecurity Review Measures are relatively new and provide no further explanation or interpretation on the determination of “affecting national security,” there remain uncertainties as to whether our data processing activities may be deemed to affect national security.
If we are deemed as a critical information infrastructure operator under the PRC cybersecurity laws and regulations, we must fulfill certain obligations as required under the PRC cybersecurity laws and regulations, including, among others, storing personal information and important data collected and produced within the PRC territory during our operations in China, which we have fulfilled in our business, and we may be subject to review when purchasing internet products and services.
Further, the Cybersecurity Review Measures stipulate that network platform operators holding personal information of over one million users must apply to the Cybersecurity Review Office for a cybersecurity review before public offering on a foreign stock exchange. Although our securities have been listed on the Nasdaq Global Select Market and the Hong Kong Stock Exchange, given the Cybersecurity Review Measures are relatively new, there are uncertainties as to the interpretation, application, and enforcement of the Cybersecurity Review Measures and how it will affect our business.
On July 7, 2022, the CAC promulgated the Security Assessment Measures for Outbound Data Transfer, which became effective on September 1, 2022. These measures provide for the circumstances under which a data processor shall be subject to security assessment. We have applied to CAC for security assessment of outbound data transfer according to these measures.
On November 14, 2021, the CAC published a discussion draft of the Administrative Measures for Internet Data Security. The draft provides that data processors refer to individuals or organizations that autonomously determine the purpose and the manner of processing data. In accordance with the draft measures, data processors shall apply for a cybersecurity review for certain activities. See “Item 4.B. Information on the Company—Business Overview—Regulation—Regulations Relating to Information Security” for details. The draft measures remains unclear on whether the requirements will be applicable to companies that have been listed in the United States and Hong Kong, such as us. There is no timetable as to when the draft measures will be enacted. We cannot predict the impact of the draft measures, if any, at this stage, and we will closely monitor and assess any development in the rule-making process. As of the date of this annual report, we have not been involved in any formal investigations on cybersecurity review made by the CAC or other regulatory authorities based on the draft measures. However, if we are not able to comply with the cybersecurity and network data security requirements in a timely manner, or at all, we may be subject to government enforcement actions and investigations, fines, penalties, suspension of our non-compliant operations, or removal of our app from the application stores, among other sanctions, which could materially and adversely affect our business and results of operations. In addition to the cybersecurity review, the draft measures requires that data processors processing “important data” or listed overseas shall conduct an annual data security assessment by itself or commission a data security service provider to do so, and submit the assessment report of the preceding year to the municipal cybersecurity department by the end of January each year. As advised by our PRC legal counsel, if a final version of the draft measures is adopted, we may be subject to review when conducting data processing activities and annual data security assessment and may face challenges in addressing its requirements and make necessary changes to our internal policies and practices in data processing. As advised by our PRC legal counsel, we are not required to file an application for the cybersecurity review by CAC for our previous issuance of securities to foreign investors as of the date of this annual report because (i) the regulations do not require data processors which process personal information of over one million users to file a supplementary application of cybersecurity review for their previous issuance of securities to foreign investors that occurred before the effective date of such regulations; and (ii) our securities have already been listed on the Nasdaq Global Select Market and the Hong Kong Stock Exchange before such regulations became effective. Thus, our PRC legal counsel does not expect that, as of the date of this annual report, we are required to file an application for the cybersecurity review by CAC for our previous issuance of securities to foreign investors.
42
Table of Contents
On August 20, 2021, the Standing Committee of the National People’s Congress of China promulgated the Personal Information Protection Law, which integrates the scattered rules with respect to personal information rights and privacy protection and took effect on November 1, 2021. Our mobile apps and websites only collect basic user personal information that is necessary to provide the corresponding services. We do not collect any sensitive personal information or other excessive personal information that is not related to the corresponding services. We update our privacy policies from time to time to meet the latest regulatory requirements of the CAC and other authorities and adopt technical measures to protect data and ensure cybersecurity in a systematic way. Nonetheless, the Personal Information Protection Law raises the protection requirements for processing personal information, and many specific requirements of the Personal Information Protection Law remain to be clarified by the CAC, other regulatory authorities, and courts in practice. We may be required to make further adjustments to our business practices to comply with the personal information protection laws and regulations. See “Item 4.B. Information on the Company—Business Overview—Regulations.”
These laws and regulations and the PRC Civil Code (which took effect on January 1, 2021 and also includes certain data-related rules) are relatively new and subject to interpretation by the regulators. Although we only gain access to user information that is necessary for, and relevant to, the services provided, the data we obtain and use may include information that is deemed as “personal information,” “network data” or “important data” under the PRC Cyber Security Law, the Civil Code and related data privacy and protection laws and regulations. As such, we have adopted a series of measures to ensure that we comply with the laws and regulations in the collection, use, disclosure, sharing, storage, and security of user information and other data. The Data Security Law also stipulates that the authorities will formulate the catalogues for important data and strengthen the protection of important data, and state core data, i.e. data having a bearing on national security, the lifelines of national economy, people’s key livelihood and major public interests, shall be subject to stricter management system. “Information on the Company—Business Overview—Regulations.” The exact scopes of important data and state core data remain unclear and may be subject to further interpretation. If any data that we are in possession of constitutes important data or state core data, we may be required to adopt stricter measures for protection and management of such data.
In addition, we may need to comply with increasingly complex and rigorous regulatory standards enacted to protect business and personal data in the U.S., Europe, Hong Kong and elsewhere. For example, the European Union adopted the General Data Protection Regulation, which became effective on May 25, 2018. The General Data Protection Regulation imposes additional obligations on companies regarding the handling of personal data and provides certain individual privacy rights to persons whose data is stored. Compliance with existing, proposed and recently enacted laws (including implementation of the privacy and process enhancements called for under General Data Protection Regulation) and regulations can be costly; any failure to comply with these regulatory standards could subject us to legal and reputational risks. In addition, to the extent we have accessed personal data in Hong Kong in our operations, such as retail business, we have been in compliance with the laws and regulations in Hong Kong regarding data security, such as the Personal Data (Privacy) Ordinance and the Unsolicited Electronic Messages Ordinance which impose protocols and obligations regarding the handling of personal data including that, among other things, (i) personal data shall be collected for a lawful purpose, necessary and not excessive, (ii) personal data shall be collected by means that are lawful and fair in the circumstances of the case, and (iii) the person from whom personal data is collected is informed of the purpose of collecting the data. We believe that the laws and regulations in Hong Kong regarding data security do not have a material impact on our business as of the date of this annual report. However, to the extent that certain laws and regulations in Hong Kong were to result in additional oversight over data security that impacts our business in Hong Kong, we may be required to incur additional cost to ensure our compliance to such laws and regulations, and any violation could result in a material adverse impact on our business, reputation and results of operations.
43
Table of Contents
We generally comply with industry standards and are subject to the terms of our own privacy policies. Compliance with any additional laws could be expensive, and may place restrictions on the conduct of our business and the manner in which we interact with our customers. Any failure to comply with applicable regulations could also result in regulatory enforcement actions against us, and misuse of or failure to secure personal information could also result in violation of data privacy laws and regulations, proceedings against us by governmental authorities or other authorities, damage to our reputation and credibility and could have a negative impact on revenues and profits.
The wide variety of payment methods that we accept subjects us to third-party payment processing-related risks.
We accept payments using a variety of methods, including payment on delivery, bank transfers, online payments through various third-party online payment platforms such as Weixin Pay, UnionPay and JD Pay. For certain payment methods, we pay interchange and other fees, which may increase over time and raise our operating costs and lower our profit margins. We may also be subject to fraud and other illegal activities in connection with the various payment methods we offer, including online payment and cash on delivery options. Although we deliver a majority of the orders directly to customers ourselves, we use third-party couriers during peak seasons to supplement our delivery force. Given some customers choose the cash-on-delivery option when they place their orders online, the delivery personnel of our third-party couriers collect payments on our behalf, and we require the third-party couriers to remit the payment collected to us on the following day. If these companies fail to remit the payment collected to us in a timely fashion or at all, if they become unwilling or unable to provide these services to us, or if their service quality deteriorates, our business could be disrupted. We are also subject to various rules, regulations and requirements governing electronic funds transfers, both in China and globally, which could change or be reinterpreted to make it difficult or impossible for us to comply with. If we fail to comply with these rules or requirements, we may be subject to fines and higher transaction fees and lose our ability to accept credit and debit card payments from our customers, process electronic funds transfers or facilitate other types of online payments, and our business, financial condition and results of operations could be materially and adversely affected.
Our delivery, return and exchange policies may materially and adversely affect our results of operations.
We have adopted shipping policies that do not necessarily pass the full cost of shipping on to our customers. We also have adopted customer-friendly return and exchange policies that make it convenient and easy for customers to change their minds after completing purchases. We may also be required by law to adopt new or amend existing return and exchange policies from time to time. For example, pursuant to the amended Consumer Protection Law, which became effective in March 2014, except for certain types of products, such as custom-made goods, fresh and perishable goods, consumers are generally entitled to return the products purchased within seven days upon receipt without giving any reasons when they purchase the products from business operators on the internet. See “Item 4.B. Information on the Company—Business Overview—Regulation—Regulations Relating to Product Quality, Consumer Protection and Operation Safety.” These policies improve customers’ shopping experience and promote customer loyalty, which in turn help us acquire and retain customers. However, these policies also subject us to additional costs and expenses which we may not recoup through increased revenue. Our ability to handle a large volume of returns is unproven. If our return and exchange policy is misused by a significant number of customers, our costs may increase significantly and our results of operations may be materially and adversely affected. If we revise these policies to reduce our costs and expenses, our customers may be dissatisfied, which may result in loss of existing customers or failure to acquire new customers at a desirable pace, which may materially and adversely affect our results of operations.
44
Table of Contents
The offline fresh food markets operated under our 7FRESH brand rely heavily on sales of perishable products, and ordering errors or product supply disruptions may have an adverse impact on its profitability and operating results.
Our offline fresh food markets rely on various suppliers and vendors to provide and deliver our perishable product inventory promptly on an ongoing basis. We could suffer significant product inventory losses in the event of the loss of a major supplier or vendor, disruption of our distribution network, extended power outages, natural disasters or other catastrophic occurrences. We have implemented certain systems to ensure our ordering is in line with demand. We cannot assure you, however, that our ordering system will always work efficiently, in particular in connection with the opening of new stores, which have no, or a limited, ordering history. If we were to over-order, we could suffer inventory losses, which would negatively impact our operating results.
We may experience negative impact on our reputation due to real or perceived quality or health issues with the food products sold at our offline fresh food markets, which could have an adverse impact on our operating results.
Customers of our offline fresh food markets expect us to provide them with fresh, high-quality food products. Concerns regarding the safety of our food products or the safety and quality of our food supply chain could cause shoppers to avoid purchasing certain products from us, or to seek alternative sources of food, even if the basis for the concern is outside of our control. Negative publicity about these concerns, whether or not ultimately based on facts, and whether or not involving products sold at our stores, could discourage consumers from buying our products and have an adverse impact on our operating results. Furthermore, sales of food products entail inherent risks of product liability claims, product recall and the resulting negative publicity. Food products containing contaminants could be inadvertently distributed by us and, if processing by the consumers level does not eliminate them, these contaminants could result in illness or death. We cannot assure you that product liability claims will not be asserted against us or that we will not be obligated to perform product recalls or held liable in the future.
Any loss in confidence on the part of our customers would be difficult and costly to reestablish. Any such adverse impact could be exacerbated by our position in the market as a purveyor of fresh, high-quality food products and could significantly reduce our brand value. Issues regarding the safety of any food items sold by us, regardless of the cause, could have a material and adverse impact on our sales and operating results.
Our 7FRESH brand may be unable to keep existing store locations, open new stores in desirable places on favorable terms or compete successfully with other retailers, which could materially and adversely affect its results of operations.
Our 7FRESH brand’s growth strategy includes opening and operating offline fresh food stores at suitable locations. The implementation of this strategy depends on finding suitable locations. In addition, we compete with other retailers and businesses for suitable locations. Local land use and zoning regulations, environmental regulations and other regulatory requirements may affect our ability to find suitable locations and have an impact on the cost of constructing, renovating and operating our stores. Real estate, zoning, construction and other delays may adversely affect store openings and renovations and increase our costs. Moreover, changing local demographics at existing store locations may adversely affect revenue and profitability levels at those stores. The termination or expiration of leases at existing store locations may adversely affect us if the renewal terms of those leases are unacceptable to us and we are forced to close or relocate stores. If we determine to close or relocate a store subject to a lease, we may remain obligated under the lease for the remainder of the lease term.
Furthermore, our offline fresh food stores face increasing competition from other retailers in various aspects, including, among others, pricing, selection, quality and availability of product offering, store hours, in-store amenities, shopping convenience and overall shopping experience. If we operate our stores at locations not suitable for our growth strategy, or if we are unable to maintain our existing store locations, open new stores in desirable places and on favorable terms or compete successfully with other retailers, the results of operations of our 7FRESH brand could be materially and adversely affected.
45
Table of Contents
If JD Technology is unable to successfully manage its business or conflicts that could arise between us and JD Technology are not resolved in our favor, our business, financial condition, results of operations and prospects could be materially and adversely affected as a result.
In June 2020, we acquired an aggregate of 36.8% equity interest in JD Technology, which became our equity method investee. In connection with the acquisition of equity interests in JD Technology, we have entered into a series of agreements with JD Technology which set forth our rights as a shareholder. On March 31, 2021, we entered into definitive agreements with JD Technology relating to the reorganization of our cloud computing and artificial intelligence business, upon which our equity interest in JD Technology increased to 41.7%.
JD Technology currently provides us with certain payment services on a non-exclusive basis and other services to us. If JD Technology is not able to successfully manage its risks such as credit risks, its ability to continue to deliver payment and other services to us may be undermined. In such event, JD Technology might seek to amend the terms of its agreements and arrangements with us, which could potentially result in a conflict of interest. Other conflicts of interest between us and JD Technology may arise relating to commercial or strategic opportunities or initiatives. Although we and JD Technology have each agreed to certain non-competition undertakings, we cannot assure you that JD Technology would not pursue opportunities to provide services to our competitors or other opportunities that would conflict with our interests. If JD Technology is unable to successfully manage its business or conflicts of interest that could arise between us and JD Technology are not resolved in our favor, our business, financial condition, results of operations and prospects could be materially and adversely affected.
In addition, we continue to license certain of our intellectual properties, including our “JD” brand and related trademarks and domain names, to JD Technology. Because of JD Technology’s ability to continue to use our brand, our close association with JD Technology and overlapping user base, events that negatively affect JD Technology, for example, alleged engagement in inappropriate activities, involvement in any legal or administrative proceedings, or negative publicity, could also negatively affect customers’, regulators’ and other third parties’ perception of us and our JD brand, harm our credibility and reputation and adversely affect our business.
JD Logistics, our subsidiary that is a technology-driven supply chain solutions and logistics services provider, is subject to risks associated with provision of integrated supply chain solutions and logistics services and operations.
JD Logistics, a subsidiary of ours that provides technology-driven supply chain solutions and logistics services provider, is subject to a variety of risks in its business, including the following:
| • | potential disruptions to the operation of the warehousing and logistics facilities operated by us or other third-party transportation companies and couriers that facilitate our logistics services, or to the development of new warehousing and logistics facilities; |
| • | risk that our customers may reduce their expenditure on third-party supply chain solutions and logistics services or increase utilization of their internal solutions; |
| • | tightening of the labor market, increases in labor costs or any labor unrest, as we operate in a labor-intensive industry; |
| • | failure to maintain positive relationships with our third-party logistics service providers; |
| • | risks associated with the items we deliver and the contents of shipments and inventories handled through our logistics networks, including real or perceived quality or health issues with the products that are handled through our logistics networks; and |
| • | risks inherent in the logistics industry, including personal injury, product damage, and transportation-related incidents. |
The occurrence of any such risks may damage the business and reputation of JD Logistics, and may have a material and adverse impact on our financial condition and results of operations.
46
Table of Contents
JD Health, our healthcare subsidiary, is subject to risks associated with the marketing, distributing, selling and regulation of pharmaceutical and healthcare products.
JD Health, our healthcare subsidiary, is subject to certain risks associated with the marketing, distributing and selling of pharmaceutical and other health and wellness products, as well as provision of medical and related services, including the following:
| • | inability to successfully execute effective advertising, marketing and promotional activities necessary to maintain and increase the awareness of JD Health and the products and services it offers; |
| • | failure to implement effective pricing and other strategies in response to intense market competition in the pharmaceutical industry in China; |
| • | inability to upgrade intelligent healthcare solutions in response to changing consumer demand and preference; |
| • | inability to stock adequate supply of pharmaceutical and healthcare products that customers desire; |
| • | potential medical liability claims in connection with our online and offline healthcare services; |
| • | potential penalties or disputes against us for failure to manage our in-house medical team and external doctors; |
| • | failure of in-house medical team or external doctors to provide adequate and proper medical services on our platform; |
| • | inability to obtain and maintain regulatory or governmental permits, approvals and clearances, or to pass PRC government inspections; and |
| • | the risk of, and resulting liability from, any contamination, injury or other harm caused by any use, misuse, misdiagnosis or side-effects involving products distributed or services provided by JD Health. |
The occurrence of any such risks may damage the business and reputation of JD Health, and may have an adverse impact on our financial condition and results of operations.
Furthermore, laws and regulations regarding pharmaceutical and healthcare industry in China are strict and extensive. Violation of the laws and regulations may result in harsh penalties and, under certain circumstances, lead to criminal prosecution. Meanwhile, regulations of both internet industry and its internet healthcare sector, as well as their interpretation and enforcement, are relatively new and evolving. As a result, it may be difficult to determine what actions or omissions would be deemed in violation of applicable laws and regulations. Due to the rapidly evolving and complexity of the regulatory environment, we cannot assure you that JD Health would always be in full compliance with applicable laws and regulations, the violation of which may have adverse effect on its brand reputation and business. Compliance with future laws and regulations may require JD Health to change its business models and practices at an undeterminable and possibly significant financial cost. These additional monetary expenditures may increase future overhead, which may, in turn, have a material adverse effect on our business, financial condition and results of operations.
JD Property faces challenges relating to the macroeconomic environment, the market condition and its own business development.
JD Property, a subsidiary of ours which develops and manages modern infrastructure in China, Asia, and Europe, consisting primarily of logistics parks as well as business parks and others, faces challenges relating to the macroeconomic environment, the market condition and certain characteristics of its current operations. These challenges include:
| • | potential downturn in general economy, which will slow down the demand for logistics properties and increase the vacancy rate, resulting in a more competitive market environment for JD Property; |
47
Table of Contents
| • | slowdown in such business area as industrial park and logistic properties; and |
| • | uncertainties in JD Property’s venture into the overseas markets, such as the Southeast Asian market and the European market, including cultural differences, complexity of local regulatory environment, political stability and communication with local clients and business partners, among other things. |
If JD Property’s business cannot continue to grow despite these challenges, our financial condition and results of operations may be adversely affected.
JD Industrials faces challenges relating to the provision of industrial supply chain technology and service.
JD Industrials, a subsidiary of ours, faces challenges as a leading industrial supply chain technology and service provider in China. These challenges include:
| • | ability to provide superior industrial supply chain technology and service to expand its customer base, which in turn depends on factors such as its ability to offer high-quality industrial products and services, optimize the product and service offerings in response to the diverse and evolving demand of its customers, expand and maintain relationships with its customers and suppliers, offer timely and reliable fulfillment service, develop industrial technology solutions and intelligent services, and recommend suitable products and services to its customers; |
| • | failure to expand its customer base and maintain satisfactory customer experience; |
| • | risk that industrial supply chain technology and service market may not develop into the stage and scale as expected, as it is still in its early stage of development in China; |
| • | ability to successfully implement its business strategy and effectively respond to changes in market dynamics; |
| • | ability to enforce effective control over the logistic service provided directly by its suppliers or other third-party logistics providers; and |
| • | damage to its fulfillment of industrial products caused by fire, flood, power outage, telecommunications failure, break-ins, earthquake, human error and other events. |
If JD Industrials’ business were negatively impacted by these challenges to a material extent, our financial condition and results of operations may be adversely affected.
Our use of some leased properties could be challenged by third parties or government authorities, which may cause interruptions to our business operations.
A small portion of the lessors of our leased warehouses, leased offices, and leased delivery stations and pickup stations have not provided us with their property ownership certificates or any other documentation proving their right to lease those properties to us. If our lessors (including the lessors of our 7FRESH offline fresh food stores) are not the owners of the properties and they have not obtained consents from the owners or their lessors or permits from the government authorities, our leases could be invalidated. If this occurs, we may have to renegotiate the leases with the owners or the parties who have the right to lease the properties, and the terms of the new leases may be less favorable to us. Some of the leased properties were also subject to mortgage at the time the leases were entered into. Such lease may not be binding on the transferee of the property in the event that the mortgage holder forecloses on the mortgage and transfers the property to another party. In addition, a substantial portion of our leasehold interests in leased properties have not been registered with the PRC government authorities as required by PRC law, which may expose us to potential fines if we fail to remediate after receiving any notice from the PRC government authorities. Also, in the event that the actual use of our leased properties is inconsistent with the use registered on the land use right certificate or our leased properties are on allocated land, the competent authorities may require the lessors to return the land and impose fines on the lessors, or confiscate the proceeds from the leasing of the properties and impose fines on the lessors if such properties are leased without their consent or handing in such income, as applicable. Therefore, the lease agreements may be deemed to be in breach of the law and therefore be void.
48
Table of Contents
As of the date of this annual report, we are not aware of any material claims or actions being contemplated or initiated by government authorities, property owners or any other third parties with respect to our leasehold interests in or use of such properties.
However, we cannot assure you that our use of such leased properties will not be challenged. In the event that our use of properties is successfully challenged, we may be subject to fines and forced to relocate the affected operations. In addition, we may become involved in disputes with the property owners or third parties who otherwise have rights to or interests in our leased properties. We can provide no assurance that we will be able to find suitable replacement sites on terms acceptable to us on a timely basis, or at all, or that we will not be subject to material liability resulting from third parties’ challenges on our use of such properties. As a result, our business, financial condition and results of operations may be materially and adversely affected.
Failure to renew our current leases or locate desirable alternatives for our facilities could materially and adversely affect our business.
We lease properties for our offices, customer service center, warehouses, sorting centers, and delivery and pickup stations. We may not be able to successfully extend or renew such leases upon expiration of the current term on commercially reasonable terms or at all, and may therefore be forced to relocate our affected operations. This could disrupt our operations and result in significant relocation expenses, which could materially and adversely affect our business, financial condition and results of operations. In addition, we compete with other businesses for premises at certain locations or of desirable sizes. As a result, even though we could extend or renew our leases, rental payments may significantly increase as a result of the high demand for the leased properties. In addition, we may not be able to locate desirable alternative sites for our facilities as our business continues to grow and failure in relocating our affected operations could materially and adversely affect our business and operations.
We are subject to a broad range of laws and regulations. Any lack of requisite approvals, licenses or permits applicable to our business or any failure to comply with applicable laws or regulations may have a material and adverse impact on our business, financial condition and results of operations.
Our business is subject to governmental supervision and regulation by the PRC governmental authorities, including the State Administration for Market Regulation (formerly known as the State Administration for Industry and Commerce), or SAMR, the NDRC, the Ministry of Commerce, the MIIT, the CAC, the Ministry of Transport, the State Post Bureau and the People’s Bank of China, among others. Together, these government authorities promulgate and enforce regulations that cover many aspects of the operation of the online retail, courier and road freight transportation industries, including entry into these industries, the scope of permissible business activities, licenses and permits for various business activities, and foreign investment. See “Item 4.B. Information on the Company—Business Overview—Regulation—Regulations Relating to Foreign Investment” and “—Licenses and Permits.”
Under PRC law, an entity operating courier services across multiple provinces must obtain a cross-provincial Courier Service Operation Permit and conduct its courier services within the permitted scope as indicated in the permit. Furthermore, any entity engaging in road freight transportation services in China must obtain a Road Transportation Operation Permit from the road transportation administrative authorities. We operate a nationwide road freight transportation and delivery network. As of December 31, 2023, we had Courier Service Operation Permits that allow Beijing Jingbangda Trade Co., Ltd. (Jingbangda), a subsidiary of Xi’an Jingdong Xincheng, one of the consolidated variable interest entities providing logistics services, and the subsidiaries of Jingbangda, to operate an express delivery business in 31 provinces and 448 cities in China. As of December 31, 2023, Jingbangda and its relevant subsidiaries had obtained Courier Service Operation Permits. As of the same date, among other entities, Xi’an Jingdong Xuncheng and its relevant branches and subsidiaries, and Jingbangda and its relevant branches and subsidiaries had obtained Road Transportation Operation Permits that allow these entities to provide road freight transportation services. We are in the process of making filings with local postal administrations for express delivery terminal outlets of the subsidiaries of Jingbangda. However, we cannot assure you that we can obtain such permits and licenses in a timely manner, or at all, due to complex procedural requirements and policies.
In addition, we issue one type of prepaid cards which may be used to buy the products and services sold on our mobile apps and websites. Due to licensing requirements, currently such prepaid cards can only be used to purchase products and services directly sold by us.
49
Table of Contents
There may be some defects with respect to the process of establishing certain of our indirect subsidiaries in China. Certain subsidiaries of our wholly foreign-owned subsidiaries in China were established without obtaining the prior approval from the government authorities that supervise their industry, and some have obtained the permits from the government authority at a level lower than as required. We have not received any notice of warning or been subject to penalties or other disciplinary action from the governmental authorities with respect to these defects. However, we cannot assure you that the governmental authorities would not require us to obtain the approvals, or the permits from proper level of government authorities to cure the defects, or take any other actions retrospectively in the future. If the government authorities require us to cure such defects, we cannot assure you that we will be able to obtain the approvals, or the permits from proper level of government authorities, in a timely manner or at all.
We provide payment by installments to certain qualified customers for purchasing products sold on our websites. These payment services may be deemed to be providing consumer loans. If so, an approval for consumer finance company from the government authority is required, and we cannot assure you that we can obtain such approval in a timely manner, or at all.
If the PRC government considers that we were operating without the proper approvals, licenses or permits, it has the power, among other things, to levy fines, confiscate our income, revoke our business licenses, and require us to discontinue that business or impose restrictions on the affected portion of our business. Any of these actions by the PRC government may have a material and adverse effect on our results of operations.
The e-commerce industry, and online retail in particular, is highly regulated by the PRC government. For example, the Price Law of the People’s Republic of China prohibits a business operator from committing the specified unlawful pricing activities, such as dumping products at price below cost for the purpose of driving out rivals or monopolizing the market, using false or misleading prices to deceive consumers to transact, colluding with others to manipulate the market price, or conducting price discrimination against other business operators. We are required to obtain various licenses and permits from different regulatory authorities in order to distribute certain categories of products on our mobile apps and websites. See “Item 4.B. Information on the Company—Business Overview—Regulation—Licenses and Permits.” We have made great efforts to obtain all the applicable licenses and permits, but due to the large number of products sold on our mobile apps and websites, we may not always be able to do so and we were penalized by governmental authorities for selling products without proper licenses. As we increase our product selection, we may also become subject to new or existing laws and regulations that did not affect us before.
As online retail is evolving rapidly in China, new laws and regulations may be adopted from time to time to require additional licenses and permits other than those we currently have, and to address new issues that arise from time to time. For example, in August 2018, the Standing Committee of the National People’s Congress promulgated the E-Commerce Law, which became effective on January 1, 2019. The E-Commerce Law imposes a number of new requirements and obligations on e-commerce platform operators. In addition, on March 15, 2021, the SAMR promulgated the Measures for the Supervision and Administration of Online Trading, which took effect from May 1, 2021 and became an important departmental regulation for the implementation of the E-commerce Law. We have adopted a series of measures to comply with such requires under the E-Commerce Law. We cannot assure you, however, that our current business operations meet the requirements under the E-Commerce Law in all respects. If the PRC governmental authorities determine that we are not in compliance with all the requirements under the E-Commerce Law and other applicable laws and rules, we may be subject to fines and/or other sanctions. As a result, we are subject to risks regarding the interpretation and implementation of PRC laws and regulations applicable to online retail businesses. If we are unable to maintain and renew one or more of our licenses and certificates when their current term expires, or obtain such renewals on commercially reasonable terms, our operations could be disrupted. If the PRC government requires additional licenses or permits or provides stricter supervision requirements in the future in order for us to conduct our businesses, there is no guarantee that we would be able to obtain such licenses or permits or meet all the supervision requirements in a timely manner, or at all.
50
Table of Contents
We have granted, and may continue to grant, restricted share units and other types of awards under our share incentive plans and our consolidated subsidiaries’ share incentive plans, which may result in increased share-based compensation expenses.
We adopted our current share incentive plan effective December 21, 2023, or the 2023 Plan, to replace our previous plan, which expired on December 20, 2023. JD Logistics, JD Health, JD Property and JD Industrials each have their own share incentive plans as well, and since we consolidate them in our financial statements, their share-based compensation expenses also affect our financial performance. See “Item 6.B. Directors, Senior Management and Employees—Compensation—Share Incentive Plans” for a detailed discussion of these various plans. In May 2015, with approval of our board of directors, Mr. Liu was granted an option to acquire a total of 26,000,000 Class A ordinary shares of our company under our previous plan, at an exercise price of US$16.70 per share or US$33.40 per ADS, subject to a 10-year vesting schedule with 10% of the award vested on each anniversary of the grant date. We incurred share-based compensation expenses of RMB73 million, RMB54 million and RMB38 million (US$5 million) in connection with this grant of option to Mr. Liu in 2021, 2022 and 2023, respectively. For the years ended December 31, 2021, 2022 and 2023, we recorded an aggregate of RMB9,134 million, RMB7,548 million, and RMB4,804 million (US$677 million), respectively, in share-based compensation expenses. As of December 31, 2023, the awards in our share incentive plans that had been granted to our directors, officers, employees and consultants and remained outstanding included (i) restricted share units to receive an aggregate of 53,988,060 ordinary shares, excluding restricted share units that were forfeited, cancelled, or vested after the grant date, and (ii) options to purchase an aggregate of 17,803,820 ordinary shares, excluding options that were forfeited, cancelled, or exercised after the grant date. As of December 31, 2023, none of the awards had been granted under the 2023 Plan. For awards granted under the share incentive plans of our consolidated subsidiaries, please see “Item 6.B. Directors, Senior Management and Employees—Compensation—Share Incentive Plans—Share Incentive Plans of our Consolidated Subsidiaries.” We believe the granting of share-based awards is of significant importance to our ability to attract and retain key personnel and employees, and we will continue to grant share-based awards to employees in the future. As a result, our expenses associated with share-based compensation may increase, which may have an adverse effect on our results of operations.
Our results of operations are subject to seasonal fluctuations.
We experience seasonality in our business, reflecting a combination of traditional retail seasonality patterns and new patterns associated with online retail in particular. For example, we generally experience less user traffic and purchase orders during national holidays in China, particularly during the Chinese New Year holiday season in the first quarter of each year. Furthermore, sales in the traditional retail industry are significantly higher in the fourth quarter of each calendar year than in the preceding three quarters.
E-commerce companies in China hold special promotional campaigns on November 11 each year, and we hold a special promotional campaign in the second quarter of each year, on June 18, to celebrate the anniversary of the founding of our business, both of which can affect our results for those quarters. Overall, the historical seasonality of our business has been relatively mild due to the rapid growth we have experienced and may increase further in the future. Our financial condition and results of operations for future periods may continue to fluctuate. As a result, the trading price of our Class A ordinary shares and/or ADSs may fluctuate from time to time due to seasonality.
We may need additional capital, and financing may not be available on terms acceptable to us, or at all.
Although we believe that our current cash and cash equivalents and anticipated cash flow from operations will be sufficient to meet our anticipated cash needs for the next 12 months, we may also require additional cash resources due to changed business conditions or other future developments, including any changes in our account payable policy, marketing initiatives or investments we may decide to pursue. If these resources are insufficient to satisfy our cash requirements, we may seek to obtain a credit facility or sell additional equity or debt securities. The sale of additional equity securities could result in dilution of our existing shareholders. The incurrence of indebtedness would result in increased debt service obligations and could result in operating and financing covenants that would restrict our operations. For example, the unsecured senior notes we issued in April 2016 and January 2020 both contain covenants including limitation on liens and restriction on consolidation, merger and sale of all or substantially all of our assets, and our term and revolving credit facilities we entered into in 2021, 2022 and 2023 contain covenants that impose certain minimum financial performance requirements on us and that might restrict our ability to raise additional debt. It is uncertain whether financing will be available in amounts or on terms acceptable to us, if at all. Disruptions in the financial markets not related to us could also affect our ability to raise capital. Any difficulty or failure to meet our liquidity needs as and when needed can have a material adverse effect on our prospects. A large balance of indebtedness may require that we devote our financial resources to servicing such debt rather than funding our operating activities, which constrains our capital flexibility and may in turn adversely affect our results of operation. It may also be a challenge for us to service our interest and principal repayments in a timely manner or at all, which could trigger cross-defaults with other debt, as applicable, as well as limit our ability to obtain further debt financing.
51
Table of Contents
Failure to comply with the terms of our indebtedness or enforcement of our obligations under any guarantee or other similar arrangement could have an adverse effect on our cash flow and liquidity.
As of December 31, 2023, we had long-term debt obligations of RMB42.4 billion (US$6 billion). Under the terms of our indebtedness and under any debt financing arrangement that we may enter into in the future, we are, and may be in the future, subject to covenants that could, among other things, restrict our business and operations. If we breach any of these covenants, our lenders under our credit facilities and holders of our unsecured senior notes will be entitled to accelerate our debt obligations. Any default under our credit facilities or unsecured senior notes could require that we repay these debts prior to maturity as well as limit our ability to obtain additional financing, which in turn may have a material adverse effect on our cash flow and liquidity. In addition, enforcement against us under any guarantee and other similar arrangements we may enter into in the future could materially and adversely affect our cash flow and liquidity.
Fluctuation of items that are non-recurring in nature and fluctuation of fair value change of the wealth management products we invested in have affected our results of operations in the past and may continue to affect our results of operations in the future.
The fluctuation of items that are non-recurring in nature, primarily gains on sale of development properties, impairment of goodwill and long-lived assets, and others, net, significantly affected our results of operations during 2021, 2022 and 2023. We recorded a gain of RMB767 million, RMB1,379 million and RMB2,283 million (US$322 million) in 2021, 2022 and 2023, respectively, for selling certain of our development properties. Impairment of goodwill and long-lived assets were nil, nil, and RMB5.2 billion (US$0.7 billion) in 2021, 2022 and 2023, respectively. Others, net are other non-operating income/(loss), primarily consist of gains/(losses) from fair value change of long-term investments, gains/(losses) from business and investment disposals, impairment of investments, government incentives, interest income and foreign exchange gains/(losses). For others, net, we recorded a loss of RMB0.6 billion, a loss of RMB1.6 billion and an income of RMB7.5 billion (US$1.1 billion) in 2021, 2022 and 2023, respectively. We identify these items as non-recurring in nature as they are not indicative of our core operating results and business outlook. We cannot assure you that we will be able to continue to generate net profits and maintain profitability in the future after excluding the impact of such non-recurring items. The significant fluctuation of these non-recurring items may continue to affect our results of operations and result in fluctuation of net income/(loss) in the future.
During 2021, 2022 and 2023, we made investments in wealth management products and recorded a fair value of wealth management products of RMB77.0 billion, RMB74.1 billion and RMB59.7 billion (US$8.4 billion) as of December 31, 2021, 2022 and 2023, respectively, which included gross unrealized gains of RMB474.0 million, RMB373.2 million and RMB647.2 million (US$91.2 million), respectively. No impairment charges were recorded for the years ended December 31, 2021, 2022 and 2023, respectively. Those wealth management products were certain deposits with variable interest rates or principal not-guaranteed with certain financial institutions, and usually have maturities of less than one year. We are exposed to credit risk in relation to our investments in wealth management products, which may adversely affect our net changes in their fair value. We cannot assure you that market conditions and regulatory environment will create fair value gains and we will not incur any fair value losses on our investments in wealth management products at fair value through profit or loss in the future. If we incur such fair value losses, our results of operations, financial condition and prospects may be adversely affected.
A severe or prolonged slowdown in the Chinese or global economy could materially and adversely affect our business and financial condition.
COVID-19 had a severe and negative impact on the Chinese and the global economy from 2020 through 2022, and the global macroeconomic environment still faces numerous challenges. The growth rate of the Chinese economy has been slowing since 2010 and the Chinese population began to decline in 2022. The Federal Reserve and other central banks outside of China have raised interest rates. The Russia-Ukraine conflict, the Hamas-Israel conflict and the attacks on shipping in the Red Sea have heightened geopolitical tensions across the world. The impact of the Russia-Ukraine conflict on Ukraine food exports has contributed to increases in food prices and thus to inflation more generally. There have also been concerns about the relationship between China and other countries which may potentially have economic effects. In particular, there is significant uncertainty about the future relationship between the United States and China with respect to a wide range of issues including trade policies, treaties, government regulations and tariffs. Economic conditions in China are sensitive to global economic conditions, as well as changes in domestic economic and political policies and the expected or perceived overall economic growth rate in China. Any severe or prolonged slowdown in the global or Chinese economy may materially and adversely affect our business, results of operations and financial condition.
52
Table of Contents
We may not be able to prevent others from unauthorized use of our intellectual property, which could harm our business and competitive position.
We regard our trademarks, copyrights, patents, domain names, know-how, proprietary technologies, and similar intellectual property as critical to our success, and we rely on a combination of intellectual property laws and contractual arrangements, including confidentiality, invention assignment and non-compete agreements with our employees and others, to protect our proprietary rights. Although we are not aware of any copycat websites that attempt to cause confusion or diversion of traffic from us at the moment, we may become an attractive target to such attacks in the future because of our brand recognition in the online retail industry in China. Despite these measures, any of our intellectual property rights could be challenged, invalidated, circumvented or misappropriated, or such intellectual property may not be sufficient to provide us with competitive advantages. In addition, there can be no assurance that our patent applications will be approved, that any issued patents will adequately protect our intellectual property, or that such patents will not be challenged by third parties or found by a judicial authority to be invalid or unenforceable. Further, because of the rapid pace of technological change in our industry, parts of our business rely on technologies developed or licensed by third parties, and we may not be able to obtain or continue to obtain licenses and technologies from these third parties at all or on reasonable terms.
Under the applicable laws and regulations relating to intellectual property, it may take months or even years to register, maintain and enforce our intellectual property rights. Confidentiality, invention assignment and non-compete agreements may be breached by counterparties, and there may not be adequate remedies available to us for any such breach. Accordingly, we may not be able to effectively protect our intellectual property rights or to enforce our contractual rights when needed. Policing any unauthorized use of our intellectual property is difficult and costly and the steps we take may be inadequate to prevent the infringement or misappropriation of our intellectual property. In the event that we resort to litigation to enforce our intellectual property rights, such litigation could result in substantial costs and a diversion of our managerial and financial resources, and could put our intellectual property at risk of being invalidated or narrowed in scope. We can provide no assurance that we will prevail in such litigation, and even if we do prevail, we may not obtain a meaningful recovery. In addition, our trade secrets may be leaked or otherwise become available to, or be independently discovered by, our competitors. Any failure in maintaining, protecting or enforcing our intellectual property rights could have a material adverse effect on our business, financial condition and results of operations.
We may be subject to intellectual property infringement claims, which may be expensive to defend and may disrupt our business and operations.
We cannot be certain that our operations or any aspects of our business do not or will not infringe upon or otherwise violate patents, copyrights or other intellectual property rights held by third parties. We have been, and from time to time in the future may be, subject to legal proceedings and claims relating to the intellectual property rights of others. In addition, there may be other third-party intellectual property that is infringed by our products or services, the products or services provided by third-party merchants on our marketplace, or other aspects of our business. There could also be existing patents of which we are not aware that our products may inadvertently infringe. We cannot assure you that holders of patents purportedly relating to some aspect of our technology platform or business, if any such holders exist, would not seek to enforce such patents against us in China, the United States or any other jurisdictions. Further, the application and interpretation of China’s patent laws and the procedures and standards for granting patents in China are still evolving and are uncertain, and we cannot assure you that PRC courts or regulatory authorities would agree with our analysis. If we are found to have violated the intellectual property rights of others, we may be subject to liability for our infringement activities or may be prohibited from using such intellectual property, and we may incur licensing fees or be forced to develop alternatives of our own. In addition, we may incur significant expenses, and may be forced to divert management’s time and other resources from our business and operations to defend against these third-party infringement claims, regardless of their merits. Successful infringement or licensing claims made against us may result in significant monetary liabilities and may materially disrupt our business and operations by restricting or prohibiting our use of the intellectual property in question. Finally, we use open source software in connection with our products and services. Companies that incorporate open source software into their products and services have, from time to time, faced claims challenging the ownership of open source software and compliance with open source license terms. As a result, we could be subject to suits by parties claiming ownership of what we believe to be open source software or noncompliance with open source licensing terms. Some open source software licenses require users who distribute open source software as part of their software to publicly disclose all or part of the source code to such software and make available any derivative works of the open source code on unfavorable terms or at no cost. Any requirement to disclose our source code or pay damages for breach of contract could be harmful to our business, results of operations and financial condition.
53
Table of Contents
We have limited insurance coverage, which could expose us to significant costs and business disruption.
We maintain various insurance policies to safeguard against risks and unexpected events. We have purchased all risk property insurance covering our inventory and fixed assets such as equipment, furniture and office facilities. We maintain public liability insurance for our business activities at 173 locations. We also provide social security insurance including pension insurance, unemployment insurance, work-related injury insurance, maternity insurance and medical insurance for our employees. Additionally, we provide group accident insurance for all employees and supplementary medical insurance for all management and technology and other professional personnel. However, insurance companies in China currently offer limited business-related insurance products. We do not maintain business interruption insurance or product liability insurance other than in connection with the fixed business premises of our 7FRESH business, nor do we maintain key-man insurance. We cannot assure you that our insurance coverage is sufficient to prevent us from any loss or that we will be able to successfully claim our losses under our current insurance policy on a timely basis, or at all. If we incur any loss that is not covered by our insurance policies, or the compensated amount is significantly less than our actual loss, our business, financial condition and results of operations could be materially and adversely affected.
Our chairman, Mr. Richard Qiangdong Liu, has considerable influence over important corporate matters. Our dual-class voting structure will limit your ability to influence corporate matters and could discourage others from pursuing any change of control transactions that holders of our Class A ordinary shares and/or our ADSs may view as beneficial.
Our company is controlled through a dual class voting structure. Our chairman, Mr. Richard Qiangdong Liu, has considerable influence over important corporate matters. Our ordinary shares are divided into Class A ordinary shares and Class B ordinary shares. Holders of Class A ordinary shares are entitled to one vote per share in respect of matters requiring the votes of shareholders, while holders of Class B ordinary shares are entitled to twenty votes per share, subject to certain exceptions. Each Class B ordinary share is convertible into one Class A ordinary share at any time by the holder thereof, while Class A ordinary shares are not convertible into Class B ordinary shares under any circumstances. Upon any direct or indirect transfer of Class B ordinary shares or associated voting power by a holder thereof to any person or entity which is not an affiliate of such holder, such Class B ordinary shares will be automatically and immediately converted into the equal number of Class A ordinary shares. Due to the disparate voting powers associated with our two classes of ordinary shares, as of March 31, 2024, Mr. Liu beneficially owned 70.5 % of the aggregate voting power of our company, including 3.8% of the aggregate voting power of our company that he may exercise on behalf of Fortune Rising Holdings Limited. See “Item 6.E. Directors, Senior Management and Employees—Share Ownership.” As a result, Mr. Liu has considerable influence over matters such as electing directors and approving material mergers, acquisitions or other business combination transactions. This concentrated control will limit your ability to influence corporate matters and could also discourage others from pursuing any potential merger, takeover or other change of control transactions, which could have the effect of depriving the holders of our Class A ordinary shares and our ADSs of the opportunity to sell their shares at a premium over the prevailing market price.
The current tensions in international trade policies and rising political tensions, particularly between the United States and China, may adversely impact our business and operating results.
The U.S. government has made statements and taken certain actions that may lead to changes in U.S. and international trade policies towards China. In January 2020, the “Phase One” agreement was signed between the United States and China on trade matters, which expired in December 2021. It remains unclear what additional actions, if any, will be taken by the U.S. or other governments with respect to international trade agreements, the imposition of tariffs on goods imported into the United States, tax policy related to international commerce, or other trade matters. While cross-border business may not be an area of focus for us, any unfavorable government policies on international trade, such as capital controls or tariffs, may affect the demand for our products and services, impact the competitive position of our products or prevent us from selling products in certain countries. If any new tariffs, legislation and/or regulations are implemented, or if existing trade agreements are renegotiated or, in particular, if the U.S. government takes retaliatory trade actions due to recent U.S.-China trade tensions, such changes could have an adverse effect on our business, financial condition and results of operations.
54
Table of Contents
In addition, we have been closely monitoring domestic policies in the United States designed to restrict certain Chinese companies from supplying or operating in the U.S. market. These policies include the Clean Network project initiated by the U.S. Department of State in August 2020, new authorities granted to the Department of Commerce to prohibit or restrict the use of information and communications technology and services, or ICTS, and Executive Order on Protecting America’s Sensitive Data from Foreign Adversaries published in June 2021. While a substantial majority of our business is conducted in China, policies like these may deter U.S. users from accessing and/or using our apps, products and services, which could adversely impact our user experience and reputation.
Likewise, we are monitoring policies in the United States that are aimed at restricting U.S. persons from investing in or supplying certain Chinese companies and/or imposing sanctions on Chinese entities. The United States and various foreign governments have imposed controls, license requirements and restrictions on the import or export of technologies and products (or voiced the intention to do so).
In August 2023, an executive order was issued by the Biden administration to restrict U.S. investments in sensitive technologies in the Chinese mainland, Hong Kong, and Macau, such as advanced computing chips, quantum technology, and artificial intelligence. As of the date of this annual report, the final rules implementing the order have not become effective yet, and the scope of the review program may be materially different from what is currently contemplated by the advance notice. Therefore, there are substantial uncertainties on whether the outbound foreign direct investment review program will have a material impact on our business, results of operations, financial condition, and prospects.
In addition, the U.S. government may potentially impose a ban prohibiting U.S. persons from making investments in or engaging in transactions with companies in certain countries, including China. Measures such as these could deter suppliers in the United States and/or other countries that impose sanctions, export controls and other restrictions from providing technologies and products to, making investments in, or otherwise engaging in transactions with Chinese companies. As a result, Chinese companies would have to identify and secure alternative supplies or sources of financing, while they may not be able to do so in a timely manner and at commercially acceptable terms, or at all. In addition, Chinese companies may have to limit and reduce their research and development and other business activities, or cease conducting transactions with parties, in the United States and other countries that impose export controls or other restrictions. Like other Chinese companies, we may be affected by such sanctions, export controls or other restrictions, and we may also be exposed to risks in dealing with business partners that are subject to sanctions, export controls or other restrictions. As a result, we could be required to incur additional costs to comply with these complicated regulations and measures and could face penalties for any violation, even inadvertent, which could adversely affect our business, financial condition and results of operations.
We may be the subject of anti-competitive, harassing, or other detrimental conduct by third parties including complaints to regulatory agencies, negative blog postings, and the public dissemination of malicious assessments of our business that could harm our reputation and cause us to lose market share, customers and revenues and adversely affect the price of our Class A ordinary shares and/or ADSs.
We may be the target of anti-competitive, harassing, or other detrimental conduct by third parties. Such conduct includes complaints, anonymous or otherwise, to regulatory agencies. Our brand name and our business may be harmed by aggressive marketing and communications strategies of our competitors. We may be subject to government or regulatory investigation as a result of such third-party conduct and may be required to expend significant time and incur substantial costs to address such third-party conduct, and there is no assurance that we will be able to conclusively refute each of the allegations within a reasonable period of time, or at all. Additionally, allegations, directly or indirectly against us, may be posted in internet chat-rooms or on blogs or websites by anyone, whether or not related to us, on an anonymous basis. Consumers value readily available information concerning retailers, manufacturers, and their goods and services and often act on such information without further investigation or authentication and without regard to its accuracy. The availability of information on social media platforms and devices is virtually immediate, as is its impact. Social media platforms and devices immediately publish the content their subscribers and participants post, often without filters or checks on the accuracy of the content posted. Information posted may be inaccurate and adverse to us, and it may harm our financial performance, prospects or business. The harm may be immediate without affording us an opportunity for redress or correction. Our reputation may be negatively affected as a result of the public dissemination of anonymous allegations or malicious statements about our business, which in turn may cause us to lose market share, customers and revenues and adversely affect the price of our Class A ordinary shares and/or ADSs.
55
Table of Contents
We face risks related to natural disasters, health epidemics and other public safety concerns.
Our business could be materially and adversely affected by natural disasters, health epidemics or other public safety concerns affecting the PRC. Any such occurrences could cause severe disruption to our daily operations, including our fulfillment infrastructure and our customer service centers, and may even require a temporary closure of our facilities. In addition, our results of operations could be adversely affected to the extent that any such occurrence affects our suppliers, customers or business partners or harms the Chinese economy in general. Furthermore, to the extent that a natural disaster, health epidemic or other public safety concern adversely affects our business and financial results, it may also have the effect of heightening many of the other risks described in this annual report, such as those relating to our level of indebtedness, our need to generate sufficient cash flows to service our indebtedness and our ability to comply with the covenants contained in the agreements that govern our indebtedness. If any natural disasters, health epidemics or other public safety concerns were to cause our operations to experience material disruptions, our business, financial condition and results of operations may be materially and adversely affected.
If we do not appropriately maintain effective internal control over financial reporting in accordance with Section 404 of the Sarbanes-Oxley Act of 2002, we may be unable to accurately report our financial results and the market price of our Class A ordinary shares and/or ADSs may be adversely affected.
We are subject to reporting obligations under the U.S. securities laws. The SEC, as required under Section 404 of the Sarbanes-Oxley Act of 2002, adopted rules requiring every public company to include a management report on such company’s internal control over financial reporting in its annual report, which contains management’s assessment of the effectiveness of the company’s internal control over financial reporting. In addition, an independent registered public accounting firm must attest to and report on the effectiveness of the company’s internal control over financial reporting. Our management has concluded that our internal control over financial reporting was effective as of December 31, 2023. See “Item 15. Controls and Procedures.”
However, if we fail to maintain effective internal control over financial reporting in the future, our management and our independent registered public accounting firm may not be able to conclude that we have effective internal control over financial reporting at a reasonable assurance level. This could in turn result in the loss of investor confidence in the reliability of our financial statements and negatively impact the trading price of our Class A ordinary shares and ADSs. Furthermore, we have incurred and may need to incur additional costs and use additional management and other resources in an effort to comply with Section 404 of the Sarbanes-Oxley Act and other requirements going forward.
The approval of and/or filing with the CSRC or other PRC government authorities may be required in connection with our offshore offerings under PRC law, and, if required, we cannot predict whether or for how long we will be able to obtain such approval or complete such filing.
PRC laws and regulations in relation to overseas issuance and listing of shares have been evolving. On July 6, 2021, the PRC government authorities issued Opinions on Strictly Cracking Down Illegal Securities Activities in Accordance with the Law. These opinions emphasized the need to strengthen the administration over illegal securities activities and the supervision on overseas listings by China-based companies and proposed to take effective measures, such as promoting the construction of regulatory systems to deal with the risks and incidents faced by China-based overseas-listed companies. As a follow-up, on February 17, 2023, the CSRC released the Trial Administrative Measures of Overseas Securities Offering and Listing by Domestic Companies and five supporting guidelines, or, collectively, the Trial Measures, which came into effect on March 31, 2023.
The Trial Measures establish a new filing-based regime to regulate overseas offerings of stocks, depository receipts, convertible corporate bond, or other equity securities, and overseas listing of these securities for trading, by domestic companies. According to the Trial Measures, an overseas offering and listing by a domestic company, whether directly or indirectly, shall be filed with the CSRC. According to the Trial Measures, an issuer like us is required to submit the filing with respect to its follow-on offering and other equivalent offering activities, within a specific time frame. The Trial Measures also sets forth certain regulatory red lines for overseas offerings and listings by domestic enterprises and additional reporting obligations for listed companies in the case of material changes. Any failure to perform such filing or reporting procedure would subject us to administrative penalties by the CSRC which could harm our reputation and may adversely affect our results of financial condition. For more details of the Trial Measures, please refer to “Item 4.B. Information on the Company—Business Overview—Regulation—Regulations Relating to Overseas Listing and M&A.”
56
Table of Contents
Furthermore, on February 24, 2023, the CSRC released the Provisions on Strengthening the Confidentiality and Archives Administration Related to the Overseas Securities Offering and Listing by Domestic Enterprises, or, the Confidentiality Provisions, which came into effect on March 31, 2023. Pursuant to the Confidentiality Provisions, any future inspection or investigation conducted by overseas securities regulator or the competent authorities on our PRC domestic companies with respect to our overseas issuance and listing shall be carried out in the manner in compliance with PRC laws and regulations.
In addition, we cannot assure you that any new rules or regulations promulgated in the future will not impose additional requirements on us. If it is determined in the future that approval and filing from the CSRC or other regulatory authorities or other procedures, including the cybersecurity review under the discussion draft of the Administrative Measures for Internet Data Security, are required for our offshore offerings, it is uncertain whether we can, or how long it will take us to, obtain such approval or complete such filing procedures and any such approval or filing could be rescinded or rejected. Any failure to obtain or delay in obtaining such approval or completing such filing procedures for our offshore offerings, or a rescission of any such approval or filing if obtained by us, would subject us to sanctions by the CSRC or other PRC regulatory authorities for failure to seek CSRC approval or filing or other government authorization for our offshore offerings. Any uncertainties or negative publicity regarding such approval requirement could materially and adversely affect our business, prospects, financial condition, reputation, and the trading price of our listed securities.
The PCAOB had historically been unable to inspect our auditor in relation to their audit work performed for our financial statements and the inability of the PCAOB to conduct inspections of our auditor in the past has deprived our investors with the benefits of such inspections.
Our auditor, the independent registered public accounting firm that issues the audit report included elsewhere in this annual report, as an auditor of companies that are traded publicly in the United States and a firm registered with the PCAOB, is subject to laws in the United States pursuant to which the PCAOB conducts regular inspections to assess its compliance with the applicable professional standards. The auditor is located in China, a jurisdiction where the PCAOB was historically unable to conduct inspections and investigations completely before 2022. As a result, we and investors in our ADSs were deprived of the benefits of such PCAOB inspections. The inability of the PCAOB to conduct inspections of auditors in China in the past has made it more difficult to evaluate the effectiveness of our independent registered public accounting firm’s audit procedures or quality control procedures as compared to auditors outside of China that are subject to the PCAOB inspections. On December 15, 2022, the PCAOB issued a report that vacated its December 16, 2021 determination and removed the Chinese mainland and Hong Kong from the list of jurisdictions where it is unable to inspect or investigate completely registered public accounting firms. However, if the PCAOB determines in the future that it no longer has full access to inspect and investigate completely accounting firms in the Chinese mainland or Hong Kong, and we use an accounting firm headquartered in one of these jurisdictions to issue an audit report on our financial statements filed with the SEC, we and investors in our ADSs would be deprived of the benefits of such PCAOB inspections again, which could cause investors and potential investors in our ADSs to lose confidence in the audit procedures and reported financial information and the quality of our financial statements.
Our ADSs may be prohibited from trading in the United States under the HFCAA in the future if the PCAOB is unable to inspect or investigate completely auditors located in China. The delisting of the ADSs, or the threat of their being delisted, may materially and adversely affect the value of your investment.
Pursuant to the HFCAA, if the SEC determines that we have filed audit reports issued by a registered public accounting firm that has not been subject to inspection for the PCAOB for two consecutive years, the SEC will prohibit our shares or ADSs from being traded on a national securities exchange or in the over-the-counter trading market in the United States.
57
Table of Contents
On December 16, 2021, the PCAOB issued a report to notify the SEC of its determination that the PCAOB was unable to inspect or investigate completely registered public accounting firms headquartered in the Chinese mainland and Hong Kong, and our auditor was subject to that determination. In May 2022, the SEC conclusively listed us as a Commission-Identified Issuer under the HFCAA following the filing of our annual report on Form 20-F for the fiscal year ended December 31, 2021. On December 15, 2022, the PCAOB removed the Chinese mainland and Hong Kong from the list of jurisdictions where it is unable to inspect or investigate completely registered public accounting firms. For this reason, we were not identified as a Commission-Identified Issuer under the HFCAA after we filed our annual report on Form 20-F for the fiscal year ended December 31, 2022 and do not expect to be identified so after we file this annual report on Form 20-F for the fiscal year ended December 31, 2023.
Each year, the PCAOB will determine whether it can inspect and investigate completely audit firms in the Chinese mainland and Hong Kong, among other jurisdictions. If the PCAOB determines in the future that it no longer has full access to inspect and investigate completely accounting firms in the Chinese mainland and Hong Kong, and we use an accounting firm headquartered in one of these jurisdictions to issue an audit report on our financial statements filed with the SEC, we would be identified as a Commission-Identified Issuer following the filing of the annual report on Form 20-F for the relevant fiscal year. In accordance with the HFCAA, our securities would be prohibited from being traded on a national securities exchange or in the over-the-counter trading market in the United States if we are identified as a Commission-Identified Issuer for two consecutive years in the future. Although our Class A ordinary shares have been listed on the Hong Kong Stock Exchange, and our ADSs and Class A ordinary shares are fully fungible, we cannot assure your that an active trading market for our Class A ordinary shares on the Hong Kong Stock Exchange will be sustained or that the ADSs can be converted and traded with sufficient market recognition and liquidity, if our shares and ADSs are prohibited from trading in the United States. A prohibition of being able to trade in the United States would substantially impair your ability to sell or purchase our ADSs when you wish to do so, and the risk and uncertainty associated with delisting would have a negative impact on the price of our ADSs and Class A ordinary shares. Also, such a prohibition would significantly affect our ability to raise capital on terms acceptable to us, or at all, which would have a material adverse impact on our business, financial condition and prospects.
We are subject to changing law and regulations regarding regulatory matters, corporate governance and public disclosure that have increased both our costs and the risk of non-compliance.
We are subject to rules and regulations by various governing bodies, including, for example, the SEC, which is charged with the protection of investors and the oversight of companies whose securities are publicly traded, and the various regulatory authorities in China and the Cayman Islands, and to new and evolving regulatory measures under applicable law. Our efforts to comply with new and changing laws and regulations have resulted in and are likely to continue to result in, increased general and administrative expenses and a diversion of management time and attention from revenue-generating activities to compliance activities.
Moreover, because these laws, regulations and standards are subject to ongoing interpretations, their application in practice may evolve over time as new guidance becomes available. This evolution may result in continuing uncertainty regarding compliance matters and additional costs necessitated by ongoing revisions to our disclosure and governance practices. If we fail to address and comply with these regulations and any subsequent changes, we may be subject to penalty and our business may be harmed.
Our international expansion strategy and ability to conduct business in international markets may be adversely affected by legal, regulatory, political and economic risks.
International expansion is a significant component of our growth strategy and may require significant capital investment, which could strain our resources and adversely impact current performance, while adding complexity to our current operations. We are subject to PRC law in addition to the laws of the foreign countries in which we operate. If any of our overseas operations, or our associates or agents, violate such laws, we could become subject to sanctions or other penalties, which could negatively affect our reputation, business and operating results.
58
Table of Contents
In addition, we may face operational issues that could have a material adverse effect on our reputation, business and results of operations, if we fail to address certain factors including the following:
| • | difficulties in developing, staffing and simultaneously managing a foreign operation as a result of distance, language and cultural differences; |
| • | challenges in formulating effective local sales and marketing strategies targeting users from various jurisdictions and cultures, who have a diverse range of preferences and demands; |
| • | challenges in identifying appropriate local business partners and establishing and maintaining good working relationships with them; |
| • | dependence on local platforms in marketing our international products and services overseas; |
| • | challenges in selecting suitable geographical regions for international business; |
| • | longer customer payment cycles; |
| • | currency exchange rate fluctuations; |
| • | political or social unrest or economic instability; |
| • | protectionist or national security policies that restrict our ability to invest in or acquire companies; develop, import or export certain technologies, such as the national AI initiative proposed by the U.S. government; or utilize technologies that are deemed by local governmental regulators to pose a threat to their national security; |
| • | compliance with applicable foreign laws and regulations and unexpected changes in laws or regulations, including compliance with privacy laws and data security laws, including the European Union General Data Protection Regulation and compliance costs across different legal systems; |
| • | differing, complex and potentially adverse customs, import/export laws, tax rules and regulations or other trade barriers or restrictions which may be applicable to transactions conducted through our international and cross-border platforms, related compliance obligations and consequences of non-compliance, and any new developments in these areas; and |
| • | increased costs associated with doing business in foreign jurisdictions. |
One or more of these factors could harm our overseas operations and consequently, could harm our overall results of operations. In addition, legislatures and taxing authorities in many jurisdictions in which we operate may enact changes to, or seek to enforce novel interpretations of, their tax rules. These changes could include amendments that have temporary effect as well as more permanent changes. For example, the Organization for Economic Cooperation and Development, or the OECD, the European Union and other countries (including countries in which we operate) have committed to enacting substantial changes to numerous long-standing tax principles impacting how large multinational enterprises are taxed. In particular, the OECD’s Pillar Two initiative introduces a 15% global minimum tax applied on a country-by-country basis, which became effective in many jurisdictions in which we operate starting January 1, 2024. The impact of these potential new rules and any other changes in domestic and international tax rules and regulations could have a material and adverse effect on our effective tax rate, and we will continue to evaluate the impact of these changes.
Risks Related to Our Corporate Structure
If the PRC government determines that the contractual arrangements constituting part of the consolidated variable interest entities structure do not comply with PRC laws and regulations, or if these laws and regulations change or are interpreted differently in the future, we could be subject to severe penalties or be forced to relinquish our interests in those operations.
Foreign ownership of certain of our businesses including value-added telecommunication services is subject to restrictions under current PRC laws and regulations. For example, foreign investors are not allowed to own more than 50% of the equity interests in a value-added telecommunication service provider (excluding e-commerce, domestic multi-party communications, data collection and transmission services and call centers).
We are a Cayman Islands exempted company and our PRC subsidiaries Jingdong Century, Shanghai Shengdayuan and Xi’an Jingxundi are considered foreign-invested enterprises. Accordingly, none of these PRC subsidiaries is eligible to provide value-added telecommunication services or provide certain other restricted services related to our businesses, such as domestic document delivery services. As a result, we conduct or will conduct such business activities through the consolidated variable interest entities and their subsidiaries in PRC, including Jingdong 360, Jiangsu Yuanzhou, Xi’an Jingdong Xincheng and Jingbangda. Jingdong 360 holds our ICP license as an internet information provider. Xi’an Jingdong Xincheng primarily provides courier services through Jingbangda and its subsidiaries.
59
Table of Contents
We entered into a series of contractual arrangements with Jingdong 360, Jiangsu Yuanzhou, Xi’an Jingdong Xincheng and other variable interest entities in China and their respective shareholders, which enable us to:
| • | receive substantially all of the economic benefits of Jingdong 360, Jiangsu Yuanzhou, Xi’an Jingdong Xincheng and other variable interest entities in China; and |
| • | have an exclusive option to purchase all or part of the equity interests in Jingdong 360, Jiangsu Yuanzhou, Xi’an Jingdong Xincheng and other variable interest entities in China when and to the extent permitted by PRC law. |
Because of these contractual arrangements, we are the primary beneficiary of Jingdong 360, Jiangsu Yuanzhou, Xi’an Jingdong Xincheng and other variable interest entities in China and hence consolidate their financial results as the consolidated variable interest entities. For a detailed discussion of these contractual arrangements, see “Item 4.C. Information on the Company—Organizational Structure.”
In the opinion of Shihui Partners, our PRC legal counsel, (i) the ownership structures of the consolidated variable interest entities in China and the PRC subsidiaries that have entered into contractual arrangements with the variable interest entities, including Jingdong Century, comply with all existing PRC laws and regulations; and (ii) the contractual arrangements between the PRC subsidiaries, including Jingdong Century, the variable interest entities and their respective shareholders governed by PRC law are valid, binding and enforceable, and will not result in any violation of PRC laws or regulations currently in effect.
However, we are a Cayman Islands holding company with no equity ownership in the consolidated variable interest entities and we conduct certain of our operations in China through the consolidated variable interest entities with which we have maintained contractual arrangements. Investors in our ADSs or Class A ordinary shares thus are not purchasing equity interest in the consolidated variable interest entities in China but instead are purchasing equity interest in a Cayman Islands holding company. If the PRC government determines that the contractual arrangements with constituting part of the consolidated variable interest entities structure do not comply with PRC laws and regulations, or if these laws and regulations change or are interpreted differently in the future, we could be subject to severe penalties or be forced to relinquish our interests in those operations. We may not be able to repay the notes and other indebtedness, and the securities we are registering may decline in value or become worthless, if the determinations, changes, or interpretations result in our inability to assert contractual control over the assets of the consolidated variable interest entities. Our holding company in the Cayman Islands, the consolidated variable interest entities, and investors of our company face uncertainty about potential future actions by the PRC government that could affect the enforceability of the contractual arrangements with the consolidated variable interest entities and, consequently, significantly affect the financial performance of the consolidated variable interest entities and our company as a group.
Our PRC legal counsel has also advised us that there are substantial uncertainties regarding the interpretation and application of current and future PRC laws, regulations and rules; accordingly, the PRC regulatory authorities may take a view that is contrary to the opinion of our PRC legal counsel in the future. It is uncertain whether any other new PRC laws or regulations relating to variable interest entity structures will be adopted or if adopted, what they would provide. If we or any of the consolidated variable interest entities are found to be in violation of any existing or future PRC laws or regulations, or fail to obtain or maintain any of the required permits or approvals, the PRC regulatory authorities would have broad discretion to take action in dealing with such violations or failures, including:
| • | revoking the business licenses of such entities; |
| • | discontinuing or restricting the conduct of any transactions between certain of our PRC subsidiaries and variable interest entities; |
| • | imposing fines, confiscating the income from the consolidated variable interest entities, or imposing other requirements with which we or the consolidated variable interest entities may not be able to comply; |
60
Table of Contents
| • | requiring us to restructure our ownership structure or operations, including terminating the contractual arrangements with the consolidated variable interest entities and deregistering the equity pledges of the consolidated variable interest entities, which in turn would affect our ability to consolidate or derive economic interests from the consolidated variable interest entities; or |
| • | restricting or prohibiting our use of the proceeds of any of our financing outside China to finance our business and operations in China. |
The imposition of any of these penalties would result in a material and adverse effect on our ability to conduct our business. In addition, it is unclear what impact the PRC government actions would have on us and on our ability to consolidate the financial results of the consolidated variable interest entities in our consolidated financial statements, if the PRC government authorities were to find our legal structure and contractual arrangements to be in violation of PRC laws and regulations. If the imposition of any of these government actions causes us to lose our right to direct the activities of the consolidated variable interest entities or our right to receive substantially all the economic benefits and residual returns from the consolidated variable interest entities and we are not able to restructure our ownership structure and operations in a satisfactory manner, we would no longer be able to consolidate the financial results of the consolidated variable interest entities in our consolidated financial statements. Either of these results, or any other significant penalties that might be imposed on us in this event, would have a material adverse effect on our financial condition and results of operations.
Although we believe we, our PRC subsidiaries and the consolidated variable interest entities comply with current PRC laws and regulations, we cannot assure you that the PRC government would agree that our contractual arrangements comply with PRC licensing, registration or other regulatory requirements, with existing policies or with requirements or policies that may be adopted in the future. The PRC government may determine rectifiable or punitive measures for non-compliance with or violations of PRC laws and regulations. If the PRC government determines that we or the consolidated variable interest entities do not comply with applicable law, it could revoke the consolidated variable interest entities’ business and operating licenses, require the consolidated variable interest entities to discontinue or restrict the consolidated variable interest entities’ operations, restrict the consolidated variable interest entities’ right to collect revenues, block the consolidated variable interest entities’ websites, require the consolidated variable interest entities to restructure our operations, impose additional conditions or requirements with which the consolidated variable interest entities may not be able to comply, impose restrictions on the consolidated variable interest entities’ business operations or on their customers, or take other regulatory or enforcement actions against the consolidated variable interest entities that could be harmful to their business. Any of these or similar occurrences could significantly disrupt our or the consolidated variable interest entities’ business operations or restrict the consolidated variable interest entities from conducting a substantial portion of their business operations, which could materially and adversely affect the consolidated variable interest entities’ business, financial condition and results of operations. If any of these occurrences results in our inability to direct the activities of any of the consolidated variable interest entities that most significantly impact its economic performance, and/or our failure to receive the economic benefits from any of the consolidated variable interest entities, we may not be able to consolidate these entities in our consolidated financial statements in accordance with U.S. GAAP.
We rely on contractual arrangements with the consolidated variable interest entities and their owners for a portion of our business operations, which may not be as effective as direct ownership in providing operational control.
We have relied and expect to continue to rely on contractual arrangements with Jingdong 360 and its shareholders to hold our ICP license as an internet information provider, contractual arrangements with Jiangsu Yuanzhou and its shareholders to conduct the distribution of books and audio and video products and contractual arrangements with other variable interest entities for the restricted businesses. For a description of these contractual arrangements, see “Item 4.C. Information on the Company—Organizational Structure.” These contractual arrangements may not be as effective as direct ownership in providing us with control over the consolidated variable interest entities.
If we had direct ownership of the consolidated variable interest entities, we would be able to exercise our rights as a shareholder to effect changes in the board of directors of those entities, which in turn could effect changes, subject to any applicable fiduciary obligations, at the management level. However, under the current contractual arrangements, we rely on the performance by the consolidated variable interest entities and their respective shareholders of their obligations under the contracts to exercise control over the consolidated variable interest entities. However, the shareholders of the consolidated variable interest entities may not act in the best interests of our company or may not perform their obligations under these contracts. Such risks exist throughout the period in which we intend to operate our business through the contractual arrangements with the consolidated variable interest entities. We may replace the shareholders of the consolidated variable interest entities at any time pursuant to our contractual arrangements with them and their shareholders. However, if any dispute relating to these contracts remains unresolved, we will have to enforce our rights under these contracts through the operations of PRC law and courts and therefore will be subject to uncertainties in the PRC legal system. See “—Any failure by the consolidated variable interest entities or their shareholders to perform their obligations under our contractual arrangements with them would have a material and adverse effect on our business.” Therefore, our contractual arrangements with the consolidated variable interest entities may not be as effective in ensuring our control over the relevant portion of our business operations as direct ownership would be.
61
Table of Contents
Any failure by the consolidated variable interest entities or their shareholders to perform their obligations under our contractual arrangements with them would have a material and adverse effect on our business.
If the consolidated variable interest entities or their shareholders fail to perform their respective obligations under the contractual arrangements, we may have to incur substantial costs and expend additional resources to enforce such arrangements. We may also have to rely on legal remedies under PRC law, including seeking specific performance or injunctive relief, and claiming damages, which we cannot assure you will be effective. For example, if the shareholders of the consolidated variable interest entities were to refuse to transfer their equity interest in the variable interest entities to us or our designee when we exercise the purchase option pursuant to these contractual arrangements, or if they were otherwise to act in bad faith toward us, we may have to take legal actions to compel them to perform their contractual obligations.
All the agreements under our contractual arrangements are governed by PRC law and provide for the resolution of disputes through arbitration in China. Accordingly, these contracts would be interpreted in accordance with PRC law and any disputes would be resolved in accordance with PRC legal procedures. See “—Risks Related to Doing Business in China—Uncertainties with respect to the legal system in the Chinese mainland could adversely affect us.” Meanwhile, there are very few precedents and little formal guidance as to how contractual arrangements in the context of a variable interest entity should be interpreted or enforced under PRC law, and as a result it may be difficult to predict how an arbitration panel would view such contractual arrangements. As a result, uncertainties in the PRC legal system could limit our ability to enforce these contractual arrangements. Additionally, under PRC law, rulings by arbitrators are final, parties cannot appeal the arbitration results in courts, and if the losing parties fail to carry out the arbitration awards within a prescribed time limit, the prevailing parties may only enforce the arbitration awards in PRC courts through arbitration award recognition proceedings, which would require additional expenses and delay.
The consolidated variable interest entities, including their subsidiaries, hold our necessary licenses and permits, including ICP licenses, Courier Service Operation Permits and Practicing License for Medical Institutions, and conduct our sales of books and audio and video products (including publication of e-books and online audio and video products). In the event we are unable to enforce our contractual arrangements, our ability to conduct these businesses may be negatively affected. We generate the majority of our revenues from products and services that are offered to customers through our mobile apps and websites and any interruption in our ability to use our mobile apps and websites may have a material and adverse effect on our financial condition and results of operations.
The shareholders of the consolidated variable interest entities may have potential conflicts of interest with us, which may materially and adversely affect our business and financial condition.
Mr. Richard Qiangdong Liu, Ms. Yayun Li and Ms. Pang Zhang are the shareholders of Suqian Juhe. Mr. Qin Miao, Ms. Yayun Li and Ms. Pang Zhang are the shareholders of the other significant consolidated variable interest entities. Mr. Richard Qiangdong Liu is our chairman of board of directors, Mr. Qin Miao is a vice president of our company, Ms. Yayun Li is chief executive officer of JD Technology, a significant investee of our company, and Ms. Pang Zhang is our chief human resources officer.
The shareholders of the consolidated variable interest entities may have potential conflicts of interest with us. These shareholders may breach, or cause the consolidated variable interest entities to breach, or refuse to renew, the existing contractual arrangements we have with them and the consolidated variable interest entities, which would have a material and adverse effect on our ability to effectively control the consolidated variable interest entities and receive substantially all the economic benefits from them. For example, the shareholders may be able to cause our agreements with the consolidated variable interest entities to be performed in a manner adverse to us by, among other things, failing to remit payments due under the contractual arrangements to us on a timely basis. We cannot assure you that when conflicts of interest arise, any or all of these shareholders will act in the best interests of our company or such conflicts will be resolved in our favor.
62
Table of Contents
Currently, we do not have any arrangements to address potential conflicts of interest between these shareholders and our company. We rely on Mr. Liu to abide by the laws of the Cayman Islands and China, which provide that directors owe a fiduciary duty to the company that requires them to act in good faith and in what they believe to be the best interests of the company and not to use their position for personal gains. If we cannot resolve any conflict of interest or dispute between us and the shareholders of the consolidated variable interest entities, we would have to rely on legal proceedings, which could result in disruption of our business and subject us to substantial uncertainty as to the outcome of any such legal proceedings.
We may rely on dividends and other distributions on equity paid by our PRC subsidiaries to fund any cash and financing requirements we may have, and any limitation on the ability of our PRC subsidiaries to make payments to us could have a material and adverse effect on our ability to conduct our business.
We are a holding company, and we may rely on dividends and other distributions on equity paid by our PRC subsidiaries like Jingdong Century for our cash and financing requirements, including the funds necessary to pay dividends and other cash distributions to our shareholders and service any debt we may incur. If these subsidiaries incur debt on their own behalf in the future, the instruments governing the debt may restrict their ability to pay dividends or make other distributions to us. In addition, the PRC tax authorities may require Jingdong Century or any other relevant PRC subsidiary to adjust its taxable income under the contractual arrangements it currently has in place with the consolidated variable interest entities in a manner that would materially and adversely affect its ability to pay dividends and other distributions to us. See “—Contractual arrangements in relation to the consolidated variable interest entities may be subject to scrutiny by the PRC tax authorities and they may determine that we or the variable interest entities owe additional taxes, which could negatively affect our financial condition and the value of your investment.”
Under PRC laws and regulations, our wholly foreign-owned subsidiaries in the Chinese mainland may pay dividends only out of their respective accumulated profits as determined in accordance with PRC accounting standards and regulations. In addition, a PRC enterprise is required to set aside at least 10% of its accumulated after-tax profits each year, if any, to fund certain statutory reserve fund, until the aggregate amount of such fund reaches 50% of its registered capital.
Any limitation on the ability of our PRC subsidiaries to pay dividends or make other distributions to us could materially and adversely limit our ability to grow, make investments or acquisitions that could be beneficial to our business, pay dividends, or otherwise fund and conduct our business. The funds in our PRC subsidiaries or the consolidated variable interest entities in the Chinese mainland may not be available to fund operations or for other use outside of the Chinese mainland if our holding company, our subsidiaries, or the consolidated variable interest entities do not comply with applicable laws and regulations on cash transfers. Although currently there are not equivalent or similar requirements in Hong Kong on cash transfers in, or out of, our Hong Kong entities, if certain requirements in the Chinese mainland were to become applicable to cash transfers in and out of Hong Kong entities in the future, the funds in our Hong Kong entities, likewise, may not be available to fund operations or for other use outside of Hong Kong. See also “—Risks Related to Doing Business in China—If we are classified as a PRC resident enterprise for PRC income tax purposes, such classification could result in unfavorable tax consequences to us and our non-PRC shareholders or ADS holders.”
63
Table of Contents
PRC regulation of loans to and direct investment in PRC entities by offshore holding companies and governmental regulation of currency conversion may delay or prevent us from making loans to our PRC subsidiaries and the consolidated variable interest entities or making additional capital contributions to our wholly foreign-owned subsidiaries in the Chinese mainland, which could materially and adversely affect our liquidity and our ability to fund and expand our business.
We are an offshore holding company conducting our operations in the Chinese mainland through our PRC subsidiaries and the consolidated variable interest entities. We may make loans to our PRC subsidiaries and the consolidated variable interest entities subject to the approval from governmental authorities and limitation of amount, or we may make additional capital contributions to our wholly foreign-owned subsidiaries in the Chinese mainland.
Any loans to our wholly foreign-owned subsidiaries in the Chinese mainland, which are treated as foreign-invested enterprises under PRC law, are subject to PRC regulations and foreign exchange loan registrations. For example, loans by us to our wholly foreign-owned subsidiaries in the Chinese mainland to finance their activities cannot exceed statutory limits, i.e., the difference between its total amount of investment and its registered capital, or certain amount calculated based on elements including capital or net assets, the cross-border financing leverage ratio and the macro prudential coefficient (“Macro-prudential Management Mode”) under PRC laws and the loans must be registered with the local counterpart of the State Administration of Foreign Exchange, or SAFE, or filed with SAFE in its information system. We may also provide loans to the consolidated variable interest entities or other domestic PRC entities under the Macro-prudential Management Mode. According to the Circular of the People’s Bank of China and the State Administration of Foreign Exchange on Upregulating the Macro-prudent Adjustment Parameter for Cross-border Financing issued on July 20, 2023, the limit for the total amount of foreign debt under the Macro-prudential Management Mode is adjusted to three times of their respective net assets.
Moreover, any medium or long-term loan to be provided by us to the consolidated variable interest entities or other domestic PRC entities must also be registered with the NDRC.
We may also decide to finance our wholly foreign-owned subsidiaries in the Chinese mainland by means of capital contributions. These capital contributions shall go through record-filing procedures from competent administration for market regulation. SAFE issued the Circular on the Management Concerning the Reform of the Payment and Settlement of Foreign Currency Capital of Foreign-Invested Enterprises, which took effect on June 1, 2015. This circular allows for the use of RMB converted from the foreign currency-denominated capital for equity investments in the PRC provided that such usage shall fall into the scope of business of the foreign-invested enterprise, which will be regarded as the reinvestment of foreign-invested enterprise. In addition, SAFE promulgated the Circular Regarding Further Promotion of the Facilitation of Cross-Border Trade and Investment on October 23, 2019, pursuant to which all foreign-invested enterprises can make equity investments in the PRC with their capital funds in accordance with the law. The Circular Regarding Further Optimizing the Cross-border RMB Policy to Support the Stabilization of Foreign Trade and Foreign Investment jointly promulgated by the People’s Bank of China, NDRC, the Ministry of Commerce, the State-owned Assets Supervision and Administration Commission of the State Council, the China Banking and Insurance Regulatory Commission and SAFE on December 31, 2020 and effective on February 4, 2021 allows the non-investment foreign-invested enterprises to make domestic reinvestment with RMB capital in accordance with the law on the premise that they comply with prevailing regulations and the invested projects in China are authentic and compliant. In addition, if a foreign-invested enterprise uses RMB income under capital accounts to conduct domestic reinvestment, the invested enterprise is not required to open a special deposit account for RMB capital.
Due to the restrictions imposed on loans in foreign currencies extended to any PRC domestic companies, we may not be able to make such loans to the subsidiaries of our wholly foreign-owned subsidiaries in the Chinese mainland and the consolidated variable interest entities in the Chinese mainland. Meanwhile, we may not be able to finance the activities of the consolidated variable interest entities by means of capital contributions given the restrictions on foreign investment in the businesses that are currently conducted by the consolidated variable interest entities.
In light of the various requirements imposed by PRC regulations on loans to and direct investment in PRC entities by offshore holding companies, we cannot assure you that we will be able to complete the necessary government registrations or record-filings on a timely basis, if at all, with respect to future loans to our PRC subsidiaries or any consolidated variable interest entity or future capital contributions by us to our wholly foreign-owned subsidiaries in the Chinese mainland. As a result, uncertainties exist as to our ability to provide prompt financial support to our PRC subsidiaries or consolidated variable interest entities when needed. If we fail to complete such registrations or record-filings, our ability to use foreign currency, including the proceeds we received from our initial public offering, and to capitalize or otherwise fund our PRC operations may be negatively affected, which could materially and adversely affect our liquidity and our ability to fund and expand our business.
64
Table of Contents
Contractual arrangements in relation to the consolidated variable interest entities may be subject to scrutiny by the PRC tax authorities and they may determine that we or the variable interest entities owe additional taxes, which could negatively affect our financial condition and the value of your investment.
Under applicable PRC laws and regulations, transactions among related parties may be subject to audit or challenge by the PRC tax authorities. If the PRC tax authorities deem the transactions between the PRC subsidiaries and the consolidated variable interest entities in China, and their respective shareholders were not entered into on an arm’s-length basis and resulted in deferral or underpayment in taxes, they are entitled to make special tax adjustments which might result in the increase of the variable interest entities’ tax liabilities. If the tax authorities conduct special tax adjustments, they might impose interest charges for the underpaid taxes. Our financial position could be adversely affected if the consolidated variable interest entities’ tax liabilities increase or if they are required to pay interest charge.
Our current corporate structure and business operations may be affected by the PRC Foreign Investment Law.
On March 15, 2019, the National People’s Congress promulgated the PRC Foreign Investment Law, which has become effective on January 1, 2020 and replaced the outgoing laws regulating foreign investment in China, namely, the PRC Equity Joint Venture Law, the PRC Cooperative Joint Venture Law and the Wholly Foreign-owned Enterprise Law, as well their implementation rules and ancillary regulations. See “Item 4.B. Information on the Company—Business Overview—Regulation—Regulation on Foreign Investment.”
Meanwhile, the Implementation Rules to the Foreign Investment Law came into effect as of January 1, 2020, which clarified and elaborated the relevant provisions of the Foreign Investment Law. However, uncertainties still exist in relation to interpretation and implementation of the Foreign Investment Law, especially in regard to, including, among other things, the nature of variable interest entities contractual arrangements and specific rules regulating the organization form of foreign-invested enterprises within the five-year transition period. While Foreign Investment Law does not define contractual arrangements as a form of foreign investment explicitly, it has a catch-all provision under definition of “foreign investment” that includes investments made by foreign investors in the PRC through other means as provided by laws, administrative regulations or the State Council, we cannot assure you that future laws and regulations will not provide for contractual arrangements as a form of foreign investment. Therefore, there can be no assurance that our control over the consolidated variable interest entities through contractual arrangements will not be deemed as foreign investment in the future. In the event that any possible implementing regulations of the Foreign Investment Law, any other future laws, administrative regulations or provisions deem contractual arrangements as a way of foreign investment, or if any of our operations through contractual arrangements is classified in the “restricted” or “prohibited” industry in the future “negative list” under the Foreign Investment Law, our contractual arrangements may be deemed as invalid and illegal, and we may be required to unwind the variable interest entity contractual arrangements and/or dispose of any affected business. Also, if future laws, administrative regulations or provisions mandate further actions to be taken with respect to existing contractual arrangements, we may face substantial uncertainties as to whether we can complete such actions in a timely manner, or at all. Furthermore, under the Foreign Investment Law, foreign investors or the foreign investment enterprise should be imposed legal liabilities for failing to report investment information in accordance with the requirements. In addition, the Foreign Investment Law provides that foreign invested enterprises established according to the existing laws regulating foreign investment may maintain their structure and corporate governance within a five-year transition period, which means that we may be required to adjust the structure and corporate governance of certain of our PRC subsidiaries in such transition period. Failure to take timely and appropriate measures to cope with any of these or similar regulatory compliance challenges could materially and adversely affect our current corporate structure, corporate governance, financial condition and business operations.
65
Table of Contents
Risks Related to Doing Business in China
Changes in China’s or global economic, political or social conditions or government policies could have a material and adverse effect on our business and operations.
Substantially all of our operations are located in China. Accordingly, our business, financial condition, results of operations and prospects may be influenced to a significant degree by political, economic and social conditions in China generally and by continued economic growth in China as a whole.
While the Chinese economy has experienced significant growth over the past decades, there can be no assurance that the growth would be maintained or equitable across sectors. The Chinese government has implemented various measures to encourage economic growth and guide the allocation of resources. Some of these measures may benefit the overall Chinese economy, but may not have the same effect on us.
In addition, the global macroeconomic environment is facing challenges. For example, health epidemics have caused significant downward pressure for the global economy. Furthermore, geopolitical tension and conflicts, energy crisis, inflation risk, interest rate increases, instability in the financial system, and the tightening of monetary policy by the U.S. Federal Reserve impose new challenges and uncertainties on the global economy. It is unclear whether these challenges and uncertainties will be contained or resolved, and what effects they may have on the global political and economic conditions in the long term.
Uncertainties with respect to the legal system in the Chinese mainland could adversely affect us.
We conduct our business primarily through our PRC subsidiaries and the consolidated variable interest entities in the Chinese mainland. Our operations in the Chinese mainland are governed by PRC laws and regulations. Our PRC subsidiaries are subject to laws and regulations applicable to foreign investment in the Chinese mainland. The PRC legal system is a civil law system based on written statutes. Unlike the common law system, prior court decisions may be cited for reference but have limited precedential value. The PRC legal system is evolving rapidly, and the interpretation and enforcement of many laws, regulations and rules may involves uncertainties.
From time to time, we may have to resort to administrative and court proceedings to enforce our legal rights. Any administrative and court proceedings may be time-consuming, resulting in substantial costs and diversion of resources and management attention. Since PRC administrative and court authorities may have significant discretion in interpreting and implementing statutory and contractual terms, it may be difficult to evaluate the outcome of administrative and court proceedings and the level of legal protection we enjoy. These uncertainties may impede our ability to enforce the contracts we have entered into and could materially and adversely affect our business and results of operations.
PRC government has significant oversight over the conduct of our business and it has recently indicated an intent to exert more oversight over offerings that are conducted overseas and/or foreign investment in China-based issuers. Any such action could significantly limit or completely hinder our ability to offer or continue to offer securities to investors and cause the value of such securities to significantly decline or be worthless.
We are subject to consumer protection laws that could require us to modify our current business practices and incur increased costs.
We are subject to numerous PRC laws and regulations that regulate retailers generally or govern online retailers specifically, such as the Consumer Protection Law. If these regulations were to change or if we, suppliers or third-party merchants on our marketplace were to violate them, the costs of certain products or services could increase, or we could be subject to fines or penalties or suffer reputational harm, which could reduce demand for the products or services offered on our mobile apps and websites and hurt our business and results of operations. For example, the amended Consumer Protection Law, which became effective in March 2014, further strengthens the protection of consumers and imposes more stringent requirements and obligations on business operators, especially on businesses that operate on the internet. Pursuant to the Consumer Protection Law, except for certain types of products, such as custom-made goods, fresh and perishable goods, consumers are generally entitled to return goods purchased within seven days upon receipt without giving any reasons if they purchased the goods over the internet. Consumers whose interests have been damaged due to their purchase of goods or acceptance of services on online marketplace platforms may claim damages from merchants or service providers. Where the operators of an online marketplace platform are unable to provide the real names, addresses and valid contact details of the merchants or service providers, the consumers may also claim damages from the operators of the online marketplace platforms. Operators of online marketplace platforms that know or should have known that merchants or service providers use their platforms to infringe upon the legitimate rights and interests of consumers but fail to take necessary measures must bear joint and several liability with the merchants or service providers. Moreover, if business operators deceive consumers or knowingly sell substandard or defective products, they should not only compensate consumers for their losses, but also pay additional damages equal to three times the price of the goods or services. Legal requirements are frequently changed and subject to interpretation, and we are unable to predict the ultimate cost of compliance with these requirements or their effect on our operations. We may be required to make significant expenditures or modify our business practices to comply with existing or future laws and regulations, which may increase our costs and materially limit our ability to operate our business.
66
Table of Contents
We may be adversely affected by the complexity and changes in PRC regulation of internet-related business and companies such as e-commerce business and internet platforms.
The PRC government extensively regulates the internet industry, including foreign ownership of, and the licensing and permit requirements pertaining to, companies in the internet industry. These internet-related laws and regulations are evolving, and their interpretation and enforcement involve significant uncertainties. As a result, in certain circumstances it may be difficult to determine what actions or omissions may be deemed to be in violation of applicable laws and regulations. Issues, risks and challenges relating to PRC government regulation of the internet industry include, but are not limited to, the following:
We only have control over our websites through contractual arrangements. We do not own the websites in the Chinese mainland due to the restriction of foreign investment in businesses providing value-added telecommunication services in the Chinese mainland, including internet information provision services. This may significantly disrupt our business, subject us to sanctions, compromise enforceability of related contractual arrangements, or have other harmful effects on us.
The evolving PRC regulatory system for the internet industry may lead to the establishment of new regulatory agencies. For example, in May 2011, the State Council announced the establishment of a new department, the Cyberspace Administration of China (with the involvement of the State Council Information Office, the MIIT, and the Ministry of Public Security). The primary role of this agency is to facilitate the policy-making and legislative development in this field to direct and coordinate with the relevant departments in connection with online content administration and to deal with cross-ministry regulatory matters in relation to the internet industry.
New laws and regulations may be promulgated that will regulate internet activities, including online retail and internet information service. If these new laws and regulations are promulgated, additional licenses may be required for our operations. If our operations do not comply with these new regulations at the time they become effective, or if we fail to obtain any licenses required under these new laws and regulations, we could be subject to penalties. For example, on February 25, 2023, the SAMR released the Administrative Measures for Internet Advertising, which came into effect on May 1, 2023 and replaced Interim Measures for the Administration of Internet Advertising. The Administrative Measures for Internet Advertising further strengthen the responsibilities of Internet platform operators and enhance their review obligation in Internet advertising activities. see “Item 4.B. Information on the Company—Business Overview—Regulation—Regulations relating to Advertising Business.” Any failure to comply with the Administrative Measures for Internet Advertising may result in administrative liabilities, including warnings, public denouncement, fines, enforcement orders requiring us to correct, suspension of business or even criminal liabilities, all of which may materially and adversely affect our business and results of operations.
The Circular on Strengthening the Administration of Foreign Investment in and Operation of Value-added Telecommunications Business, issued by the MIIT in July 2006, prohibits domestic telecommunication service providers from leasing, transferring or selling telecommunications business operating licenses to any foreign investor in any form, or providing any resources, sites or facilities to any foreign investor for their illegal operation of a telecommunications business in China. According to this circular, either the holder of a value-added telecommunication services operation permit or its shareholders must directly own the domain names and trademarks used by such license holders in their provision of value-added telecommunication services. The circular also requires each license holder to have the necessary facilities, including servers, for its approved business operations and to maintain such facilities in the regions covered by its license. If an ICP license holder fails to comply with the requirements and also fails to remedy such non-compliance within a specified period of time, the MIIT or its local counterparts have the discretion to take administrative measures against such license holder, including revoking its ICP license. Currently, Jingdong 360, one of the consolidated variable interest entities, holds an ICP license and operates our www.jd.com website. Jingdong 360 owns the domain names and registered trademarks and has the necessary personnel to operate such website.
67
Table of Contents
On February 7, 2021, the Anti-monopoly Commission of the State Council officially promulgated the Guidelines to Anti-Monopoly in the Field of Internet Platforms. Pursuant to an official interpretation from the Anti-monopoly Commission of the State Council, these guidelines mainly cover five aspects, including general provisions, monopoly agreements, abuse of market dominance, concentration of undertakings, and abuse of administrative powers that eliminate or restrict competition. These guidelines prohibit certain monopolistic acts of internet platforms to protect market competition and safeguard interests of users and undertakings participating in internet platform economy, including without limitation, prohibiting platforms with dominant position from abusing their market dominance. Notably, the guidelines provide that any concentration of undertakings involving variable interest entities fall within the scope of anti-monopoly review. If a concentration of undertakings meets the criteria for declaration as stipulated by the State Council, an operator must report such concentration of undertakings to the Anti-Monopoly Law of PRC (the “Anti-Monopoly Law”) enforcement agency under the State Council in advance. Therefore, acquisitions of other entities that we have made before or may make in the future (whether by ourselves, our subsidiaries or through the consolidated variable interest entities) and that meet the criteria for declaration, may be required to be reported to and approved by the Anti-Monopoly Law enforcement agency, and we may be subject to penalty including a fine of no more than RMB500,000 if we fail to comply with such requirement, and in extreme case may be ordered to terminate the contemplated concentration, to dispose of our equity or asset within a prescribed period, to transfer the business within a prescribed time or to take any other necessary measures to return to the pre-concentration status. In March 2021, SAMR imposed on us a fine of RMB500,000 for failing to file a prior notification of concentrations of undertaking for a prior acquisition we did. In addition, SAMR has conducted a survey of prior acquisitions by internet platforms that may involve failure to file prior notifications of concentrations of undertaking. We were subsequently imposed for fines for a few additional instances, each with similar amount on such basis since 2021. We cooperated with SAMR on this front and kept written and oral correspondence with SAMR. In April 2021, the SAMR, together with certain other PRC government authorities convened an administrative guidance meeting, focusing on certain unfair competition acts, self-inspection and rectification by major internet companies of possible violations of anti-monopoly, anti-unfair competition, tax and other related laws and regulations, and requesting such companies to comply with laws and regulations strictly and be subject to public supervision. In addition, many internet companies, including the over 30 companies which attended such administrative guidance meeting, are required to conduct a comprehensive self-inspection and make necessary rectification accordingly. If the companies are found to conduct illegal activities, more severe penalties are expected to be imposed on them in accordance with the laws. As of the date of this annual report, we have completed such self-inspection and have not received any further inquiry from the governmental authorities. We may receive more similar inquires going forward and cannot assure you that our business operations comply with the regulations and authorities’ requirements in all respects. If any non-compliance is raised by the authorities and determined against us, we may be subject to fines and other penalties. On June 24, 2022, the Standing Committee of the National People’s Congress issued the amended Anti-Monopoly Law, which came into effect on August 1, 2022. The amended PRC Anti-monopoly Law increases the fines on business operators for illegal concentration to “no more than ten percent of the preceding year’s sales revenue of the business operators if the concentration of business operators has or may have an effect of excluding or limiting competition; or a fine of up to RMB5 million if the concentration of business operators does not have an effect of excluding or limiting competition.” The newly amended Anti-Monopoly Law also specifies that the government authority may require the operators to make a declaration where there is evidence that the concentration has or may have the effect of eliminating or restricting competition, even if such concentration does not reach the filing threshold. Due to the enhanced enforcement of the Anti-Monopoly Law, we may receive greater scrutiny and attention from regulators and more frequent and rigid investigation or review by regulators, which will increase our compliance costs and subject us to heightened risks and challenges. In addition, there are significant uncertainties on the evolving legislative activities and varied local implementation practices of antimonopoly and competition laws and regulations in China, especially with respect to the interpretation and implementation of the newly amended Anti-Monopoly Law. We may have to spend much more personnel cost and time evaluating and managing these risks and challenges in connection with our products and services as well as our investments in our ordinary business course to avoid any failure to comply with these regulations. Any failure or perceived failure by us to comply with the guidelines and other Anti-Monopoly Laws and regulations may result in governmental investigations or enforcement actions, litigations or claims against us and could have an adverse effect on our business, financial condition and results of operations.
68
Table of Contents
The Interpretation and application of existing PRC laws, regulations and policies and possible new laws, regulations or policies relating to the internet industry have created substantial uncertainties regarding the legality of existing and future foreign investments in, and the businesses and activities of, internet businesses in China, including our business. We cannot assure you that we have obtained all the permits or licenses required for conducting our business in China or will be able to maintain our existing licenses or obtain new ones.
The PRC government’s significant oversight over our business operation could result in a material adverse change in our operations and the value of our ADSs and Class A ordinary shares.
We conduct our business primarily in China. Our operations in China are governed by PRC laws and regulations. The PRC government has significant oversight over the conduct of our business, and may intervene or influence our operations, which could result in a material adverse change in our operation and/or the value of our ADSs and Class A ordinary shares. Also, the PRC government has recently indicated an intent to exert more oversight and control over offerings that are conducted overseas and/or foreign investment in China-based issuers. For example, on July 6, 2021, the PRC government authorities made public the Opinions on Strictly Scrutinizing Illegal Securities Activities in Accordance with the Law. These opinions emphasized the need to strengthen the administration over illegal securities activities and the supervision on overseas listings by China-based companies and proposed to take effective measures, such as promoting the construction of regulatory systems to deal with the risks and incidents faced by China-based overseas-listed companies. On December 28, 2021, the NDRC, the MIIT, and several other administrations jointly published the Cybersecurity Review Measures, effective on February 15, 2022, which required that, among others, operators of “critical information infrastructure” purchasing network products and services or network platform operators carrying out data processing activities, that affect or may affect national security, shall apply with the Cybersecurity Review Office for a cybersecurity review. In addition, a network platform operator holding over one million users’ personal information shall apply with the Cybersecurity Review Office for a cybersecurity review before any public offering at a foreign stock exchange. On November 14, 2021, the CAC released the discussion draft of the Administrative Measures for Internet Data Security for public comments, which stipulates, among others, that a prior cybersecurity review is required for listing abroad of data processors which process over one million users’ personal information, and the listing of data processors in Hong Kong which affects or may affect national security. It remains uncertain how PRC governmental authorities will regulate overseas listing in general and whether we are required to obtain any specific regulatory approvals from the CSRC, CAC or any other PRC governmental authorities for our offshore offerings. If the CSRC, CAC or other regulatory agencies later promulgate new rules or explanations requiring that we obtain their approvals for our future offshore offerings, we may be unable to obtain such approvals in a timely manner, or at all, and such approvals may be rescinded even if obtained. Any such circumstance could significantly limit or completely hinder our ability to continue to offer securities to investors and cause the value of such securities to significantly decline or be worthless. In addition, implementation of industry-wide regulations directly targeting our operations could cause the value of our securities to significantly decline. Therefore, investors of our company and our business face potential uncertainty from actions taken by the PRC government affecting our business.
Failure to make adequate contributions to various employee benefit plans as required by PRC regulations may subject us to penalties.
Companies operating in the Chinese mainland are required to participate in various government sponsored employee benefit plans, including certain social insurance, housing funds and other welfare-oriented payment obligations, and contribute to the plans in amounts equal to certain percentages of salaries, including bonuses and allowances, of our employees up to a maximum amount specified by the local government from time to time at locations where we operate our businesses. The requirement of employee benefit plans has not been implemented consistently by the local governments in the Chinese mainland given the different levels of economic development in different locations. The government authorities may examine whether an employer has made adequate payments of the requisite employee benefit payments, and employers who fail to make adequate payments may be subject to late payment fees, fines and/or other penalties. Although almost all of our PRC operating entities incorporated in various locations in the Chinese mainland have made the required employee benefit payments, we cannot assure you that we are able to make adequate contribution in a timely manner at all time. If we are subject to late fees or fines in relation to the underpaid employee benefits, our financial condition and results of operations may be adversely affected.
69
Table of Contents
We may be required to register some operating offices as branch offices under PRC law.
Under PRC law, a company setting up premises for business operations outside its residence address must register them as branch offices with the local market regulation bureau at the place where the premises are located and obtain business licenses for them as branch offices. As of December 31, 2023, our comprehensive fulfillment facilities cover almost all the counties and districts across China. We may be required to register those operating offices outside of the residence addresses of our relevant PRC entities as branch offices under PRC law. As of the date of this annual report, we were able to register branch offices in all of the important locations where we had meaningful presence. Furthermore, we may expand our fulfillment network in the future to additional locations in China, and we may not be able to register branch offices in a timely manner due to complex procedural requirements and relocation of branch offices from time to time. If the PRC regulatory authorities determine that we are in violation of the applicable laws and regulations, we may be subject to penalties, including fines, confiscation of income and suspension of operation. If we become subject to these penalties, our business, results of operations, financial condition and prospects could be materially and adversely affected.
Regulation and censorship of information disseminated over the internet in China may adversely affect our business, and we may be liable for content that is displayed on our websites.
China has enacted laws and regulations governing internet access and the distribution of products, services, news, information, audio-video programs and other content through the internet. In the past, the PRC government has prohibited the distribution of information through the internet that it deems to be in violation of PRC laws and regulations. In November 2016, China promulgated the Cyber Security Law, which came into effect on June 1, 2017, to protect cyberspace security and order. Cyber Security Law tightens control of cyber security and sets forth various security protection obligations for network operators. If any of our internet information were deemed by the PRC government to violate any content restrictions, we would not be able to continue to display such content and could become subject to penalties, including confiscation of income, fines, suspension of business and revocation of required licenses, which could materially and adversely affect our business, financial condition and results of operations. We may also be subject to potential liability for any unlawful actions of our customers or users of our websites or for content we distribute that is deemed inappropriate. It may be difficult to determine the type of content that may result in liability to us, and if we are found to be liable, we may be prevented from operating our websites in China.
Fluctuations in exchange rates could have a material and adverse effect on our results of operations and the value of your investment.
The conversion of RMB into foreign currencies, including U.S. dollars, is based on rates set by the People’s Bank of China. The RMB has fluctuated against the U.S. dollar, at times significantly and unpredictably. The value of RMB against the U.S. dollar and other currencies is affected by changes in China’s political and economic conditions and by China’s foreign exchange policies, among other things. The RMB may fluctuate significantly in value against the U.S. dollar in the future. It is difficult to predict how market forces or PRC or U.S. government policy may impact the exchange rate between RMB and the U.S. dollar in the future.
Any significant appreciation or depreciation of RMB may materially and adversely affect our revenues, earnings and financial position, and the value of, and any dividends payable on, our Class A ordinary shares and/or ADSs. For example, to the extent that we need to convert U.S. dollars we receive into RMB to pay our operating expenses, appreciation of RMB against the U.S. dollar would have an adverse effect on the RMB amount we would receive from the conversion. Conversely, a significant depreciation of RMB against the U.S. dollar may significantly reduce the U.S. dollar equivalent of our earnings, which in turn could adversely affect the price of our Class A ordinary shares and/or ADSs.
We adopt a risk-neutral strategy to manage foreign exchange risks. For each entity with foreign exchange exposure, currency position or accounts balance are reallocated to achieve natural hedging. While we may enter into hedging transactions, the availability and effectiveness of these hedges may be limited and we may not be able to adequately hedge our exposure or at all. In addition, our currency exchange losses may be magnified by PRC exchange control regulations that restrict our ability to convert RMB into foreign currency. As a result, fluctuations in exchange rates may have a material adverse effect on your investment.
70
Table of Contents
It may be difficult for overseas regulators to conduct investigation or collect evidence within China.
Shareholder claims or regulatory investigation that are common in the United States generally are difficult to pursue as a matter of law or practicality in China. For example, in China, there are significant legal and other obstacles to providing information needed for regulatory investigations or litigation initiated outside China. Although the authorities in China may establish a regulatory cooperation mechanism with the securities regulatory authorities of another country or region to implement cross-border supervision and administration, such cooperation with the securities regulatory authorities in the Unities States may not be efficient in the absence of mutual and practical cooperation mechanism. Furthermore, according to Article 177 of the PRC Securities Law, which became effective in March 2020, no overseas securities regulator is allowed to directly conduct investigation or evidence collection activities within the territory of the PRC. While detailed interpretation of or implementation rules under Article 177 of the PRC Securities Law have yet to be promulgated, the inability for an overseas securities regulator to directly conduct investigation or evidence collection activities within China may further increase difficulties faced by you in protecting your interests.
Governmental regulation of currency conversion may limit our ability to utilize our revenues effectively and affect the value of your investment.
The PRC government imposes regulations on the convertibility of the RMB into foreign currencies and, in certain cases, the remittance of currency out of the Chinese mainland. We receive substantially all of our revenues in RMB. Under our current corporate structure, our company in the Cayman Islands may rely on dividend payments from our PRC subsidiaries to fund any cash and financing requirements we may have. Under existing PRC foreign exchange regulations, payments of current account items, such as profit distributions and trade and service-related foreign exchange transactions, can be made in foreign currencies without prior approval from SAFE by complying with certain procedural requirements. Therefore, our wholly foreign-owned subsidiaries in the Chinese mainland are able to pay dividends in foreign currencies to us without prior approval from SAFE, subject to the condition that the remittance of such dividends outside of the PRC complies with certain procedures under PRC foreign exchange regulation, such as the overseas investment registrations by our shareholders or the ultimate shareholders of our corporate shareholders who are PRC residents. But approval from or registration with appropriate government authorities or delegated banks is required where RMB is to be converted into foreign currency and remitted out of the Chinese mainland to pay capital expenses such as the repayment of loans denominated in foreign currencies. Although currently there are not equivalent or similar requirements in Hong Kong on cash transfers in, or out of, our Hong Kong entities (including currency conversion), if certain requirements in the Chinese mainland were to become applicable to cash transfers in and out of Hong Kong entities (including currency conversion) in the future, the funds in our Hong Kong entities, likewise, may not be available to meet our currency demand. If the foreign exchange control system prevents us from obtaining sufficient foreign currencies to satisfy our foreign currency demands, we may not be able to pay dividends in foreign currencies to our shareholders, including holders of our ADSs. As a result, the funds in our PRC subsidiaries or the consolidated variable interest entities in the Chinese mainland may not be available to fund operations or for other use outside of the Chinese mainland due to these requirements on currency conversion.
PRC regulations establish comprehensive procedures and requirements for some acquisitions of Chinese companies by foreign investors, which could make it more difficult for us to pursue growth through acquisitions in China.
PRC regulations and rules concerning mergers and acquisitions including the Regulations on Mergers and Acquisitions of Domestic Companies by Foreign Investors, established additional procedures and requirements that could make merger and acquisition activities by foreign investors more time consuming and complex. For example, the Regulations on Mergers and Acquisitions of Domestic Companies by Foreign Investors require that the Ministry of Commerce be notified in advance of any change-of-control transaction in which a foreign investor takes control of a PRC domestic enterprise, if (i) any important industry is concerned, (ii) such transaction involves factors that have or may have impact on the national economic security, or (iii) such transaction will lead to a change in control of a domestic enterprise which holds famous trademarks or PRC time-honored brands.
71
Table of Contents
In addition, the security review rules issued by the Ministry of Commerce that became effective in September 2011 specify that mergers and acquisitions by foreign investors that raise “national defense and security” concerns and mergers and acquisitions through which foreign investors may acquire de facto control over domestic enterprises that raise “national security” concerns are subject to strict review by the Ministry of Commerce, and the rules prohibit any activities attempting to bypass a security review, including by structuring the transaction through a proxy or contractual control arrangement. These laws and regulations are continually evolving as newly enacted Foreign Investment Law took effect. On December 19, 2020, the Measures for the Security Review for Foreign Investment was jointly issued by the NDRC and Ministry of Commerce and took effect from January 18, 2021. The Measures for the Security Review for Foreign Investment specified provisions concerning the security review mechanism on foreign investment, including the types of investments subject to review, review scopes and procedures, among others. As these measures are recently promulgated, official guidance has not been issued by the designated office in charge of such security review yet. At this stage, the interpretation of those measures remains unclear in many aspects such as what would constitute “important information technology and internet services and products” and whether these measures may apply to foreign investment that is implemented or completed before the enactment of these new measures. In the future, we may grow our business by acquiring complementary businesses. Complying with the requirements of the above-mentioned regulations and other applicable rules to complete such transactions could be time consuming, and any required approval processes may delay or inhibit our ability to complete such transactions. It is unclear whether our business would be deemed to be in an industry that raises “national defense and security” or “national security” concerns. However, the Ministry of Commerce, NDRC or other government agencies may publish explanations in the future determining that our business is in an industry subject to the security review, in which case our future acquisitions in the PRC, including those by way of entering into contractual control arrangements with target entities, may be closely scrutinized or prohibited. Our ability to expand our business or maintain or expand our market share through future acquisitions would as such be materially and adversely affected.
PRC regulations relating to the establishment of offshore special purpose companies by PRC residents may subject our PRC resident beneficial owners or our wholly foreign-owned subsidiaries in China to liability or penalties, limit our ability to inject capital into these subsidiaries, limit these subsidiaries’ ability to increase their registered capital or distribute profits to us, or may otherwise adversely affect us.
The Notice on Issues Relating to the Administration of Foreign Exchange in Fund-Raising and Round-Trip Investment Activities of Domestic Residents Conducted via Offshore Special Purpose Companies, or SAFE Circular 75, requires PRC residents to register with the relevant local branch of SAFE before establishing or controlling any company outside of China, referred to as an offshore special purpose company, for the purpose of raising funds from overseas to acquire or exchange the assets of, or acquiring equity interests in, PRC entities held by such PRC residents and to update such registration in the event of any significant changes with respect to that offshore company. SAFE promulgated the Circular on Relevant Issues Concerning Foreign Exchange Control on Domestic Residents’ Offshore Investment and Financing and Roundtrip Investment through Special Purpose Vehicles, or SAFE Circular 37, in July 2014, which replaced SAFE Circular 75. SAFE Circular 37 requires PRC residents to register with local branches of SAFE in connection with their direct establishment or indirect control of an offshore entity, for the purpose of overseas investment and financing, with such PRC residents’ legally owned assets or equity interests in domestic enterprises or offshore assets or interests, referred to in SAFE Circular 37 as a “special purpose vehicle.” The term “control” under SAFE Circular 37 is broadly defined as the operation rights, beneficiary rights or decision-making rights acquired by the PRC residents in the offshore special purpose vehicles or PRC companies by such means as acquisition, trust, proxy, voting rights, repurchase, convertible bonds or other arrangements. SAFE Circular 37 further requires amendment to the registration in the event of any changes with respect to the basic information of the special purpose vehicle, such as changes in a PRC resident individual shareholder, name or operation period; or any significant changes with respect to the special purpose vehicle, such as increase or decrease of capital contributed by PRC individuals, share transfer or exchange, merger, division or other material event. If the shareholders of the offshore holding company who are PRC residents do not complete their registration with the local SAFE branches, the PRC subsidiaries may be prohibited from distributing their profits and proceeds from any reduction in capital, share transfer or liquidation to the offshore company, and the offshore company may be restricted in its ability to contribute additional capital to its PRC subsidiaries. Moreover, failure to comply with SAFE registration and amendment requirements described above could result in liability under PRC law for evasion of applicable foreign exchange restrictions. In February 2015, SAFE issued the Circular on Further Simplifying and Improving the Policies Concerning Foreign Exchange Control on Direct Investment, which took effect on June 1, 2015. This circular has delegated to the qualified banks the authority to register all PRC residents’ investment in “special purpose vehicle” pursuant to SAFE Circular 37, except that those PRC residents who have failed to comply with SAFE Circular 37 will remain to fall into the jurisdiction of the local SAFE branch and must make their supplementary registration application with the local SAFE branch.
72
Table of Contents
We have requested PRC residents who we know hold direct or indirect interest in our company to make the necessary applications, filings and amendments as required under SAFE Circular 37 and other related rules. Mr. Richard Qiangdong Liu, our founder and beneficial owner, has completed required registrations with SAFE in relation to our financing and restructuring and will make amendments when needed and required in accordance with SAFE Circular 37. However, we may not be informed of the identities of all the PRC residents holding direct or indirect interest in our company, and we cannot provide any assurance that these PRC residents will comply with our request to make or obtain any applicable registrations or comply with other requirements under SAFE Circular 37 or other related rules. The failure or inability of our PRC resident shareholders to comply with the registration procedures set forth in these regulations may subject us to fines and legal sanctions, restrict our cross-border investment activities, limit the ability of our wholly foreign-owned subsidiaries in China to distribute dividends and the proceeds from any reduction in capital, share transfer or liquidation to us, and we may also be prohibited from injecting additional capital into these subsidiaries. Moreover, failure to comply with the various foreign exchange registration requirements described above could result in liability under PRC law for circumventing applicable foreign exchange restrictions. As a result, our business operations and our ability to distribute profits to you could be materially and adversely affected.
Any failure to comply with PRC regulations regarding the registration requirements for employee stock incentive plans may subject the PRC plan participants or us to fines and other legal or administrative sanctions.
Pursuant to the Notice on Issues Concerning the Foreign Exchange Administration for Domestic Individuals Participating in Stock Incentive Plan of Overseas Publicly Listed Company, issued by SAFE in February 2012, employees, directors, supervisors and other senior management participating in any stock incentive plan of an overseas publicly listed company who are PRC citizens or who are non-PRC citizens residing in China for a continuous period of not less than one year, subject to a few exceptions, are required to register with SAFE through a domestic qualified agent, which could be a PRC subsidiary of such overseas listed company, and complete certain other procedures. We and our directors, executive officers and other employees who are PRC citizens or who reside in the PRC for a continuous period of not less than one year and who have been granted restricted shares, restricted share units or options are subject to these regulations. Failure to complete the SAFE registrations may subject them to fines and legal sanctions and may also limit our ability to contribute additional capital into our wholly foreign-owned subsidiaries in China and limit these subsidiaries’ ability to distribute dividends to us. We also face regulatory uncertainties that could restrict our ability to adopt additional incentive plans for our directors and employees under PRC law.
Our business benefits from certain financial incentives and discretionary policies granted by local governments. Expiration of, or changes to, these incentives or policies would have an adverse effect on our results of operations.
In the past, local governments in China granted certain financial incentives from time to time to our PRC subsidiaries or consolidated variable interest entities as part of their efforts to encourage the development of local businesses. We received approximately RMB2,482 million, RMB2,773 million and RMB2,557 million (US$360 million) financial incentives from local governments relating to our business operations in 2021, 2022 and 2023, respectively. The timing, amount and criteria of government financial incentives are determined within the sole discretion of the local government authorities and cannot be predicted with certainty before we actually receive any financial incentive. We generally do not have the ability to influence local governments in making these decisions. Local governments may decide to reduce or eliminate incentives at any time. We cannot assure you of the continued availability of the government incentives currently enjoyed by our PRC subsidiaries or consolidated variable interest entities. Any reduction or elimination of incentives would have an adverse effect on our results of operations.
If we are classified as a PRC resident enterprise for PRC income tax purposes, such classification could result in unfavorable tax consequences to us and our non-PRC shareholders or ADS holders.
Under the PRC Enterprise Income Tax Law and its implementation rules, an enterprise established outside of the PRC with “de facto management body” within the PRC is considered a resident enterprise and will be subject to the enterprise income tax on its global income at the rate of 25%. The implementation rules define the term “de facto management body” as the body that exercises full and substantial control and overall management over the business, productions, personnel, accounts and properties of an enterprise. In April 2009, the State Taxation Administration issued a circular, known as Circular 82, which provides certain specific criteria for determining whether the “de facto management body” of a PRC-controlled enterprise that is incorporated offshore is located in China. Although this circular only applies to offshore enterprises controlled by PRC enterprises or PRC enterprise groups, not those controlled by PRC individuals or foreigners, the criteria set forth in the circular may reflect the State Taxation Administration’s general position on how the “de facto management body” text should be applied in determining the tax resident status of all offshore enterprises. According to Circular 82, an offshore incorporated enterprise controlled by a PRC enterprise or a PRC enterprise group will be regarded as a PRC tax resident by virtue of having its “de facto management body” in China and will be subject to PRC enterprise income tax on its global income only if all of the following conditions are met: (i) the primary location of the day-to-day operational management is in the PRC; (ii) decisions relating to the enterprise’s financial and human resource matters are made or are subject to approval by organizations or personnel in the PRC; (iii) the enterprise’s primary assets, accounting books and records, company seals, and board and shareholder resolutions, are located or maintained in the PRC; and (iv) at least 50% of voting board members or senior executives habitually reside in the PRC.
73
Table of Contents
We believe that none of JD.com, Inc. and its subsidiaries outside of the Chinese mainland is a PRC resident enterprise for PRC tax purposes. See “Item 10.E Additional Information—Taxation—People’s Republic of China Taxation.” However, the tax resident status of an enterprise is subject to determination by the PRC tax authorities and uncertainties remain with respect to the interpretation of the term “de facto management body.” If the PRC tax authorities determine that JD.com, Inc. or any of its subsidiaries outside of the Chinese mainland is a PRC resident enterprise for enterprise income tax purposes, they would be subject to a 25% enterprise income tax on their global income. If these entities derive income other than dividends from their wholly-owned subsidiaries in the Chinese mainland, a 25% enterprise income tax on their global income may increase our tax burden. If JD.com, Inc. or any of its subsidiaries outside of the Chinese mainland is classified as a PRC resident enterprise, dividends paid to it from its wholly-owned subsidiaries in the Chinese mainland may be regarded as tax-exempted income if such dividends are deemed to be “dividends between qualified PRC resident enterprises” under the PRC Enterprise Income Tax Law and its implementation rules. However, we cannot assure you that such dividends will not be subject to PRC withholding tax, as the PRC tax authorities, which enforce the withholding tax, have not yet issued guidance with respect to the processing of outbound remittances to entities that are treated as resident enterprises for PRC income tax purposes.
In addition, if JD.com, Inc. is classified as a PRC resident enterprise for PRC tax purposes and unless a tax treaty or similar arrangement provides otherwise, we may be required to withhold a 10% withholding tax from dividends we pay to our shareholders that are non-resident enterprises, including the holders of our ADSs. In addition, non-resident enterprise shareholders (including our ADS holders) may be subject to a 10% PRC withholding tax on gains realized on the sale or other disposition of ADSs or ordinary shares, if such income is treated as sourced from within the PRC. Furthermore, gains derived by our non-PRC individual shareholders from the sale of our shares and ADSs may be subject to a 20% PRC withholding tax. It is unclear whether our non-PRC individual shareholders (including our ADS holders) would be subject to any PRC tax on dividends obtained by such non-PRC individual shareholders in the event we are determined to be a PRC resident enterprise. If any PRC tax were to apply to such dividends, it would generally apply at a rate of 20% unless a reduced rate is available under an applicable tax treaty. However, it is also unclear whether non-PRC shareholders of JD.com, Inc. would be able to claim the benefits of any tax treaties between their country of tax residence and the PRC in the event that JD.com, Inc. is treated as a PRC resident enterprise.
Under the Arrangement Between the PRC and the Hong Kong Special Administrative Region on the Avoidance of Double Taxation and Prevention of Fiscal Evasion with Respect to Taxes on Income and Capital, the dividend withholding tax rate may be reduced to 5%, if a Hong Kong resident enterprise is considered a non-PRC tax resident enterprise and holds at least 25% of the equity interests in the PRC enterprise distributing the dividends. However, if the Hong Kong resident enterprise is not considered to be the beneficial owner of such dividends under applicable PRC tax regulations, such dividends may remain subject to withholding tax at a rate of 10%. In October 2009, the State Taxation Administration issued a circular, known as Circular 601, which provides guidance on determining whether an enterprise is a “beneficial owner” under China’s tax treaties and tax arrangements. Circular 601 provides that, in order to be a beneficial owner, an entity generally must be engaged in substantive business activities, and that a company that is set up for the purpose of avoiding or reducing taxes or transferring or accumulating profits will not be regarded as a beneficial owner and will not qualify for treaty benefits such as preferential dividend withholding tax rates. In February 2018, the State Taxation Administration issued a new circular, the Circular 9, to replace Circular 601, which came into effect on April 1, 2018. Circular 9 provides a more flexible framework in determining whether an applicant engages in substantive business activities. In addition, in the event that an enterprise does not satisfy the criteria for “beneficial owner,” but the person who holds 100% ownership interests in the enterprise directly or indirectly satisfies the criteria for “beneficial owner” and the circumstances fall under Circular 9, the enterprise will be deemed as a “beneficial owner.” If our Hong Kong subsidiaries are, in the light of Circular 9, considered to be a non-beneficial owner for purposes of the tax arrangement mentioned above, any dividends paid to them by our wholly foreign-owned PRC subsidiaries would not qualify for the preferential dividend withholding tax rate of 5%, but rather would be subject to a rate of 10%.
74
Table of Contents
We face uncertainties with respect to indirect transfers of equity interests in PRC resident enterprises by their non-PRC holding companies, and heightened scrutiny over acquisition transactions by the PRC tax authorities may have a negative impact on potential acquisitions we may pursue in the future.
The State Taxation Administration has issued several rules and notices to tighten the scrutiny over acquisition transactions in recent years, including the Notice on Strengthening Administration of Enterprise Income Tax for Share Transfers by Non-PRC Resident Enterprises issued in December 2009, the Notice on Several Issues Regarding the Income Tax of Non-PRC Resident Enterprises promulgated issued in March 2011, and the Notice on Certain Corporate Income Tax Matters on Indirect Transfer of Properties by Non-PRC Resident Enterprises issued in February 2015, or STA Circular 7. Pursuant to these rules and notices, if a non-PRC resident enterprise indirectly transfers PRC taxable properties, referring to properties of an establishment or a place in the PRC, real estate properties in the PRC or equity investments in a PRC tax resident enterprise, by disposing of equity interest in an overseas holding company, such indirect transfer should be deemed as a direct transfer of PRC taxable properties and gains derived from such indirect transfer may be subject to the PRC withholding tax at a rate of up to 10%. STA Circular 7 sets out several factors to be taken into consideration by tax authorities in determining whether an indirect transfer has a reasonable commercial purpose. An indirect transfer satisfying all the following criteria will be deemed to lack reasonable commercial purpose and be taxable under PRC law: (i) 75% or more of the equity value of the intermediary enterprise being transferred is derived directly or indirectly from the PRC taxable properties; (ii) at any time during the one-year period before the indirect transfer, 90% or more of the asset value of the intermediary enterprise (excluding cash) is comprised directly or indirectly of investments in the PRC, or 90% or more of its income is derived directly or indirectly from the PRC; (iii) the functions performed and risks assumed by the intermediary enterprise and any of its subsidiaries that directly or indirectly hold the PRC taxable properties are limited and are insufficient to prove their economic substance; and (iv) the foreign tax payable on the gain derived from the indirect transfer of the PRC taxable properties is lower than the potential PRC income tax on the direct transfer of such assets. Nevertheless, the indirect transfer falling into the safe harbor available under STA Circular 7 may not be subject to PRC tax and the scope of the safe harbor includes qualified group restructuring as specifically set out in STA Circular 7, public market trading and tax treaty exemptions.
In October 2017, the State Taxation Administration released the Public Notice Regarding Issues Concerning the Withholding of Non-resident Enterprise Income Tax at Source, or STA Public Notice 37, effective from December 2017. STA Public Notice 37 replaced a series of important circulars, including Notice on Strengthening Administration of Enterprise Income Tax for Share Transfers by Non-PRC Resident Enterprises, and revised the rules governing the administration of withholding tax on China-source income derived by a nonresident enterprise. STA Public Notice 37 provides for certain key changes to the previous withholding regime. For example, the withholding obligation for a non-resident enterprise deriving dividend arises on the date on which the payment is actually made rather than on the date of the resolution that declared the dividends.
Under STA Circular 7 and STA Public Notice 37, the entities or individuals obligated to pay the transfer price to the transferor are the withholding agents and must withhold the PRC income tax from the transfer price if the indirect transfer is subject to the PRC enterprise income tax. If the withholding agent fails to do so, the transferor should report to and pay the tax to the PRC tax authorities. In the event that neither the withholding agent nor the transferor fulfills their obligations under STA Circular 7 and STA Public Notice 37, according to the applicable law, apart from imposing penalties such as late payment interest on the transferor, the tax authority may also hold the withholding agent liable and impose a penalty of 50% to 300% of the unpaid tax on the withholding agent. The penalty imposed on the withholding agent may be reduced or waived if the withholding agent has submitted the relevant materials in connection with the indirect transfer to the PRC tax authorities in accordance with STA Circular 7.
However, as there is a lack of clear statutory interpretation, we face uncertainties on the reporting and consequences on future private equity financing transactions, share exchange or other transactions involving the transfer of shares in our company by investors that are non-PRC resident enterprises, or sale or purchase of shares in other non-PRC resident companies or other taxable assets by us. Our company and other non-resident enterprises in our group may be subject to filing obligations or being taxed if our company and other non-resident enterprises in our group are transferors in such transactions, and may be subject to withholding obligations if our company and other non-resident enterprises in our group are transferees in such transactions. For the transfer of shares in our company by investors that are non-PRC resident enterprises, our PRC subsidiaries may be requested to assist in the filing under the rules and notices. As a result, we may be required to expend valuable resources to comply with these rules and notices or to request the transferors from whom we purchase taxable assets to comply, or to establish that our company and other non-resident enterprises in our group should not be taxed under these rules and notices, which may have a material adverse effect on our financial condition and results of operations. There is no assurance that the tax authorities will not apply the rules and notices to our offshore restructuring transactions where non-PRC residents were involved if any of such transactions were determined by the tax authorities to lack reasonable commercial purpose. As a result, we and our non-PRC resident investors may be at risk of being taxed under these rules and notices and may be required to comply with or to establish that we should not be taxed under such rules and notices, which may have a material adverse effect on our financial condition and results of operations or such non-PRC resident investors’ investments in us. We have conducted acquisition transactions in the past and may conduct additional acquisition transactions in the future. We cannot assure you that the PRC tax authorities will not, at their discretion, adjust any capital gains and impose tax return filing obligations on us or require us to provide assistance for the investigation of PRC tax authorities with respect thereto. Heightened scrutiny over acquisition transactions by the PRC tax authorities may have a negative impact on potential acquisitions we may pursue in the future.
75
Table of Contents
Risks Related to Our ADSs and Class A Ordinary Shares
The trading price of our ADSs and Class A ordinary shares have been and are likely to continue to be volatile, which could result in substantial losses to holders of our Class A ordinary shares and/or ADSs.
The trading prices of our ADSs and Class A ordinary shares have been and are likely to continue to be volatile and could fluctuate widely in response to a variety of factors, many of which are beyond our control. For example, the highest and lowest closing prices of our ADSs on Nasdaq in 2023 were US$66.10 and US$24.38, respectively. Likewise, the highest and lowest closing prices of our Class A ordinary shares on the Hong Kong Stock Exchange in 2023 were HK$251.4 and HK$93.90, respectively. In addition, the performance and fluctuation of the market prices of other companies with business operations located mainly in China that have listed their securities in Hong Kong and/or the United States may affect the volatility in the prices of and trading volumes for our Class A ordinary shares and/or ADSs. The securities of some of these companies have experienced significant volatility since their initial public offerings, including, in some cases, substantial price declines in the trading prices of their securities. The trading performances of other Chinese companies’ securities after their offerings, including internet and e-commerce companies, may affect the attitudes of investors toward Chinese companies listed in Hong Kong and/or the United States, which consequently may impact the trading performance of our Class A ordinary shares and/or ADSs, regardless of our actual operating performance. In addition, any negative news or perceptions about inadequate corporate governance practices or fraudulent accounting, corporate structure or matters of other Chinese companies may also negatively affect the attitudes of investors towards Chinese companies in general, including us, regardless of whether we have conducted any inappropriate activities. Furthermore, securities markets may from time to time experience significant price and volume fluctuations that are not related to our operating performance, such as the large decline in share prices in the United States in early 2020, which may have a material and adverse effect on the trading price of our Class A ordinary shares and/or ADSs.
In addition to the above factors, the price and trading volume of our Class A ordinary shares and/or ADSs may be highly volatile due to multiple factors, including the following:
| • | regulatory developments affecting us or our industry, customers, suppliers or third-party merchants; |
| • | announcements of studies and reports relating to the quality of our product and service offerings or those of our competitors; |
| • | changes in the economic performance or market valuations of other online retail or e-commerce companies; |
| • | actual or anticipated fluctuations in our quarterly results of operations and changes or revisions of our expected results; |
| • | changes in financial estimates by securities research analysts; |
76
Table of Contents
| • | conditions in the online retail market; |
| • | announcements by us or our competitors of new product and service offerings, acquisitions, strategic relationships, joint ventures, capital raisings or capital commitments; |
| • | additions to or departures of our senior management; |
| • | political or market instability or disruptions, and actual or perceived social unrest in the United States, Hong Kong or other jurisdictions; |
| • | fluctuations of exchange rates among RMB, the Hong Kong dollar and the U.S. dollar; |
| • | release or expiry of lock-up or other transfer restrictions on our Class A ordinary shares or ADSs; |
| • | sales or perceived potential sales of additional Class A ordinary shares or ADSs; |
| • | any actual or alleged illegal acts of our senior management or other key employees; |
| • | any share repurchase program; and |
| • | proceedings instituted by the SEC against PRC-based accounting firms, including our independent registered public accounting firm. |
We adopt different practices as to certain matters as compared with many other companies listed on the Hong Kong Stock Exchange.
We completed our public offering in Hong Kong in June 2020 and the trading of our Class A ordinary shares on the Hong Kong Stock Exchange commenced on June 18, 2020 under the stock code “9618.” As a company listed on the Hong Kong Stock Exchange pursuant to Chapter 19C of the Hong Kong Listing Rules, we are not subject to certain provisions of the Hong Kong Listing Rules pursuant to Rule 19C.11, including, among others, rules on notifiable transactions, connected transactions, share option schemes, content of financial statements as well as certain other continuing obligations. In addition, in connection with the listing of our Class A ordinary shares on the Hong Kong Stock Exchange, we have applied for and been granted a number of waivers and/or exemptions from strict compliance with the Hong Kong Listing Rules, the Companies (Winding Up and Miscellaneous Provisions) Ordinance, the Takeovers Codes and the SFO. As a result, our practices as to those matters differ from other companies listed on the Hong Kong Stock Exchange that do not enjoy those exemptions or waivers.
Furthermore, if 55% or more of the total worldwide trading volume, by dollar value, of our Class A ordinary shares and ADSs over our most recent fiscal year takes place on the Hong Kong Stock Exchange, the Hong Kong Stock Exchange will regard us as having a dual primary listing in Hong Kong and we will no longer enjoy certain exemptions or waivers from strict compliance with the requirements under the Hong Kong Listing Rules, the Companies (Winding Up and Miscellaneous Provisions) Ordinance, the Takeovers Codes and the SFO, which could result in us having to amend our corporate structure and articles of association and our incurring of incremental compliance costs.
We cannot guarantee that any share repurchase program will be fully consummated or that any share repurchase program will enhance long-term shareholder value, and share repurchases could increase the volatility of the price of our Class A ordinary shares and/or ADSs and could diminish our cash reserves.
On March 17, 2020, our board of directors authorized a share repurchase program, under which we may repurchase up to US$2.0 billion of our ADSs or ordinary shares over the next 24 months through March 17, 2022. On December 29, 2021, our board of directors approved modifications to the share repurchase program adopted in March 2020, pursuant to which the repurchase authorization has increased from US$2.0 billion to US$3.0 billion and has been extended until March 17, 2024. In March 2024, our board of directors adopted a new share repurchase program that became effective on March 18, 2024, pursuant to which we may repurchase up to US$3.0 billion worth of our shares (including ADSs) over the next 36 months through March 2027. Our share repurchase program could affect the price of our stock and increase volatility and may be suspended or terminated at any time.
77
Table of Contents
If securities or industry analysts do not publish research or publish inaccurate or unfavorable research about our business, the market price for our Class A ordinary shares and/or ADSs and trading volume could decline.
The trading market for our Class A ordinary shares and/or ADSs will depend in part on the research and reports that securities or industry analysts publish about us or our business. If research analysts do not establish and maintain adequate research coverage or if one or more of the analysts who covers us downgrades our Class A ordinary shares and/or ADSs or publishes inaccurate or unfavorable research about our business, the market price for our Class A ordinary shares and/or ADSs would likely decline. If one or more of these analysts cease coverage of our company or fail to publish reports on us regularly, we could lose visibility in the financial markets, which, in turn, could cause the market price of or trading volume for our Class A ordinary shares and/or ADSs to decline.
You may need to rely on price appreciation of our Class A ordinary shares and/or ADSs for return on your investment due to our dividend policy.
Our board of directors has complete discretion as to whether to distribute dividends subject to our current memorandum and articles of association, which were adopted by a special resolution passed at the annual general meeting of our company held on June 21, 2023, and certain restrictions under Cayman Islands law. In addition, our shareholders may by ordinary resolution declare a dividend, but no dividend may exceed the amount recommended by our board of directors. Even if our board of directors decides to declare and pay dividends, the timing, amount and form of future dividends, if any, will depend on, among other things, our future results of operations and cash flow, our capital requirements and surplus, the amount of distributions, if any, received by us from our subsidiaries, our financial condition, contractual restrictions and other factors deemed relevant by our board of directors. Accordingly, the return on your investment in our Class A ordinary shares and/or ADSs will likely depend entirely upon any future price appreciation of our Class A ordinary shares and/or ADSs. There is no guarantee that our Class A ordinary shares and/or ADSs will appreciate in value or even maintain the price at which you purchased the Class A ordinary shares and/or ADSs. You may not realize a return on your investment in our Class A ordinary shares and/or ADSs and you may even lose your entire investment in our Class A ordinary shares and/or ADSs.
Substantial future sales or perceived potential sales of our Class A ordinary shares and/or ADSs in the public market could cause the price of our Class A ordinary shares and/or ADSs to decline.
Sales of our Class A ordinary shares and/or ADSs in the public market, or the perception that these sales could occur, could cause the market price of our Class A ordinary shares and/or ADSs to decline. Such sales also might make it more difficult for us to sell equity or equity-related securities in the future at a time and price that we deem appropriate. If any existing shareholder or shareholders sell a substantial amount of our Class A ordinary shares and/or ADSs, the prevailing market price for our Class A ordinary shares and/or ADSs could be adversely affected.
Holders of our ADSs may have fewer rights than holders of our ordinary shares and must act through the depositary to exercise those rights.
Holders of ADSs do not have the same rights of our shareholders and may only exercise the voting rights with respect to the underlying Class A ordinary shares represented by the ADSs in accordance with the provisions of the deposit agreement. Pursuant to the third amended and restated memorandum of association and articles of association of our company, or our current memorandum of association and articles of association, adopted on June 21, 2023, the minimum notice period required to convene a general meeting is 14 days, for as long as our Class A shares remain listed on the Hong Kong Stock Exchange. When a general meeting is convened, holders of ADSs may not receive sufficient notice of a shareholders’ meeting to permit withdrawal of the underlying Class A ordinary shares represented by their ADSs to allow them to cast their votes with respect to any specific matter. In addition, the depositary and its agents may not be able to send voting instructions to holders of ADSs or carry out your voting instructions in a timely manner. We will make all reasonable efforts to cause the depositary to extend voting rights to holders of ADSs in a timely manner, but we cannot assure that holders of ADSs will receive the voting materials in time to ensure that they can instruct the depositary to vote their ADSs. Furthermore, the depositary and its agents will not be responsible for any failure to carry out any instructions to vote, for the manner in which any vote is cast or for the effect of any such vote. As a result, holders of ADSs may not be able to exercise their right to vote and may lack recourse if the underlying ordinary shares represented by their ADSs are not voted as they requested. In addition, holders of ADSs will not be able to call a shareholders’ meeting.
78
Table of Contents
Except in limited circumstances, the depositary for our ADSs will give us a discretionary proxy to vote the Class A ordinary shares underlying the ADSs if holders of these ADSs do not vote at shareholders’ meetings, which could adversely affect the interests of the holders of our Class A ordinary shares and/or ADSs.
Under the deposit agreement for the ADSs, if you do not vote, the depositary will give us a discretionary proxy to vote the Class A ordinary shares underlying your ADSs at shareholders’ meetings unless:
| • | we have instructed the depositary that we do not wish a discretionary proxy to be given; |
| • | we have informed the depositary that there is substantial opposition as to a matter to be voted on at the meeting; |
| • | a matter to be voted on at the meeting would have a material adverse impact on shareholders; or |
| • | the voting at the meeting is to be made on a show of hands. |
The effect of this discretionary proxy is that holders of ADSs cannot prevent our underlying Class A ordinary shares represented by their ADSs from being voted, except under the circumstances described above. This may make it more difficult for shareholders to influence the management of our company. Holders of our ordinary shares are not subject to this discretionary proxy.
The right of our ADS holders to participate in any future rights offerings may be limited, which may cause dilution to holdings of our ADS holders.
We may from time to time distribute rights to our shareholders, including rights to acquire our securities. However, we cannot make rights available to holders of our ADSs in the United States unless we register both the rights and the securities to which the rights relate under the Securities Act or an exemption from the registration requirements is available. Under the deposit agreement, the depositary will not make rights available to ADS holders unless both the rights and the underlying securities to be distributed to ADS holders are either registered under the Securities Act or exempt from registration under the Securities Act. We are under no obligation to file a registration statement with respect to any such rights or securities or to endeavor to cause such a registration statement to be declared effective and we may not be able to establish a necessary exemption from registration under the Securities Act. Accordingly, our ADS holders may be unable to participate in our rights offerings and may experience dilution in their holdings.
Holders of our ADSs may not receive cash dividends if the depositary decides it is impractical to make them available to them.
The depositary will pay cash dividends on the ADSs only to the extent that we decide to distribute dividends on our Class A ordinary shares or other deposited securities. To the extent that there is a distribution, the depositary of our ADSs has agreed to pay to holders of our ADSs the cash dividends or other distributions it or the custodian receives on our Class A ordinary shares or other deposited securities after deducting its fees and expenses. ADS holders will receive these distributions in proportion to the number of Class A ordinary shares their ADSs represent. However, the depositary may, at its discretion, decide that it is inequitable or impractical to make a distribution available to any holders of ADSs. For example, the depositary may determine that it is not practicable to distribute certain property through the mail, or that the value of certain distributions may be less than the cost of mailing them. In these cases, the depositary may decide not to distribute such property to holders of our ADSs.
Holders of our ADSs may be subject to limitations on transfer of their ADSs.
Our ADSs are transferable on the books of the depositary. However, the depositary may close its transfer books at any time or from time to time when it deems expedient in connection with the performance of its duties. In addition, the depositary may refuse to deliver, transfer or register transfers of ADSs generally when our books or the books of the depositary are closed, or at any time if we or the depositary deems it advisable to do so because of any requirement of law or of any government or governmental body, or under any provision of the deposit agreement, or for any other reason.
79
Table of Contents
Certain judgments obtained against us by our shareholders may not be enforceable.
We are an exempted company with limited liability registered by way of continuation under the laws of the Cayman Islands. We primarily conduct our operations in the Chinese mainland and substantially all of our assets are located in the Chinese mainland. In addition, our directors and executive officers, and some of our experts reside within the Chinese mainland, and most of the assets of these persons are located within the Chinese mainland. As cross-border service of process is typically cumbersome and time-consuming, it may be difficult or impossible for you to effect service of process within the United States or Hong Kong upon us or these persons, or to bring an action against us or against these persons in the United States or Hong Kong in the event that you believe that your rights have been infringed under the U.S. federal securities laws, Hong Kong laws or otherwise. Even if you are successful in bringing an action of this kind, the laws of the Cayman Islands and of the PRC may render you unable to enforce a judgment against our assets or the assets of our directors and officers.
There is no statutory enforcement in the Cayman Islands of judgments obtained in the Hong Kong courts or federal or state courts of the United States (and the Cayman Islands are not a party to any treaties for the reciprocal enforcement or recognition of such judgments). A judgment obtained in such jurisdiction will be recognized and enforced in the courts of the Cayman Islands at common law, without any re-examination of the merits of the underlying dispute, by an action commenced on the foreign judgment debt in the Grand Court of the Cayman Islands, provided such judgment (a) is given by a foreign court of competent jurisdiction, (b) imposes on the judgment debtor a liability to pay a liquidated sum for which the judgment has been given, (c) is final and conclusive, (d) is not in respect of taxes, a fine or a penalty, (e) is not inconsistent with a Cayman Islands judgment in respect of the same matter, and (f) is not impeachable on the grounds of fraud and was not obtained in a manner and is not of a kind the enforcement of which is contrary to natural justice or the public policy of the Cayman Islands. However, the Cayman Islands courts are unlikely to enforce a judgment obtained from the U.S. or Hong Kong courts under civil liability provisions of the U.S. federal securities law or Hong Kong law if such judgment is determined by the courts of the Cayman Islands to give rise to obligations to make payments that are penal or punitive in nature. Because such a determination has not yet been made by a court of the Cayman Islands, it is uncertain whether such civil liability judgments from U.S. or Hong Kong courts would be enforceable in the Cayman Islands. A Cayman Islands court may stay enforcement proceedings if concurrent proceedings are being brought elsewhere.
The recognition and enforcement of foreign judgments are provided for under the PRC Civil Procedures Law. PRC courts may recognize and enforce foreign judgments in accordance with the requirements of the PRC Civil Procedures Law based either on treaties between China and the country where the judgment is made or on principles of reciprocity between jurisdictions. China does not have any treaties or other forms of reciprocity with the United States that provide for the reciprocal recognition and enforcement of foreign judgments. In addition, according to the PRC Civil Procedures Law, the PRC courts will not enforce a foreign judgment against us or our director and officers if they decide that the judgment violates the basic principles of PRC laws or national sovereignty, security or public interest. As a result, enforcement of a judgment rendered by a foreign court is subject to the judgment of PRC courts considering the foregoing factors.
Since we are a Cayman Islands exempted company, the rights of our shareholders may be more limited than those of shareholders of a company organized in the United States or Hong Kong.
Under the laws of some jurisdictions in the United States, majority and controlling shareholders generally have certain fiduciary responsibilities to the minority shareholders. Shareholder action must be taken in good faith, and actions by controlling shareholders which are obviously unreasonable may be declared null and void. Cayman Islands law protecting the interests of minority shareholders may not be as protective in all circumstances as the law protecting minority shareholders in some U.S. jurisdictions. In addition, the circumstances in which a shareholder of a Cayman Islands company may sue the company derivatively, and the procedures and defenses that may be available to the company, may result in the rights of shareholders of a Cayman Islands company being more limited than those of shareholders of a company organized in the United States.
Furthermore, our directors have the power to take certain actions without shareholder approval which would require shareholder approval under Hong Kong law or the laws of most U.S. jurisdictions. Subject to provisions of the memorandum and articles of association, the directors of a Cayman Islands company, without shareholder approval, may implement a sale of any assets, property, part of the business, or securities of the company. Our ability to create and issue new classes or series of shares without shareholders’ approval could have the effect of delaying, deterring or preventing a change in control without any further action by our shareholders, including a tender offer to purchase our ordinary shares at a premium over then current market prices.
80
Table of Contents
Furthermore, our articles of association are specific to us and include certain provisions that may be different from common practices in Hong Kong, such as the absence of requirements that the appointment, removal and remuneration of auditors must be approved by a majority of our shareholders.
Our current memorandum and articles of association contains anti-takeover provisions that could discourage a third party from acquiring us and adversely affect the rights of holders of our Class A ordinary shares and/or ADSs.
Our current memorandum and articles of association contain certain provisions that could limit the ability of others to acquire control of our company, including a dual-class voting structure that gives disproportionate voting power to the Class B ordinary shares held by Max Smart Limited, a company beneficially owned through a trust wholly-owned by our chairman, Mr. Richard Qiangdong Liu and of which he is the sole director, and those held by Fortune Rising Holdings Limited of which Mr. Liu is the sole shareholder and sole director. As of March 31, 2024, Mr. Liu beneficially owned 70.5% of the aggregate voting power of our company, including 3.8% of the aggregate voting power of our company that he may exercise on behalf of Fortune Rising Holdings Limited. Fortune Rising Holdings Limited holds the shares for the purpose of transferring such shares to the plan participants according to our awards under our share incentive plans, and administers the awards and acts according to our instruction. In addition, our current memorandum and articles of association also contains a provision that grants authority to our board of directors to establish and issue from time to time one or more series of preferred shares without action by our shareholders and to determine, with respect to any series of preferred shares, the terms and rights of that series. These provisions could have the effect of depriving our shareholders of the opportunity to sell their shares at a premium over the prevailing market price by discouraging third parties from seeking to obtain control of our company in a tender offer or similar transactions.
We are a foreign private issuer within the meaning of the rules under the Exchange Act, and as such we are exempt from certain provisions applicable to U.S. domestic public companies.
Because we qualify as a foreign private issuer under the Exchange Act, we are exempt from certain provisions of the securities rules and regulations in the United States that are applicable to U.S. domestic issuers, including:
| • | the rules under the Exchange Act requiring the filing with the SEC of quarterly reports on Form 10-Q or current reports on Form 8-K; |
| • | the sections of the Exchange Act regulating the solicitation of proxies, consents, or authorizations in respect of a security registered under the Exchange Act; |
| • | the sections of the Exchange Act requiring insiders to file public reports of their stock ownership and trading activities and liability for insiders who profit from trades made in a short period of time; and |
| • | the selective disclosure rules by issuers of material nonpublic information under Regulation FD. |
We are required to file an annual report within four months of the end of each fiscal year. In addition, we intend to publish our results on a quarterly basis as press releases, distributed pursuant to the rules and regulations of Nasdaq. We will also furnish press releases relating to financial results and material events to the SEC on Form 6-K. However, the information we are required to file with or furnish to the SEC will be less extensive and less timely compared to that required to be filed with the SEC by U.S. domestic issuers. As a result, you may not be afforded the same protections or information that would be made available to you were you investing in a U.S. domestic issuer.
81
Table of Contents
As a Cayman Islands exempted company, we are permitted to adopt certain home country practices in relation to corporate governance matters that differ significantly from Nasdaq corporate governance listing standards; these practices may afford less protection to shareholders than they would enjoy if we complied fully with Nasdaq corporate governance listing standards.
As a Cayman Islands exempted company listed on Nasdaq, we are subject to Nasdaq corporate governance listing standards. However, Nasdaq rules permit a foreign private issuer like us to follow the corporate governance practices of its home country. Certain corporate governance practices in the Cayman Islands, which is our home country, may differ significantly from Nasdaq corporate governance listing standards. For example, neither the Companies Act (As Revised) of the Cayman Islands nor our current memorandum and articles of association requires a majority of our directors to be independent and we could include non-independent directors as members of our compensation committee and nominating committee, and our independent directors would not necessarily hold regularly scheduled meetings at which only independent directors are present. If we choose to follow certain home country practice in the future, our shareholders may be afforded less protection than they otherwise would under Nasdaq corporate governance listing standards applicable to U.S. domestic issuers.
We may be classified as a passive foreign investment company for United States federal income tax purposes, which could subject United States investors in the ADSs or ordinary shares to significant adverse tax consequences.
A non-United States corporation, such as our company, will be classified as a PFIC for United States federal income tax purposes for any taxable year, if either (i) 75% or more of its gross income for such year consists of certain types of “passive” income or (ii) 50% or more of the value of its assets (generally determined on the basis of a quarterly average) during such year produce or are held for the production of passive income.
Although the law in this regard is unclear, we treat the consolidated variable interest entities as being owned by us for United States federal income tax purposes because we control their management decisions and we are entitled to substantially all of the economic benefits, and, as a result, we consolidate their results of operations in our U.S. GAAP financial statements and treat them as being owned by us for United States federal income tax purposes. If it were determined, however, that we are not the owner of the consolidated variable interest entities for United States federal income tax purposes, we may be treated as a PFIC for our taxable year ended December 31, 2023 and in future taxable years.
Based on our current income and assets and the value of our ADSs and outstanding ordinary shares, we do not believe that we were a PFIC for our taxable year ended December 31, 2023, and we do not expect to be classified as a PFIC in the current taxable year or the foreseeable future. Because PFIC status is a fact-intensive determination, no assurance can be given that we will not be classified as a PFIC for that year. While we do not anticipate becoming a PFIC, changes in the composition of our income or assets, or fluctuations in the market price of our Class A ordinary shares and/or ADSs, may cause us to become a PFIC for future taxable years. In estimating the value of our goodwill and other unbooked intangibles, we have taken into account our market capitalization, which may fluctuate over time. Among other factors, if our market capitalization subsequently declines, we may be or become classified as a PFIC for the current or future taxable years. Under circumstances where revenues from activities that produce passive income significantly increase relative to our revenues from activities that produce non-passive income or where we determine not to deploy significant amounts of cash for working capital or other purposes, our risk of becoming classified as a PFIC may substantially increase.
If we were to be or become a PFIC for any taxable year during which a U.S. Holder (as defined in “Item 10.E. Additional Information—Taxation—United States Federal Income Tax Considerations”) holds our ADSs or ordinary shares, certain adverse U.S. federal income tax consequences could apply to such U.S. Holder. See “Item 10.E. Additional Information—Taxation—United States Federal Income Tax Considerations.”
The different characteristics of the capital markets in Hong Kong and the U.S. may negatively affect the trading prices of our ADSs and Class A ordinary shares.
As a dual-listed company, we are subject to Hong Kong and Nasdaq listing and regulatory requirements concurrently. The Hong Kong Stock Exchange and Nasdaq have different trading hours, trading characteristics (including trading volume and liquidity), trading and listing rules, and investor bases (including different levels of retail and institutional participation). As a result of these differences, the trading prices of our ADSs and our Class A ordinary shares may not be the same, even allowing for currency differences. Fluctuations in the price of our ADSs due to circumstances peculiar to the U.S. capital markets could materially and adversely affect the price of our Class A ordinary shares, or vice versa. Certain events having significant negative impact specifically on the U.S. capital markets may result in a decline in the trading price of our Class A ordinary shares notwithstanding that such event may not impact the trading prices of securities listed in Hong Kong generally or to the same extent, or vice versa.
82
Table of Contents
Exchange between our Class A ordinary shares and our ADSs may adversely affect the liquidity and/or trading price of each other.
Our ADSs are currently traded on Nasdaq. Subject to compliance with U.S. securities law and the terms of the deposit agreement, holders of our Class A ordinary shares may deposit Class A ordinary shares with the depositary in exchange for the issuance of our ADSs. Any holder of ADSs may also withdraw the underlying Class A ordinary shares represented by the ADSs pursuant to the terms of the deposit agreement for trading on the Hong Kong Stock Exchange. In the event that a substantial number of Class A ordinary shares are deposited with the depositary in exchange for ADSs or vice versa, the liquidity and trading price of our Class A ordinary shares on the Hong Kong Stock Exchange and our ADSs on Nasdaq may be adversely affected.
The time required for the exchange between Class A ordinary shares and ADSs might be longer than expected and investors might not be able to settle or effect any sale of their securities during this period, and the exchange of Class A ordinary shares into ADSs involves costs.
There is no direct trading or settlement between Nasdaq and the Hong Kong Stock Exchange on which our ADSs and our Class A ordinary shares are respectively traded. In addition, the time differences between Hong Kong and New York and unforeseen market circumstances or other factors may delay the deposit of Class A ordinary shares in exchange of ADSs or the withdrawal of Class A ordinary shares underlying the ADSs. Investors will be prevented from settling or effecting the sale of their securities during such periods of delay. In addition, there is no assurance that any exchange of Class A ordinary shares into ADSs (and vice versa) will be completed in accordance with the timelines investors may anticipate.
Furthermore, the depositary for the ADSs is entitled to charge holders fees for various services including for the issuance of ADSs upon deposit of Class A ordinary shares, cancelation of ADSs, distributions of cash dividends or other cash distributions, distributions of ADSs pursuant to share dividends or other free share distributions, distributions of securities other than ADSs and annual service fees. As a result, shareholders who exchange Class A ordinary shares into ADSs, and vice versa, may not achieve the level of economic return the shareholders may anticipate.
We are exposed to risks associated with the potential spin-off of one or more of our businesses.
We are exposed to risks associated with the potential spin-off of one or more of our businesses. On December 8, 2020, we completed the spin-off and listing of JD Health, a consolidated subsidiary of our company, on the Main Board of the Hong Kong Stock Exchange. On May 28, 2021, we completed the spin-off and listing of JD Logistics, a consolidated subsidiary of our company, on the Main Board of the Hong Kong Stock Exchange. On March 30, 2023, each of JD Property and JD Industrials, through their respective joint sponsors, submitted a listing application form (Form A1) to the Hong Kong Stock Exchange to apply for the listing of, and permission to deal in, their respective shares on the Main Board of the Hong Kong Stock Exchange. There is no assurance as to whether or when any of the proposed listings may take place. We may continue to explore the ongoing financing requirements for our various other businesses and may consider a spin-off listing for one or more of those businesses. We cannot assure you that any spin-off will ultimately be consummated, any such spin-off will be subject to market conditions at the time and approval by the listing committee of the Hong Kong Stock Exchange or other equivalent regulatory agencies. In the event that we proceed with a spin-off, our interest in the entity to be spun-off (and its corresponding contribution to the financial results of our company) will be reduced accordingly.
83
Table of Contents
An active trading market for our Class A ordinary shares on the Hong Kong Stock Exchange might not develop or be sustained and trading prices of our Class A ordinary shares might fluctuate significantly.
Since the listing of our Class A ordinary shares on the Hong Kong Stock Exchange, we have consistently been an actively-traded company on the Hong Kong Stock Exchange. However, we cannot assure you that an active trading market for our ordinary shares on the Hong Kong Stock Exchange will be sustained. The trading price or liquidity for our ADSs on Nasdaq might not be indicative of those of our Class A ordinary shares on the Hong Kong Stock Exchange. If an active trading market of our ordinary shares on the Hong Kong Stock Exchange is not sustained, the market price and liquidity of our ordinary shares could be materially and adversely affected.
In 2014, the Hong Kong, Shanghai and Shenzhen Stock Exchanges collaborated to create an inter-exchange trading mechanism called Stock Connect that allows international and mainland Chinese investors to trade eligible equity securities listed in each other’s markets through the trading and clearing facilities of their home exchange. Stock Connect currently covers over 2,000 equity securities trading in the Hong Kong, Shanghai and Shenzhen markets. Stock Connect allows mainland Chinese investors to trade directly in eligible equity securities listed on the Hong Kong Stock Exchange, known as Southbound Trading; without Stock Connect, mainland Chinese investors would not otherwise have a direct and established means of engaging in Southbound Trading. In October 2019, the Shanghai and Shenzhen Stock Exchanges separately announced their amended implementation rules in connection with Southbound Trading to include shares of companies of a dual-class voting structure to be traded through Stock Connect. However, since these rules are relatively new, there remains uncertainty as to the implementation details, especially with respect to shares of those companies with a secondary listing on the Hong Kong Stock Exchange. It is unclear whether and when the Class A ordinary shares of our company, which has a dual-class voting structure with a secondary listing in Hong Kong, will be eligible to be traded through Stock Connect, if at all. The ineligibility or any delay of our Class A ordinary shares for trading through Stock Connect will affect mainland Chinese investors’ ability to trade our Class A ordinary shares and therefore may limit the liquidity of the trading of our Class A ordinary shares on the Hong Kong Stock Exchange.
There is uncertainty as to whether Hong Kong stamp duty will apply to the trading or conversion of our ADSs.
In connection with our initial public offering of Class A ordinary shares in Hong Kong, we have established a branch register of members in Hong Kong, which we refer to as our Hong Kong share register. Our Class A ordinary shares that are traded on the Hong Kong Stock Exchange, including those that were issued in our initial public offering of Class A ordinary shares in Hong Kong and those that may be converted from ADSs, are registered on our Hong Kong share register, and the trading of these Class A ordinary shares on the Hong Kong Stock Exchange will be subject to the Hong Kong stamp duty. To facilitate conversion between ADSs and ordinary shares and trading between Nasdaq and the Hong Kong Stock Exchange, we also moved a portion of our issued Class A ordinary shares from our register of members maintained in the Cayman Islands to our Hong Kong share register.
Under the Hong Kong Stamp Duty Ordinance, any person who effects any sale or purchase of Hong Kong stock, defined as stock the transfer of which is required to be registered in Hong Kong, is required to pay Hong Kong stamp duty. The stamp duty is currently set at 0.13% (rounded up to the nearest dollar) on the value of the transaction, on both the buyer and the seller.
To the best of our knowledge, Hong Kong stamp duty has not been levied in practice on the trading or conversion of ADSs of companies that are listed in both the United States and Hong Kong and that have maintained all or a portion of their ordinary shares, including ordinary shares underlying ADSs, in their Hong Kong share registers. However, it is unclear whether, as a matter of Hong Kong law, the trading or conversion of ADSs of these dual-listed companies constitutes a sale or purchase of the underlying Hong Kong-registered ordinary shares that is subject to Hong Kong stamp duty. We advise investors to consult their own tax advisors on this matter. If Hong Kong stamp duty is determined by the competent authority to apply to the trading or conversion of our ADSs, the trading price and the value of your investment in our Class A ordinary shares and/or ADSs may be affected.
84
Table of Contents
| Item 4. | Information on the Company |
| A. | History and Development of the Company |
Our Corporate History
Our chairman, Mr. Richard Qiangdong Liu, launched an online retail website in January 2004. He subsequently formed a company in Beijing and another company in Shanghai and conducted his online retail business through these two companies. In April 2007, we established a wholly-owned PRC subsidiary, Beijing Jingdong Century Trade Co., Ltd., or Jingdong Century, and we acquired certain intellectual property rights from the two companies Mr. Liu had established earlier, which ceased business operations and were later liquidated and dissolved.
In November 2006, we incorporated Star Wave Investments Holdings Limited under the laws of the British Virgin Islands as our offshore holding company in order to facilitate international financing. We later changed the name of this entity to 360buy Jingdong Inc. In January 2014, 360buy Jingdong Inc. was redomiciled in the Cayman Islands as an exempted company registered under the laws of the Cayman Islands, and was renamed JD.com, Inc.
We have established subsidiaries inside and outside of China and assisted in establishing PRC consolidated variable interest entities to conduct our business operations.
The significant subsidiaries that conduct business operations in China include, among others, the following:
| • | Jingdong Century, established in April 2007, and certain of its subsidiaries in China, which primarily engage in retail business; |
| • | Shanghai Shengdayuan Information Technology Co., Ltd., or Shanghai Shengdayuan, which was established in April 2011 and primarily operates our online marketplace business; and |
| • | Xi’an Jingxundi Supply Chain Technology Co., Ltd., or Xi’an Jingxundi, which was established in May 2017 and primarily provides technology and consulting services relating to logistics services. |
The significant consolidated variable interest entities and their subsidiaries that conduct our business operations in China include, among others, the following:
| • | Jingdong 360, which was established in April 2007 and holds our ICP license as an internet information provider and operates our www.jd.com website; |
| • | Jiangsu Yuanzhou, which was established in September 2010 and primarily engages in the business of selling books, audio and video products; |
| • | Xi’an Jingdong Xincheng, which was established in June 2017 and primarily provides technology and consulting services relating to logistics services; |
| • | Jiangsu Jingdong Bangneng, which was established in August 2015 and primarily engages in the business of investment management; and |
| • | Suqian Juhe, which was established in June 2020 and primarily provides enterprise management services. |
We also conduct certain of our business operations through other consolidated variable interest entities and their subsidiaries, including Suqian Jingdong Tianning Jiankang Technology Co., Ltd., or Suqian Jingdong Tianning, which was established in June 2019 and primarily provides pharmacy sales and healthcare services in connection with JD Health’s operations.
On May 22, 2014, our ADSs commenced trading on Nasdaq under the symbol “JD.”
Our Class A ordinary shares have been listed on the Hong Kong Stock Exchange since June 18, 2020 under the stock code “9618.” Our RMB counter was launched and became effective since June 7, 2023 under the stock code “89618.”
85
Table of Contents
Our Strategic Cooperations
Strategic Cooperation with Tencent
On March 10, 2014, we acquired certain e-commerce businesses and assets from, and entered into a strategic cooperation agreement and formed a strategic partnership with Tencent, a leading internet company serving the largest online community in China. Tencent offers a wide variety of internet services in China, including social communications, online games and digital content and payment. Under the strategic partnership, Tencent offers us prominent access points in its mobile apps Weixin and Mobile QQ and provide us with traffic and other support from other key platforms, which has helped us generate mobile user traffic from Tencent’s large mobile user base and enhance our customers’ mobile shopping experience. The two parties agree to cooperate in a number of areas including mobile-related products, social networking services, membership systems and payment solutions. The strategic cooperation agreement applies within the territory of China. Under the strategic cooperation agreement, we are Tencent’s preferred partner for all physical goods e-commerce businesses, and Tencent agrees not to engage in any retail or managed marketplace business model in physical goods e-commerce businesses in China and a few selected international markets for a period of eight years, other than through its controlled affiliate, Shanghai Icson E-Commerce Development Company Limited.
On May 10, 2019, we renewed the strategic cooperation agreement with Tencent for a period of three years starting from May 27, 2019. Tencent continued to offer us prominent Level I and Level II access points on its Weixin platform to provide traffic support, and the two companies continued to cooperate in a number of areas including communications, advertising and membership services, among others. Such traffic support, advertising spending and other cooperation amounted to over US$800 million, which was paid or spent over the next three years. We agreed to issue to Tencent a certain number of our Class A ordinary shares for a total consideration of approximately US$250 million at prevailing market prices at certain predetermined dates during the subsequent three-year period, of which 8,127,302, 2,938,584 and 1,914,998 of our Class A ordinary shares were issued in May 2019, May 2020 and June 2021, respectively. The issuance of Class A ordinary shares of US$250 million formed part of the total amount of US$800 million that was paid or spent for the traffic support, advertising and other cooperation from Tencent under the strategic cooperation agreement.
On March 25, 2022, Tencent completed a distribution of approximately 460 million Class A ordinary shares of our company owned by Tencent to its shareholders. Following the distribution, Tencent’s shareholding in us was below 5% pursuant to a 13G amendment file by Tencent Holdings Limited and Huang River Investment Limited with the SEC on March 30, 2022 and the shareholders of Tencent who receive our shares in the distribution have become our shareholders. We and Tencent continue to maintain our mutually beneficial business relationship, including our ongoing strategic partnership agreement. On June 29, 2022, we renewed the strategic cooperation agreement with Tencent for another period of three years. Tencent continues to offer us prominent Level I and Level II access points on its Weixin platform to provide traffic support, and we also continue to cooperate in a number of areas including communications, technology services, marketing and advertising, and membership services, among others. The value of such cooperation is to be paid or spent in cash and in the form of our shares combined over the next three years. As a part of the total consideration, we agreed to issue to Tencent a certain number of our Class A ordinary shares for a consideration of up to US$220 million by reference to prevailing market prices at certain predetermined dates during the three-year period, of which 2,164,326 and 3,761,270 of our Class A ordinary shares were issued in July 2022 and May 2023, respectively. The two parties are leveraging this mutually beneficial partnership to provide better and more convenient shopping experience for users.
Strategic Cooperation with Walmart
In June 2016, we entered into a series of agreements with Walmart Inc., or Walmart, in relation to our strategic alliance, pursuant to which Walmart subscribed for 144,952,250 of our newly issued Class A ordinary shares. As of March 31, 2024, Walmart held Class A ordinary shares representing approximately 9.4% of our total issued and outstanding shares. As part of our strategic alliance with Walmart, we acquired ownership of the Yihaodian marketplace platform assets, including the Yihaodian brand, mobile apps and websites. We have collaborated with Walmart on e-commerce, including launching Sam’s Club Flagship Store and Walmart Flagship Store on www.jd.com website, as well as Sam’s Club Global Flagship Store, Walmart Global Flagship Store, ASDA Flagship Store and several category global stores to sell specific category products (for example Walmart Beauty and Personal Care Global Store) on JD Worldwide and a one-hour delivery service from Walmart Stores and Sam’s Clubs in select cities through the JD Daojia app. As part of the strategic alliance, we also entered into an eight-year non-compete arrangement with Walmart, subject to certain conditions and exceptions.
86
Table of Contents
Developments of Our Subsidiaries
JD Logistics
JD Logistics is a leading technology-driven supply chain solutions and logistics services provider, and its shares are listed on the Main Board of the Hong Kong Stock Exchange. JD Logistics has been operating as an internal logistics department of us since 2007 and as a stand-alone business segment since April 2017. JD Logistics offers a full spectrum of supply chain solutions and high-quality logistics services enabled by technology, ranging from warehousing to distribution, spanning across manufacturing to end-customers, covering regular and specialized items. On May 28, 2021, shares of JD Logistics commenced trading on the Main Board of the Hong Kong Stock Exchange under the stock code “2618.” JD Logistics raised from the global offering in connection with the listing in Hong Kong approximately RMB22.9 billion in net proceeds after deducting underwriting commissions, share issuance costs and the offering expenses. JD Logistics remains our consolidated subsidiary after its listing.
In August 2020, JD Logistics acquired a controlling interest in Kuayue-Express a renowned modern integrated express transportation enterprise specializing in “limited-time express service” in China, for a total consideration of approximately RMB3 billion through a combination of acquiring existing shares and subscribing for newly issued shares of Kuayue Express.
In March 2022, JD Logistics entered into a series of agreements in relation to the proposed acquisition of Deppon Logistics Co., Ltd (“Deppon”). Pursuant to the transaction agreements, JD Logistics would acquire approximately 99.99% of the equity interest in Ningbo Meishan Baoshui Area Deppon Investment Holding Company Limited, or Deppon Holdco, which in turn holds a total of approximately 66.50% of the issued share capital of Deppon, for a total consideration of approximately RMB9.0 billion. On July 26, 2022, JD Logistics completed the acquisition of more than 50% equity interest in Deppon Holdco, being the first tranche of the staggered acquisition arrangement. As a result, Deppon Holdco (including Deppon and its subsidiaries) has become a subsidiary of JD Logistics, and its financial results, except for that of certain excluded business, have been consolidated into JD Logistics’s consolidated financial statements.
On April 1, 2022, JD Logistics raised approximately HK$3,102 million net proceeds from a group of third-party investors by issuing to them 150,500,000 of its ordinary shares. On May 26, 2022, we subscribed for 261,400,000 ordinary shares of JD Logistics for a total purchase price of approximately US$692 million in cash, upon which we maintained our shareholding in JD Logistics at more than 63% and continued to consolidate JD Logistics’s financial results into our financial statements.
JD Health
JD Health is one of the largest online healthcare platforms in China, the shares of which are listed on the Main Board of Hong Kong Stock Exchange. JD Health is also pioneering the digitalization and transformation of the healthcare industry. Over the past few years, JD Health is building a comprehensive “internet + healthcare” ecosystem, providing pharmaceutical and healthcare products and internet healthcare services to the customers. On December 8, 2020, shares of JD Health commenced trading on the Main Board of the Hong Kong Stock Exchange under the stock code “6618.” JD Health raised from the global offering in connection with the listing in Hong Kong approximately RMB25.7 billion in net proceeds after deducting underwriting commissions, share issuance costs and the offering expenses. JD Health remains our consolidated subsidiary after its listing.
JD Property
In 2018, we established JD Property, our infrastructure asset management and integrated service platform for developing and managing modern infrastructure to support JD Logistics and third parties.
In March 2021, JD Property completed the series A preference share financing with co-lead investors Hillhouse Investment and Warburg Pincus, among others. The total amount raised was US$703 million. In March 2022 and June 2022, JD Property conducted its series B preferred share financing with investors led by Hillhouse Investment, Warburg Pincus, and one leading global institutional investor, among others. The total amount raised in this round was approximately US$800 million. We remain to be the majority shareholder of JD Property after the two rounds of financings. On March 30, 2023, JD Property, through its joint sponsors, submitted a listing application form (Form A1) to the Hong Kong Stock Exchange to apply for the listing of, and permission to deal in, its shares on the Main Board of the Hong Kong Stock Exchange. There is no assurance as to whether or when the proposed listing may take place.
87
Table of Contents
On January 28, 2022, JD Property completed the acquisition of CNLP, upon which JD Property had accumulatively acquired approximately 37.02% of the issued share capital of CNLP. On March 1, 2022, immediately following the resignation of certain members of the board of directors of CNLP, it was deemed that JD Property had gained control of CNLP and hence CNLP became a consolidated subsidiary of JD Property. On July 14, 2022, JD Property completed the acquisition and privatization of CNLP, and CNLP became a wholly-owned subsidiary of JD Property. The listing of CNLP was subsequently withdrawn from the Hong Kong Stock Exchange on July 15, 2022. CNLP is principally engaged in the leasing of storage facilities and the related management services in the PRC.
JD Industrials
In August 2020, January 2021 and March 2023, JD Industrials, our subsidiary which is the leading industrials supply chain technology and service provider in China, completed series A, series A-1 and series B preference share financing (“JD Industrials Series A, A-1 and B Preference Shares”) with a group of third-party investors. The total amount of financing arising from JD Industrials Series A, A-1 and B Preference Shares was approximately US$545 million. Upon completion of these financings, we hold approximately 78% of the issued and outstanding shares of JD Industrials. On March 30, 2023, JD Industrials, through its joint sponsors, submitted a listing application form (Form A1) to the Hong Kong Stock Exchange to apply for the listing of, and permission to deal in, its shares on the Main Board of the Hong Kong Stock Exchange. There is no assurance as to whether or when the proposed listing may take place.
Dada
Dada is a Nasdaq-listed company and a leading local on-demand retail and delivery platform in China. It operates JD Daojia (JDDJ), one of China’s largest local on-demand retail platforms for retailers and brand owners, and Dada Now, a leading local on-demand delivery platform open to merchants and individual senders across various industries and product categories.
In April 2016, we completed the transaction with Dada, pursuant to which our online-to-offline business, JD Daojia, became a subsidiary of Dada and we contributed certain resources and US$200 million in cash in exchange for newly issued equity interest in Dada. In December 2017, we exercised our warrant to acquire additional preferred shares of Dada. In August 2018, in conjunction of Dada’s Series F round financing with Walmart, we further invested US$180 million to acquire the newly issued preferred shares of Dada. We have formed an extensive cooperation relationship with Dada, as its local on-demand delivery and retail capabilities support our innovative projects and omni-channel strategy, together bringing consumers the most convenient and advanced shopping experience. In June 2020, the ADSs of Dada commenced trading on the Nasdaq Global Select Market under the symbol “DADA.”
On March 22, 2021, we entered into a share subscription agreement through a subsidiary with Dada, and further entered into an amendment to share subscription agreement on February 25, 2022, At closing that occurred on February 28, 2022, Dada issued to us 109,215,017 ordinary shares, for a total consideration of (i) an aggregate purchase price of US$546 million in cash, and (ii) our signing and delivery of a business cooperation agreement to Dada, pursuant to which we provide certain strategic resources to Dada. Immediately following the closing, we held approximately 52% of Dada’s issued and outstanding shares and began to consolidate the financial results of Dada into ours. As of December 31, 2023, we owned approximately 53% issued and outstanding shares of Dada.
Our Major Investments
JD Technology
Since 2017, JD Technology has made remarkable progress in the field of digital technology and is now a leading technology service provider in China, enabling corporates and organizations across industries to achieve digitalization and intelligentization and fueling their growth through accessible financial solutions. In June 2020, we entered into agreements with JD Technology, pursuant to which we have, through a consolidated PRC domestic company, acquired an aggregate of 36.8% equity interest in JD Technology by converting our profit sharing right pursuant to the framework agreement between us and JD Technology and investing additional RMB1.78 billion in cash in JD Technology. The framework agreement, including the profit-sharing arrangement between JD Technology and us, was terminated, and JD Technology has become our equity method investee. In connection with the acquisition of equity interests in JD Technology, we have entered into a series of agreements with JD Technology which set forth the rights of JD as a shareholder. Pursuant to these agreements, we continue to enjoy substantially all the rights that we had under the framework agreement; provided that certain rights such as the right to liquidity event payment had been terminated upon our conversion of the profit sharing right into equity interest in JD Technology. Pursuant to these agreements, certain of our rights under these agreements should be terminated immediately the day before JD Technology submits its application for an initial public offering. These rights, however, will be restored in the event the initial public offering application is rejected by the authorities or withdrawn by JD Technology.
88
Table of Contents
In addition, on June 20, 2020, the shareholders of JD Technology passed a unanimous resolution to restructure JD Technology as a company limited by shares and adopt the dual class voting structure. The shares held by Mr. Richard Qiangdong Liu and Suqian Linghang Fangyuan Equity Investment Center (Limited Partnership), or Suqian Linghang Fangyuan, an entity controlled by Mr. Liu, were entitled to ten votes per share, while Mr. Liu and Suqian Linghang Fangyuan must abstain from voting on any related party transaction with JD Technology. As a result of this dual class voting structure, as of December 31, 2023, we held approximately 22.1% voting power, and Mr. Richard Qiangdong Liu and Suqian Linghang Fangyuan together held 52.4% of the total voting power of JD Technology.
On March 31, 2021, we entered into definitive agreements with JD Technology relating to the reorganization of our cloud computing and artificial intelligence business (“JD Cloud & AI”). Pursuant to the definitive agreements, we transferred JD Cloud & AI and additional RMB4 billion in cash, as consideration in exchange for newly issued ordinary shares of JD Technology. To support the smooth business transition of JD Cloud & AI, we also transferred some equipment and reserved some restricted share units of us for the employees of JD Cloud & AI, for which JD Technology paid cash consideration. Upon completion of the transactions on March 31, 2021, JD Cloud & AI was deconsolidated from our consolidated financial statements, and our equity interest in JD Technology increased from 36.8% to 41.7%.
Yonghui
In August 2015, we entered into definitive agreements with Yonghui, pursuant to which we subscribed for newly issued ordinary shares of Yonghui with a consideration of RMB4.23 billion. In May 2018, we made an additional investment of RMB1.2 billion to acquire additional ordinary shares from the existing shareholders of Yonghui. In 2020, we made further investment of RMB1.0 billion to acquire additional ordinary shares from the existing shareholders of Yonghui. As of December 31, 2023, we held approximately 13% of Yonghui’s issued and outstanding ordinary shares. In addition, we have formed a strategic partnership with Yonghui to strengthen supply chain management capability primarily through joint procurement, and will continue to explore development opportunities in online-to-offline initiatives and other areas of potential strategic cooperation.
Wanda Commercial Properties
In January 2018, we, along with Tencent, entered into a strategic partnership agreement with Wanda Commercial Properties, a leading developer, owner and operator of commercial properties in China, and its major shareholder, Dalian Wanda Group Co., Ltd. Pursuant to the agreement, we invested RMB5 billion to purchase the shares of Wanda Commercial Properties from its existing shareholders.
ATRenew (formerly known as AiHuiShou)
In June 2019, we completed an investment of approximately RMB3.38 billion in ATRenew, a leading pre-owned consumer electronics transactions and services platform in China. In connection with this investment, we merged our Paipai Secondhand business with and into ATRenew with certain exclusive traffic resources for the next five years, and additionally invested a certain amount of cash in exchange for additional preferred shares of ATRenew. In September and December 2020, we completed additional investments of RMB401 million in cash in ATRenew. In addition, we made an additional investment of RMB129 million in ATRenew in April 2021 and RMB321 million to acquire its ADSs in connection with its initial public offering in June 2021. The ADSs of ATRenew commenced trading on the New York Stock Exchange in June 2021. As of December 31, 2023, we owned approximately 34% issued and outstanding shares of ATRenew.
89
Table of Contents
Xingsheng
In December 2020, we invested approximately US$700 million to purchase newly issued preferred shares of Xingsheng. Xingsheng is a leading community group buying e-commerce platform that serves community families with fresh foods and daily necessities.
| B. | Business Overview |
Overview
We are a leading supply chain-based technology and service provider. We generated total net revenues of RMB951.6 billion, RMB1,046.2 billion and RMB1,084.7 billion (US$152.8 billion) in 2021, 2022 and 2023, respectively. We incurred net loss of RMB4.5 billion in 2021, and generated net income of RMB9.7 billion and RMB23.3 billion (US$3.3 billion) in 2022 and 2023, respectively.
Overview of Our E-commerce Business
We believe our scale and market leadership are built upon our competitive edge in customer experience and operational efficiency, as well as our commitment to strategically invest in technology and logistics infrastructure for the long term.
Providing superior customer experience is our top priority. Our e-commerce business offers customers a wide selection of authentic products at competitive prices. We have built and operate our own nationwide fulfillment infrastructure that supports our e-commerce business. Our speedy, efficient and reliable fulfillment services ensure a high degree of customer satisfaction. We offer an enjoyable online shopping experience mainly through our content-rich, user-friendly and highly personalized mobile apps and website www.jd.com. We also provide comprehensive customer services and convenient payment options.
We operate online retail and marketplace e-commerce businesses. In our online retail business, we purchase products from suppliers and sell them directly to our customers. We offer a wide range of product categories through our online retail business, including electronics products, home appliances and a large variety of other general merchandise categories. We have established strong relationships with our suppliers as our online retail business grows rapidly over time. As of December 31, 2023, we sourced products from over 50,000 suppliers on our platform.
Timely and reliable fulfillment is critical to our success. Leveraging this nationwide fulfillment capability, we deliver a majority of the orders to customers by ourselves. Since 2020, we have further improved our efficiency in more cities, especially the less developed areas, as we continued to expand our same day and next day delivery service in these areas. Our fulfillment services have been proven to be highly reliable in response to customer needs, and we offer our customers and consumers a full spectrum of integrated supply chain solutions and high-quality logistics services covering various industries, helping them reduce costs and enhance efficiency.
We launched our online marketplace in October 2010, and have since then been continually adding third-party merchants and introducing new products and services, including premium international brands, to our customers. Merchants on our online marketplace are held to high standards for transacting with our customers. We aim to offer our customers a consistently high-quality online shopping experience regardless of whether they purchase from us or third-party merchants. To this end, we require all third-party merchants to meet our strict standards for product authenticity and service reliability, and closely monitor their performance and activities on our online marketplace.
We provide a variety of digital marketing services to marketers on our e-commerce platform, including suppliers to our online retail business, third-party merchants on our online marketplace and other partners. Powered by AI technology, our digital marketing platform provides our marketing customers with comprehensive digital branding and performance-based marketing solutions and various effective measurement tools, which help them reach targeted audiences, attract and retain customers and improve their returns. Our digital marketing platform also features marketing tools for online marketing message creation, targeting, bidding, deployment and budget allocation, which enables marketers to manage their digital marketing strategy and spending in a convenient and efficient manner.
90
Table of Contents
We are exploring a variety of initiatives to meet our customers’ ever-growing demand. We believe we are well-positioned to empower traditional offline retailers by capitalizing on our strong online presence, industry know-how and technology and systems. We collaborate with Walmart on e-commerce by supporting Walmart and Sam’s Club Flagship Stores on our platform and providing fulfillment solutions to them. Our majority-owned subsidiary Dada, a leading local on-demand retail and delivery platform in China, cooperates with JD Logistics to provide our customers with on-demand and last-mile delivery services of a wide selection of grocery and other fresh products through JD Daojia. We are also exploring in the offline retail market through 7FRESH, our offline fresh food market.
Our proprietary and scalable technology platform enhances user experience, improves operating efficiency and supports the growth in our e-commerce business. Leveraging machine-learning technology and massive data sets amassed from online purchase behaviors, we curate personalized product recommendations and push targeted promotions. We utilize AI technology to refine our merchandise sourcing strategy, allowing us to efficiently manage our inventory and control cost. With consumer insights generated from big data analytics, we provide tailor-made products through customer-to-manufacturer production, which increase sales and enhance customer satisfaction.
Overview of Our Supply Chain-based Technologies and Services
We provide supply chain-based technology and services to other businesses. We take a holistic view on the supply chain covering from upstream manufacturing and procurement, logistics, distribution and retail to end customers.
We have established strong relationships with numerous suppliers, brands and partners. We leverage these relationships and our retail technology capability to provide them with a variety of service solutions. Over the past decade, we have also built a highly scalable and reliable logistics infrastructure and technology platform for our retail business. We are opening up logistics infrastructure and technology platform to third parties with comprehensive logistic services and technology solutions.
Technology is crucial to our achievements today and continued success in the future. It enables better customer experience, more customer cost savings and higher efficiency, while it also serves as a foundation to export our capabilities to enhance productivity and innovation across a multitude of industries in China.
Logistics Services
We made a strategic decision in 2007 to invest in and build our own nationwide fulfillment infrastructure. As of December 31, 2023, our nationwide fulfillment infrastructure covered almost all counties and districts across China, with a network of over 1,600 warehouses with an aggregate gross floor area of over 32 million square meters, including warehouse space managed under the JD Logistics Open Warehouse Platform. In addition, we had a team of 425,469 warehouse and delivery personnel as of December 31, 2023. Our value proposition is to empower our customers’ supply chains and substantially improve their operational efficiencies, which in turn enhance their own customer experience and stickiness. We help our customers reduce redundant distribution layers, improve the agility of their supply chains, and optimize inventory management. Our solutions are powered by our proprietary technology, industry know-how and insights of product merchandizing.
Our Retail Technology Services and Other Technology Initiatives
Capitalizing on our retail data, infrastructure and technology, we commercialize our retail capability into services we offer to brands and partners in the retail industry. Through such services, we believe we can create, together with our partners, a more advanced and comprehensive retail ecosystem to reach and serve more consumers, wherever and whenever they shop.
We operate a technology service platform Kepler which provides comprehensive services for our partners to conduct online retail leveraging traffic on third-party channels. For example, we help brands set up mini programs on Tencent’s Weixin and provide one-stop services including mini-program creation, product selection and pricing, digital marketing, inventory management, fulfillment and customer services. Such services are especially valuable for brands with less sophisticated online retail experience who wish to boost sales through mobile internet channels. In addition, through predictive analytics utilizing AI and big data, we also offer services to traditional brick-and-mortar retailers to optimize the operation of their offline stores by recommending product selection based on local consumers’ preferences while managing stocks at optimum inventory level.
91
Table of Contents
We have developed robust supply-chain based technology in three key areas, namely AI, big data analytics and cloud computing. We have world-class scientists and a large team of AI engineers. Our technology achievements have been well recognized globally. For example, we built a smart supply-chain platform that includes application-level products supporting many use cases that are applicable to our business as well as our ecosystem.
Core Philosophy
Putting customers first is always our core philosophy, as illustrated by the following:
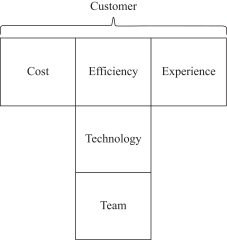
| • | Our team is the foundation of our company. We have built a strong and dedicated team and made significant efforts in hiring, training and retaining the best talent. |
| • | Technology is a key contributor to maintaining our competitive advantage. Upgrading core technologies can effectively reduce cost, improve operating efficiency, and deliver best-in-class customer experience. In order to achieve sustainable future growth, we have been heavily investing in technology innovation and will continue to do so. Our technology strategy focuses on three key areas, namely: AI, big data and cloud. By adopting a middle platform model, which means to establish an application architecture that organizes reusable business services to meet the needs of volatile user scenarios, and compartmentalizing the IT components and standard application programming interfaces in our IT architecture, we have greatly enhanced R&D efficiency and accelerated business innovation. More importantly, this has enabled us to offer more value-added technology services to our clients across a wide spectrum of industries. |
| • | To create value for our customers, partners and society, we make continual efforts to reduce cost, improve efficiency, and deliver better customer experiences: |
| • | Our technology and data-driven management employ an array of key performance indicators to minimize costs and maximize efficiency in our operations; |
| • | We continue to encourage innovation with our partners in order to offer customers a holistic shopping experience through both online and offline channels, thereby increasing customer loyalty; and |
92
Table of Contents
| • | We have opened up our infrastructure, including logistics, systems and technologies, to our business partners to develop more innovative solutions that could reduce cost and enhance efficiency for society as a whole. |
As a result, we are able to offer a broad selection of products, services and solutions at competitive prices as well as excellent experiences. We strive to deliver a sustainable best-in-class customer experience that leads to more loyalty and commitment.
Our Business
Since founding our company, we have focused on developing our online retail business as well as building our own fulfillment infrastructure, including last mile delivery capability, all based on our proprietary technology platform to support our operations. As our online retail business grew substantially in size, we launched our online marketplace to complement it and expand our product offerings, leverage our established fulfillment infrastructure and technology platform and ensure a superior customer experience. More recently, we have also begun to offer comprehensive supply chain-based services that complement our core business and create significant value for a wide range of business partners.
JD Retail
Online Retail
In our online retail business, we acquire products from suppliers and sell them directly to customers. We believe we have the largest online product review database of any online retail company in China with approximately 12 billion product reviews generated by our customers as of December 31, 2023. As of December 31, 2023, we sourced products from over 50,000 suppliers. We believe that large scale and market leading position are critical to success in the online retail market in China and can provide important competitive advantages to us.
Online Marketplace
In our online marketplace business, third-party merchants offer products to customers on our online marketplace and pay us sales commissions. We launched our online marketplace in October 2010 and have been adding new products and services, including premium international brands, since then.
We provide transaction processing and billing services on all orders placed on our online marketplace and require third-party merchants to meet our strict standards for authenticity and reliability. We monitor third-party merchants’ performance and activities on our online marketplace closely to ensure that they meet our requirements for authentic products and high-quality customer service. We tag certain top stores on our platform as “JD Haodian (京东好店),” based on each third-party merchant’s quality of service during the entire purchase process. Such certification can help the top third-party merchants improve their sales volumes on the platform. Furthermore, it sets a benchmark to encourage other third-party merchants to improve their quality of service. We aim to offer customers the same high-quality customer experience regardless of the source of the products they choose.
Omni-channel Initiatives
We are exploring a variety of omni-channel integration opportunities and innovative business models. The term “omni-channel” refers to a marketing approach that seeks to provide a consistent customer experience across multiple channels including websites, apps and physical offline stores.
We believe we are well-positioned to provide omni-channel solutions to customers and offline retailers in select locations in China by capitalizing on our strong online presence and leveraging our strategic partnership with Dada, a leading local on-demand delivery and retail platform in China. Dada has partnered with a large number of well-known chain retailers and many first-tier international and domestic FMCG (fast-moving consumer goods) brands by leveraging Dada’s crowd-sourcing delivery network. Dada has been cooperating with JD Logistics to provide fast on-demand delivery services for merchants and consumers. In 2021, we and Dada formed a strategic partnership with ASUS, a global technology leader, launching more than 150 ASUS stores on JD Daojia (JDDJ) and “Shop Now”, our on-demand consumer retail section. Leveraging this partnership, we will further accelerate the digital transformation of physical stores to improve the offline shopping experience for computer and digital products, including the extension of “one-hour delivery” service to all ASUS offline stores in China.
93
Table of Contents
On February 28, 2022, we held approximately 52% of Dada’s issued and outstanding shares and began to consolidate the financial results of Dada into ours. Our investment in Dada facilitates both sides to promote the expansion of on-demand delivery and retail, as well as omni-channel collaboration. This helped to further diversify our retail services, enable business partners to improve their operating efficiency, and deliver better services for our consumers.
In June 2016, we entered into a series of agreements in connection with our strategic alliance with Walmart. We have collaborated with Walmart on e-commerce, including launching a Sam’s Club Flagship Store and Walmart China Flagship Store on our www.jd.com website, Sam’s Club Global Flagship Store, Walmart Global Flagship Store, and several category global stores to sell specific category products (for example Walmart Beauty and Personal Care Global Store) on JD Worldwide, and a one-hour delivery service from Walmart Stores and Sam’s Clubs in selected cities through the JD Daojia app. We have also experimented with other omni-channel opportunities, aimed at offering shoppers across China faster and more convenient access to high-quality products through multiple channels.
To provide customers with a more dynamic and interactive integrated omni-channel shopping experience, we have enabled some of our offline partners with a variety of the latest technologies such as facial recognition, product recognition, and a tracking system for customers’ in-store activities, among others. We have established a closed loop to accumulate a large volume of offline shopping data, and through further analysis of the integrated online and offline dataset, we can offer differentiated products that best suit potential customer demand in each offline franchise store.
7FRESH, our offline fresh food market brand, is part of our omni-channel strategy. In December 2017, we opened our first 7FRESH store in Yizhuang Economic and Technological Development Zone in Beijing. We integrated our advanced supply chain management know-how and cutting-edge storage technologies to 7FRESH stores. The application of our advanced supply chain management solution and technology on 7FRESH is part of our ongoing experiments to deploy our retail and supply chain service capabilities, which is expected to empower our potential offline partners to further expand our 7FRESH presence to pursue an enhanced shopping experience for our consumers.
In September 2021, we opened our first “JD MALL” offline store in Xi’an, Shaanxi Province, offering consumers an immersive omni-channel shopping experience. In addition to traditional electronic categories offered by JD Super Experience Store, JD MALL provides over 200,000 items from more than 200 brands, in categories including home, furniture, kids, smart healthcare products and auto accessories. Through its partnership with leading furniture makers, JD MALL meets the demand among younger consumers for bespoke one-stop-shop home design services that incorporate furniture and home appliances categories.
Marketing Services
Leveraging our AI capabilities and our comprehensive dataset accumulated from a wide range of business scenarios along the entire value chain, we provide a variety of marketing services to suppliers, third-party merchants and other business partners through our proprietary advertisement technology platform. In 2019, through our greatly expanded development and investment in advanced advertising and marketing technology, we launched the JD Marketing 360 Platform. This platform employs sophisticated AI and big data technologies to utilize our user behavior insights to provide brand marketers and third-party merchants with a one-stop brand building and sales growth solution. It integrates omni-channel marketing, rich marketing effectiveness measurements, and comprehensive consumer asset growth management to help our marketers to effectively acquire new users and increase shopping frequency from existing users. We provide native search ads and display ads on our main apps, and we also place display ads, search ads and affiliate ads on China’s mainstream high traffic apps and video apps. In 2019, we also invested in automated marketing technologies, launching comprehensive products automating all aspects of marketing, including automatic bidding, targeting, creative generation of ads, and budget allocation to satisfy a broad range of marketing scenarios. These products not only reduce our marketers’ labor in marketing campaigns, but also improve their return on investment.
94
Table of Contents
JD Logistics
JD Logistics is the leading technology-driven supply chain solutions and logistics services provider in China. On May 28, 2021, shares of JD Logistics commenced trading on the Main Board of the Hong Kong Stock Exchange under the stock code “2618.” JD Logistics offers a full spectrum of supply chain solutions and high-quality logistics services enabled by technology, ranging from warehousing to distribution, spanning across manufacturing to end-customers, covering regular and specialized items. JD Logistics’s value proposition is to empower customers’ supply chains and substantially improve their operational efficiencies, which in turn enhance their own customer experience and stickiness. JD Logistics helps customers reduce redundant distribution layers, improve the agility of their supply chains, and optimize inventory management. The solutions are powered by proprietary technology, industry know-how and insights of product merchandizing. As of December 31, 2023, JD Logistics operated over 1,600 warehouses, which covered an aggregate gross floor area of over 32 million square meters, including warehouse space managed under the JD Logistics Open Warehouse Platform.
JD Logistics harnesses the power of technology to enhance the operational efficiency of warehouse network. A notable example is the Asia No. 1 smart industrial parks, which also demonstrate their industry-leading technological innovations and high technology standards. As of December 31, 2023, JD Logistics operated 41 Asia No. 1 smart industrial parks in 30 cities across China. In addition, JD Logistics further expanded the coverage of smart warehouse network, opening or upgrading Asia No. 1 smart industrial parks in cities such as Qingdao, Kunshan, and Lanzhou in 2023.
JD Property
JD Property is a leading and the fastest-growing platform for developing and managing logistics parks, business parks and other similar types of modern infrastructure, in China and other parts of Asia. JD Property aims to develop its logistics asset portfolios while maintaining strong capital discipline. With the expansion of our asset portfolios, we have adopted a capital recycling strategy. Collaborating with strategic capital partners, we set up funds and investment vehicles and recycle capital by disposing the projects that are on our balance sheet to such funds and investment vehicles. Meanwhile, we also externally source high-quality assets from third parties for the funds and investment vehicles. We believe this strategy will help further expand our asset portfolios, minimize our related future capital expenditures and enhance our returns. As of December 31, 2023, JD Property manages properties with a total gross floor area of approximately 26 million square meters.
On March 1, 2022, JD Property was deemed to have gained control of CNLP and hence CNLP became a consolidated subsidiary of JD Property. On July 14, 2022, JD Property completed the acquisition and privatization of CNLP. As a result, CNLP has become a wholly-owned subsidiary of JD Property. See “Item 4.A. Information on the Company—History and Development of the Company—Developments of Our Subsidiaries—JD Property” for details.
Technology Initiatives
In November 2020, we launched JD Retail Cloud, a technological ecosystem for the retail industry. JD Retail Cloud offers integrated data, technology, business, and user management industry solutions to support the digitization of enterprises and institutions. One solution provided by JD Retail Cloud is Shangling SaaS Mall, a comprehensive SaaS-based operational solution for manufacturers and offline retailers. Shangling SaaS Mall aims to help manufacturers and retailers to improve efficiency in omni-channel operation and marketing, as well as digitalization of offline store operation.
JD-Y, our supply chain R&D unit that focuses on supply chain innovation, has launched an end-to-end replenishment model (E2E model) that provides an automatic and scalable inventory management solution and shortens the decision process in inventory management. Specifically, the model applies deep learning technology to enable our company to achieve automatic merchandise replenishment based on historical sales performance without the need for sales forecasts. We aim to build up and open our capabilities with industry partners. JD-Y also launched Intelligent Supply Chain initiative, which aims to increase automation of supply chain, improve logistics efficiency among industries, and promote environmentally friendly programs. At the same time, JD-Y also opened up its capabilities to the public and worked together with merchants in Consumer-To-Manufacturing (C2M) customization.
95
Table of Contents
On the JD Logistics side, we have been strengthening our technological innovation and applications in various aspects of supply chain solutions and logistics services, including automation, digitalization and intelligentization. We apply technology to each key part of the supply chain, combining pre-planning, implementation, intelligent decision-making and post-operation management to deliver customer experience and overall efficiency. Equipped with these proprietary technologies, we have built a comprehensive smart logistics system capable of service automation, operation digitalization and intelligent decision-making. In January 2021, JD Logistics was selected by INFORMS as one of the seven finalists for the 50th annual Franz Edelman Award for Achievement in Advanced Analytics, Operations Research and Management Science, the world’s most prestigious award for achievements in the practice of analytics and operations research. Along with seven other world-leading enterprises including Amazon, JD.com, Inc. was recognized for its advanced research and self-developed “unmanned” warehouse scheduling system. JD.com, Inc. is among the few Chinese companies that have been selected as finalists in the history of the award.
In December 2019, we formed our JD Cloud & AI platform. We have a large team consisting of research and development professionals primarily covering areas of AI, big data analytics and cloud computing. We strive to deliver best-in-class services to our customers and become the most trusted technology service provider in the industry. On March 31, 2021, we entered into definitive agreements with JD Technology relating to the reorganization of JD Cloud & AI. Pursuant to the definitive agreements, we transferred JD Cloud & AI and certain assets together valued at approximately RMB15.7 billion to JD Technology, in exchange for newly issued ordinary shares of JD Technology. After completion of this transaction, we still hold a suite of cutting-edge technology and will continue to focus on our core competences and synergistic businesses to better serve customers.
JD Health
JD Health is one of the largest online healthcare platforms in China. On December 8, 2020, shares of JD Health commenced trading on the Main Board of the Hong Kong Stock Exchange under the stock code “6618.” JD Health continued to earn trust and recognition among users with a solid growth in the number of average daily consultations, which exceeded 450,000 in 2023. As a leading online healthcare platform, JD Health’s mission is to become the go-to health management platform for everyone in China. Its strategic position is to create a technology-driven platform that centers on the supply chain of pharmaceutical and healthcare products and is strengthened by healthcare services, encompassing a user’s full life span for all healthcare needs. It is committed to offering users easily accessible, convenient, high-quality yet affordable pharmaceutical and healthcare products. To achieve this goal, JD Health has built a one-stop online health management platform to create greater value for all participants in the healthcare value chain, and will continue to expand its core businesses, retail pharmacy business and online healthcare services, through utilizing AI, big data, cloud computing and other advanced technology.
JD Industrials
JD Industrials is the leading industrial supply chain technology and service provider in China. Through transformational end-to-end industrial supply chain digitalization, it helps its customers increase supply chain reliability, reduces costs, and enhances efficiency.
Customer Experience
Our operating principle is “trust-based, customer-centric value creation,” and we are committed to optimizing the customer experience and achieving customer satisfaction. This commitment drives every aspect of our operations, which are focused on six core components: extensive product offerings, compelling online experience, superior customer service, competitive pricing, timely and accurate fulfillment, and convenient payment options.
Products
We continually seek to add more products that appeal to our customers. We offer a wide range of product categories including:
| • | home appliances; |
| • | mobile handsets and other digital products; |
96
Table of Contents
| • | computers, including desktop, laptop and other varieties, as well as printers and other office equipment; |
| • | furniture and household goods; |
| • | apparel; |
| • | cosmetics and other personal care items and pet products; |
| • | women’s shoes, bags, watches, jewelry and luxury goods; |
| • | men’s shoes, sports gear and fitness equipment; |
| • | automobiles and accessories; |
| • | real estate; |
| • | maternal and childcare products, toys and musical instruments; |
| • | food, beverage and fresh produce; |
| • | gifts, flowers and plants; |
| • | pharmaceutical and healthcare products, including OCT pharmaceutical products, nutritional supplements, healthcare services and other healthcare equipment; |
| • | books, e-books, music, movies and other media products; |
| • | virtual goods, including online travel agency, attraction tickets, and prepaid phone cards and game cards; |
| • | industrial products; and |
| • | installation and maintenance services. |
Each of these categories is further divided into numerous subcategories to facilitate browsing. In building up our product offerings, we focus on quality as well as quantity. Due to our nationwide reach and our efficient fulfillment system, suppliers often choose us to launch new products that they expect will be in high demand, and we often act as the preferred distributor for a period of days or weeks when a hot new product first becomes available for sale to the public.
Online Experience
We believe that providing a compelling online experience is critical to attracting and retaining customers. We make sales primarily through our mobile apps and website www.jd.com. Our website not only offers a broad selection of authentic products at competitive prices but also provides easy site navigation, basic and advanced search functions, customized product recommendations, comprehensive product information and a large volume of customer reviews and ratings. These features address customers’ desire to view, understand and compare products before purchasing. We currently offer mobile access through our mobile website m.jd.com and our various iOS and Android mobile apps. As part of our strategic partnership with Tencent, we launched level 1 access on Tencent’s Weixin and direct access on Tencent’s Mobile QQ, whereby Tencent users can easily access our product offerings and have an enjoyable mobile shopping experience. Over 90% of orders fulfilled were placed through our mobile apps in 2023.
Our mobile apps and www.jd.com website contain the following information and features:
Comprehensive product information to support prompt decision-making. Each product page contains pictures, descriptions, and sometimes short videos of the product, the price, a pull-down menu to show whether the product is in stock at the customer’s location, customer reviews and ratings, and whether the product will be delivered by us or by one of our third-party merchants. When customers are browsing product pages, we display product highlights, reliable services available for this product and the post-discount price on the front page so as to support customers to make purchase decisions more efficiently.
97
Table of Contents
Interactive user community to enhance customer engagement and loyalty. Our mobile apps and websites contain a large volume of helpful user-generated and professionally-generated content. For each product, customers can provide reviews and ratings that are featured prominently on the product page. We encourage participation by granting loyalty points for posting reviews and ratings. We believe that we have the largest online product review database of any online retail company in China, with approximately 12 billion product reviews generated by our customers as of December 31, 2023, which benefits our customers, suppliers and third-party merchants.
We also encourage third-party merchants to generate content and promote their products through livestreams and short videos on our platform to better interact with our customers.
Targeted product recommendations to satisfy personalized demands. We have made progress in personalized recommendations, leveraging our cutting-edge technologies to provide an individualized shopping experience for each of our customers. We identify customers’ demands and make more accurate recommendations based on comprehensive algorithms, which are derived from a large volume of data about customer behavior and preferences.
Smart ordering process to further improve the shopping experience. We continue to leverage our technology to optimize the ordering process, making the shopping experience more convenient and enjoyable. For example, when customers review their shopping carts, not only do we display the special offers available at the time for the products in the customers’ shopping carts, but also we combine the existing coupons in our customers’ accounts with special offers, and calculate the all-in benefits for customers to provide them maximum benefits.
Real-time order tracking and order information revision system to provide convenient shopping experience. Customers can log into their accounts to check the status of their orders. Each package in our system is given a unique identification number, and its location is updated each time it is handled by one of our warehouse or delivery personnel or one of our third-party couriers. Each of our delivery personnel carries a mobile personal digital assistant, which allows customers to track their location in real time on an online map. Furthermore, we provide customers with the option to adjust their order information such as changing the shipping address or the preferred delivery date or time slot.
Customer Service
Providing satisfactory customer service is a high priority. Our commitment to customers is reflected in the high level of service provided by our customer service staff as well as in our flexible product return and exchange policies. We continue optimizing our customer service to guarantee the best possible shopping experience.
In 2023, we further strengthened our brand image of offering hassle-free services to our customers. Combining unique service capabilities from our retail business and our third-party merchants, we provide our customers with customized services for different product categories. Our services cover the entire purchasing process and include over 60 types of services such as instant refunds, repair by exchange program, home-delivery of replacements, and extended price protection services for selected retail products, among other offerings. The service offering aims to facilitate consumers’ purchase decisions by providing trustworthy and guaranteed services. In 2023, we continued to invest in smart services and leveraged our advanced AI and deep learning technologies to more efficiently resolve the high volume of customer inquiries without sacrificing the customer experience. We also leveraged our cutting-edge technologies and smart systems to analyze a large volume of customer feedback and alerted third-party merchants in advance regarding potential customer service issues, helping third-party merchants to improve their service quality for our customers.
24-7 customer service centers. We operate 24-7 customer service centers in Suqian, Wuhan, Chengdu and Datong, handling all kinds of customer queries and complaints regarding our products and services. We obtained COPC (Customer Operation Performance Center) Certification in November 2014. Customers can make queries and file complaints via various channels such as phone calls, online written instant messengers, JD official accounts on Weixin and Weibo, and through email. As of December 31, 2023, we had over 16,000 customer service representatives at the Suqian, Wuhan, Chengdu and Datong centers.
98
Table of Contents
Returns and exchanges. We accept unconditional returns or exchanges within seven days of purchase. For selected categories in our retail business, we provide an extended 30 days return and 180 days replacement policy to our customers. Defective merchandise can be returned for exchange within 15 days of purchase. For customers with good credit, we provide an “instant refund” service, where we provide refunds as soon as they submit their return requests. If customers report defects more than 15 days after receipt but are still within the warranty period, we will have the defective goods repaired, replaced or take another appropriate action to compensate the customer, depending on the nature of the problem. We will generally pick up defective items for return or exchange at the customer’s address, provided that the return or exchange is requested within 15 days of receipt of the item and the address is within the area that is serviced by our employees or by one of the third-party couriers that have agreed to provide this service for us. Alternatively, customers can also mail the merchandise to one of our regional after-sales centers or bring the product to a pickup station nearby. The same policies apply to products sold through our online marketplace.
Membership program. We have established a membership program to cultivate customer loyalty and encourage our customers to make repeat purchases. We continued to promote “JD Plus”, a premium paid membership program. JD Plus offers benefits including extra rebates, coupons, exclusive prices on selected product offerings, free shipping and return services, VIP customer services, PLUS DAY promotion events, online medical consultation and JD E-book unlimited access designed specifically for JD Plus members. JD Plus also partnered with content and lifestyle service providers such as Tencent Video, iQiyi, Ctrip, among others, providing JD Plus members with greater benefits. In addition to our JD Plus, we also have a customer value system, “Joy Score (京享值)”, which takes into account various indicators, such as consumer behavior, interaction, credit ratings, among others, to determine a comprehensive and dynamic score for each consumer. The customers with different level of “Joy Score” can enjoy free loyalty programs. For instance, customer with “Joy Score” beyond certain threshold could enjoy a rebate for the plus membership fee. We also provide a variety of free premium services, such as local service, fast refund channel and VIP after-sale service, to enhance customer experience and engagement. We believe JD Plus membership program and “Joy Score” value system can effectively cultivate customer loyalty and enhance the shopping experience and consumer engagement.
Pricing
We offer competitive pricing to attract and retain customers.
Pricing policy. We are making continual efforts to set our prices to be competitive with those on other major online retail websites and in physical stores in China. We typically negotiate with our suppliers for prices that are comparable to or lower than those offered to retailers in other sales channels. If we reduce the price on our website and mobile apps before or after the product is delivered to the customer, then the customer generally has an opportunity to lock in the lower price. Currently, third-party merchants are free to set their own prices on our online marketplace. We also continue to enrich our product offerings and service while maintaining low prices.
Special promotions. We offer a selection of discounted products on special occasions, such as our anniversary sales promotional event on June 18 and China’s online shopping festival on November 11, as well as on important holidays such as Christmas and Chinese New Year. We also hold daily promotions for selected products for a limited period of time. Special promotions attract bargain hunters and give our customers an additional incentive to visit our website and mobile apps regularly.
Delivery
We believe that timely and reliable fulfillment is critical to the continuing success of our business. To this end, we have incurred and will continue to incur significant expenditures in building and operating our own nationwide fulfillment infrastructure. The following are some of the advantages that derive from our nationwide fulfillment infrastructure:
Delivery network and personnel. We deliver products directly to customers in almost all counties and districts across China. We deliver a majority of orders directly to customers ourselves, and therefore our customers interact with delivery personnel more often than with any other representatives of our company. For this reason, we place great emphasis on training our delivery personnel and setting up delivery stations in more and more counties and districts. We believe that our professionally trained delivery personnel are important in helping us to shape customer experience and distinguish ourselves from our competitors.
99
Table of Contents
Flexible delivery arrangements. We believe that timely and convenient delivery is an essential part of customer satisfaction, and we arrange our delivery schedule to suit our customers’ needs. Customers can choose their preferred delivery window during the day, including evening delivery in selected areas, when they place orders. Customers who need to reschedule a delivery can log into their account on our websites or mobile apps to look up the contact information for the delivery person and contact the delivery person directly themselves, provided that the delivery will be made by our employees.
Comprehensive speedy delivery service. We introduced our 211 program in 2010. For goods that we have in stock at the corresponding regional fulfillment center or front distribution center, any orders received by the morning deadline (11:00 a.m. in most of the locations) will be delivered on the same day, and any orders received by the evening deadline (11:00 p.m.) will be delivered by 3:00 p.m. on the following day. Customers also can request that an order placed by 3:00 p.m. be delivered in the evening on the same day in selected cities. There is no extra charge for delivery under our 211 program for orders that satisfy the minimum size requirement, and customers can check the product page on our websites or through our mobile apps to see whether the product is in stock and thus eligible. The program does not cover delivery to addresses through third-party couriers or products shipped directly from our third-party merchants. Customers can request expedited delivery within two hours by paying an extra charge in the major cities where we have regional fulfillment centers. JD Logistics also provides scheduled delivery service in selected cities, allowing customers to choose a convenient delivery window within which to receive their goods. For luxury products, consumers in major cities can enjoy JD Luxury Express, a premium delivery service where a courier in suit, tie and white gloves will deliver to consumers’ doors. JD Logistics has launched a new premium logistics service with China Railway Corporation, leveraging domestic high-speed trains for secure, long-distance transportation of high-end goods and JD Luxury Express for the last-mile delivery. The combination has created a seamless network allowing customers to enjoy same-day delivery for high-end goods originating from non-local warehouses.
Customer pickup. Customers who prefer to pick up their order themselves can select a pickup station when placing the order and use the tracking function to find out when the order has arrived there. We have pickup stations at convenient locations across the country and payment can be made on the spot.
Continuous expansion of delivery service. We have established and are making continuous efforts to further expand our cold-chain and cross-border logistics capabilities, and in new business areas, to expand product offerings while ensuring superior customer experience.
Merchandise Sourcing
In our online retail business, we sourced products from over 50,000 suppliers as of December 31, 2023. Procuring products on such a massive scale requires considerable expertise, which we have built up over a number of years. None of our suppliers accounted for over 10% (by value) of the products we purchased in 2023.
We continue to increase our direct purchases from manufacturers and, where appropriate, to become an authorized reseller. Our ability to establish direct relationships with manufacturers enables us to provide high-quality products and obtain better procurement terms and access to hard-to-get products. Direct cooperation with manufacturers enables us to increase supply chain efficiency by minimizing supply chain costs and to give customers peace of mind about product quality. In addition, we have created an interface where our third-party merchants access reports regarding inventory status, purchase history and customer reviews of their products. Suppliers and third-party merchants can use this information in their marketing and product development efforts and also in managing their own inventory, which helps them manage costs and makes our services more valuable to them.
We select suppliers and third-party merchants on the basis of brand, reliability, volume and price. They must be able to meet our demands for timely supply of authentic products and also provide high quality after-sale customer service. We perform background checks on our suppliers and third-party merchants and the products they provide before we enter into any agreement. We examine their business licenses and the qualification certificates for their products, and check their brand recognition and investigate the market acceptance of their products among players in the same industry. We also conduct on-site visits to assess and verify their location, business scale, production capacity, property and equipment, human resources, research and development capability, quality control system and fulfillment capability. We normally enter into one-year framework agreements with our suppliers and third-party merchants and renew them annually.
100
Table of Contents
Our standard form contract requires suppliers and third-party merchants to represent that their goods are authentic and from lawful sources and do not infringe upon lawful rights of third parties and to pay us liquidated damages for any breach. We have also put stringent rules in place governing the operations of third-party merchants on our online marketplace. Third-party merchants will be subject to penalties or be asked to end their operations on our online marketplace if they violate the marketplace rules, for example by selling counterfeit products. We have a strict zero-tolerance policy for counterfeit products.
Logistics Services
Fulfillment
We deliver a compelling customer experience by fulfilling orders quickly and accurately. To this end, we have built our nationwide fulfillment infrastructure for the prompt receipt, storage and shipment of our products. Our fulfillment infrastructure is primarily comprised of a nationwide warehouse and delivery network that we operate ourselves, supplemented by third-party couriers to service areas that are not covered by our network. To further enhance inventory accountability and security, we track our inventory at all stages of the receiving and order fulfillment process.
Nationwide Fulfillment Infrastructure.
As of December 31, 2023, our warehouse network covered almost all counties and districts across China, consisting of over 1,600 warehouses operated by us and over 2,000 cloud warehouses operated by third-party warehouse owner-operators under our Open Warehouse Platform. As of December 31, 2023, our warehouse network had an aggregate gross floor area of over 32 million square meters, including the gross floor area of the cloud warehouses under our Open Warehouse Platform. We deliver a majority of the orders directly to customers ourselves. We maintain cooperation arrangements with a number of third-party couriers to deliver our products to our customers during peak seasons to supplement our delivery force. Third-party merchants also use third-party couriers if they do not use our delivery services.
Fulfillment Process
The following flow chart outlines our fulfillment process:
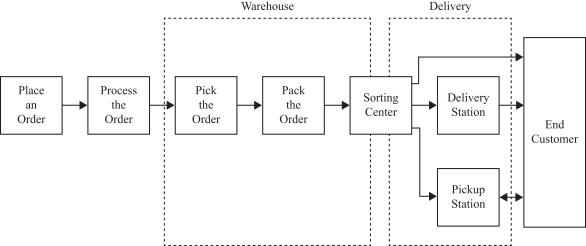
When a customer places an order, our delivery management system automatically processes the order and matches it to the warehouse or warehouses with the appropriate inventory. Picking is done on the basis of instructions that are generated automatically by our warehouse management system. The warehouse management system also automatically generates the bar codes and shipping labels that allow our staff to match the items to the correct order in the packing process. After picking, packing, and sorting, the order is shipped to a delivery or pickup station in the customer’s city for further handling and delivery. If a customer’s order contains products from different warehouses, the products will be combined at the last-mile delivery station and then sent to the customer in a single delivery. If the customer’s address is not one to which we make deliveries ourselves, we will have a third-party courier pick up the order at our sorting center to make the delivery. In some cases, we also use third-party couriers to transfer orders between a sorting center and a delivery station. Once the order has been shipped, our system automatically updates the inventory level for each product in the order, ensuring that additional inventory will be ordered as needed. Our customers can track the shipping status of their orders through our websites or mobile apps at each step in the process.
101
Table of Contents
We are in the process of constructing new warehouses on land where we have obtained land use rights. We believe that building our own warehouses will not only increase our storage capacity but will also allow us to restructure and reorganize our fulfillment workflow and processes.
We also have a dedicated internal division, to explore research, development and application of smart logistics and unmanned technology, which we believe represent the future trend of the logistics industry. Through the development of a series of cutting-edge technologies such as intelligent hardware, internet of things, big data, robotics, image and vision recognition, machine learning, deep learning, and smart logistics devices, we intend to revolutionize the logistics industry. We are also experimenting with these technologies in a wide range of logistics business areas such as unmanned warehouses, drone delivery, self-driving vehicles, unmanned delivery stations and convenience stores, among others. We will continue to invest in smart logistics to improve the intelligence level of our logistics system and to provide consumers with an unparalleled shopping experience.
Open Platform of Our Logistics Services
We also open up our logistics infrastructure to our third-party merchants and partners beyond our e-commerce business. We have developed comprehensive logistics services and continuously strengthen our logistics service capability by adding new services such as on-demand delivery, cold-chain services and individual parcel delivery solutions. We provide services relating to almost all aspects of logistics operation, including warehousing management, storage, long-haul transportation, express and on-demand delivery and cold-chain and cross-border services, among others. We offer integrated supply chain management solutions to customers in various vertical markets. We also provide technology solutions for logistics operations to enable customers to transparently and effectively monitor, manage and optimize their logistic workflows.
Technology Platform
Technology is the key to our future success. It enables better customer experience, higher efficiency and customer cost savings, while also serving as a vehicle to export our unique capabilities and cutting-edge innovation to benefit the whole industry and society.
We have a large team consisting of research and development professionals primarily covering areas of AI, big data analytics and cloud computing. Together, these areas form our technology strategy. We strive to deliver best-in-class services to our customers and become the most trusted technology service provider in the industry, powered by our large and sophisticated IT infrastructures.
In addition to our core technology innovation, research and development, we also place a strong emphasis on data privacy and security. Protecting customer data and building trust is one of our core values. Operating in compliance with the most stringent standards and regulations both in China and globally, we provide our customers with a high level of security, privacy protection and ease of mind.
AI-powered Services Improving Customer Satisfaction and Partner Productivity
We strive to offer the right product to the right customer at the right time through the right channel, known as our “4R” strategy. Technology is the foundation to achieve the 4R strategy. Through aggregation and analysis of customer behavioral big data, we derive deep insights about customer preferences and offer precision targeting for product recommendations. The access to customer insights also enables us to train and refine robust AI models, empowering a great customer experience. For example, our “Snapshop” feature allows users to identify products through uploaded pictures. Such technology is also publicly available through our open AI platform NeuHub and has been adopted by most major phone manufacturers in China to improve phone users’ shopping experiences.
To support our omni-channel strategy, our technologies are embedded in a multitude of retail scenarios, from online web and mobile shopping experience, to our offline ecosystem, including our JD Smart Speakers, 7FRESH stores, JD E-SPACE, a 50,000 square meter shopping mega store we launched in November 2019, and many JD Home outlets and unmanned convenience stores.
102
Table of Contents
Technology also permeates our customer service experience. Leveraging our cutting-edge technologies and big data, we provide an individualized shopping experience for each customer. We identify customers’ demands and provide accurate recommendations based on comprehensive algorithms derived from a large volume of data on customer behavior and preferences.
Our AI-powered services also empower our partners to improve their operational efficiency and productivity. Our marketing platform employs sophisticated AI and big data technologies to produce user behavior insights and provide brand marketers and third-party merchants with one-stop brand building and sales growth solutions. This not only reduces our marketers’ labor in marketing campaigns, but also improve their return on investment. During promotion seasons, our AI-based agent helps third-party merchants efficiently respond to large volume of customer requests, cutting wait times and improving customer experience.
AI-triaged calls effectively reduce manned calls and improve operational efficiency. Furthermore, our advanced AI custom service is integrated into our retail ecosystem by way of our SaaS (software as a service) platform.
Smart Retail & Supply Chain Technology Enhancing Operational Efficiency
Through years of online operation, we have amassed a large amount of know-how and data across China’s e-commerce supply-chain, from product manufacturing, warehouse operations and distribution to sales and customer service information. Combining the power of big data analytics and AI on our intelligent cloud platform, we streamline customer-to-manufacturer production to improve sales and enhance customer satisfaction. Leveraging our smart retail and supply chain technology, we provide technology solutions for our logistics operations to enable customers to transparently and effectively monitor, manage and optimize their logistic workflows.
At the infrastructural level, during the two major online shopping events in 2023, JD Cloud platform had a solid operational performance by recording 99.99% of service level agreements (SLAs) and having zero outages.
Technology Transcending Boundaries of Smart Logistics
In 2019, we enhanced our capabilities and operations with unmanned delivery vehicles, including our in-house level 4 (L4) autonomous delivery robots. Level 4 refers to “high driving automation,” which means that no human intervention is needed as long as the system is operating within a certain geo-fenced area. Besides self-driving robots, we also deployed unmanned drones for parcel delivery in certain areas. Furthermore, we also leverage AI technologies to detect and triage mishandling of packages within our fulfillment infrastructure, reducing goods damaged while improving customer satisfaction.
Marketing
We believe that the most effective form of marketing is to continually enhance our customer experience, as customer satisfaction engenders word-of-mouth referrals and repeat purchases. We have been able to build an extensive base of loyal customers primarily through providing superior customer experience and conducting marketing and brand promotion activities.
In addition to continuing marketing activities through traditional online and offline channels, we have also designed innovative programs and promotion activities to further enhance the brand awareness of both ourselves and our partners and to better reach our customers. We have launched a series of successful joint marketing campaigns such as “Super Brand Days,” “Super Category Days” and “Super New Product Days.” We will continue to leverage our data-driven customer insights to provide customized marketing tools and campaigns for business partners and help them to develop brand recognition in China. We have also made progress in social e-commerce innovations, particularly benefiting from access points within Weixin and QQ channels, both of which have a large mobile internet user base. Through leveraging more targeted, innovative and interactive marketing tools, we can help brands on the platform increase exposure, drive traffic and achieve deeper penetration into lower-tier cities and attract younger generations.
In addition, we have formed strategic partnerships with a number of major internet companies in China, aiming at leveraging these companies’ massive user bases to strengthen collaboration in targeted marketing, user access points and content-driven marketing. We incurred RMB38.7 billion, RMB37.8 billion and RMB40.1 billion (US$5.7 billion) of marketing expenses in 2021, 2022 and 2023, respectively.
103
Table of Contents
Competition
The online retail industry in China is intensely competitive. Our current or potential competitors include (i) major e-commerce companies in China that offer a wide range of general merchandise product categories, such as Alibaba Group, which operates taobao.com and tmall.com, and (ii) major traditional retailers in China that are moving into online retailing, such as Suning Appliance Company Limited, which operates suning.com. We also face competition from online retail companies in China focused on specific product categories and from physical retail stores, including big-box stores that also aim to offer a one-stop shopping experience.
We anticipate that the online retail market will continually evolve and will continue to experience rapid technological change, evolving industry standards, shifting customer requirements, and frequent innovation. We must continually innovate to remain competitive. We believe that the principal competitive factors in our industry are:
| • | brand recognition and reputation; |
| • | product quality and selection; |
| • | pricing; |
| • | fulfillment capabilities; and |
| • | customer service. |
In addition, new and enhanced technologies may increase competition in the online retail industry. New competitive business models may appear, for example based on new forms of social media or social commerce.
We believe that we are well-positioned to effectively compete on the basis of the factors listed above. However, some of our current or future competitors may have longer operating histories, greater brand recognition, better supplier relationships, larger customer bases or greater financial, technical or marketing resources than we do.
Seasonality
We experience seasonality in our business, reflecting a combination of seasonal fluctuations in customer purchases, promotional events, and traditional retail seasonality patterns. For example, we generally experience less user traffic and purchase orders during national holidays in China, particularly during the Chinese New Year holiday season in the first quarter of each year. Furthermore, sales in the traditional retail industry are significantly higher in the fourth quarter of each calendar year than in the preceding three quarters.
E-commerce companies in China hold special promotional campaigns on November 11 each year that tend to boost sales in the fourth quarter relative to other quarters, and we hold a special promotional campaign in the second quarter of each year, on June 18, to celebrate the anniversary of the founding of our e-commerce business. Overall, the impact of seasonality on our business has been relatively mild due to our rapid growth but we have seen an upward trend and such a trend may continue in the future. Due to our limited operating history, the seasonal trends that we have experienced in the past may not apply to, or be indicative of, our future operating results.
Intellectual Property
We regard our trademarks, copyrights, patents, domain names, know-how, proprietary technologies, and similar intellectual property as critical to our success, and we rely on copyright, trademark and patent law and confidentiality, invention assignment and non-compete agreements with our employees and others to protect our proprietary rights. As of December 31, 2023, we owned over 5,000 computer software copyrights in China relating to various aspects of our operations and maintained over 30,000 trademark registrations inside China and over 5,800 trademark registrations outside China. We had approximately 38,000 trademark applications inside China and over 7,000 outside China. As of December 31, 2023, we had approximately 7,800 patents granted in China, over 600 patents granted outside China, approximately 11,000 patent applications pending in China and approximately 1,000 patent applications pending outside China. As of December 31, 2023, we had registered over 9,000 domain names. Our registered domain names include jd.com, jdl.cn and jdhealth.com, among others.
104
Table of Contents
Insurance
We maintain various insurance policies to safeguard against risks and unexpected events. We have purchased all risk property insurance covering our inventory and fixed assets such as equipment, furniture and office facilities. We maintain public liability insurance for our business activities at 173 locations. We also provide social security insurance including pension insurance, unemployment insurance, work-related injury insurance, maternity insurance and medical insurance for our employees. Additionally, we provide group accident insurance for all employees and supplementary medical insurance for all management and technology and other professional personnel. We do not maintain business interruption insurance other than in connection with the fixed business premises of our 7FRESH business, nor do we maintain product liability insurance or key-man insurance. We consider our insurance coverage to be sufficient for our business operations in China.
Environmental, Social and Governance (ESG)
ESG is critical to our long-term development. We incorporate ESG values into our business strategies and continue to drive ESG progress with focuses on the following six areas.
Environmental Sustainability
We aim to build a green and low-carbon supply chain by actively promoting carbon-reduction measures in the fields of warehousing, packaging, transportation and consumption and driving development of a circular economy, with joint efforts with upstream and downstream partners. As of the end of 2023, we have installed photovoltaic power generation systems nationwide at our intelligent industrial parks, which have supplied green electricity of 31,700 MWh accumulatively, reducing carbon emission of 31,600 tons by replacing thermal power generation. JD Logistics achieved annual carbon reduction of over 69,000 tons in 2023 through green packaging promotion across the entire supply chain.
Building Customer Trust
We adhere to “customer first,” providing customers high-quality products and shopping experience of the utmost in selection, speed, quality and value to build customer trust. Supplier management is important to us to serve and build trust with customers. Under our responsible procurement, we have incorporated requirements for our suppliers in the areas of business ethics, social responsibilities, occupational health and safety, environmental protection, among others, and have established the JD.com Supplier Code of Conduct.
People Oriented
Our people are the driving force of our sustainable development. We are always committed to providing comprehensive employee care and welfare, offering multi-dimensional employee training and talent development programs, creating high-quality job opportunities, and promoting diversity, equality and inclusion in the workplace. JD.com was listed on Forbes 2023 World’s Best Employers, making the list six years in a row.
Business Ethics
Guided by our commitment to “Achieving Success the Right Way,” we have implemented multiple measures to build a trustworthy business ecosystem, such as the establishment of governance systems, comprehensive training and promotion, and accountability and rewards, in the areas of anti-corruption and compliance, information security and privacy protection, among others.
| • | Anti-corruption and compliance: Integrity and compliance of our business partners is an integral part to our value proposition of building a “Responsible Supply Chain.” We carry out anti-corruption and compliance training for our business partners every year. |
105
Table of Contents
| • | Information security and privacy protection: We place great importance to information security and privacy protection, and have built a comprehensive system, including policies, management, technology, supervision and training, to enhance our efforts in this field. To build a corporate culture of integrity, we provided about 445,000 hours in total of information security and privacy protection training sessions and examinations to our employees in 2023. |
Technology Empowerment and Technology for Good
We open and share our digital intelligent supply chain service capabilities, and work with upstream and downstream partners to build an ecosystem of innovation across the entire supply chain. In April 2023, JD Logistics launched the Supply Chain Emission Management Platform, a validated carbon footprint management platform incorporating over 140 types of carbon emission factors in road transportation in China. The platform calculates carbon emissions with higher granularity based on the actual routes of transportation vehicles. It aims to drive more enterprises to reduce carbon emissions with enhanced efficiency and lower cost, ultimately steering towards achieving the net-zero emission target.
Giving Back to the Community
Leveraging our advantages and experience in building a “Responsible Supply Chain”, we make active contribution in rural revitalization, disaster relief, and philanthropy. Since the launch of JD rural revitalization plan “Journey to Wealth” in October 2020, we have worked with farmers to launch a series of high-quality landmark agricultural products, leveraging our supply chain and scale benefits to help farmers reduce operating costs and enhance competitiveness.
Regulation
This section sets forth a summary of the most significant rules and regulations that affect our business activities in China.
Amended Company Law
The establishment, operation and management of corporate entities in the PRC are governed by the Company Law of the PRC. On December 29, 2023, the Standing Committee of the National People’s Congress promulgated the amended Company Law of the PRC, which will come into effect on July 1, 2024, to supersede the existing PRC Company Law which was amended in October 2018. The major revisions made by the amended PRC Company Law included improving the system for the establishment and liquidation of companies, optimizing organizational structures of companies, improving the capital system of companies, strengthening the responsibilities of the controlling shareholder and management staff, and enhancing the social responsibilities of companies, etc. With respect to the period for payment of the registered capital, pursuant to the amended PRC Company Law, all shareholders of a PRC limited liability company shall fully pay up the registered capital subscribed for by such shareholders within five years since the date of establishment of the PRC limited liability company, unless otherwise provided by laws and regulations. On February 6, 2024, the SAMR issued a draft of the Provisions of the State Council on Implementing the Registered Capital Registration and Management System under the PRC Company Law for public comments, which further specified the detailed requirements and measures of the registration and management of registered capital under the amended PRC Company Law. Pursuant to such draft provisions, there shall be a three-year interim period from July 1, 2024 to June 30, 2027 for the existing companies to adjust their periods of capital contribution.
Regulations Relating to Foreign Investment
Investment activities in the PRC by foreign investors are principally governed by the Catalog of Industries for Encouraging Foreign Investment, or the Catalog, and the Special Management Measures for the Access of Foreign Investment, or the Negative List, which were promulgated and are amended from time to time by the Ministry of Commerce and the NDRC, and together with the Foreign Investment Law and their respective implementation rules and ancillary regulations. The Catalog and the Negative List lay out the basic framework for foreign investment in China, classifying businesses into three categories with regard to foreign investment: “encouraged,” “restricted” and “prohibited.” Industries not listed in the Catalog or the Negative List are generally deemed as falling into a fourth category “permitted” unless specifically restricted by other PRC laws.
106
Table of Contents
The Ministry of Commerce and the NDRC promulgated the Catalogue of Industries for Encouraging Foreign Investment (2022 Version) on October 26, 2022, and the Special Management Measures (Negative List) for the Access of Foreign Investment (2021) on December 27, 2021, to replace the previous encouraging catalogue and negative list thereunder. Each of Jingdong Century and Shanghai Shengdayuan primarily engages in the online wholesale and retail of products, the development of computer network technology, technical consultancy and technical services, which are in the permitted category.
On March 15, 2019, the National People’s Congress promulgated the Foreign Investment Law, which has become effective on January 1, 2020 and replaced the PRC Cooperative Joint Venture Law and the Wholly Foreign-owned Enterprise Law, as well their implementation rules and ancillary regulations. The Foreign Investment Law, by means of legislation, establishes the basic framework for the access, promotion, protection and administration of foreign investment in view of investment protection and fair competition.
According to the Foreign Investment Law, foreign investment shall enjoy pre-entry national treatment, except for those foreign invested entities that operate in industries deemed to be either “restricted” or “prohibited” in the “negative list.” The Foreign Investment Law provides that foreign invested entities operating in foreign “restricted” or “prohibited” industries will require entry clearance and other approvals. The Foreign Investment Law does not comment on the concept of “de facto control” or contractual arrangements with variable interest entities, however, it has a catch-all provision under definition of “foreign investment” to include investments made by foreign investors in China through means stipulated by laws or administrative regulations or other methods prescribed by the State Council. Therefore, it still leaves leeway for future laws, administrative regulations or provisions to provide for contractual arrangements as a form of foreign investment. See “Item 3.D. Key Information—Risk Factors—Our current corporate structure and business operations may be affected by the PRC Foreign Investment Law.”
The Foreign Investment Law also provides several protective rules and principles for foreign investors and their investments in the PRC, including, among others, that local governments shall abide by their commitments to the foreign investors; foreign-invested enterprises are allowed to issue stocks and corporate bonds; except for special circumstances, in which case statutory procedures shall be followed and fair and reasonable compensation shall be made in a timely manner, expropriate or requisition the investment of foreign investors is prohibited; mandatory technology transfer is prohibited, allows foreign investors’ funds to be freely transferred out and into the territory of PRC, which run through the entire lifecycle from the entry to the exit of foreign investment, and provide an all-around and multi-angle system to guarantee fair competition of foreign-invested enterprises in the market economy. In addition, foreign investors or the foreign investment enterprise should be imposed legal liabilities for failing to report investment information in accordance with the requirements. Furthermore, the Foreign Investment Law provides that foreign invested enterprises established according to the existing laws regulating foreign investment may maintain their structure and corporate governance within five years after the implementing of the Foreign Investment Law, which means that foreign invested enterprises may be required to adjust the structure and corporate governance in accordance with the current PRC Company Law and other laws and regulations governing the corporate governance.
On December 26, 2019, the State Council promulgated the Implementation Rules to the Foreign Investment Law, which became effective on January 1, 2020. The implementation rules further clarified that the state encourages and promotes foreign investment, protects the lawful rights and interests of foreign investors, regulates foreign investment administration, continues to optimize foreign investment environment, and advances a higher-level opening.
On December 30, 2019, the Ministry of Commerce and the SAMR jointly promulgated the Measures for Information Reporting on Foreign Investment, which became effective on January 1, 2020. Pursuant to the Measures for Information Reporting on Foreign Investment, where a foreign investor carries out investment activities in China directly or indirectly, the foreign investor or the foreign-invested enterprise shall submit the investment information to the competent commerce department.
According to the Measures for the Security Review of Foreign Investment promulgated by the NDRC and the Ministry of Commerce on December 19, 2020 and became effective on January 18, 2021, the NDRC and the Ministry of Commerce will establish a working mechanism office in charge of the security review of foreign investment. Such measures define foreign investment as direct or indirect investment by foreign investors in the PRC, which includes (i) investment in new onshore projects or establishment of wholly foreign owned onshore companies or joint ventures with foreign investors; (ii) acquiring equity or asset of onshore companies by merger and acquisition; and (iii) onshore investment by and through any other means. Investment in certain key areas with bearing on national security, such as important cultural products and services, important information technology and internet services and products, key technologies and other important areas with bearing on national security which results in the acquisition of de facto control of investee companies, shall be filed with a specifically established office before such investment is carried out. What may constitute “onshore investment by and through any other means” or “de facto control” could be broadly interpreted under such measures. It is likely that control through contractual arrangement be regarded as de facto control based on provisions applied to security review of foreign investment in the free trade zone. Failure to make such filing may subject such foreign investor to rectification within prescribed period, and will be recorded as negative credit information of such foreign investor in the national credit information system, which would then subject such investors to joint punishment as provided by the rules. If such investor fails to or refuses to undertake such rectification, it would be ordered to dispose of the equity or asset and to take any other necessary measures so as to return to the status quo and to erase the impact to national security.
107
Table of Contents
Foreign Investment in Value-Added Telecommunications Businesses
The Regulations for Administration of Foreign-invested Telecommunications Enterprises promulgated by the State Council in December 2001 and subsequently amended in September 2008 and February 2016 set forth detailed requirements with respect to capitalization, investor qualifications and application procedures in connection with the establishment of a foreign-invested telecommunications enterprise. These regulations prohibit a foreign entity from owning more than 50% of the total equity interest in any value-added telecommunications service business in China and require the major foreign investor in any value-added telecommunications service business in China have a good and profitable record and operating experience in the industry. However, pursuant to the latest amendment to the Regulations for Administration of Foreign-invested Telecommunications Enterprises issued by the State Council in March 2022, which became effective on May 1, 2022, several provisions, including the requirement that such major foreign investors described above to have a good and profitable record and operating experience in the industry had been removed. In addition, the Special Management Measures (Negative List) for the Access of Foreign Investment (2021) allows foreign investors to hold more than 50% equity interests in a value-added telecommunications service provider engaging in e-commerce, domestic multiparty communication, storage-and-forward and call center businesses. Due to these regulations, we operate our www.jd.com website through Jingdong 360, one of the consolidated variable interest entities.
In July 2006, the Ministry of Information Industry, the predecessor of the MIIT, issued the Circular on Strengthening the Administration of Foreign Investment in the Operation of Value-added Telecommunications Business, pursuant to which a PRC domestic company that holds an operating license for value-added telecommunications business, which we refer to as a Value-added Telecommunication License, or a VAT License, is prohibited from leasing, transferring or selling the VAT License to foreign investors in any form and from providing any assistance, including resources, sites or facilities, to foreign investors that conduct a value-added telecommunications business illegally in the PRC. Further, the domain names and registered trademarks used by an operating company providing value-added telecommunications services must be legally owned by that company or its shareholders. In addition, the company’s operational premises and equipment must comply with the approved coverage region on its VAT License, and the company must establish and improve its internal internet and information security policies and standards and emergency management procedures. If a VAT License holder fails to comply with the requirements and also fails to remedy such non-compliance within a specified period of time, the MIIT or its local counterparts have the discretion to take administrative measures against the license holder, including revoking its VAT License. Jingdong 360, the operator of our www.jd.com website, owns the domain names and registered trademarks and has the necessary personnel to operate the website.
Licenses and Permits
We are required to hold a variety of licenses and permits in connection with various aspects of our business, including the following:
Value-added Telecommunication License
The Telecommunications Regulations promulgated by the State Council and its related implementation rules, including the Catalog of Classification of Telecommunications Business issued by the MIIT, categorize various types of telecommunications and telecommunications-related activities into basic or value-added telecommunications services, and internet information services are classified as value-added telecommunications businesses. Under the Telecommunications Regulations, commercial operators of value-added telecommunications services must first obtain a VAT License from the MIIT or its provincial level counterparts. Pursuant to the Administrative Measures on Internet Information Services promulgated by the State Council in 2000 and amended in 2011, a commercial ICP service operator must obtain an ICP License from the government authorities before engaging in any commercial ICP service in China. When the ICP service involves areas of news, publication, education, medical treatment, health, pharmaceuticals and medical devices, and if required by law or regulations, specific approval from the respective regulatory authorities must be obtained prior to applying for the ICP License from the MIIT or its provincial level counterpart. In 2017, the MIIT replaced the Administrative Measures on Telecommunications Business Operating Licenses promulgated in 2009 by promulgating the Administrative Measures on Telecommunications Business Operating Licenses, which set forth more specific provisions regarding the types of licenses required to operate value-added telecommunications services, the qualifications and procedures for obtaining such licenses and the administration and supervision of such licenses. Jingdong 360, as our ICP operator, holds an ICP License issued by the Beijing Telecommunications Administration for the provision of information services through the internet, a VAT License issued by Beijing Telecommunication Administration for the provision of online data processing and transaction processing services and also a VAT License issued by the MIIT for the provision of information services through a mobile network, the provision of internet data center services, internet access services, cellular mobile communications services provided in the means of resale, content delivery network services and storage-and-forward services.
108
Table of Contents
Internet Publication License/Network Publication Service License
As a result of institutional reform in March 2018, the National Press and Publication Administration was established and assigned to undertake the administration of publication activities in China from the State Administration of Press and Publication, Radio, Film and Television, which was integrated from the State Administration of Radio, Film and Television, and the General Administration of Press and Publication in March 2013. In June 2002, the MIIT and the General Administration of Press and Publication jointly promulgated the Tentative Administrative Measures on Internet Publication, which require internet publishers to obtain a license from the General Administration of Press and Publication to conduct internet publication activities. In February 2016, the State Administration of Press and Publication, Radio, Film and Television and the MIIT jointly issued the Administrative Measures on Network Publication, which took effect in March 2016 and replaced the Tentative Administrative Measures on Internet Publication. The Administrative Measures on Network Publication further strengthened and expanded the supervision and management on the network publication service. Pursuant to the Administrative Measures on Network Publication, entities engaging in the network publication service are required to obtain a network publication service license from a competent administrative authority; the network publishing services refer to the activities of providing network publications to the public through information networks; and the network publications refer to the digitalized works with the publishing features such as editing, producing and processing. The Administrative Measures on Network Publication also provide the detailed qualifications and application procedures for obtaining a Network Publication Service License. Jingdong 360 holds a Network Publication Service License, which is in the process of being renewed.
Internet Drug Information Service Qualification Certificate
In July 2004, the State Food and Drug Administration, the predecessor of the National Medical Products Administration, promulgated the Administrative Measures on Internet Drug Information Service (amended in November 2017). In addition, the Standing Committee of the National People’s Congress further amended the Drug Administration Law on August 26, 2019, which became effective on December 1, 2019. These laws and measures, together with certain implementing rules and notices promulgated by the State Food and Drug Administration or the National Medical Products Administration, set out regulations governing the classification, application, approval, content, qualifications and requirements for internet drug information services. An ICP service operator that provides information regarding drugs or medical devices must obtain an Internet Drug Information Service Qualification Certificate from the applicable provincial level administrative authority. Jingdong 360 has completed the filing for drugs and medical devices internet information services.
109
Table of Contents
Courier Service Operation Permit
Pursuant to the PRC Postal Law, the Administrative Measures on the Courier Service Market and the Administrative Measures on Courier Service Operation Permits, any entity engaging in courier services must obtain a Courier Service Operation Permit from the State Post Bureau or its local counterpart and is subject to their supervision and regulation. Entities applying for a permit to operate courier services in a certain province should apply to the provincial level post bureau, while an entity applying for a permit to operate courier services across multiple provinces should apply to the State Post Bureau. An entity holding a cross-provincial Courier Service Operation Permit may provide courier services in cities other than its place of registration by establishing new branches at these cities and then filing with the relevant provincial post bureau for those branches. In addition, pursuant to the Interim Regulations of Courier which came into effect in May 2018 and was further amended in March 2019, express delivery operators and their branches may open express delivery terminal outlets according to their business needs, and shall file with the local postal administrations in the places where such terminal outlets are located within 20 days from the date of opening such terminal outlets. Express delivery terminal outlets are not required to obtain a business license. The courier business must be operated within the permitted scope and valid term of the Courier Service Operation Permit. As of December 31, 2023, Jingbangda had obtained one cross-provincial Courier Service Operation Permit, and its 37 subsidiaries had obtained Courier Service Operation Permits. See “Item 3.D. Key Information—Risk Factors—Risks Related to Our Business—We are subject to a broad range of laws and regulations. Any lack of requisite approvals, licenses or permits applicable to our business or any failure to comply with applicable laws or regulations may have a material and adverse impact on our business, financial condition and results of operations.”
Road Transportation Operation Permit
Under the Regulations on Road Transportation promulgated by the State Council in April 2004 and as amended, and the Provisions on Administration of Road Transportation and Stations (Sites) issued by the Ministry of Transport in June 2005 and as amended, unless otherwise provided in the foregoing laws, anyone engaging in the business of operating road transportation must obtain a Road Transportation Operation Permit, and each vehicle used for shipping must have a Road Transportation Certificate. As of December 31, 2023, Xi’an Jingdong Xuncheng and its 10 branches and two subsidiaries, Jingbangda and its 29 subsidiaries had obtained Road Transportation Operation Permits that allow these entities to provide road freight transportation services. See “Item 3.D. Key Information—Risk Factors—Risks Related to Our Business—We are subject to a broad range of laws and regulations. Any lack of requisite approvals, licenses or permits applicable to our business or any failure to comply with applicable laws or regulations may have a material and adverse impact on our business, financial condition and results of operations.”
Unmanned Aerial Vehicle Business License
According to the Interim Regulations on the Flight Management of Unmanned Aircraft released by the Central Military Commission and the State Council of China in May 2023, the use of civilian unmanned aircraft classified as micro or smaller for flight activities requires the acquisition of a Remotely Piloted Aircraft Systems Air Operator Certificate. Xi’an Jingdong Tianhong Technology Co., Ltd, a subsidiary of Jingdong Logistics Supply Chain Co., Ltd., has obtained the Remotely Piloted Aircraft Systems Air Operator Certificate.
Publication Operation Permit
In May 2016, the Ministry of Commerce and the State Administration of Press and Publication, Radio, Film and Television jointly promulgated the Administrative Measures for the Publication Market (2016 Version), which replaced the Administrative Measures for the Publication Market (2011 Version). According to the Administrative Measures for the Publication Market (2016 Version), where an entity or individual is engaged in the distribution of publications via the internet or other information networks, the entity or individual is required to obtain a Publication Operation Permit. Entities and individuals engaged in the wholesale or retail of publications are required to carry out their activities within the scope of a Publication Operation Permit. Where an entity or individual has obtained the Publication Operation Permit and is engaged in the distribution of publications via the internet or other information networks within the approved business scope, the entity or individual is required to complete record filing with the publication administrative department within 15 days after launching the online distribution business. We engage in wholesale and retail of books and audio and video products and other publications mainly through entities including Jiangsu Yuanzhou, Beijing Jingdong Century Information Technology Co., Ltd., Guangzhou Jingdong Trading Limited and Shanghai Yuanmai Trading Co., Ltd., among others. Each of these entities has obtained a Publication Operation Permit.
110
Table of Contents
Food Operation Permit
China has adopted a licensing system for food supply operations under the Food Safety Law and its implementation rules. Entities or individuals that intend to engage in food production, food distribution or food service businesses must obtain licenses or permits for such businesses. Pursuant to the Administrative Measures for Food Operation Licensing and Record-filing, issued by SAMR in June 2023 and became effective in December 2023, which replaced the Administrative Measures on Food Operation Licensing issued by the State Food and Drug Administration in August 2015 and amended in November 2017, an enterprise needs to obtain a Food Operation Permit from the local market administration before conducting food sales and catering service activities, while only filing with local market administration is needed for enterprises selling prepackaged food. We sell food, liquor and nutritional supplements through our mobile apps and websites. Our major PRC subsidiaries or their branches engaging in food operation business have obtained Food Operation Permits.
Medical Device Operation Enterprise Permit
The Regulations on Supervision and Administration of Medical Devices, issued by the State Council in 2000 and further amended in March 2014, May 2017 and June 2021, divides medical devices into three types. Enterprises engaging in the sale of Type II medical devices must file with the relevant drug supervision and administration authority while those engaging in the sale of Type III medical devices must obtain a Medical Device Operation Permit from the relevant drug supervision and administrative authority. Beijing Jingdong Century Information Technology Co., Ltd. (a subsidiary of Jingdong Century), Beijing Jingdong Hongjian Jiankang Co., Ltd. and certain other subsidiaries of Beijing Jingdong Jiankang Co., Ltd. have obtained Medical Device Operation Permits for the sale of several types of Type III medical devices.
Permit for Production and Operation of Radio and TV Programs
Under the Regulations on the Administration of Production of Radio and Television Programs issued by the State Administration of Radio, Film and Television in July 2004 and amended in August 2015 and October 2020, any entities that engage in the production of radio and television programs are required to apply for a Permit for Production and Operation of Radio and TV Programs from the competent administrative authority. Entities with this permit must conduct their business operations in compliance with the approved scope of production and operation. Furthermore, entities other than radio and TV stations are prohibited from producing consolidated radio and TV programs regarding current political news or similar subjects. Jingdong 360 has obtained a Permit for Production and Operation of Radio and TV Programs, which remains valid until July 2025.
Regulations Relating to E-Commerce
China’s e-commerce industry is at a relatively early stage of development and there are few PRC laws or regulations specifically regulating the e-commerce industry.
On August 31, 2018, the Standing Committee of the National People’s Congress promulgated the E-Commerce Law, which became effective on January 1, 2019. Pursuant to the E-Commerce Law, an e-commerce platform operator shall (i) collect, verify and register the truthful information submitted by the third-party merchants that apply to sell products or provide services on its platform, including the identities, addresses, contacts and licenses, establish registration archives and update such information on a regular basis; (ii) submit the identification information of the third-party merchants on its platform to market regulatory administrative department as required and remind the third-party merchants to complete the registration with market regulatory administrative department; (iii) submit identification information and tax-related information to tax authorities as required in accordance with the laws and regulations regarding the administration of tax collection and remind the individual third-party merchants to complete the tax registration; (iv) record and retain the information of the products and services and the transaction information for no less than 3 years; (v) display the platform service agreement and the transaction rules or links to such information on the homepage of the platform; (vi) display the noticeable labels regarding the products or services provided by the platform operator itself on its platform, and take liabilities for such products and services; (vii) establish a credit evaluation system, display the credit evaluation rules, provide consumers with accesses to make comments on the products and services provided on its platform, and restrain from deleting such comments; and (viii) establish intellectual property protection rules, and take necessary measures when any intellectual property holder notifies the platform operator that his intellectual property rights have been infringed. An e-commerce platform operator shall take joint liabilities with the third-party merchants on its platform and may be subject to warnings and fines up to RMB2 million where (i) it fails to take necessary measures when it knows or should have known that the products or services provided by the third-party merchants on its platform do not meet the personal or property safety requirements or such third-party merchants’ other acts may infringe on the lawful rights and interests of the consumers; or (ii) it fails to take necessary measures, such as deleting and blocking information, disconnecting, terminating transactions and services, when it knows or should have known that the third-party merchants on its platform infringe any intellectual property rights of any other third party. With respect to products or services affecting the consumers’ life and health, if an e-commerce platform operator fails to verify the third-party merchants’ qualification or fails to fulfill its obligations to safeguard the safety of consumers, which results in damages to the consumers, it shall take corresponding liabilities and may be subject to warnings and fines up to RMB2 million.
111
Table of Contents
On March 15, 2021, the SAMR promulgated the Measures for the Supervision and Administration of Online Trading, which aims to regulate business activities involving the sale of commodities or provision of services through the internet and other information networks, to replace earlier measures from 2014. Pursuant to these measures, online trading operators are classified into four types: the online trading platform operators, operators on platform, operators of self-built websites, and operators that carry out online trading activities through other online services. These measures reinforce the operation requirements as provided under the E-Commerce Law and the principles of legality, rationality and necessity in the collection and use of the users’ information and disclosure of the rules, purposes, methods and scopes of collection and use of user information. These measures also provide that the online trading operators (i) shall not use false transactions, fabricated user review etc. to conduct false or misleading business promotion, so as to defraud or mislead consumers and (ii) shall not eliminate or restrict competition, damage or ruin the competitor’s reputation. Furthermore, the measures impose a series of regulatory requirements on new forms of online trading, such as online social networking e-commerce and online livestreaming e-commerce.
In March 2016, the State Taxation Administration, the Ministry of Finance and the General Administration of Customs jointly issued the Circular on Tax Policy for Cross-Border E-commerce Retail Imports, which took effect in April 2016. Pursuant to this circular, goods imported through the cross-border e-commerce retail are subject to tariff, import value-added tax, and consumption tax based on the types of goods. Individuals purchasing any goods imported through cross-border e-commerce retail are taxpayers, and e-commerce companies, companies operating e-commerce transaction platforms or logistic companies are required to withhold the taxes.
We are subject to these measures as a result of our online retail marketplace business.
Regulations Relating to Internet Content
The Administrative Measures on Internet Information Services specify that internet information services regarding news, publications, education, medical and health care, pharmacy and medical devices, among other things, are to be examined, approved and regulated by the authorities. Internet information providers are prohibited from providing services beyond those included in the scope of their ICP licenses or filings. Furthermore, these measures clearly specify a list of prohibited content. Internet information providers are prohibited from producing, copying, publishing or distributing information that is humiliating or defamatory to others or that infringes the lawful rights and interests of others. Internet information providers that violate the prohibition may face criminal charges or administrative sanctions by the PRC authorities. Internet information providers must monitor and control the information posted on their websites. If any prohibited content is found, they must remove the offending content immediately, keep a record of it and report to the authorities. Furthermore, in 2019, the CAC issued the Provisions on the Management of Network Information Content Ecology, which became effective on March 1, 2020, to further strengthen the regulation and management of network information content. Pursuant to the Provisions on the Management of Network Information Content Ecology, each network information content service platform is required, among others, (i) not to disseminate any information prohibited by laws and regulations, such as information jeopardizing national security; (ii) to strengthen the examination of advertisements published on such network information content service platform; (iii) to promulgate management rules and platform convention and improve user agreement, such that such network information content service platform could clarify users’ rights and obligations and perform management responsibilities required by laws, regulations, rules and convention; (iv) to establish convenient means for complaints and reports; and (v) to prepare annual work report regarding its management of network information content ecology. In addition, a network information content service platform must not, among others, (i) utilize new technologies such as deep learning and virtual reality to engage in activities prohibited by laws and regulations; (ii) engage in online traffic fraud, malicious traffic rerouting and other activities related to fraudulent account, illegal transaction account or maneuver of users’ account; or (iii) infringe a third party’s legitimate rights or seek illegal interests by way of interfering with information display.
112
Table of Contents
On September 15, 2021, the CAC promulgated the Opinions on Further Enforcing Responsibilities on Website Platforms as the Main Responsible Party for Information Content Management. In accordance with the Opinions, website platforms are required to perform specific responsibilities as the main responsible party for information content management, including, among others, enhancing the platform community rules, strengthening the regulation and management of accounts, improving the content vetting mechanism, improving the quality of information content, managing the dissemination of information content, and strengthening the management of key functions.
Internet information in China is also regulated and restricted from a national security standpoint. The National People’s Congress, China’s national legislative body, has enacted the Decisions on Maintaining Internet Security, which may subject violators to criminal punishment in China for any effort to: (1) gain improper entry into a computer or system of strategic importance; (2) disseminate politically disruptive information; (3) leak state secrets; (4) spread false commercial information; or (5) infringe intellectual property rights. The Ministry of Public Security has promulgated measures that prohibit use of the internet in ways which, among other things, result in a leakage of state secrets or a spread of socially destabilizing content.
Regulations Relating to Information Security
The National People’s Congress has enacted legislation that prohibits use of the internet that breaches the public security, disseminates socially destabilizing content or leaks state secrets. Breach of public security includes breach of national security and infringement on legal rights and interests of the state, society or citizens. Socially destabilizing content includes any content that incites defiance or violations of PRC laws or regulations or subversion of the PRC government or its political system, spreads socially disruptive rumors or involves cult activities, superstition, obscenities, pornography, gambling or violence. State secrets are defined broadly to include information concerning PRC national defense, state affairs and other matters as determined by the PRC authorities.
Pursuant to applicable regulations, ICP operators must complete mandatory security filing procedures and regularly update information security and monitoring systems for their websites with local public security authorities, and must also report any public dissemination of prohibited content.
In December 2015, the Standing Committee of the National People’s Congress promulgated the Anti-Terrorism Law of the PRC, which took effect on January 1, 2016 and was amended on April 27, 2018. According to the law, telecommunication service operators or internet service providers shall (i) provide technical interfaces, decryption and other technical support and assistance for the competent departments to prevent and investigate terrorist activities; (ii) implement network security and information monitoring systems as well as safety and technical prevention measures to avoid the dissemination of terrorism information, delete the terrorism information, immediately halt its dissemination, keep records and report to the competent departments once the terrorism information is discovered; and (iii) examine customer identities before providing services. Any violation of the law may result in severe penalties, including substantial fines.
In November 2016, the Standing Committee of the National People’s Congress promulgated the Cyber Security Law of the PRC, which took effect on June 1, 2017. In accordance with the Cyber Security Law, network operators must comply with applicable laws and regulations and fulfill their obligations to safeguard network security in conducting business and providing services. Network service providers must take technical and other necessary measures as required by laws, regulations and mandatory requirements to safeguard the operation of networks, respond to network security effectively, prevent illegal and criminal activities, and maintain the integrity, confidentiality and usability of network data. On December 28, 2021, the CAC and other twelve PRC governmental authorities jointly issued the Cybersecurity Review Measures, with effect from February 15, 2022, which provide detailed cybersecurity review procedures for the purchase of network products and services by operators of “critical information infrastructure” or the data processing activities by a network platform operator. According to the Cybersecurity Review Measures, “network products and services” primarily refer to core network equipment, important communication product, high-performance computers and servers, mass storage equipment, large databases and applications, network security equipment, cloud computing services, and other network products and services that may have an important impact on the security of critical information infrastructure, cyber security or data security.
113
Table of Contents
For the further purposes of regulating data processing activities, safeguarding data security, promoting data development and utilization, protecting the lawful rights and interests of individuals and organizations, and maintaining national sovereignty, security, and development interests, on June 10, 2021, Standing Committee of the PRC National People’s Congress published the Data Security Law of the People’s Republic of China, which took effect on September 1, 2021. The Data Security Law requires data processing, which includes the collection, storage, use, processing, transmission, provision, publication of data, to be conducted in a legitimate and proper manner. The Data Security Law provides for data security and privacy obligations on entities and individuals carrying out data activities. The Data Security Law also introduces a data classification and hierarchical protection system based on the importance of data in economic and social development, and the degree of harm it may cause to national security, public interests, or legitimate rights and interests of individuals or organizations if such data are tampered with, destroyed, leaked, illegally acquired or illegally used. The appropriate level of protection measures is required to be taken for each respective category of data. For example, a processor of important data is required to designate the personnel and the management body responsible for data security, carry out risk assessments of its data processing activities and file the risk assessment reports with the competent authorities. State core data, i.e. data having a bearing on national security, the lifelines of national economy, people’s key livelihood and major public interests, shall be subject to stricter management system. Moreover, the Data Security Law provides a national security review procedure for those data activities which affect or may affect national security and imposes export restrictions on certain data and information. In addition, the Data Security Law also provides that any organization or individual within the territory of the PRC shall not provide any foreign judicial body and law enforcement body with any data without the approval of the competent PRC governmental authorities. As the Data Security Law was recently promulgated, we may be required to make further adjustments to our business practices to comply with this law, as well as any adjustments that may be required by the ultimate Personal Information Protection Law.
On July 6, 2021, certain PRC regulatory authorities issued Opinions on Strictly Cracking Down on Illegal Securities Activities, which, among others, provides for improving the laws and regulations on data security, cross-border data transmission, and confidential information management. It provided that efforts will be made to revise the regulations on strengthening the confidentiality and file management relating to the offering and listing of securities overseas, to implement the responsibility on information security of overseas listed companies, and to strengthen the standardized management of cross-border information provision mechanisms and procedures.
On November 14, 2021, the CAC released the discussion draft of the Administrative Measures for Internet Data Security, which provides that data processors refer to individuals or organizations that autonomously determine the purpose and the manner of processing data. In accordance with the draft measures, data processors shall apply for a cybersecurity review for the following activities: (i) merger, reorganization or division of internet platform operators that have acquired a large number of data resources related to national security, economic development or public interests to the extent that affects or may affect national security; (ii) listing abroad of data processors which process over one million users’ personal information; (iii) listing in Hong Kong which affects or may affect national security; or (iv) other data processing activities that affect or may affect national security. Besides, data processors that are listed overseas shall carry out an annual data security assessment. The draft measures remains unclear on whether the requirements will be applicable to companies that have been listed in the United States and Hong Kong, such as us. There is no timetable as to when the draft measures will be enacted.
On July 30, 2021, the State Council issued the Regulations on Protection of Critical Information Infrastructure. Pursuant to these regulations, critical information infrastructure shall mean the important network facilities or information systems of key industries or fields such as public communication and information service, energy, transportation, water conservation, finance, public services, e-government affairs and national defense science, and important network facilities or information systems which may endanger national security, people’s livelihood and public interest once there occur damage, malfunctioning or data leakage to them. The Regulations provide that no individual or organization may carry out any illegal activity of intruding into, interfering with, or sabotaging any critical information infrastructures, or endanger the security of any critical information infrastructures. The Regulations also require that critical information infrastructure operators shall establish a cybersecurity protection system and accountability system, and that the main responsible person of a critical information infrastructure operator shall take full responsibility for the security protection of the critical information infrastructures operated by it. In addition, the administration departments for each important industry and sector shall be responsible for formulating the rule of critical information infrastructure determination applicable to their respective industry or sector, and determine the critical information infrastructure operators in their industry or sector.
114
Table of Contents
On July 12, 2021, the MIIT and two other authorities jointly issued the Provisions on the Administration of Security Vulnerabilities of Network Products. The Provisions state that, no organization or individual may abuse the security vulnerabilities of network products to engage in activities that endanger network security, or to illegally collect, sell, or publish the information on such security vulnerabilities. Anyone who is aware of the aforesaid offences shall not provide technical support, advertising, payment settlement and other assistance to the offenders. According to the Provisions, network product providers, network operators, and platforms collecting network product security vulnerabilities shall establish and improve channels for receiving network product security vulnerability information and keep such channels available, and retain network product security vulnerability information reception logs for at least six months. The Provisions also bans provision of undisclosed vulnerabilities to overseas organizations or individuals other than to the product providers.
On July 7, 2022, the CAC promulgated the Security Assessment Measures for Outbound Data Transfer, which became effective on September 1, 2022. These measures provide for the circumstances under which a data processor shall be subject to security assessment, including (i) where a data processor provides important data abroad; (ii) where a critical information infrastructure operator or a data processor that processes personal information of more than one million individuals provides personal information abroad; (iii) where a data processor that has exported personal information of over 100,000 individuals or sensitive personal information of over 10,000 individuals in total since January 1 of the previous year provides personal information abroad; and (iv) other circumstances prescribed by the CAC.
Furthermore, the Provisions on Technological Measures for Internet Security Protection, promulgated by the Ministry of Public Security and became effective in March 2006, require all ICP operators to keep records of certain information about its users (including user registration information, log-in and log-out time, IP address, content and time of posts by users) for at least 60 days and submit the above information as required by laws and regulations. The Decision on Strengthening Network Information Protection, which was promulgated by the Standing Committee of the National People’s Congress in December 2012, states that ICP operators must request identity information from users when ICP operators provide information publication services to the users. If ICP operators come across prohibited information, they must immediately cease the transmission of such information, take measures such as elimination, keep records, and report to the government authorities.
On October 21, 2019, the Supreme People’s Court and the Supreme People’s Procuratorate of the PRC jointly issued the Interpretations on Certain Issues Regarding the Applicable of Law in the Handling of Criminal Case Involving Illegal Use of Information Networks and Assisting Committing Internet Crimes, which came into effect on November 1, 2019, and further clarifies the meaning of Internet service provider and the severe situations of the crimes.
Regulations Relating to Internet Privacy
The PRC Constitution states that PRC law protects the freedom and privacy of communications of citizens and prohibits infringement of these rights. In recent years, PRC government authorities have enacted legislation on internet use to protect personal information from any unauthorized disclosure. The Decision on Strengthening Network Information Protection provides that electronic information that identifies a citizen or involves privacy of any citizen is protected by law and must not be unlawfully collected or provided to others. ICP operators collecting or using personal electronic information of citizens must specify the purposes, manners and scopes of information collection and uses, obtain consent of the relevant citizens, and keep the collected personal information confidential. ICP operators are prohibited from disclosing, tampering with, damaging, selling or illegally providing others with, collected personal information. ICP operators are required to take technical and other measures to prevent the collected personal information from any unauthorized disclosure, damage or loss. The Administrative Measures on Internet Information Services prohibit an ICP operator from insulting or slandering a third party or infringing upon the lawful rights and interests of a third party. According to the Provisions on Protection of Personal Information of Telecommunication and Internet Users, which was promulgated by MIIT and became effective in September 2013, telecommunication business operators and ICP operators are responsible for the security of the personal information of users they collect or use in the course of their provision of services. Without obtaining the consent from the users, telecommunication business operators and ICP operators may not collect or use the users’ personal information. The personal information collected or used in the course of provision of services by the telecommunication business operators or ICP operators must be kept in strict confidence, and may not be divulged, tampered with or damaged, and may not be sold or illegally provided to others. The ICP operators are required to take certain measures to prevent any divulgence of, damage to, tampering with or loss of users’ personal information. In accordance with the Cyber Security Law, network operators are required to collect and use personal information in compliance with the principles of legitimacy, properness and necessity, and strictly within the scope of authorization by the subject of personal information unless otherwise prescribed by laws or regulations. In the event of any unauthorized disclosure, damage or loss of collected personal information, network operators must take immediate remedial measures, notify the affected users and report the incidents to the authorities in a timely manner. If any user knows that a network operator illegally collects and uses his or her personal information in violation of laws, regulations or any agreement with the user, or the collected and stored personal information is inaccurate or wrong, the user has the right to request the network operator to delete or correct the collected personal information.
115
Table of Contents
The telecommunications authorities are further authorized to order ICP operators to rectify unauthorized disclosure. ICP operators are subject to legal liability, including warnings, fines, confiscation of illegal gains, revocation of licenses or filings, closing of the websites, administrative punishment, criminal liabilities, or civil liabilities, if they violate provisions on internet privacy. Pursuant to the Ninth Amendment to the Criminal Law issued by the Standing Committee of the National People’s Congress in August 2015 and becoming effective in November 2015, the standards of crime of infringing citizens’ personal information were amended accordingly and the criminal culpability of unlawful collection, transaction, and provision of personal information has been reinforced. In addition, any ICP provider that fails to fulfill the obligations related to information cybersecurity administration as required by applicable laws and refuses to rectify upon orders, will be subject to criminal liability for (i) dissemination of illegal information in large scale; (ii) severe effect due to the leakage of the client’s information; (iii) serious loss of evidence of criminal activities; or (iv) other severe situations, and any individual or entity that (x) sells or provides personal information to others unlawfully, or (y) steals or illegally obtains any personal information, will be subject to criminal liability in severe situations. In addition, the Interpretations of the Supreme People’s Court and the Supreme People’s Procuratorate of the PRC on Several Issues Concerning the Application of Law in Handling Criminal Cases of Infringing Personal Information, effective in June 2017, have clarified certain standards for the conviction and sentencing in relation to personal information infringement. The PRC government has the power and authority to order ICP operators to turn over personal information if an internet user posts any prohibited content or engages in illegal activities on the internet. The Civil Code further provides in a stand-alone chapter of right of personality and reiterate that the personal information of a natural person shall be protected by the law. Any organization or individual shall legitimately obtain such personal information of others in due course on a need-to-know basis and ensure the safety and privacy of such information, and refrain from excessively handling or using such information.
With respect to the security of information collected and used by mobile apps, pursuant to the Announcement of Conducting Special Supervision against the Illegal Collection and Use of Personal Information by Apps, which was issued on January 23, 2019, app operators should collect and use personal information in compliance with the Cyber Security Law and should be responsible for the security of personal information obtained from users and take effective measures to strengthen the personal information protection. Furthermore, app operators should not force their users to make authorization by means of bundling, suspending installation or in other default forms and should not collect personal information in violation of laws, regulations or breach of user agreements. Such regulatory requirements were emphasized by the Notice on the Special Rectification of Apps Infringing upon User’s Personal Rights and Interests, which was issued by MIIT on October 31, 2019. On November 28, 2019, the CAC, the MIIT, the Ministry of Public Security and the SAMR jointly issued the Methods of Identifying Illegal Acts of Apps to Collect and Use Personal Information. This regulation further illustrates certain commonly-seen illegal practices of apps operators in terms of personal information protection, including “failure to publicize rules for collection and use,” “failure to expressly state the purpose, manner and scope of collecting and using personal information,” “collection and use of personal information without consent of users,” “collecting personal information irrelevant to the services provided by such app in violation of the principle of necessity,” “provision of personal information to others without consent,” “failure to provide the function of deleting or correcting personal information as required by laws” and “failure to publish information such as methods for complaints and reporting.” Among others, any of the following acts of an app operator will constitute “collection and use of personal information without consent of users”: (i) collecting an user’s personal information or activating the permission for collecting any user’s personal information without obtaining such user’s consent; (ii) collecting personal information or activating the permission for collecting the personal information of any user who explicitly refuses such collection, or repeatedly seeking for user’s consent such that the user’s normal use of such app is disturbed; (iii) any user’s personal information which has been actually collected by the app operator or the permission for collecting any user’s personal information activated by the app operator is beyond the scope of personal information which such user authorizes such app operator to collect; (iv) seeking for any user’s consent in a non-explicit manner; (v) modifying any user’s settings for activating the permission for collecting any personal information without such user’s consent; (vi) using users’ personal information and any algorithms to directionally push any information, without providing the option of non-directed pushing such information; (vii) misleading users to permit collecting their personal information or activating the permission for collecting such users’ personal information by improper methods such as fraud and deception; (viii) failing to provide users with the means and methods to withdraw their permission of collecting personal information; and (ix) collecting and using personal information in violation of the rules for collecting and using personal information promulgated by such app operator.
116
Table of Contents
On August 22, 2019, the CAC promulgated the Provisions on the Internet Protection of Children’s Personal Information, which took effect on October 1, 2019, requiring that before collecting, using, transferring or disclosing the personal information of a child, the Internet service operator should inform the child’s guardians in a noticeable and clear manner and obtain their consents. Meanwhile, internet service operators should take measures like encryption when storing children’s personal information. On March 12, 2021, the CAC and three other authorities jointly issued the Rules on the Scope of Necessary Personal Information for Common Types of Mobile Internet Applications. The Rules specifies the scope of necessary personal information to be collected each for a variety of common mobile internet applications, such as maps and navigation apps, online ride-hailing apps, instant messaging apps, online community apps. Operators of such apps shall not refuse to provide basic services to users on the ground of users’ refusal to provide their personal non-essential information.
In addition, on August 20, 2021, the Standing Committee of the National People’s Congress adopted the Personal Information Protection Law which took effect on November 1, 2021. The Personal Information Protection Law requires, among others, that (i) the processing of personal information should have a clear and reasonable purpose which should be directly related to the processing purpose, in a method that has the least impact on personal rights and interests, and (ii) the collection of personal information should be limited to the minimum scope necessary to achieve the processing purpose to avoid the excessive collection of personal information. Different types of personal information and personal information processing will be subject to various rules on consent, transfer, and security. Entities handling personal information shall bear responsibilities for their personal information handling activities, and adopt necessary measures to safeguard the security of the personal information they handle. The entities failing to comply could be ordered to correct, or suspend or terminate the provision of services, and face confiscation of illegal income, fines or other penalties.
Regulations Relating to Artificial Intelligence
Pursuant to the Internet Information Service Algorithmic Recommendation Management Provisions, which came into effect on March 1, 2022, algorithm recommendation service providers shall clearly inform users of their provision of algorithm recommendation services, and make public the basic principles, intentions and main operating mechanisms of the algorithm recommendation services. The algorithmic recommendation service providers shall not (i) carry out any illegal activity which may endanger national security and social public interest, disturb economic order and social order, or infringe third parties’ legal interest, or (ii) spread any information prohibited by laws or regulations. Algorithm recommendation service providers selling goods or providing services to consumers shall also protect consumers’ rights of fair trade, and are prohibited from carrying out illegal conduct such as unreasonable, differentiated treatment based on consumers’ preferences, purchase behavior or such other characteristics.
On July 10, 2023, the Cyberspace Administration of China and six other regulatory authorities in the Chinese mainland promulgated the Interim Measures for Generative Artificial Intelligence Services, which took effect on August 15, 2023. The measures impose compliance requirements for providers of generative artificial intelligence services to the general public within the Chinese mainland. The measures stipulate that providers of generative artificial intelligence services related to text, image, audio, video and other content to the general public within the Chinese mainland will be responsible as “producers of Internet information content” and “personal information processors,” with the responsibilities specified in the Personal Information Protection Law, the Data Security Law, the Internet Security Law, and other Chinese mainland laws and regulations related to cybersecurity and personal information protection. Providers of generative artificial intelligence services are required to enter into service agreements with their users and adopt effective measures to prevent minor users from over-relying upon or becoming addicted to generative artificial intelligence services. In addition, providers of generative artificial intelligence services that have the potential to influence public opinion or provoke social agitation are required to conduct security assessments and complete filings in accordance with the Internet Information Service Algorithmic Recommendation Management Provisions.
117
Table of Contents
Regulations Relating to Product Quality, Consumer Protection and Operation Safety
The Product Quality Law applies to all production and sale activities in China. Pursuant to this law, products offered for sale must satisfy the applicable quality and safety standards. Enterprises may not produce or sell counterfeit products in any fashion, including forging brand labels or giving false information regarding a product’s manufacturer. Violations of state or industrial standards for health and safety and any other related violations may result in civil liabilities and administrative penalties, such as compensation for damages, fines, suspension or shutdown of business, as well as confiscation of products illegally produced and sold and the proceeds from such sales. Severe violations may subject the responsible individual or enterprise to criminal liabilities. Where a defective product causes physical injury to a person or damage to another person’s property, the victim may claim compensation from the manufacturer or from the seller of the product. If the seller pays compensation and it is the manufacturer that should bear the liability, the seller has a right of recourse against the manufacturer. Similarly, if the manufacturer pays compensation and it is the seller that should bear the liability, the manufacturer has a right of recourse against the seller.
The Consumer Protection Law sets out the obligations of business operators and the rights and interests of the consumers in China. Pursuant to this law, business operators must guarantee that the commodities they sell satisfy the requirements for personal or property safety, provide consumers with authentic information about the commodities, and guarantee the quality, function, usage and term of validity of the commodities. Failure to comply with the Consumer Protection Law may subject business operators to civil liabilities such as refunding purchase prices, replacement of commodities, repairing, ceasing damages, compensation, and restoring reputation, and even subject the business operators or the responsible individuals to criminal penalties when personal damages are involved or if the circumstances are severe. The Consumer Protection Law was further amended in October 2013 and became effective in March 2014. The amended Consumer Protection Law further strengthen the protection of consumers and impose more stringent requirements and obligations on business operators, especially on the business operators through the internet. For example, the consumers are entitled to return the goods (except for certain specific goods, such as custom-made goods, fresh and perishable goods, digital products (e.g. audio-visual products, computer software downloaded online or unpacked by the consumer), newspapers and periodicals delivered and other goods for which non-return of goods is confirmed by the consumer at the time of purchase based on the characteristics of the goods,) within seven days upon receipt without any reasons when they purchase the goods from business operators on the internet. The consumers whose interests have been damaged due to their purchase of goods or acceptance of services on online marketplace platforms may claim damages from sellers or service providers. Where the providers of the online marketplace platforms are unable to provide the real names, addresses and valid contact details of the sellers or service providers, the consumers may also claim damages from the providers of the online marketplace platforms. Providers of online marketplace platforms that know or should have known that sellers or service providers use their platforms to infringe upon the legitimate rights and interests of consumers but fail to take necessary measures must bear joint and several liabilities with the sellers or service providers. Moreover, if business operators deceive consumers or knowingly sell substandard or defective products, they should not only compensate consumers for their losses, but also pay additional damages equal to three times the price of the goods or services.
We are subject to the Product Quality Law and the Consumer Protection Law as an online supplier of commodities and a provider of online marketplace platform and believe that we are currently in compliance with these regulations in all material aspects.
In addition, we are subject to PRC regulations relating to operation safety. According to the Work Safety Law, which was effective on November 1, 2002 and most recently amended on June 10, 2021, the principal person-in-charge of a production and operation entity shall be the primary person responsible for the work safety of such entity, and the production and operation entities in emerging industries and fields such as platform economy shall, based on the characteristics of their respective industries and fields, establish, improve and implement a responsibility system for work safety of employees, as well as strengthen the education and training on work safety for employees.
118
Table of Contents
Regulations Relating to Pricing
In China, the prices of a very small number of products and services are guided or fixed by the government. According to the Pricing Law, business operators must, as required by the government departments in charge of pricing, mark the prices explicitly and indicate the name, origin of production, specifications, and other related particulars clearly. Business operators may not sell products at a premium or charge any fees that are not explicitly indicated. Business operators must not commit the specified unlawful pricing activities, such as colluding with others to manipulate the market price, using false or misleading prices to deceive consumers to transact, or conducting price discrimination against other business operators. Failure to comply with the Pricing Law may subject business operators to administrative sanctions such as warning, ceasing unlawful activities, compensation, confiscating illegal gains, fines. The business operators may be ordered to suspend business for rectification, or have their business licenses revoked if the circumstances are severe. We are subject to the Pricing Law as online retailer as well as business operator. We believe that our pricing activities are currently in compliance with the law in all material aspects.
Regulations Relating to Mobile Telecommunications Resale Business
In May 2013, the MIIT issued the Circular regarding the Pilot Work on Implementation of Mobile Telecommunications Resale Business and the Pilot Program on Mobile Telecommunications Resale Business, pursuant to which private capital is encouraged to invest in the mobile telecommunications resale business. The resale business refers to the business whereby a reseller purchases mobile telecommunications services (excluding mobile satellite telecommunications service) from a basic telecommunications service provider who owns a mobile network, repackages the services with its private brand and sells the services to end users. Under the circular and the pilot program, the mobile telecommunications resale is categorized as a Class II basic telecommunications business but managed by reference to the value-added telecommunications business. A mobile communications reseller does not build its own wireless network, core network, transmission network and other mobile telecommunications network infrastructures, but must build its customer service system and may build its own business management platform, and billing, business accounting and other business supporting systems as needed. The applicant for the mobile telecommunications resale business must be a private company of which the private capital must account for no less than 50% of the capital and the capital contributed by its largest shareholder must come from private capital. A mobile telecommunications reseller is required to enter into a commercial contract for mobile telecommunications resale business with a basic telecommunications service provider, specifying the resources for resale to mobile communications users, division of responsibilities for service quality assurance between both parties, as well as protection of users’ rights and interests and user information. Resellers may pre-charge service fees for up to two years from users on the condition that they provide evidence of their measures to ensure long-term services, and must abide by the Telecommunications Regulations, the Administrative Measures on Internet Information Services and other PRC related laws and regulations. In addition, the MIIT issued the Circular of the Ministry of Industry and Information Technology on the Official Commercial Use of Mobile Communication Resale Business, pursuant to which the mobile communication resale business will be transferred from the pilot to the formal commercial use, and the enterprise that has already approved to be a pilot to conduct the mobile telecommunications resale business, and intends to continue the business, the commercial contract shall be renewed in accordance with the provisions of this circular and shall apply for a renew its telecommunications business license. Jingdong 360 has been approved to be a pilot to conduct the mobile telecommunications resale business, has renewed the telecommunications business license, and has cooperated with China Telecom in 60 cities and with China Unicom in 105 cities.
Regulations Relating to Leasing
Pursuant to the Law on Administration of Urban Real Estate which took effect in January 1995 with the latest amendment on August 26, 2019, which became effective on January 1, 2020, lessors and lessees are required to enter into a written lease contract, containing such provisions as the term of the lease, the use of the premises, rental price, liability for repair, and other rights and obligations of both parties. Both lessor and lessee are also required to file for registration and record the lease contract with the real estate administration department. Pursuant to implementing rules stipulated by certain provinces or cities, if the lessor and lessee fail to go through the registration procedures, both lessor and lessee may be subject to fines.
According to the PRC Civil Code (which took effect on January 1, 2021), the lessee may sublease the leased premises to a third party, subject to the consent of the lessor. Where the lessee subleases the premises, the lease contract between the lessee and the lessor remains valid. The lessor is entitled to terminate the lease contract if the lessee subleases the premises without the consent of the lessor. In addition, if the ownership of the leased premises changes during the lessee’s possession in accordance with the terms of the lease contract, the validity of the lease contract shall not be affected.
119
Table of Contents
Pursuant to the PRC Civil Code, if the mortgaged property has been leased and transferred for occupation prior to the establishment of the mortgage right, the original tenancy shall not be affected by such mortgage right. According to the Interpretation of the Supreme People’s Court on Several Issues concerning the Application of Law in the Trial of Cases about Disputes Over Lease Contracts on Urban Buildings (2020 version), which took effect on January 1, 2021, if the ownership of the leased premises changes during lessee’s possession in accordance with the terms of the lease contract, and the lessee requests the assignee to continue to perform the original lease contract, the PRC court shall support it, except that the mortgage right has been established before the lease of the leased premises and the ownership changes due to the mortgagee’s realization of the mortgage right.
Regulations Relating to Advertising Business
The SAMR is the government agency responsible for regulating advertising activities in the PRC. According to PRC laws and regulations, companies that engage in advertising activities must obtain a business license from the SAMR or its local branches which specifically includes operating an advertising business within its business scope. The business license of an advertising company is valid for the duration of its existence, unless the license is suspended or revoked due to a violation of any law or regulation. PRC advertising laws and regulations set forth certain content requirements for advertisements in the PRC including, among other things, prohibitions on false or misleading content, superlative wording, socially destabilizing content or content involving obscenities, superstition, violence, discrimination or infringement of the public interest. Advertisers, advertising agencies, and advertising distributors are required to ensure that the content of the advertisements they prepare or distribute is true and in full compliance with applicable law. In providing advertising services, advertising operators and advertising distributors must review the supporting documents provided by advertisers for advertisements and verify that the content of the advertisements complies with applicable PRC laws and regulations. Prior to distributing advertisements that are subject to government censorship and approval, advertising distributors are obligated to verify that such censorship has been performed and approval has been obtained. The release or delivery of advertisements through the internet must not impair the normal use of the network by users. The advertisements released in pop-up form on a webpage and other forms must show the close flag prominently and ensure one-click close. Violation of these regulations may result in penalties, including fines, confiscation of advertising income, orders to cease dissemination of the advertisements and orders to eliminate the effect of illegal advertisement. In circumstances involving serious violations, the SAMR or its local branches may revoke the violators’ licenses or permits for their advertising business operations.
In July 2016, the State Administration of Industry and Commerce issued the Interim Measures for the Administration of Internet Advertising to regulate internet advertising activities. On February 25, 2023, the SAMR released the Administrative Measures for Internet Advertising, which came into effect from May 1, 2023 and replaced Interim Measures for the Administration of Internet Advertising. The Administrative Measures for Internet Advertising set out, among other things, the following requirements for Internet advertising activities:
| • | online advertisements for tobacco (including e-cigarettes) are not allowed, and online advertisements for prescription medicine are not allowed unless otherwise permitted by laws and regulations; |
| • | online advertisements for special commodities and services such as medical treatments, pharmaceuticals, medical devices, agrochemicals, veterinary medicine, health foods and food for special medical purposes must be reviewed by competent authorities before online publication, and the advertisements for such commodities and services are not allowed to be published in the form of introducing health and wellness knowledge; |
| • | advertisements for medical treatments, pharmaceuticals, health foods, special medical purpose formula foods, medical devices, cosmetics, alcohol, beauty advertisements, and online game advertisements that are detrimental to the physical and mental health of minors shall not be published on Internet media targeted to minors; |
| • | Internet advertisements must be visibly marked as “advertisement” while paid-search results must be obviously distinguished from natural search results; and |
120
Table of Contents
| • | if the Internet advertisements are published by means of algorithmic recommendation or other technologies, the rules related to algorithm recommendation services and advertising records shall be included in the advertising archives. |
According to the Administrative Measures for Internet Advertising, the advertisers are responsible for the authenticity of the content of internet advertisements, while the internet advertisement publishers and advertisement agencies are required to establish, improve, and implement registration, review, and archive management systems for internet advertising businesses, which include verifying and registering advertiser information, verifying supporting documents and advertisements content, and allocating advertising review personnel familiar with advertising laws and regulations or establish advertising review bodies.
In addition, the Administrative Measures for Internet Advertising require internet platform operators providing internet information services to take measures to prevent and stop illegal advertisements, which include recording and storing the real identity information of users who publish advertisements for at least three years, monitoring and investigating the content of advertisements, and employing measures to stop illegal advertisements. Internet platform operators are also required to establish effective complaint and reporting mechanisms, cooperate with market regulatory departments in investigating illegal conduct, and use measures such as warnings, suspending or terminating services for users who publish illegal advertisements.
Regulations Relating to Intellectual Property Rights
The PRC has adopted comprehensive legislation governing intellectual property rights, including copyrights, patents, trademarks and domain names.
Copyright
Copyright in the PRC is principally protected under the Copyright Law of the PRC and its implementation rules. Reproducing, distributing, performing, projecting, broadcasting or compiling a work or communicating the same to the public via an information network without permission from the owner of the copyright therein, unless otherwise provided in the Copyright Law of the PRC and related rules and regulations, shall constitute infringements of copyrights. The infringer shall, according to the circumstances of the case, undertake to cease the infringement, take remedial action, and offer an apology, pay damages, etc. In addition, the Regulations on the Protection of Rights to Information Network Communication promulgated by the State Council on May 18, 2006 (as amended in 2013), provides specific rules on fair use, statutory license, and a safe harbor for use of copyrights and copyright management technology and specifies the liabilities of various entities for violations, including copyright holders, libraries and internet service providers.
Patent
The Patent Law provides for three types of patents, “invention,” “utility model” and “design.” Invention or utility models must meet three criteria to be patentable: novelty, inventiveness and practicability. The National Intellectual Property Administration is responsible for examining and approving patent applications. As of December 31, 2023, we had approximately 7,800 patents granted in China, over 600 patents granted outside China, approximately 11,000 patent applications pending in China and approximately 1,000 patent applications pending outside China.
Trademark
The Trademark Law and its implementation rules protect registered trademarks. The PRC Trademark Office of National Intellectual Property Administration is responsible for the registration and administration of trademarks throughout the PRC. The Trademark Law has adopted a “first-to-file” principle with respect to trademark registration. As of December 31, 2023, we had approximately 37,000 registered trademarks in different applicable trademark categories in different jurisdictions, approximately 38,000 trademark applications in China and over 7,000 outside China.
121
Table of Contents
Domain Name
Domain names are protected under the Administrative Measures on the Internet Domain Names promulgated by the MIIT. The MIIT is the major regulatory body responsible for the administration of the PRC internet domain names, under supervision of which the CNNIC is responsible for the daily administration of .cn domain names and Chinese domain names. CNNIC adopts the “first to file” principle with respect to the registration of domain names. In November 2017, the MIIT promulgated the Notice of the Ministry of Industry and Information Technology on Regulating the Use of Domain Names in Providing Internet-based Information Services, which became effective on January 1, 2018. Pursuant to the notice, the domain name used by an internet-based information service provider in providing internet-based information services must be registered and owned by such provider in accordance with the law. If the internet-based information service provider is an entity, the domain name registrant must be the entity (or any of the entity’s shareholders), or the entity’s principal or senior manager. We have registered jd.com, jdl.cn, jdhealth.com, 360buy.com, 360buy.cn, 360buy.com.cn and other domain names.
Regulations Relating to Employment
The Labor Contract Law and its implementation rules provide requirements concerning employment contracts between an employer and its employees. If an employer fails to enter into a written employment contract with an employee within one year from the date on which the employment relationship is established, the employer must rectify the situation by entering into a written employment contract with the employee and pay the employee twice the employee’s salary for the period from the day following the lapse of one month from the date of establishment of the employment relationship to the day prior to the execution of the written employment contract. The Labor Contract Law and its implementation rules also require compensation to be paid upon certain terminations, which significantly affects the cost of reducing workforce for employers. In addition, if an employer intends to enforce a non-compete provision with an employee in an employment contract or non-competition agreement, it has to compensate the employee on a monthly basis during the term of the restriction period after the termination or ending of the labor contract. Employers in most cases are also required to provide a severance payment to their employees after their employment relationships are terminated.
Enterprises in China are required by PRC laws and regulations to participate in certain employee benefit plans, including social insurance funds, namely a pension plan, a medical insurance plan, an unemployment insurance plan, a work-related injury insurance plan and a maternity insurance plan, and a housing provident fund, and contribute to the plans or funds in amounts equal to certain percentages of salaries, including bonuses and allowances, of the employees as specified by the local government from time to time at locations where they operate their businesses or where they are located. According to the Social Insurance Law, an employer that fails to make social insurance contributions may be ordered to pay the required contributions within a stipulated deadline and be subject to a late fee. If the employer still fails to rectify the failure to make social insurance contributions within the stipulated deadline, it may be subject to a fine ranging from one to three times the amount overdue. According to the Regulations on Management of Housing Fund, an enterprise that fails to make housing fund contributions may be ordered to rectify the noncompliance and pay the required contributions within a stipulated deadline; otherwise, an application may be made to a local court for compulsory enforcement.
Regulations Relating to Overseas Listing and M&A
On August 8, 2006, six PRC governmental and regulatory agencies, including the Ministry of Commerce and the CSRC, jointly promulgated the Regulations on Mergers and Acquisitions of Domestic Enterprises by Foreign Investors, a new regulation with respect to the mergers and acquisitions of domestic enterprises by foreign investors that became effective on September 8, 2006 and revised on June 22, 2009. Foreign investors shall comply with the M&A rules when they purchase equity interests of a domestic company or subscribe for the increased capital of a domestic company, and thus changing the nature of the domestic company into a foreign- invested enterprise; or when the foreign investors establish a foreign-invested enterprise in the PRC for the purpose of purchasing the assets of a domestic company and operating the asset; or when the foreign investors purchase the asset of a domestic company, establish a foreign-invested enterprise by injecting such assets, and operate the assets.
On July 6, 2021, the PRC government authorities issued Opinions on Strictly Cracking Down Illegal Securities Activities in Accordance with the Law. These opinions emphasized the need to strengthen the administration over illegal securities activities and the supervision on overseas listings by China-based companies and proposed to take effective measures, such as promoting the construction of regulatory systems to deal with the risks and incidents faced by China-based overseas-listed companies.
122
Table of Contents
On February 17, 2023, the CSRC, as approved by the State Council, released the Trial Measures. According to the Trial Measures, domestic companies in the Chinese mainland that directly or indirectly offer or list their securities in an overseas market, are required to file with the CSRC. Specifically, the securities under the Trial Measures refer to stocks, depositary receipts, convertible corporate bonds, exchangeable bonds and other equity-linked securities to be issued and offered in overseas markets by domestic companies directly or indirectly, while a direct offering and listing refers to the overseas offering and listing of a joint-stock company incorporated in the Chinese mainland, and an indirect offering and listing refers to the overseas offering and listing of a domestic company which conducts its business operations primarily in the Chinese mainland, in the name of an offshore company and based on the underlying equities, assets, earnings or similar interests of the domestic company. In particular, the determination of an indirect offering and listing will be conducted on a “substance over form” basis, and an offering and listing should be considered as an indirect overseas offering and listing by a domestic company if the issuer meets both of the following conditions: (i) any of the revenue, profits, total assets or net assets of such domestic company in the most recent financial year account for more than 50% of the corresponding data in the issuer’s audited consolidated financial statements for the same period; and (ii) the majority of its business operations are conducted in the Chinese mainland or its principal place of business is located in the Chinese mainland, or the majority of senior management in charge of business operations are Chinese citizens or have domicile in the Chinese mainland. According to the Trial Measures, an overseas offering and listing is prohibited under any of the following circumstances: (i) if the intended securities offering and listing is specifically prohibited by the laws, administrative regulations and provisions; (ii) if the intended securities offering and listing may constitute a threat to or endangers national security as reviewed and determined by competent authorities under the State Council in accordance with law; (iii) the domestic companies or their controlling shareholders or actual controllers have committed corruption, bribery, embezzlement, misappropriation of property, or other criminal offenses disruptive to the order of the socialist market economy in the past three years; (iv) the domestic companies are currently under investigations in connection with suspicion of having committed criminal offenses or material violations of applicable laws and regulations, and there is still no explicit conclusion; (v) there are material ownership disputes over the shareholdings held by the controlling shareholder or the shareholder under the control of the controlling shareholder or the actual controllers. According to the Trial Measures, the issuer or its affiliated domestic company, as the case may be, is required to file with the CSRC (i) with respect to its initial public offering and listing and its subsequent securities offering in an overseas market different from the market where it has listed, within three business days after its submission of listing application documents to the regulator in the place of intended listing, (ii) with respect to its follow-on offering in the same overseas market where it has listed (including issuance of any corporate convertible bonds, exchangeable bonds and other equity-linked securities, but excluding the offering for employees incentive, dividend distribution by shares and share split), within three business days after completion of such follow-on offering, (iii) with respect to listing by means of single or multiple acquisitions, share swap, transfers of shares and similar transactions, within three business days after its initial filing of the listing application or the first public announcement of the transaction, as case may be. Failure to comply with the filing requirements may result in an order of rectification, a warning and fines up to RMB10 million to the non-compliant domestic companies, and the directly responsible persons of the companies will be warned and fined between RMB500,000 and RMB5 million. Furthermore, if the controlling shareholder and the actual controller of the non-compliant companies organizes or instigates the breach, they will be fined between RMB1 million and RMB10 million. In addition to above filing requirements, the Filings Rules also requires an issuer to report to the CSRC within three business days after occurrence of any the following events: (i) its change of control; (ii) its being subject to investigation or sanctions by any overseas securities regulators or overseas authorities; (iii) its change of listing status or listing segment; (iv) voluntary or mandatory delisting; and (v) material change of its principal business operations to the extent that it ceases to be subject to the filing requirements of the Trial Measures.
Regulations Relating to Anti-Monopoly
The currently effective Anti-Monopoly Law was promulgated by Standing Committee of the National People’s Congress in 2007 and most recently amended on June 24, 2022. Pursuant to the Anti-Monopoly Law, the operators of a concentration of undertakings which reaches the standard for declaration shall make an advance declaration to the Anti-Monopoly Law enforcement authority under the State Council. The fines for illegal concentration of business operators shall be “no more than ten percent of its preceding year’s sales revenue if the concentration of business operator has or may have an effect of excluding or limiting competition; or a fine of up to RMB5 million if the concentration of business operator does not have an effect of excluding or limiting competition.” Pursuant to the Anti-Monopoly Law, the authority may require the operators to make a declaration where there is evidence that the concentration has or may have the effect of eliminating or restricting competition, even if such concentration does not reach the filing threshold.
123
Table of Contents
On February 7, 2021, the Anti-Monopoly Committee of the State Council promulgated the Anti-Monopoly Guidelines for the Internet Platform Economy Sector which stipulates that any concentration of undertakings involving variable interest entities shall fall within the scope of antimonopoly review. Furthermore, the Guidelines to Anti-Monopoly in the Field of Internet Platforms prohibit certain monopolistic acts of internet platforms so as to protect market competition and safeguard interests of users and undertakings participating in internet platform economy, including without limitation, prohibiting platforms with dominant position from abusing their market dominance (such as discriminating customers in terms of pricing and other transactional conditions using big data and analytics, coercing counterparties into exclusivity arrangements, using technology means to block competitors’ interface, favorable positioning in search results of goods displays, using bundle services to sell services or products, compulsory collection of unnecessary user data). On August 17, 2021, the SAMR issued the Provisions on Prohibition of Unfair Competition on the Internet (Draft for Comments), which prohibits business operators from using data, algorithms and other technical means to commit traffic hijacking, interference, malicious incompatibility and other improprieties to influence user choices or hinder or damage the normal operation of network products or services offered by other business operators.
Regulations Relating to PRC Value Added Tax
On March 23, 2016, the Ministry of Finance and the State Taxation Administration jointly issued the Circular on the Pilot Program for Overall Implementation of the Collection of Value Added Tax Instead of Business Tax, which took effect on May 1, 2016. Pursuant to this circular, all of the companies operating in construction, real estate, finance, modern service or other sectors which were required to pay business tax are required to pay VAT, in lieu of business tax. The VAT rate is 6%, except for rate of 11% for real estate sale, land use right transferring and providing service of transportation, postal sector, basic telecommunications, construction, real estate lease; rate of 17% for providing lease service of tangible property; and rate of zero for specific cross-bond activities.
On April 4, 2018, the Ministry of Finance and the State Taxation Administration jointly promulgated the Circular of the Ministry of Finance and the State Taxation Administration on Adjustment of Value-Added Tax Rates, according to which, (i) for VAT taxable sales or importation of goods originally subject to value-added tax rates of 17% and 11% respectively, such tax rates shall be adjusted to 16% and 10%, respectively; (ii) for purchase of agricultural products originally subject to deduction rate of 11%, such deduction rate shall be adjusted to 10%; (iii) for purchase of agricultural products for the purpose of production and sales or consigned processing of goods subject to tax rate of 16%, the input VAT will be calculated at a 12% deduction rate; (iv) for exported goods originally subject to tax rate of 17% and export tax refund rate of 17%, the export tax refund rate shall be adjusted to 16%; and (v) for exported goods and cross-border taxable acts originally subject to tax rate of 11% and export tax refund rate of 11%, the export tax refund rate shall be adjusted to 10%. This circular became effective on May 1, 2018 and shall supersede any previously existing provisions in the case of any inconsistency.
Further, On March 20, 2019, the Ministry of Finance, the State Taxation Administration and the General Administration of Customs jointly issued the Announcement on Policies for Deepening the VAT Reform, to further slash value-added tax rates. According to this announcement, (i) for general VAT payers’ sales activities or imports that are subject to VAT at an existing applicable rate of 16% or 10%, the applicable VAT rate is adjusted to 13% or 9% respectively; (ii) for the agricultural products purchased by taxpayers to which an existing 10% deduction rate is applicable, the deduction rate is adjusted to 9%; (iii) for the agricultural products purchased by taxpayers for production or commissioned processing, which are subject to VAT at 13%, the input VAT will be calculated at a 10% deduction rate; (iv) for the exportation of goods or labor services that are subject to VAT at 16%, with the applicable export refund at the same rate, the export refund rate is adjusted to 13%; (v) for the exportation of goods or cross-border taxable activities that are subject to VAT at 10%, with the export refund at the same rate, the export refund rate is adjusted to 9%; and (vi) for taxpayers providing production and living services, the deductible input VAT amount for the current period shall be added additional 10% based on the actual input VAT amount. This announcement came into effect on April 1, 2019 and shall be prevail in case of any conflict with existing provisions. On September 30, 2019, the Ministry of Finance and the State Taxation Administration jointly issued the Announcement on Clarifying the VAT Additional Deduction Policy for the Living Services, pursuant to which, from October 1, 2019 to December 31, 2021, the taxpayers engaging in providing living services are allowed to deduct additional 15% of the deductible input VAT amount for the current period from the payable tax. For aforementioned taxpayers providing production and living services relating to Announcement on Policies for Deepening the VAT Reform and Announcement on Clarifying the VAT Additional Deduction Policy for the Living Services, the input VAT additional deduction policies is further extended to December 31, 2022 according to the regulations. From January 1, 2023 to December 31, 2023, the VAT Additional Deduction policy is implemented in accordance with the following provisions: (i). Taxpayers in the productive service industry are allowed to add 5% of the current deductible input tax to offset the taxable amount; (ii). Taxpayers in the lifestyle service industry are allowed to deduct 10% of the current deductible input tax to offset the taxable amount.
124
Table of Contents
Regulations Relating to Dividend Withholding Tax
Pursuant to the Enterprise Income Tax Law and its implementation rules, if a non-resident enterprise has not set up an organization or establishment in the PRC, or has set up an organization or establishment but the income derived has no actual connection with such organization or establishment, it will be subject to a withholding tax on its PRC-sourced income at a rate of 10%. Pursuant to the Arrangement between the Chinese mainland and the Hong Kong Special Administrative Region for the Avoidance of Double Taxation and Tax Evasion on Income, the withholding tax rate in respect to the payment of dividends by a PRC enterprise to a Hong Kong enterprise is reduced to 5% from a standard rate of 10% if the Hong Kong enterprise directly holds at least 25% of the PRC enterprise. Pursuant to the Notice of the State Taxation Administration on the Issues concerning the Application of the Dividend Clauses of Tax Agreements, if the PRC tax authorities determine, in their discretion, that a company benefits from such reduced income tax rate due to a structure or arrangement that is primarily tax-driven, such PRC tax authorities may adjust the preferential tax treatment. Furthermore, the Administrative Measures for Non-Resident Taxpayer to Enjoy Treatments under Tax Treaties, which became effective in November 2015, require that non-resident enterprises which satisfy the criteria for entitlement to tax treaty benefits may, at the time of tax declaration or withholding declaration through a withholding agent, enjoy the tax treaty benefits, and be subject to ongoing administration by the tax authorities. In the case where the non-resident enterprises do not apply to the withholding agent to claim the tax treaty benefits, or the materials and the information stated in the reports and statements provided to the withholding agent do not satisfy the criteria for entitlement to tax treaty benefits, the withholding agent should withhold tax pursuant to the provisions of the PRC tax laws. The State Taxation Administration issued the Announcement of State Taxation Administration on Promulgation of the Administrative Measures on Non-resident Taxpayers Enjoying Treaty Benefits, or STA Circular 35, on October 14, 2019, which became effective on January 1, 2020. STA Circular 35 further simplified the procedures for enjoying treaty benefits and replaced the Administrative Measures for Non-Resident Taxpayer to Enjoy Treatments under Tax Treaties. According to STA Circular 35, no approvals from the tax authorities are required for a non-resident taxpayer to enjoy treaty benefits, where a nonresident taxpayer self-assesses and concludes that it satisfies the criteria for claiming treaty benefits, it may enjoy treaty benefits at the time of tax declaration or at the time of withholding through the withholding agent, but it shall gather and retain the materials as required for future inspection, and accept follow-up administration by the tax authorities. There are also other conditions for enjoying the reduced withholding tax rate according to other tax rules and regulations. According to the Circular on Several Issues regarding the “Beneficial Owner” in Tax Treaties, or Circular 9, which was issued on February 3, 2018 by the State Taxation Administration, effective as of April 1, 2018, when determining the applicant’s status of the “beneficial owner” regarding tax treatments in connection with dividends, interests or royalties in the tax treaties, several factors, including without limitation, whether the applicant is obligated to pay more than 50% of its income in twelve months to residents in third country or region, whether the business operated by the applicant constitutes the actual business activities, and whether the counterparty country or region to the tax treaties does not levy any tax or grant tax exemption on the incomes or levy tax at an extremely low rate, will be taken into account, and it will be analyzed according to the actual circumstances of the specific cases. This circular further provides that applicants who intend to prove his or her status of the “beneficial owner” shall submit the documents to the tax bureau according to the Administrative Measures for Non-Resident Enterprises to Enjoy Treatments under Tax Treaties. Accordingly, JD.com International Limited may be able to enjoy the 5% withholding tax rate for the dividends it received from Jingdong Century, if it satisfies the conditions prescribed under Notice of the State Taxation Administration on the Issues concerning the Application of the Dividend Clauses of Tax Agreements and other tax rules and regulations, and obtains the approvals as required. However, if the tax authorities consider the transactions or arrangements we have are for the primary purpose of enjoying a favorable tax treatment, the tax authorities may adjust the favorable withholding tax in the future.
125
Table of Contents
Regulations Relating to Foreign Exchange
The principal regulations governing foreign currency exchange in China are the Foreign Exchange Administration Regulations, most recently amended in August 2008. Under the PRC foreign exchange regulations, payments of current account items, such as profit distributions and trade and service-related foreign exchange transactions, can be made in foreign currencies without prior approval from SAFE by complying with certain procedural requirements. By contrast, approval from or registration with appropriate government authorities is required where RMB is to be converted into foreign currency and remitted out of China to pay capital expenses such as the repayment of foreign currency-denominated loans.
In August 2008, SAFE issued the Circular on the Relevant Operating Issues Concerning the Improvement of the Administration of the Payment and Settlement of Foreign Currency Capital of Foreign-Invested Enterprises, or SAFE Circular 142, regulating the conversion by a foreign-invested enterprise of foreign currency-registered capital into RMB by restricting how the converted RMB may be used. SAFE Circular 142 provides that the RMB capital converted from foreign currency registered capital of a foreign-invested enterprise may only be used for purposes within the business scope approved by the applicable government authority and may not be used for equity investments within the PRC. SAFE also strengthened its oversight of the flow and use of the RMB capital converted from foreign currency registered capital of foreign-invested enterprises. The use of such RMB capital may not be changed without SAFE’s approval, and such RMB capital may not in any case be used to repay RMB loans if the proceeds of such loans have not been used. In March 2015, SAFE issued the Circular on Reforming the Management Approach regarding the Settlement of Foreign Capital of Foreign-invested Enterprise, which took effect and replaced SAFE Circular 142 from June 1, 2015. According to Circular 19, the foreign exchange capital of foreign-invested enterprises shall be subject to the Discretionary Foreign Exchange Settlement, which means that the foreign exchange capital in the capital account of a foreign-invested enterprise for which the rights and interests of monetary contribution have been confirmed by the local foreign exchange bureau (or the book-entry registration of monetary contribution by the banks) can be settled at the banks based on the actual operational needs of the foreign-invested enterprise, and if a foreign-invested enterprise needs to make further payment from such account, it still needs to provide supporting documents and proceed with the review process with the banks. Furthermore, Circular 19 stipulates that the use of capital by foreign-invested enterprises shall follow the principles of authenticity and self-use within the business scope of enterprises. The capital of a foreign-invested enterprise and capital in Renminbi obtained by the foreign-invested enterprise from foreign exchange settlement shall not be used for the following purposes: (i) directly or indirectly used for payments beyond the business scope of the enterprises or payments as prohibited by the laws and regulations; (ii) directly or indirectly used for investment in securities unless otherwise provided by the laws and regulations; (iii) directly or indirectly used for granting entrust loans in Renminbi (unless permitted by the scope of business), repaying inter-enterprise borrowings (including advances by the third-party) or repaying the bank loans in Renminbi that have been sub-lent to third parties; or (iv) directly or indirectly used for expenses related to the purchase of real estate that is not for self-use (except for the foreign-invested real estate enterprises). In November 2012, SAFE promulgated the Circular of Further Improving and Adjusting Foreign Exchange Administration Policies on Foreign Direct Investment which substantially amends and simplifies the current foreign exchange procedure. Pursuant to this circular, the opening of various special purpose foreign exchange accounts (e.g. pre-establishment expenses account, foreign exchange capital account, guarantee account), the reinvestment of lawful incomes derived by foreign investors in the PRC (e.g. profit, proceeds of equity transfer, capital reduction, liquidation and early repatriation of investment), and purchase and remittance of foreign exchange as a result of capital reduction, liquidation, early repatriation or share transfer in a foreign-invested enterprise no longer require SAFE approval, and multiple capital accounts for the same entity may be opened in different provinces, which was not possible before. In addition, SAFE promulgated the Circular on Printing and Distributing the Provisions on Foreign Exchange Administration over Domestic Direct Investment by Foreign Investors and the Supporting Documents in May 2013, which specifies that the administration by SAFE or its local branches over direct investment by foreign investors in the PRC shall be conducted by way of registration and banks shall process foreign exchange business relating to the direct investment in the PRC based on the registration information provided by SAFE and its branches.
In February 2015, SAFE promulgated The Circular of Further Improving and Adjusting Foreign Exchange Administration Policies on Foreign Direct Investment, which took effect on June 1, 2015 and was amended on December 30, 2019, cancels the administrative approvals of foreign exchange registration of direct domestic investment and direct overseas investment and simplifies the procedure of foreign exchange-related registration. Pursuant to this Circular, investors should register with banks for direct domestic investment and direct overseas investment.
126
Table of Contents
The Circular on Reforming and Standardizing the Foreign Exchange Settlement Management Policy of Capital Account, was promulgated by SAFE on June 9, 2016 and was amended on December 4, 2023. Pursuant to this Circular, enterprises registered in the PRC may also convert their foreign debts from foreign currency to Renminbi on a self-discretionary basis. This Circular reiterates the principle that Renminbi converted from foreign currency-denominated capital of a company may not be directly or indirectly used for purposes beyond its business scope or prohibited by PRC Laws, while such converted Renminbi shall not be provided as loans to its non-affiliated entities.
In October 2019, the SAFE promulgated the Notice for Further Advancing the Facilitation of Cross-border Trade and Investment (amended on December 4, 2023), which, among other things, allows all FIEs to use Renminbi converted from foreign currency denominated capital for equity investments in the Chinese mainland, as long as the equity investment is genuine, does not violate applicable laws, and complies with the negative list on foreign investment. The Circular Regarding Further Optimizing the Cross-border RMB Policy to Support the Stabilization of Foreign Trade and Foreign Investment jointly promulgated by the People’s Bank of China, the NDRC, the Ministry of Commerce, the State-owned Assets Supervision and Administration Commission of the State Council, the China Banking and Insurance Regulatory Commission and SAFE on December 31, 2020 and effective on February 4, 2021 allows the non-investment foreign-invested enterprises to make domestic reinvestment with RMB capital in accordance with the law on the premise that they comply with prevailing regulations and the invested projects in the Chinese mainland are authentic and compliant. In addition, if a foreign-invested enterprise uses RMB income under capital accounts to conduct domestic reinvestment, the invested enterprise is not required to open a special deposit account for RMB capital.
According to the Circular of the State Administration for Foreign Exchange on Optimizing Foreign Exchange Administration to Support the Development of Foreign-related Business, promulgated and effective on April 10, 2020 by the SAFE, the reform of facilitating the payments of incomes under the capital accounts shall be promoted nationwide. Under the prerequisite of ensuring true and compliant use of funds and compliance and complying with the prevailing administrative provisions on use of income from capital projects, enterprises which satisfy the criteria are allowed to use income under the capital account, such as capital funds, foreign debt and overseas listing, etc., for domestic payment, without the need to provide proof materials for veracity to the bank beforehand for each transaction.
127
Table of Contents
| C. | Organizational Structure |
The following diagram illustrates our corporate structure, including our principal subsidiaries and the consolidated variable interest entities as of March 31, 2024:
Notes:
| (1) | JD Assets Holding Limited has 65 subsidiaries holding, directly or indirectly, non-logistics properties. |
| (2) | JD Asia Development Limited has 499 subsidiaries holding, directly or indirectly, logistics properties. |
| (3) | Jingdong 360, Jiangsu Yuanzhou, Xi’an Jingdong Xincheng, Jiangsu Jingdong Bangneng and Suqian Juhe are the significant consolidated variable interest entities with which we have contractual arrangements. Suqian Juhe is 45% owned by Mr. Richard Qiangdong Liu, 30% owned by Ms. Yayun Li and 25% owned by Ms. Pang Zhang. Each of Jingdong 360, Jiangsu Yuanzhou, Xi’an Jingdong Xincheng and Jiangsu Jingdong Bangneng is 45% owned by Mr. Qin Miao, 30% owned by Ms. Yayun Li and 25% owned by Ms. Pang Zhang. Mr. Richard Qiangdong Liu is our chairman of board of directors, Mr. Qin Miao is a vice president of our company, Ms. Yayun Li is chief executive officer of JD Technology, a significant investee of our company, and Ms. Pang Zhang is our chief human resources officer. |
| (4) | Jingdong Century has 269 subsidiaries that engage in retail business. |
| (5) | JD.com Investment Limited has 79 subsidiaries that hold, directly or indirectly, the companies invested by us. |
| * | The diagram above omits our equity investees that are insignificant individually and in the aggregate. |
The Consolidated Variable Interest Entities
Foreign ownership of certain of our businesses including value-added telecommunication services is subject to restrictions under current PRC laws and regulations. For example, foreign investors are not allowed to own more than 50% of the equity interests in a value-added telecommunication service provider (excluding e-commerce, domestic multi-party communications, data collection and transmission services and call centers) and the main foreign investor in the foreign invested telecommunication enterprise must have experience in providing value-added telecommunications services overseas and maintain a good track record.
JD.com, Inc. is a Cayman Islands exempted company and its PRC subsidiaries are considered foreign-invested enterprises. Accordingly, none of these PRC subsidiaries is eligible to provide value-added telecommunication services or provide certain other restricted services related to our businesses, such as domestic document delivery services. As a result, we conduct or will conduct such business activities through the consolidated variable interest entities and their subsidiaries in PRC, including Jingdong 360, Jiangsu Yuanzhou, Xi’an Jingdong Xincheng and its subsidiary Jingbangda, Jiangsu Jingdong Bangneng and Suqian Juhe. Jingdong 360 holds our ICP license as an internet information provider and primarily engages in our online marketplace business. Xi’an Jingdong Xincheng primarily provides courier services through Jingbangda and its subsidiaries. Jiangsu Yuanzhou primarily engages in the business of selling books, audio and video products. Jiangsu Jingdong Bangneng primarily engages in business of investment management. Suqian Juhe primarily provides enterprise management services.
128
Table of Contents
Each of Jingdong 360, Jiangsu Yuanzhou, Xi’an Jingdong Xincheng and Jiangsu Jingdong Bangneng is 45% owned by Mr. Qin Miao, 30% owned by Ms. Yayun Li, and 25% owned by Ms. Pang Zhang. Suqian Juhe is 45% owned by Mr. Richard Qiangdong Liu, 30% owned by Ms. Yayun Li, and 25% owned by Ms. Pang Zhang. In September 2022, Mr. Richard Qiangdong Liu, who used to be a shareholder of Jingdong 360, Jiangsu Yuanzhou, Xi’an Jingdong Xincheng and Jiangsu Jingdong Bangneng at the time, entered into equity transfer agreement and transferred 45% of the equity interests in these variable interest entities to Mr. Qin Miao. Therefore, Mr. Qin Miao, Ms. Yayun Li and Ms. Pang Zhang have become the shareholders of these variable interest entities. Due to the change of one of the shareholders, we terminated prior contractual arrangements with Jingdong 360, Jiangsu Yuanzhou, Xi’an Jingdong Xincheng and Jiangsu Jingdong Bangneng, and entered into a new series of contractual arrangements having terms and conditions substantially the same as the prior contractual arraignments with these variable interest entities. Mr. Richard Qiangdong Liu is our chairman of board of directors, Mr. Qin Miao is a vice president of our company, Ms. Yayun Li is chief executive officer of JD Technology, a significant investee of our company, and Ms. Pang Zhang is our chief human resources officer. Mr. Richard Qiangdong Liu, Mr. Miao, Ms. Li and Ms. Zhang are PRC citizens.
We obtained control over Jingdong 360 through Jingdong Century in April 2007 by entering into a series of contractual arrangements with Jingdong 360 and the shareholders of Jingdong 360, which we refer to as the Jingdong 360 Agreements. The Jingdong 360 Agreements were subsequently amended and restated. In September 2022, due to a change in the shareholders of Jingdong 360, a new set of contractual arrangements were entered into among Jingdong Century, Jingdong 360 and the shareholders of Jingdong 360. We have been the primary beneficiary of Jingdong 360 since April 2007. We treat Jingdong 360 as the variable interest entity and have consolidated its financial results in our consolidated financial statements in accordance with U.S. GAAP.
We obtained control over Jiangsu Yuanzhou through Jingdong Century by commitments among the then shareholders of Jiangsu Yuanzhou and Jingdong Century at the time Jiangsu Yuanzhou was established. Jingdong Century entered into a series of contractual arrangements with Jiangsu Yuanzhou and its shareholders in April 2011, which we refer to as the Jiangsu Yuanzhou Agreements. The Jiangsu Yuanzhou Agreements were subsequently amended and restated. In September 2022, due to a change in the shareholders of Jiangsu Yuanzhou, a new set of contractual arrangements were entered into among shareholders of Jiangsu Yuanzhou, and Shanghai Shengdayuan. We have been the primary beneficiary of Jiangsu Yuanzhou since September 2010. We treat Jiangsu Yuanzhou as the variable interest entity and have consolidated its financial results in our consolidated financial statements in accordance with U.S. GAAP.
We obtained control over Xi’an Jingdong Xincheng through Xi’an Jingxundi in June 2017 by entering into a series of contractual arrangements with Xi’an Jingdong Xincheng and the shareholders of Xi’an Jingdong Xincheng. On January 25, 2021, these contractual arrangements were updated and replaced by a new set of contractual arrangements with Xi’an Jingdong Xincheng and the shareholders of Xi’an Jingdong Xincheng to comply with certain requirements of the Hong Kong Stock Exchange, which we refer to as the Xi’an Jingdong Xincheng Agreements. In September 2022, due to a change in the shareholders of Xi’an Jingdong Xincheng, a new set of contractual arrangements were entered into among Xi’an Jingxundi, Xi’an Jingdong Xincheng and the shareholders of Xi’an Jingdong Xincheng. We have been the primary beneficiary of Xi’an Jingdong Xincheng since June 2017. We treat Xi’an Jingdong Xincheng as the variable interest entity and have consolidated its financial results in our consolidated financial statements in accordance with U.S. GAAP.
We obtained control over Jiangsu Jingdong Bangneng initially through Jingdong Century by entering into a series of contractual arrangements with Jiangsu Jingdong Bangneng and the shareholders of Jiangsu Jingdong Bangneng, which we refer to as the Jiangsu Jingdong Bangneng Agreements. In September 2022, due to a change in the shareholders of Jiangsu Jingdong Bangneng, a new set of contractual arrangements were entered into among Shanghai Shengdayuan, Jiangsu Jingdong Bangneng and the shareholders of Jiangsu Jingdong Bangneng. We have been the primary beneficiary of Jiangsu Jingdong Bangneng and treat Jiangsu Jingdong Bangneng as the variable interest entity and have consolidated its financial results in our consolidated financial statements in accordance with U.S. GAAP.
129
Table of Contents
We obtained control over Suqian Juhe through Jiangsu Huiji Space Technology Co., Ltd. by entering into a series of contractual arrangements with Suqian Juhe and the shareholders of Suqian Juhe, which we refer to as the Suqian Juhe Agreements. We have been the primary beneficiary of Suqian Juhe and treat Suqian Juhe as the variable interest entity and have consolidated its financial results in our consolidated financial statements in accordance with U.S. GAAP.
In addition to the significant consolidated variable interest entities above, we assisted in establishing additional consolidated variable interest entities, such as Suqian Jingdong Tianning. We have entered into a series of contractual arrangements with each of these variable interest entities and their respective shareholders.
The contractual arrangements relating to the consolidated variable interest entities allow us to:
| • | receive substantially all of the economic benefits of the consolidated variable interest entities; and |
| • | have an exclusive option to purchase all or part of the equity interests in the consolidated variable interest entities when and to the extent permitted by PRC law. |
There are certain risks involved in our corporate structure and the contractual arrangements. A detailed discussion of material risks relating to our Contractual Arrangements is set forth in the section headed “Item 3.D. Key Information—Risk Factors—Risks Related to Our Corporate Structure.” We have determined that the costs of insurance for the risks associated with our corporate structure and the difficulties associated with acquiring such insurance on commercially reasonable terms make it impractical for us to have such insurance. Accordingly, as of December 31, 2023, we did not purchase any insurance to cover the risks relating to the contractual arrangements.
We have consolidated the financial results of the consolidated variable interest entities and their subsidiaries in our consolidated financial statements in accordance with U.S. GAAP. The external revenues of the consolidated variable interest entities and their subsidiaries collectively contributed 6.2%, 6.9% and 7.8% of our consolidated total net revenues for the years ended December 31, 2021, 2022 and 2023, respectively.
In the opinion of Shihui Partners, our PRC legal counsel:
| • | the ownership structures of the consolidated variable interest entities and the PRC subsidiaries that have entered into contractual arrangements with the variable interest entities, including Jingdong Century, will not result in any violation of PRC laws or regulations currently in effect; and |
| • | the contractual arrangements among the PRC subsidiaries, including Jingdong Century, the variable interest entities and their respective shareholders governed by PRC law are valid, binding and enforceable, and will not result in any violation of PRC laws or regulations currently in effect. |
However, we have been further advised by our PRC legal counsel that there are substantial uncertainties regarding the interpretation and application of current and future PRC laws, regulations and rules. Accordingly, the PRC regulatory authorities may in the future take a view that is contrary to the above opinion of our PRC legal counsel. We have been further advised by our PRC counsel that if the PRC government finds that the agreements that establish the structure for operating our online retail and marketplace business do not comply with PRC government restrictions on foreign investment in e-commerce and related businesses, including online retail and marketplace businesses, we could be subject to severe penalties including being prohibited from continuing operations. See “Item 3.D. Key Information—Risk Factors—Risks Related to Our Corporate Structure—If the PRC government determines that the contractual arrangements constituting part of the consolidated variable interest entities structure do not comply with PRC laws and regulations, or if these laws and regulations change or are interpreted differently in the future, we could be subject to severe penalties or be forced to relinquish our interests in those operations.”
Contractual Arrangements with the Significant Consolidated Variable Interest Entities
The Jingdong 360 Agreements, Jiangsu Yuanzhou Agreements, Xi’an Jingdong Xincheng Agreements, Jiangsu Jingdong Bangneng Agreements and Suqian Juhe Agreements are substantially similar in key aspects governing the contractual arrangements with a variable interest entity. The following is a summary of these agreements currently in effect.
130
Table of Contents
Agreements that Provide Us with Control
Equity Pledge Agreements
On September 16, 2022, Jingdong Century, Jingdong 360 and each of the shareholders of Jingdong 360 entered into an equity pledge agreement, pursuant to which each of the shareholders of Jingdong 360 has pledged all of his equity interest in Jingdong 360 to guarantee their and Jingdong 360’s performance of his obligations under, where applicable, the exclusive technology consulting and services agreement, loan agreement, exclusive purchase option agreement and power of attorney. If Jingdong 360 or the shareholders of Jingdong 360 breach their contractual obligations under these agreements, Jingdong Century, as pledgee, will have the right to dispose of the pledged equity interests. The shareholders of Jingdong 360 agree that, during the term of the equity pledge agreements, they will not dispose of the pledged equity interests or create or allow any encumbrance on the pledged equity interests, and they also agree that Jingdong Century’s rights relating to the equity pledge should not be prejudiced by the legal actions of the shareholders, their successors or their designates. During the term of the equity pledge agreements, Jingdong Century has the right to receive all of the dividends and profits distributed on the pledged equity. The equity pledge agreements will terminate on the second anniversary of the date when Jingdong 360 and the shareholders of Jingdong 360 have completed all their obligations under the exclusive technology consulting and services agreement, loan agreement, exclusive purchase option agreement and powers of attorney.
On September 30, 2022, Shanghai Shengdayuan, Jiangsu Yuanzhou and each of the shareholders of Jiangsu Yuanzhou entered into an equity pledge agreement, which contains terms substantially similar to the amended and restated equity pledge agreement relating to Jingdong 360 described above.
On September 30, 2022, Shanghai Shengdayuan, Jiangsu Jingdong Bangneng and each of the shareholders of Jiangsu Jingdong Bangneng entered into an equity pledge agreement, which contains terms substantially similar to the amended and restated equity pledge agreement relating to Jingdong 360 described above.
On June 22, 2020, Jiangsu Huiji Space Technology Co., Ltd., Suqian Juhe and each of the shareholders of Suqian Juhe entered into an equity pledge agreement, which contains terms substantially similar to the amended and restated equity pledge agreement relating to Jingdong 360 described above.
On September 16, 2022, Xi’an Jingxundi, Xi’an Jingdong Xincheng and the shareholders of Xi’an Jingdong Xincheng entered into a share pledge agreement, pursuant to which the shareholders of Xi’an Jingdong Xincheng will pledge as first charge all of their respective equity interests in Xi’an Jingdong Xincheng to Xi’an Jingxundi as collateral security for any or all of their payments due to Xi’an Jingxundi and to secure performance of their obligations under the exclusive business cooperation agreement, the exclusive option agreement, the loan agreement, the shareholders’ rights entrustment agreement and the powers of attorney.
We have completed the registration of the equity pledge for substantially all the consolidated variable interest entities with the relevant office of the administration for market regulation.
Powers of Attorney
On September 16, 2022, each of the shareholders of Jingdong 360 granted an irrevocable power of attorney to replace the irrevocable powers of attorney previously executed. Pursuant to the irrevocable power of attorney, each of the shareholders of Jingdong 360 appointed Jingdong Century’s designated person as his attorney-in-fact to exercise all shareholder rights, including voting on their behalf on all matters of Jingdong 360 requiring shareholder approval, disposing of all or part of the shareholder’s equity interest in Jingdong 360, and electing, appointing or removing directors and executive officers. The person designated by Jingdong Century is entitled to dispose of dividends and profits on the equity interest subject to the instructions of the shareholder. Each power of attorney will remain in force for so long as the shareholder remains a shareholder of Jingdong 360. Each shareholder has waived all the rights which have been authorized to Jingdong Century’s designated person under each power of attorney.
On September 30, 2022, each of the shareholders of Jiangsu Yuanzhou granted an irrevocable power of attorney in replacement of the irrevocable powers of attorney previously executed. The powers of attorney contain terms substantially similar to the powers of attorney granted by the shareholders of Jingdong 360 described above.
131
Table of Contents
On September 30, 2022, each of the shareholders of Jiangsu Jingdong Bangneng granted an irrevocable power of attorney to Shanghai Shengdayuan, which contains terms substantially similar to the powers of attorney granted by the shareholders of Jingdong 360 described above.
On June 22, 2020, each of the shareholders of Suqian Juhe granted an irrevocable power of attorney to Jiangsu Huiji Space Technology Co., Ltd., which contains terms substantially similar to the powers of attorney granted by the shareholders of Jingdong 360 described above.
On September 16, 2022, Xi’an Jingxundi, Xi’an Jingdong Xincheng and the shareholders of Xi’an Jingdong Xincheng entered into a shareholder’s rights entrustment agreement, and each of the shareholders of Xi’an Jingdong Xincheng executed the irrevocable power of attorney on the same date, pursuant to which the shareholders of Xi’an Jingdong Xincheng appointed Xi’an Jingxundi or a director of its offshore holding company or his or her successor (including a liquidator replacing Xi’an Jingxundi’s director) as their exclusive agent and attorney to act on their behalf on all matters concerning Xi’an Jingdong Xincheng and to exercise all of its rights as a registered shareholder of Xi’an Jingdong Xincheng. As a result of the shareholders’ rights entrustment agreement and the powers of attorney, we, through Xi’an Jingxundi, are able to exercise management control over the activities that most significantly impact the economic performance of Xi’an Jingdong Xincheng.
Agreements that Allow Us to Receive Economic Benefits
Exclusive Technology Consulting and Service Agreement/Exclusive Business Cooperation Agreement
On September 16, 2022, Jingdong Century and Jingdong 360 entered into an exclusive technology consulting and services agreement, which supersedes the version entered into in June 2016. Pursuant to the 2022 agreement, Jingdong Century has the sole and exclusive right to provide specified technology consulting and services to Jingdong 360. Without the prior written consent of Jingdong Century, Jingdong 360 may not accept the same or similar technology consulting and services provided by any third party during the term of the agreement. All the benefits and interests generated from the agreement, including intellectual property rights, know-how and trade secrets, will be Jingdong Century’s sole and exclusive rights. Jingdong 360 agrees to pay service fees to Jingdong Century on a quarterly basis and the amount of the service fee is decided by Jingdong Century on the basis of the work performed and commercial value of the services, subject to annual evaluation and adjustment. The agreement is valid for ten years and may be extended unilaterally by Jingdong Century with Jingdong Century’s written confirmation prior to the expiration date. Jingdong 360 cannot terminate the agreement early unless Jingdong Century commits fraud, gross negligence or illegal acts, or becomes bankrupt or winds up.
On September 30, 2022, Shanghai Shengdayuan and Jiangsu Yuanzhou entered into an exclusive technology consulting and services agreement, which supersedes the version entered into in June 2016. The 2022 agreement between Shanghai Shengdayuan and Jiangsu Yuanzhou contains terms substantially similar to the exclusive technology consulting and services agreement relating to Jingdong 360 as described above.
On September 30, 2022, Shanghai Shengdayuan and Jiangsu Jingdong Bangneng entered into an exclusive technology consulting and services agreement, which contains terms substantially similar to the exclusive technology consulting and services agreement relating to Jingdong 360 as described above.
On June 22, 2020, Jiangsu Huiji Space Technology Co., Ltd. and Suqian Juhe entered into an exclusive technology consulting and services agreement, which contains terms substantially similar to the exclusive technology consulting and services agreement relating to Jingdong 360 as described above.
On September 16, 2022, Xi’an Jingxundi and Xi’an Jingdong Xincheng entered into an exclusive business cooperation agreement, pursuant to which Xi’an Jingdong Xincheng agrees to engage Xi’an Jingxundi as its exclusive provider of business support, technical and consulting services in exchange for service fees. Under these arrangements, the service fees, subject to Xi’an Jingxundi’s adjustment, are equal to all of the net profit of Xi’an Jingdong Xincheng and its subsidiaries. Xi’an Jingxundi enjoys all the economic benefits derived from the businesses of Xi’an Jingdong Xincheng and bears the relevant portion of the business risks of Xi’an Jingdong Xincheng. If Xi’an Jingdong Xincheng runs into financial deficit or suffers severe operation difficulties, Xi’an Jingxundi will provide financial support to Xi’an Jingdong Xincheng.
132
Table of Contents
Business Operations Agreement
On September 16, 2022, Jingdong Century entered into a business operations agreement with Jingdong 360 and its shareholders. Pursuant to the business operations agreement, Jingdong 360’s shareholders must appoint the candidates nominated by Jingdong Century to be the directors on its board of directors in accordance with applicable laws and the articles of association of Jingdong 360, and must cause the persons recommended by Jingdong Century to be appointed as its general manager, chief financial officer and other senior executives. Jingdong 360 and its shareholders also agree to accept and strictly follow the guidance provided by Jingdong Century from time to time relating to employment, termination of employment, daily operations and financial management. Moreover, Jingdong 360 and its shareholders agree that Jingdong 360 will not engage in any transactions that could materially affect its assets, business, personnel, liabilities, rights or operations, including the incurrence of debt from any third party and the amendment of Jingdong 360’s articles of association, without the prior consent of Jingdong Century’s respective designees. Unless otherwise terminated early by Jingdong Century, the agreement will remain effective until Jingdong 360 is dissolved according to the PRC law.
On September 30, 2022, Shanghai Shengdayuan entered into a business operations agreement with Jiangsu Yuanzhou and its shareholders. The business operations agreement with Jiangsu Yuanzhou contains terms substantially similar to the amended and restated business operations agreement with Jingdong 360 described above.
On September 30, 2022, Shanghai Shengdayuan entered into a business operations agreement with Jiangsu Jingdong Bangneng and its shareholders. The business operations agreement with Jiangsu Jingdong Bangneng contains terms substantially similar to the amended and restated business operations agreement with Jingdong 360 described above.
On June 22, 2020, Jiangsu Huiji Space Technology Co., Ltd. entered into a business operations agreement with Suqian Juhe and its shareholders. The business operations agreement with Suqian Juhe contains terms substantially similar to the amended and restated business operations agreement with Jingdong 360 described above.
Agreements that Provide Us with the Option to Purchase the Equity Interest
Exclusive Purchase Option Agreements
On September 16, 2022, Jingdong Century, Jingdong 360 and the shareholders of Jingdong 360 entered into an amended and restated exclusive purchase option agreement in replacement of the previous exclusive purchase option agreements. Pursuant to the amended and restated exclusive purchase option agreement, the shareholders of Jingdong 360 irrevocably grant Jingdong Century an exclusive option to purchase or have its designated persons to purchase at its discretion, to the extent permitted under PRC law, all or part of their equity interests in Jingdong 360. In addition, the purchase price should equal the amount that the shareholders contributed to Jingdong 360 as registered capital for the equity interest to be purchased, or be the lowest price permitted by applicable PRC law. Without the prior written consent of Jingdong Century, Jingdong 360 may not amend its articles of associate, increase or decrease the registered capital, sell or otherwise dispose of its assets or beneficial interest, create or allow any encumbrance on its assets or other beneficial interests, provide any loans for any third parties, enter into any material contract (except those contracts entered into in the ordinary course of business), merge with or acquire any other persons or make any investments, or distribute dividends to the shareholders. The shareholders of Jingdong 360 agree that, without the prior written consent of Jingdong Century, they will not dispose of their equity interests in Jingdong 360 or create or allow any encumbrance on the equity interests. The initial term of the amended and restated exclusive purchase option agreement is 10 years and can be renewed for an additional 10 years on the same terms at Jingdong Century’s option, for an unlimited number of times.
On September 30, 2022, Shanghai Shengdayuan, Jiangsu Yuanzhou and the shareholders of Jiangsu Yuanzhou entered into an amended and restated exclusive purchase option agreement in replacement of the previous exclusive purchase option agreement. The amended and restated exclusive purchase option agreement contains terms substantially similar to the amended and restated exclusive purchase option agreement relating to Jingdong 360 described above.
133
Table of Contents
On September 30, 2022, Shanghai Shengdayuan, Jiangsu Jingdong Bangneng and the shareholders of Jiangsu Jingdong Bangneng entered into an exclusive purchase option agreement, which contains terms substantially similar to the amended and restated exclusive purchase option agreement relating to Jingdong 360 described above.
On June 22, 2020, Jiangsu Huiji Space Technology Co., Ltd., Suqian Juhe and the shareholders of Suqian Juhe entered into an exclusive purchase option agreement, which contains terms substantially similar to the amended and restated exclusive purchase option agreement relating to Jingdong 360 described above.
On September 16, 2022, Xi’an Jingxundi, Xi’an Jingdong Xincheng and the shareholders of Xi’an Jingdong Xincheng entered into an exclusive purchase option agreement, pursuant to which Xi’an Jingxundi (or JD Logistics or any subsidiary of JD Logistics, the “designee”) is granted an irrevocable and exclusive right to purchase all of the equity interest in and/or assets of Xi’an Jingdong Xincheng for a nominal price, unless the government authorities or the PRC laws request that another amount be used as the purchase price, in which case the purchase price shall be the lowest amount under such request. Subject to PRC laws and regulations, the shareholders of Xi’an Jingdong Xincheng and/ or Xi’an Jingdong Xincheng shall return any amount of purchase price they have received to Xi’an Jingxundi or its designee.
Loan Agreements
Pursuant to an amended and restated loan agreement dated September 16, 2022 between Jingdong Century and the shareholders of Jingdong 360, Jingdong Century made loans to the shareholders of Jingdong 360 for the capitalization of Jingdong 360 and purchase of equity interest of Jingdong 360. Pursuant to the amended and restated loan agreement, the shareholders can only repay the loans by the sale of all their equity interest in Jingdong 360 to Jingdong Century or its designated person. The shareholders must sell all of their equity interests in Jingdong 360 to Jingdong Century or its designated person and pay all of the proceeds from sale of such equity interests or the maximum amount permitted under PRC law to Jingdong Century. In the event that shareholders sell their equity interests to Jingdong Century or its designated person with a price equivalent to or less than the amount of the principal, the loans will be interest free. If the price is higher than the amount of the principal, the excess amount will be paid to Jingdong Century as the loan interest. The maturity date of the loans is on the tenth anniversary of the date when the shareholders received the loans and paid the amount as capital contribution to Jingdong 360. The term of the loans will be extended automatically for an additional 10 years, unless Jingdong Century objects, for an unlimited number of times. The loan must be repaid immediately under certain circumstances, including, among others, (i) if the shareholders terminate their services with us, (ii) if any other third-party claims against shareholders for an amount more than RMB100,000 and Jingdong Century has reasonable ground to believe that the shareholders are unable to repay the claimed amount, (iii) if a foreign investor is permitted to hold majority or 100% equity interest in Jingdong 360 and Jingdong Century elects to exercise its exclusive equity purchase option, or (iv) if the loan agreement, equity pledge agreement or exclusive purchase option agreement terminates for cause not attributable to Jingdong Century or is deemed to be invalid by a court.
Pursuant to the amended and restated loan agreement dated September 30, 2022 between Shanghai Shengdayuan and the shareholders of Jiangsu Yuanzhou, Shanghai Shengdayuan made loans to the shareholders of Jiangsu Yuanzhou for the capitalization of Jiangsu Yuanzhou and the purchase of equity interest of Jiangsu Yuanzhou.
Pursuant to the loan agreement dated September 30, 2022 between Shanghai Shengdayuan and the shareholders of Jiangsu Jingdong Bangneng, Jingdong Century made loans to the shareholders of Jiangsu Jingdong Bangneng for the capitalization of Jiangsu Jingdong Bangneng and the purchase of equity interest of Jiangsu Jingdong Bangneng.
Pursuant to the loan agreement dated June 22, 2020 between Jiangsu Huiji Space Technology Co., Ltd. and the shareholders of Suqian Juhe, Jiangsu Huiji Space Technology Co., Ltd. made loans to the shareholders of Suqian Juhe solely for the capitalization of Suqian Juhe.
Pursuant to the loan agreement, dated September 16, 2022, between Xi’an Jingxundi and the shareholders of Xi’an Jingdong Xincheng, Xi’an Jingxundi made loans to the shareholders of Xi’an Jingdong Xincheng solely for the capitalization of Xi’an Jingdong Xincheng.
134
Table of Contents
Additional Contractual Arrangements
In addition to the Jingdong 360 Agreements, Jiangsu Yuanzhou Agreements, Xi’an Jingdong Xincheng Agreements, Jiangsu Jingdong Bangneng Agreements and Suqian Juhe Agreements, we have also entered into contractual arrangements with each of the other variable interest entities, including Suqian Jingdong Tianning, and their respective shareholders, including equity pledge agreements, powers of attorney, exclusive technology consulting and services agreements, business operations agreements, exclusive purchase option agreements and loan agreements, as applicable. Our contractual agreements with these other variable interest entities contain terms substantially similar to those in the Jingdong 360 Agreements, Jiangsu Yuanzhou Agreements, Xi’an Jingdong Xincheng Agreements, Jiangsu Jingdong Bangneng Agreements or Suqian Juhe Agreements, as applicable.
| D. | Property, Plant and Equipment |
Our national headquarters are located in Yizhuang Economic and Technological Development Zone in Beijing, where we own office buildings with an aggregate floor area of approximately 900,000 square meters. We have acquired land use rights in Beijing to build our headquarters.
In addition, we lease our other offices in Beijing and regional offices in 70 other cities in China with an aggregate floor area of approximately 354,000 square meters.
We own our national customer service center and our data center in Suqian, which have an aggregate floor area of approximately 169,000 and 54,000 square meters, respectively. We built our own customer service center in Chengdu, with an aggregate floor area of about 55,000 square meters, and lease our customer service centers in Datong and Wuhan with an aggregate floor area of approximately 41,000 square meters.
As of December 31, 2023, we had land use rights in 69 cities in China to build our own warehouses. Highly automated and efficient warehouses will not only expand our ability to fulfill orders by ourselves but also support the third-party merchants on our online marketplace as well as a wide range of business partners in the ecosystem. As of December 31, 2023, our nationwide fulfillment infrastructure covered almost all counties and districts across China, with a network of over 1,600 warehouses with an aggregate gross floor area of over 32 million square meters. We incurred total lease cost of RMB9,545 million, RMB11,132 million and RMB12,275 million (US$1,729 million) in 2021, 2022 and 2023, respectively.
We plan to expand our nationwide fulfillment network by leasing, building or purchasing additional facilities across China over the next several years. As of December 31, 2023, we had incurred construction in progress costs of RMB9,920 million (US$1,397 million) for these fulfillment facilities and new office buildings.
| Item 4A. | Unresolved Staff Comments |
None.
| Item 5. | Operating and Financial Review and Prospects |
The following discussion of our financial condition and results of operations is based upon, and should be read in conjunction with, our audited consolidated financial statements and the related notes included in this annual report.
This report contains forward-looking statements. See “Forward-Looking Information.” In evaluating our business, you should carefully consider the information provided under the caption “Item 3.D. Key Information—Risk Factors” in this annual report.
We caution you that our businesses and financial performance are subject to substantial risks and uncertainties.
135
Table of Contents
| A. | Operating Results |
Overview
We are a leading supply chain-based technology and service provider. Our e-commerce business includes online retail and online marketplace. In the online retail business, we acquire products from suppliers and sell them directly to our customers primarily through our mobile apps and websites. In the online marketplace business, third-party merchants sell products to customers primarily through our mobile apps and websites. We also offer marketing, logistics and other value-added services.
We generated total net revenues of RMB951.6 billion, RMB1,046.2 billion and RMB1,084.7 billion (US$152.8 billion) in 2021, 2022 and 2023, respectively. Our online retail business generated net product revenues of RMB815.7 billion, RMB865.1 billion and RMB871.2 billion (US$122.7 billion) in 2021, 2022 and 2023, respectively. In addition, our marketplace and marketing, logistics and other services generated net service revenues of RMB135.9 billion, RMB181.2 billion and RMB213.4 billion (US$30.1 billion) in 2021, 2022 and 2023, respectively.
Due to the PRC legal restrictions on foreign ownership of companies that engage in a value-added telecommunications service business and certain other businesses in China, we conduct the relevant parts of our operations through consolidated variable interest entities. We have contractual arrangements with these entities and their shareholders that enable us to effectively control and receive substantially all of the economic benefits from the entities. Accordingly, we consolidate the results of these entities in our financial statements.
Major Factors Affecting Our Results of Operations
Our results of operations and financial condition are affected by the general factors driving China’s retail industry, including levels of per capita disposable income and consumer spending in China. In addition, they are also affected by factors driving online retail in China, such as the growing number of online shoppers, the adoption of online sales strategies by manufacturers and service providers, the availability of improved delivery services and the increasing variety of payment options. Our results of operations are also affected by general economic conditions in China. In particular, we have experienced and expect to continue to experience upward pressure on our operating expenses.
Our results of operations are also affected by PRC regulations and industry policies related to our business operations, licenses and permits and corporate structure. For example, the product quality and consumer protection laws require us to ensure the quality of the goods we sell and give customers the right to return goods within seven days of receipt with no questions asked, the labor contract law and related rules require employers to enter into written contracts with workers and to pay compensation to workers who are terminated under certain circumstances, regulations on foreign ownership and on transfer of funds into and out of China affect our corporate structure and financing, and regulations on business licenses affect our legal and compliance functions. For a summary of the principal PRC laws and regulations that affect us, see “Item 3.D. Key Information—Risk Factors” and “Item 4.B. Information on the Company—Business Overview—Regulation.” Although we have generally benefited from the Chinese government’s policies to encourage economic growth, we are also affected by the complexity, uncertainties and changes in PRC regulations governing various aspects of our operations. For a detailed description of the PRC regulations applicable to us, see “Item 4.B. Information on the Company—Business Overview—Regulation.”
JD.com, Inc., the holding company that is listed on Nasdaq and Hong Kong Stock Exchange, has no material operations of its own. We conduct our operations primarily through our subsidiaries and the consolidated variable interest entities and their subsidiaries in China. As a result, JD.com, Inc.’s ability to pay dividends to our shareholders depends in part upon dividends paid by our PRC subsidiaries subject to compliance with applicable PRC regulations. Our wholly-owned PRC subsidiaries are permitted to pay dividends to us only out of their retained earnings, if any, as determined in accordance with PRC accounting standards and regulations. Under PRC regulations, each of our wholly-owned PRC subsidiaries is required to set aside at least 10% of its after-tax profits each year, if any, to fund certain statutory reserve funds until such reserve funds reach 50% of its registered capital. Remittance of dividends by a wholly foreign-owned company out of China is subject to examination by the banks designated by SAFE. As of December 31, 2023, the amount restricted, including paid-in capital and statutory reserve funds, as determined in accordance with PRC accounting standards and regulations, was approximately RMB67.6 billion (US$9.5 billion).
136
Table of Contents
While our business is influenced by general factors affecting our industry, our operating results are more directly affected by company specific factors, including the following major factors:
| • | our ability to increase customer purchases; |
| • | our ability to manage our mix of product and service offerings; |
| • | our ability to further increase and leverage our scale of business; |
| • | our ability to effectively invest in our fulfillment infrastructure and technology platform; and |
| • | our ability to conduct and manage strategic investments and acquisitions. |
Our Ability to Increase Customer Purchases
Growth in customer purchases is a key driver of our revenue growth. We have a growing and loyal active customer base. Over the years, our customers have shown loyalty to us through their increased activity levels. Customer purchases are mainly driven by our success in generating repeat purchases from existing customer accounts.
Our ability to attract new customer accounts and retain existing customer accounts depends on our ability to provide superior customer experience. To this end, we offer a wide selection of authentic products at competitive prices on our mobile apps and websites and provide speedy and reliable delivery, convenient online and in-person payment options and comprehensive customer services. We continued to improve and iterate system that enables us to increase our operating efficiency through enhanced product merchandising and supply chain management capabilities, and to drive more targeted and relevant product promotions and recommendations to our customers. We have benefited from word-of-mouth viral marketing in winning new customers, and we also conduct online and offline marketing and brand promotion activities to attract new customers. In addition, we encourage existing customers to place more orders with us through a variety of means, including granting coupons and loyalty points and holding special promotions.
Our Ability to Manage Our Mix of Product and Service Offerings
Our results of operations are also affected by the mix of products and services we offer. We acquire products from suppliers and sell them directly to customers in our online retail business, and we earn commissions and service fees from third-party merchants on our online marketplace. We also offer a wide range of products and services and aim to provide one-stop shopping solutions to maximize our wallet share. Our mix of products and services affects our gross margin. For example, the marketplace service revenues that we earn from third-party merchants and the other services that we offer generally have higher gross margins. The split between our online retail business and our online marketplace business thus has a major influence on our revenue growth and our gross margins. Our marketplace and marketing revenues, logistics and other services revenues increased from RMB135.9 billion in 2021 to RMB181.2 billion in 2022, and further to RMB213.4 billion (US$30.1 billion) in 2023.
We intend to further (i) expand our selection of general merchandise products, such as FMCG (fast-moving consumer goods), which are well received by customers and expected to have a potential for greater online penetration; (ii) attract more third-party merchants to our online marketplace; and (iii) provide more fulfillment and other value-added services to third-party merchants and others.
Our Ability to Further Increase and Leverage our Scale of Business
Our results of operations are directly affected by our ability to further increase and leverage our scale of business. We expect to leverage our scale to obtain more favorable terms from suppliers, including pricing terms and volume-based rebates. In addition, we aim to create value for our suppliers by providing an effective channel for selling large volumes of their products online and by offering them comprehensive information on customer preferences and market demand and ensuring the high quality of fulfillment services. We believe this value proposition also helps us obtain favorable terms from suppliers.
137
Table of Contents
As of December 31, 2023, our nationwide fulfillment infrastructure employed a total of 425,469 warehouse and delivery personnel that manages this fulfillment infrastructure and the large number of orders we receive, process and fulfill each year. Our fulfillment expenses in absolute amount increased over 2021, 2022 and 2023, while the fulfillment expenses as a percentage of our total net revenues decreased from 6.2% in 2021 to 6.0% in 2023. Our research and development professionals design, develop and operate the technology platform, develop and post content, and improve our AI, big data and cloud technologies and services. Personnel costs are the largest component of our fulfillment costs and of our research and development costs and are likely to remain the largest component for the foreseeable future as we continue to expand our operations. Labor costs are rising in China and we strive to continue improving efficiency and utilization of our fulfillment and other personnel to mitigate this effect. Our fulfillment expenses and thus operational efficiency are also affected by the average size of orders placed by our customers.
Our Ability to Effectively Invest in Our Fulfillment Infrastructure and Technology Platform
Our results of operations depend in part on our ability to invest in our fulfillment infrastructure and technology platform to cost-effectively meet the demands of our business operations. Our nationwide fulfillment infrastructure covers almost all counties and districts across China, which, as of December 31, 2023, included a warehousing network of over 1,600 warehouses that are operated by us, and an aggregate gross floor area of over 32 million square meters, including warehouse space managed under the JD Logistics Open Warehouse Platform. We have owned and managed approximately 26 million square meters of fulfillment infrastructure related land in 84 cities in both domestic and overseas markets as of December 31, 2023.
We plan to continue to build large scale warehouse facilities with optimized configurations on these sites to improve our fulfillment efficiency, minimize order splitting, accommodate greater product selection and fulfill the anticipated sales of our own products as well as sales by third-party merchants using our fulfillment services. In selecting locations for our pickup and delivery stations, order density, a parameter we use to measure the frequency and number of orders generated from a geographical area, is an important criterion. To efficiently deploy our delivery network, we have established delivery stations and pickup stations in areas where we expect order density to increase to the extent where operating our own delivery network will be more cost efficient than using third-party couriers. We also paid significant amounts for upgrading our technology platform. To enhance our technology platform, we intend to further invest in AI, big data analytics and cloud computing. We expect these technology initiatives to provide innovative features, solutions and services to customers and suppliers, while increasing our operational efficiency.
Our Ability to Conduct and Manage Strategic Investments and Acquisitions
We have made, and may continue to make, strategic investments and acquisitions to add assets or businesses that are complementary to our existing business. Our financial results could be adversely affected by our investments or acquisitions. The investments and acquired assets or businesses may not generate the financial results we expect. They could result in occurrence of significant investments and goodwill impairment charges, and amortization expenses for other intangible assets. Moreover, we share the results of the investments which we account for as equity method investments. In 2023, our share of results of equity investees was a gain of RMB1.0 billion (US$0.1 billion). We may incur impairment charges in connection with our investments or acquisitions and pick up gains or losses of our equity method investments, which could have a material impact on our financial results.
Selected Statements of Operations Items
Net Revenues
Net revenues include net product revenues and net service revenues. Product sales is further divided into sales of electronics and home appliances products and sales of general merchandise products. Net revenues from electronics and home appliances products include revenues from sales of computer, communication and consumer electronics products as well as home appliances. Net revenues from general merchandise products mainly include revenues from sales of food, beverage and fresh produce, baby and maternity products, furniture and household goods, cosmetics and other personal care items, pharmaceutical and healthcare products, industrial products, books, automobile accessories, apparel and footwear, bags and jewelry. Net service revenues are further divided into revenues from online marketplace and marketing and revenues from logistics and other services. The following table breaks down our total net revenues by these categories, by amounts and as percentages of total net revenues:
138
Table of Contents
| For the Year Ended December 31, | ||||||||||||||||||||||||||||
| 2021 | 2022 | 2023 | ||||||||||||||||||||||||||
| RMB | % | RMB | % | RMB | US$ | % | ||||||||||||||||||||||
| (in millions, except for percentages) | ||||||||||||||||||||||||||||
| Electronics and home appliances revenues |
492,592 | 51.8 | 515,945 | 49.3 | 538,799 | 75,888 | 49.7 | |||||||||||||||||||||
| General merchandise revenues |
323,063 | 33.9 | 349,117 | 33.4 | 332,425 | 46,821 | 30.6 | |||||||||||||||||||||
|
|
|
|
|
|
|
|
|
|
|
|
|
|
|
|||||||||||||||
| Net product revenues |
815,655 | 85.7 | 865,062 | 82.7 | 871,224 | 122,709 | 80.3 | |||||||||||||||||||||
|
|
|
|
|
|
|
|
|
|
|
|
|
|
|
|||||||||||||||
| Marketplace and marketing revenues |
72,118 | 7.6 | 81,970 | 7.8 | 84,726 | 11,933 | 7.8 | |||||||||||||||||||||
| Logistics and other service revenues |
63,819 | 6.7 | 99,204 | 9.5 | 128,712 | 18,129 | 11.9 | |||||||||||||||||||||
|
|
|
|
|
|
|
|
|
|
|
|
|
|
|
|||||||||||||||
| Net service revenues |
135,937 | 14.3 | 181,174 | 17.3 | 213,438 | 30,062 | 19.7 | |||||||||||||||||||||
|
|
|
|
|
|
|
|
|
|
|
|
|
|
|
|||||||||||||||
| Total net revenues |
951,592 | 100.0 | 1,046,236 | 100.0 | 1,084,662 | 152,771 | 100.0 | |||||||||||||||||||||
|
|
|
|
|
|
|
|
|
|
|
|
|
|
|
|||||||||||||||
Net service revenues primarily consist of fees earned from providing marketing and logistics services to our business partners, and commissions earned from third-party merchants for sales made through our online marketplace. Currently, we recognize revenues from the third-party merchants on a net basis as we are not the primary obligor, we do not have control over goods sold by third-party merchants and we do not have latitude to establish prices for them.
We record revenue net of discounts, return allowances and value-added taxes, or VAT.
Cost of revenues
Cost of revenues primarily consists of our cost for acquiring the products that we sell directly and the related inbound shipping charges, inventory write-downs, traffic acquisition costs related to online marketing services, and cost related to logistics services provided to third parties. The rebates and subsidies we receive from suppliers are treated as a reduction in the purchase price and will be recorded as a reduction in cost of revenues when the product is sold.
Fulfillment expenses
Our fulfillment expenses consist primarily of (i) expenses incurred in operating our fulfillment centers, customer service centers and physical stores, including personnel cost and expenses attributable to buying, receiving, inspecting and warehousing inventories, picking, packaging, and preparing customer orders for shipment, processing payment and related transaction costs, (ii) expenses charged by third-party couriers for dispatching and delivering our products, (iii) lease expenses of warehouses, delivery and pickup stations, and physical stores, and (iv) depreciation and amortization of logistics and electronic equipment. The costs related to logistics services provided to third parties are classified in cost of revenues. We expect our fulfillment expenses to increase in absolute amount on an annual basis in the near run, as we invest in new businesses, build and lease new warehouses and establish more delivery stations to penetrate lower tier cities and to meet the demands of our business operations. We plan to increase operation efficiency by strengthening our logistics network, improving overall utilization through economies of scale, increasing the level of integration across our logistics networks, and improving efficiencies through more intelligent decision-making.
Marketing expenses
Our marketing expenses consist primarily of advertising costs, public relations expenditures, and payroll and related expenses for employees involved in marketing and business development activities. We pay commissions to participants in the associates program when their customer referrals result in successful product sales. We plan to continue to conduct brand promotion and marketing activities to enhance our brand recognition and attract new purchases from new and existing customers.
Research and development expenses
Our research and development expenses consist primarily of payroll and related expenses for research and development professionals involved in designing, developing and maintaining our technology platform, and application of our AI, big data and cloud technologies and services, and technology infrastructure costs. Technology infrastructure costs include servers and other equipment depreciation, bandwidth and data center costs, rent, utilities and other expenses necessary to support our internal and external business. We plan to continue to invest in technology and innovation to enhance customer experience and provide value-added services to suppliers and third-party merchants.
139
Table of Contents
General and administrative expenses
Our general and administrative expenses consist primarily of employee related expenses for general corporate functions, including accounting, finance, tax, legal and human relations; costs associated with these functions include facilities and equipment depreciation expenses, rental and other general corporate related expenses. We plan to continue to hire additional qualified employees to support our business operations and high-quality growth.
Gain on sale of development properties
The gain on sale of development properties is mainly derived from sale of development properties to property funds. JD Property develops and manages our logistics facilities and other real estate properties, to support JD Logistics and other third parties. By leveraging its fund management platform, JD Property can realize development profits and recycle capital from development properties to fund new developments and scale the business. Since 2019, JD Property established several property funds (the “Property Funds”) together with third parties, including GIC Private Limited (“GIC”) and Mubadala Investment Company (“MIC”). JD Property served as general partner and committed less than 50% of the total capital of each property fund as a limited partner, and cannot control the investment committee. JD Property also entered into definitive agreements with the Property Funds, pursuant to which JD Property sold certain of our completed and uncompleted modern logistics facilities, and would concurrently lease back such facilities for operational purposes when completed. For the logistics facilities that met closing conditions, we recorded disposal gain of RMB0.8 billion, RMB1.4 billion and RMB2.3 billion (US$0.3 billion) in 2021, 2022 and 2023, respectively. We derecognized the logistics facilities upon satisfaction of the hand-over condition.
Share of results of equity investees
Share of the post-acquisition profits or losses, impairment, and gains or losses from disposals and deemed disposals of the equity investments that are accounted for under the equity method are recorded in share of results of equity investees.
Others, net
Others, net are non-operating income/(loss), primarily consist of gains/(losses) from fair value change of long-term investments, gains/(losses) from business and investment disposals, impairment of investments, government incentives, interest income and foreign exchange gains/(losses).
Taxation
Cayman Islands
The Cayman Islands currently levies no taxes on individuals or corporations based upon profits, income, gains or appreciation. Payments of dividends and capital in respect of shares are not subject to taxation in the Cayman Islands. There are no other taxes likely to be material to holders of our ADSs or ordinary shares levied by the government of the Cayman Islands except for stamp duties which may be applicable on instruments executed in, or after execution, brought within the jurisdiction of the Cayman Islands. The Cayman Islands is not party to any double tax treaties that are applicable to any payments made to or by our company. There are no exchange control regulations or currency restrictions in the Cayman Islands.
Hong Kong
Our subsidiaries incorporated in Hong Kong are subject to a two-tiered income tax rate for taxable income generated from operations in Hong Kong, effective on April 1, 2018. The first HK$2 million of profits earned by our subsidiaries incorporated in Hong Kong will be taxed at half the current tax rate (i.e., 8.25%) while the remaining profits will continue to be taxed at the existing 16.5% tax rate. We make analysis on the foreign-derived income, mainly including dividend and interest, earned by its subsidiaries incorporated in Hong Kong, apply for an advance ruling with the Inland Revenue Department of Hong Kong for the income meeting exemption conditions and pay tax for the income subject to Hong Kong profits tax under the foreign-sourced income exemption regime. In addition, payments of dividends from our incorporations in Hong Kong to us are not subject to any Hong Kong withholding tax.
140
Table of Contents
Chinese Mainland
Generally, our subsidiaries and the consolidated variable interest entities in the Chinese mainland are subject to enterprise income tax on their taxable income in the Chinese mainland at a rate of 25%, except that a few entities in our group benefit from a preferential tax rate of 15% as they conduct business in certain encouraged sectors or areas, and any entity that qualifies as a “software enterprise” is entitled to an exemption from income tax for the first two years and 50% reduction for the next three years from such entity’s first profitable year. Besides, from January 1, 2023 to December 31, 2027, subject to certain criteria, the portion of annual taxable income amount of a small profit enterprise shall be computed at a reduced rate of 25% as taxable income amount, and be subject to enterprise income tax at 20% tax rate. Furthermore, certain of our entities in the Chinese mainland engaging in research and development activities in the Chinese mainland were entitled to claim 175% of their research and development expenses from January 1, 2021 to September 30, 2022 according to the laws and regulations in the PRC. In September 2022, the PRC State Tax Administration further announced that for the enterprises entitled to the current pre-tax deduction ratio of 175% for research and development expenses, such ratio is raised to 200% during the period from October 1, 2022 to December 31, 2022. In March 2023, the State Tax Administration announced that 200% of the actual amount can be deducted before tax from January 1, 2023. The enterprise income tax is calculated based on the entity’s global income as determined under PRC tax laws and accounting standards.
We are subject to VAT at a rate of 9% on sales of audio and video products, at a rate of 13% on sales of other products, at a rate of 9% on logistics services and at a rate of 6% on advertising and other services, in each case less any deductible VAT we have already paid or borne. Since January 1, 2014, we have been exempted from VAT on sales of books. We are also subject to surcharges on VAT payments in accordance with PRC law.
Dividends paid by our wholly foreign-owned subsidiaries in the Chinese mainland to our intermediate holding companies in Hong Kong should qualify for the preferential withholding tax rate of 5% under the Arrangement between the PRC and the Hong Kong Special Administrative Region on the Avoidance of Double Taxation and Prevention of Fiscal Evasion with respect to Taxes on Income and Capital, instead of the normal withholding tax rate of 10%. The Hong Kong entity is required to file an application package with the PRC tax authorities and settle the overdue taxes if the preferential 5% tax rate is denied based on the subsequent review of the application package by the tax authority. See “Item 3.D. Key Information—Risk Factors—Risks Related to Our Corporate Structure—We may rely on dividends and other distributions on equity paid by our PRC subsidiaries to fund any cash and financing requirements we may have, and any limitation on the ability of our PRC subsidiaries to make payments to us could have a material and adverse effect on our ability to conduct our business.”
If our holding company in the Cayman Islands or any of our subsidiaries outside of the Chinese mainland were deemed to be a “resident enterprise” under the PRC Enterprise Income Tax Law, it would be subject to enterprise income tax on its worldwide income at a rate of 25%. See “Item 3.D. Key Information—Risk Factors—Risks Related to Doing Business in China—If we are classified as a PRC resident enterprise for PRC income tax purposes, such classification could result in unfavorable tax consequences to us and our non-PRC shareholders or ADS holders.”
Results of Operations
The following table summarizes our consolidated results of operations in absolute amount and as a percentage of our total net revenues for the periods indicated.
Period-to-period comparisons of historical results of operations should not be relied upon as indicative of future performance.
| For the Year Ended December 31, | ||||||||||||||||||||||||||||
| 2021 | 2022 | 2023 | ||||||||||||||||||||||||||
| RMB | % | RMB | % | RMB | US$ | % | ||||||||||||||||||||||
| (in millions, except for percentages) | ||||||||||||||||||||||||||||
| Net revenues |
||||||||||||||||||||||||||||
| Net product revenues |
815,655 | 85.7 | 865,062 | 82.7 | 871,224 | 122,709 | 80.3 | |||||||||||||||||||||
| Net service revenues |
135,937 | 14.3 | 181,174 | 17.3 | 213,438 | 30,062 | 19.7 | |||||||||||||||||||||
|
|
|
|
|
|
|
|
|
|
|
|
|
|
|
|||||||||||||||
| Total net revenues |
951,592 | 100.0 | 1,046,236 | 100.0 | 1,084,662 | 152,771 | 100.0 | |||||||||||||||||||||
141
Table of Contents
| For the Year Ended December 31, | ||||||||||||||||||||||||||||
| 2021 | 2022 | 2023 | ||||||||||||||||||||||||||
| RMB | % | RMB | % | RMB | US$ | % | ||||||||||||||||||||||
| (in millions, except for percentages) | ||||||||||||||||||||||||||||
| Cost of revenues |
(822,526 | ) | (86.4 | ) | (899,163 | ) | (85.9 | ) | (924,958 | ) | (130,277 | ) | (85.3 | ) | ||||||||||||||
| Fulfillment |
(59,055 | ) | (6.2 | ) | (63,011 | ) | (6.0 | ) | (64,558 | ) | (9,093 | ) | (5.9 | ) | ||||||||||||||
| Marketing |
(38,743 | ) | (4.1 | ) | (37,772 | ) | (3.6 | ) | (40,133 | ) | (5,653 | ) | (3.7 | ) | ||||||||||||||
| Research and development |
(16,332 | ) | (1.7 | ) | (16,893 | ) | (1.6 | ) | (16,393 | ) | (2,309 | ) | (1.5 | ) | ||||||||||||||
| General and administrative |
(11,562 | ) | (1.2 | ) | (11,053 | ) | (1.1 | ) | (9,710 | ) | (1,368 | ) | (0.9 | ) | ||||||||||||||
| Impairment of goodwill |
— | — | — | — | (3,143 | ) | (443 | ) | (0.3 | ) | ||||||||||||||||||
| Impairment of long-lived assets |
— | — | — | — | (2,025 | ) | (285 | ) | (0.2 | ) | ||||||||||||||||||
| Gain on sale of development properties |
767 | 0.1 | 1,379 | 0.1 | 2,283 | 322 | 0.2 | |||||||||||||||||||||
|
|
|
|
|
|
|
|
|
|
|
|
|
|
|
|||||||||||||||
| Income from operations |
4,141 | 0.4 | 19,723 | 1.9 | 26,025 | 3,665 | 2.4 | |||||||||||||||||||||
|
|
|
|
|
|
|
|
|
|
|
|
|
|
|
|||||||||||||||
| Other income/(expense) |
||||||||||||||||||||||||||||
| Share of results of equity investees |
(4,918 | ) | (0.5 | ) | (2,195 | ) | (0.2 | ) | 1,010 | 142 | 0.1 | |||||||||||||||||
| Interest expense |
(1,213 | ) | (0.1 | ) | (2,106 | ) | (0.2 | ) | (2,881 | ) | (406 | ) | (0.3 | ) | ||||||||||||||
| Others, net |
(590 | ) | (0.1 | ) | (1,555 | ) | (0.1 | ) | 7,496 | 1,056 | 0.7 | |||||||||||||||||
|
|
|
|
|
|
|
|
|
|
|
|
|
|
|
|||||||||||||||
| Income/(loss) before tax |
(2,580 | ) | (0.3 | ) | 13,867 | 1.4 | 31,650 | 4,457 | 2.9 | |||||||||||||||||||
| Income tax expenses |
(1,887 | ) | (0.2 | ) | (4,176 | ) | (0.4 | ) | (8,393 | ) | (1,182 | ) | (0.8 | ) | ||||||||||||||
|
|
|
|
|
|
|
|
|
|
|
|
|
|
|
|||||||||||||||
| Net income/(loss) |
(4,467 | ) | (0.5 | ) | 9,691 | 1.0 | 23,257 | 3,275 | 2.1 | |||||||||||||||||||
|
|
|
|
|
|
|
|
|
|
|
|
|
|
|
|||||||||||||||
142
Table of Contents
Segment Information
Beginning with the first quarter of 2021, we implemented certain segment reporting changes to better reflect our organizational structure and business developments. As a result, we reported three segments, JD Retail, JD Logistics and New Businesses in 2021. JD Cloud & AI businesses had been deconsolidated from us since March 31, 2021, and thus the operating results of JD Cloud & AI businesses had not been included in New Businesses segment since the second quarter of 2021. We have consolidated Dada since February 28, 2022 and reported the results of Dada as a new standalone segment. We have also consolidated CNLP through JD Property since March 1, 2022 and reported the results of CNLP in the New Businesses segment. In addition, we have consolidated Deppon since July 26, 2022 and reported the results of Deppon in the JD Logistics segment. As a result, we currently report four segments, namely JD Retail, JD Logistics, Dada and New Businesses. JD Retail, including JD Health and JD Industrials, among other components, mainly engage in online retail, online marketplace and marketing services in China. JD Logistics includes both internal and external logistics businesses. Dada is a local on-demand delivery and retail platform in China. New Businesses mainly include JD Property, Jingxi and overseas businesses.
The table below provides a summary of our operating segment results, with prior period segment information retrospectively recast to conform to current period presentation:
| For the Year Ended December 31, | ||||||||||||||||
| 2021 | 2022 | 2023 | ||||||||||||||
| RMB | RMB | RMB | US$ | |||||||||||||
| (in millions) | ||||||||||||||||
| Net revenues: |
||||||||||||||||
| JD Retail |
866,303 | 929,929 | 945,343 | 133,149 | ||||||||||||
| JD Logistics |
104,693 | 137,402 | 166,625 | 23,469 | ||||||||||||
| Dada |
— | 8,030 | 10,506 | 1,480 | ||||||||||||
| New Businesses |
26,063 | 21,779 | 16,111 | 2,269 | ||||||||||||
| Inter-segment* |
(46,043 | ) | (50,904 | ) | (53,923 | ) | (7,596 | ) | ||||||||
|
|
|
|
|
|
|
|
|
|||||||||
| Total segment net revenues |
951,016 | 1,046,236 | 1,084,662 | 152,771 | ||||||||||||
| Unallocated items** |
576 | — | — | — | ||||||||||||
|
|
|
|
|
|
|
|
|
|||||||||
| Total consolidated net revenues |
951,592 | 1,046,236 | 1,084,662 | 152,771 | ||||||||||||
|
|
|
|
|
|
|
|
|
|||||||||
| Operating income/(loss): |
||||||||||||||||
| JD Retail |
26,613 | 34,852 | 35,925 | 5,060 | ||||||||||||
| JD Logistics |
(1,827 | ) | 528 | 1,005 | 142 | |||||||||||
| Dada |
— | (1,122 | ) | (488 | ) | (69 | ) | |||||||||
| New Businesses |
(10,600 | ) | (5,295 | ) | 159 | 22 | ||||||||||
| Including: gain on sale of development properties |
767 | 1,379 | 2,283 | 322 | ||||||||||||
| impairment of long-lived assets |
— | — | (1,123 | ) | (158 | ) | ||||||||||
|
|
|
|
|
|
|
|
|
|||||||||
| Total segment operating income |
14,186 | 28,963 | 36,601 | 5,155 | ||||||||||||
| Unallocated items** |
(10,045 | ) | (9,240 | ) | (10,576 | ) | (1,490 | ) | ||||||||
|
|
|
|
|
|
|
|
|
|||||||||
| Total consolidated operating income |
4,141 | 19,723 | 26,025 | 3,665 | ||||||||||||
|
|
|
|
|
|
|
|
|
|||||||||
| * | The inter-segment eliminations mainly consist of revenues from supply chain solutions and logistics services provided by JD Logistics to JD Retail, on-demand delivery and retail services provided by Dada to JD Retail and JD Logistics, and property leasing services provided by JD Property to JD Logistics. |
| ** | Unallocated items include share-based compensation, amortization of intangible assets resulting from assets and business acquisitions, effects of business cooperation arrangements, and impairment of goodwill and intangible assets, which are not allocated to segments. |
Operating expenses (including fulfillment expenses, marketing expenses, research and development expenses and general and administrative expenses) before unallocated items as a percentage of net revenues for JD Retail were 11.2%, 11.1% and 11.7% for the years ended December 31, 2021, 2022 and 2023, respectively.
143
Table of Contents
Years Ended December 31, 2023 and 2022
Net Revenues
Our total net revenues increased by 3.7% from RMB1,046,236 million in 2022 to RMB1,084,662 million (US$152,771 million) in 2023. Net product revenues increased by 0.7% from RMB865,062 million in 2022 to RMB871,224 million (US$122,709 million) in 2023. Net service revenues increased by 17.8% from RMB181,174 million in 2022 to RMB213,438 million (US$30,062 million) in 2023.
The increase in our total net revenues was primarily due to enhancement in our user engagement with our efforts on improving user experience, price competitiveness and platform ecosystem in 2023. Our net product revenues achieved soft growth as we navigated a mix of gradual macro recovery, shift of the consumption preference, and the impact of our strategic refocus. The increase in our net service revenues was primarily driven by the resilient growth in logistics revenues from external customers with revenue contribution of 70.0%, which was contributed by the increase in business volume of our express delivery and freight delivery services and the effect of the consolidation of Deppon.
Cost of revenues
Our cost of revenues increased by 2.9% from RMB899,163 million in 2022 to RMB924,958 million (US$130,277 million) in 2023. This increase was primarily due to the growth of costs related to the logistics services provided to merchants and other partners.
Fulfillment expenses
Our fulfillment expenses increased by 2.5% from RMB63,011 million in 2022 to RMB64,558 million (US$9,093 million) in 2023. This increase was primarily due to the increase in compensation costs relating to fulfillment personnel. Fulfillment expenses as a percentage of net revenues were 6.0% in 2023, which remained stable from 2022. We continue to focus on economies of scale from enhanced logistics capacity utilization and improvements in efficiencies driven by technology.
Marketing expenses
Our marketing expenses increased by 6.3% from RMB37,772 million in 2022 to RMB40,133 million (US$5,653 million) in 2023. This increase was primarily due to the increased spending in promotion activities, in particular for JD Retail.
Research and development expenses
Our research and development expenses decreased by 3.0% from RMB16,893 million in 2022 to RMB16,393 million (US$2,309 million) in 2023. This decrease was primarily due to the decrease in staff cost and share-based compensation expenses relating to research and development personnel.
General and administrative expenses
Our general and administrative expenses decreased by 12.2% from RMB11,053 million in 2022 to RMB9,710 million (US$1,368 million) in 2023. This decrease was primarily due to the decrease in share-based compensation expenses.
Impairment of goodwill
We performed a quantitative impairment test for the Dada reporting unit and recorded an non-cash impairment loss of goodwill of RMB3,143 million (US$443 million) in 2023. No impairment loss of goodwill was recorded in 2022.
144
Table of Contents
Impairment of long-lived assets
Our impairment of long-lived assets was RMB2,025 million (US$285 million) in 2023, which primarily consisted of non-cash impairment loss recognized for long-lived assets in relation to JD Property and Dada.
Gain on sale of development properties
The gain on sale of development properties is mainly derived from sale of development properties to the Property Funds. See also “Item 5.A. Operating and Financial Review and Prospects—Operating Results—Selected Statements of Operations Items—Gain on sale of development properties.” For the logistics facilities that met closing conditions, we recorded disposal gain of RMB1,379 million in 2022 and RMB2,283 million (US$322 million) in 2023.
Share of results of equity investees
Compared to a loss of RMB2,195 million in 2022, our share of results of equity investees was a gain of RMB1,010 million (US$142 million) in 2023, primarily due to the increase in share of profit and the decrease in non-cash impairment of equity investees.
Others, net
Others, net was RMB1,555 million loss in 2022 and RMB7,496 million (US$1,056 million) gain in 2023, which was primarily due to increase in interest income and decrease in loss in relation to equity investments. The interest income increased from RMB5,742 million in 2022 to RMB9,576 million (US$1,349 million) in 2023. The loss in relation to equity investments was RMB3,669 million (US$517 million) in 2023 as compared to RMB8,986 million in 2022.
Net Income/(Loss)
As a result of the foregoing, we had a net income of RMB23,257 million (US$3,275 million) in 2023, as compared to a net income of RMB9,691 million in 2022.
Years Ended December 31, 2022 and 2021
Net Revenues
Our total net revenues increased by 9.9% from RMB951,592 million in 2021 to RMB1,046,236 million in 2022, with increases in both categories of net revenues. Net product revenues increased by 6.1% from RMB815,655 million in 2021 to RMB865,062 million in 2022. Net service revenues increased by 33.3% from RMB135,937 million in 2021 to RMB181,174 million in 2022.
The increase in our total net revenues was primarily due to our ability to achieve a higher customer retention and increase in average spending per customer in 2022. Despite the impact of the COVID-19 resurgence and macroeconomic uncertainties in 2022, we achieved soft growth in our product revenues based on our supply chain capabilities. As we continued to focus on user quality and building deeper user engagement, our core user base expanded. The solid increase in our net service revenues was primarily driven by the resilient growth in logistics revenues from external customers with revenue contribution of 64.9%, as well as a healthy expansion of our merchant base and additional advertising spending, resulting in our continued progress in strengthening our marketplace ecosystem and a better growth of our marketing services.
Cost of revenues
Our cost of revenues increased by 9.3% from RMB822,526 million in 2021 to RMB899,163 million in 2022. This increase was primarily due to the growth of our online retail business and increase in costs related to the logistics services provided to merchants and other partners.
145
Table of Contents
Fulfillment expenses
Our fulfillment expenses increased by 6.7% from RMB59,055 million in 2021 to RMB63,011 million in 2022. This increase was primarily due to the increase in compensation costs relating to fulfillment personnel, as well as an increase in payment processing charges as our volume of sales increased. Fulfillment expenses as a percentage of net revenues were 6.0% in 2022, as compared to 6.2% in 2021, primarily due to economies of scale from enhanced logistics capacity utilization and improvements in efficiencies driven by technology.
Marketing expenses
Our marketing expenses decreased by 2.5% from RMB38,743 million in 2021 to RMB37,772 million in 2022. This decrease was primarily due to a decrease in our advertising expenditures on both online and offline channels from RMB32,704 million in 2021 to RMB29,898 million in 2022, especially in JD Retail and Jingxi.
Research and development expenses
Our research and development expenses were RMB16,893 million in 2022, kept relatively steady as compared to RMB16,332 million in 2021. We continued to invest in top-notch R&D talent and technology infrastructure.
General and administrative expenses
Our general and administrative expenses decreased by 4.4% from RMB11,562 million in 2021 to RMB11,053 million in 2022. This decrease was primarily due to a decrease in share-based compensation expenses, as JD Property and JD Industrials both recognized one-off share-based compensation expenses in 2021 along with the adoption of their own share incentive plans.
Gain on sale of development properties
The gain on sale of development properties is mainly derived from sale of development properties to the Property Funds. See also “Item 5.A. Operating and Financial Review and Prospects—Operating Results—Selected Statements of Operations Items—Gain on sale of development properties.” For the logistics facilities that met closing conditions, we recorded disposal gain of RMB767 million in 2021 and RMB1,379 million in 2022, respectively.
Share of results of equity investees
Compared to a loss of RMB4,918 million in 2021, our share of results of equity investees was a loss of RMB2,195 million in 2022, the decrease of loss was mainly due to decrease in non-cash impairments in equity investees.
Others, net
Others, net was RMB590 million loss in 2021 and RMB1,555 million loss in 2022. The increase of loss was primarily due to a loss of RMB3,623 million recognized in 2022 resulting from the change of Dada’s share price prior to the closing of the acquisition, which was partially offset by the decrease of loss of fair value change of long-term investments. The fair value change of long-term investments was a loss of RMB4,096 million in 2022 as compared to a loss of RMB7,252 million in 2021.
Net Income/(Loss)
As a result of the foregoing, we had a net income of RMB9,691 million in 2022, as compared to a net loss of RMB4,467 million in 2021.
146
Table of Contents
| B. | Liquidity and Capital Resources |
Our primary sources of liquidity have been proceeds from operating activities, equity and debt financing, and certain business or assets reorganizations.
Our major financings
Set forth below are our major financings in recent years:
| • | In April 2016, we issued an aggregate of US$500 million unsecured senior notes due 2021, with stated annual interest rate of 3.125%, and an aggregate of US$500 million unsecured senior notes due 2026, with stated annual interest rate of 3.875%. The net proceeds from the sale of these notes were used for general corporate purposes. As of December 31, 2023, the notes due 2021 were paid off, and the carrying value and estimated fair value of the notes due 2026 were US$497.0 million and US$482.9 million, respectively. The estimated fair values were based on quoted prices for our publicly traded debt securities as of December 31, 2023. The unsecured senior notes contain covenants including, among others, limitation on liens, and restriction on consolidation, merger and sale of all or substantially all of our assets. We are in compliance with all the covenants. During 2023, we paid an aggregate of US$19.4 million in interest payments related to these notes. |
| • | In January 2020, we issued an aggregate of US$700 million unsecured senior notes due 2030, with stated annual interest rate of 3.375%, and an aggregate of US$300 million unsecured senior notes due 2050, with stated annual interest rate of 4.125%. The net proceeds from the sale of these notes are used for general corporate purposes and refinancing. As of December 31, 2023, the total carrying value and estimated fair value were US$691.5 million and US$626.7 million, respectively, with respect to the notes due 2030, and US$281.4 million and US$223.9 million, respectively, with respect to the notes due 2050. The estimated fair values were based on quoted prices for our publicly traded debt securities as of December 31, 2023. The unsecured senior notes contain covenants including, among others, limitation on liens, and restriction on consolidation, merger and sale of all or substantially all of our assets. We are in compliance with all the covenants. During 2023, we paid an aggregate of US$36.0 million in interest payments related to these notes. |
| • | In June 2020, our Class A ordinary shares commenced trading on the Main Board of the Hong Kong Stock Exchange under the stock code “9618.” We raised from our global offering in connection with the listing in Hong Kong approximately RMB31.3 billion in net proceeds after deducting underwriting commissions, share issuance costs and the offering expenses. |
| • | In December 2021, we entered into a five-year US$2.0 billion unsecured term and revolving loan facility with five lead arrangers. This loan facility is our first green loan facility. The term and revolving loans under this facility are priced at 85 basis points over LIBOR, which was amended to the Secured Overnight Financing Rate in September 2022. In the second quarter of 2022, we drew down US$1.0 billion under the facility commitment, which will be due in 2027. We used the proceeds from this loan facility to (i) finance or refinance in whole or in part, one or more of its new or existing eligible green projects and/or (ii) general corporate purposes. |
Major financings of our subsidiaries
Set forth below are the major financings of our subsidiaries in recent years:
JD Logistics
| • | In May 2021, shares of JD Logistics commenced trading on the Main Board of the Hong Kong Stock Exchange under the stock code “2618.” JD Logistics raised from the global offering in connection with the listing in Hong Kong approximately RMB22.9 billion in net proceeds after deducting underwriting commissions, share issuance costs and the offering expenses. |
| • | On April 1, 2022, JD Logistics raised approximately HK$3,102 million net proceeds from a group of third-party investors by issuing to them 150,500,000 of its ordinary shares. On May 26, 2022, we subscribed for 261,400,000 ordinary shares of JD Logistics for a total purchase price of approximately US$692 million in cash, upon which we maintained our shareholding in JD Logistics at more than 63% and continued to consolidate JD Logistics’s financial results into our financial statements. |
147
Table of Contents
JD Health
| • | In August 2020, JD Health completed the non-redeemable series B preference share financing with a group of third-party investors. The total amount of financing raised was US$914 million, representing 4.5% of the ownership of JD Health on a fully diluted basis. |
| • | In December 2020, shares of JD Health commenced trading on the Main Board of the Hong Kong Stock Exchange under the stock code “6618.” JD Health raised from its global offering in connection with the listing in Hong Kong approximately RMB25.7 billion in net proceeds after deducting underwriting commissions, share issuance costs and the offering expenses. |
JD Property
| • | In March 2021, JD Property entered into definitive agreements for the non-redeemable series A preference share financing with co-lead investors Hillhouse Investment and Warburg Pincus, among others. The total amount raised was US$703 million. We remained the majority shareholder of JD Property after the completion of this transaction. |
| • | In March 2022 and June 2022, JD Property entered into definitive agreements for its non-redeemable series B preferred share financing with investors led by Hillhouse Investment, Warburg Pincus, and one leading global institutional investor, among others. The total amount raised in this round was approximately US$800 million. The transaction is subject to customary closing conditions. We remained the majority shareholder of JD Property after the completion of this transaction. |
| • | In December 2023, we entered into a RMB8,500 million term loan agreement with interest rate at 65 basis points below the Loan Prime Rate to refinance the loan and drew down RMB8,286 million, which was expected to be repaid through December 2028 in installments. The net proceeds from this loan facility are used for refinancing. |
JD Industrials
| • | In April 2020, December 2020 and March 2023, JD Industrials entered into definitive agreements for non-redeemable series A, series A-1 and series B preference share financing with a group of third-party investors. The total amount of financing arising was approximately US$545 million. Upon completion of such financing, we hold approximately 78% of the issued and outstanding shares of JD Industrials. |
As of December 31, 2023, we had revolving lines of credit for an aggregate amount of RMB164.3 billion (US$23.1 billion) from several commercial banks, and RMB120.7 billion (US$17.0 billion) of which was unused.
As of December 31, 2023, we had a total of RMB275.7 billion (US$38.8 billion) in cash and cash equivalents, restricted cash and short-term investments and time deposits or wealth management products with maturities more than one year in marketable securities and investments. This included primarily RMB172.4 billion (US$24.3 billion), HK$3.0 million (US$0.4 million) and US$0.1 billion in the Chinese mainland, RMB3.9 billion (US$0.5 billion) and US$10.0 billion in Hong Kong. Our cash and cash equivalents generally consist of cash on hand, time deposits and liquid investments with maturities of three months or less.
Taking into account cash and cash equivalents on hand, our operating cash flows, and the available bank facilities, we believe that we have sufficient working capital for our present requirements and for at least the next 12 months from the date of this annual report. We may, however, need additional cash resources in the future if we experience changes in business conditions or other developments. We may also need additional cash resources in the future if we find and wish to pursue opportunities for investment, acquisition, capital expenditure or similar actions. If we determine that our cash requirements exceed the amount of cash and cash equivalents we have on hand, we may seek to issue debt or equity securities or obtain additional credit facilities.
148
Table of Contents
Our net inventories amounted to RMB75.6 billion, RMB77.9 billion and RMB68.1 billion (US$9.6 billion) as of December 31, 2021, 2022 and 2023, respectively. Our annual inventory turnover days were 30.3 days in 2021, 33.2 days in 2022 and 30.3 days in 2023. Annual inventory turnover days are the quotient of average inventory over the immediately preceding five quarters, up to and including the last quarter of the annual period, to cost of revenues of retail business for that annual period, and then multiplied by 360 days. Our inventory balances will fluctuate over time due to a number of factors, including expansion in our product selection and changes in our product mix. Our inventory balances typically increase when we prepare for special promotion events, such as the anniversary of the founding of our company on June 18 and China’s online shopping festival on November 11.
Our accounts payable primarily include accounts payable to suppliers associated with our retail business. As of December 31, 2021, 2022 and 2023, our accounts payable amounted to RMB140.5 billion, RMB160.6 billion and RMB166.2 billion (US$23.4 billion), respectively. These increases reflected a stable growth in our sales volumes and scale of operations for our retail business and the related increase in products sourced from our suppliers. Our annual accounts payable turnover days for retail business were 45.3 days in 2021, 52.5 days in 2022 and 53.2 days in 2023. Annual accounts payable turnover days are the quotient of average accounts payable for retail business over the immediately preceding five quarters, up to and including the last quarter of the annual period to cost of revenues of retail business for that annual period, and then multiplied by 360 days.
Our accounts receivable primarily include amounts due from customers and online payment channels. As of December 31, 2021, 2022 and 2023, our accounts receivable amounted to RMB11.9 billion, RMB20.6 billion and RMB20.3 billion (US$2.9 billion), respectively. JD Technology provides consumer financing to our customers. As of December 31, 2021, 2022 and 2023, the balances of current portion of financing provided to our customers that were included in accounts receivable balances amounted to RMB2.5 billion, RMB3.1 billion and RMB2.3 billion (US$0.3 billion), respectively. Our accounts receivable turnover days excluding the impact from consumer financing were 2.9 days in 2021, 4.5 days in 2022 and 5.6 days in 2023. Annual accounts receivable turnover days are the quotient of average accounts receivable over the immediately preceding five quarters, up to and including the last quarter of the annual period, to total net revenues for that annual period and then multiplied by 360 days.
Although we consolidate the results of the consolidated variable interest entities, we only have access to cash balances or future earnings of the consolidated variable interest entities through our contractual arrangements with them. See “Item 4.C. Information on the Company—Organizational Structure.” For restrictions and limitations on liquidity and capital resources as a result of our corporate structure, see “Item 5.B. Operating and Financial Review and Prospects—Liquidity and Capital Resources—Holding Company Structure.”
As a Cayman Islands exempted company and offshore holding company, we are permitted under PRC laws and regulations to provide funding to our wholly foreign-owned subsidiaries in the Chinese mainland only through loans or capital contributions, subject to the approval of government authorities and limits on the amount of capital contributions and loans. In addition, our wholly foreign-owned subsidiaries in the Chinese mainland may provide RMB funding to their respective subsidiaries only through capital contributions and entrusted loans, and to the consolidated variable interest entities only through entrusted loans. See “Introduction—Summary of Risk Factors—Risks Related to Our Corporate Structure,” “Item 5.B. Operating and Financial Review—Liquidity and Capital Resources” and “Item 3.D. Key Information—Risk Factors—Risks Related to Our Corporate Structure—PRC regulation of loans to and direct investment in PRC entities by offshore holding companies and governmental regulations of currency conversion may delay or prevent us from making loans to our PRC subsidiaries and the consolidated variable interest entities or making additional capital contributions to our wholly foreign-owned subsidiaries in the Chinese mainland, which could materially and adversely affect our liquidity and our ability to fund and expand our business.”
RMB may be converted into foreign exchange for current account items, including interest and trade- and service-related transactions. As a result, our PRC subsidiaries and the consolidated variable interest entities in China may purchase foreign exchange for the payment of license, content or other royalty fees and expenses to offshore licensors and content partners, for example.
Our wholly foreign-owned subsidiaries may convert RMB amounts that they generate in their own business activities, including technical consulting and related service fees pursuant to their contracts with the consolidated variable interest entities, as well as dividends they receive from their own subsidiaries, into foreign exchange and pay them to their non-PRC parent companies in the form of dividends. However, current PRC regulations permit our wholly foreign-owned subsidiaries to pay dividends to us only out of their accumulated profits, if any, determined in accordance with Chinese accounting standards and regulations. Each of our wholly foreign-owned subsidiaries is required to set aside at least 10% of its after-tax profits after making up previous years’ accumulated losses each year, if any, to fund certain reserve funds until the total amount set aside reaches 50% of its registered capital. These reserves are not distributable as cash dividends. Furthermore, capital account transactions, which include foreign direct investment and loans, must be approved by and/or registered with SAFE and its local branches.
149
Table of Contents
The following table sets forth a summary of our cash flows for the periods indicated:
| For the Year Ended December 31, | ||||||||||||||||
| 2021 | 2022 | 2023 | ||||||||||||||
| RMB | RMB | RMB | US$ | |||||||||||||
| (in millions) | ||||||||||||||||
| Summary Consolidated Cash Flows Data: |
||||||||||||||||
| Net cash provided by operating activities |
42,301 | 57,819 | 59,521 | 8,383 | ||||||||||||
| Net cash used in investing activities |
(74,248 | ) | (54,026 | ) | (59,543 | ) | (8,386 | ) | ||||||||
| Net cash provided by/(used in) financing activities |
19,503 | 1,180 | (5,808 | ) | (818 | ) | ||||||||||
| Effect of exchange rate changes on cash, cash equivalents and restricted cash |
(1,498 | ) | 3,490 | 125 | 17 | |||||||||||
|
|
|
|
|
|
|
|
|
|||||||||
| Net increase/(decrease) in cash, cash equivalents and restricted cash |
(13,942 | ) | 8,463 | (5,705 | ) | (804 | ) | |||||||||
| Cash, cash equivalents, and restricted cash at beginning of year, including cash and cash equivalents classified within assets held for sale |
90,635 | 76,693 | 85,156 | 11,994 | ||||||||||||
| Less: cash, cash equivalents, and restricted cash classified within assets held for sale at beginning of year |
116 | — | 41 | 6 | ||||||||||||
| Cash, cash equivalents, and restricted cash at beginning of year |
90,519 | 76,693 | 85,115 | 11,988 | ||||||||||||
|
|
|
|
|
|
|
|
|
|||||||||
| Cash, cash equivalents and restricted cash at end of year, including cash and cash equivalents classified within assets held for sale |
76,693 | 85,156 | 79,451 | 11,190 | ||||||||||||
| Less: cash, cash equivalents and restricted cash classified within assets held for sale at end of year |
— | 41 | 53 | 7 | ||||||||||||
|
|
|
|
|
|
|
|
|
|||||||||
| Cash, cash equivalents and restricted cash at end of year |
76,693 | 85,115 | 79,398 | 11,183 | ||||||||||||
|
|
|
|
|
|
|
|
|
|||||||||
Operating Activities
Net cash provided by operating activities in 2023 was RMB59,521 million (US$8,383 million). In 2023, the principal items accounting for the difference between our net cash provided by operating activities and our net income were certain non-cash expenses, principally depreciation and amortization of RMB8,292 million (US$1,168 million), impairment of goodwill, long-lived assets and equity investments totaled RMB8,211 million (US$1,157 million), share-based compensation of RMB4,804 million (US$677 million), and changes in certain working capital accounts, principally an decrease in inventories of RMB9,891 million (US$1,393 million), and an increase in accounts payable of RMB4,614 million (US$650 million). The decrease in inventories was mainly due to seasonality, as inventories were pre-stocked at the end of 2022 for the 2023 Chinese New Year which was in January 2023, while the 2024 Chinese New Year was in February 2024 and thus fewer inventories was pre-stocked at the end of 2023. The increase in our accounts payable was due to the growth of our business.
Net cash provided by operating activities in 2022 was RMB57,819 million. In 2022, the principal items accounting for the difference between our net cash provided by operating activities and our net income were certain non-cash expenses, principally share-based compensation of RMB7,548 million, depreciation and amortization of RMB7,236 million, and loss from fair value change of long-term investments of RMB4,096 million, and changes in certain working capital accounts, principally an increase in accounts payable of RMB17,658 million and an increase in advance from customers of RMB4,526 million. The increase in our accounts payable was due to the growth of our business. The increase in our advance from customers was due to the increase in our sales of prepaid cards.
Net cash provided by operating activities in 2021 was RMB42,301 million. In 2021, the principal items accounting for the difference between our net cash provided by operating activities and our net income were non-cash expenses, principally share-based compensation of RMB9,134 million, loss from fair value change of long-term investments of RMB7,252 million, depreciation and amortization of RMB6,232 million, and loss on share of results of equity investees of RMB4,918 million, and changes in certain working capital accounts, principally an increase in accounts payable of RMB32,585 million, an increase in advance from customers of RMB8,702 million, and an increase in accrued expenses and other current liabilities of RMB5,257 million. The increase in our accounts payable and advance from customers was mainly due to the growth of our retail business. The increase in our accrued expenses and other current liabilities was primarily due to the increase of vendor deposits.
150
Table of Contents
Investing Activities
Net cash used in investing activities in 2023 was RMB59,543 million (US$8,386 million), consisting primarily of the purchase of short-term investments and long-term time deposits and wealth management products, cash paid for construction in progress and land use rights, purchases of property, equipment and software and asset acquisitions, partially offset by the maturity of short-term investments, cash received from disposal of equity investments and investment securities and cash received from sale of development properties.
Net cash used in investing activities in 2022 was RMB54,026 million, consisting primarily of the purchase of short-term investments, cash paid for business combination, cash paid for investment in equity investees and investment securities, cash paid for construction in progress and land use rights, purchases of property, equipment and software, partially offset by the maturity of short-term investments, cash received from disposals of investment in equity investees and investment securities and cash received from sale of development properties.
Net cash used in investing activities in 2021 was RMB74,248 million, consisting primarily of the purchase of short-term investments, investment in equity investees and investment securities, cash paid for construction in progress and land use rights, purchases of property, equipment and software, partially offset by the maturity of short-term investments, cash received from disposals of investment in equity investees and investment securities and cash received from sale of development properties.
Financing Activities
Net cash used in financing activities in 2023 was RMB5,808 million (US$818 million), consisting primarily of cash paid for dividends, cash paid for repurchase of ordinary shares and ADSs of our company, partially offset by net proceeds from bank borrowings.
Net cash provided by financing activities in 2022 was RMB1,180 million, consisting primarily of proceeds from bank borrowings, net proceeds from JD Property’s non-redeemable series B preferred share financing and share placement of JD Logistics, partially offset by repayment of bank borrowings, cash paid for dividends, and cash paid for repurchase of ordinary shares of our company and our subsidiaries.
Net cash provided by financing activities in 2021 was RMB19,503 million, consisting primarily of net proceeds of RMB23,011 million from the initial public offering of JD Logistics in Hong Kong, the proceeds from short-term borrowing of RMB7,133 million and net proceeds of RMB4,557 million from the non-redeemable series A preference share financing of JD Property, partially offset by the cash paid for repayment of short-term borrowings of RMB5,982 million, repurchase of ordinary shares of RMB5,246 million and repayment of unsecured senior notes of RMB3,246 million.
Material cash requirements
Our material cash requirements as of December 31, 2023 and any subsequent interim period primarily include our capital expenditures and contractual obligations.
Capital Expenditures
We made capital expenditures of RMB22.1 billion, RMB23.7 billion and RMB25.4 billion (US$3.6 billion) in 2021, 2022 and 2023, respectively. Our capital expenditures for 2021, 2022 and 2023 consisted primarily of expenditures related to the expansion of our fulfillment infrastructure, technology platform, logistics equipment as well as our office buildings. Our capital expenditures will continue to be significant in the foreseeable future as we expand and improve our fulfillment infrastructure and technology platform to meet the needs of our business operations. JD Property seeks to realize development profits and recycle capital from mature properties to fund new developments and scale the business. We sold certain of our development properties and received proceeds of RMB3.5 billion in 2021, RMB1.7 billion in 2022, and RMB7.0 billion (US$1.0 billion) in 2023, respectively.
151
Table of Contents
Contractual Obligations
The following table sets forth our contractual obligations as of December 31, 2023:
| Payment Due by Period | ||||||||||||||||||||
| Total | Less than 1 year |
1-3 years |
3-5 years |
More than 5 years |
||||||||||||||||
| (RMB in millions) | ||||||||||||||||||||
| Operating lease commitments for offices and fulfillment infrastructures |
25,104 | 8,111 | 8,068 | 3,458 | 5,467 | |||||||||||||||
| Commitments for internet data center service fee |
4,439 | 829 | 761 | 720 | 2,129 | |||||||||||||||
| Capital commitments(1) |
8,150 | 8,150 | — | — | — | |||||||||||||||
| Long-term debt obligations(2) |
42,437 | 471 | 10,101 | 17,527 | 14,338 | |||||||||||||||
| Estimated interest payments in relation to long-term debt obligations(2) |
9,037 | 1,599 | 2,910 | 1,631 | 2,897 | |||||||||||||||
|
|
|
|
|
|
|
|
|
|
|
|||||||||||
| Total |
89,167 | 19,160 | 21,840 | 23,336 | 24,831 | |||||||||||||||
|
|
|
|
|
|
|
|
|
|
|
|||||||||||
| (1) | Our capital commitments primarily relate to commitments on construction and purchase of office buildings and warehouses, and are expected to be paid in the following years according to the construction progress. |
| (2) | Our long-term debt obligations are mainly unsecured senior notes and long-term borrowings, including the portion due within one year. |
Our investment commitments contracted but without fixed payment schedule amounted to RMB2.3 billion (US$0.3 billion) as of December 31, 2023, which primarily related to capital contribution obligation for certain fund investment.
Off-Balance Sheet Arrangements
We have not entered into any material financial guarantees or other commitments to guarantee the payment obligations of any third parties. We have not entered into any derivative contracts that are indexed to our shares and classified as shareholder’s equity or that are not reflected in our consolidated financial statements. Furthermore, we do not have any retained or contingent interest in assets transferred to an unconsolidated entity that serves as credit, liquidity or market risk support to such entity. We do not have any variable interest in any unconsolidated entity that provides financing, liquidity, market risk or credit support to us or engages in leasing, hedging or product development services with us.
Holding Company Structure
JD.com, Inc. is a holding company with no material operations of its own. We conduct our operations primarily through our subsidiaries and the consolidated variable interest entities in China. As a result, JD.com, Inc.’s ability to pay dividends depends upon dividends paid by our PRC subsidiaries. If our existing PRC subsidiaries or any newly formed ones incur debt on their own behalf in the future, the instruments governing their debt may restrict their ability to pay dividends to us. In addition, our wholly foreign-owned subsidiaries in China are permitted to pay dividends to us only out of their retained earnings, if any, as determined in accordance with PRC accounting standards and regulations. Under PRC law, each of our subsidiaries and the consolidated variable interest entities in China is required to set aside at least 10% of its after-tax profits each year, if any, to fund certain statutory reserve funds until such reserve funds reach 50% of its registered capital. Each of the other PRC subsidiaries and the consolidated variable interest entities may allocate a portion of its after-tax profits based on PRC accounting standards to a discretionary surplus fund at its discretion. The statutory reserve funds and the discretionary funds are not distributable as cash dividends. Remittance of dividends by a wholly foreign-owned company out of China is subject to examination by the banks designated by SAFE. As of December 31, 2023, the amount restricted, including paid-in capital and statutory reserve funds, as determined in accordance with PRC accounting standards and regulations, was approximately RMB67.6 billion (US$9.5 billion).
152
Table of Contents
| C. | Research and Development, Patents, and Licenses, etc. |
We have built our technology platform relying primarily on software and systems that we have developed in-house and to a lesser extent on third-party software that we have modified and incorporated. Our research and development professionals design, develop and operate our technology platform and to improve our AI, big data and cloud technologies and services.
In 2021, 2022 and 2023, our research and development expenses, including share-based compensation expenses for research and development staff, were RMB16,332 million, RMB16,893 million and RMB16,393 million (US$2,309 million), respectively. Our research and development expenses consist primarily of payroll and related expenses for research and development professionals involved in designing, developing and operating our technology platform, and improving our AI, big data and cloud technologies and services, and technology infrastructure costs. Technology infrastructure costs include servers and other equipment depreciation, bandwidth and data center costs, rent, utilities and other expenses necessary to support our internal and external business. We expect spending in research and development continue to be significant over time as we plan to continue to invest in our technology and innovation to enhance customer experience and provide value-added services to our business partners.
| D. | Trend Information |
Other than as disclosed elsewhere in this annual report, we are not aware of any trends, uncertainties, demands, commitments or events for the period since January 1, 2024 that are reasonably likely to have a material and adverse effect on our net revenues, income, profitability, liquidity or capital resources, or that would cause the disclosed financial information to be not necessarily indicative of future results of operations or financial conditions.
| E. | Critical Accounting Estimates |
An accounting estimate is considered critical if it requires to be made based on assumptions about matters that are highly uncertain at the time such estimate is made, and if different accounting estimates that reasonably could have been used, or changes in the accounting estimate that are reasonably likely to occur periodically, could materially impact the consolidated financial statements.
We prepare our consolidated financial statements in conformity with U.S. GAAP, which requires us to make estimates and assumptions. We continually evaluate these estimates and assumptions based on the most recently available information, our own historical experiences and various other assumptions that we believe to be reasonable under the circumstances. Since the use of estimates is an integral component of the financial reporting process, actual results could differ from our expectations as a result of changes in our estimates. Some of our accounting policies require a higher degree of judgment than others in their application and require us to make significant accounting estimates.
The following descriptions of critical accounting estimates should be read in conjunction with our consolidated financial statements and other disclosures included in this annual report. For further information, see Note 2 to our consolidated financial statements in this annual report.
Impairment Assessment of Investment in Equity Investees
Investment in equity investees represents our investments in privately held companies, publicly traded companies and private equity funds. We apply the equity method of accounting to account for an equity investment, in common stock or in-substance common stock, according to ASC Topic 323, Investment-Equity Method and Joint Ventures (“ASC 323”), over which it has significant influence but does not own a majority equity interest or otherwise control.
We continually review our investment in equity investees under equity method to determine whether a decline in fair value to below the carrying value is other-than-temporary. The primary factors we consider in our determination are the duration and severity of the decline in fair value, the financial condition, operating performance and the prospects of the equity investee, and other company specific information such as recent financing rounds. If the decline in fair value is deemed to be other-than-temporary, the carrying value of the equity investee is written down to fair value.
153
Table of Contents
Our equity investments without readily determinable fair values, which do not qualify for NAV practical expedient and over which we do not have the ability to exercise significant influence through the investments in common stock or in substance common stock, are accounted for under the measurement alternative. We make assessment of whether an investment is impaired based on performance and financial position of the investee as well as other evidence of market value at each reporting date. Such assessment includes, but is not limited to, reviewing the investee’s cash position, recent financing, as well as the financial and business performance. When indicators of impairment exist, we also prepare quantitative measurements of the fair value of our equity investments using market approach, income approach or cost approach, if applicable, with observable or unobservable inputs and assumptions. Changes in inputs and assumptions might materially affect the determination of fair value of our equity investments. We recognize an impairment loss equal to the difference between the carrying value and fair value in others, net in the consolidated statements of operations and comprehensive income/(loss) if there is any.
Revenues
We recognize revenues net of discounts and return allowances when the products are delivered and title is passed to customers. Significant judgment is required to estimate return allowances. For online retail business with return conditions, we reasonably estimate the possibility of return based on the historical experience, changes in judgments on these assumptions and estimates could materially impact the amount of net revenues recognized.
Inventories
Inventories, consisting of products available for sale, are stated at the lower of cost and net realizable value. Cost of inventories is mainly determined using the weighted average cost method. Adjustments are recorded to write down the cost of inventories to the estimated net realizable value due to slow-moving merchandise and damaged goods, which is dependent upon factors such as inventory aging, historical and forecasted consumer demand, and market conditions that impact pricing. We take ownership, risks and rewards of the products purchased, but have arrangements to return unsold goods with certain vendors. Write-downs are recorded in cost of revenues in our consolidated statements of operations and comprehensive income/(loss). As a measure of sensitivity, for every 1% of additional inventory valuation allowance as of December 31, 2023, we would have recorded an additional cost of sales of approximately RMB724 million (US$102 million).
Goodwill Impairment
Goodwill represents the excess of the purchase price over the fair value of the identifiable assets and liabilities acquired in a business combination.
Goodwill is not depreciated or amortized but is tested for impairment on an annual basis as of December 31, and in between annual tests when an event occurs or circumstances change that could indicate that the asset might be impaired. In accordance with ASU 2017-04, Intangibles-Goodwill and Other (Topic 350): Simplifying the Test for Goodwill Impairment (“ASU 2017-04”) issued by the Financial Accounting Standards Board (“FASB”) guidance on testing of goodwill for impairment, we first assess qualitative factors to determine whether it is more likely than not that the fair value of a reporting unit is less than its carrying amount. If as a result of the qualitative assessment, it is more likely than not that the fair value of the reporting unit is less than its carrying amount, the quantitative impairment test is mandatory. Otherwise, no further testing is required. The quantitative impairment test consists of a comparison of the fair value of each reporting unit with its carrying amount, including goodwill. If the carrying amount of each reporting unit exceeds its fair value, an impairment loss equal to the difference between the fair value of the reporting unit and its carrying amount will be recorded.
Application of a goodwill impairment test requires significant management judgment, including the identification of reporting units, assigning assets and liabilities to reporting units, assigning goodwill to reporting units, and determining the fair value of each reporting unit. The judgment in estimating the fair value of reporting units includes estimating future cash flows, determining appropriate discount rates and making other assumptions. Changes in these estimates and assumptions could materially affect the determination of fair value for each reporting unit.
154
Table of Contents
During the years ended December 31, 2021, 2022 and 2023, management monitored the actual performance of the business and conducted goodwill impairment test. No impairment loss of goodwill was recorded for the years ended December 31, 2021 and 2022. For the year ended December 31, 2023, considered the duration and severity of the decline of Dada’s stock price, we assessed that it is more likely than not that the fair value of Dada reporting unit is less than its carrying amount and performed a quantitative impairment test for the Dada reporting unit. The fair value of Dada was determined based on the discounted cash flow analysis using the following significant assumptions: (a) internal cash flows forecasts, including expected revenue growth, operating margins and estimated capital needs, (b) an estimated terminal value using a long-term future growth rate, and (c) a discount rate. As a result, the fair value of Dada reporting unit was estimated to be below the carrying value and we recorded a RMB3.1 billion (US$0.4 billion) goodwill impairment for the year ended December 31, 2023.
Long-lived Assets Impairment
We review our long-lived assets for impairment whenever events or changes in circumstances indicate that the carrying amount of an asset or the asset group may not be fully recoverable or that the useful life is shorter than we had originally estimated. When these events occur, we evaluate the impairment for the long-lived assets by comparing the carrying value of the asset or the asset group to an estimate of future undiscounted cash flows expected to be generated from the use of the asset or the asset group and its eventual disposition. If the sum of the expected future undiscounted cash flows is less than the carrying value of the asset or the asset group, we recognize an impairment loss based on the excess of the carrying value of the asset or the asset group over its fair value. The fair value of the asset or asset group is determined using income approach, market approach or term & reversion method with unobservable inputs (Level 3), depending on the underlying nature of the asset or the asset group. Changes in inputs and assumptions might materially affect the determination of fair value of long-lived assets.
Income Taxes
Current income taxes are provided on the basis of net income for financial reporting purposes, adjusted for income and expense items which are not assessable or deductible for income tax purposes, in accordance with the regulations of the tax jurisdictions. We follow the liability method of accounting for income taxes. Under this method, deferred tax assets and liabilities are determined based on the temporary differences between the financial statements carrying amounts and tax bases of existing assets and liabilities by applying enacted statutory tax rates that will be in effect in the period in which the temporary differences are expected to reverse. We record a valuation allowance to reduce the amount of deferred tax assets if based on the weight of available evidence, it is more likely than not that some portion, or all, of the deferred tax assets will not be realized. The effect on deferred taxes of a change in tax rate is recognized in our consolidated statements of operations and comprehensive income/(loss) in the period of change. Deferred tax assets and liabilities are classified as non-current in the consolidated balance sheets.
We recognize in our consolidated financial statements the benefit of a tax position if the tax position is “more likely than not” to prevail based on the facts and technical merits of the position. Tax positions that meet the “more likely than not” recognition threshold are measured at the largest amount of tax benefit that has a greater than 50% likelihood of being realized upon settlement. We estimate our liability for unrecognized tax benefits which are periodically assessed and may be affected by changing interpretations of laws, rulings by tax authorities, changes and/or developments with respect to tax audits, and expiration of the statute of limitations. The ultimate outcome for a particular tax position may not be determined with certainty prior to the conclusion of a tax audit and, in some cases, appeal or litigation process. The actual benefits ultimately realized may differ from our estimates. As each audit is concluded, adjustments, if any, are recorded in our consolidated financial statements in the period in which the audit is concluded. Additionally, in future periods, changes in facts, circumstances and new information may require us to adjust the recognition and measurement estimates with regard to individual tax positions. Changes in recognition and measurement estimates are recognized in the period in which the changes occur. As of December 31, 2022 and 2023, we did not have any significant unrecognized uncertain tax positions.
155
Table of Contents
| Item 6. | Directors, Senior Management and Employees |
| A. | Directors and Senior Management |
The following table sets forth information regarding our executive officers and directors as of the date of this annual report.
| Directors and Executive Officers |
Age | Position/Title | ||
| Richard Qiangdong Liu |
51 | Chairman of the Board of Directors | ||
| Sandy Ran Xu |
47 | Chief Executive Officer and Executive Director | ||
| Ming Huang |
60 | Independent Director | ||
| Louis T. Hsieh |
59 | Independent Director | ||
| Dingbo Xu |
61 | Independent Director | ||
| Caroline Scheufele |
62 | Independent Director | ||
| Carol Yun Yau Li |
44 | Independent Director | ||
| Ian Su Shan |
42 | Chief Financial Officer | ||
| Pang Zhang |
35 | Chief Human Resources Officer |
Richard Qiangdong Liu has been the chairman of our company since inception and served as our chief executive officer until April 2022. He founded JD.com in 2004 and has guided its development and growth since then. Mr. Liu received the prestigious award “Person of the Year of Chinese Economy 2011” from CCTV, China’s national television network. He was among “World’s 50 Greatest Leaders” named by Fortune Magazine in 2015. Mr. Liu currently serves as the chairman of the board and director of Jingdong Technology Holding Co., Ltd., JD Health International Inc. (HKEX: 6618), and JD Logistics, Inc. (HKEX: 2618). Mr. Liu received his bachelor’s degree in sociology from Renmin University of China in 1996 and an EMBA from China Europe International Business School in 2011.
Sandy Ran Xu has served as our chief executive officer and executive director since May 2023. Prior to her current role, Ms. Xu served as the chief financial officer of our company from June 2020 to May 2023. Prior to joining JD.com in 2018, Ms. Xu was an audit partner and spent nearly 20 years with PricewaterhouseCoopers Zhong Tian LLP, Beijing office and PricewaterhouseCoopers, San Jose office. Ms. Xu currently also serves as a director of Yonghui Superstores Co., Ltd and an independent director of Baidu, Inc.. Ms. Xu was a Certified Public Accountant in both China and the United States. Ms. Xu received her bachelor’s degree with a double major in information science and economics from Peking University.
Ming Huang has served as our independent director since March 2014. Mr. Huang has been a professor of finance at the Johnson Graduate School of Management at Cornell University since July 2005. From July 2010 to June 2019, Mr. Huang was a professor of finance at China Europe International Business School. Mr. Huang also served as a professor of finance at Cheung Kong Graduate School of Business in China from July 2008 to June 2010 and Dean of the School of Finance at Shanghai University of Finance and Economics from April 2006 to March 2009. Prior to 2005, he was an associate professor of finance at the Graduate School of Business at Stanford University from September 2002 to June 2005 and an associate dean and visiting professor of finance at Cheung Kong Graduate School of Business from July 2004 to June 2005. Professor Huang’s academic research primarily focuses on behavioral finance, credit risk and derivatives. In recent years, his research has focused on Chinese capital market and public companies. Mr. Huang is also an independent non-executive director of WH Group Limited, a company listed on the Hong Kong Stock Exchange. Professor Huang received his bachelor’s degree in physics from Peking University, a Ph.D. in theoretical physics from Cornell University and a Ph.D. in finance from Stanford University.
Louis T. Hsieh has served as our independent director since May 2014. Mr. Hsieh currently serves as the global chief financial officer, since April 2021, and board director, since June 2021, of Hesai Technology (NASDAQ: HSAI), a global leader in 3-D Lidar solutions. From 2017 to 2019, Mr. Hsieh served as the global chief financial officer of Nio Inc., a leading electric car original equipment manufacturer (NYSE: NIO). Mr. Hsieh has served as a board director of New Oriental Education & Technology Group Inc., the largest provider of private educational services in China listed on the NYSE (NYSE: EDU), since March 2007, and served as its chief financial officer from 2005 to 2015 and its president from 2009 to 2016. He also served as an independent director, from 2016 to 2023, and chairman of the audit committee from 2016 to 2019, of YUM China Holdings, Inc., a NYSE and HKEX listed (NYSE: YUMC, HKEX: 9987) leading operator of restaurant chains in China including KFC and Pizza Hut. From 2000 to 2002, Mr. Hsieh was the managing director and the Asia-Pacific tech/media/telecoms head of UBS Capital Asia Pacific, the private equity division of UBS AG. From 1997 to 2000, Mr. Hsieh was a technology investment banker at JP Morgan in San Francisco, California, where he was a vice president, and Credit Suisse in Palo Alto, California, where he was an associate. From 1990 to 1995, Mr. Hsieh was a corporate and securities attorney at White & Case LLP in Los Angeles. Mr. Hsieh holds a bachelor’s degree in industrial engineering and engineering management from Stanford University, an MBA degree from the Harvard Business School, and a J.D. degree from the University of California at Berkeley.
156
Table of Contents
Dingbo Xu has served as our independent director since May 2018. Professor Xu has served as a faculty member and professor in highly-respected universities for more than two decades. He is currently Essilor Chair Professor in Accounting and an Associate Dean at China Europe International Business School (CEIBS). Before joining CEIBS in 2004, he was an assistant professor of accounting at the Hong Kong University of Science and Technology from 1996 to 2003. In addition to his academic positions, Professor Xu is the vice-president of China Association of Chief Financial Officers, the executive director of the editorial board of China Management Accounting Review and the founding chairman of Charted Global Management Accountant (CGMA) 100 North Asia Leaders Think Tank. Professor Xu has also contributed his knowledge and expertise to the board of directors of several public companies. Apart from JD.com, Professor Xu currently serves on the board of directors of China Trust Protection Fund Co., Ltd. From September 2009 to April 2018, Professor Xu was a board member as an independent director of The People’s Insurance Company (Group) of China Limited (PICC), a company listed on the Hong Kong Stock Exchange; from December 2012 to February 2019, he was an independent director of Shanghai Shyndec Pharmaceutical Co., Ltd., a company listed on the Shanghai Stock Exchange; from January 2013 to August 2019, he was an independent director of SANY Heavy Industry, a company listed on the Shanghai Stock Exchange; from June 2013 to September 2019, he was an independent director of China Cinda Asset Management Co. Ltd., a company listed on the Hong Kong Stock Exchange; from September 2016 to September 2022, he was an independent director of Kweichow Moutai Company Limited, a company listed on the Shanghai Stock Exchange, and from December 2015 to March 2023, he was an independent director of Societe Generale (China) Ltd. Professor Xu received his Ph.D. in accounting from the University of Minnesota, as well as a master’s degree in management and a bachelor’s degree in mathematics, both from Wuhan University.
Caroline Scheufele has served as our independent director since June 2021. Ms. Scheufele has over 35 years of experience in the watchmaking and jewelry industry and currently serves as the co-president and artistic director of Chopard, one of the last family-run Swiss watch makers and jewelers. Since 1985, Ms. Scheufele has held various leadership positions at Chopard, including leading Chopard’s ladies’ collections and developing the jewelry section and later the high-end jewelry department at Chopard. Ms. Scheufele designed Chopard’s first jewelry collection, Happy Diamonds, the Happy Sports watches featuring a world-first combination of steel and diamonds, and the Haute Joaillerie Red Carpet and Animal World collections. Ms. Scheufele has also contributed to Chopard’s international exposure by connecting its image with the world of cinema and iconic events, such as the Cannes Film Festival. In 1998, she redesigned the Palme d’Or, the award piece for the Cannes Film Festival, and made Chopard the official event partner onwards. Ms. Scheufele is a dedicated philanthropist in support of charitable causes, such as the American Foundation for AIDS Research (amFAR) and the José Carreras Leukemia Foundation. She has promoted corporate social responsibility including Chopard’s membership in the Responsible Jewelry Council since 2010. Under the leadership of Ms. Scheufele, Chopard has become one of the first brands to use raw materials that meet the highest possible social and environmental standards and has supported Fairmined certified responsible gold. Ms. Scheufele was honoured with both the annual Fashion 4 Development (F4D) Award and the BRAVO Business Award for “Environmentalist of the Year” in 2014 and received the Designer of the Year Award at the second Sustainable Style Gala in 2019. Ms. Scheufele holds a diploma from Geneva’s International School and decided to join the family business where she took intensive classes in design and gemmology afterwards.
Carol Yun Yau Li has served as our independent director since September 2022. Ms. Li currently serves as Assistant Dean of the Yale School of Management and Managing Director of Yale Center Beijing, Yale University’s first university-wide center outside of the United States. Ms. Li also served as an independent non-executive director of the board of JD Logistics, Inc. (HKEx: 2618), a consolidated subsidiary of JD.com, from May 2021 to September 2022. From April 2008 to May 2012, Ms. Li was a Senior Vice President at China Investment Corporation, China’s sovereign wealth fund, where she focused on private equity investments. She started her career in investment banking at Credit Suisse First Boston in New York and worked as an attorney at Sullivan & Cromwell LLP and WilmerHale LLP, specializing in corporate, financial, and transactional matters. Ms. Li holds a Bachelor of Arts Degree in Economics and International Studies from Yale University received in May 2000 and a Doctor of Jurisprudence degree from Stanford University received in June 2006. She is admitted to practice law in the State of New York and in the District of Columbia in the United States. Ms. Li was named a World Economic Forum Young Global Leader in 2016. She is also a member of the Hong Kong X-Tech Startup Platform Advisory Committee.
157
Table of Contents
Ian Su Shan has served as our chief financial officer since May 2023. He also serves as our chief climate officer. Prior to his current role, he served as chief financial officer of JD Logistics, Inc. (HKEX: 2618). Mr. Shan joined JD.com in December 2021. Prior to that, Mr. Shan worked at Lavender Hill Capital Partners from October 2019 to November 2021 and served as a Managing Director from January 2021 to November 2021. He also worked in the TMT Group of the Investment Banking Division at Goldman Sachs (Asia) L.L.C. from 2015 to 2019 and served as an Executive Director from January 2017 to September 2019. Mr. Shan currently also serves as the chairman and a member of the nominating and corporate governance committee of the board of Dada Nexus Limited (NASDAQ: DADA), and a director of Deppon Logistics Co., Ltd. (Shanghai Stock Exchange code: 603056). Mr. Shan received his bachelor’s degree in laws from China University of Political Science and Law, and his master’s degree in laws from University of Warwick. Mr. Shan is a CFA charterholder.
Pang Zhang has served as our chief human resources officer since December 2020. Ms. Zhang joined our company in July 2011. She has significant experience in leadership development as well as organizational processes optimization, and has always committed to exploring a brand-new type of platform-based HR system, thus to better support diversified business groups at JD.com. She also leads our company’s diversity, equality and inclusion efforts. Ms. Zhang has held multiple key roles within different departments in our company, including our company’s chairman office, JD Retail and JD Technology. Ms. Zhang currently serves as a director of JD Technology. Ms. Zhang holds a Cornell-Tsinghua Finance MBA and a bachelor’s degree from Central University of Finance and Economics.
| B. | Compensation |
In 2023, we paid or accrued an aggregate of approximately RMB37 million (US$5 million) in cash to our directors and executive officers as a group. We have not set aside or accrued any amount to provide pension, retirement or other similar benefits to our executive officers and directors. Our PRC subsidiaries and the consolidated variable interest entities are required by law to make contributions equal to certain percentages of each employee’s salary for his or her pension insurance, medical insurance, unemployment insurance and other statutory benefits and a housing provident fund.
We have put in place a comprehensive retirement plan for the eligible retiring salaried senior management of our company based on years of employment and contributions to our company. This plan is designed to strengthen the ability of our company to attract and retain persons of outstanding competence upon which, in large measure, our continued growth and profitability depend. Eligible management employees of our company will be entitled to certain benefits, including cash payments, incentive share award and incentive share option, additional insurance programs and pension plans. In addition, we intend to hire certain eligible retiring management employees of our company as consultants for a period of time following retirement to avail our company of the consultant’s knowledge, expertise and experience.
Employment Agreements and Indemnification Agreements
We have entered into employment agreements with each of our executive officers. Under these agreements, each of our executive officers is employed for a specified time period. We may terminate employment for cause, at any time, without advance notice or remuneration, for certain acts of the executive officer, such as conviction or plea of guilty to a felony or any crime involving moral turpitude, negligent or dishonest acts to our detriment, or misconduct or a failure to perform agreed duties. Without the foregoing causes, we may also terminate an executive officer’s employment in accordance with the applicable law of the jurisdiction where the executive officer is based, and in such case of termination by us, we will provide severance payments to the executive officer as expressly required by such applicable law. The executive officer may resign at any time with a 30-day advance written notice.
Each executive officer has agreed to hold, both during and after the termination or expiry of his or her employment agreement, in strict confidence and not to use, except as required in the performance of his or her duties in connection with the employment or pursuant to applicable law, any of our confidential information or trade secrets, any confidential information or trade secrets of our clients or prospective clients, or the confidential or proprietary information of any third party received by us and for which we have confidential obligations. The executive officers have also agreed to disclose in confidence to us all inventions, designs and trade secrets which they conceive, develop or reduce to practice during the executive officer’s employment with us and to assign all right, title and interest in them to us, and assist us in obtaining and enforcing patents, copyrights and other legal rights for these inventions, designs and trade secrets.
158
Table of Contents
In addition, each executive officer has agreed to be bound by non-competition and non-solicitation restrictions during the term of his or her employment and typically for two years following the last date of employment. Specifically, each executive officer has agreed not to (i) approach our suppliers, clients, customers or contacts or other persons or entities introduced to the executive officer in his or her capacity as a representative of us for the purpose of doing business with such persons or entities that will harm our business relationships with these persons or entities; (ii) assume employment with or provide services to any of our competitors, or engage, whether as principal, partner, licensor or otherwise, any of our competitors, without our express consent; or (iii) seek directly or indirectly, to solicit the services of any of our employees who is employed by us on or after the date of the executive officer’s termination, or in the year preceding such termination, without our express consent.
We have also entered into indemnification agreements with some of our directors and executive officers, agreeing to indemnify them against certain liabilities and expenses incurred by such persons in connection with claims made by reason of their being a director or officer of our company.
Share Incentive Plans
Our Share Incentive Plans
Our current share incentive plan became effective on December 21, 2023. We refer to this as the 2023 Plan. Our previous plan was adopted in November 2014 and expired on December 20, 2023. We refer to that plan as the 2014 Plan.
The awards that were outstanding on the expiration date of the 2014 Plan remained in force according to the terms of the 2014 Plan and the applicable award agreement. As of December 31, 2023, the awards that had been granted under the 2014 Plan to our directors, officers, employees and consultants and remained outstanding included (i) restricted share units to receive an aggregate of 53,988,060 ordinary shares, excluding restricted share units that were forfeited, cancelled, or vested after the relevant grant date, and (ii) options to purchase an aggregate of 17,803,820 ordinary shares, excluding options that were forfeited, cancelled, or exercised after the relevant grant date.
The maximum aggregate number of our shares which may be issued pursuant to all awards under the 2023 Plan was 223,666,717 at the time of its adoption, which was equal to the unused balance under the 2014 Plan. On the first day of each new fiscal year during the term of the 2023 Plan, the number of shares reserved for future issuances under our 2023 Plan increases by a number equal to 1% of the total number of outstanding shares as of the last day of the immediately preceding fiscal year. The maximum aggregate number of our shares which may be issued pursuant to all awards under our 2023 Plan is 255,109,079 shares as of the date of this annual report.
As of December 31, 2023, no grants had been made under the 2023 Plan.
159
Table of Contents
In May 2015, with the approval of the board of directors, our chairman, Mr. Richard Qiangdong Liu, was granted an option to acquire a total of 26,000,000 Class A ordinary shares of our company, at an exercise price of US$16.70 per share or US$33.40 per ADS, subject to a 10-year vesting schedule with 10% of the award vested on each anniversary of the grant date. The number of restricted shares, restricted share units and options that were granted to each of our other directors and executive officers and remain outstanding represents less than 1% of our total outstanding ordinary shares on an as-converted basis as of March 31, 2024. The awards to our other directors and executive officers have two-year, three-year, four-year or six-year vesting schedules, mostly with an equal installment vesting at the end of each calendar year following the grant or on the anniversary of the grant date. Starting from 2016, certain awards have multiple tranches with tiered vesting commencement dates from 2016 to 2020, and each of the tranches is subject to a six-year vesting schedule.
The following paragraphs describe the principal terms of the 2023 Plan.
Types of Awards. The 2023 Plan permits the awards of options, restricted shares, restricted share units or any other type of awards that the committee or the board decides.
Plan Administration. Our board of directors, our compensation committee or a sub-committee designated by our board will administer the 2023 Plan. The committee or the full board of directors, as applicable, will determine the participants to receive awards, the type and number of awards to be granted to each participant, and the terms and conditions of each award grant.
Award Agreement. Awards granted under the 2023 Plan are evidenced by an award agreement that sets forth terms, conditions and limitations for each award, which may include the term of the award, the provisions applicable in the event of the grantee’s employment or service terminates, and our authority to unilaterally or bilaterally amend, modify, suspend, cancel or rescind the award.
Eligibility. We may grant awards to our employees, directors and consultants. However, we may grant options that are intended to qualify as incentive share options only to our employees.
Acceleration of Awards upon Change in Control. If a change in control of our company occurs, the plan administrator may, in its sole discretion, provide for (i) all awards outstanding to terminate at a specific time in the future and give each participant the right to exercise the vested portion of such awards during a specific period of time, or (ii) the purchase of any award for an amount of cash equal to the amount that could have been attained upon the exercise of such award, or (iii) the replacement of such award with other rights or property selected by the plan administrator in its sole discretion, or (iv) payment of award in cash based on the value of ordinary shares on the date of the change-in-control transaction plus reasonable interest.
Vesting Schedule. In general, the plan administrator determines the vesting schedule, which is specified in the award agreement.
Exercise of Options. The plan administrator determines the exercise price for each award, which is stated in the award agreement. The vested portion of option will expire if not exercised prior to the time as the plan administrator determines at the time of its grant. However, the maximum exercisable term is the tenth anniversary after the date of a grant.
Transfer Restrictions. Awards may not be transferred in any manner by the recipient other than by will or the laws of descent and distribution, except as otherwise provided by the plan administrator.
Termination of the 2023 Plan. Unless terminated earlier, the 2023 Plan will terminate automatically on December 20, 2033. Our board of directors has the authority to amend or terminate the plan subject to shareholder approval to the extent necessary and desirable to comply with applicable law. Shareholder approval is required for any amendment to the 2023 Plan that (i) increases the number of shares available under the 2023 Plan, or (ii) permits the plan administrator to extend the term of the 2023 Plan or the exercise period for an option beyond ten years from the date of grant.
Share Incentive Plans of our Consolidated Subsidiaries
In addition, certain of our consolidated subsidiaries approved and adopted their own share incentive plans.
JD Logistics adopted its own share incentive plans in 2018 and 2021, which permit the granting of stock options, restricted share units and other types of awards of JD Logistics to its employees, directors and consultants. JD Logistics granted 224,511,105 and 30,030,446 share options for the years ended December 31, 2020 and 2021, respectively, including the share options granted to Mr. Liu. No share option was granted in 2022 or 2023. JD Logistics also granted restricted share units to its employees, directors and consultants starting from July 2021 and granted 9,663,953, 41,570,538 and 55,937,435 restricted share units in 2021, 2022 and 2023, respectively. In October 2020, options to acquire 99,186,705 ordinary shares of JD Logistics with an exercise price of US$0.01 per share were granted to Mr. Liu according to the JD Logistics’s share incentive plan. The grant is subject to a 6-year vesting schedule with 1/6 of the awards vesting on each anniversary of the grant date. Total share-based compensation expenses were RMB1,201 million, RMB961 million and RMB793 million (US$112 million) under JD Logistics’s share incentive plans for the years ended December 31, 2021, 2022 and 2023, respectively.
160
Table of Contents
JD Health adopted its own share incentive plans in 2020, which permits the granting of stock options, restricted share units and other types of awards of JD Health to its employees, directors and consultants. JD Health granted 94,770,812 share options in 2020, including the share options granted to Mr. Liu. No share option was granted in 2021, 2022 or 2023. JD Health also granted restricted share units to its employees, directors and consultants starting from January 2021, and granted 80,582,712, 4,638,422 and 6,051,558 restricted share units in 2021, 2022 and 2023, respectively. In October 2020, options to acquire 53,042,516 ordinary shares of JD Health with an exercise price of US$0.0000005 per share were granted to Mr. Liu according to the JD Health’s share incentive plan. The grant is subject to a 6-year vesting schedule with 1/6 of the awards vesting on each anniversary of the grant date. Total share-based compensation expenses were RMB2,561 million, RMB2,068 million and RMB1,778 million (US$250 million) under JD Health’s share incentive plans for the years ended December 31, 2021, 2022 and 2023, respectively.
JD Property adopted its own share incentive plan in 2021, which permits the granting of stock options, restricted share units and other types of awards of JD Property to its employees, directors and consultants. JD Property granted 193,059,698 restricted share units to Mr. Liu for the year ended December 31, 2021. The restricted share units granted to Mr. Liu were fully vested on November 25, 2021. JD Property granted 108,399,512 and 11,348,777 share options to its employees, directors and consultants for the years ended December 31, 2022 and 2023, respectively. In October 2022, options to acquire 81,446,610 ordinary shares of JD Property with an exercise US$0.0000005 per share were granted to Mr. Liu according to the JD Property’ s share incentive plan, and the share options were fully vested on October 1, 2022. Total share-based compensation expenses were RMB467 million, RMB354 million and RMB34 million (US$5 million) under JD Property’s share incentive plan for the years ended December 31, 2021, 2022 and 2023, respectively.
JD Industrials adopted its own share incentive plan in 2021, which permits the granting of stock options, restricted share units and other types of awards of JD Industrials to its employees, directors and consultants. JD Industrials granted 90,629,636 restricted share units to Mr. Liu for the year ended December 31, 2021. The restricted share units granted to Mr. Liu were fully vested on December 30, 2021. JD Industrials granted 2,660,000 and 47,915,455 share options to its employees, directors and consultants for the years ended December 31, 2022 and 2023, respectively. Total share-based compensation expenses were RMB684 million, RMB7 million and RMB180 million (US$25 million) under JD Industrials’s share incentive plan for the years ended December 31, 2021, 2022 and 2023, respectively.
| C. | Board Practices |
Board of Directors
Our board of directors consists of seven directors. A director is not required to hold any shares in our company by way of qualification. A director who is in any way, whether directly or indirectly, interested in a contract or transaction or proposed contract or transaction with our company must declare the nature of his interest at a meeting of the directors. Subject to the Nasdaq Rules and disqualification by the chairman of the relevant board meeting, a director may vote in respect of any contract or transaction or proposed contract or transaction notwithstanding that he may be interested therein, and if he does so his vote will be counted and he may be counted in the quorum at the relevant board meeting at which such contract or transaction or proposed contract or transaction is considered. The directors may exercise all the powers of the company to borrow money and to mortgage or charge its undertaking, property and uncalled capital, and to issue debentures or other securities whenever money is borrowed or as security for any debt, liability or obligation of the company or of any third party. None of our non-executive directors has a service contract with us that provides for benefits upon termination of service.
Committees of the Board of Directors
We have established four committees under the board of directors: an audit committee, a compensation committee, a nomination committee, and an environmental, social and governance (ESG) committee. We have adopted a charter for each of the four committees.
Audit Committee
Our audit committee consists of Louis T. Hsieh, Ming Huang and Dingbo Xu. Mr. Hsieh is the chairperson of our audit committee. We have determined that Mr. Hsieh, Mr. Huang and Mr. Xu satisfy the “independence” requirements of Nasdaq and Rule 10A-3 under the Securities Exchange Act of 1934. The audit committee oversees our accounting and financial reporting processes and the audits of the financial statements of our company. The audit committee is responsible for, among other things:
161
Table of Contents
| • | appointing the independent auditors and pre-approving all auditing and non-auditing services permitted to be performed by the independent auditors; |
| • | reviewing with the independent auditors any audit problems or difficulties and management’s response; |
| • | discussing the annual audited financial statements with management and the independent auditors; |
| • | reviewing the adequacy and effectiveness of our accounting and internal control policies and procedures and any steps taken to monitor and control major financial risk exposures; |
| • | reviewing and approving all proposed related party transactions; |
| • | meeting separately and periodically with management and the independent auditors; and |
| • | monitoring compliance with our code of business conduct and ethics, including reviewing the adequacy and effectiveness of our procedures to ensure proper compliance. |
Compensation Committee
Our compensation committee consists of Ming Huang and Carol Yun Yau Li. Mr. Huang is the chairperson of our compensation committee. We have determined that Mr. Huang and Ms. Li satisfy the “independence” requirements of Nasdaq. The compensation committee assists the board in reviewing and approving the compensation structure, including all forms of compensation, relating to our directors and executive officers. Our chief executive officer may not be present at any committee meeting during which his compensation is deliberated. The compensation committee is responsible for, among other things:
| • | reviewing and approving, or recommending to the board for its approval, the compensation for our chief executive officer and other executive officers; |
| • | reviewing and recommending to the board for determination with respect to the compensation of our non-employee directors; |
| • | reviewing periodically and approving any incentive compensation or equity plans, programs or similar arrangements; and |
| • | selecting compensation consultant, legal counsel or other adviser only after taking into consideration all factors relevant to that person’s independence from management. |
Nomination Committee
Our nomination committee consists of Dingbo Xu, Louis T. Hsieh and Caroline Scheufele. Mr. Xu is the chairperson of our nomination committee. Mr. Xu, Mr. Hsieh and Ms. Scheufele satisfy the “independence” requirements of Nasdaq. The nomination committee assists the board of directors in selecting individuals qualified to become our directors and in determining the composition of the board and its committees. The nomination committee is responsible for, among other things:
| • | selecting and recommending to the board nominees for election by the shareholders or appointment by the board; |
| • | reviewing annually with the board the current composition of the board with regards to characteristics such as independence, knowledge, skills, experience and diversity; and |
162
Table of Contents
| • | making recommendations on the frequency and structure of board meetings and monitoring the functioning of the committees of the board. |
Environmental, Social and Governance (ESG) Committee
Our ESG committee consists of Richard Qiangdong Liu, Dingbo Xu and Carol Yun Yau Li. Mr. Liu is the chairperson of our ESG committee. The ESG committee assists the board of the directors in overseeing the ESG relevant to our Company. The ESG committee is responsible for, among other things:
| • | reviewing the formulation of our ESG vision, strategies, and plans, the progress of our ESG-related practice and internal control system, the objectives and implementation of our ESG-related work, as well as our annual ESG report; |
| • | overseeing the status of any material cybersecurity incidents or material risks from cybersecurity threats to us and maintaining oversight of the disclosure related to cybersecurity matters of the periodic reports; and |
| • | advising the board periodically with regards to significant developments in the law and practice of corporate governance as well as our compliance with applicable laws and regulations, and making recommendations to the board on all matters of corporate governance and on any remedial action to be taken. |
Terms of Directors and Executive Officers
Our officers are elected by the board of directors. Our directors are appointed either by an ordinary resolution of our shareholders, or by a resolution of our board of directors (including the affirmative vote of Mr. Richard Qiangdong Liu for so long as he is a director). Our non-independent directors are not subject to a term of office and hold office until such time as they are removed from office by ordinary resolution of the shareholders. Our independent directors are subject to a contractual one-year term, which may be renewed for one additional year, unless either party provides a prior written notice to the other party before the initial term expires indicating the intention not to renew. A director will cease to be a director if, among other things, the director (i) becomes bankrupt or makes any arrangement or composition with his creditors; (ii) dies or is found by our company to be or becomes of unsound mind; (iii) resigns his office by notice in writing to our company; (iv) without special leave of absence from our board of directors, is absent from meetings of our board of directors for three consecutive meetings and the board resolves that his office be vacated; or (v) is removed from office pursuant to any other provision of our memorandum and articles of association.
Board Diversity Matrix
| Board Diversity Matrix (as of March 31, 2024) | ||
| Country of Principal Executive Offices: |
People’s Republic of China | |
| Foreign Private Issuer |
Yes | |
| Disclosure Prohibited Under Home Country Law |
No | |
| Total Number of Directors |
7 | |
| Female | Male | Non Binary |
Did Not Disclose Gender |
|||||||||||||
| Part I: Gender Identity |
||||||||||||||||
| Directors |
3 | 4 | — | — | ||||||||||||
| Part II: Demographic Background |
||||||||||||||||
| Underrepresented Individual in Home Country Jurisdiction |
— | |||||||||||||||
| LGBTQ+ |
— | |||||||||||||||
| Did Not Disclose Demographic Background |
— | |||||||||||||||
| D. | Employees |
As of December 31, 2021, 2022 and 2023, we had a total of 385,357, 450,679 and 517,124 employees, respectively. The following is a breakdown of our employees as of December 31, 2023 by function:
163
Table of Contents
| Function | Number | |||
| Procurement |
23,687 | |||
| Warehouses |
70,451 | |||
| Delivery |
355,018 | |||
| Customer Service |
27,157 | |||
| Research and Development |
14,128 | |||
| Sales and Marketing |
16,561 | |||
| General and Administrative |
10,122 | |||
|
|
|
|||
| TOTAL |
517,124 | |||
|
|
|
|||
| * | The number of employees shown above excludes part-time staff and interns. |
With so many employees, we place great emphasis on our corporate culture to ensure that we maintain consistently high standards everywhere we operate.
We invest resources in the recruitment of employees in support of our fast-growing business operations. In 2023, we recruited new employees in connection with the expansion of our business, and we will continue to invest resources in training, managing and motivating our workforce. In 2023, we have invested a considerable amount of resources in employee career development and training. We have clear talent criteria and have applied them to the whole process of talent management. In the talent management activities throughout the year, we not only pay attention to the improvement of employees’ ability and quality, but also pay special attention to incentive development, in particularly emphasized the mindset of “contributor-oriented,” so that to enable all kinds of talents to have a “sense of goal” and “sense of fulfillment.” We lay special emphasis on the building of talent pipeline and the building of organizational cultural cohesion. We have established a comprehensive employee training and development system covering leadership, general competencies, and professional competencies. Our comprehensive training program covers corporate culture, employee rights and responsibilities, team building, professional behavior, job performance, management skills, leadership, and administrative decision-making. As of December 31, 2023, over 1,100 management trainees had undergone our dedicated management training program.
We also sponsored selected senior and mid-level managers to participate in part-time EMBA programs. In addition, we launched “Go to college in JD” program in association with well-known universities in November 2013. All employees are eligible to join the program voluntarily and get scholarship from us once they obtain their bachelor’s or master’s diploma, or have opportunity to apply an interest-free loan for their tuition fees from us. To boost our strategy of exploring oversea markets, we also have been recruiting international management trainees who are MBA graduates from top universities worldwide.
As required by regulations in China, we participate in various government statutory employee benefit plans, including social insurance funds, namely a pension contribution plan, a medical insurance plan, an unemployment insurance plan, a work-related injury insurance plan and a maternity insurance plan, and a housing provident fund. We are required under PRC law to contribute to employee benefit plans at specified percentages of the salaries, bonuses and certain allowances of our employees up to a maximum amount specified by the local government from time to time.
We enter into standard labor contracts with our employees. We also enter into standard confidentiality and non-compete agreements with our senior management. The non-compete restricted period typically expires within two years after the termination of employment, and we agree to compensate the employee with a certain percentage of his or her pre-departure salary during the restricted period.
We believe that we maintain a good working relationship with our employees, and we have not experienced any major labor disputes.
| E. | Share Ownership |
The following table sets forth information with respect to the beneficial ownership of our ordinary shares as of March 31, 2024 by:
| • | each of our directors and executive officers; and |
164
Table of Contents
| • | each person known to us to own beneficially more than 5% of our total outstanding shares. |
The calculations in the table below are based on 3,060,465,925 ordinary shares outstanding as of March 31, 2024, comprising of (i) 2,737,299,301 Class A ordinary shares (excluding 122,968,412 Class A ordinary shares, which consisted of shares issued to our depositary bank for bulk issuance of ADSs reserved for future issuances upon the exercise or vesting of awards granted under our share incentive plans and shares repurchased but not yet cancelled), and (ii) 323,166,624 Class B ordinary shares.
Beneficial ownership is determined in accordance with the rules and regulations of the SEC. In computing the number of shares beneficially owned by a person and the percentage ownership and voting power percentage of that person, we have included shares and associated votes that the person has the right to acquire within 60 days, including through the exercise of any option, warrant or other right or the conversion of any other security. These shares and associated votes, however, are not included in the computation of the percentage ownership of any other person. Ordinary shares held by a shareholder are determined in accordance with our register of members.
| Class A Ordinary Shares |
Class B Ordinary Shares |
Total Ordinary Shares |
% of Total Ordinary Shares |
% of Aggregate Voting Power |
||||||||||||||||
| Directors and Executive Officers: |
||||||||||||||||||||
| Richard Qiangdong Liu |
37,374,550 | (1) | 305,630,780 | (1) | 343,005,330 | (1) | 11.2 | (1) | 70.5 | (2) | ||||||||||
| Sandy Ran Xu |
* | — | * | * | * | |||||||||||||||
| Ming Huang(3) |
* | — | * | * | * | |||||||||||||||
| Louis T. Hsieh(4) |
* | — | * | * | * | |||||||||||||||
| Dingbo Xu(5) |
* | — | * | * | * | |||||||||||||||
| Caroline Scheufele(6) |
* | — | * | * | * | |||||||||||||||
| Carol Yun Yau Li(7) |
* | — | * | * | * | |||||||||||||||
| Ian Su Shan |
* | — | * | * | * | |||||||||||||||
| Pang Zhang |
* | — | * | * | * | |||||||||||||||
| All Directors and Executive Officers as a Group |
37,943,764 | 305,630,780 | 343,574,544 | 11.2 | 70.6 | (2) | ||||||||||||||
| Principal Shareholders: |
||||||||||||||||||||
| Max Smart Limited(8) |
22,974,550 | 305,630,780 | 328,605,330 | 10.7 | 66.7 | |||||||||||||||
| Walmart(9) |
289,053,746 | — | 289,053,746 | 9.4 | 3.1 | |||||||||||||||
| Fortune Rising Holdings Limited(10) |
— | 17,535,844 | 17,535,844 | 0.6 | 3.8 | |||||||||||||||
| * | Less than 1% of our total outstanding ordinary shares. |
| ** | Except for Mr. Ming Huang, Mr. Louis T. Hsieh, Mr. Dingbo Xu, Ms. Caroline Scheufele and Ms. Carol Yun Yau Li, the business address of our directors and executive officers is JD national headquarters at No. 18 Kechuang 11 Street, Yizhuang Economic and Technological Development Zone, Daxing District, Beijing 101111, P.R. China. |
| (1) | Represents (i) 305,630,780 Class B ordinary shares directly held by Max Smart Limited, (ii) 11,487,275 ADSs, representing 22,974,550 Class A ordinary shares, held by Max Smart Limited, and (iii) 14,400,000 Class A ordinary shares that Mr. Liu had the right to acquire upon exercise of options that shall have become vested within 60 days after March 31, 2024. As of March 31, 2024, Mr. Liu has not exercised his right to acquire such Class A ordinary shares. Max Smart Limited is a British Virgin Islands company beneficially owned by Mr. Richard Qiangdong Liu through a trust and of which Mr. Richard Qiangdong Liu is the sole director, as described in footnote (8) below. The ordinary shares beneficially owned by Mr. Liu do not include 17,535,844 Class B ordinary shares held by Fortune Rising Holdings Limited, a British Virgin Islands company, as described in footnote (10) below. |
| (2) | The aggregate voting power includes the voting power with respect to the 17,535,844 Class B ordinary shares held by Fortune Rising Holdings Limited. Mr. Richard Qiangdong Liu is the sole shareholder and the sole director of Fortune Rising Holdings Limited and he may be deemed to beneficially own the voting power with respect to all of the ordinary shares held by Fortune Rising Holdings Limited in accordance with the rules and regulations of the SEC, notwithstanding the facts described in footnote (10) below. |
| (3) | The business address of Mr. Huang is 22 W 66th Street, New York, NY 10023, United States. |
| (4) | The business address of Mr. Hsieh is The Harbourside, Tower 2, 37-B, I Austin Road West, Kowloon, Hong Kong. |
| (5) | The business address of Professor Xu is Building 20, Zhongguancun Software Park, 8 Dongbeiwang West Road, Haidian District, Beijing, China. |
| (6) | The business address of Ms. Scheufele is Chopard & Cie SA, Rue de Veyrot 8, 1217 Meyrin, Switzerland. |
| (7) | The business address of Ms. Li is Tower B 36/F, 8 Jianguomenwai Avenue, Chaoyang District, Beijing, China. |
| (8) | Represents (i) 305,630,780 Class B ordinary shares directly held by Max Smart Limited and (ii) 11,487,275 ADSs, representing 22,974,550 Class A ordinary shares, held by Max Smart Limited. Max Smart Limited is a British Virgin Islands company beneficially owned by Mr. Richard Qiangdong Liu through a trust and of which Mr. Richard Qiangdong Liu is the sole director. The registered address of Max Smart Limited is P.O. Box 957, Offshore Incorporations Centre, Road Town, Tortola, British Virgin Islands. |
165
Table of Contents
| (9) | Based on the information provided by Walmart, represents (i) 144,952,250 Class A ordinary shares and (ii) 72,050,748 ADSs, representing144,101,496 Class A ordinary shares, owned jointly by (i) Walmart, a corporation organized under the laws of the State of Delaware, (ii) Newheight Holdings Ltd., or Newheight, a company organized under the laws of the Luxembourg, and (iii) Qomolangma Holdings Ltd., or Qomolangma, a company organized under the laws of the Luxembourg. Walmart wholly owns each of Qomolangma and Newheight indirectly through a number of other wholly-owned subsidiaries. Newheight is a wholly-owned subsidiary of Qomolangma. The address of the principal business office of Walmart is 702 S.W. Eighth Street, Bentonville, Arkansas 72716. The address of the principal business office of both Newheight and Qomolangma is 46A, avenue J.F. Kennedy, L-1855 Luxembourg Grand-Duchy of Luxembourg R.C.S Luxembourg. |
| (10) | Represents 17,535,844 Class B ordinary shares held by Fortune Rising Holdings Limited. Fortune Rising Holdings Limited holds these Class B ordinary shares for the purpose of transferring such shares to the plan participants according to our awards under our share incentive plans, and administers the awards and acts according to our instruction. Fortune Rising Holdings Limited exercises the voting power with respect to these shares according to our instruction. Fortune Rising Holdings Limited is a company incorporated in the British Virgin Islands. Mr. Richard Qiangdong Liu is the sole shareholder and the sole director of Fortune Rising Holdings Limited. The registered address of Fortune Rising Holdings Limited is P.O. Box 957, Offshore Incorporations Centre, Road Town, Tortola, British Virgin Islands. |
To our knowledge, as of March 31, 2024, a total of 1,061,329,563 Class A ordinary shares were held by four record holders in the United States, and one of these holders is Deutsche Bank Trust Company Americas, the depositary of our ADS program, which held 37.1% of our Class A ordinary shares on record, representing approximately 33.3% of our total issued shares on record as of March 31, 2024 (including shares issued to it for bulk issuance of ADSs reserved for future issuances upon the exercise or vesting of awards granted under our share incentive plans, shares repurchased but not yet cancelled, and the Class A ordinary shares held in our Hong Kong register of members). The number of beneficial owners of our ADSs in the United States is likely to be much larger than the number of record holders of our ordinary shares in the United States.
Our ordinary shares are divided into Class A ordinary shares and Class B ordinary shares. Holders of Class A ordinary shares are entitled to one vote per share, while holders of Class B ordinary shares are entitled to twenty votes per share. Holders of Class A and Class B ordinary shares vote together as one class on all matters subject to a shareholders’ vote. Each Class B ordinary share is convertible into one Class A ordinary share at any time by the holder thereof, while Class A ordinary shares are not convertible into Class B ordinary shares under any circumstance. See “Item 10.B. Additional Information—Memorandum and Articles of Association” for a more detailed description of our Class A ordinary shares and Class B ordinary shares.
We are not aware of any arrangement that may, at a subsequent date, result in a change of control of our company.
| F. | Disclosure of A Registrant’s Action to Recover Erroneously Awarded Compensation |
Not applicable.
| Item 7. | Major Shareholders and Related Party Transactions |
| A. | Major Shareholders |
Please refer to “Item 6.E. Directors, Senior Management and Employees—Share Ownership.”
| B. | Related Party Transactions |
Contractual Arrangements with the Consolidated Variable Interest Entities and Their Shareholders
PRC laws and regulations currently limit foreign ownership of companies that engage in businesses such as value-added telecommunications service business in China. Due to these restrictions, we operate the relevant portion of our business through contractual arrangements with the consolidated variable interest entities. For a description of these contractual arrangements, see “Item 4.C. Information on the Company—Organizational Structure.”
Agreements and Business Cooperation with Tencent
On March 25, 2022, Tencent completed a distribution of approximately 460 million Class A ordinary shares of our company owned by Tencent to its shareholders, and its shareholding in us changed to approximately 2.3% at the time, and the shareholders of Tencent who receive our shares in the distribution have become our shareholders. We and Tencent continue to maintain our mutually beneficial business relationship, including our ongoing strategic partnership agreement.
166
Table of Contents
Strategic Cooperation Agreement.
On May 10, 2019, we renewed the strategic cooperation agreement with Tencent for a period of three years starting from May 27, 2019. Tencent continued to offer us prominent level 1 and level 2 access points on its Weixin platform to provide traffic support, and the two companies also intend to continue to cooperate in a number of areas including communications, advertising and membership services, among others. Such traffic support, advertising spending and other cooperation amounted to over US$800 million, which was paid or spent over the next three years. We agreed to issue to Tencent a certain number of our Class A ordinary shares for a total consideration of approximately US$250 million at prevailing market prices at certain pre-determined dates during the three-year period, of which 8,127,302, 2,938,584 and 1,914,998 of our Class A ordinary shares were issued in May 2019, May 2020 and June 2021, respectively.
On June 29, 2022, we renewed the strategic cooperation agreement with Tencent for another period of three years. Tencent continues to offer us prominent Level 1 and Level 2 access points on its Weixin platform to provide traffic support, and we also continue to cooperate in a number of areas including communications, technology services, marketing and advertising, and membership services, among others. The value of such cooperation is to be paid or spent in cash and in the form of our shares combined over the next three years. As a part of the total consideration, we agreed to issue to Tencent a certain number of our Class A ordinary shares for a consideration of up to US$220 million by reference to prevailing market prices at certain predetermined dates during the three-year period, of which 2,164,326 and 3,761,270 of our Class A ordinary shares were issued in July 2022 and May 2023, respectively.
Business Cooperation with Tencent. In 2021, we generated RMB248 million commission services revenues from cooperation on advertising business with Tencent, RMB553 million revenues from services provided to and products sold to Tencent, and purchased a total amount of RMB5,010 million advertising resources and payment processing services from Tencent. Tencent ceased to be a related party of us since March 2022 when it completed the distribution of our Class A ordinary shares to its shareholders and reduced its shareholding in us. In the period from January to March 2022, we generated RMB44 million commission services revenues from cooperation on advertising business with Tencent, RMB77 million revenues from services provided to and products sold to Tencent, and purchased a total amount of RMB1,314 million advertising resources and payment processing services from Tencent.
Agreements and Transactions Relating to JD Technology
On June 20, 2020, JD Technology adopted a dual class voting structure. The shares held by Mr. Richard Qiangdong Liu and Suqian Linghang Fangyuan, an entity controlled by Mr. Liu, were entitled to ten votes per share, while Mr. Liu and Suqian Linghang Fangyuan must abstain from voting on any related party transaction with JD Technology. As a result of this dual class voting structure, as of December 31, 2023, we held approximately 22.1% voting power, and Mr. Richard Qiangdong Liu and Suqian Linghang Fangyuan together held 52.4% of the total voting power of JD Technology.
On March 31, 2021, we entered into definitive agreements with JD Technology relating to the reorganization of JD Cloud & AI. Pursuant to the definitive agreements, we transferred JD Cloud & AI and certain assets together valued at approximately RMB15.7 billion to JD Technology, in exchange for newly issued ordinary shares of JD Technology. To support the smooth business transition of JD Cloud & AI, we also transferred some equipment and reserved some restricted share units of us for the employees of JD Cloud & AI, for which JD Technology paid cash consideration. Upon completion of the transactions on March 31, 2021, JD Cloud & AI was deconsolidated from our consolidated financial statements, and our equity interest in JD Technology increased from 36.8% to 41.7%.
Please see “Item 4.A. Information on the Company—History and Development of the Company” for further information.
Set forth below is a summary of the key provisions of the currently effective material agreements between us and JD Technology.
167
Table of Contents
Shareholders Agreement. The shareholders agreement of JD Technology provides for certain special rights, including preemptive right and right to consent for certain matters and contains provisions governing the board of directors and other corporate governance matters.
Non-Compete Agreement. We and JD Technology have each agreed to certain limitations on our respective ability to enter into or participate in the same line of business as the other party. JD Technology may not engage in the e-commerce business conducted by us or our subsidiaries without our prior written consent, unless we and JD Technology are no longer under the common control of Mr. Richard Qiangdong Liu. Without the prior written consent of JD Technology, we are restricted from engaging in the financial products, financial derivatives, and other financial-related businesses operated by JD Technology and its subsidiaries, including consumer finance, supply chain finance, third party payment, factoring, insurance brokerage and agency, crowd funding (including product and equity crowd funding), wealth management, securities brokerage, banking, financial leasing, asset management, and credit reporting, unless we and JD Technology are no longer under the common control of Mr. Liu. We, however, may make passive investments in competing businesses which we do not control.
Business Transactions with JD Technology and its Subsidiaries
JD Technology is a related party controlled by our chairman of the board of directors, Mr. Richard Qiangdong Liu, through his equity stake and voting arrangements in JD Technology. In 2021, 2022 and 2023, we provided services and sold goods to JD Technology in a total amount of RMB882 million, RMB2,506 million and RMB1,696 million (US$239 million), respectively. In 2021, 2022 and 2023, we received payment processing and other services provided by JD Technology in the amount of RMB8,762 million, RMB11,494 million and RMB13,833 million (US$1,948 million), respectively. In 2021, 2022 and 2023, interest income in the amount of RMB253 million, RMB301 million and RMB287 million (US$40 million) was recognized in relation to the financial support provided to JD Technology by us, respectively. JD Technology performs the credit risk assessment services and earns fees for providing such services, and JD Technology purchases the consumer financing receivables past due over certain agreed period of time from us at carrying values without recourse and also agree to bear other cost directly related to the consumer financing to absorb the risks. In connection with the agreements, the total amount of over-due receivables related to the consumer financing sold from us to JD Technology were RMB77 million, RMB237 million and RMB240 million (US$34 million) for the years ended December 31, 2021, 2022 and 2023, respectively.
We also transferred certain financial assets to JD Technology without recourse at fair value. The amount of accounts receivables transferred without recourse in 2021, 2022 and 2023 were RMB43,299 million, RMB50,282 million and RMB55,028 million (US$7,751 million), respectively, and were derecognized.
As of December 31, 2023, we had a total amount of RMB1,447 million (US$204 million) due to JD Technology.
Transactions with Our Equity Investees and Other Related Parties
Business Transaction and Non-compete Obligation with Dada. In April 2016, we contributed certain resources and US$200 million in cash in exchange for newly issued equity interest in Dada. On the completion date of the transaction, the traffic support, marketing and promotion services to be provided to Dada which had a fair value of approximately US$67 million were recorded as deferred revenues and would be recognized as net service revenues, and the non-compete obligation with Dada which had a fair value of approximately US$83 million were recorded as other liabilities and would be recognized as other income over a period of seven years on a straight-line basis starting from May 2016. In 2021 and the period from January to February, 2022, other income in the amount of RMB77 million and RMB13 million had been recognized, respectively. In 2021 and the period from January to February, 2022, we provided services and sold goods to Dada in a total amount of RMB523 million and RMB135 million, respectively, and in the same periods, we also received services from Dada in a total amount of RMB1,087 million and RMB212 million, respectively.
On March 22, 2021, we entered into a share subscription agreement through a subsidiary with Dada, and further entered into an amendment to share subscription agreement on February 25, 2022, under which Dada issued to us 109,215,017 ordinary shares, for a total consideration of (i) an aggregate purchase price of US$546 million in cash, and (ii) our signing and delivery of a business cooperation agreement to Dada, pursuant to which we will provide certain strategic resources to Dada, at a closing that occurred on February 28, 2022. Immediately following the closing, we held approximately 52% of Dada’s issued and outstanding shares and began to consolidate the financial results of Dada into ours. Dada ceased to be a related party of ours since February 2022. As of December 31, 2023, we owned approximately 53% issued and outstanding shares of Dada.
168
Table of Contents
Business Transactions with the Property Funds. JD Property, our infrastructure asset management and integrated service platform, owns, develops and manages our logistics facilities and other real estate properties to support JD Logistics and third parties. Since 2019, we entered into definitive agreements with the Property Funds, pursuant to which we sold certain of our completed and uncompleted logistics facilities.
For the logistics facilities under the Property Funds that met the closing conditions, we recorded a disposal gain of RMB0.8 billion, RMB1.4 billion and RMB2.3 billion (US$0.3 billion) in 2021, 2022 and 2023, respectively. We will derecognize the remaining logistics facilities upon satisfaction of the hand-over condition. In addition, subsequent to the disposition, we have leased back the completed facilities from the Property Funds for operational purposes, and JD Property has started serving as the asset manager managing the Property Funds’ assets. We will also lease back some of the facilities that sale to the Property Funds for operational purposes when such facility has been completed. See also “Item 5.A. Operating and Financial Review and Prospects—Operating Results—Selected Statements of Operations Items—Gain on sale of development properties.” We received lease and property management services from the Property Funds in a total amount of RMB1,180 million, RMB1,249 million and RMB1,681 million (US$237 million) in 2021, 2022 and 2023, respectively. Interest income in the amount of RMB39 million, RMB43 million and RMB56 million (US$8 million) was recognized in 2021, 2022 and 2023, respectively, in connection with our financial support provided to the Property Funds. As of December 31, 2023, we had an amount of RMB1,563 million (US$220 million) due from the Property Funds.
Business Transactions with ATRenew and its subsidiaries, or ATRenew Group. ATRenew Group is an equity investee of us, and its ADSs commenced trading on the NYSE in June 2021. In June 2019, we completed an investment of approximately RMB3.38 billion in ATRenew, an online second-hand consumer electronics trading platform. In connection with this investment, we merged our Paipai Secondhand business with and into ATRenew with certain exclusive traffic resources for the next five years, and additionally invested a certain amount of cash in exchange for additional preferred shares of ATRenew. In September and December 2020, we completed further investment in existing and newly issued preferred shares of ATRenew for a cash consideration of RMB401 million. Upon the completion of the transaction, the traffic support, marketing and promotion services to be provided to ATRenew Group were recorded as deferred revenues and would be recognized as net service revenues over the cooperation period of five years on a straight-line basis starting from June 2019. In addition, we made an additional investment of RMB129 million in ATRenew in April 2021 and RMB321 million to acquire its ADSs in connection with its initial public offering in June 2021. The ADSs of ATRenew commenced trading on the New York Stock Exchange in June 2021. As of December 31, 2023, we owned approximately 34% issued and outstanding shares of ATRenew. As of December 31, 2023, we had a total amount of RMB182 million (US$26 million) deferred revenues in relation to traffic support, marketing and promotion services to be provided to ATRenew Group. In 2021, 2022 and 2023, we provided services and sold goods to ATRenew Group in a total amount of RMB894 million, RMB806 million and RMB845 million (US$119 million), respectively. In 2021, 2022 and 2023, we also received services from ATRenew Group in a total amount of RMB31 million, RMB4 million and nil, respectively. As of December 31, 2023, we had an amount of RMB53 million (US$7 million) due from ATRenew Group.
Our transactions with equity investees other than those discussed above were insignificant, individually or in the aggregate, in each of the past three fiscal years.
Our revenues from related parties, excluding those from the major related parties as described above, represented approximately 0.24%, 0.26% and 0.12% of total net revenues of our company for the years ended December 31, 2021, 2022 and 2023, respectively. Transactions with related parties included in operating expenses, excluding those with the major related parties as described above, represented 0.17%, 0.13% and 0.12% of total operating expenses of our company for the years ended December 31, 2021, 2022 and 2023, respectively.
In addition, Mr. Richard Qiangdong Liu, our chairman of the board of directors, has purchased his own aircraft for both business and personal use. The use of the aircraft in connection with the performance of his duty as employee is free of charge to us, and we have agreed to assume the cost of maintenance, crew and operations of the aircraft relating to the use of the aircraft. Such maintenance and incidental costs were insignificant for all periods presented.
169
Table of Contents
Employment Agreements and Indemnification Agreements
See “Item 6.B. Directors, Senior Management and Employees—Compensation.”
Share Incentives
See “Item 6.B. Directors, Senior Management and Employees—Compensation.”
| C. | Interests of Experts and Counsel |
Not applicable.
| Item 8. | Financial Information |
| A. | Consolidated Statements and Other Financial Information |
We have appended consolidated financial statements filed as part of this annual report.
Legal Proceedings
From time to time, we may be subject to legal, regulatory and/or administrative proceedings relating to third-party and principal intellectual property infringement claims, contract disputes involving suppliers and third-party merchants, consumer protection claims, claims relating to data and privacy protection, employment related disputes, unfair competition and other matters in the ordinary course of our business.
As we routinely enter into business contracts with our suppliers, third-party merchants and consumers on our platform, we have been and may continue to be involved in legal proceedings arising from contract or other disputes, including being named as a co-defendant in lawsuits filed against our suppliers by third parties. For example, in July and August 2019, Shanghai Gopher Asset Management Co., Ltd. and Noah (Shanghai) Financial Leasing Co., Ltd. filed two separate lawsuits in Shanghai, requesting the court to enforce the fulfillment of payment obligations by Jingdong Century, one of our subsidiaries, to Shanghai Gopher Asset Management Co., Ltd. and Noah (Shanghai) Financial Leasing Co., Ltd., respectively, under certain accounts receivable assignment confirmation letters allegedly signed by Jingdong Century. These two lawsuits relate to similar subject matters, and the plaintiffs allege that (i) Jingdong Century was a party to certain purchase agreements with its two suppliers, Guangdong Chengxing Holding Group Co., Ltd. and Guangdong Zhongcheng Industry Holding Co., Ltd., and has payment obligations to these two suppliers under these agreements; and (ii) Jingdong Century confirmed and agreed to certain accounts receivable assignment confirmation letters (by affixing its seal to the letter) delivered by the plaintiffs and the two suppliers when the two suppliers assigned their rights under the purchase agreements to the plaintiffs. Jingdong Century did not confirm the accounts receivable assignment confirmation letters as alleged by the plaintiffs. In addition, Jingdong Century’s corporate seal that was allegedly affixed to the purchase agreements and accounts receivable assignment confirmation letters as claimed in these two cases is inconsistent with the corporate seal of Jingdong Century filed with the competent PRC government authority. The two plaintiffs have amended their claims seeking an aggregate of RMB3.5 billion damages on the basis of tort liability. We believe these lawsuits are without merit and we will continue to defend ourselves vigorously. There is uncertainty, however, regarding the timing or ultimate resolution of these lawsuits and the other legal proceedings in which we are involved. See “Item 3.D. Key Information—Risk Factors—Risks Related to Our Business—We may be subject to legal, regulatory and/or administrative proceedings.”
Dividend Policy
Our board of directors has complete discretion on whether to distribute dividends subject to our current memorandum and articles of association and certain restrictions under Cayman Islands law. In addition, our shareholders may by ordinary resolution declare dividends, but no dividend may exceed the amount recommended by our directors. Under Cayman Islands law, a Cayman Islands company may pay a dividend out of either profit or share premium account, provided that in no circumstances may a dividend be paid if this would result in the company being unable to pay its debts as they fall due in the ordinary course of business. Even if our board of directors decides to pay dividends, the form, frequency and amount will depend upon our future operations and earnings, capital requirements and surplus, general financial condition, contractual restrictions and other factors that the board of directors may deem relevant.
170
Table of Contents
In May 2022, our board of directors approved a cash dividend of US$0.63 per ordinary share, or US$1.26 per ADS, to holders of ordinary shares and holders of ADSs, respectively. The aggregate amount of the dividend was approximately US$2.0 billion. In March 2023, our board of directors approved a cash dividend of US$0.31 per ordinary share, or US$0.62 per ADS, to holders of ordinary shares and holders of ADSs. The aggregate amount of the cash dividend was approximately US$1.0 billion. In March 2024, our board of directors approved an annual cash dividend for the year ended December 31, 2023 of US$0.38 per ordinary share, or US$0.76 per ADS, to holders of ordinary shares and holders of ADSs. The aggregate amount of the dividend will be approximately US$1.2 billion. In addition, we have adopted an annual dividend policy, under which we may choose to declare and distribute a cash dividend each year, at an amount determined in relation to our financial performance in the previous fiscal year, among other factors. The determination to make dividend distributions in any particular year will be made at the discretion of our board of directors based upon factors such as our results of operations, cash flow, financial condition, business strategies and prospects, capital requirements, regulatory constraints to the extent relevant, availability of foreign currency and other considerations that the board deems relevant.
We are a holding company registered by way of continuation under the laws of the Cayman Islands. We may rely on dividends from our subsidiaries in China for our cash requirements, including any payment of dividends to our shareholders. PRC regulations may restrict the ability of our PRC subsidiaries to pay dividends to us. See “Item 3.D. Key Information—Risk Factors—Risks Related to Our Corporate Structure—We may rely on dividends and other distributions on equity paid by our PRC subsidiaries to fund any cash and financing requirements we may have, and any limitation on the ability of our PRC subsidiaries to make payments to us could have a material and adverse effect on our ability to conduct our business.”
If we pay any dividends on our ordinary shares, we will pay those dividends which are payable in respect of the ordinary shares underlying our ADSs to the depositary, as the registered holder of such ordinary shares, and the depositary will then pay such amounts to our ADS holders in proportion to the ordinary shares underlying the ADSs held by such ADS holders, subject to the terms of the deposit agreement, including the fees and expenses payable thereunder. Cash dividends on our ordinary shares, if any, will be paid in U.S. dollars.
| B. | Significant Changes |
Except as disclosed elsewhere in this annual report, we have not experienced any significant changes since the date of our audited consolidated financial statements included in this annual report.
| Item 9. | The Offer and Listing |
| A. | Offering and Listing Details |
Our ADSs, each representing two of our Class A ordinary shares, have been listed on Nasdaq since May 22, 2014. Our ADSs trade under the symbol “JD.”
Our Class A ordinary shares have been listed on the Hong Kong Stock Exchange since June 18, 2020 under the stock code “9618.” Our RMB counter was launched and became effective since June 7, 2023 under the stock code “89618.”
| B. | Plan of Distribution |
Not applicable.
| C. | Markets |
Our ADSs have been listed on Nasdaq since May 22, 2014 under the symbol “JD.”
Our Class A ordinary shares have been listed on the Hong Kong Stock Exchange since June 18, 2020 under the stock code “9618.” Our RMB counter was launched and became effective since June 7, 2023 under the stock code “89618.”
171
Table of Contents
| D. | Selling Shareholders |
Not applicable.
| E. | Dilution |
Not applicable.
| F. | Expenses of the Issue |
Not applicable.
| Item 10. | Additional Information |
| A. | Share Capital |
Not applicable.
| B. | Memorandum and Articles of Association |
We are a Cayman Islands exempted company with limited liability and our affairs are governed by our memorandum and articles of association, as amended and restated from time to time, and the Companies Act (As Revised) of the Cayman Islands, which is referred to as the Companies Act below, and the common law of the Cayman Islands.
The following are summaries of material provisions of our current memorandum and articles of association, which were adopted by a special resolution passed at the annual general meeting of our company held on June 21, 2023, insofar as they relate to the material terms of our ordinary shares.
Registered Office and Objects
Our registered office in the Cayman Islands is located at the offices of Maples Corporate Services Limited at PO Box 309, Ugland House, Grand Cayman, KY1-1104, Cayman Islands, or at such other location within the Cayman Islands as our board of directors may from time to time decide. The objects for which our company is established are unrestricted and we have full power and authority to carry out any object not prohibited by the Companies Act, as amended from time to time, or any other law of the Cayman Islands.
Board of Directors
See “Item 6.C. Directors, Senior Management and Employees—Board Practices.”
Ordinary Shares
General. All of our issued and outstanding ordinary shares are fully paid and non-assessable.
Our ordinary shares are issued in registered form, and are issued when registered in our register of members. Our shareholders who are nonresidents of the Cayman Islands may freely hold and vote their ordinary shares. Our company will issue only non-negotiable shares, and will not issue bearer or negotiable shares.
Ordinary Shares. Our ordinary shares are divided into Class A ordinary shares and Class B ordinary shares. Holders of our Class A ordinary shares and Class B ordinary shares will have the same rights except for voting and conversion rights. Our ordinary shares are issued in registered form. Our shareholders who are non-residents of the Cayman Islands may freely hold and vote their shares.
Conversion. Each Class B ordinary share is convertible into one Class A ordinary share at any time by the holder thereof. Class A ordinary shares are not convertible into Class B ordinary shares under any circumstances. Upon (i) any direct or indirect sale, transfer, assignment or disposition of Class B ordinary shares or the voting power attached to Class B ordinary shares by a holder thereof through voting proxy or otherwise to any person or entity that is not an Affiliate (as defined in our current memorandum and articles of association) of such holder, or (ii) the direct or indirect sale, transfer, assignment or disposition of a majority of the issued and outstanding voting securities or the voting power attached to such voting securities or the sale, transfer, assignment or disposition of all or substantially all of the assets of a holder of Class B ordinary shares that is an entity to any person or entity that is not an Affiliate of such holder, such Class B ordinary shares will be automatically and immediately converted into an equal number of Class A ordinary shares. All Class B ordinary shares will be automatically and immediately converted into an equal number of Class A ordinary shares when Mr. Richard Qiangdong Liu ceases to be a director and the chief executive officer of our company, or in some other specified situations as set out in our memorandum and articles of association.
172
Table of Contents
Dividends. The holders of our ordinary shares are entitled to such dividends as may be declared by our board of directors. In addition, our shareholders may by ordinary resolution declare a dividend, but no dividend may exceed the amount recommended by our directors. Under Cayman Islands law, dividends may be declared and paid only out of funds legally available therefor, namely out of either profit or our share premium account, and provided further that a dividend may not be paid if this would result in our company being unable to pay its debts as they fall due in the ordinary course of business. Dividends received by each Class B ordinary share and Class A ordinary share in any dividend distribution shall be the same.
Voting Rights. Our Class A ordinary shares and Class B ordinary shares vote together as a single class on all matters submitted to a vote of our shareholders, except as may otherwise be required by law or provided for in our current memorandum and articles of association. In respect of matters requiring shareholders’ vote, on a poll, each Class A ordinary share is entitled to one vote, and each Class B ordinary share is entitled to twenty votes, except for where any holder of such shares are required by the Hong Kong Listing Rules to abstain from voting to approve the matter under consideration. Voting at any shareholders’ meeting is by show of hands unless a poll is (before or on the declaration of the result of the show of hands) demanded. A poll may be demanded by the chairman of such meeting or any shareholder holding not less than 10% of the votes of the issued and outstanding voting shares in our company present in person or by proxy.
A quorum required for a meeting of shareholders consists of one or more shareholders present in person or by proxy or, if a corporation or other non-natural person, by its duly authorized representative, and holding shares which represent, in aggregate, (i) not less than 10% of the votes attaching to all issued and outstanding shares of our Company, for as long as the shares remain listed on the Hong Kong Stock Exchange, or (ii) otherwise not less than one-third of the votes attaching to all issued and outstanding shares of our company and entitled to vote, present in person or by proxy or, if a corporation or other non-natural person, by its duly authorized representative, shall be quorum for all purposes. Shareholders may be present in person or by proxy or, if the shareholder is a legal entity, by its duly authorized representative.
An ordinary resolution to be passed by the shareholders requires the affirmative vote of a simple majority of the votes cast by those shareholders entitled to vote who are present in person or by proxy at a general meeting. Holders of the ordinary shares may, among other things, divide or consolidate their shares by ordinary resolution. A special resolution requires the affirmative vote of no less than two-thirds of the votes cast by those shareholders entitled to vote who are present in person or by proxy at a general meeting. A special resolution will be required for important matters such as a change of name or making changes to our current memorandum and articles of association. Both ordinary resolutions and special resolutions may also be passed by a unanimous written resolution signed by all the shareholders of our company, as permitted by the Companies Act and our current memorandum and articles of association.
Under our current memorandum and articles of association, so long as the total issued and outstanding Class B ordinary shares constitute a majority of our aggregate voting rights of our company and shareholders of our company immediately prior to the completion of our initial public offering (exclusive of Max Smart Limited, Fortune Rising Holdings Limited, Mr. Richard Qiangdong Liu and their Affiliates) hold a majority of our total issued and outstanding Class A ordinary shares, any amendments to our current memorandum and articles of association and certain related party transactions between Mr. Richard Qiangdong Liu or any of his immediate family members or Affiliates, on one hand, and our company or any of our company’s subsidiaries or consolidated affiliated entities on the other hand, require approval by both (i) holders of a majority of the total issued and outstanding Class A ordinary shares (exclusive of Max Smart Limited, Fortune Rising Holdings Limited, Mr. Richard Qiangdong Liu and their Affiliates) and (ii) holders of a majority of our aggregate voting rights in addition to a special resolution (in the case of amendments to our memorandum and articles of association) or an ordinary resolution (in any other case).
173
Table of Contents
Liquidation. On a winding up of our company, if the assets available for distribution among our shareholders shall be more than sufficient to repay the whole of the share capital at the commencement of the winding up, the surplus will be distributed among our shareholders in proportion to the par value of the shares held by them at the commencement of the winding up, subject to a deduction from those shares in respect of which there are monies due, of all monies payable to our company for unpaid calls or otherwise. If our assets available for distribution are insufficient to repay all of the paid-up capital, the assets will be distributed so that the losses are borne by our shareholders in proportion to the par value of the shares held by them.
Calls on Shares and Forfeiture of Shares. Our board of directors may from time to time make calls upon shareholders for any amounts unpaid on their shares. The shares that have been called upon and remain unpaid are subject to forfeiture.
Redemption, Repurchase and Surrender of Shares. We may issue shares on terms that such shares are subject to redemption, at our option or at the option of the holders thereof, on such terms and in such manner as may be determined, before the issue of such shares, by our board of directors or by a special resolution of our shareholders. Our company may also repurchase any of our shares provided that the manner and terms of such purchase have been approved by our board of directors or by ordinary resolution of our shareholders, or are otherwise authorized by our current memorandum and articles of association. Under the Companies Act, the redemption or repurchase of any share may be paid out of our company’s profits or out of the proceeds of a fresh issue of shares made for the purpose of such redemption or repurchase, or out of capital (including share premium account and capital redemption reserve) if our company can, immediately following such payment, pay its debts as they fall due in the ordinary course of business. In addition, under the Companies Act no such share may be redeemed or repurchased (a) unless it is fully paid up, (b) if such redemption or repurchase would result in there being no shares issued and outstanding, or (c) if the company has commenced liquidation. In addition, our company may accept the surrender of any fully paid share for no consideration.
Variations of Rights of Shares. The rights attached to any class of shares (unless otherwise provided by the terms of issue of the shares of that class or series), may only be materially adversely varied with the consent in writing of the holders of a majority of the issued shares of that class or series or with the sanction of a special resolution passed at a separate meeting of the holders of the shares of that class.
Anti-Takeover Provisions. Some provisions of our current memorandum and articles of association may discourage, delay or prevent a change of control of our company or management that shareholders may consider favorable, including provisions that:
| • | authorize our board of directors to issue preference shares in one or more series and to designate the price, rights, preferences, privileges and restrictions of such preference shares without any further vote or action by our shareholders; and |
| • | limit the ability of shareholders to requisition and convene general meetings of shareholders. |
However, under Cayman Islands law, our directors may only exercise the rights and powers granted to them under our current memorandum and articles of association for a proper purpose and for what they believe in good faith to be in the best interests of our company.
General Meetings of Shareholders and Shareholder Proposals. Our shareholders’ general meetings may be held in such place within or outside the Cayman Islands as our board of directors considers appropriate. Our current memorandum and articles of association provide that we shall in each year hold a general meeting as our annual general meeting within six months (or such other period as may be permitted by the Hong Kong Listing Rules or The Stock Exchange of Hong Kong Limited) after the end of the Company’s financial year, for as long as our Class A ordinary shares remain listed on the Hong Kong Stock Exchange.
Shareholders’ annual general meetings and any other general meetings of our shareholders may be convened by a majority of our board of directors or our chairman. At least 14 days’ notice, for as long as our Class A ordinary shares remain listed on the Hong Kong Stock Exchange, or otherwise at least 7 days’ notice, shall be given to those persons whose names appear as members in our register of members on the date the notice is given (or on any other date determined by our directors to be the record date for such meeting) and who are entitled to vote at the meeting.
174
Table of Contents
Cayman Islands law provides shareholders with only limited rights to requisition a general meeting, and does not provide shareholders with any right to put any proposal before a general meeting. However, these rights may be provided in a company’s articles of association. Our current memorandum and articles of association allow one or more of our shareholders holding shares representing in aggregate (i) no less than 10%, on a one vote per share basis, for as long as our Class A ordinary shares remain listed on the Hong Kong Stock Exchange or (ii) otherwise not less than one-third, of the votes attaching to all issued and outstanding shares which, as at that date of the deposit, carry the right to vote at general meetings of our company, to requisition an extraordinary general meeting of our shareholders, in which case our directors are obliged to call such meeting and to put the resolutions so requisitioned to a vote at such meeting; however, our current memorandum and articles of association do not provide our shareholders with any right to put any proposals before annual general meetings or extraordinary general meetings not called by such shareholders.
Limitations on the Right to Own Shares. There are no limitations on the right to own our shares.
Transfer of Shares. Any of our shareholders may transfer all or any of his or her ordinary shares by an instrument of transfer in the usual or common form or any other form approved by our board of directors.
However, our board of directors may, in its absolute discretion, decline to register any transfer of any ordinary share which is not fully paid up or on which our company has a lien. Our board of directors may also decline to register any transfer of any ordinary share unless:
| • | the instrument of transfer is lodged with us, accompanied by the certificate for the ordinary shares to which it relates and such other evidence as our board of directors may reasonably require to show the right of the transferor to make the transfer; |
| • | the instrument of transfer is in respect of only one class of shares; |
| • | the instrument of transfer is properly stamped, if required; |
| • | the ordinary shares transferred are free of any lien in favor of us; |
| • | any fee related to the transfer has been paid to us; or |
| • | in the case of a transfer to joint holders, the transfer is not to more than four joint holders. |
If our directors refuse to register a transfer they are required, within three months after the date on which the instrument of transfer was lodged, to send to each of the transferor and the transferee notice of such refusal.
Directors’ Power to Issue Shares. Our current memorandum and articles of association authorize our board of directors to issue additional ordinary shares from time to time as our board of directors shall determine, to the extent of available authorized but unissued shares.
Our current memorandum and articles of association also authorize our board of directors to establish from time to time one or more series of preference shares and to determine, with respect to any series of preference shares, the terms and rights of that series, including:
| • | the designation of the series; |
| • | the number of shares of the series; |
| • | the dividend rights, dividend rates, conversion rights, voting rights; and |
| • | the rights and terms of redemption and liquidation preferences. |
Our board of directors may issue preference shares without action by our shareholders to the extent of available authorized but unissued shares. Issuance of these shares may dilute the voting power of holders of ordinary shares.
175
Table of Contents
Exempted Company. We are an exempted company with limited liability under the Companies Act. The Companies Act in the Cayman Islands distinguishes between ordinary resident companies and exempted companies. Any company that is registered in the Cayman Islands but conducts business mainly outside of the Cayman Islands may apply to be registered as an exempted company. The requirements for an exempted company are essentially the same as for an ordinary company except for the exemptions and privileges listed below:
| • | an exempted company does not have to file an annual return of its shareholders with the Registrar of Companies; |
| • | an exempted company’s register of members is not required to be open to inspection; |
| • | an exempted company does not have to hold an annual general meeting; |
| • | an exempted company may issue no par value shares; |
| • | an exempted company may obtain an undertaking against the imposition of any future taxation (such undertakings are given for up to 30 years); |
| • | an exempted company may register by way of continuation in another jurisdiction and be deregistered in the Cayman Islands; |
| • | an exempted company may register as a limited duration company; and |
| • | an exempted company may register as a segregated portfolio company. |
“Limited liability” means that the liability of each shareholder is limited to the amount unpaid by the shareholder on that shareholder’s shares of the company (except in exceptional circumstances, such as involving fraud, the establishment of an agency relationship or an illegal or improper purpose or other circumstances in which a court may be prepared to pierce or lift the corporate veil). We are subject to reporting and other informational requirements of the Exchange Act, as applicable to foreign private issuers. Except as otherwise disclosed in this annual report, we currently intend to comply with the Nasdaq rules in lieu of following home country practice.
Register of Members. Under the Companies Act, we must keep a register of members and there should be entered therein:
| • | the names and addresses of our members, together with a statement of the shares held by each member, and such statement shall confirm (i) the amount paid or agreed to be considered as paid, on the shares of each member, (ii) the number and category of shares held by each member, and (iii) whether each relevant category of shares held by a member carries voting rights under the articles of association of the company, and if so, whether such voting rights are conditional; |
| • | the date on which the name of any person was entered on the register as a member; and |
| • | the date on which any person ceased to be a member. |
Under Cayman Islands law, the register of members of our company is prima facie evidence of the matters set out therein (i.e. the register of members will raise a presumption of fact on the matters referred to above unless rebutted) and a member registered in the register of members is deemed as a matter of Cayman Islands law to have legal title to the shares as set against its name in the register of members.
If the name of any person is incorrectly entered in or omitted from our register of members, or if there is any default or unnecessary delay in entering on the register the fact of any person having ceased to be a member of our company, the person or member aggrieved (or any member of our company or our company itself) may apply to the Grand Court of the Cayman Islands for an order that the register be rectified, and the Court may either refuse such application or it may, if satisfied of the justice of the case, make an order for the rectification of the register.
176
Table of Contents
| C. | Material Contracts |
Other than in the ordinary course of business and other than those described under this item, “Item 4. Information on the Company” or “Item 7.B. Major Shareholders and Related Party Transactions-Related Party Transactions” or elsewhere in this annual report, we have not entered into any material contract during the two years immediately preceding the date of this annual report.
Investor Rights Agreement with Walmart
In connection with our issuance of 144,952,250 Class A ordinary shares to Newheight, a wholly-owned subsidiary of Walmart, in return for Walmart’s transferring to us Yihaodian marketplace platform assets, including the Yihaodian brand, mobile apps and websites, and entering into business cooperation arrangements with us in June 2016.
We entered into an investor rights agreement with Newheight dated June 20, 2016. Pursuant to the investor rights agreement:
| • | Observer right. So long as Newheight and certain other wholly-owned subsidiaries of Walmart hold no less than 289,053,746 shares of our Class A ordinary shares (including ADSs representing Class A ordinary shares), Newheight has the right to designate one of its senior executives to attend all meetings of our board of directors in a non-voting observer capacity; |
| • | Registration rights. After the expiration of a period of 60 months following June 20, 2016, Walmart has certain demand registration rights, piggyback registration rights and F-3 registration rights under the investor rights agreement with respect to their registrable securities, including ordinary shares issued under the share subscription agreement; |
| • | Preemptive rights with respect to share issuance. Within the first 24 months after June 20, 2016 (and regardless of Newheight’s percentage of ownership of our share capital) and, after such period, for so long as Newheight holds at least 10% of our then outstanding share capital on a fully diluted basis, if we propose to issue certain new securities, Newheight or a wholly-owned subsidiary of Walmart designated by Newheight has the right to purchase such number of new securities under the same terms and conditions at its election so as to enable Newheight to hold a pro rata portion of the new securities equal to the percentage of our share capital on a fully diluted basis then held by Newheight. |
| • | Transfer restrictions. Walmart agreed to certain lock-up, standstill, rights of first refusal and other transfer restrictions provided in the investor rights agreement. |
| D. | Exchange Controls |
See “Item 4.B. Information on the Company—Business Overview—Regulation—Regulations Relating to Foreign Exchange.”
| E. | Taxation |
The following is a general summary of certain Cayman Islands, PRC, Hong Kong S.A.R. and United States federal income tax consequences relevant to an investment in our ADSs and Class A ordinary shares. The discussion is not intended to be, nor should it be construed as, legal or tax advice to any particular prospective purchaser. The discussion is based on laws and interpretations thereof in effect as of the date of this annual report, all of which are subject to change or different interpretations, possibly with retroactive effect. The discussion does not address U.S. state or local tax laws, or tax laws of jurisdictions other than the Cayman Islands, the People’s Republic of China, Hong Kong S.A.R. and the United States. You should consult your own tax advisors with respect to the consequences of acquisition, ownership and disposition of our ADSs and Class A ordinary shares.
177
Table of Contents
Cayman Islands Taxation
The Cayman Islands currently levies no taxes on individuals or corporations based upon profits, income, gains or appreciation and there is no taxation in the nature of inheritance tax or estate duty. There are no other taxes likely to be material to holders of our ADSs or ordinary shares levied by the government of the Cayman Islands except for stamp duties which may be applicable on instruments executed in, or after execution brought within the jurisdiction of, the Cayman Islands. The Cayman Islands is not party to any double tax treaties which are applicable to any payments made by or to our company. There are no exchange control regulations or currency restrictions in the Cayman Islands.
Payments of dividends and capital in respect of our ADSs or ordinary shares will not be subject to taxation in the Cayman Islands and no withholding will be required on the payment of a dividend or capital to any holder of our ADSs or ordinary shares, nor will gains derived from the disposal of our ADSs or ordinary shares be subject to Cayman Islands income or corporation tax.
People’s Republic of China Taxation
Under the PRC Enterprise Income Tax Law and its implementation rules, an enterprise established outside of the PRC with “de facto management body” within the PRC is considered a resident enterprise and will be subject to the enterprise income tax on its global income at the rate of 25%. The implementation rules define the term “de facto management body” as the body that exercises full and substantial control and overall management over the business, productions, personnel, accounts and properties of an enterprise. In 2009, the State Taxation Administration issued a circular, known as Circular 82, which provides certain specific criteria for determining whether the “de facto management body” of a PRC-controlled enterprise that is incorporated offshore is located in China. Although this circular only applies to offshore enterprises controlled by PRC enterprises or PRC enterprise groups, not those controlled by PRC individuals or foreigners, the criteria set forth in the circular may reflect the State Taxation Administration’s general position on how the “de facto management body” text should be applied in determining the tax resident status of all offshore enterprises. According to Circular 82, an offshore incorporated enterprise controlled by a PRC enterprise or a PRC enterprise group will be regarded as a PRC tax resident by virtue of having its “de facto management body” in China only if all of the following conditions are met: (i) the primary location of the day-to-day operational management is in the PRC; (ii) decisions relating to the enterprise’s financial and human resource matters are made or are subject to approval by organizations or personnel in the PRC; (iii) the enterprise’s primary assets, accounting books and records, company seals, and board and shareholder resolutions, are located or maintained in the PRC; and (iv) at least 50% of voting board members or senior executives habitually reside in the PRC.
We believe that none of JD.com, Inc. and its subsidiaries outside of China is a PRC resident enterprise for PRC tax purposes. JD.com, Inc. is not controlled by a PRC enterprise or PRC enterprise group and we do not believe that JD.com, Inc. meets all of the conditions above. JD.com, Inc. is a company incorporated outside the PRC. As a holding company, its key assets are its ownership interests in its subsidiaries, and its key assets are located, and its records (including the resolutions of its board of directors and the resolutions of its shareholders) are maintained, outside the PRC. For the same reasons, we believe our other subsidiaries outside of China are not PRC resident enterprises either. However, the tax resident status of an enterprise is subject to determination by the PRC tax authorities and uncertainties remain with respect to the interpretation of the term “de facto management body.”
If the PRC tax authorities determine that JD.com, Inc. is a PRC resident enterprise for enterprise income tax purposes, we may be required to withhold a 10% withholding tax from dividends we pay to our shareholders that are non-resident enterprises, including the holders of our ADSs. In addition, non-resident enterprise shareholders (including our ADS holders) may be subject to a 10% PRC withholding tax on gains realized on the sale or other disposition of ADSs or ordinary shares, if such income is treated as sourced from within the PRC. In addition, gains derived by our non-PRC individual shareholders from the sale of our shares and ADSs may be subject to a 20% PRC withholding tax. It is unclear whether our non-PRC individual shareholders (including our ADS holders) would be subject to any PRC tax on dividends obtained by such non-PRC individual shareholders in the event we are determined to be a PRC resident enterprise. If any PRC tax were to apply to dividends realized by non-PRC individuals, it would generally apply at a rate of 20% unless a reduced rate is available under an applicable tax treaty. However, it is also unclear whether non-PRC shareholders of JD.com, Inc. would be able to claim the benefits of any tax treaties between their country of tax residence and the PRC in the event that JD.com, Inc. is treated as a PRC resident enterprise.
178
Table of Contents
Provided that our Cayman Islands holding company, JD.com, Inc., is not deemed to be a PRC resident enterprise, holders of our ADSs and ordinary shares who are not PRC residents will not be subject to PRC income tax on dividends distributed by us or gains realized from the sale or other disposition of our shares or ADSs. STA Circular 7 further clarifies that, if a non-resident enterprise derives income by acquiring and selling shares in an offshore listed enterprise in the public market, such income will not be subject to PRC tax. In addition, STA Public Notice 37 provided certain key changes to the previous withholding regime, such as (i) the withholding obligation for a non-resident enterprise deriving dividend arises on the date on which the payment is actually made rather than on the date of the resolution that declared the dividends, (ii) non-resident enterprises are not obligated to report tax to the authorities if their withholding agents fail to perform the withholding obligation is removed. However, there is uncertainty as to the application of STA Public Notice 37 and STA Circular 7, we and our non-PRC resident investors may be at risk of being required to file a return and being taxed under STA Public Notice 37 and STA Circular 7 and we may be required to expend valuable resources to comply with STA Public Notice 37 and STA Circular 7 or to establish that we should not be taxed under STA Public Notice 37 and STA Circular 7. See “Item 3.D. Key Information—Risk Factors—Risks Related to Doing Business in China—We face uncertainties with respect to indirect transfers of equity interests in PRC resident enterprises by their non-PRC holding companies, and heightened scrutiny over acquisition transactions by the PRC tax authorities may have a negative impact on potential acquisitions we may pursue in the future.”
Hong Kong Taxation
Our subsidiaries incorporated in Hong Kong are subject to a two-tiered income tax rate for taxable income generated from operations in Hong Kong, effective on April 1, 2018. The first HK$2 million of profits earned by our subsidiaries incorporated in Hong Kong will be taxed at half the current tax rate (i.e., 8.25%) while the remaining profits will continue to be taxed at the existing 16.5% tax rate. We make analysis on the foreign-derived income, mainly including dividend and interest, earned by our subsidiaries incorporated in Hong Kong, apply for an advance ruling with the Inland Revenue Department of Hong Kong for the income meeting exemption conditions and pay tax for the income subject to Hong Kong profits tax under the foreign-sourced income exemption regime.
Our principal register of members is maintained by our principal share registrar in the Cayman Islands, and our Hong Kong register of members is maintained by the Hong Kong Share Registrar in Hong Kong.
Dealings in our Class A ordinary shares registered on our Hong Kong Share Register are subject to Hong Kong stamp duty. The stamp duty is charged to each of the seller and purchaser at the rate of 0.13% before November 17, 2023 and 0.1% on and after November 17, 2023 of the consideration for, or (if greater) the value of, our Class A ordinary shares transferred. In other words, a total of 0.26% is currently payable on a typical sale and purchase transaction of our Class A ordinary shares. In addition, a fixed duty of HK$5.00 is charged on each instrument of transfer (if required).
To facilitate ADS-ordinary share conversion and trading between Nasdaq and the Hong Kong Stock Exchange, we have moved a portion of our issued Class A ordinary shares from our Cayman share register to our Hong Kong share register. It is unclear whether, as a matter of Hong Kong law, the trading or conversion of ADSs constitutes a sale or purchase of the underlying Hong Kong registered ordinary shares that is subject to Hong Kong stamp duty. We advise investors to consult their own tax advisors on this matter. See “Item 3.D. Key Information—Risk Factors—Risks Related to Our ADSs and Class A Ordinary Shares—There is uncertainty as to whether Hong Kong stamp duty will apply to the trading or conversion of our ADSs.”
United States Federal Income Tax Considerations
The following discussion is a summary of United States federal income tax considerations relating to the ownership and disposition of our ADSs or ordinary shares by a U.S. Holder (as defined below) that holds our ADSs or ordinary shares as “capital assets” (generally, property held for investment) under the United States Internal Revenue Code of 1986, as amended (the “Code”). This discussion is based on the tax laws of the United States as in effect on the date of this annual report on Form 20-F and on U.S. Treasury regulations in effect as of the date of this annual report, as well as judicial and administrative interpretations thereof available on or before such date. All of the foregoing authorities are subject to change, which change could apply retroactively and could affect the tax considerations described below. There can be no assurance that the IRS or a court will not take a contrary position with respect to any United States federal income tax consequences described below. This discussion does not address all aspects of United States federal income taxation that may be important to particular investors in light of their individual investment circumstances, including investors subject to special tax rules (for example, banks, certain financial institutions, insurance companies, broker-dealers, traders in securities that elect mark-to-market treatment, partnerships and their partners, tax-exempt entities (including private foundations), investors who are not U.S. Holders, U.S. expatriates, investors liable for the alternative minimum tax, investors who acquired their ADSs or ordinary shares pursuant to the exercise of any employee share option or otherwise as compensation, investors who own (directly, indirectly, or constructively) 10% or more of our stock (by vote or value), investors that will hold their ADSs or ordinary shares as part of a straddle, hedge, conversion, constructive sale, or other integrated transaction for United States federal income tax purposes, investors subject to the Medicare tax on their net investment income or investors that have a functional currency other than the United States dollar), all of whom may be subject to tax rules that differ significantly from those summarized below.
179
Table of Contents
In addition, this discussion does not address any state, local or non-United States tax considerations. Each U.S. Holder is urged to consult its tax advisor regarding the United States federal, state, local, and non-United States income and other tax considerations of an investment in our ADSs or ordinary shares.
General
For purposes of this discussion, a “U.S. Holder” is a beneficial owner of our ADSs or ordinary shares that is, for United States federal income tax purposes, (i) an individual who is a citizen or resident of the United States, (ii) a corporation (or other entity treated as a corporation for United States federal income tax purposes) created in, or organized under the law of, the United States or any state thereof or the District of Columbia, (iii) an estate the income of which is includible in gross income for United States federal income tax purposes regardless of its source, or (iv) a trust (A) the administration of which is subject to the primary supervision of a United States court and which has one or more United States persons who have the authority to control all substantial decisions of the trust or (B) that has otherwise elected to be treated as a United States person under the Code.
If a partnership (or other entity treated as a partnership for United States federal income tax purposes) owns our ADSs or ordinary shares, the tax treatment of a partner in the partnership will generally depend upon the status of the partner and the activities of the partnership. Partnerships holding our ADSs or ordinary shares and their partners are urged to consult their tax advisors regarding an investment in our ADSs or ordinary shares.
For U.S. federal income tax purposes, U.S. Holders who hold ADSs will generally be treated as the holder of the underlying ordinary shares represented by those ADSs. The remainder of this discussion assumes that a U.S. Holder of our ADSs will be treated in this manner. Accordingly, deposits or withdrawals of Class A ordinary shares for ADSs will generally not be subject to U.S. federal income tax.
The discussion below under “—Dividends” and “—Sale or Other Disposition of ADSs or Ordinary Shares” is written on the basis that we will not be or become classified as a PFIC for U.S. federal income tax purposes. The U.S. federal income tax rules that apply generally if we are treated as a PFIC for any taxable year are discussed below under “—Passive Foreign Investment Company Considerations.”
Dividends
Any cash distributions (including any amount of any PRC tax withheld) paid on our ADSs or ordinary shares out of our current or accumulated earnings and profits, as determined under United States federal income tax principles, will generally be includible in the gross income of a U.S. Holder as dividend income on the day actually or constructively received by the U.S. Holder, in the case of ordinary shares, or by the depositary, in the case of ADSs. Because we do not intend to determine our earnings and profits on the basis of United States federal income tax principles, any distribution we pay will generally be reported as a “dividend” for United States federal income tax purposes. Dividends received on our ADSs or ordinary shares will not be eligible for the dividends received deduction allowed to corporations under the Code.
Individuals and other non-corporate recipients will be subject to tax at the lower capital gain tax rate applicable to “qualified dividend income” on dividends paid on our ADSs, provided that certain conditions are satisfied, including that (i) our ADSs are readily tradable on an established securities market in the United States, or, in the event that we are deemed to be a PRC resident enterprise under the PRC tax law, we are eligible for the benefit of the United States-PRC income tax treaty (the “Treaty”), (ii) we are neither a PFIC nor treated as such with respect to a U.S. Holder (as discussed above) for the taxable year in which the dividend was paid and the preceding taxable year, and (iii) certain holding period requirements are met. Because (i) U.S. Treasury guidance indicates that ADSs representing ordinary shares, such as ours, listed on the Nasdaq Global Select Market are considered to be readily tradable on an established securities market in the United States, and (ii) we believe that we were not a PFIC for United States federal income tax purposes for our taxable year ended December 31, 2023 and we do not expect to be a PFIC in subsequent years, we believe that we are a qualified foreign corporation with respect to dividends paid on the ADSs, but not with respect to dividends paid on our ordinary shares. In the event that we are deemed to be a PRC resident enterprise under PRC tax law, we believe that we would be eligible for the benefits under the Treaty and that we should be treated as a qualified foreign corporation with respect to dividends paid on our ordinary shares or ADSs. U.S. Holders should consult their tax advisors regarding the availability of the reduced tax rate on dividends in their particular circumstances.
180
Table of Contents
For United States foreign tax credit purposes, dividends will generally be treated as income from foreign sources and will generally constitute passive category income. A U.S. Holder may be eligible, subject to a number of complex limitations, to claim a foreign tax credit not in excess of any applicable treaty rate in respect of any nonrefundable foreign withholding taxes imposed on dividends received on our ADSs or ordinary shares. A U.S. Holder who does not elect to claim a foreign tax credit for foreign tax withheld may instead claim a deduction, for United States federal income tax purposes, in respect of such withholding, but only for a year in which such holder elects to do so for all creditable foreign income taxes. The rules governing the foreign tax credit are complex. U.S. Holders are urged to consult their tax advisors regarding the availability of the foreign tax credit under their particular circumstances.
Sale or Other Disposition of ADSs or Ordinary Shares
A U.S. Holder will generally recognize capital gain or loss upon the sale or other disposition of ADSs or ordinary shares in an amount equal to the difference between the amount realized upon the sale or other disposition and the holder’s adjusted tax basis in such ADSs or ordinary shares. The gain or loss will generally be capital gain or loss. Any capital gain or loss will be long-term if the ADSs or ordinary shares have been held for more than one year. An individual U.S. Holder or other non-corporate U.S. Holder who has held the ADSs or ordinary shares for more than one year will generally be eligible for reduced tax rates. The deductibility of capital losses is subject to limitations. Any such gain or loss recognized by a U.S. Holder will generally be treated as U.S. source income or loss for foreign tax credit purposes, which will generally limit the availability to claim foreign tax credits. However, in the event we are deemed to be a PRC “resident enterprise” under PRC tax law, we may be eligible for the benefits of the Treaty. In such event, if PRC tax were to be imposed on any gain from the disposition of the ADSs or ordinary shares, a U.S. Holder that is eligible for the benefits of the Treaty may elect to treat such gain as PRC source income. Pursuant to recently issued Treasury Regulations, however, if a U.S. Holder is not eligible for the benefits of the Treaty or does not elect to apply the Treaty, then such holder may not be able to claim a foreign tax credit arising from any PRC tax imposed on the disposition of the ADSs or ordinary shares. U.S. Holders are urged to consult their tax advisors regarding the tax consequences if a foreign tax is imposed on a disposition of our ADSs or ordinary shares, including the availability of the foreign tax credit or deduction under their particular circumstances, their eligibility for benefits under the Treaty and the potential impact of the recently issued Treasury Regulations.
Passive Foreign Investment Company Considerations
A non-United States corporation, such as our company, will be classified as a “passive foreign investment company,” or PFIC, for United States federal income tax purposes for any taxable year, if either (i) 75% or more of its gross income for such year consists of certain types of “passive” income or (ii) 50% or more of the value of its assets (generally determined on the basis of a quarterly average) during such year produce or are held for the production of passive income. For this purpose, cash is categorized as a passive asset and the company’s unbooked intangibles associated with active business activity are taken into account as a non-passive asset.
In addition, we will be treated as owning a proportionate share of the assets and earning a proportionate share of the income of any other corporation in which we own, directly or indirectly, 25% or more (by value) of the stock. Although the law in this regard is unclear, we treat the consolidated variable interest entities as being owned by us for United States federal income tax purposes because we control their management decisions and we are entitled to substantially all of the economic benefits associated with these entities, and, as a result, we consolidate their results of operations in our U.S. GAAP financial statements and treat them as being owned by us for United States federal income tax purposes. If it were determined, however, that we are not the owner of the consolidated variable interest entities for United States federal income tax purposes, we may be treated as a PFIC for our taxable year ended December 31, 2023 and in future taxable years.
181
Table of Contents
Based on our current income and assets and the value of our ADSs and outstanding ordinary shares, we do not believe that we were a PFIC for our taxable year ended December 31, 2023, and we do not expect to be classified as a PFIC in the current taxable year or the foreseeable future. Because PFIC status is a fact-intensive determination, no assurance can be given that we will not be classified as a PFIC for that year. While we do not anticipate becoming a PFIC, changes in the composition of our income or assets, or fluctuations in the market price of our Class A ordinary shares and/or ADSs, may cause us to become a PFIC for future taxable years. In estimating the value of our goodwill and other unbooked intangibles, we have taken into account our market capitalization, which may fluctuate over time. Among other factors, if our market capitalization subsequently declines, we may be or become classified as a PFIC for the current or future taxable years. Under circumstances where revenues from activities that produce passive income significantly increase relative to our revenues from activities that produce non-passive income or where we determine not to deploy significant amounts of cash for working capital or other purposes, our risk of becoming classified as a PFIC may substantially increase.
If we are classified as a PFIC for any taxable year during which a U.S. Holder holds our ADSs or ordinary shares, and unless the U.S. Holder makes a “mark-to-market” election (as described below), the U.S. Holder will generally be subject to special tax rules that have a penalizing effect, regardless of whether we remain a PFIC, on (i) any excess distribution that we make to the U.S. Holder (which generally means any distribution paid during a taxable year to a U.S. Holder that is greater than 125% of the average annual distributions paid in the three preceding taxable years or, if shorter, the U.S. Holder’s holding period for the ADSs or ordinary shares), and (ii) any gain realized on the sale or other disposition, including a pledge, of ADSs or ordinary shares. Under the PFIC rules:
| • | the excess distribution or gain will be allocated ratably over the U.S. Holder’s holding period for the ADSs or ordinary shares; |
| • | amounts allocated to the current taxable year and any taxable years in a U.S. Holder’s holding period prior to the first taxable year in which we are classified as a PFIC (a “pre-PFIC year”) will be taxable as ordinary income; and |
| • | amounts allocated to each prior taxable year, other than the current taxable year or a pre-PFIC year, will be subject to tax at the highest tax rate in effect applicable to such U.S. Holder for that year, and such amounts will be increased by an additional tax equal to interest on the resulting tax deemed deferred with respect to such years. |
The tax liability for amounts allocated to years prior to the year of disposition or “excess distribution” cannot be offset by any net operating losses for such years, and gains (but not losses) realized on the sale of the ADSs or ordinary shares cannot be treated as capital, even if such ADSs or ordinary shares are held as capital assets.
If we are a PFIC for any taxable year during which a U.S. Holder holds our ADSs or ordinary shares and any of our subsidiaries is also a PFIC, such U.S. Holder would be treated as owning a proportionate amount (by value) of the shares of the lower-tier PFIC and would be subject to the rules described above on certain distributions by a lower-tier PFIC and a disposition of shares of a lower-tier PFIC even though such U.S. Holders would not receive the proceeds of those distributions or dispositions. U.S. Holders should consult their tax advisors regarding the application of the PFIC rules to any of our subsidiaries.
As an alternative to the foregoing rules, a U.S. Holder of “marketable stock” (as defined below) in a PFIC may make a mark-to-market election with respect to such stock. The mark-to-market election is available only for “marketable stock,” which is stock that is traded in other than de minimis quantities on at least 15 days during each calendar quarter, or “regularly traded” on a qualified exchange or other market, as defined in applicable Treasury regulations. For these purposes, our ADSs are listed on the Nasdaq Global Select Market, which is a qualified exchange for these purposes, and our ordinary shares are listed on the Hong Kong Stock Exchange, which should constitute a qualified exchange or other market. We anticipate that our ADSs and ordinary shares should qualify as being regularly traded, but no assurances may be given in this regard. If a U.S. Holder makes this election, the holder will generally (i) include as ordinary income for each taxable year that we are a PFIC the excess, if any, of the fair market value of ADSs or ordinary shares held at the end of the taxable year over the adjusted tax basis of such ADSs or ordinary shares and (ii) deduct as an ordinary loss the excess, if any, of the adjusted tax basis of the ADSs or ordinary shares over the fair market value of such ADSs or ordinary shares held at the end of the taxable year, but such deduction will only be allowed to the extent of the amount previously included in income as a result of the mark-to-market election. The U.S. Holder’s adjusted tax basis in the ADSs or ordinary shares would be adjusted to reflect any income or loss resulting from the mark-to-market election. If a U.S. Holder makes a mark-to-market election in respect of our ADSs or ordinary shares and we cease to be a PFIC, the holder will not be required to take into account the gain or loss described above during any period that we are not classified as a PFIC. If a U.S. Holder makes a mark-to-market election, any gain such U.S. Holder recognizes upon the sale or other disposition of our ADSs or ordinary shares in a year when we are a PFIC will be treated as ordinary income and any loss will be treated as ordinary loss, but such loss will only be treated as ordinary loss to the extent of the net amount previously included in income as a result of the mark-to-market election.
182
Table of Contents
Because, as a technical matter, a mark-to-market election cannot be made for any lower-tier PFICs that we may own, a U.S. Holder may continue to be subject to the general PFIC rules described above with respect to such U.S. Holder’s indirect interest in any investments held by us that are treated as an equity interest in a PFIC for United States federal income tax purposes.
We do not intend to provide information necessary for U.S. Holders to make qualified electing fund elections which, if available, would result in tax treatment different from the tax treatment for PFICs described above.
If a U.S. Holder owns our ADSs or ordinary shares during any taxable year that we are a PFIC, the holder must file an annual Internal Revenue Service Form 8621.
Each U.S. Holder is urged to consult its tax advisor concerning the United States federal income tax consequences of purchasing, holding, and disposing of ADSs or ordinary shares if we are or become classified as a PFIC, including the possibility of making a mark-to-market election and the unavailability of the qualified electing fund election.
| F. | Dividends and Paying Agents |
Not applicable.
| G. | Statement by Experts |
Not applicable.
| H. | Documents on Display |
We are subject to periodic reporting and other informational requirements of the Exchange Act as applicable to foreign private issuers, and are required to file reports and other information with the SEC. Specifically, we are required to file annually an annual report on Form 20-F within four months after the end of each fiscal year, which is December 31. All information filed with the SEC can be obtained over the internet at the SEC’s website at www.sec.gov. As a foreign private issuer, we are exempt from the rules under the Exchange Act prescribing the furnishing and content of quarterly reports and proxy statements, and officers, directors and principal shareholders are exempt from the reporting and short-swing profit recovery provisions contained in Section 16 of the Exchange Act.
We will furnish Deutsche Bank Trust Company Americas, the depositary of our ADSs, with our annual reports, which will include a review of operations and annual audited consolidated financial statements prepared in conformity with U.S. GAAP, and all notices of shareholders’ meetings and other reports and communications that are made generally available to our shareholders. The depositary will make such notices, reports and communications available to holders of ADSs and, upon our request, will mail to all record holders of ADSs the information contained in any notice of a shareholders’ meeting received by the depositary from us.
In accordance with Nasdaq Stock Market Rule 5250(d), we will post this annual report on Form 20-F on our website at http://ir.jd.com. In addition, we will provide hardcopies of our annual report free of charge to shareholders and ADS holders upon request.
183
Table of Contents
| I. | Subsidiary Information |
Not applicable.
| J. | Annual Report to Security Holders |
As an issuer listed on the Hong Kong Stock Exchange, we are required to publish an annual report for the fiscal year ended December 31, 2023, which we plan to furnish as an exhibit to a current report on Form 6-K via EDGAR to be filed on the same date of this annual report on Form 20-F.
| Item 11. | Quantitative and Qualitative Disclosures about Market Risk |
Interest Rate Risk
Our exposure to interest rate risk primarily relates to the interest income generated by excess cash, which is mostly held in interest-bearing bank deposits. We have not used derivative financial instruments in our investment portfolio. Interest earning instruments carry a degree of interest rate risk. We have not been exposed to, nor do we anticipate being exposed to, material risks due to changes in market interest rates. However, our future interest income may fall short of expectations due to changes in market interest rates.
Foreign Exchange Risk
Substantially all of our revenues and expenses are denominated in RMB.
We do not believe that we currently have any significant direct foreign exchange risk and have not used any derivative financial instruments to hedge exposure to such risk. Certain non-derivative instruments have been used to manage exposure in exchange rates. Although our exposure to foreign exchange risks should be limited in general, the value of your investment in our ADSs will be affected by the exchange rate between U.S. dollar and RMB because the value of our business is effectively denominated in RMB, while our ADSs are traded in U.S. dollars.
The conversion of RMB into foreign currencies, including U.S. dollars, is based on rates set by the People’s Bank of China. The RMB has fluctuated against the U.S. dollar, at times significantly and unpredictably. It is difficult to predict how market forces or PRC or U.S. government policy may impact the exchange rate between RMB and the U.S. dollar in the future.
To the extent that we need to convert U.S. dollars into RMB for our operations, appreciation of the RMB against the U.S. dollar would have an adverse effect on the RMB amount we receive from the conversion. Conversely, if we decide to convert RMB into U.S. dollars for the purpose of making payments for dividends on our ordinary shares or ADSs or for other business purposes, appreciation of the U.S. dollar against the RMB would have a negative effect on the U.S. dollar amounts available to us.
As of December 31, 2023, we had RMB-denominated cash and cash equivalents, restricted cash, short-term investments and time deposits or wealth management products with maturities more than one year in marketable securities and other investments of RMB176.3 billion, and U.S. dollar-denominated cash, cash equivalents and short-term investments and time deposits or wealth management products with maturities more than one year in marketable securities and other investments of US$13.9 billion. Assuming we had converted RMB176.3 billion into U.S. dollars at the exchange rate of RMB7.0999 for US$1.00 as of December 29, 2023, our U.S. dollar cash balance would have been US$38.8 billion. If the RMB had depreciated by 10% against the U.S. dollar, our U.S. dollar cash balance would have been US$36.2 billion instead. Assuming we had converted US$13.9 billion into RMB at the exchange rate of RMB7.0999 for US$1.00 as of December 29, 2023, our RMB cash balance would have been RMB275.0 billion. If the RMB had depreciated by 10% against the U.S. dollar, our RMB cash balance would have been RMB286.2 billion instead.
| Item 12. | Description of Securities Other than Equity Securities |
| A. | Debt Securities |
Not applicable.
184
Table of Contents
| B. | Warrants and Rights |
Not applicable.
| C. | Other Securities |
Not applicable.
| D. | American Depositary Shares |
Our ADSs are traded on Nasdaq. Dealings in our ADSs on Nasdaq are conducted in U.S. Dollars.ADSs may be held either:
| • | directly, by having a certificated ADS, or an ADR, registered in the holder’s name, or by holding in the direct registration system, pursuant to which the depositary may register the ownership of uncertificated ADSs, which ownership shall be evidenced by periodic statements issued by the depositary to the ADS holders entitled thereto; or |
| • | indirectly, through the holder’s broker or other financial institution. |
The depositary for our ADSs is Deutsche Bank Trust Company Americas, whose office is located at 60 Wall Street, New York, New York 10005, United States of America.
Fees and Charges Our ADS holders May Have to Pay
An ADS holder will be required to pay the following service fees to the depositary bank and certain taxes and governmental charges (in addition to any applicable fees, expenses, taxes and other governmental charges payable on the deposited securities represented by any of the ADSs):
| Service |
Fees | |
| • to any person to whom ADSs are issued or to any person to whom a distribution is made in respect of ADS distributions pursuant to stock dividends or other free distributions of stock, bonus distributions, stock splits or other distributions (except where converted to cash) |
Up to US$0.05 per ADS issued | |
| • Surrendering ADSs for cancellation and withdrawal of deposited securities |
Up to US$0.05 per ADS surrendered | |
| • Distribution of cash dividends |
Up to US$0.05 per ADS held | |
| • Distribution of cash entitlements (other than cash dividends) and/or cash proceeds, including proceeds from the sale of rights, securities and other entitlements |
Up to US$0.05 per ADS held | |
| • Distribution of ADSs pursuant to exercise of rights |
Up to US$0.05 per ADS held | |
| • Operation and maintenance costs |
Up to US$0.05 per ADS held on the applicable record date(s) established by the depositary bank | |
An ADS holder will also be responsible to pay certain fees and expenses incurred by the depositary bank and certain taxes and governmental charges (in addition to any applicable fees, expenses, taxes and other governmental charges payable on the deposited securities represented by any of the ADSs) such as:
185
Table of Contents
| • | Fees for the transfer and registration of ordinary shares charged by the registrar and transfer agent for the ordinary shares in the Cayman Islands (i.e., upon deposit and withdrawal of ordinary shares). |
| • | Expenses incurred for converting foreign currency into U.S. dollars. |
| • | Expenses for cable, telex, fax and electronic transmissions and for delivery of securities. |
| • | Taxes and duties upon the transfer of securities, including any applicable stamp duties, any stock transfer charges or withholding taxes (i.e., when ordinary shares are deposited or withdrawn from deposit). |
| • | Fees and expenses incurred in connection with the delivery of ordinary shares on deposit or the servicing of ordinary shares, deposited securities and/or ADSs. |
| • | Fees and expenses incurred in connection with complying with exchange control regulations and other regulatory requirements applicable to ordinary shares, deposited securities, ADSs and ADRs. |
The depositary fees payable upon the issuance and cancellation of ADSs are typically paid to the depositary bank by the brokers (on behalf of their clients) receiving the newly issued ADSs from the depositary bank and by the brokers (on behalf of their clients) delivering the ADSs to the depositary bank for cancellation. The brokers in turn charge these fees to their clients. Depositary fees payable in connection with distributions of cash or securities to ADS holders and the depositary services fee are charged by the depositary bank to the holders of record of ADSs as of the applicable ADS record date.
The depositary fees payable for cash distributions are generally deducted from the cash being distributed or by selling a portion of distributable property to pay the fees. In the case of distributions other than cash (i.e., share dividends, rights), the depositary bank charges the applicable fee to the ADS record date holders concurrent with the distribution. In the case of ADSs registered in the name of the investor (whether certificated or uncertificated in direct registration), the depositary bank sends invoices to the applicable record date ADS holders. In the case of ADSs held in brokerage and custodian accounts (via DTC), the depositary bank generally collects its fees through the systems provided by DTC (whose nominee is the registered holder of the ADSs held in DTC) from the brokers and custodians holding ADSs in their DTC accounts. The brokers and custodians who hold their clients’ ADSs in DTC accounts in turn charge their clients’ accounts the amount of the fees paid to the depositary banks.
In the event of refusal to pay the depositary fees, the depositary bank may, under the terms of the deposit agreement, refuse the requested service until payment is received or may set off the amount of the depositary fees from any distribution to be made to the ADS holder.
Fees and Other Payments Made by the Depositary to Us
Deutsche Bank Trust Company Americas, as depositary, has agreed to reimburse us for a portion of certain expenses we incur that are related to establishment and maintenance of the ADR program, including investor relations expenses. There are limits on the amount of expenses for which the depositary will reimburse us, but the amount of reimbursement available to us is not related to the amounts of fees the depositary collects from investors. Further, the depositary has agreed to reimburse us certain fees payable to the depositary by holders of ADSs. Neither the depositary nor we can determine the exact amount to be made available to us because (i) the number of ADSs that will be issued and outstanding, (ii) the level of service fees to be charged to holders of ADSs and (iii) our reimbursable expenses related to the program are not known at this time. In 2023, we were entitled to approximately US$6.4 million reimbursement from the depositary for our expenses incurred in connection with investor relationship programs related to the ADS facility.
Conversion between Class A Ordinary Shares and ADSs
Dealings and Settlement of Class A Ordinary Shares in Hong Kong
Our Class A ordinary shares trade on the Hong Kong Stock Exchange in board lots of 50 Class A ordinary shares. Dealings in our Class A ordinary shares on the Hong Kong Stock Exchange will be conducted in Hong Kong dollars.
186
Table of Contents
The transaction costs of dealings in our Class A ordinary shares on the Hong Kong Stock Exchange include:
| • | Hong Kong Stock Exchange trading fee of 0.005% of the consideration of the transaction, charged to each of the buyer and seller; |
| • | Securities and Futures Commission of Hong Kong transaction levy of 0.0027% of the consideration of the transaction, charged to each of the buyer and seller; |
| • | trading tariff of HK$0.50 on each and every purchase or sale transaction. The decision on whether or not to pass the trading tariff onto investors is at the discretion of brokers; |
| • | transfer deed stamp duty of HK$5.00 per transfer deed (if applicable), payable by the seller; |
| • | ad valorem stamp duty at a total rate of 0.2% of the value of the transaction, with 0.1% payable by each of the buyer and the seller; |
| • | stock settlement fee, which is currently 0.002% of the gross transaction value, subject to a minimum fee of HK$2.00 and a maximum fee of HK$100.00 per side per trade; |
| • | brokerage commission, which is freely negotiable with the broker (other than brokerage commissions for IPO transactions which are currently set at 1% of the subscription or purchase price and will be payable by the person subscribing for or purchasing the securities); and |
| • | the Hong Kong Share Registrar will charge between HK$2.50 to HK$20.00, depending on the speed of service (or such higher fee as may from time to time be permitted under the Hong Kong Listing Rules), for each transfer of ordinary shares from one registered owner to another, each share certificate canceled or issued by it and any applicable fee as stated in the share transfer forms used in Hong Kong. |
Investors must settle their trades executed on the Hong Kong Stock Exchange through their brokers directly or through custodians. For an investor who has deposited his or her Class A ordinary shares in his or her stock account or in his or her designated Central Clearing and Settlement System participant’s stock account maintained with the Central Clearing and Settlement System, or CCASS, settlement will be effected in CCASS in accordance with the General Rules of CCASS and CCASS Operational Procedures in effect from time to time. For an investor who holds the physical certificates, settlement certificates and the duly executed transfer forms must be delivered to his or her broker or custodian before the settlement date.
Conversion between Class A Ordinary Shares Trading in Hong Kong and ADSs
In connection with the listing of our Class A ordinary shares on the Hong Kong Stock Exchange, we have established a branch register of members in Hong Kong, which we refer to as our Hong Kong share register, which is maintained by our Hong Kong Share Registrar, Computershare Hong Kong Investor Services Limited. Our principal register of members will continue to be maintained by our principal share registrar, Maples Fund Services (Cayman) Limited.
All Class A ordinary shares offered in connection with our listing in Hong Kong are registered on our Hong Kong share register in order to be listed and traded on the Hong Kong Stock Exchange. As described in further detail below, holders of Class A ordinary shares registered on the Hong Kong Share Register will be able to convert these ordinary shares into ADSs, and vice versa.
In connection with our listing in Hong Kong, and to facilitate fungibility and conversion between ADSs and Class A ordinary shares and trading between Nasdaq and the Hong Kong Stock Exchange, we moved a portion of our issued Class A ordinary shares from our register of members maintained in the Cayman Islands to our Hong Kong share register.
187
Table of Contents
Converting Class A Ordinary Shares Trading in Hong Kong into ADSs
An investor who holds Class A ordinary shares registered in Hong Kong and who intends to convert them to ADSs to trade on Nasdaq must deposit or have his or her broker deposit the Class A ordinary shares with the depositary’s Hong Kong custodian, Deutsche Bank AG, Hong Kong Branch, Hong Kong, in exchange for ADSs.
A deposit of Class A ordinary shares trading in Hong Kong in exchange for ADSs involves the following procedures:
| • | If Class A ordinary shares have been deposited with CCASS, the investor must transfer Class A ordinary shares to the depositary’s account with the custodian within CCASS by following the CCASS procedures for transfer and submit and deliver a duly completed and signed letter of transmittal to the custodian via his or her broker. |
| • | If Class A ordinary shares are held outside CCASS, the investor must arrange to deposit his or her Class A ordinary shares into CCASS for delivery to the depositary’s account with the custodian within CCASS, submit and deliver a duly completed and signed letter of transmittal to the custodian via his or her broker. |
| • | Upon payment of its fees and expenses and of any taxes or charges, such as stamp taxes or stock transfer taxes or fees, if applicable, and subject in all cases to the terms of the deposit agreement, the depositary will issue the corresponding number of ADSs in the name(s) requested by an investor and will deliver the ADSs to the designated DTC account of the person(s) designated by an investor or his or her broker. |
For Class A ordinary shares deposited in CCASS, under normal circumstances, the above steps generally require two business days. For Class A ordinary shares held outside CCASS in physical form, the above steps may take 14 business days, or more, to complete. Temporary delays may arise. For example, the transfer books of the depositary may from time to time be closed to ADS issuances. The investor will be unable to trade the ADSs until the procedures are completed.
Converting ADSs to Class A Ordinary Shares Trading in Hong Kong
An investor who holds ADSs and who intends to convert his/her ADSs into Class A ordinary shares to trade on the Hong Kong Stock Exchange must cancel the ADSs the investor holds and withdraw Class A ordinary shares from our ADS program and cause his or her broker or other financial institution to trade such ordinary shares on the Hong Kong Stock Exchange.
An investor that holds ADSs indirectly through a broker should follow the broker’s procedure and instruct the broker to arrange for cancelation of the ADSs, and transfer of the underlying ordinary shares from the depositary’s account with the custodian within the CCASS system to the investor’s Hong Kong stock account.
For investors holding ADSs directly (not holding through brokers), the following steps must be taken:
| • | To withdraw Class A ordinary shares from our ADS program, an investor who holds ADSs may turn in such ADSs at the office of the depositary (and the applicable ADR(s) if the ADSs are held in certificated form), and send an instruction to cancel such ADSs to the depositary. |
| • | Upon payment or net of its fees and expenses and of any taxes or charges, such as stamp taxes or stock transfer taxes or fees, if applicable, and subject in all cases to the terms of the deposit agreement, the depositary will instruct the custodian to deliver Class A ordinary shares underlying the canceled ADSs to the CCASS account designated by an investor. |
| • | If an investor prefers to receive Class A ordinary shares outside CCASS, he or she must receive Class A ordinary shares in CCASS first and then arrange for withdrawal from CCASS. Investors can then obtain a transfer form signed by HKSCC Nominees Limited (as the transferor) and register ordinary shares in their own names with the Hong Kong Share Registrar. |
188
Table of Contents
For Class A ordinary shares to be received in CCASS, under normal circumstances, the above steps generally require two business days. For ordinary shares to be received outside CCASS in physical form, the above steps may take 14 business days, or more, to complete. The investor will be unable to trade the Class A ordinary shares on the Hong Kong Stock Exchange until the procedures are completed.
Temporary delays may arise. For example, the transfer books of the depositary may from time to time be closed to ADS cancelations. In addition, completion of the above steps and procedures is subject to there being a sufficient number of Class A ordinary shares on our Hong Kong share register to facilitate a withdrawal from the ADS program directly into the CCASS system. We are not under any obligation to maintain or increase the number of Class A ordinary shares on our Hong Kong share register to facilitate such withdrawals.
Depositary Requirements
Before the depositary issues ADSs or permits withdrawal of ordinary shares, the depositary may require:
| • | production of satisfactory proof of the identity and genuineness of any signature or other information it deems necessary; and |
| • | compliance with procedures it may establish, from time to time, consistent with the deposit agreement, including presentation of transfer documents. |
The depositary may refuse to deliver, transfer, or register issuances, transfers and cancelations of ADSs generally when the transfer books of the depositary or our Hong Kong Share Registrar are closed or at any time if the depositary or we determine it advisable to do so.
All costs attributable to the transfer of Class A ordinary shares to effect a withdrawal from or deposit of ordinary shares into our ADS program will be borne by the investor requesting the transfer. In particular, holders of ordinary shares and ADSs should note that the Hong Kong Share Registrar will charge between HK$2.50 to HK$20, depending on the speed of service (or such higher fee as may from time to time be permitted under the Hong Kong Listing Rules), for each transfer of ordinary shares from one registered owner to another, each share certificate canceled or issued by it and any applicable fee as stated in the share transfer forms used in Hong Kong. In addition, holders of Class A ordinary shares and ADSs must pay up to US$5.00 (or less) per 100 ADSs for each issuance of ADSs and each cancelation of ADSs, as the case may be, in connection with the deposit of Class A ordinary shares into, or withdrawal of Class A ordinary shares from, our ADS program.
PART II
| Item 13. | Defaults, Dividend Arrearages and Delinquencies |
None.
| Item 14. | Material Modifications to the Rights of Security Holders and Use of Proceeds |
None.
| Item 15. | Controls and Procedures |
Evaluation of Disclosure Controls and Procedures
Our management, with the participation of our chief executive officer and chief financial officer, has performed an evaluation of the effectiveness of our disclosure controls and procedures (as defined in Rule 13a-15(e) under the Exchange Act) as of the end of the period covered by this report, as required by Rule 13a-15(b) under the Exchange Act.
Based upon that evaluation, our management has concluded that, as of December 31, 2023, our disclosure controls and procedures were effective in ensuring that the information required to be disclosed by us in the reports that we file and furnish under the Exchange Act was recorded, processed, summarized and reported, within the time periods specified in the SEC’s rules and forms, and that the information required to be disclosed by us in the reports that we file or submit under the Exchange Act is accumulated and communicated to our management, including our chief executive officer and chief financial officer, to allow timely decisions regarding required disclosure.
189
Table of Contents
Management’s Annual Report on Internal Control over Financial Reporting
Our management is responsible for establishing and maintaining adequate internal control over financial reporting as defined in Rules 13a-15(f) and 15d-15(f) under the Securities Exchange Act of 1934, as amended. Our internal control over financial reporting is a process designed to provide reasonable assurance regarding the reliability of our financial reporting and the preparation of financial statements for external purposes in accordance with Generally Accepted Accounting Principles (GAAP) in the United States of America and includes those policies and procedures that (1) pertain to the maintenance of records that, in reasonable detail, accurately and fairly reflect the transactions and dispositions of the assets of our company; (2) provide reasonable assurance that transactions are recorded as necessary to permit preparation of consolidated financial statements in accordance with GAAP, and that receipts and expenditures of our company are being made only in accordance with authorizations of our management and directors; and (3) provide reasonable assurance regarding prevention or timely detection of the unauthorized acquisition, use or disposition of our company’s assets that could have a material effect on the consolidated financial statements.
Because of its inherent limitations, internal control over financial reporting may not prevent or detect misstatements. Also, projections of any evaluation of effectiveness to future periods are subject to the risks that controls may become inadequate because of changes in conditions, or that the degree of compliance with the policies or procedures may deteriorate.
As required by Section 404 of the Sarbanes-Oxley Act of 2002 and related rules as promulgated by the Securities and Exchange Commission, our management including our Chief Executive Officer and Chief Financial Officer assessed the effectiveness of internal control over financial reporting as of December 31, 2023 using the criteria set forth in the report “Internal Control - Integrated Framework (2013)” published by the Committee of Sponsoring Organizations of the Treadway Commission. Based on this evaluation, the management concluded that our internal control over financial reporting was effective as of December 31, 2023.
Our independent registered public accounting firm, Deloitte Touche Tohmatsu Certified Public Accountants LLP, has audited the effectiveness of our company’s internal control over financial reporting as of December 31, 2023, as stated in its report, which appears on page F-4 of this annual report on Form 20-F.
Changes in Internal Control over Financial Reporting
There were no changes in our internal controls over financial reporting that occurred during the period covered by this annual report that have materially affected, or are reasonably likely to materially affect, our internal control over financial reporting.
| Item 16A. | Audit Committee Financial Expert |
Our board of directors has determined that Mr. Louis T. Hsieh, an independent director (under the standards set forth in Nasdaq Stock Market Rule 5605(a) (2) and Rule 10A-3 under the Exchange Act) and member of our audit committee, is an audit committee financial expert.
| Item 16B. | Code of Ethics |
Our board of directors adopted an amended and restated code of business conduct and ethics that applies to our directors, officers and employees in November 2022. We have posted a copy of our code of business conduct and ethics on our website at http://ir.jd.com
190
Table of Contents
Item 16C. |
Principal Accountant Fees and Services |
For the year ended December 31, |
||||||||
2022 |
2023 |
|||||||
Audit fees (2) |
US$ |
3,770,979 |
US$ |
3,989,139 |
||||
Audit-related fees (3) |
US$ |
6,090,913 |
US$ |
7,825,855 |
||||
Tax fees (4) |
US$ |
250,881 |
US$ |
445,950 |
||||
All other fees (5) |
US$ |
293,840 |
US$ |
172,417 |
||||
| (1) | We engaged Deloitte Touche Tohmatsu Certified Public Accountants LLP as external auditor for our annual report on Form 20-F, and Deloitte Touche Tohmatsu, Registered Public Interest Entity Auditor in Hong Kong as external auditor for our HK annual report. Deloitte Touche Tohmatsu Certified Public Accountants LLP’s PCAOB ID is |
| (2) | “Audit fees” means the aggregate fees billed in each of the fiscal years listed for professional services rendered by our principal auditors for the audit of our annual financial statements and assistance with and review of documents filed with the SEC. In 2022 and 2023, the audit refers to financial audit and audit pursuant to Section 404 of the Sarbanes-Oxley Act of 2002. |
| (3) | “Audit-related fees” means fees billed in each of the fiscal years listed for the issue of comfort letter, rendering of listing advice and other audit-related services to the company, including its consolidated subsidiaries. |
| (4) | “Tax Fees” means the aggregate fees billed in each of the fiscal years listed for professional services rendered by our principal auditors for tax compliance, tax advice and tax planning. |
| (5) | “All other fees” means the aggregate fees billed in each of the fiscal years listed for professional services rendered by our principal auditors associated with certain financial due diligence projects, permissible services to review and comment on internal control design over financial reporting and other advisory services. |
Table of Contents
| Item 16D. | Exemptions from the Listing Standards for Audit Committees |
Not applicable.
| Item 16E. | Purchases of Equity Securities by the Issuer and Affiliated Purchasers |
On March 17, 2020, our board of directors authorized a share repurchase program, under which we may repurchase up to US$2.0 billion of our ADSs or ordinary shares over the next 24 months through March 17, 2022. The share repurchase program was publicly announced on March 17, 2020.
On December 29, 2021, our board of directors approved modifications to the share repurchase program adopted in March 2020, pursuant to which the repurchase authorization has increased from US$2.0 billion to US$3.0 billion and has been extended until March 17, 2024.
Our board of directors has approved a new share repurchase program, effective on March 18, 2024, pursuant to which we may repurchase up to US$3.0 billion worth of our shares (including ADSs) over the next 36 months through March 2027.
The table below is a summary of our share repurchases in the periods indicated. All shares were repurchased in the open market pursuant to the share repurchase programs.
| Period |
Total Number of Class A Ordinary Shares Purchased |
Average Price Paid Per Share |
Total Number of Class A Ordinary Shares Purchased as Part of the Publicly Announced Plans |
Approximate Dollar Value of Shares that May Yet Be Purchased Under the Plans* |
||||||||||||
| March 1, 2023–March 31, 2023 |
7,678,980 | 19.94 | 7,678,980 | 1,710,395,700 | ||||||||||||
| November 1, 2023–November 30, 2023 |
6,306,030 | 14.01 | 6,306,030 | 1,622,018,709 | ||||||||||||
| December 1, 2023–December 31, 2023 |
8,693,970 | 13.20 | 8,693,970 | 1,507,297,563 | ||||||||||||
| March 1, 2024–March 17, 2024 |
48,230,474 | 13.38 | 48,230,474 | 862,104,645 | ||||||||||||
| March 18, 2024–March 31, 2024 |
39,273,924 | 13.58 | 39,273,924 | 2,466,741,017 | ** | |||||||||||
| Total |
110,183,378 | 13.93 | 110,183,378 | — | ||||||||||||
Notes:
| * | For repurchases made under the 2020 share repurchase program, the dollar value in this column is based on US$3.0 billion after the adjustment of repurchase authorization. |
| ** | The 2020 share repurchase program expired on March 17, 2024, and the repurchases since March 18, 2024 were made pursuant to the 2024 share repurchase program. |
192
Table of Contents
| Item 16F. | Change in Registrant’s Certifying Accountant |
Not applicable.
| Item 16G. | Corporate Governance |
As a Cayman Islands exempted company listed on Nasdaq, we are subject to the Nasdaq corporate governance listing standards. However, Nasdaq rules permit a foreign private issuer like us to follow the corporate governance practices of its home country. Certain corporate governance practices in the Cayman Islands, which is our home country, may differ significantly from the Nasdaq corporate governance listing standards. Currently, there are no significant differences between our corporate governance practices and those followed by U.S. domestic companies under Nasdaq Stock Market Rules. However, if we choose to follow other home country practice in the future, our shareholders may be afforded less protection than they otherwise would under the Nasdaq corporate governance listing standards applicable to U.S. domestic issuers. See “Item 3.D. Key Information—Risk Factors—Risks Related to Our ADSs and Class A Ordinary Shares—We are a foreign private issuer within the meaning of the rules under the Exchange Act, and as such we are exempt from certain provisions applicable to U.S. domestic public companies.”
| Item 16H. | Mine Safety Disclosure |
Not applicable.
| Item 16I. | Disclosure Regarding Foreign Jurisdictions that Prevent Inspections |
Not applicable.
| Item 16J. | Insider Trading Policies |
Not applicable.
| Item 16K. | Cybersecurity |
Risk Management and Strategy
We have implemented comprehensive cybersecurity risk assessment procedures that are integrated into our overall enterprise risk management system. These procedures aim to identify, assess, and manage potential and existing cybersecurity threats. We have a strong inhouse IT and cybersecurity department, led by our cybersecurity officer, that identifies, assesses, and manages cybersecurity risks on a daily basis. We have ensured that our employees have full access to the basic knowledge and principles of information security, established a sound responding process and disposal mechanism for system security, external attacks and violations, and safeguarded the confidentiality of information and data of the enterprise, employees and customers, making sure information and data can only be obtained and used when necessary.
193
Table of Contents
Besides, we engage external parties to conduct thorough assessments of our information systems. Our IT and cybersecurity department work closely with third-party service providers to ensure their compliance with our cybersecurity standards and to assess risks arising from our engagements with them. We strive to ensure the highest standards and procedures to protect data and information security for billions of consumers, millions of merchants, large multinational businesses, and government users. To guarantee the secure operation of large-scale online promotional shopping events, such as “618” and “11.11,” digital security is paramount to ensuring smooth business operations. We will continue to apply advance security technologies to ensure the safety of users, enterprises, and industries and contribute to the healthy development of the information security ecosystem.
As of the date of this annual report, we have not experienced any material cybersecurity incidents that have affected or are reasonably likely to affect us, our business strategy, results of operations, or financial condition. In 2023, we did not identify any violations of information security or privacy protection and did not receive any penalty for information security vulnerabilities or other network security breaches.
Governance
The ESG committee of our board of directors is responsible for overseeing risks related to cybersecurity. When appropriate, periodic reviews are held to discuss the landscape of cybersecurity, potential threats, and our preparedness for potential cybersecurity threats and risks to our company. In case a material cybersecurity occurs, the ESG committee is responsible for reviewing the information and issues involved, disclosures to be made, and the procedures followed. Our cybersecurity officer, who has over 10 years of experience as cybersecurity officer in large technology companies and extensive knowledge and skills in security products development, security risk management, and security compliance, is primarily responsible for assessing and managing cybersecurity risks and monitoring the prevention, detection, mitigation, and remediation of cybersecurity incidents. The cybersecurity officer reports to our chief compliance officer and provides periodic updates to our strategy execution committee and the ESG committee on any material cybersecurity incidents or material risks arising from cybersecurity threats.
PART III
| Item 17. | Financial Statements |
We have elected to provide financial statements pursuant to Item 18.
| Item 18. | Financial Statements |
The consolidated financial statements of JD.com, Inc., its subsidiaries and the consolidated variable interest entities are included at the end of this annual report.
194
Table of Contents
| Item 19. | Exhibits |
195
Table of Contents
196
Table of Contents
197
Table of Contents
198
Table of Contents
199
Table of Contents
200
Table of Contents
| * | Filed herewith |
| ** | Furnished herewith |
| † | Portions of this exhibit have been omitted pursuant to Rule 406 under the Securities Act. |
201
Table of Contents
SIGNATURES
The registrant hereby certifies that it meets all of the requirements for filing its annual report on Form 20-F and that it has duly caused and authorized the undersigned to sign this annual report on its behalf.
| JD.com, Inc. | ||
| By: |
/s/ Sandy Ran Xu | |
| Name: |
Sandy Ran Xu | |
| Title: |
Chief Executive Officer | |
Date: April 18, 2024
202
Table of Contents
Page(s) |
||||
F-2 ~ F-4 |
||||
F-5 ~ F-6 |
||||
F-7 ~ F-8 |
||||
F-9 ~ F-11 |
||||
F-12 ~ F-13 |
||||
F-14 ~ F-86 |
• |
With the assistance of our IT professionals, we: |
• |
Identified relevant IT systems used to process revenue transactions and tested the general IT controls over each of these IT systems, including testing of user access controls, change management controls, and data center & network operation controls. |
| • | Performed testing of relevant automated controls and interface controls of the relevant IT systems. |
• |
With the assistance of our data analytics specialists, we created data visualizations to analyze transactional revenue data for trends and reasonableness. |
| • | We tested relevant manual controls of the product revenues process. |
| • | We tested, on a sample basis, product revenues transactions, by agreeing the recorded revenues to supporting documents including but not limited to executed customer orders, product delivery evidence with acceptance by customers and cash collections to evaluate whether the revenues were properly recorded. |
| • | We performed substantive analytics procedures over product revenues by developing our own expected amounts based on cost of revenues data which is tested as part of our inventory substantive audit procedures. |
As of December 31, |
||||||||||||||||
Notes |
2022 |
2023 |
||||||||||||||
RMB |
RMB |
US$ Note 2(g) |
||||||||||||||
| (in millions, except share and per share data) | ||||||||||||||||
| ASSETS |
||||||||||||||||
| Current assets |
||||||||||||||||
| Cash and cash equivalents |
||||||||||||||||
| Restricted cash |
4, 5 | |||||||||||||||
| Short-term investments |
5 | |||||||||||||||
| Accounts receivable, net |
9 | |||||||||||||||
| Advance to suppliers |
||||||||||||||||
| Inventories, net |
10 | |||||||||||||||
| Prepayments and other current assets |
||||||||||||||||
| Amount due from related parties |
29 | |||||||||||||||
| Assets held for sale |
||||||||||||||||
| |
|
|
|
|
|
|||||||||||
| Total current assets |
||||||||||||||||
| Non-current assets |
||||||||||||||||
| Property, equipment and software, net |
11 | |||||||||||||||
| Construction in progress |
2(o | ) | ||||||||||||||
| Intangible assets, net |
13 | |||||||||||||||
| Land use rights, net |
12 | |||||||||||||||
| Operating lease right-of-use |
18 | |||||||||||||||
| Goodwill |
14 | |||||||||||||||
| Investment in equity investees |
8 | |||||||||||||||
| Marketable securities and other investments |
5 | |||||||||||||||
| Deferred tax assets |
21 | |||||||||||||||
| Other non-current assets |
||||||||||||||||
| |
|
|
|
|
|
|||||||||||
| Total non-current assets |
||||||||||||||||
| |
|
|
|
|
|
|||||||||||
| Total assets |
||||||||||||||||
| |
|
|
|
|
|
|||||||||||
As of December 31, |
||||||||||||||||
Notes |
2022 |
2023 |
||||||||||||||
RMB |
RMB |
US$ Note 2(g) |
||||||||||||||
| (in millions, except share and per share data) | ||||||||||||||||
| LIABILITIES |
||||||||||||||||
| Current liabilities |
||||||||||||||||
| Short-term debts |
32 | |||||||||||||||
| Accounts payable |
15 | |||||||||||||||
| Advance from customers |
||||||||||||||||
| Deferred revenues (including amounts in relation to traffic support, marketing and promotion services to be provided to related parties of RMB |
||||||||||||||||
| Taxes payable |
||||||||||||||||
| Amount due to related parties |
29 | |||||||||||||||
| Accrued expenses and other current liabilities |
16 | |||||||||||||||
| Operating lease liabilities |
18 | |||||||||||||||
| Liabilities held for sale |
||||||||||||||||
| |
|
|
|
|
|
|||||||||||
| Total current liabilities |
||||||||||||||||
| Non-current liabilities |
||||||||||||||||
| Deferred revenues (including amounts in relation to traffic support, marketing and promotion services to be provided to related parties of RMB |
||||||||||||||||
| Unsecured senior notes |
17 | |||||||||||||||
| Deferred tax liabilities |
21 | |||||||||||||||
| Long-term borrowings |
32 | |||||||||||||||
| Operating lease liabilities |
18 | |||||||||||||||
| Other non-current liabilities |
||||||||||||||||
| |
|
|
|
|
|
|||||||||||
| Total non-current liabilities |
||||||||||||||||
| |
|
|
|
|
|
|||||||||||
| Total liabilities |
||||||||||||||||
| |
|
|
|
|
|
|||||||||||
| Commitments and contingencies |
33 | |||||||||||||||
| MEZZANINE EQUITY |
||||||||||||||||
| SHAREHOLDERS’ EQUITY: |
||||||||||||||||
| JD.com, Inc. shareholders’ equity |
||||||||||||||||
| Ordinary shares (US$ |
23 | * | * | * | ||||||||||||
| Additional paid-in capital |
||||||||||||||||
| Statutory reserves |
2(oo | ) | ||||||||||||||
| Treasury stock |
( |
) | ( |
) | ( |
) | ||||||||||
| Retained earnings |
||||||||||||||||
| Accumulated other comprehensive income/( loss) |
26 | ( |
) | |||||||||||||
| |
|
|
|
|
|
|||||||||||
| Total JD.com, Inc. shareholders’ equity |
||||||||||||||||
| Non-controlling interests |
2(d | ) | ||||||||||||||
| |
|
|
|
|
|
|||||||||||
| Total shareholders’ equity |
||||||||||||||||
| |
|
|
|
|
|
|||||||||||
| Total liabilities, mezzanine equity and shareholders’ equity |
||||||||||||||||
| |
|
|
|
|
|
|||||||||||
| * | Absolute amount is less than RMB1 million. |
For the year ended December 31, |
||||||||||||||||||
Notes |
2021 |
2022 |
2023 |
|||||||||||||||
RMB |
RMB |
RMB |
US$ |
|||||||||||||||
Note 2(g) |
||||||||||||||||||
(in millions, except share and per share data) |
||||||||||||||||||
| Net revenues |
||||||||||||||||||
| Net product revenues |
2(z) | |||||||||||||||||
| Net service revenues |
2(z) | |||||||||||||||||
| |
|
|
|
|
|
|
|
|||||||||||
| Total net revenues |
||||||||||||||||||
| |
|
|
|
|
|
|
|
|||||||||||
| Cost of revenues |
( |
) | ( |
) | ( |
) | ( |
) | ||||||||||
| Fulfillment |
( |
) | ( |
) | ( |
) | ( |
) | ||||||||||
| Marketing |
( |
) | ( |
) | ( |
) | ( |
) | ||||||||||
| Research and development |
( |
) | ( |
) | ( |
) | ( |
) | ||||||||||
| General and administrative |
( |
) | ( |
) | ( |
) | ( |
) | ||||||||||
| Impairment of goodwill |
14 | — | — | ( |
) | ( |
) | |||||||||||
| Impairment of long-lived assets |
5 | — | — | ( |
) | ( |
) | |||||||||||
| Gain on sale of development properties |
19 | |||||||||||||||||
| |
|
|
|
|
|
|
|
|||||||||||
| Income from operations |
||||||||||||||||||
| |
|
|
|
|
|
|
|
|||||||||||
| Other income/(expense) |
||||||||||||||||||
| Share of results of equity investees |
8 | ( |
) | ( |
) | |||||||||||||
| Interest expense |
( |
) | ( |
) | ( |
) | ( |
) | ||||||||||
| Others, net |
20 | ( |
) | ( |
) | |||||||||||||
| |
|
|
|
|
|
|
|
|||||||||||
| Income/(loss) before tax |
( |
) | ||||||||||||||||
| Income tax expenses |
21 | ( |
) | ( |
) | ( |
) | ( |
) | |||||||||
| |
|
|
|
|
|
|
|
|||||||||||
| Net income/(loss) |
( |
) | ||||||||||||||||
| |
|
|
|
|
|
|
|
|||||||||||
| Net loss attributable to non-controlling interests shareholders |
( |
) | ( |
) | ( |
) | ( |
) | ||||||||||
| Net income attributable to mezzanine equity classified as non-controlling interests shareholders |
— | — | ||||||||||||||||
| |
|
|
|
|
|
|
|
|||||||||||
| Net income/(loss) attributable to the Company’s ordinary shareholders |
( |
) | ||||||||||||||||
| |
|
|
|
|
|
|
|
|||||||||||
For the year ended December 31, |
||||||||||||||||||||
Notes |
2021 |
2022 |
2023 |
|||||||||||||||||
RMB |
RMB |
RMB |
US$ |
|||||||||||||||||
Note 2(g) |
||||||||||||||||||||
| (in millions, except share and per share data) | ||||||||||||||||||||
| Net income/(loss) |
( |
) | ||||||||||||||||||
| Other comprehensive income/(loss): |
26 | |||||||||||||||||||
| Foreign currency translation adjustments |
( |
) | ||||||||||||||||||
| |
|
|
|
|
|
|
|
|||||||||||||
| Total other comprehensive income/(loss) |
( |
) | ||||||||||||||||||
| |
|
|
|
|
|
|
|
|||||||||||||
| Total comprehensive income/(loss) |
( |
) | ||||||||||||||||||
| Total comprehensive income/(loss) attributable to non-controlling interests shareholders |
( |
) | ( |
) |
( |
) | ||||||||||||||
| Total comprehensive income attributable to mezzanine equity classified as non-controlling interests shareholders |
— | — | ||||||||||||||||||
| |
|
|
|
|
|
|
|
|||||||||||||
| Total comprehensive income/(loss) attributable to the Company’s ordinary shareholders |
( |
) | ||||||||||||||||||
| |
|
|
|
|
|
|
|
|||||||||||||
| Net income/(loss) per share |
28 | |||||||||||||||||||
| Basic |
( |
) | ||||||||||||||||||
| Diluted |
( |
) | ||||||||||||||||||
| Weighted average number of shares |
||||||||||||||||||||
| Basic |
||||||||||||||||||||
| Diluted |
||||||||||||||||||||
For the year ended December 31, |
||||||||||||||||
2021 |
2022 |
2023 |
||||||||||||||
RMB |
RMB |
RMB |
US$ |
|||||||||||||
Note 2(g) |
||||||||||||||||
(in millions) |
||||||||||||||||
| Cash flows from operating activities: |
||||||||||||||||
| Net income/(loss) |
( |
) | ||||||||||||||
| Adjustments to reconcile net income/(loss) to net cash provided by operating activities: |
||||||||||||||||
| Depreciation and amortization |
||||||||||||||||
| Share-based compensation |
||||||||||||||||
| Losses from disposal of property, equipment and software |
||||||||||||||||
| Gain from extinguishment of debt |
— | ( |
) | — | — | |||||||||||
| Deferred income tax |
( |
) | ( |
) | ||||||||||||
| Amortization of discounts and issuance costs of the unsecured senior notes |
||||||||||||||||
| Impairment of goodwill |
— | — | ||||||||||||||
| Impairment of long-lived assets |
— | — | ||||||||||||||
| Allowance for doubtful accounts |
||||||||||||||||
| Impairment of investments |
||||||||||||||||
| Fair value change of long-term investments |
||||||||||||||||
| (Gains)/losses from acquirements or disposals of business and investment |
( |
) | ( |
) | ( |
) | ||||||||||
| Gain on sale of development properties |
( |
) | ( |
) | ( |
) | ( |
) | ||||||||
| Share of results of equity investees |
( |
) | ( |
) | ||||||||||||
| Foreign exchange (gains)/losses |
( |
) | ( |
) | ||||||||||||
| Changes in operating assets and liabilities: |
||||||||||||||||
| Accounts receivable |
( |
) | ( |
) | ( |
) | ( |
) | ||||||||
| Advance to suppliers |
( |
) | ||||||||||||||
| Inventories |
( |
) | ( |
) | ||||||||||||
| Prepayments and other current assets |
( |
) | ( |
) | ||||||||||||
| Amount due from related parties |
( |
) | ( |
) | ( |
) | ||||||||||
| Operating lease right-of-use |
( |
) | ( |
) | ( |
) | ( |
) | ||||||||
| Other non-current assets |
( |
) | ||||||||||||||
| Accounts payable |
||||||||||||||||
| Advance from customers |
( |
) | ( |
) | ||||||||||||
| Deferred revenues |
( |
) | ( |
) | ( |
) | ( |
) | ||||||||
| Taxes payable |
( |
) | ||||||||||||||
| Amount due to related parties |
( |
) | ||||||||||||||
| Accrued expenses and other current liabilities |
||||||||||||||||
| Operating lease liabilities |
||||||||||||||||
| Other non-current liabilities |
( |
) | ( |
) | ||||||||||||
| |
|
|
|
|
|
|
|
|||||||||
| Net cash provided by operating activities |
||||||||||||||||
| |
|
|
|
|
|
|
|
|||||||||
For the year ended December 31, |
||||||||||||||||
2021 |
2022 |
2023 |
||||||||||||||
RMB |
RMB |
RMB |
US$ |
|||||||||||||
Note 2(g) |
||||||||||||||||
(in millions) |
||||||||||||||||
| Cash flows from investing activities: |
||||||||||||||||
| Purchase of short-term investments |
( |
) | ( |
) | ( |
) | ( |
) | ||||||||
| Maturity of short-term investments |
||||||||||||||||
| Purchases of long-term time deposits and wealth management products |
( |
) | ( |
) | ( |
) | ( |
) | ||||||||
| Maturity of long-term time deposits and wealth management products |
— | — | — | |||||||||||||
| Purchases of investment securities |
( |
) | — | — | — | |||||||||||
| Cash received from disposal of investment securities |
||||||||||||||||
| Prepayments and investments in equity investees |
( |
) | ( |
) | ( |
) | ( |
) | ||||||||
| Cash received from disposal of equity investments |
||||||||||||||||
| Cash paid for loan originations |
( |
) | ( |
) | ( |
) | ( |
) | ||||||||
| Cash received from loan repayments |
||||||||||||||||
| Purchase of property, equipment and software |
( |
) | ( |
) | ( |
) | ( |
) | ||||||||
| Disposal of equipment and other assets |
||||||||||||||||
| Purchase of intangible assets |
( |
) | ( |
) | ( |
) | — | |||||||||
| Cash paid for asset acquisitions, net of cash acquired |
( |
) | ( |
) | ( |
) | ( |
) | ||||||||
| Purchase of land use rights |
( |
) | ( |
) | ( |
) | ( |
) | ||||||||
| Cash paid for construction in progress |
( |
) | ( |
) | ( |
) | ( |
) | ||||||||
| Cash received from sale of development properties |
||||||||||||||||
| Cash paid for business combinations, net of cash acquired |
( |
) | ( |
) | — | — | ||||||||||
| Loans settled by/(provided to) JD Technology |
( |
) | ( |
) | ||||||||||||
| Other investing activities |
( |
) | ( |
) | ( |
) | ||||||||||
| |
|
|
|
|
|
|
|
|||||||||
| Net cash used in investing activities |
( |
) | ( |
) | ( |
) | ( |
) | ||||||||
| |
|
|
|
|
|
|
|
|||||||||
For the year ended December 31, |
||||||||||||||||
2021 |
2022 |
2023 |
||||||||||||||
RMB |
RMB |
RMB |
US$ |
|||||||||||||
Note 2(g) |
||||||||||||||||
(in millions) |
||||||||||||||||
| Cash flows from financing activities: |
||||||||||||||||
| Repurchase of ordinary shares |
( |
) | ( |
) | ( |
) | ( |
) | ||||||||
| Proceeds from issuance of ordinary shares pursuant to share-based awards |
||||||||||||||||
| Cash paid for dividends |
— | ( |
) | ( |
) | ( |
) | |||||||||
| Capital injection from non-controlling interest shareholders |
||||||||||||||||
| Return of capital to non-controlling interests |
( |
) | ( |
) | — | — | ||||||||||
| Acquisition of additional equity interests in non-wholly owned subsidiaries |
( |
) | ( |
) | ( |
) | ( |
) | ||||||||
| Proceeds from short-term borrowings |
||||||||||||||||
| Repayment of short-term borrowings |
( |
) | ( |
) | ( |
) | ( |
) | ||||||||
| Proceeds from long-term borrowings |
— | |||||||||||||||
| Repayment of long-term borrowings |
( |
) | ( |
) | ( |
) | ( |
) | ||||||||
| Repurchase and repayment of unsecured senior notes |
( |
) | ( |
) | — | — | ||||||||||
| Other financing activities |
( |
) | ( |
) | ( |
) | ( |
) | ||||||||
| |
|
|
|
|
|
|
|
|||||||||
| Net cash provided by /(used in) financing activities |
( |
) | ( |
) | ||||||||||||
| |
|
|
|
|
|
|
|
|||||||||
| Effect of exchange rate changes on cash, cash equivalents, and restricted cash |
( |
) | ||||||||||||||
| |
|
|
|
|
|
|
|
|||||||||
| Net increase/(decrease) in cash, cash equivalents, and restricted cash |
( |
) | ( |
) | ( |
) | ||||||||||
| Cash, cash equivalents, and restricted cash at beginning of year, including cash and cash equivalents classified within assets held for sale |
||||||||||||||||
| Less: cash, cash equivalents, and restricted cash classified within assets held for sale at beginning of year |
— | |||||||||||||||
| |
|
|
|
|
|
|
|
|||||||||
| Cash, cash equivalents, and restricted cash at beginning of year |
||||||||||||||||
| |
|
|
|
|
|
|
|
|||||||||
| Cash, cash equivalents, and restricted cash at end of year, including cash and cash equivalents classified within assets held for sale |
||||||||||||||||
| Less: cash, cash equivalents, and restricted cash classified within assets held for sale at end of year |
— | |||||||||||||||
| |
|
|
|
|
|
|
|
|||||||||
| Cash, cash equivalents, and restricted cash at end of year |
||||||||||||||||
| |
|
|
|
|
|
|
|
|||||||||
| Supplemental disclosure of cash flow information: |
||||||||||||||||
| Cash paid for income taxes |
( |
) | ( |
) | ( |
) | ( |
) | ||||||||
| Cash paid for interest |
( |
) | ( |
) | ( |
) | ( |
) | ||||||||
| Supplemental disclosures of non-cash investing and financing activities: |
||||||||||||||||
| Issuance of ordinary shares in connection with strategic cooperation agreement with Tencent |
||||||||||||||||
| Right-of-use |
||||||||||||||||
| Acquisition of equity interest in Dada by strategic resources |
— | |||||||||||||||
Ordinary shares |
Treasury stock |
Additional paid-in capital |
Statutory reserves |
Accumulated other comprehensive income/(loss) |
Retained earnings |
Non- controlling interests |
Total shareholders’ equity |
|||||||||||||||||||||||||||||||||
Shares |
Amount |
Shares |
Amount |
|||||||||||||||||||||||||||||||||||||
RMB |
RMB |
RMB |
RMB |
RMB |
RMB |
RMB |
RMB |
|||||||||||||||||||||||||||||||||
(in millions, except share data) |
||||||||||||||||||||||||||||||||||||||||
| Balance as of December 31, 2020 |
* | ( |
) | ( |
) | ( |
) | |||||||||||||||||||||||||||||||||
| |
|
|
|
|
|
|
|
|
|
|
|
|
|
|
|
|
|
|
|
|||||||||||||||||||||
| Issuance of ordinary shares |
* | — | — | — | — | — | — | |||||||||||||||||||||||||||||||||
| Issuance of Class A ordinary shares reserved for future exercise/vesting of share-based awards |
* | ( |
) | * | — | — | — | — | — | — | ||||||||||||||||||||||||||||||
| Repurchase of ordinary shares |
— | — | ( |
) | ( |
) | — | — | — | — | — | ( |
) | |||||||||||||||||||||||||||
| Accretion of convertible redeemable non-controlling interests |
— | — | — | — | — | — | — | ( |
) | — | ( |
) | ||||||||||||||||||||||||||||
| Exercise of share-based awards |
— | — | ( |
) | — | — | — | ( |
) | |||||||||||||||||||||||||||||||
| Share-based compensation and vesting of share-based awards |
— | — | — | — | — | |||||||||||||||||||||||||||||||||||
| Net loss |
— | — | — | — | — | — | — | ( |
) | ( |
) | ( |
) | |||||||||||||||||||||||||||
| Foreign currency translation adjustments |
— | — | — | — | — | — | ( |
) | — | ( |
) | ( |
) | |||||||||||||||||||||||||||
| Statutory reserves |
— | — | — | — | — | — | ( |
) | — | — | ||||||||||||||||||||||||||||||
| Change of the capital from non-controlling interest shareholders |
— | — | — | — | — | — | — | |||||||||||||||||||||||||||||||||
| Conversion of JD Logistics preferred shares |
— | — | — | — | — | — | — | |||||||||||||||||||||||||||||||||
| Reorganization of JD Cloud & AI (Note 6, Note 8) |
— | — | — | — | ( |
) | — | — | — | — | ( |
) | ||||||||||||||||||||||||||||
| Acquisition of subsidiaries |
— | — | — | — | — | — | — | |||||||||||||||||||||||||||||||||
| Share of changes in the equity investee’s capital accounts |
— | — | — | — | ( |
) | — | — | — | — | ( |
) | ||||||||||||||||||||||||||||
| |
|
|
|
|
|
|
|
|
|
|
|
|
|
|
|
|
|
|
|
|||||||||||||||||||||
| Balance as of December 31, 2021 |
* | ( |
) | ( |
) | ( |
) | |||||||||||||||||||||||||||||||||
| |
|
|
|
|
|
|
|
|
|
|
|
|
|
|
|
|
|
|
|
|||||||||||||||||||||
| Issuance of ordinary shares |
* | — | — | — | — | — | — | |||||||||||||||||||||||||||||||||
| Issuance of Class A ordinary shares reserved for future exercise/vesting of share-based awards |
* | ( |
) | * | — | — | — | — | — | — | ||||||||||||||||||||||||||||||
| Dividends |
— | — | — | — | — | — | — | ( |
) | — | ( |
) | ||||||||||||||||||||||||||||
| Repurchase of ordinary shares |
— | — | ( |
) | ( |
) | — | — | — | — | — | ( |
) | |||||||||||||||||||||||||||
| Accretion of convertible redeemable non-controlling interests |
— | — | — | — | — | — | — | ( |
) | — | ( |
) | ||||||||||||||||||||||||||||
| Exercise of share-based awards |
— | — | — | — | — | |||||||||||||||||||||||||||||||||||
| Share-based compensation and vesting of share-based awards |
— | — | — | — | — | |||||||||||||||||||||||||||||||||||
| Net income/(loss) |
— | — | — | — | — | — | — | ( |
) | |||||||||||||||||||||||||||||||
| Foreign currency translation adjustments |
— | — | — | — | — | — | — | |||||||||||||||||||||||||||||||||
| Statutory reserves |
— | — | — | — | — | — | ( |
) | — | — | ||||||||||||||||||||||||||||||
| Change of the capital from non-controlling interest shareholders |
— | — | — | — | ( |
) | — | — | — | |||||||||||||||||||||||||||||||
| Acquisition of subsidiaries and assets |
— | — | — | — | — | — | — | — | ||||||||||||||||||||||||||||||||
| Disposal of subsidiaries |
— | — | — | — | ( |
) | — | — | — | ( |
) | ( |
) | |||||||||||||||||||||||||||
| Share of changes in the equity investee’s capital accounts |
— | — | — | — | ( |
) | — | — | — | — | ( |
) | ||||||||||||||||||||||||||||
| |
|
|
|
|
|
|
|
|
|
|
|
|
|
|
|
|
|
|
|
|||||||||||||||||||||
| Balance as of December 31, 2022 |
* | ( |
) | ( |
) | ( |
) | |||||||||||||||||||||||||||||||||
| |
|
|
|
|
|
|
|
|
|
|
|
|
|
|
|
|
|
|
|
|||||||||||||||||||||
| * | Absolute amount is less than RMB1 million. |
Ordinary shares |
Treasury stock |
Additional paid-in capital |
Statutory reserves |
Accumulated other comprehensive income/(loss) |
Retained earnings |
Non-controlling interests |
Total shareholders’ equity |
|||||||||||||||||||||||||||||||||
Shares |
Amount |
Shares |
Amount |
|||||||||||||||||||||||||||||||||||||
RMB |
RMB |
RMB |
RMB |
RMB |
RMB |
RMB |
RMB |
|||||||||||||||||||||||||||||||||
(in millions, except share data) |
||||||||||||||||||||||||||||||||||||||||
| Balance as of December 31, 2022 |
* | ( |
) | ( |
) | ( |
) | |||||||||||||||||||||||||||||||||
| |
|
|
|
|
|
|
|
|
|
|
|
|
|
|
|
|
|
|
|
|||||||||||||||||||||
| Issuance of ordinary shares |
* | — | — | — | — | — | — | |||||||||||||||||||||||||||||||||
| Dividends |
— | — | — | — | — | — | — | ( |
) | — | ( |
) | ||||||||||||||||||||||||||||
| Repurchase of ordinary shares |
— | — | ( |
) | ( |
) | — | — | — | — | — | ( |
) | |||||||||||||||||||||||||||
| Exercise of share-based awards |
— | — | ( |
) | — | — | — | — | ||||||||||||||||||||||||||||||||
| Share-based compensation and vesting of share-based awards |
— | — | — | — | — | |||||||||||||||||||||||||||||||||||
| Net income/(loss) |
— | — | — | — | — | — | — | ( |
) | |||||||||||||||||||||||||||||||
| Translation adjustments and hedge of net investments in foreign operations, net of tax |
— | — | — | — | — | — | — | ( |
) | |||||||||||||||||||||||||||||||
| Statutory reserves |
— | — | — | — | — | — | ( |
) | — | — | ||||||||||||||||||||||||||||||
| Change of the capital from non-controlling interest shareholders |
— | — | — | — | ( |
) | — | — | — | |||||||||||||||||||||||||||||||
| |
|
|||||||||||||||||||||||||||||||||||||||
| Share of changes in the equity investee’s capital accounts |
— | — | — | — | — | — | — | — | ||||||||||||||||||||||||||||||||
| |
|
|
|
|
|
|
|
|
|
|
|
|
|
|
|
|
|
|
|
|||||||||||||||||||||
| Balance as of December 31, 2023 |
* | ( |
) | ( |
) | |||||||||||||||||||||||||||||||||||
| |
|
|
|
|
|
|
|
|
|
|
|
|
|
|
|
|
|
|
|
|||||||||||||||||||||
| * | Absolute amount is less than RMB1 million. |
1. |
Principal activities and organization |
1. |
Principal activities and organization (Continued) |
Equity interest held |
Place and date of incorporation | |||
Subsidiaries |
||||
Beijing Jingdong Century Trade Co., Ltd. (“Jingdong Century”) |
Beijing, China, April 2007 | |||
Jiangsu Jingdong Information Technology Co., Ltd. |
Jiangsu, China, June 2009 | |||
Shanghai Shengdayuan Information Technology Co., Ltd. (“Shanghai Shengdayuan”) |
Shanghai, China, April 2011 | |||
JD Logistics Holding Limited |
Hong Kong, China, August 2011 | |||
Jingdong Technology Group Corporation |
Cayman Islands, November 2011 | |||
JINGDONG Property, Inc. |
Cayman Islands, January 2012 | |||
JD Logistics, Inc. |
Cayman Islands, January 2012 | |||
Jingdong E-Commerce (Trade) Hong Kong Co., Ltd. |
Hong Kong, China, February 2012 | |||
JD.com International Limited |
Hong Kong, China, February 2012 | |||
Beijing Jingdong Shangke Information Technology Co., Ltd. (“Beijing Shangke”) |
Beijing, China, March 2012 | |||
Chongqing Jingdong Haijia E-commerce Co., Ltd. (“Chongqing Haijia”) |
Chongqing, China, June 2014 | |||
JD.com Investment Limited |
British Virgin Islands, January 2015 | |||
JD Asia Development Limited |
British Virgin Islands, February 2015 | |||
Suqian Hanbang Investment Management Co., Ltd. |
Jiangsu, China, January 2016 | |||
Xi’an Jingxundi Supply Chain Technology Co., Ltd. (“Xi’an Jingxundi”) |
Shaanxi, China, May 2017 | |||
JD Assets Holding Limited |
Cayman Islands, March 2018 | |||
JD Property Holding Limited |
Cayman Islands, March 2018 | |||
Beijing Wodong Tianjun Information Technology Co., Ltd. (“Beijing Wodong Tianjun”) |
Beijing, China, May 2018 | |||
JD Health International Inc. |
Cayman Islands, November 2018 | |||
JD Jiankang Limited |
British Virgin Islands, April 2019 | |||
JD Industrial Technology Limited |
British Virgin Islands, October 2019 | |||
JINGDONG Industrials, Inc. |
Cayman Islands, November 2019 | |||
Jingdong Logistics Supply Chain Co., Ltd. |
Jiangsu, China, June 2020 | |||
Jiangsu Huiji Space Technology Co., Ltd. (“Jiangsu Huiji”) |
Jiangsu, China, March 2019 | |||
JD Sunflower Investment Limited |
British Virgin Islands, February 2016 | |||
Windcreek Limited |
British Virgin Islands, January 2016 | |||
Dada Nexus Limited (“Dada”) |
Cayman Islands, July 2014 | |||
Consolidated VIEs |
||||
Beijing Jingdong 360 Degree E-commerce Co., Ltd. (“Jingdong 360”) |
Beijing, China, April 2007 | |||
Jiangsu Yuanzhou E-commerce Co., Ltd. (“Jiangsu Yuanzhou”) |
Jiangsu, China, September 2010 | |||
Jiangsu Jingdong Bangneng Investment Management Co., Ltd. (“Jingdong Bangneng”) |
Jiangsu, China, August 2015 | |||
Xi’an Jingdong Xincheng Information Technology Co., Ltd. (“Xi’an Jingdong Xincheng”) |
Shaanxi, China, June 2017 | |||
Suqian Juhe Digital Enterprise Management Co., Ltd. (“Suqian Juhe”) |
Jiangsu, China, June 2020 | |||
Consolidated VIEs’ Subsidiaries |
||||
Beijing Jingbangda Trade Co., Ltd. (“Beijing Jingbangda”) |
Beijing, China, August 2012 | |||
1. |
Principal activities and organization (Continued) |
• |
Organization |
• |
Consolidated variable interest entities |
• |
Loan agreements |
1. |
Principal activities and organization (Continued) |
• |
Exclusive purchase option agreements |
• |
Exclusive technology consulting and services agreements or exclusive business cooperation agreements |
• |
Equity pledge agreements |
1. |
Principal activities and organization (Continued) |
• |
Powers of attorney |
• |
Business operation agreements |
• |
Risks in relations to the VIE structure |
1. |
Principal activities and organization (Continued) |
As of December 31, |
||||||||
2022 |
2023 |
|||||||
(RMB in millions) |
||||||||
| Total assets |
||||||||
| Total liabilities |
||||||||
For the year ended December 31, |
||||||||||||
2021 |
2022 |
2023 |
||||||||||
(RMB in millions) |
||||||||||||
| Total net revenues |
||||||||||||
| Net income/(loss) |
( |
) | ||||||||||
For the year ended December 31, |
||||||||||||
2021 |
2022 |
2023 |
||||||||||
(RMB in millions) |
||||||||||||
| Net cash provided by operating activities |
||||||||||||
| Net cash provided by/(used in) investing activities |
( |
) | ( |
) | ||||||||
| Net cash provided by/(used in) financing activities |
( |
) | ( |
) | ||||||||
| |
|
|
|
|
|
|||||||
| Net increase/(decrease) in cash, cash equivalents, and restricted cash |
( |
) | ||||||||||
| Cash, cash equivalents, and restricted cash at beginning of year |
||||||||||||
| |
|
|
|
|
|
|||||||
| Cash, cash equivalents, and restricted cash at end of year |
||||||||||||
| |
|
|
|
|
|
|||||||
1. |
Principal activities and organization (Continued) |
2. |
Summary of significant accounting policies |
2. |
Summary of significant accounting policies (Continued) |
2. |
Summary of significant accounting policies (Continued) |
2. |
Summary of significant accounting policies (Continued) |
| Category |
Estimated useful lives | |
| Electronic equipment |
||
| Office equipment |
||
| Vehicles |
||
| Logistics, warehouse and other heavy equipment |
||
| Leasehold improvement |
Over the shorter of the expected life of leasehold improvements or the lease term | |
| Software |
||
| Land |
||
| Building |
||
| Building improvement |
2. |
Summary of significant accounting policies (Continued) |
| Category |
Estimated useful lives | |
Non-compete |
||
| Domain names and trademarks | ||
| Customer relationship | ||
| Technology and others |
2. |
Summary of significant accounting policies (Continued) |
2. |
Summary of significant accounting policies (Continued) |
2. |
Summary of significant accounting policies (Continued) |
2. |
Summary of significant accounting policies (Continued) |
2. |
Summary of significant accounting policies (Continued) |
2. |
Summary of significant accounting policies (Continued) |
2. |
Summary of significant accounting policies (Continued) |
• |
D Coupons are given to a customer upon current purchase or can be given for free to promote future purchases. This coupon requires the customer to make future purchase of a minimum value in order to enjoy the value provided by the coupon. The rights to purchase discounted products in the future does not represent a material rights to the customer. The Group assesses the significance of the discount by considering its percentage of the total future minimum purchase value, historical usage pattern by the customers and relative outstanding volume and monetary value of D Coupons compared to the other discounts offered by the Group. D Coupons are accounted for as a reduction of revenues on the future purchase. |
• |
J Coupons are given to a customer upon their qualified purchase or can be given for free to promote future purchases and are to be used on a future purchase, with no limitation as to the minimum value of the future purchase. Accordingly, the Group has determined that J Coupons awarded are considered as a separate performance obligation within the scope of ASC 606, as J Coupons represent a material rights to the customer. Therefore, the delivered products and J Coupons awarded are treated as two distinct performance obligations identified in the contract. The total sales consideration is allocated based on management’s best estimate of the relative SSP of each performance obligation. The amount allocated to J Coupons is deferred and recognized when J Coupons are redeemed or at the coupon’s expiration, whichever occurs first. For the years ended December 31, 2021, 2022 and 2023, the amounts of expired J Coupons were not material. |
2. |
Summary of significant accounting policies (Continued) |
2. |
Summary of significant accounting policies (Continued) |
2. |
Summary of significant accounting policies (Continued) |
2. |
Summary of significant accounting policies (Continued) |
2. |
Summary of significant accounting policies (Continued) |
2. |
Summary of significant accounting policies (Continued) |
2. |
Summary of significant accounting policies (Continued) |
3. |
Concentration and risks |
4. |
Restricted cash |
5. |
Fair value measurement |
Fair value measurement at reporting date using |
||||||||||||||||
Description |
Fair Value as of December 31, 2022 |
Quoted Prices in Active Markets for Identical Assets (Level 1) |
Significant Other Observable Inputs (Level 2) |
Significant Unobservable Inputs (Level 3) |
||||||||||||
(RMB in millions) |
||||||||||||||||
| Assets: |
||||||||||||||||
| Restricted cash |
— | — | ||||||||||||||
| Short-term investments |
||||||||||||||||
| |
— | — | ||||||||||||||
| Marketable securities and other investments |
||||||||||||||||
| Listed equity securities |
— | — | ||||||||||||||
| Wealth management products |
— | — | ||||||||||||||
| |
|
|
|
|
|
|
|
|||||||||
| Total assets |
— | |||||||||||||||
| |
|
|
|
|
|
|
|
|||||||||
Fair value measurement at reporting date using |
||||||||||||||||
Description |
Fair Value as of December 31, 2023 |
Quoted Prices in Active Markets for Identical Assets (Level 1) |
Significant Other Observable Inputs (Level 2) |
Significant Unobservable Inputs (Level 3) |
||||||||||||
(RMB in millions) |
||||||||||||||||
| Assets: |
||||||||||||||||
| Restricted cash |
— | — | ||||||||||||||
| Short-term investments |
||||||||||||||||
| |
— | — | ||||||||||||||
| Marketable securities and other investments |
||||||||||||||||
| Listed equity securities |
— | — | ||||||||||||||
| Wealth management products |
— | — | ||||||||||||||
| |
|
|
|
|
|
|
|
|||||||||
| Total assets |
— | |||||||||||||||
| |
|
|
|
|
|
|
|
|||||||||
5. |
Fair value measurement (Continued) |
5. |
Fair value measurement (Continued) |
5. |
Fair value measurement (Continued) |
6. |
JD Technology reorganization |
7. |
Business acquisition |
Amounts |
||||
(RMB in millions) |
||||
Cash |
||||
Business cooperation agreement as consideration of the acquisition |
||||
Fair value of previously held equity interests |
||||
Total |
||||
Amounts |
||||
(RMB in millions) |
||||
Net assets acquired |
||||
Newly identified and appreciation of intangible assets |
||||
- Trademarks and domain names |
||||
- Technology |
||||
- Relationship with riders |
||||
- Consumer base |
||||
Premium not reflected in goodwill |
||||
Goodwill |
||||
Deferred tax liabilities |
( |
) | ||
Non-controlling interests |
( |
) | ||
Total |
||||
7. |
Business acquisition (Continued) |
Amounts |
||||
(RMB in millions) |
||||
Cash |
||||
Fair value of previously held equity interests |
||||
Total |
||||
Amounts |
||||
(RMB in millions) |
||||
Net assets acquired |
||||
Appreciation of property, equipment and software, construction in progress and land use rights |
||||
Goodwill |
||||
Deferred tax liabilities |
( |
) | ||
Non-controlling interests |
( |
) | ||
Total |
||||
7. |
Business acquisition (Continued) |
Amounts |
||||
(RMB in millions) |
||||
| Cash |
||||
Amounts |
||||
(RMB in millions) |
||||
| Net assets acquired |
||||
| Newly identified and appreciation of intangible assets |
||||
| - Trademarks and domain names |
||||
| - Technology |
||||
| - Customer relationships |
||||
| Appreciation of construction in progress and land use rights |
||||
| Goodwill |
||||
| Deferred tax liabilities |
( |
) | ||
| Non-controlling interests |
( |
) | ||
| |
|
|||
| Total |
||||
| |
|
|||
7. |
Business acquisition (Continued) |
8. |
Investment in equity investees |
As of December 31, |
||||||||
2022 |
2023 |
|||||||
(RMB in millions) |
||||||||
| Carrying value of investment in Yonghui’s ordinary shares |
||||||||
| Proportionate share of Yonghui’s net tangible and intangible assets |
||||||||
| |
|
|
|
|||||
| Positive basis difference |
||||||||
| |
|
|
|
|||||
| Positive basis difference has been assigned to: |
||||||||
| Goodwill(*) |
||||||||
| Amortizable intangible assets (**) |
||||||||
| Deferred tax liabilities |
( |
) | ( |
) | ||||
| |
|
|
|
|||||
| |
|
|
|
|||||
| (*) | In the third quarter of 2021 and fourth quarter of 2023, the Group conducted impairment assessments on its investment in Yonghui considering the duration and severity of the decline of Yonghui’s stock price after the investment, and concluded the decline in fair value of the investment was other-than-temporary. Accordingly, the Group recorded impairment charges of RMB |
| (**) | As of December 31, 2023, the weighted average remaining life of the amortizable intangible assets not included in Yonghui’s consolidated financial statements was |
8. |
Investment in equity investees (Continued) |
8. |
Investment in equity investees (Continued) |
As of December 31, |
||||||||
2022 |
2023 |
|||||||
(RMB in millions) |
||||||||
| Carrying value of investment in ATRenew’s ordinary shares |
||||||||
| Proportionate share of ATRenew’s net tangible and intangible assets |
||||||||
| |
|
|
|
|||||
| N egative basis difference |
( |
) | ( |
) | ||||
| |
|
|
|
|||||
| Negative basis difference has been assigned to: |
||||||||
| Amortizable intangible assets (**) |
( |
) | ( |
) | ||||
| Deferred tax liabilities |
( |
) | ( |
) | ||||
| |
|
|
|
|||||
| ( |
) | ( |
) | |||||
| |
|
|
|
|||||
| (*) | In the fourth quarter of 2021 and the second quarter of 2022, the Group conducted impairment assessments on its investment in ATRenew considering the duration and severity of the decline of ATRenew’s stock price after the investment, and concluded the decline in fair value of the investment was other-than-temporary. Accordingly, the Group recorded impairment charges of RMB |
| (**) | As of December 31, 2023, the negative basis difference between carrying value of investment in ATRenew and proportionate share of ATRenew’s net tangible and intangible assets was RMB |
8. |
Investment in equity investees (Continued) |
For the year ended December 31, |
||||||||||||
2021 |
2022 |
2023 |
||||||||||
(RMB in millions) |
||||||||||||
| Revenues |
||||||||||||
| Gross profit |
||||||||||||
| Income/(loss) from operations |
( |
) | ( |
) | ||||||||
| Net loss |
( |
) | ( |
) | ( |
) | ||||||
| Net income/(loss) attributable to the investees’ ordinary shareholders |
( |
) | ( |
) | ||||||||
As of December 31, |
||||||||
2022 |
2023 |
|||||||
(RMB in millions) |
||||||||
| Current assets |
||||||||
| Non-current assets |
||||||||
| Current liabilities |
||||||||
| Non-current liabilities |
||||||||
| Non-controlling interests |
||||||||
9. |
Accounts receivable, net |
As of December 31, |
||||||||
2022 |
2023 |
|||||||
(RMB in millions) |
||||||||
| Logistics receivables |
||||||||
| Online retail and online marketplace receivables (*) |
||||||||
| Advertising receivables and others |
||||||||
| |
|
|
|
|||||
| Accounts receivable |
||||||||
| Allowance for doubtful accounts |
( |
) | ( |
) | ||||
| |
|
|
|
|||||
| Accounts receivable, net |
||||||||
| |
|
|
|
|||||
For the year ended December 31, |
||||||||||||
2021 |
2022 |
2023 |
||||||||||
(RMB in millions) |
||||||||||||
| Balance at beginning of the year |
( |
) | ( |
) | ( |
) | ||||||
| Additions |
( |
) | ( |
) | ( |
) | ||||||
| Write-off |
||||||||||||
| |
|
|
|
|
|
|||||||
| Balance at end of the year |
( |
) | ( |
) | ( |
) | ||||||
| |
|
|
|
|
|
|||||||
| (*) | The accounts receivable in relation to consumer financing business is included in online retail and online marketplace receivables. As JD Technology performs credit risk assessment services for the individuals and purchases the past-due receivables from the Group at carrying values to absorb the risks and obtain the returns from such financing arrangements for doubtful accounts in relation to consumer financing receivables was provided. |
10. |
Inventories, net |
As of December 31, |
||||||||
2022 |
2023 |
|||||||
(RMB in millions) |
||||||||
| Products |
||||||||
| Packing materials and others |
||||||||
| |
|
|
|
|||||
| Inventories |
||||||||
| Inventory valuation allowance |
( |
) | ( |
) | ||||
| |
|
|
|
|||||
| Inventories, net |
||||||||
| |
|
|
|
|||||
11. |
Property, equipment and software, net |
As of December 31, |
||||||||
2022 |
2023 |
|||||||
(RMB in millions) |
||||||||
| Electronic equipment |
||||||||
| Land, building and building improvement |
||||||||
| Logistics, warehouse and other heavy equipment |
||||||||
| Vehicles |
||||||||
| Leasehold improvement |
||||||||
| Office equipment |
||||||||
| Software |
||||||||
| |
|
|
|
|||||
| Total |
||||||||
| Less: accumulated depreciation and impairment |
( |
) | ( |
) | ||||
| |
|
|
|
|||||
| Net book value |
||||||||
| |
|
|
|
|||||
12. |
Land use rights, net |
As of December 31, |
||||||||
2022 |
2023 |
|||||||
(RMB in millions) |
||||||||
| Land use rights |
||||||||
| Less: accumulated amortization and impairment |
( |
) | ( |
) | ||||
| |
|
|
|
|||||
| Net book value |
||||||||
| |
|
|
|
|||||
For the year ended December 31, |
||||||||||||||||||||||||
2024 |
2025 |
2026 |
2027 |
2028 |
2029 and thereafter |
|||||||||||||||||||
(RMB in millions) |
||||||||||||||||||||||||
| Amortization expenses |
||||||||||||||||||||||||
13. |
Intangible assets, net |
As of December 31, 2022 |
||||||||||||||||||||
Weighted- Average Amortization Period |
Gross Carrying Amount |
Accumulated Amortization |
Impairment Amount |
Net Carrying Amount |
||||||||||||||||
Year |
(RMB in millions) |
|||||||||||||||||||
| Non-compete |
( |
) | — | |||||||||||||||||
| Domain names and trademarks |
( |
) | ( |
) | ||||||||||||||||
| Customer relationship |
( |
) | ( |
) | ||||||||||||||||
| Technology and others |
( |
) | ( |
) | ||||||||||||||||
| |
|
|
|
|
|
|
|
|||||||||||||
| Total |
( |
) | ( |
) | ||||||||||||||||
| |
|
|
|
|
|
|
|
|||||||||||||
As of December 31, 2023 |
||||||||||||||||||||
Weighted- Average Amortization Period |
Gross Carrying Amount |
Accumulated Amortization |
Impairment Amount |
Net Carrying Amount |
||||||||||||||||
Year |
(RMB in millions) |
|||||||||||||||||||
| Non-compete |
( |
) | — | |||||||||||||||||
| Domain names and trademarks |
( |
) | ( |
) | ||||||||||||||||
| Customer relationship |
( |
) | ( |
) | ||||||||||||||||
| Technology and others |
( |
) | ( |
) | ||||||||||||||||
| |
|
|
|
|
|
|
|
|||||||||||||
| Total |
( |
) | ( |
) | ||||||||||||||||
| |
|
|
|
|
|
|
|
|||||||||||||
For the year ended December 31, |
||||||||||||||||||||||||
2024 |
2025 |
2026 |
2027 |
2028 |
2029 and thereafter |
|||||||||||||||||||
(RMB in millions) |
||||||||||||||||||||||||
| Amortization expenses |
||||||||||||||||||||||||
14. |
Goodwill |
JD Retail |
JD Logistics |
Dada |
New Businesses |
Total |
||||||||||||||||
(RMB in millions) |
||||||||||||||||||||
| Transaction in 2021 |
||||||||||||||||||||
| Additions |
— | — | — | |||||||||||||||||
| Balance as of December 31, 2021 |
||||||||||||||||||||
| Goodwill |
— | |||||||||||||||||||
| Accumulated impairment loss |
( |
) | — | — | ( |
) | ( |
) | ||||||||||||
| |
|
|
|
|
|
|
|
|
|
|||||||||||
| — | — | |||||||||||||||||||
| |
|
|
|
|
|
|
|
|
|
|||||||||||
| Transaction in 2022 |
||||||||||||||||||||
| Additions |
||||||||||||||||||||
| Disposal of a subsidiary |
( |
) | — | — | — | ( |
) | |||||||||||||
| Balance as of December 31, 2022 |
||||||||||||||||||||
| Goodwill |
||||||||||||||||||||
| Accumulated impairment loss |
( |
) | — | — | ( |
) | ( |
) | ||||||||||||
| |
|
|
|
|
|
|
|
|
|
|||||||||||
| |
|
|
|
|
|
|
|
|
|
|||||||||||
| Transaction in 2023 |
||||||||||||||||||||
| Impairment |
— | — | ( |
) | — | ( |
) | |||||||||||||
| Balance as of December 31, 2023 |
||||||||||||||||||||
| Goodwill |
||||||||||||||||||||
| Accumulated impairment loss |
( |
) | — | ( |
) |
( |
) | ( |
) | |||||||||||
| |
|
|
|
|
|
|
|
|
|
|||||||||||
| — | ||||||||||||||||||||
| |
|
|
|
|
|
|
|
|
|
|||||||||||
15. |
Accounts payable |
As of December 31, |
||||||||
2022 |
2023 |
|||||||
(RMB in millions) |
||||||||
| Vendor payable |
||||||||
| Shipping charges payable and others |
||||||||
| |
|
|
|
|||||
| Total |
||||||||
| |
|
|
|
|||||
16. |
Accrued expenses and other current liabilities |
As of December 31, |
||||||||
2022 |
2023 |
|||||||
(RMB in millions) |
||||||||
| Deposits |
||||||||
| Salary and welfare |
||||||||
| Accrued administrative expenses |
||||||||
| Professional fee |
||||||||
| Rental fee payable |
||||||||
| Liabilities for return allowances |
||||||||
| Vehicle fee |
||||||||
| Deferred consideration payables |
||||||||
| Internet data center fee |
||||||||
| Payable related to employees’ exercise of share-based awards |
||||||||
| Interest payable |
||||||||
| Others |
||||||||
| |
|
|
|
|||||
| Total |
||||||||
| |
|
|
|
|||||
17. |
Unsecured senior notes |
17. |
Unsecured senior notes (Continued) |
As of December 31, |
Effective interest rate |
|||||||||||
2022 |
2023 |
|||||||||||
(RMB in millions) |
||||||||||||
| US$ |
% | |||||||||||
| US$ |
% | |||||||||||
| US$ |
% | |||||||||||
| |
|
|
|
|||||||||
| Carrying value |
||||||||||||
| Unamortized discount and debt issuance costs |
||||||||||||
| |
|
|
|
|||||||||
| Total principal amounts of unsecured senior notes |
||||||||||||
| |
|
|
|
|||||||||
Principal amounts |
||||
(RMB in millions) |
||||
| Within 1 year |
||||
| Between 1 to 2 years |
||||
| Between 2 to 3 years |
||||
| Between 3 to 4 years |
||||
| Between 4 to 5 years |
||||
| Beyond 5 years |
||||
| |
|
|||
| Total |
||||
| |
|
|||
18. |
Leases |
As of December 31, |
||||||||
2022 |
2023 |
|||||||
(RMB in millions) |
||||||||
Operating lease ROU assets |
||||||||
Operating lease liabilities-current |
||||||||
Operating lease liabilities-non-current |
||||||||
Total operating lease liabilities |
||||||||
Weighted average remaining lease term |
||||||||
Weighted average discount rate |
% | % | ||||||
For the year ended December 31, |
||||||||||||
2021 |
2022 |
2023 |
||||||||||
(RMB in millions) |
||||||||||||
Operating lease cost |
||||||||||||
Short-term lease cost |
||||||||||||
Total |
||||||||||||
Cash paid for operating leases |
||||||||||||
As of December 31, 2023 |
||||
(RMB in millions) |
||||
2024 |
||||
2025 |
||||
2026 |
||||
2027 |
||||
2028 |
||||
2029 and thereafter |
||||
Total lease payments |
||||
Less: interest |
( |
) | ||
Present value of operating lease liabilities |
||||
19. |
Gain on sale of development properties |
19. |
Gain on sale of development properties (continued) |
20. |
Others, net |
For the year ended December 31, |
||||||||||||
2021 |
2022 |
2023 |
||||||||||
(RMB in millions) |
||||||||||||
| Losses from fair value change of long-term investments |
( |
) | ( |
) | ( |
) | ||||||
| Government financial incentives |
||||||||||||
| Interest income |
||||||||||||
| Gains/(losses) from acquirements or disposals of business es and investments |
( |
) | ||||||||||
| Impairment of investments |
( |
) | ( |
) | ( |
) | ||||||
| Foreign exchange gains/(losses), net |
( |
) | ||||||||||
| Others |
( |
) | ( |
) | ||||||||
| |
|
|
|
|
|
|||||||
| Total |
( |
) | ( |
) | ||||||||
| |
|
|
|
|
|
|||||||
21. |
Taxation |
a) |
Value added tax |
b) |
Income tax |
21. |
Taxation (Continued) |
b) |
Income tax (Continued) |
21. |
Taxation (Continued) |
b) |
Income tax (Continued) |
For the year ended December 31, |
||||||||||||
2021 |
2022 |
2023 |
||||||||||
(RMB in millions) |
||||||||||||
| Income/(loss) before tax |
||||||||||||
| Income from Chinese mainland operations |
||||||||||||
| Loss from non-Chinese mainland operations |
( |
) | ( |
) | ( |
) | ||||||
| |
|
|
|
|
|
|||||||
| Total income/(loss) before tax |
( |
) | ||||||||||
| |
|
|
|
|
|
|||||||
| Income tax benefits/(expenses) applicable to Chinese mainland operations |
||||||||||||
| Current income tax expenses |
( |
) | ( |
) | ( |
) | ||||||
| Deferred tax benefits |
||||||||||||
| |
|
|
|
|
|
|||||||
| Subtotal income tax expenses applicable to Chinese mainland operations |
( |
) | ( |
) | ( |
) | ||||||
| |
|
|
|
|
|
|||||||
| Income tax expenses applicable to non-Chinese mainland operations |
||||||||||||
| Current income tax expenses |
( |
) | ( |
) | ||||||||
| Deferred tax expenses |
( |
) | ( |
) | ||||||||
| |
|
|
|
|
|
|||||||
| Subtotal income tax expenses applicable to non-Chinese mainland operations |
( |
) | ( |
) | ||||||||
| |
|
|
|
|
|
|||||||
| Total income tax expenses |
( |
) | ( |
) | ( |
) | ||||||
| |
|
|
|
|
|
|||||||
For the year ended December 31, |
||||||||||||
2021 |
2022 |
2023 |
||||||||||
| Statutory income tax rate |
||||||||||||
| Tax effect of preferential tax rates and tax holiday |
( |
( |
||||||||||
| Tax effect of tax-exempt entities |
( |
|||||||||||
| Effect on tax rates in different tax jurisdiction |
( |
( |
( |
|||||||||
| Tax effect of non-deductible expenses |
( |
|||||||||||
| Tax effect of non-taxable income |
( |
( |
||||||||||
| Tax effect of Super Deduction and others |
( |
( |
||||||||||
| Changes in valuation allowance |
( |
|||||||||||
| Effect on withholding income tax |
||||||||||||
| |
|
|
|
|
|
|||||||
| Effective tax rates |
( |
|||||||||||
| |
|
|
|
|
|
|||||||
21. |
Taxation (Continued) |
b) |
Income tax (Continued) |
For the year ended December 31, |
||||||||||||
2021 |
2022 |
2023 |
||||||||||
| Tax holiday effect (RMB in millions) |
||||||||||||
| Effect of tax holiday on basic net income per share (RMB) |
||||||||||||
| Effect of tax holiday on diluted net income per share (RMB) |
||||||||||||
c) |
Deferred tax assets and deferred tax liabilities |
As of December 31, |
||||||||
2022 |
2023 |
|||||||
(RMB in millions) |
||||||||
| Deferred tax assets |
||||||||
| - Net operating loss carry forwards and others |
||||||||
| - Deferred revenues |
||||||||
| - Inventory valuation allowance |
||||||||
| - Allowance for doubtful accounts |
||||||||
| - Unrealized fair value losses for certain investments |
||||||||
| Less: valuation allowance |
( |
) | ( |
) | ||||
| |
|
|
|
|||||
| Net deferred tax assets |
||||||||
| |
|
|
|
|||||
| Deferred tax liabilities |
||||||||
| - Long-lived assets arisen from business combinations and asset acquisitions |
||||||||
| - Withholding tax on undistributed earnings |
||||||||
| - Accelerated tax depreciation and others |
||||||||
| |
|
|
|
|||||
| Total deferred tax liabilities |
||||||||
| |
|
|
|
|||||
For the year ended December 31, |
||||||||||||
2021 |
2022 |
2023 |
||||||||||
(RMB in millions) |
||||||||||||
| Balance at beginning of the year |
||||||||||||
| Additions |
||||||||||||
| Reversals |
( |
) | ( |
) | ( |
) | ||||||
| |
|
|
|
|
|
|||||||
| Balance at end of the year |
||||||||||||
| |
|
|
|
|
|
|||||||
22. |
Financing for major subsidiaries |
23. |
Ordinary shares |
24. |
Dividends |
25. |
Share repurchase program |
26. |
Other comprehensive income |
Translation adjustments and hedge of net investments in foreign operations, net of tax |
||||
(RMB in millions) |
||||
Balances as of December 31, 2020 |
( |
) | ||
Other comprehensive loss |
( |
) | ||
Balances as of December 31, 2021 |
( |
) | ||
Other comprehensive income |
||||
Balances as of December 31, 2022 |
( |
) | ||
Other comprehensive income |
||||
Balances as of December 31, 2023 |
||||
27. |
Share-based compensation |
For the year ended December 31, |
||||||||||||
2021 |
2022 |
2023 |
||||||||||
(RMB in millions) |
||||||||||||
Cost of revenues |
||||||||||||
Fulfillment |
||||||||||||
Marketing |
||||||||||||
Research and development |
||||||||||||
General and administrative |
||||||||||||
Total |
||||||||||||
27. |
Share-based compensation (Continued) |
(1) |
Employee and non-employee awards |
Number of RSUs |
Weighted- Average Grant-Date Fair Value |
|||||||
US$ |
||||||||
Unvested as of December 31, 2020 |
||||||||
Granted |
||||||||
Vested |
( |
) | ||||||
Forfeited or cancelled |
( |
) | ||||||
Unvested as of December 31, 2021 |
||||||||
Granted |
||||||||
Vested |
( |
) | ||||||
Forfeited or cancelled |
( |
) | ||||||
Unvested as of December 31, 2022 |
||||||||
Granted |
||||||||
Vested |
( |
) | ||||||
Forfeited or cancelled |
( |
) | ||||||
Unvested as of December 31, 2023 |
||||||||
27. |
Share-based compensation (Continued) |
(1) |
Employee and non-employee awards (Continued) |
Number of Share Options |
Weighted Average Exercise Price |
Weighted Average Remaining Contractual Term |
Aggregate Intrinsic Value |
|||||||||||||
US$ |
Year |
US$ in millions |
||||||||||||||
Outstanding as of December 31, 2020 |
||||||||||||||||
Exercised |
( |
) | ||||||||||||||
Forfeited or cancelled |
( |
) | ||||||||||||||
Outstanding as of December 31, 2021 |
||||||||||||||||
Exercised |
( |
) | ||||||||||||||
Forfeited or cancelled |
( |
) | ||||||||||||||
Outstanding as of December 31, 2022 |
||||||||||||||||
Exercised |
( |
) | ||||||||||||||
Forfeited or cancelled |
( |
) | ||||||||||||||
Outstanding as of December 31, 2023 |
||||||||||||||||
Vested and expected to vest as of December 31, 2023 |
||||||||||||||||
Exercisable as of December 31, 2023 |
||||||||||||||||
27. |
Share-based compensation (Continued) |
(2) |
Founder awards |
(3) |
Share-based compensation of subsidiaries |
27. |
Share-based compensation (Continued) |
(3) |
Share-based compensation of subsidiaries (Continued) |
27. |
Share-based compensation (Continued) |
(3) |
Share-based compensation of subsidiaries (Continued) |
28. |
Net income/(loss) per share |
For the year ended December 31, |
||||||||||||
2021 |
2022 |
2023 |
||||||||||
| Numerator: |
||||||||||||
| Net income/(loss) attributable to the Company’s ordinary shareholders – basic (RMB in millions) |
( |
) | ||||||||||
| Impact of subsidiaries’ diluted earnings (RMB in millions) |
( |
) | ( |
) | ( |
) | ||||||
| |
|
|
|
|
|
|||||||
| Net income/(loss) attributable to the Company’s ordinary shareholders – diluted (RMB in millions) |
( |
) | ||||||||||
| Denominator: |
||||||||||||
| Weighted average number of shares – basic |
||||||||||||
| Adjustments for dilutive options and RSUs |
||||||||||||
| |
|
|
|
|
|
|||||||
| Weighted average number of shares – diluted |
||||||||||||
| Basic net income/(loss) per share attributable to the Company’s ordinary shareholders (RMB) |
( |
) | ||||||||||
| Diluted net income/(loss) per share attributable to the Company’s ordinary shareholders (RMB) |
( |
) | ||||||||||
29. |
Related party transactions |
| Name of related parties |
Relationship with the Group | |
| Tencent and its subsidiaries (“Tencent Group”)(*) |
A shareholder of the Group | |
| Dada and its subsidiaries (“Dada Group”)(**) |
An investee of the Group | |
| JD Technology (***) |
An investee of the Group, and controlled by the Founder | |
| Property Funds |
Investees of the Group | |
| ATRenew and its subsidiaries (“ATRenew Group”) |
An investee of the Group |
| (*) | In March 2022, Tencent completed a distribution of approximately |
| (**) | Dada became the subsidiary of the Company since February 28, 2022 as disclosed in Note 7. As a result, Dada Group was not considered as the Group’s related party since then. |
| (***) | JD Technology became an investee of the Group since June 2020 (Note 6). |
(a) |
The Group entered into the following transactions with the major related parties: |
| Transactions |
For the year ended December 31, |
|||||||||||
2021 |
2022 |
2023 |
||||||||||
(RMB in millions) |
||||||||||||
| Revenues: |
||||||||||||
| Commission from cooperation on advertising business with Tencent Group |
— | * | ||||||||||
| Services provided and products sold to Tencent Group |
— | * | ||||||||||
| Services provided and products sold to Dada Group |
— | ** | ||||||||||
| Services provided and products sold to ATRenew Group |
||||||||||||
| Services provided and products sold to JD Technology |
||||||||||||
| Operating expenses: |
||||||||||||
| Services received and purchases from Tencent Group |
— | * | ||||||||||
| Services received from Dada Group |
— | ** | ||||||||||
| Payment processing and other services received from JD Technology |
||||||||||||
| Lease and property management services received from Property Funds |
||||||||||||
| Services received from ATRenew Group |
— | |||||||||||
| Other income: |
||||||||||||
| Income from non-compete agreement with Dada Group |
— | ** | ||||||||||
| Interest income from loans provided to JD Technology |
||||||||||||
| Interest income from loans provided to Property Funds |
||||||||||||
29. |
Related party transactions (Continued) |
| (b) | The Group had the following balances with the major related parties: |
As of December 31, |
||||||||
2022 |
2023 |
|||||||
(RMB in millions) |
||||||||
Due from/(to) JD Technology |
||||||||
Loans provided to JD Technology (* *** ) |
||||||||
Other payables to JD Technology |
( |
) | ( |
) | ||||
Due from Property Funds |
||||||||
Loans provided to Property Funds (* *** ) |
||||||||
Other receivables from Property Funds |
||||||||
Due from ATRenew Group |
||||||||
Total |
||||||||
Deferred revenues in relation to traffic support, marketing and promotion services to be provided to ATRenew Group |
( |
) | ( |
) | ||||
(****) |
In relation to the loans provided to JD Technology and Property Funds, the Group charged JD Technology and Property Funds based on fair market interest rate, and cash flows resulted from the loans were presented within investing activities in the consolidated statements of cash flows. |
29. |
Related party transactions (Continued) |
| (c) | Other information related to related party transactions: |
30. |
Segment reporting |
For the year ended December 31, |
||||||||||||
2021 |
2022 |
2023 |
||||||||||
(RMB in millions) |
||||||||||||
| Net revenues: |
||||||||||||
| JD Retail |
||||||||||||
| JD Logistics |
||||||||||||
| Dada |
— | |||||||||||
| New Businesses |
||||||||||||
| Inter-segment(*) |
( |
) | ( |
) | ( |
) | ||||||
| |
|
|
|
|
|
|||||||
| Total segment net revenues |
||||||||||||
| Unallocated items |
— | — | ||||||||||
| |
|
|
|
|
|
|||||||
| Total consolidated net revenues |
||||||||||||
| |
|
|
|
|
|
|||||||
| Operating income/(loss): |
||||||||||||
| JD Retail |
||||||||||||
| JD Logistics |
( |
) | ||||||||||
| Dada |
— | ( |
) | ( |
) | |||||||
| New Businesses |
( |
) | ( |
) | ||||||||
| Including: gain on sale of development properties (Note 19) |
||||||||||||
| impairment of long-lived assets |
— |
— |
( |
) | ||||||||
| |
|
|
|
|
|
|||||||
| Total segment operating income |
||||||||||||
| Unallocated items(**) |
( |
) | ( |
) | ( |
) | ||||||
| |
|
|
|
|
|
|||||||
| Total consolidated operating income |
||||||||||||
| Total other income/(expense) |
( |
) | ( |
) | ||||||||
| |
|
|
|
|
|
|||||||
| Income/(loss) before tax |
( |
) | ||||||||||
| |
|
|
|
|
|
|||||||
| (*) | The inter-segment eliminations mainly consist of revenues from supply chain solutions and logistics services provided by JD Logistics to JD Retail, on-demand delivery and retail services provided by Dada to JD Retail and JD Logistics, and property leasing services provided by JD Property to JD Logistics. |
30. |
Segment reporting (Continued) |
| (**) | A summary of unallocated ite m s for the years presented is as follows: |
For the year ended December 31, |
||||||||||||
2021 |
2022 |
2023 |
||||||||||
(RMB in millions) |
||||||||||||
| Share-based compensation |
( |
) | ( |
) | ( |
) | ||||||
| Amortization of intangible assets resulting from assets and business acquisitions |
( |
) | ( |
) | ( |
) | ||||||
| Effects of business cooperation arrangements |
( |
) | ( |
) | ||||||||
| Impairment of goodwill |
— | — | ( |
) | ||||||||
| Impairment of intangible assets |
— | — | ( |
) | ||||||||
| |
|
|
|
|
|
|||||||
| Total |
( |
) | ( |
) | ( |
) | ||||||
| |
|
|
|
|
|
|||||||
31. |
Employee benefit |
32. |
Loan facilities and lines of credit |
As of December 31, 2023 |
||||
(RMB in millions) |
||||
| Unsecured senior notes (Note 17) |
||||
| Unsecured borrowings (*) |
||||
| Secured borrowings (**) |
||||
| |
|
|||
| Total |
||||
| |
|
|||
| (*) | As of December 31, 2023, the unsecured borrowings mainly consisted of borrowings without collaterals under loan facility agreements from well-known financial institutions. The major unsecured borrowings are listed as below. |
32. |
Loan facilities and lines of credit (Continued) |
| (**) | As of December 31, 2023, RMB million which mainly comprised of construction in progress, buildings, land use rights and certain subsidiary’s equity interests measured at fair value. |
As of December 31, 2023 |
||||
(RMB in millions) |
||||
| 2024 |
||||
| 2025 |
||||
| 2026 |
||||
| 2027 |
||||
| 2028 |
||||
| 2029 and thereafter |
||||
| |
|
|||
| |
|
|||
33. |
Commitments and contingencies |
As of December 31, 2023 |
||||
(RMB in millions) |
||||
| 2024 |
||||
| 2025 |
||||
| 2026 |
||||
| 2027 |
||||
| 2028 |
||||
| 2029 and thereafter |
||||
| |
|
|||
| |
|
|||
34. |
Restricted net assets |
35. |
Subsequent events |
36. |
Parent company only condensed financial information |
As of December 31, |
||||||||||||
2022 |
2023 |
|||||||||||
RMB |
RMB |
US$ |
||||||||||
Note 2(g) |
||||||||||||
| (in millions, except share and per share data) | ||||||||||||
| ASSETS |
||||||||||||
| Cash and cash equivalents |
||||||||||||
| Short-term investments |
— | |||||||||||
| Internal balance |
||||||||||||
| Investments in subsidiaries and consolidated VIEs |
||||||||||||
| Prepayments and other assets |
||||||||||||
| |
|
|
|
|
|
|||||||
| Total assets |
||||||||||||
| |
|
|
|
|
|
|||||||
| LIABILITIES |
||||||||||||
| Unsecured senior notes |
||||||||||||
| Long-term borrowings |
||||||||||||
| Accrued expenses and other liabilities |
||||||||||||
| |
|
|
|
|
|
|||||||
| Total liabilities |
||||||||||||
| |
|
|
|
|
|
|||||||
| SHAREHOLDERS’ EQUITY: |
||||||||||||
| Ordinary shares (US$ |
— | * | — | * | — | * | ||||||
| Additional paid-in capital |
||||||||||||
| Statutory reserves |
||||||||||||
| Treasury stock |
( |
) | ( |
) | ( |
) | ||||||
| Retained earnings |
||||||||||||
| Accumulated other comprehensive income/(loss) |
( |
) | ||||||||||
| |
|
|
|
|
|
|||||||
| Total shareholders’ equity |
||||||||||||
| |
|
|
|
|
|
|||||||
| Total liabilities and shareholders’ equity |
||||||||||||
| |
|
|
|
|
|
|||||||
| * | Absolute amount is |
36. |
Parent company only condensed financial information (Continued) |
For the year ended December 31, |
||||||||||||||||
2021 |
2022 |
2023 |
||||||||||||||
RMB |
RMB |
RMB |
US$ |
|||||||||||||
Note 2(g) |
||||||||||||||||
| (in millions) | ||||||||||||||||
| Operating expenses |
||||||||||||||||
| Marketing |
( |
) | ( |
) | ( |
) | ( |
) | ||||||||
| General and administrative |
( |
) | ( |
) | ( |
) | ( |
) | ||||||||
| |
|
|
|
|
|
|
|
|||||||||
| Loss from operations |
( |
) | ( |
) | ( |
) | ( |
) | ||||||||
| |
|
|
|
|
|
|
|
|||||||||
| Other income/(expense) |
||||||||||||||||
| Income/(loss) from subsidiaries and consolidated VIEs |
( |
) | ||||||||||||||
| Other income/(expense), net |
( |
) | ( |
) | ( |
) | ||||||||||
| |
|
|
|
|
|
|
|
|||||||||
| Income/(loss) before tax |
( |
) | ||||||||||||||
| Income tax expenses |
( |
) | ( |
) | ( |
) | — | |||||||||
| |
|
|
|
|
|
|
|
|||||||||
| Net income/(loss) |
( |
) | ||||||||||||||
| |
|
|
|
|
|
|
|
|||||||||
| Net income/(loss) attributable to the Company’s ordinary shareholders |
( |
) | ||||||||||||||
| |
|
|
|
|
|
|
|
|||||||||
| Net income/(loss) |
( |
) | ||||||||||||||
| Other comprehensive income/(loss): |
||||||||||||||||
| Foreign currency translation adjustments |
( |
) | ||||||||||||||
| |
|
|
|
|
|
|
|
|||||||||
| Total other comprehensive income/(loss) |
( |
) | ||||||||||||||
| |
|
|
|
|
|
|
|
|||||||||
| Total comprehensive income/(loss) |
( |
) | ||||||||||||||
| |
|
|
|
|
|
|
|
|||||||||
36. |
Parent company only condensed financial information (Continued) |
For the year ended December 31, |
||||||||||||||||
2021 |
2022 |
2023 |
||||||||||||||
RMB |
RMB |
RMB |
US$ |
|||||||||||||
Note 2(g) |
||||||||||||||||
| (in millions) | ||||||||||||||||
| Net cash used in operating activities |
( |
) | ( |
) | ( |
) | ( |
) | ||||||||
| Cash flows from investing activities: |
||||||||||||||||
| Purchase of short-term investments |
( |
) | — | ( |
) | ( |
) | |||||||||
| Maturity of short-term investments |
— | — | ||||||||||||||
| Loans (provided to)/settled by internal companies |
( |
) | ||||||||||||||
| Other investing activities |
— | — | — | |||||||||||||
| |
|
|
|
|
|
|
|
|||||||||
| Net cash provided by/(used in) investing activities |
( |
) | ||||||||||||||
| |
|
|
|
|
|
|
|
|||||||||
| Cash flows from financing activities: |
||||||||||||||||
| Repurchase of ordinary shares |
— | ( |
) | ( |
) | ( |
) | |||||||||
| Cash paid for dividends |
— | ( |
) | ( |
) | ( |
) | |||||||||
| Proceeds from short-term borrowings |
— | — | — | |||||||||||||
| Repayment of short-term borrowings |
— | ( |
) | — | — | |||||||||||
| Proceeds from long-term borrowings |
— | — | — | |||||||||||||
| Repayment of unsecured senior notes |
( |
) | — | — | — | |||||||||||
| Other financing activities |
||||||||||||||||
| |
|
|
|
|
|
|
|
|||||||||
| Net cash used in financing activities |
( |
) | ( |
) | ( |
) | ( |
) | ||||||||
| |
|
|
|
|
|
|
|
|||||||||
| Effect of exchange rate changes on cash, cash equivalents, and restricted cash |
( |
) | ( |
) | ( |
) | ||||||||||
| |
|
|
|
|
|
|
|
|||||||||
| Net decrease in cash, cash equivalents, and restricted cash |
( |
) | ( |
) | ( |
) | ( |
) | ||||||||
| Cash, cash equivalents, and restricted cash at beginning of year |
||||||||||||||||
| |
|
|
|
|
|
|
|
|||||||||
| Cash, cash equivalents, and restricted cash at end of year |
||||||||||||||||
| |
|
|
|
|
|
|
|
|||||||||