UNITED STATES
SECURITIES AND EXCHANGE COMMISSION
Washington, D.C. 20549
FORM
(Mark One)
For the fiscal year ended
OR
Commission File Number
(Exact name of Registrant as specified in its Charter)
|
||
(State or other jurisdiction of incorporation or organization) |
|
(I.R.S. Employer Identification No.) |
|
|
|
|
||
(Address of principal executive offices) |
|
(Zip Code) |
Registrant’s telephone number, including area code: (
Securities registered pursuant to Section 12(b) of the Act:
Title of each class |
Trading symbol(s) |
Name of each exchange on which registered |
Securities registered pursuant to Section 12(g) of the Act: None
Indicate by check mark if the registrant is a well-known seasoned issuer, as defined in Rule 405 of the Securities Act. Yes ☐
Indicate by check mark if the registrant is not required to file reports pursuant to Section 13 or Section 15(d) of the Act. Yes ☐
Indicate by check mark whether the registrant: (1) has filed all reports required to be filed by Section 13 or 15(d) of the Securities Exchange Act of 1934 during the preceding 12 months (or for such shorter period that the registrant was required to file such reports), and (2) has been subject to such filing requirements for the past 90 days.
Indicate by check mark whether the registrant has submitted electronically, every Interactive Data File required to be submitted pursuant to Rule 405 of Regulation S-T (§232.405 of this chapter) during the preceding 12 months (or for such shorter period that the registrant was required to submit such files).
Indicate by check mark whether the registrant is a large accelerated filer, an accelerated filer, a non-accelerated filer, a smaller reporting company, or an emerging growth company. See the definitions of “large accelerated filer,” “accelerated filer,” “smaller reporting company,” and “emerging growth company” in Rule 12b-2 of the Exchange Act.
Large accelerated filer |
☐ |
|
|
☒ |
|
|
|
|
|
|
|
Non-accelerated filer |
☐ |
|
|
Smaller reporting company |
|
|
|
|
|
|
|
|
|
|
|
Emerging growth company |
If an emerging growth company, indicate by check mark if the registrant has elected not to use the extended transition period for complying with any new or revised financial accounting standards provided pursuant to Section 13(a) of the Exchange Act. ☐
Indicate by check mark whether the registrant has filed a report on and attestation to its management’s assessment of the effectiveness of its internal control over financial reporting under Section 404(b) of the Sarbanes-Oxley Act by the registered public accounting firm that prepared or issued its audit report.
If securities are registered pursuant to Section 12(b) of the Act, indicate by check mark whether the financial statements of the registrant
included in the filing reflect the correction of an error to previously issued financial statements.
Indicate by check mark whether any of those error corrections are restatements that required a recovery analysis of incentive-based
compensation received by any of the registrant’s executive officers during the relevant recovery period pursuant to §240.10D-1(b).☐
Indicate by check mark whether the registrant is a shell company (as defined in Rule 12b-2 of the Act). Yes ☐ No
The aggregate market value of the voting and non-voting common equity held by non-affiliates of the registrant, based on the closing price of the shares of common stock on the New York Stock Exchange as of July 28, 2023, was $
The number of shares of registrant’s Common Stock outstanding as of March 28, 2024 was
Documents Incorporated by Reference
Portions of Part II and Part III of this Form 10-K are incorporated by reference from the Registrant’s definitive proxy statement for its 2023 annual meeting of shareholders to be filed with the Securities and Exchange Commission no later than 120 days after the end of the Registrant’s fiscal year.
Auditor Firm ID: |
|
Auditor Name: |
|
Auditor Location: |
\\\\\\\\\\\
2
Table of Contents
|
|
Page |
|
2 |
|
|
2 |
|
|
|
|
|
|
|
Item 1. |
4 |
|
Item 1A. |
10 |
|
Item 1B. |
27 |
|
Item 1C. |
27 |
|
Item 2. |
28 |
|
Item 3. |
29 |
|
Item 4. |
29 |
|
|
|
|
|
|
|
Item 5. |
30 |
|
Item 6. |
31 |
|
Item 7. |
Management’s Discussion and Analysis of Financial Condition and Results of Operations |
32 |
Item 7A. |
42 |
|
Item 8. |
42 |
|
Item 9. |
Changes in and Disagreements With Accountants on Accounting and Financial Disclosure |
42 |
Item 9A. |
42 |
|
Item 9B. |
43 |
|
Item 9C. |
Disclosure Regarding Foreign Jurisdictions That Prevent Inspection |
43 |
|
|
|
|
|
|
Item 10. |
44 |
|
Item 11. |
44 |
|
Item 12. |
Security Ownership of Certain Beneficial Owners and Management and Related Stockholder Matters |
44 |
Item 13. |
Certain Relationships and Related Transactions, and Director Independence |
44 |
Item 14. |
44 |
|
|
|
|
|
|
|
Item 15. |
45 |
|
Item 16. |
48 |
1
CAUTIONARY NOTE REGARDING FORWARD-LOOKING STATEMENTS
This Annual Report on Form 10-K (“Annual Report”) contains forward-looking statements, which involve risks and uncertainties. These forward-looking statements are generally identified by the use of forward-looking terminology, including the terms “anticipate,” “believe,” “could,” “estimate,” “expect,” “intend,” “may,” “plan,” “potential,” “predict,” “project,” “should,” “target,” “will,” “would” and, in each case, their negative or other various or comparable terminology. All statements other than statements of historical facts contained in this Annual Report, including statements regarding our strategy, future operations, future financial position, future revenue, projected costs, prospects, plans, objectives of management and expected market growth are forward-looking statements. The forward-looking statements are contained principally in the sections entitled “Item 1. Business,” “Item 1A. Risk Factors” and “Item 7. Management’s Discussion and Analysis of Financial Condition and Results of Operations” and include, among other things, statements relating to:
These statements involve known and unknown risks, uncertainties and other important factors that may cause our actual results, performance or achievements to be materially different from any future results, performance or achievements expressed or implied by the forward-looking statements. Important factors that could cause our results to vary from expectations include, but are not limited to risks, uncertainties and factors set forth in this Annual Report, including those set forth under “Item 1A. Risk Factors.”
These forward-looking statements reflect our views with respect to future events as of the date of this Annual Report and are based on assumptions and subject to risks and uncertainties. Given these uncertainties, you should not place undue reliance on these forward-looking statements. These forward-looking statements represent our estimates and assumptions only as of the date of this Annual Report and, except as required by law, we undertake no obligation to update or review publicly any forward-looking statements, whether as a result of new information, future events or otherwise after the date of this Annual Report. We anticipate that subsequent events and developments will cause our views to change. You should read this Annual Report and the documents filed as exhibits to the Annual Report, completely and with the understanding that our actual future results may be materially different from what we expect. Our forward-looking statements do not reflect the potential impact of any future acquisitions, mergers, dispositions, joint ventures or investments we may undertake. We qualify all of our forward-looking statements by these cautionary statements.
RISK FACTOR SUMMARY
Our business is subject to numerous risks and uncertainties, including those described in Part I, Item 1A. Risk Factors in this Annual Report. These risks include, but are not limited to, risks associated with:
Risks Related to Our Business, Industry and Strategy
2
Risks Related to Our Indebtedness
Risks Related to Our Operations Governance Structure and Common Stock
Risks Related to Information Security
Risks Related to Labor Force
Risks Related to Intellectual Property
Risks Related to Legal, Regulatory, Accounting and Compliance Matters
3
PART I
Item 1. Business
In this Annual Report, unless otherwise indicated or the context otherwise requires, references to the “Company,” “J.Jill,” “we,” “us,” and “our” refer to J.Jill, Inc. and its consolidated subsidiaries. We operate on a 52- or 53-week fiscal year that ends on the Saturday that is closest to January 31. Each fiscal year generally is comprised of four 13-week fiscal quarters, although in the years with 53 weeks, the fourth quarter represents a 14-week period. References in this Annual Report to “Fiscal Year 2023” refer to the fiscal year ended February 3, 2024, references to “Fiscal Year 2022” refer to the fiscal year ended January 28, 2023, and references to “Fiscal Year 2021” refer to the fiscal year ended January 29, 2022. Fiscal Year 2023 is comprised of 53 weeks and Fiscal Years 2022, and 2021 are comprised of 52 weeks.
Company Overview
J.Jill is a national lifestyle brand that provides apparel, footwear and accessories designed to help its customers move through a full life with ease. The brand represents an easy, thoughtful and inspired style that celebrates the totality of all women and designs its products with its core brand ethos in mind: keep it simple and make it matter. J.Jill offers a high touch customer experience through over 200 stores nationwide and a robust ecommerce platform. J.Jill is headquartered outside Boston.
Brand
J.Jill has modernized its value proposition and introduced new customers to its relevant and compelling products through thoughtful, versatile designs that reflect the individuality of its customers. J.Jill has accomplished this by clearly communicating its offerings that align with its vision: to live in a world where the totality of every woman is seen, valued and celebrated. This permeates across all J.Jill touchpoints through authentic advertising, inclusive retail experiences and presentation of its offerings – whether the customer chooses to shop on the J.Jill website, in J.Jill retail stores, or through the J.Jill catalog.
Customer
J.Jill caters to a distinctive set of women – typically 45 years and older, college educated, and with an approximate median annual household income of $150,000. Her discretionary dollars are her own to spend and she leads a busy, yet balanced life and she is involved in her community. Her average tenure with the J.Jill brand is an industry-leading 10 plus years.
Additionally, as J.Jill retains her over time, she tends to migrate from being a single channel customer to a more valuable omnichannel customer. Omnichannel customers comprised approximately 23% of J.Jill’s active customer base for Fiscal Years 2023 and approximately 22% for Fiscal Years 2022 and 2021, respectively.
Product
J.Jill’s products are marketed under the J.Jill brand name and sold primarily through two channels: its ecommerce platform and catalog (“Direct”) and its retail stores (“Retail”). J.Jill’s thoughtful, versatile apparel, footwear and accessories reflect the individuality of each customer and are made to seamlessly take them through every moment of their day. J.Jill uses high quality fabrics and techniques for season-after-season comfort and style. J.Jill’s products are available across the full range of sizes including Regular, Petite and Tall, and it provides one, size-integrated shopping destination for customers with sizes from Extra Small up to 2X in store and 4X online.
In addition to its core assortment, J.Jill has three sub-brands, Pure Jill, Wearever, and Fit. Each demonstrate a different design ethos and offers customers a mix of casual and refined apparel based on their needs. Whether they are buying versatile work, comfortable travel, or premium casual clothes for attending occasions or meeting friends, J.Jill offers its customers a variety of options for different usage occasions.
Pure Jill: The highest expression of the J.Jill brand, Pure Jill reflects the art of understated ease. It is designed with a fabric-first approach, reflected in simple designs, unique artisanal details, interesting textures, soft natural fabrics and dye and wash techniques.
4
Wearever: Wearever is all day refined dressing designed for work, travel and home. It is a foundational collection of versatile shapes and proportions, in solids and prints that mix easily to provide endless options that work together. These soft knits are easy care and wrinkle-free, and always look great.
Fit: Style designed for wellness, Fit is versatile performance-inspired apparel for athletic usage or as feel-good loungewear.
J.Jill also offers accessories in unique, versatile and wearable collections. These accessory collections are primarily driven by scarves and jewelry and seamlessly complete customers wardrobes.
Product Design and Development
The J.Jill customer seeks newness and unique products. Through nine separate seasons, J.Jill flows designs and color palettes frequently – creating engagement and optionality for its customers. Substantially all of J.Jill’s merchandise is designed in-house, creating newness through different fabrics, colors, patterns and silhouettes. J.Jill also utilizes the launch of its sub-brands, Pure Jill, Wearever, and Fit, to stagger new deliveries, and offers web edit capsules and omnichannel product refreshes to provide newness throughout each season. The close coordination between its teams ensures that its product and brand message is clearly communicated to its customers across all channels, bringing customers back regularly to see what’s new.
Omnichannel Business Model
J.Jill believes that its customers’ purchasing decisions are influenced by the consistent experience it provides across its sales channels. For Fiscal Year 2023, J.Jill generated approximately 53% of total net sales through its Retail channel and approximately 47% of total net sales through its Direct channel. This balanced, omnichannel business model means J.Jill meets existing and prospective customers where and how they want to shop. Further, its robust customer database and analytical capabilities allow J.Jill to be focused and strategic in identifying high potential locations and optimizing its store footprint.
Retail Channel
J.Jill Stores
As of February 3, 2024, J.Jill operated 244 stores across 42 states with approximately half located in lifestyle centers and the remaining in premium malls; all J.Jill stores are leased. Its stores range in size from approximately 2,000 to 6,000 square feet, and the average store is approximately 3,700 square feet.
J.Jill’s store designs showcase its brand, while elevating and simplifying the J.Jill shopping experience. Its stores provide a shared community of like-minded women and a welcoming, easy-to-shop environment with personalized attention. Its customer relies on trusted store associates to provide honest feedback and advice to help guide them. Through its concierge service, they can get early access to J.Jill’s latest products or have its team pull items that complement their style and aesthetic. When the customer cannot find an item in-stock at their local store, J.Jill’s in-store ordering platform ships available products to their home.
Site Optimization
J.Jill believes its stores to be an important channel for its customers. J.Jill reviews and evaluates its store fleet and potential new store locations on various factors, including customer demographics within a market, concentration of existing customers, location of existing stores, center tenant quality and mix, rental economics and overall operating performance. Following several years of optimizing the fleet through net store closings, J.Jill returned to net store growth in Fiscal Year 2023 with the addition of net one new store. J.Jill will continue to review its fleet for optimization opportunities going forward, while also pursuing net new store openings.
The following table shows new store openings and closings since Fiscal Year 2019.
|
|
|
|
|
|
|
|
Total Stores at |
|
|||
|
|
Stores |
|
|
Stores |
|
|
the End of the |
|
|||
Store Open Year |
|
Opened |
|
|
Closed |
|
|
Fiscal Year |
|
|||
Fiscal Year 2019 |
|
|
11 |
|
|
|
(6 |
) |
|
|
287 |
|
Fiscal Year 2020 |
|
|
— |
|
|
|
(20 |
) |
|
|
267 |
|
Fiscal Year 2021 |
|
|
— |
|
|
|
(14 |
) |
|
|
253 |
|
Fiscal Year 2022 |
|
|
1 |
|
|
|
(11 |
) |
|
|
243 |
|
Fiscal Year 2023 |
|
|
2 |
|
|
|
(1 |
) |
|
|
244 |
|
5
Direct Channel
J.Jill’s Direct channel consists of its website and catalog orders. Within its Direct channel, ecommerce represented approximately 95% of Direct channel net sales and phone orders represented 5% of Direct channel net sales.
J.Jill’s website, www.jjill.com, delivers to customers an engaging shopping experience by featuring updates on new collections, guidance on how to wardrobe and wear its products, and the ability to chat live with a sales representative.
The J.Jill website also provides customers with a broader range of colors and sizes than available in its stores.
Competitive Strengths
Distinct, Well-Recognized Brand. The J.Jill brand represents an easy, thoughtful and inspired style that celebrates the totality of all women and fuels her joy and impact with style. J.Jill has cultivated this differentiated brand through deep consumer insights and primary research data to better understand what women want from fashion and the shopping experience. The result has helped J.Jill communicate the brand story more broadly and strategically and reaffirmed its commitment to its customers, creating significant brand trust and an emotional connection with them.
Omnichannel Business. J.Jill has developed an omnichannel business model comprised of its Retail and its Direct channel. Its Retail and Direct channels complement and drive traffic to one another, and J.Jill leverages its targeted marketing initiatives to acquire new customers across its channels.
Data-Centric Approach That Drives Future Profitability and Mitigates Risk. J.Jill believes it has industry-leading data capture capabilities that allow it to match approximately 97% of transactions to an identifiable customer. J.Jill uses its extensive customer database to track and effectively analyze customer information as well as contact history. J.Jill also has significant visibility into its customers’ transaction behavior. J.Jill can identify a single-channel customer who purchases a product through its website, its retail store or its catalogs, as well as an omnichannel customer who purchases in more than one channel. J.Jill continually leverages this database and applies its insights to operate its business as well as to acquire new customers and then create, build and maintain a relationship with each customer to drive optimum value.
Affluent and Loyal Customer Base. J.Jill targets an attractive demographic of affluent women 45 years and older. With an approximate median annual household income of $150,000, its customer has significant spending power. J.Jill’s private label credit card program also drives customer loyalty and encourages shopping. J.Jill believes it will continue to develop long-term customer relationships that can drive profitable sales growth.
Customer-Focused Product Assortment. J.Jill customers strongly associate its product with a modern balance of style, quality, comfort and ease suitable for a broad range of occasions at accessible price points. Its customer-focused assortment spans a full range of sizes and is designed to provide an easy wardrobe that is relevant to her lifestyle. Each year, J.Jill offers merchandise collections that are designed and delivered to provide a consistent flow of fresh products. J.Jill creates product newness through the use of different fabrics, colors, patterns and silhouettes. J.Jill has an in-house, customer centric product design and development process that leverages its extensive database of customer feedback and allows J.Jill to identify and incorporate changes in its customers’ preferences. J.Jill believes its customer focused approach to product development and continual delivery of fresh, high quality products drives traffic, frequency and conversion.
Highly Experienced Leadership Team. J.Jill’s leadership team has extensive industry experience with significant expertise in merchandising, marketing, stores, ecommerce, human resources, and finance. J.Jill’s senior leadership team has an average of 25 years of experience in retail.
Growth Strategy
Key drivers of J.Jill’s growth strategy include:
Grow Value of Our Customer Base. J.Jill has a significant opportunity to continue to attract new customers to its brand and to grow the value of its active customer base across all channels. J.Jill believes that its target demographic of women 45 years and older, is relatively underserved by media and the industry. J.Jill has refined its brand position to further attract these remarkable women who do not define themselves by age, size, profession, nor confine themselves by artificial boundaries or the expectations of others. J.Jill plans to continue positioning its marketing investment to acquire new customers, reactivate lapsed customers, and retain existing customers. Through its various business initiatives, J.Jill believes it will continue to attract new customers to its brand, migrate from single channel to more profitable omnichannel customers and increase overall customer spend.
6
Increase Direct Sales. Given its strong foundation and ongoing website enhancements, J.Jill believes it can leverage its Direct platform to broaden its customer reach and drive additional sales. J.Jill is undertaking initiatives to further develop its website to provide a more personalized shopping experience with more features and services for its customers. The website also provides enhanced capability to engage customers on mobile devices, and improved access to products.
Profitably Expand Our Store Base. Following several years of optimizing the fleet through net store closings, J.Jill believes there is an opportunity to strategically add back net 20-25 profitable new stores over the next three to five years. We target new locations primarily in lifestyle centers and premium malls.
Strengthen Omnichannel Capabilities. J.Jill’s profitable store channel is enhanced by store associates who have a unique connection to its customer. J.Jill’s Point of Sale (“POS”) system and Order Management System (“OMS”) initiatives further enable its associates in providing a simplified check-out and a frictionless omnichannel shopping experience. Whether calling to help her access its online exclusive products, or celebrating life’s special events in store, J.Jill associates bridge the experience between the channels by reminding her that she can access J.Jill in many ways. Concurrently, J.Jill remains focused on driving traffic and engagement with its website. J.Jill plans to continue enhancing the website with value-added services and growing its email file while optimizing its marketing strategies, including increased personalization through social media. J.Jill expects that these improvements will facilitate a more cohesive and seamless shopping experience for its customer, wherever and whenever she chooses to shop. J.Jill plans to continue leveraging its insight into customer attributes and behavior, which will guide strategic investments in its business.
Enhance Product Assortment. J.Jill believes there is an opportunity to improve its productivity by selectively enhancing its assortment in certain product categories, including its Pure Jill and Wearever sub-brands, its Regular, Petite and Tall businesses, and accessories. J.Jill also believes it has the opportunity to continue to optimize its assortment architecture by delivering the right mix and flow of fashion and basics to its channels. In addition, J.Jill expects to continue delivering high quality customer focused product assortments across each of its channels, while strengthening visual merchandising and maintaining a balance between newness and core staples.
Inclusive Sizing. Inclusivity is inherent to the J.Jill brand, allowing its customer to shop where and how she wants. J.Jill also sees a huge opportunity to better serve its customers and continue to support the mission of the company through totality and inclusivity. By focusing on perfecting our fit, improving her experience when shopping extended sizing, and clearly communicating our robust range of sizes, J.Jill continues to meet the most salient needs of its customer: finding her desired fit and products that are uniquely relevant to her with the confidence that J.Jill has what she is looking for in beautiful styles and fabrications.
Marketing and Advertising
J.Jill leverages a variety of marketing and advertising vehicles to increase brand awareness, acquire new customers, drive customer traffic across its channels, and strengthen and reinforce its brand image. These include print mailings, email communications, digital advertisements, and public relations initiatives. J.Jill leverages its customer database to strategically optimize the value of its marketing investments across customer segments and channels. This enables J.Jill to productively acquire new customers, effectively market to existing customers, increase customer retention levels and reactivate lapsed customers.
J.Jill’s ecommerce platform offers a full representation of its brand with its complete range of styles, sizes and colors, including curated shops and online exclusives. Accessed through desktop, tablet or mobile, its website enables J.Jill to attract new customers to the brand and creates momentum with existing customers through its valuable brand proposition.
Along with ecommerce, its catalogs continue to be an integral part of its business. As one of J.Jill’s key marketing vehicles, its catalogs promote and reinforce its brand image and drive customer acquisition and engagement. As on its website and in its retail stores, J.Jill’s catalogs reflect its product offering in settings that align with its merchandise segments, including its sub-brands, and provide guidance on styling and wardrobe. J.Jill’s catalogs are designed in-house, providing greater creative control as well as effectively managing production costs.
J.Jill offers a private label credit card program through an agreement (“Credit Card Agreement”) with Comenity Capital Bank (“CCB”), under which CCB owns the credit card receivables. Pursuant to the Credit Card Agreement, we are eligible to receive reimbursements for costs of marketing programs and royalties based on net sales charged to the private label credit card, as defined in the Credit Card Agreement. All credit card holders receive invitations to exclusive customer events and promotions including special purchase events six times per year, a special offer for her birthday, and a 5% discount when purchases are made on the card. J.Jill promotes the benefits of its credit card to new and existing customers through its various marketing channels. J.Jill believes that its credit card program encourages customer loyalty, repeat visits and additional spending. In Fiscal Year 2023, 46% of its gross sales were generated by its credit card holders.
7
Sourcing and Supply Strategy
To efficiently source its products, J.Jill leverages its longstanding relationships with agents who represent suppliers and factories. In Fiscal Year 2023 approximately 80% of its products were sourced through agents and 20% were sourced directly from suppliers and factories. J.Jill works with several primary agents that help it identify quality suppliers and coordinate its manufacturing requirements. Additionally, the agents manage the development of samples of merchandise produced in the factories, inspect finished merchandise, ensure the timely delivery of goods and carry out other administrative and oversight functions on J.Jill’s behalf. J.Jill sources the remainder of its products by interacting directly with suppliers and factories both domestically and abroad.
Agents work with approximately 40 suppliers on J.Jill’s behalf. J.Jill sources its merchandise globally from 11 countries with the top three by volume being India, Indonesia, and Vietnam. No single supplier accounts for more than 20% of merchandise purchased by volume.
J.Jill has no long-term merchandise supply contracts as it typically transacts business on an order-by-order basis to maintain flexibility. J.Jill believes its strong relationships with suppliers have provided it with the ability to negotiate favorable pricing terms, further improving its overall cost structure and profitability. J.Jill’s dedicated sourcing team actively negotiates and manages product costs to deliver initial mark-up objectives. The team further focuses on quality control to ensure that merchandise meets required technical specifications and inspects the merchandise to ensure it meets J.Jill’s strict standards, including regular in-line inspections while goods are in production. Upon receipt, merchandise is further inspected on a test basis for consistency in cut, size and color, as well as for conformity with specifications and overall quality of manufacturing. J.Jill’s sourcing team ensures that the customer has a consistent product and satisfying brand experience regardless of product size, color or collection. See Item 1A. Risk Factors for additional discussion related to our risks associated with sourcing and our supply chain.
Omnichannel Distribution and Customer Contact Center
J.Jill leases its 520,000 square foot distribution and customer contact center in Tilton, New Hampshire. The facility manages the receipt, storage, sorting, packing and distribution of merchandise for its Retail and Direct channels. Retail stores are replenished from this facility and shipped by third-party delivery services, providing its retail stores with a steady flow of new inventory that helps to maintain product freshness. J.Jill’s distribution system is designed to operate in an efficient and cost-effective manner, including its ability to profitably support individual direct orders. In Fiscal Year 2023, the distribution center handled 28 million units, split between 12 million retail (43%) and 16 million direct (57%), and J.Jill believes this facility is sufficient to support its future growth.
The customer contact center is an extension of the J.Jill brand, providing a consistent customer experience at every stage of a purchase across all of its channels. In Fiscal Year 2023, J.Jill managed approximately 3.4 million customer interactions through its in-house customer contact center in Tilton, New Hampshire. J.Jill’s customer contact center is responsible for nearly all live customer interactions, other than in retail stores, including order taking and further serves as an important feedback loop in gathering customer responses to its brand, product and service. J.Jill continues to refine and improve its contact center strategy and experience to support the constantly evolving digital landscape.
Information Systems
J.Jill uses information systems to support business intelligence and processes across its sales channels. J.Jill continues to invest in information systems and technology to enhance the customer experience and create operating efficiencies including the completion of the rollout of our new POS system during Fiscal Year 2023 and its initiative to upgrade its OMS system over the next two fiscal years. J.Jill utilizes third-party providers for customer database and customer campaign management, ensuring efficient maintenance of information in a secure, backed-up environment.
Seasonality
While the retail business is generally seasonal in nature, J.Jill has historically not experienced significant seasonal fluctuations in its sales. J.Jill’s merchandise offering drives consistent sales across seasons with no quarter contributing more than 26% of total annual net sales in Fiscal Year 2023.
Competition
The women’s apparel industry is highly competitive. J.Jill competes with local, national and international retail chains and department stores, specialty and discount stores, catalogs and internet businesses offering similar categories of merchandise. J.Jill competes on the basis of design, service, quality and value. J.Jill believes its distinct combination of design, service, quality and value allows it to challenge the competition effectively and believes it differentiates itself based on the strength of its brand, its omnichannel platform, its strong data capabilities, its loyal customer base, its customer-focused product assortment and its highly experienced leadership team. See Item 1A. Risk Factors for additional discussion related to our risks associated with the competition we face.
8
Human Capital
Attracting, retaining, and developing a pool of talent with diverse backgrounds and experiences to drive the success of the J.Jill brand is a key element of its business strategy. As of February 3, 2024, J.Jill employed 1,115 full-time and 1,976 part-time associates. Of these associates, 298 were employed in its headquarters in Quincy, Massachusetts, 2,507 were employed in its retail stores and field management team, and 286 worked in its distribution and customer contact center and administrative office in Tilton, New Hampshire. The number of associates, particularly part-time associates, fluctuates depending upon seasonal needs. J.Jill considers its relations with its associates to be very good.
J.Jill’s offices were open throughout Fiscal Year 2023 as it continued to embrace a flexible work model across the organization in accordance with its Optimizing Work and Life initiative adopted in Fiscal Year 2022.
J.Jill’s key human capital measures include associate safety, turnover, pay benchmarking and associate professional development. J.Jill has programs in place to provide associates with feedback on performance and professional development planning, and its senior leadership team engages in a formal talent review and development planning process each year.
J.Jill frequently benchmarks its compensation practices and benefits programs against those of comparable industries and in the geographic areas where its facilities are located. J.Jill believes that its compensation and employee benefits are competitive and allows it to attract and retain talent throughout its organization. J.Jill’s notable health, welfare and retirement benefits include:
J.Jill strives to maintain an inclusive environment free from discrimination of any kind, including sexual or other discriminatory harassment. Associates have multiple ways to report inappropriate behavior, including through a confidential hotline. All reports of inappropriate behavior are promptly investigated with appropriate action taken to stop such behavior.
Intellectual Property
J.Jill’s trademarks are important to its marketing efforts. J.Jill owns or has the rights to use certain trademarks, service marks and trade names that are registered with the U.S. Patent and Trademark Office or other foreign trademark registration offices or exist under common law in the United States and other jurisdictions. Trademarks that are important in identifying and distinguishing its products and services include, but are not limited to, J.Jill®, The J.Jill Wearever Collection® and Pure Jill®. J.Jill’s rights to some of these trademarks may be limited to selected markets. J.Jill also owns domain names, including www.jjill.com.
Corporate Information
Our principal executive office is located at 4 Batterymarch Park, Quincy, MA 02169, and our telephone number is (617) 376-4300.
Available Information
We are required to file annual, quarterly and current reports, proxy statements and other documents with the Securities and Exchange Commission (the “SEC”) under the Securities Exchange Act of 1934, as amended (the “Exchange Act”). The SEC maintains an Internet website that contains reports, proxy and information statements and other information regarding issuers that file electronically with the SEC. The public can obtain any documents that are filed by us at www.sec.gov.
9
In addition, this Annual Report as well as future quarterly reports on Form 10-Q, current reports on Form 8-K and any amendments to all of the foregoing reports, are made available free of charge on our Internet website (https://www.jjill.com) as soon as reasonably practicable after such reports are electronically filed with or furnished to the SEC. The contents of our website are not incorporated by reference in this report.
Item 1A. Risk Factors
Risks Related to Our Business, Industry and Strategy
Our business is sensitive to macroeconomic conditions and we rely on consumer discretionary spending, which means we may be adversely affected by economic downturns and other macroeconomic conditions or trends.
Our business and operating results are subject to national and global economic conditions and their impact on consumer discretionary spending. Some of the factors that may negatively influence consumer spending include high levels of unemployment; higher consumer debt levels; reductions in net worth, declines in asset values, and related market and macroeconomic uncertainty; home foreclosures and reductions in home values; fluctuating interest rates, increased inflationary pressures and credit availability; rising fuel and other energy costs; rising commodity prices; and general uncertainty regarding the overall future political and economic environment. We have experienced many of these factors, including current inflationary pressures, and are experiencing negative impacts on client demand and discretionary spending as a result. Consumer purchases of discretionary items, including the merchandise that we offer, generally decline during recessionary periods or periods of economic uncertainty, when disposable income is reduced and when there is a reduction in consumer confidence. Furthermore, economic conditions in certain regions may also be affected by natural disasters, such as hurricanes, tropical storms, earthquakes, and wildfires; public health crises; and other major unforeseen events.
Adverse macroeconomic changes could reduce consumer confidence and could thereby negatively affect our operating results. In challenging and uncertain economic environments, we cannot predict when macroeconomic uncertainty may arise, whether or when such circumstances may improve or worsen, or what impact such circumstances could have on our business. In recessionary periods and other periods where disposable income is adversely affected, we may have to increase the number of promotional sales or otherwise dispose of inventory for which we have already paid to manufacture, which could further adversely affect our profitability. It is difficult to predict when or for how long any of these conditions can affect our business and a prolonged economic downturn could have a material adverse effect on our business, financial condition and results of operations.
Disruption in the economy may further affect our business, results of operations, liquidity, and financial results.
The extent to which economic disruptions caused by pandemics, epidemics, or public health emergencies will impact our business, liquidity, financial condition, cash flows and results of operations, depends on numerous evolving factors that we may not be able to accurately predict or assess. Such factors include, but are not limited to, the duration and scope of the pandemic, epidemic, or public health emergency; the negative impact on the economy; the short and longer-term impacts on the demand for retail and levels of consumer confidence; our ability to successfully navigate the impacts, including potential staffing and supply shortages; government actions, including restrictions on congregating in heavily populated areas, such as malls and shopping centers; and increased unemployment and reductions in consumer discretionary spending. The impact of any such event may also heighten other risks included in this Risk Factors section, any of which could be material.
Our ability to anticipate and respond to changing customer preferences and shifts in fashion and industry trends in a timely manner could have a material adverse effect on our business, financial condition and results of operations.
Our success largely depends on our ability to consistently gauge tastes and trends and provide a balanced assortment of merchandise that satisfies customer demands in a timely manner. We enter into agreements to manufacture and purchase our merchandise well in advance of the applicable selling season and our failure to anticipate, identify or react appropriately in a timely manner to changes in customer preferences, tastes and trends and economic conditions could lead to, among other things, missed opportunities, excess inventory or inventory shortages, markdowns and write-offs, all of which could negatively impact our profitability and have a material adverse effect on our business, financial condition and results of operations. Failure to respond to changing customer preferences and fashion trends could also negatively impact our brand image with our customers and result in diminished brand loyalty.
10
Our ability to maintain our brand image, engage new and existing customers and gain market share could have a material adverse effect on our growth strategy and our business, financial condition and results of operations.
Our ability to maintain our brand image and reputation is integral to our business, as well as the implementation of our strategy to grow. Maintaining, promoting and growing our brand will depend largely on the success of our design, merchandising and marketing efforts and our ability to provide a consistent, high-quality customer experience. Our reputation could be jeopardized if we fail to maintain high standards for merchandise quality and integrity and any negative publicity about these types of concerns may reduce demand for our merchandise. While our brand enjoys a loyal customer base, the success of our growth strategy depends, in part, on our ability to keep existing customers engaged as well as attract new customers to shop our brand.
Additionally, we are increasingly reliant on social media for marketing and developing our brand image. As use of social media becomes more prevalent, our susceptibility to risks related to social media increases. The immediacy of social media and prevalence of user generated content precludes us from having real-time control over postings made regarding us via social media, whether matters of fact or opinion. Information distributed via social media could result in immediate unfavorable publicity for which we, like our competitors, do not have the ability to reverse. Any such unfavorable publicity could result in damage to our reputation.
If we experience damage to our reputation or loss of consumer confidence, we may not be able to retain existing customers or acquire new customers, which could have a material adverse effect on our business, financial condition and results of operations.
If we fail to acquire new customers in a cost-effective manner, it could have an adverse impact on our growth strategy as we may not be able to increase net revenue or profit per active customer.
The success of our growth strategy depends in part on our ability to acquire new customers in a cost-effective manner. In order to expand our active customer base, we must appeal to and acquire customers who identify with our brand. We have made significant investments related to customer acquisition and expect to continue to spend significant amounts to acquire additional customers. The more we invest in marketing efforts to increase the name recognition of our brand, we may experience diminishing returns on that investment of resources and future marketing campaigns may not result in the acquisition of new customers at the same rate as past campaigns. There can be no assurances that the revenue from new customers we acquire will ultimately exceed the cost of acquiring those customers.
We use paid and non-paid advertising. Our paid advertising includes catalogs, paid search engine marketing, email, display and other advertising. Our non-paid advertising efforts include search engine optimization and social media. We obtain a significant amount of traffic via search engines and rely on search engines such as Google, Yahoo! and Bing. Search engines frequently update and change the logic that determines the placement and display of results of a user’s search and the purchased or algorithmic placement of links to our site can be negatively affected. A major search engine could change its algorithms in a manner that negatively affects our paid or non-paid search ranking, and competitive dynamics could impact the effectiveness of search engine marketing or search engine optimization. We also obtain traffic via social networking websites or other channels used by our current and prospective customers. As ecommerce and social networking continue to rapidly evolve, we must continue to establish relationships with these channels and may be unable to develop or maintain these relationships on acceptable terms. Additionally, digital advertising costs may continue to rise and as our usage of these channels expands, such costs may impact our ability to acquire new customers in a cost-effective manner. If the level of usage of these channels by our active customer base does not grow as expected, we may suffer a decline in customer growth or net sales. If we are unable to acquire new customers in a cost-effective manner, it could have a material adverse effect on our business, financial condition and results of operations.
Competitive pressures from other retailers as well as adverse structural developments in the retail sector may have a material adverse effect on our business, financial condition and results of operations.
The women’s apparel industry is highly competitive. We compete with local, regional, national and international retail chains and department stores, specialty and discount stores, catalogs, internet and ecommerce businesses offering similar categories of merchandise. We face a variety of competitive challenges, including price pressure, anticipating and quickly responding to changing customer demands or preferences, maintaining favorable brand recognition and effectively marketing our merchandise to our customers in diverse demographic markets, sourcing merchandise efficiently and developing merchandise assortments in styles that appeal to our customers in ways that favorably distinguish us from our competitors. In addition, new and enhanced technologies, including search, web and infrastructure computing services, digital content, and electronic devices, may increase our competition. The internet and other new technologies facilitate competitive entry and
11
comparison shopping, and increased competition may reduce our sales and profits. We strive to offer an omnichannel shopping experience for our customers that enhances their shopping experiences. Omnichannel retailing is constantly evolving, and we must keep pace with changing customer expectations and new developments by our competitors. Furthermore, many of our competitors have advantages over us, including substantially greater financial, marketing and other resources. Increased levels of promotional activity by our competitors, some of whom may be able to adopt more aggressive pricing policies than we can, both on our website and in stores, may negatively impact our sales and profitability. There can be no assurances that we will be able to compete successfully with these companies in the future. In addition to competing for sales, we compete for favorable store locations, lease terms and qualified sales associates and professional staff. Increased competition in these areas may result in higher costs and reduced profitability, which could have a material adverse effect on our business, financial condition and results of operations.
Dependence on our ecommerce business and failure to successfully manage this line of business and deliver a seamless omnichannel shopping experience to our customers could have an adverse effect on our growth strategy and our business, financial condition and results of operations.
Sales through our Direct channel, of which our ecommerce business constitutes the vast majority, accounted for approximately 47% of our total net sales for Fiscal Year 2023. Our business, financial condition and results of operations are dependent on maintaining our ecommerce business and expanding this business is an important part of our strategy to grow through our omnichannel operations. Dependence on our ecommerce business and the continued growth of our Direct channel subjects us to certain risks, including:
Our failure to successfully address and respond to these risks and uncertainties related to our ecommerce business could negatively impact sales, increase costs, diminish our growth prospects and damage the reputation of our brand, each of which could have a material adverse effect on our business, financial condition and results of operations.
Our business depends on effective marketing and increasing customer traffic and the success of our Direct channel depends on customers’ use of our website and response to catalogs and digital marketing.
We have many initiatives in our marketing programs. If our competitors increase their spending on marketing, if our marketing expenses increase, if our marketing becomes less effective than that of our competitors, or if we do not adequately leverage technology and data analytics needed to generate concise competitive insight, we could experience a material adverse effect on our business, financial condition and results of operations. A failure to sufficiently innovate or maintain adequate and effective marketing strategies could inhibit our ability to maintain brand relevance and increase sales.
In particular, the level of customer traffic and volume of customer purchases through our Direct channel, which accounted for approximately 47% of our total net sales for Fiscal Year 2023, is substantially dependent on our ability to provide a content-rich and user-friendly website, widely distributed and informative catalogs, a fun, easy and hassle-free customer experience and reliable delivery of our merchandise. If we are unable to maintain and increase customers’ use of our ecommerce platform, and the volume of purchases declines, our business, financial condition and results of operations could be adversely affected.
Customer response to our catalogs and digital marketing is substantially dependent on merchandise assortment, merchandise availability and creative presentation, as well as the selection of customers to whom our catalogs are sent and to whom our digital marketing is directed, changes in mailing strategies and the size of our mailings. Our maintenance of a robust customer database has also been a key component of our overall strategy. If the performance of our website, catalogs and email declines, or if our overall marketing strategy is not successful, it could have a material adverse effect on our business, financial condition and results of operations.
12
Our growth strategy depends in part on our ability to open and operate new retail stores on a profitable basis, and our ability to identify and close retail stores that are no longer profitable, and if we are not successful in executing our Retail channel strategy to optimize profitability, our growth and profitability could be adversely impacted.
Our growth strategy depends, in part, on our ability to open and operate new retail stores on a profitable basis within our Retail channel. We may be unable to identify and open new retail locations in desirable places in the future. In addition to competition with other retailers and businesses for suitable retail locations, local land use, local zoning issues, environmental regulations, governmental permits and approvals and other regulations may affect our ability to find suitable retail locations and also influence the cost of leasing them. We also may have difficulty negotiating real estate leases for new stores on acceptable terms. In addition, construction, environmental, zoning and real estate delays may negatively affect retail location openings and increase costs and capital expenditures. If we are unable to open new retail store locations in desirable places and on favorable terms, our net sales and profits could be materially adversely affected.
Any expansion of our retail store base, may increase overall expenses due to costs associated with entering into and making payments under new leases, expanding and improving our operating capabilities, including by making investments in our information technology and operational infrastructure. New retail locations also require us to train and manage additional employees, and we may be unable to do so. We primarily rely on cash flow generated from our operations to pay our lease expenses and to fund our growth initiatives, and a significant investment of capital is necessary to open a new retail store. If we open a large number of stores relatively close in time, the cost of these retail store openings and lease expenses and the cost of continuing operations could reduce our cash position. If our business does not generate sufficient cash flow from operating activities to fund these expenses associated with adding new retail locations, we may not have sufficient cash available to address other aspects of our business or we may be unable to service our lease expenses, which could materially harm our business.
If we increase the number of retail stores too quickly or open retail stores too close together, our stores may become more highly concentrated in geographic regions we already serve. As a result, the number of customers and related net sales at individual stores may decline and the time before a new retail store becomes profitable may be increased. The growth in the number of our retail stores could also draw customers away from our Direct channel offerings, including ecommerce and catalogs, and if our competitors open stores with similar formats, our retail store format may become less unique and may be less attractive to customers as a shopping destination. If either of these events occurs, our business, financial condition and results of operations could be materially adversely affected.
We are subject to risks related to the operation of our retail stores such as failure of our technology infrastructure or the computer systems that operate our POS system and their related support systems, causing, among other things, downtimes, telecommunications issues or other technical failures, the reliance on third-party computer hardware/software providers, as well as risks related to data protection, credit card fraud, and cyber security and vulnerability to electronic break-ins and other similar disruptions.
Our future growth strategy also depends, in part, on our ability to optimize and profitably operate our stores and to close underperforming stores. We may not be able to optimize our store base by profitably operating stores and closing stores that are unprofitable, and this could have a material adverse impact on our business, financial condition and results of operations.
Reductions in the volume of mall traffic or the closing of shopping malls as a result of changing economic conditions or demographic patterns could significantly reduce our sales and leave us with unsold inventory.
A significant portion of our stores are currently located in shopping malls. Sales at stores located in malls are highly dependent on the traffic in those malls and the ability of developers to generate traffic near our stores. In recent years, there has been increased purchasing of merchandise online, and it is not clear yet whether this recent change is permanent or temporary. This has adversely affected mall traffic. A continuation of this trend could adversely impact the sales generated by our mall stores, which could have a material adverse effect on our business, financial condition and results of operations.
The ability to accurately forecast our operating results and growth rate, which may adversely affect our reported results.
We may not be able to accurately forecast our operating results and growth rate. We use a variety of factors in our forecasting and planning processes, including historical results, recent history and assessments of economic and market conditions, among other things. The growth rates in sales and profitability that we have experienced historically may not be sustainable as our active customer base expands and we achieve higher market penetration rates, and our percentage growth rates may decrease. The growth of our sales and profitability depends on the continued growth of demand for the merchandise we offer. A softening of demand, whether caused by changes in customer preferences or a weakening of the economy or other factors, may result in decreased net sales or growth. Furthermore, many of our expenses and investments
13
are fixed, and we may not be able to adjust our spending in a timely manner to compensate for any unexpected shortfall in our net sales results. Failure to accurately forecast our operating results and growth rate could cause our actual results to be materially lower than anticipated, and if our growth rates decline as a result, investors’ perceptions of our business may be adversely affected, and the market price of our common stock could decline.
Inventory shrinkage could have a material adverse effect on our business, financial condition and results of operations.
We are subject to the risk of inventory loss and theft. Although our inventory shrinkage rates have not been material, and have not fluctuated significantly in recent years, there can be no assurances that actual rates of inventory loss and theft in the future will be within our estimates or that the measures we are taking will effectively reduce inventory shrinkage. Although some level of inventory shrinkage is an unavoidable cost of doing business in our industry, if we were to experience higher rates of inventory shrinkage or incur increased security costs to combat inventory theft, it could have a material adverse effect on our business, financial condition and results of operations.
We occupy our stores under long-term leases, which are subject to future increases in occupancy costs, which we may be unable to renew on favorable terms and which may limit our flexibility to move to new locations.
We lease all of our store locations, our corporate headquarters and our distribution and customer contact center. We typically occupy our stores under operating leases with terms of up to 10 years, which may include options to renew for additional multi-year periods thereafter. We depend on cash flow from operations to pay our lease expenses. If our business does not generate sufficient cash flow from operating activities to fund these expenses, we may not be able to service our lease expenses, which could materially harm our business. In the future, we may not be able to negotiate favorable lease terms. Our inability to do so may cause our occupancy costs to be higher in future years or may force us to close stores in desirable locations. If we are unable to renew our store leases, we may be forced to close or relocate a store, which could subject us to significant construction and other costs. Closing a store, for even a brief relocation period, would reduce the revenue contribution of that store. Additionally, the revenue and profit, if any, generated at a relocated store may not equal the revenue and profit generated at the previous location.
Long-term leases can limit our flexibility to move a store to a new location. If an existing or future store is not profitable, we are nonetheless committed to perform our obligations under the applicable lease including, among other things, paying the base rent for the balance of the lease term, unless the lease has an early termination clause which allows us the right to close under certain specified lease terms. Some of our leases have early cancellation clauses, which permit the lease to be terminated if certain sales levels are not met in specific periods. However, even if a lease has an early cancellation clause, we may not satisfy the contractual requirements for early cancellation under that lease. Our ability to enter into new leases or renew existing leases on terms acceptable to us or be released from our obligations under leases for stores that we close could have a material adverse effect on our business, financial condition and results of operations.
Our ability to manage our inventory levels, size assortments and merchandise mix, including with respect to our omnichannel retail operations, could have a material adverse effect on our business, financial condition and results of operations.
Customer demand is difficult to predict and the lead times required for a substantial portion of our merchandise make it challenging for us to respond quickly to changes. Though we have the ability to source certain merchandise categories with shorter lead times, we generally enter into contracts for a substantial portion of our merchandise well in advance of the applicable selling season. Our business, financial condition and results of operations could be materially adversely affected if we are unable to manage inventory levels, size assortments and merchandise mix and respond to changes in customer demand patterns. Inventory levels in excess of customer demand may result in lower than planned profitability. On the other hand, if we underestimate demand for our merchandise, we may experience inventory shortages resulting in missed sales opportunities and lost revenues. Either of these events could significantly affect our operating results and brand image and loyalty. Our profitability may also be impacted by changes in our size assortments, merchandise mix and changes in our pricing. These changes could have a material adverse effect on our business, financial condition and results of operations.
In addition, our omnichannel operations create additional complexities in our ability to manage inventory levels, as well as certain operational issues in stores and on our website, including timely shipping and returns. Accordingly, our success depends to a large degree on continually evolving the processes and technology that enable us to plan and manage inventory levels and fulfill orders, address any related operational issues in store and on our website and further align channels to optimize our omnichannel operations. If we are unable to successfully manage these complexities, it may have a material adverse effect on our business, financial condition and results of operations.
14
Relying on third-party service providers, such as Federal Express, UPS Mail Innovations and the U.S. Postal Service, for the delivery of our merchandise and our catalogs, could have a material adverse effect on our business, financial condition and results of operations.
We primarily utilize Federal Express to support retail store shipping. We use a combination of Federal Express and UPS Mail Innovations for the majority of our direct-to-consumer shipping. We also use the U.S. Postal Service to deliver millions of catalogs each year, and we depend on third parties to print and mail our catalogs. As a result, postal rate increases and paper and printing costs impact the cost of our catalog, promotional mailings and our products to the extent we pass such increases directly to our customers. We rely on discounts from the basic postal rate structure, such as discounts for bulk mailings and sorting, but there remains uncertainty in the future costs of such mailings, particularly as a result of the well-documented operational and financial difficulties of the U.S. Postal Service. Any significant and unanticipated increase in postage, shipping costs, surcharges, reduction in service, slow-down in delivery or increase in paper and printing costs could impair our ability to deliver merchandise and catalogs in a timely or economically efficient manner. As a result, our profitability may be negatively impacted if we are unable to pass such increases directly on to our customers or if we are unable to implement more efficient delivery and order fulfillment systems, all of which could have a material adverse effect on our business, financial condition and results of operations.
Competitive pricing pressures with respect to shipping our merchandise to our customers may harm our business and results of operations.
In addition to cost increases driven by our third-party service providers, we face competitive pricing pressures with respect to the shipping and handling fees we charge our Direct customers, which are intended to recover our related shipping and handling expenses. Online and omnichannel retailers are increasing their focus on delivery services, as customers are increasingly seeking faster, guaranteed delivery times and low-price or free shipping. To remain competitive, we may be required to offer discounted, free or other more competitive shipping options to our customers, which may result in declines in our shipping and handling fees charged to customers and an increase in the shipping and handling expenses paid by us. Declines in revenue from customers for shipping and handling fees that are not offset by declines in our shipping and handling expense, or if our shipping and handling expenses increase with no proportional increase in revenue to cover such increase, could have a material adverse effect on our business, financial condition and results of operations.
Payment-related risks, including compliance with regulations, increased fee expenses, reliance on third-party and data security risks, could have a material adverse effect on our business, financial condition and results of operations.
We accept payments using a variety of methods, including credit cards, debit cards, gift cards, cash and bank checks. For existing and future payment methods we offer to our customers, we may become subject to additional regulations and compliance requirements (including obligations to implement enhanced authentication processes that could result in increased costs and reduce the ease of use of certain payment methods), as well as fraud. For certain payment methods, including credit and debit cards, we pay interchange and other fees, which may increase over time, thereby raising our operating costs and lowering profitability. We rely on third-party service providers for payment processing services, including the processing of credit and debit cards. In each case, it could disrupt our business if these third-party service providers become unwilling or unable to provide these services to us. We are also subject to payment card association operating rules, including data security rules, certification requirements and rules governing electronic funds transfers, which could change or be reinterpreted to make it difficult or impossible for us to comply with such rules. If we fail to comply with these rules or requirements, or if our data security systems are breached or compromised, we may be liable for card issuing banks’ and others’ costs, we may be subject to fines and higher transaction fees and/or we may lose our ability to accept credit and debit card payments from our customers and process electronic funds transfers or facilitate other types of payments. Any of these developments could have a material adverse effect on our business, financial condition and results of operations.
Interruptions in our third- party, foreign sourcing operations and the relationships with our suppliers and agents could disrupt production, shipment or receipt of our merchandise, which would result in lost sales and increased costs.
We do not own or operate any manufacturing facilities and therefore depend upon independent, third-party suppliers for the manufacturing of all our merchandise, primarily through our use of buying agents. In Fiscal Year 2023, approximately 80% of our products were sourced through agents and approximately 20% were sourced directly from suppliers and factories. Our merchandise is manufactured to our specifications primarily by factories outside of the United States. Some of the factors that might affect a supplier’s ability to ship orders of our merchandise in a timely manner or to meet our quality standards are outside of our control, including inclement weather, natural disasters, negative global climate patterns, political and financial instability, including the conflict in Ukraine and in the Middle East and the surrounding regions, and related
15
sanctions, legal and regulatory developments, strikes, health concerns regarding infectious diseases (such as the outbreak of COVID-19), and acts of terrorism. Inadequate labor conditions, health or safety issues in the factories where goods are produced can negatively impact the reputation of our brand. Late delivery of merchandise or delivery of merchandise that does not meet our quality standards could cause us to miss the delivery date requirements of our customers or delay timely delivery of merchandise to our stores for those items. These events could cause us to fail to meet customer expectations, cause our customers to cancel orders or cause us to be unable to deliver merchandise in sufficient quantities or of sufficient quality to our stores, which could result in lost sales.
We have no long-term merchandise supply contracts as we typically transact business on an order-by-order basis. If we are unable to maintain good relationships with our suppliers and agents and are unexpectedly required to change suppliers or agents, or if a key supplier or agent is unable or unwilling to supply acceptable merchandise in sufficient quantities on acceptable terms, we could experience a significant disruption in the supply of merchandise. We could also experience operational difficulties with our suppliers, such as reductions in the availability of production capacity, supply chain disruptions, errors in complying with merchandise specifications, insufficient quality control, shortages of fabrics or other raw materials, failures to meet production deadlines or increases in manufacturing costs.
Currently, we source our imported merchandise from 11 countries. The top three by volume are India, Indonesia, and Vietnam and we also source some merchandise from China. In Fiscal Year 2023, approximately 46% of our products were sourced in southeast Asia. Any event causing a sudden disruption of manufacturing or imports from Asia or elsewhere, including epidemic or pandemic or the imposition of additional import restrictions, could materially harm our operations. For example, the U.S. government has imposed tariffs on goods imported from China in connection with China’s intellectual property practices and forced technology transfer. Adverse changes in import costs and restrictions, including tariffs, or the failure by us or our suppliers to comply with trade regulations or similar laws, could harm our business. In this regard, the increasingly protectionist trade policy in the United States has introduced greater uncertainty with respect to future tax and trade regulations. If additional tariffs or trade restrictions are implemented by the United States or other countries in connection with a global trade war, the cost of our products manufactured in China or other countries and imported into the United States or other countries could increase, which in turn could adversely affect the demand for these products and have an adverse effect on our business and results of operations. These potential developments, market perceptions concerning these and related issues and the attendant regulatory uncertainty regarding, for example, the posture of governments with respect to international trade, could have a material adverse effect on global trade and economic growth which, in turn, can adversely affect our business, financial condition and results of operations. In addition, many of our imports are subject to existing or potential duties, tariffs or quotas that may limit the quantity of certain types of goods that may be imported into the United States from countries in Asia or elsewhere. We compete with other companies for production facilities and import quota capacity. While substantially all foreign purchases of our merchandise are negotiated and paid for in U.S. dollars, the cost of our merchandise may be affected by fluctuations in the value of relevant foreign currencies. In addition, we are engaging in growing the amount of production carried out in other developing countries. These countries may present other risks with regard to infrastructure available to support manufacturing, labor and employee relations, political and economic stability, corruption, regulatory, environmental, health and safety compliance. While we endeavor to monitor and audit facilities where our production is done, any significant events with factories we use can adversely impact our reputation, brand and product delivery.
Furthermore, many of our suppliers rely on working capital financing to support their operations. To the extent any of our suppliers are unable to obtain adequate credit or their borrowing costs increase, we may experience delays in obtaining merchandise, our suppliers increasing their prices or our suppliers modifying payment terms in a manner that is unfavorable to us.
If we experience significant supply chain disruptions, the Company may not be able to develop alternate sourcing quickly on favorable terms, if at all, which could result in increased costs, loss of sales and a loss of customers, and adversely impact our financial condition and results of operations.
The failure of our suppliers to comply with our social compliance program requirements could have a material adverse effect on our reputation, business, financial condition and results of operations.
We require our third-party suppliers to comply with all applicable laws and regulations, as well as our Terms of Engagement-Commitment to Ethical Sourcing, which cover many areas, including labor, health, safety, environmental and other legal standards. We monitor compliance with these standards using third-party monitoring firms. Although we have an active program to provide training for our third-party suppliers and monitor their compliance with these standards, we do not control the suppliers or their practices. Any failure of our third-party suppliers to comply with our ethical sourcing standards or labor or other local laws in the country of manufacture, or the divergence of a third-party supplier’s labor practices from those generally accepted as ethical in the United States, could disrupt the shipment of merchandise to our stores, force us to locate alternative manufacturing sources, reduce demand for our merchandise, damage our reputation and/or expose us to potential liability for their wrongdoings. Any of these events could have a material adverse effect on our reputation, business, financial condition and results of operations.
16
Relying on third parties to provide services in connection with certain aspects of our business, and any failure by these third parties to perform their obligations could have an adverse effect on our business, financial condition and results of operations.
We have entered into agreements with third parties that include, but are not limited to, logistics services, information technology systems (including hosting our website), servicing certain customer calls, software development and support, catalog production, select marketing services, distribution and employee benefits servicing. Services provided by third-party suppliers could be interrupted as a result of many factors, such as acts of nature or contract disputes. Any failure by a third party to provide services for which we have contracted on a timely basis or within expected service levels and performance standards could result in a disruption of our business and have an adverse effect on our business, financial condition and results of operations.
Increases in the demand for, or the price of, cotton and other raw materials used to manufacture our merchandise or other fluctuations in sourcing or distribution costs could increase our costs and negatively impact our profitability.
We believe that we have strong supplier relationships, and we work continuously with our suppliers to manage cost increases. Our overall profitability depends, in part, on the success of our ability to mitigate rising costs or shortages of raw materials used to manufacture our merchandise. Cotton and other raw materials used to manufacture our merchandise are subject to availability constraints and price volatility impacted by a number of factors, including supply and demand for fabrics, weather, government regulations, economic climate and other unpredictable factors. In addition, our sourcing costs may fluctuate due to labor conditions, transportation or freight costs, energy prices, currency fluctuations or other unpredictable factors. The cost of labor at many of our third-party suppliers has been increasing in recent years, and we believe it is unlikely that such cost pressures will abate.
Most of our merchandise is shipped from our suppliers by ocean vessel. If a disruption occurs in the operation of ports through which our merchandise is imported, we may incur increased costs related to air freight or use of alternative ports. Shipping by air is significantly more expensive than shipping by ocean and our margins and profitability could be reduced. Shipping to alternative ports could also lead to delays in receipt of our merchandise. We rely on third-party shipping companies to deliver our merchandise to us. Failures by these shipping companies to deliver our merchandise to us or lack of capacity in the shipping industry could lead to delays in receipt of our merchandise or increased expense in the delivery of our merchandise. Any of these developments could have a material adverse effect on our business, financial condition and results of operations.
Unseasonal or severe weather conditions may adversely affect our merchandise sales.
Our business is adversely affected by unseasonal weather conditions. Sales of certain seasonal apparel items are dependent in part on the weather and may decline when weather conditions do not favor the use of this apparel. Severe weather events may also impact our ability to supply our retail stores, deliver orders to customers on schedule and staff our retail stores and distribution and customer contact center, which could have a material adverse effect on our business, financial condition and results of operations.
If our distribution and customer contact center is damaged or closed or if its operations are diminished, that could have a material adverse effect on our business, financial condition and results of operations.
Our distribution and customer contact center is located in Tilton, New Hampshire. The distribution center manages the receipt, storage, sorting, packing and distribution of merchandise to our stores and to our Direct customers. Independent third-party transportation companies then deliver merchandise from the distribution center to our stores or to our Direct customers. The customer contact center handles all customer interactions, other than those in retail stores, including phone sales orders as well as customer service calls, emails and internet contacts. Any significant interruption in the operations of our Tilton distribution and customer contact center, our third-party distribution, fulfillment or transportation providers, for any reason, including natural disasters, accidents, inclement weather, technology system failures, work stoppages, slowdowns or strikes or other unforeseen events and circumstances could delay or impair our ability to receive orders and to distribute merchandise to our stores and/or our Direct customers and could impair our ability to respond to customer outreach. This could lead to inventory issues, increased costs, lower sales adversely impact brand loyalty and customer satisfaction, among other things, which could adversely affect our business, financial condition and results of operations.
17
War, terrorism, acts of piracy, civil unrest or other violence may negatively impact availability of merchandise and/or otherwise adversely impact our business.
In the event of war, terrorism, civil unrest or other violence, our ability to obtain merchandise available for sale in our stores or on our websites may be negatively impacted. A substantial portion of our merchandise is imported from other countries, see “Interruptions in our third-party, foreign sourcing operations and the relationships with our suppliers and agents could disrupt production, shipment or receipt of our merchandise, which would result in lost sales and increased our costs.” If commercial transportation is curtailed or substantially delayed, our business may be adversely impacted, as we may have difficulty shipping merchandise to our distribution and customer contact center and stores, as well as fulfilling catalog and website orders. In addition, our stores are located in public areas where large numbers of people typically gather. Terrorist attacks, threats of terrorist attacks or civil unrest involving public areas could cause people not to visit areas where our stores are located. Other types of violence in malls or in other public areas could lead to lower customer traffic in areas in which we operate stores. If any of these events were to occur, we may be required to suspend operations in some or all of our stores, which could have a material adverse effect on our business, financial condition and results of operations.
ESG matters, including those related to climate change and inclusion and diversity matters, our reporting of such matters, or sustainability ratings could negatively impact our business, results of operations and financial condition.
ESG related matters have received increased focus recently from investors, employees, ratings agencies, governmental agencies and other stakeholders. From time to time, we may publish statements relating to our commitment to responsible business, including commitments relating to greenhouse gas (“GHG”) emissions. Such statements reflect the Company’s current plans and aspirations at the time they are made, and should not be construed as guarantees or that we will be able to achieve them. Our failure to adequately update, accomplish or accurately track and report on these commitments on a timely basis, or at all, could adversely affect our reputation, financial performance and growth, and expose us to increased scrutiny from the investment community, special interest groups and enforcement authorities. In addition, there exists certain “anti-ESG” sentiment among some individuals and government institutions, and we may also face scrutiny, reputational risk, lawsuits or market access restrictions from these parties regarding our ESG initiatives. Additionally, we may face increased scrutiny related to any third party sustainability ratings we receive, which could adversely affect our reputation, business, and results of operations.
Risks Related to Our Indebtedness
The terms of our term loan credit agreement and asset-based revolving credit facility restrict our operational and financial flexibility, which could adversely affect our ability to respond to changes in our business and to manage our operations.
Our term loan credit agreement, dated as of April 5, 2023 (the “Term Loan Credit Agreement” and, such facility, the “Term Loan”), by and among the lenders party thereto and Jefferies Finance LLC, as administrative and collateral agent, our Asset-Based Revolving credit agreement, dated as of December 1, 2023, by and among the Company, Jill Acquisition LLC, J.Jill Gift Card Solutions, Inc the other guarantors party thereto, the other lenders party thereto, and CIT Finance LLC, as the administrative agent and collateral agent. (as amended, the “ABL Credit Agreement” and, such facility, the “ABL Facility” and, together with the Term Loan, the “Credit Facilities” and, the agreements governing such facilities, the “Credit Agreements”), each contain, and any additional debt financing we may incur would likely contain, covenants that restrict our operations, including limitations on our ability to, among other things, incur additional indebtedness, create liens on assets, make investments, loans or advances, engage in mergers, consolidations, sales of assets and purchases, pay dividends and distributions, enter into transactions with affiliates, and make payments in respect of junior indebtedness. A failure by us to comply with the covenants contained in our Credit Agreements could result in an event of default under each respective Credit Agreement, which could adversely affect our ability to respond to changes in our business and manage our operations. Upon the occurrence of an event of default, the lenders could elect to declare all amounts outstanding to be immediately due and payable and exercise other remedies as set forth in our Credit Agreements. If the indebtedness under our Credit Agreements were to be accelerated, our future financial condition could be materially adversely affected. See “Management’s Discussion and Analysis of Financial Condition and Results of Operations—Liquidity and Capital Resources—General.”
Our level of indebtedness could have a material adverse effect on our ability to generate sufficient cash to fulfill our obligations under such indebtedness, to react to changes in our business and to incur additional indebtedness to fund future needs.
As of February 3, 2024, we had $168.4 million aggregate principal amount of borrowings under the Credit Agreements. If our cash flows and capital resources are insufficient to fund our debt service obligations, we may be forced to
18
reduce or delay investments and capital expenditures or to sell assets, seek additional capital or restructure or refinance our indebtedness. Our ability to restructure or refinance our current or future debt will depend on the condition of the capital markets and our financial condition at such time. Any refinancing of our debt could be at higher interest rates and may require us to comply with more onerous covenants, which could further restrict our business operations. The terms of existing or future debt instruments may restrict us from adopting some of these alternatives. We cannot provide assurance that our business will be able to generate sufficient levels of cash or that future borrowings or other financings will be available to us in an amount sufficient to enable us to service our indebtedness and fund our other liquidity needs. These financing risks, in addition to potential rising interest rates and changes in market conditions, if realized, could negatively impact our business, financial condition and results of operations. See Note 9. Debt to the audited consolidated financial statements included in this Annual Report for more information on our indebtedness.
Having a substantial amount of indebtedness under our Credit Agreements which matures in the near term, and the scheduled maturity dates are in close proximity to each other.
We have a substantial amount of indebtedness under our Credit Agreements, and the scheduled maturity dates of our Credit Agreements are in close proximity to each other. Our Term Loan Credit Agreement will mature on May 8, 2028 and our ABL Facility will mature on May 10, 2028 (or 180 days prior to the maturity date of the Company’s Term Loan Credit Agreement if the maturity date of such Term Loan Facility has not been extended to a date that is at least 180 days after the maturity date of the ABL Credit Agreement). As a result, we can make no assurance that we will be able to refinance these agreements on acceptable terms prior to their maturity dates. Market disruptions or other credit factors, such as rising inflation and higher interest rates, are expected to increase our cost of borrowing or adversely affect our ability to refinance our obligations as they become due.
Risks Related to Our Operations Governance Structure and Common Stock
Continuing to incur significant costs and devote substantial management time as a result of operating as a public company.
As a public company, we will continue to incur significant legal, accounting and other expenses. For example, we are required to comply with certain requirements of the Sarbanes-Oxley Act and the Dodd-Frank Wall Street Reform and Consumer Protection Act, as well as rules and regulations subsequently implemented by the Securities and Exchange Commission, and the NYSE, our stock exchange, including the establishment and maintenance of effective disclosure and financial controls and changes in corporate governance practices. Compliance with these requirements will result in significant legal and financial compliance costs and will make some activities more time consuming and costly. In addition, our management and other personnel will need to divert attention from operational and other business matters to devote substantial time to these public company requirements.
We are a “smaller reporting company” within the meaning of the Securities Act of 1933, as amended (the “Securities Act”) and are taking advantage of reduced disclosure requirements applicable to “smaller reporting companies,” which could make our common stock less attractive to investors and make it more difficult to compare our performance with other public companies.
We are a “smaller reporting company,” as defined in Item 10(f)(1) of Regulation S-K. Smaller reporting companies may take advantage of certain reduced disclosure obligations, including, among other things, ability to provide simplified executive compensation information. We will remain a smaller reporting company until the last day of the fiscal year in which (i) the market value of our common stock held by non-affiliates is greater than or equal to $250 million as of the end of that fiscal year’s second fiscal quarter, or (ii) our annual revenues are greater than or equal to $100 million during the last completed fiscal year and the market value of our common stock held by non-affiliates exceeds $700 million as of the end of that fiscal year’s second fiscal quarter. For so long as we continue to be a smaller reporting company, we intend to take advantage of these reduced disclosure obligations.
We are a “controlled company” within the meaning of the NYSE rules and, as a result, qualify for and intend to rely on exemptions from certain corporate governance requirements.
TowerBrook controls a majority of the voting power of our outstanding voting stock, and as a result we are a controlled company within the meaning of the NYSE corporate governance standards. Under the NYSE rules, a company of which
19
more than 50% of the voting power is held by another person or group of persons acting together is a controlled company and may elect not to comply with certain corporate governance requirements, including the requirements that:
These requirements will not apply to us for so long as we remain a controlled company. Accordingly, you may not have the same protections afforded to stockholders of companies that are subject to all of the corporate governance requirements of the NYSE.
We continue to be controlled by TowerBrook, and TowerBrook’s interests may conflict with our interests and the interests of other stockholders.
TowerBrook owns a majority of our common stock. As a result, TowerBrook will have effective control over the outcome of votes on all matters requiring approval by our stockholders, including entering into significant corporate transactions such as mergers, tender offers and the sale of all or substantially all of our assets and issuance of additional debt or equity. In addition, as long as TowerBrook beneficially owns at least 50% of our common stock, the Stockholders Agreement provides TowerBrook with veto rights with respect to certain material matters. The interests of TowerBrook and its affiliates could conflict with or differ from our interests or the interests of our other stockholders. For example, the concentration of ownership held by TowerBrook could delay, defer or prevent a change of control of our company or impede a merger, takeover or other business combination which may otherwise be favorable for us. Additionally, TowerBrook is in the business of making investments in companies and may, from time to time, acquire and hold interests in businesses that compete, directly or indirectly with us. TowerBrook may also pursue acquisition opportunities that may be complementary to our business, and as a result, those acquisition opportunities may not be available to us. So long as TowerBrook continues to directly or indirectly own a significant amount of our equity, even if such amount is less than 50%, TowerBrook will continue to be able to substantially influence or effectively control our ability to enter into corporate transactions.
As of April 5, 2023, the Subordinated Credit Loan was repaid in full. Refer to Note 9. Debt for additional information on repayment of the Subordinated Credit Agreement.
Our certificate of incorporation contains a provision renouncing our interest and expectancy in certain corporate opportunities.
Our certificate of incorporation provides for the allocation of certain corporate opportunities between us and TowerBrook. Under these provisions, neither TowerBrook, its portfolio companies, funds or other affiliates, nor any of their officers, directors, agents, stockholders, members or partners have any duty to refrain from engaging, directly or indirectly, in the same business activities, similar business activities or lines of business in which we operate. For instance, a director of our company who also serves as a director, officer, partner or employee of TowerBrook or any of its portfolio companies, funds or other affiliates may pursue certain acquisitions or other opportunities that may be complementary to our business and, as a result, such acquisition or other opportunities may not be available to us. These potential conflicts of interest could have a material adverse effect on our business, financial condition, results of operations or prospects if attractive corporate opportunities are allocated by TowerBrook to itself or its portfolio companies, funds or other affiliates instead of to us.
Provisions in our organizational documents and Delaware law may discourage our acquisition by a third party.
Our certificate of incorporation authorizes our board of directors to issue preferred stock without stockholder approval. If the board of directors elects to issue preferred stock, it could be more difficult for a third party to acquire us. In addition, some provisions of our certificate of incorporation and bylaws could make it more difficult for a third party to acquire control of us, even if the change of control would be beneficial to our stockholders.
Section 203 of the General Corporation Law of the State of Delaware (the “DGCL”) affects the ability of an “interested stockholder” to engage in certain business combinations, for a period of three years following the time that the stockholder becomes an “interested stockholder.” We have elected in our certificate of incorporation not to be subject to Section 203 of the DGCL. Nevertheless, our certificate of incorporation contains provisions that have the same effect as Section 203 of the DGCL, except that it provides that affiliates of TowerBrook and their transferees will not be deemed to be “interested stockholders,” regardless of the percentage of our voting stock owned by them, and will therefore not be subject to such restrictions. These charter provisions may limit the ability of third parties to acquire control of our company.
20
We are a holding company and rely on dividends, distributions and other payments, advances and transfers of funds from our subsidiaries to meet our obligations.
We are a holding company that does not conduct any business operations of our own. As a result, we are largely dependent upon cash dividends and distributions and other transfers from our subsidiaries to meet our obligations. The agreements governing the indebtedness of our subsidiaries impose restrictions on our subsidiaries’ ability to pay dividends or other distributions to us. See “Management’s Discussion and Analysis of Financial Condition and Results of Operations—Liquidity and Capital Resources—General.” The deterioration of the earnings from, or other available assets of, our subsidiaries for any reason could also limit or impair their ability to pay dividends or other distributions to us.
Future sales of our common stock in the public market, or the perception in the public market that such sales may occur, could reduce our stock price.
We have 10,614,454 outstanding shares of common stock as of February 3, 2024. The number of outstanding shares of common stock includes 5,817,375 shares, including shares controlled by TowerBrook, that are “restricted securities,” as defined under Rule 144 under the Securities Act, and eligible for sale in the public market subject to the requirements of Rule 144. The Subordinated Lenders have been issued warrants under the prior Subordinated Term Loan Facility. On May 31, 2021, the Company chose to issue 272,097 additional shares of Common Stock under the prior Priming Facility. As a result of this choice and because of the antidilution provision under the warrant agreement, the warrants became exercisable into 3,820,748 shares of common stock. Exercise of the warrants and sales of significant amounts of stock in the public market could adversely affect prevailing market prices of our common stock.
Our stock price has been and may continue to be volatile and there can be no assurances that a viable public market for our common stock will be maintained.
The market price of our common stock could vary significantly as a result of a number of factors, some of which are beyond our control. In the event of a drop in the market price of our common stock, you could lose a substantial part or all of your investment in our common stock. The following factors could affect our stock price:
The stock markets in general have experienced extreme volatility that has often been unrelated to the operating performance of particular companies. These broad market fluctuations may adversely affect the trading price of our common stock and an active liquid and orderly trading market for our common stock may not be maintained. Active, liquid and orderly trading markets usually result in less price volatility and more efficiency in carrying out investors’ purchase and sale orders. We cannot predict the extent to which investor interest in our common stock will lead to the maintenance of an active trading market on the NYSE or otherwise how liquid that market might continue to be. If an active public market for our common stock is not sustained, it may be difficult for you to sell your shares at a price that is attractive to you or at all.
Securities class action litigation has often been instituted against companies following periods of volatility in the overall market and in the market price of a company’s securities. A securities class action lawsuit, if instituted against us,
21
could result in substantial costs, divert our management’s attention and resources and harm our business, financial condition and results of operations.
If securities or industry analysts do not publish research or reports about our business or publish negative reports, our stock price could decline.
The trading market for our common stock will be influenced by the research and reports that industry or securities analysts publish about us or our business. If one or more of these analysts cease coverage of our company or fail to publish reports on us regularly, we could lose visibility in the financial markets, which in turn could cause our stock price or trading volume to decline. Moreover, if one or more of the analysts who cover our company downgrades our common stock or if our operating results do not meet their expectations, our stock price could decline.
The issuance by us of additional shares of common stock or convertible securities may dilute your ownership of us and could adversely affect our stock price.
From time to time in the future, we may register additional shares of our common stock issued or reserved for issuance to our employees, issue additional shares of our common stock or securities convertible into common stock pursuant to a variety of transactions, including acquisitions. The issuance by us of additional shares of our common stock or securities convertible into our common stock would dilute your ownership of us and the sale of a significant amount of such shares in the public market could adversely affect prevailing market prices of our common stock.
We may issue preferred stock with terms that could adversely affect the voting power or value of our common stock.
Our certificate of incorporation authorizes us to issue, without the approval of our stockholders, one or more classes or series of preferred stock having such designations, preferences, limitations and relative rights, including preferences over our common stock respecting dividends and distributions, as our board of directors may determine. The terms of one or more classes or series of preferred stock could adversely impact the voting power or value of our common stock. For example, we might grant holders of preferred stock the right to elect some number of our directors in all events or on the happening of specified events or the right to veto specified transactions. Similarly, the repurchase or redemption rights or liquidation preferences we might assign to holders of preferred stock could affect the residual value of the common stock.
Our designation of the Delaware Court of Chancery as the exclusive forum for certain types of stockholder legal proceedings could limit our stockholders’ ability to obtain a more favorable forum.
Our certificate of incorporation provides that unless we consent in writing to the selection of an alternative forum, the Court of Chancery of the State of Delaware will, to the fullest extent permitted by applicable law, be the sole and exclusive forum for (i) any derivative action or proceeding brought on our behalf, (ii) any action asserting a claim of breach of a fiduciary duty owed by any of our directors, officers, employees or agents to us or our stockholders, (iii) any action asserting a claim arising pursuant to any provision of the DGCL, our certificate of incorporation or our bylaws or (iv) any action asserting a claim against us that is governed by the internal affairs doctrine, in each such case subject to such Court of Chancery having personal jurisdiction over the indispensable parties named as defendants therein. Any person or entity purchasing or otherwise acquiring any interest in shares of our capital stock will be deemed to have notice of, and consented to, the provisions of our certificate of incorporation described in the preceding sentence. This choice of forum provision may limit a stockholder’s ability to bring a claim in a judicial forum that it finds favorable for disputes with us or our directors, officers, employees or agents, which may discourage such lawsuits against us and such persons. See “Description of Capital Stock—Forum Selection.” Alternatively, if a court were to find these provisions of our certificate of incorporation inapplicable to, or unenforceable in respect of, one or more of the specified types of actions or proceedings, we may incur additional costs that we do not currently anticipate associated with resolving such matters in other jurisdictions, which could adversely affect our business, financial condition and results of operations.
Risks Related to Information Security
Material damage to, or interruptions in, our information systems could have a material adverse effect on our business, financial condition and results of operations, and we may be exposed to risks and costs associated with protecting the integrity and security of our customers’ information.
We depend largely upon our information technology systems for all aspects of our operations, including running our website, processing transactions, responding to customer inquiries, managing inventory, purchasing, selling and shipping goods on a timely basis and maintaining cost-efficient operations. Such systems are subject to damage or interruption from
22
power outages, computer and telecommunications failures, computer viruses, security breaches and natural disasters. Damage to or interruption of our information technology systems may require a significant investment to fix or replace the affected system, and we may suffer interruptions in our operations as a result. In addition, costs and interruptions associated with the implementation of new or upgraded systems and technology, such as our new POS system or with maintenance or adequate support of existing systems could also disrupt or reduce the efficiency of our operations.
Additionally, a significant number of customer purchases across our omnichannel platform are made using credit cards, and a significant number of our customer orders are placed through our website. We process, store and transmit large amounts of data, including personal information, for our customers. From time to time, we may implement strategic initiatives related to elevating our customer service experience, such as customer membership programs, where we collect and maintain increasing amounts of customer data. We also handle and transmit sensitive information about our suppliers and workforce, including social security numbers, bank account information and health and medical information. We depend in part on the secure transmission of confidential information over public networks throughout our operations. In addition, security breaches can also occur due to non-technical issues, including vandalism, catastrophic events and human error. Our operations may further be impacted by security breaches that occur at third-party suppliers. Although we maintain cyber-security insurance, there can be no assurances that our insurance coverage will be sufficient, or that insurance proceeds will be paid to us in a timely manner.
States and the federal government have enacted additional laws and regulations to protect consumers against identity theft, including laws governing treatment of personally identifiable information. As data privacy and security laws and regulations evolve, we may be subject to more extensive requirements to protect the customer information that we process in connection with the purchases of our merchandise. There can be no assurances that we will be able to operate our operations in accordance with Payment Card Industry Data Security Standards ("PCI DSS"), other industry recommended practices or applicable laws and regulations or any future security standards or regulations, or that meeting those standards will, in fact, prevent a data breach. These laws have increased the costs of doing business and, if we fail to implement appropriate safeguards or we fail to detect and provide prompt notice of unauthorized access as required by some of these laws, we could be subject to potential claims for damages and other remedies.
If a third party can circumvent our security measures, they could destroy or steal valuable information or disrupt our operations. Because techniques used to obtain unauthorized access or to sabotage systems change frequently and often are not recognized until launched against a target, we may be unable to anticipate these techniques or to implement adequate preventative measures. Any security breach could expose us to risks of data loss, fines, litigation and liability and could seriously disrupt our operations and harm our reputation. In addition, we could be required to expend significant resources to change our business practices or modify our service offerings in connection with the protection of personally identifiable information, which could have a material adverse effect on our business, financial condition and results of operations.
The impact of privacy breaches at service providers could severely damage our business and reputation.
We rely heavily on technology services provided by third parties for the successful operation of our business, including electronic messaging, digital marketing efforts and the collection and retention of customer data and associate information. We also rely on third parties to host our website, process credit card transactions, perform ecommerce and social media activities and retain data relating to our financial position and results of operations, strategic initiatives and other important information. The facilities and systems of our third-party service providers may be vulnerable to cyber-security breaches, acts of vandalism, computer viruses, misplaced or lost data, programming and/or human errors or other similar events. Any actual or perceived misappropriation, loss or other unauthorized disclosure of confidential or personally identifiable information by our third-party service providers could severely damage our reputation and our relationship with our customers, associates and investors as well as expose us to risks of litigation, liability or other penalties, all of which could have a material adverse effect on our business, financial condition and results of operations.
The protection of our data involves a variety of risks, including both potential cyber-attacks as well as any potential failure to comply with data protection laws and regulations, any of which could subject us to sanctions and damages and could harm our reputation and business.
We collect and process personal data as part of our business. As a result, we are subject to U.S. data protection laws and regulations at both the federal and state levels. The legislative and regulatory landscape for data protection continues to evolve, and in recent years there has been an increasing focus on privacy and data security. The strategic use of our customer database, including interactions with our customers, marketing efforts and analysis of customer behavior, rely on the collection, retention and use of customer data and may be affected by these laws and regulations and their interpretation and enforcement. Alleged violations of laws, regulations or contractual obligations relating to privacy and data protection, and
23
any relevant claims, may expose us to potential liability, require us to expend significant resources in responding to and defending such allegations and claims, and result in negative publicity and a loss of confidence in us by our customers, all of which could have an adverse effect on our business, financial condition and results of operations. Further, it is unclear how the laws and regulations relating to the collection, process and use of personal data will further develop in the United States, and to what extent this may affect our operations in the future. Any failure to comply with data protection laws and regulations, or future changes required to the way in which we use personal data could have a material adverse effect on our business, financial condition and results of operations.
In addition, information security threats, particularly cybersecurity threats, could pose risks to the security of our systems and networks, as well as the confidentiality, availability and integrity of our data.
Although we maintain systems and processes that are designed to protect the security of our computer systems, software, networks and other technology, there is no assurance that all of our security measures will provide absolute security. Any material incidents could cause us to experience financial losses that are either not insured against or not fully covered through any insurance maintained by us and increased expenses related to addressing or mitigating the risks associated with any such material incidents. Cyber threats are rapidly evolving and are becoming increasingly sophisticated. Despite our efforts to ensure the integrity of our systems, as cyber threats evolve and become more difficult to detect and successfully defend against, one or more cyber threats might defeat the measures that we or our vendors take to anticipate, detect, avoid or mitigate such threats.
To date, we have not experienced a significant compromise, significant data loss or any material financial losses related to cybersecurity attacks, but our systems and those of our customers and third-party service providers are under constant threat and it is possible that we or they could experience a significant event in the future. Risks and exposures related to cybersecurity attacks are expected to remain high for the foreseeable future due to the rapidly evolving nature and sophistication of these threats, as well as due to the expanding use of ecommerce, mobile banking and other technology-based products and services by us and our customers. Any potential breach of our information technology systems and databases could have a material adverse effect on our business, financial condition and results of operations.
Risks Related to Labor Force
We depend on our executive management and key personnel and may not be able to retain or replace these employees or recruit additional qualified personnel, which could harm our business.
The loss of the services of any of our senior executives could have a material adverse effect on our business, financial condition and results of operations, as we may not be able to find suitable management personnel to replace departing executives on a timely basis. In addition, we believe that our future success will depend greatly on our continued ability to attract and retain highly skilled and qualified personnel. There is a high level of competition for personnel in the retail industry. Our inability to meet our staffing requirements in the future could impair our ability to increase revenue and could otherwise harm our business.
Labor organizing and other activities could negatively impact us.
Currently, none of our employees are represented by a union. However, our employees have the right at any time to form or affiliate with a union. Such organizing activities could lead to work slowdowns or stoppages, which could lead to disruption in our operations and increases in our labor costs, either of which could materially adversely affect our business, financial condition and results of operations.
Our failure to find store employees that reflect our brand image and embody our culture could adversely affect our business, financial condition and results of operations.
Our success depends in part upon our ability to attract, motivate and retain a sufficient number of store employees, including store managers, who understand and appreciate our culture and customers, and are able to adequately and effectively represent this culture and establish credibility with our customers. The store employee turnover rate in the retail industry is generally high. Labor shortages and excessive store employee turnover will result in higher employee costs associated with finding, hiring and training new store employees. If we are unable to hire and retain store personnel capable of consistently providing a high level of customer service, our ability to open new stores and operate existing stores may be impaired and our performance and brand image may be negatively impacted. Competition for such qualified individuals and wage increases by other retailers could require us to pay higher wages to attract a sufficient number of employees. We are also dependent upon temporary personnel to adequately staff our stores and distribution and customer contact center, with
24
heightened dependence during busy periods such as the holiday season. There can be no assurances that there will be sufficient sources of suitable temporary personnel to meet our demand. Any such failure to meet our staffing needs or any material increases in employee turnover rates could have a material adverse effect on our business, financial condition and results of operations.
Increases in labor costs, including wages, could adversely affect our business, financial condition and results of operations.
The labor costs associated with our retail stores and our distribution and customer contact center are subject to many external factors, including unemployment levels, prevailing wage rates, minimum wage laws, potential collective bargaining arrangements, health insurance costs and other insurance costs and changes in employment and labor legislation or other workplace regulation. From time to time, legislative proposals are made to increase the federal minimum wage in the United States, as well as the minimum wage in a number of individual states and municipalities, and to reform entitlement programs, such as health insurance and paid leave programs. As minimum wage rates increase or related laws and regulations change, our labor costs may increase. Any increase in the cost of our labor could have an adverse effect on our business, financial condition and results of operations or if we fail to pay such higher wages we could suffer increased employee turnover. Increases in labor costs could force us to increase prices, which could adversely impact our sales. If competitive pressures or other factors prevent us from offsetting increased labor costs by increases in prices, our profitability may decline and could have a material adverse effect on our business, financial condition and results of operations.
Risks Related to Intellectual Property Matters
Being unable to protect our trademarks and other intellectual property rights.
We believe that our trademarks and service marks are important to our success and our competitive position due to their name recognition with our customers. We devote substantial resources to the establishment and protection of our trademarks and service marks. We are not aware of any valid claims of infringement or challenges to our right to use any of our trademarks and service marks. Nevertheless, there can be no assurances that the actions we have taken to establish and protect our trademarks and service marks will be adequate to prevent imitation of our merchandise by others or to prevent others from seeking to block sales of our merchandise as a violation of the trademarks, service marks and intellectual property of others. Also, others may assert rights in, or ownership of, our trademarks and other intellectual property and we may not be able to successfully resolve these types of conflicts to our satisfaction.
We may be subject to liability if we infringe upon the intellectual property rights of third parties.
Because of the potential similarity between clothing produced in a competitive and saturated market, third parties may sue us for alleged infringement of their proprietary rights. The party claiming infringement might have greater resources than we do to pursue its claims, and we could be forced to incur substantial costs and devote significant management resources to defend against such litigation. If the party claiming infringement were to prevail, we could be forced to discontinue the use of the related trademark or design, pay significant damages and/or enter into expensive royalty or licensing arrangements with the prevailing party, assuming these royalty or licensing arrangements are available at all on an economically feasible basis, which they may not be. Such infringement claims could harm our brand. In addition, any payments we are required to make and any injunction we are required to comply with as a result of such infringement could have a material adverse effect on our business, financial condition and results of operations.
Risks Related to Legal, Regulatory, Accounting and Compliance Matters
Changes to estimates related to our property, fixtures and equipment or operating results that are lower than our current estimates at certain store locations may cause us to incur impairment charges on certain long-lived assets, which may adversely affect our results of operations.
In accordance with accounting guidance as it relates to the impairment of long-lived assets, we make certain estimates and projections with regard to individual store operations, as well as our overall performance, in connection with our impairment analyses for long-lived assets. When impairment triggers are deemed to exist for any location, the estimated undiscounted future cash flows are compared to its carrying value. If the carrying value exceeds the undiscounted cash flows, an impairment charge equal to the difference between the carrying value and the fair value is recorded. The projections of future cash flows used in these analyses require the use of judgment and a number of estimates and projections of future
25
operating results. If actual results differ from our estimates, additional charges for asset impairments may be required in the future. If future impairment charges are significant, our reported operating results would be adversely affected.
In Fiscal Year 2023, the Company reduced the net carrying value of certain long-lived assets to their estimated fair value, which was determined using a discounted cash flows method. The Company incurred $0.2 million of impairment charges related primarily to leasehold improvements.
Goodwill and identifiable intangible assets represent a significant portion of our total assets and any impairment of these assets, or other changes in accounting standards or assumptions, could adversely affect our results of operations.
Our goodwill and indefinite-lived intangible assets, which consist of goodwill from the controlling interest in the company held by JJill Holdings, Inc. and JJill Topco Holdings, LP, and our trade name, represented a significant portion of our total assets as of February 3, 2024. Accounting rules require the evaluation of our goodwill and indefinite-lived intangible assets for impairment at least annually, or more frequently when events or changes in circumstances indicate that the carrying value of such assets may not be recoverable. Such indicators are based on market conditions and the operational performance of our business. If in conducting an impairment evaluation we determine that the carrying value of an asset exceeded its fair value, we would be required to record a non-cash impairment charge for the difference between the carrying value and the fair value of the asset. If a significant amount of our goodwill and identifiable intangible assets were deemed to be impaired, our business, financial condition and results of operations could be materially adversely affected.
More broadly, other changes in accounting standards and subjective assumptions, estimates and judgments by management related to complex accounting matters could significantly affect our financial results or financial condition. Generally accepted accounting principles and related accounting pronouncements, implementation guidelines and interpretations with regard to a wide range of matters that are relevant to our business (including, but not limited to, revenue recognition, business combinations, impairment of goodwill, indefinite-lived intangible assets and long-lived assets, inventory and equity-based compensation) are highly complex and involve many subjective assumptions, estimates and judgments. Changes in these rules or their interpretation or changes in underlying assumptions, estimates or judgments could significantly change our reported or expected financial performance or financial condition.
If we are unable to design, implement and maintain effective internal controls in accordance with Section 404 of the Sarbanes-Oxley Act, it could have a material adverse effect on our business and stock price.
As a public company, we have significant requirements for enhanced financial reporting and internal controls. The process of designing and implementing effective internal controls is a continuous effort that requires us to anticipate and react to changes in our business and the economic and regulatory environments and to expend significant resources to maintain a system of internal controls that is adequate to satisfy our reporting obligations as a public company. If we are unable to maintain appropriate internal financial reporting controls and procedures, it could cause us to fail to meet our reporting obligations on a timely basis, result in material misstatements in our consolidated financial statements and harm our operating results. In addition, pursuant to Section 404 of the Sarbanes-Oxley Act, as amended, we are required to furnish a report by management and our independent registered public accounting firm is required to attest to, among other things, the effectiveness of our internal control over financial reporting. This assessment includes disclosure of any material weaknesses identified by our management in our internal control over financial reporting. Testing and maintaining internal controls may divert our management’s attention from other matters that are important to our business. We may not be able to conclude on an ongoing basis that we have effective internal control over financial reporting in accordance with Section 404 of the Sarbanes-Oxley Act.
We are subject to laws and regulations in the jurisdictions in which we operate and changes to the regulatory environment in which we operate or failure to comply with applicable laws and regulations could adversely affect our business, financial condition and results of operations.
Our business requires compliance with many laws and regulations in the United States and abroad, including, without limitation, labor and employment, tax, environmental, privacy, anti-bribery laws and regulations, trade laws and customs, truth-in-advertising, ecommerce, consumer protection and zoning and occupancy laws and ordinances that regulate retailers generally and/or govern the importation, promotion and sale of merchandise and the operation of stores and warehouse facilities. In addition, in the future, there may be new legal or regulatory requirements or more stringent interpretations of applicable requirements, which could increase the complexity of the regulatory environment in which we operate and the related cost of compliance. While it is our policy and practice to comply with all legal and regulatory requirements and our procedures and internal controls are designed to ensure such compliance, failure to achieve compliance could subject us to lawsuits and other proceedings, and could also lead to damage awards, fines and penalties. Litigation matters may include,
26
among other things, government and agency investigations, employment, commercial, intellectual property, tort, advertising and stockholder claims. We cannot predict with certainty the outcomes of these legal proceedings and other contingencies. The outcome of some of these legal proceedings, audits and other contingencies could require us to take, or refrain from taking, actions which could negatively affect our operations or require us to pay substantial amounts of money adversely affecting our business, financial condition and results of operations. Even a claim of an alleged violation of applicable laws or regulations could negatively affect our reputation. Additionally, defending against these lawsuits and proceedings may be necessary, which could result in substantial costs and diversion of management’s attention and resources, causing a material adverse effect on our business, financial condition and results of operations. Any pending or future legal proceedings and audits could have a material adverse effect on our business, financial condition and results of operations.
Government agencies and listing exchanges have mandated or proposed, and others may in the future further mandate certain ESG requirements and disclosures. For example, on March 6, 2024, the SEC adopted a final rule that will require smaller reporting companies, such as the Company, to make certain climate-related disclosures, including information about climate-related risks, risk management and oversight of climate-related risks, related targets or goals and certain climate-related financial statement metrics. To ensure compliance with the new rule, we may be required to establish additional internal controls, engage additional consultants, and incur additional costs related to measuring and evaluating our environmental impact and preparing such disclosures. If we fail to implement sufficient internal controls or accurately capture and disclose relevant data concerning our ESG activities, our reputation, business, financial condition and results of operations may be materially adversely affected.
Changes in tax laws and regulations or in our operations may impact our effective tax rate and may adversely affect our business, financial condition and operating results.
Changes in tax laws in any of the multiple jurisdictions in which we operate, or adverse outcomes from tax audits that we may be subject to in any of the jurisdictions in which we operate, could result in an unfavorable change in our effective tax rate, which could adversely affect our business, financial condition and operating results. Developments in tax policy or trade relations, such as the disallowance of tax deductions for imported merchandise or the imposition of tariffs on imported products, could have a material adverse effect on our business, results of operations and liquidity. In particular, the implementation of an increase to the corporate income tax rate for U.S. corporations could adversely impact our liquidity, business, financial condition and results of operations. Changes in tax laws result in uncertainty as to how tax laws will be applied to us and require us to perform computations that were not required previously.
Item 1B. Unresolved Staff Comments
None.
Item 1C. Cybersecurity
Overview
Maintaining the safety and security of our systems and data is essential to the success of our company. As with other industries, there are several cybersecurity threats we encounter. These include phishing, ransomware, and denial of service, among others. Our suppliers, vendors, and other partners face similar threats. A cybersecurity incident impacting us or any of these entities could materially affect our operations, performance, or financial results. See Item 1A, Risks Related to Information Security for additional details.
The governance of our risk management program is a partnership between our cross functional management team and our Board of Directors. This program includes both a cyber team led by our Chief Information Officer (“CIO”), as well as an Enterprise Risk Management (“ERM”) program led by our head of compliance. Our CIO has 30 years of information technology experience, including over 3 years of direct oversight of information security. Risk oversight for both our cyber and ERM programs is primarily the responsibility of the Audit Committee of the Board of Directors who receive quarterly updates, at a minimum, with additional updates shared to the full Board of Directors on a recurring basis.
Cyber Security Team
Our cross functional cyber security team is responsible for the overall information security strategy, risk assessment, cyber threat detection and response, and execution of an ongoing cyber program. The goal of this team is to lower the impact and likelihood of persistent threats to the extent feasible, including safeguarding of key information and the integrity of key systems. We also partner with third-party vendors to enhance our program including monitoring, pen testing, and other
27
assessments and programs. Additionally, the Company has implemented certain information security measures which include security reviews as well as internal training and testing programs.
Enterprise Risk Management (ERM) Program
Our cyber risks are included in our ERM program. Our ERM program is led by our Senior Director of Compliance and Internal Audit and has oversight from our Audit Committee. This program includes a cross functional team including our senior leadership team and other key members of management. Risk reduction plans are developed and updates are regularly assessed by the team. Our Audit Committee provides oversight and is briefed quarterly, at a minimum. In the event a cyber incident should occur, there are additional steps taken to mitigate cybersecurity risks and incidents.
As of the date of this filing, we are not aware of any current cybersecurity threats or cybersecurity incidents that have materially affected or are reasonably likely to materially affect our business, results of operations or financial condition.
Item 2. Properties
We are headquartered in Quincy, Massachusetts. Our principal executive offices are leased under a lease agreement expiring in December 2027, with options to renew thereafter. Our 520,000 square foot distribution and customer contact center, located in Tilton, New Hampshire, supports both our Retail and Direct channels and is leased under a lease agreement expiring in September 2030, with options to renew thereafter. We consider these properties to be in good condition and believe that our facilities are adequate for operations and provide sufficient capacity to meet our anticipated future requirements.
As of February 3, 2024, we operated 244 stores in 42 states. Of these stores, approximately half are located in lifestyle centers and half in premium malls. The average size of our stores is approximately 3,700 square feet. All of our retail stores are leased from third parties and new stores historically have had terms of ten years. The weighted-average remaining lease term is 2 years. A portion of our leases have options to renew for periods up to five years. Generally, store leases contain standard provisions concerning the payment of rent, events of default and the rights and obligations of each party. Rent due under the leases is generally comprised of annual base rent plus a contingent rent payment based on the store’s sales in excess of a specified threshold. Some of the leases also contain early termination options, which can be exercised by us or the landlord under certain conditions. The leases also generally require us to pay real estate taxes, insurance and certain common area costs. We renegotiate with landlords to obtain more favorable terms as opportunities arise.
The current terms of our leases expire as follows:
Fiscal Years Lease Terms Expire |
|
Number of Stores |
|
|
2023 – 2025 |
|
|
106 |
|
2026 – 2028 |
|
|
113 |
|
2029 – 2031 |
|
|
20 |
|
2032 and later |
|
|
5 |
|
The table below sets forth the number of retail stores by state that we operated as of February 3, 2024.
|
|
Number |
|
|
|
|
Number |
|
|
|
|
Number |
|
|||
State |
|
of Stores |
|
|
State |
|
of Stores |
|
|
State |
|
of Stores |
|
|||
Alabama |
|
|
5 |
|
|
Kentucky |
|
|
2 |
|
|
New York |
|
|
12 |
|
Arizona |
|
|
5 |
|
|
Louisiana |
|
|
5 |
|
|
North Carolina |
|
|
9 |
|
Arkansas |
|
|
3 |
|
|
Maine |
|
|
1 |
|
|
Ohio |
|
|
8 |
|
California |
|
|
21 |
|
|
Maryland |
|
|
6 |
|
|
Oklahoma |
|
|
3 |
|
Colorado |
|
|
5 |
|
|
Massachusetts |
|
|
11 |
|
|
Oregon |
|
|
5 |
|
Connecticut |
|
|
7 |
|
|
Michigan |
|
|
8 |
|
|
Pennsylvania |
|
|
13 |
|
Delaware |
|
|
1 |
|
|
Minnesota |
|
|
6 |
|
|
Rhode Island |
|
|
1 |
|
Florida |
|
|
10 |
|
|
Mississippi |
|
|
2 |
|
|
South Carolina |
|
|
5 |
|
Georgia |
|
|
10 |
|
|
Missouri |
|
|
4 |
|
|
Tennessee |
|
|
8 |
|
Idaho |
|
|
1 |
|
|
Nebraska |
|
|
1 |
|
|
Texas |
|
|
15 |
|
Illinois |
|
|
12 |
|
|
Nevada |
|
|
2 |
|
|
Utah |
|
|
1 |
|
Indiana |
|
|
3 |
|
|
New Hampshire |
|
|
1 |
|
|
Virginia |
|
|
7 |
|
Iowa |
|
|
2 |
|
|
New Jersey |
|
|
11 |
|
|
Washington |
|
|
5 |
|
Kansas |
|
|
2 |
|
|
New Mexico |
|
|
1 |
|
|
Wisconsin |
|
|
4 |
|
28
Item 3. Legal Proceedings
We are not presently party to any legal proceedings the resolution of which we believe would have a material adverse effect on our business, financial condition, operating results or cash flows. We establish reserves for specific legal matters when we determine that the likelihood of an unfavorable outcome is probable and the loss is reasonably estimable.
Item 4. Mine Safety Disclosures
Not applicable.
29
PART II
Item 5. Market for Registrant’s Common Equity, Related Stockholder Matters and Issuer Purchases of Equity Securities
Market Information
Our common stock began trading publicly on the NYSE under the symbol “JILL” on March 9, 2017. Prior to that time, there was no public market for our common stock.
The following table sets forth the high and low sales prices of our common stock as reported on the NYSE for the Fiscal Years 2023 and 2022 quarters ended, respectively:
|
|
Fiscal Year 2023 |
|
|
Fiscal Year 2022 |
|
||||||||||
|
|
High |
|
|
Low |
|
|
High |
|
|
Low |
|
||||
First |
|
$ |
30.36 |
|
|
$ |
22.75 |
|
|
$ |
17.00 |
|
|
$ |
12.47 |
|
Second |
|
$ |
25.00 |
|
|
$ |
18.85 |
|
|
$ |
20.72 |
|
|
$ |
15.14 |
|
Third |
|
$ |
29.91 |
|
|
$ |
21.49 |
|
|
$ |
20.80 |
|
|
$ |
15.45 |
|
Fourth |
|
$ |
32.26 |
|
|
$ |
23.06 |
|
|
$ |
27.52 |
|
|
$ |
20.04 |
|
Holders of Record
As of February 3, 2024, there were approximately 25 holders of record of our common stock. This number does not include beneficial owners whose shares are held of record by banks, brokers and other financial institutions.
Dividends
We did not pay any dividends on our common stock during Fiscal Years 2023, 2022 and 2021 and do not have any current plans to pay a cash dividend on our common stock for the foreseeable future.
The payment of cash dividends in the future, if any, will be at the discretion of our board of directors and will depend upon such factors as earnings levels, capital requirements, restrictions imposed by applicable law, our overall financial condition, restrictions in our debt agreements, including in our Credit Agreements, and any other factors deemed relevant by our board of directors. As a holding company, our ability to pay dividends depends on our receipt of cash dividends from our operating subsidiaries, which may further restrict our ability to pay dividends as a result of restrictions on their ability to pay dividends to us under our Credit Facilities and under future indebtedness that we or they may incur. See “Management’s Discussion and Analysis of Financial Condition and Results of Operations—Liquidity and Capital Resources—General.”
30
Performance Graph
The following graph shows a comparison from February 2, 2019 through February 3, 2024, of the cumulative total return for our common stock, the S&P 500 Index and an S&P Retail Index. The graph assumes $100 was invested in each of the Company’s common stock, the S&P 500 Index and the S&P Retail Index as of the market close on February 2, 2019. Such returns are based on historical results and are not intended to suggest future performance.
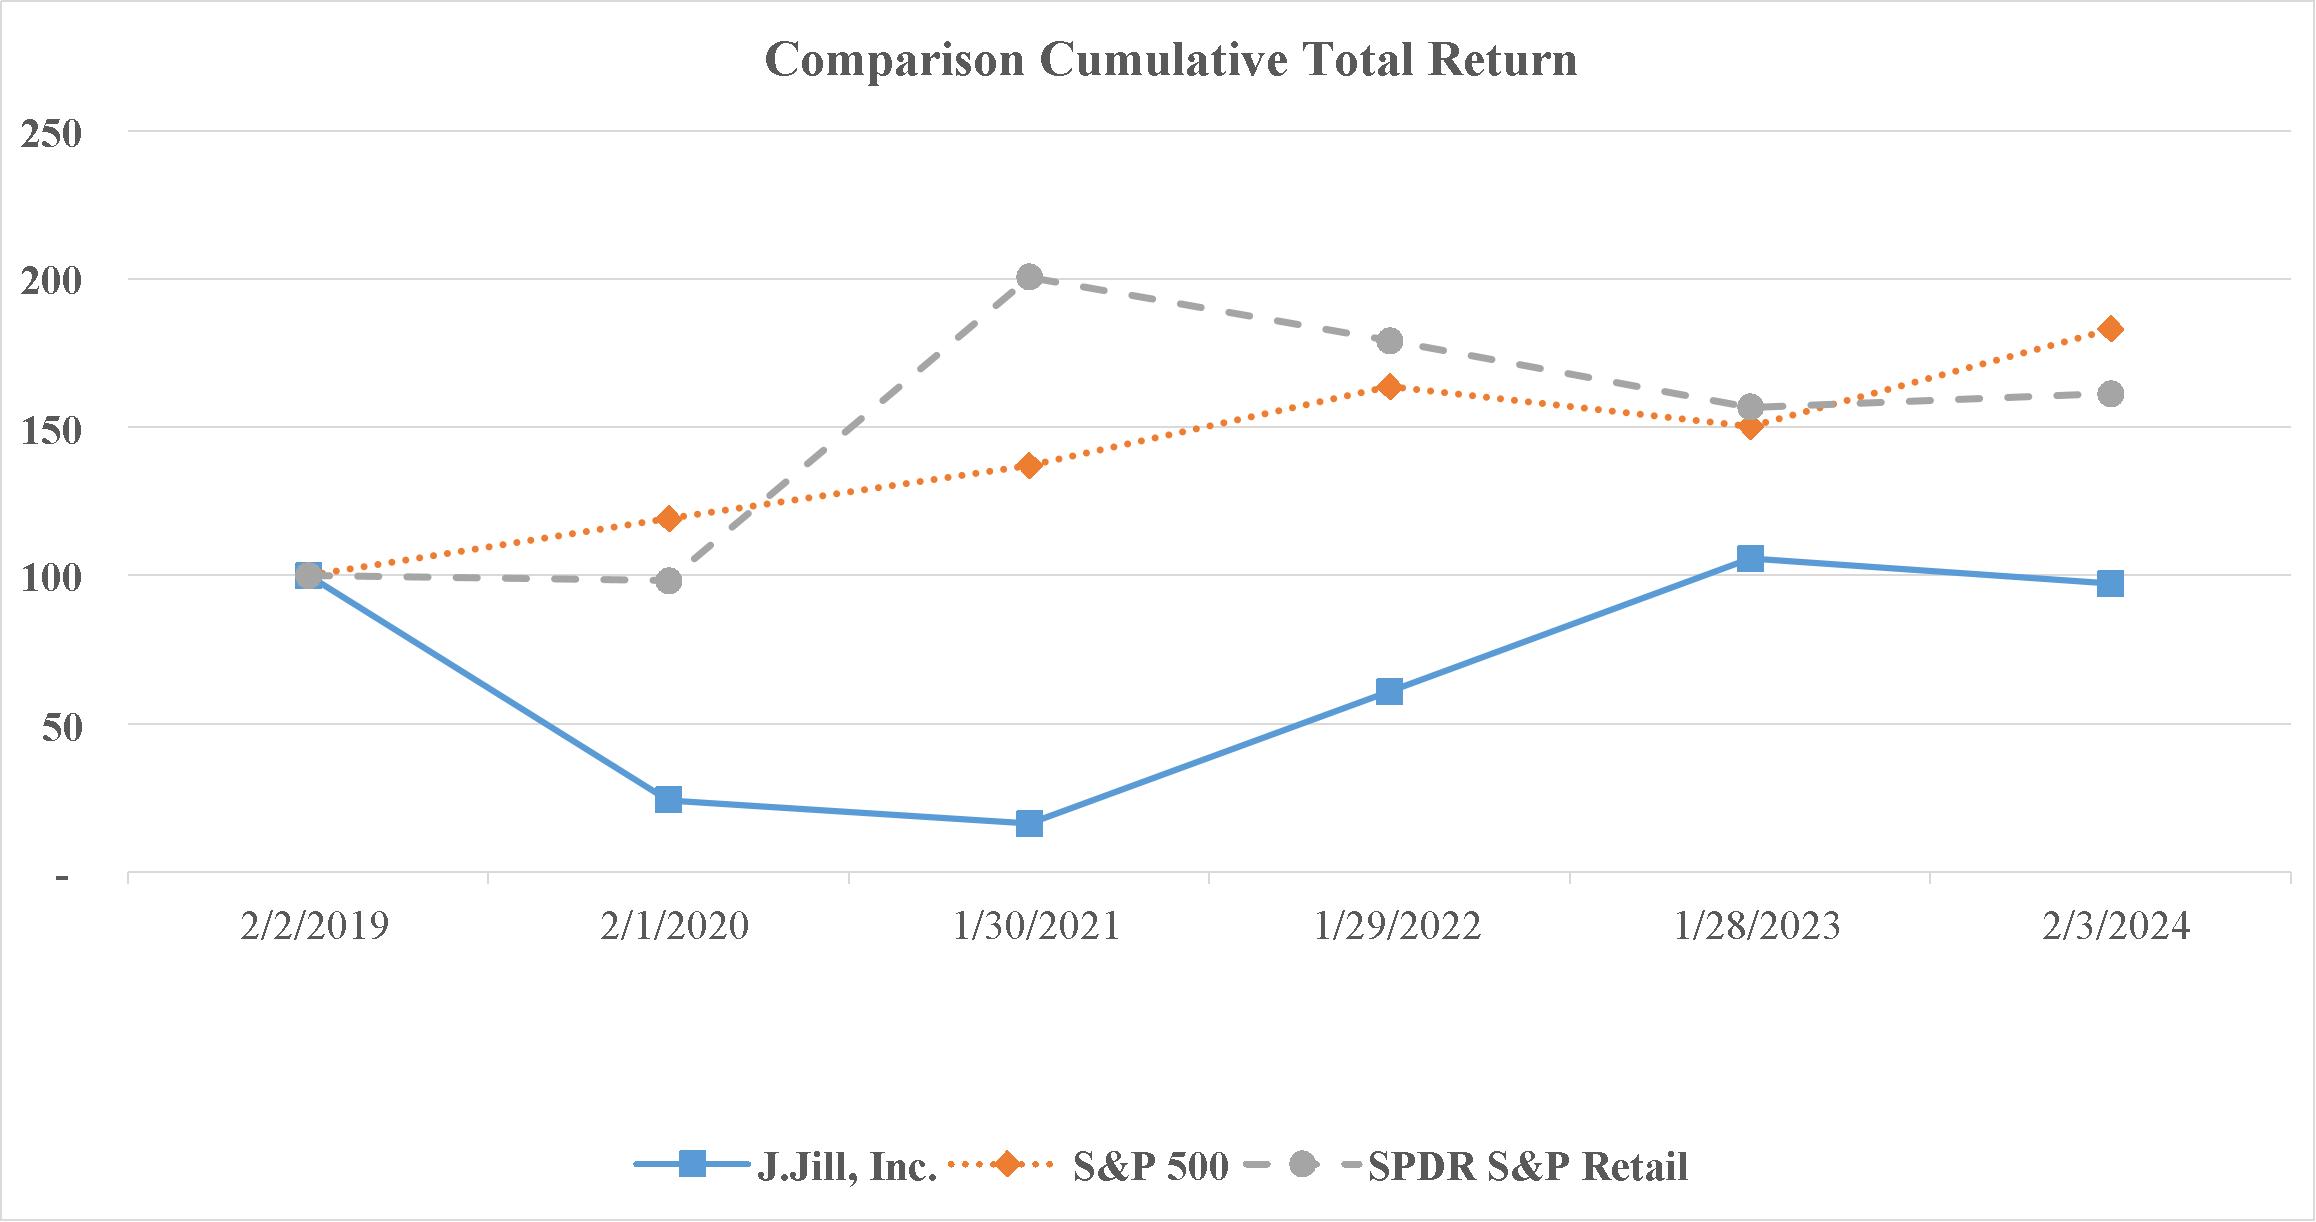
Purchases of Equity Securities by the Issuer and Affiliated Purchasers
None.
Securities Authorized for Issuance Under Equity Compensation Plans
Information regarding our equity compensation plans is set forth in Item 12, Security Ownership of Certain Beneficial Owners and Management and Related Shareholder Matters.
Item 6. [Reserved]
31
Item 7. Management’s Discussion and Analysis of Financial Condition and Results of Operations
The following discussion and analysis should be read in conjunction with our consolidated financial statements and related notes thereto included elsewhere in this Annual Report. The following discussion contains forward-looking statements that reflect our plans, estimates and assumptions. Our actual results could differ materially from those discussed in the forward-looking statements. Factors that could cause such differences are discussed in the sections of this Annual Report titled “Risk Factors” and “Cautionary Note Regarding Forward-Looking Statements.”
We operate on a 52- or 53-week fiscal year that ends on the Saturday that is closest to January 31. Each fiscal year generally is comprised of four 13-week fiscal quarters, although in the years with 53 weeks, the fourth quarter represents a 14-week period. References in this Annual Report to “Fiscal Year 2023” refer to the fiscal year ended February 3, 2024, references to the “Fiscal Year 2022” refer to the fiscal year ended January 28, 2023 and references to “Fiscal Year 2021” refer to the fiscal year ended January 29, 2022. Fiscal Year 2023 is comprised of 53 weeks and Fiscal Years 2022, and 2021 are comprised of 52 weeks.
The discussion that follows includes a comparison of our results of operations and liquidity and capital resources for Fiscal Years 2023 and 2022. For the discussion comparing the Fiscal Years 2022 and 2021, refer to Part II, Item 7. Management’s Discussion and Analysis of Financial Condition and Results of Operations in our Fiscal Year 2022 Form 10-K, which was filed with the United States Securities and Exchange Commission on March 30, 2023.
Overview
J.Jill is a national lifestyle brand that provides apparel, footwear and accessories designed to help its customers move through a full life with ease. The brand represents an easy, thoughtful and inspired style that celebrates the totality of all women and designs its products with its core brand ethos in mind: keep it simple and make it matter. J.Jill offers a high touch customer experience through over 200 stores nationwide and a robust ecommerce platform. J.Jill is headquartered outside Boston.
How We Assess the Performance of Our Business
In assessing the performance of our business, we consider a variety of financial and operating metrics, including accounting principles generally accepted in the United States of America (“GAAP”) and non-GAAP measures, such as:
Net sales consist primarily of revenues, net of merchandise returns and discounts, generated from the sale of apparel and accessory merchandise through our Retail and Direct channels. Net sales also include shipping and handling fees collected from customers, and royalty revenues and marketing reimbursements related to our private label credit card agreement. Retail revenue is recognized at the time of sale and Direct revenue is recognized upon shipment of merchandise to the customer.
Net sales are impacted by the size of our active customer base, product assortment and availability, marketing and promotional activities and the spending habits of our customers. Net sales are also impacted by the migration of single-channel customers to omnichannel customers who, on average, spend three times more than single-channel customers.
Total company comparable sales include net sales from our retail stores that have been open for more than 52 weeks and from our Direct channel. This measure highlights the performance of existing stores open during the period, while excluding the impact of new store openings and closures. When a store in the total company comparable store base is temporarily closed for four or more days within a fiscal week, the store is excluded from the comparable store base; if it is temporarily closed for three or fewer days within a fiscal week, the store is included within the comparable store base. Certain of our competitors and other retailers may calculate total company comparable sales differently than we do. Our comparable sales are based on a 52-week period. As a result, the reporting of our total company comparable sales may not be comparable to sales data made available by other companies.
Number of stores reflects all stores open at the end of a reporting period. In connection with opening new stores, we incur pre-opening costs. Pre-opening costs include expenses incurred prior to opening a new store and primarily consist of payroll, travel, training, marketing, initial opening supplies and costs of transporting initial inventory and fixtures to retail stores, as well as occupancy costs incurred from the time of possession of a store site to the opening of that store. In connection with closing stores, we incur store-closing costs. Store-closing costs primarily consist of lease termination penalties and costs of transporting inventory and fixtures to other store locations. These pre-opening and store-closing costs are included in selling, general and administrative expenses and are generally incurred and expensed within 30 days of opening a new store or closing a store.
32
Gross profit is equal to our net sales less costs of goods sold. Gross profit as a percentage of our net sales is referred to as gross margin.
Costs of goods sold (“COGS”) includes the direct costs of sold merchandise, inventory shrinkage, and adjustments and reserves for excess, aged and obsolete inventory. We review our inventory levels on an ongoing basis to identify slow-moving merchandise and use markdowns to liquidate these products. Changes in the assortment of our products may also impact our gross profit. The timing and level of markdowns are driven by customer acceptance of our merchandise. The Company’s COGS, and consequently gross profit, may not be comparable to those of other retailers, as inclusion of certain costs vary across the industry.
The variability in COGS is due to raw materials, transportation and freight costs. These costs fluctuate based on certain factors beyond our control, including labor conditions, inbound transportation or freight costs, energy prices, currency fluctuations and commodity prices. We place orders with merchandise suppliers in U.S. dollars and, as a result, are not exposed to significant foreign currency exchange risk.
Selling, general and administrative expenses include all operating costs not included in COGS. These expenses include all payroll and related expenses, occupancy costs, information systems costs and other operating expenses related to our stores and to our operations at our headquarters, including utilities, depreciation and amortization. These expenses also include marketing expense, including catalog production and mailing costs, warehousing, distribution and outbound shipping costs, customer service operations, consulting and software services, professional services and other administrative costs. Additionally, our outbound shipping costs may fluctuate due to surcharges from shipping vendors based on demand for shipping services.
Our historical revenue growth has been accompanied by increased selling, general and administrative expenses. The most significant increases were in marketing and payroll investments.
Adjusted earnings before interest, taxes, depreciation and amortization (“Adjusted EBITDA”) and Adjusted EBITDA Margin. Adjusted EBITDA, represents net income (loss) plus net interest expense, provision (benefit) for income taxes, depreciation and amortization, equity-based compensation expense, goodwill and indefinite-lived intangible assets impairment, write-off of property and equipment, loss on debt refinancing, adjustment for exited retail stores, fair value adjustments, and other non-recurring expenses, primarily consisting of outside legal and professional fees associated with certain non-recurring transactions and events. We present Adjusted EBITDA on a consolidated basis because management uses it as a supplemental measure in assessing our operating performance, and we believe that it is helpful to investors, securities analysts and other interested parties as a measure of our comparative operating performance from period to period. We also use Adjusted EBITDA as one of the primary methods for planning and forecasting overall expected performance of our business and for evaluating on a quarterly and annual basis actual results against such expectations. Further, we recognize Adjusted EBITDA as a commonly used measure in determining business value and as such, use it internally to report results. Adjusted EBITDA margin represents, for any period, Adjusted EBITDA as a percentage of net sales.
While we believe that Adjusted EBITDA is useful in evaluating our business, Adjusted EBITDA is a non-GAAP financial measure that has limitations as an analytical tool. Adjusted EBITDA should not be considered an alternative to, or substitute for, net income (loss), which is calculated in accordance with GAAP. In addition, other companies, including companies in our industry, may calculate Adjusted EBITDA differently or not at all, which reduces the usefulness of Adjusted EBITDA as a tool for comparison. We recommend that you review the reconciliation of Adjusted EBITDA to net income (loss), the most directly comparable GAAP financial measure, and the calculation of the resultant Adjusted EBITDA margin below and not rely solely on Adjusted EBITDA or any single financial measure to evaluate our business.
33
Reconciliation of Net Income (Loss) to Adjusted EBITDA and Calculation of Adjusted EBITDA Margin
Fiscal Year Ended February 3, 2024 which is comprised of 53-weeks compared to Fiscal Year Ended January 28, 2023 and January 29, 2022 which are comprised of 52-weeks.
The following table provides a reconciliation of net income (loss) to Adjusted EBITDA and the calculation of Adjusted EBITDA margin for the periods presented:
|
|
For the Fiscal Year Ended |
|
|||||||||
(in thousands) |
|
February 3, 2024 |
|
|
January 28, 2023 |
|
|
January 29, 2022 |
|
|||
Statements of Operations Data: |
|
|
|
|
|
|
|
|
|
|||
Net income (loss) |
|
$ |
36,201 |
|
|
$ |
42,175 |
|
|
$ |
(28,143 |
) |
Add back: |
|
|
|
|
|
|
|
|
|
|||
Depreciation and amortization |
|
|
22,931 |
|
|
|
25,761 |
|
|
|
29,258 |
|
Income tax provision |
|
|
13,164 |
|
|
|
16,499 |
|
|
|
8,018 |
|
Interest expense, net |
|
|
22,909 |
|
|
|
15,946 |
|
|
|
17,057 |
|
Interest expense - related party |
|
|
1,074 |
|
|
|
4,114 |
|
|
|
2,029 |
|
Adjustments: |
|
|
|
|
|
|
|
|
|
|||
Fair value adjustment of derivative |
|
|
— |
|
|
|
— |
|
|
|
2,775 |
|
Fair value adjustment of warrants - related party (a) |
|
|
— |
|
|
|
— |
|
|
|
56,984 |
|
Equity-based compensation expense (b) |
|
|
3,762 |
|
|
|
3,505 |
|
|
|
2,610 |
|
Write-off of property and equipment (c) |
|
|
70 |
|
|
|
267 |
|
|
|
940 |
|
Loss on debt refinancing (d) |
|
|
12,702 |
|
|
|
— |
|
|
|
— |
|
Adjustment for exited retail stores (e) |
|
|
(767 |
) |
|
|
(250 |
) |
|
|
(1,755 |
) |
Impairment of long-lived assets (f) |
|
|
189 |
|
|
|
1,413 |
|
|
|
— |
|
Other non-recurring items (g) |
|
|
2 |
|
|
|
7 |
|
|
|
2,013 |
|
Adjusted EBITDA |
|
$ |
112,237 |
|
|
$ |
109,437 |
|
|
$ |
91,786 |
|
Net sales |
|
$ |
604,661 |
|
|
$ |
615,268 |
|
|
$ |
585,206 |
|
Adjusted EBITDA margin |
|
|
18.6 |
% |
|
|
17.8 |
% |
|
|
15.7 |
% |
Items Affecting the Comparability of our Results of Operations
Impairment losses. Our Fiscal Year 2023 results include $0.2 million of impairment charges for long-lived assets (leasehold improvements and furniture, fixtures and equipment), and our Fiscal Year 2022 results include $1.4 million of impairment charges for long-lived assets (operating lease right-of-use asset, leasehold improvements and furniture, fixtures and equipment).
Fair value adjustments. Fair value adjustments consist of the mark-to-market of warrants and derivative liabilities related to the debt restructuring consummated on September 30, 2020. These fair value adjustments were due to the increase in J.Jill’s stock price from January 30, 2021 through May 31, 2021. Effective May 31, 2021, these liabilities were reclassified to equity because from that date they can only be settled by exercise of the warrants into common stock. Our Fiscal Year 2021 results include fair value adjustments totaling $59.8 million. See Note 14. Net Income (Loss) Per Share, in the notes to the financial statements included elsewhere in this Annual Report, for additional information on these fair value adjustments.
COVID-19 impact. Our Fiscal Year 2021 financial results were significantly impacted by COVID-19. Although the Company lost revenues, we continued to incur certain expenses, such as payroll and rent; therefore, ratios and other items may not be comparable to our Fiscal Year 2023 and Fiscal Year 2022 financial results.
53rd week. The Company’s fiscal year ends on the Saturday, in January or February, nearest the last day of January, resulting in an additional week of results every five or six years. Fiscal Year 2023 contained 53-weeks of operations whereas
34
the Fiscal Years 2022 and 2021 contained 52-weeks of operations. The 53rd week added approximately $7.9 million to net sales and $2.2 million to Adjusted EBITDA for Fiscal Year 2023.
Results of Operations
Fiscal Year Ended February 3, 2024 which is comprised of 53-weeks compared to Fiscal Year Ended January 28, 2023 which is comprised of 52-weeks.
The following table summarizes our consolidated results of operations for the periods indicated:
|
|
For the Fiscal Year Ended |
|
|
Change from Year Ended January 28, 2023 to the Year |
|
||||||||||||||||||
(in thousands) |
|
February 3, 2024 |
|
|
January 28, 2023 |
|
|
Ended February 3, 2024 |
|
|||||||||||||||
|
|
Dollars |
|
|
% of Net |
|
|
Dollars |
|
|
% of Net |
|
|
$ Change |
|
|
% Change |
|
||||||
Net sales |
|
$ |
604,661 |
|
|
|
100.0 |
% |
|
$ |
615,268 |
|
|
|
100.0 |
% |
|
$ |
(10,607 |
) |
|
|
(1.7 |
)% |
Costs of goods sold |
|
|
177,261 |
|
|
|
29.3 |
% |
|
|
193,218 |
|
|
|
31.4 |
% |
|
|
(15,957 |
) |
|
|
(8.3 |
)% |
Gross profit |
|
|
427,400 |
|
|
|
70.7 |
% |
|
|
422,050 |
|
|
|
68.6 |
% |
|
|
5,350 |
|
|
|
1.3 |
% |
Selling, general and administrative expenses |
|
|
341,161 |
|
|
|
56.4 |
% |
|
|
341,903 |
|
|
|
55.6 |
% |
|
|
(742 |
) |
|
|
(0.2 |
)% |
Impairment of long-lived assets |
|
|
189 |
|
|
|
0.0 |
% |
|
|
1,413 |
|
|
|
0.2 |
% |
|
|
(1,224 |
) |
|
|
(86.6 |
)% |
Operating income |
|
|
86,050 |
|
|
|
14.2 |
% |
|
|
78,734 |
|
|
|
12.8 |
% |
|
|
7,316 |
|
|
|
9.3 |
% |
Loss on debt refinancing |
|
|
12,702 |
|
|
|
2.1 |
% |
|
|
— |
|
|
|
0.0 |
% |
|
|
12,702 |
|
|
|
100.0 |
% |
Interest expense, net |
|
|
22,909 |
|
|
|
3.8 |
% |
|
|
15,946 |
|
|
|
2.6 |
% |
|
|
6,963 |
|
|
|
43.7 |
% |
Interest expense - related party |
|
|
1,074 |
|
|
|
0.2 |
% |
|
|
4,114 |
|
|
|
0.7 |
% |
|
|
(3,040 |
) |
|
|
(73.9 |
)% |
Income before provision for income taxes |
|
|
49,365 |
|
|
|
8.2 |
% |
|
|
58,674 |
|
|
|
9.5 |
% |
|
|
(9,309 |
) |
|
|
(15.9 |
)% |
Income tax provision |
|
|
13,164 |
|
|
|
2.2 |
% |
|
|
16,499 |
|
|
|
2.7 |
% |
|
|
(3,335 |
) |
|
|
(20.2 |
)% |
Net income |
|
$ |
36,201 |
|
|
|
6.0 |
% |
|
$ |
42,175 |
|
|
|
6.9 |
% |
|
$ |
(5,974 |
) |
|
|
(14.2 |
)% |
Net Sales
Net sales for Fiscal Year 2023 decreased $10.6 million or 1.7%, to $604.7 million from $615.3 million for Fiscal Year 2022. The decrease in net sales was due to total company comparable sales decrease of 1.4%.
Our Direct channel was responsible for 46.5% of our net sales in Fiscal Year 2023 compared to 46.8% in Fiscal Year 2022. Our Retail channel was responsible for 53.5% of our net sales in Fiscal Year 2023 and 53.2% in Fiscal Year 2022. We operated 244 and 243 retail stores at the end of these same periods, respectively.
Gross Profit and Cost of Goods Sold
Gross profit for Fiscal Year 2023 increased $5.4 million, or 1.3%, to $427.4 million from $422.1 million for Fiscal Year 2022. The gross margin for Fiscal Year 2023 was 70.7% compared to 68.6% for Fiscal Year 2022, largely driven by favorable freight costs and strong full price sales.
Selling, General and Administrative Expenses
Selling, general and administrative expenses for Fiscal Year 2023 decreased $0.7 million, or 0.2%, to $341.2 million from $341.9 million for Fiscal Year 2022. The decrease is driven by a $2.8 million decrease in depreciation and amortization, and a $1.1 million decrease in shipping expenses. The decrease was partially offset by a $1.6 million increase in software application hosting and maintenance expenses and a $1.6 million increase in compensation expenses.
Impairment of long-lived assets
Impairment of long-lived assets for Fiscal Year 2023 decreased by $1.2 million, or 86.6% to $0.2 million from $1.4 million for Fiscal Year 2022. Our Fiscal Year 2023 results include $0.2 million of impairment charges for long-lived assets (leasehold improvements and furniture, fixtures and equipment), and our Fiscal Year 2022 results include $1.4 million of impairment charges for long-lived assets (operating lease right-of-use asset, leasehold improvements and furniture, fixtures and equipment).
35
Loss on debt refinancing
For Fiscal Year 2023, the Company recognized a loss on debt refinancing of $12.7 million related to entering into a Term Loan Credit Agreement and the repayment of the Priming Credit Agreement and the Subordinated Credit Agreement, as discussed in the Liquidity and Capital Resources section below. The Company did not incur any gain or loss on debt refinancing for Fiscal Year 2022.
Interest Expense, net
Interest expense, net consists of interest expense on the Credit Facilities, partially offset by interest earned on cash. Interest expense for Fiscal Year 2023 increased by $3.9 million, or 19.6%, to $24.0 million from $20.1 million for Fiscal Year 2022. The increase was driven by higher interest rates.
Income Tax Provision
The income tax provision for Fiscal Year 2023 was $13.2 million compared to $16.5 million for Fiscal Year 2022. Our effective tax rates were 26.7% and 28.1%, respectively. The effective tax rate during Fiscal Year 2023 differs from the federal statutory rate of 21.0% due primarily to the impacts of (i) state and local income taxes, (ii) executive compensation limitations, and (iii) valuation allowance changes. Refer to Note 13. Income Taxes to the consolidated financial statements for additional income tax information.
The effective tax rate for Fiscal Year 2022 differs from the federal statutory rate of 21.0% due primarily to the impacts of (i) state and local income taxes, (ii) executive compensation limitations, (iii) valuation allowance changes, and (iv) tax return to provision adjustments. The Company paid $19.7 million in cash for income taxes during Fiscal Year 2022 and received tax refunds of approximately $10.3 million relating to prior years.
Liquidity and Capital Resources
General
Our primary sources of liquidity and capital resources are cash and cash equivalents generated from operating activities and availability under our asset-based revolving credit facility agreement (the “ABL Facility”). As of February 3, 2024, we had $62.2 million in cash and cash equivalents and $34.2 million of total availability under our $40.0 million ABL Facility.
On April 5, 2023, the Company and Jill Acquisition LLC (the “Borrower”) entered into a Term Loan Credit Agreement (the “Term Loan Credit Agreement”) by and among the lenders party thereto and Jefferies Finance LLC, as administrative and collateral agent. The Term Loan Credit Agreement provides for a secured term loan facility in an aggregate principal amount of $175.0 million with a maturity date of May 8, 2028 (the “Term Loan Facility”). Loans under the Term Loan Credit Agreement bear interest at the Borrower’s election at (1) Base Rate (as defined in the Term Loan Credit Agreement) plus 7.00% or (2) Adjusted Term SOFR (as defined in the Term Loan Credit Agreement) plus 8.00%, with Adjusted Term SOFR subject to a floor rate of 1.00%.
The Term Loan Facility is to be repaid in quarterly payments of $2.2 million from July 28, 2023 to May 2, 2025, and $3.3 million from August 1, 2025 to April 28, 2028 with the balance of the Term Loan Facility due upon maturity on May 8, 2028. Additionally, the Term Loan Facility is subject to mandatory repayment, subject to certain exceptions, including (i) 100% of the net proceeds of any incurrence of debt other than debt permitted in the Term Loan Credit Agreement, (ii) 100% of the net cash proceeds of certain asset sales/insurance proceeds, subject to reinvestment rights and certain other exceptions, and (iii) 95 days after the last day of the Fiscal Year, an annual payment ranging from 25%-75%, based on the First Lien Net Leverage Ratio, of the annual Excess Cash Flow (“ECF”), less certain voluntary prepayments made during the year, as defined in the Term Loan Credit Agreement.
As of February 3, 2024 the Company expects to make an ECF payment of $26.6 million (amounting to 50% of the annual ECF) for Fiscal Year 2023, in accordance with the provisions of the Term Loan Credit Agreement. The amount expected to be repaid is included in the line item “Current portion of long-term debt” in the Company’s consolidated balance sheet.
The Term Loan Facility may be voluntarily prepaid after the one-year anniversary but on or prior to the two-year anniversary, subject to a premium of 3.0% of the aggregate principal amount being prepaid, and after the two-year anniversary without premium.
The proceeds from the Term Loan Credit Agreement, combined with a portion of the Company’s existing cash on hand, were used to repay in full the outstanding balance of $225.4 million, inclusive of $3.6 million interest, under the Priming Term Loan Credit Agreement (the “Priming Credit Agreement”) and the Subordinated Term Loan Credit Agreement (the “Subordinated Credit Agreement”). All security interests and liens incurred in connection with the Priming Credit
36
Agreement and Subordinated Credit Agreement have been released. The prepayment of the Priming Credit Agreement and Subordinated Credit Agreement was in accordance with the terms of such agreements.
On May 10, 2023, the Company entered into Amendment No. 6 to our ABL Credit Agreement, by and among the Company, J.Jill Gift Card Solutions, the other guarantors party thereto, the other lenders party thereto, and CIT Finance LLC, as the administrative agent and collateral agent. This amendment extended the maturity date of the ABL Credit Agreement from May 8, 2024 to May 10, 2028 (or 180 days prior to the maturity date of the Company’s Term Loan Credit Agreement if the maturity date of such Term Loan Facility has not been extended to a date that is at least 180 days after the maturity date of the ABL Credit Agreement). The other terms and conditions of the ABL Facility remain substantially unchanged.
On December 1, 2023, the Company entered into Amendment No. 7 (the “ABL Amendment”) to the ABL Credit Agreement, by and among the Company, Jill Acquisition LLC, J.Jill Gift Card Solutions, Inc. (collectively, the “Borrowers”), the other guarantors party thereto, the other lenders party thereto, and CIT Finance LLC, as the administrative agent and collateral agent. The ABL Amendment made a technical revision for administrative purposes which removed the requirement for a Borrower’s non-negotiable bill of lading, non-negotiable sea waybill or other similar shipping document (each a “Non-Negotiable Document”) to state on its face that the inventory that is subject to such Non-Negotiable Document is subject to the lien of the administrative agent. In connection with removing this requirement, a $500,000 in transit inventory reserve amount will be applied to eligible in transit inventory on the borrowing base certificate during any period in which excess liability is less than $5.0 million. This increase in the reserve decreases the borrowing base by the same amount during an in-transit inventory reserve period.
The Credit Agreements include customary negative covenants, including covenants limiting the ability of the Company to, among other things, incur additional indebtedness, create liens on assets, make investments, loans or advances, engage in mergers, consolidations, sales of assets and purchases, pay dividends and distributions, enter into transactions with affiliates, and make payments in respect of junior indebtedness. Each of the Term Loan Credit Agreement and the ABL Credit Agreement also has certain financial covenants (see Note 9. Debt to the audited consolidated financial statements included in this Annual Report). As of February 3, 2024, the Company is in compliance with all such covenants.
In response to the COVID-19 pandemic, the Coronavirus Aid, Relief, and Economic Security Act (the “CARES Act”) enacted in March 2020, the Company received federal income tax refunds of $17.5 million in Fiscal Year 2021 and the remaining $9.2 million in Fiscal Year 2022 from the net operating loss carryback provisions relating to the Fiscal Year ended January 30, 2021.
Cash Flow Analysis
The following table shows our cash flows information for the periods presented:
|
|
For the Fiscal Year Ended |
|
|||||||||
(in thousands) |
|
February 3, 2024 |
|
|
January 28, 2023 |
|
|
January 29, 2022 |
|
|||
Net cash provided by operating activities |
|
$ |
63,313 |
|
|
$ |
74,425 |
|
|
$ |
74,999 |
|
Net cash used in investing activities |
|
|
(16,934 |
) |
|
|
(15,067 |
) |
|
|
(5,474 |
) |
Net cash used in financing activities |
|
|
(71,260 |
) |
|
|
(8,262 |
) |
|
|
(37,975 |
) |
Net Cash provided by Operating Activities
Net cash provided by operating activities during Fiscal Year 2023 decreased $11.1 million compared to Fiscal Year 2022. Net income for Fiscal Year 2023 was offset by the increase in cash used for working capital of $12.9 million compared to Fiscal Year 2022. Working capital cash uses consisted of lower cash inflows relating to prepaid expenses and other current assets of $10.8 million driven primarily by lower collection of income tax receivables in the current year, and accrued expenses and other current liabilities of $8.2 million mainly due to lower accrued employee compensation and other accruals, partially offset by the impact of product returns, and inventories of $8.1 million due to increased inventory in-transit. These net cash outflows were partially offset by higher accounts payable of $12.4 million and lower accounts receivable of $3.2 million due to the timing of payments.
Net cash provided by operating activities during Fiscal Year 2023 was $63.3 million. Key elements of cash provided by operating activities were (i) net income of $36.2 million, (ii) adjustments to reconcile net income to net cash provided by operating activities of $43.1 million, primarily driven by $22.9 million of depreciation and amortization and the loss on debt refinancing of $12.7 million, and (iii) the use of cash from net operating assets and liabilities of $16.0 million, primarily driven by accrued expenses and other current liabilities and operating lease assets and liabilities.
Net cash provided by operating activities during Fiscal Year 2022 was $74.4 million. Key elements of cash provided by operating activities were (i) net income of $42.2 million, (ii) adjustments to reconcile net income to net cash provided by operating activities of $35.4 million, primarily driven by $25.8 million of depreciation and amortization, and (iii) the use of
37
cash from net operating assets and liabilities of $3.1 million, primarily driven by accounts payable and operating lease assets and liabilities, partially offset by changes in merchandise inventory and prepaid expenses and other current assets.
Net Cash used in Investing Activities
Net cash used in investing activities during Fiscal Year 2023 was $16.9 million, an increase of $1.9 million as compared to Fiscal Year 2022, representing increased purchases of property, equipment, software and technology-related investments, primarily relating to the new point of sale system.
Net Cash used in Financing Activities
Net cash used in financing activities during Fiscal Year 2023 increased as compared to the prior year. The change was primarily driven by the repayment of the previously existing Priming and Subordinated Credit Agreements offset by the proceeds from issuance of the Term Loan.
Net cash used in financing activities during Fiscal Year 2023 was $71.3 million, which was driven by the full repayment of the previously existing Priming and Subordinated Credit Agreements offset by the proceeds from issuance of the Term Loan.
Net cash used in financing activities during Fiscal Year 2022 was $8.3 million, which was driven by the $5.0 million repayment of the Existing Term Loan and $2.1 million principal payment on the Priming Facility.
Dividends
The payment of cash dividends in the future, if any, will be at the discretion of our board of directors and will depend upon such factors as earnings levels, capital requirements, restrictions imposed by applicable law, our overall financial condition, restrictions in our debt agreements and any other factors deemed relevant by our board of directors. As a holding company, our ability to pay dividends depends on our receipt of cash dividends from our operating subsidiaries, which may further restrict our ability to pay dividends as a result of restrictions on their ability to pay dividends to us under our debt agreements and under future indebtedness that we or they may incur.
Capitalization
At February 3, 2024, long-term debt consisted of the following:
|
|
Carrying Value of Debt |
|
|
|
|
February 3, 2024 |
|
|
Term Loan Facility (principal of $168,438) |
|
|
155,948 |
|
Less: Current portion (including ECF payment) |
|
|
(35,353 |
) |
Net long-term debt |
|
$ |
120,595 |
|
The Company had no short-term borrowings under the Company’s ABL Facility as of February 3, 2024. The Company had outstanding letters of credit in the amount of $5.8 million and had a maximum additional borrowing capacity of $34.2 million as of February 3, 2024.
Future Cash Requirements
We enter into contractual obligations in the ordinary course of business that may require future cash payments. Such obligations include merchandise inventories, marketing, including catalog production and distribution, payroll, store occupancy costs and capital expenditures associated with opening new stores, remodeling existing stores and upgrading information systems. The notes to the financial statements included elsewhere in this Annual Report provide additional information.
We believe our sources of liquidity, namely operating cash flows and ABL Facility capacity will continue to be adequate to meet our contractual obligations, working capital and capital expenditure requirements, finance anticipated expansion and strategic initiatives, and fund debt maturities for the foreseeable future. We may also engage in capital markets transactions from time to time subject to the discretion of our Board. We expect capital expenditures in the next twelve months to support opening of new stores, store design/ remodels, and system upgrades and maintenance projects.
38
Off Balance Sheet Arrangements
We are not a party to any off balance sheet arrangements.
Critical Accounting Policies and Significant Estimates
Our discussion of results of operations and financial condition is based upon the consolidated financial statements included elsewhere in this Annual Report, which have been prepared in accordance with GAAP. The preparation of financial statements in conformity with GAAP requires management to make estimates and certain assumptions about future events that affect the classification and amounts reported in our consolidated financial statements and accompanying notes, including revenue and expenses, assets and liabilities, and the disclosure of contingent assets and liabilities. These estimates and assumptions are based on our historical results as well as management’s judgment. Although management believes the judgment applied in preparing estimates is reasonable based on circumstances and information known at the time, actual results could vary materially from estimates based on assumptions used in the preparation of our consolidated financial statements.
The most significant accounting estimates involve a high degree of judgment or complexity. Management believes the estimates and judgments most critical to the preparation of our consolidated financial statements and to the understanding of our reported financial results include those made in connection with revenue recognition, including accounting for outstanding gift cards that will ultimately not be redeemed (“gift card breakage”) and estimated merchandise returns; estimating the value of inventory; and impairment assessments for goodwill and other indefinite-lived intangible assets, and long-lived assets. Management evaluates its policies and assumptions on an ongoing basis. Our significant accounting policies related to these accounts in the preparation of our consolidated financial statements are described below (see Note 2. Summary of Significant Accounting Policies to our audited consolidated financial statements presented elsewhere in this Annual Report for additional information regarding our critical accounting policies).
Sales Return Reserve
The Company has a return policy where merchandise returns will be accepted within 90 days of the original purchase date. At the time of sale, the Company records an estimated sales reserve for merchandise returns based on historical prior returns experience and expected future returns. The estimated sales reserve is recorded as a return asset (and corresponding adjustment to cost of goods sold) for the cost of inventory and a return liability for the amount to settle the return with a customer (and a corresponding adjustment to revenue). The return asset and return liability are recorded in Prepaid expenses and other current assets, and Accrued expenses and other current liabilities, respectively, in the consolidated balance sheets. The Company collects and remits sales and use taxes in all states in which retail and direct sales occur and taxes are applicable. These taxes are reported on a net basis and are thereby excluded from revenue.
Gift Cards
The Company sells gift cards without expiration dates to customers. The Company does not charge administrative fees on unused gift cards. Proceeds from the sale of gift cards are recorded as a contract liability until the customer redeems the gift card or when the likelihood of redemption is remote. Based on historical experience, the Company estimates the value of gift card breakage and will not be escheated under statutory unclaimed property laws. This gift card breakage is recognized as revenue over the time period established by the Company’s historical gift card redemption pattern.
Merchandise Inventory
Inventory consists of finished goods merchandise held for sale to our customers. Inventory is stated at the lower of cost or net realizable value. Cost is calculated using the weighted average method of accounting, and includes the cost to purchase merchandise from our manufacturers, duties, tariffs, inbound freight and commissions.
In the normal course of business, we record inventory reserves by applying estimates, based on past and projected sales performance, to the inventory on hand. The carrying value of inventory is reduced to estimated net realizable value when factors indicate that merchandise will not be sold on terms sufficient to recover its cost.
We monitor inventory levels, sales trends and sales forecasts to estimate and record reserves for excess, slow-moving and obsolete inventory. We utilize internal channels, including sales catalogs, the internet, and price reductions in retail and outlet stores to liquidate excess inventory. In some cases, external channels such as inventory liquidators are utilized. The prices obtained through these off-price selling methods vary based on many factors. Accordingly, estimates of future sales prices require management judgment based on historical experience, assessment of current conditions and assumptions about future transactions. We have not made significant changes to our assumptions during the periods presented in our consolidated financial statements included elsewhere in this Annual Report, and estimates have not varied significantly from historically recorded amounts.
39
Asset Impairment Assessments
Goodwill
We evaluate goodwill for impairment on an annual basis on the last day of our eleventh fiscal month beginning Fiscal Year 2023 and at the end of each fiscal year prior to Fiscal 2023, or more frequently between annual tests when events or changes in circumstances indicate that the carrying value may not be recoverable. The Company has determined that this change in the impairment assessment date does not represent a material change to the Company’s method of applying an accounting principle, and therefore does not delay, accelerate, or avoid an impairment charge. See Note 2. Summary of Significant Accounting Policies to our audited consolidated financial statements presented elsewhere in this Annual Report for additional information.
Our two reporting units applicable to goodwill impairment assessments are defined as our Direct and Retail sales channels. Examples of impairment indicators that would trigger an impairment assessment of goodwill between annual evaluations include, among others, macro-economic conditions, competitive environment, industry conditions, changes in our profitability and cash flows, and changes in sales trends or customer demand.
The Company’s policy is to perform a quantitative analysis of goodwill every three years. During those years when a quantitative assessment is not performed initially, we assess our goodwill for impairment using a qualitative approach to determine whether conditions exist to indicate that it is more likely than not that the fair value of a reporting unit is less than its carrying value. If management concludes, based on assessment of relevant events, facts and circumstances, that it is more likely than not that a reporting unit’s fair value is greater than its carrying value, no further impairment testing is required.
If management’s assessment of qualitative factors indicates that it is more likely than not that the fair value of a reporting unit is less than its carrying value, then a quantitative assessment is performed. We also have the option to bypass the qualitative assessment described above and proceed directly to the quantitative assessment. The quantitative assessment requires comparing the fair value of a reporting unit to its carrying value, including goodwill. We estimate the fair value of reporting units using the income approach. The income approach uses a discounted cash flow analysis, which involves significant estimates and assumptions, including preparation of revenue and profitability growth forecasts, selection of the discount rate and the terminal year multiple.
If the fair value of a reporting unit exceeds its carrying amount, goodwill is not considered to be impaired and no further testing is required. If the carrying amount exceeds the reporting unit’s fair value, a goodwill impairment charge is recognized for the amount in excess, not to exceed the total amount of goodwill allocated to that reporting unit.
During Fiscal Years 2023, 2022 and 2021 we did not record any impairment to our goodwill. During Fiscal Year 2023, we performed a quantitative assessment of goodwill. This analysis contains uncertainties because it requires us to make assumptions and to apply judgments to estimate industry economic factors and the profitability of future business strategies. If actual results are not consistent with our estimates and assumptions, we may be exposed to future impairment losses that could be material.
Indefinite-Lived Intangible Assets
Our trade name has been assigned an indefinite life as we currently anticipate that it will contribute cash flows to us indefinitely. Our trade name is reviewed at least annually to determine whether events and circumstances continue to support an indefinite, useful life.
We evaluate our trade name for impairment on an annual basis on the last day of our eleventh fiscal month beginning Fiscal Year 2023 and at the end of each fiscal year prior to Fiscal 2023, or more frequently between annual tests whenever events or changes in circumstances indicate that its carrying value may not be recoverable. Conditions that may indicate impairment include, but are not limited to, significant loss of market share to a competitor, the identification of other impaired assets within a reporting unit, loss of key personnel that negatively and materially has an adverse effect on our operations, the disposition of a significant portion of a reporting unit or a significant adverse change in business climate or regulations.
The Company’s policy is to perform a quantitative analysis of its indefinite-lived intangible assets every three years. Impairment losses are recorded to the extent that the carrying value of the indefinite-lived intangible asset exceeds its fair value. We measure the fair value of our trade name using the relief-from-royalty method, which estimates the present value of royalty income that could be hypothetically earned by licensing the brand name to a third party over the remaining useful life. The most significant estimates and assumptions inherent in this approach are the preparation of revenue forecasts, selection of the royalty and discount rates, and selection of the terminal year multiple.
We did not record any impairment losses related to the trade name during Fiscal Years 2023, 2022 and 2021. During Fiscal Year 2023, we performed a quantitative assessment of our trade name. This analysis contains uncertainties because it
40
requires us to make assumptions and to apply judgments to estimate industry economic factors and the profitability of future business strategies. If actual results are not consistent with our estimates and assumptions, we may be exposed to future impairment losses that could be material.
Long-Lived Assets
Long-lived assets include definite-lived intangible assets (our customer list) subject to amortization, property and equipment and operating lease assets. Long-lived assets obtained in a business combination are recorded at the acquisition-date fair value, property and equipment purchased in the normal course of business is recorded at cost and operating lease assets are recorded at the present value of the lease payments.
We assess the carrying value of long-lived assets for potential impairment whenever indicators exist that the carrying value of an asset group might not be recoverable. Indicators of impairment include, among others, a significant decrease in the market price of an asset, a significant adverse change in the extent or manner in which an asset is being used or in its physical condition, and operating or cash flow performance that demonstrates continuing losses associated with an asset group.
When indicators of potential impairment exist, we compare the sum of estimated undiscounted future cash flows expected to result from the use and eventual disposition of the asset group to the carrying value of the asset group. If the carrying value of an asset group exceeds the sum of estimated undiscounted future cash flows, we record an impairment loss in the amount required to reduce carrying value of the asset group to fair value. We estimate the fair value of an asset group based on the present value of estimated future cash flows, calculated by discounting the cash flow projections used in the previous step.
During Fiscal Year 2023, we assessed the carrying values of right-of-use assets and property and equipment as described above. During Fiscal Year 2023, the Company recorded impairment charges of $0.2 million. During Fiscal Year 2022, the Company recorded impairment charges of $0.6 million related primarily to a right-of-use asset relating to revised sublease assumptions of one floor of the corporate headquarters located in Quincy, Massachusetts that was vacated in July 2019 and $0.8 million due to the Company’s revised outlook on future cash flows at certain store locations. During Fiscal Year 2021, we did not record any impairments related to right-of-use assets and leasehold improvements.
Determining the fair value of long-lived assets requires management judgment and relies upon the use of significant estimates and assumptions, including future sales, our margins and cash flows, current and future market conditions, discount rates applied, useful lives and other factors. We believe our assumptions are reasonable based on available information. Changes in assumptions and estimates used in the impairment analysis, or future results that vary from assumptions used in the analysis, could affect the estimated fair value of long-lived intangible assets and could result in impairment charges in a future period.
Recent Accounting Pronouncements
See Note 3. Accounting Standards to our audited consolidated financial statements included elsewhere in this Annual Report for information regarding recently issued accounting pronouncements.
41
Item 7A. Quantitative and Qualitative Disclosures About Market Risk
Interest Rate Risk
We are subject to interest rate risk in connection with borrowings under the Credit Facilities, each of which bear interest at variable rates as defined in the respective agreements described above. As of February 3, 2024, there was an outstanding balance of $168.4 million under the Term Loan Facility. There were no outstanding borrowings under the ABL Facility. We currently do not engage in any interest rate hedging activity. Based on the schedule of outstanding borrowings as of February 3, 2024, a 10% change in our current interest rate would have affected net income by $10.5 million during Fiscal Year 2023.
Item 8. Financial Statements and Supplementary Data
The financial statements required to be filed pursuant to this Item 8 are appended to this report. An index of those financial statements is found in Item 15.
Item 9. Changes in and Disagreements with Accountants on Accounting and Financial Disclosure
None.
Item 9A. Controls and Procedures
Evaluation of Disclosure Controls and Procedures
We maintain disclosure controls and procedures that are designed to provide reasonable assurance that information required to be disclosed in the reports we file or submit under the Exchange Act is recorded, processed, summarized and reported within the time periods specified in the SEC’s rules and forms, and that such information is accumulated and communicated to our management, including our Chief Executive Officer and Chief Financial Officer, to allow timely decisions regarding required disclosure.
Our management, under the supervision of our Chief Executive Officer and Chief Financial Officer, evaluated the effectiveness of our disclosure controls and procedures (as defined in Rules 13a-15(e) and 15d-15(e) under the Exchange Act) as of the end of the period covered by this Annual Report. Based on that evaluation, our Chief Executive Officer and Chief Financial Officer have concluded that as of February 3, 2024, the end of the period covered by this Annual Report, our disclosure controls and procedures were effective to provide such reasonable assurance.
Management’s Annual Report on Internal Control over Financial Reporting
Our management is responsible for establishing and maintaining adequate internal control over financial reporting. Internal control over financial reporting is defined in Rules 13a-15(f) and 15d-15(f) promulgated under the Exchange Act as a process designed by, or under the supervision of, our Chief Executive Officer and Chief Financial Officer and effected by the company’s board of directors, management and other personnel, to provide reasonable assurance regarding the reliability of financial reporting and the preparation of financial statements for external purposes in accordance with generally accepted accounting principles and includes those policies and procedures that pertain to the maintenance of records that in reasonable detail accurately and fairly reflect the transactions and dispositions of the assets of the company; provide reasonable assurance that transactions are recorded as necessary to permit preparation of financial statements in accordance with generally accepted accounting principles, and that receipts and expenditures of the company are being made only in accordance with authorizations of management and directors of the company; and provide reasonable assurance regarding prevention or timely detection of unauthorized acquisition, use or disposition of the company’s assets that could have a material effect on the financial statements.
Because of its inherent limitations, internal control over financial reporting may not prevent or detect misstatements. Also, projections of any evaluation of effectiveness to future periods are subject to the risk that controls may become inadequate because of changes in conditions, or that the degree of compliance with the policies or procedures may deteriorate.
42
Our management, with the participation of our Chief Executive Officer and Chief Financial Officer, has assessed the effectiveness of the Company’s internal control over financial reporting as of February 3, 2024. In making this assessment, our management used the criteria set forth by the Committee of Sponsoring Organizations of the Treadway Commission ("COSO") in Internal Control – Integrated Framework (2013). Based on this evaluation, our management concluded that the Company’s internal control over financial reporting was effective as of February 3, 2024.
The Company’s independent registered public accounting firm, Grant Thornton LLP, has audited the effectiveness of the Company’s internal control over financial reporting as of February 3, 2024, and has expressed an unqualified opinion in their report which appears in the Annual Report.
Limitations on the Effectiveness of Controls and Procedures
In designing and evaluating our disclosure controls and procedures, our management recognizes that any controls and procedures, no matter how well designed and operated, can provide only reasonable, not absolute, assurance of achieving the desired control objectives. In addition, the design of disclosure controls and procedures must reflect the fact that there are resource constraints and our management is required to apply judgment in evaluating the benefits of possible controls and procedures relative to their costs. The design of any disclosure controls and procedures also is based in part upon certain assumptions about the likelihood of future events, and there can be no assurance that any design will succeed in achieving its stated goals under all potential future conditions.
Changes to Internal Control over Financial Reporting
There have been no changes in our internal control over financial reporting during our most recent fiscal quarter ended February 3, 2024, that have materially affected, or are reasonably likely to materially affect, our internal control over financial reporting.
Item 9B. Other Information
Not applicable.
Item 9C. Disclosure Regarding Foreign Jurisdictions That Prevent Inspections
Not applicable.
43
PART III
Item 10. Directors, Executive Officers and Corporate Governance
The information required by this item will be contained in our definitive proxy statement in connection with our 2023 Annual Meeting of Stockholders (the “Proxy Statement”), which is expected to be filed with the SEC not later than 120 days after the end of our Fiscal Year 2023 and is incorporated herein by reference.
Code of Business Conduct and Ethics
Our board of directors has adopted a code of conduct and ethics that applies to all of our directors, officers and employees and is intended to comply with the relevant listing requirements for a code of conduct as well as qualify as a “code of ethics” as defined by the rules of the SEC. The statement contains general guidelines for conducting our business consistent with the highest standards of business ethics. We intend to disclose future amendments to certain provisions of our code of conduct and ethics, or waivers of such provisions applicable to any principal executive officer, principal financial officer, principal accounting officer and controller, or persons performing similar functions, and our directors, on our website at www.jjill.com. The code of conduct and ethics is available on our website at www.jjill.com.
Item 11. Executive Compensation
The information required by this Item will be set forth in the Proxy Statement and is incorporated herein by reference.
Item 12. Security Ownership of Certain Beneficial Owners and Management and Related Stockholder Matters
The information required by this Item will be set forth in the Proxy Statement and is incorporated herein by reference.
The information required by this Item will be set forth in the Proxy Statement and is incorporated herein by reference.
Item 14. Principal Accounting Fees and Services
The information required by this Item will be set forth in the Proxy Statement and is incorporated herein by reference.
44
PART IV
Item 15. Exhibits, Financial Statement Schedules
(a)(1) Financial Statements.
See the “Index to Consolidated Financial Statements” on page F-1 below for the list of financial statements filed as part of this report.
(a)(2) Financial Statement Schedules.
All schedules have been omitted because they are not required or because the required information is given in the Consolidated Financial Statements or Notes thereto set forth below beginning on page F-1.
(a)(3) Exhibits.
The exhibits listed in the Exhibit Index below are filed or incorporated by reference as part of this Annual Report.
Exhibit Index
Exhibit Number |
|
Exhibit Description |
|
|
|
3.1 |
|
|
|
|
|
3.2 |
|
|
|
|
|
3.3 |
|
|
|
|
|
4.1 |
|
Description of the Registrant’s Securities Registered pursuant to Section 12 of the Securities Exchange Act of 1934 (incorporated by reference from Exhibit 4.1 to the Company’s Form 10-K, filed on June 15, 2020 (File No. 001-38026)). |
|
|
|
10.1 |
|
|
|
|
|
10.2 |
|
|
|
|
|
10.3† |
|
|
|
|
|
10.4 |
|
|
|
|
|
10.5 |
|
|
|
|
|
10.6 |
|
|
|
|
|
10.7 |
|
45
Exhibit Number |
|
Exhibit Description |
|
|
|
10.8 |
|
|
|
|
|
10.9 |
|
|
|
|
|
10.10 |
|
|
|
|
|
10.11* |
|
|
|
|
|
10.12 |
|
|
|
|
|
10.13 |
|
|
|
|
|
10.14 |
|
|
|
|
|
10.15 |
|
|
|
|
|
10.16 |
|
|
|
|
|
10.17 |
|
|
|
|
|
10.18 |
|
|
|
|
|
10.19† |
|
|
|
|
|
10.20† |
|
|
|
|
|
10.21 |
|
46
Exhibit Number |
|
Exhibit Description |
|
|
|
10.22† |
|
|
|
|
|
10.23† |
|
|
|
|
|
10.24† |
|
|
|
|
|
10.25*† |
|
|
|
|
|
10.26*† |
|
|
|
|
|
10.27† |
|
|
|
|
|
10.28† |
|
|
|
|
|
10.29† |
|
|
|
|
|
10.30† |
|
|
|
|
|
10.31† |
|
|
|
|
|
10.32† |
|
|
|
|
|
10.33† |
|
|
|
|
|
21.1 |
|
|
|
|
|
23.1* |
|
Consent of Grant Thornton LLP, independent registered public accounting firm. |
|
|
|
31.1* |
|
|
|
|
|
31.2* |
|
|
|
|
|
32.1* |
|
|
|
|
|
32.2* |
|
|
|
|
|
97.1* |
|
|
|
|
|
99.1† |
|
47
Exhibit Number |
|
Exhibit Description |
|
|
|
101.INS |
|
Inline XBRL Instance Document (the instance document does not appear in the Interactive Data File because its XBRL tags are embedded within the Inline XBRL document) |
|
|
|
101.SCH |
|
Inline XBRL Taxonomy Extension Schema with Embedded Linkbase Documents |
|
|
|
104 |
|
Cover Page formatted as inline XBRL and contained in Exhibits 101 |
* Filed herewith.
† Management contract or compensatory plan or arrangement.
Item 16. Form 10-K Summary
None
48
SIGNATURES
Pursuant to the requirements of Section 13 or 15(d) of the Securities Exchange Act of 1934, the registrant has duly caused this report to be signed on its behalf by the undersigned, thereunto duly authorized.
|
J.Jill, Inc. |
|
|
|
|
Date: April 4, 2024 |
By: |
/s/ Claire Spofford |
|
|
Claire Spofford |
|
|
Chief Executive Officer, President and Director |
Pursuant to the requirements of the Securities Exchange Act of 1934, this report has been signed below by the following persons on behalf of the registrant in the capacities and on the dates indicated.
Signature |
|
Title |
|
Date |
|
|
|
|
|
/s/ Claire Spofford |
|
Chief Executive Officer, President and Director (Principal Executive Officer) |
|
April 4, 2024 |
Claire Spofford |
|
|
|
|
|
|
|
|
|
/s/ Mark Webb |
|
Executive Vice President, Chief Financial and Operating Officer (Principal Financial Officer and Principal Operating Officer) |
|
April 4, 2024 |
Mark Webb |
|
|
|
|
|
|
|
|
|
/s/ Michael Rahamim |
|
Chairman of the Board of Directors |
|
April 4, 2024 |
Michael Rahamim |
|
|
|
|
|
|
|
|
|
/s/ James Scully |
|
Director |
|
April 4, 2024 |
James Scully |
|
|
|
|
|
|
|
|
|
/s/ Andrew Rolfe |
|
Director |
|
April 4, 2024 |
Andrew Rolfe |
|
|
|
|
|
|
|
|
|
/s/ Jyothi Rao |
|
Director |
|
April 4, 2024 |
Jyothi Rao |
|
|
|
|
|
|
|
|
|
/s/ Michael Recht |
|
Director |
|
April 4, 2024 |
Michael Recht |
|
|
|
|
|
|
|
|
|
/s/ Michael Eck |
|
Director |
|
April 4, 2024 |
Michael Eck |
|
|
|
|
|
|
|
|
|
/s/ Shelley Milano |
|
Director |
|
April 4, 2024 |
Shelley Milano |
|
|
|
|
|
|
|
|
|
49
J.Jill, Inc.
INDEX TO CONSOLIDATED FINANCIAL STATEMENTS
F-1
Report of Independent Registered Public Accounting Firm
Board of Directors and Shareholders
J.Jill, Inc.
Opinion on the financial statements
We have audited the accompanying consolidated balance sheets of J.Jill, Inc. (a Delaware corporation) and subsidiaries (the “Company”) as of February 3, 2024 and January 28, 2023, the related consolidated statements of operations and comprehensive income (loss), shareholders’ equity (deficit) and cash flows for each of the three years in the period ended February 3, 2024, and the related notes (collectively referred to as the “financial statements”). In our opinion, the financial statements present fairly, in all material respects, the financial position of the Company as of February 3, 2024 and January 28, 2023, and the results of its operations and its cash flows for each of the three years in the period ended February 3, 2024 in conformity with accounting principles generally accepted in the United States of America.
We also have audited, in accordance with the standards of the Public Company Accounting Oversight Board (United States) (“PCAOB”), the Company’s internal control over financial reporting as of February 3, 2024, based on criteria established in the 2013 Internal Control—Integrated Framework issued by the Committee of Sponsoring Organizations of the Treadway Commission (“COSO”), and our report dated April 4, 2024 expressed an unqualified opinion.
Basis for opinion
These financial statements are the responsibility of the Company’s management. Our responsibility is to express an opinion on the Company’s financial statements based on our audits. We are a public accounting firm registered with the PCAOB and are required to be independent with respect to the Company in accordance with the U.S. federal securities laws and the applicable rules and regulations of the Securities and Exchange Commission and the PCAOB.
We conducted our audits in accordance with the standards of the PCAOB. Those standards require that we plan and perform the audit to obtain reasonable assurance about whether the financial statements are free of material misstatement, whether due to error or fraud. Our audits included performing procedures to assess the risks of material misstatement of the financial statements, whether due to error or fraud, and performing procedures that respond to those risks. Such procedures included examining, on a test basis, evidence regarding the amounts and disclosures in the financial statements. Our audits also included evaluating the accounting principles used and significant estimates made by management, as well as evaluating the overall presentation of the financial statements. We believe that our audits provide a reasonable basis for our opinion.
Critical audit matter
Critical audit matters are matters arising from the current period audit of the financial statements that were communicated or required to be communicated to the audit committee and that: (1) relate to accounts or disclosures that are material to the financial statements and (2) involved our especially challenging, subjective, or complex judgments. We determined that there are no critical audit matters.
/s/ GRANT THORNTON LLP
We have served as the Company’s auditor since 2021.
Southfield, Michigan
April 4, 2024
F-2
Report of Independent Registered Public Accounting Firm
Board of Directors and Shareholders
J.Jill, Inc.
Opinion on internal control over financial reporting
We have audited the internal control over financial reporting of J.Jill, Inc. (a Delaware corporation) and subsidiaries (the “Company”) as of February 3, 2024, based on criteria established in the 2013 Internal Control—Integrated Framework issued by the Committee of Sponsoring Organizations of the Treadway Commission (“COSO”). In our opinion, the Company maintained, in all material respects, effective internal control over financial reporting as of February 3, 2024, based on criteria established in the 2013 Internal Control—Integrated Framework issued by COSO.
We also have audited, in accordance with the standards of the Public Company Accounting Oversight Board (United States) (“PCAOB”), the consolidated financial statements of the Company as of and for the year ended February 4, 2024, and our report dated April 4, 2024, expressed an unqualified opinion on those financial statements.
Basis for opinion
The Company’s management is responsible for maintaining effective internal control over financial reporting and for its assessment of the effectiveness of internal control over financial reporting, included in the accompanying Management’s Annual Report on Internal Control over Financial Reporting. Our responsibility is to express an opinion on the Company’s internal control over financial reporting based on our audit. We are a public accounting firm registered with the PCAOB and are required to be independent with respect to the Company in accordance with the U.S. federal securities laws and the applicable rules and regulations of the Securities and Exchange Commission and the PCAOB.
We conducted our audit in accordance with the standards of the PCAOB. Those standards require that we plan and perform the audit to obtain reasonable assurance about whether effective internal control over financial reporting was maintained in all material respects. Our audit included obtaining an understanding of internal control over financial reporting, assessing the risk that a material weakness exists, testing and evaluating the design and operating effectiveness of internal control based on the assessed risk, and performing such other procedures as we considered necessary in the circumstances. We believe that our audit provides a reasonable basis for our opinion.
Definition and limitations of internal control over financial reporting
A company’s internal control over financial reporting is a process designed to provide reasonable assurance regarding the reliability of financial reporting and the preparation of financial statements for external purposes in accordance with generally accepted accounting principles. A company’s internal control over financial reporting includes those policies and procedures that (1) pertain to the maintenance of records that, in reasonable detail, accurately and fairly reflect the transactions and dispositions of the assets of the company; (2) provide reasonable assurance that transactions are recorded as necessary to permit preparation of financial statements in accordance with generally accepted accounting principles, and that receipts and expenditures of the company are being made only in accordance with authorizations of management and directors of the company; and (3) provide reasonable assurance regarding prevention or timely detection of unauthorized acquisition, use, or disposition of the company’s assets that could have a material effect on the financial statements.
Because of its inherent limitations, internal control over financial reporting may not prevent or detect misstatements. Also, projections of any evaluation of effectiveness to future periods are subject to the risk that controls may become inadequate because of changes in conditions, or that the degree of compliance with the policies or procedures may deteriorate.
/s/ GRANT THORNTON LLP
Southfield, Michigan
April 4, 2024
F-3
J.Jill, Inc.
CONSOLIDATED BALANCE SHEETS
(in thousands, except share data)
|
|
February 3, 2024 |
|
|
January 28, 2023 |
|
||
Assets |
|
|
|
|
|
|
||
Current assets: |
|
|
|
|
|
|
||
Cash and cash equivalents |
|
$ |
|
|
$ |
|
||
Accounts receivable |
|
|
|
|
|
|
||
Inventories, net |
|
|
|
|
|
|
||
Prepaid expenses and other current assets |
|
|
|
|
|
|
||
Total current assets |
|
|
|
|
|
|
||
Property and equipment, net |
|
|
|
|
|
|
||
Intangible assets, net |
|
|
|
|
|
|
||
Goodwill |
|
|
|
|
|
|
||
Operating lease assets, net |
|
|
|
|
|
|
||
Other assets |
|
|
|
|
|
|
||
Total assets |
|
$ |
|
|
$ |
|
||
Liabilities and Shareholders’ Equity (Deficit): |
|
|
|
|
|
|
||
Current liabilities: |
|
|
|
|
|
|
||
Accounts payable |
|
$ |
|
|
$ |
|
||
Accrued expenses and other current liabilities |
|
|
|
|
|
|
||
Current portion of long-term debt |
|
|
|
|
|
|
||
Current portion of operating lease liabilities |
|
|
|
|
|
|
||
Total current liabilities |
|
|
|
|
|
|
||
Long-term debt, net of discount and current portion |
|
|
|
|
|
|
||
Long-term debt, net of discount - related party |
|
|
— |
|
|
|
|
|
Deferred income taxes |
|
|
|
|
|
|
||
Operating lease liabilities, net of current portion |
|
|
|
|
|
|
||
Other liabilities |
|
|
|
|
|
|
||
Total liabilities |
|
|
|
|
|
|
||
(see Note 11) |
|
|
|
|
|
|
||
Shareholders’ Equity (Deficit) |
|
|
|
|
|
|
||
Common stock, par value $ |
|
|
|
|
|
|
||
Additional paid-in capital |
|
|
|
|
|
|
||
Accumulated deficit |
|
|
( |
) |
|
|
( |
) |
Total shareholders’ equity (deficit) |
|
|
|
|
|
( |
) |
|
Total liabilities and shareholders’ equity (deficit) |
|
$ |
|
|
$ |
|
||
The accompanying notes are an integral part of these consolidated financial statements.
F-4
J.Jill, Inc.
CONSOLIDATED STATEMENTS OF OPERATIONS AND
COMPREHENSIVE INCOME (LOSS)
(in thousands, except share and per share data)
|
|
For the Fiscal Year Ended |
|
|||||||||
|
|
February 3, 2024 |
|
|
January 28, 2023 |
|
|
January 29, 2022 |
|
|||
Net sales |
|
$ |
|
|
$ |
|
|
$ |
|
|||
Costs of goods sold (exclusive of depreciation and amortization) |
|
|
|
|
|
|
|
|
|
|||
Gross profit |
|
|
|
|
|
|
|
|
|
|||
Selling, general and administrative expenses |
|
|
|
|
|
|
|
|
|
|||
Impairment of long-lived assets |
|
|
|
|
|
|
|
|
— |
|
||
Operating income |
|
|
|
|
|
|
|
|
|
|||
Loss on debt refinancing |
|
|
|
|
|
— |
|
|
|
— |
|
|
Fair value adjustment of derivative |
|
|
— |
|
|
|
— |
|
|
|
|
|
Fair value adjustment of warrants - related party |
|
|
— |
|
|
|
— |
|
|
|
|
|
Interest expense, net |
|
|
|
|
|
|
|
|
|
|||
Interest expense - related party |
|
|
|
|
|
|
|
|
|
|||
Income (loss) before provision for income taxes |
|
|
|
|
|
|
|
|
( |
) |
||
Income tax provision |
|
|
|
|
|
|
|
|
|
|||
Net income (loss) and total comprehensive income (loss) |
|
$ |
|
|
$ |
|
|
$ |
( |
) |
||
Per share data (Note 14): |
|
|
|
|
|
|
|
|
|
|||
Net income (loss) per common share: |
|
|
|
|
|
|
|
|
|
|||
Basic |
|
$ |
|
|
$ |
|
|
$ |
( |
) |
||
Diluted |
|
$ |
|
|
$ |
|
|
$ |
( |
) |
||
Weighted average common shares: |
|
|
|
|
|
|
|
|
|
|||
Basic |
|
|
|
|
|
|
|
|
|
|||
Diluted |
|
|
|
|
|
|
|
|
|
|||
The accompanying notes are an integral part of these consolidated financial statements.
F-5
J.Jill, Inc.
(in thousands, except common share data)
|
|
|
|
|
|
|
|
Additional |
|
|
|
|
|
Total |
|
|||||
|
|
Common Stock |
|
|
Paid-in |
|
|
Accumulated |
|
|
Shareholders’ |
|
||||||||
|
|
Shares |
|
|
Amount |
|
|
Capital |
|
|
Deficit |
|
|
(Deficit) Equity |
|
|||||
Balance, January 30, 2021 |
|
|
|
|
$ |
|
|
$ |
|
|
$ |
( |
) |
|
$ |
( |
) |
|||
Vesting of restricted stock |
|
|
|
|
|
|
|
|
( |
) |
|
|
— |
|
|
|
— |
|
||
Surrender of shares to pay withholding taxes |
|
|
( |
) |
|
|
— |
|
|
|
( |
) |
|
|
— |
|
|
|
( |
) |
Equity-based compensation |
|
|
— |
|
|
|
— |
|
|
|
|
|
|
— |
|
|
|
|
||
Shares issued to Priming lenders |
|
|
|
|
|
|
|
|
|
|
|
— |
|
|
|
|
||||
Reclass of warrants to equity |
|
|
— |
|
|
|
— |
|
|
|
|
|
|
— |
|
|
|
|
||
Net loss |
|
|
— |
|
|
|
— |
|
|
|
— |
|
|
|
( |
) |
|
|
( |
) |
Balance, January 29, 2022 |
|
|
|
|
$ |
|
|
$ |
|
|
$ |
( |
) |
|
$ |
( |
) |
|||
Vesting of restricted stock units |
|
|
|
|
|
|
|
|
( |
) |
|
|
— |
|
|
|
— |
|
||
Surrender of shares to pay withholding taxes |
|
|
( |
) |
|
|
— |
|
|
|
( |
) |
|
|
— |
|
|
|
( |
) |
Equity-based compensation |
|
|
— |
|
|
|
— |
|
|
|
|
|
|
— |
|
|
|
|
||
Net income |
|
|
— |
|
|
|
— |
|
|
|
— |
|
|
|
|
|
|
|
||
Balance, January 28, 2023 |
|
|
|
|
$ |
|
|
$ |
|
|
$ |
( |
) |
|
$ |
( |
) |
|||
Vesting of restricted stock units |
|
|
|
|
|
|
|
|
( |
) |
|
|
— |
|
|
|
— |
|
||
Surrender of shares to pay withholding taxes |
|
|
( |
) |
|
|
— |
|
|
|
( |
) |
|
|
— |
|
|
|
( |
) |
Equity-based compensation |
|
|
— |
|
|
|
— |
|
|
|
|
|
|
— |
|
|
|
|
||
Exercise of warrants |
|
|
|
|
|
|
|
|
( |
) |
|
|
— |
|
|
|
— |
|
||
Net income |
|
|
— |
|
|
|
— |
|
|
|
— |
|
|
|
|
|
|
|
||
Balance, February 3, 2024 |
|
|
|
|
$ |
|
|
$ |
|
|
$ |
( |
) |
|
$ |
|
||||
The accompanying notes are an integral part of these consolidated financial statements.
F-6
J.Jill, Inc.
CONSOLIDATED STATEMENTS OF CASH FLOWS
(in thousands)
|
|
For the Fiscal Year Ended |
|
|||||||||
|
|
February 3, 2024 |
|
|
January 28, 2023 |
|
|
January 29, 2022 |
|
|||
Net Income (loss) |
|
$ |
|
|
$ |
|
|
$ |
( |
) |
||
Operating activities: |
|
|
|
|
|
|
|
|
|
|||
Adjustments to reconcile net income (loss) to net cash provided by operating activities |
|
|
|
|
|
|
|
|
|
|||
Depreciation and amortization |
|
|
|
|
|
|
|
|
|
|||
Impairment of long-lived assets |
|
|
|
|
|
|
|
|
— |
|
||
Adjustment for exited retail stores |
|
|
( |
) |
|
|
( |
) |
|
|
( |
) |
Loss on disposal of fixed assets |
|
|
|
|
|
|
|
|
|
|||
Loss on debt refinancing |
|
|
|
|
|
— |
|
|
|
— |
|
|
Noncash interest expense, net |
|
|
|
|
|
|
|
|
|
|||
Noncash change in fair value of derivative |
|
|
— |
|
|
|
— |
|
|
|
|
|
Noncash change in fair value of warrants - related party |
|
|
— |
|
|
|
— |
|
|
|
|
|
Equity-based compensation |
|
|
|
|
|
|
|
|
|
|||
Deferred rent incentives |
|
|
( |
) |
|
|
( |
) |
|
|
( |
) |
Deferred income taxes |
|
|
|
|
|
( |
) |
|
|
( |
) |
|
Changes in operating assets and liabilities: |
|
|
|
|
|
|
|
|
|
|||
Accounts receivable |
|
|
|
|
|
( |
) |
|
|
|
||
Inventories, net |
|
|
( |
) |
|
|
|
|
|
|
||
Prepaid expenses and other current assets |
|
|
( |
) |
|
|
|
|
|
|
||
Accounts payable |
|
|
|
|
|
( |
) |
|
|
( |
) |
|
Accrued expenses and other current liabilities |
|
|
( |
) |
|
|
|
|
|
|
||
Operating lease assets and liabilities |
|
|
( |
) |
|
|
( |
) |
|
|
( |
) |
Other noncurrent assets and liabilities |
|
|
( |
) |
|
|
|
|
|
|
||
Net cash provided by operating activities |
|
|
|
|
|
|
|
|
|
|||
Investing activities: |
|
|
|
|
|
|
|
|
|
|||
Purchases of property and equipment |
|
|
( |
) |
|
|
( |
) |
|
|
( |
) |
Capitalized software |
|
|
( |
) |
|
|
( |
) |
|
|
( |
) |
Net cash used in investing activities |
|
|
( |
) |
|
|
( |
) |
|
|
( |
) |
Financing activities: |
|
|
|
|
|
|
|
|
|
|||
Principal repayments on Term Loan |
|
|
( |
) |
|
|
— |
|
|
|
( |
) |
Principal repayments on Priming Term Loan |
|
|
( |
) |
|
|
( |
) |
|
|
— |
|
Principal repayments on Subordinated Term Loan-related party |
|
|
( |
) |
|
|
— |
|
|
|
— |
|
Proceeds from issuance of Term Loan |
|
|
|
|
|
— |
|
|
|
— |
|
|
Third-party debt financing costs |
|
|
( |
) |
|
|
— |
|
|
|
— |
|
Borrowings under revolving credit facility |
|
|
— |
|
|
|
— |
|
|
|
|
|
Repayments of revolving credit facility |
|
|
— |
|
|
|
— |
|
|
|
( |
) |
Surrender of shares to pay withholding taxes |
|
|
( |
) |
|
|
( |
) |
|
|
( |
) |
Net cash used in financing activities |
|
|
( |
) |
|
|
( |
) |
|
|
( |
) |
Net change in cash and cash equivalents |
|
|
( |
) |
|
|
|
|
|
|
||
Cash and cash equivalents: |
|
|
|
|
|
|
|
|
|
|||
Beginning of Period |
|
|
|
|
|
|
|
|
|
|||
End of Period |
|
$ |
|
|
$ |
|
|
$ |
|
|||
The accompanying notes are an integral part of these consolidated financial statements.
F-7
J.Jill, Inc.
Notes to Consolidated Financial Statements
1. General
J.Jill is a national lifestyle brand that provides apparel, footwear and accessories designed to help its customers move through a full life with ease. The brand represents an easy, thoughtful and inspired style that celebrates the totality of all women and designs its products with its core brand ethos in mind: keep it simple and make it matter. J.Jill offers a high touch customer experience through over
J.Jill, Inc. is a holding company, and Jill Acquisition LLC, its wholly-owned subsidiary, is the operating company for the business assets.
2. Summary of Significant Accounting Policies
Basis of Presentation
The consolidated financial statements have been prepared in conformity with accounting principles generally accepted in the United States of America (“GAAP”).
The Company’s fiscal year ends on the Saturday, in January or February, nearest the last day of January, resulting in an additional week of results every five or six years. Fiscal Year 2023 contained 53-weeks of operations whereas the Fiscal Years 2022 and 2021 contained 52-weeks of operations.
Financial Statement Presentation
Certain reclassifications have been made to prior periods to conform with the current period presentation. On the consolidated statement of cash flows, the Company reclassified amounts for capitalized software purchases for Fiscal Year 2021 from purchases of property and equipment to a separate financial statement line item within investing activities to conform to the current fiscal year presentation of capitalized software purchases. In addition, for Fiscal Year 2022, the Company reclassified certain cloud computing related assets from prepaid expenses and other current assets to other assets in the Company’s consolidated financial statements.
Use of Estimates
The preparation of the consolidated financial statements in accordance with GAAP requires management to make estimates and judgments that affect reported amounts of assets, liabilities, shareholders’ equity, net sales and expenses, and the disclosure of contingent assets and liabilities. Significant estimates relied upon in preparing these consolidated financial statements include, but are not limited to, revenue recognition, including accounting for outstanding gift cards that will ultimately not be redeemed (“gift card breakage”) and estimated merchandise returns; estimating the value of inventory; impairment assessments for goodwill and other indefinite-lived intangible assets, and long-lived assets; and estimating equity-based compensation expense. Actual results could differ from those estimates, and such differences could be material.
Principles of Consolidation
The accompanying consolidated financial statements include the assets, liabilities and results of operations of the Company and its subsidiaries. All intercompany balances and transactions have been eliminated in the consolidated financial statements.
F-8
Supplemental Cash Flow Information
The following table shows supplemental cash flow information (in thousands):
|
|
For the Fiscal Year Ended |
|
|||||||||
|
|
February 3, 2024 |
|
|
January 28, 2023 |
|
|
January 29, 2022 |
|
|||
Supplemental cash flow information: |
|
|
|
|
|
|
|
|
|
|||
Cash paid for interest |
|
$ |
|
|
$ |
|
|
$ |
|
|||
Cash paid for taxes |
|
$ |
|
|
$ |
|
|
$ |
|
|||
Cash received for income tax refunds |
|
$ |
|
|
$ |
|
|
$ |
|
|||
Noncash investing and financing activities: |
|
|
|
|
|
|
|
|
|
|||
Lease assets obtained in exchange for new operating lease liabilities |
|
$ |
— |
|
|
$ |
|
|
$ |
— |
|
|
Capital expenditures financed with the ending balance in accounts payable and accrued expenses |
|
$ |
|
|
$ |
|
|
$ |
|
|||
Settlement of debt in exchange for shares |
|
$ |
— |
|
|
$ |
— |
|
|
$ |
|
|
Segment Reporting
The Company determined its operating segments on the same basis that it assesses performance and makes operating decisions. The Company’s operating segments consist of its Retail and Direct channels, which have been aggregated into
All of the Company’s identifiable assets are located in the United States, which is where the Company is domiciled. The Company has immaterial sales outside the United States.
Cash and cash equivalents
Cash and cash equivalents include cash on hand, demand deposits and all highly liquid investments with original maturities at the time of purchase of three months or less. Certain cash account balances exceed FDIC insured limits of $
Accounts Receivable
The Company’s accounts receivable relates primarily to payments due from banks for credit and debit transactions for approximately
Inventories
Inventory consists of finished goods held for sale. Inventory is stated at the lower of cost or net realizable value. Cost is calculated using the weighted average method of accounting, and includes the cost to purchase merchandise from the Company’s manufacturers plus duties, tariffs, inbound freight and commissions. The net realizable value of the Company’s inventory is estimated based on historical experience, current and forecasted demand, and market conditions. The allowance for excess and obsolete inventory requires management to make assumptions and to apply judgment regarding a number of factors, including estimates applying past and projected sales performance to current inventory levels. As of February 3, 2024 and January 28, 2023, an inventory reserve of $
Inventory from domestic suppliers is recorded when it is received at the distribution center. Inventory from foreign suppliers is recorded when goods are cleared for export on board the ship at the port of shipment.
Property and Equipment
Property and equipment purchases are recorded at cost. Property and equipment is presented net of accumulated depreciation. Depreciation is computed using the straight-line method over the estimated useful lives of the respective assets. Leasehold improvements are amortized over the shorter of the term of the related lease or the estimated useful lives of the improvements. The Company capitalizes as property and equipment certain qualified costs incurred in connection with the development of internal-use software. Capitalization of internal-use software begins during the application development stage and ends when the software is available for its intended use. Capitalized internal-use software is amortized on a straight-line
F-9
basis over the estimated useful life of the software. Expenditures for repairs and maintenance are charged to expense as incurred. Expenditures for betterments and major improvements that significantly enhance the value and increase the estimated useful life of the asset are capitalized and depreciated over the new estimated useful life. The carrying amounts of assets sold or retired and the related accumulated depreciation are eliminated in the year of disposal, and any resulting gains or losses are included in the consolidated statements of operations and comprehensive income. See Note 7. Property and Equipment for additional information.
Estimated useful lives of property and equipment asset categories are as follows:
Furniture, fixtures and equipment |
|
Computer software and hardware |
|
Leasehold improvements |
Capitalized Interest
The cost of interest that is incurred in connection with long-term leasehold improvements and software related projects is capitalized using a weighted average interest rate. These costs are included in property and equipment and amortized over the useful life of the related property or equipment.
Long-lived Assets
The carrying value of long-lived assets, including amortizable identifiable intangible assets, and asset groups are evaluated whenever events or changes in circumstances indicate that the carrying value may not be recoverable. Conditions that may indicate impairment include, but are not limited to, a significant decrease in the market price of an asset, a significant adverse change in the extent or manner in which an asset is being used or a significant decrease in its physical condition, and operating performance that demonstrates continuing cash flow losses associated with an asset or asset group. A potential impairment has occurred if the projected future undiscounted cash flows expected to result from the use and eventual disposition of the asset or asset group are less than the carrying value of the asset or asset group. The estimate of cash flows includes management’s assumptions of cash inflows and outflows directly resulting from the use of the asset in operation. If the carrying value exceeds the sum of the undiscounted cash flows, an impairment charge is recorded equal to the excess of the asset or asset group’s carrying value over its fair value. Fair value is measured based on a projected discounted cash flow model using a discount rate the Company believes is commensurate with the market participant rate. The fair value measurement includes the fair value of the right of use asset and will not be written down below the asset’s fair value. Any impairment charge would be recognized within operating expenses.
Goodwill and Indefinite-lived Intangible Assets
Goodwill represents the excess of the purchase price over the fair values of the assets acquired and liabilities assumed in conjunction with an acquisition. Goodwill and indefinite-lived intangible assets are not amortized but are reviewed for impairment at least annually or more frequently between annual tests when events or changes in circumstances indicate that the carrying value may not be recoverable. Beginning in Fiscal Year 2023, we evaluate goodwill for impairment on an annual basis on the last day of our eleventh fiscal month instead of the end of our fiscal year. The change in the impairment test date from February 3, 2024 to December 30, 2023 will reduce resource constraints that exist in connection with the Company’s year-end close and financial reporting process and it provides for additional time to complete the required impairment testing and aligns with the Company’s long-range planning and forecasting process. This change does not represent a material change to the Company’s method of applying an accounting principle, and therefore does not delay, accelerate, or avoid an impairment charge. Judgments regarding indicators of potential impairment are based on market conditions and operational performance of the business.
The Company’s policy is to perform a quantitative analysis every three years. During those years when a quantitative assessment is not performed initially, the Company may assess these assets for impairment using a qualitative approach to determine whether conditions exist to indicate that it is more likely than not that the fair value of a reporting unit is less than its carrying value. If management concludes, based on its assessment of relevant events, facts and circumstances, that it is more likely than not that an impairment exists, then a quantitative analysis is performed to determine if there is any impairment.
See Note 6. Goodwill and Other Intangible Assets for additional information.
F-10
Revenue Recognition
Revenue is primarily derived from the sale of apparel and accessory merchandise through our retail stores and through our website and catalog orders. The Company recognizes revenue when its single performance obligation is met at the time when the control of the promised goods or services is transferred to customers at an amount that reflects the consideration to which the entity expects to be entitled to in exchange for those goods or services. Revenue from our Retail channel is recognized at the time of sale and revenue from our Direct channel is recognized upon shipment of merchandise to the customer.
The Company has a return policy where merchandise returns will be accepted within 90 days of the original purchase date. At the time of sale, the Company records an estimated sales reserve for merchandise returns based on historical prior returns experience and expected future returns. The estimated sales reserve is recorded as a return asset (and corresponding adjustment to cost of goods sold) for the cost of inventory and a return liability for the amount to settle the return with a customer (and a corresponding adjustment to revenue). The return asset and return liability are recorded in Prepaid expenses and other current assets, and Accrued expenses and other current liabilities, respectively, in the consolidated balance sheets. The Company collects and remits sales and use taxes in all states in which Retail and Direct sales occur and taxes are applicable. These taxes are reported on a net basis and are thereby excluded from revenue.
The Company sells gift cards without expiration dates to customers. The Company does not charge administrative fees on unused gift cards. Proceeds from the sale of gift cards are recorded as a contract liability until the customer redeems the gift card or when the likelihood of redemption is remote. Based on historical experience, the Company estimates the value of gift card breakage and will not be escheated under statutory state unclaimed property laws. This gift card breakage is recognized as revenue over the time period established by the Company’s historical gift card redemption pattern.
The Company recognizes revenues from shipments to customers when the shipping and handling activities occur and will accrue those related costs. Shipping and handling costs are recorded in selling, general and administrative expenses.
Costs of Goods Sold
The Company’s costs of goods sold includes the direct costs of sold merchandise, which include customs, taxes, duties, commissions and inbound shipping costs, inventory shrinkage, and adjustments and reserves for excess, aged and obsolete inventory. Costs of goods sold does not include distribution center costs and allocations of indirect costs, such as occupancy, depreciation, amortization, or labor and benefits.
Selling, General and Administrative Expenses
Selling, general and administrative expenses consist primarily of payroll and related expenses, occupancy costs, information systems costs and other operating expenses related to our stores and to our operations at our headquarters, including utilities, depreciation and amortization. These expenses also include marketing expense, including catalog production and mailing costs, warehousing, distribution and outbound shipping costs, customer service operations, consulting and software services, professional services and other administrative costs.
Outbound shipping costs to customers recorded in selling, general and administrative expenses were $
The Company incurs costs to produce, print, and distribute its catalogs. Catalog costs are expensed when the catalog is mailed to the customer (the first time the advertising occurs). Catalog advertising expenses were $
Other advertising costs are recorded as incurred. Other advertising costs recorded were $
F-11
Operating Leases
The Company determines if an arrangement is a lease at inception. Lease agreements will typically exist with lease and non-lease components, which are generally accounted for separately. The Company has elected not to recognize right of use assets or lease obligations for leases with an initial term of twelve months or less.
The Company recognizes operating lease liabilities equal to the present value of the lease payments and operating lease assets representing the right to use the underlying asset for the lease term. The lease expense for lease payments is recognized on a straight-line basis over the lease term.
As the Company’s leases do not provide an implicit rate, the Company uses an incremental borrowing rate based on the information available at lease commencement in determining the present value of lease payments. The operating lease assets include any lease payments made prior to lease commencement and are reduced by any lease incentives.
Under lease accounting guidance, for any new leases entered into, the Company assesses if it is reasonably certain to exercise lease options to extend or terminate the lease for inclusion (or exclusion) in the lease term when the Company measures the lease liability. The depreciable life of any assets and leasehold improvements are limited by the expected lease term.
For certain lease agreements, the Company allocates the consideration in the agreement to separate lease components by determining the relative standalone price of separate lease and non-lease components. Certain of the Company’s retail operating leases include variable rental payments based on a percentage of retail sales over contractual levels. Variable rental payments are recognized in the consolidated statements of operations and comprehensive income in the period in which the obligation for those payments is incurred. If such variable operating leases arise that include incentives from landlords in the form of cash, the Company will record the full amount of the incentive when specific performance criteria are met as a deferred liability. The deferred liability is amortized into income as a reduction of rent expense over the term of the applicable lease, including options to extend if they are reasonably certain to be exercised. The Company recognizes those liabilities to be amortized within one year as current liability and those greater than one year as long-term liability. For purposes of recognizing these incentives and rental expenses on a straight-line basis, the Company uses the date it obtains the legal right to use and control the lease asset to begin amortization, which is generally when the Company takes possession of the asset.
Debt Issuance Costs
The Company defers costs directly associated with acquiring third-party financing. Debt issuance costs are deferred and amortized using the effective interest rate method over the term of the related long-term debt agreement and the straight-line method for the revolving credit agreement. Debt issuance costs related to long-term debt are reflected as a direct deduction from the carrying amount of the debt on the Company’s consolidated balance sheet. From time-to-time the Company could make prepayments on the long-term debt and a portion of the debt issuance costs associated with the prepayment would be accelerated and expensed at that time.
Interest Income
The Company recorded interest income of $
Income Taxes
The Company accounts for income taxes using the asset and liability method and elected to be taxed as a C corporation. Under this method, deferred tax assets and liabilities are recognized for the expected future tax consequences of temporary differences between the financial statement carrying values and their respective tax bases, using enacted tax rates expected to be applicable in the years in which the temporary differences are expected to reverse. Changes in deferred tax assets and liabilities are recorded in the provision for income taxes. The Company evaluates the realizability of its deferred tax assets and establishes a valuation allowance when it is more likely than not that all or a portion of the deferred tax assets will not be realized. Potential for recovery of deferred tax assets is evaluated by estimating the future taxable profits expected, scheduling of anticipated reversals of taxable temporary differences, and considering prudent and feasible tax planning strategies.
The Company records liabilities for uncertain income tax positions based on a two-step process. The first step is recognition, where an individual tax position is evaluated as to whether it has a likelihood of greater than 50% of being sustained upon examination based on the technical merits of the position, including resolution of any related appeals or
F-12
litigation processes. For tax positions that are currently estimated to have less than a 50% likelihood of being sustained, no tax benefit is recorded. For tax positions that have met the recognition threshold in the first step, the Company performs the second step of measuring the benefit to be recorded. The amount of benefit that may be recognized is the largest amount that has greater than 50% likelihood of being realized on ultimate settlement. The actual benefits ultimately realized may differ from the estimates. In future periods, changes in facts, circumstances and new information may require the Company to change the recognition and measurement estimates with regard to individual tax positions. Changes in recognition and measurement estimates are recorded in income tax expense and liability in the period in which such changes occur.
Any interest or penalties incurred are recorded in Selling, general, and administrative expenses in the accompanying consolidated statements of operations and comprehensive income. The Company incurred immaterial amounts of interest expense and penalties related to income taxes for Fiscal Years 2023, 2022 and 2021.
Comprehensive Income (Loss)
Comprehensive income (loss) is a measure of net income (loss) and all other changes in equity that result from transactions other than with equity holders and would normally be recorded in the consolidated statements of shareholders’ equity and the consolidated statements of comprehensive income (loss). The Company’s management has determined that net income (loss) is the only component of the Company’s comprehensive income (loss). Accordingly, there is no difference between net income (loss) and comprehensive income (loss).
Equity-based Compensation
The Company accounts for equity-based compensation for employees and directors by recognizing the fair value of equity-based compensation as an expense in the calculation of net income, based on the grant-date fair value. The Company recognizes equity-based compensation expense in the periods in which the employee or director is required to provide service, which is generally over the vesting period of the individual equity instruments. The fair value of the equity-based awards is determined using either the Black-Scholes option pricing model, Monte Carlo simulation model or the stock price on the date of grant.
All of the equity-based awards granted by the Company during Fiscal Years, 2023, 2022 and 2021 were considered equity-classified awards and compensation expense for these awards was recognized in Selling, general, and administrative expenses in the consolidated statements of operations and comprehensive income. Forfeitures were recorded as they occurred.
Earnings Per Share
Basic net income per common share attributable to common shareholders is calculated by dividing net income attributable to common shareholders by the weighted average number of common shares outstanding for the period. Diluted net income per common share attributable to common shareholders is calculated by dividing net income attributable to common shareholders by the diluted weighted average number of common shares outstanding for the period. For Fiscal Years 2023 and 2022, respectively, there were
Credit Card Agreement
During Fiscal Year 2023
The Company receives royalty payments through its private label credit card agreement. The royalty payments are recognized as revenue when they are earned each month. Royalty payments recognized were $
The Company also receives reimbursements for costs of marketing programs related to the private label credit card, which are recorded as revenue as earned and the costs incurred are recorded as Selling, general and administrative expenses in the accompanying consolidated statements of operations and comprehensive income. Reimbursements for costs of marketing programs of $
The previous credit card agreement provided a signing bonus to the Company, which was recognized as revenue through August 2023. The amended and restated agreement provided for an upfront payment which is being recorded as
F-13
revenue on a straight line basis through January 2031. See Note 4. Revenues for additional information related to our signing bonus and upfront payment.
Employee Benefit Plan
The Company has a 401(k) retirement plan covering all eligible employees who meet certain age and employment requirements pursuant to Section 401(k) of the Internal Revenue Code. Subject to certain dollar limits, eligible employees may contribute a portion of their pretax annual compensation to the plan, on a tax-deferred basis. The plan operates on a calendar year basis.
Concentration of Credit Risks
Financial instruments that potentially subject the Company to concentrations of credit risk principally consist of cash held in financial institutions and accounts receivable. The Company considers the credit risk associated with these financial instruments to be minimal. Cash is held by financial institutions with high credit ratings and the Company has not historically sustained any credit losses associated with its cash balances. The Company evaluates the credit risk associated with accounts receivable to determine if an allowance for estimated credit losses is necessary. As of February 3, 2024 and January 28, 2023, the Company determined that
3. Accounting Standards
Recently Issued Accounting Standards
In October 2023, the Financial Accounting Standards Board (“FASB”) issued Accounting Standards Update (“ASU”) 2023-06, “Disclosure Improvements: Codification Amendments in Response to the SEC’s Disclosure Update and Simplification Initiative”. This ASU amends the FASB Accounting Standards Codification in response to the SEC’s disclosure update and simplification initiative. This guidance will be applied prospectively with effective date for each amendment to be the date on which the SEC’s removal of that related disclosure from Regulation S-X or Regulation S-K becomes effective, with early adoption prohibited. The Company is assessing what impact this guidance will have on the Company’s consolidated financial statements.
In December 2023, the FASB issued ASU 2023-07, “Segment Reporting, Improvements to Reportable Segment Disclosures”. This ASU enhances the disclosures required about a public entity’s reportable segments in its annual and interim condensed consolidated financial statements. The amendments in this update require additional detailed and enhanced information about reportable segments’ expense, including significant segment expenses and other segment items that bridge segment revenue, significant expenses to segment profit or loss. The ASU also requires disclosure of the title and position of the Chief Operating Decision Maker (“CODM”) on annual basis as well as an explanation of how CODM uses the reported measures and other disclosures. The amendments in this update do not change how a public entity identifies its operating segments, aggregates those operating segments, or applies the quantitative thresholds to determine its reportable segments. ASU 2023-07 is effective for the Company for annual reporting periods beginning with the fiscal year ending February 1, 2025 and for interim reporting periods beginning in fiscal year 2026. Early adoption is permitted. The Company is assessing what impact this guidance will have on its disclosures in the Company’s consolidated financial statements.
In December 2023, the FASB issued ASU 2023-09, “Improvements to Income Tax Disclosures”. This ASU requires enhanced income tax disclosures, including disaggregation of information in the rate reconciliation table and disaggregated information related to income taxes paid. The other amendments in this update improve the effectiveness and comparability of disclosures by (1) adding disclosures of pretax income (or loss) and income tax expense (or benefit), and (2) removing disclosures that are no longer considered cost beneficial or relevant. The amendments in ASU 2023-09 are effective for the fiscal year ending January 31, 2026. Early adoption is permitted. The Company is currently evaluating the impact that this guidance will have on its disclosures in the Company’s consolidated financial statements.
F-14
4. Revenues
Disaggregation of Revenue
The Company sells its apparel and accessory merchandise through its Retail and Direct channels.
|
|
For the Fiscal Year Ended |
|
|||||||||
|
|
February 3, 2024 |
|
|
January 28, 2023 |
|
|
January 29, 2022 |
|
|||
Retail |
|
$ |
|
|
$ |
|
|
$ |
|
|||
Direct |
|
|
|
|
|
|
|
|
|
|||
Net sales |
|
$ |
|
|
$ |
|
|
$ |
|
|||
Contract Liabilities
The Company recognizes a contract liability when it has received consideration from the customer and has a future obligation to the customer.
|
|
February 3, 2024 |
|
|
January 28, 2023 |
|
||
Contract liabilities: |
|
|
|
|
|
|
||
Signing bonus (1) |
|
$ |
— |
|
|
$ |
|
|
Upfront payment (2) |
|
|
|
|
|
— |
|
|
Unredeemed gift cards (3) |
|
|
|
|
|
|
||
Total contract liabilities |
|
$ |
|
|
$ |
|
||
For the Fiscal Years 2023, 2022 and 2021, the Company recognized approximately $
Performance Obligations
As of Fiscal Year 2023, the signing bonus related to the private label credit card agreement was fully amortized.
As of Fiscal Year 2023, the Company has received an upfront payment of $
Practical Expedients and Policy Elections
The Company excludes from revenue all amounts collected from customers for sales taxes that are remitted to taxing authorities.
Shipping and handling activities that occur after control of related goods transfers to the customer are accounted for as fulfillment activities rather than assessing these activities as performance obligations.
The Company does not disclose remaining performance obligations that have an expected duration of one year or less.
F-15
5. Prepaid Expenses and Other Current Assets
Prepaid expenses and other current assets include the following (in thousands):
|
|
February 3, 2024 |
|
|
January 28, 2023 |
|
||
Prepaid rent |
|
$ |
|
|
$ |
|
||
Prepaid catalog costs |
|
|
|
|
|
|
||
Prepaid store supplies |
|
|
|
|
|
|
||
Prepaid insurance |
|
|
|
|
|
|
||
Prepaid software project costs |
|
|
|
|
|
|
||
Prepaid software maintenance costs |
|
|
|
|
|
|
||
Returns reserve asset |
|
|
|
|
|
|
||
Corporate income taxes |
|
|
|
|
|
|
||
Other prepaid expenses |
|
|
|
|
|
|
||
Other current assets |
|
|
|
|
|
|
||
Total prepaid expenses and other current assets |
|
$ |
|
|
$ |
|
||
6. Goodwill and Other Intangible Assets
The balance of goodwill was $
A summary of other intangible assets as of February 3, 2024 and January 28, 2023 is as follows (in thousands):
|
|
|
|
February 3, 2024 |
|
|||||||||||||
|
|
Weighted Average Useful Life (Years) |
|
Gross |
|
|
Accumulated Amortization |
|
|
Accumulated Impairment |
|
|
Carrying Amount |
|
||||
Indefinite-lived: |
|
|
|
|
|
|
|
|
|
|
|
|
|
|
||||
Trade name |
|
N/A |
|
$ |
|
|
$ |
— |
|
|
$ |
|
|
$ |
|
|||
Definite-lived: |
|
|
|
|
|
|
|
|
|
|
|
|
|
|
||||
Customer relationships |
|
|
|
|
|
|
|
|
|
|
|
|
|
|||||
Total intangible assets |
|
|
|
$ |
|
|
$ |
|
|
$ |
|
|
$ |
|
||||
|
|
|
|
January 28, 2023 |
|
|||||||||||||
|
|
Weighted Average Useful Life (Years) |
|
Gross |
|
|
Accumulated Amortization |
|
|
Accumulated Impairment |
|
|
Carrying Amount |
|
||||
Indefinite-lived: |
|
|
|
|
|
|
|
|
|
|
|
|
|
|
||||
Trade name |
|
N/A |
|
$ |
|
|
$ |
— |
|
|
$ |
|
|
$ |
|
|||
Definite-lived: |
|
|
|
|
|
|
|
|
|
|
|
|
|
|
||||
Customer relationships |
|
|
|
|
|
|
|
|
|
|
|
|
|
|||||
Total intangible assets |
|
|
|
$ |
|
|
$ |
|
|
$ |
|
|
$ |
|
||||
Impairment Tests
General
Goodwill and indefinite-lived intangible assets are not amortized but are reviewed for impairment at least annually, or more frequently when events or changes in circumstances indicate that the carrying value may not be recoverable. Definite-lived intangible assets are reviewed for impairment when events or circumstances indicate that the carrying value may not be recoverable. Judgments regarding indicators of potential impairment are based on market conditions and operational performance of the business.
The Company’s policy is to perform a quantitative analysis of goodwill and indefinite-lived intangible assets every
F-16
likely than not that the fair value of a reporting unit is less than its carrying value. If management concludes, based on its assessment of relevant events, facts and circumstances, that it is more likely than not that an impairment exists, then a quantitative analysis is performed to determine if there is any impairment.
For goodwill, the quantitative assessment requires comparing the fair value of a reporting unit to its carrying value, including goodwill. The Company estimates fair value using the income approach. The income approach uses a discounted cash flow model, which involves significant estimates and assumptions, including preparation of revenue and profitability growth forecasts, selection of a discount rate, and selection of a terminal year multiple. These assumptions are classified as Level 3 inputs. If the fair value of a reporting unit exceeds its carrying amount, goodwill is not considered to be impaired and no further testing is required. If the carrying amount exceeds the reporting unit’s fair value, a goodwill impairment charge is recognized for the amount in excess, not to exceed the total amount of goodwill allocated to that reporting unit. An impairment charge is recorded within the Company’s consolidated statements of operations and comprehensive income.
For other intangible assets, impairment losses are recorded to the extent that the carrying value of the intangible asset exceeds its fair value. The Company measures the fair value of its trade name using the relief from royalty method and the fair value of customer relationships using a recoverability approach. The most significant estimates and assumptions inherent in these approaches are the preparation of revenue forecasts, selection of royalty and discount rates and a terminal year multiple. These assumptions are classified as Level 3 inputs.
2023 Impairment Tests
During the fourth quarter of Fiscal Year 2023, the Company performed its annual assessment by electing to perform a quantitative assessment (the “2023 Impairment Test”). The 2023 Impairment Test was performed using the income approach (or discounted cash flows method) for goodwill, the relief-from-royalty method for indefinite-lived intangible assets and a recoverability analysis for definite-lived intangible assets. The estimated fair values of the reporting units, indefinite-lived and definite-lived intangible assets were above their carrying values resulting in no impairment of goodwill, the Company’s trade name (indefinite-lived intangible asset) and the Company’s customer list (definite-lived intangible asset). The most significant estimates and assumptions inherent in this approach are the preparation of revenue forecasts, selection of royalty and discount rates and a terminal year multiple. These assumptions are classified as Level 3 inputs. The key assumptions used under the income approach and relief-from-royalty method for the Fiscal Year 2023 Impairment Tests included the following:
For goodwill and other intangible assets, the Company performed the required impairment tests applying the quantitative approach and
2022 and 2021 Impairments
For goodwill and other intangible assets, the Company performed the required impairment tests applying the qualitative approach and
F-17
Definite-Lived Intangible Assets
The definite-lived intangible assets are amortized over the period the Company expects to receive the related economic benefit, which for customer lists is based upon estimated future net cash inflows. The estimated useful lives of intangible assets are as follows:
Asset |
|
Amortization Method |
|
Estimated Useful Life |
Customer lists |
|
|
Total amortization expense for these amortizable intangible assets was $
The estimated amortization expense for each of the next five years and thereafter is as follows (in thousands):
Fiscal Year |
|
Estimated Amortization Expense |
|
|
2024 |
|
|
|
|
2025 |
|
|
|
|
2026 |
|
|
|
|
2027 |
|
|
|
|
2028 |
|
|
|
|
Thereafter |
|
|
|
|
Total |
|
$ |
|
|
7. Property and Equipment
Property and equipment at February 3, 2024 and January 28, 2023 consist of the following (in thousands):
|
|
February 3, 2024 |
|
|
January 28, 2023 |
|
||
Leasehold improvements |
|
$ |
|
|
$ |
|
||
Furniture, fixtures and equipment |
|
|
|
|
|
|
||
Computer hardware and software |
|
|
|
|
|
|
||
Total property and equipment, gross |
|
|
|
|
|
|
||
Accumulated depreciation |
|
|
( |
) |
|
|
( |
) |
|
|
|
|
|
|
|
||
Construction in progress |
|
|
|
|
|
|
||
Property and equipment, net |
|
$ |
|
|
$ |
|
||
Construction in progress is primarily comprised of leasehold improvements, furniture, fixtures and equipment related to unopened retail stores and costs incurred related to the implementation of certain computer software and hardware.
Capitalized software, subject to amortization, included in property and equipment at February 3, 2024 and January 28, 2023 had a cost basis of approximately $
Total depreciation expense recorded within Selling, general and administrative expenses on the Consolidated statements of operations was $
During Fiscal Year 2023, the Company recorded $
For Fiscal Years 2023, the Company capitalized $
F-18
8. Accrued Expenses and Other Current Liabilities
Accrued expenses and other current liabilities include the following (in thousands):
|
|
February 3, 2024 |
|
|
January 28, 2023 |
|
||
Accrued payroll and benefits |
|
$ |
|
|
$ |
|
||
Accrued returns reserve |
|
|
|
|
|
|
||
Gift cards redeemable |
|
|
|
|
|
|
||
Accrued professional fees |
|
|
|
|
|
|
||
Accrued corporate expenses |
|
|
|
|
|
|
||
Accrued retail expenses |
|
|
|
|
|
|
||
Taxes, other than income taxes |
|
|
|
|
|
|
||
Accrued occupancy |
|
|
|
|
|
|
||
Other accrued employee costs |
|
|
|
|
|
|
||
Other |
|
|
|
|
|
|
||
Total accrued expenses and other current liabilities |
|
$ |
|
|
$ |
|
||
The following table reflects the changes in the accrued returns reserve for the Fiscal Years 2023, 2022 and 2021 (in thousands):
Accrued returns reserve |
|
Beginning |
|
|
Charged to |
|
|
Deductions |
|
|
End of |
|
||||
Fiscal Year Ended January 29, 2022 |
|
$ |
|
|
$ |
|
|
$ |
( |
) |
|
$ |
|
|||
Fiscal Year Ended January 28, 2023 |
|
|
|
|
|
|
|
|
( |
) |
|
|
|
|||
Fiscal Year Ended February 3, 2024 |
|
|
|
|
|
|
|
|
( |
) |
|
|
|
|||
9. Debt
The components of the Company’s outstanding long-term debt at February 3, 2024 and January 28, 2023 were as follows (in thousands):
|
|
At February 3, 2024 |
|
|||||||||||||
|
|
Outstanding Balance |
|
|
Original Issue Discount |
|
|
Capitalized Fees & Expenses |
|
|
Balance Sheet |
|
||||
Term Loan due 2028 |
|
$ |
|
|
$ |
( |
) |
|
$ |
( |
) |
|
$ |
|
||
Less: Current portion (including Excess Cash Flow payment) |
|
|
( |
) |
|
|
— |
|
|
|
— |
|
|
|
( |
) |
Net long-term debt |
|
$ |
|
|
$ |
( |
) |
|
$ |
( |
) |
|
$ |
|
||
|
|
At January 28, 2023 |
|
|||||||||||||
|
|
Outstanding Balance |
|
|
Original Issue Discount |
|
|
Capitalized Fees & Expenses |
|
|
Balance Sheet |
|
||||
Priming Term Loan due 2024 |
|
$ |
|
|
$ |
( |
) |
|
$ |
( |
) |
|
$ |
|
||
Subordinated Term Loan due 2024 |
|
|
|
|
|
— |
|
|
|
( |
) |
|
|
|
||
Totals |
|
|
|
|
|
( |
) |
|
|
( |
) |
|
|
|
||
Less: Current portion |
|
|
( |
) |
|
|
— |
|
|
|
— |
|
|
|
( |
) |
Net long-term debt |
|
$ |
|
|
$ |
( |
) |
|
$ |
( |
) |
|
$ |
|
||
The original issuer discount and capitalized fees and expenses are amortized over the related term of the debt.
The Company recorded interest expense related to long-term debt of $
F-19
Term Loan Credit Agreement
On April 5, 2023, the Company and Jill Acquisition LLC (the “Borrower”) entered into a Term Loan Credit Agreement (the “Term Loan Credit Agreement”) by and among the lenders party thereto and Jefferies Finance LLC, as administrative and collateral agent. The Term Loan Credit Agreement provides for a secured term loan facility in an aggregate principal amount of $
In conjunction with the entry into the Term Loan Credit Agreement, the Company paid $
The Term Loan Facility is to be repaid in quarterly payments of $
As of February 3, 2024 the Company expects to make an ECF payment of $
The Term Loan Facility may be voluntarily prepaid after the one-year anniversary but on or prior to the two-year anniversary, subject to a premium of
The Borrower’s obligations under the Term Loan Credit Agreement are guaranteed by the Company and J.Jill Gift Card Solutions, Inc., a Florida corporation (“Jill Gift Card Solutions” and collectively with the Company, the “Guarantors”), and are secured by substantially all of the real and personal property of the Borrower and the Guarantors, subject to certain customary exceptions. The Term Loan Credit Agreement includes customary negative covenants for term loan agreements of this type, including covenants limiting the ability of the Borrower and the Guarantors to, among other things, incur additional indebtedness, create liens on assets, make investments, loans or advances, engage in mergers, consolidations, sales of assets and purchases, pay dividends and distributions, enter into transactions with affiliates, and make payments in respect of junior indebtedness, in each case subject to customary exceptions for term loan agreements of this type. The Term Loan Credit Agreement also includes certain customary representations and warranties, affirmative covenants, certain financial covenants and events of default, including but not limited to, payment defaults, breaches of representations and warranties, covenant defaults, certain events under the Employee Retirement Income Security Act of 1974 (“ERISA”), certain final non-appealable judgments that are not covered by a reputable and solvent insurance company, certain defaults under other indebtedness, change of control and certain Title 11 proceedings.
As of February 3, 2024, the Company was in compliance with all covenants.
Priming and Subordinated Term Loans
The proceeds from the Term Loan Credit Agreement, combined with a portion of the Company’s existing cash on hand, were used to repay in full the outstanding balance of $
A portion of the transaction was accounted for as a debt modification. As a result, approximately $
F-20
entirety of the Subordinated Credit Agreement, the Company recorded a loss on debt refinancing of $
The Company was in compliance with all covenants in effect under the Priming Credit Agreement and the Subordinated Credit Agreement at the time of their repayment and for the Fiscal Year ended January 28, 2023.
Asset-Based Revolving Credit Agreement
On May 8, 2015, the Company entered into a
On April 15, 2022, the Company entered into an amendment to the ABL Facility, whereby (i) the maturity date of the ABL Facility was extended from
On May 10, 2023, the Company entered into Amendment No. 6 to the ABL Credit Agreement, by and among the Company, J.Jill Gift Card Solutions, the other guarantors party thereto the other lenders party thereto, and CIT Finance LLC, as the administrative agent and collateral agent.
On December 1, 2023, the Company entered into Amendment No. 7 (the “ABL Amendment”) to the ABL Credit Agreement, by and among the Company, Jill Acquisition LLC, J.Jill Gift Card Solutions, Inc. (collectively, the “Borrowers”), the other guarantors party thereto, the other lenders party thereto, and CIT Finance LLC, as the administrative agent and collateral agent. The ABL Amendment made a technical revision for administrative purposes which removed the requirement for a Borrower’s non-negotiable bill of lading, non-negotiable sea waybill or other similar shipping document (each a “Non-Negotiable Document”) to state on its face that the inventory that is subject to such Non-Negotiable Document is subject to the lien of the administrative agent. In connection with removing this requirement, a $
The ABL Facility consists of revolving loans and swing line loans. Borrowings classified as revolving loans under the ABL Facility may be maintained as either Term SOFR or Base Rate loans, each of which has a variable interest rate plus an applicable margin. Borrowings classified as swing line loans under the ABL Facility are Base Rate loans. Term SOFR loans under the ABL Facility accrue interest at a rate equal to Term SOFR plus a spread ranging from
The ABL Facility also requires the quarterly payment, in arrears, of a commitment fee. The commitment fee is payable in an amount equal to (i)
The Company had
The Company incurred an immaterial amount of interest expense related to the ABL facility for Fiscal Years 2023 and 2022, respectively. The Company recorded interest expense related to the ABL Facility of $
F-21
In the Fiscal Years 2023 and 2022, there were
Borrowings under the ABL Facility are secured by a first lien on accounts receivable and inventory. In connection with the ABL Facility, the Company is subject to various financial reporting (including with respect to liquidity), financial and other covenants. Affirmative covenants include providing timely quarterly and annual financial statements and prompt notification of the occurrence of any event of default or any other event, change or circumstance that has had, or could reasonably be expected to have, a material adverse effect as defined in the ABL Facility. In addition, there are negative covenants, including certain restrictions on the Company’s ability to incur additional indebtedness, create liens, enter into transactions with affiliates, transfer assets, pay dividends, consolidate or merge with other entities, make advances, investments and loans or modify its organizational documents. The ABL Facility also includes certain financial maintenance covenants, including a requirement to maintain a fixed charge coverage ratio greater than or equal to
If an event of default occurs under the ABL Facility, the Company’s obligations may be accelerated. In addition, a
Letters of Credit
As of February 3, 2024 and January 28, 2023, there were outstanding letters of credit of $
Payments of Long-term Debt Obligations Due by Period
As of February 3, 2024, minimum future principal amounts payable under the Company’s outstanding long-term debt are as follows (in thousands):
Fiscal Year |
|
Term Loan Credit Agreement |
|
|
2024 (including Excess Cash Flow payment) |
|
|
|
|
2025 |
|
|
|
|
2026 |
|
|
|
|
2027 |
|
|
|
|
2028 |
|
|
|
|
|
|
$ |
|
|
10. Fair Value Measurements
Certain assets and liabilities are carried at fair value in accordance with GAAP. Fair value is defined as the exchange price that would be received for an asset or paid to transfer a liability (an exit price) in the principal or most advantageous market for the asset or liability in an orderly transaction between market participants on the measurement date.
Valuation techniques used to measure fair value requires the Company to maximize the use of observable inputs and minimize the use of unobservable inputs. The hierarchy gives the highest priority to unadjusted quoted prices in active markets for identical assets or liabilities (Level 1 measurements) and the lowest priority to unobservable inputs (Level 3 measurements). Financial assets and liabilities carried at fair value are to be classified and disclosed in one of the following three levels of the fair value hierarchy, of which the first two are considered observable and the last is considered unobservable:
F-22
The following tables present the carrying value and fair value hierarchy for those assets and liabilities measured at fair value on a recurring basis as of February 3, 2024 and January 28, 2023, respectively (in thousands):
|
|
|
|
|
Fair Value as of February 3, 2024 |
|
||||||||||
|
|
Carrying Value |
|
|
Level 1 |
|
|
Level 2 |
|
|
Level 3 |
|
||||
Financial instruments not carried at fair value: |
|
|
|
|
|
|
|
|
|
|
|
|
||||
Total debt |
|
$ |
|
|
$ |
— |
|
|
$ |
|
|
$ |
— |
|
||
Total financial instruments not carried at fair value |
|
$ |
|
|
$ |
— |
|
|
$ |
|
|
$ |
— |
|
||
|
|
|
|
|
Fair Value as of January 28, 2023 |
|
||||||||||
|
|
Carrying Value |
|
|
Level 1 |
|
|
Level 2 |
|
|
Level 3 |
|
||||
Financial instruments not carried at fair value: |
|
|
|
|
|
|
|
|
|
|
|
|
||||
Total debt |
|
$ |
|
|
$ |
— |
|
|
$ |
|
|
$ |
— |
|
||
Total financial instruments not carried at fair value |
|
$ |
|
|
$ |
— |
|
|
$ |
|
|
$ |
— |
|
||
The Company’s debt instruments include the Term Loan Credit Agreement as of February 3, 2024, and the Priming Credit Agreement and Subordinated Credit Agreement as of January 28, 2023. The debt instruments are recorded at cost, net of debt issuance costs and any related discount. The fair value of the debt instruments is obtained based on observable market prices quoted on public exchanges for similar instruments.
The Company believes that the carrying amounts of its other financial instruments, including cash and cash equivalents, accounts receivable, accounts payable and any amounts drawn on its revolving credit facilities, consisting primarily of instruments without extended maturities, based on management’s estimates, approximates their fair value due to the short-term maturities of these instruments.
Assets and Liabilities with Recurring Fair Value Measurements - Certain assets and liabilities may be measured at fair value on an ongoing basis. We did not elect to apply the fair value option for recording financial assets and financial liabilities. Other than total debt, we do not have any assets or liabilities which we measure at fair value on a recurring basis.
Assets and Liabilities with Nonrecurring Fair Value Measurements - Certain assets and liabilities are not measured at fair value on an ongoing basis. These assumptions are classified as Level 3 inputs. These assets and liabilities, which include long-lived assets, goodwill, and intangible assets, are subject to fair value adjustment in certain circumstances. From time to time, the fair value is determined on these assets and liabilities as part of related impairment tests or for disclosure purposes. Other than impairment accounting adjustments, no adjustments to fair value or fair value measurements were required for non-financial assets and liabilities for all periods presented. See Note 6. Goodwill and Other Intangible Assets, for additional information.
11. Commitments and Contingencies
Legal Proceedings
The Company is subject to various legal proceedings that arise in the ordinary course of business. Although the outcome of such proceedings cannot be predicted with certainty, management does not believe that the Company is presently party to any legal proceedings the resolution of which management believes would have a material adverse effect on the Company’s financial statements. The Company establishes reserves for specific legal matters, including legal costs, when the Company determines that the likelihood of an unfavorable outcome is probable, and the loss is reasonably estimable.
Concentration Risk
An adverse change in the Company’s relationships with its key suppliers, or loss of the supply of one of the Company’s key products for any reason, could have a material effect on the business and results of operations of the Company.
Other Commitments
F-23
12. Operating Leases
As of February 3, 2024, the Company leased certain retail stores, a distribution center, and office space. As of that same date, the Company did not have any financing leases and no operating leases contained any material residual value guarantees or material restrictive covenants. Certain of the Company’s retail operating leases include variable rental payments based on a percentage of retail sales over contractual levels and month-to-month leases.
The Company maintained a tenant incentive liability of $
The components of lease expense were as follows (in thousands):
|
|
|
|
For the Fiscal Year Ended |
|
|||||||||
Lease Cost |
|
Classification |
|
February 3, 2024 |
|
|
January 28, 2023 |
|
|
January 29, 2022 |
|
|||
Operating lease cost |
|
SG&A Expenses |
|
$ |
|
|
$ |
|
|
$ |
|
|||
Variable lease cost |
|
SG&A Expenses |
|
|
|
|
|
|
|
|
|
|||
Total lease cost |
|
|
|
$ |
|
|
$ |
|
|
$ |
|
|||
For Fiscal Year 2022, noncash impairment charges of $
For the fiscal years ended February 3, 2024, January 28, 2023 and January 29, 2022, total common area maintenance expense was $
For the fiscal years ended February 3, 2024 and January 28, 2023, the total cash paid for amounts included in the measurement of operating lease liabilities was $
The weighted average remaining lease term and weighted average discount rate for our operating leases are as follows:
Lease Term and Discount Rate |
|
February 3, 2024 |
|
|
Weighted-average remaining lease term (in years) |
|
|
|
|
Operating leases |
|
|
|
|
Weighted-average discount rate |
|
|
|
|
Operating leases |
|
|
% |
|
Maturities of lease liabilities as of February 3, 2024 were as follows (in thousands):
Fiscal Year |
|
Operating Leases(1) |
|
|
2024 |
|
|
|
|
2025 |
|
|
|
|
2026 |
|
|
|
|
2027 |
|
|
|
|
2028 |
|
|
|
|
Thereafter |
|
|
|
|
Subtotal |
|
|
|
|
Less: Imputed interest |
|
|
|
|
Present value of lease liabilities |
|
$ |
|
|
F-24
13. Income Taxes
The provision (benefit) for income taxes for the Fiscal Years 2023, 2022, and 2021 consists of the following (in thousands):
|
|
For the Fiscal Year Ended |
|
|||||||||
|
|
February 3, 2024 |
|
|
January 28, 2023 |
|
|
January 29, 2022 |
|
|||
Current |
|
|
|
|
|
|
|
|
|
|||
U.S. Federal |
|
$ |
|
|
$ |
|
|
$ |
|
|||
State and local |
|
|
|
|
|
|
|
|
|
|||
Total current |
|
|
|
|
|
|
|
|
|
|||
Deferred tax benefit |
|
|
|
|
|
|
|
|
|
|||
U.S. Federal |
|
|
|
|
|
( |
) |
|
|
( |
) |
|
State and local |
|
|
( |
) |
|
|
|
|
|
( |
) |
|
Total deferred tax expense (benefit) |
|
|
|
|
|
( |
) |
|
|
( |
) |
|
Total income tax provision |
|
$ |
|
|
$ |
|
|
$ |
|
|||
The effective tax rate for the fiscal year ended February 3, 2024 differs from the federal statutory rate of
A reconciliation of the federal statutory income tax rate of
|
|
For the Fiscal Year Ended |
|
|||||||||
|
|
February 3, 2024 |
|
|
January 28, 2023 |
|
|
January 29, 2022 |
|
|||
Federal statutory income tax rate |
|
|
% |
|
|
% |
|
|
% |
|||
State income taxes, net of federal tax effect |
|
|
% |
|
|
% |
|
|
( |
)% |
||
Fair market value of warrants and derivative |
|
|
% |
|
|
% |
|
|
( |
)% |
||
Disallowed interest |
|
|
% |
|
|
% |
|
|
% |
|||
Disallowed officer compensation |
|
|
% |
|
|
% |
|
|
( |
)% |
||
Net operating loss CARES ACT benefit |
|
|
% |
|
|
% |
|
|
% |
|||
Valuation allowance |
|
|
( |
)% |
|
|
( |
)% |
|
|
% |
|
Equity-based compensation expense |
|
|
( |
)% |
|
|
( |
)% |
|
|
% |
|
Charitable contributions |
|
|
( |
)% |
|
|
( |
)% |
|
|
% |
|
Tax return to provision adjustments |
|
|
% |
|
|
% |
|
|
( |
)% |
||
Other |
|
|
( |
)% |
|
|
% |
|
|
% |
||
Effective tax rate |
|
|
% |
|
|
% |
|
|
( |
)% |
||
F-25
The components of deferred tax assets (liabilities) were as follows (in thousands):
|
|
|
|
|||||
|
|
February 3, 2024 |
|
|
January 28, 2023 |
|
||
Deferred tax assets |
|
|
|
|
|
|
||
Accrued expenses |
|
$ |
|
|
$ |
|
||
Net operating loss and interest carryforwards |
|
|
|
|
|
|
||
Start-up costs |
|
|
|
|
|
|
||
Debt issuance costs |
|
|
— |
|
|
|
|
|
Lease liabilities |
|
|
|
|
|
|
||
Total deferred tax assets, gross |
|
|
|
|
|
|
||
Less: Deferred tax valuation allowances |
|
|
— |
|
|
|
( |
) |
Total deferred tax assets net of valuation allowances |
|
|
|
|
|
|
||
Deferred tax liabilities |
|
|
|
|
|
|
||
Inventory |
|
|
( |
) |
|
|
( |
) |
Lease assets |
|
|
( |
) |
|
|
( |
) |
Fixed assets |
|
|
( |
) |
|
|
( |
) |
Intangible assets |
|
|
( |
) |
|
|
( |
) |
Prepaid expenses |
|
|
( |
) |
|
|
( |
) |
Total deferred tax liabilities |
|
|
( |
) |
|
|
( |
) |
Net deferred tax liabilities |
|
$ |
( |
) |
|
$ |
( |
) |
Deferred tax assets and deferred tax liabilities are recognized based on temporary differences between the financial reporting and tax bases of assets and liabilities using statutory rates. The Company has evaluated the positive and negative evidence bearing upon the realizability of its deferred tax assets on a quarterly basis. During the fiscal year ended February 3, 2024, the Company reassessed the valuation allowance noting the shift of positive evidence outweighing negative evidence, including continued strong historical profits since the fiscal year 2021 emergence from the COVID-19 pandemic and expectations regarding future profitability. After assessing both the positive evidence and negative evidence, management determined it was more likely than not that the Company will realize all of its deferred tax assets as of the fiscal year ended February 3, 2024. As such, the Company has released its valuation allowance on its state deferred tax assets that are expected to be utilized in future years during the fiscal year ended February 3, 2024. The Company’s total deferred tax asset balance subject to a valuation allowance analysis was $
As of February 3, 2024, the Company does
The following table summarizes the changes in the Company’s unrecognized income tax benefits for Fiscal Years 2023, 2022 and 2021 (in thousands):
|
|
For the Fiscal Year Ended |
|
|||||||||
|
|
February 3, 2024 |
|
|
January 28, 2023 |
|
|
January 29, 2022 |
|
|||
Balance at the beginning of the period |
|
$ |
|
|
$ |
|
|
$ |
|
|||
(Decreases) Increases for tax positions related to prior periods |
|
|
( |
) |
|
|
|
|
|
|
||
Balance at the end of the period |
|
$ |
|
|
$ |
|
|
$ |
|
|||
The Company had gross unrecognized tax benefits of $
For federal and state income tax purposes, the Company’s tax years remain open under statute for Fiscal Year 2016 to present.
F-26
14. Net Income (Loss) Per Share
The following table summarizes the computation of basic and diluted net income (loss) per common share for the Fiscal Years 2023, 2022 and 2021 (in thousands, except share and per share data):
|
|
For the Fiscal Year Ended |
|
|||||||||
|
|
February 3, 2024 |
|
|
January 28, 2023 |
|
|
January 29, 2022 |
|
|||
Numerator |
|
|
|
|
|
|
|
|
|
|||
Net income (loss) |
|
$ |
|
|
$ |
|
|
$ |
( |
) |
||
Denominator |
|
|
|
|
|
|
|
|
|
|||
Weighted average number of common shares outstanding |
|
|
|
|
|
|
|
|
|
|||
Assumed exercise of warrants |
|
|
|
|
|
|
|
|
|
|||
Weighted average common shares, basic |
|
|
|
|
|
|
|
|
|
|||
Dilutive effect of equity compensation awards |
|
|
|
|
|
|
|
|
— |
|
||
Weighted average common shares, diluted |
|
|
|
|
|
|
|
|
|
|||
Net income (loss) per common share, basic |
|
$ |
|
|
$ |
|
|
|
( |
) |
||
Net income (loss) per common share, diluted |
|
$ |
|
|
$ |
|
|
$ |
( |
) |
||
Equity compensation awards are excluded from the diluted earnings per share calculation when their inclusion would have an antidilutive effect such as when the Company has a net loss for the reporting period, or if the assumed proceeds per share of the award is in excess of the related fiscal period’s average price of the Company’s common stock. Accordingly, there were
Warrants
On May 31, 2021, and within the terms of the Priming Loan, the Company chose to issue
Effective May 31, 2021 the warrants issued to the Subordinated Facility holders have been included in the denominator for basic and diluted EPS calculations as the exercise of the warrants is near certain because the exercise price is non substantive in relation to the fair value of the common shares to be issued upon exercise.
15. Equity-Based Compensation
In conjunction with the initial public offering (“IPO”), on March 9, 2017, the Company established the J.Jill, Inc. Omnibus Equity Incentive Plan, as amended and restated on June 1, 2023 (the “A&R Plan”), which reserves common stock for issuance upon exercise of options, or in respect of granted awards. The A&R Plan is administered by the Compensation Committee of the Board of Directors (the “Committee”). The Committee has the authority to determine the type, size and terms and conditions of awards to be granted and to grant such awards.
On June 29, 2023, the Company registered an additional
During Fiscal Year 2023, the Committee approved and granted restricted stock units (“RSUs”) and performance-based restricted stock units (“PSUs”) under the A&R Plan.
F-27
Equity-based compensation expense for all award types of $
Restricted Stock Units
During Fiscal Years 2023 and 2022, the Committee granted RSUs under the A&R Plan, which
The following table summarizes the RSUs award activity, for Fiscal Year 2023:
|
Number of RSUs |
|
Weighted Average Grant Date Fair Value |
|
||
Unvested units outstanding at January 28, 2023 |
|
|
$ |
|
||
Granted |
|
|
$ |
|
||
Vested |
|
( |
) |
$ |
|
|
Forfeited |
|
( |
) |
$ |
|
|
Unvested units outstanding at February 3, 2024 |
|
|
$ |
|
||
As of February 3, 2024, there was $
Performance Stock Units
During Fiscal Year 2023, the Company granted PSUs, a portion of which are based on achieving an Adjusted earnings before interest, taxes, depreciation and amortization (“Adjusted EBITDA”) goal and the remaining portion is based on achieving an annualized absolute total shareholder return (“TSR”) growth goal.
Each PSU award reflects a target number of shares (“Target Shares”) that may be issued to the award recipient provided the employee continues to provide services to the Company throughout the three year performance period of the award. For Adjusted EBITDA based PSUs, the number of units earned will be determined based on the achievement of the predetermined Adjusted EBITDA goals at the end of each performance year, and for TSR based PSUs, the number of units earned will be determined based on the achievement of the predetermined TSR growth goal at the end of the performance period. The TSR is based on J.Jill’s
The fair value of the PSUs granted during Fiscal Year 2023 for which the performance is based on an Adjusted EBITDA goal was determined based on the market price of the Company’s shares on the date of the grant. Additionally, for those awards whose performance is based on a TSR growth goal, the fair value was estimated on the grant date using a Monte Carlo simulation with the below noted assumptions:
Monte Carlo Simulation Assumptions |
|
|
|
Risk Free Interest Rate |
|
% |
|
Expected Dividend Yield |
— |
|
|
Expected Volatility |
|
% |
|
Expected Term |
|
||
The Company recognizes equity-based compensation expense related to Adjusted EBITDA goal-based PSUs based on the Company’s estimate of the percentage of the award that will be achieved. The Company evaluates the estimate on these awards on a quarterly basis and adjusts equity-based compensation expense related to these awards, as appropriate. For the TSR goal-based PSUs, the equity-based compensation expense is recognized on a straight-line basis over the
F-28
The following table summarizes the PSU awards activity for Fiscal Year 2023:
|
Number of PSUs |
|
Weighted Average Grant Date Fair Value |
|
||
Unvested units outstanding at January 28, 2023 |
|
— |
|
|
— |
|
Granted |
|
|
$ |
|
||
Forfeited |
|
( |
) |
$ |
|
|
Unvested units outstanding at February 3, 2024 |
|
|
$ |
|
||
As of February 3, 2024, there was $
Stock Options
During Fiscal Years 2018 and 2017, the Committee granted stock options under the A&R Plan. Stock options are granted to purchase ordinary shares at prices as determined by the Committee, but in no event shall the exercise price be less than the fair market value of the common stock at the time of grant. Options generally vest in equal installments over a
As of February 3, 2024, there was
Employee Stock Purchase Plan (the “Purchase Plan”)
The Company established the Purchase Plan during Fiscal Year 2017, under which a maximum of
16. Related Party Transactions
TowerBrook Capital Partners LP (“TowerBrook”) controls a majority of the voting power of our outstanding voting stock, and as a result we are a controlled company within the meaning of the New York Stock Exchange (the “NYSE”) corporate governance standards.
On September 30, 2020, the Company entered into the Subordinated Facility, with a group of lenders that includes certain affiliates of TowerBrook and our Chairman of the board of directors. As of April 5, 2023, the Subordinated Facility was repaid in full. Refer to Note 9. Debt for additional information on repayment of the Subordinated Facility.
In the consolidated statements of operations and comprehensive income, in association with the Subordinated Facility, the Company incurred $
During the Fiscal Years 2023, 2022 and 2021, the Company incurred an immaterial amount of other related party transactions.
F-29