UNITED STATES
SECURITIES AND EXCHANGE COMMISSION
WASHINGTON, D.C. 20549
FORM 10-K
Annual report pursuant to Section 13 or 15(d) of
the Securities Exchange Act of 1934
| For the fiscal year ended | Commission file | |||||||||||||
| number | ||||||||||||||
(Exact name of registrant as specified in its charter)
| (State or other jurisdiction of incorporation or organization) | (I.R.S. employer identification no.) | ||||||||||
| (Address of principal executive offices) | (Zip Code) | ||||||||||
Registrant’s telephone number, including area code: (212 ) 270-6000
Securities registered pursuant to Section 12(b) of the Act:
| Title of each class | Trading Symbol(s) | Name of each exchange on which registered | ||||||
Securities registered pursuant to Section 12(g) of the Act: None
Indicate by check mark if the registrant is a well-known seasoned issuer, as defined in Rule 405 of the Securities Act. ☐ Yes ☒ No
Indicate by check mark if the registrant is not required to file reports pursuant to Section 13 or Section 15(d) of the Act. ☐ Yes ☒ No
Indicate by check mark whether the registrant (1) has filed all reports required to be filed by Section 13 or 15(d) of the Securities Exchange Act of 1934 during the preceding 12 months (or for such shorter period that the registrant was required to file such reports), and (2) has been subject to such filing requirements for the past 90 days. ☒ Yes ☐ No
Indicate by check mark whether the registrant has submitted electronically every Interactive Data File required to be submitted pursuant to Rule 405 of Regulation S-T (§ 232.405 of this chapter) during the preceding 12 months (or for such shorter period that the registrant was required to submit such files). ☒ Yes ☐ No
Indicate by check mark whether the registrant is a large accelerated filer, an accelerated filer, a non-accelerated filer, a smaller reporting company, or an emerging growth company. See the definitions of “large accelerated filer,” “accelerated filer,” “smaller reporting company,” and “emerging growth company” in Rule 12b-2 of the Exchange Act.
☒ | ☐ | Accelerated filer | ☐ | Non-accelerated filer | Smaller reporting company | Emerging growth company | |||||||||||||||||||||||
If an emerging growth company, indicate by check mark if the registrant has elected not to use the extended transition period for complying with any new or revised financial accounting standards provided pursuant to Section 13(a) of the Exchange Act. ☐
Indicate by check mark whether the registrant has filed a report on and attestation to its management’s assessment of the effectiveness of its internal control over financial reporting under Section 404(b) of the Sarbanes-Oxley Act (15 U.S.C. 7262(b)) by the registered public accounting firm that prepared or issued its audit report. ☒ Yes ☐ No
If securities are registered pursuant to Section 12(b) of the Act, indicate by check mark whether the financial statements of the registrant included in the filing reflect the correction of an error to previously issued financial statements. ☐
Indicate by check mark whether any of those error corrections are restatements that required a recovery analysis of incentive-based compensation received by any of the registrant’s executive officers during the relevant recovery period pursuant to §240.10D-1 (b). ☐
Indicate by check mark whether the registrant is a shell company (as defined in Rule 12b-2 of the Exchange Act). ☐ Yes ☒ No
The aggregate market value of JPMorgan Chase & Co. common stock held by non-affiliates as of June 30, 2023: $421,027,210,720
Number of shares of common stock outstanding as of January 31, 2024: 2,880,371,498
Documents incorporated by reference: Portions of the registrant’s Proxy Statement for the annual meeting of stockholders to be held on May 21, 2024, are incorporated by reference in this Form 10-K in response to Items 10, 11, 12, 13 and 14 of Part III.
Form 10-K Index
| Page | ||||||||
| 1 | ||||||||
| 1 | ||||||||
| 1 | ||||||||
| 1 | ||||||||
| 2-3 | ||||||||
| 4-8 | ||||||||
| 310-314 | ||||||||
| 46, 170, 310 | ||||||||
| 227 | ||||||||
| 113-130, 235-254 | ||||||||
| 131-133, 255-260 | ||||||||
| 274 | ||||||||
| 9-33 | ||||||||
| 34 | ||||||||
| 34 | ||||||||
| 34 | ||||||||
| 34 | ||||||||
| 35 | ||||||||
| 35 | ||||||||
| 35 | ||||||||
| 35 | ||||||||
| 36 | ||||||||
| 36 | ||||||||
| 36 | ||||||||
| 37 | ||||||||
| 37 | ||||||||
| 38 | ||||||||
| 39 | ||||||||
| 39 | ||||||||
| 39 | ||||||||
| 39 | ||||||||
| 40-43 | ||||||||
Part I
Item 1. Business.
Overview
JPMorgan Chase & Co. (“JPMorgan Chase” or the “Firm”, NYSE: JPM), a financial holding company incorporated under Delaware law in 1968, is a leading financial services firm based in the United States of America (“U.S.”), with operations worldwide. JPMorgan Chase had $3.9 trillion in assets and $327.9 billion in stockholders’ equity as of December 31, 2023. The Firm is a leader in investment banking, financial services for consumers and small businesses, commercial banking, financial transaction processing and asset management. Under the J.P. Morgan and Chase brands, the Firm serves millions of customers, predominantly in the U.S., and many of the world’s most prominent corporate, institutional and government clients globally.
JPMorgan Chase’s principal bank subsidiary is JPMorgan Chase Bank, National Association (“JPMorgan Chase Bank, N.A.”), a national banking association with U.S. branches in 48 states and Washington, D.C. JPMorgan Chase’s principal non-bank subsidiary is J.P. Morgan Securities LLC (“J.P. Morgan Securities”), a U.S. broker-dealer. The bank and non-bank subsidiaries of JPMorgan Chase operate nationally as well as through overseas branches and subsidiaries, representative offices and subsidiary foreign banks. The Firm’s principal operating subsidiaries outside the U.S. are J.P. Morgan Securities plc and J.P. Morgan SE (“JPMSE”), which are subsidiaries of JPMorgan Chase Bank, N.A. and are based in the United Kingdom (“U.K.”) and Germany, respectively.
The Firm’s website is www.jpmorganchase.com. JPMorgan Chase makes available on its website, free of charge, annual reports on Form 10-K, quarterly reports on Form 10-Q and current reports on Form 8-K pursuant to Section 13(a) or Section 15(d) of the Securities Exchange Act of 1934, as soon as reasonably practicable after it electronically files or furnishes such material to the U.S. Securities and Exchange Commission (the “SEC”) at www.sec.gov. JPMorgan Chase makes new and important information about the Firm available on its website at https://www.jpmorganchase.com, including on the Investor Relations section of its website at https://www.jpmorganchase.com/ir. Information on the Firm's website, including documents on the website that are referenced in this Form 10-K, is not incorporated by reference into this Annual Report on Form 10-K for the year ended December 31, 2023 (“2023 Form 10-K” or “Form 10-K”) or the Firm’s other filings with the SEC. The Firm has adopted, and posted on its website, a Code of Conduct for all employees of the Firm and a Code of Ethics for its Chairman and Chief Executive Officer, Chief Financial Officer, Principal Accounting Officer and all other professionals of the Firm worldwide serving in a finance, accounting, treasury, tax or investor relations role. The Code of Ethics is also available in print upon request to the Firm’s Investor Relations team. Within the time period required by the SEC, JPMorgan Chase will post on its website any amendment to the Code of Ethics and any waiver applicable to a director or executive officer.
Business segments
For management reporting purposes, JPMorgan Chase’s activities are organized into four major reportable business segments, as well as a Corporate segment. The Firm’s consumer business is the Consumer & Community Banking (“CCB”) segment. The Firm’s wholesale businesses are the Corporate & Investment Bank (“CIB”), Commercial Banking (“CB”), and Asset & Wealth Management (“AWM”) segments.
A description of the Firm’s business segments and the products and services they provide to their respective client bases is provided in the “Business segment results” section of Management’s discussion and analysis of financial condition and results of operations (“Management’s discussion and analysis” or “MD&A”), beginning on page 48 and in Note 32. On May 1, 2023, JPMorgan Chase acquired certain assets and assumed certain liabilities of First Republic Bank (the “First Republic acquisition”) from the Federal Deposit Insurance Corporation (“FDIC”). Refer to Note 34 for additional information.
Competition
JPMorgan Chase and its subsidiaries and affiliates operate in highly competitive environments. Competitors include other banks, brokerage firms, investment banking companies, merchant banks, hedge funds, commodity trading companies, private equity firms, insurance companies, mutual fund companies, investment managers, credit card companies, mortgage banking companies, trust companies, securities processing companies, automobile financing companies, leasing companies, e-commerce and other internet-based companies, financial technology companies, and other companies engaged in providing similar as well as new products and services. The Firm’s businesses generally compete on the basis of the quality and variety of the Firm’s products and services, transaction execution, innovation, reputation and price. Competition also varies based on the types of clients, customers, industries and geographies served. With respect to some of its geographies and products, JPMorgan Chase competes globally; with respect to others, the Firm competes on a national or regional basis. New competitors in the financial services industry continue to emerge, including firms that offer products and services solely through the internet and non-financial companies that offer products and services that disintermediate traditional banking products and services offered by financial services firms such as JPMorgan Chase.
1 | ||||||||
Part I
Human capital
JPMorgan Chase believes that its long-term growth and success depend on its ability to attract, develop and retain a high-performing and diverse workforce, with inclusion and accessibility as key components of the way the Firm does business. The information provided below relates to JPMorgan Chase’s full-time and part-time employees and does not include the Firm’s contractors.
Global workforce
As of December 31, 2023, JPMorgan Chase had 309,926 employees globally, an increase of 16,203 employees from the prior year. The increase was primarily attributable to growth in front office, operations and technology, as well as the impact of the First Republic acquisition. The Firm’s employees are located in 65 countries, with 60% of the Firm’s employees located in the U.S. The following table presents the distribution of the Firm’s global workforce by region and by line of business (“LOB”) and Corporate as of December 31, 2023:
| Employee Breakdown by Region | Employee Breakdown by LOB and Corporate | |||||||||||||||||||
| Region | Employees | LOB | Employees | |||||||||||||||||
| North America | 186,751 | CCB | 141,640 | |||||||||||||||||
| Asia-Pacific | 88,406 | CIB | 74,404 | |||||||||||||||||
| Europe/Middle East/Africa | 29,583 | CB | 17,867 | |||||||||||||||||
| Latin America/Caribbean | 5,186 | AWM | 28,485 | |||||||||||||||||
| Total Firm | 309,926 | Corporate | 47,530 | |||||||||||||||||
| Total Firm | 309,926 | |||||||||||||||||||
Diversity, equity and inclusion
The following table presents information based on voluntary self-identifications by the Firm’s employees and members of the Board of Directors, as of December 31, 2023. Information on race/ethnicity of employees is categorized based on Equal Employment Opportunity (“EEO”) classifications and is presented for U.S. employees who self-identified, and information on gender is presented for global employees who self-identified. Information on race/ethnicity and gender for members of the Operating Committee and the Board of Directors reflects all such members. Information on LGBTQ+ and veteran statuses is based on all U.S. employees, and all members of the Operating Committee and the Board of Directors. Information on disability status is based on all U.S. employees and all members of the Operating Committee.
| December 31, 2023 | Total employees | Senior level employees(e) | Operating Committee | Board of Directors(f) | |||||||||||||||||||||||||
Race/Ethnicity(a): | |||||||||||||||||||||||||||||
| White | 43 | % | 75 | % | 88 | % | 82 | % | |||||||||||||||||||||
| Hispanic | 21 | % | 6 | % | 6 | % | — | ||||||||||||||||||||||
| Asian | 19 | % | 13 | % | 6 | % | — | ||||||||||||||||||||||
| Black | 14 | % | 5 | % | — | 18 | % | ||||||||||||||||||||||
Other(b) | 3 | % | 1 | % | — | — | |||||||||||||||||||||||
Gender(c): | |||||||||||||||||||||||||||||
| Men | 51 | % | 72 | % | 59 | % | 55 | % | |||||||||||||||||||||
| Women | 49 | % | 28 | % | 41 | % | 45 | % | |||||||||||||||||||||
LGBTQ+(d) | 4 | % | 3 | % | 6 | % | — | ||||||||||||||||||||||
Military veterans(d) | 3 | % | 2 | % | — | 9 | % | ||||||||||||||||||||||
People with disabilities(d) | 4 | % | 3 | % | — | — | (g) | ||||||||||||||||||||||
(a)Based on EEO metrics. Presented as a percentage of the respective populations who self-identified race/ethnicity, which was 96% and 94% of the Firm’s total U.S.-based employees and U.S.-based senior level employees, respectively, and all members of the Operating Committee and the Board of Directors. Information for the Operating Committee includes one member who is based outside of the U.S.
(b)Other includes American Indian or Alaskan Native, Native Hawaiian or Other Pacific Islander, and two or more races/ethnicities.
(c)Presented as a percentage of the respective populations who self-identified gender, which was 98% of the Firm’s total global employees and 99% of the Firm’s global senior level employees, and all members of the Operating Committee and the Board of Directors.
(d)Presented as a percentage of total U.S.-based employees, total U.S.-based senior level employees, all members of the Operating Committee, and all members of the Board of Directors, respectively.
(e)Senior level employees represents employees with the titles of Managing Director and above.
(f)Excludes Mark A. Weinberger, who was elected to the Firm’s Board of Directors, effective January 16, 2024.
(g)The Firm did not request members of the Board of Directors to self-identify disability status.
2 | ||||||||
Firm culture
The foundations of JPMorgan Chase’s culture are its purpose, values and “Business Principles.” The “Business Principles” are guiding principles established by the Firm, which it believes are fundamental to the Firm’s success, and are represented by four central corporate tenets: exceptional client service; operational excellence; a commitment to integrity, fairness and responsibility; and cultivation of a great team and winning culture. The Firm maintains its focus on its culture of inclusion and respect, which is reinforced by its Code of Conduct and by increasing employee awareness, education, communication and training. An important part of these efforts includes the Firm’s Business Resource Groups, which are groups of employees who support JPMorgan Chase’s diversity, equity and inclusion strategies by leveraging the unique perspectives of their members. The Firm has global Diversity, Equity & Inclusion centers of excellence that lead the Firm’s strategy in supporting its commitments to create more equity and lasting impact in communities, and strengthen its inclusive culture.
Attracting and retaining employees
The goal of JPMorgan Chase’s recruitment efforts is to attract and hire talented individuals in all roles and at all career levels. The Firm strives to provide both external candidates and internal employees who are seeking a different role with challenging and stimulating career opportunities. These opportunities range from internship training programs for students to entry-level, management and executive careers. During 2023, approximately 60% of the Firm’s employment opportunities were filled by external candidates, with the remainder filled by existing employees. In addition, depending on business needs, and where appropriate, the Firm continues to employ hybrid work models which include a mix of on-site and remote work for certain roles.
Attracting talent with diverse backgrounds and perspectives is an important area of focus throughout the Firm’s recruitment process. JPMorgan Chase sources talent by engaging in efforts aimed at building and fostering an inclusive work environment. The Firm’s global Diversity, Equity & Inclusion centers of excellence support its diversity, equity and inclusion strategies through initiatives such as career coaching and mentorship.
JPMorgan Chase offers a competitive fellowship program that seeks to attract accomplished individuals who have taken a career break and wish to return to the workforce. In addition, and where appropriate, the Firm’s hiring practices focus on the skills of a job candidate rather than degrees held.
Developing employees
JPMorgan Chase supports the professional development and career growth of its employees. An onboarding training curriculum is required for new hires which covers, among other topics, compliance with the Firm’s Code of Conduct and information concerning Firm policies and standards, including those relating to cybersecurity. In addition, the Firm offers extensive training programs and educational resources to all employees covering a broad variety of topics such as leadership, change management, analytical thinking, culture and conduct, diversity, equity and inclusion, and risk and controls. Leadership Edge, the Firm’s global leadership and management development center of excellence, is focused on creating one Firmwide leadership culture.
Compensation and benefits
The Firm provides market-competitive compensation and benefits programs. JPMorgan Chase’s compensation philosophy includes guiding principles that drive compensation-related decisions across the Firm, and includes: pay-for-performance practices designed to attract and retain top talent; responsiveness and alignment with shareholder interests; and reinforcement of the Firm’s culture and Business Principles. The Firm follows a disciplined and balanced compensation framework, including the integration of risk, controls and conduct considerations. The Firm’s compensation review processes seek to ensure that the Firm’s employees are paid equitably and competitively for the work they do.
JPMorgan Chase offers extensive benefits and wellness packages to support employees and their families, which vary depending on location and include healthcare coverage, retirement benefits, life and disability insurance, access to on-site health and wellness centers, counseling and resources related to mental health, competitive vacation and leave policies, child care access and support, tuition reimbursement programs, and financial coaching. In 2023, the Firm further enhanced its health and wellness benefits for U.S. employees, including updates to the U.S. medical plan, as well as expedited access to an expanded network of professionals for free mental health counseling and coaching.
3 | ||||||||
Part I
Supervision and regulation
The Firm is subject to extensive and comprehensive regulation under U.S. federal and state laws, as well as the applicable laws of the jurisdictions outside the U.S. in which the Firm does business.
Financial holding company:
Consolidated supervision. JPMorgan Chase & Co. is a bank holding company (“BHC”) and a financial holding company (“FHC”) under U.S. federal law, and is subject to comprehensive consolidated supervision, regulation and examination by the Board of Governors of the Federal Reserve System (the “Federal Reserve”). The Federal Reserve acts as the supervisor of the consolidated operations of BHCs. Certain of JPMorgan Chase’s subsidiaries are also regulated directly by additional authorities based on the activities or licenses of those subsidiaries.
JPMorgan Chase’s national bank subsidiary, JPMorgan Chase Bank, N.A., is supervised and regulated by the Office of the Comptroller of the Currency (“OCC”) and, with respect to certain matters, by the Federal Deposit Insurance Corporation (the “FDIC”).
JPMorgan Chase’s U.S. broker-dealers are supervised and regulated by the Securities and Exchange Commission (“SEC”) and the Financial Industry Regulatory Authority (“FINRA”). Subsidiaries of the Firm that engage in certain futures-related and swaps-related activities are supervised and regulated by the Commodity Futures Trading Commission (“CFTC”). J.P. Morgan Securities plc holds a banking license in the U.K. and is regulated by the U.K. Prudential Regulation Authority (the “PRA”) and the U.K. Financial Conduct Authority (“FCA”).
JPMSE is a Germany-based credit institution regulated by the European Central Bank (“ECB”) as well as the local regulators in each of the countries in which it operates. The Firm’s other non-U.S. subsidiaries are regulated by the banking, securities, prudential, payments and conduct regulatory authorities, as applicable, in the countries in which they operate.
Permissible business activities. The Bank Holding Company Act restricts BHCs from engaging in business activities other than the business of banking and certain closely-related activities. FHCs are permitted to engage in a broader range of financial activities. The Federal Reserve has the authority to limit an FHC’s ability to conduct otherwise permissible activities if the FHC or any of its depository institution subsidiaries ceases to meet applicable eligibility requirements. The Federal Reserve may also impose corrective capital and/or managerial requirements on the FHC, and if deficiencies are persistent, may require divestiture of the FHC’s depository institutions. If any depository institution controlled by an FHC fails to maintain a satisfactory rating under the Community Reinvestment Act, the Federal Reserve must prohibit the FHC and its subsidiaries from engaging in any new activities other than
those permissible for BHCs, or acquiring a company engaged in such activities.
Capital and liquidity requirements. The Federal Reserve establishes capital, liquidity and leverage requirements for JPMorgan Chase that are generally consistent with the international Basel III capital and liquidity framework and evaluates the Firm’s compliance with those requirements. The OCC establishes similar requirements for JPMorgan Chase Bank, N.A. Certain of the Firm’s non-U.S. subsidiaries and branches are also subject to local capital and liquidity requirements.
Banking supervisors globally continue to refine and enhance the Basel III capital framework for financial institutions. In July 2023, U.S. banking regulators released a proposal to amend the U.S. risk-based capital framework to incorporate certain elements of the revised international Basel III capital framework. The proposal would significantly revise risk-based capital requirements for banks with assets of $100 billion or more, including the Firm and other U.S. global systemically important banks ("GSIBs"). The proposed effective date is July 1, 2025 with a three-year transition period.
In addition to the release of the U.S. proposal, the EU and U.K. regulators have also largely finalized the rules implementing their Basel III frameworks. The proposed effective dates are January 1, 2025, in the EU and July 1, 2025, in the U.K., with certain transitional arrangements applicable until 2030 and 2032, respectively.
Stress tests. As a large BHC, JPMorgan Chase is subject to supervisory stress testing administered by the Federal Reserve as part of the Federal Reserve’s annual Comprehensive Capital Analysis and Review (“CCAR”) framework. The Firm must conduct annual company-run stress tests and must also submit an annual capital plan to the Federal Reserve, taking into account the results of separate stress tests designed by each of the Firm and the Federal Reserve. The Federal Reserve uses the results under the severely adverse scenario from its supervisory stress test to determine the Firm’s Stress Capital Buffer (“SCB”) requirement for the coming year, which forms part of the Firm’s applicable capital buffers. The Firm is required to file its annual CCAR submission on April 5, 2024. The Federal Reserve will notify the Firm of its indicative SCB requirement by June 30, 2024 and final SCB requirement by August 31, 2024. The Firm’s final SCB requirement will become effective on October 1, 2024. The OCC requires JPMorgan Chase Bank, N.A. to perform separate, similar stress tests annually. The Firm publishes each year the results of the annual stress tests for the Firm and JPMorgan Chase Bank, N.A. under the supervisory “severely adverse” scenarios provided by the Federal Reserve and the OCC.
Refer to Capital Risk Management on pages 91-101 and Liquidity Risk Management on pages 102–109 for more information.
4 | ||||||||
Enhanced prudential standards. As part of its mandate to identify and monitor risks to the financial stability of the U.S. posed by large banking organizations, the Financial Stability Oversight Council (“FSOC”) recommends prudential standards and reporting requirements to the Federal Reserve for systemically important financial institutions (“SIFIs”), such as JPMorgan Chase. The Federal Reserve has adopted several rules to implement those heightened prudential standards, including rules relating to risk management and corporate governance of subject BHCs. JPMorgan Chase is required under these rules to comply with enhanced liquidity and overall risk management standards, including oversight by the board of directors of risk management activities.
Resolution and recovery. The Firm is required to maintain a comprehensive recovery plan, which is updated annually and which summarizes the actions that it would take to remain well-capitalized and well-funded in order to avoid failure in the case of an adverse event. In addition, JPMorgan Chase Bank, N.A. is required to prepare and submit a recovery plan as directed by the OCC. Under the Dodd-Frank Wall Street Reform and Consumer Protection Act (the “Dodd-Frank Act”), the Firm is required to submit periodically to the Federal Reserve and the FDIC a plan for resolution (a “resolution plan”) under the Bankruptcy Code in the event of material distress or failure. Under rules adopted by the FDIC and the Federal Reserve, the Firm’s resolution plan submissions under the Dodd-Frank Act alternate between “targeted” and “full” plans. The Firm’s most recent “full” resolution plan was filed on June 30, 2023, and the Firm's next "targeted" resolution plan is due to be filed on or before July 1, 2025. JPMorgan Chase Bank, N.A. is also required to prepare and submit a separate resolution plan pursuant to a separate FDIC regulation that requires FDIC-insured depository institutions over a certain asset threshold to prepare a resolution plan to facilitate their resolution by the FDIC under the Federal Deposit Insurance Act (the “IDI Resolution Rule”). JPMorgan Chase Bank, N.A. most recently filed a resolution plan pursuant to the IDI Resolution Rule on December 1, 2023.
In August 2023, the FDIC released a proposal to revise the IDI Resolution Rule. For FDIC-insured depository institutions with $100 billion or more in total assets, such as JPMorgan Chase Bank, N.A., the proposal would revise the content requirements for resolution plan submissions, increase the frequency of resolution plan submissions to every two years (instead of the current three-year cycle) and require the filing of interim supplements in non-submission years. The proposal would also enhance how the FDIC assesses the credibility of resolution plan submissions, expand the FDIC’s expectations regarding bank engagement with FDIC staff and capabilities testing, and outline expectations regarding the FDIC’s review and enforcement of compliance with the IDI Rule.
Certain of the Firm’s non-U.S. subsidiaries and branches are also subject to local resolution and recovery planning requirements.
Orderly liquidation authority. Certain financial companies, including JPMorgan Chase and certain of its subsidiaries, can also be subjected to resolution under the “orderly liquidation authority” rather than under the Bankruptcy Code. In order to invoke the orderly liquidation authority, the U.S. Treasury Secretary, in consultation with the President of the United States, must first make certain determinations concerning extraordinary financial distress and systemic risk, and action must be recommended by the FDIC and the Federal Reserve. Absent such actions, the Firm, as a BHC, would remain subject to resolution under the Bankruptcy Code. The FDIC has issued a draft policy statement describing its “single point of entry” strategy for resolution of SIFIs under the orderly liquidation authority, which seeks to keep operating subsidiaries of a BHC open and impose losses on shareholders and creditors of the BHC in receivership according to their statutory order of priority.
Holding company as a source of strength. JPMorgan Chase & Co. is required to serve as a source of financial strength for its depository institution subsidiaries and to commit resources to support those subsidiaries, including when directed to do so by the Federal Reserve.
Regulation of acquisitions. Acquisitions by BHCs and their banks are subject to requirements, limitations and prohibitions established by law and by the Federal Reserve and the OCC. For example, FHCs and BHCs are required to obtain the approval of the Federal Reserve before they acquire more than 5% of the voting shares of an unaffiliated bank. In addition, acquisitions by financial companies are generally prohibited if, as a result of the acquisition, the total liabilities of the financial company would exceed 10% of the total liabilities of all financial companies, as determined under Federal Reserve regulations. Furthermore, for certain acquisitions, the Firm must provide written notice to the Federal Reserve prior to acquiring direct or indirect ownership or control of any voting shares of any company with over $10 billion in assets that is engaged in activities that are “financial in nature.” Moreover, while FHCs may engage in a broader range of activities (including acquisitions) than BHCs, the Federal Reserve has the authority to limit an FHC’s ability to conduct otherwise permissible acquisitions if the FHC or any of its depository institution subsidiaries ceases to meet applicable eligibility requirements.
Ongoing obligations. The Firm is subject to a Deferred Prosecution Agreement entered into with the Department of Justice on September 29, 2020, relating to precious metals and U.S. Treasuries markets investigations, as well as a cooperation obligation under a related order issued by the CFTC.
Subsidiary banks:
The activities of JPMorgan Chase Bank, N.A., the Firm’s principal subsidiary bank, are limited to those specifically authorized under the National Bank Act and related interpretations of the OCC. The OCC has authority to bring an enforcement action against JPMorgan Chase Bank, N.A.
5 | ||||||||
Part I
for unsafe or unsound banking practices, which could include limiting JPMorgan Chase Bank, N.A.’s ability to conduct otherwise permissible activities, or imposing corrective capital or managerial requirements on the bank.
FDIC deposit insurance. The FDIC deposit insurance fund provides insurance coverage for certain deposits and is funded through assessments on banks, including JPMorgan Chase Bank, N.A. The FDIC is required to maintain a minimum reserve ratio, which measures the balance of reserves in the deposit insurance fund against an estimate of FDIC-insured deposits, of 1.35%. The reserve ratio is currently below the statutory minimum and, in October 2022, the FDIC adopted a final rule to raise bank assessments and accelerate the time by which the reserve ratio would meet the statutory minimum. As a result, the FDIC has adopted a restoration plan to bring the reserve ratio up to the required 1.35% by September 30, 2028, with a longer-term target of maintaining a reserve ratio of 2%.
FDIC powers upon a bank insolvency. Upon any insolvency of JPMorgan Chase Bank, N.A., the FDIC could be appointed as conservator or receiver under the Federal Deposit Insurance Act. The FDIC has broad powers to transfer assets and liabilities without the approval of the institution’s creditors.
Prompt corrective action. The Federal Deposit Insurance Corporation Improvement Act of 1991 requires the relevant federal banking regulator to take “prompt corrective action” with respect to a depository institution if that institution does not meet certain capital adequacy standards. The Federal Reserve is also authorized to take appropriate action against the parent BHC, such as JPMorgan Chase & Co., based on the undercapitalized status of any bank subsidiary. In certain instances, the BHC would be required to guarantee the performance of the capital restoration plan for its undercapitalized subsidiary.
Heightened Supervisory Standards. In the U.S., the OCC has established guidelines setting forth heightened standards for large banks, including minimum standards for the design and implementation of a risk governance framework for banks. Under these standards, a bank’s risk governance framework must ensure that the bank’s risk profile is easily distinguished and separate from that of its parent BHC for risk management purposes. The bank’s board or risk committee is responsible for approving the bank’s risk governance framework, providing active oversight of the bank’s risk-taking activities, and holding management accountable for adhering to the risk governance framework.
The Firm’s banking entities in the EU and the U.K. are subject to supervisory expectations published by the ECB and the PRA, respectively, addressing bank strategy, governance and risk management in the areas of climate change, operational resilience, reliance on IT systems and third-party services, and resilience from macro-financial and geopolitical shocks. Further, the EU requires that certain non-EU banking groups operating in the EU establish
an intermediate parent undertaking (“IPU”) located in the EU or, with ECB approval, two IPUs if a single IPU would conflict with “home country” bank separation rules or impede resolvability. The Firm was granted approval by the ECB in May 2023 to have two IPUs, which will hold the Firm’s EU banks and broker-dealers.
Restrictions on transactions with affiliates. JPMorgan Chase Bank, N.A. and its subsidiaries are subject to restrictions imposed by federal law on extensions of credit to, investments in stock or securities of, and derivatives, securities lending and certain other transactions with, JPMorgan Chase & Co. and certain other affiliates. These restrictions prevent JPMorgan Chase & Co. and other affiliates from borrowing from JPMorgan Chase Bank, N.A. and its subsidiaries unless the loans are secured in specified amounts and comply with certain other requirements.
Dividend restrictions. Federal law imposes limitations on the payment of dividends by national banks, such as JPMorgan Chase Bank, N.A. Refer to Note 26 for the amount of dividends that JPMorgan Chase Bank, N.A. could pay, at January 1, 2024, to JPMorgan Chase without the approval of the banking regulators. The OCC and the Federal Reserve also have authority to prohibit or limit the payment of dividends of a bank subsidiary that they supervise if, in the banking regulator’s opinion, payment of a dividend would constitute an unsafe or unsound practice in light of the financial condition of the bank.
Depositor preference. Under federal law, the claims of a receiver of an insured depositary institution (“IDI”) for administrative expense and the claims of holders of U.S. deposit liabilities (including the FDIC and deposits in non-U.S. branches that are dually payable in the U.S. and in a non-U.S. branch) have priority over the claims of other unsecured creditors of the institution, including depositors in non-U.S. branches and public noteholders.
Consumer supervision and regulation. JPMorgan Chase and JPMorgan Chase Bank, N.A. are subject to supervision and regulation in the U.S. by the Consumer Financial Protection Bureau (“CFPB”) with respect to federal consumer protection laws, including laws relating to fair lending and the prohibition of unfair, deceptive or abusive acts or practices in connection with the offer, sale or provision of consumer financial products and services. The CFPB also has jurisdiction over small business lending activities with respect to fair lending and the Equal Credit Opportunity Act. As part of its regulatory oversight, the CFPB has authority to take enforcement actions against firms that offer certain products and services to consumers using practices that are deemed to be unfair, deceptive or abusive. In February 2023, the CFPB proposed a rule that would significantly reduce and limit the late payment fees that credit card issuers, including the Firm, would be permitted to charge to customers. In January 2024, the CFPB proposed a rule that could significantly restrict bank overdraft fees for certain insured depository institutions, including the Firm. The proposal would impose certain requirements on overdraft
6 | ||||||||
protections, similar to those that apply to credit cards, unless the financial institution prices the overdraft fee at the institution’s cost to provide the product or at a benchmark determined by the CFPB. In October 2023, the Federal Reserve Board proposed to lower the maximum interchange fee that large debit card issuers, including the Firm, would be permitted to receive for a debit card transaction. The proposal would also establish a process for automatically publishing an updated maximum fee amount every other year going forward. The Firm’s consumer activities are also subject to regulation under state statutes which are enforced by the Attorney General or empowered agency of each state.
In the U.K., the Firm operates a retail bank through J.P. Morgan Europe Limited (“JPMEL”) and provides retail investment management services through Nutmeg Saving and Investment Limited (“Nutmeg”). JPMEL is regulated by the PRA, and both JPMEL and Nutmeg are regulated by the FCA with respect to their conduct of financial services in the U.K., including obligations relating to the fair treatment of customers. JPMEL is also regulated by the U.K. Payment Systems Regulator with respect to its operation and use of payment systems. In addition, the retail businesses of JPMEL and Nutmeg are subject to U.K. consumer-protection legislation. The Consumer Duty in the U.K. became effective in July 2023 for U.K.-regulated financial service providers, and encompasses requirements on the types of products and services that should be offered to consumers, how to balance value and pricing for consumers as well as how to promote good consumer understanding and post-sale support to consumers.
Securities and broker-dealer regulation:
The Firm conducts securities underwriting, dealing and brokerage activities in the U.S. through J.P. Morgan Securities LLC and other non-bank broker-dealer subsidiaries, all of which are subject to regulations of the SEC, FINRA and the New York Stock Exchange, among others. The Firm conducts similar securities activities outside the U.S. subject to local regulatory requirements. In the U.K., those activities are primarily conducted by J.P. Morgan Securities plc and in the EU, those activities are primarily conducted by JPMSE. Broker-dealers are subject to laws and regulations covering all aspects of the securities business, including sales and trading practices, securities offerings, publication of research reports, use of customer funds, the financing of client purchases, capital structure, record-keeping and retention, and the conduct of their directors, officers and employees. Refer to Broker-dealer regulatory capital on page 101 for information concerning the capital of J.P. Morgan Securities LLC and J.P. Morgan Securities plc. In addition, the Firm's sales and trading activities, which are conducted through both bank and non-bank subsidiaries, are subject to laws and regulations relating to market conduct, including prohibitions on manipulative or anti-competitive practices.
Investment management regulation:
The Firm’s asset and wealth management businesses are subject to significant regulation in jurisdictions around the world relating to, among other things, the safeguarding and management of client assets, offerings of funds and marketing activities. Certain of the Firm’s subsidiaries are registered with, and subject to oversight by, the SEC as investment advisers and broker-dealers. The Firm’s registered investment advisers in the U.S. are subject to the fiduciary and other obligations imposed under the Investment Advisers Act of 1940 and applicable state and federal law. The Firm’s bank fiduciary activities are subject to supervision by the OCC.
The Firm’s asset and wealth management businesses continue to be subject to ongoing rule-making and implementation of new regulations and other guidance, including by the SEC and certain U.S. states with respect to enhanced standards of conduct and conflicts of interest. In October 2023, the Department of Labor (“DOL”) proposed a new “fiduciary” rule that could significantly expand the scope for defining who can be deemed investment advice fiduciaries for purposes of retirement plans and individual retirement accounts (“IRAs”) under the Employee Retirement Income Security Act of 1974, as amended. Among the most significant impacts of the proposed rule and related amendments to prohibited transaction exemptions would be the impact on the fee and compensation practices at financial institutions that offer investment recommendations to retirement clients, including in the context of rollovers from an employer plan to an IRA.
Derivatives regulation:
The Firm is subject to comprehensive regulation of its derivatives businesses. In the U.S., JPMorgan Chase Bank, N.A., J.P. Morgan Securities LLC and J.P. Morgan Securities plc are registered with the CFTC as “swap dealers”. In addition, JPMorgan Chase Bank, N.A. and J.P. Morgan Securities LLC are registered with the SEC as “security-based swap dealers”. As a result, these entities are subject to a comprehensive regulatory framework applicable to their swap or security-based swap activities, including capital requirements, rules requiring the collateralization of uncleared swaps and security-based swaps, rules regarding segregation of counterparty collateral, business conduct and documentation standards, rules requiring the central clearing of standardized over-the-counter (“OTC”) derivatives, requirements that certain standardized OTC swaps be traded on regulated trading venues, record-keeping and reporting obligations, and anti-fraud and anti-manipulation requirements. Similar requirements have also been established in the European Union (“EU”) under the European Market Infrastructure Regulation (“EMIR”) and the Markets in Financial Instruments Directive (“MiFID II”), as well as in the U.K. and other jurisdictions around the world.
7 | ||||||||
Part I
J.P. Morgan Securities LLC is also registered with the CFTC as a futures commission merchant and is a member of the National Futures Association.
Data, privacy and cybersecurity regulation:
The Firm and its subsidiaries are subject to laws, rules and regulations globally concerning data, including data protection, consumer protection, privacy, cybersecurity and related matters. These laws, rules and regulations are constantly evolving, subject to interpretation, remain a focus of regulators globally, may be enforced by private parties or government bodies, and continue to have a significant impact on all of the Firm’s businesses and operations.
The Bank Secrecy Act and Economic Sanctions:
The Bank Secrecy Act (“BSA”) requires all financial institutions, including banks and securities broker-dealers, to establish a risk-based system of internal controls reasonably designed to prevent money laundering and the financing of terrorism. The BSA includes a variety of record-keeping and reporting requirements, as well as due diligence/know-your-customer documentation requirements. The Firm is also subject to the regulations and economic sanctions programs administered and enforced by the U.S. Treasury’s Office of Foreign Assets Control (“OFAC”) and EU and U.K. authorities which target entities or individuals that are, or are located in countries that are, involved in activities including terrorism, hostilities, embezzlement or human rights violations. The Firm is also subject to economic sanctions laws, rules and regulations in other jurisdictions in which it operates, including those that conflict with or prohibit a firm such as JPMorgan Chase from complying with certain laws, rules and regulations to which it is otherwise subject.
Anti-Corruption:
The Firm is subject to laws and regulations relating to corrupt and illegal payments to government officials and others in the jurisdictions in which it operates, including the U.S. Foreign Corrupt Practices Act and the U.K. Bribery Act.
Compensation practices:
The Firm’s compensation practices are subject to oversight by the Federal Reserve, as well as other agencies. The Federal Reserve has jointly issued guidance with the FDIC and the OCC that is designed to ensure that incentive compensation paid by banking organizations does not encourage imprudent risk-taking that threatens the organizations’ safety and soundness. The Financial Stability Board (“FSB”) has also established standards covering compensation principles for banks. The Firm’s compensation practices are also subject to regulation and oversight by regulators in other jurisdictions, notably the Fifth Capital Requirements Directive (“CRD V”), as implemented in the EU and as largely adopted in the U.K, which includes compensation-related provisions. The European Banking Authority has instituted guidelines on compensation policies including under CRD V which in certain countries (such as Germany) are implemented or
supplemented by local regulations or guidelines. The U.K. regulators have also instituted regulations and guidelines on compensation policies, which diverge in certain areas from EU rules. The Firm expects that the implementation of regulatory guidelines regarding compensation in the U.S. and other countries will continue to evolve, and may affect the manner in which the Firm structures its compensation programs and practices.
Sustainability:
Policymakers in the U.K. and the EU have continued to implement and enhance sustainability-related initiatives and disclosure requirements. The Corporate Sustainability Reporting Directive (“CSRD”) will replace and significantly expand the scope and content of certain EU ESG reporting requirements, with phased-in requirements starting with fiscal years in 2024. In addition, in December 2023, the EU reached agreement on the Corporate Sustainability Due Diligence Directive (“CSDDD”). The CSDDD sets mandatory due diligence obligations for companies to address actual and potential human rights violations and environmental adverse impacts stemming from their own operations and business relationships, including the activities of certain companies with which they have established business relationships and also requires the adoption of company-specific climate-related transition plans. Both the CSRD and CSDDD will impact certain of the Firm’s EU and non-EU entities.
8 | ||||||||
Item 1A. Risk Factors.
The following discussion sets forth the material risk factors that could affect JPMorgan Chase’s financial condition and operations. Readers should not consider any descriptions of these factors to be a complete set of all potential risks that could affect the Firm. Any of the risk factors discussed below could by itself, or combined with other factors, materially and adversely affect JPMorgan Chase’s business, results of operations, financial condition, capital position, liquidity, competitive position or reputation, including by materially increasing expenses or decreasing revenues, which could result in material losses or a decrease in earnings.
Summary
The principal risk factors that could adversely affect JPMorgan Chase’s business, results of operations, financial condition, capital position, liquidity, competitive position or reputation include:
•Regulatory risks, including the impact that applicable laws, rules and regulations in the highly-regulated and supervised financial services industry, as well as changes to or in the application, interpretation or enforcement of those laws, rules and regulations, can have on JPMorgan Chase’s business and operations, including JPMorgan Chase incurring additional costs associated with assessments, levies or other governmental charges; the ways in which differences in financial services regulation and supervision in different jurisdictions or with respect to certain competitors can negatively impact JPMorgan Chase’s business; the penalties and collateral consequences, and higher compliance and operational costs, that JPMorgan Chase may incur when resolving a regulatory investigation; the ways in which less predictable legal and regulatory frameworks in certain jurisdictions can negatively impact JPMorgan Chase’s operations and financial results; and the losses that security holders will absorb if JPMorgan Chase were to enter into a resolution.
•Political risks, including the potential negative effects on JPMorgan Chase’s businesses due to economic uncertainty or instability caused by political developments.
•Market risks, including the effects that economic and market events and conditions, governmental policies, changes in interest rates and credit spreads, and market fluctuations can have on JPMorgan Chase’s consumer and wholesale businesses and its investment and market-making positions and on JPMorgan Chase’s earnings and its liquidity and capital levels.
•Credit risks, including potential negative effects from adverse changes in the financial condition of clients, customers, counterparties, custodians and central counterparties; the potential for losses due to declines in the value of collateral in stressed market conditions; and potential negative impacts from concentrations of credit risk with respect to clients, customers, counterparties and other market participants.
•Liquidity risks, including the risk that JPMorgan Chase’s liquidity could be impaired by market-wide illiquidity or disruption, unforeseen liquidity or capital requirements, the inability to sell assets, default by a significant market participant, unanticipated outflows of cash or collateral, or lack of market or customer confidence in JPMorgan Chase; the dependence of JPMorgan Chase & Co. on the cash flows of its subsidiaries; and the potential adverse effects that any downgrade in any of JPMorgan Chase’s credit ratings may have on its liquidity and cost of funding.
•Capital risks, including the risk that any failure by or inability of JPMorgan Chase to maintain the required level and composition of capital, or unfavorable changes in applicable capital requirements, could limit JPMorgan Chase’s ability to distribute capital to shareholders or to support its business activities.
•Operational risks, including risks associated with JPMorgan Chase’s dependence on its operational systems, its ability to maintain appropriately-staffed workforces and the competence, integrity, health and safety of its employees, as well as the systems and employees of third parties, market participants and service providers; the potential negative effects of failing to identify and address operational risks related to the failure of internal or external operational systems, the introduction of or changes to products, services and delivery platforms or the adoption of new technologies; legal and regulatory risks related to safeguarding personal information; the harm that could be caused by a successful cyber attack affecting JPMorgan Chase or by other extraordinary events; risks related to acquisitions, including the acquisition of certain assets and liabilities of First Republic Bank; risks associated with JPMorgan Chase’s risk management framework and control environment, its models and estimations and associated judgments used in its stress testing and financial statements, and controls over disclosure and financial reporting; and potential adverse effects of failing to comply with heightened regulatory and other standards for the oversight of vendors and other service providers.
•Strategic risks, including the damage to JPMorgan Chase’s competitive standing and results that could occur if management fails to develop and execute effective business strategies; risks associated with the significant and increasing competition that JPMorgan Chase faces; and the potential adverse impacts of climate change on JPMorgan Chase’s business operations, clients and customers.
•Conduct risks, including the negative impact that can result from the actions or misconduct of employees, including any failure of employees to conduct themselves in accordance with JPMorgan Chase’s expectations, policies and practices.
•Reputation risks, including the potential adverse effects on JPMorgan Chase’s relationships with its clients,
9 | ||||||||
Part I
customers, shareholders, regulators and other stakeholders that could arise from employee misconduct, security breaches, inadequate risk management, compliance or operational failures, litigation and regulatory investigations, failure to satisfy expectations concerning environmental, social and governance concerns, failure to effectively manage conflicts of interest or to satisfy fiduciary obligations, or other factors that could damage JPMorgan Chase’s reputation.
•Country risks, including potential impacts on JPMorgan Chase’s businesses from an outbreak or escalation of hostilities between countries or within a country or region; and the potential adverse effects of local economic, political, regulatory and social factors on JPMorgan Chase’s business and revenues in certain countries in which it operates.
•People risks, including the criticality of attracting and retaining qualified and diverse employees; and the potential adverse effects of unfavorable changes in immigration or travel policies on JPMorgan Chase’s workforce.
•Legal risks, including those relating to litigation and regulatory and government investigations.
The above summary is subject in its entirety to the discussion of the risk factors set forth below.
Regulatory
JPMorgan Chase’s businesses are highly regulated, and the laws, rules and regulations that apply to JPMorgan Chase have a significant impact on its business and operations.
JPMorgan Chase is a financial services firm with operations worldwide. JPMorgan Chase must comply with the laws, rules and regulations that apply to its operations in all of the jurisdictions around the world in which it does business, and financial services firms such as JPMorgan Chase are subject to extensive and constantly-evolving regulation and supervision.
The regulation and supervision of JPMorgan Chase significantly affects the way that it conducts its business and structures its operations, and JPMorgan Chase could be required to make changes to its business and operations in response to supervisory expectations or decisions or to new or changed laws, rules and regulations. These types of developments could result in JPMorgan Chase incurring additional costs or experiencing a reduction in revenues to comply with applicable laws, rules and regulations, which could reduce its profitability. Furthermore, JPMorgan Chase’s entry into or acquisition of a new business or an increase in its principal investments may require JPMorgan Chase to comply with additional laws, rules, and regulations.
In response to new and existing laws, rules and regulations and expanded supervision, JPMorgan Chase has in the past been and could in the future be, required to:
•limit the products and services that it offers
•reduce the liquidity that it can provide through its market-making activities
•refrain from engaging in business opportunities that it might otherwise pursue
•pay higher taxes (including as part of any minimum global tax regime), assessments, levies or other governmental charges, including in connection with the resolution of tax examinations
•incur losses, including with respect to fraudulent transactions perpetrated against its customers
•dispose of certain assets, and do so at times or prices that are disadvantageous
•impose restrictions on certain business activities, or
•increase the prices that it charges for products and services, which could reduce the demand for them.
Any failure by JPMorgan Chase to comply with the laws, rules and regulations to which it is subject could result in:
•increased regulatory and supervisory scrutiny
•regulatory and governmental enforcement actions
•the imposition of fines, penalties or other sanctions
•increased exposure to litigation, or
•harm to its reputation.
Differences and inconsistencies in financial services regulation and supervision can negatively impact JPMorgan Chase’s businesses, operations and financial results.
The content and application of laws, rules and regulations affecting financial services firms can vary according to factors such as the size of the firm, the jurisdiction in which it is organized or operates, and other criteria. For example:
•larger firms such as JPMorgan Chase are often subject to more stringent supervision, regulation and regulatory scrutiny
•financial technology companies and other non-traditional competitors may not be subject to banking regulation, or may be supervised by a national or state regulatory agency that does not have the same resources or regulatory priorities as the regulatory agencies which supervise more diversified financial services firms, or
•the financial services regulatory and supervisory framework in a particular jurisdiction may favor financial institutions that are based in that jurisdiction.
These types of differences in the regulatory and supervisory framework can result in JPMorgan Chase losing market share to competitors that are less regulated or not subject to regulation, especially with respect to unregulated financial products.
10 | ||||||||
There can also be significant differences in the ways that similar regulatory initiatives affecting the financial services industry are implemented in the U.S. and in other countries and regions in which JPMorgan Chase does business. For example, when adopting rules that are intended to implement a global regulatory or supervisory standard, a national regulator may introduce additional or more restrictive requirements, which can create competitive disadvantages for financial services firms, such as JPMorgan Chase, that may be subject to those enhanced regulations.
In addition, certain national and multi-national bodies and governmental agencies outside the U.S. have adopted laws, rules or regulations that may conflict with or prohibit JPMorgan Chase from complying with laws, rules and regulations to which it is otherwise subject, creating conflict of law issues that also increase its risk of non-compliance in those jurisdictions.
Legislative and regulatory initiatives outside the U.S. could require JPMorgan Chase to make significant modifications to its operations and legal entity structure in the relevant countries or regions in order to comply with those requirements. These include laws, rules and regulations that have been adopted or proposed, as well as regulatory expectations, relating to:
•the establishment of locally-based intermediate holding companies or operating subsidiaries
•requirements to maintain minimum amounts of capital or liquidity in locally-based subsidiaries
•the implementation of processes within locally-based subsidiaries to comply with local regulatory requirements or expectations
•the separation (or “ring fencing”) of core banking products and services from markets activities
•requirements for the orderly resolution of financial institutions
•requirements for executing or settling transactions on exchanges or through central counterparties (“CCPs”), or for depositing funds with other financial institutions or clearing and settlement systems
•position limits and reporting rules for derivatives
•governance and accountability regimes
•conduct of business and control requirements, and
•restrictions on compensation.
These types of differences, inconsistencies and conflicts in financial services regulation have required and could in the future require JPMorgan Chase to:
•divest assets or restructure its operations
•maintain higher levels of capital and liquidity, or absorb increased capital and liquidity costs
•incur higher operational and compliance costs
•change the prices that it charges for its products and services
•curtail the products and services that it offers to its customers and clients
•curtail other business opportunities, including acquisitions or principal investments, that it otherwise would have pursued
•become subject to regulatory fines, penalties or other sanctions, or
•incur higher costs for complying with different legal and regulatory frameworks.
Any or all of these factors could harm JPMorgan Chase’s ability to compete against other firms that are not subject to the same laws, rules and regulations or supervisory oversight, or harm JPMorgan Chase’s businesses, results of operations and profitability.
Resolving regulatory investigations can subject JPMorgan Chase to significant penalties and collateral consequences, and could result in higher compliance costs or restrictions on its operations.
JPMorgan Chase is subject to heightened oversight and scrutiny from regulatory authorities in many jurisdictions. JPMorgan Chase has paid significant fines, provided other monetary relief, incurred other penalties and experienced other repercussions in connection with resolving investigations and enforcement actions by governmental agencies. JPMorgan Chase could become subject to similar regulatory or governmental resolutions or other actions in the future, and addressing the requirements of any such resolutions or actions could result in JPMorgan Chase incurring higher operational and compliance costs, including devoting substantial resources to the required remediation or needing to comply with other restrictions.
In connection with resolving specific regulatory investigations or enforcement actions, certain regulators have required JPMorgan Chase and other financial institutions to admit wrongdoing with respect to the activities that gave rise to the resolution. These types of admissions can lead to:
•greater exposure in litigation
•damage to JPMorgan Chase’s reputation
•disqualification from doing business with certain clients or customers, or in specific jurisdictions, or
•other direct and indirect adverse effects.
Furthermore, government officials in the U.S. and other countries have demonstrated a willingness to bring criminal actions against financial institutions and have required that institutions plead guilty to criminal offenses or admit other wrongdoing in connection with resolving regulatory investigations or enforcement actions. Resolutions of this type can have significant collateral consequences for the subject financial institution, including:
11 | ||||||||
Part I
•loss of clients, customers and business
•restrictions on offering certain products or services, and
•losing permission to operate certain businesses, either temporarily or permanently.
JPMorgan Chase expects that:
•it and other financial services firms will continue to be subject to heightened regulatory scrutiny and governmental investigations and enforcement actions
•governmental authorities will continue to require that financial institutions be penalized for actual or deemed violations of law with formal and punitive enforcement actions, including the imposition of significant monetary and other sanctions, rather than resolving these matters through informal supervisory actions; and
•governmental authorities will be more likely to pursue formal enforcement actions and resolutions against JPMorgan Chase to the extent that it has previously been subject to other governmental investigations or enforcement actions.
If JPMorgan Chase fails to meet the requirements of any resolution of a governmental investigation or enforcement action, or to maintain risk and control processes that meet the heightened standards and expectations of its regulators, it could be required to, among other things:
•enter into further resolutions of investigations or enforcement actions
•pay additional regulatory penalties or enter into judgments, or
•accept material regulatory restrictions on, or changes in the management of, its businesses.
In these circumstances, JPMorgan Chase could also become subject to other sanctions, or to prosecution or civil litigation with respect to the conduct that gave rise to an investigation or enforcement action. In addition, JPMorgan Chase can be subject to higher costs or requests for additional capital in connection with the resolution of governmental investigations and enforcement actions involving newly-acquired businesses, companies in which JPMorgan Chase has made principal investments, parties to joint ventures with JPMorgan Chase, and vendors with which JPMorgan Chase does business.
JPMorgan Chase’s operations and financial results can be negatively impacted in jurisdictions with less predictable legal and regulatory frameworks.
JPMorgan Chase conducts existing and new business in certain countries, states, municipalities, territories and other jurisdictions in which the application of the rule of law is inconsistent or less predictable, including with respect to:
•the absence of a statutory or regulatory basis or guidance for engaging in specific types of business or transactions
•conflicting or ambiguous laws, rules and regulations, or the inconsistent application or interpretation of existing laws, rules and regulations
•uncertainty concerning the enforceability of intellectual property rights or contractual or other obligations
•difficulty in competing in economies in which the government controls or protects all or a portion of the local economy or specific businesses, or where graft or corruption may be pervasive
•the threat of regulatory investigations, civil litigations or criminal prosecutions that are arbitrary or otherwise contrary to established legal principles in other parts of the world, and
•the termination of licenses required to operate in the local market or the suspension of business relationships with governmental bodies.
If the application of the laws, rules and regulations in any jurisdiction is susceptible to producing inconsistent or unexpected outcomes, this can create a more difficult environment in which JPMorgan Chase conducts its business and could negatively affect JPMorgan Chase’s operations and reduce its earnings with respect to that jurisdiction. For example, conducting business could require JPMorgan Chase to devote significant additional resources to understanding, and monitoring changes in, local laws, rules and regulations, as well as structuring its operations to comply with local laws, rules and regulations and implementing and administering related internal policies and procedures.
There can be no assurance that JPMorgan Chase will always be successful in its efforts to fully understand and to conduct its business in compliance with the laws, rules and regulations of all of the jurisdictions in which it operates, and the risk of non-compliance can be greater in jurisdictions that have less predictable legal and regulatory frameworks.
Requirements for the orderly resolution of JPMorgan Chase could result in JPMorgan Chase having to restructure or reorganize its businesses and could increase its funding or operational costs or curtail its businesses.
JPMorgan Chase is required under Federal Reserve and FDIC rules to prepare and submit periodically to those agencies a detailed plan for rapid and orderly resolution in bankruptcy, without extraordinary government support, in the event of material financial distress or failure. The evaluation of JPMorgan Chase’s resolution plan by these agencies may change, and the requirements for resolution plans may be modified from time to time. Any such determinations or modifications could result in JPMorgan Chase needing to make changes to its legal entity structure or to certain internal or external activities, which could increase its funding or operational costs, or hamper its ability to serve clients and customers.
12 | ||||||||
If the Federal Reserve and the FDIC were both to determine that a resolution plan submitted by JPMorgan Chase has deficiencies, they could jointly impose more stringent capital, leverage or liquidity requirements or restrictions on JPMorgan Chase’s growth, activities or operations. The agencies could also require that JPMorgan Chase restructure, reorganize or divest assets or businesses in ways that could materially and adversely affect JPMorgan Chase’s operations and strategy.
Holders of JPMorgan Chase & Co.’s debt and equity securities will absorb losses if it were to enter into a resolution.
Federal Reserve rules require that JPMorgan Chase & Co. (the “Parent Company”) maintain minimum levels of unsecured external long-term debt and other loss-absorbing capacity with specific terms (“eligible LTD”) for purposes of recapitalizing JPMorgan Chase’s operating subsidiaries if the Parent Company were to enter into a resolution either:
•in a bankruptcy proceeding under Chapter 11 of the U.S. Bankruptcy Code, or
•in a receivership administered by the FDIC under Title II of the Dodd-Frank Act (“Title II”).
If the Parent Company were to enter into a resolution, holders of eligible LTD and other debt and equity securities of the Parent Company will absorb the losses of the Parent Company and its subsidiaries.
The preferred “single point of entry” strategy under JPMorgan Chase’s resolution plan contemplates that only the Parent Company would enter bankruptcy proceedings. JPMorgan Chase’s subsidiaries would be recapitalized, as needed, so that they could continue normal operations or subsequently be divested or wound down in an orderly manner. As a result, the Parent Company’s losses and any losses incurred by its subsidiaries would be imposed first on holders of the Parent Company’s equity securities and thereafter on its unsecured creditors, including holders of eligible LTD and other debt securities. Claims of holders of those securities would have a junior position to the claims of creditors of JPMorgan Chase’s subsidiaries and to the claims of priority (as determined by statute) and secured creditors of the Parent Company.
Accordingly, in a resolution of the Parent Company in bankruptcy, holders of eligible LTD and other debt securities of the Parent Company would realize value only to the extent available to the Parent Company as a shareholder of JPMorgan Chase Bank, N.A. and its other subsidiaries, and only after any claims of priority and secured creditors of the Parent Company have been fully repaid.
The FDIC has similarly indicated that a single point of entry recapitalization model could be a desirable strategy to resolve a systemically important financial institution, such as the Parent Company, under Title II. However, the FDIC
has not formally adopted a single point of entry resolution strategy.
If the Parent Company were to approach, or enter into, a resolution, none of the Parent Company, the Federal Reserve or the FDIC is obligated to follow JPMorgan Chase’s preferred resolution strategy, and losses to holders of eligible LTD and other debt and equity securities of the Parent Company, under whatever strategy is ultimately followed, could be greater than they might have been under JPMorgan Chase’s preferred strategy.
Political
Economic uncertainty or instability caused by political or geopolitical developments can negatively impact JPMorgan Chase’s businesses.
Political developments in the U.S. and other countries can cause uncertainty in the economic environment and market conditions in which JPMorgan Chase operates its businesses. Certain governmental policy initiatives, as well as heightened geopolitical tensions, could significantly affect U.S. and global economic growth and cause higher volatility in the financial markets, including:
•an outbreak or escalation of hostilities, or other geopolitical instabilities
•monetary policies and actions taken by the Federal Reserve and other central banks or governmental authorities, including any sustained large-scale asset purchases or any suspension or reversal of those actions
•fiscal policies, including with respect to taxation and spending
•actions that governments take or fail to take in response to the effects of health emergencies, the spread of infectious diseases, epidemics or pandemics, as well as the effectiveness of any actions taken
•governmental actions or initiatives relating to climate risk, or more generally, the impact of business activities on environmental, social and governance (“ESG”) matters, and the management of climate and other ESG-related risks
•isolationist foreign policies
•economic or financial sanctions
•the implementation of tariffs and other protectionist trade policies, or
•other governmental policies or actions adopted or taken in response to political or social pressures.
These types of political developments, and uncertainty about the possible outcomes of these developments, could:
•erode investor confidence in the U.S. economy and financial markets, which could potentially undermine the status of the U.S. dollar as a safe haven currency
13 | ||||||||
Part I
•provoke retaliatory countermeasures by other countries and otherwise heighten tensions in regulatory, enforcement or diplomatic relations
•increase concerns about whether the U.S. government will be funded, and its outstanding debt serviced, at any particular time
•lead to the withdrawal of government support for agencies and enterprises such as the U.S. Federal National Mortgage Association and the U.S. Federal Home Loan Mortgage Corporation (together, the “U.S. GSEs”)
•result in periodic shutdowns of the U.S. government or governments in other countries
•increase investor reliance on actions by the Federal Reserve or other central banks, or influence investor perceptions concerning government support of sectors of the economy or the economy as a whole
•adversely affect the financial condition or credit ratings of clients and counterparties with which JPMorgan Chase does business, or
•cause JPMorgan Chase to refrain from engaging in business opportunities that it might otherwise pursue.
These factors could lead to:
•slower growth rates, rising inflation or recession
•greater market volatility
•a contraction of available credit and the widening of credit spreads
•erosion of adequate risk premium on certain financial assets
•diminished investor and consumer confidence
•lower investments in a particular country or sector of the economy
•large-scale sales of government debt and other debt and equity securities in the U.S. and other countries
•reduced commercial activity among trading partners
•the potential for a currency redenomination by a particular country
•the possible departure of a country from, or the dissolution or formation of, a political or economic alliance or treaty
•potential expropriation or nationalization of assets, including client assets, or
•other market dislocations, including unfavorable economic conditions that could spread from a particular country or region to other countries or regions.
Any of these potential outcomes could cause JPMorgan Chase to suffer losses on its market-making positions or in its investment portfolio, reduce its liquidity and capital levels, increase the allowance for credit losses or lead to higher net charge-offs, hamper its ability to deliver
products and services to its clients and customers, and weaken its results of operations and financial condition or credit rating.
JPMorgan Chase's business and results of operations may also be adversely affected by actions or initiatives by national, state or local governmental authorities that:
•seek to discourage financial institutions from doing business with companies engaged in certain industries, or conversely, to penalize financial institutions that elect not to do business with such companies, or
•mandate specific business practices that companies operating in the relevant jurisdiction must adopt.
Because governmental policies in one jurisdiction may differ or conflict with those in other jurisdictions, JPMorgan Chase may face negative consequences regardless of the course of action it takes or elects not to take, including:
•restrictions or prohibitions on doing business within a particular jurisdiction, or with governmental entities in a jurisdiction
•the threat of enforcement actions, including under antitrust or other anti-competition laws, rules and regulations, and
•harm to its reputation arising from public criticism, including from politicians, activists and other stakeholders.
JPMorgan Chase has been prohibited from engaging in certain business activities in specific jurisdictions as a result of these types of governmental actions, and there is no assurance that it will not face similar restrictions on its business and operations in the future.
In addition, JPMorgan Chase's relationships or ability to transact with clients and customers, and with governmental or regulatory bodies in jurisdictions in which JPMorgan Chase does business, could be adversely affected if its decisions with respect to doing business with companies in certain sensitive industries are perceived to harm those companies or to align with particular political viewpoints. Furthermore, JPMorgan Chase's participation in or association with certain environmental and social industry groups or initiatives could be viewed by activists or governmental authorities as boycotting or other discriminatory business behavior.
Market
Economic and market events and conditions can materially affect JPMorgan Chase’s businesses and investment and market-making positions.
JPMorgan Chase’s results of operations can be negatively affected by adverse changes in any of the following:
•investor, consumer and business sentiment
•events that reduce confidence in the financial markets
•inflation, deflation or recession
14 | ||||||||
•high unemployment or, conversely, a tightening labor market
•the availability and cost of capital, liquidity and credit
•levels and volatility of interest rates, credit spreads and market prices for currencies, equities and commodities, as well as the duration of any such changes
•the economic effects of an outbreak or escalation of hostilities, terrorism or other geopolitical instabilities, cyber attacks, climate change, natural disasters, severe weather conditions, health emergencies, the spread of infectious diseases, epidemics or pandemics or other extraordinary events beyond JPMorgan Chase’s control, and
•the strength of the U.S. and global economies.
All of these are affected by global economic, market and political events and conditions, as well as regulatory restrictions.
In addition, JPMorgan Chase’s investment portfolio and market-making businesses can suffer losses due to unanticipated market events, including:
•severe declines in asset values
•unexpected credit events
•unforeseen events or conditions that may cause previously uncorrelated factors to become correlated (and vice versa)
•the inability to effectively hedge risks related to market-making and investment portfolio positions, or
•other market risks that may not have been appropriately taken into account in the development, structuring or pricing of a financial instrument.
If JPMorgan Chase experiences significant losses in its investment portfolio or from market-making activities, this could reduce JPMorgan Chase’s profitability and its liquidity and capital levels, and thereby constrain the growth of its businesses.
JPMorgan Chase’s consumer businesses can be negatively affected by adverse economic conditions and governmental policies.
JPMorgan Chase’s consumer businesses are particularly affected by U.S. and global economic conditions, including:
•personal and household income distribution
•unemployment or underemployment
•prolonged periods of exceptionally high or low interest rates
•changes in the value of collateral such as residential real estate and vehicles
•changes in housing prices
•the level of inflation and its effect on prices for goods and services
•consumer and small business confidence levels, and
•changes in consumer spending or in the level of consumer debt.
Heightened levels of unemployment or underemployment that result in reduced personal and household income could negatively affect consumer credit performance to the extent that consumers are less able to service their debts. In addition, sustained low growth, low or negative interest rates, inflationary pressures or recessionary conditions could diminish customer demand for the products and services offered by JPMorgan Chase’s consumer businesses.
Adverse economic conditions could also lead to an increase in delinquencies, additions to the allowance for credit losses and higher net charge-offs, which can reduce JPMorgan Chase’s earnings. These consequences could be significantly worse in certain geographies, including where declining industrial or manufacturing activity has resulted in or could result in higher levels of unemployment, or where high levels of consumer debt, such as outstanding student loans, could impair the ability of customers to pay their other consumer loan obligations.
JPMorgan Chase’s earnings from its consumer businesses could also be adversely affected by governmental policies and actions that affect consumers, including:
•policies and initiatives relating to medical insurance, education, immigration, employment status and housing
•laws, rules and regulations relating specifically to the financial services industry, such as limitations on late payment, overdraft and interchange fees, and
•policies aimed at the economy more broadly, such as higher taxes and increased regulation which could result in reductions in consumer disposable income.
Unfavorable market and economic conditions can have an adverse effect on JPMorgan Chase’s wholesale businesses.
In JPMorgan Chase’s wholesale businesses, market and economic factors can affect the volume of transactions that JPMorgan Chase executes for its clients or for which it advises clients, and, therefore, the revenue that JPMorgan Chase receives from those transactions. These factors can also influence the willingness of other financial institutions and investors to participate in capital markets transactions that JPMorgan Chase manages, such as loan syndications or securities underwriting. Furthermore, if a significant and sustained deterioration in market conditions were to occur, the profitability of JPMorgan Chase’s businesses engaged in capital markets activities, including loan syndication, securities underwriting and leveraged lending activities, could be reduced to the extent that those businesses:
•earn less fee revenue due to lower transaction volumes, including when clients are unwilling or unable to
15 | ||||||||
Part I
refinance their outstanding debt obligations in unfavorable market conditions, or
•dispose of portions of credit commitments at a loss, or hold larger residual positions in credit commitments that cannot be sold at favorable prices.
The fees that JPMorgan Chase earns from managing client assets or holding assets under custody for clients could be diminished by declining asset values or other adverse macroeconomic conditions. For example, higher interest rates or a downturn in financial markets could affect the valuation of client assets that JPMorgan Chase manages or holds under custody, which, in turn, could affect JPMorgan Chase’s revenue from fees that are based on the amount of assets under management or custody. Similarly, adverse macroeconomic or market conditions could prompt outflows from JPMorgan Chase funds or accounts, or cause clients to invest in products that generate lower revenue. Substantial and unexpected withdrawals from a JPMorgan Chase fund can also hamper the investment performance of the fund, particularly if the outflows create the need for the fund to dispose of fund assets at disadvantageous times or prices, and could lead to further withdrawals based on the weaker investment performance.
An adverse change in market conditions in particular segments of the economy, such as a sudden and severe downturn in oil and gas prices or an increase in commodity prices, severe declines in commercial real estate values, or sustained changes in consumer behavior that affect specific economic sectors, could have a material adverse effect on clients of JPMorgan Chase whose operations or financial condition are directly or indirectly dependent on the health or stability of those market segments or economic sectors, as well as clients that are engaged in related businesses. JPMorgan Chase could incur credit losses on its loans and other commitments to clients that operate in, or are dependent on, any sector of the economy that is or comes under stress.
An economic downturn or sustained changes in consumer behavior that results in shifts in consumer and business spending could also have a negative impact on certain of JPMorgan Chase’s wholesale clients, and thereby diminish JPMorgan Chase’s earnings from its wholesale operations. For example, the businesses of certain of JPMorgan Chase’s wholesale clients are dependent on consistent streams of rental income from commercial real estate properties, including offices, which are owned or being built by those clients. Sustained adverse economic conditions or hybrid work models could result in reductions in the rental cash flows that owners or developers receive from their tenants which, in turn, could depress the values of the properties, impair the ability of borrowers to service or refinance their commercial real estate loans and lead to an increase in foreclosures. These consequences could result in JPMorgan Chase experiencing increases in the allowance for credit losses, higher delinquencies, defaults and charge-offs within its commercial real estate loan portfolio and
incurring higher costs for servicing a larger volume of delinquent loans in that portfolio. An increase in foreclosures could result in higher operational risk associated with JPMorgan Chase owning and managing real property, and any inadequacy in governance or control over the foreclosed properties could result in regulatory scrutiny and reputational harm.
Changes in interest rates and credit spreads can adversely affect JPMorgan Chase’s earnings, its liquidity or its capital levels.
When interest rates are high or increasing, JPMorgan Chase can generally be expected to earn higher net interest income. However, higher interest rates can also lead to:
•fewer originations of commercial and residential real estate loans
•losses on underwriting exposures or incremental client-specific downgrades, or increases in the allowance for credit losses and net charge-offs due to higher financing costs for clients
•the loss of deposits, particularly if customers withdraw deposits because they believe that interest rates offered by JPMorgan Chase are lower than those of competitors or if JPMorgan Chase makes incorrect assumptions about depositor behavior
•losses on available-for-sale (“AFS”) securities held in the investment securities portfolio
•lower net interest income if central banks introduce interest rate increases more quickly than anticipated and this results in a misalignment in the pricing of short-term and long-term borrowings
•less liquidity in the financial markets, and
•higher funding costs.
All of these outcomes could adversely affect JPMorgan Chase’s earnings or its liquidity and capital levels, and any negative outcomes could be more severe in a prolonged period of high interest rates. Higher interest rates can also negatively affect the payment performance on loans within JPMorgan Chase’s consumer and wholesale loan portfolios that are linked to variable interest rates. If borrowers of variable rate loans are unable to afford higher interest payments, those borrowers may reduce or stop making payments, thereby causing JPMorgan Chase to incur losses and increased operational costs related to servicing a higher volume of delinquent loans.
On the other hand, a low or negative interest rate environment may cause:
•net interest margins to be compressed, which could reduce the amounts that JPMorgan Chase earns on its investment securities portfolio to the extent that it is unable to reinvest contemporaneously in higher-yielding instruments
16 | ||||||||
•unanticipated or adverse changes in depositor behavior, which could negatively affect JPMorgan Chase’s broader asset and liability management strategy, and
•a reduction in the value of JPMorgan Chase’s mortgage servicing rights (“MSRs”) asset, decreasing revenues.
When credit spreads widen, it becomes more expensive for JPMorgan Chase to borrow. JPMorgan Chase’s credit spreads may widen or narrow not only in response to events and circumstances that are specific to JPMorgan Chase but also as a result of general economic and geopolitical events and conditions. Changes in JPMorgan Chase’s credit spreads will affect, positively or negatively, JPMorgan Chase’s earnings on certain liabilities, such as derivatives, that are recorded at fair value.
JPMorgan Chase’s results may be materially affected by market fluctuations and significant changes in the value of financial instruments.
The value of securities, derivatives and other financial instruments which JPMorgan Chase owns or in which it makes markets can be materially affected by market fluctuations. Market volatility, illiquid market conditions and other disruptions in the financial markets may make it extremely difficult to value certain financial instruments. Subsequent valuations of financial instruments in future periods, in light of factors then prevailing, may result in significant changes in the value of these instruments. In addition, at the time of any disposition of these financial instruments, the price that JPMorgan Chase ultimately realizes will depend on the demand and liquidity in the market at that time and may be materially lower than their current fair value. Any of these factors could cause a decline in the value of financial instruments that JPMorgan Chase owns or in which it makes markets, which may have an adverse effect on JPMorgan Chase’s results of operations.
JPMorgan Chase’s risk management and monitoring processes, including its stress testing framework, seek to quantify and manage JPMorgan Chase’s exposure to more extreme market moves. However, JPMorgan Chase’s hedging and other risk management strategies may not be effective, and it could incur significant losses, if extreme market events were to occur.
Credit
JPMorgan Chase can be negatively affected by adverse changes in the financial condition of clients, counterparties, custodians and CCPs.
JPMorgan Chase routinely executes transactions with clients and counterparties such as corporations, financial institutions, asset managers, hedge funds, securities exchanges and government entities within and outside the U.S. Many of these transactions expose JPMorgan Chase to the credit risk of its clients and counterparties, and can involve JPMorgan Chase in disputes and litigation if a client or counterparty defaults. JPMorgan Chase can also be subject to losses or liability where a financial institution that
it has appointed to provide custodial services for client assets or funds becomes insolvent as a result of fraud or the failure to abide by existing laws and obligations, or where clients are unable to access assets held by JPMorgan Chase as custodian due to governmental actions or other factors.
A default by, or the financial or operational failure of, a CCP through which JPMorgan Chase executes contracts would require JPMorgan Chase to replace those contracts, thereby increasing its operational costs and potentially resulting in losses. In addition, JPMorgan Chase can be exposed to losses if a member of a CCP in which JPMorgan Chase is also a member defaults on its obligations to the CCP because of requirements that each member of the CCP absorb a portion of those losses. Furthermore, JPMorgan Chase can be subject to bearing its share of non-default losses incurred by a CCP, including losses from custodial, settlement or investment activities or due to cyber or other security breaches.
As part of its clearing services activities, JPMorgan Chase is exposed to the risk of nonperformance by its clients, which it seeks to mitigate by requiring clients to provide adequate collateral. JPMorgan Chase is also exposed to intra-day credit risk of its clients in connection with providing cash management, clearing, custodial and other transaction services to those clients. If a client for which JPMorgan Chase provides these services becomes bankrupt or insolvent, JPMorgan Chase may incur losses, become involved in disputes and litigation with one or more CCPs, the client’s bankruptcy estate and other creditors, or be subject to regulatory investigations. All of the foregoing events can increase JPMorgan Chase’s operational and litigation costs, and JPMorgan Chase may suffer losses to the extent that any collateral that it has received is insufficient to cover those losses.
Transactions with government entities, including national, state, provincial, municipal and local authorities, can expose JPMorgan Chase to enhanced sovereign, credit, operational and reputation risks. Government entities may, among other things, claim that actions taken by government officials were beyond the legal authority of those officials or repudiate transactions authorized by a previous incumbent government. These types of actions have in the past caused, and could in the future cause, JPMorgan Chase to suffer losses or hamper its ability to conduct business in the relevant jurisdiction.
In addition, local laws, rules and regulations could limit JPMorgan Chase’s ability to resolve disputes and litigation in the event of a counterparty default or unwillingness to make previously agreed-upon payments, which could subject JPMorgan Chase to losses.
Disputes may arise with counterparties to derivatives contracts with regard to the terms, the settlement procedures or the value of underlying collateral. The disposition of those disputes could cause JPMorgan Chase to incur unexpected transaction, operational and legal costs, or result in credit losses. These consequences can
17 | ||||||||
Part I
also impair JPMorgan Chase’s ability to effectively manage its credit risk exposure from its market activities, or cause harm to JPMorgan Chase’s reputation.
The financial or operational failure of a significant market participant, such as a major financial institution or a CCP, or concerns about the creditworthiness of such a market participant or its ability to fulfill its obligations, can cause substantial and cascading disruption within the financial markets, including in circumstances where coordinated action by multiple other market participants is required to address the failure or disruption. JPMorgan Chase’s businesses could be significantly disrupted by such an event, particularly if it leads to other market participants incurring significant losses, experiencing liquidity issues or defaulting, and JPMorgan Chase is likely to have significant interrelationships with, and credit exposure to, such a significant market participant.
JPMorgan Chase may suffer losses if the value of collateral declines in stressed market conditions.
During periods of market stress or illiquidity, JPMorgan Chase’s credit risk may be further increased when:
•JPMorgan Chase fails to realize the estimated value of the collateral it holds
•collateral is liquidated at prices that are not sufficient to recover the full amount owed to it, or
•counterparties are unable to post collateral, whether for operational or other reasons.
Furthermore, disputes with counterparties concerning the valuation of collateral may increase in times of significant market stress, volatility or illiquidity, and JPMorgan Chase could suffer losses during these periods if it is unable to realize the fair value of collateral or to manage declines in the value of collateral.
JPMorgan Chase could incur significant losses arising from concentrations of credit and market risk.
JPMorgan Chase is exposed to greater credit and market risk to the extent that groupings of its clients or counterparties, or obligors on securities and other financial instruments:
•engage in similar or related businesses, or in businesses in related industries
•do business in the same geographic region, or
•have business profiles, models or strategies that could cause their ability to meet their obligations to be similarly affected by changes in economic conditions.
For example, a significant deterioration in the credit quality of a counterparty, borrower or other obligor could lead to concerns about the creditworthiness of other counterparties, borrowers or obligors in similar, related or dependent industries. This type of interrelationship could exacerbate JPMorgan Chase’s credit, liquidity and market risk exposure and potentially cause it to incur losses,
including fair value losses in its market-making businesses and investment portfolios. In addition, JPMorgan Chase may be required to increase the allowance for credit losses or establish other reserves with respect to certain clients, industries or country exposures in order to align with directives or expectations of its banking regulators.
Similarly, challenging economic conditions that affect a particular industry or geographic area could lead to concerns about the credit quality of counterparties, borrowers or other obligors not only in that particular industry or geography but in related or dependent industries, wherever located. These conditions could also heighten concerns about the ability of customers of JPMorgan Chase’s consumer businesses who live in those areas or work in those affected industries or related or dependent industries to meet their obligations to JPMorgan Chase. JPMorgan Chase regularly monitors various segments of its credit and market risk exposures to assess the potential risks of concentration or contagion, but its ability to diversify or hedge its exposure against those risks may be limited.
JPMorgan Chase’s consumer businesses can also be harmed by an excessive expansion of consumer credit by bank or non-bank competitors. Heightened competition for certain types of consumer loans could prompt industry-wide reactions such as significant reductions in the pricing or margins of those loans or the making of loans to less-creditworthy borrowers. If large numbers of consumers subsequently default on their loans, whether due to weak credit profiles, an economic downturn or other factors, this could impair their ability to repay obligations owed to JPMorgan Chase and result in higher charge-offs and other credit-related losses. More broadly, widespread defaults on consumer debt could lead to recessionary conditions in the U.S. economy, and JPMorgan Chase’s consumer businesses may earn lower revenues in such an environment.
If JPMorgan Chase is unable to reduce positions effectively during a market dislocation, this can increase both the market and credit risks associated with those positions and the level of risk-weighted-assets (“RWA”) that JPMorgan Chase holds on its balance sheet. These factors could adversely affect JPMorgan Chase’s capital position, funding costs and the profitability of its businesses.
Liquidity
JPMorgan Chase’s ability to operate its businesses could be impaired if its liquidity is constrained.
JPMorgan Chase’s liquidity can be impacted at any given time as a result of factors such as:
•market-wide illiquidity or disruption
•changes in liquidity or capital requirements resulting from changes in laws, rules and regulations, including those in response to economic effects of systemic events
•actions taken by the U.S. government or by the Federal Reserve to reduce its balance sheet, which may reduce
18 | ||||||||
deposits held by JPMorgan Chase and other financial institutions
•inability to sell assets, or to sell assets at favorable times or prices
•default by a CCP or other significant market participant
•unanticipated outflows of cash or collateral
•unexpected loss of deposits or higher than anticipated draws on lending-related commitments, and
•lack of market or customer confidence in JPMorgan Chase or financial institutions in general.
A reduction in JPMorgan Chase’s liquidity may be caused by events over which it has little or no control. For example, periods of market stress, low investor confidence and significant market illiquidity could result in higher funding costs for JPMorgan Chase and could limit its access to some of its traditional sources of liquidity.
JPMorgan Chase may need to raise funding from alternative sources if its access to stable and lower-cost sources of funding, such as deposits and borrowings from Federal Home Loan Banks, is reduced. Alternative sources of funding could be more expensive or limited in availability. JPMorgan Chase’s funding costs could also be negatively affected by actions that JPMorgan Chase may take in order to:
•satisfy applicable liquidity coverage ratio and net stable funding ratio requirements
•address obligations under its resolution plan, or
•satisfy regulatory requirements in jurisdictions outside the U.S. relating to the pre-positioning of liquidity in subsidiaries that are material legal entities.
More generally, if JPMorgan Chase fails to effectively manage its liquidity, this could constrain its ability to fund or invest in its businesses and subsidiaries, and thereby adversely affect its results of operations.
JPMorgan Chase & Co. is a holding company and depends on the cash flows of its subsidiaries to make payments on its outstanding securities.
JPMorgan Chase & Co. is a holding company that holds the stock of JPMorgan Chase Bank, N.A. and an intermediate holding company, JPMorgan Chase Holdings LLC (the “IHC”). The IHC in turn generally holds the stock of JPMorgan Chase’s subsidiaries other than JPMorgan Chase Bank, N.A. and its subsidiaries. The IHC also owns other assets and provides intercompany lending to the Parent Company.
The Parent Company is obligated to contribute to the IHC substantially all the net proceeds received from securities issuances (including issuances of senior and subordinated debt securities and of preferred and common stock).
The ability of JPMorgan Chase Bank, N.A. and the IHC to make payments to the Parent Company is also
limited. JPMorgan Chase Bank, N.A. is subject to regulatory restrictions on its dividend distributions, as well as capital adequacy requirements, such as the Supplementary Leverage Ratio (“SLR”), and liquidity requirements and other regulatory restrictions on its ability to make payments to the Parent Company. The IHC is prohibited from paying dividends or extending credit to the Parent Company if certain capital or liquidity thresholds are breached, or if limits are otherwise imposed by the Parent Company’s management or Board of Directors.
As a result of these arrangements, the ability of the Parent Company to make various payments is dependent on its receiving dividends from JPMorgan Chase Bank, N.A. and dividends and borrowings from the IHC. These limitations could affect the Parent Company’s ability to:
•pay interest on its debt securities
•pay dividends on its equity securities
•redeem or repurchase outstanding securities, and
•fulfill its other payment obligations.
These arrangements could also result in the Parent Company seeking protection under bankruptcy laws or otherwise entering into resolution proceedings at a time earlier than would have been the case absent the existence of the capital and liquidity thresholds to which JPMorgan Chase Bank, N.A. and the IHC are subject.
Reductions in JPMorgan Chase’s credit ratings may adversely affect its liquidity and cost of funding.
JPMorgan Chase & Co. and certain of its principal subsidiaries are rated by credit rating agencies. Rating agencies evaluate general, firm-specific and industry-specific factors when determining credit ratings for a particular financial institution, including:
•expected future profitability
•risk management practices
•legal expenses
•ratings differentials between bank holding companies and their bank and non-bank subsidiaries
•regulatory developments
•assumptions about government support, and
•economic and geopolitical developments.
JPMorgan Chase closely monitors and manages, to the extent that it is able, factors that could influence its credit ratings. However, there is no assurance that JPMorgan Chase’s credit ratings will not be downgraded in the future. Furthermore, any such downgrade could occur at times of broader market instability when JPMorgan Chase’s options for responding to events may be more limited and general investor confidence is low.
19 | ||||||||
Part I
A reduction in JPMorgan Chase’s credit ratings could curtail JPMorgan Chase’s business activities and reduce its profitability in a number of ways, including:
•reducing its access to capital markets
•materially increasing its cost of issuing and servicing securities
•triggering additional collateral or funding requirements, and
•decreasing the number of investors and counterparties that are willing or permitted to do business with or lend to JPMorgan Chase.
Any rating reduction could also increase the credit spreads charged by the market for taking credit risk on JPMorgan Chase & Co. and its subsidiaries. This could, in turn, adversely affect the value of debt and other obligations of JPMorgan Chase & Co. and its subsidiaries.
Capital
Maintaining the required level and composition of capital may impact JPMorgan Chase’s ability to support business activities, meet evolving regulatory requirements and distribute capital to shareholders.
JPMorgan Chase is subject to various regulatory capital requirements, including leverage- and risk-based capital requirements. In addition, as a Global Systemically Important Bank (“GSIB”), JPMorgan Chase is required to hold additional capital buffers, including a GSIB surcharge, a Stress Capital Buffer (“SCB”), and a countercyclical buffer, each of which is reassessed at least annually. The amount of capital that JPMorgan Chase is required to hold in order to satisfy these leverage- and risk-based requirements could increase at any given time due to factors such as:
•actions by banking regulators, including changes in laws, rules, and regulations
•changes in the composition of JPMorgan Chase’s balance sheet or developments that could increase RWA, such as increased market risk, customer delinquencies, client credit rating downgrades or other factors, and
•increases in estimated stress losses as determined by the Federal Reserve under the Comprehensive Capital Analysis and Review, which could increase JPMorgan Chase’s SCB.
Any failure by or inability of JPMorgan Chase to maintain the required level and composition of capital, or unfavorable changes in applicable capital requirements, could have an adverse impact on JPMorgan Chase’s shareholders, such as:
•reducing the amount of common stock that JPMorgan Chase is permitted to repurchase
•requiring the issuance of, or prohibiting the redemption of, capital instruments in a manner inconsistent with JPMorgan Chase’s capital management strategy
•constraining the amount of dividends that may be paid on common stock, or
•curtailing JPMorgan Chase’s business activities or operations.
Banking regulators have released a proposal to amend the Basel III risk-based capital framework which could significantly revise the risk-based capital requirements for banks with assets of $100 billion or more, including JPMorgan Chase. Uncertainty remains as to the manner in which these requirements will ultimately apply to JPMorgan Chase, however it is possible that these requirements could impact JPMorgan Chase’s decisions concerning the business activities in which it will engage and its levels of capital distributions to its shareholders.
Operational
JPMorgan Chase’s businesses are dependent on the effectiveness of internal and external operational systems.
JPMorgan Chase’s businesses rely on the ability of JPMorgan Chase’s financial, accounting, transaction execution, data processing and other operational systems to process, record, monitor and report a large number of transactions on a continuous basis, and to do so accurately, quickly and securely. In addition to proper design, installation, maintenance and training, the effective functioning of JPMorgan Chase’s operational systems depends on:
•the quality of the information contained in those systems, as inaccurate, outdated, incomplete or corrupted data can significantly compromise the functionality or reliability of a particular system and other systems to which it transmits or from which it receives information, and
•JPMorgan Chase’s ability to continue to maintain and upgrade its systems on a regular basis in line with technological advancements and evolving security requirements, carefully manage any changes introduced to its systems to maintain security and operational continuity, and adhere to all applicable legal and regulatory requirements, particularly in regions where JPMorgan Chase may face a heightened risk of malicious activity.
JPMorgan Chase has experienced and expects that it will continue to experience failures and disruptions in the stability of its operational systems, including degraded performance of data processing systems, data quality issues, disruptions of network connectivity and malfunctioning software, as well as disruptions in its ability to access and use the operational systems of third parties. These incidents have resulted in various negative effects for customers, including the inability to access account information or to make transactions through ATM, internet or mobile channels, the exfiltration of customer personal data, the recording of duplicative transactions and extended delays for customers requiring services from call
20 | ||||||||
centers. There can be no assurance that these and other types of operational failures or disruptions will not occur in the future.
JPMorgan Chase’s ability to effectively manage the stability of its operational systems and infrastructure could be hindered by many factors, any of which could have a negative impact on JPMorgan Chase and its clients, customers and counterparties, including:
•JPMorgan Chase’s ability to effectively maintain and upgrade systems and infrastructure can become more challenging as the speed, frequency, volume, interconnectivity and complexity of transactions continue to increase
•attempts by third parties to defraud JPMorgan Chase or its clients and customers are increasing, evolving and becoming more complex, and during periods of market disruption or economic uncertainty, these attempts can be expected to increase in volume
•errors made by JPMorgan Chase or another market participant, whether inadvertent or malicious, could cause widespread system disruption
•failure to detect weaknesses or shortcomings in operational systems in a timely manner
•isolated or seemingly insignificant errors in operational systems could compound, or migrate to other systems over time, to become larger issues
•disruptions in operational systems or in the ability of systems to communicate with each other could be caused by failures in synchronization or encryption software, or degraded performance of microprocessors, and
•attempts by third parties to block the use of key technology solutions by claiming that the use infringes on their intellectual property rights.
JPMorgan Chase also depends on its ability to access and use the operational systems of third parties, including its custodians, vendors (such as those that provide data and cloud computing services, and security and technology services) and other market participants (such as clearing and payment systems, CCPs and securities exchanges), and external operational systems with which JPMorgan is connected, whether directly or indirectly, can be sources of operational risk to JPMorgan Chase. JPMorgan Chase may be exposed not only to a systems failure or cyber attack that may be experienced by a vendor or market infrastructure with which JPMorgan Chase is directly connected, but also to a systems breakdown or cyber attack involving another party to which such a vendor or infrastructure is connected. Similarly, retailers, payment systems and processors, data aggregators and other external parties with which JPMorgan Chase’s customers do business can increase JPMorgan Chase’s operational risk. This is particularly the case where activities of customers or other parties are beyond JPMorgan Chase’s security and control systems, including through the use of the internet,
cloud computing services, and personal smart phones and other mobile devices or services.
If an external party obtains access to customer account data on JPMorgan Chase’s systems, whether authorized or unauthorized, and that party misappropriates that data, this could result in negative outcomes for JPMorgan Chase and its clients and customers, including a heightened risk of fraudulent transactions using JPMorgan Chase’s systems, losses from fraudulent transactions and reputational harm arising from the perception that JPMorgan Chase’s systems may not be secure.
As JPMorgan Chase’s interconnectivity with clients, customers and other external parties continues to expand, JPMorgan Chase increasingly faces the risk of operational failure or cyber attacks with respect to the systems of those parties. Security breaches affecting JPMorgan Chase’s clients or customers, or systems breakdowns or failures, security breaches or human error or misconduct affecting other external parties, may require JPMorgan Chase to take steps to protect the integrity of its own operational systems or to safeguard confidential information, including restricting the access of customers to their accounts. These actions can increase JPMorgan Chase’s operational costs and potentially diminish customer satisfaction and confidence in JPMorgan Chase.
Furthermore, the widespread and expanding interconnectivity among financial institutions, clearing banks, CCPs, payments processors, financial technology companies, securities exchanges, clearing houses and other financial market infrastructures increases the risk that the disruption of an operational system involving one institution or entity, including due to a cyber attack, may cause industry-wide operational disruptions that could materially affect JPMorgan Chase’s ability to conduct business. In addition, the risks associated with the disruption of an operational system of a third party could be exacerbated to the extent that the services provided by that system are used by a significant number or proportion of market participants.
The ineffectiveness, failure or other disruption of operational systems upon which JPMorgan Chase depends, including due to a systems malfunction, cyber incident or other systems failure, could result in unfavorable ripple effects in the financial markets and for JPMorgan Chase and its clients and customers, including:
•delays or other disruptions in providing services, including the provision of liquidity or information to clients and customers
•impairment of JPMorgan Chase’s ability to execute transactions, including delays or failures in the confirmation or settlement of transactions or in obtaining access to funds or other assets required for settlement
•the possibility that funds transfers, capital markets trades or other transactions are executed erroneously
21 | ||||||||
Part I
•financial losses, including due to loss-sharing requirements of CCPs, payment systems or other market infrastructures, or as possible restitution to clients and customers
•higher operational costs associated with replacing services provided by a system that has experienced a failure or other disruption
•limitations on JPMorgan Chase's ability to collect data needed for its business and operations
•loss of confidence in the ability of JPMorgan Chase, or financial institutions generally, to protect against and withstand operational disruptions
•dissatisfaction among JPMorgan Chase’s clients or customers
•significant exposure to litigation and regulatory fines, penalties or other sanctions, and
•harm to JPMorgan Chase’s reputation.
If JPMorgan Chase’s operational systems, or those of acquired businesses or of external parties on which JPMorgan Chase’s businesses depend, are unable to meet the requirements of JPMorgan Chase’s businesses and operations or bank regulatory standards, or if they fail or have other significant shortcomings, JPMorgan Chase could be materially and adversely affected.
A successful cyber attack affecting JPMorgan Chase could cause significant harm to JPMorgan Chase and its clients and customers.
JPMorgan Chase experiences numerous cyber attacks on its computer systems, software, networks and other technology assets on a daily basis from various actors, including groups acting on behalf of hostile countries, cyber-criminals, “hacktivists” (i.e., individuals or groups that use technology to promote a political agenda or social change) and others. These cyber attacks can take many forms, including attempts to introduce computer viruses or malicious code, which are commonly referred to as “malware,” into JPMorgan Chase’s systems. These attacks are often designed to:
•obtain unauthorized access to confidential information belonging to JPMorgan Chase or its clients, customers, counterparties or employees
•manipulate data
•destroy data or systems with the aim of rendering services unavailable
•disrupt, sabotage or degrade service on JPMorgan Chase’s systems
•steal money, or
•extort money through the use of so-called “ransomware.”
JPMorgan Chase also experiences:
•distributed denial-of-service attacks intended to disrupt JPMorgan Chase’s websites, including those that provide online banking and other services,
•a higher volume and complexity of cyber attacks against the backdrop of heightened geopolitical tensions, and
•a high volume of disruptions to internet-based services used by JPMorgan Chase that are provided by third parties.
JPMorgan Chase has experienced security breaches due to cyber attacks in the past, and it is inevitable that additional breaches will occur in the future. Any such breach could result in serious and harmful consequences for JPMorgan Chase or its clients and customers.
A principal reason that JPMorgan Chase cannot provide absolute security against cyber attacks is that it may not always be possible to anticipate, detect or recognize threats to JPMorgan Chase’s systems, or to implement effective preventive measures against all breaches because:
•the techniques used in cyber attacks evolve frequently and are increasingly sophisticated, and therefore may not be recognized until launched or may go undetected for extended periods
•cyber attacks can originate from a wide variety of sources, including JPMorgan Chase’s own employees, cyber-criminals, hacktivists, well-resourced groups linked to terrorist organizations or hostile nation-states that can sustain malicious activities for extended periods, or third parties whose objective is to disrupt the operations of financial institutions more generally
•JPMorgan Chase does not have control over the cybersecurity of the systems of the large number of clients, customers, counterparties and third-party service providers with which it does business, and
•it is possible that a third party, after establishing a foothold on an internal network without being detected, may gain access to other networks and systems.
The risk of a security breach due to a cyber attack could increase in the future due to factors such as:
•JPMorgan Chase’s ongoing expansion of its mobile banking and other internet-based product offerings and its internal use of internet-based products and applications, including those that use cloud computing services
•advances in artificial intelligence, such as the use of machine learning and generative artificial intelligence by malicious actors to develop more advanced social engineering attacks, including targeted phishing attacks
•the inability to maintain the security of information transmitted by JPMorgan Chase due to advances in quantum computing that may counteract or nullify existing information protections, and
•the acquisition and integration of new businesses.
22 | ||||||||
In addition, a third party could misappropriate confidential information obtained by intercepting signals or communications from mobile devices used by JPMorgan Chase’s employees.
The dynamic nature of the cyber threat landscape necessitates continuous enhancement and adaptation of cybersecurity controls. Failure to discover or address known vulnerabilities or shortcomings in cybersecurity controls, or to prioritize or complete enhancements to address them, in each case in a timely manner, may leave JPMorgan Chase vulnerable to cyber attacks, potentially resulting in data breaches, financial losses, reputational damage and regulatory penalties, including the failure to prioritize or complete enhancements relating to:
•preventing unauthorized access and protecting against the misuse of access, including the maintenance and enhancement of controls related to secure software development practices and identity and access management, such as those relating to the management of administrative access to systems
•detecting, escalating and addressing effectively and in a timely manner any vulnerabilities that may be present either in internally-developed software or externally-provided software or services, including vulnerabilities that could allow attackers to exploit unknown security flaws in software and hardware (“zero-day vulnerabilities”)
•enhancing early detection of attacks against third-party vendors, including attacks targeting vulnerabilities in third-party open-source software, in support of the secure development and maintenance of internal systems
•maintaining and enhancing controls related to technology asset management and inventory systems to prevent the risk of undetected vulnerabilities that could undermine JPMorgan Chase’s ability to operate an effective control process
•upgrading the coverage and capabilities of systems and controls to protect JPMorgan Chase and its clients and customers from the impact of distributed denial-of-service attacks, or to recover from outages that could be caused by a malware or ransomware attack
•strengthening network security and management of outbound connections to reduce the risk of data loss
•identifying, assessing and mitigating insider threat activities that could lead to the misuse of JPMorgan Chase’s systems or client and customer information, and
•integrating acquired businesses where system integration may be complex or may require extensive and lengthy remediation or enhancement of controls.
A successful penetration or circumvention of the security of JPMorgan Chase’s systems or the systems of a vendor, governmental body or another market participant could cause serious negative consequences, including:
•significant disruption of JPMorgan Chase’s operations and those of its clients, customers and counterparties, including losing access to operational systems
•misappropriation of confidential information of JPMorgan Chase or that of its clients, customers, counterparties, employees or regulators
•disruption of or damage to JPMorgan Chase’s systems and those of its clients, customers and counterparties
•the inability, or extended delays in the ability, to fully recover and restore data that has been stolen, manipulated or destroyed, or the inability to prevent systems from processing fraudulent transactions
•demands that JPMorgan Chase pay a ransom to a malicious actor that has perpetrated a cybersecurity breach
•unintended violations by JPMorgan Chase of applicable privacy and other laws
•financial loss to JPMorgan Chase or to its clients, customers, counterparties or employees
•loss of confidence in JPMorgan Chase’s cybersecurity and business resiliency measures
•dissatisfaction among JPMorgan Chase’s clients, customers or counterparties
•significant exposure to litigation and regulatory fines, penalties or other sanctions, and
•harm to JPMorgan Chase’s reputation.
The extent of a particular cyber attack, the methods and tools used by various actors, and the steps that JPMorgan Chase may need to take to investigate the attack may not be immediately clear, and it may take a significant amount of time before such an investigation can be completed. While such an investigation is ongoing, JPMorgan Chase may not necessarily know the full extent of the harm caused by the cyber attack, and that damage may continue to spread. These factors may inhibit JPMorgan Chase’s ability to provide rapid, full and reliable information about the cyber attack to its clients, customers, counterparties and regulators, as well as the public. Furthermore, it may not be clear how best to contain and remediate the harm caused by the cyber attack, and certain errors or actions could be repeated or compounded before they are discovered and remediated. Any or all of these factors could further increase the costs and consequences of a cyber attack.
JPMorgan Chase can be negatively affected if it fails to identify and address operational risks associated with the introduction of or changes to products, services and delivery platforms or the adoption of new technologies.
When JPMorgan Chase launches a new product or service, introduces a new platform for the delivery or distribution of products or services (including mobile connectivity, electronic trading and cloud computing), acquires or invests in a business, makes changes to an existing product, service
23 | ||||||||
Part I
or delivery platform, or adopts a new technology, it may not fully appreciate or identify new operational risks that may arise from those changes, including increased reliance on third party providers, or may fail to implement adequate controls to mitigate the risks associated with those changes. Any significant failure in this regard could diminish JPMorgan Chase’s ability to operate one or more of its businesses or result in:
•potential liability to clients, counterparties and customers
•higher compliance and operational cost
•higher litigation costs, including regulatory fines, penalties and other sanctions
•damage to JPMorgan Chase’s reputation
•impairment of JPMorgan Chase’s liquidity
•regulatory intervention, or
•weaker competitive standing.
Any of the foregoing consequences could materially and adversely affect JPMorgan Chase’s businesses and results of operations.
JPMorgan Chase’s business and operations rely on its ability, and the ability of key external parties, to maintain appropriately-staffed workforces, and on the competence, trustworthiness, health and safety of employees.
JPMorgan Chase’s ability to operate its businesses efficiently and profitably, to offer products and services that meet the expectations of its clients and customers, and to maintain an effective risk management framework is highly dependent on its ability to staff its operations appropriately and on the competence, trustworthiness, health and safety of its employees. JPMorgan Chase's businesses and operations similarly rely on the workforces of third parties, including employees of vendors, custodians and financial markets infrastructures, and of businesses that it may seek to acquire. JPMorgan Chase’s businesses could be materially and adversely affected by:
•the ineffective implementation of business decisions
•any failure to institute controls that appropriately address risks associated with business activities, or to appropriately train employees with respect to those risks and controls
•staffing shortages, particularly in tight labor markets
•the possibility that significant portions of JPMorgan Chase’s workforce are unable to work effectively, including because of illness, quarantines, shelter-in-place arrangements, government actions or other restrictions in connection with health emergencies, the spread of infectious diseases, epidemics or pandemics, or due to extraordinary events beyond JPMorgan Chase’s control such as natural disasters or an outbreak or escalation of hostilities
•a significant operational breakdown or failure, theft, fraud or other unlawful conduct, or
•other negative outcomes caused by human error or misconduct by an employee of JPMorgan Chase or of another party on which JPMorgan Chase’s businesses or operations rely.
JPMorgan Chase’s operations could also be impaired if the measures taken by it or by governmental authorities to protect the health and safety of its employees are ineffective, or if any external party on which JPMorgan Chase relies fails to take appropriate and effective actions to protect the health and safety of its employees.
JPMorgan Chase faces substantial legal and operational risks in the processing and safeguarding of personal information.
JPMorgan Chase’s businesses and operations are subject to complex and evolving laws, rules and regulations, both within and outside the U.S., governing the privacy and protection of personal information of individuals. Governmental authorities around the world have adopted and are considering the adoption of numerous legislative and regulatory initiatives concerning privacy, data protection and security. Litigation or enforcement actions relating to these laws, rules and regulations could result in
fines or orders requiring that JPMorgan Chase change its data-related practices, which could have an adverse effect on JPMorgan Chase’s ability to provide products and otherwise harm its business operations.
Implementing processes relating to JPMorgan Chase’s collection, use, sharing and storage of personal information to comply with all applicable laws, rules and regulations in all relevant jurisdictions, including where the laws of different jurisdictions are in conflict, can:
•increase JPMorgan Chase’s compliance and operating costs
•hinder the development of new products or services, curtail the offering of existing products or services, or affect how products and services are offered to clients and customers
•demand significant oversight by JPMorgan Chase’s management, and
•require JPMorgan Chase to structure its businesses, operations and systems in less efficient ways.
Not all of JPMorgan Chase’s clients, customers, vendors, counterparties and other external parties may have appropriate controls in place to protect the confidentiality, integrity or availability of the information exchanged between them and JPMorgan Chase, particularly where information is transmitted by electronic means. JPMorgan Chase could be exposed to litigation or regulatory fines, penalties or other sanctions if personal information of clients, customers, employees or others were to be mishandled or misused, such as situations where such information is:
24 | ||||||||
•erroneously provided to parties who are not permitted to have the information, or
•intercepted or otherwise compromised by unauthorized third parties.
Concerns regarding the effectiveness of JPMorgan Chase’s measures to safeguard personal information, or the perception that those measures are inadequate, could cause JPMorgan Chase to lose existing or potential clients and customers or employees, and thereby reduce JPMorgan Chase’s revenues. Furthermore, any failure or perceived failure by JPMorgan Chase to comply with applicable privacy or data protection laws, rules and regulations, or any failure to appropriately calibrate, manage and monitor access by employees or third parties to personal information, could subject JPMorgan Chase to inquiries, examinations and investigations that could result in requirements to modify or cease certain operations or practices, significant liabilities or regulatory fines, penalties or other sanctions. Any of these could damage JPMorgan Chase’s reputation and otherwise adversely affect its businesses.
In recent years, well-publicized incidents involving the inappropriate collection, use, sharing or storage of personal information have led to expanded governmental scrutiny of practices relating to the processing or safeguarding of personal information by companies in the U.S. and other countries. That scrutiny has in some cases resulted in, and could in the future lead to, the adoption of stricter laws, rules and regulations relating to the collection, use, sharing and storage of personal information. These types of laws, rules and regulations can prohibit or significantly restrict financial services firms such as JPMorgan Chase from transferring information across national borders or sharing information among affiliates or with third parties such as vendors, thereby increase compliance costs and operational risk, or restrict JPMorgan Chase’s use of personal information when developing or offering products or services to customers. Some countries are considering or have adopted legislation implementing data protection requirements or requiring local storage and processing of data which could increase the cost and complexity of JPMorgan Chase’s delivery of products and services. These restrictions could also inhibit JPMorgan Chase’s development or marketing of certain products or services, or increase the costs of offering them to customers.
JPMorgan Chase’s operations, results and reputation could be harmed by occurrences of extraordinary events beyond its control.
JPMorgan Chase’s business and operational systems could be seriously disrupted, and its reputation could be harmed, by events or contributing factors that are wholly or partially beyond its control, including material instances of:
•cyber attacks
•security breaches of its physical premises, including threats to health and safety
•power, telecommunications or internet outages, or shutdowns of mass transit
•failure of, or loss of access to, technology or operational systems, including any resulting loss of critical data
•damage to or loss of property or assets of JPMorgan Chase or third parties, and any consequent injuries, including in connection with any construction projects undertaken by JPMorgan Chase
•effects of climate change
•natural disasters or severe weather conditions
•accidents such as explosions or structural failures
•health emergencies, the spread of infectious diseases, epidemics or pandemics, or
•events arising from local or larger-scale civil or political unrest, any outbreak or escalation of hostilities, or terrorist acts.
JPMorgan Chase maintains a Firmwide resiliency program that is designed to enable it to prepare for, adapt to, withstand and recover from business disruptions that may impact critical business functions and supporting assets, including staff, technology, third party service providers and facilities, in the event of a business disruption, including due to the occurrence of an extraordinary event beyond its control. There can be no assurance that JPMorgan Chase’s resiliency plans will fully mitigate all potential business resiliency risks to JPMorgan Chase, its clients, and customers and third parties with which it does business, or that its resiliency plans will be adequate to address the effects of simultaneous occurrences of multiple business disruption events. In addition, JPMorgan Chase’s ability to respond effectively to a business disruption event could be hampered to the extent that the members of its workforce, physical assets or systems and other support infrastructure needed to address the event are geographically dispersed, or conversely, if such an event were to occur in an area in which they are concentrated. Further, should extraordinary events or the factors that cause or contribute to those events become more chronic, the disruptive effects of those events on JPMorgan Chase’s business and operations, and on its clients, customers, counterparties and employees, could become more significant and long-lasting.
Any significant failure or disruption of JPMorgan Chase’s operations or operational systems, or the occurrence of one or more extraordinary events that are beyond its control, could:
•hinder JPMorgan Chase’s ability to provide services to its clients and customers or to transact with its counterparties
•require it to expend significant resources to correct the failure or disruption or to address the event
•cause it to incur losses or liabilities, including from loss of revenue, damage to or loss of property, or injuries
25 | ||||||||
Part I
•disrupt market infrastructure systems on which JPMorgan Chase’s businesses rely
•expose it to litigation or regulatory fines, penalties or other sanctions, and
•harm its reputation.
The occurrence of one or more extraordinary events could also negatively impact the financial condition or creditworthiness of JPMorgan Chase’s clients and customers, and could lead to an increase in delinquencies, additions to the allowance for credit losses and higher net charge-offs, which can reduce JPMorgan Chase’s earnings.
JPMorgan Chase’s acquisition of certain assets and liabilities of First Republic Bank may not result in all of the benefits anticipated.
On May 1, 2023, JPMorgan Chase Bank, N.A. acquired certain assets and assumed certain liabilities of First Republic Bank from the FDIC (the “First Republic acquisition”). Actual results associated with the First Republic acquisition may differ from the anticipated positive results, including with respect to:
•the settlement of the final purchase price
•the total cost of integration
•the time required to complete the integration
•the overall performance of the assets and liabilities acquired in the First Republic acquisition, or
•an improved price for JPMorgan Chase’s common stock.
Integration of an acquired business can be complex and costly, and involves the combination of relevant accounting and data processing systems and management controls, as well as managing relevant relationships with employees, clients, suppliers and other business partners. The integration process could result in the disruption of ongoing businesses or inconsistencies in standards, controls, procedures and policies that could adversely affect JPMorgan Chase’s ability to maintain relationships with clients and customers. In addition, the loss of key employees in connection with the First Republic acquisition could adversely affect JPMorgan Chase’s ability to successfully conduct its business.
JPMorgan Chase could also incur unanticipated costs or losses in connection with the First Republic acquisition, including if JPMorgan Chase fails to comply with the conditions of the shared-loss agreements with the FDIC related to certain loans and lending-related commitments, which could diminish the coverage of the credit losses these agreements are designed to provide.
Enhanced regulatory and other standards for the oversight of vendors and other service providers can result in higher costs and other potential exposures.
JPMorgan Chase must comply with enhanced regulatory and other standards associated with doing business with vendors and other service providers, including standards
relating to the outsourcing of functions as well as the performance of significant banking and other functions by subsidiaries. JPMorgan Chase incurs significant costs and expenses in connection with its initiatives to address the risks associated with oversight of its internal and external service providers. JPMorgan Chase’s failure to appropriately assess and manage these relationships, especially those involving significant banking functions, shared services or other critical activities, could materially adversely affect JPMorgan Chase. Specifically, any such failure could result in:
•potential harm to clients and customers, and any liability associated with that harm
•regulatory fines, penalties or other sanctions
•lower revenues, and the opportunity cost from lost revenues
•increased operational costs, or
•harm to JPMorgan Chase’s reputation.
JPMorgan Chase’s risk management framework and control environment may not be effective in identifying and mitigating every risk to JPMorgan Chase.
Any inadequacy or lapse in JPMorgan Chase’s risk management framework, governance structure, practices, models or reporting systems, or in its control environment could expose it to unexpected losses, and its financial condition or results of operations could be materially and adversely affected. Any such inadequacy or lapse could:
•hinder the timely escalation of material risk issues to JPMorgan Chase’s senior management and Board of Directors
•lead to business decisions that have negative outcomes for JPMorgan Chase
•require significant resources and time to remediate
•lead to non-compliance with laws, rules and regulations
•attract heightened regulatory scrutiny
•expose JPMorgan Chase to litigation, regulatory investigations or regulatory fines, penalties or other sanctions
•lead to potential harm to customers and clients, and any liability associated with that harm
•harm its reputation, or
•otherwise diminish confidence in JPMorgan Chase.
JPMorgan Chase relies on data to assess its various risk exposures. Any deficiencies in the accuracy, timeliness or completeness of data, or the effectiveness of JPMorgan Chase’s data gathering, analysis and validation processes could result in ineffective risk management practices. These deficiencies could also result in inaccurate or untimely risk reporting.
26 | ||||||||
Many of JPMorgan Chase’s risk management strategies and techniques consider historical market behavior and to some degree are based on management’s subjective judgment or assumptions. For example, many models used by JPMorgan Chase are based on assumptions regarding historical correlations among prices of various asset classes or other market indicators. In times of market stress, including difficult or less liquid market environments, or in the event of other unforeseen circumstances, previously uncorrelated indicators may become correlated. Conversely, previously-correlated indicators may become uncorrelated at those times. Sudden market movements and unanticipated market or economic movements could, in some circumstances, limit the effectiveness of JPMorgan Chase’s risk management strategies, causing it to incur losses.
JPMorgan Chase could recognize unexpected losses, its capital levels could be reduced and it could face greater regulatory scrutiny if its models, estimations or judgments, including those used in its financial statements, are inadequate or incorrect.
JPMorgan Chase has developed and uses a variety of models and other analytical and judgment-based estimations to measure, monitor and implement controls over its market, credit, capital, liquidity, operational and other risks. JPMorgan Chase also uses internal models and estimations as a basis for its stress testing and in connection with the preparation of its financial statements under U.S. generally accepted accounting principles (“U.S. GAAP”).
These models and estimations are based on a variety of assumptions and historical trends, and are periodically reviewed and modified as necessary. The models and estimations that JPMorgan Chase uses, including those that use machine learning, artificial intelligence or quantum computing, may not be effective in all cases to identify, observe and mitigate risk due to a variety of factors, such as:
•reliance on historical trends that may not persist in the future, including assumptions underlying the models and estimations such as correlations among certain market indicators or asset prices
•inherent limitations associated with forecasting uncertain economic and financial outcomes
•historical trend information may be incomplete, or may not be indicative of severely negative market conditions such as extreme volatility, dislocation or lack of liquidity
•sudden illiquidity in markets or declines in prices of certain loans and securities may make it more difficult to value certain financial instruments
•technology that is introduced to run models or estimations may not perform as expected, or may not be well understood by the personnel using the technology
•models and estimations may contain erroneous data, valuations, formulas or algorithms, and
•review processes may fail to detect flaws in models and estimations.
JPMorgan Chase may experience unexpected losses if models, estimates or judgments used or applied in connection with its risk management activities or the preparation of its financial statements are inadequate or incorrect. For example, where quoted market prices are not available for certain financial instruments that require a determination of their fair value, JPMorgan Chase may make fair value determinations based on internally developed models or other means which ultimately rely to some degree on management estimates and judgment. In addition, JPMorgan Chase may experience increased uncertainty in its estimates if assets acquired differ from those used to develop those models, which may lead to unexpected losses.
Similarly, JPMorgan Chase establishes an allowance for expected credit losses related to its credit exposures which requires significant judgments, including forecasts of how macroeconomic conditions might impair the ability of JPMorgan Chase’s clients and customers to repay their loans or other obligations. These types of estimates and judgments may not prove to be accurate due to a variety of factors, including when the current and forecasted environments are significantly different from the historical environments upon which the models were developed. The increased uncertainty may necessitate a greater degree of judgment and analytics to inform any adjustments that JPMorgan Chase may make to model outputs than would otherwise be the case.
Some of the models and other analytical and judgment-based estimations used by JPMorgan Chase in managing risks are subject to review by, and require the approval of, JPMorgan Chase’s regulators. These reviews are required before JPMorgan Chase may use those models and estimations for calculating market risk RWA, credit risk RWA and operational risk RWA under Basel III. If JPMorgan Chase’s models or estimations are not approved by its regulators, it may be subject to higher capital charges, which could adversely affect its financial results or limit the ability to expand its businesses.
Lapses in controls over disclosure or financial reporting could materially affect JPMorgan Chase’s profitability or reputation.
JPMorgan Chase’s businesses and operations are subject to complex and evolving laws, rules and regulations, both within and outside the U.S., requiring continuous enhancements to various disclosures in its financial statements and regulatory reports.
There can be no assurance that JPMorgan Chase’s disclosure controls and procedures will be effective in every circumstance, or that a material weakness or significant deficiency in internal control over financial reporting will not occur. Any such lapses or deficiencies could result in inaccurate financial reporting which, in turn, could:
27 | ||||||||
Part I
•materially and adversely affect JPMorgan Chase’s business and results of operations or financial condition
•restrict its ability to access the capital markets
•require it to expend significant resources to correct the lapses or deficiencies
•expose it to litigation or regulatory fines, penalties or other sanctions
•harm its reputation, or
•otherwise diminish investor confidence in JPMorgan Chase.
Strategic
If JPMorgan Chase’s management fails to develop and execute effective business strategies, and to anticipate changes affecting those strategies, JPMorgan Chase’s competitive standing and results could suffer.
JPMorgan Chase’s business strategies significantly affect its competitive standing and operations. These strategies relate to:
•the products and services that JPMorgan Chase offers
•the geographies in which it operates
•the types of clients and customers that it serves
•the businesses that it acquires or in which it invests
•the counterparties with which it does business, and
•the methods, distribution channels and third party service providers by or through which it offers products and services.
If management makes choices about these strategies and goals that prove to be incorrect, are based on incomplete, inaccurate or fraudulent information, do not accurately assess the competitive landscape and industry trends, or fail to address changing regulatory and market environments or the expectations of clients, customers, investors, employees and other stakeholders, then the franchise values and growth prospects of JPMorgan Chase’s businesses may suffer and its earnings could decline.
JPMorgan Chase’s growth prospects also depend on management’s ability to develop and execute effective business plans to address these strategic priorities, both in the near term and over longer time horizons. Management’s effectiveness in this regard will affect JPMorgan Chase’s ability to develop and enhance its resources, control expenses and return capital to shareholders. Each of these objectives could be adversely affected by any failure on the part of management to:
•devise effective business plans and strategies
•offer products and services that meet changing expectations of clients and customers
•allocate capital in a manner that promotes long-term stability to enable JPMorgan Chase to build and invest in
market-leading businesses, even in a highly stressed environment
•allocate capital appropriately due to imprecise modeling or subjective judgments made in connection with those allocations
•appropriately assess and monitor principal investments made to enhance or accelerate JPMorgan Chase's business strategies
•conduct appropriate due diligence on prospective business acquisitions or investments, or effectively integrate newly-acquired businesses
•appropriately address concerns of clients, customers, investors, employees and other stakeholders, including with respect to climate and other ESG matters
•react quickly to changes in market conditions or market structures, or
•develop and enhance the operational, technology, risk, financial and managerial resources necessary to grow and manage JPMorgan Chase’s businesses.
Furthermore, JPMorgan Chase may incur costs in connection with disposing of excess properties, premises and facilities, and those costs could be material to its results of operations.
JPMorgan Chase faces significant and increasing competition in the rapidly evolving financial services industry.
JPMorgan Chase operates in a highly competitive environment in which it must evolve and adapt to changes in financial regulation, technological advances, increased public scrutiny and changes in economic conditions. JPMorgan Chase expects that competition in the U.S. and global financial services industry will continue to be intense. Competitors include:
•other banks and financial institutions
•trading, advisory and investment management firms
•finance companies
•technology companies, and
•other non-bank firms that are engaged in providing similar as well as new products and services.
JPMorgan Chase cannot provide assurance that the significant competition in the financial services industry will not materially and adversely affect its future results of operations. For example, aggressive or less disciplined lending practices by non-bank competitors could lead to a loss of market share for traditional banks, and in an economic downturn could result in instability in the financial services industry and adversely impact other market participants, including JPMorgan Chase.
New competitors in the financial services industry continue to emerge. For example, technological advances and the growth of e-commerce have made it possible for non-
28 | ||||||||
depository institutions to offer products and services that traditionally were banking products. These advances have also allowed financial institutions and other companies to provide electronic and internet-based financial solutions, including electronic securities and cryptocurrency trading, lending and other extensions of credit to consumers, payments processing and online automated algorithmic-based investment advice. Furthermore, both financial institutions and their non-banking competitors face the risk that payments processing and other products and services, including deposits and other traditional banking products, could be significantly disrupted by the use of new technologies, such as cryptocurrencies and other applications using secure distributed ledgers, that may not require intermediation. New technologies have required and could require JPMorgan Chase to spend more to modify or adapt its products to attract and retain clients and customers or to match products and services offered by its competitors, including technology companies. In addition, new technologies may be used by customers, or breached or infiltrated by third parties, in unexpected ways, which can increase JPMorgan Chase’s costs for complying with laws, rules and regulations that apply to the offering of products and services through those technologies and reduce the income that JPMorgan Chase earns from providing products and services through those technologies.
Ongoing or increased competition may put pressure on the pricing for JPMorgan Chase’s products and services or may cause JPMorgan Chase to lose market share, particularly with respect to traditional banking products. This competition may be based on quality and variety of products and services offered, transaction execution, innovation, reputation and price. The failure of any of JPMorgan Chase’s businesses to meet the expectations of clients and customers, whether due to general market conditions, under-performance, a decision not to offer a particular product or service, changes in client and customer expectations or other factors, could affect JPMorgan Chase’s ability to attract or retain clients and customers. Any such impact could, in turn, reduce JPMorgan Chase’s revenues. Increased competition also may require JPMorgan Chase to make additional capital investments in its businesses, or to extend more of its capital on behalf of its clients to remain competitive.
The effects of climate change could adversely affect JPMorgan Chase’s business and operations, both directly and as a result of impacts on its clients and customers.
JPMorgan Chase operates in many regions, countries and communities around the world where its business, and the activities of its clients and customers, could be adversely affected by climate change. Climate change could manifest as a financial risk to JPMorgan Chase either through changes in the physical climate or from the process of transitioning to a low-carbon economy. Both physical risks and transition risks associated with climate change could have negative impacts on the financial condition or
creditworthiness of JPMorgan’s clients and customers, and on its exposure to those clients and customers.
Physical risks include the increased frequency or severity of acute weather events, such as floods, wildfires and tropical cyclones, and chronic shifts in the climate, such as persistent changes in precipitation levels, rising sea levels, or increases in average ambient temperature. Potential adverse impacts of climate-related physical risks include:
•declines in asset values, including due to the destruction or degradation of property
•reduced availability or increased cost of insurance for clients of JPMorgan Chase
•interruptions to business operations, including supply chain disruption, and
•population migration or unemployment in affected regions.
Transition risks arise from societal adjustment to a low-carbon economy, such as changes in public policy, adoption of new technologies or changes in consumer preferences towards low-carbon goods and services. These risks could also be influenced by changes in the physical climate. Potential adverse impacts of transition risks include:
•sudden devaluation of assets, including unanticipated write-downs (“stranded assets”)
•increased operational and compliance costs driven by changes in climate policy
•increased energy costs driven by governmental actions and initiatives such as emission pricing and accelerated decarbonization policies
•negative consequences to business models, and the need to make changes in response to those consequences, and
•damage to JPMorgan Chase’s reputation, including due to any perception that its business practices are contrary to public policy or the preferences of different stakeholders.
Climate risks can also arise from inconsistencies and conflicts in the manner in which climate policy and financial regulations are implemented in the many regions where JPMorgan Chase operates, including initiatives to apply and enforce policy and regulation with extraterritorial effect. Additionally, internal models and estimations used in climate risk assessments have an increased level of uncertainty due to limited historical trend information and the absence of standardized, reliable and comprehensive greenhouse gas emissions data, which could lead to inaccurate disclosures or financial reporting.
Conduct
Conduct failure by JPMorgan Chase employees can harm clients and customers, impact market integrity, damage JPMorgan Chase’s reputation and trigger litigation and regulatory action.
29 | ||||||||
Part I
JPMorgan Chase’s employees interact with clients, customers, counterparties and other market and industry participants, and with each other, every day. All employees are expected to demonstrate values and exhibit the behaviors that are an integral part of JPMorgan Chase’s Code of Conduct and Business Principles, including JPMorgan Chase’s commitment to “do first class business in a first class way.” JPMorgan Chase endeavors to embed conduct risk management throughout an employee’s life cycle, including recruiting, onboarding, training and development, and performance management. Conduct risk management is also an integral component of JPMorgan Chase’s promotion and compensation processes.
Notwithstanding these expectations, policies and practices, certain employees have engaged in improper or illegal conduct in the past. These instances of misconduct have resulted in litigation, and resolutions of governmental investigations or enforcement actions involving consent orders, deferred prosecution agreements, non-prosecution agreements and other civil or criminal sanctions. There is no assurance that further inappropriate or unlawful actions by employees have not occurred or will not occur, lead to a violation of the terms of these resolutions (and associated consequences), or that any such actions will always be detected, deterred or prevented.
JPMorgan Chase’s reputation could be harmed, and collateral consequences could result, from a failure by one or more employees to conduct themselves in accordance with JPMorgan Chase’s expectations, policies and practices, including by acting in ways that harm clients, customers, other market participants, employees or others. Some examples of this include:
•improperly selling and marketing JPMorgan Chase’s products or services
•engaging in insider trading, market manipulation or unauthorized trading
•engaging in improper or fraudulent behavior in connection with government relief programs
•facilitating a transaction where a material objective is to achieve a particular tax, accounting or financial disclosure treatment that may be subject to scrutiny by governmental or regulatory authorities, or where the proposed treatment is unclear or may not reflect the economic substance of the transaction
•failing to fulfill fiduciary obligations or other duties owed to clients or customers
•violating antitrust or anti-competition laws by colluding with other market participants
•using electronic communications channels that have not been approved by JPMorgan Chase
•engaging in discriminatory behavior or harassment with respect to clients, customers or employees, or acting contrary to JPMorgan Chase’s goal of fostering a diverse and inclusive workplace
•managing or reporting risks in ways that subordinate JPMorgan Chase’s risk appetite to business performance goals or employee compensation objectives, and
•misappropriating property, confidential or proprietary information, or technology assets belonging to JPMorgan Chase, its clients and customers or third parties.
The consequences of any failure by one or more employees to conduct themselves in accordance with JPMorgan Chase’s expectations, policies or practices could include litigation, or regulatory or other governmental investigations or enforcement actions. Any of these proceedings or actions could result in judgments, settlements, fines, penalties or other sanctions, or lead to:
•financial losses
•increased operational and compliance costs
•greater scrutiny by regulators and other parties
•regulatory actions that require JPMorgan Chase to restructure, curtail or cease certain of its activities
•the need for significant oversight by JPMorgan Chase’s management
•loss of clients or customers, and
•harm to JPMorgan Chase’s reputation.
The foregoing risks could be heightened with respect to newly-acquired businesses if JPMorgan Chase fails to successfully integrate employees of those businesses or any of those employees do not conduct themselves in accordance with JPMorgan Chase's expectations, policies and practices.
Reputation
Damage to JPMorgan Chase’s reputation could harm its businesses.
Maintaining trust in JPMorgan Chase is critical to its ability to attract and retain clients, customers, investors and employees. Damage to JPMorgan Chase’s reputation can therefore cause significant harm to JPMorgan Chase’s business and prospects, and can arise from numerous sources, including:
•employee misconduct, including discriminatory behavior or harassment with respect to clients, customers or employees, or actions that are contrary to JPMorgan Chase’s goal of fostering a diverse and inclusive workplace
•security breaches, including as a result of cyber attacks
•failure to safeguard client, customer or employee information
•failure to manage risks associated with its client relationships, or with transactions or business activities in which JPMorgan Chase or its clients engage, including transactions or activities that may be unpopular among one or more constituencies
30 | ||||||||
•failure to meet publicly-announced commitments to support ESG initiatives
•non-compliance with laws, rules, and regulations
•operational failures
•litigation or regulatory fines, penalties or other sanctions
•actions taken in executing regulatory and governmental requirements during a global or regional health emergency, spread of infectious disease, epidemic or pandemic
•regulatory investigations or enforcement actions, or resolutions of these matters, and
•failure or perceived failure to comply with laws, rules or regulations by JPMorgan Chase or its clients, customers, counterparties or other parties, including newly-acquired businesses, companies in which JPMorgan Chase has made principal investments, parties to joint ventures with JPMorgan Chase, and vendors with which JPMorgan Chase does business.
JPMorgan Chase’s reputation may be significantly damaged by adverse publicity or negative information regarding JPMorgan Chase, whether or not true, that may be published or broadcast by the media or posted on social media, non-mainstream news services or other parts of the internet, or that may be disseminated through disinformation campaigns targeted at JPMorgan Chase. This latter risk can be magnified by the speed and pervasiveness with which information is disseminated through those channels.
Social and environmental activists have been increasingly targeting JPMorgan Chase and other financial services firms with public criticism concerning their business practices, including business relationships with clients that are engaged in certain sensitive industries, such as companies:
•whose products are or are perceived to be harmful to human health, or
•whose activities negatively affect or are perceived to negatively affect the environment, workers’ rights or communities.
Activists have also taken actions intended to change or influence JPMorgan Chase’s business practices with respect to ESG matters, including public protests at JPMorgan Chase’s headquarters and other properties, and submitting specific ESG-related proposals for a vote by JPMorgan Chase’s shareholders.
In addition, JPMorgan Chase and other companies have been and continue to be criticized by activists, politicians and other members of the public concerning positions taken with respect to matters of public policy. These criticisms can be more widespread during election years in various jurisdictions, and could have the effect of focusing attention on a company such as JPMorgan Chase as part of a wider public debate on public policy matters.
These and other types of criticism and actions directed at JPMorgan Chase could potentially engender dissatisfaction among clients, customers, investors, employees, government officials and other stakeholders. In all of these cases, JPMorgan Chase’s reputation and its business and results of operations could be harmed by:
•greater scrutiny from governmental or regulatory bodies, or further criticism from politicians and other members of the public
•unfavorable coverage or commentary in the media, including through social media campaigns
•certain clients and customers ceasing doing business with JPMorgan Chase, and encouraging others to do so
•impairment of JPMorgan Chase’s ability to attract new clients and customers, to expand its relationships with existing clients and customers, or to hire or retain employees, or
•certain investors opting to divest from investments in securities of JPMorgan Chase.
Actions by the financial services industry generally or individuals in the industry can also affect JPMorgan Chase’s reputation. For example, the reputation of the industry as a whole can be damaged by concerns that:
•consumers have been treated unfairly by a financial institution, or
•a financial institution has acted inappropriately with respect to the methods used to offer products to customers.
If JPMorgan Chase is perceived to have engaged in these types of behaviors, this could weaken its reputation among clients or customers, employees or other stakeholders.
Failure to effectively manage potential conflicts of interest or to satisfy fiduciary obligations can result in litigation and enforcement actions, as well as damage JPMorgan Chase’s reputation.
JPMorgan Chase’s ability to manage potential conflicts of interest is highly complex due to the broad range of its business activities which encompass a variety of transactions, obligations and interests with and among JPMorgan Chase’s clients and customers. JPMorgan Chase can become subject to litigation, enforcement actions, and heightened regulatory scrutiny, and its reputation can be damaged, by the failure or perceived failure to:
•adequately address or appropriately disclose conflicts of interest, including potential conflicts of interest that may arise in connection with providing multiple products and services in, or having one or more investments related to, the same transaction
•identify and address any conflict of interest that a third party with which it is does business may have with respect to a transaction involving JPMorgan Chase
•deliver appropriate standards of service and quality
31 | ||||||||
Part I
•treat clients and customers fairly and with the appropriate standard of care
•use client and customer data responsibly and in a manner that meets legal requirements and regulatory expectations
•provide fiduciary products or services in accordance with the applicable legal and regulatory standards, or
•handle or use confidential information of customers or clients appropriately and in compliance with applicable data protection and privacy laws, rules and regulations.
A failure or perceived failure to appropriately address conflicts of interest or fiduciary obligations could result in customer dissatisfaction, litigation and regulatory fines, penalties or other sanctions, and heightened regulatory scrutiny and enforcement actions, all of which can lead to lost revenue and higher operating costs and cause serious harm to JPMorgan Chase’s reputation.
Country
An outbreak or escalation of hostilities between countries or within a country or region could have a material adverse effect on the global economy and on JPMorgan Chase’s businesses within the affected region or globally.
Aggressive actions by hostile governments or groups, including armed conflict or intensified cyber attacks, could expand in unpredictable ways by drawing in other countries or escalating into full-scale war with potentially catastrophic consequences, particularly if one or more of the combatants possess nuclear weapons. Depending on the scope of the conflict, the hostilities could result in:
•worldwide economic disruption
•heightened volatility in financial markets
•severe declines in asset values, accompanied by widespread sell-offs of investments
•sudden increases in prices in the energy and commodity markets or for certain safe haven currencies
•substantial depreciation of local currencies, potentially leading to defaults by borrowers and counterparties in the affected region
•disruption of global trade, and
•diminished consumer, business and investor confidence.
Any of the above consequences could have significant negative effects on JPMorgan Chase’s operations and earnings, both in the countries or regions directly affected by the hostilities or globally. Further, if the U.S. were to become directly involved in such a conflict, this could lead to a curtailment of any operations that JPMorgan Chase may have in the affected countries or region, as well as in any nation that is aligned against the U.S. in the hostilities. JPMorgan Chase could also experience more numerous and aggressive cyber attacks launched by or under the
sponsorship of one or more of the adversaries in such a conflict.
JPMorgan Chase’s business and operations in certain countries can be adversely affected by local economic, political, regulatory and social factors.
Some of the countries in which JPMorgan Chase conducts business have economies or markets that are less developed and more volatile or may have political, legal and regulatory regimes that are less established or predictable than other countries in which JPMorgan Chase operates. In addition, in some jurisdictions in which JPMorgan Chase conducts business, the local economy and business activities are subject to substantial government influence or control. Some of these countries have in the past experienced economic disruptions, including:
•extreme currency fluctuations
•high inflation
•low or negative growth
•defaults or reduced ability to service sovereign debt and
•increased fraud or other misrepresentation of value.
The governments in these countries have sometimes reacted to these developments by imposing restrictive policies that adversely affect the local and regional business environment, such as:
•price, capital or exchange controls, including imposition of punitive transfer and convertibility restrictions or forced currency exchange
•expropriation or nationalization of assets or confiscation of property, including intellectual property, and
•changes in laws, rules and regulations.
The impact of these actions could be accentuated in trading markets that are smaller, less liquid and more volatile than more-developed markets. These types of government actions can negatively affect JPMorgan Chase’s operations in the relevant country, either directly or by suppressing the business activities of local clients or multi-national clients that conduct business in the jurisdiction.
In addition, emerging markets countries, as well as more developed countries, have been susceptible to unfavorable social developments arising from poor economic conditions or governmental actions, including:
•widespread demonstrations, civil unrest or general strikes
•crime and corruption
•security and personal safety issues
•an outbreak or escalation of hostilities, or other geopolitical instabilities
•overthrow of incumbent governments
•terrorist attacks, and
32 | ||||||||
•other forms of internal discord.
These economic, political, regulatory and social developments have in the past resulted in, and in the future could lead to, conditions that can adversely affect JPMorgan Chase’s operations in those countries and impair the revenues, growth and profitability of those operations. In addition, any of these events or circumstances in one country can affect JPMorgan Chase’s operations and investments in another country or countries, including in the U.S.
People
JPMorgan Chase’s ability to attract and retain qualified and diverse employees is critical to its success.
JPMorgan Chase’s employees are its most important resource, and in many areas of the financial services industry, competition for qualified personnel is intense. JPMorgan Chase endeavors to attract talented and diverse new employees and retain, develop and motivate its existing employees. JPMorgan Chase's efforts to hire and retain talented and diverse employees could be hindered by factors such as:
•the emerging need for more-skilled workers in an evolving labor and workplace environment, including due to changes in technology, and
•targeted recruitment of JPMorgan Chase employees by competitors.
If JPMorgan Chase were unable to continue to attract or retain qualified and diverse employees, including successors to the Chief Executive Officer, members of the Operating Committee and other senior leaders, JPMorgan Chase’s performance, including its competitive position, could be materially and adversely affected.
JPMorgan Chase’s use of hybrid work models could result in deterioration in employee performance or degradation of JPMorgan Chase's control environment which may have a material and adverse effect on its business and operations. Alternatively, discontinuing hybrid work models could harm JPMorgan Chase’s ability to attract and retain employees.
Unfavorable changes in immigration or travel policies could adversely affect JPMorgan Chase’s businesses and operations.
JPMorgan Chase relies on the skills, knowledge and expertise of employees located throughout the world. Changes in immigration or travel policies in the U.S. and other countries that unduly restrict or otherwise make it more difficult for employees or their family members to work in, or travel to or transfer between, jurisdictions in which JPMorgan Chase has operations or conducts its business could inhibit JPMorgan Chase’s ability to attract and retain qualified employees, and thereby dilute the quality of its workforce, or could prompt JPMorgan Chase to make structural changes to its worldwide or regional operating models that cause its operations to be less efficient or more costly.
Legal
JPMorgan Chase faces significant legal risks from litigation and formal and informal regulatory and government investigations.
JPMorgan Chase is named as a defendant or is otherwise involved in many legal proceedings, including class actions, derivative actions and other litigation or disputes with third parties, as well as criminal proceedings. Actions currently pending against JPMorgan Chase may result in judgments, settlements, fines, penalties or other sanctions adverse to JPMorgan Chase. Any of these matters could materially and adversely affect JPMorgan Chase’s business, financial condition or results of operations, or cause serious reputational harm. As a participant in the financial services industry, it is likely that JPMorgan Chase will continue to experience a high level of litigation and regulatory and government investigations related to its businesses and operations.
Regulators and other government agencies conduct examinations of JPMorgan Chase and its subsidiaries both on a routine basis and in targeted exams, and JPMorgan Chase’s businesses and operations are subject to heightened regulatory oversight. This heightened regulatory scrutiny, or the results of such an investigation or examination, may lead to additional regulatory investigations or enforcement actions. There is no assurance that those actions will not result in resolutions or other enforcement actions against JPMorgan Chase. Furthermore, a single event involving a potential violation of law or regulation may give rise to numerous and overlapping investigations and proceedings, either by multiple federal, state or local agencies and officials in the U.S. or, in some instances, regulators and other governmental officials in non-U.S. jurisdictions.
If another financial institution violates a law or regulation relating to a particular business activity or practice, this will often give rise to an investigation by regulators and other governmental agencies of the same or similar activity or practice by JPMorgan Chase.
These and other initiatives by U.S. and non-U.S. governmental authorities may subject JPMorgan Chase to judgments, settlements, fines, penalties or other sanctions, and may require JPMorgan Chase to restructure its operations and activities or to cease offering certain products or services. All of these potential outcomes could harm JPMorgan Chase’s reputation or lead to higher operational costs, thereby reducing JPMorgan Chase’s profitability, or result in collateral consequences. In addition, the extent of JPMorgan Chase’s exposure to legal and regulatory matters can be unpredictable and could, in some cases, exceed the amount of reserves that JPMorgan Chase has established for those matters.
33 | ||||||||
Parts I and II
Item 1B. Unresolved Staff Comments.
None.
Item 1C. Cybersecurity.
Refer to the Operational Risk Management section of Management’s discussion and analysis on pages 147–150 for a discussion of cybersecurity risk.
Item 2. Properties.
JPMorgan Chase’s headquarters is located in New York City at 383 Madison Avenue, a 47-story office building that it owns. The demolition of the Firm's former headquarters at 270 Park Avenue in New York City was completed in 2021, and construction of a new headquarters on the same site continues.
The Firm owned or leased facilities in the following locations at December 31, 2023.
| December 31, 2023 (in millions) | Approximate square footage | ||||
United States(a) | |||||
New York City, New York | |||||
383 Madison Avenue, New York, New York | 1.1 | ||||
All other New York City locations | 5.9 | ||||
Total New York City, New York | 7.0 | ||||
Other U.S. locations | |||||
Columbus/Westerville, Ohio | 3.5 | ||||
Chicago, Illinois | 2.7 | ||||
Dallas/Plano/Fort Worth, Texas | 2.5 | ||||
Wilmington/Newark, Delaware | 2.2 | ||||
Houston, Texas | 1.6 | ||||
Jersey City, New Jersey | 1.4 | ||||
Phoenix/Tempe, Arizona | 1.3 | ||||
All other U.S. locations | 34.5 | ||||
Total United States | 56.7 | ||||
Europe, the Middle East and Africa (“EMEA”) | |||||
25 Bank Street, London, U.K. | 1.4 | ||||
All other U.K. locations | 2.4 | ||||
All other EMEA locations | 1.5 | ||||
Total EMEA | 5.3 | ||||
Asia-Pacific, Latin America and Canada | |||||
India | 5.8 | ||||
| Philippines | 1.7 | ||||
All other locations | 2.8 | ||||
Total Asia-Pacific, Latin America and Canada | 10.3 | ||||
Total | 72.3 | ||||
(a)At December 31, 2023, the Firm owned or leased 4,897 retail branches in 48 states and Washington D.C.
The premises and facilities occupied by JPMorgan Chase are collectively used across all of the Firm’s business segments and for corporate purposes. JPMorgan Chase continues to evaluate its current and projected space requirements and may determine from time to time that certain of its properties (including the premises and facilities noted
above) are no longer necessary for its operations. There is no assurance that the Firm will be able to dispose of any such excess properties, premises or facilities, or that it will not incur costs in connection with such dispositions. Such disposition costs may be material to the Firm’s results of operations in a given period. Refer to the Consolidated Results of Operations on pages 54–57 for information on occupancy expense.
Item 3. Legal Proceedings.
Refer to Note 30 for a description of the Firm’s material legal proceedings.
Item 4. Mine Safety Disclosures.
Not applicable.
34 | ||||||||
Item 5. Market for Registrant’s Common Equity, Related Stockholder Matters and Issuer Purchases of Equity Securities.
Market for registrant’s common equity
JPMorgan Chase’s common stock is listed and traded on the New York Stock Exchange. Refer to “Five-year stock performance,” on page 47 for a comparison of the cumulative total return for JPMorgan Chase common stock with the comparable total return of the S&P 500 Index, the KBW Bank Index and the S&P Financials Index over the five-year period ended December 31, 2023.
Refer to Capital actions in the Capital Risk Management section of Management’s discussion and analysis on page 99 for information on the common dividend payout ratio. Refer to Note 21 and Note 26 for a discussion of restrictions on dividend payments. On January 31, 2024, there were 204,357 holders of record of JPMorgan Chase common stock. Refer to Part III, Item 12 on page 39 for information regarding securities authorized for issuance under the Firm’s employee share-based incentive plans.
Repurchases under the common share repurchase program
Refer to Capital actions in the Capital Risk Management section of Management’s discussion and analysis on page 99 for information regarding repurchases under the Firm’s common share repurchase program.
Effective May 1, 2022, the Firm is authorized to purchase up to $30 billion under its common share repurchase program previously approved by the Board of Directors, which was announced on April 13, 2022.
Shares repurchased pursuant to the common share repurchase program during 2023 were as follows.
| Year ended December 31, 2023 | Total number of shares of common stock repurchased | Average price paid per share of common stock(a) | Aggregate purchase price of common stock repurchases (in millions)(a) | Dollar value of remaining authorized repurchase (in millions)(a)(b) | |||||||||||||||||||||||||
| First quarter | 21,995,253 | $ | 133.67 | $ | 2,940 | $ | 26,693 | ||||||||||||||||||||||
| Second quarter | 16,711,299 | 137.20 | 2,293 | 24,400 | |||||||||||||||||||||||||
| Third quarter | 15,608,838 | 151.46 | 2,364 | 22,036 | |||||||||||||||||||||||||
| October | 5,533,418 | 143.44 | 794 | 21,242 | |||||||||||||||||||||||||
| November | 5,173,068 | 148.50 | 768 | 20,474 | |||||||||||||||||||||||||
| December | 4,527,383 | 163.15 | 739 | 19,735 | |||||||||||||||||||||||||
| Fourth quarter | 15,233,869 | 151.02 | 2,301 | 19,735 | |||||||||||||||||||||||||
Full year | 69,549,259 | $ | 142.31 | $ | 9,898 | $ | 19,735 | ||||||||||||||||||||||
(a)Excludes excise tax and commissions. As part of the Inflation Reduction Act of 2022, a 1% excise tax was imposed on net share repurchases effective January 1, 2023.
(b)Represents the amount remaining under the $30 billion repurchase program.
Item 6. Reserved
Item 7. Management’s Discussion and Analysis of Financial Condition and Results of Operations.
Management’s discussion and analysis of financial condition and results of operations, entitled “Management’s discussion and analysis,” appears on pages 48–161. Such information should be read in conjunction with the Consolidated Financial Statements and Notes thereto, which appear on pages 166–309.
Item 7A. Quantitative and Qualitative Disclosures About Market Risk.
Refer to the Market Risk Management section of Management’s discussion and analysis on pages 135–143 for a discussion of quantitative and qualitative disclosures about market risk.
35 | ||||||||
Parts II and III
Item 8. Financial Statements and Supplementary Data.
The Consolidated Financial Statements, together with the Notes thereto and the report thereon dated February 16, 2024, of PricewaterhouseCoopers LLP, the Firm’s independent registered public accounting firm (PCAOB ID 238 ), appear on pages 163–309.
The “Glossary of Terms and Acronyms’’ is included on pages 315-321.
Item 9. Changes in and Disagreements With Accountants on Accounting and Financial Disclosure.
None.
Item 9A. Controls and Procedures.
The internal control framework promulgated by the Committee of Sponsoring Organizations of the Treadway Commission (“COSO”), “Internal Control — Integrated Framework” (“COSO 2013”), provides guidance for designing, implementing and conducting internal control and assessing its effectiveness. The Firm used the COSO 2013 framework to assess the effectiveness of the Firm’s internal control over financial reporting as of December 31, 2023. Refer to “Management’s report on internal control over financial reporting” on page 162.
As of the end of the period covered by this report, an evaluation was carried out under the supervision and with the participation of the Firm’s management, including its Chairman and Chief Executive Officer and its Chief Financial Officer, of the effectiveness of its disclosure controls and procedures (as defined in Rule 13a-15(e) under the Securities Exchange Act of 1934). Based on that evaluation, the Chairman and Chief Executive Officer and the Chief Financial Officer concluded that these disclosure controls and procedures were effective. Refer to Exhibits 31.1 and 31.2 for the Certifications furnished by the Chairman and Chief Executive Officer and Chief Financial Officer, respectively.
The Firm is committed to maintaining high standards of internal control over financial reporting. Nevertheless, because of its inherent limitations, internal control over financial reporting may not prevent or detect all misstatements. Deficiencies or lapses in internal controls may occur from time to time, and there can be no assurance that any such deficiencies will not result in significant deficiencies or material weaknesses in internal control in the future and collateral consequences therefrom. Refer to “Management’s report on internal control over financial reporting” on page 162 for further information.
On May 1, 2023, the Firm acquired certain assets and assumed certain liabilities of First Republic Bank from the FDIC. The Firm has included internal controls over these acquired assets and assumed liabilities in its evaluation of
the effectiveness of disclosure controls and procedures. Otherwise, there was no change in the Firm’s internal control over financial reporting (as defined in Rule 13a-15(f) under the Securities Exchange Act of 1934) that occurred during the three months ended December 31, 2023, that has materially affected, or is reasonably likely to materially affect, the Firm’s internal control over financial reporting.
36 | ||||||||
Item 9B. Other Information.
Director and executive officer trading arrangements
The following table provides information concerning Rule 10b5-1 trading arrangements (as defined in Item 408 of Regulation S-K under the Securities Exchange Act of 1934) adopted in the fourth quarter of 2023 by any director or any executive officer who is subject to the filing requirements of Section 16 of the Securities Exchange Act of 1934. These trading arrangements are intended to satisfy the affirmative defense of Rule 10b5-1(c). Certain of the Firm's directors and executive officers may participate in employee stock purchase plans, 401(k) plans or dividend reinvestment plans of the Firm that have been designed to comply with Rule 10b5-1(c). No non-Rule 10b5-1 trading arrangements (as defined in Item 408 of Regulation S-K under the Securities Exchange Act of 1934) were adopted by any director or executive officer during the fourth quarter of 2023. Additionally, no Rule 10b5-1 or non-Rule 10b5-1 trading arrangements were terminated
| Name | Title | Adoption date | Duration(b) | Aggregate number of shares to be sold | ||||||||||
| November 13, 2023 - May 17, 2024 | ||||||||||||||
| October 26, 2023 - August 23, 2024 | ||||||||||||||
| November 7, 2023 - May 17, 2024 | ||||||||||||||
(a)Transaction by trusts of which Mr. Dimon has either a direct or indirect pecuniary interest.
Iran threat reduction disclosure
Pursuant to Section 219 of the Iran Threat Reduction and Syria Human Rights Act of 2012, which added Section 13(r)
to the Securities Exchange Act of 1934, an issuer is required to disclose in its annual or quarterly reports, as applicable, whether it or any of its affiliates knowingly engaged in certain activities, transactions or dealings relating to Iran or with individuals or entities designated pursuant to certain Executive Orders. Disclosure may be required even where the activities, transactions or dealings were conducted in compliance with applicable law. Except as set forth below, as of the date of this report, the Firm is not aware of any other activity, transaction or dealing by any of its affiliates during the quarter ended December 31, 2023 that requires disclosure under Section 219.
A client of a fund distributor, who had invested the equivalent of approximately USD 1,400 in a fund managed by a non-US subsidiary of the Firm in September 2023, was subsequently designated by the Office of Foreign Assets Control as a Specially Designated National under 31 C.F.R. Part 544. Following the identification of this designation, the client of the fund distributor fully redeemed their investment in October 2023 for the equivalent of approximately USD 1,400. The Firm did not receive a transaction fee and calculates the management fee attributable to this investment to be less than USD 0.01. The Firm does not intend to engage in such transactions in the future.
Item 9C. Disclosure regarding Foreign Jurisdictions that Prevent Inspections.
Not applicable.
37 | ||||||||
Parts III and IV
Item 10. Directors, Executive Officers and Corporate Governance.
Executive officers of the registrant
| Age | ||||||||
| Name | (at December 31, 2023) | Positions and offices | ||||||
| James Dimon | 67 | Chairman of the Board since December 2006 and Chief Executive Officer since December 2005. | ||||||
| Ashley Bacon | 54 | Chief Risk Officer since June 2013. | ||||||
| Jeremy Barnum | 51 | Chief Financial Officer since May 2021, prior to which he was Head of Global Research for the Corporate & Investment Bank since February 2021. He previously served as Chief Financial Officer of the Corporate & Investment Bank from July 2013 until February 2021. | ||||||
| Lori A. Beer | 56 | Chief Information Officer since September 2017. | ||||||
| Mary Callahan Erdoes | 56 | Chief Executive Officer of Asset & Wealth Management since September 2009. | ||||||
| Stacey Friedman | 55 | General Counsel since January 2016. | ||||||
Marianne Lake(a) | 54 | Co-Chief Executive Officer of Consumer & Community Banking since May 2021, prior to which she had been Chief Executive Officer of Consumer Lending since May 2019. She was Chief Financial Officer from January 2013 until May 2019. | ||||||
| Robin Leopold | 59 | Head of Human Resources since January 2018. | ||||||
Douglas B. Petno | 58 | Chief Executive Officer of Commercial Banking since January 2012. | ||||||
Jennifer A. Piepszak(a) | 53 | Co-Chief Executive Officer of Consumer & Community Banking since May 2021, prior to which she had been Chief Financial Officer since May 2019. She previously served as Chief Executive Officer for Card Services from February 2017 until May 2019. | ||||||
Daniel E. Pinto(a) | 61 | President and Chief Operating Officer since January 2022 and Chief Executive Officer of the Corporate & Investment Bank since March 2014, having previously served as Co-President and Co-Chief Operating Officer since January 2018. | ||||||
| Peter L. Scher | 62 | Vice Chairman since March 2021. He previously served as Chairman of the Mid-Atlantic Region from February 2015 until December 2022 and Head of Corporate Responsibility from April 2011 until September 2021. | ||||||
Unless otherwise noted, during the five fiscal years ended December 31, 2023, all of JPMorgan Chase’s above-named executive officers have continuously held senior-level positions with JPMorgan Chase. There are no family relationships among the foregoing executive officers. Information to be provided in Items 10, 11, 12, 13 and 14 of this 2023 Form 10-K and not otherwise included herein is incorporated by reference to the Firm’s Definitive Proxy Statement for its 2024 Annual Meeting of Stockholders to be held on May 21, 2024, which will be filed with the SEC within 120 days of the end of the Firm’s fiscal year ended December 31, 2023.
(a)On January 25, 2024, the Firm announced new responsibilities for certain executives: Ms. Piepszak, along with Troy Rohrbaugh, the Firm’s Co-Head of Markets and Securities Services, became Co-Chief Executive Officers of the expanded Commercial & Investment Bank; Mr. Pinto continues as the Firm’s President and Chief Operating Officer but is no longer Chief Executive Officer of the former Corporate & Investment Bank; and Ms. Lake became the sole Chief Executive Officer of Consumer & Community Banking. Refer to Recent events on page 52 for further information.
38 | ||||||||
Item 11. Executive Compensation.
Refer to Item 10.
Item 12. Security Ownership of Certain Beneficial Owners and Management and Related Stockholder Matters.
Refer to Item 10 for security ownership of certain beneficial owners and management.
The following table sets forth the total number of shares available for issuance under JPMorgan Chase’s employee share-based incentive plans (including shares available for issuance to non-employee directors). The Firm is not authorized to grant share-based incentive awards to non-employees, other than to non-employee directors.
| December 31, 2023 | Number of shares to be issued upon exercise of outstanding options/stock appreciation rights | Weighted-average exercise price of outstanding options/stock appreciation rights | Number of shares remaining available for future issuance under stock incentive plans | |||||||||||||||||||||||
| Plan category | ||||||||||||||||||||||||||
| Employee share-based incentive plans approved by shareholders | 2,250,000 | (a) | $ | 152.19 | 53,807,804 | (b) | ||||||||||||||||||||
| Total | 2,250,000 | $ | 152.19 | 53,807,804 | ||||||||||||||||||||||
(a)Does not include restricted stock units or performance stock units granted under the shareholder-approved Long-Term Incentive Plan (“LTIP”), as amended and restated effective May 18, 2021. Refer to Note 9 for further information.
(b)Represents shares available for future issuance under the shareholder-approved LTIP.
All shares available for future issuance will be issued under the shareholder-approved LTIP. Refer to Note 9 for further discussion.
Item 13. Certain Relationships and Related Transactions, and Director Independence.
Refer to Item 10.
Item 14. Principal Accounting Fees and Services.
Refer to Item 10.
39 | ||||||||
Part IV
Item 15. Exhibits, Financial Statement Schedules.
| 1 | Financial statements | |||||||
| The Consolidated Financial Statements, the Notes thereto and the report of the Independent Registered Public Accounting Firm thereon listed in Item 8 are set forth commencing on page 156. | ||||||||
| 2 | Financial statement schedules | |||||||
| 3 | Exhibits | |||||||
| 3.1 | ||||||||
| 3.2 | ||||||||
| 3.3 | ||||||||
| 3.4 | ||||||||
| 3.5 | ||||||||
| 3.6 | ||||||||
| 3.7 | ||||||||
| 3.8 | ||||||||
| 3.9 | ||||||||
| 3.10 | ||||||||
| 3.11 | ||||||||
| 3.12 | ||||||||
| 3.13 | ||||||||
| 3.14 | ||||||||
| 3.15 | ||||||||
| 3.16 | ||||||||
| 3.17 | ||||||||
40 | ||||||||
| 3.18 | ||||||||
| 3.19 | ||||||||
| 4.1(a) | ||||||||
| 4.1(b) | ||||||||
| 4.2(a) | ||||||||
| 4.2(b) | ||||||||
| 4.3(a) | ||||||||
| 4.3(b) | ||||||||
| 4.4 | ||||||||
| 4.5 | ||||||||
| 4.6 | ||||||||
| Other instruments defining the rights of holders of long-term debt securities of JPMorgan Chase & Co. and its subsidiaries are omitted pursuant to Section (b)(4)(iii)(A) of Item 601 of Regulation S-K. JPMorgan Chase & Co. agrees to furnish copies of these instruments to the SEC upon request. | ||||||||
| 10.1 | Deferred Compensation Plan for Non-Employee Directors of JPMorgan Chase & Co., as amended and restated July 2001 and as of December 31, 2004 (incorporated by reference to Exhibit 10.1 to the Annual Report on Form 10-K of JPMorgan Chase & Co. (File No. 1-5805) for the year ended December 31, 2007).(a) | |||||||
| 10.2 | ||||||||
| 10.3 | ||||||||
| 10.4 | ||||||||
| 10.5 | ||||||||
41 | ||||||||
Part IV
42 | ||||||||
| 10.20 | ||||||||
| 10.21 | ||||||||
| 21 | ||||||||
| 22.1 | Annual Report on Form 11-K of The JPMorgan Chase 401(k) Savings Plan for the year ended December 31, 2023 (to be filed pursuant to Rule 15d-21 under the Securities Exchange Act of 1934). | |||||||
| 22.2 | ||||||||
| 23 | ||||||||
| 31.1 | ||||||||
| 31.2 | ||||||||
| 32 | ||||||||
| 97 | ||||||||
| 101.INS | The instance document does not appear in the interactive data file because its XBRL tags are embedded within the Inline XBRL document.(d) | |||||||
| 101.SCH | XBRL Taxonomy Extension Schema Document.(b) | |||||||
| 101.CAL | XBRL Taxonomy Extension Calculation Linkbase Document.(b) | |||||||
| 101.DEF | XBRL Taxonomy Extension Definition Linkbase Document.(b) | |||||||
| 101.LAB | XBRL Taxonomy Extension Label Linkbase Document.(b) | |||||||
| 101.PRE | XBRL Taxonomy Extension Presentation Linkbase Document.(b) | |||||||
| 104 | Cover Page Interactive Data File (embedded within the Inline XBRL document and included in Exhibit 101). | |||||||
(a) This exhibit is a management contract or compensatory plan or arrangement.
(b) Filed herewith.
(c) Furnished herewith. This exhibit shall not be deemed “filed” for purposes of Section 18 of the Securities Exchange Act of 1934, or otherwise subject to the liability of that Section. Such exhibit shall not be deemed incorporated into any filing under the Securities Act of 1933 or the Securities Exchange Act of 1934.
(d) Pursuant to Rule 405 of Regulation S-T, includes the following financial information included in the Firm’s Form 10-K for the year ended December 31, 2023, formatted in XBRL (eXtensible Business Reporting Language) interactive data files: (i) the Consolidated statements of income for the years ended December 31, 2023, 2022 and 2021, (ii) the Consolidated statements of comprehensive income for the years ended December 31, 2023, 2022 and 2021, (iii) the Consolidated balance sheets as of December 31, 2023 and 2022, (iv) the Consolidated statements of changes in stockholders’ equity for the years ended December 31, 2023, 2022 and 2021, (v) the Consolidated statements of cash flows for the years ended December 31, 2023, 2022 and 2021, and (vi) the Notes to Consolidated Financial Statements.
43 | ||||||||
page 44 not used
44 | ||||||||
Table of contents
| Financial: | Audited financial statements: | |||||||||||||||||||
| 46 | 162 | |||||||||||||||||||
| 47 | 163 | |||||||||||||||||||
| Management’s discussion and analysis: | 166 | |||||||||||||||||||
| 48 | 171 | |||||||||||||||||||
| 49 | ||||||||||||||||||||
| 54 | ||||||||||||||||||||
| 58 | Supplementary information: | |||||||||||||||||||
| 62 | 310 | |||||||||||||||||||
| 65 | 315 | |||||||||||||||||||
| 86 | ||||||||||||||||||||
| 90 | ||||||||||||||||||||
| 91 | ||||||||||||||||||||
| 102 | ||||||||||||||||||||
| 111 | ||||||||||||||||||||
| 135 | ||||||||||||||||||||
| 144 | ||||||||||||||||||||
| 146 | ||||||||||||||||||||
| 147 | ||||||||||||||||||||
| 155 | ||||||||||||||||||||
| 159 | ||||||||||||||||||||
| 161 | ||||||||||||||||||||
JPMorgan Chase & Co./2023 Form 10-K | 45 | |||||||
Financial
THREE-YEAR SUMMARY OF CONSOLIDATED FINANCIAL HIGHLIGHTS (unaudited)
As of or for the year ended December 31, (in millions, except per share, ratio, employee data and where otherwise noted) | |||||||||||||||||||||||
| 2023 | 2022 | 2021 | |||||||||||||||||||||
| Selected income statement data | |||||||||||||||||||||||
| Total net revenue | $ | 158,104 | $ | 128,695 | $ | 121,649 | |||||||||||||||||
| Total noninterest expense | 87,172 | 76,140 | 71,343 | ||||||||||||||||||||
Pre-provision profit(a) | 70,932 | 52,555 | 50,306 | ||||||||||||||||||||
| Provision for credit losses | 9,320 | 6,389 | (9,256) | ||||||||||||||||||||
| Income before income tax expense | 61,612 | 46,166 | 59,562 | ||||||||||||||||||||
| Income tax expense | 12,060 | 8,490 | 11,228 | ||||||||||||||||||||
| Net income | $ | 49,552 | $ | 37,676 | $ | 48,334 | |||||||||||||||||
| Earnings per share data | |||||||||||||||||||||||
| Net income: Basic | $ | 16.25 | $ | 12.10 | $ | 15.39 | |||||||||||||||||
| Diluted | 16.23 | 12.09 | 15.36 | ||||||||||||||||||||
| Average shares: Basic | 2,938.6 | 2,965.8 | 3,021.5 | ||||||||||||||||||||
| Diluted | 2,943.1 | 2,970.0 | 3,026.6 | ||||||||||||||||||||
| Market and per common share data | |||||||||||||||||||||||
| Market capitalization | 489,320 | 393,484 | 466,206 | ||||||||||||||||||||
| Common shares at period-end | 2,876.6 | 2,934.2 | 2,944.1 | ||||||||||||||||||||
| Book value per share | 104.45 | 90.29 | 88.07 | ||||||||||||||||||||
Tangible book value per share (“TBVPS”)(a) | 86.08 | 73.12 | 71.53 | ||||||||||||||||||||
| Cash dividends declared per share | 4.10 | 4.00 | 3.80 | ||||||||||||||||||||
| Selected ratios and metrics | |||||||||||||||||||||||
Return on common equity (“ROE”) | 17 | % | 14 | % | 19 | % | |||||||||||||||||
Return on tangible common equity (“ROTCE”)(a) | 21 | 18 | 23 | ||||||||||||||||||||
Return on assets (“ROA”) | 1.30 | 0.98 | 1.30 | ||||||||||||||||||||
| Overhead ratio | 55 | 59 | 59 | ||||||||||||||||||||
| Loans-to-deposits ratio | 55 | 49 | 44 | ||||||||||||||||||||
Firm Liquidity coverage ratio (“LCR”) (average)(b) | 113 | 112 | 111 | ||||||||||||||||||||
JPMorgan Chase Bank, N.A. LCR (average)(b) | 129 | 151 | 178 | ||||||||||||||||||||
Common equity Tier 1 (“CET1”) capital ratio(c)(d) | 15.0 | 13.2 | 13.1 | ||||||||||||||||||||
Tier 1 capital ratio(c)(d) | 16.6 | 14.9 | 15.0 | ||||||||||||||||||||
Total capital ratio(c)(d) | 18.5 | 16.8 | 16.8 | ||||||||||||||||||||
Tier 1 leverage ratio(b)(c) | 7.2 | 6.6 | 6.5 | ||||||||||||||||||||
Supplementary leverage ratio (“SLR”)(b)(c) | 6.1 | 5.6 | 5.4 | ||||||||||||||||||||
Selected balance sheet data (period-end) | |||||||||||||||||||||||
| Trading assets | $ | 540,607 | $ | 453,799 | $ | 433,575 | |||||||||||||||||
| Investment securities, net of allowance for credit losses | 571,552 | 631,162 | 672,232 | ||||||||||||||||||||
| Loans | 1,323,706 | 1,135,647 | 1,077,714 | ||||||||||||||||||||
| Total assets | 3,875,393 | 3,665,743 | 3,743,567 | ||||||||||||||||||||
| Deposits | 2,400,688 | 2,340,179 | 2,462,303 | ||||||||||||||||||||
| Long-term debt | 391,825 | 295,865 | 301,005 | ||||||||||||||||||||
| Common stockholders’ equity | 300,474 | 264,928 | 259,289 | ||||||||||||||||||||
| Total stockholders’ equity | 327,878 | 292,332 | 294,127 | ||||||||||||||||||||
Employees(e) | 309,926 | (f) | 293,723 | 271,025 | |||||||||||||||||||
| Credit quality metrics | |||||||||||||||||||||||
| Allowances for credit losses | $ | 24,765 | $ | 22,204 | $ | 18,689 | |||||||||||||||||
| Allowance for loan losses to total retained loans | 1.75 | % | 1.81 | % | 1.62 | % | |||||||||||||||||
| Nonperforming assets | $ | 7,597 | $ | 7,247 | $ | 8,346 | |||||||||||||||||
| Net charge-offs | 6,209 | 2,853 | 2,865 | ||||||||||||||||||||
| Net charge-off rate | 0.52 | % | 0.27 | % | 0.30 | % | |||||||||||||||||
As of and for the period ended December 31, 2023, the results of the Firm include the impact of First Republic. Refer to Business Segment Results on page 67 and Note 34 for additional information.
(a)Pre-provision profit, TBVPS and ROTCE are each non-GAAP financial measures. Tangible common equity (“TCE”) is also a non-GAAP financial measure. Refer to Explanation and Reconciliation of the Firm’s Use of Non-GAAP Financial Measures on pages 62–64 for a discussion of these measures.
(b)For the years ended December 31, 2023, 2022 and 2021, the percentage represents average ratios for the three months ended December 31, 2023, 2022 and 2021.
(c)The ratios reflect the Current Expected Credit Losses (“CECL”) capital transition provisions. Refer to Note 27 for additional information.
(d)Reflects the Firm’s ratios under the Basel III Standardized approach. Refer to Capital Risk Management on pages 91-101 for additional information.
(e)This metric, which was formerly Headcount, has been renamed Employees but is otherwise unchanged. Refer to Part I, Item 1, Business section on pages 2-3 of this Form 10-K for a further discussion of Human Capital.
(f)Included approximately 4,500 individuals associated with First Republic who became employees effective July 2, 2023.
46 | JPMorgan Chase & Co./2023 Form 10-K | |||||||
FIVE-YEAR STOCK PERFORMANCE
The following table and graph compare the five-year cumulative total return for JPMorgan Chase & Co. (“JPMorgan Chase” or the “Firm”) common stock with the cumulative return of the S&P 500 Index, the KBW Bank Index and the S&P Financials Index. The S&P 500 Index is a commonly referenced equity benchmark in the United States of America (“U.S.”), consisting of leading companies from different economic sectors. The KBW Bank Index seeks to reflect the performance of banks and thrifts that are publicly traded in the U.S. and is composed of leading national money center and regional banks and thrifts. The S&P Financials Index is an index of financial companies, all of which are components of the S&P 500. The Firm is a component of all three industry indices.
The following table and graph assume simultaneous investments of $100 on December 31, 2018, in JPMorgan Chase common stock and in each of the above indices. The comparison assumes that all dividends were reinvested.
| December 31, (in dollars) | 2018 | 2019 | 2020 | 2021 | 2022 | 2023 | |||||||||||||||||||||||||||||
| JPMorgan Chase | $ | 100.00 | $ | 147.27 | $ | 139.14 | $ | 177.72 | $ | 155.33 | $ | 203.09 | |||||||||||||||||||||||
| KBW Bank Index | 100.00 | 136.12 | 122.09 | 168.90 | 132.76 | 131.58 | |||||||||||||||||||||||||||||
| S&P Financials Index | 100.00 | 132.09 | 129.77 | 175.02 | 156.59 | 175.61 | |||||||||||||||||||||||||||||
| S&P 500 Index | 100.00 | 131.48 | 155.65 | 200.29 | 164.02 | 207.13 | |||||||||||||||||||||||||||||
December 31,
(in dollars)
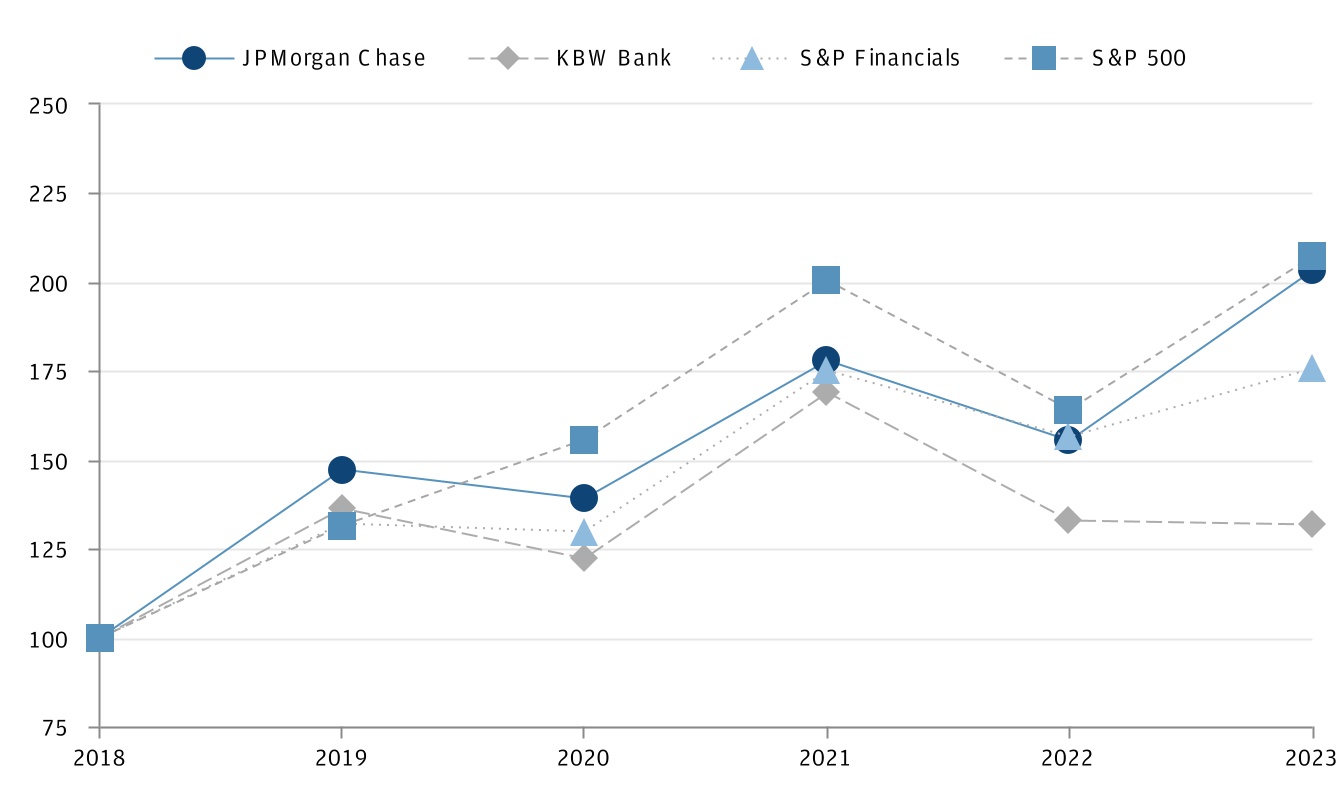
JPMorgan Chase & Co./2023 Form 10-K | 47 | |||||||
Management’s discussion and analysis
The following is Management’s discussion and analysis of the financial condition and results of operations (“MD&A”) of JPMorgan Chase for the year ended December 31, 2023. The MD&A is included in both JPMorgan Chase’s Annual Report for the year ended December 31, 2023 (“Annual Report”) and its Annual Report on Form 10-K for the year ended December 31, 2023 (“2023 Form 10-K” or “Form 10-K”) filed with the Securities and Exchange Commission (“SEC”). Refer to the Glossary of terms and acronyms on pages 315-321 for definitions of terms and acronyms used throughout the Annual Report and the 2023 Form 10-K.
This Form 10-K contains forward-looking statements within the meaning of the Private Securities Litigation Reform Act of 1995. These forward-looking statements are based on the current beliefs and expectations of JPMorgan Chase’s management, speak only as of the date of this Form 10-K and are subject to significant risks and uncertainties. Refer to Forward-looking Statements on page 161 and Part 1, Item 1A: Risk factors in this Form 10-K on pages 9-33 for a discussion of certain of those risks and uncertainties and the factors that could cause JPMorgan Chase’s actual results to differ materially because of those risks and uncertainties. There is no assurance that actual results will be in line with any outlook information set forth herein, and the Firm does not undertake to update any forward-looking statements.
| INTRODUCTION | ||||||||||||||
JPMorgan Chase & Co. (NYSE: JPM), a financial holding company incorporated under Delaware law in 1968, is a leading financial services firm based in the United States of America (“U.S.”), with operations worldwide. JPMorgan Chase had $3.9 trillion in assets and $327.9 billion in stockholders’ equity as of December 31, 2023. The Firm is a leader in investment banking, financial services for consumers and small businesses, commercial banking, financial transaction processing and asset management. Under the J.P. Morgan and Chase brands, the Firm serves millions of customers, predominantly in the U.S., and many of the world’s most prominent corporate, institutional and government clients globally.
JPMorgan Chase’s principal bank subsidiary is JPMorgan Chase Bank, National Association (“JPMorgan Chase Bank, N.A.”), a national banking association with U.S. branches in 48 states and Washington, D.C. JPMorgan Chase’s principal non-bank subsidiary is J.P. Morgan Securities LLC (“J.P. Morgan Securities”), a U.S. broker-dealer. The bank and non-bank subsidiaries of JPMorgan Chase operate nationally as well as through overseas branches and subsidiaries, representative offices and subsidiary foreign banks. The Firm’s principal operating subsidiaries outside the U.S. are J.P. Morgan Securities plc and J.P. Morgan SE (“JPMSE”), which are subsidiaries of JPMorgan Chase Bank, N.A. and are based in the United Kingdom (“U.K.”) and Germany, respectively.
For management reporting purposes, the Firm’s activities are organized into four major reportable business segments, as well as a Corporate segment. The Firm’s consumer business is the Consumer & Community Banking (“CCB”) segment. The Firm’s wholesale businesses are the Corporate & Investment Bank (“CIB”), Commercial Banking (“CB”), and Asset & Wealth Management (“AWM”) segments. Refer to Business Segment Results on pages 65–85, and Note 32 for a description of the Firm’s business segments, and the products and services they provide to their respective client bases. On May 1, 2023, JPMorgan Chase acquired certain assets and assumed certain liabilities of First Republic Bank (the “First Republic acquisition”) from the Federal Deposit Insurance Corporation (“FDIC”). All references in this Form 10-K to “excluding First Republic,” “including First Republic,” “associated with First Republic” or “attributable to First Republic” refer to excluding or including the relevant effects of the First Republic acquisition, as well as subsequent related business and activities, as applicable. Refer to Note 34 for additional information.
The Firm’s website is www.jpmorganchase.com. JPMorgan Chase makes available on its website, free of charge, annual reports on Form 10-K, quarterly reports on Form 10-Q and current reports on Form 8-K pursuant to Section 13(a) or Section 15(d) of the Securities Exchange Act of 1934, as soon as reasonably practicable after it electronically files or furnishes such material to the U.S. Securities and Exchange Commission (the “SEC”) at www.sec.gov. JPMorgan Chase makes new and important information about the Firm available on its website at https://www.jpmorganchase.com, including on the Investor Relations section of its website at https://www.jpmorganchase.com/ir. Information on the Firm's website, including documents on the website that are referenced in this Form 10-K, is not incorporated by reference into this 2023 Form 10-K or the Firm’s other filings with the SEC.
48 | JPMorgan Chase & Co./2023 Form 10-K | |||||||
| EXECUTIVE OVERVIEW | ||||||||||||||
This executive overview of the MD&A highlights selected information and does not contain all of the information that is important to readers of the Firm’s 2023 Form 10-K. For a complete description of the trends and uncertainties, as well as the risks and critical accounting estimates affecting the Firm, the 2023 Form 10-K should be read in its entirety.
| Financial performance of JPMorgan Chase | ||||||||||||||
| Year ended December 31, (in millions, except per share data and ratios) | ||||||||||||||
| 2023 | 2022 | Change | ||||||||||||
| Selected income statement data | ||||||||||||||
| Noninterest revenue | $ | 68,837 | $ | 61,985 | 11% | |||||||||
| Net interest income | 89,267 | 66,710 | 34 | |||||||||||
| Total net revenue | 158,104 | 128,695 | 23 | |||||||||||
| Total noninterest expense | 87,172 | 76,140 | 14 | |||||||||||
| Pre-provision profit | 70,932 | 52,555 | 35 | |||||||||||
| Provision for credit losses | 9,320 | 6,389 | 46 | |||||||||||
| Net income | 49,552 | 37,676 | 32 | |||||||||||
| Diluted earnings per share | 16.23 | 12.09 | 34 | |||||||||||
| Selected ratios and metrics | ||||||||||||||
| Return on common equity | 17 | % | 14 | % | ||||||||||
Return on tangible common equity | 21 | 18 | ||||||||||||
| Book value per share | $ | 104.45 | $ | 90.29 | 16 | |||||||||
| Tangible book value per share | 86.08 | 73.12 | 18 | |||||||||||
Capital ratios(a)(b) | ||||||||||||||
| CET1 capital | 15.0 | % | 13.2 | % | ||||||||||
| Tier 1 capital | 16.6 | 14.9 | ||||||||||||
Total capital | 18.5 | 16.8 | ||||||||||||
| Memo: | ||||||||||||||
NII excluding Markets(c) | $ | 90,041 | $ | 62,355 | 44 | |||||||||
NIR excluding Markets(c) | 44,533 | 40,938 | 9 | |||||||||||
Markets(c) | 27,792 | 28,984 | (4) | |||||||||||
| Total net revenue - managed basis | $ | 162,366 | $ | 132,277 | 23 | |||||||||
As of and for the year ended December 31, 2023, the results of the Firm include the impact of First Republic. Refer to page 67 and Note 34 for additional information.
(a) The ratios reflect the CECL capital transition provisions. Refer to Note 27 for additional information.
(b) Reflects the Firm’s ratios under the Basel III Standardized approach. Refer to Capital Risk Management on pages 91-101 for additional information.
(c) NII and NIR refer to net interest income and noninterest revenue, respectively. Markets consists of CIB's Fixed Income Markets and Equity Markets businesses.
Comparisons noted in the sections below are for the full year of 2023 versus the full year of 2022, unless otherwise specified.
Firmwide overview
JPMorgan Chase reported net income of $49.6 billion for 2023, up 32%, earnings per share of $16.23, ROE of 17% and ROTCE of 21%.
•Total net revenue was $158.1 billion, up 23%, reflecting:
–Net interest income (“NII”) of $89.3 billion, up 34%, driven by higher rates, the impact of First Republic, and higher revolving balances in Card Services, partially offset by lower Markets net interest income and lower average deposit balances. NII excluding Markets was $90.0 billion, up 44%.
–Noninterest revenue (“NIR”) was $68.8 billion, up 11%, driven by the impact of First Republic, including the $2.8 billion estimated bargain purchase gain, higher Markets noninterest revenue, and higher asset management fees, partially offset by the absence of the gain on the sale of Visa B shares in the prior year, higher net securities losses in Treasury and CIO, and lower auto operating lease income.
•Noninterest expense was $87.2 billion, up 14%, predominantly driven by higher compensation expense, reflecting an increase in employees, primarily in technology and front office, as well as wage inflation. The increase in expense also includes the $2.9 billion FDIC special assessment and costs associated with the First Republic acquisition.
•The provision for credit losses was $9.3 billion, reflecting $6.2 billion of net charge-offs and a net addition to the allowance for credit losses of $3.1 billion. Net charge-offs increased $3.3 billion, predominantly driven by Card Services, and to a lesser extent single name exposures in wholesale. The net addition to the allowance for credit losses included:
–a net addition of $1.3 billion in consumer, predominantly driven by CCB, reflecting $1.4 billion in Card Services driven by loan growth, including an increase in revolving balances, partially offset by a net reduction of $200 million in Home Lending, and
–a net addition of $657 million in wholesale, driven by net downgrade activity and a deterioration in the outlook for commercial real estate in CB.
The net addition also included $1.2 billion to establish the allowance for First Republic loans and lending-related commitments in the second quarter of 2023.
The provision in the prior year included a $3.5 billion net addition to the allowance for credit losses and net charge-offs of $2.9 billion.
•The total allowance for credit losses was $24.8 billion at December 31, 2023. The Firm had an allowance for loan losses to retained loans coverage ratio of 1.75%, compared with 1.81% in the prior year.
•The Firm’s nonperforming assets totaled $7.6 billion at December 31, 2023, up 5%, predominantly driven by wholesale nonaccrual loans, which reflected the impact of downgrades. Refer to Wholesale Credit Portfolio and Consumer Credit Portfolio on pages 120–130 and pages 114–119, respectively, for additional information.
JPMorgan Chase & Co./2023 Form 10-K | 49 | |||||||
•Firmwide average loans of $1.2 trillion were up 13%, predominantly driven by higher loans in CCB and CB, primarily as a result of First Republic.
•Firmwide average deposits of $2.4 trillion were down 4%, driven by
–continued migration into higher-yielding investments in AWM, the impact of higher customer spending in CCB, continued deposit attrition in CB, and a net decline in CIB, which included actions taken to reduce certain deposits,
partially offset by
–the increase in deposits associated with First Republic, and growth related to the Firm’s international consumer initiatives in Corporate.
Refer to Liquidity Risk Management on pages 102–109 for additional information.
Selected capital and other metrics
•CET1 capital was $251 billion, and the Standardized and Advanced CET1 ratios were both 15.0%.
•SLR was 6.1%.
•TBVPS grew 18%, ending 2023 at $86.08.
•As of December 31, 2023, the Firm had eligible end-of-period High Quality Liquid Assets (“HQLA”) of approximately $798 billion and unencumbered marketable securities with a fair value of approximately $649 billion, resulting in approximately $1.4 trillion of liquidity sources. Refer to Liquidity Risk Management on pages 102–109 for additional information.
Refer to Consolidated Results of Operations and Consolidated Balance Sheets Analysis on pages 54–57 and pages 58–60, respectively, for a further discussion of the Firm's results, including the provision for credit losses; and Business Segment Results on page 67 and Note 34 for additional information on the First Republic acquisition.
Pre-provision profit, ROTCE, TCE, TBVPS, NII and NIR excluding Markets, and total net revenue on a managed basis are non-GAAP financial measures. Refer to Explanation and Reconciliation of the Firm’s Use of Non-GAAP Financial Measures on pages 62–64 for a further discussion of each of these measures.
50 | JPMorgan Chase & Co./2023 Form 10-K | |||||||
Business segment highlights
Selected business metrics for each of the Firm’s four lines of business (“LOB”) are presented below for the full year of 2023, and include the impact of First Republic, unless otherwise specified.
CCB ROE 38% | •Average deposits down 3%; client investment assets up 47%, or up 25% excluding First Republic •Average loans up 20%, or up 6% excluding First Republic; Card Services net charge-off rate of 2.45% •Debit and credit card sales volume(a) up 8% •Active mobile customers(b) up 8% | |||||||
CIB ROE 13% | •#1 ranking for Global Investment Banking fees with 8.8% wallet share for the year •Total Markets revenue of $27.8 billion, down 4%, with Fixed Income Markets up 1% and Equity Markets down 13% | |||||||
CB ROE 20% | •Gross Investment Banking and Markets revenue of $3.4 billion, up 14% •Average loans up 20%, or up 8% excluding First Republic; average deposits down 9% | |||||||
AWM ROE 31% | •Assets under management (“AUM”) of $3.4 trillion, up 24% •Average loans up 2%, or down 2% excluding First Republic; average deposits down 17% | |||||||
(a) Excludes Commercial Card.
(b) Users of all mobile platforms who have logged in within the past 90 days. As of December 31, 2023, excludes First Republic.
Refer to the Business Segment Results on pages 65–85 for a detailed discussion of results by business segment.
Credit provided and capital raised
JPMorgan Chase continues to support consumers, businesses and communities around the globe. The Firm provided new and renewed credit and raised capital for wholesale and consumer clients during 2023, consisting of:
$2.3 trillion | Total credit provided and capital raised (including loans and commitments) | |||||||
$239 billion | Credit for consumers | |||||||
$36 billion | Credit for U.S. small businesses | |||||||
$1.0 trillion | Credit for corporations | |||||||
$915 billion | Capital for corporate clients and non-U.S. government entities | |||||||
$47 billion | Credit and capital for nonprofit and U.S. government entities(a) | |||||||
(a) Includes states, municipalities, hospitals and universities.
JPMorgan Chase & Co./2023 Form 10-K | 51 | |||||||
Recent events
•On February 6, 2024, JPMorgan Chase announced that it plans to open more than 500 new branches, renovate approximately 1,700 locations and hire 3,500 employees over the next three years.
•On January 25, 2024, JPMorgan Chase announced new responsibilities for several key executives:
–Jennifer Piepszak, formerly the Co-Chief Executive Officer (“CEO”) of CCB, and Troy Rohrbaugh, formerly the Co-head of Markets and Securities Services, became Co-CEOs of the expanded Commercial & Investment Bank, which brings together the Firm’s major wholesale businesses consisting of Global Investment Banking, Commercial Banking and Corporate Banking, as well as Markets, Securities Services and Global Payments.
–Marianne Lake, the former Co-CEO of CCB, became the sole CEO of that business.
–James Dimon, Chairman and CEO, and Daniel Pinto, President and Chief Operating Officer, will continue to jointly manage the company, with Mr. Pinto focusing on the execution of the Firm’s LOB priorities.
As a result of these organizational changes, the Firm will be reorganizing its business segments to reflect the manner in which the segments will be managed. The reorganization of the business segments is expected to be effective in the second quarter of 2024.
•On January 16, 2024, JPMorgan Chase announced that Mark Weinberger, 62, had been elected to its Board of Directors, effective immediately. He will also serve as a member of the Board’s Audit Committee. Mr. Weinberger served as the Global Chairman and Chief Executive Officer of Ernst & Young from 2013 to 2019.
Outlook
These current expectations are forward-looking statements within the meaning of the Private Securities Litigation Reform Act of 1995. Such forward-looking statements are based on the current beliefs and expectations of JPMorgan Chase’s management, speak only as of the date of this Form 10-K, and are subject to significant risks and uncertainties. Refer to Forward-Looking Statements on page 161 and Part I, Item 1A, Risk Factors section on pages 9-33 of this Form 10-K for a further discussion of certain of those risks and uncertainties and the other factors that could cause JPMorgan Chase’s actual results to differ materially because of those risks and uncertainties. There is no assurance that actual results in 2024 will be in line with the outlook information set forth below, and the Firm does not undertake to update any forward-looking statements.
JPMorgan Chase’s current outlook for full-year 2024 should be viewed against the backdrop of the global and U.S. economies, financial markets activity, the geopolitical environment, the competitive environment, client and customer activity levels, and regulatory and legislative developments in the U.S. and other countries where the Firm does business. Each of these factors will affect the performance of the Firm. The Firm will continue to make appropriate adjustments to its businesses and operations in response to ongoing developments in the business, economic, regulatory and legal environments in which it operates.
Full-year 2024
•Management expects net interest income to be approximately $90 billion, market dependent.
•Management expects net interest income excluding Markets to be approximately $88 billion, market dependent.
•Management expects adjusted expense to be approximately $90 billion, market dependent.
•Management expects the net charge-off rate in Card Services to be less than 3.50%.
Net interest income excluding Markets and adjusted expense are non-GAAP financial measures. Refer to Explanation and Reconciliation of the Firm’s Use of Non-GAAP Financial Measures on pages 62–64.
52 | JPMorgan Chase & Co./2023 Form 10-K | |||||||
Business Developments
First Republic acquisition
On May 1, 2023, JPMorgan Chase acquired certain assets and assumed certain liabilities of First Republic Bank (the "First Republic acquisition") from the Federal Deposit Insurance Corporation (“FDIC”), as receiver.
JPMorgan Chase’s Consolidated Financial Statements as of and for the period ended December 31, 2023 reflect the impact of First Republic. Where meaningful to the disclosure, the impact of the First Republic acquisition, as well as subsequent related business and activities, are disclosed in various sections of this Form 10-K. The Firm continues to convert certain operations, and to integrate clients, products and services, associated with the First Republic acquisition to align with the Firm’s businesses and operations.
Refer to Note 34 and page 67 for additional information related to First Republic.
Interbank Offered Rate (“IBOR”) transition
The publication of the remaining principal tenors of U.S. dollar LIBOR (i.e., overnight, one-month, three-month, six-month and 12-month LIBOR) ceased on June 30, 2023 (“LIBOR Cessation”). The one-month, three-month and six-month tenors of U.S. dollar LIBOR will continue to be published on a "synthetic" basis, which will allow market participants to use such rates for certain legacy LIBOR-linked contracts through September 30, 2024.
As part of the Firm’s overall transition efforts which culminated in the second quarter of 2023, the Firm successfully completed the conversion of predominantly all of its remaining cleared derivatives contracts linked to U.S. dollar LIBOR to the Secured Overnight Financing Rate (“SOFR”) as part of initiatives by the principal central counterparties (“CCPs”) to convert cleared derivatives prior to LIBOR Cessation. Nearly all of the Firm’s other U.S. dollar LIBOR-linked products that remained outstanding at LIBOR Cessation have been remediated through contractual fallback provisions or through the framework provided by the Adjustable Interest Rate (LIBOR) Act (“LIBOR Act”). The Firm expects that the limited number of contracts remaining that reference “synthetic” U.S. dollar LIBOR will be remediated by September 30, 2024.
JPMorgan Chase & Co./2023 Form 10-K | 53 | |||||||
| CONSOLIDATED RESULTS OF OPERATIONS | ||||||||||||||
| Revenue | ||||||||||||||
| Year ended December 31, (in millions) | ||||||||||||||
| 2023 | 2022 | 2021 | ||||||||||||
| Investment banking fees | $ | 6,519 | $ | 6,686 | $ | 13,216 | ||||||||
| Principal transactions | 24,460 | 19,912 | 16,304 | |||||||||||
| Lending- and deposit-related fees | 7,413 | 7,098 | 7,032 | |||||||||||
| Asset management fees | 15,220 | 14,096 | 14,405 | |||||||||||
| Commissions and other fees | 6,836 | 6,581 | 6,624 | |||||||||||
Investment securities losses | (3,180) | (2,380) | (345) | |||||||||||
Mortgage fees and related income | 1,176 | 1,250 | 2,170 | |||||||||||
| Card income | 4,784 | 4,420 | 5,102 | |||||||||||
Other income(a) | 5,609 | (b) | 4,322 | 4,830 | ||||||||||
| Noninterest revenue | 68,837 | 61,985 | 69,338 | |||||||||||
| Net interest income | 89,267 | 66,710 | 52,311 | |||||||||||
| Total net revenue | $ | 158,104 | $ | 128,695 | $ | 121,649 | ||||||||
(a)Included operating lease income of $2.8 billion, $3.7 billion and $4.9 billion for the years ended December 31, 2023, 2022 and 2021, respectively. Also includes losses on tax-oriented investments. Refer to Note 6 for additional information.
(b)Included the estimated bargain purchase gain of $2.8 billion for the year ended December 31, 2023, in Corporate associated with the First Republic acquisition. Refer to Business Segment Results on page 67, and Notes 6 and 34 for additional information.
2023 compared with 2022
Investment banking fees decreased, reflecting in CIB:
•lower advisory fees due to a lower number of completed transactions, reflecting the lower level of announced deals in the current and the prior year amid a challenging environment, and
•lower debt underwriting fees as challenging market conditions, primarily in the first half of the year, resulted in lower issuance activity across leveraged loans, investment-grade loans and high-grade bonds. This was largely offset by higher issuance activity in high-yield bonds driven by higher industry-wide issuance,
partially offset by
•higher equity underwriting fees driven by a higher level of follow-on offerings due to lower equity market volatility and a higher level of convertible securities offerings, which benefited from higher rates, partially offset by lower activity in private placements amid a challenging environment.
Refer to CIB segment results on pages 72–77 and Note 6 for additional information.
Principal transactions revenue increased, reflecting in CIB:
•higher Equity Markets principal transactions revenue in Prime Finance and Equity Derivatives,
•higher Fixed Income Markets principal transactions revenue in Securitized Products and Fixed Income
Financing, largely offset by lower revenue in Rates and Currencies & Emerging Markets;
–the net increase in Markets principal transactions revenue was more than offset by a decline in Markets net interest income, primarily due to higher funding costs; and
•losses of $280 million in Credit Adjustments & Other compared with $836 million in the prior year.
The prior year included net markdowns on held-for-sale positions, primarily unfunded commitments, in the bridge financing portfolio in CIB and CB.
The increase in principal transactions revenue also included the impact of higher short-term cash deployment activities in Treasury and CIO, reflective of the current interest rate environment.
Principal transactions revenue in CIB generally has offsets across other revenue lines, including net interest income. The Firm assesses the performance of its Markets business on a total net revenue basis.
Refer to CIB and Corporate segment results on pages 72–77 and pages 84–85, respectively, and Note 6 for additional information.
Lending- and deposit-related fees increased, reflecting:
•higher lending-related revenue driven by the amortization of the purchase discount on certain acquired lending-related commitments associated with First Republic, primarily in AWM and CB,
predominantly offset by
•lower deposit-related fees in CB and CIB driven by the higher level of client credits that reduce such fees.
Refer to CIB, CB and AWM segment results on pages 72–77, pages 78–80 and pages 81–83, respectively, and Note 6 for additional information.
Asset management fees increased driven by strong net inflows and the removal of most money market fund fee waivers in the prior year in AWM, and in CCB the impact of First Republic, as well as higher average market levels and strong net inflows. Refer to CCB and AWM segment results on pages 68–71 and pages 81–83, respectively, and Note 6 for additional information.
54 | JPMorgan Chase & Co./2023 Form 10-K | |||||||
Commissions and other fees increased due to higher commissions on annuity sales and travel-related services in CCB. Refer to CCB segment results on pages 68–71 and Note 6 for additional information.
Investment securities losses reflected higher net losses on higher sales of U.S. Treasuries and U.S. GSE and government agency MBS, associated with repositioning the investment securities portfolio in both periods in Treasury and CIO. Refer to Corporate segment results on pages 84–85 and Note 10 for additional information.
Mortgage fees and related income: refer to CCB segment results on pages 68–71, Note 6 and 15 for further information.
Card income increased in CIB and CB, reflecting growth in merchant processing volume and Commercial Card transactions in J.P. Morgan Payments; and in CCB, driven by higher net interchange income on increased debit and credit card sales volume. Refer to Business Segment Results, CCB, CIB and CB segment results on pages 65–85, pages 68–71, pages 72–77 and pages 78–80, respectively, and Note 6 for further information.
Other income increased, reflecting:
•the $2.8 billion estimated bargain purchase gain in Corporate associated with the First Republic acquisition,
•the impact of net investment hedges in Treasury and CIO, and
•a gain of $339 million recognized in the first quarter of 2023 in AWM on the original minority interest in China International Fund Management (“CIFM”) upon the Firm's acquisition of the remaining 51% interest in the entity,
partially offset by
•lower auto operating lease income in CCB due to a decline in volume,
•lower net gains related to certain other Corporate investments, and
•the net impact of equity investments in CIB, including impairment losses in the second half of 2023,
The prior year included:
•a gain of $914 million on the sale of Visa B shares and proceeds from an insurance settlement in Corporate, and
•a gain on an equity-method investment received in partial satisfaction of a loan in CB.
Refer to Business Segment Results on page 67 and Note 34 for additional information on the First Republic acquisition; Note 5 for additional information on net investment hedges; and Note 6 for further information.
Net interest income increased driven by higher rates, the impact of First Republic, and higher revolving balances in Card Services, partially offset by lower Markets net interest income and lower average deposit balances.
The Firm’s average interest-earning assets were $3.3 trillion, down $23 billion, and the yield was 5.14%, up 236 basis points (“bps”). The net yield on these assets, on an FTE basis, was 2.70%, an increase of 70 bps. The net yield excluding Markets was 3.85%, up 125 bps.
Refer to the Consolidated average balance sheets, interest and rates schedule on pages 310-314 for further information. Net yield excluding Markets is a non-GAAP financial measure. Refer to Explanation and Reconciliation of the Firm’s Use of Non-GAAP Financial Measures on pages 62–64 for a further discussion of Net yield excluding Markets.
JPMorgan Chase & Co./2023 Form 10-K | 55 | |||||||
| Provision for credit losses | |||||||||||||||||
| Year ended December 31, | |||||||||||||||||
| (in millions) | 2023 | 2022 | 2021 | ||||||||||||||
Consumer, excluding credit card | $ | 935 | $ | 506 | $ | (1,933) | |||||||||||
| Credit card | 6,048 | 3,353 | (4,838) | ||||||||||||||
| Total consumer | 6,983 | 3,859 | (6,771) | ||||||||||||||
| Wholesale | 2,299 | 2,476 | (2,449) | ||||||||||||||
| Investment securities | 38 | 54 | (36) | ||||||||||||||
Total provision for credit losses | $ | 9,320 | $ | 6,389 | $ | (9,256) | |||||||||||
2023 compared with 2022
The provision for credit losses was $9.3 billion, reflecting $6.2 billion of net charge-offs and a net addition of $3.1 billion to the allowance for credit losses.
Net charge-offs increased $3.3 billion, consisting of $2.6 billion in consumer, predominantly driven by Card Services, as the portfolio continued to normalize to pre-pandemic levels, and $698 million in wholesale.
The net addition to the allowance for credit losses included $1.9 billion, consisting of:
•$1.3 billion in consumer, predominantly driven by CCB, reflecting a $1.4 billion net addition in Card Services, partially offset by a net reduction of $200 million in Home Lending. The net addition in Card Services was driven by loan growth, including an increase in revolving balances, partially offset by reduced borrower uncertainty. The net reduction in Home Lending was driven by improvements in the outlook for home prices; and
•$657 million in wholesale, driven by net downgrade activity and the net effect of changes in the Firm's weighted average macroeconomic outlook, including a deterioration in the outlook for commercial real estate in CB, partially offset by the impact of changes in the loan and lending-related commitment portfolios.
The net addition also included $1.2 billion to establish the allowance for the First Republic loans and lending-related commitments in the second quarter of 2023.
The provision in the prior year included a $3.5 billion net addition to the allowance for credit losses, consisting of $2.3 billion in wholesale and $1.2 billion in consumer, driven by loan growth and deterioration in the Firm’s macroeconomic outlook, partially offset by a reduction in the allowance related to a decrease in uncertainty associated with borrower behavior as the effects of the pandemic gradually receded, and net charge-offs of $2.9 billion.
Refer to the segment discussions of CCB on pages 68–71, CIB on pages 72–77, CB on pages 78–80, AWM on pages 81–83, the Allowance for Credit Losses on pages 131–133, and Notes 1, 10 and 13 for further discussion of the credit portfolio and the allowance for credit losses.
56 | JPMorgan Chase & Co./2023 Form 10-K | |||||||
| Noninterest expense | |||||||||||
| Year ended December 31, | |||||||||||
| (in millions) | 2023 | 2022 | 2021 | ||||||||
Compensation expense | $ | 46,465 | $ | 41,636 | $ | 38,567 | |||||
Noncompensation expense: | |||||||||||
| Occupancy | 4,590 | 4,696 | 4,516 | ||||||||
Technology, communications and equipment(a) | 9,246 | 9,358 | 9,941 | ||||||||
Professional and outside services | 10,235 | 10,174 | 9,814 | ||||||||
| Marketing | 4,591 | 3,911 | 3,036 | ||||||||
Other(b) | 12,045 | 6,365 | 5,469 | ||||||||
Total noncompensation expense(c) | 40,707 | 34,504 | 32,776 | ||||||||
Total noninterest expense | $ | 87,172 | $ | 76,140 | $ | 71,343 | |||||
(a)Includes depreciation expense associated with auto operating lease assets.
(b)Included Firmwide legal expense of $1.4 billion, $266 million and $426 million, as well as FDIC-related expense of $4.2 billion, $860 million and $730 million for the years ended December 31, 2023, 2022 and 2021, respectively. Refer to Note 6 for additional information.
(c)Reflected the impact of First Republic of $1.5 billion, which included expenses recorded in the second quarter of 2023 with respect to individuals associated with First Republic who did not become employees of the Firm until July 2, 2023. Refer to Business Segment Results on page 67 for additional information.
2023 compared with 2022
Compensation expense increased driven by:
•an increase in employees, primarily in technology and front office, as well as wage inflation,
•the impact of First Republic in the second half of 2023, predominantly in CCB and Corporate, and
•higher volume- and revenue-related compensation predominantly in AWM and CCB.
Noncompensation expense increased as a result of:
•higher FDIC-related expense, which included the $2.9 billion special assessment recognized in Corporate,
•the impact of First Republic in Corporate and CCB,
•higher legal expense in CIB, Corporate and CCB,
•higher investments in the business, including marketing and technology, and
•higher other expenses, including higher indirect tax expense in CIB, and higher travel and entertainment expense across the segments,
partially offset by
•lower depreciation expense on lower auto lease assets.
Refer to Business Segment Results on page 67 and Note 34 for additional information on the First Republic acquisition; Note 6 for further information;
| Income tax expense | |||||||||||||||||
| Year ended December 31, (in millions, except rate) | |||||||||||||||||
| 2023 | 2022 | 2021 | |||||||||||||||
Income before income tax expense | $ | 61,612 | $ | 46,166 | $ | 59,562 | |||||||||||
| Income tax expense | 12,060 | 8,490 | 11,228 | ||||||||||||||
| Effective tax rate | 19.6 | % | 18.4 | % | 18.9 | % | |||||||||||
2023 compared with 2022
The effective tax rate increased predominantly driven by:
•the higher level of pre-tax income and changes in the mix of income and expenses subject to U.S. federal, state and local taxes,
•lower benefits associated with tax audit settlements, and
• vesting of employee stock based awards,
largely offset by
•the impact of the income tax expense associated with the First Republic acquisition that was reflected in the estimated bargain purchase gain, which resulted in a reduction in the Firm’s effective tax rate, and
•an income tax benefit related to the finalization of certain income tax regulations.
Refer to Note 25 for further information.
JPMorgan Chase & Co./2023 Form 10-K | 57 | |||||||
| CONSOLIDATED BALANCE SHEETS AND CASH FLOWS ANALYSIS | ||||||||||||||
Consolidated balance sheets analysis
The following is a discussion of the significant changes between December 31, 2023 and 2022. Refer to pages 155–158 for a discussion of the Critical Accounting Estimates Used by the Firm that affect the Consolidated Balance Sheets.
| Selected Consolidated balance sheets data | ||||||||||||||
| December 31, (in millions) | 2023 | 2022 | Change | |||||||||||
| Assets | ||||||||||||||
| Cash and due from banks | $ | 29,066 | $ | 27,697 | 5 | % | ||||||||
| Deposits with banks | 595,085 | 539,537 | 10 | |||||||||||
Federal funds sold and securities purchased under resale agreements | 276,152 | 315,592 | (12) | |||||||||||
| Securities borrowed | 200,436 | 185,369 | 8 | |||||||||||
| Trading assets | 540,607 | 453,799 | 19 | |||||||||||
| Available-for-sale securities | 201,704 | 205,857 | (2) | |||||||||||
| Held-to-maturity securities | 369,848 | 425,305 | (13) | |||||||||||
| Investment securities, net of allowance for credit losses | 571,552 | 631,162 | (9) | |||||||||||
| Loans | 1,323,706 | 1,135,647 | 17 | |||||||||||
| Allowance for loan losses | (22,420) | (19,726) | 14 | |||||||||||
| Loans, net of allowance for loan losses | 1,301,286 | 1,115,921 | 17 | |||||||||||
Accrued interest and accounts receivable | 107,363 | 125,189 | (14) | |||||||||||
| Premises and equipment | 30,157 | 27,734 | 9 | |||||||||||
| Goodwill, MSRs and other intangible assets | 64,381 | 60,859 | 6 | |||||||||||
| Other assets | 159,308 | 182,884 | (13) | |||||||||||
| Total assets | $ | 3,875,393 | $ | 3,665,743 | 6 | % | ||||||||
Cash and due from banks and deposits with banks increased reflecting the higher level of excess cash placed with the Federal Reserve Banks. The Firm’s excess cash primarily resulted from:
•the net issuance of long-term debt, and
•the impact of maturities and paydowns of investment securities in Treasury and CIO,
partially offset by
•the impacts associated with the First Republic acquisition in the first half of 2023.
Federal funds sold and securities purchased under resale agreements decreased, reflecting a reduction in client-driven market-making activities, partially offset by higher cash deployment in Treasury and CIO.
Securities borrowed increased driven by Markets, reflecting a higher demand for securities to cover short positions and client-driven activities.
Refer to Note 11 for additional information on securities purchased under resale agreements and securities borrowed.
Trading assets increased, reflecting in Markets higher debt and equity instruments on client-driven market-making activities, partially offset by lower derivative receivables, primarily as a result of market movements. Refer to Notes 2 and 5 for additional information.
Investment securities decreased due to:
•lower available-for-sale ("AFS") securities driven by maturities and paydowns, predominantly offset by the impact of First Republic, net purchases, and the transfer of securities from held-to-maturity (“HTM”) in the first
quarter of 2023, and
•lower HTM securities driven by maturities and paydowns, and the transfer of securities to AFS.
Refer to Corporate segment results on pages 84–85, Investment Portfolio Risk Management on page 134 and Notes 2 and 10 for additional information on investment securities.
Loans increased, reflecting:
•$146 billion of loans associated with First Republic,
•growth in new accounts in Card Services, as well as higher revolving balances, which continued to normalize to pre-pandemic levels, and
•growth in Auto loans due to net originations.
The allowance for loan losses increased, reflecting:
•a net addition to the allowance for loan losses of $2.2 billion, consisting of:
–$1.3 billion in consumer, predominantly driven by CCB, reflecting $1.4 billion in Card Services driven by loan growth, including an increase in revolving balances, partially offset by a net reduction of $176 million in Home Lending, and
–$930 million in wholesale, driven by net downgrade activity and the net effect of changes in the Firm's weighted average macroeconomic outlook, and
•$1.1 billion to establish the allowance for the First Republic loans in the second quarter of 2023.
The allowance for loan losses also reflected a reduction of $587 million, on January 1, 2023, as a result of the adoption of the Financial Instruments - Credit Losses: Troubled Debt Restructurings accounting guidance.
58 | JPMorgan Chase & Co./2023 Form 10-K | |||||||
References in this Form 10-K to "changes to the TDR accounting guidance" pertain to the Firm's adoption of this guidance.
There was also a $408 million net reduction in the allowance for lending-related commitments recognized in other liabilities on the Consolidated balance sheets.
Refer to Consolidated Results of Operations and Credit and Investment Risk Management on pages 54–57 and pages 111–134, respectively, and Notes 2, 3, 12 and 13 for additional information on loans and the total allowance for credit losses; and Business Segment Results on page 67 and Note 34 for additional information on the First Republic acquisition.
Accrued interest and accounts receivable decreased due to lower client receivables related to client-driven activities in Markets.
Premises and equipment increased as a result of the construction-in-process associated with the Firm's headquarters, the First Republic acquisition, largely lease right-of-use assets, and higher capitalized software. Refer to Note 16 and 18 for additional information.
Goodwill, MSRs and other intangibles increased predominantly due to:
•other intangibles and goodwill related to the acquisition of the remaining 51% interest in CIFM,
•core deposit intangibles associated with the First Republic acquisition, and
•higher MSRs as a result of net additions primarily from purchases, and the impact of higher interest rates, partially offset by the realization of expected cash flows.
Refer to Note 15 and 34 for additional information.
Other assets decreased reflecting the impact of the change in the type of collateral placed with CCPs from cash to securities.
| Selected Consolidated balance sheets data | ||||||||||||||
| December 31, (in millions) | 2023 | 2022 | Change | |||||||||||
| Liabilities | ||||||||||||||
| Deposits | $ | 2,400,688 | $ | 2,340,179 | 3 | |||||||||
Federal funds purchased and securities loaned or sold under repurchase agreements | 216,535 | 202,613 | 7 | |||||||||||
| Short-term borrowings | 44,712 | 44,027 | 2 | |||||||||||
| Trading liabilities | 180,428 | 177,976 | 1 | |||||||||||
| Accounts payable and other liabilities | 290,307 | 300,141 | (3) | |||||||||||
Beneficial interests issued by consolidated variable interest entities (“VIEs”) | 23,020 | 12,610 | 83 | |||||||||||
| Long-term debt | 391,825 | 295,865 | 32 | |||||||||||
| Total liabilities | 3,547,515 | 3,373,411 | 5 | |||||||||||
| Stockholders’ equity | 327,878 | 292,332 | 12 | |||||||||||
Total liabilities and stockholders’ equity | $ | 3,875,393 | $ | 3,665,743 | 6 | % | ||||||||
Deposits increased, reflecting the net impact of:
•higher balances in CIB due to net issuances of structured notes as a result of client demand, as well as deposit inflows from client-driven activities in Payments and Securities Services, partially offset by deposit attrition, including actions taken to reduce certain deposits,
•growth in Corporate related to the Firm's international consumer initiatives,
•lower balances in CCB reflecting higher customer spending,
•a decline in AWM due to continued migration into higher-yielding investments driven by the higher interest rate environment, predominantly offset by growth from new and existing customers as a result of new product offerings, and
•a decrease in CB due to continued deposit attrition as clients seek higher-yielding investments, predominantly offset by the retention of inflows associated with disruptions in the market in the first quarter of 2023.
The net increase also included $61 billion of deposits associated with First Republic, primarily reflected in CCB, AWM and CB.
Federal funds purchased and securities loaned or sold under repurchase agreements increased, reflecting the impact of a lower level of netting on reduced repurchase activity.
Refer to Liquidity Risk Management on pages 102–109 for additional information on deposits, federal funds purchased and securities loaned or sold under repurchase agreements, and short-term borrowings; Notes 2 and 17 for deposits and Note 11 for federal funds purchased and securities loaned or sold under repurchase agreements; Business Segment Results on page 67 and Note 34 for additional information on the First Republic acquisition.
Trading liabilities increased due to client-driven market-making activities in Fixed Income Markets, which resulted in higher levels of short positions in debt instruments, partially offset by lower derivative payables primarily as a result of market movements. Refer to Notes 2 and 5 for additional information.
Accounts payable and other liabilities decreased primarily due to lower client payables related to client-driven activities in Markets, partially offset by higher accounts payable and accrued liabilities, including the $2.9 billion payable related to the FDIC special assessment. Refer to Note 19 for additional information.
JPMorgan Chase & Co./2023 Form 10-K | 59 | |||||||
Beneficial interests issued by consolidated VIEs increased in CIB primarily driven by higher levels of Firm-administered multi-seller conduit commercial paper held by third parties, reflecting changes in the Firm’s short-term liquidity management. Refer to Liquidity Risk Management on pages 102–109; and Notes 14 and 28 for additional information on Firm-sponsored VIEs and loan securitization trusts.
Long-term debt increased, reflecting the impact of First Republic, which included the Purchase Money Note issued to the FDIC and additional FHLB advances, as well as net issuance consistent with the Firm’s long-term funding plans. The increase was also attributable to net issuances of structured notes in Markets due to client demand and an increase in fair value. Refer to Liquidity Risk Management on pages 102–109 and Note 34 for additional information on the First Republic acquisition.
Stockholders’ equity: refer to Consolidated Statements of changes in stockholders’ equity on page 169, Capital Actions on page 99, and Note 24 for additional information.
60 | JPMorgan Chase & Co./2023 Form 10-K | |||||||
Consolidated cash flows analysis
The following is a discussion of cash flow activities during the years ended December 31, 2023 and 2022. Refer to Consolidated cash flows analysis on page 57 of the Firm’s 2022 Form 10-K for a discussion of the 2021 activities.
| (in millions) | Year ended December 31, | |||||||||||||||||||
| 2023 | 2022 | 2021 | ||||||||||||||||||
Net cash provided by/(used in) | ||||||||||||||||||||
| Operating activities | $ | 12,974 | $ | 107,119 | $ | 78,084 | ||||||||||||||
| Investing activities | 67,643 | (137,819) | (129,344) | |||||||||||||||||
Financing activities | (25,571) | (126,257) | 275,993 | |||||||||||||||||
Effect of exchange rate changes on cash | 1,871 | (16,643) | (11,508) | |||||||||||||||||
Net increase/(decrease) in cash and due from banks and deposits with banks | $ | 56,917 | $ | (173,600) | $ | 213,225 | ||||||||||||||
Operating activities
JPMorgan Chase’s operating assets and liabilities primarily support the Firm’s lending and capital markets activities. These assets and liabilities can vary significantly in the normal course of business due to the amount and timing of cash flows, which are affected by client-driven and risk management activities and market conditions. The Firm believes that cash flows from operations, available cash and other liquidity sources, and its capacity to generate cash through secured and unsecured sources, are sufficient to meet its operating liquidity needs.
•In 2023, cash provided primarily reflected net income, lower other assets, and accrued interest and accounts receivable, predominantly offset by higher trading assets, lower accounts payable and other liabilities, and higher securities borrowed.
•In 2022, cash provided resulted from higher accounts payable and other liabilities, lower securities borrowed, and net proceeds from sales, securitizations, and paydowns of loans held-for-sale, partially offset by higher trading assets.
Investing activities
The Firm’s investing activities predominantly include originating held-for-investment loans, investing in the investment securities portfolio and other short-term instruments.
•In 2023, cash provided resulted from net proceeds from investment securities, proceeds from sales and securitizations of loans held-for-investment and lower securities purchased under resale agreements, largely offset by net originations of loans and net cash used in the First Republic Bank acquisition.
•In 2022, cash used resulted from net originations of loans and higher securities purchased under resale agreements, partially offset by net proceeds from investment securities.
Financing activities
The Firm’s financing activities include acquiring customer deposits and issuing long-term debt and preferred stock.
•In 2023, cash used reflected lower deposits, which included the impact of the repayment of the deposits provided to First Republic Bank by the consortium of large U.S. banks that the Firm assumed as part of the First Republic acquisition, partially offset by higher securities loaned under repurchase agreements and net proceeds from long- and short-term borrowings.
•In 2022, cash used reflected lower deposits, partially offset by net proceeds from long- and short-term borrowings.
•For both periods, cash was used for repurchases of common stock and cash dividends on common and preferred stock.
* * *
Refer to Consolidated Balance Sheets Analysis on pages 58–60, Capital Risk Management on pages 91-101, and Liquidity Risk Management on pages 102–109, and the Consolidated Statements of Cash Flows on page 170 for a further discussion of the activities affecting the Firm’s cash flows.
JPMorgan Chase & Co./2023 Form 10-K | 61 | |||||||
EXPLANATION AND RECONCILIATION OF THE FIRM’S USE OF NON-GAAP FINANCIAL MEASURES | ||
Non-GAAP financial measures
The Firm prepares its Consolidated Financial Statements in accordance with U.S. GAAP; these financial statements appear on pages 166–170. That presentation, which is referred to as “reported” basis, provides the reader with an understanding of the Firm’s results that can be tracked consistently from year-to-year and enables a comparison of the Firm’s performance with the U.S. GAAP financial statements of other companies.
In addition to analyzing the Firm’s results on a reported basis, management reviews Firmwide results, including the overhead ratio, on a “managed” basis; these Firmwide managed basis results are non-GAAP financial measures. The Firm also reviews the results of the LOBs on a managed basis. The Firm’s definition of managed basis starts, in each case, with the reported U.S. GAAP results and includes certain reclassifications to present total net revenue for the Firm (and each of the reportable business segments) on an FTE basis. Accordingly, revenue from investments that receive tax credits and tax-exempt securities is presented in the managed results on a basis comparable to taxable investments and securities. These financial measures allow
management to assess the comparability of revenue from year-to-year arising from both taxable and tax-exempt sources. The corresponding income tax impact related to tax-exempt items is recorded within income tax expense. These adjustments have no impact on net income as reported by the Firm as a whole or by the LOBs.
Management also uses certain non-GAAP financial measures at the Firm and business-segment level because these other non-GAAP financial measures provide information to investors about the underlying operational performance and trends of the Firm or of the particular business segment, as the case may be, and therefore facilitate a comparison of the Firm or the business segment with the performance of its relevant competitors. Refer to Business Segment Results on pages 65–85 for additional information on these non-GAAP measures. Non-GAAP financial measures used by the Firm may not be comparable to similarly named non-GAAP financial measures used by other companies.
The following summary table provides a reconciliation from the Firm’s reported U.S. GAAP results to managed basis.
| 2023 | 2022 | 2021 | |||||||||||||||||||||||||||||||||||||||||||||||||||
| Year ended December 31, (in millions, except ratios) | Reported | Fully taxable-equivalent adjustments(a) | Managed basis | Reported | Fully taxable-equivalent adjustments(a) | Managed basis | Reported | Fully taxable-equivalent adjustments(a) | Managed basis | ||||||||||||||||||||||||||||||||||||||||||||
| Other income | $ | 5,609 | $ | 3,782 | $ | 9,391 | $ | 4,322 | $ | 3,148 | $ | 7,470 | $ | 4,830 | $ | 3,225 | $ | 8,055 | |||||||||||||||||||||||||||||||||||
| Total noninterest revenue | 68,837 | 3,782 | 72,619 | 61,985 | 3,148 | 65,133 | 69,338 | 3,225 | 72,563 | ||||||||||||||||||||||||||||||||||||||||||||
| Net interest income | 89,267 | 480 | 89,747 | 66,710 | 434 | 67,144 | 52,311 | 430 | 52,741 | ||||||||||||||||||||||||||||||||||||||||||||
| Total net revenue | 158,104 | 4,262 | 162,366 | 128,695 | 3,582 | 132,277 | 121,649 | 3,655 | 125,304 | ||||||||||||||||||||||||||||||||||||||||||||
| Total noninterest expense | 87,172 | NA | 87,172 | 76,140 | NA | 76,140 | 71,343 | NA | 71,343 | ||||||||||||||||||||||||||||||||||||||||||||
| Pre-provision profit | 70,932 | 4,262 | 75,194 | 52,555 | 3,582 | 56,137 | 50,306 | 3,655 | 53,961 | ||||||||||||||||||||||||||||||||||||||||||||
| Provision for credit losses | 9,320 | NA | 9,320 | 6,389 | NA | 6,389 | (9,256) | NA | (9,256) | ||||||||||||||||||||||||||||||||||||||||||||
| Income before income tax expense | 61,612 | 4,262 | 65,874 | 46,166 | 3,582 | 49,748 | 59,562 | 3,655 | 63,217 | ||||||||||||||||||||||||||||||||||||||||||||
| Income tax expense | 12,060 | 4,262 | 16,322 | 8,490 | 3,582 | 12,072 | 11,228 | 3,655 | 14,883 | ||||||||||||||||||||||||||||||||||||||||||||
| Net income | $ | 49,552 | NA | $ | 49,552 | $ | 37,676 | NA | $ | 37,676 | $ | 48,334 | NA | $ | 48,334 | ||||||||||||||||||||||||||||||||||||||
| Overhead ratio | 55 | % | NM | 54 | % | 59 | % | NM | 58 | % | 59 | % | NM | 57 | % | ||||||||||||||||||||||||||||||||||||||
(a)Predominantly recognized in CIB, CB and Corporate.
62 | JPMorgan Chase & Co./2023 Form 10-K | |||||||
Net interest income, net yield, and noninterest revenue excluding Markets
In addition to reviewing net interest income, net yield, and noninterest revenue on a managed basis, management also reviews these metrics excluding Markets, as shown below. Markets consists of CIB’s Fixed Income Markets and Equity Markets. These metrics, which exclude Markets, are non-GAAP financial measures. Management reviews these metrics to assess the performance of the Firm’s lending, investing (including asset-liability management) and deposit-raising activities, apart from any volatility associated with Markets activities. In addition, management also assesses Markets business performance on a total revenue basis as offsets may occur across revenue lines. Management believes that these measures provide investors and analysts with alternative measures to analyze the revenue trends of the Firm.
| Year ended December 31, (in millions, except rates) | 2023 | 2022 | 2021 | ||||||||
| Net interest income – reported | $ | 89,267 | $ | 66,710 | $ | 52,311 | |||||
| Fully taxable-equivalent adjustments | 480 | 434 | 430 | ||||||||
Net interest income – managed basis(a) | $ | 89,747 | $ | 67,144 | $ | 52,741 | |||||
Less: Markets net interest income(b) | (294) | 4,789 | 8,243 | ||||||||
Net interest income excluding Markets(a) | $ | 90,041 | $ | 62,355 | $ | 44,498 | |||||
| Average interest-earning assets | $ | 3,325,708 | $ | 3,349,079 | $ | 3,215,942 | |||||
Less: Average Markets interest-earning assets(b) | 985,777 | 953,195 | 888,238 | ||||||||
| Average interest-earning assets excluding Markets | $ | 2,339,931 | $ | 2,395,884 | $ | 2,327,704 | |||||
| Net yield on average interest-earning assets – managed basis | 2.70 | % | 2.00 | % | 1.64 | % | |||||
Net yield on average Markets interest-earning assets(b) | (0.03) | 0.50 | 0.93 | ||||||||
| Net yield on average interest-earning assets excluding Markets | 3.85 | % | 2.60 | % | 1.91 | % | |||||
| Noninterest revenue – reported | $ | 68,837 | $ | 61,985 | $ | 69,338 | |||||
| Fully taxable-equivalent adjustments | 3,782 | 3,148 | 3,225 | ||||||||
| Noninterest revenue – managed basis | $ | 72,619 | $ | 65,133 | $ | 72,563 | |||||
Less: Markets noninterest revenue(b) | 28,086 | 24,195 | 19,151 | ||||||||
| Noninterest revenue excluding Markets | $ | 44,533 | $ | 40,938 | $ | 53,412 | |||||
Memo: Total Markets net revenue(b) | $ | 27,792 | $ | 28,984 | $ | 27,394 | |||||
(a)Interest includes the effect of related hedges. Taxable-equivalent amounts are used where applicable.
(b)Refer to pages 75-76 for further information on Markets.
Calculation of certain U.S. GAAP and non-GAAP financial measures | ||||||||||||||
Certain U.S. GAAP and non-GAAP financial measures are calculated as follows: | ||||||||||||||
Book value per share (“BVPS”) Common stockholders’ equity at period-end / Common shares at period-end | ||||||||||||||
Overhead ratio Total noninterest expense / Total net revenue | ||||||||||||||
ROA Reported net income / Total average assets | ||||||||||||||
ROE Net income* / Average common stockholders’ equity | ||||||||||||||
ROTCE Net income* / Average tangible common equity | ||||||||||||||
TBVPS Tangible common equity at period-end / Common shares at period-end | ||||||||||||||
* Represents net income applicable to common equity | ||||||||||||||
In addition, the Firm reviews other non-GAAP measures such as:
•Adjusted expense, which represents noninterest expense excluding Firmwide legal expense, and
•Pre-provision profit, which represents total net revenue less total noninterest expense.
Management believes that these measures help investors understand the effect of these items on reported results and provide an alternative presentation of the Firm’s performance.
The Firm also reviews the allowance for loan losses to period-end loans retained excluding trade finance and conduits, a non-GAAP financial measure, to provide a more meaningful assessment of CIB’s allowance coverage ratio.
JPMorgan Chase & Co./2023 Form 10-K | 63 | |||||||
TCE, ROTCE and TBVPS
TCE, ROTCE and TBVPS are each non-GAAP financial measures. TCE represents the Firm’s common stockholders’ equity (i.e., total stockholders’ equity less preferred stock) less goodwill and identifiable intangible assets (other than MSRs), net of related deferred tax liabilities. ROTCE measures the Firm’s net income applicable to common equity as a percentage of average TCE. TBVPS represents the Firm’s TCE at period-end divided by common shares at period-end. TCE, ROTCE and TBVPS are utilized by the Firm, as well as investors and analysts, in assessing the Firm’s use of equity.
The following summary table provides a reconciliation from the Firm’s common stockholders’ equity to TCE.
| Period-end | Average | |||||||||||||||||||
| Dec 31, 2023 | Dec 31, 2022 | Year ended December 31, | ||||||||||||||||||
| (in millions, except per share and ratio data) | 2023 | 2022 | 2021 | |||||||||||||||||
Common stockholders’ equity | $ | 300,474 | $ | 264,928 | $ | 282,056 | $ | 253,068 | $ | 250,968 | ||||||||||
| Less: Goodwill | 52,634 | 51,662 | 52,258 | 50,952 | 49,584 | |||||||||||||||
Less: Other intangible assets | 3,225 | 1,224 | 2,572 | 1,112 | 876 | |||||||||||||||
Add: Certain deferred tax liabilities(a) | 2,996 | 2,510 | 2,883 | 2,505 | 2,474 | |||||||||||||||
| Tangible common equity | $ | 247,611 | $ | 214,552 | $ | 230,109 | $ | 203,509 | $ | 202,982 | ||||||||||
| Return on tangible common equity | NA | NA | 21 | % | 18 | % | 23 | % | ||||||||||||
| Tangible book value per share | $ | 86.08 | $ | 73.12 | NA | NA | NA | |||||||||||||
(a)Represents deferred tax liabilities related to tax-deductible goodwill and to identifiable intangibles created in nontaxable transactions, which are netted against goodwill and other intangibles when calculating TCE.
64 | JPMorgan Chase & Co./2023 Form 10-K | |||||||
| BUSINESS SEGMENT RESULTS | ||||||||||||||
The Firm is managed on an LOB basis. There are four major reportable business segments – Consumer & Community Banking, Corporate & Investment Bank, Commercial Banking and Asset & Wealth Management. In addition, there is a Corporate segment.
The business segments are determined based on the products and services provided, or the type of customer served, and they reflect the manner in which financial information is evaluated by the Firm’s Operating Committee. Segment results are presented on a managed basis. Refer to Explanation and Reconciliation of the Firm’s use of Non-GAAP Financial Measures, on pages 62–64 for a definition of managed basis.
JPMorgan Chase (a) | ||||||||||||||||||||||||||||||||||||||
| Consumer Businesses | Wholesale Businesses | |||||||||||||||||||||||||||||||||||||
| Consumer & Community Banking | Corporate & Investment Bank | Commercial Banking | Asset & Wealth Management | |||||||||||||||||||||||||||||||||||
| Banking & Wealth Management | Home Lending | Card Services & Auto | Banking | Markets & Securities Services | • Middle Market Banking | • Asset Management | ||||||||||||||||||||||||||||||||
• Consumer Banking • J.P. Morgan Wealth Management • Business Banking | • Home Lending Production • Home Lending Servicing • Real Estate Portfolios | • Card Services • Auto | • Investment Banking • Payments • Lending | • Fixed Income Markets | • Corporate Client Banking | • Global Private Bank | ||||||||||||||||||||||||||||||||
• Equity Markets • Securities Services • Credit Adjustments & Other | • Commercial Real Estate Banking | |||||||||||||||||||||||||||||||||||||
(a)As a result of the organizational changes that were announced on January 25, 2024, the Firm will be reorganizing its business segments to reflect the manner in which the segments will be managed. The reorganization of the business segments is expected to be effective in the second quarter of 2024. Refer to Recent events on page 52 for additional information.
Description of business segment reporting methodology
Results of the business segments are intended to present each segment as if it were a stand-alone business. The management reporting process that derives business segment results includes the allocation of certain income and expense items. The Firm periodically assesses the assumptions, methodologies and reporting classifications used for segment reporting, and therefore further refinements may be implemented in future periods. The Firm also assesses the level of capital required for each LOB on at least an annual basis. The Firm’s LOBs also provide various business metrics which are utilized by the Firm and its investors and analysts in assessing performance.
Revenue sharing
When business segments join efforts to sell products and services to the Firm’s clients and customers, the participating business segments may agree to share revenue from those transactions. Revenue is generally recognized in the segment responsible for the related product or service, with allocations to the other segment(s) involved in the transaction. The segment results reflect these revenue-sharing agreements.
Expense allocation
Where business segments use services provided by corporate support units, or another business segment, the costs of those services are allocated to the respective business segments. The expense is generally
allocated based on the actual cost and use of services provided. In contrast, certain costs and investments related to corporate support units, technology and operations that are not currently utilized by any LOB are not allocated to the business segments and are retained in Corporate. Expense retained in Corporate generally includes costs that would not be incurred if the segments were stand-alone businesses, and other items not solely aligned with a particular business segment.
Funds transfer pricing
Funds transfer pricing (“FTP”) is the process by which the Firm allocates interest income and expense to the LOBs and Other Corporate and transfers the primary interest rate risk and liquidity risk to Treasury and CIO.
The funds transfer pricing process considers the interest rate and liquidity risk characteristics of assets and liabilities and off-balance sheet products. Periodically, the methodology and assumptions utilized in the FTP process are adjusted to reflect economic conditions and other factors, which may impact the allocation of net interest income to the segments.
As a result of the higher interest rate environment, the cost of funds for assets and the credits earned for liabilities have generally increased, impacting the business segments’ net interest income. During the period ended December 31, 2023, this has resulted in higher cost of funds for loans and
JPMorgan Chase & Co./2023 Form 10-K | 65 | |||||||
Markets activities, and contributed to margin expansion on deposits.
Foreign exchange risk
Foreign exchange risk is transferred from the LOBs and Other Corporate to Treasury and CIO for certain revenues and expenses. Treasury and CIO manages these risks centrally and reports the impact of foreign exchange rate movements related to the transferred risk in its results. Refer to Market Risk Management on page 143 for additional information.
Debt expense and preferred stock dividend allocation
As part of the funds transfer pricing process, almost all of the cost of the credit spread component of outstanding unsecured long-term debt and preferred stock dividends is allocated to the reportable business segments, while the balance of the cost is retained in Corporate. The methodology to allocate the cost of unsecured long-term debt and preferred stock dividends to the business segments is aligned with the relevant regulatory capital requirements and funding needs of the LOBs, as applicable.
The allocated cost of unsecured long-term debt is included in a business segment’s net interest income, and net income is reduced by preferred stock dividends, to arrive at a business segment’s net income applicable to common equity.
Refer to Capital Risk Management on pages 91-101 for additional information.
Capital allocation
The amount of capital assigned to each business segment is referred to as equity. The Firm’s current allocation methodology incorporates Basel III Standardized risk-weighted assets (“RWA”) and the global systemically important banks (“GSIB”) surcharge, both under rules currently in effect, as well as a simulation of capital in a severe stress environment. At least annually, the assumptions, judgments and methodologies used to allocate capital are reassessed and, as a result, the capital allocated to the LOBs may change.
Refer to Line of business equity on page 98 for additional information on capital allocation.
Segment Results – Managed Basis
The following tables summarize the Firm’s results by segment for the periods indicated.
| Year ended December 31, | Consumer & Community Banking | Corporate & Investment Bank | Commercial Banking | ||||||||||||||||||||||||||||||||||||||
| (in millions, except ratios) | 2023 | 2022 | 2021 | 2023 | 2022 | 2021 | 2023 | 2022 | 2021 | ||||||||||||||||||||||||||||||||
| Total net revenue | $ | 70,148 | $ | 54,814 | (a) | $ | 49,879 | (a) | $ | 48,807 | $ | 48,102 | (a) | $ | 51,943 | (a) | $ | 15,546 | $ | 11,533 | $ | 10,008 | |||||||||||||||||||
| Total noninterest expense | 34,819 | 31,208 | (a) | 29,028 | (a) | 28,594 | 27,350 | (a) | 25,553 | (a) | 5,378 | 4,719 | 4,041 | ||||||||||||||||||||||||||||
| Pre-provision profit/(loss) | 35,329 | 23,606 | 20,851 | 20,213 | 20,752 | 26,390 | 10,168 | 6,814 | 5,967 | ||||||||||||||||||||||||||||||||
| Provision for credit losses | 6,899 | 3,813 | (6,989) | 121 | 1,158 | (1,174) | 1,970 | 1,268 | (947) | ||||||||||||||||||||||||||||||||
| Net income/(loss) | 21,232 | 14,916 | (a) | 20,957 | (a) | 14,129 | 14,925 | (a) | 21,107 | (a) | 6,143 | 4,213 | 5,246 | ||||||||||||||||||||||||||||
| Return on equity (“ROE”) | 38 | % | 29 | % | 41 | % | 13 | % | 14 | % | 25 | % | 20 | % | 16 | % | 21 | % | |||||||||||||||||||||||
| Year ended December 31, | Asset & Wealth Management | Corporate | Total | ||||||||||||||||||||||||||||||||
| (in millions, except ratios) | 2023 | 2022 | 2021 | 2023 | 2022 | 2021 | 2023 | 2022 | 2021 | ||||||||||||||||||||||||||
| Total net revenue | $ | 19,827 | $ | 17,748 | $ | 16,957 | $ | 8,038 | $ | 80 | $ | (3,483) | $ | 162,366 | $ | 132,277 | $ | 125,304 | |||||||||||||||||
| Total noninterest expense | 12,780 | 11,829 | 10,919 | 5,601 | 1,034 | 1,802 | 87,172 | 76,140 | 71,343 | ||||||||||||||||||||||||||
| Pre-provision profit/(loss) | 7,047 | 5,919 | 6,038 | 2,437 | (954) | (5,285) | 75,194 | 56,137 | 53,961 | ||||||||||||||||||||||||||
| Provision for credit losses | 159 | 128 | (227) | 171 | 22 | 81 | 9,320 | 6,389 | (9,256) | ||||||||||||||||||||||||||
| Net income/(loss) | 5,227 | 4,365 | 4,737 | 2,821 | (743) | (3,713) | 49,552 | 37,676 | 48,334 | ||||||||||||||||||||||||||
| Return on equity (“ROE”) | 31 | % | 25 | % | 33 | % | NM | NM | NM | 17 | % | 14 | % | 19 | % | ||||||||||||||||||||
(a)In the first quarter of 2023, the allocations of revenue and expense to CCB associated with a Merchant Services revenue sharing agreement were discontinued and are now retained in Payments in CIB. Prior-period amounts have been revised to conform with the current presentation.
66 | JPMorgan Chase & Co./2023 Form 10-K | |||||||
Selected Firmwide Metrics
The following tables present key metrics for Wealth Management, which consists of the Global Private Bank in AWM and J.P. Morgan Wealth Management in CCB; and total revenue and key metrics for J.P. Morgan Payments, which consists of payments activities in CIB and CB. This presentation is intended to provide investors with additional information concerning Wealth Management and J.P. Morgan Payments, each of which consists of similar business activities conducted across LOBs to serve different types of clients and customers.
Selected metrics - Wealth Management
| Year ended December 31, | 2023 | 2022 | 2021 | |||||||||||
Client assets (in billions)(a) | $ | 3,177 | (b) | $ | 2,438 | $ | 2,456 | |||||||
| Number of client advisors | 8,971 | 8,166 | 7,463 | |||||||||||
(a) Consists of Global Private Bank in AWM and client investment assets in J.P. Morgan Wealth Management in CCB.
(b)At December 31, 2023, included $144.6 billion of client investment assets associated with First Republic.
Selected metrics - J.P. Morgan Payments
| (in millions, except where otherwise noted) | |||||||||||
| Year ended December 31, | 2023 | 2022 | 2021 | ||||||||
Total net revenue(a) | $ | 18,248 | $ | 13,909 | $ | 9,861 | |||||
| Merchant processing volume (in billions) | 2,408 | 2,158 | 1,887 | ||||||||
| Average deposits (in billions) | 715 | 779 | 800 | ||||||||
(a)Includes certain revenues that are reported as investment banking product revenue in CB, and excludes the net impact of equity investments.
Segment information related to First Republic
The following table presents selected impacts to CCB, CB, AWM and Corporate associated with First Republic from the acquisition date of May 1, 2023.
| As of or for the year ended December 31, 2023 | ||||||||||||||||||||||||||||||||
| (in millions) | Consumer & Community Banking | Commercial Banking | Asset & Wealth Management | Corporate | Total | |||||||||||||||||||||||||||
| Selected Income Statement Data | ||||||||||||||||||||||||||||||||
| Revenue | ||||||||||||||||||||||||||||||||
| Asset management fees | $ | 387 | $ | — | $ | — | $ | — | $ | 387 | ||||||||||||||||||||||
| All other income | 489 | 201 | 503 | 2,862 | (b) | 4,055 | ||||||||||||||||||||||||||
| Noninterest revenue | 876 | 201 | 503 | 2,862 | 4,442 | |||||||||||||||||||||||||||
| Net interest income | 2,401 | 704 | 668 | (55) | 3,718 | |||||||||||||||||||||||||||
| Total net revenue | 3,277 | 905 | 1,171 | 2,807 | 8,160 | |||||||||||||||||||||||||||
| Provision for credit losses | 421 | 731 | 128 | — | 1,280 | |||||||||||||||||||||||||||
| Noninterest expense | 1,219 | 45 | 50 | 1,033 | (c) | 2,347 | ||||||||||||||||||||||||||
| Net income | 1,244 | 98 | 753 | 2,015 | 4,110 | |||||||||||||||||||||||||||
| Selected Balance Sheet Data (period-end) | ||||||||||||||||||||||||||||||||
| Loans | $ | 94,671 | $ | 38,495 | $ | 11,436 | $ | — | $ | 144,602 | (d) | |||||||||||||||||||||
Deposits (a) | 42,710 | 6,163 | 12,098 | — | 60,971 | (d) | ||||||||||||||||||||||||||
(a)In the fourth quarter of 2023, CCB transferred certain deposits associated with First Republic to AWM, CB and CIB.
(b)Included the preliminary estimated bargain purchase gain of $2.7 billion recorded in other income. For the year ended December 31, 2023, reflects measurement period adjustments of $63 million, resulting in an estimated bargain purchase gain of $2.8 billion for the year ended December 31, 2023. Refer to Note 34 for additional information.
(c)Included $360 million of restructuring and integration costs.
(d)Excluded $1.9 billion of loans and $508 million of deposits allocated to CIB.
The following sections provide a comparative discussion of the Firm’s results by segment as of or for the years ended December 31, 2023 and 2022, unless otherwise specified.
JPMorgan Chase & Co./2023 Form 10-K | 67 | |||||||
| CONSUMER & COMMUNITY BANKING | ||||||||||||||
Consumer & Community Banking offers products and services to consumers and small businesses through bank branches, ATMs, digital (including mobile and online) and telephone banking. CCB is organized into Banking & Wealth Management (including Consumer Banking, J.P. Morgan Wealth Management and Business Banking), Home Lending (including Home Lending Production, Home Lending Servicing and Real Estate Portfolios) and Card Services & Auto. Banking & Wealth Management offers deposit, investment and lending products, cash management, payments and services. Home Lending includes mortgage origination and servicing activities, as well as portfolios consisting of residential mortgages and home equity loans. Card Services issues credit cards and offers travel services. Auto originates and services auto loans and leases. | ||
| Selected income statement data | ||||||||||||||||||||
| Year ended December 31, | ||||||||||||||||||||
| (in millions, except ratios) | 2023 | 2022 | 2021 | |||||||||||||||||
| Revenue | ||||||||||||||||||||
| Lending- and deposit-related fees | $ | 3,356 | $ | 3,316 | $ | 3,034 | ||||||||||||||
| Asset management fees | 3,282 | (d) | 2,734 | 2,794 | ||||||||||||||||
| Mortgage fees and related income | 1,175 | 1,236 | 2,159 | |||||||||||||||||
| Card income | 2,532 | 2,469 | (f) | 3,364 | (f) | |||||||||||||||
All other income(a) | 4,773 | (d) | 5,131 | (f) | 5,741 | (f) | ||||||||||||||
| Noninterest revenue | 15,118 | 14,886 | 17,092 | |||||||||||||||||
| Net interest income | 55,030 | (d) | 39,928 | 32,787 | ||||||||||||||||
| Total net revenue | 70,148 | 54,814 | 49,879 | |||||||||||||||||
| Provision for credit losses | 6,899 | (d) | 3,813 | (6,989) | ||||||||||||||||
| Noninterest expense | ||||||||||||||||||||
| Compensation expense | 15,171 | 13,092 | 12,142 | |||||||||||||||||
Noncompensation expense(b) | 19,648 | 18,116 | (f) | 16,886 | (f) | |||||||||||||||
| Total noninterest expense | 34,819 | (d) | 31,208 | 29,028 | ||||||||||||||||
| Income before income tax expense | 28,430 | 19,793 | 27,840 | |||||||||||||||||
| Income tax expense | 7,198 | 4,877 | (f) | 6,883 | (f) | |||||||||||||||
| Net income | $ | 21,232 | $ | 14,916 | $ | 20,957 | ||||||||||||||
| Revenue by line of business | ||||||||||||||||||||
| Banking & Wealth Management | $ | 43,199 | (e) | $ | 30,059 | (f) | $ | 23,786 | (f) | |||||||||||
| Home Lending | 4,140 | (e) | 3,674 | 5,291 | ||||||||||||||||
| Card Services & Auto | 22,809 | 21,081 | 20,802 | |||||||||||||||||
| Mortgage fees and related income details: | ||||||||||||||||||||
| Production revenue | 421 | 497 | 2,215 | |||||||||||||||||
Net mortgage servicing revenue(c) | 754 | 739 | (56) | |||||||||||||||||
| Mortgage fees and related income | $ | 1,175 | $ | 1,236 | $ | 2,159 | ||||||||||||||
| Financial ratios | ||||||||||||||||||||
| Return on equity | 38 | % | 29 | % | 41 | % | ||||||||||||||
| Overhead ratio | 50 | 57 | 58 | |||||||||||||||||
(a)Primarily includes operating lease income and commissions and other fees. Operating lease income was $2.8 billion, $3.6 billion and $4.8 billion for the years ended December 31, 2023, 2022 and 2021, respectively.
(b)Included depreciation expense on leased assets of $1.7 billion, $2.4 billion and $3.3 billion for the years ended December 31, 2023, 2022 and 2021, respectively.
(c)Included MSR risk management results of $131 million, $93 million and $(525) million for the years ended December 31, 2023, 2022 and 2021, respectively.
(d)Includes First Republic. Refer to page 67 for additional information.
(e)Banking & Wealth Management and Home Lending included revenue associated with First Republic of $2.3 billion and $932 million, respectively, for the year ended December 31, 2023.
(f)In the first quarter of 2023, the allocations of revenue and expense to CCB associated with a Merchant Services revenue sharing agreement were discontinued and are now retained in Payments in CIB. Prior-period amounts have been revised to conform with the current presentation.
68 | JPMorgan Chase & Co./2023 Form 10-K | |||||||
2023 compared with 2022
Net income was $21.2 billion, up 42%.
Net revenue was $70.1 billion, up 28%.
Net interest income was $55.0 billion, up 38%, driven by:
•deposit margin expansion on higher rates, partially offset by lower average deposits and the impact of lower PPP loan forgiveness in Banking & Wealth Management (“BWM”),
•higher Card Services NII, reflecting an increase in revolving balances, and
•the impact of First Republic in Home Lending.
Noninterest revenue was $15.1 billion, up 2%, driven by:
•higher asset management fees due to the impact of First Republic as well as higher market levels and strong net inflows, higher commissions on annuity sales in BWM and higher other service fees associated with First Republic,
•higher net interchange income on increased debit and credit card sales volume, and
–In Card Services, higher annual fees and the higher net interchange income were more than offset by an increase in amortization related to new account origination costs, reflecting continued growth. Net interchange income in Card Services also reflected the impact of a reduction in rewards costs and partner payments in the first quarter of 2023 related to a periodic tax refund on airline miles redeemed and an increase to the rewards liability due to adjustments to certain reward program terms in the second quarter of 2023;
•higher travel-related commissions in Card Services,
predominantly offset by
•lower auto operating lease income as a result of a decline in volume, and
•lower mortgage fees and related income in Home Lending.
Refer to Note 6 for additional information on card income,
asset management fees, and commissions and other fees; and Critical Accounting Estimates on pages 155–158 for credit card rewards liability.
Refer to Note 15 for further information regarding changes in the value of the MSR asset and related hedges, and mortgage fees and related income.
Refer to Note 34 for additional information on the First Republic acquisition.
Noninterest expense was $34.8 billion, up 12%, reflecting:
•higher compensation expense, driven by an increase in employees, including the impact of First Republic in the second half of 2023 and additions primarily in bankers, advisors and technology, wage inflation and higher revenue-related compensation, as well as
•higher noncompensation expense, driven by the impact of First Republic, investments in marketing and technology, the increase in the FDIC assessment announced in the prior year as well as higher legal expense, partially offset by lower auto lease depreciation on lower auto lease assets.
The provision for credit losses was $6.9 billion, reflecting:
•net charge-offs of $5.3 billion, up $2.6 billion, predominantly driven by Card Services, as the portfolio continued to normalize to pre-pandemic levels,
•a $1.2 billion net addition to the allowance for credit losses, which included $1.4 billion in Card Services, partially offset by a net reduction of $200 million in Home Lending. The net addition in Card Services was driven by loan growth, including an increase in revolving balances, partially offset by reduced borrower uncertainty. The net reduction in Home Lending was driven by improvements in the outlook for home prices; and
•$408 million to establish the allowance for the First Republic loans and lending-related commitments in the second quarter of 2023.
The provision in the prior year was $3.8 billion, driven by net charge-offs of $2.7 billion and a $1.1 billion net addition to the allowance for credit losses across CCB.
Refer to Credit and Investment Risk Management on pages 111–134 and Allowance for Credit Losses on pages 131–133 for a further discussion of the credit portfolios and the allowance for credit losses.
JPMorgan Chase & Co./2023 Form 10-K | 69 | |||||||
| Selected metrics | ||||||||||||||
| As of or for the year ended December 31, | ||||||||||||||
(in millions, except employees) | 2023 | 2022 | 2021 | |||||||||||
| Selected balance sheet data (period-end) | ||||||||||||||
| Total assets | $ | 642,951 | $ | 514,085 | $ | 500,370 | ||||||||
| Loans: | ||||||||||||||
Banking & Wealth Management(a) | 31,142 | (d) | 29,008 | 35,095 | ||||||||||
Home Lending(b) | 259,181 | (d) | 172,554 | 180,529 | ||||||||||
| Card Services | 211,175 | 185,175 | 154,296 | |||||||||||
| Auto | 77,705 | 68,191 | 69,138 | |||||||||||
| Total loans | 579,203 | 454,928 | 439,058 | |||||||||||
| Deposits | 1,094,738 | (e) | 1,131,611 | 1,148,110 | ||||||||||
| Equity | 55,500 | 50,000 | 50,000 | |||||||||||
| Selected balance sheet data (average) | ||||||||||||||
| Total assets | $ | 584,367 | $ | 497,263 | $ | 489,771 | ||||||||
| Loans: | ||||||||||||||
| Banking & Wealth Management | 30,142 | (f) | 31,545 | 44,906 | ||||||||||
Home Lending(c) | 232,115 | (f) | 176,285 | 181,049 | ||||||||||
| Card Services | 191,424 | 163,335 | 140,405 | |||||||||||
| Auto | 72,674 | 68,098 | 67,624 | |||||||||||
| Total loans | 526,355 | 439,263 | 433,984 | |||||||||||
| Deposits | 1,126,552 | (g) | 1,162,680 | 1,054,956 | ||||||||||
| Equity | 54,349 | 50,000 | 50,000 | |||||||||||
Employees | 141,640 | 135,347 | 128,863 | |||||||||||
(a)At December 31, 2023, 2022 and 2021, included $94 million, $350 million and $5.4 billion of loans, respectively, in Business Banking under the PPP.
(b)At December 31, 2023, 2022 and 2021, Home Lending loans held-for-sale and loans at fair value were $3.4 billion, $3.0 billion and $14.9 billion, respectively.
(c)Average Home Lending loans held-for sale and loans at fair value were $4.8 billion, $7.3 billion and $15.4 billion for the years ended December 31, 2023, 2022 and 2021, respectively.
(d)At December 31, 2023, included $4.0 billion and $90.7 billion for Banking & Wealth Management and Home Lending, respectively, associated with First Republic.
(e)Includes First Republic. In the fourth quarter of 2023, CCB transferred certain deposits associated with First Republic to AWM, CB, and CIB. Refer to page 67 for additional information.
(f)Average Banking & Wealth Management and Home Lending loans associated with First Republic were $2.4 billion and $60.2 billion, respectively, for the year ended December 31, 2023.
(g)Included $39.4 billion associated with First Republic for the year ended December 31, 2023.
| Selected metrics | ||||||||||||||||||||
| As of or for the year ended December 31, | ||||||||||||||||||||
| (in millions, except ratio data) | 2023 | 2022 | 2021 | |||||||||||||||||
| Credit data and quality statistics | ||||||||||||||||||||
Nonaccrual loans(a)(b) | $ | 3,740 | $ | 3,899 | $ | 4,875 | ||||||||||||||
| Net charge-offs/(recoveries) | ||||||||||||||||||||
| Banking & Wealth Management | 340 | 370 | 289 | |||||||||||||||||
| Home Lending | (56) | (229) | (275) | |||||||||||||||||
| Card Services | 4,699 | 2,403 | 2,712 | |||||||||||||||||
| Auto | 357 | 144 | 35 | |||||||||||||||||
| Total net charge-offs/(recoveries) | $ | 5,340 | $ | 2,688 | $ | 2,761 | ||||||||||||||
| Net charge-off/(recovery) rate | ||||||||||||||||||||
Banking & Wealth Management(c) | 1.13 | % | 1.17 | % | 0.64 | % | ||||||||||||||
| Home Lending | (0.02) | (0.14) | (0.17) | |||||||||||||||||
| Card Services | 2.45 | 1.47 | 1.94 | |||||||||||||||||
| Auto | 0.49 | 0.21 | 0.05 | |||||||||||||||||
| Total net charge-off/(recovery) rate | 1.02 | % | 0.62 | % | 0.66 | % | ||||||||||||||
| 30+ day delinquency rate | ||||||||||||||||||||
Home Lending(d)(e) | 0.66 | % | 0.83 | % | 1.25 | % | ||||||||||||||
| Card Services | 2.14 | 1.45 | 1.04 | |||||||||||||||||
| Auto | 1.19 | 1.01 | 0.64 | |||||||||||||||||
90+ day delinquency rate - Card Services | 1.05 | % | 0.68 | % | 0.50 | % | ||||||||||||||
| Allowance for loan losses | ||||||||||||||||||||
| Banking & Wealth Management | $ | 685 | $ | 722 | $ | 697 | ||||||||||||||
| Home Lending | 578 | (f) | 867 | 660 | ||||||||||||||||
| Card Services | 12,453 | 11,200 | 10,250 | |||||||||||||||||
| Auto | 742 | 715 | 733 | |||||||||||||||||
| Total allowance for loan losses | $ | 14,458 | (g) | $ | 13,504 | $ | 12,340 | |||||||||||||
(a)At December 31, 2023, 2022 and 2021, nonaccrual loans excluded mortgage loans 90 or more days past due and insured by U.S. government agencies of $123 million, $187 million and $342 million, respectively. These amounts have been excluded based upon the government guarantee. In addition, the Firm’s policy is generally to exempt credit card loans from being placed on nonaccrual status as permitted by regulatory guidance.
(b)At December 31, 2023, 2022 and 2021, generally excludes loans that were under payment deferral programs offered in response to the COVID-19 pandemic.
(c)At December 31, 2023, 2022 and 2021, included $94 million, $350 million and $5.4 billion of loans, respectively, in Business Banking under the PPP. The Firm does not expect to realize material credit losses on PPP loans because the loans are guaranteed by the SBA.
(d)At December 31, 2023, 2022 and 2021, the principal balance of loans under payment deferral programs offered in response to the COVID-19 pandemic was $29 million, $449 million and $1.1 billion in Home Lending, respectively. Loans that are performing according to their modified terms are generally not considered delinquent.
(e)At December 31, 2023, 2022 and 2021, excluded mortgage loans insured by U.S. government agencies of $176 million, $258 million and $405 million, respectively, that are 30 or more days past due. These amounts have been excluded based upon the government guarantee.
(f)Includes First Republic.
(g)On January 1, 2023, the Firm adopted changes to the TDR accounting guidance. The adoption of this guidance resulted in a net decrease in the allowance for loan losses of $591 million, driven by residential real estate and credit card. Refer to Note 1 for further information.
70 | JPMorgan Chase & Co./2023 Form 10-K | |||||||
| Selected metrics | ||||||||||||||||||||
| As of or for the year ended December 31, | ||||||||||||||||||||
| (in billions, except ratios and where otherwise noted) | 2023 | 2022 | 2021 | |||||||||||||||||
| Business Metrics | ||||||||||||||||||||
CCB Consumer customers (in millions)(a) | 82.1 | (g) | 79.2 | 76.5 | ||||||||||||||||
CCB Small business customers (in millions)(a) | 6.4 | (g) | 5.7 | 5.3 | ||||||||||||||||
| Number of branches | 4,897 | 4,787 | 4,790 | |||||||||||||||||
Active digital customers (in thousands)(b) | 66,983 | (g) | 63,136 | 58,857 | ||||||||||||||||
Active mobile customers (in thousands)(c) | 53,828 | (g) | 49,710 | 45,452 | ||||||||||||||||
| Debit and credit card sales volume | $ | 1,678.6 | $ | 1,555.4 | $ | 1,360.7 | ||||||||||||||
Total payments transaction volume (in trillions)(d) | 5.9 | (g) | 5.6 | 5.0 | ||||||||||||||||
| Banking & Wealth Management | ||||||||||||||||||||
| Average deposits | $ | 1,111.7 | (h) | $ | 1,145.7 | $ | 1,035.4 | |||||||||||||
| Deposit margin | 2.84 | % | 1.71 | % | 1.27 | % | ||||||||||||||
| Business Banking average loans | $ | 19.6 | $ | 22.3 | $ | 37.5 | ||||||||||||||
| Business Banking origination volume | 4.8 | 4.3 | 13.9 | (j) | ||||||||||||||||
Client investment assets(e) | 951.1 | 647.1 | 718.1 | |||||||||||||||||
| Number of client advisors | 5,456 | 5,029 | 4,725 | |||||||||||||||||
| Home Lending | ||||||||||||||||||||
| Mortgage origination volume by channel | ||||||||||||||||||||
| Retail | $ | 22.4 | (i) | $ | 38.5 | $ | 91.8 | |||||||||||||
| Correspondent | 12.7 | 26.9 | 70.9 | |||||||||||||||||
Total mortgage origination volume(f) | $ | 35.1 | $ | 65.4 | $ | 162.7 | ||||||||||||||
| Third-party mortgage loans serviced (period-end) | $ | 631.2 | $ | 584.3 | $ | 519.2 | ||||||||||||||
| MSR carrying value (period-end) | 8.5 | 8.0 | 5.5 | |||||||||||||||||
| Card Services | ||||||||||||||||||||
| Sales volume, excluding commercial card | $ | 1,163.6 | $ | 1,064.7 | $ | 893.5 | ||||||||||||||
| Net revenue rate | 9.72 | % | 9.87 | % | 10.51 | % | ||||||||||||||
| Net yield on average loans | 9.61 | 9.77 | 9.88 | |||||||||||||||||
New credit card accounts opened (in millions) | 10.0 | 9.6 | 8.0 | |||||||||||||||||
| Auto | ||||||||||||||||||||
| Loan and lease origination volume | $ | 41.3 | $ | 30.4 | $ | 43.6 | ||||||||||||||
| Average auto operating lease assets | 10.9 | 14.3 | 19.1 | |||||||||||||||||
(a)The Consumer and Small business customers metrics include unique individuals, and businesses and legal entities, respectively, that have financial ownership or decision-making power with respect to accounts; these metrics exclude customers under the age of 18. Where a customer uses the same unique identifier as both a Consumer and a Small business, the customer is included in both metrics. For information concerning the Households metric previously disclosed, refer to the Glossary of terms and acronyms on pages 315-321.
(b)Users of all web and/or mobile platforms who have logged in within the past 90 days.
(c)Users of all mobile platforms who have logged in within the past 90 days.
(d)Total payments transaction volume includes debit and credit card sales volume and gross outflows of ACH, ATM, teller, wires, BillPay, PayChase, Zelle, person-to-person and checks.
(e)Includes assets invested in managed accounts and J.P. Morgan mutual funds where AWM is the investment manager. Refer to AWM segment results on pages 81–83 for additional information. At December 31, 2023, included $144.6 billion of client investment assets associated with First Republic.
(f)Firmwide mortgage origination volume was $41.4 billion, $81.8 billion and $182.4 billion for the years ended December 31, 2023, 2022 and 2021, respectively.
(g)Excludes First Republic.
(h)Included $39.4 billion for the year ended December 31, 2023, associated with First Republic.
(i)Included $2.3 billion for the year ended December 31, 2023, associated with First Republic.
(j)Included origination volume under the PPP of $10.6 billion for the year ended December 31, 2021. The program ended on May 31, 2021 for new applications.
JPMorgan Chase & Co./2023 Form 10-K | 71 | |||||||
| CORPORATE & INVESTMENT BANK | ||||||||||||||
The Corporate & Investment Bank, which consists of Banking and Markets & Securities Services, offers a broad suite of investment banking, market-making, prime brokerage, lending, and treasury and securities products and services to a global client base of corporations, investors, financial institutions, merchants, government and municipal entities. Banking offers a full range of investment banking products and services in all major capital markets, including advising on corporate strategy and structure, capital-raising in equity and debt markets, as well as loan origination and syndication. Banking also includes Payments, which provides services, that enable clients to manage payments globally across liquidity and account solutions, commerce solutions, clearing, trade and working capital. Markets & Securities Services includes Markets, a global market-maker across products, including cash and derivative instruments, which also offers sophisticated risk management solutions, prime brokerage, clearing and research. Markets & Securities Services also includes Securities Services, a leading global custodian which provides custody, fund accounting and administration, and securities lending products principally for asset managers, insurance companies and public and private investment funds. | ||
| Selected income statement data | ||||||||||||||||||||
| Year ended December 31, | ||||||||||||||||||||
| (in millions) | 2023 | 2022 | 2021 | |||||||||||||||||
| Revenue | ||||||||||||||||||||
Investment banking fees(a) | $ | 6,582 | $ | 6,929 | $ | 13,359 | ||||||||||||||
| Principal transactions | 23,671 | 19,926 | 15,764 | |||||||||||||||||
| Lending- and deposit-related fees | 2,213 | 2,419 | 2,514 | |||||||||||||||||
| Commissions and other fees | 4,821 | 5,058 | 4,995 | |||||||||||||||||
| Card income | 1,450 | 1,249 | (c) | 1,108 | (c) | |||||||||||||||
| All other income | 1,578 | 621 | (c) | 663 | (c) | |||||||||||||||
| Noninterest revenue | 40,315 | 36,202 | 38,403 | |||||||||||||||||
| Net interest income | 8,492 | 11,900 | 13,540 | |||||||||||||||||
Total net revenue(b) | 48,807 | 48,102 | 51,943 | |||||||||||||||||
| Provision for credit losses | 121 | 1,158 | (1,174) | |||||||||||||||||
| Noninterest expense | ||||||||||||||||||||
| Compensation expense | 14,345 | 13,918 | 13,096 | |||||||||||||||||
| Noncompensation expense | 14,249 | 13,432 | (c) | 12,457 | (c) | |||||||||||||||
| Total noninterest expense | 28,594 | 27,350 | 25,553 | |||||||||||||||||
Income before income tax expense | 20,092 | 19,594 | 27,564 | |||||||||||||||||
| Income tax expense | 5,963 | 4,669 | (c) | 6,457 | (c) | |||||||||||||||
| Net income | $ | 14,129 | $ | 14,925 | $ | 21,107 | ||||||||||||||
(a)Includes CB's share of revenue from investment banking products sold to CB clients through the CIB that is subject to a revenue sharing arrangement which is reported as a reduction in All other income.
(b)Includes tax-equivalent adjustments, predominantly due to income tax credits and other tax benefits related to alternative energy investments; income tax credits and amortization of the cost of investments in affordable housing projects; and tax-exempt income
from municipal bonds of $3.6 billion, $3.0 billion and $3.0 billion for the years ended December 31, 2023, 2022 and 2021, respectively.
(c)In the first quarter of 2023, the allocations of revenue and expense to CCB associated with a Merchant Services revenue sharing agreement were discontinued and are now retained in Payments in CIB. Prior-period amounts have been revised to conform with the current presentation.
| Selected income statement data | ||||||||||||||||||||
| Year ended December 31, | ||||||||||||||||||||
| (in millions, except ratios) | 2023 | 2022 | 2021 | |||||||||||||||||
| Financial ratios | ||||||||||||||||||||
| Return on equity | 13 | % | 14 | % | 25 | % | ||||||||||||||
| Overhead ratio | 59 | 57 | 49 | |||||||||||||||||
Compensation expense as percentage of total net revenue | 29 | 29 | 25 | |||||||||||||||||
| Revenue by business | ||||||||||||||||||||
| Investment Banking | $ | 6,243 | $ | 6,510 | $ | 12,506 | ||||||||||||||
| Payments | 9,273 | 7,579 | (b) | 6,464 | (b) | |||||||||||||||
| Lending | 1,007 | 1,377 | 1,001 | |||||||||||||||||
| Total Banking | 16,523 | 15,466 | 19,971 | |||||||||||||||||
| Fixed Income Markets | 18,813 | 18,617 | 16,865 | |||||||||||||||||
| Equity Markets | 8,979 | 10,367 | 10,529 | |||||||||||||||||
| Securities Services | 4,772 | 4,488 | 4,328 | |||||||||||||||||
Credit Adjustments & Other(a) | (280) | (836) | 250 | |||||||||||||||||
Total Markets & Securities Services | 32,284 | 32,636 | 31,972 | |||||||||||||||||
| Total net revenue | $ | 48,807 | $ | 48,102 | $ | 51,943 | ||||||||||||||
(a)Consists primarily of centrally managed credit valuation adjustments ("CVA"), funding valuation adjustments ("FVA") on derivatives, other valuation adjustments, and certain components of fair value option elected liabilities, which are primarily reported in principal transactions revenue. Results are presented net of associated hedging activities and net of CVA and FVA amounts allocated to Fixed Income Markets and Equity Markets. Refer to Notes 2, 3 and 24 for additional information.
(b)In the first quarter of 2023, the allocations of revenue and expense to CCB associated with a Merchant Services revenue sharing agreement were discontinued and are now retained in Payments in CIB. Prior-period amounts have been revised to conform with the current presentation.
72 | JPMorgan Chase & Co./2023 Form 10-K | |||||||
2023 compared with 2022
Net income was $14.1 billion, down 5%.
Net revenue was $48.8 billion, up 1%.
Banking revenue was $16.5 billion, up 7%.
•Investment Banking revenue was $6.2 billion, down 4%. Excluding $257 million of markdowns on held-for-sale positions, primarily unfunded commitments, in the bridge financing portfolio recorded in the second quarter of 2022, Investment Banking revenue was down 8%. Investment Banking fees were down 5%, driven by lower advisory and debt underwriting fees, partially offset by higher equity underwriting fees. The Firm ranked #1 for Global Investment Banking fees, according to Dealogic.
–Advisory fees were $2.8 billion, down 8%, due to a lower number of completed transactions, reflecting the lower level of announced deals in the current and the prior year amid a challenging environment.
–Debt underwriting fees were $2.6 billion, down 8%, as challenging market conditions, primarily in the first half of the year, resulted in lower issuance activity across leveraged loans, investment-grade loans, and high-grade bonds. This was largely offset by higher issuance activity in high-yield bonds driven by higher industry-wide issuance.
–Equity underwriting fees were $1.2 billion, up 11%, driven by a higher level of follow-on offerings due to lower equity market volatility and a higher level of convertible securities offerings which benefited from higher rates, partially offset by lower activity in private placements amid a challenging environment.
•Payments revenue was $9.3 billion, up 22%, driven by deposit margin expansion on higher rates and fees, partially offset by the higher level of client credits that reduce such fees and lower average deposits. The net impact of equity investments was flat reflecting net markdowns in both periods, including the impact of an impairment in the current year.
•Lending revenue was $1.0 billion, down 27%, driven by $494 million of fair value losses on hedges of retained loans which included an increase in hedging activity, compared to $27 million of gains in the prior year, partially offset by higher net interest income.
Markets & Securities Services revenue was $32.3 billion, down 1%. Markets revenue was $27.8 billion, down 4%.
•Fixed Income Markets revenue was $18.8 billion, up 1%, driven by an increase in finance and trading activity in the Securitized Products Group and improved performance in Credit Trading, predominantly offset by lower revenue in Currencies & Emerging Markets as the business substantially normalized from the prior year’s elevated levels of volatility and client activity.
•Equity Markets revenue was $9.0 billion, down 13%, driven by lower revenue in Equity Derivatives and Cash Equities, compared with a stronger performance in the prior year.
•Securities Services revenue was $4.8 billion, up 6%, driven by deposit margin expansion on higher rates, largely offset by lower average deposits and fees.
•Credit Adjustments & Other was a loss of $280 million, compared with a loss of $836 million in the prior year.
Noninterest expense was $28.6 billion, up 5%, driven by higher legal expense, compensation expense, including the impact of wage inflation, and higher indirect tax expense.
The provision for credit losses was $121 million, driven by net charge-offs of $272 million, up $190 million, driven by single name exposures, largely offset by a $151 million net reduction in the allowance for credit losses.
The net reduction in the allowance was driven by the impact of changes in the loan and lending-related commitment portfolios and the net effect of changes in the Firm’s weighted average macroeconomic outlook, predominantly offset by an addition for certain accounts receivable and net downgrade activity.
The provision in the prior year was $1.2 billion, predominantly driven by a net addition to the allowance for credit losses.
JPMorgan Chase & Co./2023 Form 10-K | 73 | |||||||
| Selected metrics | ||||||||||||||||||||
As of or for the year ended December 31, (in millions, except employees) | ||||||||||||||||||||
| 2023 | 2022 | 2021 | ||||||||||||||||||
Selected balance sheet data (period-end) | ||||||||||||||||||||
| Total assets | $ | 1,338,168 | $ | 1,334,296 | $ | 1,259,896 | ||||||||||||||
| Loans: | ||||||||||||||||||||
Loans retained(a) | 197,523 | 187,642 | 159,786 | |||||||||||||||||
Loans held-for-sale and loans at fair value(b) | 38,919 | 42,304 | 50,386 | |||||||||||||||||
| Total loans | 236,442 | 229,946 | 210,172 | |||||||||||||||||
| Equity | 108,000 | 103,000 | 83,000 | |||||||||||||||||
Selected balance sheet data (average) | ||||||||||||||||||||
| Total assets | $ | 1,428,904 | $ | 1,406,250 | $ | 1,334,518 | ||||||||||||||
| Trading assets-debt and equity instruments | 508,799 | 405,916 | 448,099 | |||||||||||||||||
| Trading assets-derivative receivables | 63,836 | 77,802 | 68,203 | |||||||||||||||||
| Loans: | ||||||||||||||||||||
Loans retained(a) | 190,601 | 172,627 | 145,137 | |||||||||||||||||
Loans held-for-sale and loans at fair value(b) | 39,831 | 46,846 | 51,072 | |||||||||||||||||
| Total loans | 230,432 | 219,473 | 196,209 | |||||||||||||||||
| Deposits | 728,537 | 739,700 | 760,048 | |||||||||||||||||
| Equity | 108,000 | 103,000 | 83,000 | |||||||||||||||||
Employees | 74,404 | 73,452 | 67,546 | |||||||||||||||||
(a)Loans retained includes credit portfolio loans, loans held by consolidated Firm-administered multi-seller conduits, trade finance loans, other held-for-investment loans and overdrafts.
(b)Loans held-for-sale and loans at fair value primarily reflect lending related positions originated and purchased in CIB Markets, including loans held for securitization.
| Selected metrics | |||||||||||||||||
| As of or for the year ended December 31, (in millions, except ratios) | |||||||||||||||||
| 2023 | 2022 | 2021 | |||||||||||||||
Credit data and quality statistics | |||||||||||||||||
Net charge-offs/(recoveries) | $ | 272 | $ | 82 | $ | 6 | |||||||||||
| Nonperforming assets: | |||||||||||||||||
| Nonaccrual loans: | |||||||||||||||||
Nonaccrual loans retained(a) | 866 | 718 | 584 | ||||||||||||||
Nonaccrual loans held-for-sale and loans at fair value(b) | 828 | 848 | 844 | ||||||||||||||
Total nonaccrual loans | 1,694 | 1,566 | 1,428 | ||||||||||||||
| Derivative receivables | 364 | 296 | 316 | ||||||||||||||
Assets acquired in loan satisfactions | 115 | 87 | 91 | ||||||||||||||
Total nonperforming assets | 2,173 | 1,949 | 1,835 | ||||||||||||||
| Allowance for credit losses: | |||||||||||||||||
| Allowance for loan losses | 2,321 | 2,292 | 1,348 | ||||||||||||||
| Allowance for lending-related commitments | 1,048 | 1,448 | 1,372 | ||||||||||||||
Total allowance for credit losses | 3,369 | 3,740 | 2,720 | ||||||||||||||
Net charge-off/(recovery) rate(c) | 0.14 | % | 0.05 | % | — | % | |||||||||||
Allowance for loan losses to period-end loans retained | 1.18 | 1.22 | 0.84 | ||||||||||||||
Allowance for loan losses to period-end loans retained, excluding trade finance and conduits(d) | 1.64 | 1.67 | 1.12 | ||||||||||||||
Allowance for loan losses to nonaccrual loans retained(a) | 268 | 319 | 231 | ||||||||||||||
| Nonaccrual loans to total period-end loans | 0.72 | 0.68 | 0.68 | ||||||||||||||
(a)Allowance for loan losses of $95 million, $104 million and $58 million were held against these nonaccrual loans at December 31, 2023, 2022 and 2021, respectively.
(b)At December 31, 2023, 2022 and 2021, nonaccrual loans excluded mortgage loans 90 or more days past due and insured by U.S. government agencies of $59 million, $115 million and $281 million, respectively. These amounts have been excluded based upon the government guarantee.
(c)Loans held-for-sale and loans at fair value were excluded when calculating the net charge-off/(recovery) rate.
(d)Management uses allowance for loan losses to period-end loans retained, excluding trade finance and conduits, a non-GAAP financial measure, to provide a more meaningful assessment of CIB’s allowance coverage ratio. Refer to Explanation and Reconciliation of the Firm’s Use of Non-GAAP Financial Measures on pages 62–64.
74 | JPMorgan Chase & Co./2023 Form 10-K | |||||||
Investment banking fees | |||||||||||||||||
| Year ended December 31, | |||||||||||||||||
(in millions) | 2023 | 2022 | 2021 | ||||||||||||||
Advisory | $ | 2,814 | $ | 3,051 | $ | 4,381 | |||||||||||
Equity underwriting | 1,151 | 1,034 | 3,953 | ||||||||||||||
Debt underwriting(a) | 2,617 | 2,844 | 5,025 | ||||||||||||||
Total investment banking fees | $ | 6,582 | $ | 6,929 | $ | 13,359 | |||||||||||
(a)Represents long-term debt and loan syndications.
| League table results – wallet share | ||||||||||||||||||||||||||
| 2023 | 2022 | 2021 | ||||||||||||||||||||||||
| Year ended December 31, | Rank | Share | Rank | Share | Rank | Share | ||||||||||||||||||||
Based on fees(a) | ||||||||||||||||||||||||||
M&A(b) | ||||||||||||||||||||||||||
Global | # | 2 | 9.3 | % | # | 2 | 7.9 | % | # | 2 | 9.6 | % | ||||||||||||||
U.S. | 2 | 11.2 | 2 | 9.0 | 2 | 10.7 | ||||||||||||||||||||
Equity and equity-related(c) | ||||||||||||||||||||||||||
Global | 1 | 7.8 | 2 | 5.7 | 3 | 8.8 | ||||||||||||||||||||
U.S. | 1 | 14.1 | 1 | 13.9 | 2 | 11.8 | ||||||||||||||||||||
Long-term debt(d) | ||||||||||||||||||||||||||
Global | 1 | 7.2 | 1 | 6.9 | 1 | 8.4 | ||||||||||||||||||||
U.S. | 1 | 10.9 | 1 | 12.2 | 1 | 12.1 | ||||||||||||||||||||
Loan syndications | ||||||||||||||||||||||||||
| Global | 1 | 12.1 | 1 | 11.0 | 1 | 10.9 | ||||||||||||||||||||
| U.S. | 1 | 15.1 | 1 | 12.8 | 1 | 12.6 | ||||||||||||||||||||
Global investment banking fees(e) | # | 1 | 8.8 | % | # | 1 | 7.8 | % | # | 1 | 9.3 | % | ||||||||||||||
(a)Source: Dealogic as of January 2, 2024. Reflects the ranking of revenue wallet and market share.
(b)Global M&A excludes any withdrawn transactions. U.S. M&A revenue wallet represents wallet from client parents based in the U.S.
(c)Global equity and equity-related ranking includes rights offerings and Chinese A-Shares.
(d)Long-term debt rankings include investment-grade, high-yield, supranationals, sovereigns, agencies, covered bonds, asset-backed securities ("ABS") and mortgage-backed securities ("MBS"); and exclude money market, short-term debt, and U.S. municipal securities.
(e)Global investment banking fees exclude money market, short-term debt and shelf securities.
Markets revenue
The following table summarizes selected income statement data for the Markets businesses. Markets includes both Fixed Income Markets and Equity Markets. Markets revenue consists of principal transactions, fees, commissions and other income, as well as net interest income. The Firm assesses its Markets business performance on a total revenue basis, as offsets generally occur across revenue line items. For example, securities that generate net interest income may be risk-managed by derivatives that are reflected at fair value in principal transactions revenue. Refer to Notes 6 and 7 for a description of the composition of these income statement line items.
Principal transactions reflects revenue on financial instruments and commodities transactions that arise from client-driven market-making activity. Principal transactions revenue includes amounts recognized upon executing new transactions with market participants, as well as “inventory-related revenue”, which is revenue recognized from gains and losses on derivatives and other instruments that the Firm has been holding in anticipation of, or in response to, client demand, and changes in the fair value of instruments used by the Firm to actively manage the risk exposure arising from such inventory. Principal transactions revenue recognized upon executing new transactions with market participants is affected by many factors including the level of client activity, the bid-offer spread (which is the
difference between the price at which a market participant is willing and able to sell an instrument to the Firm and the price at which another market participant is willing and able to buy it from the Firm, and vice versa), market liquidity and volatility. These factors are interrelated and sensitive to the same factors that drive inventory-related revenue, which include general market conditions, such as interest rates, foreign exchange rates, credit spreads, and equity and commodity prices, as well as other macroeconomic conditions.
JPMorgan Chase & Co./2023 Form 10-K | 75 | |||||||
For the periods presented below, the primary source of principal transactions revenue was the amount recognized upon executing new transactions.
| 2023 | 2022 | 2021 | |||||||||||||||||||||||||||||||||
| Year ended December 31, (in millions, except where otherwise noted) | Fixed Income Markets | Equity Markets | Total Markets | Fixed Income Markets | Equity Markets | Total Markets | Fixed Income Markets | Equity Markets | Total Markets | ||||||||||||||||||||||||||
Principal transactions | $ | 12,064 | $ | 11,514 | $ | 23,578 | $ | 11,682 | $ | 8,846 | $ | 20,528 | $ | 7,911 | $ | 7,519 | $ | 15,430 | |||||||||||||||||
Lending- and deposit-related fees | 307 | 40 | 347 | 303 | 22 | 325 | 321 | 17 | 338 | ||||||||||||||||||||||||||
| Commissions and other fees | 596 | 1,908 | 2,504 | 550 | 1,975 | 2,525 | 545 | 1,948 | 2,493 | ||||||||||||||||||||||||||
| All other income | 1,744 | (87) | 1,657 | 916 | (99) | 817 | 972 | (82) | 890 | ||||||||||||||||||||||||||
| Noninterest revenue | 14,711 | 13,375 | 28,086 | 13,451 | 10,744 | 24,195 | 9,749 | 9,402 | 19,151 | ||||||||||||||||||||||||||
Net interest income(a) | 4,102 | (4,396) | (294) | 5,166 | (377) | 4,789 | 7,116 | 1,127 | 8,243 | ||||||||||||||||||||||||||
| Total net revenue | $ | 18,813 | $ | 8,979 | $ | 27,792 | $ | 18,617 | $ | 10,367 | $ | 28,984 | $ | 16,865 | $ | 10,529 | $ | 27,394 | |||||||||||||||||
Loss days(b) | 3 | 7 | 4 | ||||||||||||||||||||||||||||||||
(a)The decline in Markets net interest income was driven by higher funding costs.
(b)Loss days represent the number of days for which Markets, which consists of Fixed Income Markets and Equity Markets, posted losses to total net revenue. The loss days determined under this measure differ from the measure used to determine backtesting gains and losses. Daily backtesting gains and losses include positions in the Firm’s Risk Management value-at-risk ("VaR") measure and exclude certain components of total net revenue, which may more than offset backtesting gains or losses on a particular day. For more information on daily backtesting gains and losses, refer to the VaR discussion on pages 137–139.
Selected metrics | |||||||||||||||||
| As of or for the year ended December 31, (in millions, except where otherwise noted) | 2023 | 2022 | 2021 | ||||||||||||||
| Assets under custody ("AUC") by asset class (period-end) (in billions): | |||||||||||||||||
| Fixed Income | $ | 15,543 | $ | 14,361 | $ | 16,098 | |||||||||||
| Equity | 12,927 | 10,748 | 12,962 | ||||||||||||||
Other(a) | 3,922 | 3,526 | 4,161 | ||||||||||||||
| Total AUC | $ | 32,392 | $ | 28,635 | $ | 33,221 | |||||||||||
Merchant processing volume (in billions)(b) | $ | 2,408 | $ | 2,158 | $ | 1,887 | |||||||||||
Client deposits and other third party liabilities (average)(c) | $ | 645,074 | $ | 687,391 | $ | 714,910 | |||||||||||
(a)Consists of mutual funds, unit investment trusts, currencies, annuities, insurance contracts, options and other contracts.
(b)Represents Firmwide merchant processing volume.
(c)Client deposits and other third-party liabilities pertain to the Payments and Securities Services businesses.
76 | JPMorgan Chase & Co./2023 Form 10-K | |||||||
| International metrics | ||||||||||||||||||||
| As of or for the year ended December 31, (in millions, except where otherwise noted) | 2023 | 2022 | 2021 | |||||||||||||||||
Total net revenue(a) | ||||||||||||||||||||
| Europe/Middle East/Africa | $ | 13,725 | $ | 15,303 | $ | 13,954 | ||||||||||||||
| Asia-Pacific | 7,607 | 7,846 | 7,555 | |||||||||||||||||
| Latin America/Caribbean | 2,094 | 2,239 | 1,833 | |||||||||||||||||
| Total international net revenue | 23,426 | 25,388 | 23,342 | |||||||||||||||||
| North America | 25,381 | 22,714 | (c) | 28,601 | (c) | |||||||||||||||
| Total net revenue | $ | 48,807 | $ | 48,102 | $ | 51,943 | ||||||||||||||
Loans retained (period-end)(a) | ||||||||||||||||||||
| Europe/Middle East/Africa | $ | 42,792 | $ | 39,424 | $ | 33,084 | ||||||||||||||
| Asia-Pacific | 14,333 | 15,571 | 14,471 | |||||||||||||||||
| Latin America/Caribbean | 8,341 | 8,599 | 7,006 | |||||||||||||||||
| Total international loans | 65,466 | 63,594 | 54,561 | |||||||||||||||||
| North America | 132,057 | 124,048 | 105,225 | |||||||||||||||||
| Total loans retained | $ | 197,523 | $ | 187,642 | $ | 159,786 | ||||||||||||||
Client deposits and other third-party liabilities (average)(b) | ||||||||||||||||||||
| Europe/Middle East/Africa | $ | 230,225 | $ | 247,203 | $ | 243,867 | ||||||||||||||
| Asia-Pacific | 126,918 | 129,134 | 132,241 | |||||||||||||||||
| Latin America/Caribbean | 39,134 | 39,917 | 46,045 | |||||||||||||||||
| Total international | $ | 396,277 | $ | 416,254 | $ | 422,153 | ||||||||||||||
| North America | 248,797 | 271,137 | 292,757 | |||||||||||||||||
Total client deposits and other third-party liabilities | $ | 645,074 | $ | 687,391 | $ | 714,910 | ||||||||||||||
AUC (period-end)(b) (in billions) | ||||||||||||||||||||
| North America | $ | 21,792 | $ | 19,219 | $ | 21,655 | ||||||||||||||
| All other regions | 10,600 | 9,416 | 11,566 | |||||||||||||||||
| Total AUC | $ | 32,392 | $ | 28,635 | $ | 33,221 | ||||||||||||||
(a)Total net revenue and loans retained (excluding loans held-for-sale and loans at fair value) are based on the location of the trading desk, booking location, or domicile of the client, as applicable.
(b)Client deposits and other third-party liabilities pertaining to the Payments and Securities Services businesses, and AUC, are based on the domicile of the client.
(c)In the first quarter of 2023, the allocations of revenue and expense to CCB associated with a Merchant Services revenue sharing agreement were discontinued and are now retained in Payments in CIB. Prior-period amounts have been revised to conform with the current presentation.
JPMorgan Chase & Co./2023 Form 10-K | 77 | |||||||
| COMMERCIAL BANKING | ||||||||||||||
Commercial Banking provides comprehensive financial solutions, including lending, payments, investment banking and asset management products across three primary client segments: Middle Market Banking, Corporate Client Banking and Commercial Real Estate Banking. Other includes amounts not aligned with a primary client segment. Middle Market Banking covers small and midsized companies, local governments and nonprofit clients. Corporate Client Banking covers large corporations. Commercial Real Estate Banking covers investors, developers, and owners of multifamily, office, retail, industrial and affordable housing properties. | ||
| Selected income statement data | |||||||||||||||||
| Year ended December 31, (in millions) | 2023 | 2022 | 2021 | ||||||||||||||
| Revenue | |||||||||||||||||
| Lending- and deposit-related fees | $ | 1,210 | (b) | $ | 1,243 | $ | 1,392 | ||||||||||
| Card income | 763 | 685 | 624 | ||||||||||||||
All other income | 1,521 | 1,408 | 1,913 | ||||||||||||||
| Noninterest revenue | 3,494 | 3,336 | 3,929 | ||||||||||||||
| Net interest income | 12,052 | (b) | 8,197 | 6,079 | |||||||||||||
Total net revenue(a) | 15,546 | 11,533 | 10,008 | ||||||||||||||
| Provision for credit losses | 1,970 | (b) | 1,268 | (947) | |||||||||||||
| Noninterest expense | |||||||||||||||||
| Compensation expense | 2,760 | (b) | 2,296 | 1,973 | |||||||||||||
| Noncompensation expense | 2,618 | 2,423 | 2,068 | ||||||||||||||
| Total noninterest expense | 5,378 | 4,719 | 4,041 | ||||||||||||||
Income before income tax expense | 8,198 | 5,546 | 6,914 | ||||||||||||||
| Income tax expense | 2,055 | 1,333 | 1,668 | ||||||||||||||
| Net income | $ | 6,143 | $ | 4,213 | $ | 5,246 | |||||||||||
(a)Total net revenue included tax-equivalent adjustments from income tax credits related to equity investments in designated community development entities and in entities established for rehabilitation of historic properties, as well as tax-exempt income related to municipal financing activities of $382 million, $322 million and $330 million for the years ended December 31, 2023, 2022 and 2021, respectively.
(b)Includes First Republic. Refer to page 67 for additional information.
2023 compared with 2022
Net income was $6.1 billion, up 46%.
Net revenue was $15.5 billion, up 35%.
Net interest income was $12.1 billion, up 47%, driven by:
•deposit margin expansion on higher rates, partially offset by lower average deposits, and
•higher average loans, including the impact from First Republic.
Noninterest revenue was $3.5 billion, up 5%, driven by:
•higher lending-related revenue predominantly driven by the amortization of the purchase discount on certain acquired lending-related commitments associated with First Republic,
•net markups on held-for-sale positions, primarily unfunded commitments, in the bridge financing portfolio, compared with net markdowns in the prior year, and
•higher investment banking revenue and card income,
predominantly offset by
•lower deposit-related fees due to the higher level of client credits that reduce such fees, and
•the absence of a gain on an equity-method investment received in partial satisfaction of a loan.
Noninterest expense was $5.4 billion, up 14%, driven by higher compensation expense, reflecting an increase in employees including front office and technology, as well as higher volume-related expense, including the impact of new client acquisitions.
The provision for credit losses was $2.0 billion, reflecting:
•a $1.0 billion net addition to the allowance for credit losses, driven by the net effect of changes in the Firm’s weighted average macroeconomic outlook, including a deterioration in the outlook for commercial real estate and net downgrade activity, partially offset by the impact of changes in the loan and lending-related commitment portfolios,
•$608 million to establish the allowance for the First Republic loans and lending-related commitments in the second quarter of 2023; and
•net charge-offs of $316 million, up $232 million, primarily driven by Real Estate, predominantly concentrated in Office.
The provision in the prior year was $1.3 billion, reflecting a net addition to the allowance for credit losses.
78 | JPMorgan Chase & Co./2023 Form 10-K | |||||||
CB product revenue consists of the following: Lending includes a variety of financing alternatives, which are primarily provided on a secured basis; collateral includes receivables, inventory, equipment, real estate or other assets. Products include term loans, revolving lines of credit, bridge financing, asset-based structures, leases, and standby letters of credit. Payments includes services that enable CB clients to manage payments globally across liquidity and account solutions, commerce solutions, clearing, trade and working capital. Investment banking includes revenue from a range of products providing CB clients with sophisticated capital-raising alternatives, as well as balance sheet and risk management tools through advisory, equity underwriting, and loan syndications. Revenue from fixed income and equity markets products used by CB clients is also included. Other revenue primarily includes tax-equivalent adjustments generated from Community Development Banking and activity derived from principal transactions. | ||||||||||||||
| Selected income statement data (continued) | |||||||||||||||||
| Year ended December 31, (in millions, except ratios) | 2023 | 2022 | 2021 | ||||||||||||||
| Revenue by product | |||||||||||||||||
| Lending | $ | 5,993 | (d) | $ | 4,524 | $ | 4,629 | ||||||||||
Payments(a) | 8,250 | 5,691 | 3,653 | ||||||||||||||
Investment banking(a)(b) | 1,167 | 1,064 | 1,611 | ||||||||||||||
| Other | 136 | 254 | 115 | ||||||||||||||
| Total net revenue | $ | 15,546 | $ | 11,533 | $ | 10,008 | |||||||||||
Investment Banking and Markets revenue, gross(c) | $ | 3,393 | $ | 2,978 | $ | 5,092 | |||||||||||
| Revenue by client segment | |||||||||||||||||
| Middle Market Banking | $ | 7,371 | (e) | $ | 5,134 | $ | 4,004 | ||||||||||
| Corporate Client Banking | 4,777 | 3,918 | 3,508 | ||||||||||||||
Commercial Real Estate Banking | 3,308 | (e) | 2,461 | 2,419 | |||||||||||||
| Other | 90 | 20 | 77 | ||||||||||||||
| Total net revenue | $ | 15,546 | $ | 11,533 | $ | 10,008 | |||||||||||
| Financial ratios | |||||||||||||||||
| Return on equity | 20 | % | 16 | % | 21 | % | |||||||||||
| Overhead ratio | 35 | 41 | 40 | ||||||||||||||
(a)In the third quarter of 2023, certain revenue from CIB Markets products was reclassified from payments to investment banking. Prior-period amounts have been revised to conform with the current presentation.
(b)Includes CB’s share of revenue from Investment Banking and Markets' products sold to CB clients through the CIB which is reported in All other income.
(c)Includes gross revenues earned by the Firm that are subject to a revenue sharing arrangement between CB and the CIB for Investment Banking and Markets' products sold to CB clients. This includes revenues related to fixed income and equity markets products. Refer to Business Segment Results on page 65 for a discussion of revenue sharing.
(d)Includes First Republic. Refer to page 67 for additional information.
(e)Middle Market Banking and Commercial Real Estate Banking included $216 million and $687 million, respectively, for the year ended December 31, 2023, associated with First Republic.
| Selected metrics | |||||||||||||||||
As of or for the year ended December 31, (in millions, except employees) | 2023 | 2022 | 2021 | ||||||||||||||
Selected balance sheet data (period-end) | |||||||||||||||||
| Total assets | $ | 300,325 | $ | 257,106 | $ | 230,776 | |||||||||||
| Loans: | |||||||||||||||||
| Loans retained | 277,663 | (b) | 233,879 | 206,220 | |||||||||||||
Loans held-for-sale and loans at fair value | 545 | 707 | 2,223 | ||||||||||||||
| Total loans | $ | 278,208 | $ | 234,586 | $ | 208,443 | |||||||||||
| Equity | 30,000 | 25,000 | 24,000 | ||||||||||||||
Period-end loans by client segment | |||||||||||||||||
Middle Market Banking(a) | $ | 78,043 | (c) | $ | 72,625 | $ | 61,159 | ||||||||||
| Corporate Client Banking | 56,132 | 53,840 | 45,315 | ||||||||||||||
| Commercial Real Estate Banking | 143,507 | (c) | 107,999 | 101,751 | |||||||||||||
| Other | 526 | 122 | 218 | ||||||||||||||
Total loans(a) | $ | 278,208 | $ | 234,586 | $ | 208,443 | |||||||||||
Selected balance sheet data (average) | |||||||||||||||||
| Total assets | $ | 287,851 | $ | 243,108 | $ | 225,548 | |||||||||||
| Loans: | |||||||||||||||||
| Loans retained | 267,285 | (d) | 222,388 | 201,920 | |||||||||||||
Loans held-for-sale and loans at fair value | 1,060 | 1,350 | 3,122 | ||||||||||||||
| Total loans | $ | 268,345 | $ | 223,738 | $ | 205,042 | |||||||||||
| Deposits | 267,758 | (e) | 294,180 | 301,343 | |||||||||||||
| Equity | 29,507 | 25,000 | 24,000 | ||||||||||||||
Average loans by client segment | |||||||||||||||||
| Middle Market Banking | $ | 77,130 | (f) | $ | 67,830 | $ | 60,128 | ||||||||||
| Corporate Client Banking | 58,770 | 50,281 | 44,361 | ||||||||||||||
| Commercial Real Estate Banking | 132,114 | (f) | 105,459 | 100,331 | |||||||||||||
| Other | 331 | 168 | 222 | ||||||||||||||
| Total loans | $ | 268,345 | $ | 223,738 | $ | 205,042 | |||||||||||
Employees | 17,867 | 14,687 | 12,902 | ||||||||||||||
(a)As of December 31, 2023, 2022 and 2021, total loans included $36 million, $132 million, and $1.2 billion of loans, respectively, under the PPP, of which $32 million, $123 million and $1.1 billion were in Middle Market Banking, respectively.
(b)Includes First Republic. Refer to page 67 for additional information.
(c)As of December 31, 2023, included $5.9 billion and $32.6 billion for Middle Market Banking and Commercial Real Estate Banking, respectively, associated with First Republic.
(d)Average loans retained associated with First Republic were $26.8 billion for the year ended December 31, 2023.
(e)In the fourth quarter of 2023, certain deposits associated with First Republic were transferred from CCB. Refer to page 67 for additional information.
(f)Average Middle Market Banking and Commercial Real Estate Banking loans associated with First Republic were $4.2 billion and $22.5 billion, respectively, for the year ended December 31, 2023.
JPMorgan Chase & Co./2023 Form 10-K | 79 | |||||||
| Selected metrics | |||||||||||||||||
| As of or for the year ended December 31, (in millions, except ratios) | 2023 | 2022 | 2021 | ||||||||||||||
Credit data and quality statistics | |||||||||||||||||
| Net charge-offs/(recoveries) | $ | 316 | $ | 84 | $ | 71 | |||||||||||
| Nonperforming assets | |||||||||||||||||
| Nonaccrual loans: | |||||||||||||||||
Nonaccrual loans retained(a) | $ | 809 | $ | 766 | $ | 740 | |||||||||||
Nonaccrual loans held-for-sale and loans at fair value | — | — | — | ||||||||||||||
| Total nonaccrual loans | $ | 809 | $ | 766 | $ | 740 | |||||||||||
Assets acquired in loan satisfactions | 54 | — | 17 | ||||||||||||||
| Total nonperforming assets | $ | 863 | $ | 766 | $ | 757 | |||||||||||
| Allowance for credit losses: | |||||||||||||||||
| Allowance for loan losses | $ | 5,005 | $ | 3,324 | $ | 2,219 | |||||||||||
Allowance for lending-related commitments | 801 | 830 | 749 | ||||||||||||||
Total allowance for credit losses | $ | 5,806 | (c) | $ | 4,154 | $ | 2,968 | ||||||||||
Net charge-off/(recovery) rate(b) | 0.12% | 0.04% | 0.04% | ||||||||||||||
Allowance for loan losses to period-end loans retained | 1.80 | 1.42 | 1.08 | ||||||||||||||
Allowance for loan losses to nonaccrual loans retained(a) | 619 | 434 | 300 | ||||||||||||||
Nonaccrual loans to period-end total loans | 0.29 | 0.33 | 0.36 | ||||||||||||||
(a)Allowance for loan losses of $156 million, $153 million and $124 million was held against nonaccrual loans retained at December 31, 2023, 2022 and 2021, respectively.
(b)Loans held-for-sale and loans at fair value were excluded when calculating the net charge-off/(recovery) rate.
(c)As of December 31, 2023, included a $729 million allowance for First Republic.
80 | JPMorgan Chase & Co./2023 Form 10-K | |||||||
| ASSET & WEALTH MANAGEMENT | ||||||||||||||
Asset & Wealth Management, with client assets of $5.0 trillion, is a global leader in investment and wealth management. Asset Management Offers multi-asset investment management solutions across equities, fixed income, alternatives and money market funds to institutional and retail investors providing for a broad range of clients’ investment needs. Global Private Bank Provides retirement products and services, brokerage, custody, estate planning, lending, deposits and investment management to high net worth clients. The majority of AWM’s client assets are in actively managed portfolios. | ||
| Selected income statement data | ||||||||||||||
| Year ended December 31, (in millions, except ratios) | 2023 | 2022 | 2021 | |||||||||||
| Revenue | ||||||||||||||
| Asset management fees | $ | 11,826 | $ | 11,510 | $ | 11,518 | ||||||||
| Commissions and other fees | 697 | 662 | $ | 815 | ||||||||||
| All other income | 1,037 | (a)(b) | 335 | 738 | ||||||||||
| Noninterest revenue | 13,560 | 12,507 | 13,071 | |||||||||||
| Net interest income | 6,267 | 5,241 | 3,886 | |||||||||||
| Total net revenue | 19,827 | 17,748 | 16,957 | |||||||||||
| Provision for credit losses | 159 | 128 | (227) | |||||||||||
| Noninterest expense | ||||||||||||||
| Compensation expense | 7,115 | 6,336 | 5,692 | |||||||||||
| Noncompensation expense | 5,665 | 5,493 | 5,227 | |||||||||||
| Total noninterest expense | 12,780 | 11,829 | 10,919 | |||||||||||
Income before income tax expense | 6,888 | 5,791 | 6,265 | |||||||||||
| Income tax expense | 1,661 | 1,426 | 1,528 | |||||||||||
| Net income | $ | 5,227 | $ | 4,365 | $ | 4,737 | ||||||||
| Revenue by line of business | ||||||||||||||
| Asset Management | $ | 9,129 | $ | 8,818 | $ | 9,246 | ||||||||
| Global Private Bank | 10,698 | 8,930 | 7,711 | |||||||||||
| Total net revenue | $ | 19,827 | $ | 17,748 | $ | 16,957 | ||||||||
| Financial ratios | ||||||||||||||
| Return on equity | 31 | % | 25 | % | 33 | % | ||||||||
| Overhead ratio | 64 | 67 | 64 | |||||||||||
| Pre-tax margin ratio: | ||||||||||||||
| Asset Management | 31 | 30 | 35 | |||||||||||
| Global Private Bank | 38 | 35 | 39 | |||||||||||
| Asset & Wealth Management | 35 | 33 | 37 | |||||||||||
(a)Includes the amortization of the purchase discount on certain acquired lending-related commitments associated with First Republic. The discount is deferred in other liabilities and recognized on a straight-line basis over the commitment period and was largely recognized in the current year as the commitments are generally short term. Refer to Note 34 for additional information.
(b)Includes the gain on the original minority interest in CIFM upon the Firm’s acquisition of the remaining 51% interest in the entity.
2023 compared with 2022
Net income was $5.2 billion, up 20%.
Net revenue was $19.8 billion, up 12%. Net interest income was $6.3 billion, up 20%. Noninterest revenue was $13.6 billion, up 8%.
Revenue from Asset Management was $9.1 billion, up 4%, driven by:
•a gain of $339 million on the original minority interest in CIFM upon the Firm's acquisition of the remaining 51% interest in the entity, and
•higher asset management fees driven by strong net inflows largely offset by the net impact of foreign exchange rate movements, as well as the removal of most money market fund fee waivers in the prior year,
largely offset by
•lower performance fees, and
•lower NII due to higher funding costs.
Revenue from Global Private Bank was $10.7 billion, up 20%, driven by:
•higher net interest income on higher average loans associated with First Republic, and from deposit margin expansion on higher rates, largely offset by lower average deposits, and
•higher noninterest revenue, predominantly driven by the amortization of the purchase discount on certain acquired lending-related commitments associated with First Republic, partially offset by net investment valuation losses.
Noninterest expense was $12.8 billion, up 8%, predominantly driven by higher compensation, including continued growth in private banking advisor teams, revenue-related compensation and the impacts of closing the Global Shares and J.P. Morgan Asset Management China acquisitions.
The provision for credit losses was $159 million, predominantly driven by a $146 million addition to the allowance for credit losses to establish the allowance for the First Republic loans and lending-related commitments in the second quarter of 2023.
The provision in the prior year was $128 million driven by a net addition to the allowance for credit losses.
JPMorgan Chase & Co./2023 Form 10-K | 81 | |||||||
| Asset Management has two high-level measures of its overall fund performance. | ||||||||||||||
• Percentage of active mutual fund and active ETF assets under management in funds rated 4- or 5-star: Mutual fund rating services rank funds based on their risk adjusted performance over various periods. A 5-star rating is the best rating and represents the top 10% of industry-wide ranked funds. A 4-star rating represents the next 22.5% of industry-wide ranked funds. A 3-star rating represents the next 35% of industry-wide ranked funds. A 2-star rating represents the next 22.5% of industry-wide ranked funds. A 1-star rating is the worst rating and represents the bottom 10% of industrywide ranked funds. An overall Morningstar rating is derived from a weighted average of the performance associated with a fund’s three-, five and ten- year (if applicable) Morningstar Rating metrics. For U.S.-domiciled funds, separate star ratings are provided at the individual share class level. The Nomura “star rating” is based on three-year risk-adjusted performance only. Funds with fewer than three years of history are not rated and hence excluded from these rankings. All ratings, the assigned peer categories and the asset values used to derive these rankings are sourced from the applicable fund rating provider. Where applicable, the fund rating providers redenominate asset values into U.S. dollars. The percentage of AUM is based on star ratings at the share class level for U.S.-domiciled funds, and at a “primary share class” level to represent the star rating of all other funds, except for Japan, for which Nomura provides ratings at the fund level. The performance data may have been different if all share classes had been included. Past performance is not indicative of future results. | ||||||||||||||
• Percentage of active mutual fund and active ETF assets under management in funds ranked in the 1st or 2nd quartile (one, three and five years):All quartile rankings, the assigned peer categories and the asset values used to derive these rankings are sourced from the fund rating providers. Quartile rankings are based on the net-of-fee absolute return of each fund. Where applicable, the fund rating providers redenominate asset values into U.S. dollars. The percentage of AUM is based on fund performance and associated peer rankings at the share class level for U.S.-domiciled funds, at a “primary share class” level to represent the quartile ranking for U.K., Luxembourg and Hong Kong SAR funds and at the fund level for all other funds. The performance data may have been different if all share classes had been included. Past performance is not indicative of future results. | ||||||||||||||
“Primary share class” means the C share class for European funds and Acc share class for Hong Kong SAR and Taiwan funds. If these share classes are not available, the oldest share class is used as the primary share class. | ||||||||||||||
| Selected metrics | ||||||||||||||
As of or for the year ended December 31, (in millions, except ranking data, ratios and employees) | 2023 | 2022 | 2021 | |||||||||||
% of JPM mutual fund assets and ETFs rated as 4- or 5-star(a) | 69 | % | 73 | % | 69 | % | ||||||||
% of JPM mutual fund assets and ETFs ranked in 1st or 2nd quartile:(b) | ||||||||||||||
| 1 year | 40 | 68 | 54 | |||||||||||
| 3 years | 67 | 76 | 73 | |||||||||||
| 5 years | 71 | 81 | 80 | |||||||||||
Selected balance sheet data (period-end)(c) | ||||||||||||||
| Total assets | $ | 245,512 | $ | 232,037 | $ | 234,425 | ||||||||
| Loans | 227,929 | (d) | 214,006 | 218,271 | ||||||||||
| Deposits | 233,232 | (e) | 233,130 | 282,052 | ||||||||||
| Equity | 17,000 | 17,000 | 14,000 | |||||||||||
Selected balance sheet data (average)(c) | ||||||||||||||
| Total assets | $ | 240,222 | $ | 232,438 | $ | 217,187 | ||||||||
| Loans | 220,487 | (f) | 215,582 | 198,487 | ||||||||||
| Deposits | 216,178 | (e) | 261,489 | 230,296 | ||||||||||
| Equity | 16,671 | 17,000 | 14,000 | |||||||||||
Employees | 28,485 | 26,041 | 22,762 | |||||||||||
| Number of Global Private Bank client advisors | 3,515 | 3,137 | 2,738 | |||||||||||
Credit data and quality statistics(c) | ||||||||||||||
| Net charge-offs/(recoveries) | $ | 13 | $ | (7) | $ | 26 | ||||||||
| Nonaccrual loans | 650 | 459 | 708 | |||||||||||
| Allowance for credit losses: | ||||||||||||||
| Allowance for loan losses | $ | 633 | $ | 494 | $ | 365 | ||||||||
Allowance for lending-related commitments | 28 | 20 | 18 | |||||||||||
Total allowance for credit losses | $ | 661 | (g) | $ | 514 | $ | 383 | |||||||
| Net charge-off/(recovery) rate | 0.01 | % | — | % | 0.01 | % | ||||||||
Allowance for loan losses to period-end loans | 0.28 | 0.23 | 0.17 | |||||||||||
Allowance for loan losses to nonaccrual loans | 97 | 108 | 52 | |||||||||||
Nonaccrual loans to period-end loans | 0.29 | 0.21 | 0.32 | |||||||||||
(a)Represents the Morningstar Rating for all domiciled funds except for Japan domiciled funds which use Nomura. Includes only Asset Management retail active open-ended mutual funds and active ETFs that have a rating. Excludes money market funds, Undiscovered Managers Fund, and Brazil domiciled funds. This metric has been updated to include active ETFs, and prior period amounts have been revised to conform with the current presentation.
(b)Quartile ranking sourced from Morningstar, Lipper and Nomura based on country of domicile. Includes only Asset Management retail active open-ended mutual funds and active ETFs that are ranked by the aforementioned sources. Excludes money market funds, Undiscovered Managers Fund, and Brazil domiciled funds. This metric has been updated to include active ETFs, and prior period numbers have been revised to conform with the current presentation.
(c)Loans, deposits and related credit data and quality statistics relate to the Global Private Bank business.
(d)Includes First Republic. Refer to page 67 for additional information.
(e)In the fourth quarter of 2023, certain deposits associated with First Republic were transferred from CCB. Refer to page 67 for additional information.
(f)Includes $8.7 billion for the full year 2023, associated with First Republic.
(g)Includes First Republic.
82 | JPMorgan Chase & Co./2023 Form 10-K | |||||||
Client assets
2023 compared with 2022
Assets under management were $3.4 trillion and client assets were $5.0 trillion, each up 24%, driven by continued net inflows, higher market levels, and the impact of the acquisition of Global Shares.
| Client assets | |||||||||||
| December 31, (in billions) | 2023 | 2022 | 2021 | ||||||||
| Assets by asset class | |||||||||||
| Liquidity | $ | 926 | $ | 654 | $ | 708 | |||||
| Fixed income | 751 | 638 | 693 | ||||||||
| Equity | 868 | 670 | 779 | ||||||||
| Multi-asset | 680 | 603 | 732 | ||||||||
| Alternatives | 197 | 201 | 201 | ||||||||
| Total assets under management | 3,422 | 2,766 | 3,113 | ||||||||
Custody/brokerage/ administration/deposits | 1,590 | 1,282 | 1,182 | ||||||||
Total client assets(a) | $ | 5,012 | $ | 4,048 | $ | 4,295 | |||||
| Assets by client segment | |||||||||||
| Private Banking | $ | 974 | $ | 751 | $ | 805 | |||||
| Global Institutional | 1,488 | 1,252 | 1,430 | ||||||||
| Global Funds | 960 | 763 | 878 | ||||||||
| Total assets under management | $ | 3,422 | $ | 2,766 | $ | 3,113 | |||||
Private Banking | $ | 2,452 | $ | 1,964 | $ | 1,931 | |||||
| Global Institutional | 1,594 | 1,314 | 1,479 | ||||||||
| Global Funds | 966 | 770 | 885 | ||||||||
Total client assets(a) | $ | 5,012 | $ | 4,048 | $ | 4,295 | |||||
(a)Includes CCB client investment assets invested in managed accounts and J.P. Morgan mutual funds where AWM is the investment manager.
| Client assets (continued) | |||||||||||
| Year ended December 31, (in billions) | 2023 | 2022 | 2021 | ||||||||
Assets under management rollforward | |||||||||||
| Beginning balance | $ | 2,766 | $ | 3,113 | $ | 2,716 | |||||
| Net asset flows: | |||||||||||
| Liquidity | 242 | (55) | 68 | ||||||||
| Fixed income | 70 | 13 | 36 | ||||||||
| Equity | 70 | 35 | 85 | ||||||||
| Multi-asset | 1 | (9) | 17 | ||||||||
| Alternatives | (1) | 8 | 26 | ||||||||
| Market/performance/other impacts | 274 | (339) | 165 | ||||||||
| Ending balance, December 31 | $ | 3,422 | $ | 2,766 | $ | 3,113 | |||||
| Client assets rollforward | |||||||||||
| Beginning balance | $ | 4,048 | $ | 4,295 | $ | 3,652 | |||||
| Net asset flows | 490 | 49 | 389 | ||||||||
| Market/performance/other impacts | 474 | (296) | 254 | ||||||||
| Ending balance, December 31 | $ | 5,012 | $ | 4,048 | $ | 4,295 | |||||
| International metrics | |||||||||||
| Year ended December 31, (in billions, except where otherwise noted) | 2023 | 2022 | 2021 | ||||||||
Total net revenue (in millions)(a) | |||||||||||
| Europe/Middle East/Africa | $ | 3,377 | $ | 3,240 | $ | 3,571 | |||||
| Asia-Pacific | 1,876 | 1,836 | 2,017 | ||||||||
| Latin America/Caribbean | 985 | 967 | 886 | ||||||||
| Total international net revenue | 6,238 | 6,043 | 6,474 | ||||||||
| North America | 13,589 | 11,705 | 10,483 | ||||||||
| Total net revenue | $ | 19,827 | $ | 17,748 | $ | 16,957 | |||||
| Assets under management | |||||||||||
| Europe/Middle East/Africa | $ | 539 | $ | 487 | $ | 561 | |||||
| Asia-Pacific | 263 | 218 | 254 | ||||||||
| Latin America/Caribbean | 86 | 69 | 79 | ||||||||
| Total international assets under management | 888 | 774 | 894 | ||||||||
| North America | 2,534 | 1,992 | 2,219 | ||||||||
| Total assets under management | $ | 3,422 | $ | 2,766 | $ | 3,113 | |||||
| Client assets | |||||||||||
| Europe/Middle East/Africa | $ | 740 | $ | 610 | $ | 687 | |||||
| Asia-Pacific | 406 | 331 | 381 | ||||||||
| Latin America/Caribbean | 232 | 189 | 195 | ||||||||
| Total international client assets | 1,378 | 1,130 | 1,263 | ||||||||
| North America | 3,634 | 2,918 | 3,032 | ||||||||
| Total client assets | $ | 5,012 | $ | 4,048 | $ | 4,295 | |||||
(a)Regional revenue is based on the domicile of the client.
JPMorgan Chase & Co./2023 Form 10-K | 83 | |||||||
| CORPORATE | ||||||||||||||
The Corporate segment consists of Treasury and Chief Investment Office (“CIO”) and Other Corporate. Treasury and CIO is predominantly responsible for measuring, monitoring, reporting and managing the Firm’s liquidity, funding, capital, structural interest rate and foreign exchange risks. Other Corporate includes staff functions and expense that is centrally managed as well as certain Firm initiatives and activities not solely aligned to a specific LOB. The major Other Corporate functions include Real Estate, Technology, Legal, Corporate Finance, Human Resources, Internal Audit, Risk Management, Compliance, Control Management, Corporate Responsibility and various Other Corporate groups. | |||||
| Selected income statement and balance sheet data | ||||||||||||||
Year ended December 31, (in millions, except employees) | 2023 | 2022 | 2021 | |||||||||||
| Revenue | ||||||||||||||
| Principal transactions | $ | 302 | $ | (227) | $ | 187 | ||||||||
| Investment securities gains/(losses) | (3,180) | (2,380) | (345) | |||||||||||
| All other income | 3,010 | (c) | 809 | 226 | ||||||||||
| Noninterest revenue | 132 | (1,798) | 68 | |||||||||||
| Net interest income | 7,906 | (c) | 1,878 | (3,551) | ||||||||||
Total net revenue(a) | 8,038 | 80 | (3,483) | |||||||||||
| Provision for credit losses | 171 | 22 | 81 | |||||||||||
| Noninterest expense | 5,601 | (c)(d) | 1,034 | 1,802 | ||||||||||
| Income/(loss) before income tax expense/(benefit) | 2,266 | (976) | (5,366) | |||||||||||
| Income tax expense/(benefit) | (555) | (e) | (233) | (1,653) | ||||||||||
| Net income/(loss) | $ | 2,821 | $ | (743) | $ | (3,713) | ||||||||
| Total net revenue | ||||||||||||||
| Treasury and CIO | 6,072 | (439) | (3,464) | |||||||||||
| Other Corporate | 1,966 | (c) | 519 | (19) | ||||||||||
| Total net revenue | $ | 8,038 | $ | 80 | $ | (3,483) | ||||||||
| Net income/(loss) | ||||||||||||||
| Treasury and CIO | 4,206 | (197) | (3,057) | |||||||||||
| Other Corporate | (1,385) | (c)(d) | (546) | (656) | ||||||||||
| Total net income/(loss) | $ | 2,821 | $ | (743) | $ | (3,713) | ||||||||
| Total assets (period-end) | $ | 1,348,437 | $ | 1,328,219 | $ | 1,518,100 | ||||||||
| Loans (period-end) | 1,924 | 2,181 | 1,770 | |||||||||||
Deposits(b) | 21,826 | 14,203 | 396 | |||||||||||
Employees | 47,530 | 44,196 | 38,952 | |||||||||||
(a)Included tax-equivalent adjustments, predominantly driven by tax-exempt income from municipal bonds, of $211 million, $235 million and $257 million for the years ended December 31, 2023, 2022 and 2021, respectively.
(b)Predominantly relates to the Firm's international consumer initiatives.
(c)Includes the impact of the First Republic acquisition. Refer to Notes 6 and 34 for additional information.
(d)Includes the FDIC special assessment. Refer to Note 6 for additional information.
(e)Income taxes associated with the First Republic acquisition are reflected in the estimated bargain purchase gain.
2023 compared with 2022
Net income was $2.8 billion, compared with a net loss of $743 million in the prior year.
Net revenue was $8.0 billion, compared with $80 million in the prior year, predominantly driven by higher net interest income due to higher rates, partially offset by the impact of lower Firmwide average deposit balances.
Noninterest revenue was $132 million, compared with a loss of $1.8 billion in the prior year, driven by:
•the $2.8 billion estimated bargain purchase gain associated with the First Republic acquisition,
•higher losses in the prior year on certain revenues associated with foreign exchange rate movements that are risk-managed by Treasury and CIO, and
•the impact of higher short-term cash deployment activities as a result of the current interest rate environment,
partially offset by
•higher net investment securities losses related to the sales of U.S. Treasuries and U.S. GSE and government agency MBS, associated with repositioning the investment securities portfolio, and
•lower net gains related to certain other Corporate investments.
The prior year included a gain on the sale of Visa B shares and proceeds from an insurance settlement.
Noninterest expense was $5.6 billion, up $4.6 billion, predominantly driven by:
•the $2.9 billion FDIC special assessment,
•$1.0 billion associated with First Republic, predominantly driven by integration and restructuring costs as well as expenses recorded in the second quarter of 2023 with respect to individuals associated with First Republic who did not become employees of the Firm until July 2, 2023,
•a greater benefit in the prior year on certain expenses associated with foreign exchange rate movements that are risk-managed by Treasury and CIO,
•higher legal expenses, and
•higher costs associated with the Firm's international consumer growth initiatives,
partially offset by
•lower benefits-related and real estate expenses.
The net impact of movements in foreign exchange rates associated with the foreign exchange risk that was transferred to Treasury and CIO on certain revenues and expenses was not material to net income. Refer to Foreign Exchange Risk on page 66 for additional information.
Refer to Note 10 and Note 13 for additional information on the investment securities portfolio and the allowance for credit losses.
84 | JPMorgan Chase & Co./2023 Form 10-K | |||||||
The provision for credit losses was $171 million, reflecting a net addition to the allowance for credit losses related to a single name exposure, which was subsequently charged off upon the restructuring of a loan.
The current period income tax benefit was driven by:
•the finalization of certain income tax regulations, other tax adjustments and tax benefits associated with tax audit settlements,
partially offset by
•the impact from changes in the level and mix of income and expenses subject to U.S. federal, state and local taxes that also impacted the Firm's tax reserves.
The income taxes associated with the First Republic acquisition are reflected in the estimated bargain purchase gain.
The prior period income tax benefit was driven by benefits related to tax audit settlements as well as other tax adjustments, partially offset by a change in the level and mix of income and expenses subject to U.S. federal, state and local taxes that also impacted the Firm's tax reserves.
Other Corporate also reflects the Firm's international consumer initiatives, which includes Chase U.K., the Firm's digital retail bank in the U.K.; Nutmeg, a digital wealth manager in the U.K.; and a 46% ownership stake in C6 Bank, a digital bank in Brazil.
Treasury and CIO overview
Treasury and CIO is predominantly responsible for measuring, monitoring, reporting and managing the Firm’s liquidity, funding, capital, structural interest rate and foreign exchange risks. The risks managed by Treasury and CIO arise from the activities undertaken by the Firm’s four major reportable business segments to serve their respective client bases, which generate both on- and off-balance sheet assets and liabilities.
Treasury and CIO seeks to achieve the Firm’s asset-liability management objectives generally by investing in high-quality securities that are managed for the longer-term as part of the Firm’s investment securities portfolio. Treasury and CIO also uses derivatives to meet the Firm’s asset-liability management objectives. Refer to Note 5 for further information on derivatives. In addition, Treasury and CIO manages the Firm’s cash position primarily through deposits at central banks and investments in short-term instruments. Refer to Liquidity Risk Management on pages 102–109 for further information on liquidity and funding risk. Refer to Market Risk Management on pages 135–143 for information on interest rate and foreign exchange risks.
The investment securities portfolio predominantly consists of U.S. and non-U.S. government securities, U.S. GSE and government agency and nonagency mortgage-backed securities, collateralized loan obligations, obligations of U.S. states and municipalities and other ABS. At December 31, 2023, the Treasury and CIO investment securities portfolio, net of the allowance for credit losses, was $569.2 billion,
and the average credit rating of the securities comprising the portfolio was AA+ (based upon external ratings where available and, where not available, based primarily upon internal risk ratings). Refer to Note 10 for further information on the Firm’s investment securities portfolio and internal risk ratings.
| Selected income statement and balance sheet data | |||||||||||||||||
| As of or for the year ended December 31, (in millions) | 2023 | 2022 | 2021 | ||||||||||||||
| Investment securities losses | $ | (3,180) | $ | (2,380) | $ | (345) | |||||||||||
| Available-for-sale securities (average) | $ | 200,708 | $ | 239,924 | $ | 306,827 | |||||||||||
Held-to-maturity securities (average)(a) | 402,010 | 412,180 | 285,086 | ||||||||||||||
Investment securities portfolio (average) | $ | 602,718 | $ | 652,104 | $ | 591,913 | |||||||||||
| Available-for-sale securities (period-end) | $ | 199,354 | (c) | $ | 203,981 | $ | 306,352 | ||||||||||
Held-to-maturity securities (period–end)(a) | 369,848 | 425,305 | 363,707 | ||||||||||||||
Investment securities portfolio, net of allowance for credit losses (period–end)(b) | $ | 569,202 | $ | 629,286 | $ | 670,059 | |||||||||||
(a)Effective January 1, 2023, the Firm adopted new hedge accounting guidance. As permitted by the guidance, the Firm elected to transfer $7.1 billion of HTM securities to AFS. During 2022 and 2021, the Firm transferred $78.3 billion and $104.5 billion of investment securities, respectively, from AFS to HTM for capital management purposes. Refer to Note 1 and Note 10 for additional information on the new hedge accounting guidance.
(b)As of December 31, 2023, 2022 and 2021, the allowance for credit losses on investment securities was $94 million, $67 million and $42 million, respectively.
(c)As of December 31, 2023, included $24.2 billion of AFS securities associated with First Republic. Refer to Note 34 for additional information.
JPMorgan Chase & Co./2023 Form 10-K | 85 | |||||||
Management’s discussion and analysis
FIRMWIDE RISK MANAGEMENT | ||||||||||||||
Risk is an inherent part of JPMorgan Chase’s business activities. When the Firm extends a consumer or wholesale loan, advises customers and clients on their investment decisions, makes markets in securities, or offers other products or services, the Firm takes on some degree of risk. The Firm’s overall objective is to manage its business, and the associated risks, in a manner that balances serving the interests of its clients, customers and investors, and protecting the safety and soundness of the Firm.
The Firm believes that effective risk management requires, among other things:
•Acceptance of responsibility, including identification and escalation of risks by all individuals within the Firm;
•Ownership of risk identification, assessment, data and management within each of the LOBs and Corporate; and
•A Firmwide risk governance and oversight structure.
The Firm follows a disciplined and balanced compensation framework with strong internal governance and independent oversight by the Board of Directors (the “Board”). The impact of risk and control issues is carefully considered in the Firm’s performance evaluation and incentive compensation processes.
Risk governance framework
The Firm’s risk governance framework involves understanding drivers of risks, types of risks, and impacts of risks. 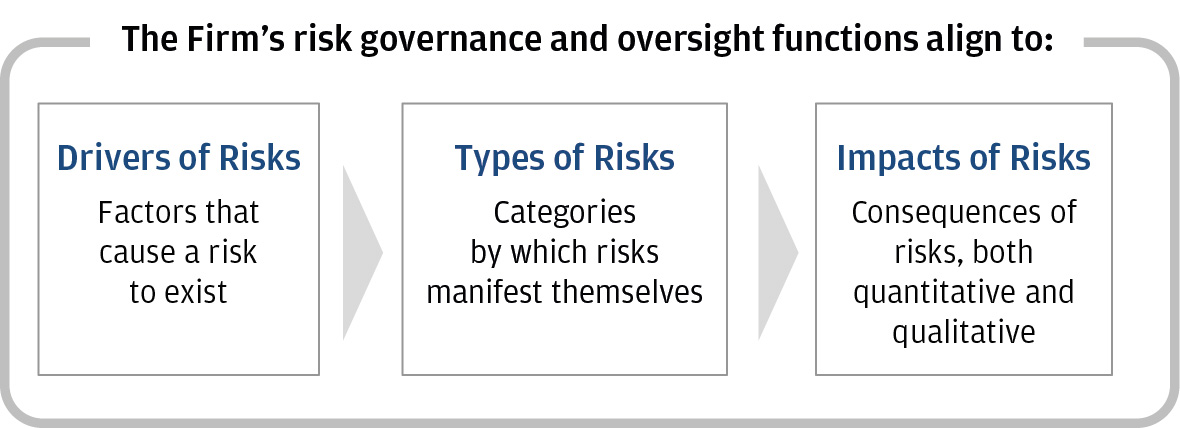
Drivers of risks are factors that cause a risk to exist. Drivers of risks include, but are not limited to, the economic environment, regulatory or government policy, competitor or market evolution, business decisions, process or judgment error, deliberate wrongdoing, dysfunctional markets, and natural disasters.
Types of risks are categories by which risks manifest themselves. The Firm’s risks are generally categorized in the following four risk types:
•Strategic risk is the risk to earnings, capital, liquidity, or reputation associated with poorly designed or failed business plans or an inadequate response to changes in the operating environment.
•Credit and investment risk is the risk associated with the default or change in credit profile of a client, counterparty or customer; or loss of principal or a reduction in expected returns on investments, including consumer credit risk, wholesale credit risk, and investment portfolio risk.
•Market risk is the risk associated with the effect of changes in market factors, such as interest and foreign exchange rates, equity and commodity prices, credit spreads or implied volatilities, on the value of assets and liabilities held for both the short and long term.
•Operational risk is the risk of an adverse outcome resulting from inadequate or failed internal processes or systems; human factors; or external events impacting the Firm’s processes or systems. Operational risk includes cybersecurity, compliance, conduct, legal, and estimations and model risk.
Impacts of risks are consequences of risks, both quantitative and qualitative. There may be many consequences of risks manifesting, including quantitative impacts such as a reduction in earnings and capital, liquidity outflows, and fines or penalties, or qualitative impacts such as damage to the Firm’s reputation, loss of clients and customers, and regulatory and enforcement actions.
The Firm’s risk governance framework is managed on a Firmwide basis. The Firm has an Independent Risk Management (“IRM”) function, which is comprised of Risk Management and Compliance. The Firm’s Chief Executive Officer (“CEO”) appoints, subject to approval by the Risk Committee of the Board of Directors (the “Board Risk Committee”), the Firm’s Chief Risk Officer (“CRO”) to lead the IRM function and maintain the risk governance framework of the Firm. The framework is subject to approval by the Board Risk Committee through its review and approval of the Risk Governance and Oversight Policy.
The Firm’s CRO oversees and delegates authority to the Firmwide Risk Executives (“FREs”), the Chief Risk Officers of the LOBs and Corporate (“LOB CROs”), and the Firm’s Chief Compliance Officer (“CCO”), who, in turn, establish Risk Management and Compliance organizations, develop the Firm’s risk governance policies and standards, and define and oversee the implementation of the Firm’s risk governance framework. The LOB CROs oversee risks that arise in their LOBs and Corporate, while FREs oversee risks that span across the LOBs and Corporate, as well as functions and regions. Each area of the Firm giving rise to risk is expected to operate within the parameters identified by the IRM function, and within the risk and control standards established by its own management.
Three lines of defense
The Firm’s “three lines of defense” are as follows:
The first line of defense consists of each LOB, Treasury and CIO, and certain Other Corporate initiatives, including their aligned Operations, Technology and Control Management. The first line of defense owns the identification of risks within their respective organizations and the design and execution of controls to manage those risks. Responsibilities also include adherence to applicable laws, rules and regulations and implementation of the risk
86 | JPMorgan Chase & Co./2023 Form 10-K | |||||||
governance framework established by IRM, which may include policies, standards, limits, thresholds and controls.
The second line of defense is the IRM function, which is separate from the first line of defense and is responsible for independently measuring risk, as well as assessing and challenging the risk management practices of the first line of defense. IRM is also responsible for the identification of risks within its respective organization, adherence to applicable laws, rules and regulations and for the development and implementation of policies and standards with respect to its own processes.
The third line of defense is Internal Audit, an independent function that provides objective assessment of the adequacy and effectiveness of Firmwide processes, controls, governance and risk management. The Internal Audit function is headed by the General Auditor, who reports to the Audit Committee and administratively to the CEO.
In addition, there are other functions that contribute to the Firmwide control environment but are not considered part of a particular line of defense, including Finance, Human Resources and Legal. These other functions are responsible for the identification of risks within their respective organizations, adherence to applicable laws, rules and regulations and implementation of the risk governance framework established by IRM.
Risk identification and ownership
The LOBs and Corporate own the identification of risks within their respective organizations, as well as the design and execution of controls, including IRM-specified controls, to manage those risks. To support this activity, the Firm has a risk identification framework designed to facilitate each LOB and Corporate’s responsibility to identify material risks inherent to the Firm’s businesses and operational activities, catalog them in a central repository and review material risks on a regular basis. The IRM function reviews and challenges the LOB and Corporate’s identified risks, maintains the central repository and provides the consolidated Firmwide results to the Firmwide Risk Committee (“FRC”) and the Board Risk Committee.
Risk appetite
The Firm’s overall appetite for risk is governed by “Risk Appetite” frameworks for quantitative and qualitative risks. The Firm’s risk appetite is periodically set and approved by senior management (including the CEO and CRO) and approved by the Board Risk Committee. Quantitative and qualitative risks are assessed to monitor and measure the Firm’s capacity to take risk consistent with its stated risk appetite. Risk appetite results are reported to the Board Risk Committee.
JPMorgan Chase & Co./2023 Form 10-K | 87 | |||||||
Management’s discussion and analysis
Risk governance and oversight structure
The independent status of the IRM function is supported by a risk governance and oversight structure that provides channels for the escalation of risks and issues to senior management, the FRC, and the Board of Directors, as appropriate.
The chart below illustrates the principal standing committees of the Board of Directors and key senior management-level committees in the Firm’s risk governance and oversight structure. In addition, there are other committees, forums and channels of escalation that support the oversight of risk that are not shown in the chart below or described in this Form 10-K.
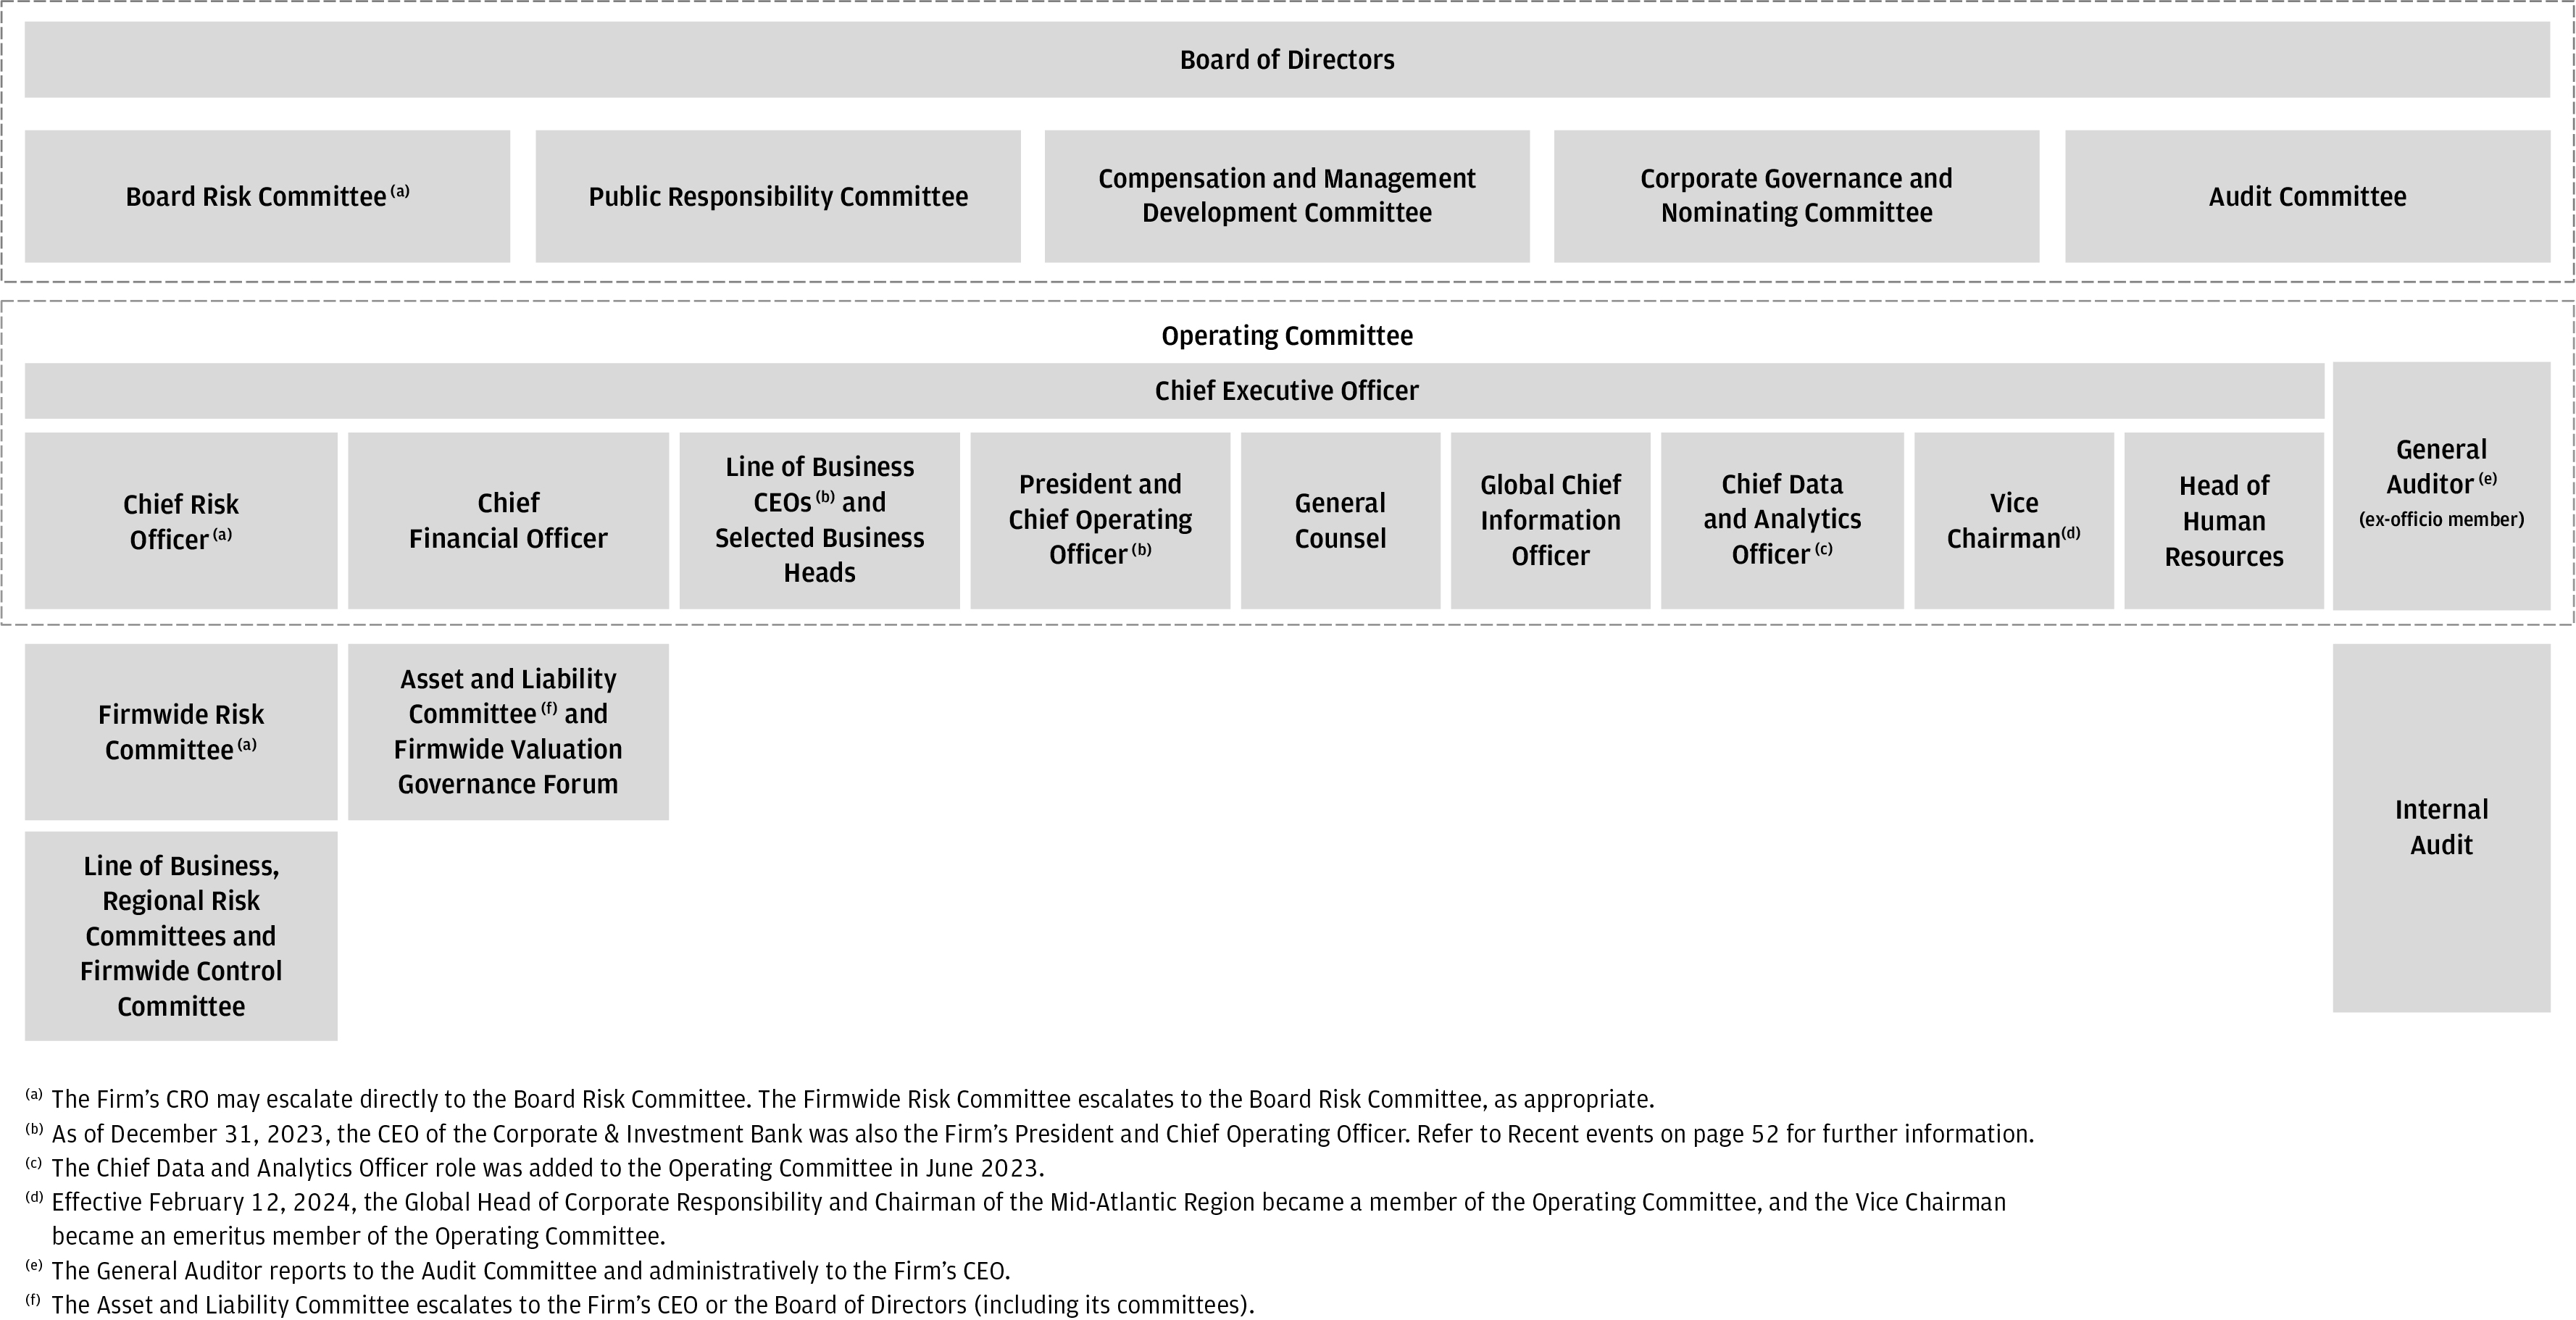
The Firm’s Operating Committee, which consists of the Firm’s CEO, CRO, Chief Financial Officer (“CFO”), General Counsel, CEOs of the LOBs and other senior executives, is accountable to and may refer matters to the Firm’s Board of Directors. The Operating Committee and certain other members of senior management are responsible for escalating to the Board the information necessary to facilitate the Board’s exercise of its duties.
Board oversight
The Firm’s Board of Directors actively oversees the business and affairs of the Firm. This includes monitoring the Firm’s financial performance and condition and reviewing the strategic objectives and plans of the Firm. The Board carries out a significant portion of its oversight responsibilities through its principal standing committees, each of which consists solely of independent members of the Board. The Board Risk Committee is the principal committee that oversees risk matters. The Audit Committee oversees the control environment, and the Compensation & Management Development Committee oversees compensation and other management-related matters. Each committee of the Board oversees reputation risks, conduct risks, and environmental, social and governance (“ESG”) matters within its scope of responsibility.
The JPMorgan Chase Bank, N.A. Board of Directors is responsible for the oversight of management of the bank, which it discharges both acting directly and through the principal standing committees of the Firm’s Board of Directors. Risk and control oversight on behalf of JPMorgan
Chase Bank N.A. is primarily the responsibility of the Board Risk Committee and the Audit Committee, respectively, and, with respect to compensation and other management-related matters, the Compensation & Management Development Committee.
The Board Risk Committee assists the Board in its oversight of management’s responsibility to implement a global risk management framework reasonably designed to identify, assess and manage the Firm’s risks. The Board Risk Committee’s responsibilities include approval of applicable primary risk policies and review of certain associated frameworks, analysis and reporting established by management. Breaches in risk appetite and parameters, issues that may have a material adverse impact on the Firm, including capital and liquidity issues, and other significant risk-related matters are escalated to the Board Risk Committee, as appropriate.
The Audit Committee assists the Board in its oversight of management’s responsibility to ensure that there is an effective system of controls reasonably designed to safeguard the Firm’s assets and income, ensure the integrity of the Firm’s financial statements, and maintain compliance with the Firm’s ethical standards, policies, plans and procedures, and with laws, rules and regulations. It also assists the Board in its oversight of the qualifications, independence and performance of the Firm’s independent registered public accounting firm, and of the performance of the Firm’s Internal Audit function.
88 | JPMorgan Chase & Co./2023 Form 10-K | |||||||
The Compensation & Management Development Committee (“CMDC”) assists the Board in its oversight of the Firm’s compensation principles and practices. The CMDC reviews and approves the Firm’s compensation and qualified benefits programs. The Committee reviews the performance of Operating Committee members against their goals, and approves their compensation awards. In addition, the CEO’s award is subject to ratification by the independent directors of the Board. The CMDC also reviews the development of and succession for key executives. As part of the Board’s role of reinforcing, demonstrating and communicating the “tone at the top,” the CMDC oversees the Firm’s culture, including reviewing updates from management regarding significant conduct issues and any related actions with respect to employees, including compensation actions.
The Public Responsibility Committee oversees and reviews the Firm's positions and practices on public responsibility matters such as community investment, fair lending, sustainability, consumer practices and other public policy issues that reflect the Firm's values and character and could impact the Firm's reputation among its stakeholders. The Committee also provides guidance on these matters to management and the Board, as appropriate.
The Corporate Governance & Nominating Committee exercises general oversight with respect to the governance of the Board of Directors. It reviews the qualifications of and recommends to the Board proposed nominees for election to the Board. The Committee evaluates and recommends to the Board corporate governance practices applicable to the Firm. It also reviews the framework for assessing the Board’s performance and self-evaluation.
Management oversight
The Firm’s senior management-level committees that are primarily responsible for key risk-related functions include:
The Firmwide Risk Committee (“FRC”) is the Firm’s highest management-level risk committee. It oversees the risks inherent in the Firm’s business and provides a forum for discussion of topics and issues that are raised or escalated by its members and other committees.
The Firmwide Control Committee (“FCC”) is an escalation committee for senior management to review and discuss the Firmwide compliance and operational risk environment including identified issues, compliance and operational risk metrics and significant events that have been escalated.
Line of Business and Regional Risk Committees are responsible for overseeing the governance, limits, and controls that have been established within the scope of their respective activities. These committees review the ways in which the particular LOB or the businesses operating in a particular region could be exposed to adverse outcomes, with a focus on identifying, accepting, escalating and/or requiring remediation of matters brought to these committees.
Line of Business and Corporate Function Control Committees oversee the risk and control environment of their respective business or function, inclusive of Operational Risk, Compliance and Conduct Risks. As part of that mandate, they are responsible for reviewing indicators of elevated or emerging risks and other data that may impact the level of compliance and operational risk in a business or function, addressing key compliance and operational risk issues, with an emphasis on processes with control concerns and overseeing control remediation.
The Asset and Liability Committee (“ALCO”) is responsible for overseeing the Firm’s asset and liability management (“ALM”), including the activities and frameworks supporting management of the balance sheet, liquidity risk, interest rate risk, and capital risk.
The Firmwide Valuation Governance Forum (“VGF”) is composed of senior finance and risk executives and is responsible for overseeing the management of risks arising from valuation activities conducted across the Firm.
Risk governance and oversight functions
The Firm manages its risk through risk governance and oversight functions. The scope of a particular function or business activity may include one or more drivers, types and/or impacts of risk. For example, Country Risk Management oversees country risk which may be a driver of risk or an aggregation of exposures that could give rise to multiple risk types such as credit or market risk.
The following sections discuss the risk governance and oversight functions that have been established to manage the risks inherent in the Firm’s business activities.
| Risk governance and oversight functions | Page | ||||
| Strategic Risk | 90 | ||||
| Capital Risk | 91-101 | ||||
| Liquidity Risk | 102-109 | ||||
| Reputation Risk | 110 | ||||
| Consumer Credit Risk | 114-119 | ||||
| Wholesale Credit Risk | 120-130 | ||||
| Investment Portfolio Risk | 134 | ||||
| Market Risk | 135-143 | ||||
| Country Risk | 144-145 | ||||
| Climate Risk | 146 | ||||
| Operational Risk | 147-150 | ||||
| Compliance Risk | 151 | ||||
| Conduct Risk | 152 | ||||
| Legal Risk | 153 | ||||
| Estimations and Model Risk | 154 | ||||
JPMorgan Chase & Co./2023 Form 10-K | 89 | |||||||
Management’s discussion and analysis
STRATEGIC RISK MANAGEMENT | ||||||||||||||
Strategic risk is the risk to earnings, capital, liquidity or reputation associated with poorly designed or failed business plans or an inadequate response to changes in the operating environment.
Management and oversight
The Operating Committee, together with the senior leadership of each LOB and Corporate, are responsible for managing the Firm’s most significant strategic risks. IRM engages regularly in strategic business discussions and decision-making, including participation in relevant business reviews and senior management meetings, risk and control committees and other relevant governance forums, and review of acquisitions and new business initiatives. The Board of Directors oversees management’s strategic decisions, and the Board Risk Committee oversees IRM and the Firm’s risk governance framework.
In the process of developing business plans and strategic initiatives, LOB and Corporate senior management identify the associated risks that are incorporated into the Firmwide Risk Identification framework and their impact on risk appetite.
In addition, IRM conducts a qualitative assessment of the LOB and Corporate strategic initiatives to assess their impact on the risk profile of the Firm.
The Firm’s strategic planning process, which includes the development of the Firm’s strategic plan and other strategic initiatives, is one component of managing the Firm’s strategic risk. The strategic plan outlines the Firm’s strategic framework and initiatives, and includes components such as budget, risk appetite, capital, earnings and asset-liability management objectives. Guided by the Firm’s Business Principles, the Operating Committee and senior management teams in each LOB and Corporate review and update the strategic plan periodically, including evaluating the strategic framework and performance against prior-year initiatives, assessing the operating environment, refining existing strategies and developing new strategies.
The Firm’s strategic plan, together with IRM’s assessment, are provided to the Board as part of its review and approval of the Firm’s strategic plan, and the plan is also reflected in the Firm's budget.
The Firm’s balance sheet strategy, which focuses on risk-adjusted returns, strong capital and robust liquidity, is also a component in the management of strategic risk. Refer to Capital Risk Management on pages 91-101 for further information on capital risk. Refer to Liquidity Risk Management on pages 102–109 for further information on liquidity risk. Refer to Reputation Risk Management on page 110 for further information on reputation risk.
90 | JPMorgan Chase & Co./2023 Form 10-K | |||||||
CAPITAL RISK MANAGEMENT | ||||||||||||||
Capital risk is the risk that the Firm has an insufficient level or composition of capital to support the Firm’s business activities and associated risks during normal economic environments and under stressed conditions.
A strong capital position is essential to the Firm’s business strategy and competitive position. Maintaining a strong balance sheet to manage through economic volatility is a strategic imperative of the Firm’s Board of Directors, CEO and Operating Committee. The Firm’s “fortress balance sheet” philosophy focuses on risk-adjusted returns, strong capital and robust liquidity. The Firm’s capital risk management strategy focuses on maintaining long-term stability to enable the Firm to build and invest in market-leading businesses, including in highly stressed environments. Senior management considers the implications on the Firm’s capital prior to making significant decisions that could impact future business activities. In addition to considering the Firm’s earnings outlook, senior management evaluates all sources and uses of capital with a view to ensuring the Firm’s capital strength.
Capital risk management
The Firm has a Capital Risk Management function whose primary objective is to provide independent oversight of capital risk across the Firm.
Capital Risk Management’s responsibilities include:
•Defining, monitoring and reporting capital risk metrics;
•Establishing, calibrating and monitoring capital risk limits and indicators, including capital risk appetite;
•Developing processes to classify, monitor and report capital limit breaches;
•Performing assessments of the Firm’s capital management activities, including changes made to the Contingency Capital Plan described below; and
•Conducting assessments of the Firm's regulatory capital framework intended to ensure compliance with applicable regulatory capital rules.
Capital management
Treasury and CIO is responsible for capital management.
The primary objectives of the Firm’s capital management are to:
•Maintain sufficient capital in order to continue to build and invest in the Firm’s businesses through normal economic cycles and in stressed environments;
•Retain flexibility to take advantage of future investment opportunities;
•Promote the Parent Company’s ability to serve as a source of strength to its subsidiaries;
•Ensure the Firm operates above the minimum regulatory capital ratios as well as maintain “well-capitalized” status for the Firm and its principal insured depository institution (“IDI”) subsidiary, JPMorgan Chase Bank, N.A.
at all times under applicable regulatory capital requirements;
•Meet capital distribution objectives; and
•Maintain sufficient capital resources to operate throughout a resolution period in accordance with the Firm’s preferred resolution strategy.
The Firm addresses these objectives through:
•Establishing internal minimum capital requirements and maintaining a strong capital governance framework. The internal minimum capital levels consider the Firm’s regulatory capital requirements as well as an internal assessment of capital adequacy, in normal economic cycles and in stress events;
•Retaining flexibility in order to react to a range of potential events; and
•Regularly monitoring the Firm’s capital position and following prescribed escalation protocols, both at the Firm and material legal entity levels.
Governance
Committees responsible for overseeing the Firm’s capital management include the Capital Governance Committee, the Firmwide ALCO as well as regional ALCOs, and the CIO, Treasury and Corporate (“CTC”) Risk Committee. In addition, the Board Risk Committee periodically reviews the Firm’s capital risk tolerance. Refer to Firmwide Risk Management on pages 86–89 for additional discussion of the Firmwide ALCO and other risk-related committees.
Capital planning and stress testing
Comprehensive Capital Analysis and Review
The Federal Reserve requires the Firm, as a large Bank Holding Company (“BHC”), to submit at least annually a capital plan that has been reviewed and approved by the Board of Directors. The Federal Reserve uses Comprehensive Capital Analysis and Review (“CCAR”) and other stress testing processes to assess whether large BHCs, such as the Firm, have sufficient capital during periods of economic and financial stress, and have robust, forward-looking capital assessment and planning processes in place that address each BHC’s unique risks to enable it to absorb losses under certain stress scenarios. Through CCAR, the Federal Reserve evaluates each BHC’s capital adequacy and internal capital adequacy assessment processes (“ICAAP”), as well as its plans to make capital distributions, such as dividend payments or stock repurchases. The Federal Reserve uses results under the severely adverse scenario from its supervisory stress test to determine each firm’s Stress Capital Buffer (“SCB”) requirement for the coming year.
The Firm's current SCB requirement is 2.9%, and will remain in effect until September 30, 2024. The Firm’s Standardized CET1 capital ratio requirement, including regulatory buffers, was 11.4% as of December 31, 2023.
Refer to Capital actions on page 99 for information on actions taken by the Firm’s Board of Directors.
JPMorgan Chase & Co./2023 Form 10-K | 91 | |||||||
Management’s discussion and analysis
Internal Capital Adequacy Assessment Process
Annually, the Firm prepares the ICAAP, which informs the Board of Directors of the ongoing assessment of the Firm’s processes for managing the sources and uses of capital as well as compliance with supervisory expectations for capital planning and capital adequacy. The Firm’s ICAAP integrates stress testing protocols with capital planning. The Firm’s Audit Committee is responsible for reviewing and approving the capital planning framework.
Stress testing assesses the potential impact of alternative economic and business scenarios on the Firm’s earnings and capital. Economic scenarios, and the parameters underlying those scenarios, are defined centrally and applied uniformly across the businesses. These scenarios are articulated in terms of macroeconomic factors, which are key drivers of business results; global market shocks, which generate short-term but severe trading losses; and idiosyncratic operational risk events. The scenarios are intended to capture and stress key vulnerabilities and idiosyncratic risks facing the Firm. In addition to CCAR and other periodic stress testing, management also considers tailored stress scenarios and sensitivity analyses, as necessary.
Contingency Capital Plan
The Firm’s Contingency Capital Plan establishes the capital management framework for the Firm and specifies the principles underlying the Firm’s approach towards capital management in normal economic conditions and in stressed environments. The Contingency Capital Plan defines how the Firm calibrates its targeted capital levels and meets minimum capital requirements, monitors the ongoing appropriateness of planned capital distributions, and sets out the capital contingency actions that are expected to be taken or considered at various levels of capital depletion during a period of stress.
Regulatory capital
The Federal Reserve establishes capital requirements, including well-capitalized standards, for the Firm as a consolidated financial holding company. The Office of the Comptroller of the Currency ("OCC") establishes similar minimum capital requirements and standards for the Firm’s principal IDI subsidiary, JPMorgan Chase Bank, N.A. The U.S. capital requirements generally follow the Capital Accord of the Basel Committee, as amended from time to time.
Basel III Overview
The capital rules under Basel III establish minimum capital ratios and overall capital adequacy standards for large and internationally active U.S. BHCs and banks, including the Firm and JPMorgan Chase Bank, N.A. The minimum amount of regulatory capital that must be held by BHCs and banks is determined by calculating RWA, which are on-balance sheet assets and off-balance sheet exposures, weighted according to risk. Under the rules currently in effect, two comprehensive approaches are prescribed for calculating RWA: a standardized approach (“Basel III Standardized”), and an advanced approach (“Basel III Advanced”).
For each of these risk-based capital ratios, the capital adequacy of the Firm is evaluated against the lower of the Standardized or Advanced approaches compared to their respective regulatory capital ratio requirements.
In July 2023, the Federal Reserve, the OCC and the FDIC released a proposal to amend the risk-based capital framework, entitled "Regulatory capital rule: Amendments applicable to large banking organizations and to banking organizations with significant trading activity," which is referred to in this Form 10-K as “U.S. Basel III proposal”. Under the proposal, changes to the framework would include replacement of the Advanced approach with an expanded risk-based approach, which would not permit the use of internal models for the calculation of RWA, other than for market risk. In addition, the stress capital buffer requirement would be applicable to both the expanded risk-based approach and the Standardized approach. The proposal would significantly revise risk-based capital requirements for all banks with assets of $100 billion or more, including the Firm and other U.S. GSIBs. The proposed effective date is July 1, 2025, with a three-year transition period applicable to the expanded risk-based approach. Based on the Firm's understanding of the proposal, as applied to its Consolidated balance sheets as of June 30, 2023 (the reference date for a special data collection exercise conducted by the Federal Reserve), the estimated impact at the end of the transition period would increase RWA by approximately 30%, which would result in an approximately 25% increase to CET1 capital necessary to meet the Firm’s CET1 ratio requirement, all else equal. These estimates do not reflect any actions that the Firm may take to mitigate the impact of the rule as currently proposed.
Pending the finalization of the U.S. Basel III proposal, the Firm expects that it will continue to build capital above the current levels, and therefore the CET1 target of 13.5% previously set by the Firm (which was with respect to the current Standardized RWA measure) is no longer meaningful. The Firm's quarterly capital ratios will vary dependent on market conditions and other factors. Under the requirements of the U.S. Basel III proposal, the new expanded risk-based approach, when fully phased-in, would be the Firm’s binding constraint.
The current Basel III rules establish capital requirements for calculating credit risk RWA and market risk RWA, and in the case of Basel III Advanced, operational risk RWA. Key differences in the calculation of credit risk RWA between the Standardized and Advanced approaches are that for Basel III Advanced, credit risk RWA is based on risk-sensitive approaches which largely rely on the use of internal credit models and parameters, whereas for Basel III Standardized, credit risk RWA is generally based on supervisory risk-weightings which vary primarily by counterparty type and asset class. Market risk RWA is generally calculated consistently between Basel III Standardized and Basel III Advanced. In addition to the RWA calculated under these approaches, the Firm may supplement such amounts to
92 | JPMorgan Chase & Co./2023 Form 10-K | |||||||
incorporate management judgment and feedback from its regulators.
As of December 31, 2023, the Advanced Total Capital ratio became the most binding constraint for the Firm’s Basel III risk-based ratios, primarily reflecting the reduction in the Stress Capital Buffer requirement. However, as of December 31, 2023, with respect to the CET1 and Tier 1 risk-based ratios, the Standardized ratios are more binding than the Advanced ratios.
Basel III also includes a requirement for Advanced Approaches banking organizations, including the Firm, to calculate its SLR. As of the fourth quarter of 2023, the Firm’s SLR became more binding than the Basel III risk-based ratios, primarily reflecting the reduction in the Stress Capital Buffer requirement. With the increase in the GSIB surcharge in the first quarter of 2024, the Firm expects the risk-based ratios to revert to being more binding than the SLR.
Refer to page 95 for additional information on GSIB surcharge and page 98 for additional information on SLR.
Other Key Regulatory Developments
GSIB Surcharge
In July 2023, the Federal Reserve also released a proposal to amend the calculation of the GSIB surcharge. If adopted as proposed, these amendments would require the Firm to assess its GSIB surcharge on an annual basis, using the average of the quarterly surcharge calculations throughout the calendar year, with daily averaging required for certain measures within the surcharge calculation. Surcharge increments would be reduced from 50 bps to 10 bps and there would also be other technical amendments to the Method 2 calculation. The proposed amendments would revise risk-based capital requirements for the Firm and other U.S. GSIBs, and would become effective two calendar quarters after the adoption of the final rule. Refer to Risk-based Capital Regulatory Requirements on pages 94-95 for further information on the GSIB surcharge.
TLAC and Eligible LTD Requirements
In August 2023, the Federal Reserve, the FDIC and the OCC released a proposal to expand the eligible long-term debt ("eligible LTD") and clean holding company requirements under the existing total loss-absorbing capacity ("TLAC") rule to apply to non-GSIB banks with $100 billion or more in total consolidated assets. While U.S. GSIBs are already subject to these requirements, the proposal would reduce the amount of LTD with remaining maturities of less than two years that count towards a U.S. GSIB's TLAC requirement. The proposal would also expand the existing capital deduction framework for LTD issued by GSIBs to include LTD issued by non-GSIB banks subject to the LTD requirements.
JPMorgan Chase & Co./2023 Form 10-K | 93 | |||||||
Management’s discussion and analysis
Risk-based Capital Regulatory Requirements
The following chart presents the Firm’s Basel III CET1 capital ratio requirements under the Basel III rules currently in effect.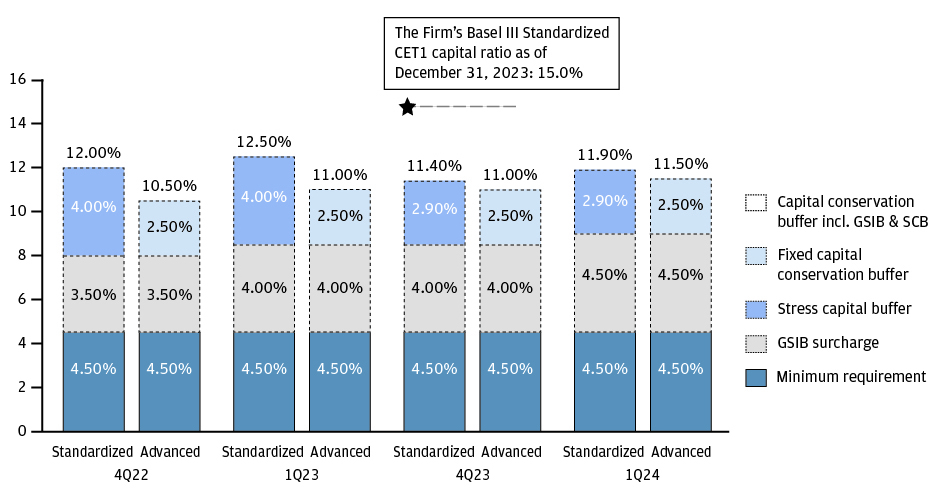
All banking institutions are currently required to have a minimum CET1 capital ratio of 4.5% of risk-weighted assets.
Certain banking organizations, including the Firm, are required to hold additional levels of capital to serve as a “capital conservation buffer”. The capital conservation buffer incorporates a GSIB surcharge, a discretionary countercyclical capital buffer and a fixed capital conservation buffer of 2.5% for Advanced regulatory capital requirements, as well as a variable SCB requirement, floored at 2.5%, for Standardized regulatory capital requirements.
Under the Federal Reserve’s GSIB rule, the Firm is required to assess its GSIB surcharge on an annual basis under two separately prescribed methods based on data for the previous fiscal year-end, and is subject to the higher of the two. “Method 1” reflects the GSIB surcharge as prescribed by the Basel Committee’s assessment methodology, and is calculated by the Financial Stability Board (“FSB”) across five criteria: size, cross-jurisdictional activity, interconnectedness, complexity and substitutability. “Method 2”, calculated by the Firm, modifies the Method 1 requirements to include a measure of short-term wholesale funding in place of substitutability, and introduces a GSIB score “multiplication factor”.
94 | JPMorgan Chase & Co./2023 Form 10-K | |||||||
The following table presents the Firm’s effective GSIB surcharge for the years ended December 31, 2024, 2023 and 2022.
| 2024 | 2023 | 2022 | |||||||||
| Method 1 | 2.5 | % | 2.5 | % | 2.0 | % | |||||
| Method 2 | 4.5 | % | 4.0 | % | 3.5 | % | |||||
On November 27, 2023, the FSB released its annual list of GSIBs based upon data as of December 31, 2022, which affirmed the Firm’s Method 1 GSIB surcharge of 2.5%, which will be effective January 1, 2025, unless the Firm’s Method 1 GSIB surcharge, as determined by the FSB, is lower based upon data as of December 31, 2023.
The Firm’s Method 2 surcharge calculated using data as of December 31, 2021 is 4.5% (up from 4.0%), which became effective January 1, 2024. The Firm’s estimated Method 2 surcharge calculated using data as of December 31, 2022 is 4.5%. Accordingly, based on the GSIB rule currently in effect, the Firm’s effective GSIB surcharge increased to 4.5% on January 1, 2024.
The U.S. federal regulatory capital standards include a framework for setting a discretionary countercyclical capital buffer taking into account the macro financial environment in which large, internationally active banks function. As of December 31, 2023, the U.S. countercyclical capital buffer remained at 0%. The Federal Reserve will continue to review the buffer at least annually. The buffer can be increased if the Federal Reserve, FDIC and OCC determine that systemic risks are meaningfully above normal and can be calibrated up to an additional 2.5% of RWA subject to a 12-month implementation period.
Failure to maintain regulatory capital equal to or in excess of the risk-based regulatory capital minimum plus the capital conservation buffer (inclusive of the GSIB surcharge) and any countercyclical buffer will result in limitations to the amount of capital that the Firm may distribute, such as through dividends and common share repurchases, as well as on discretionary bonus payments for certain executive officers.
Total Loss-Absorbing Capacity
The Federal Reserve’s TLAC rule requires the U.S. GSIB top-tier holding companies, including the Firm, to maintain minimum levels of external TLAC and eligible LTD. Refer to TLAC on page 100 for additional information.
Leverage-based Capital Regulatory Requirements
Supplementary leverage ratio
Banking organizations subject to the Basel III Advanced approach are currently required to have a minimum SLR of 3.0%. Certain banking organizations, including the Firm, are also required to hold an additional 2.0% leverage buffer. The SLR is defined as Tier 1 capital under Basel III divided by the Firm’s total leverage exposure. Total leverage exposure is calculated by taking the Firm’s total average on-balance sheet assets, less amounts permitted to be deducted for Tier 1 capital, and adding certain off-balance sheet exposures, as defined in regulatory capital rules. Refer to SLR on page 98 for additional information.
Failure to maintain an SLR equal to or greater than the regulatory requirement will result in limitations on the amount of capital that the Firm may distribute such as through dividends and common share repurchases, as well as on discretionary bonus payments for certain executive officers.
Other regulatory capital
In addition to meeting the capital ratio requirements of Basel III, the Firm and its principal IDI subsidiary, JPMorgan Chase Bank, N.A. must also maintain minimum capital and leverage ratios in order to be “well-capitalized” under the regulations issued by the Federal Reserve and the Prompt Corrective Action requirements of the FDIC Improvement Act, respectively. Refer to Note 27 for additional information.
Additional information regarding the Firm’s capital ratios, as well as the U.S. federal regulatory capital standards to which the Firm is subject, is presented in Note 27. Refer to the Firm’s Pillar 3 Regulatory Capital Disclosures reports, which are available on the Firm’s website, for further information on the Firm’s current capital measures.
JPMorgan Chase & Co./2023 Form 10-K | 95 | |||||||
Management’s discussion and analysis
Selected capital and RWA data
The following tables present the Firm’s risk-based capital metrics under both the Basel III Standardized and Advanced approaches and leverage-based capital metrics. Refer to Note 27 for JPMorgan Chase Bank, N.A.’s risk-based and leverage-based capital metrics. First Republic Bank was not subject to Advanced approach regulatory capital requirements. As a result, for certain exposures associated with the First Republic acquisition, Advanced RWA and any impact on Advanced Total capital is calculated under the Standardized approach as permitted by the transition provisions in the U.S. capital rules. Refer to Note 34 for additional information on the First Republic acquisition.
| Standardized | Advanced | ||||||||||||||||||||||||||||||||||
(in millions, except ratios) | December 31, 2023 | December 31, 2022 | Capital ratio requirements(b) | December 31, 2023 | December 31, 2022 | Capital ratio requirements(b) | |||||||||||||||||||||||||||||
Risk-based capital metrics:(a) | |||||||||||||||||||||||||||||||||||
| CET1 capital | $ | 250,585 | $ | 218,934 | $ | 250,585 | $ | 218,934 | |||||||||||||||||||||||||||
| Tier 1 capital | 277,306 | 245,631 | 277,306 | 245,631 | |||||||||||||||||||||||||||||||
| Total capital | 308,497 | 277,769 | 295,417 | (c) | 264,583 | ||||||||||||||||||||||||||||||
| Risk-weighted assets | 1,671,995 | 1,653,538 | 1,669,156 | (c) | 1,609,773 | ||||||||||||||||||||||||||||||
| CET1 capital ratio | 15.0 | % | 13.2 | % | 11.4 | % | 15.0 | % | 13.6 | % | 11.0 | % | |||||||||||||||||||||||
| Tier 1 capital ratio | 16.6 | 14.9 | 12.9 | 16.6 | 15.3 | 12.5 | |||||||||||||||||||||||||||||
| Total capital ratio | 18.5 | 16.8 | 14.9 | 17.7 | 16.4 | 14.5 | |||||||||||||||||||||||||||||
(a)The capital metrics reflect the CECL capital transition provisions. Refer to Note 27 for additional information.
(b)Represents minimum requirements and regulatory buffers applicable to the Firm for the period ended December 31, 2023. For the period ended December 31, 2022, the Basel III Standardized CET1, Tier 1, and Total capital ratio requirements applicable to the Firm were 12.0%, 13.5%, and 15.5%, respectively; the Basel III Advanced CET1, Tier 1, and Total capital ratio requirements applicable to the Firm were 10.5%, 12.0%, and 14.0%, respectively. Refer to Note 27 for additional information.
(c)Includes the impacts of certain assets associated with First Republic to which the Standardized approach has been applied as permitted by the transition provisions in the U.S. capital rules.
| Three months ended (in millions, except ratios) | December 31, 2023 | December 31, 2022 | Capital ratio requirements(c) | |||||||||||
Leverage-based capital metrics:(a) | ||||||||||||||
Adjusted average assets(b) | $ | 3,831,200 | $ | 3,703,873 | ||||||||||
| Tier 1 leverage ratio | 7.2 | % | 6.6 | % | 4.0 | % | ||||||||
| Total leverage exposure | $ | 4,540,465 | $ | 4,367,092 | ||||||||||
| SLR | 6.1 | % | 5.6 | % | 5.0 | % | ||||||||
(a)The capital metrics reflect the CECL capital transition provisions. Refer to Note 27 for additional information.
(b)Adjusted average assets, for purposes of calculating the leverage ratios, includes quarterly average assets adjusted for on-balance sheet assets that are subject to deduction from Tier 1 capital, predominantly goodwill, inclusive of estimated equity method goodwill, and other intangible assets.
(c)Represents minimum requirements and regulatory buffers applicable to the Firm. Refer to Note 27 for additional information.
96 | JPMorgan Chase & Co./2023 Form 10-K | |||||||
Capital components
The following table presents reconciliations of total stockholders’ equity to Basel III CET1 capital, Tier 1 capital and Total capital as of December 31, 2023 and 2022.
| (in millions) | December 31, 2023 | December 31, 2022 | ||||||||||||
| Total stockholders’ equity | $ | 327,878 | $ | 292,332 | ||||||||||
| Less: Preferred stock | 27,404 | 27,404 | ||||||||||||
| Common stockholders’ equity | 300,474 | 264,928 | ||||||||||||
| Add: | ||||||||||||||
Certain deferred tax liabilities(a) | 2,996 | 2,510 | ||||||||||||
Other CET1 capital adjustments(b) | 4,717 | 6,221 | ||||||||||||
| Less: | ||||||||||||||
Goodwill(c) | 54,377 | 53,501 | ||||||||||||
Other intangible assets | 3,225 | 1,224 | ||||||||||||
Standardized/Advanced CET1 capital | 250,585 | 218,934 | ||||||||||||
| Add: Preferred stock | 27,404 | 27,404 | ||||||||||||
Less: Other Tier 1 adjustments | 683 | 707 | ||||||||||||
Standardized/Advanced Tier 1 capital | $ | 277,306 | $ | 245,631 | ||||||||||
Long-term debt and other instruments qualifying as Tier 2 capital | $ | 11,779 | $ | 13,569 | ||||||||||
Qualifying allowance for credit losses(d) | 20,102 | 19,353 | ||||||||||||
Other | (690) | (784) | ||||||||||||
Standardized Tier 2 capital | $ | 31,191 | $ | 32,138 | ||||||||||
Standardized Total capital | $ | 308,497 | $ | 277,769 | ||||||||||
Adjustment in qualifying allowance for credit losses for Advanced Tier 2 capital(e) | (13,080) | (f) | (13,186) | |||||||||||
Advanced Tier 2 capital | $ | 18,111 | $ | 18,952 | ||||||||||
| Advanced Total capital | $ | 295,417 | $ | 264,583 | ||||||||||
(a)Represents deferred tax liabilities related to tax-deductible goodwill and to identifiable intangibles created in nontaxable transactions, which are netted against goodwill and other intangibles when calculating CET1 capital.
(b)As of December 31, 2023 and 2022, included a net benefit associated with cash flow hedges and debit valuation adjustments ("DVA") related to structured notes recorded in AOCI of $4.3 billion and $5.2 billion and the benefit from the CECL capital transition provisions of $1.4 billion and $2.2 billion, respectively.
(c)Goodwill deducted from capital includes goodwill associated with equity method investments in nonconsolidated financial institutions based on regulatory requirements. Refer to page 134 for additional information on principal investment risk.
(d)Represents the allowance for credit losses eligible for inclusion in Tier 2 capital up to 1.25% of credit risk RWA, including the impact of the CECL capital transition provision with any excess deducted from RWA. Refer to Note 27 for additional information on the CECL capital transition.
(e)Represents an adjustment to qualifying allowance for credit losses for the excess of eligible credit reserves over expected credit losses up to 0.6% of credit risk RWA, including the impact of the CECL capital transition provision with any excess deducted from RWA.
(f)Included an incremental $655 million allowance for credit losses on certain assets associated with First Republic to which the Standardized approach has been applied, as permitted by the transition provisions in the U.S. capital rules.
Capital rollforward
The following table presents the changes in Basel III CET1 capital, Tier 1 capital and Tier 2 capital for the year ended December 31, 2023.
| Year ended December 31, (in millions) | 2023 | ||||
| Standardized/Advanced CET1 capital at December 31, 2022 | $ | 218,934 | |||
| Net income applicable to common equity | 48,051 | ||||
| Dividends declared on common stock | (12,055) | ||||
Net purchase of treasury stock | (8,881) | ||||
Changes in additional paid-in capital | 1,084 | ||||
| Changes related to AOCI applicable to capital: | |||||
| Unrealized gains/(losses) on investment securities | 5,381 | ||||
Translation adjustments, net of hedges(a) | 329 | ||||
| Fair value hedges | (101) | ||||
| Defined benefit pension and other postretirement employee benefit (“OPEB”) plans | 373 | ||||
Changes related to other CET1 capital adjustments(b) | (2,530) | ||||
| Change in Standardized/Advanced CET1 capital | 31,651 | ||||
Standardized/Advanced CET1 capital at December 31, 2023 | $ | 250,585 | |||
| Standardized/Advanced Tier 1 capital at December 31, 2022 | $ | 245,631 | |||
Change in CET1 capital(b) | 31,651 | ||||
| Redemptions of noncumulative perpetual preferred stock | — | ||||
| Other | 24 | ||||
| Change in Standardized/Advanced Tier 1 capital | 31,675 | ||||
| Standardized/Advanced Tier 1 capital at December 31, 2023 | $ | 277,306 | |||
| Standardized Tier 2 capital at December 31, 2022 | $ | 32,138 | |||
Change in long-term debt and other instruments qualifying as Tier 2 | (1,790) | ||||
Change in qualifying allowance for credit losses(b) | 749 | ||||
Other | 94 | ||||
Change in Standardized Tier 2 capital | (947) | ||||
| Standardized Tier 2 capital at December 31, 2023 | $ | 31,191 | |||
| Standardized Total capital at December 31, 2023 | $ | 308,497 | |||
| Advanced Tier 2 capital at December 31, 2022 | $ | 18,952 | |||
Change in long-term debt and other instruments qualifying as Tier 2 | (1,790) | ||||
Change in qualifying allowance for credit losses(b)(c) | 855 | ||||
Other | 94 | ||||
Change in Advanced Tier 2 capital | (841) | ||||
| Advanced Tier 2 capital at December 31, 2023 | $ | 18,111 | |||
| Advanced Total capital at December 31, 2023 | $ | 295,417 | |||
(a)Includes foreign currency translation adjustments and the impact of related derivatives.
(b)Includes the impact of the CECL capital transition provisions and the cumulative effect of changes in accounting principles. Refer to Note 27 for additional information on the CECL capital transition.
(c)Included an incremental $655 million allowance for credit losses on certain assets associated with First Republic to which the Standardized approach has been applied, as permitted by the transition provisions in the U.S. capital rules.
JPMorgan Chase & Co./2023 Form 10-K | 97 | |||||||
Management’s discussion and analysis
RWA rollforward
The following table presents changes in the components of RWA under Basel III Standardized and Advanced approaches for the year ended December 31, 2023. The amounts in the rollforward categories are estimates, based on the predominant driver of the change.
| Standardized | Advanced | |||||||||||||||||||||||||
| Year ended December 31, 2023 (in millions) | Credit risk RWA(c) | Market risk RWA | Total RWA | Credit risk RWA(c)(d) | Market risk RWA | Operational risk RWA | Total RWA | |||||||||||||||||||
| December 31, 2022 | $ | 1,568,536 | $ | 85,002 | $ | 1,653,538 | $ | 1,078,076 | $ | 85,432 | $ | 446,265 | $ | 1,609,773 | ||||||||||||
Model & data changes(a) | (11,024) | (4,883) | (15,907) | (11,313) | (4,883) | — | (16,196) | |||||||||||||||||||
Movement in portfolio levels(b) | 46,339 | (11,975) | 34,364 | 88,498 | (11,946) | (973) | 75,579 | |||||||||||||||||||
| Changes in RWA | 35,315 | (16,858) | 18,457 | 77,185 | (16,829) | (973) | 59,383 | |||||||||||||||||||
| December 31, 2023 | $ | 1,603,851 | $ | 68,144 | $ | 1,671,995 | $ | 1,155,261 | $ | 68,603 | $ | 445,292 | $ | 1,669,156 | ||||||||||||
(a)Model & data changes refer to material movements in levels of RWA as a result of revised methodologies and/or treatment per regulatory guidance (exclusive of rule changes).
(b)Movement in portfolio levels (inclusive of rule changes) refers to: for Credit risk RWA, changes in book size, impacts associated with the First Republic acquisition, including the benefit of the shared-loss agreements entered into with the FDIC, position roll-offs in legacy portfolios in Home Lending, changes in composition and credit quality, market movements, and deductions for excess eligible allowances for credit losses not eligible for inclusion in Tier 2 capital; for Market risk RWA, changes in position, market movements, and changes in the Firm’s regulatory multiplier from Regulatory VaR backtesting exceptions; and for Operational risk RWA, updates to cumulative losses and macroeconomic model inputs.
(c)As of December 31, 2023 and 2022, the Basel III Standardized Credit risk RWA included wholesale and retail off balance-sheet RWA of $208.5 billion and $210.1 billion, respectively; and the Basel III Advanced Credit risk RWA included wholesale and retail off balance-sheet RWA of $188.5 billion and $180.8 billion, respectively.
(d)As of December 31, 2023, Credit risk RWA reflected approximately $52.4 billion of RWA calculated under the Standardized approach for certain assets associated with First Republic as permitted by the transition provisions in the U.S. capital rules.
Refer to the Firm’s Pillar 3 Regulatory Capital Disclosures reports, which are available on the Firm’s website, for further information on Credit risk RWA, Market risk RWA and Operational risk RWA.
Supplementary leverage ratio
The following table presents the components of the Firm’s SLR.
Three months ended (in millions, except ratio) | December 31, 2023 | December 31, 2022 | ||||||
Tier 1 capital | $ | 277,306 | $ | 245,631 | ||||
| Total average assets | 3,885,632 | 3,755,271 | ||||||
Less: Regulatory capital adjustments(a) | 54,432 | 51,398 | ||||||
Total adjusted average assets(b) | 3,831,200 | 3,703,873 | ||||||
Add: Off-balance sheet exposures(c) | 709,265 | 663,219 | ||||||
Total leverage exposure | $ | 4,540,465 | $ | 4,367,092 | ||||
SLR | 6.1 | % | 5.6 | % | ||||
(a)For purposes of calculating the SLR, includes quarterly average assets adjusted for on-balance sheet assets that are subject to deduction from Tier 1 capital, predominantly goodwill, inclusive of estimated equity method goodwill, other intangible assets and adjustments for the CECL capital transition provisions. Refer to Note 27 for additional information on the CECL capital transition.
(b)Adjusted average assets used for the calculation of Tier 1 leverage ratio.
(c)Off-balance sheet exposures are calculated as the average of the three month-end spot balances on applicable regulatory exposures during the reporting quarter. Refer to the Firm’s Pillar 3 Regulatory Capital Disclosures reports for additional information.
Line of business equity
Each business segment is allocated capital by taking into consideration a variety of factors including capital levels of similarly rated peers and applicable regulatory capital requirements. ROE is measured and internal targets for expected returns are established as key measures of a business segment’s performance.
The Firm’s current allocation methodology incorporates Basel III Standardized RWA and the GSIB surcharge, both
under rules currently in effect, as well as a simulation of capital in a severe stress environment. At least annually, the assumptions, judgments and methodologies used to allocate capital are reassessed and, as a result, the capital allocated to the LOBs may change. As of January 1, 2024, changes to the Firm’s line of business capital allocations are primarily a result of updates to the Firm’s current capital requirements and changes in RWA for each LOB under rules currently in effect. In addition, the capital that the Firm has accumulated to meet the increased requirements of the U.S. Basel III proposal has generally been retained in Corporate.
The following table presents the capital allocated to each business segment.
| Line of business equity (Allocated capital) | ||||||||||||||
| December 31, | ||||||||||||||
| (in billions) | January 1, 2024 | 2023(a) | 2022 | |||||||||||
| Consumer & Community Banking | $ | 54.5 | $ | 55.5 | $ | 50.0 | ||||||||
| Corporate & Investment Bank | 102.0 | 108.0 | 103.0 | |||||||||||
| Commercial Banking | 30.0 | 30.0 | 25.0 | |||||||||||
| Asset & Wealth Management | 15.5 | 17.0 | 17.0 | |||||||||||
| Corporate | 98.5 | 90.0 | 69.9 | |||||||||||
Total common stockholders’ equity | $ | 300.5 | $ | 300.5 | $ | 264.9 | ||||||||
(a)Includes the impact of the First Republic acquisition.
98 | JPMorgan Chase & Co./2023 Form 10-K | |||||||
Capital actions
Common stock dividends
The Firm’s common stock dividends are planned as part of the Capital Management governance framework in line with the Firm’s capital management objectives.
The Firm’s quarterly common stock dividend is currently $1.05 per share. The Firm’s dividends are subject to approval by the Board of Directors on a quarterly basis.
Refer to Note 21 and Note 26 for information regarding dividend restrictions.
The following table shows the common dividend payout ratio based on net income applicable to common equity.
| Year ended December 31, | 2023 | 2022 | 2021 | ||||||||||||||
| Common dividend payout ratio | 25 | % | 33 | % | 25 | % | |||||||||||
Common stock
Effective May 1, 2022, the Firm is authorized to purchase up to $30 billion under its common share repurchase program previously approved by the Board of Directors, which was announced on April 13, 2022.
The following table sets forth the Firm’s repurchases of common stock for the years ended December 31, 2023, 2022 and 2021.
| Year ended December 31, (in millions) | 2023 | 2022(b) | 2021(c) | |||||||||||||||||
Total number of shares of common stock repurchased | 69.5 | 23.1 | 119.7 | |||||||||||||||||
Aggregate purchase price of common stock repurchases(a) | $ | 9,898 | $ | 3,122 | $ | 18,448 | ||||||||||||||
(a)Excludes excise tax and commissions. As part of the Inflation Reduction Act of 2022, a 1% excise tax was imposed on net share repurchases effective January 1, 2023.
(b)In the second half of 2022, the Firm temporarily suspended share repurchases, which it resumed under its current common share repurchase program in the first quarter of 2023.
(c)As directed by the Federal Reserve, total net repurchases and common stock dividends in the first and second quarter of 2021 were restricted and could not exceed the average of the Firm’s net income for the four preceding calendar quarters. Effective July 1, 2021, the Firm became subject to the normal capital distribution restrictions provided under the regulatory capital framework.
The Board of Directors’ authorization to repurchase common shares is utilized at management’s discretion, and the timing of purchases and the exact amount of common shares that may be repurchased is subject to various factors, including market conditions; legal and regulatory considerations affecting the amount and timing of repurchase activity; the Firm’s capital position (taking into account goodwill and intangibles); internal capital generation; current and proposed future capital requirements; and alternative investment opportunities. The $30 billion common share repurchase program approved by the Board does not establish specific price targets or timetables. The repurchase program may be suspended by management at any time; and may be executed through open market purchases or privately negotiated transactions, or utilizing Rule 10b5-1 plans, which are written trading plans that the Firm may enter into from time to time under Rule 10b5-1 of the Securities Exchange Act of 1934 and which allow the Firm to repurchase its common shares during periods when it may otherwise not be repurchasing common shares — for example, during internal trading blackout periods.
Refer to Part II, Item 5: Market for Registrant’s Common Equity, Related Stockholder Matters and Issuer Purchases of Equity Securities on page 35 of the 2023 Form 10-K for additional information regarding repurchases of the Firm’s equity securities.
Refer to capital planning and stress testing on page 91 for additional information.
Preferred stock
Preferred stock dividends declared were $1.5 billion for the year ended December 31, 2023, and $1.6 billion for each of the years ended December 31, 2022 and 2021.
Refer to Note 21 for additional information on the Firm’s preferred stock, including the issuance and redemption of preferred stock.
Subordinated Debt
Refer to Long-term funding and issuance on page 108 and Note 20 for additional information on the Firm’s subordinated debt.
JPMorgan Chase & Co./2023 Form 10-K | 99 | |||||||
Management’s discussion and analysis
Other capital requirements
Total Loss-Absorbing Capacity
The Federal Reserve’s TLAC rule requires the U.S. GSIB top-tier holding companies, including the Firm, to maintain minimum levels of external TLAC and eligible long-term debt.
The external TLAC requirements and the minimum level of eligible long-term debt requirements are shown below:
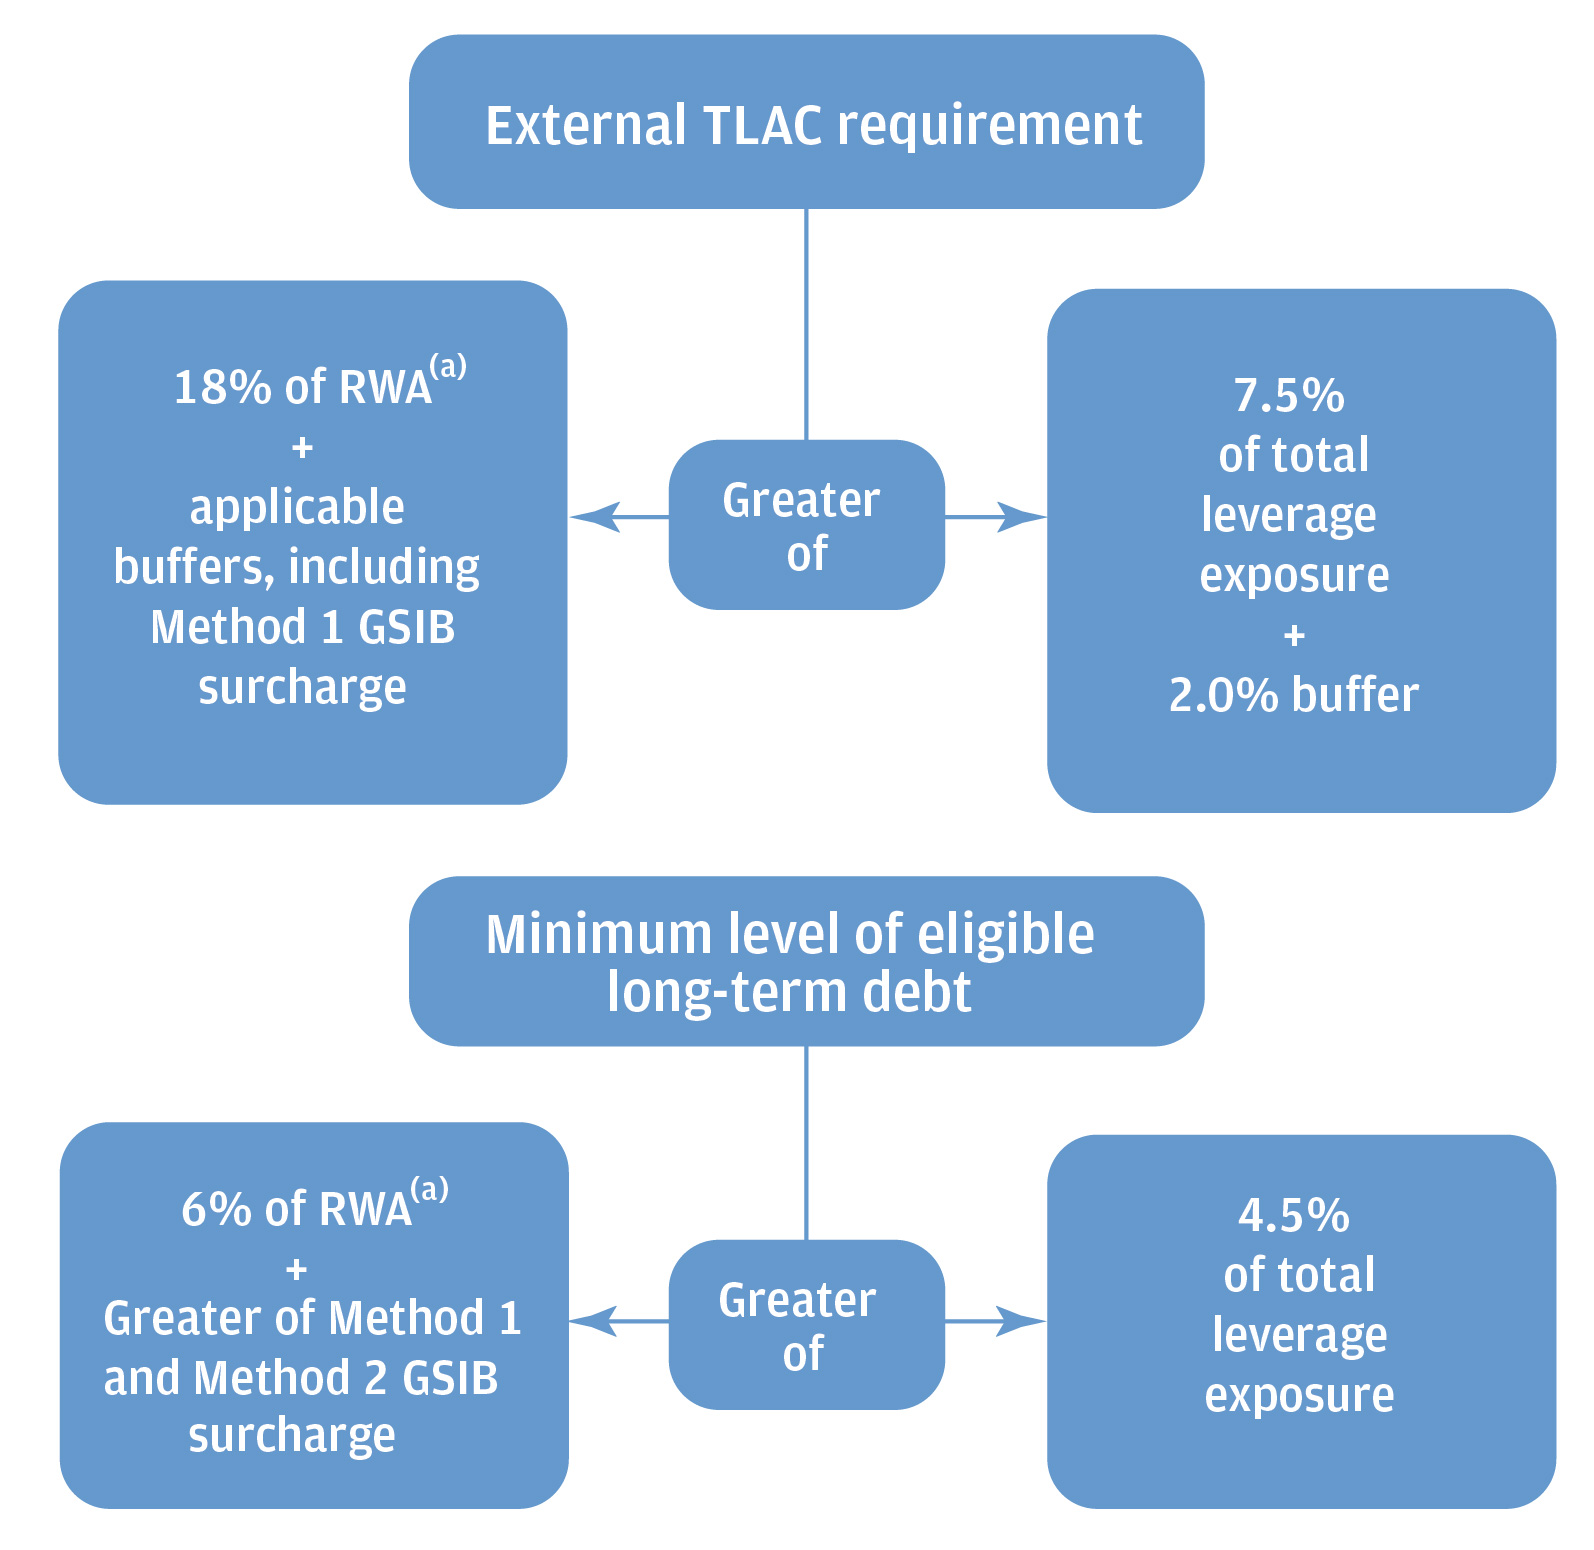
(a)RWA is the greater of Standardized and Advanced compared to their respective regulatory capital ratio requirements.
Failure to maintain TLAC equal to or in excess of the regulatory minimum plus applicable buffers will result in limitations on the amount of capital that the Firm may distribute, such as through dividends and common share repurchases, as well as on discretionary bonus payments for certain executive officers.
The following table presents the eligible external TLAC and eligible LTD amounts, as well as a representation of these amounts as a percentage of the Firm’s total RWA and total leverage exposure applying the impact of the CECL capital transition provisions as of December 31, 2023 and 2022.
| December 31, 2023 | December 31, 2022 | |||||||||||||
| (in billions, except ratio) | External TLAC | LTD | External TLAC | LTD | ||||||||||
| Total eligible amount | $ | 513.8 | $ | 222.6 | $ | 486.0 | $ | 228.5 | ||||||
| % of RWA | 30.7 | % | 13.3 | % | 29.4 | % | 13.8 | % | ||||||
| Regulatory requirements | 23.0 | 10.0 | 22.5 | 9.5 | ||||||||||
| Surplus/(shortfall) | $ | 129.2 | $ | 55.4 | $ | 114.0 | $ | 71.4 | ||||||
| % of total leverage exposure | 11.3 | % | 4.9 | % | 11.1 | % | 5.2 | % | ||||||
| Regulatory requirements | 9.5 | 4.5 | 9.5 | 4.5 | ||||||||||
| Surplus/(shortfall) | $ | 82.5 | $ | 18.3 | $ | 71.2 | $ | 32.0 | ||||||
Effective January 1, 2023, the Firm’s regulatory requirements for TLAC to RWA and eligible LTD to RWA ratios increased by 50 bps to 23.0% and 10.0%, respectively, due to the increase in the Firm’s GSIB requirements. Refer to Risk-based Capital Regulatory Requirements on pages 94–95 for further information on the GSIB surcharge.
Refer to Liquidity Risk Management on pages 102–109 for further information on long-term debt issued by the Parent Company.
Refer to Part I, Item 1A: Risk Factors on pages 9-33 of the 2023 Form 10-K for information on the financial consequences to holders of the Firm’s debt and equity securities in a resolution scenario.
100 | JPMorgan Chase & Co./2023 Form 10-K | |||||||
U.S. broker-dealer regulatory capital
J.P. Morgan Securities
JPMorgan Chase’s principal U.S. broker-dealer subsidiary is J.P. Morgan Securities. J.P. Morgan Securities is subject to the regulatory capital requirements of Rule 15c3-1 under the Securities Exchange Act of 1934 (the “Net Capital Rule”). J.P. Morgan Securities is also registered as a futures commission merchant and is subject to regulatory capital requirements, including those imposed by the SEC, the Commodity Futures Trading Commission (“CFTC”), the Financial Industry Regulatory Authority (“FINRA”) and the National Futures Association (“NFA”).
J.P. Morgan Securities has elected to compute its minimum net capital requirements in accordance with the “Alternative Net Capital Requirements” of the Net Capital Rule.
The following table presents J.P. Morgan Securities’ net capital:
| December 31, 2023 | ||||||||
| (in millions) | Actual | Minimum | ||||||
| Net Capital | $ | 27,865 | $ | 5,346 | ||||
J.P. Morgan Securities is registered with the SEC as a security-based swap dealer and with the CFTC as a swap dealer. As a result of additional SEC and CFTC capital and financial reporting requirements for security-based swap dealers and swap dealers, J.P. Morgan Securities is subject to alternative minimum net capital requirements and required to hold “tentative net capital” in excess of $5.0 billion. J.P. Morgan Securities is also required to notify the SEC and CFTC in the event that its tentative net capital is less than $6.0 billion. Tentative net capital is net capital before deducting market and credit risk charges as defined by the Net Capital Rule. As of December 31, 2023, J.P. Morgan Securities maintained tentative net capital in excess of the minimum and notification requirements.
Non-U.S. subsidiary regulatory capital
J.P. Morgan Securities plc
J.P. Morgan Securities plc is a wholly-owned subsidiary of JPMorgan Chase Bank, N.A. and has authority to engage in banking, investment banking and broker-dealer activities. J.P. Morgan Securities plc is jointly regulated in the U.K. by the Prudential Regulation Authority (“PRA”) and the Financial Conduct Authority (“FCA”). J.P. Morgan Securities plc is subject to the European Union (“EU”) Capital Requirements Regulation (“CRR”), as adopted in the U.K., and the PRA capital rules, each of which have implemented Basel III and thereby subject J.P. Morgan Securities plc to its requirements.
The Bank of England requires that U.K. banks, including U.K. regulated subsidiaries of overseas groups, maintain minimum requirements for own funds and eligible liabilities (“MREL”). As of December 31, 2023, J.P. Morgan Securities plc was compliant with its MREL requirements.
Effective January 1, 2023, J.P. Morgan Securities plc was required to meet the minimum Tier 1 leverage ratio requirement established by the PRA of 3.25%, plus regulatory buffers.
The following table presents J.P. Morgan Securities plc’s risk-based and leverage-based capital metrics:
| December 31, 2023 | |||||||||||
| (in millions, except ratios) | Actual | Regulatory Minimum ratios(a) | |||||||||
| Total capital | $ | 52,522 | |||||||||
| CET1 capital ratio | 16.9 | % | 4.5 | % | |||||||
| Tier 1 capital ratio | 22.3 | 6.0 | |||||||||
| Total capital ratio | 28.1 | 8.0 | |||||||||
| Tier 1 leverage ratio | 7.3 | 3.3 | (b) | ||||||||
(a)Represents minimum Pillar 1 requirements specified by the PRA. J.P. Morgan Securities plc's capital ratios as of December 31, 2023 exceeded the minimum requirements, including the additional capital requirements specified by the PRA.
(b)At least 75% of the Tier 1 leverage ratio minimum must be met with CET1 capital.
J.P. Morgan SE
JPMSE is a wholly-owned subsidiary of JPMorgan Chase Bank, N.A. and has authority to engage in banking, investment banking and markets activities. JPMSE is regulated by the European Central Bank as well as the local regulators in each of the countries in which it operates, and it is subject to EU capital requirements under Basel III.
JPMSE is required by the EU Single Resolution Board to maintain MREL. As of December 31, 2023, JPMSE was compliant with its MREL requirements.
The following table presents JPMSE’s risk-based and leverage-based capital metrics:
| December 31, 2023 | Regulatory Minimum ratios(a) | |||||||
| (in millions, except ratios) | Actual | |||||||
| Total capital | $ | 44,158 | ||||||
| CET1 capital ratio | 18.1 | % | 4.5 | % | ||||
| Tier 1 capital ratio | 18.1 | 6.0 | ||||||
| Total capital ratio | 32.2 | 8.0 | ||||||
| Tier 1 leverage ratio | 5.8 | 3.0 | ||||||
(a)Represents minimum Pillar 1 requirements specified by the EU CRR. J.P. Morgan SE’s capital and leverage ratios as of December 31, 2023 exceeded the minimum requirements, including the additional capital requirements specified by EU regulators.
JPMorgan Chase & Co./2023 Form 10-K | 101 | |||||||
Management’s discussion and analysis
LIQUIDITY RISK MANAGEMENT | ||||||||||||||
Liquidity risk is the risk that the Firm will be unable to meet its cash and collateral needs as they arise or that it does not have the appropriate amount, composition and tenor of funding and liquidity to support its assets and liabilities.
Liquidity risk management
The Firm has a Liquidity Risk Management (“LRM”) function whose primary objective is to provide independent oversight of liquidity risk across the Firm. Liquidity Risk Management’s responsibilities include:
•Defining, monitoring and reporting liquidity risk metrics;
•Independently establishing and monitoring limits and indicators, including liquidity risk appetite;
•Developing a process to classify, monitor and report limit breaches;
•Performing an independent review of liquidity risk management processes to evaluate their adequacy and effectiveness;
•Monitoring and reporting internal Firmwide and legal entity liquidity stress tests, regulatory defined metrics, as well as liquidity positions, balance sheet variances and funding activities; and
•Approving or escalating for review new or updated liquidity stress assumptions.
Liquidity management
Treasury and CIO is responsible for liquidity management.
The primary objectives of the Firm’s liquidity management are to:
•Ensure that the Firm’s core businesses and material legal entities are able to operate in support of client needs and meet contractual and contingent financial obligations through normal economic cycles as well as during stress events, and
•Manage an optimal funding mix and availability of liquidity sources.
The Firm addresses these objectives through:
•Analyzing and understanding the liquidity characteristics of the assets and liabilities of the Firm, LOBs, legal entities, as well as currencies, taking into account legal, regulatory, and operational restrictions;
•Developing internal liquidity stress testing assumptions;
•Defining and monitoring Firmwide and legal entity-specific liquidity strategies, policies, reporting and contingency funding plans;
•Managing liquidity within the Firm’s approved liquidity risk appetite tolerances and limits;
•Managing compliance with regulatory requirements related to funding and liquidity risk; and
•Setting FTP in accordance with underlying liquidity characteristics of balance sheet assets and liabilities as well as certain off-balance sheet items.
As part of the Firm’s overall liquidity management strategy, the Firm manages liquidity and funding using a centralized, global approach designed to:
•Optimize liquidity sources and uses;
•Monitor exposures;
•Identify constraints on the transfer of liquidity between the Firm’s legal entities; and
•Maintain the appropriate amount of surplus liquidity at a Firmwide and legal entity level, where relevant.
Governance
Committees responsible for liquidity governance include the Firmwide ALCO, as well as regional ALCOs, the Treasurer Committee, and the CTC Risk Committee. In addition, the Board Risk Committee reviews and recommends to the Board of Directors, for approval, the Firm’s liquidity risk tolerances, liquidity strategy, and liquidity policy. Refer to Firmwide Risk Management on pages 86–89 for further discussion of ALCO and other risk-related committees.
Internal stress testing
The Firm conducts internal liquidity stress testing that is intended to ensure that the Firm and its material legal entities have sufficient liquidity under a variety of adverse scenarios, including scenarios analyzed as part of the Firm’s resolution and recovery planning. Internal stress tests are produced on a regular basis, and other stress tests are performed in response to specific market events or concerns. Liquidity stress tests assume all of the Firm’s contractual financial obligations are met and take into consideration:
•Varying levels of access to unsecured and secured funding markets;
•Estimated non-contractual and contingent cash outflows;
•Credit rating downgrades;
•Collateral haircuts; and
•Potential impediments to the availability and transferability of liquidity between jurisdictions and material legal entities such as regulatory, legal or other restrictions.
Liquidity outflows are modeled across a range of time horizons and currency dimensions and contemplate both market and idiosyncratic stresses.
Results of stress tests are considered in the formulation of the Firm’s funding plan and assessment of its liquidity position. The Parent Company acts as a source of funding for the Firm through equity and long-term debt issuances, and its intermediate holding company, JPMorgan Chase Holdings LLC (the “IHC”), provides funding to support the ongoing operations of the Parent Company and its subsidiaries. The Firm maintains liquidity at the Parent Company, the IHC, and operating subsidiaries at levels sufficient to comply with liquidity risk tolerances and minimum liquidity requirements, and to manage through
102 | JPMorgan Chase & Co./2023 Form 10-K | |||||||
periods of stress when access to normal funding sources may be disrupted.
Contingency funding plan
The Firm’s Contingency Funding Plan (“CFP”) sets out the strategies for addressing and managing liquidity resource needs during a liquidity stress event and incorporates liquidity risk limits, indicators and risk appetite tolerances. The CFP also identifies the alternative contingent funding and liquidity resources available to the Firm and its legal entities in a period of stress.
LCR and HQLA
The LCR rule requires that the Firm and JPMorgan Chase Bank, N.A. maintain an amount of eligible HQLA that is sufficient to meet their respective estimated total net cash outflows over a prospective 30 calendar-day period of significant stress. Eligible HQLA, for purposes of calculating the LCR, is the amount of unencumbered HQLA that satisfy certain operational considerations as defined in the LCR rule. HQLA primarily consist of cash and certain high-quality liquid securities as defined in the LCR rule.
Under the LCR rule, the amount of eligible HQLA held by JPMorgan Chase Bank, N.A. that is in excess of its stand-alone 100% minimum LCR requirement, and that is not transferable to non-bank affiliates, must be excluded from the Firm’s reported eligible HQLA.
Estimated net cash outflows are based on standardized stress outflow and inflow rates prescribed in the LCR rule, which are applied to the balances of the Firm’s assets, sources of funds, and obligations. The LCR for both the Firm and JPMorgan Chase Bank, N.A. is required to be a minimum of 100%.
The following table summarizes the Firm and JPMorgan Chase Bank, N.A.’s average LCR for the three months ended December 31, 2023, September 30, 2023 and December 31, 2022 based on the Firm’s interpretation of the LCR framework.
| Three months ended | |||||||||||
| Average amount (in millions) | December 31, 2023 | September 30, 2023 | December 31, 2022 | ||||||||
JPMorgan Chase & Co.: | |||||||||||
| HQLA | |||||||||||
Eligible cash(a) | $ | 485,263 | $ | 402,663 | $ | 542,847 | |||||
Eligible securities(b)(c) | 313,365 | 378,702 | 190,201 | ||||||||
Total HQLA(d) | $ | 798,628 | $ | 781,365 | $ | 733,048 | |||||
| Net cash outflows | $ | 704,857 | $ | 696,668 | $ | 652,580 | |||||
| LCR | 113 | % | 112 | % | 112 | % | |||||
Net excess eligible HQLA(d) | $ | 93,771 | $ | 84,697 | $ | 80,468 | |||||
JPMorgan Chase Bank, N.A.: | |||||||||||
| LCR | 129 | % | 123 | % | 151 | % | |||||
| Net excess eligible HQLA | $ | 215,190 | $ | 167,096 | $ | 356,733 | |||||
(a)Represents cash on deposit at central banks, primarily the Federal Reserve Banks.
(b)Eligible HQLA securities may be reported in securities borrowed or purchased under resale agreements, trading assets, or investment securities on the Firm’s Consolidated balance sheets. For purposes of calculating the LCR, HQLA securities are included at fair value, which may differ from the accounting treatment under U.S. GAAP.
(c)Predominantly U.S. Treasuries, U.S. GSE and government agency MBS, and sovereign bonds net of regulatory haircuts under the LCR rule.
(d)Excludes average excess eligible HQLA at JPMorgan Chase Bank, N.A. that are not transferable to non-bank affiliates.
JPMorgan Chase Bank, N.A.'s average LCR increased during the three months ended December 31, 2023, compared with the three months ended September 30, 2023, driven by CIB market activities, partially offset by loan growth.
JPMorgan Chase Bank, N.A.’s average LCR for the three months ended December 31, 2023 decreased compared with the three months ended December 31, 2022, reflecting a decrease in JPMorgan Chase Bank, N.A.’s HQLA as a result of a reduction in cash due to a decline in average deposits and loan growth, as well as the impact of First Republic and lower market values of HQLA-eligible investment securities. These impacts were partially offset by CIB markets activities.
Refer to Note 10 and Note 34 for additional information on the Firm's investment securities portfolio and the First Republic acquisition.
JPMorgan Chase & Co./2023 Form 10-K | 103 | |||||||
Management’s discussion and analysis
Actions by the Federal Reserve have impacted depositor behavior, resulting in reductions to system-wide deposits, including those held by the Firm. Each of the Firm and JPMorgan Chase Bank, N.A.'s average LCR may fluctuate from period to period due to changes in their respective eligible HQLA and estimated net cash outflows as a result of ongoing business activity and from the continued impacts of Federal Reserve actions as well as other factors. Refer to the Firm’s U.S. LCR Disclosure reports, which are available on the Firm’s website, for a further discussion of the Firm’s LCR.
Liquidity sources
In addition to the assets reported in the Firm’s eligible HQLA discussed above, the Firm had unencumbered marketable securities, such as equity and debt securities, that the Firm believes would be available to raise liquidity. This includes excess eligible HQLA securities at JPMorgan Chase Bank, N.A. that are not transferable to non-bank affiliates. The fair value of these securities was approximately $649 billion and $694 billion as of December 31, 2023 and 2022, respectively, although the amount of liquidity that could be raised at any particular time would be dependent on prevailing market conditions. The decrease compared to December 31, 2022, was driven by a reduction in excess eligible HQLA securities at JPMorgan Chase Bank, N.A., partially offset by an increase in unencumbered AFS securities.
As of December 31, 2023 and 2022, the Firm had approximately $1.4 trillion of available cash and securities comprised of eligible end-of-period HQLA, excluding the impact of regulatory haircuts of $798.0 billion and $735.5 billion, respectively, and unencumbered marketable securities with a fair value of approximately $649 billion and $694 billion, respectively.
The Firm also had available borrowing capacity at the Federal Home Loan Banks (“FHLBs”) and the discount window at the Federal Reserve Banks as a result of collateral pledged by the Firm to such banks of approximately $340 billion and $323 billion as of December 31, 2023 and 2022, respectively. This borrowing capacity excludes the benefit of cash and securities reported in the Firm’s eligible HQLA or other unencumbered securities that are currently pledged at the Federal Reserve Banks discount window and other central banks. Available borrowing capacity increased from December 31, 2022 primarily due to a higher amount of wholesale loans pledged at the Federal Reserve Banks. Although available, the Firm does not view this borrowing capacity at the Federal Reserve Banks discount window and the other central banks as a primary source of liquidity.
NSFR
The net stable funding ratio (“NSFR”) is a liquidity requirement for large banking organizations that is intended to measure the adequacy of “available” stable funding that is sufficient to meet their “required” amounts of stable funding over a one-year horizon.
For the three months ended December 31, 2023, both the Firm and JPMorgan Chase Bank, N.A. were compliant with the 100% minimum NSFR requirement, based on the Firm’s interpretation of the final rule. Refer to the Firm's U.S. NSFR Disclosure report covering December 31, 2023 and September 30, 2023 on the Firm’s website for additional information.
104 | JPMorgan Chase & Co./2023 Form 10-K | |||||||
Funding
Sources of funds
Management believes that the Firm’s unsecured and secured funding capacity is sufficient to meet its on- and off-balance sheet obligations, which includes both short- and long-term cash requirements.
The Firm funds its global balance sheet through diverse sources of funding including stable deposits, secured and unsecured funding in the capital markets and stockholders’ equity. Deposits are the primary funding source for JPMorgan Chase Bank, N.A. Additionally, JPMorgan Chase Bank, N.A. may access funding through short- or long-term secured borrowings, the issuance of unsecured long-term
debt, or from borrowings from the IHC. The Firm’s non-bank subsidiaries are primarily funded from long-term unsecured borrowings and short-term secured borrowings which are primarily securities loaned or sold under repurchase agreements. Excess funding is invested by Treasury and CIO in the Firm’s investment securities portfolio or deployed in cash or other short-term liquid investments based on their interest rate and liquidity risk characteristics.
Refer to Note 28 for additional information on off–balance sheet obligations.
Deposits
The table below summarizes, by LOB and Corporate, the period-end and average deposit balances as of and for the years ended December 31, 2023 and 2022.
| As of or for the year ended December 31, | Average | |||||||||||||||||||
| (in millions) | 2023 | 2022 | 2023 | 2022 | ||||||||||||||||
Consumer & Community Banking | $ | 1,094,738 | $ | 1,131,611 | $ | 1,126,552 | $ | 1,162,680 | ||||||||||||
Corporate & Investment Bank | 777,638 | 689,893 | 728,537 | 739,700 | ||||||||||||||||
Commercial Banking | 273,254 | 271,342 | 267,758 | 294,180 | ||||||||||||||||
Asset & Wealth Management | 233,232 | 233,130 | 216,178 | 261,489 | ||||||||||||||||
Corporate | 21,826 | 14,203 | 20,042 | 9,866 | ||||||||||||||||
| Total Firm | $ | 2,400,688 | $ | 2,340,179 | $ | 2,359,067 | $ | 2,467,915 | ||||||||||||
The Firm believes that deposits provide a stable source of funding and reduce the Firm’s reliance on the wholesale funding markets. A significant portion of the Firm’s deposits are consumer deposits and wholesale operating deposits, which are both considered to be stable sources of liquidity. Wholesale operating deposits are generally considered to be stable sources of liquidity because they are generated from customers that maintain operating service relationships with the Firm.
The Firm believes that average deposit balances are generally more representative of deposit trends than period-end deposit balances. However, during periods of market disruption, average deposit trends may be impacted.
Average deposits were lower for the year ended December 31, 2023 compared to the year ended December 31, 2022, reflecting the net impact of:
•lower balances in AWM due to continued migration into higher-yielding investments driven by the higher interest rate environment, partially offset by growth from new and existing customers as a result of new product offerings and the impact of First Republic,
•a decline in CCB reflecting higher customer spending, largely offset by the impact of First Republic,
•a decrease in CB due to continued deposit attrition as clients seek higher-yielding investments, partially offset by the retention of inflows associated with disruptions in the market in the first quarter of 2023,
•a decline in CIB due to deposit attrition, including actions taken to reduce certain deposits, predominantly offset by
net issuances of structured notes as a result of client demand, and
•growth in Corporate related to the Firm's international consumer initiatives.
Period-end deposits increased from December 31, 2022, reflecting the net impact of:
•higher balances in CIB due to net issuances of structured notes as a result of client demand, as well as deposit inflows from client-driven activities in Payments and Securities Services, partially offset by deposit attrition, including actions taken to reduce certain deposits,
•growth in Corporate related to the Firm's international consumer initiatives,
•lower balances in CCB reflecting higher customer spending,
•a decline in AWM due to continued migration into higher-yielding investments driven by the higher interest rate environment, predominantly offset by growth from new and existing customers as a result of new product offerings, and
•a decrease in CB due to continued deposit attrition as clients seek higher-yielding investments, predominantly offset by the retention of inflows associated with disruptions in the market in the first quarter of 2023.
The net increase also included $61 billion of deposits associated with First Republic, primarily reflected in CCB, AWM and CB.
JPMorgan Chase & Co./2023 Form 10-K | 105 | |||||||
Management’s discussion and analysis
Refer to Business Segment Results on pages 65–85 and Note 34 for additional information on the First Republic acquisition.
Refer to the Firm’s Consolidated Balance Sheets Analysis and the Business Segment Results on pages 58–60 and pages 65–85, respectively, for further information on deposit and liability balance trends. Refer to Note 3 for further information on structured notes.
Certain deposits are covered by insurance protection that provides additional funding stability and results in a benefit to the LCR. Deposit insurance protection may be available to depositors in the countries in which the deposits are placed. For example, the Federal Deposit Insurance Corporation (“FDIC”) provides deposit insurance protection for deposits placed in a U.S. depository institution. At December 31, 2023 and 2022, the Firmwide estimated uninsured deposits were $1,331.9 billion and $1,383.7 billion, respectively, primarily reflecting wholesale operating deposits.
Total uninsured deposits include time deposits. The table below presents an estimate of uninsured U.S. and non-U.S. time deposits, and their remaining maturities. The Firm’s estimates of its uninsured U.S. time deposits are based on data that the Firm calculates periodically under applicable FDIC regulations. For purposes of this presentation, all non-U.S. time deposits are deemed to be uninsured.
| (in millions) | December 31, 2023 | December 31, 2022 | ||||||||||||||||||
| U.S. | Non-U.S. | U.S. | Non-U.S. | |||||||||||||||||
| Three months or less | $ | 82,719 | $ | 77,466 | $ | 43,513 | $ | 68,765 | ||||||||||||
| Over three months but within 6 months | 17,736 | 5,358 | 8,670 | 3,658 | ||||||||||||||||
| Over six months but within 12 months | 10,294 | 4,820 | 7,035 | 2,850 | ||||||||||||||||
| Over 12 months | 710 | 2,543 | 787 | 2,634 | ||||||||||||||||
| Total | $ | 111,459 | $ | 90,187 | $ | 60,005 | $ | 77,907 | ||||||||||||
The table below shows the loan and deposit balances, the loans-to-deposits ratios, and deposits as a percentage of total liabilities, as of December 31, 2023 and 2022.
| As of December 31, (in billions except ratios) | ||||||||
| 2023 | 2022 | |||||||
Deposits | $ | 2,400.7 | $ | 2,340.2 | ||||
Deposits as a % of total liabilities | 68 | % | 69 | % | ||||
Loans | $ | 1,323.7 | $ | 1,135.6 | ||||
Loans-to-deposits ratio | 55 | % | 49 | % | ||||
The following table provides a summary of the average balances and average interest rates of JPMorgan Chase’s deposits for the years ended December 31, 2023, 2022, and 2021.
| (Unaudited) Year ended December 31, | Average balances | Average interest rates | |||||||||||||||||||||||||||||||||
| (in millions, except interest rates) | 2023 | 2022 | 2021 | 2023 | 2022 | 2021 | |||||||||||||||||||||||||||||
| U.S. offices | |||||||||||||||||||||||||||||||||||
| Noninterest-bearing | $ | 635,791 | $ | 691,206 | $ | 648,170 | NA | NA | NA | ||||||||||||||||||||||||||
| Interest-bearing | |||||||||||||||||||||||||||||||||||
Demand(a) | 279,725 | 324,512 | 322,122 | 3.50 | % | 0.92 | % | 0.06 | % | ||||||||||||||||||||||||||
Savings(b) | 864,558 | 971,788 | 930,866 | 1.10 | 0.28 | 0.06 | |||||||||||||||||||||||||||||
| Time | 145,827 | 62,022 | 48,628 | 4.74 | 2.07 | 0.26 | |||||||||||||||||||||||||||||
| Total interest-bearing deposits | 1,290,110 | 1,358,322 | 1,301,616 | 2.03 | 0.52 | 0.07 | |||||||||||||||||||||||||||||
| Total deposits in U.S. offices | 1,925,901 | 2,049,528 | 1,949,786 | 1.36 | 0.34 | 0.05 | |||||||||||||||||||||||||||||
| Non-U.S. offices | |||||||||||||||||||||||||||||||||||
| Noninterest-bearing | 24,747 | 28,043 | 26,315 | NA | NA | NA | |||||||||||||||||||||||||||||
| Interest-bearing | |||||||||||||||||||||||||||||||||||
| Demand | 321,976 | 324,740 | 313,304 | 2.71 | 0.57 | (0.10) | |||||||||||||||||||||||||||||
| Time | 86,443 | 65,604 | 57,749 | 5.82 | 1.85 | (0.09) | |||||||||||||||||||||||||||||
| Total interest-bearing deposits | 408,419 | 390,344 | 371,053 | 3.37 | 0.78 | (0.10) | |||||||||||||||||||||||||||||
| Total deposits in non-U.S. offices | 433,166 | 418,387 | 397,368 | 3.18 | 0.73 | (0.09) | |||||||||||||||||||||||||||||
| Total deposits | $ | 2,359,067 | $ | 2,467,915 | $ | 2,347,154 | 1.70 | % | 0.41 | % | 0.02 | % | |||||||||||||||||||||||
(a)Includes Negotiable Order of Withdrawal accounts, and certain trust accounts.
(b)Includes Money Market Deposit Accounts.
Refer to Note 17 for additional information on deposits.
106 | JPMorgan Chase & Co./2023 Form 10-K | |||||||
The following table summarizes short-term and long-term funding, excluding deposits, as of December 31, 2023 and 2022, and average balances for the years ended December 31, 2023 and 2022. Refer to the Consolidated Balance Sheets Analysis on pages 58–60 and Note 11 for additional information.
| Sources of funds (excluding deposits) | ||||||||||||||||||||
| As of or for the year ended December 31, | Average | |||||||||||||||||||
| (in millions) | 2023 | 2022 | 2023 | 2022 | ||||||||||||||||
Commercial paper | $ | 14,737 | $ | 12,557 | $ | 12,675 | $ | 16,151 | ||||||||||||
Other borrowed funds | 8,200 | 8,418 | 9,712 | 12,250 | ||||||||||||||||
| Federal funds purchased | 787 | 1,684 | 1,754 | 1,567 | ||||||||||||||||
| Total short-term unsecured funding | $ | 23,724 | $ | 22,659 | $ | 24,141 | $ | 29,968 | ||||||||||||
Securities sold under agreements to repurchase(a) | $ | 212,804 | $ | 198,382 | $ | 249,661 | $ | 236,192 | ||||||||||||
Securities loaned(a) | 2,944 | 2,547 | 4,671 | 5,003 | ||||||||||||||||
| Other borrowed funds | 21,775 | (g) | 23,052 | 22,010 | 25,211 | |||||||||||||||
Obligations of Firm-administered multi-seller conduits(b) | 17,781 | 9,236 | 14,918 | 7,387 | ||||||||||||||||
Total short-term secured funding | $ | 255,304 | $ | 233,217 | $ | 291,260 | $ | 273,793 | ||||||||||||
| Senior notes | $ | 191,202 | $ | 188,025 | $ | 181,803 | $ | 189,047 | ||||||||||||
| Subordinated debt | 19,708 | 21,803 | 20,374 | 20,125 | ||||||||||||||||
Structured notes(c) | 86,056 | 70,839 | 76,574 | 68,656 | ||||||||||||||||
| Total long-term unsecured funding | $ | 296,966 | $ | 280,667 | $ | 278,751 | $ | 277,828 | ||||||||||||
Credit card securitization(b) | $ | 2,998 | $ | 1,999 | $ | 1,634 | $ | 1,950 | ||||||||||||
| FHLB advances | 41,246 | (g) | 11,093 | 28,865 | 11,103 | |||||||||||||||
Purchase Money Note(d) | 48,989 | NA | $ | 32,829 | NA | |||||||||||||||
Other long-term secured funding(e) | 4,624 | 4,105 | 4,513 | 3,837 | ||||||||||||||||
| Total long-term secured funding | $ | 97,857 | $ | 17,197 | $ | 67,841 | $ | 16,890 | ||||||||||||
Preferred stock(f) | $ | 27,404 | $ | 27,404 | $ | 27,404 | $ | 31,893 | ||||||||||||
Common stockholders’ equity(f) | $ | 300,474 | $ | 264,928 | $ | 282,056 | $ | 253,068 | ||||||||||||
(a)Primarily consists of short-term securities loaned or sold under agreements to repurchase.
(b)Included in beneficial interests issued by consolidated variable interest entities on the Firm’s Consolidated balance sheets.
(c)Includes certain TLAC-eligible long-term unsecured debt issued by the Parent Company.
(d)Reflects the Purchase Money Note associated with the First Republic acquisition on May 1, 2023. Refer to Note 34 for additional information.
(e)Includes long-term structured notes which are secured.
(f)Refer to Capital Risk Management on pages 91-101, Consolidated statements of changes in stockholders’ equity on page 169, Note 21 and Note 22 for additional information on preferred stock and common stockholders’ equity.
(g)As of December 31, 2023, included short-term and long-term FHLB advances of $500 million and $23.2 billion, respectively, associated with First Republic. Refer to Note 34 for additional information.
Short-term funding
The Firm’s sources of short-term secured funding primarily consist of securities loaned or sold under agreements to repurchase. These instruments are secured predominantly by high-quality securities collateral, including government-issued debt and U.S. GSE and government agency MBS. Securities sold under agreements to repurchase increased at December 31, 2023, compared with December 31, 2022, reflecting the impact of a lower level of netting on reduced repurchase activity.
The balances associated with securities loaned or sold under agreements to repurchase fluctuate over time due to investment and financing activities of clients, the Firm’s demand for financing, the ongoing management of the mix of the Firm’s liabilities, including its secured and unsecured financing (for both the investment securities and market-making portfolios), and other market and portfolio factors.
The Firm’s sources of short-term unsecured funding primarily consist of issuances of wholesale commercial paper and other borrowed funds.
The increase in period-end commercial paper and the decrease in average balances for the year ended December 31, 2023 compared to the respective prior year periods were due to changes in net issuance levels primarily for short-term liquidity management.
The decrease in average secured other borrowed funds for the year ended December 31, 2023 compared to the prior year period was primarily due to lower financing of Markets activities.
JPMorgan Chase & Co./2023 Form 10-K | 107 | |||||||
Management’s discussion and analysis
Long-term funding and issuance
Long-term funding provides an additional source of stable funding and liquidity for the Firm. The Firm’s long-term funding plan is driven primarily by expected client activity, liquidity considerations and regulatory requirements, including TLAC. Long-term funding objectives include maintaining diversification, maximizing market access and optimizing funding costs. The Firm evaluates various funding markets, tenors and currencies in creating its optimal long-term funding plan.
The significant majority of the Firm’s total outstanding long-term debt has been issued by the Parent Company to provide flexibility in support of the funding needs of both bank and non-bank subsidiaries. The Parent Company advances substantially all net funding proceeds to its subsidiary, the IHC. The IHC does not issue debt to external counterparties. For the year ended December 31, 2023, the increase in period-end structured notes compared to the prior year period was attributable to net issuances of structured notes in Markets due to client demand and an increase in fair value.
The following table summarizes long-term unsecured issuance and maturities or redemptions for the years ended December 31, 2023 and 2022. Refer to Note 20 for additional information on the IHC and long-term debt.
| Long-term unsecured funding | |||||||||||||||||
| Year ended December 31, | 2023 | 2022 | 2023 | 2022 | |||||||||||||
| (Notional in millions) | Parent Company | Subsidiaries | |||||||||||||||
| Issuance | |||||||||||||||||
| Senior notes issued in the U.S. market | $ | 14,256 | $ | 32,600 | $ | 3,750 | $ | — | |||||||||
| Senior notes issued in non-U.S. markets | 2,141 | 2,752 | — | — | |||||||||||||
| Total senior notes | 16,397 | 35,352 | 3,750 | — | |||||||||||||
| Subordinated debt | — | 3,500 | — | — | |||||||||||||
Structured notes(a) | 3,013 | 2,535 | 35,281 | 35,577 | |||||||||||||
Total long-term unsecured funding – issuance | $ | 19,410 | $ | 41,387 | $ | 39,031 | $ | 35,577 | |||||||||
| Maturities/redemptions | |||||||||||||||||
| Senior notes | $ | 21,483 | $ | 16,700 | $ | 67 | $ | 65 | |||||||||
| Subordinated debt | 2,090 | — | — | — | |||||||||||||
| Structured notes | 1,532 | 1,594 | 28,777 | 25,481 | |||||||||||||
Total long-term unsecured funding – maturities/redemptions | $ | 25,105 | $ | 18,294 | $ | 28,844 | $ | 25,546 | |||||||||
(a)Includes certain TLAC-eligible long-term unsecured debt issued by the Parent Company.
The Firm can also raise secured long-term funding through securitization of consumer credit card loans and FHLB advances. The following table summarizes the securitization issuance, the FHLB advances, and their respective maturities or redemptions, as applicable for the years ended December 31, 2023 and 2022. Additionally, the table includes the FHLB advances and Purchase Money Note associated with First Republic. Refer to Note 34 for additional information.
| Long-term secured funding | ||||||||||||||||||||
| Year ended December 31, | Issuance | Maturities/Redemptions | ||||||||||||||||||
| (in millions) | 2023 | 2022 | 2023 | 2022 | ||||||||||||||||
Credit card securitization | $ | 1,998 | $ | 999 | $ | 1,000 | $ | 1,400 | ||||||||||||
| FHLB advances | 39,775 | — | 9,485 | 14 | ||||||||||||||||
Purchase Money Note(a) | 50,000 | NA | — | NA | ||||||||||||||||
Other long-term secured funding(b) | 991 | 476 | 432 | 268 | ||||||||||||||||
Total long-term secured funding | $ | 92,764 | $ | 1,475 | $ | 10,917 | $ | 1,682 | ||||||||||||
(a)Reflects the Purchase Money Note associated with the First Republic acquisition. Refer to Note 34 for additional information.
(b)Includes long-term structured notes that are secured.
The Firm’s wholesale businesses also securitize loans for client-driven transactions; those client-driven loan securitizations are not considered to be a source of funding for the Firm and are not included in the table above. Refer to Note 14 for a further description of client-driven loan securitizations.
108 | JPMorgan Chase & Co./2023 Form 10-K | |||||||
Credit ratings
The cost and availability of financing are influenced by credit ratings. Reductions in these ratings could have an adverse effect on the Firm’s access to liquidity sources, increase the cost of funds, trigger additional collateral or funding requirements and decrease the number of investors and counterparties willing to lend to the Firm. The nature and magnitude of the impact of ratings downgrades depends on numerous contractual and behavioral factors,
which the Firm believes are incorporated in its liquidity risk and stress testing metrics. The Firm believes that it
maintains sufficient liquidity to withstand a potential decrease in funding capacity due to ratings downgrades.
Additionally, the Firm’s funding requirements for VIEs and other third-party commitments may be adversely affected by a decline in credit ratings. Refer to Note 5 and Note 14 for additional information.
The credit ratings of the Parent Company and the Firm’s principal bank and non-bank subsidiaries as of December 31, 2023, were as follows:
| JPMorgan Chase & Co. | JPMorgan Chase Bank, N.A. | J.P. Morgan Securities LLC J.P. Morgan Securities plc J.P. Morgan SE | |||||||||||||||||||||||||||||||||
| December 31, 2023 | Long-term issuer | Short-term issuer | Outlook | Long-term issuer | Short-term issuer | Outlook | Long-term issuer | Short-term issuer | Outlook | ||||||||||||||||||||||||||
| Moody’s Investors Service | A1 | P-1 | Stable | Aa2 | P-1 | Negative | (b) | Aa3 | P-1 | Stable | |||||||||||||||||||||||||
Standard & Poor’s(a) | A- | A-2 | Stable | A+ | A-1 | Stable | A+ | A-1 | Stable | ||||||||||||||||||||||||||
| Fitch Ratings | AA- | F1+ | Stable | AA | F1+ | Stable | AA | F1+ | Stable | ||||||||||||||||||||||||||
(a)On March 31, 2023, Standard & Poor's affirmed the credit ratings of the Parent Company and the Firm’s principal bank and non-bank subsidiaries, and revised the outlook from positive to stable.
(b)On November 13, 2023, Moody’s revised the outlook of the Firm’s principal bank subsidiary from stable to negative to reflect Moody’s change to the U.S. sovereign outlook.
JPMorgan Chase’s unsecured debt does not contain requirements that would call for an acceleration of payments, maturities or changes in the structure of the existing debt, provide any limitations on future borrowings or require additional collateral, based on unfavorable changes in the Firm’s credit ratings, financial ratios, earnings, or stock price.
Critical factors in maintaining high credit ratings include a stable and diverse earnings stream, strong capital and liquidity ratios, strong credit quality and risk management controls, and diverse funding sources. Rating agencies continue to evaluate economic and geopolitical trends, regulatory developments, future profitability, risk management practices, and litigation matters, as well as their broader ratings methodologies. Changes in any of these factors could lead to changes in the Firm’s credit ratings.
JPMorgan Chase & Co./2023 Form 10-K | 109 | |||||||
REPUTATION RISK MANAGEMENT | ||||||||||||||
Reputation risk is the risk that an action or inaction may negatively impact perception of the Firm’s integrity and reduce confidence in the Firm’s competence by various stakeholders, including clients, counterparties, customers, communities, investors, regulators, or employees.
The types of events that may result in reputation risk are wide-ranging and can be introduced by the Firm’s employees, business strategies and activities, clients, customers and counterparties with which the Firm does business. These events could contribute to financial losses, litigation, regulatory enforcement actions, fines, penalties or other sanctions, as well as other harm to the Firm.
Organization and management
Reputation Risk Management is an independent risk management function that establishes the governance framework for managing reputation risk across the Firm’s LOBs and Corporate. Reputation risk is inherently challenging to identify, manage, and quantify.
The Firm’s reputation risk management function includes the following activities:
•Maintaining a Firmwide Reputation Risk Governance policy and a standard consistent with the reputation risk framework
•Providing oversight of the governance framework through processes and infrastructure to support consistent identification, escalation and monitoring of reputation risk issues Firmwide
Governance and oversight
The Reputation Risk Governance policy establishes the principles for managing reputation risk for the Firm. It is the responsibility of each LOB, Corporate and employees to consider the reputation of the Firm when deciding whether to offer a new product, engage in a transaction or client relationship, enter a new jurisdiction, initiate a business process or consider any other activity. Environmental impacts and social concerns are increasingly important considerations in assessing the Firm’s reputation risk, and are a component of the Firm’s reputation risk governance.
110 | JPMorgan Chase & Co./2023 Form 10-K | |||||||
| CREDIT AND INVESTMENT RISK MANAGEMENT | ||||||||||||||
Credit and investment risk is the risk associated with the default or change in credit profile of a client, counterparty or customer; or loss of principal or a reduction in expected returns on investments, including consumer credit risk, wholesale credit risk, and investment portfolio risk.
Credit risk management
Credit risk is the risk associated with the default or change in credit profile of a client, counterparty or customer. The Firm provides credit to a variety of clients and customers, ranging from large corporate and institutional clients to individual consumers and small businesses. In its consumer businesses, the Firm is exposed to credit risk primarily through its home lending, credit card, auto, and business banking businesses. In its wholesale businesses, the Firm is exposed to credit risk through its underwriting, lending, market-making, and hedging activities with and for clients and counterparties, as well as through its operating services activities (such as cash management and clearing activities), and securities financing activities. The Firm is also exposed to credit risk through its investment securities portfolio and cash placed with banks.
Credit Risk Management monitors, measures and manages credit risk throughout the Firm and defines credit risk policies and procedures. The Firm’s credit risk management governance includes the following activities:
•Maintaining a credit risk policy framework
•Monitoring, measuring and managing credit risk across all portfolio segments, including transaction and exposure approval
•Setting industry and geographic concentration limits, as appropriate, and establishing underwriting guidelines
•Assigning and managing credit approval authorities in connection with the approval of credit exposure
•Managing criticized exposures and delinquent loans, and
•Estimating credit losses and supporting appropriate credit risk-based capital management
Risk identification and measurement
To measure credit risk, the Firm employs several methodologies for estimating the likelihood of obligor or counterparty default. Methodologies for measuring credit risk vary depending on several factors, including type of asset (e.g., consumer versus wholesale), risk measurement parameters (e.g., delinquency status and borrower’s credit score versus wholesale risk-rating) and risk management and collection processes (e.g., retail collection center versus centrally managed workout groups). Credit risk measurement is based on the probability of default of an obligor or counterparty, the loss severity given a default event and the exposure at default.
Based on these factors and the methodology and estimates described in Note 13 and Note 10, the Firm estimates credit losses for its exposures. The allowance for loan losses reflects estimated credit losses related to the consumer and wholesale held-for-investment loan portfolios, the allowance for lending-related commitments reflects estimated credit losses related to the Firm’s lending-related commitments and the allowance for investment securities reflects estimated credit losses related to the investment securities portfolio. Refer to Note 13, Note 10 and Critical Accounting Estimates used by the Firm on pages 155–158 for further information.
In addition, potential and unexpected credit losses are reflected in the allocation of credit risk capital and represent the potential volatility of actual losses relative to the established allowances for loan losses and lending-related commitments. The analyses for these losses include stress testing that considers alternative economic scenarios as described below.
Stress testing
Stress testing is important in measuring and managing credit risk in the Firm’s credit portfolio. The stress testing process assesses the potential impact of alternative economic and business scenarios on estimated credit losses for the Firm. Economic scenarios and the underlying parameters are defined centrally, articulated in terms of macroeconomic factors and applied across the businesses. The stress test results may indicate credit migration, changes in delinquency trends and potential losses in the credit portfolio. In addition to the periodic stress testing processes, management also considers additional stresses outside these scenarios, including industry and country- specific stress scenarios, as appropriate. The Firm uses stress testing to inform decisions on setting risk appetite both at a Firm and LOB level, as well as to assess the impact of stress on individual counterparties.
JPMorgan Chase & Co./2023 Form 10-K | 111 | |||||||
Management’s discussion and analysis
Risk monitoring and management
The Firm has developed policies and practices that are designed to preserve the independence and integrity of the approval and decision-making process for extending credit so that credit risks are assessed accurately, approved properly, monitored regularly and managed actively at both the transaction and portfolio levels. The policy framework establishes credit approval authorities, concentration limits, risk-rating methodologies, portfolio review parameters and guidelines for management of distressed exposures. In addition, certain models, assumptions and inputs used in evaluating and monitoring credit risk are independently validated by groups that are separate from the LOBs.
Consumer credit risk is monitored for delinquency and other trends, including any concentrations at the portfolio level, as certain of these trends can be addressed through changes in underwriting policies and portfolio guidelines. Consumer Risk Management evaluates delinquency and other trends against business expectations, current and forecasted economic conditions, and industry benchmarks. Historical and forecasted economic performance and trends are incorporated into the modeling of estimated consumer credit losses and are part of the monitoring of the credit risk profile of the portfolio.
Wholesale credit risk is monitored regularly at an aggregate portfolio, industry, and individual client and counterparty level with established concentration limits that are reviewed and revised periodically as deemed appropriate by management. Industry and counterparty limits, as measured in terms of exposure and economic risk appetite, are subject to stress-based loss constraints.
Management of the Firm’s wholesale credit risk exposure is accomplished through a number of means, including:
•Loan underwriting and credit approval processes
•Loan syndications and participations
•Loan sales and securitizations
•Credit derivatives
•Master netting agreements, and
•Collateral and other risk-reduction techniques
In addition to Credit Risk Management, an independent Credit Review function is responsible for:
•Independently assessing risk grades assigned to exposures in the Firm’s wholesale credit portfolio and the timeliness of risk grade changes initiated by responsible business units; and
•Evaluating the effectiveness of the credit management processes of the LOBs and Corporate, including the adequacy of credit analyses and risk grading/loss given default (“LGD”) rationales, proper monitoring and management of credit exposures, and compliance with applicable grading policies and underwriting guidelines.
Refer to Note 12 for further discussion of consumer and wholesale loans.
Risk reporting
To enable monitoring of credit risk and effective decision-making, aggregate credit exposure, credit quality forecasts, concentration levels and risk profile changes are reported regularly to senior members of Credit Risk Management. Detailed portfolio reporting of industry, clients, counterparties and customers, product and geography are prepared, and the appropriateness of the allowance for credit losses is reviewed by senior management at least on a quarterly basis. Through the risk reporting and governance structure, credit risk trends and limit exceptions are provided regularly to, and discussed with, risk committees, senior management and the Board of Directors.
112 | JPMorgan Chase & Co./2023 Form 10-K | |||||||
| CREDIT PORTFOLIO | ||||||||||||||
Credit risk is the risk associated with the default or change in credit profile of a client, counterparty or customer.
In the following tables, total loans include loans retained (i.e., held-for-investment); loans held-for-sale; and certain loans accounted for at fair value. The following tables do not include loans which the Firm accounts for at fair value and classifies as trading assets; refer to Notes 2 and 3 for further information regarding these loans. Refer to Notes 12, 28, and 5 for additional information on the Firm’s loans, lending-related commitments and derivative receivables, including the Firm’s related accounting policies.
Refer to Note 10 for information regarding the credit risk inherent in the Firm’s investment securities portfolio; and refer to Note 11 for information regarding credit risk inherent in the securities financing portfolio. Refer to Consumer Credit Portfolio on pages 114–119 and Note 12 for further discussions of the consumer credit environment and consumer loans. Refer to Wholesale Credit Portfolio on pages 120–130 and Note 12 for further discussions of the wholesale credit environment and wholesale loans.
On January 1, 2023, the Firm adopted changes to the TDR accounting guidance, which eliminated the accounting and disclosure requirements for TDRs including the requirement to assess whether a modification is reasonably expected or involves a concession. The new guidance requires disclosure of loan modifications to borrowers experiencing financial difficulty consisting of principal forgiveness, interest rate reduction, other-than-insignificant payment delay, term extension or a combination of these modifications. The Firm has defined these types of modifications as financial difficulty modifications ("FDMs"). As a result of the elimination of the requirement to assess whether a modification is reasonably expected or involves a concession, the population of loans considered FDMs differs from the population previously considered TDRs. Refer to Note 1 and Note 12 for further information.
| Total credit portfolio | ||||||||||||||||||||
| December 31, (in millions) | Credit exposure | Nonperforming(d) | ||||||||||||||||||
| 2023 | 2022 | 2023 | 2022 | |||||||||||||||||
| Loans retained | $ | 1,280,870 | $ | 1,089,598 | $ | 5,989 | $ | 5,837 | ||||||||||||
| Loans held-for-sale | 3,985 | 3,970 | 184 | 54 | ||||||||||||||||
| Loans at fair value | 38,851 | 42,079 | 744 | 829 | ||||||||||||||||
| Total loans | 1,323,706 | 1,135,647 | 6,917 | 6,720 | ||||||||||||||||
| Derivative receivables | 54,864 | 70,880 | 364 | 296 | ||||||||||||||||
Receivables from customers(a) | 47,625 | 49,257 | — | — | ||||||||||||||||
Total credit-related assets | 1,426,195 | 1,255,784 | 7,281 | 7,016 | ||||||||||||||||
Assets acquired in loan satisfactions | ||||||||||||||||||||
| Real estate owned | NA | NA | 274 | 203 | ||||||||||||||||
| Other | NA | NA | 42 | 28 | ||||||||||||||||
Total assets acquired in loan satisfactions | NA | NA | 316 | 231 | ||||||||||||||||
| Lending-related commitments | 1,497,847 | 1,326,782 | 464 | 455 | ||||||||||||||||
| Total credit portfolio | $ | 2,924,042 | (c) | $ | 2,582,566 | $ | 8,061 | $ | 7,702 | |||||||||||
Credit derivatives and credit-related notes used in credit portfolio management activities(b) | $ | (37,779) | $ | (19,330) | $ | — | $ | — | ||||||||||||
| Liquid securities and other cash collateral held against derivatives | (22,461) | (23,014) | NA | NA | ||||||||||||||||
(a) Receivables from customers reflect held-for-investment margin loans to brokerage clients in CIB, CCB and AWM; these are reported within accrued interest and accounts receivable on the Consolidated balance sheets.
(b) Represents the net notional amount of protection purchased and sold through credit derivatives and credit-related notes used to manage credit exposures.
(c) Includes credit exposure associated with First Republic consisting of $102.2 billion in the Consumer credit portfolio and $90.6 billion in the Wholesale credit portfolio.
(d) At December 31, 2023 and 2022, nonperforming assets excluded mortgage loans 90 or more days past due and insured by U.S. government agencies of $182 million and $302 million, respectively. These amounts have been excluded based upon the government guarantee. In addition, the Firm’s policy is generally to exempt credit card loans from being placed on nonaccrual status as permitted by regulatory guidance.
The following table provides information on Firmwide nonaccrual loans to total loans.
| December 31, (in millions, except ratios) | 2023 | 2022 | ||||||
| Total nonaccrual loans | $ | 6,917 | $ | 6,720 | ||||
| Total loans | 1,323,706 | 1,135,647 | ||||||
| Firmwide nonaccrual loans to total loans outstanding | 0.52 | % | 0.59 | % | ||||
The following table provides information about the Firm’s net charge-offs and recoveries.
| Year ended December 31, (in millions, except ratios) | 2023 | 2022 | ||||||
| Net charge-offs | $ | 6,209 | $ | 2,853 | ||||
Average retained loans | 1,202,348 | 1,044,765 | ||||||
Net charge-off rates | 0.52 | % | 0.27 | % | ||||
JPMorgan Chase & Co./2023 Form 10-K | 113 | |||||||
Management’s discussion and analysis
| CONSUMER CREDIT PORTFOLIO | ||||||||||||||
The Firm’s retained consumer portfolio consists primarily of loans and lending-related commitments for residential real estate, credit card, scored auto and business banking, including those associated with First Republic, primarily in residential real estate. The consumer credit portfolio also includes loans at fair value, predominantly in residential real estate. The Firm’s focus is on serving primarily the prime segment of the consumer credit market. Originated mortgage loans are retained in the residential real estate portfolio, securitized or sold to U.S. government agencies and U.S. government-sponsored enterprises; other types of consumer loans are typically retained on the balance sheet. Refer to Note 12 for further information on the consumer loan portfolio. Refer to Note 28 for further information on lending-related commitments.
114 | JPMorgan Chase & Co./2023 Form 10-K | |||||||
The following tables present consumer credit-related information with respect to the scored credit portfolio held in CCB, AWM, CIB and Corporate.
| Consumer credit portfolio | ||||||||||||||||||||
| December 31, (in millions) | Credit exposure | Nonaccrual loans(j)(k)(l) | ||||||||||||||||||
| 2023 | 2022 | 2023 | 2022 | |||||||||||||||||
| Consumer, excluding credit card | ||||||||||||||||||||
Residential real estate(a) | $ | 326,409 | $ | 237,561 | $ | 3,466 | $ | 3,745 | ||||||||||||
Auto and other(b)(c) | 70,866 | 63,192 | 177 | 129 | ||||||||||||||||
| Total loans - retained | 397,275 | 300,753 | 3,643 | 3,874 | ||||||||||||||||
| Loans held-for-sale | 487 | 618 | 95 | 28 | ||||||||||||||||
Loans at fair value(d) | 12,331 | 10,004 | 465 | 423 | ||||||||||||||||
| Total consumer, excluding credit card loans | 410,093 | 311,375 | 4,203 | 4,325 | ||||||||||||||||
Lending-related commitments(e) | 45,403 | 33,518 | ||||||||||||||||||
Total consumer exposure, excluding credit card | 455,496 | (i) | 344,893 | |||||||||||||||||
| Credit card | ||||||||||||||||||||
Loans retained(f) | 211,123 | 185,175 | NA | NA | ||||||||||||||||
| Total credit card loans | 211,123 | 185,175 | NA | NA | ||||||||||||||||
Lending-related commitments(e)(g) | 915,658 | 821,284 | ||||||||||||||||||
| Total credit card exposure | 1,126,781 | 1,006,459 | ||||||||||||||||||
| Total consumer credit portfolio | $ | 1,582,277 | $ | 1,351,352 | $ | 4,203 | $ | 4,325 | ||||||||||||
Credit-related notes used in credit portfolio management activities(h) | $ | (790) | $ | (1,187) | ||||||||||||||||
| Year ended December 31, | ||||||||||||||||||||||||||
| (in millions, except ratios) | Net charge-offs/(recoveries) | Average loans - retained | Net charge-off/(recovery) rate(m) | |||||||||||||||||||||||
| 2023 | 2022 | 2023 | 2022 | 2023 | 2022 | |||||||||||||||||||||
Consumer, excluding credit card | ||||||||||||||||||||||||||
| Residential real estate | $ | (52) | $ | (226) | $ | 296,515 | $ | 233,454 | (0.02) | % | (0.10) | % | ||||||||||||||
| Auto and other | 684 | 495 | 67,546 | 65,955 | 1.01 | 0.75 | ||||||||||||||||||||
| Total consumer, excluding credit card - retained | 632 | 269 | 364,061 | 299,409 | 0.17 | 0.09 | ||||||||||||||||||||
| Credit card - retained | 4,698 | 2,403 | 191,412 | 163,335 | 2.45 | 1.47 | ||||||||||||||||||||
| Total consumer - retained | $ | 5,330 | $ | 2,672 | $ | 555,473 | $ | 462,744 | 0.96 | % | 0.58 | % | ||||||||||||||
(a)Includes scored mortgage and home equity loans held in CCB and AWM.
(b)At December 31, 2023 and 2022, excluded operating lease assets of $10.4 billion and $12.0 billion, respectively. These operating lease assets are included in other assets on the Firm’s Consolidated balance sheets. Refer to Note 18 for further information.
(c)Includes scored auto and business banking loans, and overdrafts.
(d)Includes scored mortgage loans held in CCB and CIB, and other consumer unsecured loans in CIB.
(e)Credit card, home equity and certain business banking lending-related commitments represent the total available lines of credit for these products. The Firm has not experienced, and does not anticipate, that all available lines of credit would be used at the same time. For credit card commitments, and if certain conditions are met, home equity commitments and certain business banking commitments, the Firm can reduce or cancel these lines of credit by providing the borrower notice or, in some cases as permitted by law, without notice. Refer to Note 28 for further information.
(f)Includes billed interest and fees.
(g)Also includes commercial card lending-related commitments primarily in CB and CIB.
(h)Represents the notional amount of protection obtained through the issuance of credit-related notes that reference certain pools of residential real estate and auto loans in the retained consumer portfolio.
(i)At December 31, 2023, included credit exposure of $102.2 billion associated with First Republic, consisting of $99.6 billion in residential real estate and $2.6 billion in auto and other.
(j)At December 31, 2023 and 2022, nonaccrual loans excluded mortgage loans 90 or more days past due and insured by U.S. government agencies of $182 million and $302 million, respectively. These amounts have been excluded from nonaccrual loans based upon the government guarantee. In addition, the Firm’s policy is generally to exempt credit card loans from being placed on nonaccrual status, as permitted by regulatory guidance.
(k)Generally excludes loans under payment deferral programs offered in response to the COVID-19 pandemic.
(l)At December 31, 2023 and 2022, nonaccrual loans excluded $15 million and $101 million, respectively, of PPP loans 90 or more days past due and guaranteed by the SBA.
(m)Average consumer loans held-for-sale and loans at fair value were $12.9 billion and $17.4 billion for the years ended December 31, 2023 and 2022, respectively. These amounts were excluded when calculating net charge-off/(recovery) rates.
JPMorgan Chase & Co./2023 Form 10-K | 115 | |||||||
Management’s discussion and analysis
Maturities and sensitivity to changes in interest rates
The table below sets forth loan maturities by scheduled repayments, by class of loan and the distribution between fixed and floating interest rates based on the stated terms of the loan agreements. The Firm estimated the principal repayment amounts for both the residential real estate and auto and other loan classes by calculating the weighted-average loan balance and interest rates for loan pools based on remaining loan term. Refer to Note 12 for further information on loan classes.
| December 31, 2023 (in millions) | Within 1 year(e) | 1-5 years | 5-15 years | After 15 years | Total | ||||||||||||||||||||||||
| Consumer, excluding credit card | |||||||||||||||||||||||||||||
| Residential real estate | $ | 17,830 | $ | 27,447 | $ | 110,504 | $ | 181,593 | $ | 337,374 | |||||||||||||||||||
| Auto and other | 20,191 | (f) | 47,315 | 5,209 | 4 | 72,719 | |||||||||||||||||||||||
Total consumer, excluding credit card loans(a) | $ | 38,021 | $ | 74,762 | $ | 115,713 | $ | 181,597 | $ | 410,093 | |||||||||||||||||||
| Total credit card loans | $ | 210,418 | $ | 700 | $ | 5 | $ | — | $ | 211,123 | |||||||||||||||||||
| Total consumer loans | $ | 248,439 | $ | 75,462 | $ | 115,718 | $ | 181,597 | $ | 621,216 | |||||||||||||||||||
| Loans due after one year at fixed interest rates | |||||||||||||||||||||||||||||
Residential real estate(b) | $ | 20,337 | $ | 59,603 | $ | 89,044 | |||||||||||||||||||||||
| Auto and other | 47,236 | 3,767 | 4 | ||||||||||||||||||||||||||
| Credit card | 700 | 5 | — | ||||||||||||||||||||||||||
Loans due after one year at variable interest rates(c) | |||||||||||||||||||||||||||||
Residential real estate(d) | $ | 7,110 | $ | 50,901 | $ | 92,549 | |||||||||||||||||||||||
| Auto and other | 79 | 1,442 | — | ||||||||||||||||||||||||||
| Total consumer loans | $ | 75,462 | $ | 115,718 | $ | 181,597 | |||||||||||||||||||||||
(a)Included $3.9 billion, $4.6 billion, $27.9 billion, and $56.2 billion of loans within 1 year, 1-5 years, 5-15 years, and after 15 years, respectively, associated with First Republic.
(b)Included $3.0 billion, $8.9 billion, and $15.1 billion in 1-5 years, 5-15 years, and after 15 years, respectively, associated with First Republic.
(c)Includes loans that have an initial fixed interest rate that resets to a variable rate as the variable rate will be the prevailing rate over the life of the loan.
(d)Included $1.6 billion, $19.1 billion, and $41.0 billion in 1-5 years, 5-15 years, and after 15 years, respectively, associated with First Republic.
(e)Includes loans held-for-sale and loans at fair value.
(f)Includes overdrafts.
116 | JPMorgan Chase & Co./2023 Form 10-K | |||||||
Consumer, excluding credit card
Portfolio analysis
Loans increased from December 31, 2022 driven by residential real estate loans associated with First Republic and higher auto loans.
The following discussions provide information concerning individual loan products. Refer to Note 12 for further information about this portfolio, including information about delinquencies, loan modifications and other credit quality indicators.
Residential real estate: The residential real estate portfolio, including loans held-for-sale and loans at fair value, predominantly consists of prime mortgage loans and home equity lines of credit.
Retained loans increased compared to December 31, 2022 driven by residential real estate loans associated with First Republic. Retained nonaccrual loans decreased compared to December 31, 2022 predominantly driven by loan sales, partially offset by the net impact of paydowns and additions, including those associated with First Republic. Net recoveries were lower for the year ended December 31, 2023 compared to the prior year driven by lower prepayments due to higher interest rates.
Loans at fair value increased from December 31, 2022, driven by an increase in Home Lending as originations outpaced warehouse loan sales, and in CIB as purchases outpaced sales and paydowns.
At December 31, 2023 and 2022, the carrying values of interest-only residential mortgage loans were $90.6 billion and $36.3 billion, respectively. The increase was driven by First Republic. These loans have an interest-only payment period generally followed by an adjustable-rate or fixed-rate fully amortizing payment period to maturity and are typically originated as higher-balance loans to higher-income borrowers. The credit performance of this portfolio is comparable with the performance of the broader prime mortgage portfolio.
The carrying value of home equity lines of credit outstanding was $16.1 billion at December 31, 2023, which included $2.6 billion associated with First Republic. The carrying value of home equity lines of credit outstanding included $4.2 billion of HELOCs that have recast from interest-only to fully amortizing payments or have been modified and $4.3 billion of interest-only balloon HELOCs, which primarily mature after 2030. The Firm manages the risk of HELOCs during their revolving period by closing or reducing the undrawn line to the extent permitted by law when borrowers are exhibiting a material deterioration in their credit risk profile.
The following table provides a summary of the Firm’s
residential mortgage portfolio insured and/or guaranteed
by U.S. government agencies, predominantly loans held-for-sale and loans at fair value. The Firm monitors its exposure to certain potential unrecoverable claim payments related to government-insured loans and considers this exposure in estimating the allowance for loan losses.
| (in millions) | December 31, 2023 | December 31, 2022 | ||||||
| Current | $ | 446 | $ | 659 | ||||
| 30-89 days past due | 102 | 136 | ||||||
| 90 or more days past due | 182 | 302 | ||||||
| Total government guaranteed loans | $ | 730 | $ | 1,097 | ||||
Geographic composition and current estimated loan-to-value ratio of residential real estate loans
At December 31, 2023, $228.4 billion, or 70% of the total retained residential real estate loan portfolio, was concentrated in California, New York, Florida, Texas and Massachusetts, compared with $147.8 billion, or 62% at December 31, 2022.
Average current estimated loan-to-value (“LTV”) ratios have improved, reflecting an increase in home prices.
Refer to Note 12 for information on the geographic composition and current estimated LTVs of the Firm’s residential real estate loans.
Modified residential real estate loans
For the year ended December 31, 2023, residential real estate FDMs were $136 million. In addition to FDMs, the Firm also had $69 million of loans subject to trial modification where the terms of the loans have not been permanently modified, as well as $9 million of loans subject to discharge under Chapter 7 bankruptcy proceedings ("Chapter 7 loans"). The changes to the TDR accounting guidance eliminated the TDR reasonably expected and concession assessment criteria. Accordingly, trial modifications and Chapter 7 loans were considered TDRs, but not FDMs. Refer to Note 1 and Note 12 for further information.
For the year ended December 31, 2022, residential real estate TDRs were $362 million. Refer to Note 12 for further information on TDRs in prior periods.
JPMorgan Chase & Co./2023 Form 10-K | 117 | |||||||
Management’s discussion and analysis
Auto and other: The auto and other loan portfolio, including loans at fair value, generally consists of prime-quality scored auto and business banking loans, other consumer unsecured loans, and overdrafts. The portfolio increased when compared to December 31, 2022 due to originations of scored auto loans and an increase in other consumer unsecured fair value option loans in CIB associated with First Republic, largely offset by paydowns. Net charge-offs for the year ended December 31, 2023 increased compared to the prior year due to higher charge-offs of scored auto loans driven by the decline in used vehicle valuations. The scored auto net charge-off rates were 0.56% and 0.24% for the years ended December 31, 2023 and 2022, respectively.
Nonperforming assets
The following table presents information as of December 31, 2023 and 2022, about consumer, excluding credit card, nonperforming assets.
Nonperforming assets(a) | ||||||||
| December 31, (in millions) | 2023 | 2022 | ||||||
| Nonaccrual loans | ||||||||
Residential real estate(b) | $ | 4,015 | $ | 4,196 | ||||
Auto and other(c) | 188 | 129 | ||||||
| Total nonaccrual loans | 4,203 | 4,325 | ||||||
| Assets acquired in loan satisfactions | ||||||||
| Real estate owned | 120 | 129 | ||||||
| Other | 42 | 28 | ||||||
| Total assets acquired in loan satisfactions | 162 | 157 | ||||||
| Total nonperforming assets | $ | 4,365 | $ | 4,482 | ||||
(a)At December 31, 2023 and 2022, nonperforming assets excluded mortgage loans 90 or more days past due and insured by U.S. government agencies of $182 million and $302 million, respectively. These amounts have been excluded based upon the government guarantee.
(b)Generally excludes loans under payment deferral programs offered in response to the COVID-19 pandemic.
(c)At December 31, 2023 and 2022, nonaccrual loans excluded $15 million and $101 million, respectively, of PPP loans 90 or more days past due and guaranteed by the SBA.
Nonaccrual loans
The following table presents changes in consumer, excluding credit card, nonaccrual loans for the years ended December 31, 2023 and 2022.
| Nonaccrual loan activity | ||||||||
| Year ended December 31, | ||||||||
| (in millions) | 2023 | 2022 | ||||||
| Beginning balance | $ | 4,325 | $ | 5,350 | ||||
| Additions: | 2,894 | 2,196 | ||||||
| Reductions: | ||||||||
Principal payments and other(a) | 1,306 | 1,393 | ||||||
| Charge-offs | 472 | 255 | ||||||
| Returned to performing status | 1,052 | 1,405 | ||||||
| Foreclosures and other liquidations | 186 | 168 | ||||||
| Total reductions | 3,016 | 3,221 | ||||||
| Net changes | (122) | (1,025) | ||||||
| Ending balance | $ | 4,203 | $ | 4,325 | ||||
(a)Other reductions include loan sales.
Refer to Note 12 for further information about the consumer credit portfolio, including information about delinquencies, other credit quality indicators, loan modifications and loans that were in the process of active or suspended foreclosure.
118 | JPMorgan Chase & Co./2023 Form 10-K | |||||||
Credit card
Total credit card loans increased from December 31, 2022 reflecting growth from new accounts and revolving balances which continued to normalize to pre-pandemic levels. The December 31, 2023 30+ and 90+ day delinquency rates of 2.14% and 1.05%, respectively, increased compared to the December 31, 2022 30+ and 90+ day delinquency rates of 1.45% and 0.68%, respectively. Net charge-offs increased for the year ended December 31, 2023 compared to the prior year as delinquencies have normalized.
Consistent with the Firm’s policy, all credit card loans typically remain on accrual status until charged off. However, the Firm’s allowance for loan losses includes the estimated uncollectible portion of accrued and billed interest and fee income.
Geographic and FICO composition of credit card loans
At December 31, 2023, $98.1 billion, or 46% of the total retained credit card loan portfolio, was concentrated in California, Texas, New York, Florida and Illinois, compared with $85.4 billion, or 46%, at December 31, 2022.
Modifications of credit card loans
For the year ended December 31, 2023, credit card FDMs were $648 million. FDMs increased for the year ended December 31, 2023 compared to credit card TDRs in the prior year, as delinquencies have normalized. In addition to FDMs, the Firm also had $27 million of loans subject to trial modification where the terms of the loans have not been permanently modified for the year ended December 31, 2023. The changes to the TDR accounting guidance eliminated the TDR reasonably expected and concession assessment criteria. Accordingly, trial modifications were considered TDRs, but not FDMs.
For the year ended December 31, 2022, credit card TDRs were $418 million.
Refer to Note 1 and Note 12 for further information about this portfolio, including information about delinquencies, geographic and FICO composition, and modifications.
JPMorgan Chase & Co./2023 Form 10-K | 119 | |||||||
Management’s discussion and analysis
| WHOLESALE CREDIT PORTFOLIO | ||||||||||||||
In its wholesale businesses, the Firm is exposed to credit risk primarily through its underwriting, lending, market-making, and hedging activities with and for clients and counterparties, as well as through various operating services (such as cash management and clearing activities), securities financing activities and cash placed with banks. A portion of the loans originated or acquired by the Firm’s wholesale businesses is generally retained on the balance sheet. The Firm distributes a significant percentage of the loans that it originates into the market as part of its syndicated loan business and to manage portfolio concentrations and credit risk. The wholesale portfolio is actively managed, in part by conducting ongoing, in-depth reviews of client credit quality and transaction structure, inclusive of collateral where applicable, and of industry, product and client concentrations. Refer to the industry discussion on pages 122–125 for further information.
The Firm’s wholesale credit portfolio includes exposure held in CIB, CB, AWM, and Corporate, and risk-rated exposure held in CCB, for which the wholesale methodology is applied when determining the allowance for loan losses. The Firm continues to convert certain operations, and to integrate clients, products and services, associated with First Republic. Accordingly, reporting classifications and internal risk rating profiles in the wholesale portfolio may change in future periods. Refer to Business Developments on page 53 for additional information.
As of December 31, 2023, retained loans increased $68.8 billion predominantly driven by the impact of First Republic. Lending-related commitments increased $64.8 billion, driven by the impact of First Republic, and net portfolio activity in CIB and CB.
As of December 31, 2023, nonperforming exposure increased $476 million predominantly driven by nonperforming retained loans in Real Estate and Healthcare, reflecting downgrades, and Individuals largely driven by the impact of First Republic, partially offset by a single name upgrade in Civic Organizations.
For the year ended December 31, 2023, wholesale net charge-offs increased $698 million, predominantly driven by the restructuring of a loan, increases in Real Estate (concentrated in Office) and Consumer & Retail.
| Wholesale credit portfolio | |||||||||||||||||
| December 31, (in millions) | Credit exposure | Nonperforming | |||||||||||||||
| 2023 | 2022 | 2023 | 2022 | ||||||||||||||
| Loans retained | $ | 672,472 | $ | 603,670 | $ | 2,346 | $ | 1,963 | |||||||||
| Loans held-for-sale | 3,498 | 3,352 | 89 | 26 | |||||||||||||
| Loans at fair value | 26,520 | 32,075 | 279 | 406 | |||||||||||||
| Loans | 702,490 | 639,097 | 2,714 | 2,395 | |||||||||||||
| Derivative receivables | 54,864 | 70,880 | 364 | 296 | |||||||||||||
Receivables from customers(a) | 47,625 | 49,257 | — | — | |||||||||||||
Total wholesale credit-related assets | 804,979 | 759,234 | 3,078 | 2,691 | |||||||||||||
Assets acquired in loan satisfactions | |||||||||||||||||
| Real estate owned | NA | NA | 154 | 74 | |||||||||||||
| Other | NA | NA | — | — | |||||||||||||
Total assets acquired in loan satisfactions | NA | NA | 154 | 74 | |||||||||||||
| Lending-related commitments | 536,786 | 471,980 | 464 | 455 | |||||||||||||
Total wholesale credit portfolio | $ | 1,341,765 | (c) | $ | 1,231,214 | $ | 3,696 | $ | 3,220 | ||||||||
Credit derivatives and credit-related notes used in credit portfolio management activities(b) | $ | (36,989) | $ | (18,143) | $ | — | $ | — | |||||||||
| Liquid securities and other cash collateral held against derivatives | (22,461) | (23,014) | NA | NA | |||||||||||||
(a)Receivables from customers reflect held-for-investment margin loans to brokerage clients in CIB, CCB and AWM; these are reported within accrued interest and accounts receivable on the Consolidated balance sheets.
(b)Represents the net notional amount of protection purchased and sold through credit derivatives and credit-related notes used to manage both performing and nonperforming wholesale credit exposures; these derivatives do not qualify for hedge accounting under U.S. GAAP. Refer to Credit derivatives on page 130 and Note 5 for additional information.
(c)Included credit exposure of $90.6 billion associated with First Republic.
120 | JPMorgan Chase & Co./2023 Form 10-K | |||||||
Wholesale credit exposure – maturity and ratings profile
The following tables present the maturity and internal risk ratings profiles of the wholesale credit portfolio as of December 31, 2023 and 2022. The Firm generally considers internal ratings with qualitative characteristics equivalent to BBB-/Baa3 or higher as investment grade, and takes into consideration collateral and structural support when determining the internal risk rating for each credit facility. Refer to Note 12 for further information on internal risk ratings.
Maturity profile(d) | Ratings profile | ||||||||||||||||||||||||||||||||||
| 1 year or less | After 1 year through 5 years | After 5 years | Total | Total | Total % of IG | ||||||||||||||||||||||||||||||
December 31, 2023 (in millions, except ratios) | Investment-grade | Noninvestment-grade | |||||||||||||||||||||||||||||||||
| Loans retained | $ | 211,104 | $ | 280,821 | $ | 180,547 | $ | 672,472 | $ | 458,838 | $ | 213,634 | $ | 672,472 | 68 | % | |||||||||||||||||||
| Derivative receivables | 54,864 | 54,864 | |||||||||||||||||||||||||||||||||
| Less: Liquid securities and other cash collateral held against derivatives | (22,461) | (22,461) | |||||||||||||||||||||||||||||||||
| Total derivative receivables, net of collateral | 8,007 | 8,970 | 15,426 | 32,403 | 24,919 | 7,484 | 32,403 | 77 | |||||||||||||||||||||||||||
| Lending-related commitments | 143,337 | 368,646 | 24,803 | 536,786 | 341,611 | 195,175 | 536,786 | 64 | |||||||||||||||||||||||||||
| Subtotal | 362,448 | 658,437 | 220,776 | 1,241,661 | 825,368 | 416,293 | 1,241,661 | 66 | |||||||||||||||||||||||||||
Loans held-for-sale and loans at fair value(a) | 30,018 | 30,018 | |||||||||||||||||||||||||||||||||
| Receivables from customers | 47,625 | 47,625 | |||||||||||||||||||||||||||||||||
| Total exposure – net of liquid securities and other cash collateral held against derivatives | $ | 1,319,304 | $ | 1,319,304 | |||||||||||||||||||||||||||||||
Credit derivatives and credit-related notes used in credit portfolio management activities(b)(c) | $ | (3,311) | $ | (28,353) | $ | (5,325) | $ | (36,989) | $ | (28,869) | $ | (8,120) | $ | (36,989) | 78 | % | |||||||||||||||||||
Maturity profile(d) | Ratings profile | |||||||||||||||||||||||||||||||||||||
| 1 year or less | After 1 year through 5 years | After 5 years | Total | Total | Total % of IG | |||||||||||||||||||||||||||||||||
| December 31, 2022 (in millions, except ratios) | Investment-grade | Noninvestment-grade | ||||||||||||||||||||||||||||||||||||
| Loans retained | $ | 204,761 | $ | 253,896 | $ | 145,013 | $ | 603,670 | $ | 425,412 | $ | 178,258 | $ | 603,670 | 70 | % | ||||||||||||||||||||||
| Derivative receivables | 70,880 | 70,880 | ||||||||||||||||||||||||||||||||||||
| Less: Liquid securities and other cash collateral held against derivatives | (23,014) | (23,014) | ||||||||||||||||||||||||||||||||||||
| Total derivative receivables, net of collateral | 13,508 | 14,880 | 19,478 | 47,866 | 36,231 | 11,635 | 47,866 | 76 | ||||||||||||||||||||||||||||||
| Lending-related commitments | 101,083 | 347,456 | 23,441 | 471,980 | 327,168 | 144,812 | 471,980 | 69 | ||||||||||||||||||||||||||||||
| Subtotal | 319,352 | 616,232 | 187,932 | 1,123,516 | 788,811 | 334,705 | 1,123,516 | 70 | ||||||||||||||||||||||||||||||
Loans held-for-sale and loans at fair value(a) | 35,427 | 35,427 | ||||||||||||||||||||||||||||||||||||
| Receivables from customers | 49,257 | 49,257 | ||||||||||||||||||||||||||||||||||||
| Total exposure – net of liquid securities and other cash collateral held against derivatives | $ | 1,208,200 | $ | 1,208,200 | ||||||||||||||||||||||||||||||||||
Credit derivatives and credit-related notes used in credit portfolio management activities(b)(c) | $ | (2,817) | $ | (13,530) | $ | (1,796) | $ | (18,143) | $ | (15,115) | $ | (3,028) | $ | (18,143) | 83 | % | ||||||||||||||||||||||
(a)Loans held-for-sale are primarily related to syndicated loans and loans transferred from the retained portfolio.
(b)These derivatives do not qualify for hedge accounting under U.S. GAAP.
(c)The notional amounts are presented on a net basis by underlying reference entity and the ratings profile shown is based on the ratings of the reference entity on which protection has been purchased. Predominantly all of the credit derivatives entered into by the Firm where it has purchased protection used in credit portfolio management activities are executed with investment-grade counterparties. In addition, the Firm obtains credit protection against certain loans in the retained loan portfolio through the issuance of credit-related notes.
(d)The maturity profile of retained loans, lending-related commitments and derivative receivables is generally based on remaining contractual maturity. Derivative contracts that are in a receivable position at December 31, 2023, may become payable prior to maturity based on their cash flow profile or changes in market conditions.
JPMorgan Chase & Co./2023 Form 10-K | 121 | |||||||
Management’s discussion and analysis
Wholesale credit exposure – industry exposures
The Firm focuses on the management and diversification of its industry exposures, and pays particular attention to industries with actual or potential credit concerns. Exposures that are deemed to be criticized align with the U.S. banking regulators’ definition of criticized exposures, which consist of the special mention, substandard and doubtful categories. Total criticized exposure, excluding loans held-for-sale and loans at fair value, was $41.4 billion at December 31, 2023 and $31.3 billion at December 31, 2022, representing approximately 3.3% and 2.7% of total wholesale credit exposure, respectively; of the $41.4 billion, $38.3 billion was performing. The increase in criticized exposure was predominantly driven by Real Estate, Technology, Media & Telecommunications (predominantly Technology) and Healthcare, reflecting downgrades.
The table below summarizes by industry the Firm’s exposures as of December 31, 2023 and 2022. The industry of risk category is generally based on the client or counterparty’s primary business activity. Refer to Note 4 for additional information on industry concentrations.
Wholesale credit exposure – industries(a) | |||||||||||||||||||||||||||||
| Selected metrics | |||||||||||||||||||||||||||||
30 days or more past due and accruing loans(i) | Net charge-offs/ (recoveries) | Credit derivative and credit-related notes(i) | Liquid securities and other cash collateral held against derivative receivables | ||||||||||||||||||||||||||
| Noninvestment-grade | |||||||||||||||||||||||||||||
Credit exposure(f)(g)(h) | Investment- grade | Noncriticized | Criticized performing | Criticized nonperforming | |||||||||||||||||||||||||
As of or for the year ended December 31, 2023 (in millions) | |||||||||||||||||||||||||||||
| Real Estate | $ | 208,261 | $ | 148,866 | $ | 50,190 | $ | 8,558 | $ | 647 | $ | 717 | $ | 275 | $ | (574) | $ | — | |||||||||||
Individuals and Individual Entities(b) | 145,849 | 110,673 | 34,261 | 334 | 581 | 861 | 10 | — | — | ||||||||||||||||||||
Asset Managers | 129,574 | 83,857 | 45,623 | 90 | 4 | 201 | 1 | — | (7,209) | ||||||||||||||||||||
| Consumer & Retail | 127,086 | 60,168 | 58,606 | 7,863 | 449 | 318 | 161 | (4,204) | — | ||||||||||||||||||||
| Technology, Media & Telecommunications | 77,296 | 40,468 | 27,094 | 9,388 | 346 | 36 | 81 | (4,287) | — | ||||||||||||||||||||
| Industrials | 75,092 | 40,951 | 30,586 | 3,419 | 136 | 213 | 31 | (2,949) | — | ||||||||||||||||||||
| Healthcare | 65,025 | 43,163 | 18,396 | 3,005 | 461 | 130 | 17 | (3,070) | — | ||||||||||||||||||||
| Banks & Finance Companies | 57,177 | 33,881 | 22,744 | 545 | 7 | 9 | 277 | (511) | (412) | ||||||||||||||||||||
| Utilities | 36,061 | 25,242 | 9,929 | 765 | 125 | 1 | (3) | (2,373) | — | ||||||||||||||||||||
State & Municipal Govt(c) | 35,986 | 33,561 | 2,390 | 27 | 8 | 31 | — | (4) | — | ||||||||||||||||||||
| Oil & Gas | 34,475 | 18,276 | 16,076 | 111 | 12 | 45 | 11 | (1,927) | (5) | ||||||||||||||||||||
| Automotive | 33,977 | 23,152 | 10,060 | 640 | 125 | 59 | — | (653) | — | ||||||||||||||||||||
| Chemicals & Plastics | 20,773 | 11,353 | 8,352 | 916 | 152 | 106 | 2 | (1,045) | — | ||||||||||||||||||||
| Insurance | 20,501 | 14,503 | 5,700 | 298 | — | 2 | — | (961) | (6,898) | ||||||||||||||||||||
| Central Govt | 17,704 | 17,264 | 312 | 127 | 1 | — | — | (3,490) | (2,085) | ||||||||||||||||||||
| Transportation | 16,060 | 8,865 | 5,943 | 1,196 | 56 | 23 | (26) | (574) | — | ||||||||||||||||||||
| Metals & Mining | 15,508 | 8,403 | 6,514 | 536 | 55 | 12 | 44 | (229) | — | ||||||||||||||||||||
| Securities Firms | 8,689 | 4,570 | 4,118 | 1 | — | — | — | (14) | (2,765) | ||||||||||||||||||||
| Financial Markets Infrastructure | 4,251 | 4,052 | 199 | — | — | — | — | — | — | ||||||||||||||||||||
All other(d) | 134,777 | 115,711 | 18,618 | 439 | 9 | 21 | (2) | (10,124) | (3,087) | ||||||||||||||||||||
| Subtotal | $ | 1,264,122 | $ | 846,979 | $ | 375,711 | $ | 38,258 | $ | 3,174 | $ | 2,785 | $ | 879 | $ | (36,989) | $ | (22,461) | |||||||||||
| Loans held-for-sale and loans at fair value | 30,018 | ||||||||||||||||||||||||||||
| Receivables from customers | 47,625 | ||||||||||||||||||||||||||||
Total(e) | $ | 1,341,765 | |||||||||||||||||||||||||||
122 | JPMorgan Chase & Co./2023 Form 10-K | |||||||
| Selected metrics | ||||||||||||||||||||||||||||||||||||||
| 30 days or more past due and accruing loans | Net charge-offs/ (recoveries) | Credit derivative and credit-related notes (i) | Liquid securities and other cash collateral held against derivative receivables | |||||||||||||||||||||||||||||||||||
| Noninvestment-grade | ||||||||||||||||||||||||||||||||||||||
Credit exposure(f)(g) | Investment- grade | Noncriticized | Criticized performing | Criticized nonperforming | ||||||||||||||||||||||||||||||||||
| As of or for the year ended December 31, 2022 (in millions) | ||||||||||||||||||||||||||||||||||||||
| Real Estate | $ | 170,857 | $ | 129,866 | $ | 36,945 | $ | 3,609 | $ | 437 | $ | 543 | $ | 19 | $ | (113) | $ | — | ||||||||||||||||||||
Individuals and Individual Entities(b) | 130,815 | 112,006 | 18,104 | 360 | 345 | 1,038 | 1 | — | — | |||||||||||||||||||||||||||||
Asset Managers | 95,656 | 78,925 | 16,665 | 61 | 5 | 15 | (1) | — | (8,278) | |||||||||||||||||||||||||||||
| Consumer & Retail | 120,555 | 60,781 | 51,871 | 7,295 | 608 | 321 | 49 | (1,157) | — | |||||||||||||||||||||||||||||
| Technology, Media & Telecommunications | 72,286 | 39,199 | 25,689 | 7,096 | 302 | 62 | 39 | (1,766) | — | |||||||||||||||||||||||||||||
| Industrials | 72,483 | 39,052 | 30,500 | 2,809 | 122 | 282 | 44 | (1,258) | — | |||||||||||||||||||||||||||||
| Healthcare | 62,613 | 43,839 | 17,117 | 1,479 | 178 | 43 | 27 | (1,055) | — | |||||||||||||||||||||||||||||
| Banks & Finance Companies | 51,816 | 27,811 | 22,994 | 961 | 50 | 36 | — | (262) | (994) | |||||||||||||||||||||||||||||
| Utilities | 36,218 | 25,981 | 9,294 | 807 | 136 | 21 | 15 | (607) | (1) | |||||||||||||||||||||||||||||
State & Municipal Govt(c) | 33,847 | 33,191 | 529 | 126 | 1 | 36 | — | (9) | (5) | |||||||||||||||||||||||||||||
| Oil & Gas | 38,668 | 20,547 | 17,616 | 474 | 31 | 57 | (6) | (414) | — | |||||||||||||||||||||||||||||
| Automotive | 33,287 | 23,908 | 8,839 | 416 | 124 | 198 | (2) | (513) | — | |||||||||||||||||||||||||||||
| Chemicals & Plastics | 20,030 | 12,134 | 7,103 | 744 | 49 | 10 | 3 | (298) | — | |||||||||||||||||||||||||||||
| Insurance | 21,045 | 15,468 | 5,396 | 181 | — | 1 | — | (273) | (7,296) | |||||||||||||||||||||||||||||
| Central Govt | 19,095 | 18,698 | 362 | 35 | — | — | 10 | (4,591) | (677) | |||||||||||||||||||||||||||||
| Transportation | 15,009 | 6,497 | 6,862 | 1,574 | 76 | 24 | 2 | (339) | — | |||||||||||||||||||||||||||||
| Metals & Mining | 15,915 | 8,825 | 6,863 | 222 | 5 | 7 | (1) | (27) | (4) | |||||||||||||||||||||||||||||
| Securities Firms | 8,066 | 4,235 | 3,716 | 115 | — | — | (13) | (26) | (2,811) | |||||||||||||||||||||||||||||
| Financial Markets Infrastructure | 4,962 | 4,525 | 437 | — | — | — | — | — | — | |||||||||||||||||||||||||||||
All other(d) | 123,307 | 105,284 | 17,555 | 223 | 245 | 4 | (5) | (5,435) | (2,948) | |||||||||||||||||||||||||||||
| Subtotal | $ | 1,146,530 | $ | 810,772 | $ | 304,457 | $ | 28,587 | $ | 2,714 | $ | 2,698 | $ | 181 | $ | (18,143) | $ | (23,014) | ||||||||||||||||||||
| Loans held-for-sale and loans at fair value | 35,427 | |||||||||||||||||||||||||||||||||||||
| Receivables from customers | 49,257 | |||||||||||||||||||||||||||||||||||||
Total(e) | $ | 1,231,214 | ||||||||||||||||||||||||||||||||||||
(a)The industry rankings presented in the table as of December 31, 2022, are based on the industry rankings of the corresponding exposures at December 31, 2023, not actual rankings of such exposures at December 31, 2022.
(b)Individuals and Individual Entities predominantly consists of Global Private Bank clients within AWM and J.P. Morgan Wealth Management within CCB, and includes exposure to personal investment companies and personal and testamentary trusts.
(c)In addition to the credit risk exposure to states and municipal governments (both U.S. and non-U.S.) at December 31, 2023 and 2022, noted above, the Firm held: $5.9 billion and $6.6 billion, respectively, of trading assets; $21.4 billion and $6.8 billion, respectively, of AFS securities; and $9.9 billion and $19.7 billion, respectively, of HTM securities, issued by U.S. state and municipal governments. Refer to Note 2 and Note 10 for further information.
(d)All other includes: SPEs and Private education and civic organizations, representing approximately 94% and 6%, respectively, at December 31, 2023 and 95% and 5%, respectively, at December 31, 2022.
(e)Excludes cash placed with banks of $614.1 billion and $556.6 billion, at December 31, 2023 and 2022, respectively, which is predominantly placed with various central banks, primarily Federal Reserve Banks.
(f)Credit exposure is net of risk participations and excludes the benefit of credit derivatives and credit-related notes used in credit portfolio management activities held against derivative receivables or loans and liquid securities and other cash collateral held against derivative receivables.
(g)Credit exposure includes held-for-sale and fair value option elected lending-related commitments.
(h)Included credit exposure of $90.6 billion associated with First Republic predominantly in Real Estate, Asset Managers, and Individuals and Individual Entities.
(i)Represents the net notional amounts of protection purchased and sold through credit derivatives and credit-related notes used to manage the credit exposures; these derivatives do not qualify for hedge accounting under U.S. GAAP. The All other category includes purchased credit protection on certain credit indices.
JPMorgan Chase & Co./2023 Form 10-K | 123 | |||||||
Management’s discussion and analysis
Presented below is additional detail on certain of the Firm’s industry exposures.
Real Estate
Real Estate exposure was $208.3 billion as of December 31, 2023. Criticized exposure increased by $5.2 billion from $4.0 billion at December 31, 2022 to $9.2 billion at December 31, 2023, predominantly driven by client-specific downgrades, partially offset by client-specific upgrades.
| December 31, 2023 | ||||||||||||||||||||||||||||||||
| (in millions, except ratios) | Loans and Lending-related Commitments | Derivative Receivables | Credit exposure | % Investment-grade | % Drawn(e) | |||||||||||||||||||||||||||
Multifamily(a) | $ | 121,946 | $ | 21 | $ | 121,967 | 79 | % | 90 | % | ||||||||||||||||||||||
| Industrial | 20,254 | 18 | 20,272 | 70 | 72 | |||||||||||||||||||||||||||
Office | 16,462 | 32 | 16,494 | 51 | 81 | |||||||||||||||||||||||||||
| Services and Non Income Producing | 16,145 | 74 | 16,219 | 62 | 46 | |||||||||||||||||||||||||||
Other Income Producing Properties(b) | 15,542 | 208 | 15,750 | 55 | 63 | |||||||||||||||||||||||||||
| Retail | 12,763 | 48 | 12,811 | 75 | 73 | |||||||||||||||||||||||||||
| Lodging | 4,729 | 19 | 4,748 | 30 | 48 | |||||||||||||||||||||||||||
Total Real Estate Exposure(c) | $ | 207,841 | $ | 420 | $ | 208,261 | (d) | 71 | % | 80 | % | |||||||||||||||||||||
| December 31, 2022 | ||||||||||||||||||||||||||||||||
| (in millions, except ratios) | Loans and Lending-related Commitments | Derivative Receivables | Credit exposure | % Investment- grade | % Drawn(e) | |||||||||||||||||||||||||||
Multifamily(a) | $ | 99,555 | $ | 17 | $ | 99,572 | 82 | % | 87 | % | ||||||||||||||||||||||
| Industrial | 15,928 | 1 | 15,929 | 72 | 71 | |||||||||||||||||||||||||||
Office | 14,917 | 25 | 14,942 | 74 | 73 | |||||||||||||||||||||||||||
| Services and Non Income Producing | 13,968 | 10 | 13,978 | 65 | 48 | |||||||||||||||||||||||||||
Other Income Producing Properties(b) | 12,701 | 150 | 12,851 | 70 | 62 | |||||||||||||||||||||||||||
| Retail | 10,192 | 8 | 10,200 | 75 | 68 | |||||||||||||||||||||||||||
| Lodging | 3,347 | 38 | 3,385 | 6 | 37 | |||||||||||||||||||||||||||
| Total Real Estate Exposure | $ | 170,608 | $ | 249 | $ | 170,857 | 76 | % | 77 | % | ||||||||||||||||||||||
(a)Multifamily exposure is largely in California.
(b)Other Income Producing Properties consists of clients with diversified property types or other property types outside of categories listed in the table above.
(c)Real Estate exposure is approximately 82% secured; unsecured exposure is predominantly investment-grade largely to Real Estate Investment Trusts (“REITs”) and Real Estate Operating Companies (“REOCs”) whose underlying assets are generally diversified.
(d)Included $33.4 billion of credit exposure associated with First Republic, largely in Multifamily.
(e)Represents drawn exposure as a percentage of credit exposure.
124 | JPMorgan Chase & Co./2023 Form 10-K | |||||||
Consumer & Retail
Consumer & Retail exposure was $127.1 billion as of December 31, 2023. Criticized exposure increased by $409 million from $7.9 billion at December 31, 2022 to $8.3 billion at December 31, 2023, driven by client-specific downgrades predominantly offset by client-specific upgrades and net portfolio activity.
| December 31, 2023 | ||||||||||||||||||||||||||||||||
| (in millions, except ratios) | Loans and Lending-related Commitments | Derivative Receivables | Credit exposure | % Investment-grade | % Drawn(d) | |||||||||||||||||||||||||||
Retail(a) | $ | 36,042 | $ | 334 | $ | 36,376 | 51 | % | 30 | % | ||||||||||||||||||||||
| Business and Consumer Services | 34,822 | 392 | 35,214 | 42 | 42 | |||||||||||||||||||||||||||
| Food and Beverage | 32,256 | 930 | 33,186 | 57 | 36 | |||||||||||||||||||||||||||
| Consumer Hard Goods | 13,169 | 197 | 13,366 | 43 | 33 | |||||||||||||||||||||||||||
Leisure(b) | 8,784 | 160 | 8,944 | 25 | 47 | |||||||||||||||||||||||||||
Total Consumer & Retail(c) | $ | 125,073 | $ | 2,013 | $ | 127,086 | 47 | % | 36 | % | ||||||||||||||||||||||
| December 31, 2022 | ||||||||||||||||||||||||||||||||
| (in millions, except ratios) | Loans and Lending-related Commitments | Derivative Receivables | Credit exposure | % Investment- grade | % Drawn(d) | |||||||||||||||||||||||||||
Retail(a) | $ | 33,891 | $ | 309 | $ | 34,200 | 50 | % | 33 | % | ||||||||||||||||||||||
| Business and Consumer Services | 31,256 | 384 | 31,640 | 50 | 40 | |||||||||||||||||||||||||||
| Food and Beverage | 31,706 | 736 | 32,442 | 59 | 39 | |||||||||||||||||||||||||||
| Consumer Hard Goods | 13,879 | 172 | 14,051 | 51 | 39 | |||||||||||||||||||||||||||
Leisure(b) | 8,173 | 49 | 8,222 | 21 | 45 | |||||||||||||||||||||||||||
Total Consumer & Retail | $ | 118,905 | $ | 1,650 | $ | 120,555 | 50 | % | 38 | % | ||||||||||||||||||||||
(a)Retail consists of Home Improvement & Specialty Retailers, Restaurants, Supermarkets, Discount & Drug Stores, Specialty Apparel and Department Stores.
(b)Leisure consists of Gaming, Arts & Culture, Travel Services and Sports & Recreation. As of December 31, 2023, approximately 90% of the noninvestment-grade Leisure portfolio is secured.
(c)Consumer & Retail exposure is approximately 59% secured; unsecured exposure is approximately 79% investment-grade.
(d)Represents drawn exposure as a percent of credit exposure.
Oil & Gas
Oil & Gas exposure was $34.5 billion as of December 31, 2023 of which $123 million was considered criticized.
| December 31, 2023 | ||||||||||||||||||||||||||||||||
| (in millions, except ratios) | Loans and Lending-related Commitments | Derivative Receivables | Credit exposure | % Investment-grade | % Drawn(c) | |||||||||||||||||||||||||||
| Exploration & Production ("E&P") and Oil field Services | $ | 18,121 | $ | 536 | $ | 18,657 | 51 | % | 26 | % | ||||||||||||||||||||||
Other Oil & Gas(a) | 15,649 | 169 | 15,818 | 55 | 22 | |||||||||||||||||||||||||||
Total Oil & Gas(b) | $ | 33,770 | $ | 705 | $ | 34,475 | 53 | % | 25 | % | ||||||||||||||||||||||
| December 31, 2022 | ||||||||||||||||||||||||||||||||
| (in millions, except ratios) | Loans and Lending-related Commitments | Derivative Receivables | Credit exposure | % Investment- grade | % Drawn(c) | |||||||||||||||||||||||||||
| Exploration & Production ("E&P") and Oil field Services | $ | 17,729 | $ | 4,666 | $ | 22,395 | 50 | % | 25 | % | ||||||||||||||||||||||
Other Oil & Gas(a) | 15,818 | 455 | 16,273 | 57 | 25 | |||||||||||||||||||||||||||
| Total Oil & Gas | $ | 33,547 | $ | 5,121 | $ | 38,668 | 53 | % | 25 | % | ||||||||||||||||||||||
(a)Other Oil & Gas includes Integrated Oil & Gas companies, Midstream/Oil Pipeline companies and refineries.
(b)Oil & Gas exposure is approximately 35% secured, approximately half of which is reserve-based lending to the Exploration & Production sub-sector; unsecured exposure is approximately 61% investment-grade.
(c)Represents drawn exposure as a percent of credit exposure.
JPMorgan Chase & Co./2023 Form 10-K | 125 | |||||||
Management’s discussion and analysis
Loans
In its wholesale businesses, the Firm provides loans to a variety of clients, ranging from large corporate and institutional clients to high-net-worth individuals. Refer to Note 12 for a further discussion on loans, including information about delinquencies, loan modifications and other credit quality indicators.
The following table presents the change in the nonaccrual loan portfolio for the years ended December 31, 2023 and 2022. Since December 31, 2022, nonaccrual loan exposure increased by $319 million driven by retained loans in Real Estate and Healthcare, reflecting downgrades, and Individuals largely driven by the impact of First Republic, partially offset by a single name upgrade in Civic Organizations.
| Wholesale nonaccrual loan activity | |||||||||||
| Year ended December 31, (in millions) | 2023 | 2022 | |||||||||
| Beginning balance | $ | 2,395 | $ | 2,445 | |||||||
| Additions | 3,543 | 2,119 | |||||||||
| Reductions: | |||||||||||
| Paydowns and other | 1,336 | 1,329 | |||||||||
| Gross charge-offs | 965 | 213 | |||||||||
| Returned to performing status | 616 | 594 | |||||||||
| Sales | 307 | 33 | |||||||||
| Total reductions | 3,224 | 2,169 | |||||||||
| Net changes | 319 | (50) | |||||||||
| Ending balance | $ | 2,714 | $ | 2,395 | |||||||
The following table presents net charge-offs/recoveries, which are defined as gross charge-offs less recoveries, for the years ended December 31, 2023 and 2022. The amounts in the table below do not include gains or losses from sales of nonaccrual loans recognized in noninterest revenue.
| Wholesale net charge-offs/(recoveries) | ||||||||
| Year ended December 31, (in millions, except ratios) | 2023 | 2022 | ||||||
| Loans | ||||||||
| Average loans retained | $ | 646,875 | $ | 582,021 | ||||
| Gross charge-offs | 1,011 | 322 | ||||||
| Gross recoveries collected | (132) | (141) | ||||||
| Net charge-offs/(recoveries) | 879 | 181 | ||||||
| Net charge-off/(recovery) rate | 0.14 | % | 0.03 | % | ||||
Modified wholesale loans
The amortized cost of wholesale FDMs was $2.1 billion for the year ended December 31, 2023. Refer to Note 1 and Note 12 for further information.
Wholesale TDRs were $801 million for the year ended December 31, 2022.
As a result of the elimination of the requirement to assess whether a modification is reasonably expected or involves a concession, the population of loans considered FDMs is greater than the population previously considered TDRs. Refer to Note 12 for further information on TDRs in prior periods.
126 | JPMorgan Chase & Co./2023 Form 10-K | |||||||
Maturities and sensitivity to changes in interest rates
The table below sets forth wholesale loan maturities and the distribution between fixed and floating interest rates based on the stated terms of the loan agreements by loan class. Refer to Note 12 for further information on loan classes.
December 31, 2023 (in millions, except ratios) | 1 year or less(g) | After 1 year through 5 years | After 5 years through 15 years | After 15 years | Total | ||||||||||||||||||||||||
| Wholesale loans: | |||||||||||||||||||||||||||||
Secured by real estate(a) | $ | 16,144 | $ | 61,764 | $ | 48,972 | $ | 42,417 | $ | 169,297 | |||||||||||||||||||
| Commercial and industrial | 52,351 | 112,339 | 8,469 | 35 | 173,194 | ||||||||||||||||||||||||
Other(b) | 173,752 | 141,760 | 38,558 | 5,929 | 359,999 | ||||||||||||||||||||||||
| Total wholesale loans | $ | 242,247 | $ | 315,863 | $ | 95,999 | $ | 48,381 | $ | 702,490 | |||||||||||||||||||
| Loans due after one year at fixed interest rates | |||||||||||||||||||||||||||||
Secured by real estate(c) | $ | 15,871 | $ | 11,185 | $ | 720 | |||||||||||||||||||||||
| Commercial and industrial | 5,004 | 1,376 | 34 | ||||||||||||||||||||||||||
| Other | 25,264 | 17,656 | 3,910 | ||||||||||||||||||||||||||
Loans due after one year at variable interest rates(d) | |||||||||||||||||||||||||||||
Secured by real estate(e) | $ | 45,893 | $ | 37,787 | $ | 41,696 | |||||||||||||||||||||||
| Commercial and industrial | 107,334 | 7,093 | 2 | ||||||||||||||||||||||||||
Other(f) | 116,497 | 20,902 | 2,019 | ||||||||||||||||||||||||||
| Total wholesale loans | $ | 315,863 | $ | 95,999 | $ | 48,381 | |||||||||||||||||||||||
(a)Included $6.6 billion, $16.9 billion, and $9.7 billion of loans in 1 year or less, after 1 year through 5 years, and after 5 years though 15, respectively, associated with First Republic.
(b)Included $9.8 billion, and $4.1 billion of loans in 1 year or less, and after 1 year through 5 years, respectively, associated with First Republic.
(c)Included $9.7 billion, and $5.7 billion in after 1 year through 5 years, and after 5 years though 15, respectively, associated with First Republic.
(d)Includes loans that have an initial fixed interest rate that resets to a variable rate as the variable rate will be the prevailing rate over the life of the loan.
(e)Included $7.1 billion, and $4.0 billion in after 1 year through 5 years, and after 5 years though 15, respectively, associated with First Republic.
(f)Included $3.0 billion in after 1 year through 5 years associated with First Republic.
(g)Includes loans held-for-sale, demand loans and overdrafts.
The following table presents net charge-offs/recoveries, average retained loans and net charge-off/recovery rate by loan class for the year ended December 31, 2023 and 2022.
| Year ended December 31, | |||||||||||||||||||||||||||||||||||
| Secured by real estate | Commercial and industrial | Other | Total | ||||||||||||||||||||||||||||||||
(in millions, except ratios) | 2023 | 2022 | 2023 | 2022 | 2023 | 2022 | 2023 | 2022 | |||||||||||||||||||||||||||
| Net charge-offs/(recoveries) | $ | 178 | $ | 6 | $ | 370 | $ | 145 | $ | 331 | $ | 30 | $ | 879 | $ | 181 | |||||||||||||||||||
| Average retained loans | 151,214 | 122,904 | 170,503 | 160,611 | 325,158 | 298,506 | 646,875 | 582,021 | |||||||||||||||||||||||||||
| Net charge-off/(recovery) rate | 0.12 | % | — | % | 0.22 | % | 0.09 | % | 0.10 | % | 0.01 | % | 0.14 | % | 0.03 | % | |||||||||||||||||||
JPMorgan Chase & Co./2023 Form 10-K | 127 | |||||||
Management’s discussion and analysis
Lending-related commitments
The Firm uses lending-related financial instruments, such as commitments (including revolving credit facilities) and guarantees, to address the financing needs of its clients. The contractual amounts of these financial instruments represent the maximum possible credit risk should the clients draw down on these commitments or when the Firm fulfills its obligations under these guarantees, and the clients subsequently fail to perform according to the terms of these contracts. Most of these commitments and guarantees have historically been refinanced, extended, cancelled, or expired without being drawn upon or a default occurring. As a result, the Firm does not believe that the total contractual amount of these wholesale lending-related commitments is representative of the Firm’s expected future credit exposure or funding requirements. Refer to Note 28 for further information on wholesale lending-related commitments.
Receivables from customers
Receivables from customers reflect held-for-investment margin loans to brokerage clients in CIB, CCB and AWM that are collateralized by assets maintained in the clients’ brokerage accounts (including cash on deposit, and primarily liquid and readily marketable debt or equity securities). To manage its credit risk, the Firm establishes margin requirements and monitors the required margin levels on an ongoing basis, and requires clients to deposit additional cash or other collateral, or to reduce positions, when appropriate. Credit risk arising from lending activities subject to collateral maintenance requirements is generally mitigated by factors such as the short-term nature of the activity, the fair value of collateral held and the Firm’s right to call for, and the borrower’s obligation to provide, additional margin when the fair value of the collateral declines. Because of these mitigating factors, these receivables generally do not require an allowance for credit losses. However, if in management’s judgment, an allowance for credit losses is required, the Firm estimates expected credit losses based on the value of the collateral and probability of borrower default. These receivables are reported within accrued interest and accounts receivable on the Firm’s Consolidated balance sheets.
Refer to Note 13 for further information on the Firm’s accounting policies for the allowance for credit losses.
Derivative contracts
Derivatives enable clients and counterparties to manage risk, including credit risk and risks arising from fluctuations in interest rates, foreign exchange and equities and commodities prices. The Firm makes markets in derivatives in order to meet these needs and uses derivatives to manage certain risks associated with net open risk positions from its market-making activities, including the counterparty credit risk arising from derivative receivables. The Firm also uses derivative instruments to manage its own credit risk and other market risk exposure. The nature of the counterparty and the settlement mechanism of the derivative affect the credit risk to which the Firm is exposed. For OTC derivatives, the Firm is exposed to the credit risk of the derivative counterparty. For exchange-traded derivatives (“ETD”), such as futures and options, and cleared over-the-counter (“OTC-cleared”) derivatives, the Firm can also be exposed to the
credit risk of the relevant CCP. Where possible, the Firm seeks to mitigate its credit risk exposures arising from derivative contracts through the use of legally enforceable master netting arrangements and collateral agreements. The percentage of the Firm’s OTC derivative transactions subject to collateral agreements — excluding foreign exchange spot trades, which are not typically covered by collateral agreements due to their short maturity and centrally cleared trades that are settled daily — was approximately 87% at both December 31, 2023 and 2022. Refer to Note 5 for additional information on the Firm’s use of collateral agreements and further discussion of derivative contracts, counterparties and settlement types.
The fair value of derivative receivables reported on the Consolidated balance sheets was $54.9 billion and $70.9 billion at December 31, 2023 and 2022, respectively. The decrease was primarily as a result of market movements. Derivative receivables represent the fair value of the derivative contracts after giving effect to legally enforceable master netting agreements and the related cash collateral held by the Firm.
In addition, the Firm holds liquid securities and other cash collateral that may be used as security when the fair value of the client’s exposure is in the Firm’s favor. For these purposes, the definition of liquid securities is consistent with the definition of high quality liquid assets as defined in the LCR rule.
In management’s view, the appropriate measure of current credit risk should also take into consideration other collateral, which generally represents securities that do not qualify as high quality liquid assets under the LCR rule. The benefits of these additional collateral amounts for each counterparty are subject to a legally enforceable master netting agreement and limited to the net amount of the derivative receivables for each counterparty.
The Firm also holds additional collateral (primarily cash, G7 government securities, other liquid government agency and guaranteed securities, and corporate debt and equity securities) delivered by clients at the initiation of transactions, as well as collateral related to contracts that have a non-daily call frequency and collateral that the Firm has agreed to return but has not yet settled as of the reporting date. Although this collateral does not reduce the receivables balances and is not included in the tables below, it is available as security against potential exposure that could arise should the fair value of the client’s derivative contracts move in the Firm’s favor. Refer to Note 5 for additional information on the Firm’s use of collateral agreements for derivative transactions.
128 | JPMorgan Chase & Co./2023 Form 10-K | |||||||
The following tables summarize the net derivative receivables and the internal ratings profile for the periods presented.
| Derivative receivables | ||||||||
| December 31, (in millions) | 2023 | 2022 | ||||||
| Total, net of cash collateral | $ | 54,864 | $ | 70,880 | ||||
| Liquid securities and other cash collateral held against derivative receivables | (22,461) | (23,014) | ||||||
| Total, net of liquid securities and other cash collateral | $ | 32,403 | $ | 47,866 | ||||
| Other collateral held against derivative receivables | (993) | (1,261) | ||||||
| Total, net of collateral | $ | 31,410 | $ | 46,605 | ||||
| Ratings profile of derivative receivables | ||||||||||||||||||||
2023 | 2022 | |||||||||||||||||||
| December 31, (in millions, except ratios) | Exposure net of collateral | % of exposure net of collateral | Exposure net of collateral | % of exposure net of collateral | ||||||||||||||||
| Investment-grade | $ | 24,004 | 76 | % | $ | 35,097 | 75 | % | ||||||||||||
| Noninvestment-grade | 7,406 | 24 | 11,508 | 25 | ||||||||||||||||
| Total | $ | 31,410 | 100 | % | $ | 46,605 | 100 | % | ||||||||||||
While useful as a current view of credit exposure, the net fair value of the derivative receivables does not capture the potential future variability of that credit exposure. To capture this variability, the Firm calculates, on a client-by-client basis, three measures of potential derivatives-related credit loss: Peak, Derivative Risk Equivalent (“DRE”), and Average exposure (“AVG”). These measures all incorporate netting and collateral benefits, where applicable.
Peak represents a conservative measure of potential derivative exposure, including the benefit of collateral, to a counterparty calculated in a manner that is broadly equivalent to a 97.5% confidence level over the life of the transaction. Peak is the primary measure used by the Firm for setting credit limits for derivative contracts, senior management reporting and derivatives exposure management.
DRE exposure is a measure that expresses the risk of derivative exposure, including the benefit of collateral, on a basis intended to be equivalent to the risk of loan exposures. DRE is a less extreme measure of potential credit loss than Peak and is used as an input for aggregating derivative credit risk exposures with loans and other credit risk.
Finally, AVG is a measure of the expected fair value of the Firm’s derivative exposures, including the benefit of collateral, at future time periods. AVG over the total life of the derivative contract is used as the primary metric for pricing purposes and is used to calculate credit risk capital and CVA, as further described below.
The fair value of the Firm’s derivative receivables incorporates CVA to reflect the credit quality of counterparties. CVA is based on the Firm’s AVG to a counterparty and the counterparty’s credit spread in the credit derivatives market. The Firm believes that active risk management is essential to controlling the dynamic credit risk in the derivatives portfolio. In addition, the Firm’s risk management process for derivatives exposures takes into consideration the potential impact of wrong-way risk, which
is broadly defined as the risk that exposure to a counterparty is positively correlated with the impact of a default by the same counterparty, which could cause exposure to increase at the same time as the counterparty’s capacity to meet its obligations is decreasing. Many factors may influence the nature and magnitude of these correlations over time. To the extent that these correlations are identified, the Firm may adjust the CVA associated with a particular counterparty’s AVG. The Firm risk manages exposure to changes in CVA by entering into credit derivative contracts, as well as interest rate, foreign exchange, equity and commodity derivative contracts.
The below graph shows exposure profiles to the Firm’s current derivatives portfolio over the next 10 years as calculated by the Peak, DRE and AVG metrics. The three measures generally show that exposure will decline after the first year, if no new trades are added to the portfolio.
Exposure profile of derivatives measures
December 31, 2023
(in billions)
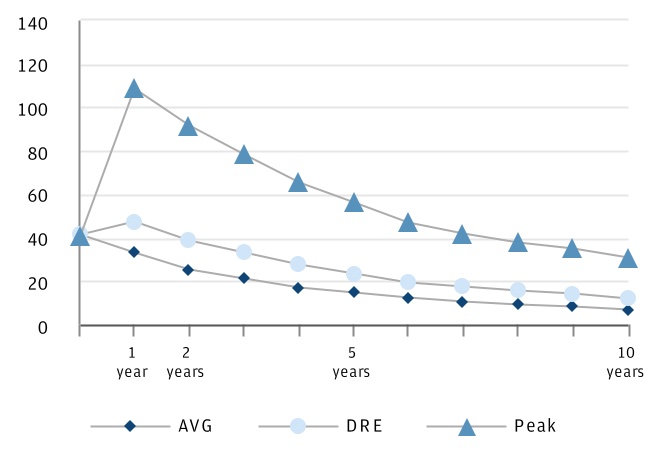
JPMorgan Chase & Co./2023 Form 10-K | 129 | |||||||
Management’s discussion and analysis
Credit derivatives
The Firm uses credit derivatives for two primary purposes: first, in its capacity as a market-maker, and second, as an end-user to manage the Firm’s own credit risk associated with various exposures.
Credit portfolio management activities
Included in the Firm’s end-user activities are credit derivatives used to mitigate the credit risk associated with traditional lending activities (loans and lending-related commitments) and derivatives counterparty exposure in the Firm’s wholesale businesses (collectively, “credit portfolio management activities”). Information on credit portfolio management activities is provided in the table below.
The Firm also uses credit derivatives as an end-user to manage other exposures, including credit risk arising from certain securities held in the Firm’s market-making businesses. These credit derivatives are not included in credit portfolio management activities.
| Credit derivatives and credit-related notes used in credit portfolio management activities | ||||||||||||||
Notional amount of protection purchased and sold(a) | ||||||||||||||
| December 31, (in millions) | 2023 | 2022 | ||||||||||||
| Credit derivatives and credit-related notes used to manage: | ||||||||||||||
| Loans and lending-related commitments | $ | 24,157 | $ | 6,422 | ||||||||||
| Derivative receivables | 12,832 | 11,721 | ||||||||||||
| Credit derivatives and credit-related notes used in credit portfolio management activities | $ | 36,989 | $ | 18,143 | ||||||||||
(a)Amounts are presented net, considering the Firm’s net protection purchased or sold with respect to each underlying reference entity or index.
The credit derivatives used in credit portfolio management activities do not qualify for hedge accounting under U.S. GAAP; these derivatives are reported at fair value, with gains and losses recognized in principal transactions revenue. In contrast, the loans and lending-related commitments being risk-managed are accounted for on an accrual basis. This asymmetry in accounting treatment, between loans and lending-related commitments and the credit derivatives used in credit portfolio management activities, causes earnings volatility that is not representative, in the Firm’s view, of the true changes in value of the Firm’s overall credit exposure.
The effectiveness of credit default swaps (“CDS”) as a hedge against the Firm’s exposures may vary depending on a number of factors, including the named reference entity (i.e., the Firm may experience losses on specific exposures that are different than the named reference entities in the purchased CDS); the contractual terms of the CDS (which may have a defined credit event that does not align with an actual loss realized by the Firm); and the maturity of the Firm’s CDS protection (which in some cases may be shorter than the Firm’s exposures). However, the Firm generally seeks to purchase credit protection with a maturity date that is the same or similar to the maturity date of the exposure for which the protection was purchased, and remaining differences in maturity are actively monitored and managed by the Firm. Refer to Credit derivatives in Note 5 for further information on credit derivatives and derivatives used in credit portfolio management activities.
130 | JPMorgan Chase & Co./2023 Form 10-K | |||||||
| ALLOWANCE FOR CREDIT LOSSES | ||||||||||||||
The Firm’s allowance for credit losses represents management's estimate of expected credit losses over the remaining expected life of the Firm's financial assets measured at amortized cost and certain off-balance sheet lending-related commitments. The Firm’s allowance for credit losses generally consists of:
•the allowance for loan losses, which covers the Firm’s retained loan portfolios (scored and risk-rated) and is presented separately on the Consolidated balance sheets,
•the allowance for lending-related commitments, which is reflected in accounts payable and other liabilities on the Consolidated balance sheets, and
•the allowance for credit losses on investment securities, which is reflected in investment securities on the Consolidated balance sheets.
Discussion of changes in the allowance
The allowance for credit losses as of December 31, 2023 was $24.8 billion, reflecting a net addition of $3.1 billion from December 31, 2022.
The net addition to the allowance for credit losses included $1.9 billion, consisting of:
•$1.3 billion in consumer, predominantly driven by CCB, comprised of $1.4 billion in Card Services, partially offset by a net reduction of $200 million in Home Lending. The net addition in Card Services was driven by loan growth, including an increase in revolving balances, partially offset by reduced borrower uncertainty. The net reduction in Home Lending was driven by improvements in the outlook for home prices, and
•$675 million in wholesale, driven by net downgrade activity, the net effect of changes in the Firm’s weighted average macroeconomic outlook, including deterioration in the outlook for commercial real estate in CB, and an addition for certain accounts receivable in CIB, partially offset by the impact of changes in the loan and lending-related commitment portfolios.
The net addition also included $1.2 billion to establish the allowance for the First Republic loans and lending-related commitments in the second quarter of 2023.
The changes in the Firm's weighted average macroeconomic outlook also included updates to the central scenario in the third quarter of 2023 to reflect a lower forecasted unemployment rate consistent with a higher growth rate in GDP, and the impact of the additional weight placed on the adverse scenarios in the first quarter of 2023, reflecting elevated recession risks due to high inflation and tightening financial conditions.
The allowance for credit losses also reflected a reduction of $587 million as a result of the adoption of changes to the TDR accounting guidance on January 1, 2023. Refer to Note 1 for further information.
The Firm's allowance for credit losses is estimated using a weighted average of five internally developed macroeconomic scenarios. The adverse scenarios incorporate more punitive macroeconomic factors than the central case assumptions provided in the table below, resulting in a weighted average U.S. unemployment rate peaking at 5.5% in the fourth quarter of 2024, and a weighted average U.S. real GDP level that is 1.5% lower than the central case at the end of the second quarter of 2025.
The following table presents the Firm’s central case assumptions for the periods presented:
| Central case assumptions at December 31, 2023 | |||||||||||
| 2Q24 | 4Q24 | 2Q25 | |||||||||
U.S. unemployment rate(a) | 4.1 | % | 4.4 | % | 4.1 | % | |||||
YoY growth in U.S. real GDP(b) | 1.8 | % | 0.7 | % | 1.0 | % | |||||
| Central case assumptions at December 31, 2022 | |||||||||||
| 2Q23 | 4Q23 | 2Q24 | |||||||||
U.S. unemployment rate(a) | 3.8 | % | 4.3 | % | 5.0 | % | |||||
YoY growth in U.S. real GDP(b) | 1.5 | % | 0.4 | % | — | % | |||||
(a)Reflects quarterly average of forecasted U.S. unemployment rate.
(b)The year over year growth in U.S. real GDP in the forecast horizon of the central scenario is calculated as the percentage change in U.S. real GDP levels from the prior year.
Subsequent changes to this forecast and related estimates
will be reflected in the provision for credit losses in future
periods.
Refer to Critical Accounting Estimates Used by the Firm on pages 155–158 for further information on the allowance for credit losses and related management judgments.
Refer to Consumer Credit Portfolio on pages 114–119, Wholesale Credit Portfolio on pages 120–130 for additional information on the consumer and wholesale credit portfolios.
JPMorgan Chase & Co./2023 Form 10-K | 131 | |||||||
Management’s discussion and analysis
| Allowance for credit losses and related information | |||||||||||||||||||||||||||||
| 2023 | 2022 | ||||||||||||||||||||||||||||
| Year ended December 31, | Consumer, excluding credit card | Credit card | Wholesale | Total | Consumer, excluding credit card | Credit card | Wholesale | Total | |||||||||||||||||||||
| (in millions, except ratios) | |||||||||||||||||||||||||||||
| Allowance for loan losses | |||||||||||||||||||||||||||||
| Beginning balance at January 1, | $ | 2,040 | $ | 11,200 | $ | 6,486 | $ | 19,726 | $ | 1,765 | $ | 10,250 | $ | 4,371 | $ | 16,386 | |||||||||||||
Cumulative effect of a change in accounting principle(a) | (489) | (100) | 2 | (587) | NA | NA | NA | NA | |||||||||||||||||||||
| Gross charge-offs | 1,151 | 5,491 | 1,011 | 7,653 | 812 | 3,192 | 322 | 4,326 | |||||||||||||||||||||
| Gross recoveries collected | (519) | (793) | (132) | (1,444) | (543) | (789) | (141) | (1,473) | |||||||||||||||||||||
| Net charge-offs | 632 | 4,698 | 879 | 6,209 | 269 | 2,403 | 181 | 2,853 | |||||||||||||||||||||
| Provision for loan losses | 936 | 6,048 | 2,484 | 9,468 | 543 | 3,353 | 2,293 | 6,189 | |||||||||||||||||||||
| Other | 1 | — | 21 | 22 | 1 | — | 3 | 4 | |||||||||||||||||||||
| Ending balance at December 31, | $ | 1,856 | $ | 12,450 | $ | 8,114 | $ | 22,420 | $ | 2,040 | $ | 11,200 | $ | 6,486 | $ | 19,726 | |||||||||||||
Allowance for lending-related commitments | |||||||||||||||||||||||||||||
| Beginning balance at January 1, | $ | 76 | $ | — | $ | 2,306 | $ | 2,382 | $ | 113 | $ | — | $ | 2,148 | $ | 2,261 | |||||||||||||
Provision for lending-related commitments | (1) | — | (407) | (408) | (37) | — | 157 | 120 | |||||||||||||||||||||
| Other | — | — | — | — | — | — | 1 | 1 | |||||||||||||||||||||
| Ending balance at December 31, | $ | 75 | $ | — | $ | 1,899 | $ | 1,974 | $ | 76 | $ | — | $ | 2,306 | $ | 2,382 | |||||||||||||
| Impairment methodology | |||||||||||||||||||||||||||||
Asset-specific(b) | $ | (876) | $ | — | $ | 392 | $ | (484) | $ | (624) | $ | 223 | $ | 467 | $ | 66 | |||||||||||||
| Portfolio-based | 2,732 | 12,450 | 7,722 | 22,904 | 2,664 | 10,977 | 6,019 | 19,660 | |||||||||||||||||||||
| Total allowance for loan losses | $ | 1,856 | $ | 12,450 | $ | 8,114 | $ | 22,420 | $ | 2,040 | $ | 11,200 | $ | 6,486 | $ | 19,726 | |||||||||||||
| Impairment methodology | |||||||||||||||||||||||||||||
| Asset-specific | $ | — | $ | — | $ | 89 | $ | 89 | $ | — | $ | — | $ | 90 | $ | 90 | |||||||||||||
| Portfolio-based | 75 | — | 1,810 | 1,885 | 76 | — | 2,216 | 2,292 | |||||||||||||||||||||
| Total allowance for lending-related commitments | $ | 75 | $ | — | $ | 1,899 | $ | 1,974 | $ | 76 | $ | — | $ | 2,306 | $ | 2,382 | |||||||||||||
| Total allowance for investment securities | NA | NA | NA | $ | 128 | NA | NA | NA | $ | 96 | |||||||||||||||||||
Total allowance for credit losses(c)(d) | $ | 1,931 | $ | 12,450 | $ | 10,013 | $ | 24,522 | $ | 2,116 | $ | 11,200 | $ | 8,792 | $ | 22,204 | |||||||||||||
| Memo: | |||||||||||||||||||||||||||||
Retained loans, end of period | $ | 397,275 | $ | 211,123 | $ | 672,472 | $ | 1,280,870 | $ | 300,753 | $ | 185,175 | $ | 603,670 | $ | 1,089,598 | |||||||||||||
Retained loans, average | 364,061 | 191,412 | 646,875 | 1,202,348 | 299,409 | 163,335 | 582,021 | 1,044,765 | |||||||||||||||||||||
| Credit ratios | |||||||||||||||||||||||||||||
Allowance for loan losses to retained loans | 0.47 | % | 5.90 | % | 1.21 | % | 1.75 | % | 0.68 | % | 6.05 | % | 1.07 | % | 1.81 | % | |||||||||||||
Allowance for loan losses to retained nonaccrual loans(e) | 51 | NA | 346 | 374 | 53 | NM | 330 | 338 | |||||||||||||||||||||
Allowance for loan losses to retained nonaccrual loans excluding credit card | 51 | NA | 346 | 166 | 53 | NM | 330 | 146 | |||||||||||||||||||||
| Net charge-off rates | 0.17 | 2.45 | 0.14 | 0.52 | 0.09 | 1.47 | 0.03 | 0.27 | |||||||||||||||||||||
(a)Represents the impact to the allowance for loan losses upon the adoption of changes to the TDR accounting guidance on January 1, 2023. Refer to Note 1 for further information.
(b)Includes collateral-dependent loans, including those for which foreclosure is deemed probable, and nonaccrual risk-rated loans for all periods presented. Prior periods also include non collateral-dependent TDRs or reasonably expected TDRs and modified PCD loans.
(c)At December 31, 2023 and 2022, in addition to the allowance for credit losses in the table above, the Firm also had an allowance for credit losses of $243 million and $21 million, respectively, associated with certain accounts receivable in CIB.
(d)As of December 31, 2023, included the allowance for credit losses associated with First Republic.
(e)The Firm’s policy is generally to exempt credit card loans from being placed on nonaccrual status as permitted by regulatory guidance.
132 | JPMorgan Chase & Co./2023 Form 10-K | |||||||
Allocation of allowance for loan losses
The table below presents a breakdown of the allowance for loan losses by loan class. Refer to Note 12 for further information on loan classes.
| 2023 | 2022 | ||||||||||||||||
| December 31, (in millions, except ratios) | Allowance for loan losses | Percent of retained loans to total retained loans | Allowance for loan losses | Percent of retained loans to total retained loans | |||||||||||||
| Residential real estate | $ | 817 | 25 | % | $ | 1,070 | 22 | % | |||||||||
| Auto and other | 1,039 | 6 | 970 | 6 | |||||||||||||
| Consumer, excluding credit card | 1,856 | 31 | 2,040 | 28 | |||||||||||||
| Credit card | 12,450 | 16 | 11,200 | 17 | |||||||||||||
| Total consumer | 14,306 | 47 | 13,240 | 45 | |||||||||||||
| Secured by real estate | 2,997 | 13 | 1,782 | 12 | |||||||||||||
| Commercial and industrial | 3,519 | 13 | 3,507 | 15 | |||||||||||||
| Other | 1,598 | 27 | 1,197 | 28 | |||||||||||||
| Total wholesale | 8,114 | 53 | 6,486 | 55 | |||||||||||||
Total(a) | $ | 22,420 | 100 | % | $ | 19,726 | 100 | % | |||||||||
(a) As of December 31, 2023, included the allowance for loan losses associated with First Republic.
JPMorgan Chase & Co./2023 Form 10-K | 133 | |||||||
Management’s discussion and analysis
| INVESTMENT PORTFOLIO RISK MANAGEMENT | ||||||||||||||
Investment portfolio risk is the risk associated with the loss of principal or a reduction in expected returns on investments arising from the investment securities portfolio or from principal investments. The investment securities portfolio is predominantly held by Treasury and CIO in connection with the Firm's balance sheet and asset-liability management objectives. Principal investments are predominantly privately-held financial instruments and are managed in the LOBs and Corporate. Investments are typically intended to be held over extended periods and, accordingly, the Firm has no expectation for short-term realized gains with respect to these investments.
Investment securities risk
Investment securities risk includes the exposure associated with a default in the payment of principal and interest. This risk is mitigated given that the investment securities portfolio held by Treasury and CIO predominantly consists of high-quality securities. At December 31, 2023, the Treasury and CIO investment securities portfolio, net of the allowance for credit losses, was $569.2 billion, and the average credit rating of the securities comprising the portfolio was AA+ (based upon external ratings where available, and where not available, based primarily upon internal risk ratings). Refer to Corporate segment results on pages 84–85 and Note 10 for further information on the investment securities portfolio and internal risk ratings. Refer to Liquidity Risk Management on pages 102–109 for further information on related liquidity risk. Refer to Market Risk Management on pages 135–143 for further information on the market risk inherent in the portfolio.
Governance and oversight
Investment securities risks are governed by the Firm’s Risk Appetite framework, and reviewed at the CTC Risk Committee with regular updates provided to the Board Risk Committee.
The Firm’s independent control functions are responsible for reviewing the appropriateness of the carrying value of investment securities in accordance with relevant policies. Approved levels for investment securities are established for each risk category, including capital and credit risks.
Principal investment risk
Principal investments are typically privately-held financial instruments representing ownership interests or other forms of junior capital. In general, principal investments include tax-oriented investments and investments made to enhance or accelerate the Firm’s business strategies and exclude those that are consolidated on the Firm's balance sheets. These investments are made by dedicated investing businesses or as part of a broader business strategy. The Firm’s principal investments are managed by the LOBs and Corporate and are reflected within their respective financial results. The Firm’s investments will continue to evolve based on market circumstances and in line with its strategic initiatives, including the Firm’s environmental and social goals.
The table below presents the aggregate carrying values of the principal investment portfolios as of December 31, 2023 and 2022.
| (in billions) | December 31, 2023 | December 31, 2022 | |||||||||
Tax-oriented investments, primarily in alternative energy and affordable housing(a) | $ | 28.8 | $ | 26.2 | |||||||
Private equity, various debt and equity instruments, and real assets | 10.5 | 10.8 | |||||||||
| Total carrying value | $ | 39.3 | $ | 37.0 | |||||||
(a)As of December 31, 2023, included approximately $1.0 billion in tax-oriented investments in CIB associated with First Republic.
Governance and oversight
The Firm’s approach to managing principal investment risk is consistent with the Firm’s risk governance structure. The Firm has established a Firmwide risk policy framework for all principal investing activities that includes approval by executives who are independent from the investing businesses, as appropriate.
The Firm’s independent control functions are responsible for reviewing the appropriateness of the carrying value of investments in accordance with relevant policies. As part of the risk governance structure, approved levels for investments are established and monitored for each relevant business or segment in order to manage the overall size of the portfolios. The Firm also conducts stress testing on these portfolios using specific scenarios that estimate losses based on significant market moves and/or other risk events.
134 | JPMorgan Chase & Co./2023 Form 10-K | |||||||
| MARKET RISK MANAGEMENT | ||||||||||||||
Market risk is the risk associated with the effect of changes in market factors such as interest and foreign exchange rates, equity and commodity prices, credit spreads or implied volatilities, on the value of assets and liabilities held for both the short and long term.
Market Risk Management
Market Risk Management monitors market risks throughout the Firm and defines market risk policies and procedures.
Market Risk Management seeks to manage risk, facilitate efficient risk/return decisions, reduce volatility in operating performance and provide transparency into the Firm’s market risk profile for senior management, the Board of Directors and regulators. Market Risk Management is responsible for the following functions:
•Maintaining a market risk policy framework
•Independently measuring, monitoring and controlling LOB, Corporate, and Firmwide market risk
•Defining, approving and monitoring limits
•Performing stress testing and qualitative risk assessments
Risk measurement
Measures used to capture market risk
There is no single measure to capture market risk and therefore Market Risk Management uses various metrics, both statistical and nonstatistical, to assess risk including:
•Value-at-risk
•Stress testing
•Profit and loss drawdowns
•Earnings-at-risk
•Economic Value Sensitivity
•Other sensitivity-based measures
Risk monitoring and control
Market risk exposure is managed primarily through a series of limits set in the context of the market environment and business strategy. In setting limits, Market Risk Management takes into consideration factors such as market volatility, product liquidity, accommodation of client business, and management judgment. Market Risk Management maintains different levels of limits. Firm level limits include VaR and stress limits. Similarly, LOB and Corporate limits include VaR and stress limits and may be supplemented by certain nonstatistical risk measures such as profit and loss drawdowns. Limits may also be set within the LOBs and Corporate, as well as at the legal entity level.
Market Risk Management sets limits and regularly reviews and updates them as appropriate. Senior management is responsible for reviewing and approving certain of these risk limits on an ongoing basis. Limits that have not been reviewed within specified time periods by Market Risk Management are reported to senior management. The LOBs and Corporate are responsible for adhering to established limits against which exposures are monitored and reported.
Limit breaches are required to be reported in a timely manner to limit approvers, which include Market Risk Management and senior management. In the event of a breach, Market Risk Management consults with senior members of appropriate groups within the Firm to determine the suitable course of action required to return the applicable positions to compliance, which may include a reduction in risk in order to remedy the breach or granting a temporary increase in limits to accommodate an expected increase in client activity and/or market volatility. Firm, Corporate or LOB-level limit breaches are escalated as appropriate.
Models used to measure market risk are inherently imprecise and are limited in their ability to measure certain risks or to predict losses. This imprecision may be heightened when sudden or severe shifts in market conditions occur. For additional discussion on model uncertainty refer to Estimations and Model Risk Management on page 154.
Market Risk Management periodically reviews the Firm’s existing market risk measures to identify opportunities for enhancement, and to the extent appropriate, will calibrate those measures accordingly over time.
JPMorgan Chase & Co./2023 Form 10-K | 135 | |||||||
Management’s discussion and analysis
The following table summarizes the predominant business activities and related market risks, as well as positions which give rise to market risk and certain measures used to capture those risks, for each LOB and Corporate.
In addition to the predominant business activities, each LOB and Corporate may engage in principal investing activities. To the extent principal investments are deemed market risk sensitive, they are reflected in relevant risk measures and captured in the table below. Refer to Investment Portfolio Risk Management on page 134 for additional discussion on principal investments.
| LOBs and Corporate | Predominant business activities | Related market risks | Positions included in Risk Management VaR | Positions included in earnings-at-risk | Positions included in other sensitivity-based measures | ||||||||||||
| CCB | •Originates and services mortgage loans •Originates loans and takes deposits | •Risk from changes in the probability of newly originated mortgage commitments closing •Interest rate risk and prepayment risk | •Mortgage commitments, classified as derivatives •Warehouse loans that are fair value option elected, classified as loans – debt instruments •MSRs •Hedges of mortgage commitments, warehouse loans and MSRs, classified as derivatives •Interest-only and mortgage-backed securities, classified as trading assets debt instruments, and related hedges, classified as derivatives •Fair value option elected liabilities(a) | •Retained loan portfolio •Deposits | •Fair value option elected liabilities DVA(a) | ||||||||||||
| CIB | •Makes markets and services clients across fixed income, foreign exchange, equities and commodities •Originates loans and takes deposits | •Risk of loss from adverse movements in market prices and implied volatilities across interest rate, foreign exchange, credit, commodity and equity instruments •Basis and correlation risk from changes in the way asset values move relative to one another •Interest rate risk and prepayment risk | •Trading assets/liabilities – debt and marketable equity instruments, and derivatives, including hedges of the retained loan portfolio •Certain securities purchased, loaned or sold under resale agreements and securities borrowed •Fair value option elected liabilities(a) •Certain fair value option elected loans •Derivative CVA and associated hedges •Marketable equity investments | •Retained loan portfolio •Deposits | •Privately held equity and other investments measured at fair value; and certain real estate-related fair value option elected loans •Derivatives FVA and fair value option elected liabilities DVA(a) •Credit risk component of CVA and associated hedges for counterparties with credit spreads that have widened to elevated levels C | ||||||||||||
| CB | •Originates loans and takes deposits | •Interest rate risk and prepayment risk | •Marketable equity investments(b) | •Retained loan portfolio •Deposits | |||||||||||||
| AWM | •Provides initial capital investments in products such as mutual funds and capital invested alongside third-party investors •Originates loans and takes deposits | •Risk from adverse movements in market factors (e.g., market prices, rates and credit spreads) •Interest rate risk and prepayment risk | •Debt securities held in advance of distribution to clients, classified as trading assets - debt instruments(b) •Trading assets/liabilities - derivatives that hedge the retained loan portfolio(b) | •Retained loan portfolio •Deposits | •Initial seed capital investments and related hedges, classified as derivatives •Certain deferred compensation and related hedges, classified as derivatives •Capital invested alongside third-party investors, typically in privately distributed collective vehicles managed by AWM (i.e., co-investments) | ||||||||||||
| Corporate | •Manages the Firm’s liquidity, funding, capital, structural interest rate and foreign exchange risks | •Structural interest rate risk from the Firm’s traditional banking activities •Structural non-USD foreign exchange risks | •Derivative positions measured through noninterest revenue in earnings •Marketable equity investments | •Deposits with banks •Investment securities portfolio and related interest rate hedges •Long-term debt and related interest rate hedges •Deposits | •Privately held equity and other investments measured at fair value •Foreign exchange exposure related to Firm-issued non-USD long-term debt (“LTD”) and related hedges | ||||||||||||
(a)Reflects structured notes in Risk Management VaR and the DVA on structured notes in other sensitivity-based measures.
(b)The AWM and CB contributions to Firmwide average VaR were not material for the years ended December 31, 2023 and 2022.
136 | JPMorgan Chase & Co./2023 Form 10-K | |||||||
Value-at-risk
JPMorgan Chase utilizes value-at-risk (“VaR”), a statistical risk measure, to estimate the potential loss from adverse market moves in the current market environment. The Firm has a single VaR framework used as a basis for calculating Risk Management VaR and Regulatory VaR.
The framework is employed across the Firm using historical simulation based on data for the previous 12 months. The framework’s approach assumes that historical changes in market values are representative of the distribution of potential outcomes in the immediate future. The Firm believes the use of Risk Management VaR provides a daily measure of risk that is closely aligned to risk management decisions made by the LOBs and Corporate and, along with other market risk measures, provides the appropriate information needed to respond to risk events.
The Firm’s Risk Management VaR is calculated assuming a one-day holding period and an expected tail-loss methodology which approximates a 95% confidence level. Risk Management VaR provides a consistent framework to measure risk profiles and levels of diversification across product types and is used for aggregating risks and monitoring limits across businesses. VaR results are reported as appropriate to various groups including senior management, the Board Risk Committee and regulators.
Underlying the overall VaR model framework are individual VaR models that simulate historical market returns for individual risk factors and/or product types. To capture material market risks as part of the Firm’s risk management framework, comprehensive VaR model calculations are performed daily for businesses whose activities give rise to market risk. These VaR models are granular and incorporate numerous risk factors and inputs to simulate daily changes in market values over the historical period; inputs are selected based on the risk profile of each portfolio, as sensitivities and historical time series used to generate daily market values may be different across product types or risk management systems. The VaR model results across all portfolios are aggregated at the Firm level.
As VaR is based on historical data, it is an imperfect measure of market risk exposure and potential future losses. In addition, based on their reliance on available historical data, limited time horizons, and other factors, VaR measures are inherently limited in their ability to measure certain risks and to predict losses, particularly those associated with market illiquidity and sudden or severe shifts in market conditions.
For certain products, specific risk parameters are not captured in VaR due to the lack of liquidity and availability of appropriate historical data. The Firm uses proxies to estimate the VaR for these and other products when daily time series are not available. It is likely that using an actual price-based time series for these products, if available, would affect the VaR results presented. The Firm therefore considers other nonstatistical measures such as stress
testing, in addition to VaR, to capture and manage its market risk positions.
As VaR model calculations require daily data and a consistent source for valuation, the daily market data used may be different than the independent third-party data collected for VCG price testing in its monthly valuation process. For example, in cases where market prices are not observable, or where proxies are used in VaR historical time series, the data sources may differ. Refer to Valuation process in Note 2 for further information on the Firm’s valuation process.
The Firm’s VaR model calculations are periodically evaluated and enhanced in response to changes in the composition of the Firm’s portfolios, changes in market conditions, improvements in the Firm’s modeling techniques and measurements, and other factors. Such changes may affect historical comparisons of VaR results. Refer to Estimations and Model Risk Management on page 154 for information regarding model reviews and approvals.
The Firm calculates separately a daily aggregated VaR in accordance with regulatory rules (“Regulatory VaR”), which is used to derive the Firm’s regulatory VaR-based capital requirements under Basel III capital rules. This Regulatory VaR model framework currently assumes a ten business-day holding period and an expected tail loss methodology which approximates a 99% confidence level. Regulatory VaR is applied to “covered” positions as defined by Basel III capital rules, which may be different than the positions included in the Firm’s Risk Management VaR. For example, credit derivative hedges of accrual loans are included in the Firm’s Risk Management VaR, while Regulatory VaR excludes these credit derivative hedges. In addition, in contrast to the Firm’s Risk Management VaR, Regulatory VaR currently excludes the diversification benefit for certain VaR models.
Refer to JPMorgan Chase’s Basel III Pillar 3 Regulatory Capital Disclosures reports, which are available on the Firm’s website, for additional information on Regulatory VaR and the other components of market risk regulatory capital for the Firm (e.g., VaR-based measure, stressed VaR-based measure and the respective backtesting).
JPMorgan Chase & Co./2023 Form 10-K | 137 | |||||||
Management’s discussion and analysis
The table below shows the results of the Firm’s Risk Management VaR measure using a 95% confidence level. VaR can vary significantly as positions change, market volatility fluctuates, and diversification benefits change.
| Total VaR | |||||||||||||||||||||||||||||||||||||||||
| As of or for the year ended December 31, | 2023 | 2022 | |||||||||||||||||||||||||||||||||||||||
| (in millions) | Avg. | Min | Max | Avg. | Min | Max | |||||||||||||||||||||||||||||||||||
| CIB trading VaR by risk type | |||||||||||||||||||||||||||||||||||||||||
| Fixed income | $ | 49 | $ | 31 | $ | 71 | $ | 59 | $ | 33 | $ | 82 | |||||||||||||||||||||||||||||
| Foreign exchange | 12 | 6 | 26 | 8 | 3 | 15 | |||||||||||||||||||||||||||||||||||
| Equities | 7 | 3 | 11 | 12 | 7 | 20 | |||||||||||||||||||||||||||||||||||
| Commodities and other | 11 | 6 | 19 | 15 | 10 | 28 | |||||||||||||||||||||||||||||||||||
Diversification benefit to CIB trading VaR (a) | (42) | NM | NM | (43) | NM | NM | |||||||||||||||||||||||||||||||||||
| CIB trading VaR | 37 | 24 | 55 | 51 | 34 | 69 | |||||||||||||||||||||||||||||||||||
Credit Portfolio VaR(b) | 14 | 8 | 26 | 16 | 4 | 235 | (d) | ||||||||||||||||||||||||||||||||||
Diversification benefit to CIB VaR(a) | (11) | NM | NM | (10) | NM | NM | |||||||||||||||||||||||||||||||||||
CIB VaR | 40 | 23 | 58 | 57 | 35 | 240 | |||||||||||||||||||||||||||||||||||
CCB VaR | 7 | 1 | 15 | 6 | 2 | 20 | |||||||||||||||||||||||||||||||||||
Corporate and other LOB VaR(c) | 12 | 9 | 17 | 12 | 9 | 16 | |||||||||||||||||||||||||||||||||||
Diversification benefit to other VaR(a) | (5) | NM | NM | (4) | NM | NM | |||||||||||||||||||||||||||||||||||
| Other VaR | 14 | 9 | 22 | 14 | 10 | 24 | |||||||||||||||||||||||||||||||||||
Diversification benefit to CIB and other VaR(a) | (11) | NM | NM | (13) | NM | NM | |||||||||||||||||||||||||||||||||||
| Total VaR | $ | 43 | $ | 26 | $ | 57 | $ | 58 | $ | 34 | $ | 242 | (d) | ||||||||||||||||||||||||||||
(a)Diversification benefit represents the difference between the portfolio VaR and the sum of its individual components. This reflects the non-additive nature of VaR due to imperfect correlation across LOBs, Corporate, and risk types. For maximum and minimum VaR, diversification benefit is not meaningful as the maximum and minimum VaR for each portfolio may have occurred on different trading days than the components.
(b)Credit Portfolio VaR includes the derivative CVA, hedges of the CVA and hedges of the retained loan portfolio, which are reported in principal transactions revenue. This VaR does not include the retained loan portfolio, which is not reported at fair value. In line with the Firm's internal model governance, the credit risk component of CVA related to certain counterparties was removed from Credit Portfolio VaR due to the widening of the credit spreads for those counterparties to elevated levels. The related hedges were also removed to maintain consistency. This exposure is now reflected in other sensitivity-based measures.
(c)Corporate and other LOB VaR includes a legacy private equity position in Corporate which is publicly traded.
(d)In March 2022, the effects of nickel price increases and the associated volatility in the nickel market resulted in elevated maximum Credit Portfolio VaR, as well as maximum Total VaR.
2023 compared with 2022
Average Total VaR decreased by $15 million for the year ended December 31, 2023 when compared with the prior year.
The decrease was driven by reduced market volatility and risk reductions predominantly impacting fixed income, commodities and equities.
The following graph presents daily Risk Management VaR for the four trailing quarters.
Daily Risk Management VaR
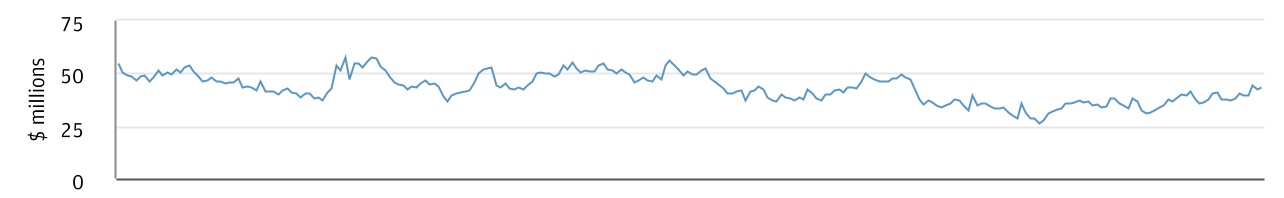
| First Quarter 2023 | Second Quarter 2023 | Third Quarter 2023 | Fourth Quarter 2023 | ||||||||
138 | JPMorgan Chase & Co./2023 Form 10-K | |||||||
VaR backtesting
The Firm performs daily VaR model backtesting, which compares the daily Risk Management VaR results with the daily gains and losses that are utilized for VaR backtesting purposes. The gains and losses depicted in the chart below do not reflect the Firm’s reported revenue as they exclude certain components of total net revenue, such as those associated with the execution of new transactions (i.e., intraday client-driven trading and intraday risk management activities), fees, commissions, other valuation adjustments and net interest income. These excluded components of total net revenue may more than offset the backtesting gain or loss on a particular day. The definition of backtesting gains and losses above is consistent with the requirements for backtesting under Basel III capital rules.
A backtesting exception occurs when the daily backtesting loss exceeds the daily Risk Management VaR for the prior day. Under the Firm’s Risk Management VaR methodology, assuming current changes in market values are consistent with the historical changes used in the simulation, the Firm would expect to incur VaR backtesting exceptions five times every 100 trading days on average. The number of VaR backtesting exceptions observed can differ from the statistically expected number of backtesting exceptions if the current level of market volatility is materially different from the level of market volatility during the 12 months of historical data used in the VaR calculation.
For the 12 months ended December 31, 2023, the Firm posted backtesting gains on 139 of the 258 days, and observed 13 VaR backtesting exceptions, of which eight were in the three months ended December 31, 2023. Firmwide backtesting loss days can differ from the loss days for which Fixed Income Markets and Equity Markets posted losses, as disclosed in CIB Markets revenue, as the population of positions which comprise each metric are different and due to the exclusion of certain components of total net revenue in backtesting gains and losses as described above.
The following chart presents the distribution of Firmwide daily backtesting gains and losses for the trailing 12 months and three months ended December 31, 2023. The daily backtesting losses are displayed as a percentage of the corresponding daily Risk Management VaR. The count of days with backtesting losses are shown in aggregate, in fifty percentage point intervals. Backtesting exceptions are displayed within the intervals that are greater than one hundred percent. The results in the chart below differ from the results of backtesting disclosed in the Market Risk section of the Firm’s Basel III Pillar 3 Regulatory Capital Disclosures reports, which are based on Regulatory VaR applied to the Firm’s covered positions.
Distribution of Daily Backtesting Gains and Losses
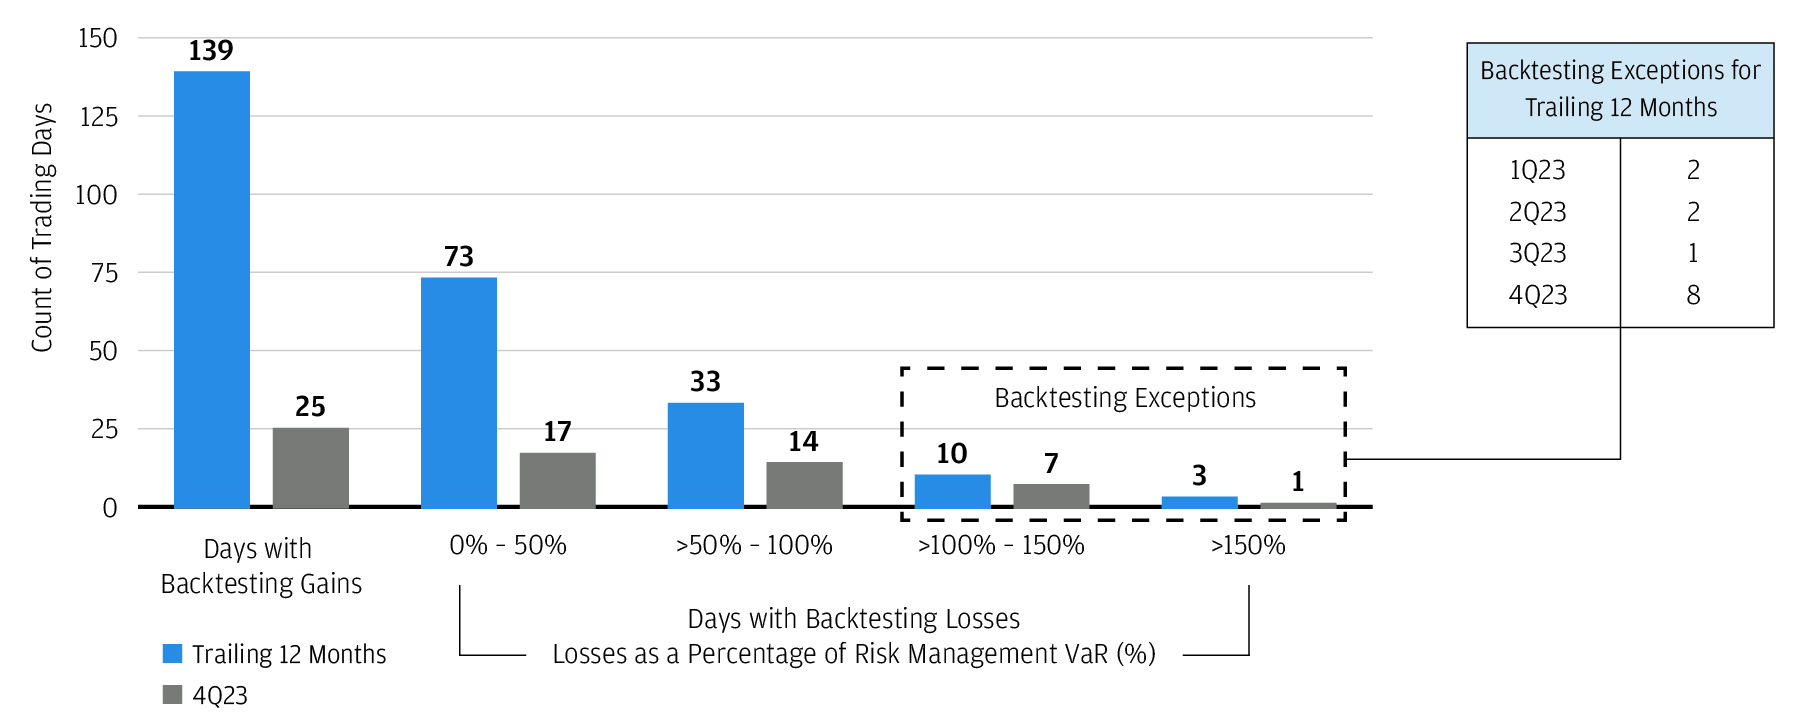
JPMorgan Chase & Co./2023 Form 10-K | 139 | |||||||
Management’s discussion and analysis
Other risk measures
Stress testing
Along with VaR, stress testing is an important tool used to assess risk. While VaR reflects the risk of loss due to adverse changes in markets using recent historical market behavior, stress testing reflects the risk of loss from hypothetical changes in the value of market risk sensitive positions applied simultaneously. Stress testing measures the Firm’s vulnerability to losses under a range of stressed but possible economic and market scenarios. The results are used to understand the exposures responsible for those potential losses and are measured against limits.
The Firm’s stress framework covers market risk sensitive positions in the LOBs and Corporate. The framework is used to calculate multiple magnitudes of potential stress for both market rallies and market sell-offs, assuming significant changes in market factors such as credit spreads, equity prices, interest rates, currency rates and commodity prices, and combines them in multiple ways to capture an array of hypothetical economic and market scenarios.
The Firm generates a number of scenarios that focus on tail events in specific asset classes and geographies, including how the event may impact multiple market factors simultaneously. Scenarios also incorporate specific idiosyncratic risks and stress basis risk between different products. The flexibility in the stress framework allows the Firm to construct new scenarios that can test the outcomes against possible future stress events. Stress testing results are reported periodically to senior management of the Firm, as appropriate.
Stress scenarios are governed by the overall stress framework, under the oversight of Market Risk Management, and the models to calculate the stress results are subject to the Firm’s Estimations and Model Risk Management Policy. The Firmwide Market Risk Stress Methodology Committee reviews and approves changes to stress testing methodology and scenarios across the Firm. Significant changes to the framework are escalated to senior management, as appropriate.
The Firm’s stress testing framework is utilized in calculating the Firm’s CCAR and other stress test results, which are reported periodically to the Board of Directors. In addition, stress testing results are incorporated into the Firm’s Risk Appetite framework, and are reported periodically to the Board Risk Committee.
Profit and loss drawdowns
Profit and loss drawdowns are used to highlight trading losses above certain levels of risk tolerance. A profit and loss drawdown is a decline in revenue from its year-to-date peak level.
Structural interest rate risk management
The effect of interest rate exposure on the Firm’s reported net income is important as interest rate risk represents one of the Firm’s significant market risks. Interest rate risk arises not only from trading activities which are included in
VaR, but also from the Firm’s traditional banking activities, which include extension of loans and credit facilities, taking deposits, issuing debt, as well as the investment securities portfolio, and associated derivative instruments. Refer to the table on page 136 for a summary by LOB and Corporate identifying positions included in earnings-at-risk.
Governance
The CTC Risk Committee establishes the Firm’s interest rate risk management policy and related limits, which are subject to approval by the Board Risk Committee. Treasury and CIO, working in partnership with the LOBs, calculates the Firm’s structural interest rate risk profile and reviews it with senior management, including the CTC Risk Committee. In addition, oversight of structural interest rate risk is managed through a dedicated risk function reporting to the CTC CRO. This risk function is responsible for providing independent oversight and governance around assumptions and establishing and monitoring limits for structural interest rate risk, including limits related to Earnings-at-Risk and Economic Value Sensitivity. The Firm manages structural interest rate risk generally through its investment securities portfolio and interest rate derivatives.
Key Risk Drivers and Risk Management Process
Structural interest rate risk can arise due to a variety of factors, including:
•Differences in timing among the maturity or repricing of assets, liabilities and off-balance sheet instruments
•Differences in the amounts of assets, liabilities and off-balance sheet instruments that are maturing or repricing at the same time
•Differences in the amounts by which short-term and long-term market interest rates change (for example, changes in the slope of the yield curve)
•The impact of changes in the maturity of various assets, liabilities or off-balance sheet instruments as interest rates change
The Firm manages interest rate exposure related to its assets and liabilities on a consolidated, Firmwide basis. Business units transfer their interest rate risk to Treasury and CIO through funds transfer pricing, which takes into account the elements of interest rate exposure that can be risk-managed in financial markets. These elements include asset and liability balances and contractual rates of interest, contractual principal payment schedules, expected prepayment experience, interest rate reset dates and maturities, rate indices used for repricing, and any interest rate ceilings or floors for adjustable rate products.
Earnings-at-Risk
One way that the Firm evaluates its structural interest rate risk is through earnings-at-risk. Earnings-at-risk estimates the Firm’s interest rate exposure for a given interest rate scenario. It is presented as a sensitivity to a baseline, which includes net interest income and certain interest rate sensitive fees. The baseline uses market interest rates and,
140 | JPMorgan Chase & Co./2023 Form 10-K | |||||||
in the case of deposits, pricing assumptions. The Firm conducts simulations of changes to this baseline for interest rate-sensitive assets and liabilities denominated in U.S. dollars and other currencies (“non-U.S. dollar” currencies). These simulations primarily include retained loans, deposits, deposits with banks, investment securities, long-term debt and any related interest rate hedges, and funds transfer pricing of other positions in risk management VaR and other sensitivity-based measures as described on page 136. These simulations exclude hedges of exposure from non-U.S. dollar foreign exchange risk arising from the Firm’s capital investments. The inclusion of the hedges in these simulations would increase U.S. dollar sensitivities and decrease non-U.S. dollar sensitivities. Refer to non-U.S. dollar foreign exchange risk on page 145 for more information.
Earnings-at-risk scenarios estimate the potential change to a net interest income baseline over the following 12 months utilizing multiple assumptions. These scenarios include a parallel shift involving changes to both short-term and long-term rates by an equal amount; a steeper yield curve involving holding short-term rates constant and increasing long-term rates; and a flatter yield curve involving increasing short-term rates and holding long-term rates constant or holding short-term rates constant and decreasing long-term rates. These scenarios consider many different factors, including:
•The impact on exposures as a result of instantaneous changes in interest rates from baseline rates.
•Forecasted balance sheet, as well as modeled prepayment and reinvestment behavior, but excluding assumptions about actions that could be taken by the Firm or its clients and customers in response to instantaneous rate changes. Mortgage prepayment assumptions are based on the interest rates used in the scenarios compared with underlying contractual rates, the time since origination, and other factors which are updated periodically based on historical experience. Deposit forecasts are a key assumption in the Firm’s earnings-at-risk. The baseline reflects certain assumptions relating to the reversal of Quantitative Easing that are highly uncertain and require management judgment. Therefore, the actual amount of deposits held by the Firm at any particular time could be impacted by actions the Federal Reserve may take as part of monetary policy, including through the use of the Reverse Repurchase Facility. In addition, there are other factors that impact the amount of deposits held at the Firm such as the level of loans across the industry and competition for deposits.
•The pricing sensitivity of deposits, known as deposit betas, represent the amount by which deposit rates paid could change upon a given change in market interest rates. As part of the Firm's continuous evaluation and periodic enhancements to its earnings-at-risk calculations, the Firm updated its model in the second quarter of 2023 to incorporate deposit repricing lags
impacting both consumer and wholesale deposits. The model change incorporated observed pricing and customer behavior in both rising and falling interest rate environments. Actual deposit rates paid may differ from the modeled assumptions, primarily due to customer behavior and competition for deposits.
The Firm performs sensitivity analyses of the assumptions used in earnings-at-risk scenarios, including with respect to deposit betas and forecasts of deposit balances, both of which are especially significant in the case of consumer deposits. The results of these sensitivity analyses are reported to the CTC Risk Committee and the Board Risk Committee.
The Firm’s earnings-at-risk scenarios are periodically evaluated and enhanced in response to changes in the composition of the Firm’s balance sheet, changes in market conditions, improvements in the Firm’s simulation and other factors. While a relevant measure of the Firm’s interest rate exposure, the earnings-at-risk analysis does not represent a forecast of the Firm’s net interest income (Refer to Outlook on page 52 for additional information).
The Firm’s U.S. dollar and non-U.S. dollar sensitivities are presented in the table below.
| December 31, (in billions) | 2023 | 2022 | |||||||||
U.S. dollar: (a) | |||||||||||
Parallel shift: (b) | |||||||||||
| +100 bps shift in rates | $ | 2.4 | $ | (2.0) | |||||||
| -100 bps shift in rates | (2.1) | 2.4 | |||||||||
| +200 bps shift in rates | 4.8 | (4.2) | |||||||||
| -200 bps shift in rates | (4.6) | 3.3 | |||||||||
| Steeper yield curve: | |||||||||||
| +100 bps shift in long-term rates | 0.6 | 0.8 | |||||||||
| -100 bps shift in short-term rates | (1.5) | 3.2 | |||||||||
| Flatter yield curve: | |||||||||||
| +100 bps shift in short-term rates | 1.8 | (2.8) | |||||||||
| -100 bps shift in long-term rates | (0.5) | (0.9) | |||||||||
Non-U.S. dollar: | |||||||||||
Parallel shift: (b) | |||||||||||
| +100 bps shift in rates | $ | 0.7 | $ | 0.7 | |||||||
| -100 bps shift in rates | (0.7) | (0.6) | |||||||||
(a)Reflects the impact of the aforementioned model update to incorporate deposit repricing lags. Prior periods have not been revised.
(b)Reflects the simultaneous shift of U.S. dollar and non-U.S. dollar rates.
In the absence of the model update to incorporate deposit repricing lags in the second quarter of 2023, the Firm's U.S. dollar sensitivities as of December 31, 2023, would have been lower by $4.1 billion to the +100 basis points shift in short-term and parallel rate scenarios and higher by $3.7 billion to the -100 basis points shift in short-term and parallel rate scenarios.
The change in the Firm’s U.S. dollar sensitivities as of December 31, 2023 compared to December 31, 2022 also reflected the impact of changes in the Firm’s balance sheet including the impact of the First Republic acquisition.
JPMorgan Chase & Co./2023 Form 10-K | 141 | |||||||
Management’s discussion and analysis
As of December 31, 2023, the Firm’s sensitivity to a parallel shift in rates is primarily the result of a greater impact from assets repricing compared to the impact of liabilities repricing.
Economic Value Sensitivity
In addition to earnings-at-risk, which is measured as a sensitivity to a baseline of earnings over the next 12 months, the Firm also measures Economic Value Sensitivity (“EVS”). EVS stress tests the longer-term economic value of equity by measuring the sensitivity of the Firm’s current balance sheet, primarily retained loans, deposits, debt and investment securities as well as related hedges, under various interest rate scenarios. In accordance with the CTC interest rate risk management policy, the Firm has established limits on EVS as a percentage of TCE. Additional information on long-term debt and held to maturity investment securities is disclosed on page 195 in Note 2 financial instruments that are not carried at fair value on the Consolidated balance sheets.
142 | JPMorgan Chase & Co./2023 Form 10-K | |||||||
Non-U.S. dollar foreign exchange risk
Non-U.S. dollar FX risk is the risk that changes in foreign exchange rates affect the value of the Firm’s assets or liabilities or future results. The Firm has structural non-U.S. dollar FX exposures arising from capital investments, forecasted expense and revenue, the investment securities portfolio and non-U.S. dollar-denominated debt issuance. Treasury and CIO, working in partnership with the LOBs, primarily manage these risks on behalf of the Firm. Treasury and CIO may hedge certain of these risks using derivatives. Refer to Business Segment Results on page 66 for additional information.
Other sensitivity-based measures
The Firm quantifies the market risk of certain debt and equity and credit and funding-related exposures by assessing the potential impact on net revenue, other comprehensive income (“OCI”) and noninterest expense due to changes in relevant market variables. Refer to the predominant business activities that give rise to market risk on page 136 for additional information on the positions captured in other sensitivity-based measures.
The table below represents the potential impact to net revenue, OCI or noninterest expense for market risk sensitive instruments that are not included in VaR or earnings-at-risk. Where appropriate, instruments used for hedging purposes are reported net of the positions being hedged. The sensitivities disclosed in the table below may not be representative of the actual gain or loss that would have been realized at December 31, 2023 and 2022, as the movement in market parameters across maturities may vary and are not intended to imply management’s expectation of future changes in these sensitivities.
Gain/(loss) (in millions) | |||||||||||||||||||||||
| Activity | Description | Sensitivity measure | December 31, 2023 | December 31, 2022 | |||||||||||||||||||
Debt and equity(a) | |||||||||||||||||||||||
| Asset Management activities | Consists of seed capital and related hedges; fund co-investments(c); and certain deferred compensation and related hedges(d) | 10% decline in market value | $ | (61) | $ | (56) | |||||||||||||||||
| Other debt and equity | Consists of certain real estate-related fair value option elected loans, privately held equity and other investments held at fair value(c) | 10% decline in market value | (1,044) | (1,046) | |||||||||||||||||||
| Credit- and funding-related exposures | |||||||||||||||||||||||
Non-USD LTD cross-currency basis | Represents the basis risk on derivatives used to hedge the foreign exchange risk on the non-USD LTD(e) | 1 basis point parallel tightening of cross currency basis | (12) | (12) | |||||||||||||||||||
Non-USD LTD hedges foreign currency (“FX”) exposure | Primarily represents the foreign exchange revaluation on the fair value of the derivative hedges(e) | 10% depreciation of currency | 16 | 3 | |||||||||||||||||||
| Derivatives – funding spread risk | Impact of changes in the spread related to derivatives FVA(c) | 1 basis point parallel increase in spread | (3) | (4) | |||||||||||||||||||
CVA - counterparty credit risk(b) | Credit risk component of CVA and associated hedges | 10% credit spread widening | — | (1) | |||||||||||||||||||
| Fair value option elected liabilities - funding spread risk | Impact of changes in the spread related to fair value option elected liabilities DVA(e) | 1 basis point parallel increase in spread | 46 | 43 | |||||||||||||||||||
Fair value option elected liabilities –interest rate sensitivity | Interest rate sensitivity on fair value option elected liabilities resulting from a change in the Firm’s own credit spread(e) | 1 basis point parallel increase in spread | — | — | |||||||||||||||||||
Interest rate sensitivity related to risk management of changes in the Firm’s own credit spread on the fair value option elected liabilities noted above(c) | 1 basis point parallel increase in spread | — | — | ||||||||||||||||||||
(a)Excludes equity securities without readily determinable fair values that are measured under the measurement alternative. Refer to Note 2 for additional information.
(b)In line with the Firm's internal model governance, the credit risk component of CVA related to certain counterparties was removed from Credit Portfolio VaR due to the widening of the credit spreads for those counterparties to elevated levels. The related hedges were also removed to maintain consistency. This exposure is now reflected in other sensitivity-based measures.
(c)Impact recognized through net revenue.
(d)Impact recognized through noninterest expense.
(e)Impact recognized through OCI.
JPMorgan Chase & Co./2023 Form 10-K | 143 | |||||||
Management’s discussion and analysis
| COUNTRY RISK MANAGEMENT | ||||||||||||||
The Firm, through its LOBs and Corporate, may be exposed to country risk resulting from financial, economic, political or other significant developments which adversely affect the value of the Firm’s exposures related to a particular country or set of countries. The Country Risk Management group actively monitors the various portfolios which may be impacted by these developments and measures the extent to which the Firm’s exposures are diversified given the Firm’s strategy and risk tolerance relative to a country.
Organization and management
Country Risk Management is an independent risk management function that assesses, manages and monitors exposure to country risk across the Firm.
The Firm’s country risk management function includes the following activities:
•Maintaining policies, procedures and standards consistent with a comprehensive country risk framework
•Assigning sovereign ratings, assessing country risks and establishing risk tolerance relative to a country
•Measuring and monitoring country risk exposure and stress across the Firm
•Managing and approving country limits and reporting trends and limit breaches to senior management
•Developing surveillance tools, such as signaling models and ratings indicators, for early identification of potential country risk concerns
•Providing country risk scenario analysis
Sources and measurement
The Firm is exposed to country risk through its lending and deposits, investing, and market-making activities, whether cross-border or locally funded. Country exposure includes activity with both government and private-sector entities in a country.
Under the Firm’s internal country risk management approach, attribution of exposure to an individual country is based on the country where the largest proportion of the assets of the counterparty, issuer, obligor or guarantor are located or where the largest proportion of its revenue is derived, which may be different than the domicile (i.e. legal residence) or country of incorporation.
Individual country exposures reflect an aggregation of the Firm’s risk to an immediate default, with zero recovery, of the counterparties, issuers, obligors or guarantors attributed to that country. Activities which result in contingent or indirect exposure to a country are not included in the country exposure measure (for example, providing clearing services or secondary exposure to collateral on securities financing receivables).
Assumptions are sometimes required in determining the measurement and allocation of country exposure, particularly in the case of certain non-linear or index products, or where the nature of the counterparty, issuer, obligor or guarantor is not suitable for attribution to an
individual country. The use of different measurement approaches or assumptions could affect the amount of reported country exposure.
Under the Firm’s internal country risk measurement framework:
•Deposits with banks are measured as the cash balances placed with central banks, commercial banks, and other financial institutions
•Lending exposures are measured at the total committed amount (funded and unfunded), net of the allowance for credit losses and eligible cash and marketable securities collateral received
•Securities financing exposures are measured at their receivable balance, net of eligible collateral received
•Debt and equity securities are measured at the fair value of all positions, including both long and short positions
•Counterparty exposure on derivative receivables is measured at the derivative’s fair value, net of the fair value of the eligible collateral received
•Credit derivatives exposure is measured at the net notional amount of protection purchased or sold for the same underlying reference entity, inclusive of the fair value of the derivative receivable or payable, reflecting the manner in which the Firm manages these exposures
The Firm’s internal country risk reporting differs from the reporting provided under the FFIEC bank regulatory requirements.
144 | JPMorgan Chase & Co./2023 Form 10-K | |||||||
Stress testing
Stress testing is an important component of the Firm’s country risk management framework, which aims to estimate and limit losses arising from a country crisis by measuring the impact of adverse asset price movements to a country based on market shocks combined with counterparty specific assumptions. Country Risk Management periodically designs and runs tailored stress scenarios to test vulnerabilities to individual countries or sets of countries in response to specific or potential market events, sector performance concerns, sovereign actions and geopolitical risks. These tailored stress results are used to inform potential risk reduction across the Firm, as necessary.
Risk reporting
Country exposure and stress are measured and reported regularly, and used by Country Risk Management to identify trends and monitor high usages and breaches against limits.
For country risk management purposes, the Firm may report exposure to jurisdictions that are not fully autonomous, including Special Administrative Regions (“SAR”) and dependent territories, separately from the independent sovereign states with which they are associated.
The following table presents the Firm’s top 20 exposures by country (excluding the U.S.) as of December 31, 2023, and their comparative exposures as of December 31, 2022. The top 20 country exposures represent the Firm’s largest total exposures by individual country. Country exposures may fluctuate from period to period due to a variety of factors, including client activity, market flows and liquidity management activities undertaken by the Firm.
The decrease in exposure to Japan when compared to December 31, 2022, was driven by a reduction in cash placed with the central bank of Japan as a result of liquidity management activities undertaken by the Firm.
The decrease in exposure to Australia when compared to December 31, 2022, was predominantly driven by a reduction in cash placed with the central bank of Australia due to client-driven activities resulting from changes in interest rates.
The Firm continues to monitor its exposure to Russia which was approximately $350 million as of December 31, 2023. This amount excludes certain deposits placed on behalf of clients at the Depository Insurance Agency of Russia.
Top 20 country exposures (excluding the U.S.)(a) | |||||||||||||||||||||||
| December 31, (in billions) | 2023 | 2022(f) | |||||||||||||||||||||
Deposits with banks(b) | Lending(c) | Trading and investing(d) | Other(e) | Total exposure | Total exposure | ||||||||||||||||||
| Germany | $ | 69.8 | $ | 12.1 | $ | 2.1 | $ | 0.8 | $ | 84.8 | $ | 93.2 | |||||||||||
| United Kingdom | 36.4 | 25.5 | 13.5 | 1.7 | 77.1 | 70.1 | |||||||||||||||||
| Japan | 29.4 | 2.4 | 3.9 | 0.3 | 36.0 | 55.8 | |||||||||||||||||
| Australia | 9.7 | 6.9 | 1.7 | — | 18.3 | 25.7 | |||||||||||||||||
| Brazil | 5.2 | 5.3 | 6.2 | — | 16.7 | 17.8 | |||||||||||||||||
| Canada | 2.3 | 11.4 | 2.0 | 0.3 | 16.0 | 14.4 | |||||||||||||||||
| China | 3.5 | 5.5 | 5.0 | — | 14.0 | 13.7 | |||||||||||||||||
| Switzerland | 5.2 | 3.6 | 1.2 | 0.9 | 10.9 | 15.3 | |||||||||||||||||
| France | 0.6 | 10.9 | (2.2) | 0.8 | 10.1 | 18.1 | |||||||||||||||||
| Singapore | 1.9 | 3.8 | 3.8 | 0.3 | 9.8 | 9.9 | |||||||||||||||||
| India | 1.2 | 3.8 | 4.3 | 0.4 | 9.7 | 9.0 | |||||||||||||||||
| Mexico | 1.1 | 3.7 | 3.4 | — | 8.2 | 5.4 | |||||||||||||||||
| Belgium | 5.6 | 2.1 | 0.3 | — | 8.0 | 9.2 | |||||||||||||||||
| South Korea | 0.8 | 3.2 | 3.5 | 0.3 | 7.8 | 10.0 | |||||||||||||||||
Saudi Arabia | 0.6 | 5.2 | 1.9 | — | 7.7 | 7.9 | |||||||||||||||||
Spain | 0.3 | 5.2 | 0.8 | — | 6.3 | 3.4 | |||||||||||||||||
| Italy | 0.1 | 5.9 | (0.2) | 0.2 | 6.0 | 5.8 | |||||||||||||||||
| Netherlands | 0.1 | 6.4 | (1.2) | 0.3 | 5.6 | 7.1 | |||||||||||||||||
| Malaysia | 3.5 | 0.2 | 0.4 | 0.1 | 4.2 | 5.3 | |||||||||||||||||
| Luxembourg | 0.9 | 2.2 | 0.9 | — | 4.0 | 4.2 | |||||||||||||||||
(a)Country exposures presented in the table reflect 88% of total Firmwide non-U.S. exposure, where exposure is attributed to an individual country based on the Firm’s internal country risk management approach, at both December 31, 2023 and 2022.
(b)Predominantly represents cash placed with central banks.
(c)Includes loans and accrued interest receivable, lending-related commitments (net of eligible collateral and the allowance for credit losses). Excludes intra-day and operating exposures, such as those from settlement and clearing activities.
(d)Includes market-making positions and hedging, investment securities, and counterparty exposure on derivative and securities financings net of eligible collateral. Market-making positions and hedging includes exposure from single reference entity (“single-name”), index and other multiple reference entity transactions for which one or more of the underlying reference entities is in a country listed in the above table.
(e)Includes clearing house guarantee funds and physical commodities.
(f)The country rankings presented in the table as of December 31, 2022, are based on the country rankings of the corresponding exposures at December 31, 2023, not actual rankings of such exposures at December 31, 2022.
JPMorgan Chase & Co./2023 Form 10-K | 145 | |||||||
Management’s discussion and analysis
CLIMATE RISK MANAGEMENT | ||||||||||||||
Climate risk is the risk associated with the impacts of climate change on the Firm’s clients, customers, operations and business strategy. Climate change is viewed as a driver of risk that may impact existing types of risks managed by the Firm. Climate risk is categorized into physical risk and transition risk.
Physical risk refers to economic costs and financial loss associated with a changing climate. Acute physical risk drivers include the increased frequency or severity of climate and weather events, such as floods, wildfires and tropical cyclones. Chronic physical risk drivers include more gradual shifts in the climate, such as sea level rise, persistent changes in precipitation levels and increases in average ambient temperatures.
Transition risk refers to the financial and economic implications associated with a societal adjustment to a low-carbon economy. Transition risk drivers include possible changes in public policy, adoption of new technologies and shifts in consumer preferences. Transition risks may also be influenced by changes in the physical climate.
Organization and management
The Firm has a Climate Risk Management function that is responsible for establishing and maintaining the Firmwide framework and strategy for managing climate risks that may impact the Firm. The Climate Risk Management function engages across the Firm to help integrate climate risk considerations into existing risk management frameworks, as appropriate.
Other responsibilities of Climate Risk Management include:
•Setting policies, standards, procedures and processes to support identification, escalation, monitoring and management of climate risk across the Firm
•Developing metrics, scenarios and stress testing mechanisms designed to assess the range of potential climate-related financial and economic impacts to the Firm
•Establishing a Firmwide climate risk data strategy and the supporting climate risk technology infrastructure
The LOBs and Corporate are responsible for the identification, assessment and management of climate risks present in their business activities and for adherence to applicable climate-related laws, rules and regulations.
Governance and oversight
The Firm’s approach to managing climate risk is consistent with the Firm’s risk governance structure. The LOBs and Corporate are responsible for integrating climate risk management into existing governance frameworks, or creating new governance frameworks, as appropriate.
The LOBs, Corporate and Climate Risk Management are responsible for providing the Board Risk Committee with information on significant climate risks and climate-related initiatives, as appropriate.
146 | JPMorgan Chase & Co./2023 Form 10-K | |||||||
OPERATIONAL RISK MANAGEMENT | ||||||||||||||
Operational risk is the risk of an adverse outcome resulting from inadequate or failed internal processes or systems; human factors; or external events impacting the Firm’s processes or systems. Operational Risk includes compliance, conduct, legal, and estimations and model risk. Operational risk is inherent in the Firm’s activities and can manifest itself in various ways, including fraudulent acts, business disruptions (including those caused by extraordinary events beyond the Firm's control), cyber attacks, inappropriate employee behavior, failure to comply with applicable laws, rules and regulations or failure of vendors or other third party providers to perform in accordance with their agreements. Operational Risk Management attempts to manage operational risk at appropriate levels in light of the Firm’s financial position, the characteristics of its businesses, and the markets and regulatory environments in which it operates.
Operational Risk Management Framework
The Firm’s Compliance, Conduct, and Operational Risk (“CCOR”) Management Framework is designed to enable the Firm to govern, identify, measure, monitor and test, manage and report on the Firm’s operational risk.
Operational Risk Governance
The LOBs and Corporate are responsible for the management of operational risk. The Control Management Organization, which consists of control managers within each LOB and Corporate, is responsible for the day-to-day execution of the CCOR Framework.
The Firm’s Global Chief Compliance Officer (“CCO”) and FRE for Operational Risk and Qualitative Risk Appetite is responsible for defining the CCOR Management Framework and establishing the minimum standards for its execution. The LOB and Corporate aligned CCOR Lead Officers report to the Global CCO and FRE for Operational Risk and Qualitative Risk Appetite and are independent of the respective businesses or functions they oversee. The CCOR Management Framework is included in the Risk Governance and Oversight Policy that is reviewed and approved by the Board Risk Committee periodically.
Operational Risk Identification
The Firm utilizes a structured risk and control self-assessment process that is executed by the LOBs and Corporate. As part of this process, the LOBs and Corporate evaluate the effectiveness of their respective control environment to assess circumstances in which controls have failed, and to determine where remediation efforts may be required. The Firm’s Operational Risk and Compliance organization (“Operational Risk and Compliance”) provides oversight of and challenge to these evaluations and may also perform independent assessments of significant operational risk events and areas of concentrated or emerging risk.
Operational Risk Measurement
Operational Risk and Compliance performs an independent assessment of the operational risks inherent within the LOBs and Corporate, which includes evaluating the effectiveness of the control environments and reporting the results to senior management.
In addition, Operational Risk and Compliance assesses operational risks through quantitative means, including operational risk-based capital and estimation of operational risk losses under both baseline and stressed conditions.
The primary component of the operational risk-based capital estimate is the Loss Distribution Approach (“LDA”) statistical model, which simulates the projected frequency and severity of operational risk losses based on historical data. The LDA model is used to estimate an aggregate operational risk loss over a one-year time horizon, at a 99.9% confidence level. The LDA model incorporates actual internal operational risk losses in the quarter following the period in which those losses were realized, and the calculation generally continues to reflect such losses even after the issues or business activities giving rise to the losses have been remediated or reduced.
As required under the Basel III capital framework, the Firm’s operational risk capital methodology, which uses the Advanced Measurement Approach (“AMA”), incorporates internal and external losses as well as management’s view of tail risk captured through operational risk scenario analysis, and evaluation of key business environment and internal control metrics. The Firm does not reflect the impact of insurance in its AMA estimate of operational risk capital.
The Firm considers the impact of stressed economic conditions on operational risk losses and develops a forward looking view of material operational risk events that may occur in a stressed environment. The Firm’s operational risk stress testing framework is utilized in calculating results for the Firm’s CCAR and other stress testing processes.
Refer to Capital Risk Management on pages 91-101 for information related to operational risk RWA, and CCAR.
Operational Risk Monitoring and testing
The results of risk assessments performed by Operational Risk and Compliance are used in connection with their independent monitoring and testing compliance of the LOBs and Corporate with laws, rules and regulations. Through monitoring and testing, Operational Risk and Compliance independently identify areas of heightened operational risk and tests the effectiveness of controls within the LOBs and Corporate.
JPMorgan Chase & Co./2023 Form 10-K | 147 | |||||||
Management’s discussion and analysis
Management of Operational Risk
The operational risk areas or issues identified through monitoring and testing are escalated to the LOBs and Corporate to be remediated through action plans, as needed, to mitigate operational risk. Operational Risk and Compliance may advise the LOBs and Corporate in the development and implementation of action plans.
Operational Risk Reporting
All employees of the Firm are expected to escalate risks appropriately. Risks identified by Operational Risk and Compliance are escalated to the appropriate LOB and Corporate Control Committees, as needed. Operational Risk and Compliance has established standards designed to ensure that consistent operational risk reporting and operational risk reports are produced on a Firmwide basis as well as by the LOBs and Corporate. Reporting includes the evaluation of key risk and performance indicators against established thresholds as well as the assessment of different types of operational risk against stated risk appetite. The standards establish escalation protocols to senior management and to the Board of Directors.
Insurance
One of the ways in which operational risk may be mitigated is through insurance maintained by the Firm. The Firm purchases insurance from commercial insurers and maintains a wholly-owned captive insurer, Park Assurance Company. Insurance may also be required by third parties with whom the Firm does business.
Subcategories and examples of operational risks
Operational risk can manifest itself in various ways. Operational risk subcategories include Compliance risk, Conduct risk, Legal risk, and Estimations and Model risk. Refer to pages 151, 152, 153 and 154, respectively for more information on Compliance, Conduct, Legal, and Estimations and Model risk. Details on other select examples of operational risks such as business and technology resiliency, payment fraud and third-party outsourcing, as well as cybersecurity, are provided below.
War in Ukraine and Sanctions
In response to the war in Ukraine, numerous financial and economic sanctions have been imposed on Russia and Russia-associated entities and individuals by various governments around the world, including the authorities in the U.S., U.K. and EU. These sanctions are complex and continue to evolve. The Firm continues to face increased operational and other risks associated with addressing these complex compliance-related matters. To manage this increased risk, the Firm has implemented controls reasonably designed to mitigate the risk of non-compliance and to prevent dealing with sanctioned persons or in property subject to sanctions, as well as to block or restrict payments as required by the applicable regulations.
Business and technology resiliency risk
Disruptions can occur due to forces beyond the Firm’s control such as the spread of infectious diseases or pandemics, severe weather, natural disasters, the effects of climate change, power or telecommunications loss, failure of a third party to provide expected services, cyberattacks, civil or political unrest or terrorism. The Firmwide Business Resiliency Program is designed to enable the Firm to prepare for, adapt to, withstand and recover from business disruptions including occurrence of extraordinary events beyond its control that may impact critical business functions and supporting assets including staff, technology, facilities and third parties. The program includes governance, awareness training, planning and testing of recovery strategies, as well as strategic and tactical initiatives to identify, assess, and manage business resiliency risks. The program is required to be managed in accordance with the Firm’s overall approach to Operational Risk Management, including alignment with technology, cybersecurity, data, physical security, crisis management, real estate and outsourcing programs.
Payment fraud risk
Payment fraud risk is the risk of external and internal parties unlawfully obtaining personal monetary benefit through misdirected or otherwise improper payment. The Firm employs various controls for managing payment fraud risk as well as providing employee and client education and awareness trainings.
Third-party outsourcing risk
The Firm‘s Third-Party Oversight (“TPO”) and Inter-affiliates Oversight (“IAO”) frameworks assist the LOBs and Corporate in selecting, documenting, onboarding, monitoring and managing their supplier relationships including services provided by affiliates. The objectives of the TPO framework are to hold suppliers and other third parties to an appropriate standard of operational performance and to mitigate key risks, including data loss and business disruptions. The Corporate Third-Party Oversight group is responsible for Firmwide training, monitoring, reporting and standards with respect to third-party outsourcing risks.
148 | JPMorgan Chase & Co./2023 Form 10-K | |||||||
Cybersecurity risk
Cybersecurity risk is the risk of harm or loss resulting from misuse or abuse of technology or the unauthorized disclosure of data.
Overview
Cybersecurity risk is an important and continuously evolving focus for the Firm. Significant resources are devoted to protecting and enhancing the security of computer systems, software, networks, storage devices, and other technology. The Firm’s security efforts are designed to protect against, among other things, cybersecurity attacks that can result in unauthorized access to confidential information, the destruction of data, disruptions to or degradations of service, the sabotaging of systems or other damage.
The Firm has experienced, and expects that it will continue to experience, a higher volume and complexity of cyber attacks against the backdrop of heightened geopolitical tensions. The Firm has implemented measures and controls reasonably designed to address this evolving environment, including enhanced threat monitoring. In addition, the Firm continues to review and enhance its capabilities to address associated risks, such as those relating to the management of administrative access to systems.
Third parties with which the Firm does business, that facilitate the Firm’s business activities (e.g., vendors, supply chain, exchanges, clearing houses, central depositories, and financial intermediaries) or that the Firm has acquired are also sources of cybersecurity risk to the Firm. Third party incidents such as system breakdowns or failures, misconduct by the employees of such parties, or cyber attacks, including ransomware and supply-chain compromises, could have a material adverse effect on the Firm, including in circumstances in which an affected third party is unable to deliver a product or service to the Firm or where the incident delivers compromised software to the Firm or results in lost or compromised information of the Firm or its clients or customers.
Clients and customers are also sources of cybersecurity risk to the Firm and its information assets, particularly when their activities and systems are beyond the Firm’s own security and control systems. The Firm engages in periodic discussions with its clients, customers and other external parties concerning cybersecurity risks including opportunities to improve cybersecurity.
Risks from cybersecurity threats, including any previous cybersecurity events, have not materially affected the Firm or its business strategy, results of operations or financial condition. Notwithstanding the comprehensive approach that the Firm takes to address cybersecurity risk, the Firm may not be successful in preventing or mitigating a future cybersecurity incident that could have a material adverse effect on the Firm or its business strategy, results of operations or financial condition.
Organization and management
The Global Chief Information Security Officer (“CISO”) reports to the Global Chief Information Officer, and is a member of key cybersecurity governance forums. The CISO leads the Global Cybersecurity and Technology Controls organization, which is responsible for identifying technology and cybersecurity risks and for implementing and maintaining controls to manage cybersecurity threats. The CISO is responsible for the Firm’s Information Security Program, which is designed to prevent, detect and respond to cyber attacks in order to help safeguard the confidentiality, integrity and availability of the Firm's infrastructure, resources and information. The program includes managing the Firm’s global cybersecurity operations centers, providing training, conducting cybersecurity event simulation exercises, implementing the Firm’s policies and standards relating to technology risk and cybersecurity management, and enhancing, as needed, the Firm’s cybersecurity capabilities.
The Firm’s Information Security Program includes the following functions:
Cyber Operations, which is responsible for implementing and maintaining controls designed to detect and defend the Firm against cyber attacks, and includes a dedicated function for incident response and ongoing monitoring for cybersecurity threats and vulnerabilities, including those among the Firm’s third-party suppliers.
Technology Governance, Risk & Controls, which is responsible for operationalizing technology risk and control frameworks, analyzing regulatory developments that may impact the Firm, and developing control catalogs and assessments of controls, as well as overseeing governance and reporting of technology and cybersecurity risk.
Security Awareness, which provides awareness and training that reinforces information risk and security management practices and compliance with the Firm's policies, standards and practices. The training is mandatory for all employees globally on a periodic basis, and it is supplemented by Firmwide testing initiatives, including periodic phishing tests. The Firm also provides specialized security training to employees in specific roles, such as application developers. The Firm’s Global Privacy Program requires all employees to take periodic training on data privacy that focuses on confidentiality and security, as well as responding to unauthorized access to or use of information.
Technology Resiliency, which establishes control requirements for planning and testing the prioritized recovery of technology services in the event of degradation or outage, including incident response planning, data backup and retention, and recovery readiness in support of the Firmwide Business Resiliency Program and operational risk management practices.
JPMorgan Chase & Co./2023 Form 10-K | 149 | |||||||
Management’s discussion and analysis
The Firm has a cybersecurity incident response plan designed to enable the Firm to respond to attempted cybersecurity incidents, coordinate as appropriate with law enforcement and other government agencies, notify clients and customers, as applicable, and recover from such incidents. In addition, the Firm actively partners with appropriate government and law enforcement agencies and peer industry forums, participating in discussions and simulations to assist in understanding the full spectrum of cybersecurity risks and in enhancing defenses and improving resiliency in the Firm’s operating environment.
Governance and oversight
The governance structure for the Global Cybersecurity and Technology Controls organization is designed to appropriately identify, escalate and mitigate cybersecurity risks. Cybersecurity risk management and its governance and oversight are integrated into the Firm’s operational risk management framework, including through the escalation of key risk and control issues to management and the development of risk mitigation plans for heightened risk and control issues. IRM independently assesses and challenges the activities and risk management practices of the Global Cybersecurity and Technology Controls organization related to the identification, assessment, measurement and mitigation of cybersecurity risk. As needed, the Firm engages third-party assessors or auditing firms with industry-recognized expertise on cybersecurity matters to review specific aspects of the Firm’s cybersecurity risk management framework, processes and controls.
The governance and oversight for cybersecurity risk management includes governance forums that inform management of key areas of concern regarding the prevention, detection, mitigation and remediation of cybersecurity risks.
The Cybersecurity and Technology Controls Operating Committee (“CTOC”) is the principal management committee that oversees the Firm’s assessment and management of cybersecurity risk, including oversight of the implementation and maintenance of appropriate controls in support of the Firm’s Information Security Program. The membership of the CTOC includes senior representatives from the Global Cybersecurity and Technology Controls organization and relevant corporate functions, including IRM and Internal Audit. CTOC members have extensive experience and qualifications in various technology and information security disciplines, including relevant experience at the Firm, at other financial services companies or in other highly-regulated industries.
The CTOC escalates key operational risk and control issues, as appropriate, to the Global Technology Operating Committee (“GTOC”) or its business control committee or to the appropriate LOB and Corporate Control Committees. The GTOC is responsible for the governance of the Firmwide Global Technology organization, including oversight of Firmwide technology strategies, the delivery of technology and technology operations, the effective use of information technology resources, and monitoring and resolving key operational risk and control matters arising in the Global Technology organization.
As part of its oversight of management’s implementation and maintenance of the Firm’s risk management framework, the Firm’s Board of Directors receives periodic updates from the CIO, the CISO and senior members of the CTOC concerning cybersecurity matters. These updates generally include information regarding cybersecurity and technology developments, the Firm’s Information Security Program and recommended changes to that program, cybersecurity policies and practices, and ongoing initiatives to improve information security, as well as any significant cybersecurity incidents and the Firm's efforts to address those incidents. The Audit Committee and the Risk Committee assist the Board in this oversight.
150 | JPMorgan Chase & Co./2023 Form 10-K | |||||||
COMPLIANCE RISK MANAGEMENT | ||||||||||||||
Compliance risk, a subcategory of operational risk, is the risk of failing to comply with laws, rules, regulations or codes of conduct and standards of self-regulatory organizations.
Overview
Each of the LOBs and Corporate hold primary ownership of and accountability for managing their compliance risk. The Firm’s Operational Risk and Compliance Organization (“Operational Risk and Compliance”), which is independent of the LOBs and Corporate, provides independent review, monitoring and oversight of business operations with a focus on compliance with the laws, rules, and regulations applicable to the delivery of the Firm’s products and services to clients and customers.
These compliance risks relate to a wide variety of laws, rules and regulations across the LOBs and Corporate, and jurisdictions, and include risks related to financial products and services, relationships and interactions with clients and customers, and employee activities. For example, compliance risks include those associated with anti-money laundering compliance, trading activities, market conduct, and complying with the laws, rules, and regulations related to the offering of products and services across jurisdictional borders. Compliance risk is also inherent in the Firm’s fiduciary activities, including the failure to exercise the applicable standard of care to act in the best interest of fiduciary clients and customers or to treat fiduciary clients and customers fairly.
Other functions provide oversight of significant regulatory obligations that are specific to their respective areas of responsibility.
Operational Risk and Compliance implements policies and standards designed to govern, identify, measure, monitor and test, manage, and report on compliance risk.
Governance and oversight
Operational Risk and Compliance is led by the Firm’s Global CCO and FRE for Operational Risk and Qualitative Risk Appetite.
The Firm maintains oversight and coordination of its compliance risk through the CCOR Management Framework. The Firm’s Global CCO and FRE for Operational Risk and Qualitative Risk Appetite also provides regular updates to the Board Risk Committee and the Audit Committee on significant compliance risk issues, as appropriate.
Code of Conduct
The Firm has a Code of Conduct (the “Code”) that sets forth the Firm’s expectation that employees will conduct themselves with integrity, at all times. The Code provides the principles that help govern employee conduct with clients, customers, suppliers, vendors, shareholders, regulators, other employees, as well as with the markets and communities in which the Firm operates. The Code requires employees to promptly report any potential or actual violation of the Code, any Firm policy, or any law or regulation applicable to the Firm’s business. It also requires employees to report any illegal or unethical conduct, or conduct that violates the underlying principles of the Code, by any of the Firm’s employees, consultants, clients, customers, suppliers, contract or temporary workers, or business partners or agents. Training is assigned to newly hired employees upon joining the Firm, and to current employees periodically thereafter. Employees are required to affirm their compliance with the Code annually.
Employees can report any potential or actual violations of the Code through the Firm’s Conduct Hotline (the “Hotline”) by phone or the internet. The Hotline is anonymous, where permitted by law, and is available at all times globally, with translation services and is administered by an outside service provider. The Code prohibits retaliation against anyone who raises an issue or concern in good faith or assists with an inquiry or investigation. Periodically, the Audit Committee receives reports on the Code of Conduct program.
JPMorgan Chase & Co./2023 Form 10-K | 151 | |||||||
Management’s discussion and analysis
CONDUCT RISK MANAGEMENT | ||||||||||||||
Conduct risk, a subcategory of operational risk, is the risk that any action or misconduct by an employee could lead to unfair client or customer outcomes, impact the integrity of the markets in which the Firm operates, harm employees or the Firm, or compromise the Firm’s reputation.
Overview
Each LOB and Corporate is accountable for identifying and managing its conduct risk to provide appropriate engagement, ownership and sustainability of a culture consistent with the Firm’s Business Principles. The Business Principles serve as a guide for how employees are expected to conduct themselves. With the Business Principles serving as a guide, the Firm’s Code sets out the Firm’s expectations for each employee and provides information and resources to help employees conduct business ethically and in compliance with applicable laws, rules and regulations everywhere the Firm operates. Refer to Compliance Risk Management on page 151 for further discussion of the Code.
Governance and oversight
The Firm maintains oversight and coordination of its conduct risk through the CCOR Management Framework.
The Firm has a senior forum that provides oversight of the Firm’s conduct initiatives to develop a more holistic view of conduct risks and to connect key programs across the Firm in order to identify opportunities and emerging areas of focus. This forum is responsible for setting overall program direction for strategic enhancements to the Firm's employee conduct framework and reviewing the consolidated Firmwide Conduct Risk Appetite Assessment.
Conduct risk management encompasses various aspects of people management practices throughout the employee life cycle, including recruiting, onboarding, training and development, performance management, promotion and compensation processes. Each LOB, Treasury and CIO, and each designated corporate function completes an assessment of conduct risk periodically, reviews metrics and issues which may involve conduct risk, and provides conduct education as appropriate.
152 | JPMorgan Chase & Co./2023 Form 10-K | |||||||
LEGAL RISK MANAGEMENT | ||||||||||||||
Legal risk, a subcategory of operational risk, is the risk of loss primarily caused by the actual or alleged failure to meet legal obligations that arise from the rule of law in jurisdictions in which the Firm operates, agreements with clients and customers, and products and services offered by the Firm.
Overview
The global Legal function (“Legal”) provides legal services and advice to the Firm. Legal is responsible for managing the Firm’s exposure to legal risk by:
•managing actual and potential litigation and enforcement matters, including internal reviews and investigations related to such matters
•advising on products and services, including contract negotiation and documentation
•advising on offering and marketing documents and new business initiatives
•managing dispute resolution
•interpreting existing laws, rules and regulations, and advising on changes to them
•advising on advocacy in connection with contemplated and proposed laws, rules and regulations, and
•providing legal advice to the LOBs, Corporate and the Board.
Legal selects, engages and manages outside counsel for the Firm on all matters in which outside counsel is engaged. In addition, Legal advises the Firm’s Conflicts Office which reviews the Firm’s wholesale transactions that may have the potential to create conflicts of interest for the Firm.
Governance and oversight
The Firm’s General Counsel reports to the CEO and is a member of the Operating Committee, the Firmwide Risk Committee and the Firmwide Control Committee. The Firm’s General Counsel and other members of Legal report on significant legal matters to the Firm’s Board of Directors and to the Audit Committee.
Legal serves on and advises various committees and advises the Firm’s LOBs and Corporate on potential reputation risk issues.
JPMorgan Chase & Co./2023 Form 10-K | 153 | |||||||
Management’s discussion and analysis
ESTIMATIONS AND MODEL RISK MANAGEMENT | ||||||||||||||
Estimations and Model risk, a subcategory of operational risk, is the potential for adverse consequences from decisions based on incorrect or misused estimation outputs.
The Firm uses models and other analytical and judgment-based estimations across various businesses and functions. The estimation methods are of varying levels of sophistication and are used for many purposes, such as the valuation of positions and measurement of risk, assessing regulatory capital requirements, conducting stress testing, evaluating the allowance for credit losses and making business decisions. A dedicated independent function, Model Risk Governance and Review (“MRGR”), defines and governs the Firm’s policies relating to the management of model risk and risks associated with certain analytical and judgment-based estimations, such as those used in risk management, budget forecasting and capital planning and analysis.
The governance of analytical and judgment-based estimations within MRGR’s scope follows a consistent approach which is used for models, as described in detail below.
Model risks are owned by the users of the models within the LOBs and Corporate based on the specific purposes of such models. Users and developers of models are responsible for developing, implementing and testing their models, as well as referring models to MRGR for review and approval. Once models have been approved, model users and developers are responsible for maintaining a robust operating environment, and must monitor and evaluate the performance of the models on an ongoing basis. Model users and developers may seek to enhance models in response to changes in the relevant portfolios and in product and market developments, as well as to capture improvements in available modeling techniques and systems capabilities.
Models are tiered based on an internal standard according to their complexity, the exposure associated with the model and the Firm’s reliance on the model. This tiering is subject to the approval of MRGR. In its review of a model, MRGR considers whether the model is suitable for the specific purposes for which it will be used. When reviewing a model, MRGR analyzes and challenges the model methodology and the reasonableness of model assumptions, and may perform or require additional testing, including back-testing of model outcomes. Model reviews are approved by the appropriate level of management within MRGR based on the relevant model tier.
Under the Firm’s Estimations and Model Risk Management Policy, MRGR reviews and approves new models, as well as material changes to existing models, prior to their use. In certain circumstances, exceptions may be granted to the Firm’s policy to allow a model to be used prior to review or approval. MRGR may also require the user to take appropriate actions to mitigate the model risk if it is to be used in the interim. These actions will depend on the model and may include, for example, limitation of trading activity.
While models are inherently imprecise, the degree of imprecision or uncertainty can be heightened by the market or economic environment. This is particularly true when the current and forecasted environments are significantly different from the historical environments upon which the models were developed. This increased uncertainty may necessitate a greater degree of judgment and analytics to inform any adjustments that the Firm may make to model outputs than would otherwise be the case. In addition, the Firm may experience increased uncertainty in its estimates if assets acquired differ from those used to develop the models.
Refer to Critical Accounting Estimates Used by the Firm on pages 155–158 and Note 2 for a summary of model-based valuations and other valuation techniques.
154 | JPMorgan Chase & Co./2023 Form 10-K | |||||||
| CRITICAL ACCOUNTING ESTIMATES USED BY THE FIRM | ||||||||||||||
JPMorgan Chase’s accounting policies and use of estimates are integral to understanding its reported results. The Firm’s most complex accounting estimates require management’s judgment to ascertain the appropriate carrying value of assets and liabilities. The Firm has established policies and control procedures intended to ensure that estimation methods, including any judgments made as part of such methods, are well-controlled, independently reviewed and applied consistently from period to period. The methods used and judgments made reflect, among other factors, the nature of the assets or liabilities and the related business and risk management strategies, which may vary across the Firm’s businesses and portfolios. In addition, the policies and procedures are intended to ensure that the process for changing methodologies occurs in an appropriate manner. The Firm believes its estimates for determining the carrying value of its assets and liabilities are appropriate. The following is a brief description of the Firm’s critical accounting estimates involving significant judgments.
Allowance for credit losses
The Firm’s allowance for credit losses represents management’s estimate of expected credit losses over the remaining expected life of the Firm’s financial assets measured at amortized cost and certain off-balance sheet lending-related commitments. The allowance for credit losses generally comprises:
•The allowance for loan losses, which covers the Firm’s retained loan portfolios (scored and risk-rated),
•The allowance for lending-related commitments and
•The allowance for credit losses on investment securities.
The allowance for credit losses involves significant judgment on a number of matters including development and weighting of macroeconomic forecasts, incorporation of historical loss experience, assessment of risk characteristics, assignment of risk ratings, valuation of collateral, and the determination of remaining expected life. Refer to Note 10 and Note 13 for further information on these judgments as well as the Firm’s policies and methodologies used to determine the Firm’s allowance for credit losses.
One of the most significant judgments involved in estimating the Firm’s allowance for credit losses relates to the macroeconomic forecasts used to estimate credit losses over the eight-quarter forecast period within the Firm’s methodology. The eight-quarter forecast incorporates hundreds of macroeconomic variables (“MEVs”) that are relevant for exposures across the Firm, with modeled credit losses being driven primarily by a subset of less than twenty variables. The specific variables that have the greatest effect on the modeled losses of each portfolio vary by portfolio and geography.
•Key MEVs for the consumer portfolio include regional U.S. unemployment rates and U.S. HPI.
•Key MEVs for the wholesale portfolio include U.S. unemployment, U.S. real GDP, U.S. equity prices, U.S. interest rates, U.S. corporate credit spreads, oil prices, U.S. commercial real estate prices and U.S. HPI.
Changes in the Firm’s assumptions and forecasts of economic conditions could significantly affect its estimate of expected credit losses in the portfolio at the balance sheet date or lead to significant changes in the estimate from one reporting period to the next.
As a result of the First Republic acquisition, the Firm recorded an allowance for credit losses for the loans acquired and lending-related commitments assumed as of May 1, 2023. Given the differences in risk rating methodologies for the First Republic portfolio, and the ongoing integration of products and systems, the allowance for credit losses for the acquired wholesale portfolio was measured based on other facilities underwritten by the Firm with similar risk characteristics and not based on modeled estimates. As such, the First Republic wholesale portfolio is excluded from the modeled estimates sensitivity analysis below. The allowance for credit losses for predominantly all of the consumer portfolio was measured using the Firm’s modeled approach, as the consumer portfolio is predominantly residential real estate that has more commonly defined risk characteristics including loan to value ratio and credit score, and therefore is reflected in the sensitivity analysis below. Refer to Note 34 for additional information on the First Republic acquisition.
It is difficult to estimate how potential changes in any one factor or input might affect the overall allowance for credit losses because management considers a wide variety of factors and inputs in estimating the allowance for credit losses. Changes in the factors and inputs considered may not occur at the same rate and may not be consistent across all geographies or product types, and changes in factors and inputs may be directionally inconsistent, such that improvement in one factor or input may offset deterioration in others.
To consider the impact of a hypothetical alternate macroeconomic forecast, the Firm compared the modeled credit losses determined using its central and relative adverse macroeconomic scenarios, which are two of the five scenarios considered in estimating the allowances for loan losses and lending-related commitments. The central and relative adverse scenarios each included a full suite of MEVs, but differed in the levels, paths and peaks/troughs of those variables over the eight-quarter forecast period.
For example, compared to the Firm’s central scenario shown on page 131 and in Note 13, the Firm’s relative adverse scenario assumes an elevated U.S. unemployment rate, averaging approximately 2.1% higher over the eight-quarter forecast, with a peak difference of approximately 2.7% in the fourth quarter of 2024; lower U.S. real GDP with a slower recovery, remaining nearly 3.3% lower at the end of the eight-quarter forecast, with a peak difference of
JPMorgan Chase & Co./2023 Form 10-K | 155 | |||||||
Management’s discussion and analysis
approximately 3.9% in the fourth quarter of 2024; and lower HPI with a peak difference of approximately 17.9% in the third quarter of 2025.
This analysis is not intended to estimate expected future changes in the allowance for credit losses, for a number of reasons, including:
•The allowance as of December 31, 2023, reflects credit losses beyond those estimated under the central scenario due to the weight placed on the adverse scenarios.
•The impacts of changes in many MEVs are both interrelated and nonlinear, so the results of this analysis cannot be simply extrapolated for more severe changes in macroeconomic variables.
•Expectations of future changes in portfolio composition and borrower behavior can significantly affect the allowance for credit losses.
To demonstrate the sensitivity of credit loss estimates to macroeconomic forecasts as of December 31, 2023, the Firm compared the modeled estimates under its relative adverse scenario to its central scenario. Without considering offsetting or correlated effects in other qualitative components of the Firm’s allowance for credit losses, the comparison between these two scenarios for the exposures below reflect the following differences:
•An increase of approximately $850 million for residential real estate loans and lending-related commitments
•An increase of approximately $3.1 billion for credit card loans
•An increase of approximately $3.9 billion for wholesale loans and lending-related commitments
This analysis relates only to the modeled credit loss estimates and is not intended to estimate changes in the overall allowance for credit losses as it does not reflect any potential changes in other adjustments to the quantitative calculation, which would also be influenced by the judgment management applies to the modeled lifetime loss estimates to reflect the uncertainty and imprecision of these modeled lifetime loss estimates based on then-current circumstances and conditions.
Recognizing that forecasts of macroeconomic conditions are inherently uncertain, the Firm believes that its process to consider the available information and associated risks and uncertainties is appropriately governed and that its estimates of expected credit losses were reasonable and appropriate for the period ended December 31, 2023.
Fair value
JPMorgan Chase carries a portion of its assets and liabilities at fair value. The majority of such assets and liabilities are measured at fair value on a recurring basis, including derivatives, structured note products and certain securities financing agreements. Certain assets and liabilities are measured at fair value on a nonrecurring basis, including certain mortgage, home equity and other loans, where the carrying value is based on the fair value of the underlying collateral.
Assets measured at fair value
The following table includes the Firm’s assets measured at fair value and the portion of such assets that are classified within level 3 of the fair value hierarchy. Refer to Note 2 for further information.
| December 31, 2023 (in millions, except ratios) | Total assets at fair value | Total level 3 assets | |||||||||
| Federal funds sold and securities purchased under resale agreements | $ | 259,813 | $ | — | |||||||
| Securities borrowed | 70,086 | — | |||||||||
| Trading assets: | |||||||||||
| Trading-debt and equity instruments | 485,701 | 2,373 | |||||||||
Derivative receivables(a) | 54,864 | 8,924 | |||||||||
| Total trading assets | 540,565 | 11,297 | |||||||||
| AFS securities | 201,704 | — | |||||||||
| Loans | 38,851 | 3,079 | |||||||||
| MSRs | 8,522 | 8,522 | |||||||||
| Other | 11,322 | 758 | |||||||||
Total assets measured at fair value on a recurring basis | 1,130,863 | 23,656 | |||||||||
Total assets measured at fair value on a nonrecurring basis | 3,141 | 2,490 | |||||||||
Total assets measured at fair value | $ | 1,134,004 | $ | 26,146 | |||||||
| Total Firm assets | $ | 3,875,393 | |||||||||
Level 3 assets at fair value as a percentage of total Firm assets(a) | 1 | % | |||||||||
Level 3 assets at fair value as a percentage of total Firm assets at fair value(a) | 2 | % | |||||||||
(a)For purposes of the table above, the derivative receivables total reflects the impact of netting adjustments; however, the $8.9 billion of derivative receivables classified as level 3 does not reflect the netting adjustment as such netting is not relevant to a presentation based on the transparency of inputs to the valuation of an asset. The level 3 balances would be reduced if netting were applied, including the netting benefit associated with cash collateral.
156 | JPMorgan Chase & Co./2023 Form 10-K | |||||||
Valuation
Details of the Firm’s processes for determining fair value are set out in Note 2. Estimating fair value requires the application of judgment. The type and level of judgment required is largely dependent on the amount of observable market information available to the Firm. For instruments valued using internally developed valuation models and other valuation techniques that use significant unobservable inputs and are therefore classified within level 3 of the fair value hierarchy, judgments used to estimate fair value are more significant than those required when estimating the fair value of instruments classified within levels 1 and 2.
In arriving at an estimate of fair value for an instrument within level 3, management must first determine the appropriate valuation model or other valuation technique to use. Second, the lack of observability of certain significant inputs requires management to assess relevant empirical data in deriving valuation inputs including, for example, transaction details, yield curves, interest rates, prepayment speeds, default rates, volatilities, correlations, prices (such as commodity, equity or debt prices), valuations of comparable instruments, foreign exchange rates and credit curves. Refer to Note 2 for a further discussion of the valuation of level 3 instruments, including unobservable inputs used.
For instruments classified in levels 2 and 3, management judgment must be applied to assess the appropriate level of valuation adjustments to reflect counterparty credit quality, the Firm’s creditworthiness, market funding rates, liquidity considerations, unobservable parameters, and for portfolios that meet specified criteria, the size of the net open risk position. The judgments made are typically affected by the type of product and its specific contractual terms, and the level of liquidity for the product or within the market as a whole. In periods of heightened market volatility and uncertainty judgments are further affected by the wider variation of reasonable valuation estimates, particularly for positions that are less liquid. Refer to Note 2 for a further discussion of valuation adjustments applied by the Firm.
Imprecision in estimating unobservable market inputs or other factors can affect the amount of gain or loss recorded for a particular position. Furthermore, while the Firm believes its valuation methods are appropriate and consistent with those of other market participants, the methods and assumptions used reflect management judgment and may vary across the Firm’s businesses and portfolios.
The Firm uses various methodologies and assumptions in the determination of fair value. The use of methodologies or assumptions different than those used by the Firm could result in a different estimate of fair value at the reporting date. Refer to Note 2 for a detailed discussion of the Firm’s valuation process and hierarchy, and its determination of fair value for individual financial instruments.
Goodwill impairment
Under U.S. GAAP, goodwill must be allocated to reporting units and tested for impairment at least annually. The Firm’s process and methodology used to conduct goodwill impairment testing is described in Note 15.
Management applies significant judgment when testing goodwill for impairment. The goodwill associated with each business combination is allocated to the related reporting units for goodwill impairment testing.
For the year ended December 31, 2023, the Firm reviewed current economic conditions, estimated market cost of equity, as well as actual business results and projections of business performance. Based on such reviews, the Firm has concluded that goodwill was not impaired as of December 31, 2023. For each of the reporting units, fair value exceeded carrying value by at least 9% and there was no indication of a significant risk of goodwill impairment based on current projections and valuations.
The projections for the Firm’s reporting units are consistent with management’s current business outlook assumptions in the short term, and the Firm’s best estimates of long-term growth and return on equity in the longer term. Where possible, the Firm uses third-party and peer data to benchmark its assumptions and estimates.
Refer to Note 15 for additional information on goodwill, including the goodwill impairment assessment as of December 31, 2023.
Credit card rewards liability
JPMorgan Chase offers credit cards with various rewards programs which allow cardholders to earn rewards points based on their account activity and the terms and conditions of the rewards program. Generally, there are no limits on the points that an eligible cardholder can earn, nor do the points expire, and the points can be redeemed for a variety of rewards, including cash (predominantly in the form of account credits), gift cards and travel. The Firm maintains a rewards liability which represents the estimated cost of rewards points earned and expected to be redeemed by cardholders. The liability is accrued as the cardholder earns the benefit and is reduced when the cardholder redeems points. This liability was $13.2 billion and $11.3 billion at December 31, 2023 and 2022, respectively, and is recorded in accounts payable and other liabilities on the Consolidated balance sheets. The increase in the liability was predominantly driven by continued growth in rewards points earned on higher spend and promotional offers outpacing redemptions throughout 2023, and, to a lesser extent, adjustments to certain reward program terms in the second quarter of 2023.
The rewards liability is sensitive to redemption rate (“RR”) and cost per point (“CPP”) assumptions. The RR assumption is used to estimate the number of points earned by customers that will be redeemed over the life of the account. The CPP assumption is used to estimate the cost of future point redemptions. These assumptions are evaluated periodically considering historical actuals, cardholder
JPMorgan Chase & Co./2023 Form 10-K | 157 | |||||||
Management’s discussion and analysis
redemption behavior and management judgment. Updates to these assumptions will impact the rewards liability. As of December 31, 2023, a combined increase of 25 basis points in RR and 1 basis point in CPP would increase the rewards liability by approximately $376 million.
Income taxes
JPMorgan Chase is subject to the income tax laws of the various jurisdictions in which it operates, including U.S. federal, state and local, and non-U.S. jurisdictions. These laws are often complex and may be subject to different interpretations. To determine the financial statement impact of accounting for income taxes, including the provision for income tax expense and unrecognized tax benefits, JPMorgan Chase must make assumptions and judgments about how to interpret and apply these complex tax laws to numerous transactions and business events, as well as make judgments regarding the timing of when certain items may affect taxable income in the U.S. and non-U.S. tax jurisdictions.
JPMorgan Chase’s interpretations of tax laws around the world are subject to review and examination by the various taxing authorities in the jurisdictions where the Firm operates, and disputes may occur regarding its view on a tax position. These disputes over interpretations with the various taxing authorities may be settled by audit, administrative appeals or adjudication in the court systems of the tax jurisdictions in which the Firm operates. JPMorgan Chase regularly reviews whether it may be assessed additional income taxes as a result of the resolution of these matters, and the Firm records additional unrecognized tax benefits, as appropriate. In addition, the Firm may revise its estimate of income taxes due to changes in income tax laws, legal interpretations, and business strategies. It is possible that revisions in the Firm’s estimate of income taxes may materially affect the Firm’s results of operations in any reporting period.
Deferred taxes arise from differences between assets and liabilities measured for financial reporting versus income tax return purposes. Deferred tax assets are recognized if, in management’s judgment, their realizability is determined to be more likely than not. Deferred taxes are measured using enacted tax rates expected to apply to taxable income in the years in which those temporary differences are expected to be recovered or settled. The effect on deferred taxes of a change in tax rates is recognized within the provision for income taxes in the period enacted.
The Firm has also recognized deferred tax assets in connection with certain tax attributes, including net operating loss (“NOL”) carryforwards and foreign tax credit (“FTC”) carryforwards. The Firm performs regular reviews to ascertain whether its deferred tax assets are realizable. These reviews include management’s estimates and assumptions regarding future taxable income, including foreign source income, and may incorporate various tax planning strategies, including strategies that may be available to utilize NOLs and FTCs before they expire. In connection with these reviews, if it is determined that a
deferred tax asset is not realizable, a valuation allowance is established. The valuation allowance may be reversed in a subsequent reporting period if the Firm determines that, based on revised estimates of future taxable income or changes in tax planning strategies, it is more likely than not that all or part of the deferred tax asset will become realizable. As of December 31, 2023, management has determined it is more likely than not that the Firm will realize its deferred tax assets, net of the existing valuation allowance.
The Firm adjusts its unrecognized tax benefits as necessary when new information becomes available, including changes in tax law and regulations, and interactions with taxing authorities. Uncertain tax positions that meet the more-likely-than-not recognition threshold are measured to determine the amount of benefit to recognize. An uncertain tax position is measured at the largest amount of benefit that management believes is more likely than not to be realized upon settlement. It is possible that the reassessment of JPMorgan Chase’s unrecognized tax benefits may have a material impact on its effective income tax rate in the period in which the reassessment occurs. Although the Firm believes that its estimates are reasonable, the final tax amount could be different from the amounts reflected in the Firm’s income tax provisions and accruals. To the extent that the final outcome of these amounts is different than the amounts recorded, such differences will generally impact the Firm’s provision for income taxes in the period in which such a determination is made.
The Firm’s provision for income taxes is composed of current and deferred taxes. The current and deferred tax provisions are calculated based on estimates and assumptions that could differ from the actual results reflected in income tax returns filed during the subsequent year. Adjustments based on filed returns are generally recorded in the period when the tax returns are filed and the global tax implications are known, which could impact the Firm’s effective tax rate.
Refer to Note 25 for additional information on income taxes.
Litigation reserves
Refer to Note 30 for a description of the significant estimates and judgments associated with establishing litigation reserves.
158 | JPMorgan Chase & Co./2023 Form 10-K | |||||||
| ACCOUNTING AND REPORTING DEVELOPMENTS | ||||||||||||||
| Financial Accounting Standards Board (“FASB”) Standards Adopted since January 1, 2021 | |||||||||||
| Standard | Summary of guidance | Effects on financial statements | |||||||||
Reference Rate Reform Issued March 2020 and updated January 2021 and December 2022 | •Provides optional expedients and exceptions to current accounting guidance when financial instruments, hedge accounting relationships, and other transactions are amended due to reference rate reform. | •Issued and effective March 12, 2020. The January 7, 2021 and December 21, 2022 updates were effective when issued. | |||||||||
FASB Standards Adopted since January 1, 2023 | |||||||||||
Standard | Summary of guidance | Effects on financial statements | |||||||||
Derivatives and Hedging: Fair Value Hedging – Portfolio Layer Method Issued March 2022 | •Expands the ability to hedge a portfolio of fixed-rate assets to allow more types of assets to be included in the portfolio, and to allow more of the portfolio to be hedged. •Clarifies the types of derivatives that can be used as hedges, and the balance sheet presentation and disclosure requirements for the hedge accounting adjustments. •Allows a one-time reclassification from HTM to AFS upon adoption. | •Adopted prospectively on January 1, 2023. •Refer to Note 1 for further information. | |||||||||
Financial Instruments – Credit Losses: Troubled Debt Restructurings and Vintage Disclosures Issued March 2022 | •Eliminates existing accounting and disclosure requirements for Troubled Debt Restructurings, including the requirement to measure the allowance using a discounted cash flow methodology. •Requires disclosure of loan modifications for borrowers experiencing financial difficulty involving principal forgiveness, interest rate reduction, other-than-insignificant payment delay, term extension or a combination of these modifications. •Requires disclosure of current period loan charge-off information by origination year. •May be adopted prospectively, or by using a modified retrospective method wherein the effect of adoption is reflected as an adjustment to retained earnings at the effective date. | •Adopted under the modified retrospective method on January 1, 2023. •Refer to Note 1 for further information. | |||||||||
JPMorgan Chase & Co./2023 Form 10-K | 159 | |||||||
Management’s discussion and analysis
FASB Standards Issued but not yet Adopted as of December 31, 2023 | |||||||||||
Standard | Summary of guidance | Effects on financial statements | |||||||||
Investments - Equity Method and Joint Ventures: Accounting for Investments in Tax Credit Structures Using the Proportional Amortization Method Issued March 2023 | •Expands the ability to elect proportional amortization for more types of tax-oriented investments (beyond low income housing tax credit investments) on a program-by-program basis. •May be adopted using a full retrospective method, or a modified retrospective method wherein the effect of adoption is reflected as an adjustment to retained earnings at the effective date. | •Adopted under the modified retrospective method on January 1, 2024, which resulted in a decrease to retained earnings of approximately $200 million. | |||||||||
Segment Reporting: Improvements to Reportable Segment Disclosures Issued November 2023 | •Requires disclosure of significant segment expenses that are readily provided to the chief operating decision maker (“CODM”) and included in segment profit or loss. •Requires disclosure of the composition and aggregate amount of other segment items, which represent the difference between profit or loss and segment revenues less significant segment expenses. •Requires disclosure of the title and position of the CODM and an explanation of how the CODM uses the reported segment measures in assessing segment performance and deciding how to allocate resources. | •Required effective date: Annual financial statements for the year ending December 31, 2024 and interim financial statements for the year ending December 31, 2025.(a) •The Firm is currently assessing the potential impact on its segment disclosures. | |||||||||
Income Taxes: Improvements to Income Tax Disclosures Issued December 2023 | •Requires disclosure of income taxes paid disaggregated by 1) federal, state, and foreign taxes and 2) individual jurisdiction on the basis of a quantitative threshold of equal to or greater than 5 percent of total income taxes paid (net of refunds received). •Requires disclosure of the effective tax rate reconciliation by specific categories, at a minimum, with accompanying qualitative disclosures, and separate disclosure of reconciling items based on quantitative thresholds. •Requires categories within the effective tax rate reconciliation to be further disaggregated if quantitative thresholds are met. | •Required effective date: Annual financial statements for the year ending December 31, 2025.(a) •The guidance can be applied on a prospective basis with the option to apply the standard retrospectively. •The Firm is evaluating the potential impact on the Consolidated Financial Statements disclosures, as well as the Firm’s planned date of adoption. | |||||||||
(a) Early adoption is permitted.
160 | JPMorgan Chase & Co./2023 Form 10-K | |||||||
| FORWARD-LOOKING STATEMENTS | ||||||||||||||
From time to time, the Firm has made and will make forward-looking statements. These statements can be identified by the fact that they do not relate strictly to historical or current facts. Forward-looking statements often use words such as “anticipate,” “target,” “expect,” “estimate,” “intend,” “plan,” “goal,” “believe,” or other words of similar meaning. Forward-looking statements provide JPMorgan Chase’s current expectations or forecasts of future events, circumstances, results or aspirations. JPMorgan Chase’s disclosures in this 2023 Form 10-K contain forward-looking statements within the meaning of the Private Securities Litigation Reform Act of 1995. The Firm also may make forward-looking statements in its other documents filed or furnished with the SEC. In addition, the Firm’s senior management may make forward-looking statements orally to investors, analysts, representatives of the media and others.
All forward-looking statements are, by their nature, subject to risks and uncertainties, many of which are beyond the Firm’s control. JPMorgan Chase’s actual future results may differ materially from those set forth in its forward-looking statements. While there is no assurance that any list of risks and uncertainties or risk factors is complete, below are certain factors which could cause actual results to differ from those in the forward-looking statements:
•Local, regional and global business, economic and political conditions and geopolitical events, including geopolitical tensions and hostilities;
•Changes in laws, rules and regulatory requirements, including capital and liquidity requirements affecting the Firm’s businesses, and the ability of the Firm to address those requirements;
•Heightened regulatory and governmental oversight and scrutiny of JPMorgan Chase’s business practices, including dealings with retail customers;
•Changes in trade, monetary and fiscal policies and laws;
•Changes in the level of inflation;
•Changes in income tax laws, rules, and regulations;
•Changes in FDIC assessments;
•Securities and capital markets behavior, including changes in market liquidity and volatility;
•Changes in investor sentiment or consumer spending or savings behavior;
•Ability of the Firm to manage effectively its capital and liquidity;
•Changes in credit ratings assigned to the Firm or its subsidiaries;
•Damage to the Firm’s reputation;
•Ability of the Firm to appropriately address social, environmental and sustainability concerns that may arise, including from its business activities;
•Ability of the Firm to deal effectively with an economic slowdown or other economic or market disruption,
including, but not limited to, in the interest rate environment;
•Technology changes instituted by the Firm, its counterparties or competitors;
•The effectiveness of the Firm’s control agenda;
•Ability of the Firm to develop or discontinue products and services, and the extent to which products or services previously sold by the Firm require the Firm to incur liabilities or absorb losses not contemplated at their initiation or origination;
•Acceptance of the Firm’s new and existing products and services by the marketplace and the ability of the Firm to innovate and to increase market share;
•Ability of the Firm to attract and retain qualified and diverse employees;
•Ability of the Firm to control expenses;
•Competitive pressures;
•Changes in the credit quality of the Firm’s clients, customers and counterparties;
•Adequacy of the Firm’s risk management framework, disclosure controls and procedures and internal control over financial reporting;
•Adverse judicial or regulatory proceedings;
•Ability of the Firm to determine accurate values of certain assets and liabilities;
•Occurrence of natural or man-made disasters or calamities, including health emergencies, the spread of infectious diseases, epidemics or pandemics, an outbreak or escalation of hostilities or other geopolitical instabilities, the effects of climate change or extraordinary events beyond the Firm’s control, and the Firm’s ability to deal effectively with disruptions caused by the foregoing;
•Ability of the Firm to maintain the security of its financial, accounting, technology, data processing and other operational systems and facilities;
•Ability of the Firm to withstand disruptions that may be caused by any failure of its operational systems or those of third parties;
•Ability of the Firm to effectively defend itself against cyber attacks and other attempts by unauthorized parties to access information of the Firm or its customers or to disrupt the Firm’s systems; and
•The other risks and uncertainties detailed in Part I, Item 1A: Risk Factors in JPMorgan Chase’s 2023 Form 10-K.
Any forward-looking statements made by or on behalf of the Firm speak only as of the date they are made, and JPMorgan Chase does not undertake to update any forward-looking statements. The reader should, however, consult any further disclosures of a forward-looking nature the Firm may make in any subsequent Annual Reports on Form 10-Ks, Quarterly Reports on Form 10-Qs, or Current Reports on Form 8-K.
JPMorgan Chase & Co./2023 Form 10-K | 161 | |||||||
Management’s report on internal control over financial reporting
Management of JPMorgan Chase & Co. (“JPMorgan Chase” or the “Firm”) is responsible for establishing and maintaining adequate internal control over financial reporting. Internal control over financial reporting is a process designed by, or under the supervision of, the Firm’s principal executive and principal financial officers, or persons performing similar functions, and effected by JPMorgan Chase’s Board of Directors, management and other personnel, to provide reasonable assurance regarding the reliability of financial reporting and the preparation of financial statements for external purposes in accordance with accounting principles generally accepted in the United States of America (“U.S. GAAP”).
JPMorgan Chase’s internal control over financial reporting includes those policies and procedures that (1) pertain to the maintenance of records, that, in reasonable detail, accurately and fairly reflect the transactions and dispositions of the Firm’s assets; (2) provide reasonable assurance that transactions are recorded as necessary to permit preparation of financial statements in accordance with U.S. GAAP, and that receipts and expenditures of the Firm are being made only in accordance with authorizations of JPMorgan Chase’s management and directors; and (3) provide reasonable assurance regarding prevention or timely detection of unauthorized acquisition, use or disposition of the Firm’s assets that could have a material effect on the financial statements.
Because of its inherent limitations, internal control over financial reporting may not prevent or detect misstatements. Also, projections of any evaluation of effectiveness to future periods are subject to the risk that controls may become inadequate because of changes in conditions, or that the degree of compliance with the policies or procedures may deteriorate. Management has completed an assessment of the effectiveness of the Firm’s internal control over financial reporting as of December 31, 2023. In making the assessment, management used the “Internal Control — Integrated Framework” (“COSO 2013”) promulgated by the Committee of Sponsoring Organizations of the Treadway Commission (“COSO”).
Based upon the assessment performed, management concluded that as of December 31, 2023, JPMorgan Chase’s internal control over financial reporting was effective based upon the COSO 2013 framework. Additionally, based upon management’s assessment, the Firm determined that there were no material weaknesses in its internal control over financial reporting as of December 31, 2023.
The effectiveness of the Firm’s internal control over financial reporting as of December 31, 2023, has been audited by PricewaterhouseCoopers LLP, an independent registered public accounting firm, as stated in their report which appears herein.

James Dimon
Chairman and Chief Executive Officer

Jeremy Barnum
Executive Vice President and Chief Financial Officer
February 16, 2024
162 | JPMorgan Chase & Co./2023 Form 10-K | |||||||
Report of Independent Registered Public Accounting Firm

To the Board of Directors and Shareholders of JPMorgan Chase & Co.:
Opinions on the Financial Statements and Internal Control over Financial Reporting
We have audited the accompanying consolidated balance sheets of JPMorgan Chase & Co. and its subsidiaries (the “Firm”) as of December 31, 2023 and 2022, and the related consolidated statements of income, comprehensive income, changes in stockholders’ equity and cash flows for each of the three years in the period ended December 31, 2023, including the related notes (collectively referred to as the “consolidated financial statements”). We also have audited the Firm’s internal control over financial reporting as of December 31, 2023, based on criteria established in Internal Control - Integrated Framework (2013) issued by the Committee of Sponsoring Organizations of the Treadway Commission (COSO).
In our opinion, the consolidated financial statements referred to above present fairly, in all material respects, the financial position of the Firm as of December 31, 2023 and 2022, and the results of its operations and its cash flows for each of the three years in the period ended December 31, 2023 in conformity with accounting principles generally accepted in the United States of America. Also in our opinion, the Firm maintained, in all material respects, effective internal control over financial reporting as of December 31, 2023, based on criteria established in Internal Control – Integrated Framework (2013) issued by the COSO.
Basis for Opinions
The Firm’s management is responsible for these consolidated financial statements, for maintaining effective internal control over financial reporting, and for its assessment of the effectiveness of internal control over financial reporting, included in the accompanying Management’s report on internal control over financial reporting. Our responsibility is to express opinions on the Firm’s consolidated financial statements and on the Firm’s internal control over financial reporting based on our audits. We are a public accounting firm registered with the Public Company Accounting Oversight Board (United States) (PCAOB) and are required to be independent with respect to the Firm in accordance with the U.S. federal securities laws and the applicable rules and regulations of the Securities and Exchange Commission and the PCAOB.
We conducted our audits in accordance with the standards of the PCAOB. Those standards require that we plan and perform the audits to obtain reasonable assurance about
whether the consolidated financial statements are free of material misstatement, whether due to error or fraud, and whether effective internal control over financial reporting was maintained in all material respects.
Our audits of the consolidated financial statements included performing procedures to assess the risks of material misstatement of the consolidated financial statements, whether due to error or fraud, and performing procedures that respond to those risks. Such procedures included examining, on a test basis, evidence regarding the amounts and disclosures in the consolidated financial statements. Our audits also included evaluating the accounting principles used and significant estimates made by management, as well as evaluating the overall presentation of the consolidated financial statements. Our audit of internal control over financial reporting included obtaining an understanding of internal control over financial reporting, assessing the risk that a material weakness exists, and testing and evaluating the design and operating effectiveness of internal control based on the assessed risk. Our audits also included performing such other procedures as we considered necessary in the circumstances. We believe that our audits provide a reasonable basis for our opinions.
Definition and Limitations of Internal Control over Financial Reporting
A company’s internal control over financial reporting is a process designed to provide reasonable assurance regarding the reliability of financial reporting and the preparation of financial statements for external purposes in accordance with generally accepted accounting principles. A company’s internal control over financial reporting includes those policies and procedures that (i) pertain to the maintenance of records that, in reasonable detail, accurately and fairly reflect the transactions and dispositions of the assets of the company; (ii) provide reasonable assurance that transactions are recorded as necessary to permit preparation of financial statements in accordance with generally accepted accounting principles, and that receipts and expenditures of the company are being made only in accordance with authorizations of management and directors of the company; and (iii) provide reasonable assurance regarding prevention or timely detection of unauthorized acquisition, use, or disposition of the company’s assets that could have a material effect on the financial statements.
Because of its inherent limitations, internal control over financial reporting may not prevent or detect misstatements. Also, projections of any evaluation of effectiveness to future periods are subject to the risk that controls may become inadequate because of changes in conditions, or that the degree of compliance with the policies or procedures may deteriorate.
JPMorgan Chase & Co./2023 Form 10-K | 163 | |||||||
Report of Independent Registered Public Accounting Firm
Critical Audit Matters
The critical audit matters communicated below are matters arising from the current period audit of the consolidated financial statements that were communicated or required to be communicated to the audit committee and that (i) relate to accounts or disclosures that are material to the consolidated financial statements and (ii) involved our especially challenging, subjective, or complex judgments. The communication of critical audit matters does not alter in any way our opinion on the consolidated financial statements, taken as a whole, and we are not, by communicating the critical audit matters below, providing separate opinions on the critical audit matters or on the accounts or disclosures to which they relate.
Allowance for Loan Losses – Portfolio-based component of Wholesale Loan and Credit Card Loan Portfolios
As described in Note 13 to the consolidated financial statements, the allowance for loan losses for the portfolio-based component of the wholesale and credit card loan portfolios was $20.2 billion on total portfolio-based retained loans of $881.3 billion at December 31, 2023. The Firm’s allowance for loan losses represents management’s estimate of expected credit losses over the remaining expected life of the Firm's loan portfolios and considers expected future changes in macroeconomic conditions. The portfolio-based component of the Firm’s allowance for loan losses for the wholesale and credit card retained loan portfolios begins with a quantitative calculation of expected credit losses over the expected life of the loan by applying credit loss factors to the estimated exposure at default. The credit loss factors applied are determined based on the weighted average of five internally developed macroeconomic scenarios that take into consideration the Firm's economic outlook as derived through forecast macroeconomic variables, the most significant of which are U.S. unemployment and U.S. real gross domestic product. This quantitative calculation is further adjusted to take into consideration model imprecision, emerging risk assessments, trends and other subjective factors that are not yet otherwise reflected in the credit loss estimate.
The principal considerations for our determination that performing procedures relating to the allowance for loan losses for the portfolio-based component of the wholesale and credit card loan portfolios is a critical audit matter are (i) the significant judgment and estimation by management in the forecast of macroeconomic variables, specifically U.S. unemployment and U.S. real gross domestic product, as the Firm’s forecasts of economic conditions significantly affect its estimate of expected credit losses at the balance sheet date, (ii) the significant judgment and estimation by management in determining the quantitative calculation utilized in their credit loss estimates and the adjustments to take into consideration model imprecision, emerging risk assessments, trends and other subjective factors that are not yet otherwise reflected in the credit loss estimate, which both in turn led to a high degree of auditor judgment, subjectivity, and effort in performing procedures and in
evaluating audit evidence obtained relating to the credit loss estimates and the appropriateness of the adjustments to the credit loss estimates, and (iii) the audit effort involved the use of professionals with specialized skill and knowledge.
Addressing the matter involved performing procedures and evaluating audit evidence in connection with forming our overall opinion on the consolidated financial statements. These procedures included testing the effectiveness of controls relating to the Firm’s allowance for loan losses, including controls over model validation and generation of macroeconomic scenarios. These procedures also included, among others, testing management’s process for estimating the allowance for loan losses, which involved (i) evaluating the appropriateness of the models and methodologies used in quantitative calculations; (ii) evaluating the reasonableness of forecasts of U.S. unemployment and U.S. real gross domestic product; (iii) testing the completeness and accuracy of data used in the estimate; and (iv) evaluating the reasonableness of management’s adjustments to the quantitative output for the impacts of model imprecision, emerging risk assessments, trends and other subjective factors that are not yet otherwise reflected in the credit loss estimate. These procedures also included the use of professionals with specialized skill and knowledge to assist in evaluating the appropriateness of certain models, methodologies and macroeconomic variables.
Fair Value of Certain Level 3 Financial Instruments
As described in Notes 2 and 3 to the consolidated financial statements, the Firm carries $1.1 trillion of its assets and $541.4 billion of its liabilities at fair value on a recurring basis. Included in these balances are $11.3 billion of trading assets and $42.2 billion of liabilities measured at fair value on a recurring basis, collectively financial instruments, which are classified as level 3 as they contain one or more inputs to valuation which are unobservable and significant to their fair value measurement. The Firm utilized internally developed valuation models and unobservable inputs to estimate fair value of the level 3 financial instruments. The unobservable inputs used by management to estimate the fair value of certain of these financial instruments include interest rate volatility, interest rate spread volatility, Bermudan switch value, and correlation relating to interest rates, interest rate-to-foreign exchange, equity prices, equity-to-foreign exchange, equity-to-interest rate and credit.
The principal considerations for our determination that performing procedures relating to the fair value of certain level 3 financial instruments is a critical audit matter are (i) the significant judgment and estimation by management in determining the inputs to estimate fair value, which in turn led to a high degree of auditor judgment, subjectivity, and effort in performing procedures and in evaluating audit evidence obtained related to the fair value of these financial instruments, and (ii) the audit effort involved the use of professionals with specialized skill and knowledge.
164 | JPMorgan Chase & Co./2023 Form 10-K | |||||||
Report of Independent Registered Public Accounting Firm
Addressing the matter involved performing procedures and evaluating audit evidence in connection with forming our overall opinion on the consolidated financial statements. These procedures included testing the effectiveness of controls relating to the Firm’s determination of the fair value, including controls over models, inputs, and data. These procedures also included, among others, the involvement of professionals with specialized skill and knowledge to assist in developing an independent estimate of fair value for a sample of these financial instruments and comparing management’s estimate to the independently developed estimate of fair value. Developing the independent estimate involved testing the completeness and accuracy of data provided by management, developing independent inputs and, as appropriate, evaluating and utilizing management’s aforementioned unobservable inputs.

February 16, 2024
We have served as the Firm’s auditor since 1965.
JPMorgan Chase & Co./2023 Form 10-K | 165 | |||||||
JPMorgan Chase & Co.
Consolidated statements of income
| Year ended December 31, (in millions, except per share data) | 2023 | 2022 | 2021 | ||||||||||||||
| Revenue | |||||||||||||||||
| Investment banking fees | $ | $ | $ | ||||||||||||||
| Principal transactions | |||||||||||||||||
| Lending- and deposit-related fees | |||||||||||||||||
| Asset management fees | |||||||||||||||||
| Commissions and other fees | |||||||||||||||||
Investment securities losses | ( | ( | ( | ||||||||||||||
| Mortgage fees and related income | |||||||||||||||||
| Card income | |||||||||||||||||
| Other income | |||||||||||||||||
| Noninterest revenue | |||||||||||||||||
| Interest income | |||||||||||||||||
| Interest expense | |||||||||||||||||
| Net interest income | |||||||||||||||||
| Total net revenue | |||||||||||||||||
| Provision for credit losses | ( | ||||||||||||||||
| Noninterest expense | |||||||||||||||||
| Compensation expense | |||||||||||||||||
| Occupancy expense | |||||||||||||||||
| Technology, communications and equipment expense | |||||||||||||||||
| Professional and outside services | |||||||||||||||||
| Marketing | |||||||||||||||||
| Other expense | |||||||||||||||||
| Total noninterest expense | |||||||||||||||||
| Income before income tax expense | |||||||||||||||||
| Income tax expense | |||||||||||||||||
| Net income | $ | $ | $ | ||||||||||||||
| Net income applicable to common stockholders | $ | $ | $ | ||||||||||||||
| Net income per common share data | |||||||||||||||||
| Basic earnings per share | $ | $ | $ | ||||||||||||||
| Diluted earnings per share | |||||||||||||||||
| Weighted-average basic shares | |||||||||||||||||
| Weighted-average diluted shares | |||||||||||||||||
166 | JPMorgan Chase & Co./2023 Form 10-K | |||||||
JPMorgan Chase & Co.
Consolidated statements of comprehensive income
| Year ended December 31, (in millions) | 2023 | 2022 | 2021 | |||||||||||||||||
| Net income | $ | $ | $ | |||||||||||||||||
| Other comprehensive income/(loss), after–tax | ||||||||||||||||||||
| Unrealized gains/(losses) on investment securities | ( | ( | ||||||||||||||||||
| Translation adjustments, net of hedges | ( | ( | ||||||||||||||||||
| Fair value hedges | ( | ( | ||||||||||||||||||
| Cash flow hedges | ( | ( | ||||||||||||||||||
| Defined benefit pension and OPEB plans | ( | |||||||||||||||||||
| DVA on fair value option elected liabilities | ( | ( | ||||||||||||||||||
| Total other comprehensive income/(loss), after–tax | ( | ( | ||||||||||||||||||
| Comprehensive income | $ | $ | $ | |||||||||||||||||
The Notes to Consolidated Financial Statements are an integral part of these statements.
JPMorgan Chase & Co./2023 Form 10-K | 167 | |||||||
JPMorgan Chase & Co.
Consolidated balance sheets
| December 31, (in millions, except share data) | 2023 | 2022 | |||||||||
| Assets | |||||||||||
| Cash and due from banks | $ | $ | |||||||||
| Deposits with banks | |||||||||||
Federal funds sold and securities purchased under resale agreements (included $ | |||||||||||
Securities borrowed (included $ | |||||||||||
Trading assets (included assets pledged of $ | |||||||||||
Available-for-sale securities (amortized cost of $ | |||||||||||
| Held-to-maturity securities | |||||||||||
| Investment securities, net of allowance for credit losses | |||||||||||
Loans (included $ | |||||||||||
| Allowance for loan losses | ( | ( | |||||||||
| Loans, net of allowance for loan losses | |||||||||||
| Accrued interest and accounts receivable | |||||||||||
| Premises and equipment | |||||||||||
| Goodwill, MSRs and other intangible assets | |||||||||||
Other assets (included $ | |||||||||||
Total assets(a) | $ | $ | |||||||||
| Liabilities | |||||||||||
Deposits (included $ | $ | $ | |||||||||
Federal funds purchased and securities loaned or sold under repurchase agreements (included $ | |||||||||||
Short-term borrowings (included $ | |||||||||||
| Trading liabilities | |||||||||||
Accounts payable and other liabilities (included $ | |||||||||||
Beneficial interests issued by consolidated VIEs (included $ | |||||||||||
Long-term debt (included $ | |||||||||||
Total liabilities(a) | |||||||||||
| Commitments and contingencies (refer to Notes 28, 29 and 30) | |||||||||||
| Stockholders’ equity | |||||||||||
Preferred stock ($ | |||||||||||
Common stock ($ | |||||||||||
| Additional paid-in capital | |||||||||||
| Retained earnings | |||||||||||
| Accumulated other comprehensive losses | ( | ( | |||||||||
Treasury stock, at cost ( | ( | ( | |||||||||
| Total stockholders’ equity | |||||||||||
| Total liabilities and stockholders’ equity | $ | $ | |||||||||
(a)The following table presents information on assets and liabilities related to VIEs that are consolidated by the Firm at December 31, 2023 and 2022. The assets of the consolidated VIEs are used to settle the liabilities of those entities. The holders of the beneficial interests do not have recourse to the general credit of JPMorgan Chase. The assets and liabilities in the table below include third-party assets and liabilities of consolidated VIEs and exclude intercompany balances that eliminate in consolidation. Refer to Note 14 for a further discussion.
| December 31, (in millions) | 2023 | 2022 | |||||||||
| Assets | |||||||||||
| Trading assets | $ | $ | |||||||||
| Loans | |||||||||||
| All other assets | |||||||||||
| Total assets | $ | $ | |||||||||
| Liabilities | |||||||||||
| Beneficial interests issued by consolidated VIEs | $ | $ | |||||||||
| All other liabilities | |||||||||||
| Total liabilities | $ | $ | |||||||||
The Notes to Consolidated Financial Statements are an integral part of these statements.
168 | JPMorgan Chase & Co./2023 Form 10-K | |||||||
JPMorgan Chase & Co.
Consolidated statements of changes in stockholders’ equity
| Year ended December 31, (in millions, except per share data) | 2023 | 2022 | 2021 | |||||||||||||||||
| Preferred stock | ||||||||||||||||||||
| Balance at January 1 | $ | $ | $ | |||||||||||||||||
| Issuance | ||||||||||||||||||||
| Redemption | ( | ( | ||||||||||||||||||
| Balance at December 31 | ||||||||||||||||||||
| Common stock | ||||||||||||||||||||
| Balance at January 1 and December 31 | ||||||||||||||||||||
| Additional paid-in capital | ||||||||||||||||||||
| Balance at January 1 | ||||||||||||||||||||
Shares issued and commitments to issue common stock for employee share-based compensation awards, and related tax effects | ||||||||||||||||||||
| Other | ( | |||||||||||||||||||
| Balance at December 31 | ||||||||||||||||||||
| Retained earnings | ||||||||||||||||||||
| Balance at January 1 | ||||||||||||||||||||
| Cumulative effect of change in accounting principles | — | — | ||||||||||||||||||
| Net income | ||||||||||||||||||||
| Dividends declared: | ||||||||||||||||||||
| Preferred stock | ( | ( | ( | |||||||||||||||||
Common stock ($ | ( | ( | ( | |||||||||||||||||
| Balance at December 31 | ||||||||||||||||||||
| Accumulated other comprehensive income/(loss) | ||||||||||||||||||||
| Balance at January 1 | ( | ( | ||||||||||||||||||
| Other comprehensive income/(loss), after-tax | ( | ( | ||||||||||||||||||
| Balance at December 31 | ( | ( | ( | |||||||||||||||||
| Treasury stock, at cost | ||||||||||||||||||||
| Balance at January 1 | ( | ( | ( | |||||||||||||||||
| Repurchase | ( | ( | ( | |||||||||||||||||
| Reissuance | ||||||||||||||||||||
| Balance at December 31 | ( | ( | ( | |||||||||||||||||
| Total stockholders’ equity | $ | $ | $ | |||||||||||||||||
Effective January 1, 2023, the Firm adopted the Financial Instruments – Credit Losses: Troubled Debt Restructurings and Derivatives and Hedging: Fair Value Hedging – Portfolio Layer Method accounting guidance. Refer to Note 1 for further information.
The Notes to Consolidated Financial Statements are an integral part of these statements.
JPMorgan Chase & Co./2023 Form 10-K | 169 | |||||||
JPMorgan Chase & Co.
Consolidated statements of cash flows
| Year ended December 31, (in millions) | 2023 | 2022 | 2021 | ||||||||||||||
| Operating activities | |||||||||||||||||
| Net income | $ | $ | $ | ||||||||||||||
Adjustments to reconcile net income to net cash provided by operating activities: | |||||||||||||||||
| Provision for credit losses | ( | ||||||||||||||||
| Depreciation and amortization | |||||||||||||||||
| Deferred tax (benefit)/expense | ( | ( | |||||||||||||||
| Bargain purchase gain associated with the First Republic acquisition | ( | ||||||||||||||||
| Other | |||||||||||||||||
| Originations and purchases of loans held-for-sale | ( | ( | ( | ||||||||||||||
| Proceeds from sales, securitizations and paydowns of loans held-for-sale | |||||||||||||||||
| Net change in: | |||||||||||||||||
| Trading assets | ( | ( | |||||||||||||||
| Securities borrowed | ( | ( | |||||||||||||||
| Accrued interest and accounts receivable | ( | ( | |||||||||||||||
| Other assets | ( | ( | |||||||||||||||
| Trading liabilities | ( | ||||||||||||||||
| Accounts payable and other liabilities | ( | ||||||||||||||||
| Other operating adjustments | ( | ||||||||||||||||
Net cash provided by operating activities | |||||||||||||||||
| Investing activities | |||||||||||||||||
| Net change in: | |||||||||||||||||
| Federal funds sold and securities purchased under resale agreements | ( | ||||||||||||||||
| Held-to-maturity securities: | |||||||||||||||||
| Proceeds from paydowns and maturities | |||||||||||||||||
| Purchases | ( | ( | ( | ||||||||||||||
| Available-for-sale securities: | |||||||||||||||||
| Proceeds from paydowns and maturities | |||||||||||||||||
| Proceeds from sales | |||||||||||||||||
| Purchases | ( | ( | ( | ||||||||||||||
| Proceeds from sales and securitizations of loans held-for-investment | |||||||||||||||||
| Other changes in loans, net | ( | ( | ( | ||||||||||||||
Net cash used in First Republic Acquisition | ( | ||||||||||||||||
| All other investing activities, net | ( | ( | ( | ||||||||||||||
Net cash provided by/(used in) investing activities | ( | ( | |||||||||||||||
| Financing activities | |||||||||||||||||
| Net change in: | |||||||||||||||||
| Deposits | ( | ( | |||||||||||||||
| Federal funds purchased and securities loaned or sold under repurchase agreements | ( | ||||||||||||||||
| Short-term borrowings | ( | ( | |||||||||||||||
| Beneficial interests issued by consolidated VIEs | ( | ||||||||||||||||
| Proceeds from long-term borrowings | |||||||||||||||||
| Payments of long-term borrowings | ( | ( | ( | ||||||||||||||
| Proceeds from issuance of preferred stock | |||||||||||||||||
| Redemption of preferred stock | ( | ( | |||||||||||||||
| Treasury stock repurchased | ( | ( | ( | ||||||||||||||
| Dividends paid | ( | ( | ( | ||||||||||||||
| All other financing activities, net | ( | ( | |||||||||||||||
| Net cash provided by/(used in) financing activities | ( | ( | |||||||||||||||
| Effect of exchange rate changes on cash and due from banks and deposits with banks | ( | ( | |||||||||||||||
| Net increase/(decrease) in cash and due from banks and deposits with banks | ( | ||||||||||||||||
| Cash and due from banks and deposits with banks at the beginning of the period | |||||||||||||||||
| Cash and due from banks and deposits with banks at the end of the period | $ | $ | $ | ||||||||||||||
| Cash interest paid | $ | $ | $ | ||||||||||||||
| Cash income taxes paid, net | |||||||||||||||||
The Notes to Consolidated Financial Statements are an integral part of these statements.
170 | JPMorgan Chase & Co./2023 Form 10-K | |||||||
Notes to consolidated financial statements
Note 1 – Basis of presentation
JPMorgan Chase & Co. (“JPMorgan Chase” or the “Firm”), a financial holding company incorporated under Delaware law in 1968, is a leading financial services firm based in the U.S., with operations worldwide. The Firm is a leader in investment banking, financial services for consumers and small businesses, commercial banking, financial transaction processing and asset management. On May 1, 2023, JPMorgan Chase acquired certain assets and assumed certain liabilities of First Republic Bank (the “First Republic acquisition”) from the Federal Deposit Insurance Corporation (“FDIC”). The Firm continues to convert certain operations, and to integrate clients, products and services associated with the First Republic acquisition, to align with the Firm’s businesses and operations. Accordingly, reporting classification and internal risk rating profiles in the wholesale portfolio may change in future periods. Refer to Note 34 for additional information on the First Republic acquisition.
The accounting and financial reporting policies of JPMorgan Chase and its subsidiaries conform to U.S. GAAP. Additionally, where applicable, the policies conform to the accounting and reporting guidelines prescribed by regulatory authorities.
Consolidation
The Consolidated Financial Statements include the accounts of JPMorgan Chase and other entities in which the Firm has a controlling financial interest. All material intercompany balances and transactions have been eliminated.
Assets held for clients in an agency or fiduciary capacity by the Firm are not assets of JPMorgan Chase and are not included on the Consolidated balance sheets.
The Firm determines whether it has a controlling financial interest in an entity by first evaluating whether the entity is a voting interest entity or a variable interest entity.
Voting interest entities
Voting interest entities are entities that have sufficient equity and provide the equity investors voting rights that enable them to make significant decisions relating to the entity’s operations. For these types of entities, the Firm’s determination of whether it has a controlling interest is primarily based on the amount of voting equity interests held. Entities in which the Firm has a controlling financial interest, through ownership of the majority of the entities’ voting equity interests, or through other contractual rights that give the Firm control, are consolidated by the Firm.
Investments in companies in which the Firm has significant influence over operating and financing decisions (but does not own a majority of the voting equity interests) are accounted for (i) in accordance with the equity method of accounting, or (ii) at fair value if the fair value option was elected. These investments are generally included in other assets, with income or loss included in noninterest revenue.
Certain Firm-sponsored asset management funds are structured as limited partnerships or limited liability companies. For many of these entities, the Firm is the general partner or managing member, but the non-affiliated partners or members have the ability to remove the Firm as the general partner or managing member without cause (i.e., kick-out rights), based on a simple majority vote, or the non-affiliated partners or members have rights to participate in important decisions. Accordingly, the Firm does not consolidate these voting interest entities. However, in the limited cases where the non-managing partners or members do not have substantive kick-out or participating rights, the Firm evaluates the funds as VIEs and consolidates the funds if the Firm is the general partner or managing member and has both power and a potentially significant interest.
The Firm’s investment companies and asset management funds have investments in both publicly-held and privately-held entities, including investments in buyouts, growth equity and venture opportunities. These investments are accounted for under investment company guidelines and, accordingly, irrespective of the percentage of equity ownership interests held, are carried on the Consolidated balance sheets at fair value, and are recorded in other assets, with income or loss included in noninterest revenue. If consolidated, the Firm retains the accounting under such specialized investment company guidelines.
Variable interest entities
VIEs are entities that, by design, either (1) lack sufficient equity to permit the entity to finance its activities without additional subordinated financial support from other parties, or (2) have equity investors that do not have the ability to make significant decisions relating to the entity’s operations through voting rights, or do not have the obligation to absorb the expected losses, or do not have the right to receive the residual returns of the entity.
The most common type of VIE is an SPE. SPEs are commonly used in securitization transactions in order to isolate certain assets and distribute the cash flows from those assets to investors. The basic SPE structure involves a company selling assets to the SPE; the SPE funds the purchase of those assets by issuing securities to investors. The legal documents that govern the transaction specify how the cash earned on the assets must be allocated to the SPE’s investors and other parties that have rights to those cash flows. SPEs are generally structured to insulate investors from claims on the SPE’s assets by creditors of other entities, including the creditors of the seller of the assets.
The primary beneficiary of a VIE (i.e., the party that has a controlling financial interest) is required to consolidate the assets and liabilities of the VIE. The primary beneficiary is the party that has both (1) the power to direct the activities of the VIE that most significantly impact the VIE’s economic performance; and (2) through its interests in the VIE, the
JPMorgan Chase & Co./2023 Form 10-K | 171 | |||||||
Notes to consolidated financial statements
obligation to absorb losses or the right to receive benefits from the VIE that could potentially be significant to the VIE.
To assess whether the Firm has the power to direct the activities of a VIE that most significantly impact the VIE’s economic performance, the Firm considers all the facts and circumstances, including its role in establishing the VIE and its ongoing rights and responsibilities. This assessment includes, first, identifying the activities that most significantly impact the VIE’s economic performance; and second, identifying which party, if any, has power over those activities. In general, the parties that make the most significant decisions affecting the VIE (such as asset managers, collateral managers, servicers, or owners of call options or liquidation rights over the VIE’s assets) or have the right to unilaterally remove those decision-makers are deemed to have the power to direct the activities of a VIE.
To assess whether the Firm has the obligation to absorb losses of the VIE or the right to receive benefits from the VIE that could potentially be significant to the VIE, the Firm considers all of its economic interests, including debt and equity investments, servicing fees, and derivatives or other arrangements deemed to be variable interests in the VIE. This assessment requires that the Firm apply judgment in determining whether these interests, in the aggregate, are considered potentially significant to the VIE. Factors considered in assessing significance include: the design of the VIE, including its capitalization structure; subordination of interests; payment priority; relative share of interests held across various classes within the VIE’s capital structure; and the reasons why the interests are held by the Firm.
The Firm performs on-going reassessments of: (1) whether entities previously evaluated under the majority voting-interest framework have become VIEs, based on certain events, and are therefore subject to the VIE consolidation framework; and (2) whether changes in the facts and circumstances regarding the Firm’s involvement with a VIE cause the Firm’s consolidation conclusion to change.
Refer to Note 14 for further discussion of Firm-sponsored VIEs.
Revenue recognition
Interest income
The Firm recognizes interest income on loans, debt securities, and other debt instruments, generally on a level-yield basis, based on the underlying contractual rate. Refer to Note 7 for further information.
Revenue from contracts with customers
JPMorgan Chase recognizes noninterest revenue from certain contracts with customers, in investment banking fees, deposit-related fees, asset management fees, commissions and other fees, and components of card income, when the Firm’s related performance obligations are satisfied. Refer to Note 6 for further discussion of the Firm’s revenue from contracts with customers.
Principal transactions revenue
Use of estimates in the preparation of consolidated financial statements
The preparation of the Consolidated Financial Statements requires management to make estimates and assumptions that affect the reported amounts of assets and liabilities, revenue and expense, and disclosures of contingent assets and liabilities. Actual results could be different from these estimates.
Foreign currency translation
JPMorgan Chase revalues assets, liabilities, revenue and expense denominated in non-U.S. currencies into U.S. dollars using applicable exchange rates.
Gains and losses relating to translating functional currency financial statements for U.S. reporting are included in the Consolidated statements of comprehensive income. Gains and losses relating to nonfunctional currency transactions, including non-U.S. operations where the functional currency is the U.S. dollar, are reported in the Consolidated statements of income.
Offsetting assets and liabilities
U.S. GAAP permits entities to present derivative receivables and derivative payables with the same counterparty and the related cash collateral receivables and payables on a net basis on the Consolidated balance sheets when a legally enforceable master netting agreement exists. U.S. GAAP also permits securities sold and purchased under repurchase agreements and securities borrowed or loaned under securities loan agreements to be presented net when specified conditions are met, including the existence of a legally enforceable master netting agreement. The Firm has elected to net such balances where it has determined that the specified conditions are met.
The Firm uses master netting agreements to mitigate counterparty credit risk in certain transactions, including derivative contracts, resale, repurchase, securities borrowed and securities loaned agreements. A master netting agreement is a single agreement with a counterparty that permits multiple transactions governed by that agreement to be terminated or accelerated and settled through a single payment in a single currency in the event of a default (e.g., bankruptcy, failure to make a required payment or securities transfer or deliver collateral or margin when due). Upon the exercise of derivatives termination rights by the non-defaulting party (i) all transactions are terminated, (ii) all transactions are valued and the positive values of “in the money” transactions are netted against the negative values of “out of the money” transactions and (iii) the only remaining payment obligation is of one of the parties to pay the netted termination amount. Upon exercise of default rights under repurchase
172 | JPMorgan Chase & Co./2023 Form 10-K | |||||||
agreements and securities loan agreements in general (i) all transactions are terminated and accelerated, (ii) all values of securities or cash held or to be delivered are calculated, and all such sums are netted against each other and (iii) the only remaining payment obligation is of one of the parties to pay the netted termination amount.
Typical master netting agreements for these types of transactions also often contain a collateral/margin agreement that provides for a security interest in, or title transfer of, securities or cash collateral/margin to the party that has the right to demand margin (the “demanding party”). The collateral/margin agreement typically requires a party to transfer collateral/margin to the demanding party with a value equal to the amount of the margin deficit on a net basis across all transactions governed by the master netting agreement, less any threshold. The collateral/margin agreement grants to the demanding party, upon default by the counterparty, the right to set-off any amounts payable by the counterparty against any posted collateral or the cash equivalent of any posted collateral/margin. It also grants to the demanding party the right to liquidate collateral/margin and to apply the proceeds to an amount payable by the counterparty.
Refer to Note 5 for further discussion of the Firm’s derivative instruments. Refer to Note 11 for further discussion of the Firm’s securities financing agreements.
Statements of cash flows
For JPMorgan Chase’s Consolidated statements of cash flows, cash is defined as those amounts included in cash and due from banks and deposits with banks on the Consolidated balance sheets.
Accounting standards adopted January 1, 2023
Derivatives and Hedging: Fair Value Hedging – Portfolio Layer Method
The adoption of this guidance expanded the ability to hedge a portfolio of fixed-rate assets to allow more types of assets to be included in the portfolio, and to allow more of the portfolio to be hedged. This guidance also clarified the types of derivatives that could be used as hedges, and the balance sheet presentation and disclosure requirements for the hedge accounting adjustments. As permitted by the guidance, the Firm elected to transfer HTM securities to AFS and designated those securities in a portfolio layer method hedge upon adoption. The adoption impact of the transfer on retained earnings was not material.
Refer to Note 5 and Note 10 for additional information.
Financial Instruments – Credit Losses: Troubled Debt Restructurings (“TDRs”)
The adoption of this guidance eliminated the accounting and disclosure requirements for TDRs, including the requirement to measure the allowance using a discounted cash flow (“DCF”) methodology, and allowed the option of a non-DCF portfolio-based approach for modified loans to troubled borrowers. If a DCF methodology is still applied for these modified loans, the discount rate must be the post-modification effective interest rate, instead of the pre-modification effective interest rate.
The Firm elected to apply its non-DCF, portfolio-based allowance approach for modified loans to troubled borrowers for all portfolios except collateral-dependent loans and nonaccrual risk-rated loans which the Firm elected to continue applying a DCF methodology. Refer to Note 13 for a description of the portfolio-based allowance approach and the asset-specific allowance approach.
This guidance was adopted on January 1, 2023 under the modified retrospective method which resulted in a net decrease to the allowance for credit losses of $587 million and an increase to retained earnings of $446 million, after-tax, predominantly driven by residential real estate and credit card.
The adoption of this guidance eliminated the disclosure requirements for TDRs including the requirement to assess whether a modification is reasonably expected or involves a concession. The new guidance requires disclosure for loan modifications to borrowers experiencing financial difficulty consisting of principal forgiveness, interest rate reduction, other-than-insignificant payment delay, term extension or a combination of these modifications. The Firm has defined these types of modifications as financial difficulty modifications ("FDMs"). As a result of the elimination of the requirement to assess whether a modification is reasonably expected or involves a concession, the population of loans considered FDMs differs from those previously considered TDRs. This guidance also requires disclosure of current period gross charge-offs by vintage origination year.
Refer to Note 12 for further information.
JPMorgan Chase & Co./2023 Form 10-K | 173 | |||||||
Notes to consolidated financial statements
Significant accounting policies
The following table identifies JPMorgan Chase’s other significant accounting policies and the Note and page where a detailed description of each policy can be found.
| Fair value measurement | Note 2 | page 175 | |||||||||
| Fair value option | Note 3 | page 197 | |||||||||
| Derivative instruments | Note 5 | page 203 | |||||||||
Noninterest revenue and noninterest expense | Note 6 | page 217 | |||||||||
| Interest income and Interest expense | Note 7 | page 221 | |||||||||
Pension and other postretirement employee benefit plans | Note 8 | page 222 | |||||||||
| Employee share-based incentives | Note 9 | page 225 | |||||||||
| Investment securities | Note 10 | page 227 | |||||||||
| Securities financing activities | Note 11 | page 232 | |||||||||
| Loans | Note 12 | page 235 | |||||||||
| Allowance for credit losses | Note 13 | page 255 | |||||||||
| Variable interest entities | Note 14 | page 261 | |||||||||
Goodwill, mortgage servicing rights, and other intangible assets | Note 15 | page 269 | |||||||||
| Premises and equipment | Note 16 | page 274 | |||||||||
| Leases | Note 18 | page 275 | |||||||||
Accounts payable & other liabilities | Note 19 | page 277 | |||||||||
| Long-term debt | Note 20 | page 278 | |||||||||
| Earnings per share | Note 23 | page 283 | |||||||||
| Income taxes | Note 25 | page 285 | |||||||||
Off–balance sheet lending-related financial instruments, guarantees and other commitments | Note 28 | page 291 | |||||||||
| Litigation | Note 30 | page 298 | |||||||||
174 | JPMorgan Chase & Co./2023 Form 10-K | |||||||
Note 2 – Fair value measurement
JPMorgan Chase carries a portion of its assets and liabilities at fair value. These assets and liabilities are predominantly carried at fair value on a recurring basis (i.e., assets and liabilities that are measured and reported at fair value on the Firm’s Consolidated balance sheets). Certain assets, liabilities and unfunded lending-related commitments are measured at fair value on a nonrecurring basis; that is, they are not measured at fair value on an ongoing basis but are subject to fair value adjustments only in certain circumstances (for example, when there is evidence of impairment).
Fair value is defined as the price that would be received to sell an asset or paid to transfer a liability in an orderly transaction between market participants at the measurement date. Fair value is based on quoted market prices or inputs, where available. If prices or quotes are not available, fair value is based on valuation models and other valuation techniques that consider relevant transaction characteristics (such as maturity) and use, as inputs, observable or unobservable market parameters, including yield curves, interest rates, volatilities, prices (such as commodity, equity or debt prices), correlations, foreign exchange rates and credit curves. Fair value may also incorporate valuation adjustments.
The level of precision in estimating unobservable market inputs or other factors can affect the amount of gain or loss recorded for a particular position. Furthermore, while the Firm believes its valuation methods are appropriate and consistent with those of other market participants, the methods and assumptions used reflect management judgment and may vary across the Firm’s businesses and portfolios.
The Firm uses various methodologies and assumptions in the determination of fair value. The use of different methodologies or assumptions by other market participants compared with those used by the Firm could result in the Firm deriving a different estimate of fair value at the reporting date.
Valuation process
Risk-taking functions are responsible for providing fair value estimates for assets and liabilities carried on the Consolidated balance sheets at fair value. The Firm’s Valuation Control Group (“VCG”), which is part of the Firm’s Finance function and independent of the risk-taking functions, is responsible for verifying these estimates and determining any fair value adjustments that may be required to ensure that the Firm’s positions are recorded at fair value. In addition, the Firm’s Valuation Governance Forum (“VGF”), which is composed of senior finance and risk executives, is responsible for overseeing the management of risks arising from valuation activities conducted across the Firm. The Firmwide VGF is chaired by the Firmwide head of the VCG (under the direction of the Firm’s Controller), and includes sub-forums covering the CIB, CCB, CB, AWM and certain corporate functions including Treasury and CIO.
Price verification process
The VCG verifies fair value estimates provided by the risk-taking functions by leveraging independently derived prices, valuation inputs and other market data, where available. Where independent prices or inputs are not available, the VCG performs additional review to ensure the reasonableness of the estimates. The additional review may include evaluating the limited market activity including client unwinds, benchmarking valuation inputs to those used for similar instruments, decomposing the valuation of structured instruments into individual components, comparing expected to actual cash flows, reviewing profit and loss trends, and reviewing trends in collateral valuation. There are also additional levels of management review for more significant or complex positions.
The VCG determines any valuation adjustments that may be required to the estimates provided by the risk-taking functions. No adjustments to quoted prices are applied for instruments classified within level 1 of the fair value hierarchy (refer to the discussion below for further information on the fair value hierarchy). For other positions, judgment is required to assess the need for valuation adjustments to appropriately reflect liquidity considerations, unobservable parameters, and, for certain portfolios that meet specified criteria, the size of the net open risk position. The determination of such adjustments follows a consistent framework across the Firm:
•Liquidity valuation adjustments are considered where an observable external price or valuation parameter exists but is of lower reliability, potentially due to lower market activity. Liquidity valuation adjustments are made based on current market conditions. Factors that may be considered in determining the liquidity adjustment include analysis of: (1) the estimated bid-offer spread for the instrument being traded; (2) alternative pricing points for similar instruments in active markets; and (3) the range of reasonable values that the price or parameter could take.
•The Firm manages certain portfolios of financial instruments on the basis of net open risk exposure and, as permitted by U.S. GAAP, has elected to estimate the fair value of such portfolios on the basis of a transfer of the entire net open risk position in an orderly transaction. Where this is the case, valuation adjustments may be necessary to reflect the cost of exiting a larger-than-normal market-size net open risk position. Where applied, such adjustments are based on factors that a relevant market participant would consider in the transfer of the net open risk position, including the size of the adverse market move that is likely to occur during the period required to sufficiently reduce the net open risk position.
•Uncertainty adjustments related to unobservable parameters may be made when positions are valued using prices or input parameters to valuation models that are unobservable due to a lack of market activity or
JPMorgan Chase & Co./2023 Form 10-K | 175 | |||||||
Notes to consolidated financial statements
because they cannot be implied from observable market data. Such prices or parameters must be estimated and are, therefore, subject to management judgment. Adjustments are made to reflect the uncertainty inherent in the resulting valuation estimate.
•Where appropriate, the Firm also applies adjustments to its estimates of fair value in order to appropriately reflect counterparty credit quality (CVA), the Firm’s own creditworthiness (DVA) and the impact of funding (FVA), using a consistent framework across the Firm. Refer to Credit and funding adjustments on page 192 of this Note for more information on such adjustments.
Valuation model review and approval
If prices or quotes are not available for an instrument or a similar instrument, fair value is generally determined using valuation models that consider relevant transaction terms such as maturity and use as inputs market-based or independently sourced parameters. Where this is the case the price verification process described above is applied to the inputs in those models.
Under the Firm’s Estimations and Model Risk Management Policy, MRGR reviews and approves new models, as well as material changes to existing models, prior to implementation in the operating environment. In certain circumstances exceptions may be granted to the Firm’s policy to allow a model to be used prior to review or approval. MRGR may also require the user to take appropriate actions to mitigate the model risk if it is to be used in the interim. These actions will depend on the model and may include, for example, limitation of trading activity.
Fair value hierarchy
A three-level fair value hierarchy has been established under U.S. GAAP for disclosure of fair value measurements. The fair value hierarchy is based on the observability of inputs to the valuation of an asset or liability as of the measurement date. The three levels are defined as follows.
•Level 1 – inputs to the valuation methodology are quoted prices (unadjusted) for identical assets or liabilities in active markets.
•Level 2 – inputs to the valuation methodology include quoted prices for similar assets and liabilities in active markets, and inputs that are observable for the asset or liability, either directly or indirectly, for substantially the full term of the financial instrument.
•Level 3 – one or more inputs to the valuation methodology are unobservable and significant to the fair value measurement.
A financial instrument’s categorization within the fair value hierarchy is based on the lowest level of input that is significant to the fair value measurement.
176 | JPMorgan Chase & Co./2023 Form 10-K | |||||||
The following table describes the valuation methodologies generally used by the Firm to measure its significant products/instruments at fair value, including the general classification of such instruments pursuant to the fair value hierarchy.
| Product/instrument | Valuation methodology | Classifications in the fair value hierarchy | ||||||
| Securities financing agreements | Valuations are based on discounted cash flows, which consider: | Predominantly level 2 | ||||||
| • Derivative features: refer to the discussion of derivatives below for further information | ||||||||
• Market rates for the respective maturity | ||||||||
• Collateral characteristics | ||||||||
Loans and lending-related commitments — wholesale Loans carried at fair value (trading loans and non-trading loans) and associated lending-related commitments | Where observable market data is available, valuations are based on: | Level 2 or 3 | ||||||
• Observed market prices (circumstances are infrequent) | ||||||||
• Relevant broker quotes | ||||||||
• Observed market prices for similar instruments | ||||||||
| Where observable market data is unavailable or limited, valuations are based on discounted cash flows, which consider the following: | ||||||||
• Credit spreads derived from the cost of CDS; or benchmark credit curves developed by the Firm, by industry and credit rating | ||||||||
• Prepayment speed | ||||||||
• Collateral characteristics | ||||||||
| Loans — consumer | Fair value is based on observable market prices for mortgage-backed securities with similar collateral and incorporates adjustments to these prices to account for differences between the securities and the value of the underlying loans, which include credit characteristics, portfolio composition, and liquidity. | Predominantly level 2 | ||||||
| Loans carried at fair value — conforming residential mortgage loans expected to be sold | ||||||||
| Investment and trading securities | Quoted market prices | Level 1 | ||||||
| In the absence of quoted market prices, securities are valued based on: | Level 2 or 3 | |||||||
| • Observable market prices for similar securities | ||||||||
• Relevant broker quotes | ||||||||
• Discounted cash flows | ||||||||
| In addition, the following inputs to discounted cash flows are used for the following products: | ||||||||
| Mortgage- and asset-backed securities specific inputs: | ||||||||
• Collateral characteristics | ||||||||
| • Deal-specific payment and loss allocations | ||||||||
• Current market assumptions related to yield, prepayment speed, conditional default rates and loss severity | ||||||||
| Collateralized loan obligations (“CLOs”) specific inputs: | ||||||||
• Collateral characteristics | ||||||||
• Deal-specific payment and loss allocations | ||||||||
• Expected prepayment speed, conditional default rates, loss severity | ||||||||
• Credit spreads | ||||||||
| • Credit rating data | ||||||||
| Physical commodities | Valued using observable market prices or data. | Level 1 or 2 | ||||||
JPMorgan Chase & Co./2023 Form 10-K | 177 | |||||||
Notes to consolidated financial statements
| Product/instrument | Valuation methodology | Classifications in the fair value hierarchy | ||||||
| Derivatives | Actively traded derivatives, e.g., exchange-traded derivatives, that are valued using quoted prices. | Level 1 | ||||||
Derivatives that are valued using models such as the Black-Scholes option pricing model, simulation models, or a combination of models that may use observable or unobservable valuation inputs as well as considering the contractual terms. The key valuation inputs used will depend on the type of derivative and the nature of the underlying instruments and may include equity prices, commodity prices, foreign exchange rates, volatilities, correlations, CDS spreads, recovery rates and prepayment speed. | Level 2 or 3 | |||||||
| In addition, specific inputs used for derivatives that are valued based on models with significant unobservable inputs are as follows: | ||||||||
| Interest rate and FX exotic derivatives specific inputs include: | ||||||||
• Interest rate curve | ||||||||
• Interest rate volatility | ||||||||
• Interest rate spread volatility | ||||||||
• Bermudan switch value | ||||||||
• Interest rate correlation | ||||||||
• Interest rate-FX correlation | ||||||||
• Foreign exchange correlation | ||||||||
| Credit derivatives specific inputs include: | ||||||||
• Credit correlation between the underlying debt instruments | ||||||||
| Equity derivatives specific inputs include: | ||||||||
• Forward equity price | ||||||||
• Equity volatility | ||||||||
• Equity correlation | ||||||||
• Equity-FX correlation | ||||||||
• Equity-IR correlation | ||||||||
| Commodity derivatives specific inputs include: | ||||||||
• Forward commodity price | ||||||||
• Commodity volatility | ||||||||
• Commodity correlation | ||||||||
Additionally, adjustments are made to reflect counterparty credit quality (CVA) and the impact of funding (FVA). Refer to page 192 of this Note. | ||||||||
| Mortgage servicing rights | Refer to Mortgage servicing rights in Note 15. | Level 3 | ||||||
| Private equity direct investments | Fair value is estimated using all available information; the range of potential inputs include: | Level 2 or 3 | ||||||
• Transaction prices | ||||||||
| • Trading multiples of comparable public companies | ||||||||
| • Operating performance of the underlying portfolio company | ||||||||
• Adjustments as required, since comparable public companies are not identical to the company being valued, and for company-specific issues including lack of liquidity | ||||||||
| • Additional available inputs relevant to the investment | ||||||||
| Fund investments (e.g., mutual/collective investment funds, private equity funds, hedge funds, and real estate funds) | Net asset value | |||||||
| • NAV is supported by the ability to redeem and purchase at the NAV level | Level 1 | |||||||
| • Adjustments to the NAV as required, for restrictions on redemption (e.g., lock-up periods or withdrawal limitations) or where observable activity is limited | Level 2 or 3(a) | |||||||
| Beneficial interests issued by consolidated VIEs | Valued using observable market information, where available. | Level 2 or 3 | ||||||
| In the absence of observable market information, valuations are based on the fair value of the underlying assets held by the VIE. | ||||||||
(a)Excludes certain investments that are measured at fair value using the net asset value per share (or its equivalent) as a practical expedient.
178 | JPMorgan Chase & Co./2023 Form 10-K | |||||||
| Product/instrument | Valuation methodology | Classification in the fair value hierarchy | ||||||
| Structured notes (included in deposits, short-term borrowings and long-term debt) | Valuations are based on discounted cash flow analyses that consider the embedded derivative and the terms and payment structure of the note. The embedded derivative features are considered using models such as the Black-Scholes option pricing model, simulation models, or a combination of models that may use observable or unobservable valuation inputs, depending on the embedded derivative. The specific inputs used vary according to the nature of the embedded derivative features, as described in the discussion above regarding derivatives valuation. Adjustments are then made to this base valuation to reflect the Firm’s own credit risk (DVA). Refer to page 192 of this Note. | Level 2 or 3 | ||||||
JPMorgan Chase & Co./2023 Form 10-K | 179 | |||||||
Notes to consolidated financial statements
The following table presents the assets and liabilities reported at fair value as of December 31, 2023 and 2022, by major product category and fair value hierarchy.
| Assets and liabilities measured at fair value on a recurring basis | |||||||||||||||||||||||
| Fair value hierarchy | |||||||||||||||||||||||
| December 31, 2023 (in millions) | Level 1 | Level 2 | Level 3 | Derivative netting adjustments(f) | Total fair value | ||||||||||||||||||
| Federal funds sold and securities purchased under resale agreements | $ | $ | $ | $ | — | $ | |||||||||||||||||
| Securities borrowed | — | ||||||||||||||||||||||
| Trading assets: | |||||||||||||||||||||||
| Debt instruments: | |||||||||||||||||||||||
| Mortgage-backed securities: | |||||||||||||||||||||||
U.S. GSEs and government agencies(a) | — | ||||||||||||||||||||||
| Residential – nonagency | — | ||||||||||||||||||||||
| Commercial – nonagency | — | ||||||||||||||||||||||
| Total mortgage-backed securities | — | ||||||||||||||||||||||
U.S. Treasury, GSEs and government agencies(a) | — | ||||||||||||||||||||||
| Obligations of U.S. states and municipalities | — | ||||||||||||||||||||||
Certificates of deposit, bankers’ acceptances and commercial paper | — | ||||||||||||||||||||||
| Non-U.S. government debt securities | — | ||||||||||||||||||||||
| Corporate debt securities | — | ||||||||||||||||||||||
| Loans | — | ||||||||||||||||||||||
| Asset-backed securities | — | ||||||||||||||||||||||
| Total debt instruments | — | ||||||||||||||||||||||
| Equity securities | — | ||||||||||||||||||||||
Physical commodities(b) | — | ||||||||||||||||||||||
| Other | — | ||||||||||||||||||||||
Total debt and equity instruments(c) | — | ||||||||||||||||||||||
| Derivative receivables: | |||||||||||||||||||||||
| Interest rate | ( | ||||||||||||||||||||||
| Credit | ( | ||||||||||||||||||||||
| Foreign exchange | ( | ||||||||||||||||||||||
| Equity | ( | ||||||||||||||||||||||
| Commodity | ( | ||||||||||||||||||||||
| Total derivative receivables | ( | ||||||||||||||||||||||
Total trading assets(d) | ( | ||||||||||||||||||||||
| Available-for-sale securities: | |||||||||||||||||||||||
| Mortgage-backed securities: | |||||||||||||||||||||||
U.S. GSEs and government agencies(a) | — | ||||||||||||||||||||||
| Residential – nonagency | — | ||||||||||||||||||||||
| Commercial – nonagency | — | ||||||||||||||||||||||
| Total mortgage-backed securities | — | ||||||||||||||||||||||
| U.S. Treasury and government agencies | — | ||||||||||||||||||||||
| Obligations of U.S. states and municipalities | — | ||||||||||||||||||||||
| Non-U.S. government debt securities | — | ||||||||||||||||||||||
| Corporate debt securities | — | ||||||||||||||||||||||
| Asset-backed securities: | |||||||||||||||||||||||
| Collateralized loan obligations | — | ||||||||||||||||||||||
Other(a) | — | ||||||||||||||||||||||
| Total available-for-sale securities | — | ||||||||||||||||||||||
Loans(e) | — | ||||||||||||||||||||||
| Mortgage servicing rights | — | ||||||||||||||||||||||
Other assets(d) | — | ||||||||||||||||||||||
| Total assets measured at fair value on a recurring basis | $ | $ | $ | $ | ( | $ | |||||||||||||||||
| Deposits | $ | $ | $ | $ | — | $ | |||||||||||||||||
Federal funds purchased and securities loaned or sold under repurchase agreements | — | ||||||||||||||||||||||
| Short-term borrowings | — | ||||||||||||||||||||||
| Trading liabilities: | |||||||||||||||||||||||
Debt and equity instruments(c) | — | ||||||||||||||||||||||
| Derivative payables: | |||||||||||||||||||||||
| Interest rate | ( | ||||||||||||||||||||||
| Credit | ( | ||||||||||||||||||||||
| Foreign exchange | ( | ||||||||||||||||||||||
| Equity | ( | ||||||||||||||||||||||
| Commodity | ( | ||||||||||||||||||||||
| Total derivative payables | ( | ||||||||||||||||||||||
| Total trading liabilities | ( | ||||||||||||||||||||||
| Accounts payable and other liabilities | — | ||||||||||||||||||||||
| Beneficial interests issued by consolidated VIEs | — | ||||||||||||||||||||||
| Long-term debt | — | ||||||||||||||||||||||
| Total liabilities measured at fair value on a recurring basis | $ | $ | $ | $ | ( | $ | |||||||||||||||||
180 | JPMorgan Chase & Co./2023 Form 10-K | |||||||
| Fair value hierarchy | ||||||||||||||||||||||||||
| December 31, 2022 (in millions) | Level 1 | Level 2 | Level 3 | Derivative netting adjustments(f) | Total fair value | |||||||||||||||||||||
| Federal funds sold and securities purchased under resale agreements | $ | $ | $ | $ | — | $ | ||||||||||||||||||||
| Securities borrowed | — | |||||||||||||||||||||||||
| Trading assets: | ||||||||||||||||||||||||||
| Debt instruments: | ||||||||||||||||||||||||||
| Mortgage-backed securities: | ||||||||||||||||||||||||||
U.S. GSEs and government agencies(a) | — | |||||||||||||||||||||||||
| Residential – nonagency | — | |||||||||||||||||||||||||
| Commercial – nonagency | — | |||||||||||||||||||||||||
| Total mortgage-backed securities | — | |||||||||||||||||||||||||
U.S. Treasury, GSEs and government agencies(a) | — | |||||||||||||||||||||||||
| Obligations of U.S. states and municipalities | — | |||||||||||||||||||||||||
Certificates of deposit, bankers’ acceptances and commercial paper | — | |||||||||||||||||||||||||
| Non-U.S. government debt securities | — | |||||||||||||||||||||||||
| Corporate debt securities | — | |||||||||||||||||||||||||
| Loans | — | |||||||||||||||||||||||||
| Asset-backed securities | — | |||||||||||||||||||||||||
| Total debt instruments | — | |||||||||||||||||||||||||
| Equity securities | — | |||||||||||||||||||||||||
Physical commodities(b) | — | |||||||||||||||||||||||||
| Other | — | |||||||||||||||||||||||||
Total debt and equity instruments(c) | — | |||||||||||||||||||||||||
| Derivative receivables: | ||||||||||||||||||||||||||
| Interest rate | ( | |||||||||||||||||||||||||
| Credit | ( | |||||||||||||||||||||||||
| Foreign exchange | ( | |||||||||||||||||||||||||
| Equity | ( | |||||||||||||||||||||||||
| Commodity | ( | |||||||||||||||||||||||||
| Total derivative receivables | ( | |||||||||||||||||||||||||
Total trading assets(d) | ( | |||||||||||||||||||||||||
| Available-for-sale securities: | ||||||||||||||||||||||||||
| Mortgage-backed securities: | ||||||||||||||||||||||||||
U.S. GSEs and government agencies(a) | — | |||||||||||||||||||||||||
| Residential – nonagency | — | |||||||||||||||||||||||||
| Commercial – nonagency | — | |||||||||||||||||||||||||
| Total mortgage-backed securities | — | |||||||||||||||||||||||||
| U.S. Treasury and government agencies | — | |||||||||||||||||||||||||
| Obligations of U.S. states and municipalities | — | |||||||||||||||||||||||||
| Non-U.S. government debt securities | — | |||||||||||||||||||||||||
| Corporate debt securities | — | |||||||||||||||||||||||||
| Asset-backed securities: | ||||||||||||||||||||||||||
| Collateralized loan obligations | — | |||||||||||||||||||||||||
| Other | — | |||||||||||||||||||||||||
| Total available-for-sale securities | — | |||||||||||||||||||||||||
Loans(e) | — | |||||||||||||||||||||||||
| Mortgage servicing rights | — | |||||||||||||||||||||||||
Other assets(d) | — | |||||||||||||||||||||||||
| Total assets measured at fair value on a recurring basis | $ | $ | $ | $ | ( | $ | ||||||||||||||||||||
| Deposits | $ | $ | $ | $ | — | $ | ||||||||||||||||||||
Federal funds purchased and securities loaned or sold under repurchase agreements | — | |||||||||||||||||||||||||
| Short-term borrowings | — | |||||||||||||||||||||||||
| Trading liabilities: | ||||||||||||||||||||||||||
Debt and equity instruments(c) | — | |||||||||||||||||||||||||
| Derivative payables: | ||||||||||||||||||||||||||
| Interest rate | ( | |||||||||||||||||||||||||
| Credit | ( | |||||||||||||||||||||||||
| Foreign exchange | ( | |||||||||||||||||||||||||
| Equity | ( | |||||||||||||||||||||||||
| Commodity | ( | |||||||||||||||||||||||||
| Total derivative payables | ( | |||||||||||||||||||||||||
| Total trading liabilities | ( | |||||||||||||||||||||||||
| Accounts payable and other liabilities | — | |||||||||||||||||||||||||
| Beneficial interests issued by consolidated VIEs | — | |||||||||||||||||||||||||
| Long-term debt | — | |||||||||||||||||||||||||
| Total liabilities measured at fair value on a recurring basis | $ | $ | $ | $ | ( | $ | ||||||||||||||||||||
(a)At December 31, 2023 and 2022, included total U.S. GSE obligations of $78.5 billion and $73.8 billion, respectively, which were mortgage-related.
(b)Physical commodities inventories are generally accounted for at the lower of cost or net realizable value. “Net realizable value” is a term defined in U.S. GAAP as not exceeding fair value less costs to sell (“transaction costs”). Transaction costs for the Firm’s physical commodities inventories are either not applicable or immaterial to the value of the inventory. Therefore, net realizable value approximates fair value for the Firm’s physical commodities inventories. When fair value hedging has been applied (or when net realizable value is below cost), the carrying value of physical commodities approximates fair value, because under fair value hedge accounting, the cost basis is adjusted for changes in fair value. Refer to Note 5 for a further discussion of the Firm’s hedge accounting relationships. To provide consistent fair value disclosure information, all physical commodities inventories have been included in each period presented.
(c)Balances reflect the reduction of securities owned (long positions) by the amount of identical securities sold but not yet purchased (short positions).
JPMorgan Chase & Co./2023 Form 10-K | 181 | |||||||
Notes to consolidated financial statements
(d)Certain investments that are measured at fair value using the net asset value per share (or its equivalent) as a practical expedient are not required to be classified in the fair value hierarchy. At December 31, 2023 and 2022, the fair values of these investments, which include certain hedge funds, private equity funds, real estate and other funds, were $1.0 billion and $950 million, respectively. Included in these balances at December 31, 2023 and 2022, were trading assets of $42 million and $43 million, respectively, and other assets of $984 million and $907 million, respectively.
(e)At December 31, 2023 and 2022, included $10.2 billion and $9.7 billion, respectively, of residential first-lien mortgages, and $6.0 billion and $6.8 billion, respectively, of commercial first-lien mortgages. Residential mortgage loans include conforming mortgage loans originated with the intent to sell to U.S. GSEs and government agencies of $2.9 billion and $2.4 billion, respectively.
(f)As permitted under U.S. GAAP, the Firm has elected to net derivative receivables and derivative payables and the related cash collateral received and paid when a legally enforceable master netting agreement exists. The level 3 balances would be reduced if netting were applied, including the netting benefit associated with cash collateral.
182 | JPMorgan Chase & Co./2023 Form 10-K | |||||||
Level 3 valuations
The Firm has established well-structured processes for determining fair value, including for instruments where fair value is estimated using significant unobservable inputs (level 3). Refer to pages 175–179 of this Note for further information on the Firm’s valuation process and a detailed discussion of the determination of fair value for individual financial instruments.
Estimating fair value requires the application of judgment. The type and level of judgment required is largely dependent on the amount of observable market information available to the Firm. For instruments valued using internally developed valuation models and other valuation techniques that use significant unobservable inputs and are therefore classified within level 3 of the fair value hierarchy, judgments used to estimate fair value are more significant than those required when estimating the fair value of instruments classified within levels 1 and 2.
In arriving at an estimate of fair value for an instrument within level 3, management must first determine the appropriate valuation model or other valuation technique to use. Second, due to the lack of observability of significant inputs, management must assess relevant empirical data in deriving valuation inputs including transaction details, yield curves, interest rates, prepayment speed, default rates, volatilities, correlations, prices (such as commodity, equity or debt prices), valuations of comparable instruments, foreign exchange rates and credit curves.
The following table presents the Firm’s primary level 3 financial instruments, the valuation techniques used to measure the fair value of those financial instruments, the significant unobservable inputs, the range of values for those inputs and the weighted or arithmetic averages of such inputs. While the determination to classify an instrument within level 3 is based on the significance of the unobservable inputs to the overall fair value measurement, level 3 financial instruments typically include observable components (that is, components that are actively quoted and can be validated to external sources) in addition to the unobservable components. The level 1 and/or level 2 inputs are not included in the table. In addition, the Firm manages the risk of the observable components of level 3 financial instruments using securities and derivative positions that are classified within levels 1 or 2 of the fair value hierarchy.
The range of values presented in the table is representative of the highest and lowest level input used to value the significant groups of instruments within a product/instrument classification. Where provided, the weighted averages of the input values presented in the table are calculated based on the fair value of the instruments that the input is being used to value.
In the Firm’s view, the input range, weighted and arithmetic average values do not reflect the degree of input uncertainty or an assessment of the reasonableness of the Firm’s estimates and assumptions. Rather, they reflect the characteristics of the various instruments held by the Firm and the relative distribution of instruments within the range of characteristics. For example, two option contracts may have similar levels of market risk exposure and valuation uncertainty, but may have significantly different implied volatility levels because the option contracts have different underlyings, tenors, or strike prices. The input range and weighted and arithmetic average values will therefore vary from period-to-period and parameter-to-parameter based on the characteristics of the instruments held by the Firm at each balance sheet date.
JPMorgan Chase & Co./2023 Form 10-K | 183 | |||||||
Notes to consolidated financial statements
Level 3 inputs(a) | ||||||||||||||||||||||||||
| December 31, 2023 | ||||||||||||||||||||||||||
| Product/Instrument | Fair value (in millions) | Principal valuation technique | Unobservable inputs(g) | Range of input values | Average(i) | |||||||||||||||||||||
Residential mortgage-backed securities and loans(b) | $ | Discounted cash flows | Yield | |||||||||||||||||||||||
| Prepayment speed | ||||||||||||||||||||||||||
| Conditional default rate | ||||||||||||||||||||||||||
| Loss severity | ||||||||||||||||||||||||||
Commercial mortgage-backed securities and loans(c) | Market comparables | Price | $ | $ | $ | |||||||||||||||||||||
| Corporate debt securities | Market comparables | Price | $ | $ | $ | |||||||||||||||||||||
Loans(d) | Market comparables | Price | $ | $ | $ | |||||||||||||||||||||
| Non-U.S. government debt securities | Market comparables | Price | $ | $ | $ | |||||||||||||||||||||
| Net interest rate derivatives | Option pricing | Interest rate volatility | ||||||||||||||||||||||||
| Interest rate spread volatility | ||||||||||||||||||||||||||
| Bermudan switch value | ||||||||||||||||||||||||||
| Interest rate correlation | ( | |||||||||||||||||||||||||
| IR-FX correlation | ( | |||||||||||||||||||||||||
| Discounted cash flows | Prepayment speed | |||||||||||||||||||||||||
| Net credit derivatives | Discounted cash flows | Credit correlation | ||||||||||||||||||||||||
| Credit spread | ||||||||||||||||||||||||||
| Recovery rate | ||||||||||||||||||||||||||
| Market comparables | Price | $ | $ | $ | ||||||||||||||||||||||
| Net foreign exchange derivatives | Option pricing | IR-FX correlation | ( | |||||||||||||||||||||||
| ( | Discounted cash flows | Prepayment speed | ||||||||||||||||||||||||
| Interest rate curve | ||||||||||||||||||||||||||
| Net equity derivatives | ( | Option pricing | Forward equity price(h) | |||||||||||||||||||||||
| Equity volatility | ||||||||||||||||||||||||||
| Equity correlation | ||||||||||||||||||||||||||
| Equity-FX correlation | ( | ( | ||||||||||||||||||||||||
| Equity-IR correlation | ( | |||||||||||||||||||||||||
| Net commodity derivatives | ( | Option pricing | Oil commodity forward | $ | $ | $ | ||||||||||||||||||||
| Natural gas commodity forward | $ | $ | $ | |||||||||||||||||||||||
| Commodity volatility | ||||||||||||||||||||||||||
| Commodity correlation | ( | |||||||||||||||||||||||||
| MSRs | Discounted cash flows | Refer to Note 15 | ||||||||||||||||||||||||
Long-term debt, short-term borrowings, and deposits(e) | Option pricing | Interest rate volatility | ||||||||||||||||||||||||
| Bermudan switch value | ||||||||||||||||||||||||||
| Interest rate correlation | ( | |||||||||||||||||||||||||
| IR-FX correlation | ( | |||||||||||||||||||||||||
| Equity correlation | ||||||||||||||||||||||||||
| Equity-FX correlation | ( | ( | ||||||||||||||||||||||||
| Equity-IR correlation | ( | |||||||||||||||||||||||||
| Discounted cash flows | Credit correlation | |||||||||||||||||||||||||
| Yield | ||||||||||||||||||||||||||
| Loss severity | ||||||||||||||||||||||||||
Other level 3 assets and liabilities, net(f) | ||||||||||||||||||||||||||
(a)The categories presented in the table have been aggregated based upon the product type, which may differ from their classification on the Consolidated balance sheets. Furthermore, the inputs presented for each valuation technique in the table are, in some cases, not applicable to every instrument valued using the technique as the characteristics of the instruments can differ.
(b)Comprises U.S. GSE and government agency securities of $758 million, nonagency securities of $5 million and non-trading loans of $980 million.
(c)Comprises nonagency securities of $12 million, trading loans of $65 million and non-trading loans of $1.4 billion.
(d)Comprises trading loans of $619 million and non-trading loans of $716 million.
(e)Long-term debt, short-term borrowings and deposits include structured notes issued by the Firm that are financial instruments that typically contain embedded derivatives. The estimation of the fair value of structured notes includes the derivative features embedded within the instrument. The significant unobservable inputs are broadly consistent with those presented for derivative receivables.
(f)Includes equity securities of $671 million including $544 million in Other assets, for which quoted prices are not readily available and the fair value is generally based on internal valuation techniques such as EBITDA multiples and comparable analysis. All other level 3 assets and liabilities are insignificant both individually and in aggregate.
(g)Price is a significant unobservable input for certain instruments. When quoted market prices are not readily available, reliance is generally placed on price-based internal valuation techniques. The price input is expressed assuming a par value of $100 .
(h)Forward equity price is expressed as a percentage of the current equity price.
(i)Amounts represent weighted averages except for derivative related inputs where arithmetic averages are used.
184 | JPMorgan Chase & Co./2023 Form 10-K | |||||||
Changes in and ranges of unobservable inputs
The following discussion provides a description of the impact on a fair value measurement of a change in each unobservable input in isolation, and the interrelationship between unobservable inputs, where relevant and significant. The impact of changes in inputs may not be independent, as a change in one unobservable input may give rise to a change in another unobservable input. Where relationships do exist between two unobservable inputs, those relationships are discussed below. Relationships may also exist between observable and unobservable inputs (for example, as observable interest rates rise, unobservable prepayment rates decline); such relationships have not been included in the discussion below. In addition, for each of the individual relationships described below, the inverse relationship would also generally apply.
The following discussion also provides a description of attributes of the underlying instruments and external market factors that affect the range of inputs used in the valuation of the Firm’s positions.
Yield – The yield of an asset is the interest rate used to discount future cash flows in a discounted cash flow calculation. An increase in the yield, in isolation, would result in a decrease in a fair value measurement.
Credit spread – The credit spread is the amount of additional annualized return over the market interest rate that a market participant would demand for taking exposure to the credit risk of an instrument. The credit spread for an instrument forms part of the discount rate used in a discounted cash flow calculation. Generally, an increase in the credit spread would result in a decrease in a fair value measurement.
The yield and the credit spread of a particular mortgage-backed security primarily reflect the risk inherent in the instrument. The yield is also impacted by the absolute level of the coupon paid by the instrument (which may not correspond directly to the level of inherent risk). Therefore, the range of yield and credit spreads reflects the range of risk inherent in various instruments owned by the Firm. The risk inherent in mortgage-backed securities is driven by the subordination of the security being valued and the characteristics of the underlying mortgages within the collateralized pool, including borrower FICO scores, LTV ratios for residential mortgages and the nature of the property and/or any tenants for commercial mortgages. For corporate debt securities, obligations of U.S. states and municipalities and other similar instruments, credit spreads reflect the credit quality of the obligor and the tenor of the obligation.
Prepayment speed – The prepayment speed is a measure of the voluntary unscheduled principal repayments of a prepayable obligation in a collateralized pool. Prepayment speeds generally decline as borrower delinquencies rise. An increase in prepayment speeds, in isolation, would result in a decrease in a fair value measurement of assets valued at a premium to par and an increase in a fair value measurement of assets valued at a discount to par.
Prepayment speeds may vary from collateral pool to collateral pool, and are driven by the type and location of the underlying borrower, and the remaining tenor of the obligation as well as the level and type (e.g., fixed or floating) of interest rate being paid by the borrower. Typically collateral pools with higher borrower credit quality have a higher prepayment rate than those with lower borrower credit quality, all other factors being equal.
Conditional default rate – The conditional default rate is a measure of the reduction in the outstanding collateral balance underlying a collateralized obligation as a result of defaults. While there is typically no direct relationship between conditional default rates and prepayment speeds, collateralized obligations for which the underlying collateral has high prepayment speeds will tend to have lower conditional default rates. An increase in conditional default rates would generally be accompanied by an increase in loss severity and an increase in credit spreads. An increase in the conditional default rate, in isolation, would result in a decrease in a fair value measurement. Conditional default rates reflect the quality of the collateral underlying a securitization and the structure of the securitization itself. Based on the types of securities owned in the Firm’s market-making portfolios, conditional default rates are most typically at the lower end of the range presented.
Loss severity – The loss severity (the inverse concept is the recovery rate) is the expected amount of future realized losses resulting from the ultimate liquidation of a particular loan, expressed as the net amount of loss relative to the outstanding loan balance. An increase in loss severity is generally accompanied by an increase in conditional default rates. An increase in the loss severity, in isolation, would result in a decrease in a fair value measurement.
The loss severity applied in valuing a mortgage-backed security depends on factors relating to the underlying mortgages, including the LTV ratio, the nature of the lender’s lien on the property and other instrument-specific factors.
JPMorgan Chase & Co./2023 Form 10-K | 185 | |||||||
Notes to consolidated financial statements
Correlation – Correlation is a measure of the relationship between the movements of two variables. Correlation is a pricing input for a derivative product where the payoff is driven by one or more underlying risks. Correlation inputs are related to the type of derivative (e.g., interest rate, credit, equity, foreign exchange and commodity) due to the nature of the underlying risks. When parameters are positively correlated, an increase in one parameter will result in an increase in the other parameter. When parameters are negatively correlated, an increase in one parameter will result in a decrease in the other parameter. An increase in correlation can result in an increase or a decrease in a fair value measurement. Given a short correlation position, an increase in correlation, in isolation, would generally result in a decrease in a fair value measurement.
The level of correlation used in the valuation of derivatives with multiple underlying risks depends on a number of factors including the nature of those risks. For example, the correlation between two credit risk exposures would be different than that between two interest rate risk exposures. Similarly, the tenor of the transaction may also impact the correlation input, as the relationship between the underlying risks may be different over different time periods. Furthermore, correlation levels are very much dependent on market conditions and could have a relatively wide range of levels within or across asset classes over time, particularly in volatile market conditions.
Volatility – Volatility is a measure of the variability in possible returns for an instrument, parameter or market index given how much the particular instrument, parameter or index changes in value over time. Volatility is a pricing input for options, including equity options, commodity options, and interest rate options. Generally, the higher the volatility of the underlying, the riskier the instrument. Given a long position in an option, an increase in volatility, in isolation, would generally result in an increase in a fair value measurement.
The level of volatility used in the valuation of a particular option-based derivative depends on a number of factors, including the nature of the risk underlying the option (e.g., the volatility of a particular equity security may be significantly different from that of a particular commodity index), the tenor of the derivative as well as the strike price of the option.
Bermudan switch value – The switch value is the difference between the overall value of a Bermudan swaption, which can be exercised at multiple points in time, and its most expensive European swaption and reflects the additional value that the multiple exercise dates provide the holder. Switch values are dependent on market conditions and can vary greatly depending on a number of factors, such as the tenor of the underlying swap as well as the strike price of the option. An increase in switch value, in isolation, would generally result in an increase in a fair value measurement.
Interest rate curve – The interest rate curve represents the relationship of interest rates over differing tenors. The interest rate curve is used to set interest rate and foreign exchange derivative cash flows and is also a pricing input used in the discounting of any derivative cash flow.
Forward price – The forward price is the price at which the buyer agrees to purchase the asset underlying a forward contract on the predetermined future delivery date, and is such that the value of the contract is zero at inception.
The forward price is used as an input in the valuation of certain derivatives and depends on a number of factors including interest rates, the current price of the underlying asset, and the expected income to be received and costs to be incurred by the seller as a result of holding that asset until the delivery date. An increase in the forward can result in an increase or a decrease in a fair value measurement.
Changes in level 3 recurring fair value measurements
The following tables include a rollforward of the Consolidated balance sheets amounts (including changes in fair value) for financial instruments classified by the Firm within level 3 of the fair value hierarchy for the years ended December 31, 2023, 2022 and 2021. When a determination is made to classify a financial instrument within level 3, the determination is based on the significance of the unobservable inputs to the overall fair value measurement. However, level 3 financial instruments typically include, in addition to the unobservable or level 3 components, observable components (that is, components that are actively quoted and can be validated to external sources); accordingly, the gains and losses in the table below include changes in fair value due in part to observable factors that are part of the valuation methodology. The Firm risk-manages the observable components of level 3 financial instruments using securities and derivative positions that are classified within level 1 or 2 of the fair value hierarchy; as these level 1 and level 2 risk management instruments are not included below, the gains or losses in the following tables do not reflect the effect of the Firm’s risk management activities related to such level 3 instruments.
186 | JPMorgan Chase & Co./2023 Form 10-K | |||||||
| Fair value measurements using significant unobservable inputs | |||||||||||||||||||||||||||||||||||||||||
| Year ended December 31, 2023 (in millions) | Fair value at January 1, 2023 | Total realized/unrealized gains/(losses) | Transfers into level 3 | Transfers (out of) level 3 | Fair value at Dec. 31, 2023 | Change in unrealized gains/(losses) related to financial instruments held at Dec. 31, 2023 | |||||||||||||||||||||||||||||||||||
Purchases(g) | Sales | Settlements(h) | |||||||||||||||||||||||||||||||||||||||
Assets:(a) | |||||||||||||||||||||||||||||||||||||||||
| Federal funds sold and securities purchased under resale agreements | $ | $ | $ | $ | $ | $ | $ | $ | $ | ||||||||||||||||||||||||||||||||
| Trading assets: | |||||||||||||||||||||||||||||||||||||||||
| Debt instruments: | |||||||||||||||||||||||||||||||||||||||||
| Mortgage-backed securities: | |||||||||||||||||||||||||||||||||||||||||
| U.S. GSEs and government agencies | ( | ( | ( | ||||||||||||||||||||||||||||||||||||||
| Residential – nonagency | ( | ( | |||||||||||||||||||||||||||||||||||||||
| Commercial – nonagency | ( | ( | |||||||||||||||||||||||||||||||||||||||
Total mortgage-backed securities | ( | ( | ( | ||||||||||||||||||||||||||||||||||||||
Obligations of U.S. states and municipalities | ( | ||||||||||||||||||||||||||||||||||||||||
Non-U.S. government debt securities | ( | ( | |||||||||||||||||||||||||||||||||||||||
| Corporate debt securities | ( | ( | ( | ||||||||||||||||||||||||||||||||||||||
Loans | ( | ( | ( | ( | |||||||||||||||||||||||||||||||||||||
| Asset-backed securities | ( | ( | ( | ||||||||||||||||||||||||||||||||||||||
| Total debt instruments | ( | ( | ( | ||||||||||||||||||||||||||||||||||||||
| Equity securities | ( | ( | ( | ( | ( | ||||||||||||||||||||||||||||||||||||
| Physical commodities | ( | ||||||||||||||||||||||||||||||||||||||||
| Other | ( | ( | ( | ( | |||||||||||||||||||||||||||||||||||||
Total trading assets – debt and equity instruments | ( | ( | ( | ( | (c) | ||||||||||||||||||||||||||||||||||||
Net derivative receivables:(b) | |||||||||||||||||||||||||||||||||||||||||
| Interest rate | ( | ( | ( | ||||||||||||||||||||||||||||||||||||||
| Credit | ( | ( | ( | ||||||||||||||||||||||||||||||||||||||
| Foreign exchange | ( | ( | ( | ( | |||||||||||||||||||||||||||||||||||||
| Equity | ( | ( | ( | ( | ( | ( | |||||||||||||||||||||||||||||||||||
| Commodity | ( | ( | ( | ( | ( | ( | ( | ||||||||||||||||||||||||||||||||||
(c) | ( | ( | ( | ( | ( | ( | (c) | ||||||||||||||||||||||||||||||||||
| Available-for-sale securities: | |||||||||||||||||||||||||||||||||||||||||
| Corporate debt securities | ( | ( | |||||||||||||||||||||||||||||||||||||||
| Total available-for-sale securities | (d) | ( | ( | ||||||||||||||||||||||||||||||||||||||
Loans | (c) | ( | ( | ( | (c) | ||||||||||||||||||||||||||||||||||||
| Mortgage servicing rights | (e) | ( | ( | (e) | |||||||||||||||||||||||||||||||||||||
Other assets | ( | (c) | ( | ( | ( | ( | (c) | ||||||||||||||||||||||||||||||||||
| Fair value measurements using significant unobservable inputs | |||||||||||||||||||||||||||||||||||||||||
| Year ended December 31, 2023 (in millions) | Fair value at January 1, 2023 | Total realized/unrealized (gains)/losses | Transfers (out of) level 3 | Fair value at Dec. 31, 2023 | Change in unrealized (gains)/losses related to financial instruments held at Dec. 31, 2023 | ||||||||||||||||||||||||||||||||||||
| Purchases | Sales | Issuances | Settlements(h) | Transfers into level 3 | |||||||||||||||||||||||||||||||||||||
Liabilities:(a) | |||||||||||||||||||||||||||||||||||||||||
| Deposits | $ | $ | (c)(f) | $ | $ | $ | $ | ( | $ | $ | ( | $ | $ | (c)(f) | |||||||||||||||||||||||||||
| Short-term borrowings | (c)(f) | ( | ( | (c)(f) | |||||||||||||||||||||||||||||||||||||
Trading liabilities – debt and equity instruments | ( | (c) | ( | ( | ( | ||||||||||||||||||||||||||||||||||||
Accounts payable and other liabilities | ( | (c) | ( | ( | ( | (c) | |||||||||||||||||||||||||||||||||||
| Long-term debt | (c)(f) | ( | ( | (c)(f) | |||||||||||||||||||||||||||||||||||||
JPMorgan Chase & Co./2023 Form 10-K | 187 | |||||||
Notes to consolidated financial statements
| Fair value measurements using significant unobservable inputs | |||||||||||||||||||||||||||||||||||||||||
| Year ended December 31, 2022 (in millions) | Fair value at January 1, 2022 | Total realized/unrealized gains/(losses) | Transfers (out of) level 3 | Fair value at Dec. 31, 2022 | Change in unrealized gains/(losses) related to financial instruments held at Dec. 31, 2022 | ||||||||||||||||||||||||||||||||||||
Purchases(g) | Sales | Settlements(h) | Transfers into level 3 | ||||||||||||||||||||||||||||||||||||||
Assets:(a) | |||||||||||||||||||||||||||||||||||||||||
| Federal funds sold and securities purchased under resale agreements | $ | $ | $ | $ | ( | $ | ( | $ | $ | $ | $ | ||||||||||||||||||||||||||||||
| Trading assets: | |||||||||||||||||||||||||||||||||||||||||
| Debt instruments: | |||||||||||||||||||||||||||||||||||||||||
| Mortgage-backed securities: | |||||||||||||||||||||||||||||||||||||||||
| U.S. GSEs and government agencies | ( | ( | ( | ||||||||||||||||||||||||||||||||||||||
| Residential – nonagency | ( | ( | ( | ( | |||||||||||||||||||||||||||||||||||||
| Commercial – nonagency | ( | ( | |||||||||||||||||||||||||||||||||||||||
Total mortgage-backed securities | ( | ( | ( | ||||||||||||||||||||||||||||||||||||||
Obligations of U.S. states and municipalities | |||||||||||||||||||||||||||||||||||||||||
Non-U.S. government debt securities | ( | ( | ( | ( | ( | ||||||||||||||||||||||||||||||||||||
| Corporate debt securities | ( | ( | ( | ( | ( | ||||||||||||||||||||||||||||||||||||
Loans | ( | ( | ( | ( | ( | ||||||||||||||||||||||||||||||||||||
| Asset-backed securities | ( | ( | ( | ||||||||||||||||||||||||||||||||||||||
| Total debt instruments | ( | ( | ( | ( | ( | ||||||||||||||||||||||||||||||||||||
| Equity securities | ( | ( | ( | ( | ( | ||||||||||||||||||||||||||||||||||||
| Physical commodities | ( | ( | |||||||||||||||||||||||||||||||||||||||
| Other | ( | ( | |||||||||||||||||||||||||||||||||||||||
Total trading assets – debt and equity instruments | ( | (c) | ( | ( | ( | ( | (c) | ||||||||||||||||||||||||||||||||||
Net derivative receivables:(b) | |||||||||||||||||||||||||||||||||||||||||
| Interest rate | ( | ( | ( | ||||||||||||||||||||||||||||||||||||||
| Credit | ( | ( | ( | ||||||||||||||||||||||||||||||||||||||
| Foreign exchange | ( | ( | ( | ||||||||||||||||||||||||||||||||||||||
| Equity | ( | ( | ( | ( | |||||||||||||||||||||||||||||||||||||
| Commodity | ( | ( | ( | ||||||||||||||||||||||||||||||||||||||
| ( | (c) | ( | ( | (c) | |||||||||||||||||||||||||||||||||||||
| Available-for-sale securities: | |||||||||||||||||||||||||||||||||||||||||
| Corporate debt securities | ( | ||||||||||||||||||||||||||||||||||||||||
| Total available-for-sale securities | (d) | ( | (d) | ||||||||||||||||||||||||||||||||||||||
Loans | ( | (c) | ( | ( | ( | ( | (c) | ||||||||||||||||||||||||||||||||||
| Mortgage servicing rights | (e) | ( | ( | (e) | |||||||||||||||||||||||||||||||||||||
Other assets | (c) | ( | ( | ( | (c) | ||||||||||||||||||||||||||||||||||||
| Fair value measurements using significant unobservable inputs | |||||||||||||||||||||||||||||||||||||||||
| Year ended December 31, 2022 (in millions) | Fair value at January 1, 2022 | Total realized/unrealized (gains)/losses | Transfers (out of) level 3 | Fair value at Dec. 31, 2022 | Change in unrealized (gains)/losses related to financial instruments held at Dec. 31, 2022 | ||||||||||||||||||||||||||||||||||||
| Purchases | Sales | Issuances | Settlements(h) | Transfers into level 3 | |||||||||||||||||||||||||||||||||||||
Liabilities:(a) | |||||||||||||||||||||||||||||||||||||||||
| Deposits | $ | $ | ( | (c)(f) | $ | $ | $ | $ | ( | $ | $ | ( | $ | $ | ( | (c)(f) | |||||||||||||||||||||||||
| Short-term borrowings | ( | (c)(f) | ( | ( | (c)(f) | ||||||||||||||||||||||||||||||||||||
Trading liabilities – debt and equity instruments | ( | (c) | ( | ( | (c) | ||||||||||||||||||||||||||||||||||||
Accounts payable and other liabilities | ( | (c) | ( | ( | ( | (c) | |||||||||||||||||||||||||||||||||||
| Long-term debt | ( | (c)(f) | ( | ( | ( | (c)(f) | |||||||||||||||||||||||||||||||||||
188 | JPMorgan Chase & Co./2023 Form 10-K | |||||||
| Fair value measurements using significant unobservable inputs | ||||||||||||||||||||||||||||||||||||||||||||||||||
| Year ended December 31, 2021 (in millions) | Fair value at January 1, 2021 | Total realized/unrealized gains/(losses) | Transfers (out of) level 3 | Fair value at Dec. 31, 2021 | Change in unrealized gains/(losses) related to financial instruments held at Dec. 31, 2021 | |||||||||||||||||||||||||||||||||||||||||||||
Purchases(g) | Sales | Settlements(h) | Transfers into level 3 | |||||||||||||||||||||||||||||||||||||||||||||||
Assets:(a) | ||||||||||||||||||||||||||||||||||||||||||||||||||
| Federal funds sold and securities purchased under resale agreements | $ | $ | $ | $ | $ | $ | $ | $ | $ | |||||||||||||||||||||||||||||||||||||||||
| Trading assets: | ||||||||||||||||||||||||||||||||||||||||||||||||||
| Debt instruments: | ||||||||||||||||||||||||||||||||||||||||||||||||||
| Mortgage-backed securities: | ||||||||||||||||||||||||||||||||||||||||||||||||||
| U.S. GSEs and government agencies | ( | ( | ( | ( | ( | |||||||||||||||||||||||||||||||||||||||||||||
| Residential – nonagency | ( | ( | ( | ( | ||||||||||||||||||||||||||||||||||||||||||||||
| Commercial – nonagency | ( | ( | ( | |||||||||||||||||||||||||||||||||||||||||||||||
Total mortgage-backed securities | ( | ( | ( | ( | ( | |||||||||||||||||||||||||||||||||||||||||||||
Obligations of U.S. states and municipalities | ( | |||||||||||||||||||||||||||||||||||||||||||||||||
Non-U.S. government debt securities | ( | ( | ( | ( | ( | |||||||||||||||||||||||||||||||||||||||||||||
| Corporate debt securities | ( | ( | ( | ( | ( | |||||||||||||||||||||||||||||||||||||||||||||
Loans | ( | ( | ( | ( | ||||||||||||||||||||||||||||||||||||||||||||||
| Asset-backed securities | ( | ( | ( | ( | ||||||||||||||||||||||||||||||||||||||||||||||
| Total debt instruments | ( | ( | ( | ( | ( | |||||||||||||||||||||||||||||||||||||||||||||
| Equity securities | ( | ( | ( | ( | ||||||||||||||||||||||||||||||||||||||||||||||
| Physical commodities | ||||||||||||||||||||||||||||||||||||||||||||||||||
| Other | ( | ( | ||||||||||||||||||||||||||||||||||||||||||||||||
Total trading assets – debt and equity instruments | ( | (c) | ( | ( | ( | ( | (c) | |||||||||||||||||||||||||||||||||||||||||||
Net derivative receivables:(b) | ||||||||||||||||||||||||||||||||||||||||||||||||||
| Interest rate | ( | ( | ( | ( | ||||||||||||||||||||||||||||||||||||||||||||||
| Credit | ( | ( | ( | |||||||||||||||||||||||||||||||||||||||||||||||
| Foreign exchange | ( | ( | ( | ( | ( | |||||||||||||||||||||||||||||||||||||||||||||
| Equity | ( | ( | ( | ( | ( | |||||||||||||||||||||||||||||||||||||||||||||
| Commodity | ( | ( | ( | ( | ( | ( | ( | |||||||||||||||||||||||||||||||||||||||||||
| ( | (c) | ( | ( | ( | (c) | |||||||||||||||||||||||||||||||||||||||||||||
| Available-for-sale securities: | ||||||||||||||||||||||||||||||||||||||||||||||||||
| Corporate debt securities | ( | ( | ||||||||||||||||||||||||||||||||||||||||||||||||
| Total available-for-sale securities | ( | (d) | ( | (d) | ||||||||||||||||||||||||||||||||||||||||||||||
Loans | ( | (c) | ( | ( | ( | ( | (c) | |||||||||||||||||||||||||||||||||||||||||||
| Mortgage servicing rights | (e) | ( | ( | (e) | ||||||||||||||||||||||||||||||||||||||||||||||
Other assets | (c) | ( | ( | ( | (c) | |||||||||||||||||||||||||||||||||||||||||||||
| Fair value measurements using significant unobservable inputs | ||||||||||||||||||||||||||||||||||||||||||||||||||
| Year ended December 31, 2021 (in millions) | Fair value at January 1, 2021 | Total realized/unrealized (gains)/losses | Transfers into level 3 | Transfers (out of) level 3 | Fair value at Dec. 31, 2021 | Change in unrealized (gains)/losses related to financial instruments held at Dec. 31, 2021 | ||||||||||||||||||||||||||||||||||||||||||||
| Purchases | Sales | Issuances | Settlements(h) | |||||||||||||||||||||||||||||||||||||||||||||||
Liabilities:(a) | ||||||||||||||||||||||||||||||||||||||||||||||||||
| Deposits | $ | $ | ( | (c)(f) | $ | $ | $ | $ | ( | $ | $ | ( | $ | $ | ( | (c)(f) | ||||||||||||||||||||||||||||||||||
| Short-term borrowings | ( | (c)(f) | ( | ( | ( | (c)(f) | ||||||||||||||||||||||||||||||||||||||||||||
Trading liabilities – debt and equity instruments | ( | (c) | ( | ( | ( | (c) | ||||||||||||||||||||||||||||||||||||||||||||
Accounts payable and other liabilities | (c) | ( | (c) | |||||||||||||||||||||||||||||||||||||||||||||||
| Long-term debt | (c)(f) | ( | ( | (c)(f) | ||||||||||||||||||||||||||||||||||||||||||||||
(a)Level 3 assets at fair value as a percentage of total Firm assets at fair value (including assets measured at fair value on a nonrecurring basis) were 2 8 10 % at December 31, 2021.
(b)All level 3 derivatives are presented on a net basis, irrespective of the underlying counterparty.
JPMorgan Chase & Co./2023 Form 10-K | 189 | |||||||
Notes to consolidated financial statements
(c)Predominantly reported in principal transactions revenue, except for changes in fair value for CCB mortgage loans and lending-related commitments originated with the intent to sell, and mortgage loan purchase commitments, which are reported in mortgage fees and related income.
(d)Realized gains/(losses) on AFS securities are reported in investment securities gains/(losses). Unrealized gains/(losses) are reported in OCI. Realized and unrealized gains/(losses) recorded on level 3 AFS securities were not material for the years ended December 31, 2023, 2022 and 2021.
(e)Changes in fair value for MSRs are reported in mortgage fees and related income.
(f)Realized (gains)/losses due to DVA for fair value option elected liabilities are reported in principal transactions revenue, and were not material for the years ended December 31, 2023, 2022 and 2021. Unrealized (gains)/losses are reported in OCI, and were $(158 ) million, $(529 ) million and $258 million for the years ended December 31, 2023, 2022 and 2021, respectively.
(g)Loan originations are included in purchases.
(h)Includes financial assets and liabilities that have matured, been partially or fully repaid, impacts of modifications, deconsolidations associated with beneficial interests in VIEs and other items.
Level 3 analysis
Consolidated balance sheets changes
The following describes significant changes to level 3 assets since December 31, 2022, for those items measured at fair value on a recurring basis. Refer to Assets and liabilities measured at fair value on a nonrecurring basis on page 193 for further information on changes impacting items measured at fair value on a nonrecurring basis.
For the year ended December 31, 2023
Level 3 assets were $23.7 billion at December 31, 2023, reflecting an increase of $30 million from December 31, 2022.
The increase for the year ended December 31, 2023 was driven by:
•$1.7 billion increase in non-trading loans largely due to $1.1 billion of loans in CIB associated with First Republic.
•$549 million increase in MSRs,
predominantly offset by:
•$1.8 billion decrease in gross derivative receivables due to settlements and net transfers largely offset by gains and purchases.
Refer to Note 15 for information on MSRs.
Refer to the sections below for additional information.
Transfers between levels for instruments carried at
fair value on a recurring basis
During the year ended December 31, 2023, significant transfers from level 2 into level 3 included the following:
•$951 million of gross interest rate derivative receivables as a result of a decrease in observability and an increase in the significance of unobservable inputs and $2.1 billion of gross interest rate derivative payables as a result of transition to term SOFR for certain interest rate options.
•$1.5 billion of gross equity derivative receivables and $829 million of gross equity derivative payables as a result of a decrease in observability and an increase in the significance of unobservable inputs.
•$1.3 billion of non-trading loans driven by a decrease in observability.
During the year ended December 31, 2023, significant transfers from level 3 into level 2 included the following:
•$1.1 billion of total debt and equity instruments, partially due to trading loans, driven by an increase in observability.
•$921 million of gross interest rate derivative receivables as a result of an increase in observability and a decrease in the significance of unobservable inputs.
•$2.3 billion of gross equity derivative receivables and $1.7 billion of gross equity derivative payables as a result of an increase in observability and a decrease in the significance of unobservable inputs.
•$1.1 billion of non-trading loans as a result of an increase in observability and a decrease in the significance of unobservable inputs.
During the year ended December 31, 2022, significant transfers from level 2 into level 3 included the following:
•$2.4 billion of total debt and equity instruments, predominantly due to equity securities of $1.1 billion driven by a decrease in observability predominantly as a result of restricted access to certain markets and trading loans of $925 million driven by a decrease in observability.
•$1.6 billion of gross interest rate derivative receivables and $878 million of gross interest rate derivative payables as a result of a decrease in observability and an increase in the significance of unobservable inputs.
•$1.6 billion of gross equity derivative receivables and $2.3 billion of gross equity derivative payables as a result of a decrease in observability and an increase in the significance of unobservable inputs.
•$1.1 billion of non-trading loans driven by a decrease in observability.
•$793 million of long-term debt driven by a decrease in observability and an increase in the significance of unobservable inputs for structured notes.
190 | JPMorgan Chase & Co./2023 Form 10-K | |||||||
During the year ended December 31, 2022, significant transfers from level 3 into level 2 included the following:
•$1.2 billion of total debt and equity instruments, largely due to trading loans, driven by an increase in observability.
•$1.2 billion of gross interest rate derivative receivables and $807 million of gross interest rate derivative payables as a result of an increase in observability and a decrease in the significance of unobservable inputs.
•$2.2 billion of gross equity derivative receivables and $2.3 billion of gross equity derivative payables as a result of an increase in observability and a decrease in the significance of unobservable inputs.
•$831 million of non-trading loans driven by an increase in observability.
•$1.0 billion of long-term debt driven by an increase in observability and a decrease in the significance of unobservable inputs for structured notes.
During the year ended December 31, 2021, significant transfers from level 2 into level 3 included the following:
•$1.0 billion of total debt and equity instruments, largely due to trading loans, driven by a decrease in observability.
•$1.5 billion of gross equity derivative receivables and $1.2 billion of gross equity derivative payables as a result of a decrease in observability and an increase in the significance of unobservable inputs.
•$1.3 billion of non-trading loans driven by a decrease in observability.
During the year ended December 31, 2021, significant transfers from level 3 into level 2 included the following:
•$1.4 billion of total debt and equity instruments, largely due to trading loans, driven by an increase in observability.
•$1.9 billion of gross equity derivative receivables and $2.1 billion of gross equity derivative payables as a result of an increase in observability and a decrease in the significance of unobservable inputs.
•$794 million of non-trading loans driven by an increase in observability.
•$809 million of long-term debt driven by an increase in observability and a decrease in the significance of unobservable inputs for structured notes.
All transfers are based on changes in the observability and/or significance of the valuation inputs and are assumed to occur at the beginning of the quarterly reporting period in which they occur.
Gains and losses
The following describes significant components of total realized/unrealized gains/(losses) for instruments measured at fair value on a recurring basis for the years ended December 31, 2023, 2022 and 2021. These amounts exclude any effects of the Firm’s risk management activities where the financial instruments are classified as level 1 and 2 of the fair value hierarchy. Refer to Changes in level 3 recurring fair value measurements rollforward tables on pages 186–190 for further information on these instruments.
2023
•$1.8 billion of net gains on assets, largely driven by gains in net interest rate derivative receivables due to market movements and gains in MSRs reflecting lower prepayment speeds on higher rates.
•$3.3 billion of net losses on liabilities, predominantly driven by losses in long-term debt due to market movements.
2022
•$7.7 billion of net gains on assets, predominantly driven by gains in net equity derivative receivables due to market movements and gains in MSRs reflecting lower prepayment speeds on higher rates.
•$4.6 billion of net gains on liabilities, predominantly driven by a decline in the fair value of long-term debt due to market movements.
2021
•$495 million of net gains on assets, driven by gains in net interest rate derivative receivables due to market movements, partially offset by losses in net equity derivative receivables and net commodity derivative receivables due to market movements.
•$1.1 billion of net gains on liabilities, driven by gains in short-term borrowings due to market movements.
Refer to Note 15 for information on MSRs.
JPMorgan Chase & Co./2023 Form 10-K | 191 | |||||||
Notes to consolidated financial statements
Credit and funding adjustments – derivatives
Derivatives are generally valued using models that use as their basis observable market parameters. These market parameters generally do not consider factors such as counterparty nonperformance risk, the Firm’s own credit quality, and funding costs. Therefore, it is generally necessary to make adjustments to the base estimate of fair value to reflect these factors.
CVA represents the adjustment, relative to the relevant benchmark interest rate, necessary to reflect counterparty nonperformance risk. The Firm estimates CVA using a scenario analysis to estimate the expected positive credit exposure across all of the Firm’s existing positions with each counterparty, and then estimates losses based on the probability of default and estimated recovery rate as a result of a counterparty credit event considering contractual factors designed to mitigate the Firm’s credit exposure, such as collateral and legal rights of offset. The key inputs to this methodology are (i) the probability of a default event occurring for each counterparty, as derived from observed or estimated CDS spreads; and (ii) estimated recovery rates implied by CDS spreads, adjusted to consider the differences in recovery rates as a derivative creditor relative to those reflected in CDS spreads, which generally reflect senior unsecured creditor risk.
FVA represents the adjustment to reflect the impact of funding and is recognized where there is evidence that a market participant in the principal market would incorporate it in a transfer of the instrument. The Firm’s FVA framework, applied to uncollateralized (including partially collateralized) over-the-counter (“OTC”) derivatives incorporates key inputs such as: (i) the expected funding requirements arising from the Firm’s positions with
each counterparty and collateral arrangements; and (ii) the estimated market funding cost in the principal market which, for derivative liabilities, considers the Firm’s credit risk (DVA). For collateralized derivatives, the fair value is estimated by discounting expected future cash flows at the relevant overnight indexed swap rate given the underlying collateral agreement with the counterparty, and therefore a separate FVA is not necessary.
The following table provides the impact of credit and funding adjustments on principal transactions revenue in the respective periods, excluding the effect of any associated hedging activities. The FVA presented below includes the impact of the Firm’s own credit quality on the inception value of liabilities as well as the impact of changes in the Firm’s own credit quality over time.
| Year ended December 31, (in millions) | 2023 | 2022 | 2021 | ||||||||||||||
| Credit and funding adjustments: | |||||||||||||||||
| Derivatives CVA | $ | $ | $ | ||||||||||||||
| Derivatives FVA | |||||||||||||||||
Valuation adjustments on fair value option elected liabilities
192 | JPMorgan Chase & Co./2023 Form 10-K | |||||||
Assets and liabilities measured at fair value on a nonrecurring basis
The following tables present the assets and liabilities held as of December 31, 2023 and 2022, for which nonrecurring fair value adjustments were recorded during the years ended December 31, 2023 and 2022, by major product category and fair value hierarchy.
| December 31, 2023 (in millions) | Fair value hierarchy | Total fair value | |||||||||||||||||||||
Level 1 | Level 2 | Level 3 | |||||||||||||||||||||
| Loans | $ | $ | $ | $ | |||||||||||||||||||
Other assets(a) | |||||||||||||||||||||||
| Total assets measured at fair value on a nonrecurring basis | $ | $ | $ | $ | |||||||||||||||||||
| Accounts payable and other liabilities | |||||||||||||||||||||||
| Total liabilities measured at fair value on a nonrecurring basis | $ | $ | $ | $ | |||||||||||||||||||
| December 31, 2022 (in millions) | Fair value hierarchy | Total fair value | |||||||||||||||||||||
Level 1 | Level 2 | Level 3 | |||||||||||||||||||||
| Loans | $ | $ | $ | $ | |||||||||||||||||||
| Other assets | |||||||||||||||||||||||
| Total assets measured at fair value on a nonrecurring basis | $ | $ | $ | $ | |||||||||||||||||||
Accounts payable and other liabilities | |||||||||||||||||||||||
| Total liabilities measured at fair value on a nonrecurring basis | $ | $ | $ | $ | |||||||||||||||||||
(a) Included impairments on certain equity method investments, as well as equity securities without readily determinable fair values that were adjusted based on observable price changes in orderly transactions from an identical or similar investment of the same issuer (measurement alternative). Of the $1.3 billion in level 3 assets measured at fair value on a nonrecurring basis as of December 31, 2023, $412 million related to equity securities adjusted based on the measurement alternative. These equity securities are classified as level 3 due to the infrequency of the observable prices and/or the restrictions on the shares.
Nonrecurring fair value changes
The following table presents the total change in value of assets and liabilities for which fair value adjustments have been recognized for the years ended December 31, 2023, 2022 and 2021, related to assets and liabilities held at those dates.
| December 31, (in millions) | 2023 | 2022 | 2021 | ||||||||||||||
| Loans | $ | ( | $ | ( | $ | ( | |||||||||||
Other assets(a) | ( | ( | |||||||||||||||
| Accounts payable and other liabilities | ( | ||||||||||||||||
Total nonrecurring fair value gains/(losses) | $ | ( | $ | ( | $ | ||||||||||||
(a)Included $(232 ) million, $(338 ) million and $379 million for the years ended December 31, 2023, 2022 and 2021, respectively, of net gains/(losses) as a result of the measurement alternative. The current period also included impairments on certain equity method investments.
JPMorgan Chase & Co./2023 Form 10-K | 193 | |||||||
Notes to consolidated financial statements
Equity securities without readily determinable fair values
The Firm measures certain equity securities without readily determinable fair values at cost less impairment (if any), plus or minus observable price changes from an identical or similar investment of the same issuer (i.e., measurement alternative), with such changes recognized in other income.
In its determination of the new carrying values upon observable price changes, the Firm may adjust the prices if deemed necessary to arrive at the Firm’s estimated fair values. Such adjustments may include adjustments to reflect the different rights and obligations of similar securities, and other adjustments that are consistent with the Firm’s valuation techniques for private equity direct investments.
The following table presents the carrying value of equity securities without readily determinable fair values held as of December 31, 2023 and 2022, that are measured under the measurement alternative and the related adjustments recorded during the periods presented for those securities with observable price changes. These securities are included in the nonrecurring fair value tables when applicable price changes are observable.
| As of or for the year ended December 31, | |||||||||||
| (in millions) | 2023 | 2022 | |||||||||
| Other assets | |||||||||||
Carrying value(a) | $ | $ | |||||||||
Upward carrying value changes(b) | |||||||||||
Downward carrying value changes/impairment(c) | ( | ( | |||||||||
(a)The period-end carrying values reflect cumulative purchases and sales in addition to upward and downward carrying value changes.
(b)The cumulative upward carrying value changes between January 1, 2018 and December 31, 2023 were $1.2 billion.
Included in other assets above is the Firm’s interest in approximately 37 million Visa Class B common shares (“Visa B shares”). These shares are subject to certain transfer restrictions and are convertible into Visa Class A common shares (“Visa A shares”) at a specified conversion rate upon final resolution of certain litigation matters involving Visa. The conversion rate of Visa B shares to Visa A shares was 1.5875 at December 31, 2023 and may be adjusted by Visa depending on developments related to the litigation matters. The outcome of those litigation matters, and the effect that the resolution of those matters may have on the conversion rate, is unknown. Accordingly, as of December 31, 2023, there is significant uncertainty regarding when the transfer restrictions on Visa B shares may be terminated and what the final conversion rate for the Visa B shares will be. As a result of these considerations, as well as differences in voting rights, Visa B shares are not considered to be similar to Visa A shares, and they continue to be held at their nominal carrying value.
In connection with prior sales of Visa B shares, the Firm has entered into derivative instruments with the purchasers of the shares under which the Firm retains the risk associated with changes in the conversion rate. Under the terms of the derivative instruments, the Firm will (a) make or receive payments based on subsequent changes in the conversion rate and (b) make periodic interest payments to the purchasers of the Visa B shares. The payments under the derivative instruments will continue as long as the Visa B shares remain subject to transfer restrictions. The derivative instruments are accounted for at fair value using a discounted cash flow methodology based upon the Firm’s estimate of the timing and magnitude of final resolution of the litigation matters. The derivative instruments are recorded in trading liabilities, and changes in fair value are recognized in other income. As of December 31, 2023, the Firm held derivative instruments associated with 23 million Visa B shares that the Firm had previously sold, which are all subject to similar terms and conditions.
On January 24, 2024, Visa filed a Current Report on Form 8-K with the SEC announcing that Visa’s stockholders approved amendments to its Certificate of Incorporation that redenominate the Visa B shares to Visa Class B-1 common shares (“Visa B-1 shares”) and authorize Visa to conduct one or more exchange offers ("the Program") which, if conducted, would have the effect of releasing transfer restrictions on a portion of Visa's B-1 shares through an exchange for Visa Class C common shares (“Visa C shares”). The Program would entitle the Firm to exchange its Visa B-1 shares, for Visa Class B-2 common shares (”Visa B-2 shares”) and Visa C shares, through an initial exchange offer if and when conducted by Visa. The Visa B-2 shares would continue to be subject to the transfer restrictions associated with the Visa B shares. The Firm is then entitled to sell the Visa C shares received after a brief lock-up period expires, and Visa is also authorized to extend offers for potential future exchanges, each enabling the release of additional Visa B shares if certain conditions are met. The timing and likelihood of any initial or future exchange offer is dependent upon actions taken by Visa and other factors that may be outside of the Firm’s control.
194 | JPMorgan Chase & Co./2023 Form 10-K | |||||||
Additional disclosures about the fair value of financial instruments that are not carried on the Consolidated balance sheets at fair value
U.S. GAAP requires disclosure of the estimated fair value of certain financial instruments, which are included in the following table. However, this table does not include other items, such as nonfinancial assets, intangible assets, certain financial instruments, and customer relationships. In the opinion of management, these items, in the aggregate, add significant value to JPMorgan Chase.
Financial instruments for which carrying value approximates fair value
Certain financial instruments that are not carried at fair value on the Consolidated balance sheets are carried at
amounts that approximate fair value, due to their short-term nature and generally negligible credit risk. These instruments include cash and due from banks, deposits with banks, federal funds sold, securities purchased under resale agreements and securities borrowed, short-term receivables and accrued interest receivable, short-term borrowings, federal funds purchased, securities loaned and sold under repurchase agreements, accounts payable, and accrued liabilities. In addition, U.S. GAAP requires that the fair value of deposit liabilities with no stated maturity (i.e., demand, savings and certain money market deposits) be equal to their carrying value; recognition of the inherent funding value of these instruments is not permitted.
The following table presents, by fair value hierarchy classification, the carrying values and estimated fair values at December 31, 2023 and 2022, of financial assets and liabilities, excluding financial instruments that are carried at fair value on a recurring basis, and their classification within the fair value hierarchy.
| December 31, 2023 | December 31, 2022 | ||||||||||||||||||||||||||||||||||||||||
| Estimated fair value hierarchy | Estimated fair value hierarchy | ||||||||||||||||||||||||||||||||||||||||
| (in billions) | Carrying value | Level 1 | Level 2 | Level 3 | Total estimated fair value | Carrying value | Level 1 | Level 2 | Level 3 | Total estimated fair value | |||||||||||||||||||||||||||||||
| Financial assets | |||||||||||||||||||||||||||||||||||||||||
| Cash and due from banks | $ | $ | $ | $ | $ | $ | $ | $ | $ | $ | |||||||||||||||||||||||||||||||
| Deposits with banks | |||||||||||||||||||||||||||||||||||||||||
Accrued interest and accounts receivable | |||||||||||||||||||||||||||||||||||||||||
Federal funds sold and securities purchased under resale agreements | |||||||||||||||||||||||||||||||||||||||||
Securities borrowed | |||||||||||||||||||||||||||||||||||||||||
Investment securities, held-to-maturity | |||||||||||||||||||||||||||||||||||||||||
Loans, net of allowance for loan losses(a) | |||||||||||||||||||||||||||||||||||||||||
| Other | |||||||||||||||||||||||||||||||||||||||||
| Financial liabilities | |||||||||||||||||||||||||||||||||||||||||
| Deposits | $ | $ | $ | $ | $ | $ | $ | $ | $ | $ | |||||||||||||||||||||||||||||||
Federal funds purchased and securities loaned or sold under repurchase agreements | |||||||||||||||||||||||||||||||||||||||||
Short-term borrowings(b) | |||||||||||||||||||||||||||||||||||||||||
Accounts payable and other liabilities | |||||||||||||||||||||||||||||||||||||||||
Beneficial interests issued by consolidated VIEs | |||||||||||||||||||||||||||||||||||||||||
Long-term debt(b) | |||||||||||||||||||||||||||||||||||||||||
(a)Fair value is typically estimated using a discounted cash flow model that incorporates the characteristics of the underlying loans (including principal, contractual interest rate and contractual fees) and other key inputs, including expected lifetime credit losses, interest rates, prepayment rates, and primary origination or secondary market spreads. For certain loans, the fair value is measured based on the value of the underlying collateral. Carrying value of the loan takes into account the loan’s allowance for loan losses, which represents the loan’s expected credit losses over its remaining expected life. The difference between the estimated fair value and carrying value of a loan is generally attributable to changes in market interest rates, including credit spreads, market liquidity premiums and other factors that affect the fair value of a loan but do not affect its carrying value.
(b)Includes FHLB advances in level 2 of Long-term debt and Short-term borrowings and the Purchase Money Note in level 3 of Long-term debt associated with First Republic. Refer to Notes 20 and 34 for additional information.
JPMorgan Chase & Co./2023 Form 10-K | 195 | |||||||
Notes to consolidated financial statements
The majority of the Firm’s lending-related commitments are not carried at fair value on a recurring basis on the Consolidated balance sheets. The carrying value and the estimated fair value of these wholesale lending-related commitments were as follows for the periods indicated.
| December 31, 2023 | December 31, 2022 | ||||||||||||||||||||||||||||||||||
| Estimated fair value hierarchy | Estimated fair value hierarchy | ||||||||||||||||||||||||||||||||||
| (in billions) | Carrying value(a)(b)(c) | Level 1 | Level 2 | Level 3 | Total estimated fair value | Carrying value(a)(b) | Level 1 | Level 2 | Level 3 | Total estimated fair value | |||||||||||||||||||||||||
Wholesale lending-related commitments | $ | $ | $ | $ | $ | $ | $ | $ | $ | $ | |||||||||||||||||||||||||
(a)Excludes the current carrying values of the guarantee liability and the offsetting asset, each of which is recognized at fair value at the inception of the guarantees.
(b)Includes the wholesale allowance for lending-related commitments.
(c)As of December 31, 2023, includes fair value adjustments associated with First Republic for other unfunded commitments to extend credit totaling $1.1 billion recorded in accounts payable and other liabilities on the Consolidated balance sheets. Refer to Notes 28 and 34 for additional information.
196 | JPMorgan Chase & Co./2023 Form 10-K | |||||||
Note 3 – Fair value option
The fair value option provides an option to elect fair value for selected financial assets, financial liabilities, unrecognized firm commitments, and written loan commitments.
The Firm has elected to measure certain instruments at fair value for several reasons including to mitigate income statement volatility caused by the differences between the measurement basis of elected instruments (e.g., certain instruments that otherwise would be accounted for on an accrual basis) and the associated risk management arrangements that are accounted for on a fair value basis, as well as to better reflect those instruments that are managed on a fair value basis.
The Firm’s election of fair value includes the following instruments:
•Loans purchased or originated as part of securitization warehousing activity, subject to bifurcation accounting, or managed on a fair value basis, including lending-related commitments
•Certain securities financing agreements
•Owned beneficial interests in securitized financial assets that contain embedded credit derivatives, which would otherwise be required to be separately accounted for as a derivative instrument
•Structured notes and other hybrid instruments, which are predominantly financial instruments that contain embedded derivatives, that are issued or transacted as part of client-driven activities
JPMorgan Chase & Co./2023 Form 10-K | 197 | |||||||
Notes to consolidated financial statements
Changes in fair value under the fair value option election
The following table presents the changes in fair value included in the Consolidated statements of income for the years ended December 31, 2023, 2022 and 2021, for items for which the fair value option was elected. The profit and loss information presented below only includes the financial instruments that were elected to be measured at fair value; related risk management instruments, which are required to be measured at fair value, are not included in the table.
| 2023 | 2022 | 2021 | ||||||||||||||||||||||||||||||||||||||||||||||||
| December 31, (in millions) | Principal transactions | All other income | Total changes in fair value recorded(e) | Principal transactions | All other income | Total changes in fair value recorded(e) | Principal transactions | All other income | Total changes in fair value recorded(e) | |||||||||||||||||||||||||||||||||||||||||
Federal funds sold and securities purchased under resale agreements | $ | $ | $ | $ | ( | $ | $ | ( | $ | ( | $ | $ | ( | |||||||||||||||||||||||||||||||||||||
| Securities borrowed | ( | ( | ( | ( | ||||||||||||||||||||||||||||||||||||||||||||||
| Trading assets: | ||||||||||||||||||||||||||||||||||||||||||||||||||
Debt and equity instruments, excluding loans | ( | ( | ( | ( | (c) | ( | ||||||||||||||||||||||||||||||||||||||||||||
Loans reported as trading assets: | ||||||||||||||||||||||||||||||||||||||||||||||||||
| Changes in instrument-specific credit risk | ( | ( | ||||||||||||||||||||||||||||||||||||||||||||||||
| Other changes in fair value | (c) | ( | ( | ( | ( | |||||||||||||||||||||||||||||||||||||||||||||
| Loans: | ||||||||||||||||||||||||||||||||||||||||||||||||||
| Changes in instrument-specific credit risk | ( | (c) | ( | (c) | ( | ( | (c) | |||||||||||||||||||||||||||||||||||||||||||
| Other changes in fair value | (c) | ( | ( | (c) | ( | ( | (c) | |||||||||||||||||||||||||||||||||||||||||||
| Other assets | ( | (d) | ( | (d) | ( | (d) | ( | |||||||||||||||||||||||||||||||||||||||||||
Deposits(a) | ( | ( | ( | ( | ||||||||||||||||||||||||||||||||||||||||||||||
Federal funds purchased and securities loaned or sold under repurchase agreements | ( | ( | ||||||||||||||||||||||||||||||||||||||||||||||||
Short-term borrowings(a) | ( | ( | ( | ( | ||||||||||||||||||||||||||||||||||||||||||||||
| Trading liabilities | ( | ( | ||||||||||||||||||||||||||||||||||||||||||||||||
Beneficial interests issued by consolidated VIEs | ( | ( | ||||||||||||||||||||||||||||||||||||||||||||||||
Other liabilities | ( | ( | ( | ( | ( | ( | ||||||||||||||||||||||||||||||||||||||||||||
Long-term debt(a)(b) | ( | ( | (c)(d) | ( | (c)(d) | ( | (c)(d) | ( | ||||||||||||||||||||||||||||||||||||||||||
(a)Unrealized gains/(losses) due to instrument-specific credit risk (DVA) for liabilities for which the fair value option has been elected are recorded in OCI, while realized gains/(losses) are recorded in principal transactions revenue. Realized gains/(losses) due to instrument-specific credit risk recorded in principal transactions revenue were not material for the years ended December 31, 2023, 2022 and 2021.
(b)Long-term debt measured at fair value predominantly relates to structured notes. Although the risk associated with the structured notes is actively managed, the gains/(losses) reported in this table do not include the income statement impact of the risk management instruments used to manage such risk.
(c)Reported in mortgage fees and related income.
(d)Reported in other income.
(e)Changes in fair value exclude contractual interest, which is included in interest income and interest expense for all instruments other than certain hybrid financial instruments in CIB. Refer to Note 7 for further information regarding interest income and interest expense.
Determination of instrument-specific credit risk for items for which the fair value option was elected
The following describes how the gains and losses that are attributable to changes in instrument-specific credit risk, were determined.
•Loans and lending-related commitments: For floating-rate instruments, all changes in value are attributed to instrument-specific credit risk. For fixed-rate instruments, an allocation of the changes in value for the period is made between those changes in value that are interest rate-related and changes in value that are credit-related. Allocations are generally based on an analysis of borrower-specific credit spread and recovery
information, where available, or benchmarking to similar entities or industries.
•Long-term debt: Changes in value attributable to instrument-specific credit risk were derived principally from observable changes in the Firm’s credit spread as observed in the bond market.
•Securities financing agreements: Generally, for these types of agreements, there is a requirement that collateral be maintained with a market value equal to or in excess of the principal amount loaned; as a result, there would be no adjustment or an immaterial adjustment for instrument-specific credit risk related to these agreements.
198 | JPMorgan Chase & Co./2023 Form 10-K | |||||||
Difference between aggregate fair value and aggregate remaining contractual principal balance outstanding
The following table reflects the difference between the aggregate fair value and the aggregate remaining contractual principal balance outstanding as of December 31, 2023 and 2022, for loans, long-term debt and long-term beneficial interests for which the fair value option has been elected.
| 2023 | 2022 | ||||||||||||||||||||||||||||
| December 31, (in millions) | Contractual principal outstanding | Fair value | Fair value over/(under) contractual principal outstanding | Contractual principal outstanding | Fair value | Fair value over/(under) contractual principal outstanding | |||||||||||||||||||||||
| Loans | |||||||||||||||||||||||||||||
| Nonaccrual loans | |||||||||||||||||||||||||||||
| Loans reported as trading assets | $ | $ | $ | ( | $ | $ | $ | ( | |||||||||||||||||||||
| Loans | ( | ( | |||||||||||||||||||||||||||
| Subtotal | ( | ( | |||||||||||||||||||||||||||
| 90 or more days past due and government guaranteed | |||||||||||||||||||||||||||||
Loans(a) | ( | ( | |||||||||||||||||||||||||||
All other performing loans(b) | |||||||||||||||||||||||||||||
| Loans reported as trading assets | ( | ( | |||||||||||||||||||||||||||
| Loans | ( | ( | |||||||||||||||||||||||||||
| Subtotal | ( | ( | |||||||||||||||||||||||||||
| Total loans | $ | $ | $ | ( | $ | $ | $ | ( | |||||||||||||||||||||
| Long-term debt | |||||||||||||||||||||||||||||
| Principal-protected debt | $ | (d) | $ | $ | ( | $ | (d) | $ | $ | ( | |||||||||||||||||||
Nonprincipal-protected debt(c) | NA | NA | NA | NA | |||||||||||||||||||||||||
| Total long-term debt | NA | $ | NA | NA | $ | NA | |||||||||||||||||||||||
| Long-term beneficial interests | |||||||||||||||||||||||||||||
Nonprincipal-protected debt(c) | NA | $ | NA | NA | $ | NA | |||||||||||||||||||||||
| Total long-term beneficial interests | NA | $ | NA | NA | $ | NA | |||||||||||||||||||||||
(a)These balances are excluded from nonaccrual loans as the loans are insured and/or guaranteed by U.S. government agencies.
(b)There were no
(c)Remaining contractual principal is not applicable to nonprincipal-protected structured notes and long-term beneficial interests. Unlike principal-protected structured notes and long-term beneficial interests, for which the Firm is obligated to return a stated amount of principal at maturity, nonprincipal-protected structured notes and long-term beneficial interests do not obligate the Firm to return a stated amount of principal at maturity, but for structured notes to return an amount based on the performance of an underlying variable or derivative feature embedded in the note. However, investors are exposed to the credit risk of the Firm as issuer for both nonprincipal-protected and principal-protected notes.
(d)Where the Firm issues principal-protected zero-coupon or discount notes, the balance reflects the contractual principal payment at maturity or, if applicable, the contractual principal payment at the Firm’s next call date.
At December 31, 2023 and 2022, the contractual amount of lending-related commitments for which the fair value option was elected was $9.7 billion and $7.6 billion, respectively, with a corresponding fair value of $97 million and $24 million, respectively. Refer to Note 28 for further information regarding off-balance sheet lending-related financial instruments.
JPMorgan Chase & Co./2023 Form 10-K | 199 | |||||||
Notes to consolidated financial statements
Structured note products by balance sheet classification and risk component
The following table presents the fair value of structured notes, by balance sheet classification and the primary risk type.
| December 31, 2023 | December 31, 2022 | ||||||||||||||||||||||||||||||||||||||||||||||
| (in millions) | Long-term debt | Short-term borrowings | Deposits | Total | Long-term debt | Short-term borrowings | Deposits | Total | |||||||||||||||||||||||||||||||||||||||
| Risk exposure | |||||||||||||||||||||||||||||||||||||||||||||||
| Interest rate | $ | $ | $ | $ | $ | $ | $ | $ | |||||||||||||||||||||||||||||||||||||||
| Credit | |||||||||||||||||||||||||||||||||||||||||||||||
| Foreign exchange | |||||||||||||||||||||||||||||||||||||||||||||||
| Equity | |||||||||||||||||||||||||||||||||||||||||||||||
| Commodity | (a) | (a) | |||||||||||||||||||||||||||||||||||||||||||||
| Total structured notes | $ | $ | $ | $ | $ | $ | $ | $ | |||||||||||||||||||||||||||||||||||||||
(a)Excludes deposits linked to precious metals for which the fair value option has not been elected of $627 million and $602 million for the years ended December 31, 2023 and 2022, respectively.
200 | JPMorgan Chase & Co./2023 Form 10-K | |||||||
Note 4 – Credit risk concentrations
Concentrations of credit risk arise when a number of clients, counterparties or customers are engaged in similar business activities or activities in the same geographic region, or when they have similar economic features that would cause their ability to meet contractual obligations to be similarly affected by changes in economic conditions.
JPMorgan Chase regularly monitors various segments of its credit portfolios to assess potential credit risk concentrations and to obtain additional collateral when deemed necessary and permitted under the Firm’s agreements. Senior management is significantly involved in the credit approval and review process, and risk levels are adjusted as needed to reflect the Firm’s risk appetite.
In the Firm’s consumer portfolio, concentrations are managed primarily by product and by U.S. geographic region, with a key focus on trends and concentrations at the portfolio level, where potential credit risk concentrations can be remedied through changes in underwriting policies and portfolio guidelines. Refer to Note 12 for additional information on the geographic composition of the Firm’s consumer loan portfolios. In the wholesale portfolio, credit risk concentrations are evaluated primarily by industry and monitored regularly on both an aggregate portfolio level and on an individual client or counterparty basis.
The Firm’s wholesale exposure is managed through loan syndications and participations, loan sales, securitizations, credit derivatives, master netting agreements, collateral and other risk-reduction techniques. Refer to Note 12 for additional information on loans.
The Firm does not believe that its exposure to any particular loan product or industry segment results in a significant concentration of credit risk.
Terms of loan products and collateral coverage are included in the Firm’s assessment when extending credit and establishing its allowance for credit losses. Refer to Note 13 for additional information on the allowance for credit losses.
JPMorgan Chase & Co./2023 Form 10-K | 201 | |||||||
Notes to consolidated financial statements
The table below presents both on–balance sheet and off–balance sheet consumer and wholesale credit exposure by the Firm’s three credit portfolio segments as of December 31, 2023 and 2022. The wholesale industry of risk category is generally based on the client or counterparty’s primary business activity.
| 2023 | 2022 | |||||||||||||||||||||||||||||||||||||
Credit exposure(h)(i) | On-balance sheet | Off-balance sheet(k) | Credit exposure(h) | On-balance sheet | Off-balance sheet(k) | |||||||||||||||||||||||||||||||||
| December 31, (in millions) | Loans | Derivatives | Loans | Derivatives | ||||||||||||||||||||||||||||||||||
| Consumer, excluding credit card | $ | $ | $ | — | $ | $ | $ | (j) | $ | — | $ | |||||||||||||||||||||||||||
Credit card(a) | — | — | ||||||||||||||||||||||||||||||||||||
Total consumer(a) | — | — | ||||||||||||||||||||||||||||||||||||
Wholesale(b) | ||||||||||||||||||||||||||||||||||||||
| Real Estate | ||||||||||||||||||||||||||||||||||||||
Individuals and Individual Entities(c) | ||||||||||||||||||||||||||||||||||||||
Asset Managers | ||||||||||||||||||||||||||||||||||||||
| Consumer & Retail | ||||||||||||||||||||||||||||||||||||||
| Technology, Media & Telecommunications | ||||||||||||||||||||||||||||||||||||||
| Industrials | ||||||||||||||||||||||||||||||||||||||
| Healthcare | ||||||||||||||||||||||||||||||||||||||
| Banks & Finance Companies | ||||||||||||||||||||||||||||||||||||||
| Utilities | ||||||||||||||||||||||||||||||||||||||
State & Municipal Govt(d) | ||||||||||||||||||||||||||||||||||||||
Oil & Gas | ||||||||||||||||||||||||||||||||||||||
| Automotive | ||||||||||||||||||||||||||||||||||||||
| Chemicals & Plastics | ||||||||||||||||||||||||||||||||||||||
| Insurance | ||||||||||||||||||||||||||||||||||||||
| Central Govt | ||||||||||||||||||||||||||||||||||||||
| Transportation | ||||||||||||||||||||||||||||||||||||||
| Metals & Mining | ||||||||||||||||||||||||||||||||||||||
| Securities Firms | ||||||||||||||||||||||||||||||||||||||
| Financial Markets Infrastructure | ||||||||||||||||||||||||||||||||||||||
All other(e) | ||||||||||||||||||||||||||||||||||||||
| Subtotal | ||||||||||||||||||||||||||||||||||||||
Loans held-for-sale and loans at fair value | — | — | — | — | ||||||||||||||||||||||||||||||||||
Receivables from customers(f) | — | — | — | — | — | — | ||||||||||||||||||||||||||||||||
| Total wholesale | ||||||||||||||||||||||||||||||||||||||
Total exposure(g)(h) | $ | $ | $ | $ | $ | $ | $ | $ | ||||||||||||||||||||||||||||||
(a)Also includes commercial card lending-related commitments primarily in CB and CIB.
(b)The industry rankings presented in the table as of December 31, 2022, are based on the industry rankings of the corresponding exposures at December 31, 2023, not actual rankings of such exposures at December 31, 2022.
(c)Individuals and Individual Entities predominantly consists of Global Private Bank clients within AWM and J.P. Morgan Wealth Management within CCB, and includes exposure to personal investment companies and personal and testamentary trusts.
(d)In addition to the credit risk exposure to states and municipal governments (both U.S. and non-U.S.) at December 31, 2023 and 2022, noted above, the Firm held: $5.9 billion and $6.6 billion, respectively, of trading assets; $21.4 billion and $6.8 billion, respectively, of AFS securities; and $9.9 billion and $19.7 billion, respectively, of HTM securities, issued by U.S. state and municipal governments. Refer to Note 2 and Note 10 for further information.
(e)All other includes: SPEs and Private education and civic organizations, representing approximately 94 % and 6 %, respectively, at December 31, 2023 and 95 % and 5 %, respectively, at December 31, 2022. Refer to Note 14 for more information on exposures to SPEs.
(f)Receivables from customers reflect held-for-investment margin loans to brokerage clients in CIB, CCB and AWM that are collateralized by assets maintained in the clients’ brokerage accounts (including cash on deposit, and primarily liquid and readily marketable debt or equity securities).
(g)Excludes cash placed with banks of $614.1 billion and $556.6 billion, at December 31, 2023 and 2022, respectively, which is predominantly placed with various central banks, primarily Federal Reserve Banks.
(h)Credit exposure is net of risk participations and excludes the benefit of credit derivatives used in credit portfolio management activities held against derivative receivables or loans and liquid securities and other cash collateral held against derivative receivables.
(i)Included credit exposure associated with First Republic consisting of $102.2 billion in the Consumer, excluding credit card portfolio, and $90.6 billion in the Wholesale portfolio predominantly in Real Estate, Asset Managers, and Individuals and Individual Entities.
(j)At December 31, 2023 and 2022, included $94 million and $350 million of loans in Business Banking under the PPP, respectively. PPP loans are guaranteed by the SBA. Other than in certain limited circumstances, the Firm typically does not recognize charge-offs, classify as nonaccrual nor record an allowance for loan losses on these loans.
(k)Represents lending-related financial instruments.
202 | JPMorgan Chase & Co./2023 Form 10-K | |||||||
Note 5 – Derivative instruments
Derivative contracts derive their value from underlying asset prices, indices, reference rates, other inputs or a combination of these factors and may expose counterparties to risks and rewards of an underlying asset or liability without having to initially invest in, own or exchange the asset or liability. JPMorgan Chase makes markets in derivatives for clients and also uses derivatives to hedge or manage its own risk exposures. Predominantly all of the Firm’s derivatives are entered into for market-making or risk management purposes.
Market-making derivatives
The majority of the Firm’s derivatives are entered into for market-making purposes. Clients use derivatives to mitigate or modify interest rate, credit, foreign exchange, equity and commodity risks. The Firm actively manages the risks from its exposure to these derivatives by entering into other derivative contracts or by purchasing or selling other financial instruments that partially or fully offset the exposure from client derivatives.
Risk management derivatives
The Firm manages certain market and credit risk exposures using derivative instruments, including derivatives in hedge accounting relationships and other derivatives that are used to manage risks associated with specified assets and liabilities.
The Firm generally uses interest rate derivatives to manage the risk associated with changes in interest rates. Fixed-rate assets and liabilities appreciate or depreciate in market value as interest rates change. Similarly, interest income and expense increase or decrease as a result of variable-rate assets and liabilities resetting to current market rates, and as a result of the repayment and subsequent origination or issuance of fixed-rate assets and liabilities at current market rates. Gains and losses on the derivative instruments related to these assets and liabilities are expected to substantially offset this variability.
Foreign currency derivatives are used to manage the foreign exchange risk associated with certain foreign currency–denominated (i.e., non-U.S. dollar) assets and liabilities and forecasted transactions, as well as the Firm’s net investments in certain non-U.S. subsidiaries or branches whose functional currencies are not the U.S. dollar. As a result of fluctuations in foreign currencies, the U.S. dollar–equivalent values of the foreign currency–denominated assets and liabilities or the forecasted revenues or expenses increase or decrease. Gains or losses on the derivative instruments related to these foreign currency–denominated assets or liabilities, or forecasted transactions, are expected to substantially offset this variability.
Commodities derivatives are used to manage the price risk of certain commodities inventories. Gains or losses on these derivative instruments are expected to substantially offset the depreciation or appreciation of the related inventory.
Credit derivatives are used to manage the counterparty credit risk associated with loans and lending-related commitments. Credit derivatives compensate the purchaser when the entity referenced in the contract experiences a credit event, such as bankruptcy or a failure to pay an obligation when due. Credit derivatives primarily consist of CDS. Refer to the Credit derivatives section on pages 214–216 of this Note for a further discussion of credit derivatives.
Refer to the risk management derivatives gains and losses table on page 214 and the hedge accounting gains and losses tables on pages 211–213 of this Note for more information about risk management derivatives.
Derivative counterparties and settlement types
The Firm enters into OTC derivatives, which are negotiated and settled bilaterally with the derivative counterparty. The Firm also enters into, as principal, certain ETD such as futures and options, and OTC-cleared derivative contracts with CCPs. ETD contracts are generally standardized contracts traded on an exchange and cleared by the CCP, which is the Firm’s counterparty from the inception of the transactions. OTC-cleared derivatives are traded on a bilateral basis and then novated to the CCP for clearing.
Derivative clearing services
The Firm provides clearing services for clients in which the Firm acts as a clearing member at certain exchanges and clearing houses. The Firm does not reflect the clients’ derivative contracts in its Consolidated Financial Statements. Refer to Note 28 for further information on the Firm’s clearing services.
Accounting for derivatives
All free-standing derivatives that the Firm executes for its own account are required to be recorded on the Consolidated balance sheets at fair value.
As permitted under U.S. GAAP, the Firm nets derivative assets and liabilities, and the related cash collateral receivables and payables, when a legally enforceable master netting agreement exists between the Firm and the derivative counterparty. Refer to Note 1 for further discussion of the offsetting of assets and liabilities. The accounting for changes in value of a derivative depends on whether or not the transaction has been designated and qualifies for hedge accounting. Derivatives that are not designated as hedges are reported and measured at fair value through earnings. The tabular disclosures on pages 207–214 of this Note provide additional information on the amount of, and reporting for, derivative assets, liabilities, gains and losses. Refer to Notes 2 and 3 for a further discussion of derivatives embedded in structured notes.
JPMorgan Chase & Co./2023 Form 10-K | 203 | |||||||
Notes to consolidated financial statements
Derivatives designated as hedges
The Firm applies hedge accounting to certain derivatives executed for risk management purposes – generally interest rate, foreign exchange and commodity derivatives. However, JPMorgan Chase does not seek to apply hedge accounting to all of the derivatives associated with the Firm’s risk management activities. For example, the Firm does not apply hedge accounting to purchased CDS used to manage the credit risk of loans and lending-related commitments, because of the difficulties in qualifying such contracts as hedges. For the same reason, the Firm does not apply hedge accounting to certain interest rate, foreign exchange, and commodity derivatives used for risk management purposes.
To qualify for hedge accounting, a derivative must be highly effective at reducing the risk associated with the exposure being hedged. In addition, for a derivative to be designated as a hedge, the risk management objective and strategy must be documented. Hedge documentation must identify the derivative hedging instrument, the asset or liability or forecasted transaction and type of risk to be hedged, and how the effectiveness of the derivative is assessed prospectively and retrospectively. To assess effectiveness, the Firm uses statistical methods such as regression analysis, nonstatistical methods such as dollar-value comparisons of the change in the fair value of the derivative to the change in the fair value or cash flows of the hedged item, and qualitative comparisons of critical terms and the evaluation of any changes in those terms. The extent to which a derivative has been, and is expected to continue to be, highly effective at offsetting changes in the fair value or cash flows of the hedged item must be assessed and documented at least quarterly. If it is determined that a derivative is not highly effective at hedging the designated exposure, hedge accounting is discontinued.
There are three types of hedge accounting designations: fair value hedges, cash flow hedges and net investment hedges. JPMorgan Chase uses fair value hedges primarily to hedge fixed-rate long-term debt, AFS securities and certain commodities inventories. For qualifying fair value hedges, the changes in the fair value of the derivative, and in the value of the hedged item for the risk being hedged, are recognized in earnings. Certain amounts excluded from the assessment of effectiveness are recorded in OCI and recognized in earnings over the life of the derivative. If the hedge relationship is terminated, then the adjustment to the hedged item continues to be reported as part of the basis of the hedged item and, for interest-bearing financial instruments, is amortized to earnings as a yield adjustment. Derivative amounts affecting earnings are recognized consistent with the classification of the hedged item – primarily net interest income and principal transactions revenue.
Effective January 1, 2023, the Firm adopted the new portfolio layer method hedge accounting guidance which expanded the ability to hedge a portfolio of fixed-rate assets to allow more types of assets to be included in the portfolio, and to allow more of the portfolio to be hedged.
The Firm employs the Portfolio Layer Method to manage the interest rate risk of portfolios of fixed-rate assets. Throughout the life of the open hedge, basis adjustments are maintained at the portfolio level and are only allocated to individual assets under certain circumstances. These include instances where the portfolio amount falls below the hedged layer amounts, or in cases of voluntary de-designation.
JPMorgan Chase uses cash flow hedges primarily to hedge the exposure to variability in forecasted cash flows from floating-rate assets and liabilities and foreign currency–denominated revenue and expense. For qualifying cash flow hedges, changes in the fair value of the derivative are recorded in OCI and recognized in earnings as the hedged item affects earnings. Derivative amounts affecting earnings are recognized consistent with the classification of the hedged item – primarily noninterest revenue, net interest income and compensation expense. If the hedge relationship is terminated, then the change in value of the derivative recorded in AOCI is recognized in earnings when the cash flows that were hedged affect earnings. For hedge relationships that are discontinued because a forecasted transaction is expected to not occur according to the original hedge forecast, any related derivative values recorded in AOCI are immediately recognized in earnings.
204 | JPMorgan Chase & Co./2023 Form 10-K | |||||||
The following table outlines the Firm’s primary uses of derivatives and the related hedge accounting designation or disclosure category.
| Type of Derivative | Use of Derivative | Designation and disclosure | Affected segment or unit | Page reference | ||||||||||
| Manage specifically identified risk exposures in qualifying hedge accounting relationships: | ||||||||||||||
•Interest rate | Hedge fixed rate assets and liabilities | Fair value hedge | Corporate | 211-212 | ||||||||||
•Interest rate | Hedge floating-rate assets and liabilities | Cash flow hedge | Corporate | 213 | ||||||||||
•Foreign exchange | Hedge foreign currency-denominated assets and liabilities | Fair value hedge | Corporate | 211-212 | ||||||||||
•Foreign exchange | Hedge foreign currency-denominated forecasted revenue and expense | Cash flow hedge | Corporate | 213 | ||||||||||
•Foreign exchange | Hedge the value of the Firm’s investments in non-U.S. dollar functional currency entities | Net investment hedge | Corporate | 213 | ||||||||||
•Commodity | Hedge commodity inventory | Fair value hedge | CIB, AWM | 211-212 | ||||||||||
Manage specifically identified risk exposures not designated in qualifying hedge accounting relationships: | ||||||||||||||
•Interest rate | Manage the risk associated with mortgage commitments, warehouse loans and MSRs | Specified risk management | CCB | 214 | ||||||||||
•Credit | Manage the credit risk associated with wholesale lending exposures | Specified risk management | CIB, AWM | 214 | ||||||||||
•Interest rate and foreign exchange | Manage the risk associated with certain other specified assets and liabilities | Specified risk management | Corporate, CIB | 214 | ||||||||||
Market-making derivatives and other activities: | ||||||||||||||
•Various | Market-making and related risk management | Market-making and other | CIB | 214 | ||||||||||
•Various | Other derivatives | Market-making and other | CIB, AWM, Corporate | 214 | ||||||||||
JPMorgan Chase & Co./2023 Form 10-K | 205 | |||||||
Notes to consolidated financial statements
Notional amount of derivative contracts
The following table summarizes the notional amount of free-standing derivative contracts outstanding as of December 31, 2023 and 2022.
Notional amounts(b) | |||||||||||
| December 31, (in billions) | 2023 | 2022 | |||||||||
| Interest rate contracts | |||||||||||
Swaps | $ | $ | |||||||||
Futures and forwards | |||||||||||
Written options | |||||||||||
Purchased options | |||||||||||
Total interest rate contracts | |||||||||||
Credit derivatives(a) | |||||||||||
Foreign exchange contracts | |||||||||||
Cross-currency swaps | |||||||||||
Spot, futures and forwards | |||||||||||
Written options | |||||||||||
Purchased options | |||||||||||
Total foreign exchange contracts | |||||||||||
| Equity contracts | |||||||||||
Swaps | |||||||||||
Futures and forwards | |||||||||||
Written options | |||||||||||
Purchased options | |||||||||||
| Total equity contracts | |||||||||||
| Commodity contracts | |||||||||||
Swaps | |||||||||||
Spot, futures and forwards | |||||||||||
Written options | |||||||||||
Purchased options | |||||||||||
Total commodity contracts | |||||||||||
Total derivative notional amounts | $ | $ | |||||||||
(a)Refer to the Credit derivatives discussion on pages 214–216 for more information on volumes and types of credit derivative contracts.
(b)Represents the sum of gross long and gross short third-party notional derivative contracts.
206 | JPMorgan Chase & Co./2023 Form 10-K | |||||||
Impact of derivatives on the Consolidated balance sheets
The following table summarizes information on derivative receivables and payables (before and after netting adjustments) that are reflected on the Firm’s Consolidated balance sheets as of December 31, 2023 and 2022, by accounting designation (e.g., whether the derivatives were designated in qualifying hedge accounting relationships or not) and contract type.
Free-standing derivative receivables and payables(a) | |||||||||||||||||||||||||||||||||||||||||||||||
| Gross derivative receivables | Gross derivative payables | ||||||||||||||||||||||||||||||||||||||||||||||
| December 31, 2023 (in millions) | Not designated as hedges | Designated as hedges | Total derivative receivables | Net derivative receivables(b) | Not designated as hedges | Designated as hedges | Total derivative payables | Net derivative payables(b) | |||||||||||||||||||||||||||||||||||||||
| Trading assets and liabilities | |||||||||||||||||||||||||||||||||||||||||||||||
| Interest rate | $ | $ | $ | $ | $ | $ | $ | $ | |||||||||||||||||||||||||||||||||||||||
| Credit | |||||||||||||||||||||||||||||||||||||||||||||||
| Foreign exchange | |||||||||||||||||||||||||||||||||||||||||||||||
| Equity | |||||||||||||||||||||||||||||||||||||||||||||||
| Commodity | |||||||||||||||||||||||||||||||||||||||||||||||
Total fair value of trading assets and liabilities | $ | $ | $ | $ | $ | $ | $ | $ | |||||||||||||||||||||||||||||||||||||||
| Gross derivative receivables | Gross derivative payables | ||||||||||||||||||||||||||||||||||||||||||||||
| December 31, 2022 (in millions) | Not designated as hedges | Designated as hedges | Total derivative receivables | Net derivative receivables(b) | Not designated as hedges | Designated as hedges | Total derivative payables | Net derivative payables(b) | |||||||||||||||||||||||||||||||||||||||
| Trading assets and liabilities | |||||||||||||||||||||||||||||||||||||||||||||||
| Interest rate | $ | $ | $ | $ | $ | $ | $ | $ | |||||||||||||||||||||||||||||||||||||||
| Credit | |||||||||||||||||||||||||||||||||||||||||||||||
| Foreign exchange | |||||||||||||||||||||||||||||||||||||||||||||||
| Equity | |||||||||||||||||||||||||||||||||||||||||||||||
| Commodity | |||||||||||||||||||||||||||||||||||||||||||||||
Total fair value of trading assets and liabilities | $ | $ | $ | $ | $ | $ | $ | $ | |||||||||||||||||||||||||||||||||||||||
(a)Balances exclude structured notes for which the fair value option has been elected. Refer to Note 3 for further information.
(b)As permitted under U.S. GAAP, the Firm has elected to net derivative receivables and derivative payables and the related cash collateral receivables and payables when a legally enforceable master netting agreement exists.
JPMorgan Chase & Co./2023 Form 10-K | 207 | |||||||
Notes to consolidated financial statements
Derivatives netting
The following tables present, as of December 31, 2023 and 2022, gross and net derivative receivables and payables by contract and settlement type. Derivative receivables and payables, as well as the related cash collateral from the same counterparty, have been netted on the Consolidated balance sheets where the Firm has obtained an appropriate legal opinion with respect to the master netting agreement. Where such a legal opinion has not been either sought or obtained, amounts are not eligible for netting on the Consolidated balance sheets, and those derivative receivables and payables are shown separately in the tables below.
In addition to the cash collateral received and transferred that is presented on a net basis with derivative receivables and payables, the Firm receives and transfers additional collateral (financial instruments and cash). These amounts mitigate counterparty credit risk associated with the Firm’s derivative instruments, but are not eligible for net presentation:
•collateral that consists of liquid securities and other cash collateral held at third-party custodians, which are shown separately as "Collateral not nettable on the Consolidated balance sheets" in the tables below, up to the fair value exposure amount. For the purpose of this disclosure, the definition of liquid securities is consistent with the definition of high quality liquid assets as defined in the LCR rule;
•the amount of collateral held or transferred that exceeds the fair value exposure at the individual counterparty level, as of the date presented, which is excluded from the tables below; and
•collateral held or transferred that relates to derivative receivables or payables where an appropriate legal opinion has not been either sought or obtained with respect to the master netting agreement, which is excluded from the tables below.
| 2023 | 2022 | ||||||||||||||||||||||||||||||||||
| December 31, (in millions) | Gross derivative receivables | Amounts netted on the Consolidated balance sheets | Net derivative receivables | Gross derivative receivables | Amounts netted on the Consolidated balance sheets | Net derivative receivables | |||||||||||||||||||||||||||||
U.S. GAAP nettable derivative receivables | |||||||||||||||||||||||||||||||||||
| Interest rate contracts: | |||||||||||||||||||||||||||||||||||
| OTC | $ | $ | ( | $ | $ | $ | ( | $ | |||||||||||||||||||||||||||
| OTC–cleared | ( | ( | |||||||||||||||||||||||||||||||||
Exchange-traded(a) | ( | ( | |||||||||||||||||||||||||||||||||
| Total interest rate contracts | ( | ( | |||||||||||||||||||||||||||||||||
| Credit contracts: | |||||||||||||||||||||||||||||||||||
| OTC | ( | ( | |||||||||||||||||||||||||||||||||
| OTC–cleared | ( | ( | |||||||||||||||||||||||||||||||||
| Total credit contracts | ( | ( | |||||||||||||||||||||||||||||||||
| Foreign exchange contracts: | |||||||||||||||||||||||||||||||||||
| OTC | ( | ( | |||||||||||||||||||||||||||||||||
| OTC–cleared | ( | ( | |||||||||||||||||||||||||||||||||
Exchange-traded(a) | ( | ( | |||||||||||||||||||||||||||||||||
| Total foreign exchange contracts | ( | ( | |||||||||||||||||||||||||||||||||
| Equity contracts: | |||||||||||||||||||||||||||||||||||
| OTC | ( | ( | |||||||||||||||||||||||||||||||||
Exchange-traded(a) | ( | ( | |||||||||||||||||||||||||||||||||
| Total equity contracts | ( | ( | |||||||||||||||||||||||||||||||||
| Commodity contracts: | |||||||||||||||||||||||||||||||||||
| OTC | ( | ( | |||||||||||||||||||||||||||||||||
| OTC–cleared | ( | ( | |||||||||||||||||||||||||||||||||
Exchange-traded(a) | ( | ( | |||||||||||||||||||||||||||||||||
| Total commodity contracts | ( | ( | |||||||||||||||||||||||||||||||||
Derivative receivables with appropriate legal opinion | ( | (d) | ( | (d) | |||||||||||||||||||||||||||||||
Derivative receivables where an appropriate legal opinion has not been either sought or obtained | |||||||||||||||||||||||||||||||||||
Total derivative receivables recognized on the Consolidated balance sheets | $ | $ | $ | $ | |||||||||||||||||||||||||||||||
Collateral not nettable on the Consolidated balance sheets(b)(c) | ( | ( | |||||||||||||||||||||||||||||||||
Net amounts | $ | $ | |||||||||||||||||||||||||||||||||
208 | JPMorgan Chase & Co./2023 Form 10-K | |||||||
| 2023 | 2022 | ||||||||||||||||||||||||||||||||||
| December 31, (in millions) | Gross derivative payables | Amounts netted on the Consolidated balance sheets | Net derivative payables | Gross derivative payables | Amounts netted on the Consolidated balance sheets | Net derivative payables | |||||||||||||||||||||||||||||
U.S. GAAP nettable derivative payables | |||||||||||||||||||||||||||||||||||
| Interest rate contracts: | |||||||||||||||||||||||||||||||||||
| OTC | $ | $ | ( | $ | $ | $ | ( | $ | |||||||||||||||||||||||||||
| OTC–cleared | ( | ( | |||||||||||||||||||||||||||||||||
Exchange-traded(a) | ( | ( | |||||||||||||||||||||||||||||||||
| Total interest rate contracts | ( | ( | |||||||||||||||||||||||||||||||||
| Credit contracts: | |||||||||||||||||||||||||||||||||||
| OTC | ( | ( | |||||||||||||||||||||||||||||||||
| OTC–cleared | ( | ( | |||||||||||||||||||||||||||||||||
| Total credit contracts | ( | ( | |||||||||||||||||||||||||||||||||
| Foreign exchange contracts: | |||||||||||||||||||||||||||||||||||
| OTC | ( | ( | |||||||||||||||||||||||||||||||||
| OTC–cleared | ( | ( | |||||||||||||||||||||||||||||||||
Exchange-traded(a) | |||||||||||||||||||||||||||||||||||
| Total foreign exchange contracts | ( | ( | |||||||||||||||||||||||||||||||||
| Equity contracts: | |||||||||||||||||||||||||||||||||||
| OTC | ( | ( | |||||||||||||||||||||||||||||||||
Exchange-traded(a) | ( | ( | |||||||||||||||||||||||||||||||||
| Total equity contracts | ( | ( | |||||||||||||||||||||||||||||||||
| Commodity contracts: | |||||||||||||||||||||||||||||||||||
| OTC | ( | ( | |||||||||||||||||||||||||||||||||
| OTC–cleared | ( | ( | |||||||||||||||||||||||||||||||||
Exchange-traded(a) | ( | ( | |||||||||||||||||||||||||||||||||
| Total commodity contracts | ( | ( | |||||||||||||||||||||||||||||||||
Derivative payables with appropriate legal opinion | ( | (d) | ( | (d) | |||||||||||||||||||||||||||||||
Derivative payables where an appropriate legal opinion has not been either sought or obtained | |||||||||||||||||||||||||||||||||||
| $ | $ | $ | $ | ||||||||||||||||||||||||||||||||
Collateral not nettable on the Consolidated balance sheets(b)(c) | ( | ( | |||||||||||||||||||||||||||||||||
Net amounts | $ | $ | |||||||||||||||||||||||||||||||||
(a)Exchange-traded derivative balances that relate to futures contracts are settled daily.
(b)Includes liquid securities and other cash collateral held at third-party custodians related to derivative instruments where an appropriate legal opinion has been obtained. For some counterparties, the collateral amounts of financial instruments may exceed the derivative receivables and derivative payables balances. Where this is the case, the total amount reported is limited to the net derivative receivables and net derivative payables balances with that counterparty.
(c)Derivative collateral relates only to OTC and OTC-cleared derivative instruments.
(d)Net derivatives receivable included cash collateral netted of $48.3 billion and $51.5 billion at December 31, 2023 and 2022, respectively. Net derivatives payable included cash collateral netted of $70.0 billion and $69.2 billion at December 31, 2023 and 2022, respectively. Derivative cash collateral relates to OTC and OTC-cleared derivative instruments.
JPMorgan Chase & Co./2023 Form 10-K | 209 | |||||||
Notes to consolidated financial statements
Liquidity risk and credit-related contingent features
In addition to the specific market risks introduced by each derivative contract type, derivatives expose JPMorgan Chase to credit risk — the risk that derivative counterparties may fail to meet their payment obligations under the derivative contracts and the collateral, if any, held by the Firm proves to be of insufficient value to cover the payment obligation. It is the policy of JPMorgan Chase to actively pursue, where possible, the use of legally enforceable master netting arrangements and collateral agreements to mitigate derivative counterparty credit risk inherent in derivative receivables.
While derivative receivables expose the Firm to credit risk, derivative payables expose the Firm to liquidity risk, as the derivative contracts typically require the Firm to post cash or securities collateral with counterparties as the fair value of the contracts moves in the counterparties’ favor or upon specified downgrades in the Firm’s and its subsidiaries’ respective credit ratings. Certain derivative contracts also provide for termination of the contract, generally upon a downgrade of either the Firm or the counterparty, at the fair value of the derivative contracts. The following table shows the aggregate fair value of net derivative payables related to OTC and OTC-cleared derivatives that contain contingent collateral or termination features that may be triggered upon a ratings downgrade, and the associated collateral the Firm has posted in the normal course of business, at December 31, 2023 and 2022.
| OTC and OTC-cleared derivative payables containing downgrade triggers | |||||||||||||||||||||||
| (in millions) | December 31, 2023 | December 31, 2022 | |||||||||||||||||||||
| Aggregate fair value of net derivative payables | $ | $ | |||||||||||||||||||||
| Collateral posted | |||||||||||||||||||||||
The following table shows the impact of a single-notch and two-notch downgrade of the long-term issuer ratings of JPMorgan Chase & Co. and its subsidiaries, predominantly JPMorgan Chase Bank, N.A., at December 31, 2023 and 2022, related to OTC and OTC-cleared derivative contracts with contingent collateral or termination features that may be triggered upon a ratings downgrade. Derivatives contracts generally require additional collateral to be posted or terminations to be triggered when the predefined rating threshold is breached. A downgrade by a single rating agency that does not result in a rating lower than a preexisting corresponding rating provided by another major rating agency will generally not result in additional collateral (except in certain instances in which additional initial margin may be required upon a ratings downgrade), nor in termination payment requirements. The liquidity impact in the table is calculated based upon a downgrade below the lowest current rating of the rating agencies referred to in the derivative contract.
| Liquidity impact of downgrade triggers on OTC and OTC-cleared derivatives | |||||||||||||||||
| December 31, 2023 | December 31, 2022 | ||||||||||||||||
| (in millions) | Single-notch downgrade | Two-notch downgrade | Single-notch downgrade | Two-notch downgrade | |||||||||||||
Amount of additional collateral to be posted upon downgrade(a) | $ | $ | $ | $ | |||||||||||||
Amount required to settle contracts with termination triggers upon downgrade(b) | |||||||||||||||||
(a)Includes the additional collateral to be posted for initial margin.
(b)Amounts represent fair values of derivative payables, and do not reflect collateral posted.
Derivatives executed in contemplation of a sale of the underlying financial asset
In certain instances the Firm enters into transactions in which it transfers financial assets but maintains the economic exposure to the transferred assets by entering into a derivative with the same counterparty in contemplation of the initial transfer. The Firm generally accounts for such transfers as collateralized financing transactions as described in Note 11, but in limited circumstances they may qualify to be accounted for as a sale and a derivative under U.S. GAAP. The amount of such transfers accounted for as a sale where the associated derivative was outstanding was not material at both December 31, 2023 and 2022.
210 | JPMorgan Chase & Co./2023 Form 10-K | |||||||
Impact of derivatives on the Consolidated statements of income
The following tables provide information related to gains and losses recorded on derivatives based on their hedge accounting
designation or purpose.
Fair value hedge gains and losses
The following tables present derivative instruments, by contract type, used in fair value hedge accounting relationships, as well as pre-tax gains/(losses) recorded on such derivatives and the related hedged items for the years ended December 31, 2023, 2022 and 2021, respectively. The Firm includes gains/(losses) on the hedging derivative in the same line item in the Consolidated statements of income as the related hedged item.
| Gains/(losses) recorded in income | Income statement impact of excluded components(e) | OCI impact | ||||||||||||||||||||||||
| Year ended December 31, 2023 (in millions) | Derivatives | Hedged items | Income statement impact | Amortization approach | Changes in fair value | Derivatives - Gains/(losses) recorded in OCI(f) | ||||||||||||||||||||
| Contract type | ||||||||||||||||||||||||||
Interest rate(a)(b) | $ | $ | ( | $ | $ | $ | $ | |||||||||||||||||||
Foreign exchange(c) | ( | ( | ( | |||||||||||||||||||||||
Commodity(d) | ( | |||||||||||||||||||||||||
| Total | $ | $ | ( | $ | $ | ( | $ | $ | ( | |||||||||||||||||
| Gains/(losses) recorded in income | Income statement impact of excluded components(e) | OCI impact | ||||||||||||||||||||||||
| Year ended December 31, 2022 (in millions) | Derivatives | Hedged items | Income statement impact | Amortization approach | Changes in fair value | Derivatives - Gains/(losses) recorded in OCI(f) | ||||||||||||||||||||
| Contract type | ||||||||||||||||||||||||||
Interest rate(a)(b) | $ | ( | $ | $ | ( | $ | $ | ( | $ | |||||||||||||||||
Foreign exchange(c) | ( | ( | ||||||||||||||||||||||||
Commodity(d) | ( | |||||||||||||||||||||||||
| Total | $ | ( | $ | $ | ( | $ | ( | $ | ( | $ | ||||||||||||||||
| Gains/(losses) recorded in income | Income statement impact of excluded components(e) | OCI impact | ||||||||||||||||||||||||
| Year ended December 31, 2021 (in millions) | Derivatives | Hedged items | Income statement impact | Amortization approach | Changes in fair value | Derivatives - Gains/(losses) recorded in OCI(f) | ||||||||||||||||||||
| Contract type | ||||||||||||||||||||||||||
Interest rate(a)(b) | $ | ( | $ | $ | ( | $ | $ | ( | $ | |||||||||||||||||
Foreign exchange(c) | ( | ( | ( | |||||||||||||||||||||||
Commodity(d) | ( | |||||||||||||||||||||||||
| Total | $ | ( | $ | $ | ( | $ | ( | $ | ( | $ | ( | |||||||||||||||
(a)Primarily consists of hedges of the benchmark (e.g., Secured Overnight Financing Rate (“SOFR”)) interest rate risk of fixed-rate long-term debt and AFS securities. Gains and losses were recorded in net interest income.
(b)Includes the amortization of income/expense associated with the inception hedge accounting adjustment applied to the hedged item. Excludes the accrual of interest on interest rate swaps and the related hedged items.
(c)Primarily consists of hedges of the foreign currency risk of long-term debt and AFS securities for changes in spot foreign currency rates. Gains and losses related to the derivatives and the hedged items due to changes in foreign currency rates and the income statement impact of excluded components were recorded primarily in principal transactions revenue and net interest income.
(d)Consists of overall fair value hedges of physical commodities inventories that are generally carried at the lower of cost or net realizable value (net realizable value approximates fair value). Gains and losses were recorded in principal transactions revenue.
(e)The assessment of hedge effectiveness excludes certain components of the changes in fair values of the derivatives and hedged items such as forward points on foreign exchange forward contracts, time values and cross-currency basis spreads. Excluded components may impact earnings either through amortization of the initial amount over the life of the derivative or through fair value changes recognized in the current period.
(f)Represents the change in value of amounts excluded from the assessment of effectiveness under the amortization approach, predominantly cross-currency basis spreads. The amount excluded at inception of the hedge is recognized in earnings over the life of the derivative.
JPMorgan Chase & Co./2023 Form 10-K | 211 | |||||||
Notes to consolidated financial statements
As of December 31, 2023 and 2022, the following amounts were recorded on the Consolidated balance sheets related to certain cumulative fair value hedge basis adjustments that are expected to reverse through the income statement in future periods as an adjustment to yield.
Carrying amount of the hedged items(a)(b) | Cumulative amount of fair value hedging adjustments included in the carrying amount of hedged items: | |||||||||||||||||||
| December 31, 2023 (in millions) | Active hedging relationships(d) | Discontinued hedging relationships(d)(e) | Total | |||||||||||||||||
| Assets | ||||||||||||||||||||
| Investment securities - AFS | $ | (c) | $ | $ | ( | $ | ( | |||||||||||||
| Liabilities | ||||||||||||||||||||
| Long-term debt | $ | $ | ( | $ | ( | $ | ( | |||||||||||||
Carrying amount of the hedged items(a)(b) | Cumulative amount of fair value hedging adjustments included in the carrying amount of hedged items: | |||||||||||||||||||
| December 31, 2022 (in millions) | Active hedging relationships(d) | Discontinued hedging relationships(d)(e) | Total | |||||||||||||||||
| Assets | ||||||||||||||||||||
| Investment securities - AFS | $ | (c) | $ | ( | $ | ( | $ | ( | ||||||||||||
| Liabilities | ||||||||||||||||||||
| Long-term debt | $ | $ | ( | $ | ( | $ | ( | |||||||||||||
(a)Excludes physical commodities with a carrying value of $5.6 billion and $26.0 billion at December 31, 2023 and 2022, respectively, to which the Firm applies fair value hedge accounting. As a result of the application of hedge accounting, these inventories are carried at fair value, thus recognizing unrealized gains and losses in current periods. Since the Firm exits these positions at fair value, there is no incremental impact to net income in future periods.
(b)Excludes hedged items where only foreign currency risk is the designated hedged risk, as basis adjustments related to foreign currency hedges will not reverse through the income statement in future periods. At December 31, 2023 and 2022, the carrying amount excluded for AFS securities is $19.3 billion and $20.3 billion, respectively, and for long-term debt is zero and $221 million, respectively.
(c)Carrying amount represents the amortized cost, net of allowance if applicable. Effective January 1, 2023, the Firm adopted the portfolio layer method hedge accounting guidance. At December 31, 2023, the amortized cost of the portfolio layer method closed portfolios was $83.9 billion, of which $68.0 billion was designated as hedged. The amount designated as hedged is the sum of the notional amounts of all outstanding layers in each portfolio, which includes both spot starting and forward starting layers. The cumulative amount of basis adjustments was $(165 ) million, which is comprised of $73 million and $(238 ) million for active and discontinued hedging relationships, respectively. Refer to Note 1 and Note 10 for additional information.
(d)Positive (negative) amounts related to assets represent cumulative fair value hedge basis adjustments that will reduce (increase) net interest income in future periods. Positive (negative) amounts related to liabilities represent cumulative fair value hedge basis adjustments that will increase (reduce) net interest income in future periods.
(e)Represents basis adjustments existing on the balance sheet date associated with hedged items that have been de-designated from qualifying fair value hedging relationships.
212 | JPMorgan Chase & Co./2023 Form 10-K | |||||||
Cash flow hedge gains and losses
The following tables present derivative instruments, by contract type, used in cash flow hedge accounting relationships, and the pre-tax gains/(losses) recorded on such derivatives, for the years ended December 31, 2023, 2022 and 2021, respectively. The Firm includes the gains/(losses) on the hedging derivative in the same line item in the Consolidated statements of income as the change in cash flows on the related hedged item.
| Derivatives gains/(losses) recorded in income and other comprehensive income/(loss) | |||||||||||||||||||||||||||||
| Year ended December 31, 2023 (in millions) | Amounts reclassified from AOCI to income | Amounts recorded in OCI | Total change in OCI for period | ||||||||||||||||||||||||||
| Contract type | |||||||||||||||||||||||||||||
Interest rate(a) | $ | ( | $ | $ | |||||||||||||||||||||||||
Foreign exchange(b) | |||||||||||||||||||||||||||||
| Total | $ | ( | $ | $ | |||||||||||||||||||||||||
| Derivatives gains/(losses) recorded in income and other comprehensive income/(loss) | |||||||||||||||||||||||||||||
| Year ended December 31, 2022 (in millions) | Amounts reclassified from AOCI to income | Amounts recorded in OCI | Total change in OCI for period | ||||||||||||||||||||||||||
| Contract type | |||||||||||||||||||||||||||||
Interest rate(a) | $ | ( | $ | ( | $ | ( | |||||||||||||||||||||||
Foreign exchange(b) | ( | ( | ( | ||||||||||||||||||||||||||
| Total | $ | ( | $ | ( | $ | ( | |||||||||||||||||||||||
| Derivatives gains/(losses) recorded in income and other comprehensive income/(loss) | |||||||||||||||||||||||||||||
| Year ended December 31, 2021 (in millions) | Amounts reclassified from AOCI to income | Amounts recorded in OCI | Total change in OCI for period | ||||||||||||||||||||||||||
| Contract type | |||||||||||||||||||||||||||||
Interest rate(a) | $ | $ | ( | $ | ( | ||||||||||||||||||||||||
Foreign exchange(b) | ( | ||||||||||||||||||||||||||||
| Total | $ | $ | ( | $ | ( | ||||||||||||||||||||||||
(a)Primarily consists of hedges of SOFR-indexed floating-rate assets. Gains and losses were recorded in net interest income.
(b)Primarily consists of hedges of the foreign currency risk of non-U.S. dollar-denominated revenue and expense. The income statement classification of gains and losses follows the hedged item – primarily noninterest revenue and compensation expense.
The Firm did not experience any forecasted transactions that failed to occur for the years ended 2023, 2022 and 2021.
Over the next 12 months, the Firm expects that approximately $(1.6 ) billion (after-tax) of net losses recorded in AOCI at December 31, 2023, related to cash flow hedges will be recognized in income. For cash flow hedges that have been terminated, the maximum length of time over which the derivative results recorded in AOCI will be recognized in earnings is approximately six years , corresponding to the timing of the originally hedged forecasted cash flows. For open cash flow hedges, the maximum length of time over which forecasted transactions are hedged is approximately seven years . The Firm’s longer-dated forecasted transactions relate to core lending and borrowing activities.
Net investment hedge gains and losses
The following table presents hedging instruments, by contract type, that were used in net investment hedge accounting relationships, and the pre-tax gains/(losses) recorded on such instruments for the years ended December 31, 2023, 2022 and 2021.
| 2023 | 2022 | 2021 | ||||||||||||||||||||||||
| Year ended December 31, (in millions) | Amounts recorded in income(a)(b) | Amounts recorded in OCI | Amounts recorded in income(a)(b) | Amounts recorded in OCI | Amounts recorded in income(a)(b) | Amounts recorded in OCI | ||||||||||||||||||||
| Foreign exchange derivatives | $ | $( | $( | $ | $( | $ | ||||||||||||||||||||
(a)Certain components of hedging derivatives are permitted to be excluded from the assessment of hedge effectiveness, such as forward points on foreign exchange forward contracts. The Firm elects to record changes in fair value of these amounts directly in other income.
(b)Excludes amounts reclassified from AOCI to income on the sale or liquidation of hedged entities. During the year ended December 31, 2023, the Firm reclassified a net pre-tax loss of $(35 ) million to other revenue including the impact of the acquisition of CIFM. The Firm reclassified net pre-tax gains of $38 million to other income/expense related to the liquidation of certain legal entities during the year ended December 31, 2022. The amount reclassified for the year ended December 31, 2021 was no t material. Refer to Note 24 for further information.
JPMorgan Chase & Co./2023 Form 10-K | 213 | |||||||
Notes to consolidated financial statements
Gains and losses on derivatives used for specified risk management purposes
The following table presents pre-tax gains/(losses) recorded on a limited number of derivatives, not designated in hedge accounting relationships, that are used to manage risks associated with certain specified assets and liabilities, including certain risks arising from mortgage commitments, warehouse loans, MSRs, wholesale lending exposures, and foreign currency denominated assets and liabilities.
| Derivatives gains/(losses) recorded in income | |||||||||||||||||
| Year ended December 31, (in millions) | 2023 | 2022 | 2021 | ||||||||||||||
| Contract type | |||||||||||||||||
Interest rate(a) | $ | ( | $ | ( | $ | ||||||||||||
Credit(b) | ( | ( | |||||||||||||||
Foreign exchange(c) | ( | ( | |||||||||||||||
| Total | $ | ( | $ | ( | $ | ||||||||||||
(a)Primarily represents interest rate derivatives used to hedge the interest rate risk inherent in mortgage commitments, warehouse loans and MSRs, as well as written commitments to originate warehouse loans. Gains and losses were recorded predominantly in mortgage fees and related income.
(b)Relates to credit derivatives used to mitigate credit risk associated with lending exposures in the Firm’s wholesale businesses. These derivatives do not include credit derivatives used to mitigate counterparty credit risk arising from derivative receivables, which is included in gains and losses on derivatives related to market-making activities and other derivatives. Gains and losses were recorded in principal transactions revenue.
(c)Primarily relates to derivatives used to mitigate foreign exchange risk of specified foreign currency-denominated assets and liabilities. Gains and losses were recorded in principal transactions revenue.
Gains and losses on derivatives related to market-making activities and other derivatives
Credit derivatives
Credit derivatives are financial instruments whose value is derived from the credit risk associated with the debt of a third-party issuer (the reference entity) and which allow one party (the protection purchaser) to transfer that risk to another party (the protection seller). Credit derivatives expose the protection purchaser to the creditworthiness of the protection seller, as the protection seller is required to make payments under the contract when the reference entity experiences a credit event, such as a bankruptcy, a failure to pay its obligation or a restructuring. The seller of credit protection receives a premium for providing protection but has the risk that the underlying instrument referenced in the contract will be subject to a credit event.
The Firm is both a purchaser and seller of protection in the credit derivatives market and uses these derivatives for two primary purposes. First, in its capacity as a market-maker, the Firm actively manages a portfolio of credit derivatives by purchasing and selling credit protection, predominantly on corporate debt obligations, to meet the needs of customers. Second, as an end-user, the Firm uses credit derivatives to manage credit risk associated with lending exposures (loans and unfunded commitments) in its wholesale and consumer businesses and derivatives counterparty exposures in its wholesale businesses, and to manage the credit risk arising from certain financial instruments in the Firm’s market-making businesses. Following is a summary of various types of credit derivatives.
214 | JPMorgan Chase & Co./2023 Form 10-K | |||||||
Credit default swaps
Credit derivatives may reference the credit of either a single reference entity (“single-name”), broad-based index or portfolio. The Firm purchases and sells protection on both single- name and index-reference obligations. Single-name CDS and index CDS contracts are either OTC or OTC-cleared derivative contracts. Single-name CDS are used to manage the default risk of a single reference entity, while index CDS contracts are used to manage the credit risk associated with the broader credit markets or credit market segments. Like the S&P 500 and other market indices, a CDS index consists of a portfolio of CDS across many reference entities. New series of CDS indices are periodically established with a new underlying portfolio of reference entities to reflect changes in the credit markets. If one of the reference entities in the index experiences a credit event, then the reference entity that defaulted is removed from the index. CDS can also be referenced against specific portfolios of reference names or against customized exposure levels: for example, to provide protection against the first $1 million of realized credit losses in a $10 million portfolio of exposure. Such structures are commonly known as tranche CDS.
For both single-name CDS contracts and index CDS contracts, upon the occurrence of a credit event, under the terms of a CDS contract neither party to the CDS contract has recourse to the reference entity. The protection purchaser has recourse to the protection seller for the difference between the face value of the CDS contract and the fair value of the reference obligation at settlement of the credit derivative contract, also known as the recovery value. The protection purchaser does not need to hold the debt instrument of the underlying reference entity in order to receive amounts due under the CDS contract when a credit event occurs.
Credit-related notes
A credit-related note is a funded derivative with a credit risk component where the issuer of the credit-related note purchases from the note investor credit protection on a reference entity or an index. Under the contract, the investor pays the issuer the par value of the note at the inception of the transaction, and in return, the issuer makes periodic payments to the investor, based on the credit risk of the referenced entity. The issuer also repays the investor the par value of the note at maturity unless the reference entity (or one of the entities that makes up a reference index) experiences a specified credit event. If a credit event occurs, the issuer is not obligated to repay the par value of the note, but rather, the issuer pays the investor the difference between the par value of the note and the fair value of the defaulted reference obligation at the time of settlement. Neither party to the credit-related note has recourse to the defaulting reference entity.
The following tables present a summary of the notional amounts of credit derivatives and credit-related notes the Firm sold and purchased as of December 31, 2023 and 2022. Upon a credit event, the Firm as a seller of protection would typically pay out a percentage of the full notional amount of net protection sold, as the amount actually required to be paid on the contracts takes into account the recovery value of the reference obligation at the time of settlement. The Firm manages the credit risk on contracts to sell protection by purchasing protection with identical or similar underlying reference entities. Other purchased protection referenced in the following tables includes credit derivatives bought on related, but not identical, reference positions (including indices, portfolio coverage and other reference points) as well as protection purchased by CIB through credit-related notes. Other purchased protection also includes credit protection against certain loans in the retained lending portfolio through the issuance of credit derivatives and credit-related notes.
JPMorgan Chase & Co./2023 Form 10-K | 215 | |||||||
Notes to consolidated financial statements
The Firm does not use notional amounts of credit derivatives as the primary measure of risk management for such derivatives, because the notional amount does not take into account the probability of the occurrence of a credit event, the recovery value of the reference obligation, or related cash instruments and economic hedges, each of which reduces, in the Firm’s view, the risks associated with such derivatives.
Total credit derivatives and credit-related notes | |||||||||||||||||||||||
| Maximum payout/Notional amount | |||||||||||||||||||||||
| Protection sold | Protection purchased with identical underlyings(c) | Net protection (sold)/purchased(d) | Other protection purchased(e) | ||||||||||||||||||||
| December 31, 2023 (in millions) | |||||||||||||||||||||||
| Credit derivatives | |||||||||||||||||||||||
| Credit default swaps | $ | ( | $ | $ | $ | ||||||||||||||||||
Other credit derivatives(a) | ( | ||||||||||||||||||||||
| Total credit derivatives | ( | ||||||||||||||||||||||
Credit-related notes(b) | |||||||||||||||||||||||
| Total | $ | ( | $ | $ | $ | ||||||||||||||||||
| Maximum payout/Notional amount | |||||||||||||||||||||||
| Protection sold | Protection purchased with identical underlyings(c) | Net protection (sold)/purchased(d) | Other protection purchased(e) | ||||||||||||||||||||
| December 31, 2022 (in millions) | |||||||||||||||||||||||
| Credit derivatives | |||||||||||||||||||||||
| Credit default swaps | $ | ( | $ | $ | $ | ||||||||||||||||||
Other credit derivatives(a) | ( | ||||||||||||||||||||||
| Total credit derivatives | ( | ||||||||||||||||||||||
Credit-related notes(b) | |||||||||||||||||||||||
| Total | $ | ( | $ | $ | $ | ||||||||||||||||||
(a)Other credit derivatives predominantly consist of credit swap options and total return swaps.
(b)Predominantly represents Other protection purchased by CIB.
(c)Represents the total notional amount of protection purchased where the underlying reference instrument is identical to the reference instrument on protection sold; the notional amount of protection purchased for each individual identical underlying reference instrument may be greater or lower than the notional amount of protection sold.
(d)Does not take into account the fair value of the reference obligation at the time of settlement, which would generally reduce the amount the seller of protection pays to the buyer of protection in determining settlement value.
(e)Represents protection purchased by the Firm on referenced instruments (single-name, portfolio or index) where the Firm has not sold any protection on the identical reference instrument.
The following tables summarize the notional amounts by the ratings, maturity profile, and total fair value, of credit derivatives as of December 31, 2023 and 2022, where JPMorgan Chase is the seller of protection. The maturity profile is based on the remaining contractual maturity of the credit derivative contracts. The ratings profile is based on the rating of the reference entity on which the credit derivative contract is based. The ratings and maturity profile of credit derivatives where JPMorgan Chase is the purchaser of protection are comparable to the profile reflected below.
Protection sold – credit derivatives ratings(a)/maturity profile | |||||||||||||||||||||||||||||||||||||||||
| December 31, 2023 (in millions) | <1 year | 1–5 years | >5 years | Total notional amount | Fair value of receivables(b) | Fair value of payables(b) | Net fair value | ||||||||||||||||||||||||||||||||||
| Risk rating of reference entity | |||||||||||||||||||||||||||||||||||||||||
| Investment-grade | $ | ( | $ | ( | $ | ( | $ | ( | $ | $ | ( | $ | |||||||||||||||||||||||||||||
| Noninvestment-grade | ( | ( | ( | ( | ( | ||||||||||||||||||||||||||||||||||||
| Total | $ | ( | $ | ( | $ | ( | $ | ( | $ | $ | ( | $ | |||||||||||||||||||||||||||||
| December 31, 2022 (in millions) | <1 year | 1–5 years | >5 years | Total notional amount | Fair value of receivables(b) | Fair value of payables(b) | Net fair value | ||||||||||||||||||||||||||||||||||
| Risk rating of reference entity | |||||||||||||||||||||||||||||||||||||||||
| Investment-grade | $ | ( | $ | ( | $ | ( | $ | ( | $ | $ | ( | $ | |||||||||||||||||||||||||||||
| Noninvestment-grade | ( | ( | ( | ( | ( | ( | |||||||||||||||||||||||||||||||||||
| Total | $ | ( | $ | ( | $ | ( | $ | ( | $ | $ | ( | $ | ( | ||||||||||||||||||||||||||||
(a)The ratings scale is primarily based on external credit ratings defined by S&P and Moody’s.
(b)Amounts are shown on a gross basis, before the benefit of legally enforceable master netting agreements including cash collateral netting.
216 | JPMorgan Chase & Co./2023 Form 10-K | |||||||
Note 6 – Noninterest revenue and noninterest expense
Noninterest revenue
The Firm records noninterest revenue from certain contracts with customers in investment banking fees, deposit-related fees, asset management fees, commissions and other fees, and components of card income. The related contracts are often terminable on demand and the Firm has no remaining obligation to deliver future services. For arrangements with a fixed term, the Firm may commit to deliver services in the future. Revenue associated with these remaining performance obligations typically depends on the occurrence of future events or underlying asset values, and is not recognized until the outcome of those events or values are known.
Investment banking fees
This revenue category includes debt and equity underwriting and advisory fees. As an underwriter, the Firm helps clients raise capital via public offering and private placement of various types of debt and equity instruments. Underwriting fees are primarily based on the issuance price and quantity of the underlying instruments, and are recognized as revenue typically upon execution of the client’s transaction. The Firm also manages and syndicates loan arrangements. Credit arrangement and syndication fees, included within debt underwriting fees, are recorded as revenue after satisfying certain retention, timing and yield criteria.
The Firm also provides advisory services, by assisting its clients with mergers and acquisitions, divestitures, restructuring and other complex transactions. Advisory fees are recognized as revenue typically upon execution of the client’s transaction.
The following table presents the components of investment banking fees.
| Year ended December 31, (in millions) | 2023 | 2022 | 2021 | ||||||||||||||
| Underwriting | |||||||||||||||||
| Equity | $ | $ | $ | ||||||||||||||
| Debt | |||||||||||||||||
| Total underwriting | |||||||||||||||||
| Advisory | |||||||||||||||||
| Total investment banking fees | $ | $ | $ | ||||||||||||||
Investment banking fees are earned primarily by CIB.
Principal transactions
Principal transactions revenue is driven by many factors, including:
•the bid-offer spread, which is the difference between the price at which a market participant is willing and able to sell an instrument to the Firm and the price at which another market participant is willing and able to buy it from the Firm, and vice versa; and
•realized and unrealized gains and losses on financial instruments and commodities transactions, including those accounted for under the fair value option, primarily used in client-driven market-making activities.
–Realized gains and losses result from the sale of instruments, closing out or termination of transactions, or interim cash payments.
–Unrealized gains and losses result from changes in valuation.
In connection with its client-driven market-making activities, the Firm transacts in debt and equity instruments, derivatives and commodities, including physical commodities inventories and financial instruments that reference commodities.
Principal transactions revenue also includes realized and unrealized gains and losses related to:
•derivatives designated in qualifying hedge accounting relationships, primarily fair value hedges of commodity and foreign exchange risk;
•derivatives used for specific risk management purposes, primarily to mitigate credit, foreign exchange and interest rate risks.
Refer to Note 5 for further information on the income statement classification of gains and losses from derivatives activities.
In the financial commodity markets, the Firm transacts in OTC derivatives (e.g., swaps, forwards, options) and ETD that reference a wide range of underlying commodities. In the physical commodity markets, the Firm primarily purchases and sells precious and base metals and may hold other commodities inventories under financing and other arrangements with clients.
The following table presents all realized and unrealized gains and losses recorded in principal transactions revenue. This table excludes interest income and interest expense on trading assets and liabilities, which are an integral part of the overall performance of the Firm’s client-driven market-making activities in CIB and fund deployment activities in Treasury and CIO. Refer to Note 7 for further information on interest income and interest expense.
Trading revenue is presented primarily by instrument type. The Firm’s client-driven market-making businesses generally utilize a variety of instrument types in connection with their market-making and related risk-management activities; accordingly, the trading revenue presented in the table below is not representative of the total revenue of any individual LOB.
JPMorgan Chase & Co./2023 Form 10-K | 217 | |||||||
Notes to consolidated financial statements
| Year ended December 31, (in millions) | 2023 | 2022 | 2021 | |||||||||||||||||
Trading revenue by instrument type | ||||||||||||||||||||
Interest rate(a) | $ | $ | $ | |||||||||||||||||
Credit(b) | (c) | |||||||||||||||||||
| Foreign exchange | ||||||||||||||||||||
| Equity | ||||||||||||||||||||
| Commodity | ||||||||||||||||||||
| Total trading revenue | ||||||||||||||||||||
Private equity losses | ( | ( | ( | |||||||||||||||||
| Principal transactions | $ | $ | $ | |||||||||||||||||
(a)Includes the impact of changes in funding valuation adjustments on derivatives.
(b)Includes the impact of changes in credit valuation adjustments on derivatives, net of the associated hedging activities.
(c)Includes net markdowns on held-for-sale positions, primarily unfunded commitments, in the bridge financing portfolio.
Principal transactions revenue is earned primarily by CIB.
Lending- and deposit-related fees
The following table presents the components of lending- and deposit-related fees.
| Year ended December 31, (in millions) | 2023 | 2022 | 2021 | ||||||||||||||
| Lending-related fees | $ | (a) | $ | $ | |||||||||||||
| Deposit-related fees | |||||||||||||||||
Total lending- and deposit-related fees | $ | $ | $ | ||||||||||||||
(a) Includes the amortization of the purchase discount on certain acquired lending-related commitments associated with First Republic, predominantly in AWM and CB. The discount is deferred in other liabilities and recognized on a straight-line basis over the commitment period and was largely recognized in the current year as the commitments are generally short term. Refer to Note 34 for additional information.
Lending- and deposit-related fees are earned by CCB, CIB, CB, and AWM.
Asset management fees
Investment management fees include fees associated with assets the Firm manages on behalf of its clients, including investors in Firm-sponsored funds and owners of separately managed investment accounts. Management fees are typically based on the value of assets under management and are collected and recognized at the end of each period over which the management services are provided and the value of the managed assets is known. The Firm also receives performance-based management fees, which are earned based on exceeding certain benchmarks or other performance targets and are accrued and recognized when the probability of reversal is remote, typically at the end of the related billing period.
All other asset management fees include commissions earned on the sales or distribution of mutual funds to clients. These fees are recorded as revenue at the time the service is rendered or, in the case of certain distribution fees, based on the underlying fund’s asset value or investor redemption activity.
The following table presents the components of asset management fees.
| Year ended December 31, (in millions) | 2023 | 2022 | 2021 | ||||||||||||||
| Asset management fees | |||||||||||||||||
Investment management fees | $ | (a) | $ | $ | |||||||||||||
All other asset management fees | |||||||||||||||||
| Total asset management fees | $ | $ | $ | ||||||||||||||
Asset management fees earned primarily by AWM and CCB.
Commissions and other fees
This revenue category includes commissions and fees from brokerage and custody services, and other products.
Brokerage commissions represents commissions earned when the Firm acts as a broker, by facilitating its clients’ purchases and sales of securities and other financial instruments. Brokerage commissions are collected and recognized as revenue upon occurrence of the client transaction. The Firm reports certain costs paid to third-party clearing houses and exchanges net against commission revenue.
Administration fees predominantly include fees for custody, funds services, securities lending and securities clearance. These fees are recorded as revenue over the period in which the related service is provided.
218 | JPMorgan Chase & Co./2023 Form 10-K | |||||||
The following table presents the components of commissions and other fees.
| Year ended December 31, (in millions) | 2023 | 2022 | 2021 | ||||||||||||||
| Commissions and other fees | |||||||||||||||||
Brokerage commissions | $ | $ | $ | ||||||||||||||
Administration fees | |||||||||||||||||
All other commissions and fees(a) | |||||||||||||||||
| Total commissions and other fees | $ | $ | $ | ||||||||||||||
Commissions and other fees are earned primarily by CIB, CCB and AWM.
Mortgage fees and related income
This revenue category reflects CCB’s Home Lending production and net mortgage servicing revenue.
Production revenue includes fees and income recognized as earned on mortgage loans originated with the intent to sell, and the impact of risk management activities associated with the mortgage pipeline and warehouse loans. Production revenue also includes gains and losses on sales and lower of cost or fair value adjustments on mortgage loans held-for-sale (excluding certain repurchased loans insured by U.S. government agencies), and changes in the fair value of financial instruments measured under the fair value option. Net mortgage servicing revenue includes operating revenue earned from servicing third-party mortgage loans, which is recognized over the period in which the service is provided; changes in the fair value of MSRs; the impact of risk management activities associated with MSRs; and gains and losses on securitization of excess mortgage servicing. Net mortgage servicing revenue also includes gains and losses on sales and lower of cost or fair value adjustments of certain repurchased loans insured by U.S. government agencies.
Refer to Note 15 for further information on risk management activities and MSRs.
Net interest income from mortgage loans is recorded in interest income.
Card income
This revenue category includes interchange and other income from credit and debit card transactions; and fees earned from processing card transactions for merchants, both of which are recognized when purchases are made by a cardholder and presented net of certain transaction-related costs. Card income also includes account origination costs and annual fees, which are deferred and recognized on a straight-line basis over a 12 -month period.
Certain credit card products offer the cardholder the ability to earn points based on account activity, which the cardholder can choose to redeem for cash and non-cash rewards. The cost to the Firm related to these proprietary rewards programs varies based on multiple factors including the terms and conditions of the rewards
programs, cardholder activity, cardholder reward redemption rates and cardholder reward selections. The Firm maintains a liability for its obligations under its rewards programs and reports the current-period cost as a reduction of card income.
Credit card revenue sharing agreements
The Firm has contractual agreements with numerous co-brand partners that grant the Firm exclusive rights to issue co-branded credit card products and market them to the customers of such partners. These partners endorse the co-brand credit card programs and provide their customer or member lists to the Firm. The partners may also conduct marketing activities and provide rewards redeemable under their own loyalty programs that the Firm will grant to co-brand credit cardholders based on account activity. The terms of these agreements generally range from to ten years .
The following table presents the components of card income:
| Year ended December 31, (in millions) | 2023 | 2022 | 2021 | ||||||||||||||
Interchange and merchant processing income | $ | $ | $ | ||||||||||||||
| Reward costs and partner payments | ( | ( | ( | ||||||||||||||
All other(a) | ( | ( | ( | ||||||||||||||
| Total card income | $ | $ | $ | ||||||||||||||
Card income is earned primarily by CCB, CIB and CB.
JPMorgan Chase & Co./2023 Form 10-K | 219 | |||||||
Notes to consolidated financial statements
Other income
This revenue category includes operating lease income, as well as losses associated with the Firm’s tax-oriented investments, predominantly alternative energy equity-method investments in CIB. The losses associated with these tax-oriented investments are more than offset by lower income tax expense from the associated tax credits.
The following table presents certain components of other income:
| Year ended December 31, (in millions) | 2023 | 2022 | 2021 | ||||||||||||||
| Operating lease income | $ | $ | $ | ||||||||||||||
Losses on tax-oriented investments | ( | ( | ( | ||||||||||||||
(a) | |||||||||||||||||
| Gain related to the acquisition of CIFM | (b) | ||||||||||||||||
| Gain on sale of Visa B shares | |||||||||||||||||
(a) Refer to Note 34 for additional information on the First Republic acquisition.
(b) Gain on the original minority interest in CIFM upon the Firm's acquisition of the remaining 51 % of the entity.
Refer to Note 2 and 18 for additional information on Visa B shares and operating leases, respectively.
Noninterest expense
Other expense
Other expense on the Firm’s Consolidated statements of income included:
| Year ended December 31, (in millions) | 2023 | 2022 | 2021 | ||||||||||||||
| Legal expense | $ | $ | $ | ||||||||||||||
| FDIC-related expense | (a) | ||||||||||||||||
| First Republic-related expense | (b) | ||||||||||||||||
(a) Included the $2.9 billion FDIC special assessment.
(b) Included payments to the FDIC in the second quarter of 2023 with respect to First Republic individuals who were not employees of the Firm until July 2, 2023, as well as $360 million restructuring and integration costs. Refer to Note 34 for additional information on the First Republic acquisition.
FDIC Special Assessment
In November 2023, the FDIC approved a final rule to implement a special assessment intended to recover losses to the Deposit Insurance Fund (“DIF”) arising from the protection of uninsured depositors resulting from the systemic risk determination made on March 12, 2023. The final rule imposed a special assessment at a quarterly rate of 3.36 basis points on insured depository institutions whose estimated uninsured deposits were over $5.0 billion as of December 31, 2022. In the fourth quarter of 2023, the Firm recognized the estimated special assessment expense of $2.9 billion (pre-tax).
Refer to Note 32 for additional information on noninterest revenue and expense by segment.
220 | JPMorgan Chase & Co./2023 Form 10-K | |||||||
Note 7 – Interest income and Interest expense
Interest income and interest expense are recorded in the Consolidated statements of income and classified based on the nature of the underlying asset or liability.
Interest income and interest expense includes the current-period interest accruals for financial instruments measured at fair value, except for derivatives and financial instruments containing embedded derivatives that would be separately accounted for in accordance with U.S. GAAP, absent the fair value option election; for those instruments, all changes in fair value including any interest elements, are primarily reported in principal transactions revenue. For financial instruments that are not measured at fair value, the related interest is included within interest income or interest expense, as applicable.
Interest income on loans and securities include the amortization and accretion of purchase premiums and discounts, as well as net deferred fees and costs on loans. These amounts are deferred in loans and investment securities, respectively, and recognized on a level-yield basis.
Refer to Notes 10, 11, 12, and 20 for further information on accounting for interest income and interest expense related to investment securities, securities financing activities (i.e., securities purchased or sold under resale or repurchase agreements; securities borrowed; and securities loaned), loans and long-term debt, respectively.
The following table presents the components of interest income and interest expense:
| Year ended December 31, (in millions) | 2023 | 2022 | 2021 | |||||||||||
| Interest income | ||||||||||||||
Loans | $ | (e) | $ | $ | ||||||||||
| Taxable securities | ||||||||||||||
Non-taxable securities(a) | ||||||||||||||
Total investment securities | (e) | |||||||||||||
| Trading assets - debt instruments | ||||||||||||||
Federal funds sold and securities purchased under resale agreements | ||||||||||||||
Securities borrowed(b) | ( | |||||||||||||
| Deposits with banks | ||||||||||||||
All other interest-earning assets(c) | ||||||||||||||
| Total interest income | $ | $ | $ | |||||||||||
| Interest expense | ||||||||||||||
| Interest bearing deposits | $ | $ | $ | |||||||||||
Federal funds purchased and securities loaned or sold under repurchase agreements | ||||||||||||||
Short-term borrowings | ||||||||||||||
Trading liabilities - debt and all other interest-bearing liabilities(d) | ||||||||||||||
| Long-term debt | ||||||||||||||
Beneficial interest issued by consolidated VIEs | ||||||||||||||
| Total interest expense | $ | $ | $ | |||||||||||
| Net interest income | $ | $ | $ | |||||||||||
| Provision for credit losses | ( | |||||||||||||
Net interest income after provision for credit losses | $ | $ | $ | |||||||||||
(a)Represents securities that are tax-exempt for U.S. federal income tax purposes.
(b)Negative interest and rates reflect the net impact of interest earned offset by fees paid on client-driven prime brokerage securities borrowed transactions.
(c)Includes interest earned on brokerage-related held-for-investment customer receivables, which are classified in accrued interest and accounts receivable, and all other interest-earning assets, which are classified in other assets on the Consolidated balance sheets.
(d)All other interest-bearing liabilities includes interest expense on brokerage-related customer payables.
JPMorgan Chase & Co./2023 Form 10-K | 221 | |||||||
Notes to consolidated financial statements
Note 8 – Pension and other postretirement
employee benefit plans
The Firm has various defined benefit pension plans and OPEB plans that provide benefits to its employees in the U.S. and certain non-U.S. locations. Substantially all the defined benefit pension plans are closed to new participants. The principal defined benefit pension plan in the U.S., which covered substantially all U.S. employees, was closed to new participants and frozen for existing participants on January 1, 2020, (and January 1, 2019 for new hires on or after December 2, 2017). Interest credits continue to accrue to participants’ accounts based on their accumulated balances.
The Firm maintains funded and unfunded postretirement benefit plans that provide medical and life insurance for certain eligible employees and retirees as well as their
dependents covered under these programs. None of these plans have a material impact on the Firm’s Consolidated Financial Statements.
The following table presents the pretax benefit obligations, plan assets, the net funded status, and the amounts recorded in AOCI on the Consolidated balance sheets for the Firm’s significant defined benefit pension and OPEB plans.
| As of or for the year ended December 31, | Defined benefit pension and OPEB plans | ||||||||||
| (in millions) | 2023 | 2022 | |||||||||
| Projected benefit obligations | $ | ( | $ | ( | |||||||
| Fair value of plan assets | |||||||||||
| Net funded status | |||||||||||
| Accumulated other comprehensive income/(loss) | ( | ( | |||||||||
The weighted-average discount rate used to value the benefit obligations as of December 31, 2023 and 2022, was 5.16 % and 5.14 %, respectively.
Gains and losses
Gains or losses resulting from changes in the benefit obligation and the fair value of plan assets are recorded in OCI. Amortization of net gains or losses are recognized as part of the net periodic benefit cost over subsequent periods, if, as of the beginning of the year, the net gain or loss exceeds 10 % of the greater of the projected benefit obligation or the fair value of the plan assets. Amortization is generally over the average expected remaining lifetime of plan participants, given the frozen status of most plans. For the year ended December 31, 2023, the net gain was attributable to market-driven increases in the fair value of plan assets, partially offset by changes in the discount rate
and interest crediting rate. During the year ended December 31, 2022, a remeasurement of the Firm’s U.S. principal defined benefit plan in the third quarter, was required as a result of a pension settlement. The remeasurement resulted in a reduction in the fair value of the Firm’s U.S. principal defined benefit plan assets, reflecting market conditions at the time of remeasurement, and a reduction in the plan’s projected benefit obligation totaling $4.0 billion and $2.6 billion, respectively, resulting in a net decrease of $1.4 billion in pre-tax AOCI.
The following table presents the net periodic benefit costs reported in the Consolidated statements of income for the Firm’s defined benefit pension, defined contribution and OPEB plans, and in other comprehensive income for the defined benefit pension and OPEB plans.
| Pension and OPEB plans | |||||||||||||||||
| Year ended December 31, (in millions) | 2023 | 2022 | 2021 | ||||||||||||||
Total net periodic defined benefit plan cost/(credit)(a) | $ | ( | $ | ( | (b) | $ | ( | (b) | |||||||||
| Total defined contribution plans | |||||||||||||||||
| Total pension and OPEB cost included in noninterest expense | $ | $ | $ | ||||||||||||||
| Total recognized in other comprehensive (income)/loss | $ | ( | $ | $ | ( | ||||||||||||
(a)The service cost component of net periodic defined benefit cost is reported in compensation expense; all other components of net periodic defined benefit costs are reported in other expense in the Consolidated statements of income.
222 | JPMorgan Chase & Co./2023 Form 10-K | |||||||
The following table presents the weighted-average actuarial assumptions used to determine the net periodic benefit costs for the defined benefit pension and OPEB plans.
| Defined benefit pension and OPEB plans | ||||||||||||||
| Year ended December 31, | 2023 | 2022 | 2021 | |||||||||||
| Discount rate | % | % | % | |||||||||||
| Expected long-term rate of return on plan assets | % | % | % | |||||||||||
Plan assumptions
The Firm’s expected long-term rate of return is a blended weighted average, by asset allocation of the projected long-term returns for the various asset classes, taking into consideration local market conditions and the specific allocation of plan assets. Returns on asset classes are developed using a forward-looking approach and are not strictly based on historical returns, with consideration given to current market conditions and the portfolio mix of each plan.
The discount rates used in determining the benefit obligations are generally provided by the Firm’s actuaries, with the Firm’s principal defined benefit pension plan using a rate that was selected by reference to the yields on portfolios of bonds with maturity dates and coupons that closely match each of the plan’s projected cash flows.
Investment strategy and asset allocation
The assets of the Firm’s defined benefit pension plans are held in various trusts and are invested in well-diversified portfolios of equity and fixed income securities, cash and cash equivalents, and alternative investments. The Firm regularly reviews the asset allocations and asset managers, as well as other factors that could impact the portfolios, which are rebalanced when deemed necessary. As of December 31, 2023, the approved asset allocation ranges by asset class for the Firm’s principal defined benefit plan are 42 -100 % debt securities, 0 -40 % equity securities, 0 -2 % real estate, and 0 -10 % alternatives.
Assets held by the Firm’s defined benefit pension and OPEB plans do not include securities issued by JPMorgan Chase or its affiliates, except through indirect exposures through investments in exchange traded funds, mutual funds and collective investment funds managed by third-parties. The defined benefit pension and OPEB plans hold investments that are sponsored or managed by affiliates of JPMorgan Chase in the amount of $1.8 billion and $1.7 billion, as of December 31, 2023 and 2022, respectively.
Fair value measurement of the plans’ assets and liabilities
Refer to Note 2 for information on fair value measurements, including descriptions of level 1, 2, and 3 of the fair value hierarchy and the valuation methods employed by the Firm.
| Pension plan assets and liabilities measured at fair value | ||||||||||||||||||||||||||
| Defined benefit pension and OPEB plans | ||||||||||||||||||||||||||
| 2023 | 2022 | |||||||||||||||||||||||||
December 31, (in millions) | Level 1(a) | Level 2(b) | Level 3(c) | Total fair value | Level 1(a) | Level 2(b) | Level 3(c) | Total fair value | ||||||||||||||||||
Assets measured at fair value classified in the fair value hierarchy | $ | $ | $ | $ | $ | $ | $ | $ | ||||||||||||||||||
Assets measured at fair value using NAV as a practical expedient | ||||||||||||||||||||||||||
Net defined benefit pension plan payables | ( | ( | ||||||||||||||||||||||||
| Total fair value of plan assets | $ | $ | ||||||||||||||||||||||||
(a) Consists predominantly of equity securities, U.S. federal, state, and local and non-U.S. government debt securities, and cash equivalents.
(b) Consists predominantly of corporate debt securities and U.S. federal, state, and local and non-U.S. government debt securities.
(c) Consists of corporate-owned life insurance policies, fund investments, and participating annuity contracts in 2023, and corporate-owned life insurance policies and participating annuity contracts in 2022.
JPMorgan Chase & Co./2023 Form 10-K | 223 | |||||||
Notes to consolidated financial statements
Changes in level 3 fair value measurements using significant unobservable inputs
Investments classified in level 3 of the fair value hierarchy increased in 2023 to $3.1 billion, due to $400 million in unrealized gains and $173 million of transfers in, partially offset by $59 million in settlements. The decline in 2022 was due to $501 million in unrealized losses and $54 million in settlements.
Estimated future benefit payments
The following table presents benefit payments expected to be paid for the defined benefit pension and OPEB plans for the years indicated.
| Year ended December 31, (in millions) | Defined benefit pension and OPEB plans | |||||||||||||
| 2024 | $ | |||||||||||||
| 2025 | ||||||||||||||
| 2026 | ||||||||||||||
| 2027 | ||||||||||||||
| 2028 | ||||||||||||||
| Years 2029–2033 | ||||||||||||||
224 | JPMorgan Chase & Co./2023 Form 10-K | |||||||
Note 9 – Employee share-based incentives
Employee share-based awards
In 2023, 2022 and 2021, JPMorgan Chase granted long-term share-based awards to certain employees under its LTIP, as amended and restated effective May 15, 2018, and subsequently amended effective May 18, 2021. Under the terms of the LTIP, as of December 31, 2023, 54 million shares of common stock were available for issuance through May 2025. The LTIP is the only active plan under which the Firm is currently granting share-based incentive awards. In the following discussion, the LTIP, plus prior Firm plans and plans assumed as the result of acquisitions, are referred to collectively as the “LTI Plans,” and such plans constitute the Firm’s share-based incentive plans.
RSUs are awarded at no cost to the recipient upon their grant. Generally, RSUs are granted annually and vest at a rate of 50% after two years and 50% after three years and are converted into shares of common stock as of the vesting date. In addition, RSUs typically include full-career eligibility provisions, which allow employees to continue to vest upon voluntary termination based on age and/or service-related requirements, subject to post-employment and other restrictions. All RSU awards are subject to forfeiture until vested and contain clawback provisions that may result in cancellation under certain specified circumstances. Predominantly all RSUs entitle the recipient to receive cash payments equivalent to any dividends paid on the underlying common stock during the period the RSUs are outstanding.
Performance share units (“PSUs”) are granted annually, and approved by the Firm’s Board of Directors, to members of the Firm’s Operating Committee under the variable compensation program. PSUs are subject to the Firm’s achievement of specified performance criteria over a -year period. The number of awards that vest can range from zero to 150 % of the grant amount. In addition, dividends that accrue during the vesting period are reinvested in dividend equivalent share units. PSUs and the related dividend equivalent share units are converted into shares of common stock after vesting.
Once the PSUs and dividend equivalent share units have vested, the shares of common stock that are delivered, after applicable tax withholding, must be retained for an additional holding period, for a total combined vesting and holding period of approximately to years from the grant date depending on regulations in certain countries.
Under the LTI Plans, stock appreciation rights (“SARs”) were generally granted with an exercise price equal to the fair value of JPMorgan Chase’s common stock on the grant date. SARs generally expire ten years after the grant date. In 2021, the Firm awarded its Chairman and CEO and its President and Chief Operating Officer 1.5 million and 750,000 SARs, respectively. There were no
The Firm separately recognizes compensation expense for each tranche of each award, net of estimated forfeitures, as if it were a separate award with its own vesting date. Generally, for each tranche granted, compensation expense is recognized on a straight-line basis from the grant date until the vesting date of the respective tranche, provided that the employees will not become full-career eligible during the vesting period. For awards with full-career eligibility provisions and awards granted with no future substantive service requirement, the Firm accrues the estimated value of awards expected to be awarded to employees as of the grant date without giving consideration to the impact of post-employment restrictions. For each tranche granted to employees who will become full-career eligible during the vesting period, compensation expense is recognized on a straight-line basis from the grant date until the earlier of the employee’s full-career eligibility date or the vesting date of the respective tranche.
Refer to Note 23 for further information on the classification of share-based awards for purposes of calculating earnings per share.
JPMorgan Chase & Co./2023 Form 10-K | 225 | |||||||
Notes to consolidated financial statements
RSUs, PSUs and SARs activity
Generally, compensation expense for RSUs and PSUs is measured based on the number of units granted multiplied by the stock price at the grant date, and for SARs, is measured at the grant date using the Black-Scholes valuation model. Compensation expense for these awards is recognized in net income as described previously. The following table summarizes JPMorgan Chase’s RSUs, PSUs and SARs activity for 2023.
| RSUs/PSUs | SARs | |||||||||||||||||||||||||||||||
| Year ended December 31, 2023 | Number of units | Weighted-average grant date fair value | Number of awards | Weighted-average exercise price | Weighted-average remaining contractual life (in years) | Aggregate intrinsic value | ||||||||||||||||||||||||||
(in thousands, except weighted-average data, and where otherwise stated) | ||||||||||||||||||||||||||||||||
| Outstanding, January 1 | $ | $ | ||||||||||||||||||||||||||||||
| Granted | ||||||||||||||||||||||||||||||||
| Exercised or vested | ( | ( | ||||||||||||||||||||||||||||||
| Forfeited | ( | |||||||||||||||||||||||||||||||
| Canceled | NA | NA | ||||||||||||||||||||||||||||||
| Outstanding, December 31 | $ | $ | $ | |||||||||||||||||||||||||||||
| Exercisable, December 31 | NA | NA | — | |||||||||||||||||||||||||||||
The total fair value of RSUs and PSUs that vested during the years ended December 31, 2023, 2022 and 2021, was $2.5 billion, $3.2 billion and $2.9 billion, respectively. The total intrinsic value of options exercised during the years ended December 31, 2023, 2022 and 2021, was $24 million, $75 million and $232 million, respectively.
Compensation expense
The Firm recognized the following noncash compensation expense related to its various employee share-based incentive plans in its Consolidated statements of income.
| Year ended December 31, (in millions) | 2023 | 2022 | 2021 | |||||||||||||||||
Cost of prior grants of RSUs, PSUs and SARs that are amortized over their applicable vesting periods | $ | $ | $ | |||||||||||||||||
| Accrual of estimated costs of share-based awards to be granted in future periods, predominantly those to full-career eligible employees | ||||||||||||||||||||
Total noncash compensation expense related to employee share-based incentive plans | $ | $ | $ | |||||||||||||||||
Tax benefits
Income tax benefits (including tax benefits from dividends or dividend equivalents) related to share-based incentive arrangements recognized in the Firm’s Consolidated statements of income for the years ended December 31, 2023, 2022 and 2021, were $836 million, $901 million and $957 million, respectively.
226 | JPMorgan Chase & Co./2023 Form 10-K | |||||||
Note 10 – Investment securities
Investment securities consist of debt securities that are classified as AFS or HTM. Debt securities classified as trading assets are discussed in Note 2. Predominantly all of the Firm’s AFS and HTM securities are held by Treasury and CIO in connection with its asset-liability management activities.
AFS securities are carried at fair value on the Consolidated balance sheets. Unrealized gains and losses, after any applicable hedge accounting adjustments or allowance for credit losses, are reported in AOCI. The specific identification method is used to determine realized gains and losses on AFS securities, which are included in investment securities gains/(losses) on the Consolidated statements of income. HTM securities, which the Firm has the intent and ability to hold until maturity, are carried at amortized cost, net of allowance for credit losses, on the Consolidated balance sheets.
For both AFS and HTM securities, purchase discounts or premiums are generally amortized into interest income on a level-yield basis over the contractual life of the security. However, premiums on certain callable debt securities are amortized to the earliest call date.
Effective January 1, 2023, the Firm adopted the portfolio layer method hedge accounting guidance which permitted a transfer of HTM securities to AFS upon adoption. The Firm transferred obligations of U.S. states and municipalities with a carrying value of $7.1 billion resulting in the recognition of $38 million net pre-tax unrealized losses in AOCI. Refer to Note 1 and Note 24 for additional information.
During 2022, the Firm transferred investment securities with a fair value of $78.3 billion from AFS to HTM for capital management purposes. AOCI included pretax unrealized losses of $4.8 billion on the securities at the date of transfer.
Unrealized gains or losses at the date of transfer of these securities continue to be reported in AOCI and are amortized into interest income on a level-yield basis over the remaining life of the securities. This amortization will offset the effect on interest income of the amortization of the premium or discount resulting from the transfer recorded at fair value.
Transfers of securities between AFS and HTM are non-cash transactions.
JPMorgan Chase & Co./2023 Form 10-K | 227 | |||||||
Notes to consolidated financial statements
The amortized costs and estimated fair values of the investment securities portfolio were as follows for the dates indicated.
| 2023 | 2022 | |||||||||||||||||||||||||||||||
| December 31, (in millions) | Amortized cost(c)(d) | Gross unrealized gains | Gross unrealized losses | Fair value | Amortized cost(c)(d) | Gross unrealized gains | Gross unrealized losses | Fair value | ||||||||||||||||||||||||
| Available-for-sale securities | ||||||||||||||||||||||||||||||||
| Mortgage-backed securities: | ||||||||||||||||||||||||||||||||
| U.S. GSEs and government agencies | $ | $ | $ | $ | $ | $ | $ | $ | ||||||||||||||||||||||||
| Residential: | ||||||||||||||||||||||||||||||||
| U.S. | ||||||||||||||||||||||||||||||||
| Non-U.S. | ||||||||||||||||||||||||||||||||
| Commercial | ||||||||||||||||||||||||||||||||
| Total mortgage-backed securities | ||||||||||||||||||||||||||||||||
| U.S. Treasury and government agencies | ||||||||||||||||||||||||||||||||
| Obligations of U.S. states and municipalities | ||||||||||||||||||||||||||||||||
| Non-U.S. government debt securities | ||||||||||||||||||||||||||||||||
| Corporate debt securities | ||||||||||||||||||||||||||||||||
| Asset-backed securities: | ||||||||||||||||||||||||||||||||
| Collateralized loan obligations | ||||||||||||||||||||||||||||||||
| Other | ||||||||||||||||||||||||||||||||
Unallocated portfolio layer fair value basis adjustments(a) | ( | — | NA | NA | NA | NA | NA | |||||||||||||||||||||||||
| Total available-for-sale securities | (e) | |||||||||||||||||||||||||||||||
Held-to-maturity securities(b) | ||||||||||||||||||||||||||||||||
| Mortgage-backed securities: | ||||||||||||||||||||||||||||||||
| U.S. GSEs and government agencies | ||||||||||||||||||||||||||||||||
| U.S. Residential | ||||||||||||||||||||||||||||||||
| Commercial | ||||||||||||||||||||||||||||||||
| Total mortgage-backed securities | ||||||||||||||||||||||||||||||||
| U.S. Treasury and government agencies | ||||||||||||||||||||||||||||||||
| Obligations of U.S. states and municipalities | ||||||||||||||||||||||||||||||||
| Asset-backed securities: | ||||||||||||||||||||||||||||||||
| Collateralized loan obligations | ||||||||||||||||||||||||||||||||
| Other | ||||||||||||||||||||||||||||||||
| Total held-to-maturity securities | ||||||||||||||||||||||||||||||||
| Total investment securities, net of allowance for credit losses | $ | $ | $ | $ | $ | $ | $ | $ | ||||||||||||||||||||||||
(a)Represents the amount of portfolio layer method basis adjustments related to AFS securities hedged in a closed portfolio. Under U.S. GAAP portfolio layer method basis adjustments are not allocated to individual securities, however the amounts impact the unrealized gains or losses in the table for the types of securities being hedged. Refer to Note 1 and Note 5 for additional information.
(b)The Firm purchased $4.1 billion, $33.7 billion and $111.8 billion of HTM securities for the years ended December 31, 2023, 2022 and 2021, respectively.
(c)The amortized cost of investment securities is reported net of allowance for credit losses of $128 million and $96 million at December 31, 2023 and 2022, respectively.
(d)Excludes $2.8 billion and $2.5 billion of accrued interest receivable at December 31, 2023 and 2022, respectively, included in accrued interest and accounts receivable on the Consolidated balance sheets. The Firm generally does not recognize an allowance for credit losses on accrued interest receivable, consistent with its policy to write them off no later than 90 days past due by reversing interest income. The Firm did no
(e)As of December 31, 2023, included $24.2 billion of AFS securities associated with First Republic. Refer to Note 34 for additional information.
At December 31, 2023, the investment securities portfolio consisted of debt securities with an average credit rating of AA+ (based upon external ratings where available, and where not available, based primarily upon internal risk ratings). Risk ratings are used to identify the credit quality of securities and differentiate risk within the portfolio. The Firm’s internal risk ratings generally align with the qualitative characteristics (e.g., borrower capacity to meet financial commitments and vulnerability to changes in the economic environment) defined by S&P and Moody’s,
however the quantitative characteristics (e.g., probability of default (“PD”) and loss given default (“LGD”)) may differ as they reflect internal historical experiences and assumptions. Risk ratings are assigned at acquisition, reviewed on a regular and ongoing basis by Credit Risk Management and adjusted as necessary over the life of the investment for updated information affecting the issuer’s ability to fulfill its obligations.
228 | JPMorgan Chase & Co./2023 Form 10-K | |||||||
AFS securities impairment
The following tables present the fair value and gross unrealized losses by aging category for AFS securities at December 31, 2023 and 2022. The tables exclude U.S. Treasury and government agency securities and U.S. GSE and government agency MBS with unrealized losses of $4.6 billion and $9.6 billion, at December 31, 2023 and 2022, respectively; changes in the value of these securities are generally driven by changes in interest rates rather than changes in their credit profile given the explicit or implicit guarantees provided by the U.S. government.
| Available-for-sale securities with gross unrealized losses | ||||||||||||||||||||||||||
| Less than 12 months | 12 months or more | |||||||||||||||||||||||||
| Year ended December 31, 2023 (in millions) | Fair value | Gross unrealized losses | Fair value | Gross unrealized losses | Total fair value | Total gross unrealized losses | ||||||||||||||||||||
| Available-for-sale securities | ||||||||||||||||||||||||||
| Mortgage-backed securities: | ||||||||||||||||||||||||||
| Residential: | ||||||||||||||||||||||||||
| U.S. | $ | $ | $ | $ | $ | $ | ||||||||||||||||||||
| Non-U.S. | ||||||||||||||||||||||||||
| Commercial | ||||||||||||||||||||||||||
| Total mortgage-backed securities | ||||||||||||||||||||||||||
| Obligations of U.S. states and municipalities | ||||||||||||||||||||||||||
| Non-U.S. government debt securities | ||||||||||||||||||||||||||
| Corporate debt securities | ||||||||||||||||||||||||||
| Asset-backed securities: | ||||||||||||||||||||||||||
| Collateralized loan obligations | ||||||||||||||||||||||||||
| Other | ||||||||||||||||||||||||||
| Total available-for-sale securities with gross unrealized losses | $ | (a) | $ | $ | $ | $ | $ | |||||||||||||||||||
| Available-for-sale securities with gross unrealized losses | |||||||||||||||||||||||
| Less than 12 months | 12 months or more | ||||||||||||||||||||||
| Year ended December 31, 2022 (in millions) | Fair value | Gross unrealized losses | Fair value | Gross unrealized losses | Total fair value | Total gross unrealized losses | |||||||||||||||||
| Available-for-sale securities | |||||||||||||||||||||||
| Mortgage-backed securities: | |||||||||||||||||||||||
| Residential: | |||||||||||||||||||||||
| U.S. | $ | $ | $ | $ | $ | $ | |||||||||||||||||
| Non-U.S. | |||||||||||||||||||||||
| Commercial | |||||||||||||||||||||||
| Total mortgage-backed securities | |||||||||||||||||||||||
| Obligations of U.S. states and municipalities | |||||||||||||||||||||||
| Non-U.S. government debt securities | |||||||||||||||||||||||
| Corporate debt securities | |||||||||||||||||||||||
| Asset-backed securities: | |||||||||||||||||||||||
| Collateralized loan obligations | |||||||||||||||||||||||
| Other | |||||||||||||||||||||||
| Total available-for-sale securities with gross unrealized losses | $ | $ | $ | $ | $ | $ | |||||||||||||||||
(a)Includes the impact of First Republic, primarily obligations of U.S. states and municipalities. Refer to Note 34 for additional information.
JPMorgan Chase & Co./2023 Form 10-K | 229 | |||||||
Notes to consolidated financial statements
AFS securities are considered impaired if the fair value is less than the amortized cost.
The Firm recognizes impairment losses in earnings if the Firm has the intent to sell the debt security, or if it is more likely than not that the Firm will be required to sell the debt security before recovery of its amortized cost. In these circumstances the impairment loss is recognized in investment securities gains/(losses) in the Consolidated Statements of Income and is equal to the full difference between the amortized cost (net of allowance if applicable) and the fair value of the security.
For impaired debt securities that the Firm has the intent and ability to hold, the securities are evaluated to determine if a credit loss exists. If it is determined that a credit loss exists, that loss is recognized as an allowance for credit losses through the provision for credit losses in the Consolidated Statements of Income, limited by the amount of impairment. Any impairment on debt securities that the Firm has the intent and ability to hold not due to credit losses is recorded in OCI.
Factors considered in evaluating credit losses include adverse conditions specifically related to the industry, geographic area or financial condition of the issuer or underlying collateral of a security; and payment structure of the security.
When assessing securities issued in a securitization for credit losses, the Firm estimates cash flows considering relevant market and economic data, underlying loan-level data, and structural features of the securitization, such as subordination, excess spread, overcollateralization or other forms of credit enhancement, and compares the losses projected for the underlying collateral (“pool losses”) against the level of credit enhancement in the securitization structure to determine whether these features are sufficient to absorb the pool losses, or whether a credit loss exists.
For beneficial interests in securitizations that are rated below “AA” at their acquisition, or that can be contractually prepaid or otherwise settled in such a way that the Firm would not recover substantially all of its recorded investment, the Firm evaluates impairment for credit losses when there is an adverse change in expected cash flows.
HTM securities – credit risk
Allowance for credit losses
The allowance for credit losses on HTM securities represents expected credit losses over the remaining expected life of the securities.
The allowance for credit losses on HTM obligations of U.S. states and municipalities and commercial mortgage-backed securities is calculated by applying statistical credit loss factors (estimated PD and LGD) to the amortized cost. The credit loss factors are derived using a weighted average of five internally developed eight-quarter macroeconomic scenarios, followed by a single year straight-line interpolation to revert to long run historical information for periods beyond the forecast period. Refer to Note 13 for further information on the eight-quarter macroeconomic forecast.
The allowance for credit losses on HTM collateralized loan obligations and U.S. residential mortgage-backed securities
is calculated as the difference between the amortized cost and the present value of the cash flows expected to be collected, discounted at the security’s effective interest rate. These cash flow estimates are developed based on expectations of underlying collateral performance derived using the eight-quarter macroeconomic forecast and the single year straight-line interpolation, as well as considering the structural features of the security.
The application of different inputs and assumptions into the calculation of the allowance for credit losses is subject to significant management judgment, and emphasizing one input or assumption over another, or considering other inputs or assumptions, could affect the estimate of the allowance for credit losses on HTM securities.
Credit quality indicator
Allowance for credit losses on investment securities
The allowance for credit losses on investment securities was $128 million, $96 million and $42 million as of December 31, 2023, 2022 and 2021, respectively, which included a cumulative-effect adjustment to retained earnings related to the transfer of HTM securities to AFS for the year ended December 31, 2023.
Selected impacts of investment securities on the Consolidated statements of income
| Year ended December 31, (in millions) | 2023 | 2022 | 2021 | ||||||||||||||
| Realized gains | $ | $ | $ | ||||||||||||||
| Realized losses | ( | ( | ( | ||||||||||||||
| Investment securities losses | $ | ( | $ | ( | $ | ( | |||||||||||
| Provision for credit losses | $ | $ | $ | ( | |||||||||||||
230 | JPMorgan Chase & Co./2023 Form 10-K | |||||||
Contractual maturities and yields
The following table presents the amortized cost and estimated fair value at December 31, 2023, of JPMorgan Chase’s investment securities portfolio by contractual maturity.
| By remaining maturity December 31, 2023 (in millions) | Due in one year or less | Due after one year through five years | Due after five years through 10 years | Due after 10 years(c) | Total | |||||||||||||||
| Available-for-sale securities | ||||||||||||||||||||
| Mortgage-backed securities | ||||||||||||||||||||
| Amortized cost | $ | $ | $ | $ | $ | |||||||||||||||
| Fair value | (d) | |||||||||||||||||||
Average yield(a) | % | % | % | % | % | |||||||||||||||
| U.S. Treasury and government agencies | ||||||||||||||||||||
| Amortized cost | $ | $ | $ | $ | $ | |||||||||||||||
| Fair value | ||||||||||||||||||||
Average yield(a) | % | % | % | % | % | |||||||||||||||
| Obligations of U.S. states and municipalities | ||||||||||||||||||||
| Amortized cost | $ | $ | $ | $ | $ | |||||||||||||||
| Fair value | (d) | |||||||||||||||||||
Average yield(a) | % | % | % | % | % | |||||||||||||||
| Non-U.S. government debt securities | ||||||||||||||||||||
| Amortized cost | $ | $ | $ | $ | $ | |||||||||||||||
| Fair value | ||||||||||||||||||||
Average yield(a) | % | % | % | % | % | |||||||||||||||
| Corporate debt securities | ||||||||||||||||||||
| Amortized cost | $ | $ | $ | $ | $ | |||||||||||||||
| Fair value | ||||||||||||||||||||
Average yield(a) | % | % | % | % | % | |||||||||||||||
| Asset-backed securities | ||||||||||||||||||||
| Amortized cost | $ | $ | $ | $ | $ | |||||||||||||||
| Fair value | (d) | |||||||||||||||||||
Average yield(a) | % | % | % | % | % | |||||||||||||||
| Total available-for-sale securities | ||||||||||||||||||||
Amortized cost(b) | $ | $ | $ | $ | $ | |||||||||||||||
| Fair value | (d) | |||||||||||||||||||
Average yield(a) | % | % | % | % | % | |||||||||||||||
| Held-to-maturity securities | ||||||||||||||||||||
| Mortgage-backed securities | ||||||||||||||||||||
| Amortized cost | $ | $ | $ | $ | $ | |||||||||||||||
| Fair value | ||||||||||||||||||||
Average yield(a) | % | % | % | % | % | |||||||||||||||
| U.S. Treasury and government agencies | ||||||||||||||||||||
| Amortized cost | $ | $ | $ | $ | $ | |||||||||||||||
| Fair value | ||||||||||||||||||||
Average yield(a) | % | % | % | % | % | |||||||||||||||
| Obligations of U.S. states and municipalities | ||||||||||||||||||||
| Amortized cost | $ | $ | $ | $ | $ | |||||||||||||||
| Fair value | ||||||||||||||||||||
Average yield(a) | % | % | % | % | % | |||||||||||||||
| Asset-backed securities | ||||||||||||||||||||
| Amortized cost | $ | $ | $ | $ | $ | |||||||||||||||
| Fair value | ||||||||||||||||||||
Average yield(a) | % | % | % | % | % | |||||||||||||||
| Total held-to-maturity securities | ||||||||||||||||||||
Amortized cost(b) | $ | $ | $ | $ | $ | |||||||||||||||
| Fair value | ||||||||||||||||||||
Average yield(a) | % | % | % | % | % | |||||||||||||||
(a)Average yield is computed using the effective yield of each security owned at the end of the period, weighted based on the amortized cost of each security. The effective yield considers the contractual coupon, amortization of premiums and accretion of discounts, and the effect of related hedging derivatives, including closed portfolio hedges. Taxable-equivalent amounts are used where applicable. The effective yield excludes unscheduled principal prepayments; and accordingly, actual maturities of securities may differ from their contractual or expected maturities as certain securities may be prepaid. However, for certain callable debt securities, the average yield is calculated to the earliest call date.
(b)For purposes of this table, the amortized cost of available-for-sale securities excludes the allowance for credit losses of $34 million and the portfolio layer fair value hedge basis adjustments of $73 million at December 31, 2023. The amortized cost of held-to-maturity securities also excludes the allowance for credit losses of $94 million at December 31, 2023.
(c)Substantially all of the Firm’s U.S. residential MBS and collateralized mortgage obligations are due in 10 years or more, based on contractual maturity. The estimated weighted-average life, which reflects anticipated future prepayments, is approximately seven years for agency residential MBS, seven years for agency residential collateralized mortgage obligations, and six years for nonagency residential collateralized mortgage obligations.
(d)Includes AFS securities associated with First Republic, primarily due after 10 years. Refer to Note 34 for additional information.
JPMorgan Chase & Co./2023 Form 10-K | 231 | |||||||
Notes to consolidated financial statements
Note 11 – Securities financing activities
JPMorgan Chase enters into resale, repurchase, securities borrowed and securities loaned agreements (collectively, “securities financing agreements”) primarily to finance the Firm’s inventory positions, acquire securities to cover short sales, accommodate customers’ financing needs, settle other securities obligations and to deploy the Firm’s excess cash.
Securities financing agreements are treated as collateralized financings on the Firm’s Consolidated balance sheets. Where appropriate under applicable accounting guidance, securities financing agreements with the same counterparty are reported on a net basis. Refer to Note 1 for further discussion of the offsetting of assets and liabilities. Fees received and paid in connection with securities financing agreements are recorded over the life of the agreement in interest income and interest expense on the Consolidated statements of income.
The Firm has elected the fair value option for certain securities financing agreements. Refer to Note 3 for further information regarding the fair value option. The securities financing agreements for which the fair value option has been elected are reported within securities purchased under resale agreements, securities loaned or sold under repurchase agreements, and securities borrowed on the Consolidated balance sheets. Generally, for agreements carried at fair value, current-period interest accruals are recorded within interest income and interest expense, with changes in fair value reported in principal transactions revenue. However, for financial instruments containing embedded derivatives that would be separately accounted for in accordance with accounting guidance for hybrid instruments, all changes in fair value, including any interest elements, are reported in principal transactions revenue.
Securities financing agreements not elected under the fair value option are measured at amortized cost. As a result of the Firm’s credit risk mitigation practices described below, the Firm did not hold any allowance for credit losses with respect to resale and securities borrowed arrangements as of December 31, 2023 and 2022.
Credit risk mitigation practices
Securities financing agreements expose the Firm primarily to credit and liquidity risk. To manage these risks, the Firm monitors the value of the underlying securities (predominantly high-quality securities collateral, including government-issued debt and U.S. GSEs and government agencies MBS) that it has received from or provided to its counterparties compared to the value of cash proceeds and exchanged collateral, and either requests additional collateral or returns securities or collateral when appropriate. Margin levels are initially established based upon the counterparty, the type of underlying securities, and the permissible collateral, and are monitored on an ongoing basis.
In resale and securities borrowed agreements, the Firm is exposed to credit risk to the extent that the value of the securities received is less than initial cash principal advanced and any collateral amounts exchanged. In repurchase and securities loaned agreements, credit risk exposure arises to the extent that the value of underlying securities advanced exceeds the value of the initial cash principal received, and any collateral amounts exchanged.
Additionally, the Firm typically enters into master netting agreements and other similar arrangements with its counterparties, which provide for the right to liquidate the underlying securities and any collateral amounts exchanged in the event of a counterparty default. It is also the Firm’s policy to take possession, where possible, of the securities underlying resale and securities borrowed agreements. Refer to Note 29 for further information regarding assets pledged and collateral received in securities financing agreements.
232 | JPMorgan Chase & Co./2023 Form 10-K | |||||||
The table below summarizes the gross and net amounts of the Firm’s securities financing agreements, as of December 31, 2023 and 2022. When the Firm has obtained an appropriate legal opinion with respect to a master netting agreement with a counterparty and where other relevant netting criteria under U.S. GAAP are met, the Firm nets, on the Consolidated balance sheets, the balances outstanding under its securities financing agreements with the same counterparty. In addition, the Firm exchanges securities and/or cash collateral with its counterparty to reduce the economic exposure with the counterparty, but such collateral is not eligible for net Consolidated balance sheet presentation. Where the Firm has obtained an appropriate legal opinion with respect to the counterparty master netting agreement, such collateral, along with
securities financing balances that do not meet all these relevant netting criteria under U.S. GAAP, is presented in the table below as “Amounts not nettable on the Consolidated balance sheets,” and reduces the “Net amounts” presented. Where a legal opinion has not been either sought or obtained, the securities financing balances are presented gross in the “Net amounts” below. In transactions where the Firm is acting as the lender in a securities-for-securities lending agreement and receives securities that can be pledged or sold as collateral, the Firm recognizes the securities received at fair value within other assets and the obligation to return those securities within accounts payable and other liabilities on the Consolidated balance sheets.
| December 31, 2023 | ||||||||||||||||||||
| (in millions) | Gross amounts | Amounts netted on the Consolidated balance sheets | Amounts presented on the Consolidated balance sheets | Amounts not nettable on the Consolidated balance sheets(b) | Net amounts(c) | |||||||||||||||
Assets | ||||||||||||||||||||
Securities purchased under resale agreements | $ | $ | ( | $ | $ | ( | $ | |||||||||||||
Securities borrowed | ( | ( | ||||||||||||||||||
Liabilities | ||||||||||||||||||||
| Securities sold under repurchase agreements | $ | $ | ( | $ | $ | ( | $ | |||||||||||||
Securities loaned and other(a) | ( | ( | ||||||||||||||||||
| December 31, 2022 | ||||||||||||||||||||
| (in millions) | Gross amounts | Amounts netted on the Consolidated balance sheets | Amounts presented on the Consolidated balance sheets | Amounts not nettable on the Consolidated balance sheets(b) | Net amounts(c) | |||||||||||||||
Assets | ||||||||||||||||||||
Securities purchased under resale agreements | $ | $ | ( | $ | $ | ( | $ | |||||||||||||
Securities borrowed | ( | ( | ||||||||||||||||||
Liabilities | ||||||||||||||||||||
| Securities sold under repurchase agreements | $ | $ | ( | $ | $ | ( | $ | |||||||||||||
Securities loaned and other(a) | ( | ( | ||||||||||||||||||
(a)Includes securities-for-securities lending agreements of $5.6 billion and $7.0 billion at December 31, 2023 and 2022, respectively, accounted for at fair value, where the Firm is acting as lender.
(b)In some cases, collateral exchanged with a counterparty exceeds the net asset or liability balance with that counterparty. In such cases, the amounts reported in this column are limited to the related net asset or liability with that counterparty.
JPMorgan Chase & Co./2023 Form 10-K | 233 | |||||||
Notes to consolidated financial statements
The tables below present as of December 31, 2023 and 2022 the types of financial assets pledged in securities financing agreements and the remaining contractual maturity of the securities financing agreements.
| Gross liability balance | |||||||||||||||||||||||
| 2023 | 2022 | ||||||||||||||||||||||
| December 31, (in millions) | Securities sold under repurchase agreements | Securities loaned and other | Securities sold under repurchase agreements | Securities loaned and other | |||||||||||||||||||
| Mortgage-backed securities: | |||||||||||||||||||||||
| U.S. GSEs and government agencies | $ | $ | $ | $ | |||||||||||||||||||
| Residential - nonagency | |||||||||||||||||||||||
| Commercial - nonagency | |||||||||||||||||||||||
| U.S. Treasury, GSEs and government agencies | |||||||||||||||||||||||
| Obligations of U.S. states and municipalities | |||||||||||||||||||||||
| Non-U.S. government debt | |||||||||||||||||||||||
| Corporate debt securities | |||||||||||||||||||||||
| Asset-backed securities | |||||||||||||||||||||||
| Equity securities | |||||||||||||||||||||||
Total | $ | $ | $ | $ | |||||||||||||||||||
| Remaining contractual maturity of the agreements | |||||||||||||||||||||||||||||
| December 31, 2023 (in millions) | Overnight and continuous | Greater than 90 days | |||||||||||||||||||||||||||
| Up to 30 days | 30 – 90 days | Total | |||||||||||||||||||||||||||
| Total securities sold under repurchase agreements | $ | $ | $ | $ | $ | ||||||||||||||||||||||||
| Total securities loaned and other | |||||||||||||||||||||||||||||
| Remaining contractual maturity of the agreements | |||||||||||||||||||||||||||||
| December 31, 2022 (in millions) | Overnight and continuous | Greater than 90 days | |||||||||||||||||||||||||||
| Up to 30 days | 30 – 90 days | Total | |||||||||||||||||||||||||||
| Total securities sold under repurchase agreements | $ | $ | $ | $ | $ | ||||||||||||||||||||||||
| Total securities loaned and other | |||||||||||||||||||||||||||||
Transfers not qualifying for sale accounting
234 | JPMorgan Chase & Co./2023 Form 10-K | |||||||
Note 12 – Loans
Loan accounting framework
The accounting for a loan depends on management’s strategy for the loan. The Firm accounts for loans based on the following categories:
•Originated or purchased loans held-for-investment (i.e., “retained”)
•Loans held-for-sale
•Loans at fair value
The following provides a detailed accounting discussion of the Firm’s loans by category:
Loans held-for-investment
Originated or purchased loans held-for-investment, including PCD, are recorded at amortized cost, reflecting the principal amount outstanding, net of the following: unamortized deferred loan fees, costs, premiums or discounts; charge-offs; collection of cash; and foreign exchange. Credit card loans also include billed finance charges and fees.
Interest income
Interest income on performing loans held-for-investment is accrued and recognized as interest income at the contractual rate of interest. Purchase price discounts or premiums, as well as net deferred loan fees or costs, are recognized in interest income over the contractual life of the loan as an adjustment of yield.
The Firm classifies accrued interest on loans, including accrued but unbilled interest on credit card loans, in accrued interest and accounts receivables on the Consolidated balance sheets. For credit card loans, accrued interest once billed is then recognized in the loan balances, with the related allowance recorded in the allowance for credit losses. Changes in the allowance for credit losses on accrued interest on credit card loans are recognized in the provision for credit losses and charge-offs are recognized by reversing interest income. For other loans, the Firm generally does not recognize an allowance for credit losses on accrued interest receivables, consistent with its policy to write them off no later than 90 days past due by reversing interest income.
Nonaccrual loans
Nonaccrual loans are those on which the accrual of interest has been suspended. Loans (other than credit card loans and certain consumer loans insured by U.S. government agencies) are placed on nonaccrual status and considered nonperforming when full payment of principal and interest is not expected, regardless of delinquency status, or when principal and interest has been in default for a period of 90 days or more, unless the loan is both well-secured and in the process of collection. A loan is determined to be past due when the minimum payment is not received from the borrower by the contractually specified due date or for certain loans (e.g., residential real estate loans), when a monthly payment is due and unpaid for 30 days or more.
Finally, collateral-dependent loans are typically maintained on nonaccrual status.
On the date a loan is placed on nonaccrual status, all interest accrued but not collected is reversed against interest income. In addition, the amortization of deferred amounts is suspended. Interest income on nonaccrual loans may be recognized as cash interest payments are received (i.e., on a cash basis) if the recorded loan balance is deemed fully collectible; however, if there is doubt regarding the ultimate collectibility of the recorded loan balance, all interest cash receipts are applied to reduce the carrying value of the loan (the cost recovery method). For consumer loans, application of this policy typically results in the Firm recognizing interest income on nonaccrual consumer loans on a cash basis.
A loan may be returned to accrual status when repayment is reasonably assured and there has been demonstrated performance under the terms of the loan or, if applicable, the terms of the restructured loan.
As permitted by regulatory guidance, credit card loans are generally exempt from being placed on nonaccrual status; accordingly, interest and fees related to credit card loans continue to accrue until the loan is charged off or paid in full.
Allowance for loan losses
The allowance for loan losses represents the estimated expected credit losses in the held-for-investment loan portfolio at the balance sheet date and is recognized on the balance sheet as a contra asset, which brings the amortized cost to the net carrying value. Changes in the allowance for loan losses are recorded in the provision for credit losses on the Firm’s Consolidated statements of income. Refer to Note 13 for further information on the Firm’s accounting policies for the allowance for loan losses.
Charge-offs
Consumer loans are generally charged off or charged down to the lower of the amortized cost or the net realizable value of the underlying collateral (i.e., fair value less estimated costs to sell), with an offset to the allowance for loan losses, upon reaching specified stages of delinquency in accordance with standards established by the FFIEC. Residential real estate loans, unmodified credit card loans and scored business banking loans are generally charged off no later than 180 days past due. Scored auto and closed-end consumer loans, including modified credit card accounts placed on a fixed payment plan, are charged off no later than 120 days past due.
Certain consumer loans are charged off or charged down to their net realizable value earlier than the FFIEC charge-off standards in the following circumstances:
•Loans modified to borrowers experiencing financial difficulty that are determined to be collateral-dependent.
JPMorgan Chase & Co./2023 Form 10-K | 235 | |||||||
Notes to consolidated financial statements
•Loans to borrowers who have experienced an event that suggests a loss is either known or highly certain are subject to accelerated charge-off standards (e.g., residential real estate and auto loans are charged off or charged down within 60 days of receiving notification of a bankruptcy filing).
•Auto loans upon repossession of the automobile.
Other than in certain limited circumstances, the Firm typically does not recognize charge-offs on the government-guaranteed portion of loans.
Wholesale loans are charged off when it is highly certain that a loss has been realized. The determination of whether to recognize a charge-off includes many factors, including the prioritization of the Firm’s claim in bankruptcy, expectations of the workout/restructuring of the loan and valuation of the borrower’s equity or the loan collateral.
When a loan is charged down to the lower of its amortized cost or the estimated net realizable value of the underlying collateral, the determination of the fair value of the collateral depends on the type of collateral (e.g., securities, real estate). In cases where the collateral is in the form of liquid securities, the fair value is based on quoted market prices or broker quotes. For illiquid securities or other financial assets, the fair value of the collateral is generally estimated using a discounted cash flow model.
For residential real estate loans, collateral values are based upon external valuation sources. When it becomes likely that a borrower is either unable or unwilling to pay, the Firm utilizes a broker’s price opinion, appraisal and/or an automated valuation model of the home based on an exterior-only valuation (“exterior opinions”), which is then updated at least every 12 months, or more frequently depending on various market factors. As soon as practicable after the Firm receives the property in satisfaction of a debt (e.g., by taking legal title or physical possession), the Firm generally obtains an appraisal based on an inspection that includes the interior of the home (“interior appraisals”). Exterior opinions and interior appraisals are discounted based upon the Firm’s experience with actual liquidation values as compared with the estimated values provided by exterior opinions and interior appraisals, considering state-specific factors.
For commercial real estate loans, collateral values are generally based on appraisals from internal and external valuation sources. Collateral values are typically updated every to twelve months , either by obtaining a new appraisal or by performing an internal analysis, in accordance with the Firm’s policies. The Firm also considers both borrower- and market-specific factors, which may result in obtaining appraisal updates or broker price opinions at more frequent intervals.
Loans held-for-sale
Loans held-for-sale are measured at the lower of cost or fair value, with valuation changes recorded in noninterest revenue. For consumer loans, the valuation is performed on a portfolio basis. For wholesale loans, the valuation is performed on an individual loan basis.
Interest income on loans held-for-sale is accrued and recognized based on the contractual rate of interest.
Loan origination fees or costs and purchase price discounts or premiums are deferred in a contra loan account until the related loan is sold. The deferred fees or costs and discounts or premiums are an adjustment to the basis of the loan and therefore are included in the periodic determination of the lower of cost or fair value adjustments and/or the gain or loss recognized at the time of sale.
Because these loans are recognized at the lower of cost or fair value, the Firm’s allowance for loan losses and charge-off policies do not apply to these loans. However, loans held-for-sale are subject to the Firm’s nonaccrual policies.
Loans at fair value
Loans for which the fair value option has been elected are measured at fair value, with changes in fair value recorded in noninterest revenue.
Interest income on these loans is accrued and recognized based on the contractual rate of interest. Changes in fair value are recognized in noninterest revenue. Loan origination fees are recognized upfront in noninterest revenue. Loan origination costs are recognized in the associated expense category as incurred.
Because these loans are recognized at fair value, the Firm’s allowance for loan losses and charge-off policies do not apply to these loans. However, loans at fair value are subject to the Firm’s nonaccrual policies.
Refer to Note 3 for further information on the Firm’s elections of fair value accounting under the fair value option. Refer to Note 2 and Note 3 for further information on loans carried at fair value and classified as trading assets.
236 | JPMorgan Chase & Co./2023 Form 10-K | |||||||
Loan classification changes
Loans in the held-for-investment portfolio that management decides to sell are transferred to the held-for-sale portfolio at the lower of cost or fair value on the date of transfer. Credit-related losses are charged against the allowance for loan losses; non-credit related losses such as those due to changes in interest rates or foreign currency exchange rates are recognized in noninterest revenue.
In the event that management decides to retain a loan in the held-for-sale portfolio, the loan is transferred to the held-for-investment portfolio at amortized cost on the date of transfer. These loans are subsequently assessed for impairment based on the Firm’s allowance methodology. Refer to Note 13 for a further discussion of the methodologies used in establishing the Firm’s allowance for loan losses.
Loan modifications
The Firm seeks to modify certain loans in conjunction with its loss mitigation activities. Through the modification, JPMorgan Chase grants one or more concessions to a borrower who is experiencing financial difficulty in order to minimize the Firm’s economic loss and avoid foreclosure or repossession of the collateral, and to ultimately maximize payments received by the Firm from the borrower. The concessions granted vary by program and by borrower-specific characteristics, and may include interest rate reductions, term extensions, other-than-insignificant payment delays or principal forgiveness. Effective January 1, 2023 the Firm adopted the Financial Instruments - Credit Losses: Troubled Debt Restructurings and Vintage Disclosure accounting guidance, which changed the accounting for loan modifications from TDRs to FDMs. Refer to Note 1 for further information.
Loans, except for credit card loans, reported as FDMs are generally placed on nonaccrual status, although in many cases such loans were already on nonaccrual status prior to modification. These loans may be returned to performing status (the accrual of interest is resumed) if the following criteria are met: (i) the borrower has performed under the modified terms for a minimum of six months and/or six payments, and (ii) the Firm has an expectation that repayment of the modified loan is reasonably assured based on, for example, the borrower’s debt capacity and level of future earnings, collateral values, LTV ratios, and other current market considerations. In certain limited and well-defined circumstances in which the loan is current at the modification date, such loans are not placed on nonaccrual status at the time of modification.
The allowance for credit losses associated with FDMs is measured using the Firm’s established allowance methodology, which considers the expected re-default rates for the modified loans. Refer to Note 13 for further discussion.
For periods ending prior to January 1, 2023, modifications of loans where the Firm granted concessions to a borrower experiencing financial difficulty were accounted for and
reported as TDRs. The concessions granted varied by program and by borrower-specific characteristics, and included interest rate reductions, term extensions, payment delays, principal forgiveness, or the acceptance of equity or other assets in lieu of payments. Loans with short-term and other insignificant modifications that were not considered concessions were not TDRs.
Loans modified in TDRs were generally measured for impairment using the Firm’s established asset-specific allowance methodology, which considers the expected redefault rates for the modified loans. A loan modified in a TDR generally remained subject to the asset-specific component of the allowance throughout its remaining life, regardless of whether the loan was performing and had been returned to accrual status. Refer to Note 13 for further discussion.
Foreclosed property
The Firm acquires property from borrowers through loan restructurings, workouts, and foreclosures. Property acquired may include real property (e.g., residential real estate, land, and buildings) and other commercial and personal property (e.g., automobiles, aircraft, railcars, and ships).
JPMorgan Chase & Co./2023 Form 10-K | 237 | |||||||
Notes to consolidated financial statements
Loan portfolio
The Firm’s loan portfolio is divided into three portfolio segments, which are the same segments used by the Firm to determine the allowance for loan losses: Consumer, excluding credit card; Credit card; and Wholesale. Within each portfolio segment the Firm monitors and assesses the credit risk in the following classes of loans, based on the risk characteristics of each loan class.
Consumer, excluding credit card | Credit card | Wholesale(c)(d) | ||||||||||||
• Residential real estate(a) • Auto and other(b) | • Credit card loans | • Secured by real estate • Commercial and industrial • Other(e) | ||||||||||||
(a)Includes scored mortgage and home equity loans held in CCB and AWM, and scored mortgage loans held in CIB.
(b)Includes scored auto, business banking and consumer unsecured loans as well as overdrafts, primarily in CCB.
(c)Includes loans held in CIB, CB, AWM, Corporate, and risk-rated exposure held in CCB, for which the wholesale methodology is applied when determining the allowance for loan losses.
(d)The wholesale portfolio segment's classes align with loan classifications as defined by the bank regulatory agencies, based on the loan's collateral, purpose, and type of borrower.
(e)Includes loans to SPEs, financial institutions, personal investment companies and trusts, individuals and individual entities (predominantly Global Private Bank clients within AWM and J.P. Morgan Wealth Management within CCB), states and political subdivisions, as well as loans to nonprofits. Refer to Note 14 for more information on SPEs.
The following tables summarize the Firm’s loan balances by portfolio segment.
| December 31, 2023 | Consumer, excluding credit card | Credit card | Wholesale | Total(b)(c) | |||||||||||||||||||||||||||||||
| (in millions) | |||||||||||||||||||||||||||||||||||
| Retained | $ | (a) | $ | $ | (a) | $ | |||||||||||||||||||||||||||||
| Held-for-sale | |||||||||||||||||||||||||||||||||||
| At fair value | (a) | ||||||||||||||||||||||||||||||||||
| Total | $ | $ | $ | $ | |||||||||||||||||||||||||||||||
| December 31, 2022 | Consumer, excluding credit card | Credit card | Wholesale | Total(b)(c) | |||||||||||||||||||||||||||||||
| (in millions) | |||||||||||||||||||||||||||||||||||
| Retained | $ | $ | $ | $ | |||||||||||||||||||||||||||||||
| Held-for-sale | |||||||||||||||||||||||||||||||||||
| At fair value | |||||||||||||||||||||||||||||||||||
| Total | $ | $ | $ | $ | |||||||||||||||||||||||||||||||
(a)Includes loans associated with First Republic consisting of $90.7 billion of retained loans and $1.9 billion of loans at fair value in consumer, excluding credit card and $53.9 billion of retained loans in wholesale.
(b)Excludes $6.8 billion and $5.2 billion of accrued interest receivable at December 31, 2023 and 2022, respectively. The Firm wrote off accrued interest receivable of $49 million and $39 million for the years ended December 31, 2023 and 2022, respectively.
(c)Loans (other than those for which the fair value option has been elected) are presented net of unamortized discounts and premiums and net deferred loan fees or costs. These amounts were not material as of December 31, 2023 and 2022.
The following tables provide information about the carrying value of retained loans purchased, sold and reclassified to held-for-sale during the periods indicated. Loans that were reclassified to held-for-sale and sold in a subsequent period are excluded from the sales line of this table.
| 2023 | ||||||||||||||||||||||||||||||||||||||
| Year ended December 31, (in millions) | Consumer, excluding credit card | Credit card | Wholesale | Total | ||||||||||||||||||||||||||||||||||
| Purchases | $ | (b)(c)(d) | $ | $ | (d) | $ | ||||||||||||||||||||||||||||||||
| Sales | ||||||||||||||||||||||||||||||||||||||
Retained loans reclassified to held-for-sale(a) | ||||||||||||||||||||||||||||||||||||||
| 2022 | ||||||||||||||||||||||||||||||||||||||
| Year ended December 31, (in millions) | Consumer, excluding credit card | Credit card | Wholesale | Total | ||||||||||||||||||||||||||||||||||
| Purchases | $ | (b)(c) | $ | $ | $ | |||||||||||||||||||||||||||||||||
| Sales | ||||||||||||||||||||||||||||||||||||||
Retained loans reclassified to held-for-sale(a) | ||||||||||||||||||||||||||||||||||||||
238 | JPMorgan Chase & Co./2023 Form 10-K | |||||||
| 2021 | |||||||||||||||||||||||||||||||||||
| Year ended December 31, (in millions) | Consumer, excluding credit card | Credit card | Wholesale | Total | |||||||||||||||||||||||||||||||
| Purchases | $ | (b)(c) | $ | $ | $ | ||||||||||||||||||||||||||||||
| Sales | |||||||||||||||||||||||||||||||||||
Retained loans reclassified to held-for-sale(a) | |||||||||||||||||||||||||||||||||||
(a)Reclassifications of loans to held-for-sale are non-cash transactions.
(b)Includes purchases of residential real estate loans, including the Firm’s voluntary repurchases of certain delinquent loans from loan pools as permitted by Government National Mortgage Association (“Ginnie Mae”) guidelines for the years ended December 31, 2023, 2022 and 2021. The Firm typically elects to repurchase these delinquent loans as it continues to service them and/or manage the foreclosure process in accordance with applicable requirements of Ginnie Mae, FHA, RHS, and/or VA.
(c)Excludes purchases of retained loans of $5.1 billion, $12.4 billion and $25.8 billion for the years ended December 31, 2023, 2022 and 2021, respectively, which are predominantly sourced through the correspondent origination channel and underwritten in accordance with the Firm’s standards.
(d)Includes loans acquired in the First Republic acquisition consisting of $91.9 billion in Consumer, excluding credit card and $59.2 billion in Wholesale. Refer to Note 34 for additional information.
Gains and losses on sales of loans
JPMorgan Chase & Co./2023 Form 10-K | 239 | |||||||
Notes to consolidated financial statements
Consumer, excluding credit card loan portfolio
Consumer loans, excluding credit card loans, consist primarily of scored residential mortgages, home equity loans and lines of credit, auto and business banking loans, with a focus on serving the prime consumer credit market. These loans include home equity loans secured by junior liens, prime mortgage loans with an interest-only payment period, and certain payment-option loans that may result in negative amortization.
The following table provides information about retained consumer loans, excluding credit card, by class.
| December 31, (in millions) | 2023 | 2022 | |||||||||
| Residential real estate | $ | (a) | $ | ||||||||
| Auto and other | |||||||||||
| Total retained loans | $ | $ | |||||||||
Delinquency rates are the primary credit quality indicator for consumer loans. Loans that are more than 30 days past due provide an early warning of borrowers who may be experiencing financial difficulties and/or who may be unable or unwilling to repay the loan. As the loan continues to age, it becomes more clear whether the borrower is likely to be unable or unwilling to pay. In the case of residential real estate loans, late-stage delinquencies (greater than 150 days past due) are a strong indicator of loans that will ultimately result in a foreclosure or similar liquidation transaction. In addition to delinquency rates, other credit quality indicators for consumer loans vary based on the class of loan, as follows:
•For residential real estate loans, the current estimated LTV ratio, or the combined LTV ratio in the case of junior lien loans, is an indicator of the potential loss severity in the event of default. Additionally, LTV or combined LTV ratios can provide insight into a borrower’s continued willingness to pay, as the delinquency rate of high-LTV loans tends to be greater than that for loans where the borrower has equity in the collateral. The geographic distribution of the loan collateral also provides insight as to the credit quality of the portfolio, as factors such as the regional economy, home price changes and specific events such as natural disasters, will affect credit quality. The borrower’s current or “refreshed” FICO score is a secondary credit quality indicator for certain loans, as FICO scores are an indication of the borrower’s credit payment history. Thus, a loan to a borrower with a low FICO score (less than 660) is considered to be of higher risk than a loan to a borrower with a higher FICO score. Further, a loan to a borrower with a high LTV ratio and a low FICO score is at greater risk of default than a loan to a borrower that has both a high LTV ratio and a high FICO score.
•For scored auto and business banking loans, geographic distribution is an indicator of the credit performance of the portfolio. Similar to residential real estate loans, geographic distribution provides insights into the portfolio performance based on regional economic activity and events.
240 | JPMorgan Chase & Co./2023 Form 10-K | |||||||
Residential real estate
Delinquency is the primary credit quality indicator for retained residential real estate loans. The following tables provide information on delinquency and gross charge-offs for the year ended December 31, 2023.
| (in millions, except ratios) | December 31, 2023 | ||||||||||||||||||||||||||||||||||
Term loans by origination year(f) | Revolving loans | Total | |||||||||||||||||||||||||||||||||
| 2023 | 2022 | 2021 | 2020 | 2019 | Prior to 2019 | Within the revolving period | Converted to term loans | ||||||||||||||||||||||||||||
Loan delinquency(a)(b) | |||||||||||||||||||||||||||||||||||
Current(c) | $ | $ | $ | $ | $ | $ | $ | $ | $ | ||||||||||||||||||||||||||
| 30–149 days past due | |||||||||||||||||||||||||||||||||||
| 150 or more days past due | |||||||||||||||||||||||||||||||||||
| Total retained loans | $ | $ | $ | $ | $ | $ | $ | $ | $ | ||||||||||||||||||||||||||
% of 30+ days past due to total retained loans(d)(e) | % | % | % | % | % | % | % | % | % | ||||||||||||||||||||||||||
| Gross charge-offs | $ | $ | $ | $ | $ | $ | $ | $ | $ | ||||||||||||||||||||||||||
| (in millions, except ratios) | December 31, 2022 | ||||||||||||||||||||||||||||||||||
Term loans by origination year(f) | Revolving loans | Total | |||||||||||||||||||||||||||||||||
| 2022 | 2021 | 2020 | 2019 | 2018 | Prior to 2018 | Within the revolving period | Converted to term loans | ||||||||||||||||||||||||||||
Loan delinquency(a)(b) | |||||||||||||||||||||||||||||||||||
| Current | $ | $ | $ | $ | $ | $ | $ | $ | $ | ||||||||||||||||||||||||||
| 30–149 days past due | |||||||||||||||||||||||||||||||||||
| 150 or more days past due | |||||||||||||||||||||||||||||||||||
| Total retained loans | $ | $ | $ | $ | $ | $ | $ | $ | $ | ||||||||||||||||||||||||||
% of 30+ days past due to total retained loans(d) | % | % | % | % | % | % | % | % | % | ||||||||||||||||||||||||||
(a)Individual delinquency classifications include mortgage loans insured by U.S. government agencies which were not material at December 31, 2023 and 2022.
(b)At December 31, 2023 and 2022, loans under payment deferral programs offered in response to the COVID-19 pandemic which are still within their deferral period and performing according to their modified terms are generally not considered delinquent.
(c)Included $6.4 billion, $26.3 billion, $21.9 billion, $14.8 billion, $7.4 billion, and $10.9 billion of term loans originated in 2023, 2022, 2021, 2020, 2019 and prior to 2019, respectively, and $2.5 billion of revolving loans within the revolving period associated with First Republic.
(d)Excludes mortgage loans that are 30 or more days past due insured by U.S. government agencies which were not material at December 31, 2023 and 2022. These amounts have been excluded based upon the government guarantee.
(e)Included $343 million of 30 or more days past due loans associated with First Republic.
(f)Purchased loans are included in the year in which they were originated.
Approximately 37 % of the total revolving loans are senior lien loans; the remaining balance are junior lien loans. The lien position the Firm holds is considered in the Firm’s allowance for credit losses. Revolving loans that have been converted to term loans have higher delinquency rates than those that are still within the revolving period. That is primarily because the fully-amortizing payment that is generally required for those products is higher than the minimum payment options available for revolving loans within the revolving period.
JPMorgan Chase & Co./2023 Form 10-K | 241 | |||||||
Notes to consolidated financial statements
Nonaccrual loans and other credit quality indicators
The following table provides information on nonaccrual and other credit quality indicators for retained residential real estate loans.
| (in millions, except weighted-average data) | December 31, 2023 | December 31, 2022 | |||||||||
Nonaccrual loans(a)(b)(c)(d)(e) | $ | $ | |||||||||
Current estimated LTV ratios(f)(g)(h) | |||||||||||
Greater than 125% and refreshed FICO scores: | |||||||||||
| Equal to or greater than 660 | $ | $ | |||||||||
| Less than 660 | |||||||||||
101% to 125% and refreshed FICO scores: | |||||||||||
| Equal to or greater than 660 | |||||||||||
| Less than 660 | |||||||||||
80% to 100% and refreshed FICO scores: | |||||||||||
| Equal to or greater than 660 | (l) | ||||||||||
| Less than 660 | |||||||||||
Less than 80% and refreshed FICO scores: | |||||||||||
| Equal to or greater than 660 | (l) | ||||||||||
| Less than 660 | (l) | ||||||||||
No FICO/LTV available(i) | |||||||||||
Total retained loans | $ | (m) | $ | ||||||||
Weighted average LTV ratio(f)(j) | % | % | |||||||||
Weighted average FICO(g)(j) | |||||||||||
Geographic region(i)(k) | |||||||||||
| California | $ | (n) | $ | ||||||||
| New York | (n) | ||||||||||
| Florida | (n) | ||||||||||
| Texas | |||||||||||
| Massachusetts | (n) | ||||||||||
| Illinois | |||||||||||
| Colorado | |||||||||||
| Washington | |||||||||||
| New Jersey | |||||||||||
| Connecticut | |||||||||||
| All other | |||||||||||
Total retained loans | $ | $ | |||||||||
(a)Includes collateral-dependent residential real estate loans that are charged down to the fair value of the underlying collateral less costs to sell. The Firm reports, in accordance with regulatory guidance, residential real estate loans that have been discharged under Chapter 7 bankruptcy and not reaffirmed by the borrower (“Chapter 7 loans”) as collateral-dependent nonaccrual loans, regardless of their delinquency status. At December 31, 2023, approximately 9 % of Chapter 7 residential real estate loans were 30 days or more past due.
(b)Mortgage loans insured by U.S. government agencies excluded from nonaccrual loans were not material at December 31, 2023 and 2022.
(c)Generally, all consumer nonaccrual loans have an allowance. In accordance with regulatory guidance, certain nonaccrual loans that are considered collateral-dependent have been charged down to the lower of amortized cost or the fair value of their underlying collateral less costs to sell. If the value of the underlying collateral improves subsequent to charge down, the related allowance may be negative.
(d)Interest income on nonaccrual loans recognized on a cash basis was $180 million and $175 million for the years ended December 31, 2023 and 2022, respectively.
(e)Generally excludes loans under payment deferral programs offered in response to the COVID-19 pandemic.
(f)Represents the aggregate unpaid principal balance of loans divided by the estimated current property value. Current property values are estimated, at a minimum, quarterly, based on home valuation models using nationally recognized home price index valuation estimates incorporating actual data to the extent available and forecasted data where actual data is not available. Current estimated combined LTV for junior lien home equity loans considers all available lien positions, as well as unused lines, related to the property.
(g)Refreshed FICO scores represent each borrower’s most recent credit score, which is obtained by the Firm on at least a quarterly basis.
(h)Includes residential real estate loans, primarily held in LLCs in AWM that did not have a refreshed FICO score. These loans have been included in a FICO band based on management’s estimation of the borrower’s credit quality.
(i)Included U.S. government-guaranteed loans as of December 31, 2023 and 2022.
(j)Excludes loans with no FICO and/or LTV data available.
(k)The geographic regions presented in the table are ordered based on the magnitude of the corresponding loan balances at December 31, 2023.
(l)Included $1.1 billion in equal to or greater than 660 FICO scores within 80% to 100% LTV ratio, and $87.9 billion and $1.1 billion in equal to or greater than 660 and less than 660 FICO scores, respectively, within less than 80% LTV ratio associated with First Republic.
(m)Included $90.7 billion of loans associated with First Republic.
(n)Included $54.9 billion, $14.9 billion, $3.5 billion, and $7.8 billion in California, New York, Florida and Massachusetts, respectively, associated with First Republic.
242 | JPMorgan Chase & Co./2023 Form 10-K | |||||||
Loan modifications
The Firm grants certain modifications of residential real estate loans to borrowers experiencing financial difficulty, which effective January 1, 2023, are reported as FDMs. The Firm's proprietary modification programs as well as government programs, including U.S. GSE programs, that generally provide various modifications to borrowers experiencing financial difficulty including, but not limited to, interest rate reductions, term extensions, other-than-insignificant payment delay and principal forgiveness that would otherwise have been required under the terms of the original agreement, are considered FDMs.
Financial effects of FDMs
For the year ended December 31, 2023, residential real estate FDMs were $136 million. The financial effects of the FDMs, which were predominantly in the form of term extensions and interest rate reductions, included extending the weighted-average life of the loans by 20 years, and reducing the weighted-average contractual interest rate from 7.21 % to 4.44 % for the year ended December 31, 2023. There were no additional commitments to lend to borrowers experiencing financial difficulty whose loans have been modified as FDMs.
In addition to FDMs, the Firm also had $69 million of loans subject to a trial modification, and $9 million of Chapter 7 loans for the year ended December 31, 2023. The changes to the TDR accounting guidance eliminated the TDR reasonably expected and concession assessment criteria. Accordingly, trial modifications and Chapter 7 loans were considered TDRs, but not FDMs. Refer to Note 1 for further information.
Payment status of FDMs and redefaults
For the year ended December 31, 2023, residential real estate FDMs of $29 million were 30 or more days past due and FDMs that re-defaulted were $17 million.
Nature and extent of TDRs
For periods ending prior to January 1, 2023, modifications of residential real estate loans where the Firm granted concessions to borrowers who were experiencing financial difficulty were generally accounted for and reported as TDRs. Loans with short-term or other insignificant modifications that were not considered concessions were not TDRs. For the years ended December 31, 2022 and 2021, new TDRs were $362 million and $866 million, and there were no additional commitments to lend to borrowers whose residential real estate loans were modified in TDRs.
The Firm’s proprietary modification programs as well as government programs, including U.S. GSE programs, generally provide various concessions to financially troubled borrowers including, but not limited to, interest rate reductions, term or payment extensions and delays of principal and/or interest payments that would otherwise have been required under the terms of the original agreement.
The following table provides information about how residential real estate loans were modified in TDRs during
the period presented. This table excludes loans with short-term or other insignificant modifications that are not considered concessions.
| Year ended December 31, | 2022 | 2021 | ||||||
| Number of loans approved for a trial modification | ||||||||
| Number of loans permanently modified | ||||||||
Concession granted:(a) | ||||||||
| Interest rate reduction | % | % | ||||||
| Term or payment extension | ||||||||
| Principal and/or interest deferred | ||||||||
| Principal forgiveness | ||||||||
Other(b) | ||||||||
(a)Represents concessions granted in permanent modifications as a percentage of the number of loans permanently modified. The sum of the percentages exceeds 100 % because predominantly all of the modifications include more than one type of concession. Concessions offered on trial modifications are generally consistent with those granted on permanent modifications.
Financial effects of TDRs and redefaults
The following table provides information about the financial effects of the various concessions granted in modifications of residential real estate loans and about redefaults of certain loans modified in TDRs for the periods presented. The following table presents only the financial effects of permanent modifications and does not include temporary concessions offered through trial modifications. This table also excludes loans with short-term or other insignificant modifications that were not considered concessions.
| Year ended December 31, (in millions, except weighted - average data) | 2022 | 2021 | ||||||
| Weighted-average interest rate of loans with interest rate reductions – before TDR | % | % | ||||||
| Weighted-average interest rate of loans with interest rate reductions – after TDR | ||||||||
| Weighted-average remaining contractual term (in years) of loans with term or payment extensions – before TDR | ||||||||
| Weighted-average remaining contractual term (in years) of loans with term or payment extensions – after TDR | ||||||||
| Charge-offs recognized upon permanent modification | $ | $ | ||||||
| Principal deferred | ||||||||
| Principal forgiven | ||||||||
Balance of loans that redefaulted within one year of permanent modification(a) | $ | $ | ||||||
(a)Represents loans permanently modified in TDRs that experienced a payment default in the periods presented, and for which the payment default occurred within one year of the modification. The dollar amounts presented represent the balance of such loans at the end of the reporting period in which such loans defaulted.
Active and suspended foreclosure
At December 31, 2023 and 2022, the Firm had residential real estate loans, excluding those insured by U.S. government agencies, with a carrying value of $566 million and $565 million, respectively, that were not included in REO, but were in the process of active or suspended foreclosure.
JPMorgan Chase & Co./2023 Form 10-K | 243 | |||||||
Notes to consolidated financial statements
Auto and other
Delinquency is the primary credit quality indicator for retained auto and other loans. The following tables provide information on delinquency and gross charge-offs for the year ended December 31, 2023.
| December 31, 2023 | |||||||||||||||||||||||||||||||||||||||||
(in millions, except ratios) | Term loans by origination year | Revolving loans | |||||||||||||||||||||||||||||||||||||||
| 2023 | 2022 | 2021 | 2020 | 2019 | Prior to 2019 | Within the revolving period | Converted to term loans | Total | |||||||||||||||||||||||||||||||||
| Loan delinquency | |||||||||||||||||||||||||||||||||||||||||
Current | $ | $ | $ | $ | $ | $ | $ | $ | $ | ||||||||||||||||||||||||||||||||
| 30–119 days past due | |||||||||||||||||||||||||||||||||||||||||
| 120 or more days past due | |||||||||||||||||||||||||||||||||||||||||
| Total retained loans | $ | $ | $ | $ | $ | $ | $ | $ | $ | ||||||||||||||||||||||||||||||||
% of 30+ days past due to total retained loans(a) | % | % | % | % | % | % | % | % | % | ||||||||||||||||||||||||||||||||
| Gross charge-offs | $ | $ | $ | $ | $ | $ | $ | $ | $ | ||||||||||||||||||||||||||||||||
| December 31, 2022 | |||||||||||||||||||||||||||||||||||||||||
(in millions, except ratios) | Term loans by origination year | Revolving loans | |||||||||||||||||||||||||||||||||||||||
| 2022 | 2021 | 2020 | 2019 | 2018 | Prior to 2018 | Within the revolving period | Converted to term loans | Total | |||||||||||||||||||||||||||||||||
| Loan delinquency | |||||||||||||||||||||||||||||||||||||||||
Current | $ | $ | $ | $ | $ | $ | $ | $ | $ | ||||||||||||||||||||||||||||||||
| 30–119 days past due | |||||||||||||||||||||||||||||||||||||||||
| 120 or more days past due | |||||||||||||||||||||||||||||||||||||||||
| Total retained loans | $ | $ | $ | $ | $ | $ | $ | $ | $ | ||||||||||||||||||||||||||||||||
% of 30+ days past due to total retained loans(a) | % | % | % | % | % | % | % | % | % | ||||||||||||||||||||||||||||||||
(a)At December 31, 2023 and 2022, auto and other loans excluded $20 million and $153 million, respectively, of PPP loans guaranteed by the SBA that are 30 or more days past due. These amounts have been excluded based upon the SBA guarantee.
244 | JPMorgan Chase & Co./2023 Form 10-K | |||||||
Nonaccrual and other credit quality indicators
The following table provides information on nonaccrual and other credit quality indicators for retained auto and other consumer loans.
| (in millions) | Total Auto and other | |||||||
| December 31, 2023 | December 31, 2022 | |||||||
Nonaccrual loans(a)(b)(c) | $ | $ | ||||||
Geographic region(d) | ||||||||
| California | $ | $ | ||||||
| Texas | ||||||||
| Florida | ||||||||
| New York | ||||||||
| Illinois | ||||||||
| New Jersey | ||||||||
| Georgia | ||||||||
| Pennsylvania | ||||||||
| Arizona | ||||||||
| North Carolina | ||||||||
| All other | ||||||||
| Total retained loans | $ | $ | ||||||
(a)At December 31, 2023 and 2022, nonaccrual loans excluded $15 million and $101 million, respectively, of PPP loans 90 or more days past due and guaranteed by the SBA, of which $15 million and $76 million, respectively, were no longer accruing interest based on the guidelines set by the SBA. Typically the principal balance of the loans is insured and interest is guaranteed at a specified reimbursement rate subject to meeting the guidelines set by the SBA. There were no
(b)Generally, all consumer nonaccrual loans have an allowance. In accordance with regulatory guidance, certain nonaccrual loans that are considered collateral-dependent have been charged down to the lower of amortized cost or the fair value of their underlying collateral less costs to sell. If the value of the underlying collateral improves subsequent to charge down, the related allowance may be negative.
(c)Interest income on nonaccrual loans recognized on a cash basis was not material for the years ended December 31, 2023 and 2022.
(d)The geographic regions presented in this table are ordered based on the magnitude of the corresponding loan balances at December 31, 2023.
Loan modifications
The Firm grants certain modifications of auto and other loans to borrowers experiencing financial difficulty, which effective January 1, 2023, are reported as FDMs. For the year ended December 31, 2023, auto and other FDMs were not material and there were no additional commitments to lend to borrowers modified as FDMs.
For periods ending prior to January 1, 2023, modifications of auto and other loans where the Firm granted concessions to borrowers who were experiencing financial difficulty were generally accounted for and reported as TDRs. Loans with short-term or other insignificant modifications that were not considered concessions were not TDRs. For the years ended December 31, 2022 and 2021, auto and other TDRs were not material.
JPMorgan Chase & Co./2023 Form 10-K | 245 | |||||||
Notes to consolidated financial statements
Credit card loan portfolio
The credit card portfolio segment includes credit card loans originated and purchased by the Firm. Delinquency rates are the primary credit quality indicator for credit card loans as they provide an early warning that borrowers may be experiencing difficulties (30 days past due); information on those borrowers that have been delinquent for a longer period of time (90 days past due) is also considered. In addition to delinquency rates, the geographic distribution of the loans provides insight as to the credit quality of the portfolio based on the regional economy.
While the borrower’s credit score is another general indicator of credit quality, the Firm does not view credit scores as a primary indicator of credit quality because the borrower’s credit score tends to be a lagging indicator. The distribution of such scores provides a general indicator of
credit quality trends within the portfolio; however, the score does not capture all factors that would be predictive of future credit performance. Refreshed FICO score information, which is obtained at least quarterly, for a statistically significant random sample of the credit card portfolio is indicated in other credit quality indicators. FICO is considered to be the industry benchmark for credit scores.
The Firm generally originates new credit card accounts to prime consumer borrowers. However, certain cardholders’ FICO scores may decrease over time, depending on the performance of the cardholder and changes in the credit score calculation.
The following tables provide information on delinquency and gross charge-offs for the year ended December 31, 2023.
(in millions, except ratios) | December 31, 2023 | ||||||||||
| Within the revolving period | Converted to term loans | Total | |||||||||
Loan delinquency | |||||||||||
Current and less than 30 days past due and still accruing | $ | $ | $ | ||||||||
30–89 days past due and still accruing | |||||||||||
90 or more days past due and still accruing | |||||||||||
| Total retained loans | $ | $ | $ | ||||||||
| Loan delinquency ratios | |||||||||||
% of 30+ days past due to total retained loans | % | % | % | ||||||||
% of 90+ days past due to total retained loans | |||||||||||
| Gross charge-offs | $ | $ | $ | ||||||||
(in millions, except ratios) | December 31, 2022 | ||||||||||
| Within the revolving period | Converted to term loans | Total | |||||||||
Loan delinquency | |||||||||||
Current and less than 30 days past due and still accruing | $ | $ | $ | ||||||||
30–89 days past due and still accruing | |||||||||||
90 or more days past due and still accruing | |||||||||||
| Total retained loans | $ | $ | $ | ||||||||
| Loan delinquency ratios | |||||||||||
% of 30+ days past due to total retained loans | % | % | % | ||||||||
% of 90+ days past due to total retained loans | |||||||||||
246 | JPMorgan Chase & Co./2023 Form 10-K | |||||||
Other credit quality indicators
The following table provides information on other credit quality indicators for retained credit card loans.
| (in millions, except ratios) | December 31, 2023 | December 31, 2022 | ||||||
Geographic region(a) | ||||||||
| California | $ | $ | ||||||
| Texas | ||||||||
| New York | ||||||||
| Florida | ||||||||
| Illinois | ||||||||
| New Jersey | ||||||||
| Ohio | ||||||||
| Colorado | ||||||||
| Pennsylvania | ||||||||
| Arizona | ||||||||
| All other | ||||||||
| Total retained loans | $ | $ | ||||||
Percentage of portfolio based on carrying value with estimated refreshed FICO scores | ||||||||
| Equal to or greater than 660 | % | % | ||||||
| Less than 660 | ||||||||
| No FICO available | ||||||||
(a)The geographic regions presented in the table are ordered based on the magnitude of the corresponding loan balances at December 31, 2023.
Loan modifications
The Firm grants certain modifications of credit card loans to borrowers experiencing financial difficulty, which effective January 1, 2023, are reported as FDMs. These modifications may involve placing the customer’s credit card account on a fixed payment plan, generally for 60 months, which typically includes reducing the interest rate on the credit card account. If the borrower does not make the contractual payments when due under the modified payment terms, the credit card loan continues to age and will be charged-off in accordance with the Firm's standard charge-off policy. In most cases, the Firm does not reinstate the borrower's line of credit.
Financial effects of FDMs
The following table provides information on credit card loan modifications considered FDMs.
| Year ended December 31, 2023 (in millions) | Amortized cost basis | % of loan modifications to total retained credit card loans | Financial effect of loan modification | ||||||||
| Loan modification | |||||||||||
Term extension and interest rate reduction(a)(b) | $ | % | Term extension with a reduction in the weighted average contractual interest rate from | ||||||||
| Total | $ | ||||||||||
(a)Term extension includes credit card loans whose terms have been modified under long-term programs by placing the customer’s credit card account on a fixed payment plan.
(b)The interest rates represent weighted average at enrollment.
For the year ended December 31, 2023, the Firm also had $27 million of credit card loans subject to trial modifications. The changes to the TDR accounting guidance eliminated the TDR reasonably expected and concession assessment criteria. Accordingly, trial modifications are not considered FDMs.
Payment status of FDMs and redefaults
The following table provides information on the payment status of FDMs during the year ended December 31, 2023.
| Year ended December 31, 2023 (in millions) | Amortized cost basis | ||||
| Current and less than 30 days past due and still accruing | $ | ||||
| 30-89 days past due and still accruing | |||||
| 90 or more days past due and still accruing | |||||
| Total | $ | ||||
There were $50 million FDMs that re-defaulted during the year ended December 31, 2023 which were a combination of term extension and interest rate reduction.
For credit card loans modified as FDMs, payment default is deemed to have occurred when the borrower misses two consecutive contractual payments. Defaulted modified credit card loans remain in the modification program and continue to be charged off in accordance with the Firm's standard charge-off policy.
JPMorgan Chase & Co./2023 Form 10-K | 247 | |||||||
Notes to consolidated financial statements
Financial effects of TDRs and redefaults
For periods ending prior to January 1, 2023, modifications of credit card loans where the Firm granted concessions to borrowers who were experiencing financial difficulty were generally accounted for and reported as TDRs. The Firm granted concessions for most of the credit card loans under long-term programs. These concessions involved placing the customer’s credit card account on a fixed payment plan, generally for 60 months, and typically included reducing the interest rate on the credit card account. Substantially all modifications under the Firm’s long-term programs were considered to be TDRs. Loans with short-term or other insignificant modifications that were not considered concessions were not reported as TDRs.
The following table provides information about the financial effects of the concessions granted on credit card loans modified in TDRs and redefaults for the periods presented. For all periods disclosed, new enrollments were less than 1 % of total retained credit card loans.
| Year ended December 31, (in millions, except weighted-average data) | 2022 | 2021 | ||||||
Balance of new TDRs(a) | $ | $ | ||||||
| Weighted-average interest rate of loans – before TDR | % | % | ||||||
Weighted-average interest rate of loans – after TDR | ||||||||
Balance of loans that redefaulted within one year of modification(b) | $ | $ | ||||||
(a)Represents the outstanding balance prior to modification.
(b)Represents loans modified in TDRs that experienced a payment default in the periods presented, and for which the payment default occurred within one year of the modification. The amounts presented represent the balance of such loans as of the end of the quarter in which they defaulted.
For credit card loans modified in TDRs, payment default was deemed to have occurred when the borrower missed two consecutive contractual payments. Defaulted modified credit card loans remained in the modification program and continued to be charged of in accordance with the Firm’s standard charge-off policy.
248 | JPMorgan Chase & Co./2023 Form 10-K | |||||||
Wholesale loan portfolio
Wholesale loans include loans made to a variety of clients, ranging from large corporate and institutional clients to high-net-worth individuals.
The primary credit quality indicator for wholesale loans is the internal risk rating assigned to each loan. Risk ratings are used to identify the credit quality of loans and differentiate risk within the portfolio. Risk ratings on loans consider the PD and the LGD. The PD is the likelihood that a loan will default. The LGD is the estimated loss on the loan that would be realized upon the default of the borrower and takes into consideration collateral and structural support for each credit facility.
Management considers several factors to determine an appropriate internal risk rating, including the obligor’s debt capacity and financial flexibility, the level of the obligor’s earnings, the amount and sources for repayment, the level and nature of contingencies, management strength, and the industry and geography in which the obligor operates. The Firm’s internal risk ratings generally align with the qualitative characteristics (e.g., borrower capacity to meet financial commitments and vulnerability to changes in the economic environment) defined by S&P and Moody’s, however the quantitative characteristics (e.g., PD and LGD) may differ as they reflect internal historical experiences and assumptions. The Firm generally considers internal ratings with qualitative characteristics equivalent to BBB-/Baa3 or higher as investment grade, and these ratings have a lower PD and/or lower LGD than non-investment grade ratings.
Noninvestment-grade ratings are further classified as noncriticized and criticized, and the criticized portion is further subdivided into performing and nonaccrual loans, representing management’s assessment of the collectibility of principal and interest. Criticized loans have a higher PD than noncriticized loans. The Firm’s definition of criticized aligns with the U.S. banking regulatory definition of criticized exposures, which consist of special mention, substandard and doubtful categories. Refer to Note 1 for additional information.
Risk ratings are reviewed on a regular and ongoing basis by Credit Risk Management and are adjusted as necessary for updated information affecting the obligor’s ability to fulfill its obligations.
As noted above, the risk rating of a loan considers the industry in which the obligor conducts its operations. As part of the overall credit risk management framework, the Firm focuses on the management and diversification of its industry and client exposures, with particular attention paid to industries with an actual or potential credit concern. Refer to Note 4 for further detail on industry concentrations.
JPMorgan Chase & Co./2023 Form 10-K | 249 | |||||||
Notes to consolidated financial statements
Internal risk rating is the primary credit quality indicator for retained wholesale loans. The following tables provide information on internal risk rating and gross charge-offs for the year ended December 31, 2023.
| December 31, (in millions, except ratios) | Secured by real estate | Commercial and industrial | Other(b) | Total retained loans | ||||||||||||||||||||||||||||||||||||||||
| 2023 | 2022 | 2023 | 2022 | 2023 | 2022 | 2023 | 2022 | |||||||||||||||||||||||||||||||||||||
| Loans by risk ratings | ||||||||||||||||||||||||||||||||||||||||||||
| Investment-grade | $ | $ | $ | $ | $ | $ | $ | $ | ||||||||||||||||||||||||||||||||||||
| Noninvestment- grade: | ||||||||||||||||||||||||||||||||||||||||||||
| Noncriticized | ||||||||||||||||||||||||||||||||||||||||||||
| Criticized performing | ||||||||||||||||||||||||||||||||||||||||||||
| Criticized nonaccrual | ||||||||||||||||||||||||||||||||||||||||||||
| Total noninvestment- grade | ||||||||||||||||||||||||||||||||||||||||||||
Total retained loans(a) | $ | $ | $ | $ | $ | $ | $ | $ | ||||||||||||||||||||||||||||||||||||
| % of investment-grade to total retained loans | % | % | % | % | % | % | % | % | ||||||||||||||||||||||||||||||||||||
| % of total criticized to total retained loans | ||||||||||||||||||||||||||||||||||||||||||||
| % of criticized nonaccrual to total retained loans | ||||||||||||||||||||||||||||||||||||||||||||
(a)As of December 31, 2023 included $33.8 billion of Secured by real estate loans, $3.0 billion of Commercial and industrial loans, and $17.1 billion of Other loans associated with First Republic.
(b)Includes loans to SPEs, financial institutions, personal investment companies and trusts, individuals and individual entities (predominantly Global Private Bank clients within AWM and J.P. Morgan Wealth Management within CCB), states and political subdivisions, as well as loans to nonprofits. As of December 31, 2023, predominantly consisted of $106.9 billion to individuals and individual entities, $91.2 billion to SPEs, and $87.5 billion to financial institutions, Refer to Note 14 for more information on SPEs.
| Secured by real estate | |||||||||||||||||||||||||||||||||||
(in millions) | December 31, 2023 | ||||||||||||||||||||||||||||||||||
| Term loans by origination year | Revolving loans | ||||||||||||||||||||||||||||||||||
| 2023 | 2022 | 2021 | 2020 | 2019 | Prior to 2019 | Within the revolving period | Converted to term loans | Total | |||||||||||||||||||||||||||
| Loans by risk ratings | |||||||||||||||||||||||||||||||||||
| Investment-grade | $ | $ | $ | $ | $ | $ | $ | $ | $ | ||||||||||||||||||||||||||
| Noninvestment-grade | |||||||||||||||||||||||||||||||||||
Total retained loans(a) | $ | $ | $ | $ | $ | $ | $ | $ | $ | ||||||||||||||||||||||||||
| Gross charge-offs | $ | $ | $ | $ | $ | $ | $ | $ | $ | ||||||||||||||||||||||||||
| Secured by real estate | |||||||||||||||||||||||||||||||||||
(in millions) | December 31, 2022 | ||||||||||||||||||||||||||||||||||
| Term loans by origination year | Revolving loans | ||||||||||||||||||||||||||||||||||
| 2022 | 2021 | 2020 | 2019 | 2018 | Prior to 2018 | Within the revolving period | Converted to term loans | Total | |||||||||||||||||||||||||||
| Loans by risk ratings | |||||||||||||||||||||||||||||||||||
| Investment-grade | $ | $ | $ | $ | $ | $ | $ | $ | $ | ||||||||||||||||||||||||||
| Noninvestment-grade | |||||||||||||||||||||||||||||||||||
| Total retained loans | $ | $ | $ | $ | $ | $ | $ | $ | $ | ||||||||||||||||||||||||||
(a)As of December 31, 2023 included $3.3 billion, $11.2 billion, $6.2 billion, $4.3 billion, $2.9 billion, and $5.1 billion of retained loans originated in 2023, 2022, 2021, 2020, 2019 and prior to 2019, respectively, and $838 million of revolving loans within the revolving period associated with First Republic.
250 | JPMorgan Chase & Co./2023 Form 10-K | |||||||
| Commercial and industrial | ||||||||||||||||||||||||||||||||||||||
(in millions) | December 31, 2023 | |||||||||||||||||||||||||||||||||||||
| Term loans by origination year | Revolving loans | |||||||||||||||||||||||||||||||||||||
| 2023 | 2022 | 2021 | 2020 | 2019 | Prior to 2019 | Within the revolving period | Converted to term loans | Total | ||||||||||||||||||||||||||||||
Loans by risk ratings | ||||||||||||||||||||||||||||||||||||||
| Investment-grade | $ | $ | $ | $ | $ | $ | $ | $ | $ | |||||||||||||||||||||||||||||
| Noninvestment-grade | ||||||||||||||||||||||||||||||||||||||
Total retained loans(a) | $ | $ | $ | $ | $ | $ | $ | $ | $ | |||||||||||||||||||||||||||||
| Gross charge-offs | $ | $ | $ | $ | $ | $ | $ | $ | $ | |||||||||||||||||||||||||||||
| Commercial and industrial | ||||||||||||||||||||||||||||||||||||||
(in millions) | December 31, 2022 | |||||||||||||||||||||||||||||||||||||
| Term loans by origination year | Revolving loans | |||||||||||||||||||||||||||||||||||||
| 2022 | 2021 | 2020 | 2019 | 2018 | Prior to 2018 | Within the revolving period | Converted to term loans | Total | ||||||||||||||||||||||||||||||
| Loans by risk ratings | ||||||||||||||||||||||||||||||||||||||
| Investment-grade | $ | $ | $ | $ | $ | $ | $ | $ | $ | |||||||||||||||||||||||||||||
| Noninvestment-grade | ||||||||||||||||||||||||||||||||||||||
| Total retained loans | $ | $ | $ | $ | $ | $ | $ | $ | $ | |||||||||||||||||||||||||||||
(a)As of December 31, 2023, included $364 million, $568 million, $471 million, $212 million, $53 million, and $121 million of retained loans originated in 2023, 2022, 2021, 2020, 2019 and prior to 2019, respectively, and $1.2 billion of revolving loans within the revolving period and $12 million converted to term loans associated with First Republic.
Other(a) | |||||||||||||||||||||||||||||||||||
(in millions) | December 31, 2023 | ||||||||||||||||||||||||||||||||||
| Term loans by origination year | Revolving loans | ||||||||||||||||||||||||||||||||||
| 2023 | 2022 | 2021 | 2020 | 2019 | Prior to 2019 | Within the revolving period | Converted to term loans | Total | |||||||||||||||||||||||||||
Loans by risk ratings | |||||||||||||||||||||||||||||||||||
| Investment-grade | $ | $ | $ | $ | $ | $ | $ | $ | $ | ||||||||||||||||||||||||||
| Noninvestment-grade | |||||||||||||||||||||||||||||||||||
Total retained loans(b) | $ | $ | $ | $ | $ | $ | $ | $ | $ | ||||||||||||||||||||||||||
| Gross charge-offs | $ | $ | $ | $ | $ | $ | $ | $ | $ | ||||||||||||||||||||||||||
Other(a) | |||||||||||||||||||||||||||||||||||
(in millions) | December 31, 2022 | ||||||||||||||||||||||||||||||||||
| Term loans by origination year | Revolving loans | ||||||||||||||||||||||||||||||||||
| 2022 | 2021 | 2020 | 2019 | 2018 | Prior to 2018 | Within the revolving period | Converted to term loans | Total | |||||||||||||||||||||||||||
| Loans by risk ratings | |||||||||||||||||||||||||||||||||||
| Investment-grade | $ | $ | $ | $ | $ | $ | $ | $ | $ | ||||||||||||||||||||||||||
| Noninvestment-grade | |||||||||||||||||||||||||||||||||||
| Total retained loans | $ | $ | $ | $ | $ | $ | $ | $ | $ | ||||||||||||||||||||||||||
(a)Includes loans to SPEs, financial institutions, personal investment companies and trusts, individuals and individual entities (predominantly Global Private Bank clients within AWM and J.P. Morgan Wealth Management within CCB), states and political subdivisions, as well as loans to nonprofits. Refer to Note 14 for more information on SPEs.
(b)As of December 31, 2023, included $610 million, $1.0 billion, $820 million, $1.1 billion, $244 million, and $1.4 billion of retained loans originated in 2023, 2022, 2021, 2020, 2019 and prior to 2019, respectively, and $11.8 billion of revolving loans within the revolving period and $56 million converted to term loans associated with First Republic.
JPMorgan Chase & Co./2023 Form 10-K | 251 | |||||||
Notes to consolidated financial statements
The following table presents additional information on retained loans secured by real estate within the Wholesale portfolio, which consists of loans secured wholly or substantially by a lien or liens on real property at origination. Multifamily lending includes financing for acquisition, leasing and construction of apartment buildings. Other commercial lending largely includes financing for acquisition, leasing and construction, largely for office, retail and industrial real estate. Included in secured by real estate loans is $10.2 billion and $6.4 billion as of December 31, 2023 and 2022, respectively, of construction and development loans made to finance land development and on-site construction of commercial, industrial, residential, or farm buildings.
| December 31, (in millions, except ratios) | Multifamily | Other Commercial | Total retained loans secured by real estate | ||||||||||||||||||||||||||
| 2023 | 2022 | 2023 | 2022 | 2023 | 2022 | ||||||||||||||||||||||||
| Retained loans secured by real estate | $ | $ | $ | $ | $ | (a) | $ | ||||||||||||||||||||||
| Criticized | |||||||||||||||||||||||||||||
| % of criticized to total retained loans secured by real estate | % | % | % | % | % | % | |||||||||||||||||||||||
| Criticized nonaccrual | $ | $ | $ | $ | $ | $ | |||||||||||||||||||||||
| % of criticized nonaccrual loans to total retained loans secured by real estate | % | % | % | % | % | % | |||||||||||||||||||||||
(a)Included $20.7 billion and $13.1 billion of Multifamily and Other commercial loans, respectively, associated with First Republic.
Geographic distribution and delinquency
The following table provides information on the geographic distribution and delinquency for retained wholesale loans.
| Secured by real estate | Commercial and industrial | Other | Total retained loans | ||||||||||||||||||||||||||||||||
| December 31, (in millions) | 2023 | 2022 | 2023 | 2022 | 2023 | 2022 | 2023 | 2022 | |||||||||||||||||||||||||||
Loans by geographic distribution(a)(b) | |||||||||||||||||||||||||||||||||||
| Total U.S. | $ | $ | $ | $ | $ | $ | $ | $ | |||||||||||||||||||||||||||
| Total non-U.S. | |||||||||||||||||||||||||||||||||||
| Total retained loans | $ | $ | $ | $ | $ | $ | $ | $ | |||||||||||||||||||||||||||
| Loan delinquency | |||||||||||||||||||||||||||||||||||
Current and less than 30 days past due and still accruing | $ | $ | $ | $ | $ | $ | $ | $ | |||||||||||||||||||||||||||
| 30–89 days past due and still accruing | |||||||||||||||||||||||||||||||||||
90 or more days past due and still accruing(c) | |||||||||||||||||||||||||||||||||||
Criticized nonaccrual(c) | |||||||||||||||||||||||||||||||||||
| Total retained loans | $ | $ | $ | $ | $ | $ | $ | $ | |||||||||||||||||||||||||||
(a)The U.S. and non-U.S. distribution is determined based predominantly on the domicile of the borrower.
(b)Borrowers associated with First Republic are predominantly domiciled in the U.S.
(c)Represents loans that are considered well-collateralized and therefore still accruing interest.
Nonaccrual loans
The following table provides information on retained wholesale nonaccrual loans.
| December 31, (in millions) | Secured by real estate | Commercial and industrial | Other | Total retained loans | ||||||||||||||||||||||||||||||||||
| 2023 | 2022 | 2023 | 2022 | 2023 | 2022 | 2023 | 2022 | |||||||||||||||||||||||||||||||
| Nonaccrual loans | ||||||||||||||||||||||||||||||||||||||
| With an allowance | $ | $ | $ | $ | $ | $ | $ | $ | ||||||||||||||||||||||||||||||
Without an allowance(a) | ||||||||||||||||||||||||||||||||||||||
Total nonaccrual loans(b) | $ | $ | $ | $ | $ | $ | $ | $ | ||||||||||||||||||||||||||||||
(a)When the discounted cash flows or collateral value equals or exceeds the amortized cost of the loan, the loan does not require an allowance. This typically occurs when the loans have been partially charged off and/or there have been interest payments received and applied to the loan balance.
(b)Interest income on nonaccrual loans recognized on a cash basis were not material for the years ended December 31, 2023 and 2022.
252 | JPMorgan Chase & Co./2023 Form 10-K | |||||||
Loan modifications
The Firm grants certain modifications of wholesale loans to borrowers experiencing financial difficulty, which effective January 1, 2023, are reported as FDMs.
Financial effects of FDMs
The following tables provide information by loan class about modifications considered FDMs.
(in millions) | Secured by real estate | ||||||||||
Year ended December 31, 2023 | |||||||||||
| Amortized cost basis | % of loan modifications to total retained Real Estate loans | Financial effect of loan modification | |||||||||
| Loan modification | |||||||||||
| Single modifications | |||||||||||
| Term extension | $ | % | Extended loans by a weighted average of | ||||||||
Other-than-insignificant payment deferral | % | Provided payment deferrals with delayed amounts primarily re-amortized over the remaining life of the loan | |||||||||
| Multiple modifications | |||||||||||
Interest rate reduction and term extension | % | Reduced weighted average contractual interest by | |||||||||
Other-than-insignificant payment deferral and interest rate reduction | % | Provided payment deferrals with delayed amounts primarily recaptured at maturity and reduced weighted average contractual interest by | |||||||||
| Total | $ | ||||||||||
(in millions) | Commercial and industrial | ||||||||||
Year ended December 31, 2023 | |||||||||||
| Amortized cost basis | % of loan modifications to total retained Commercial and industrial loans | Financial effect of loan modification | |||||||||
| Loan modification | |||||||||||
| Single modifications | |||||||||||
| Term extension | $ | % | Extended loans by a weighted average of | ||||||||
Other-than-insignificant payment deferral | % | Provided payment deferrals with delayed amounts primarily recaptured at the end of the deferral period | |||||||||
| Multiple modifications | |||||||||||
Other-than-insignificant payment deferral and term extension | $ | % | Provided payment deferrals with delayed amounts primarily re-amortized over the remaining life of the loan and extended loans by a weighted-average of | ||||||||
Other-than-insignificant payment deferral and interest rate reduction and term extension | % | Provided payment deferrals with delayed amounts primarily re-amortized over the remaining life of the loan, reduced weighted average contractual interest by | |||||||||
| Term extension and principal forgiveness | % | Extended loans by a weighted average of | |||||||||
| Interest rate reduction and term extension | % | Reduced weighted average contractual interest rate over the life of the loan as a result of converting from variable to fixed rate and extended loans by a weighted average of | |||||||||
| $ | |||||||||||
JPMorgan Chase & Co./2023 Form 10-K | 253 | |||||||
Notes to consolidated financial statements
(in millions) | Other | ||||||||||
Year ended December 31, 2023 | |||||||||||
| Amortized cost basis | % of loan modifications to total retained Other loans | Financial effect of loan modification | |||||||||
| Loan modification | |||||||||||
| Single modifications | |||||||||||
| Interest rate reduction | $ | % | Reduced weighted average contractual interest by | ||||||||
| Term extension | % | Extended loans by a weighted average of | |||||||||
| Multiple modifications | |||||||||||
Other-than-insignificant payment deferral and term extension | % | Provided payment deferrals with delayed amounts primarily recaptured at the end of the deferral period and extended loans by a weighted average of | |||||||||
Total(a) | $ | ||||||||||
(a) Includes loans to nonprofits, financial institutions, and personal investment companies and trusts.
Payment status of FDMs and redefaults
The following table provides information by loan class about the payment status of FDMs during the year ended December 31, 2023.
| Amortized cost basis | |||||||||||
| Secured by real estate | Commercial and industrial | Other | |||||||||
| (in millions) | Year ended December 31, 2023 | Year ended December 31, 2023 | Year ended December 31, 2023 | ||||||||
| Current and less than 30 days past due and still accruing | $ | $ | $ | ||||||||
| 30-89 days past due and still accruing | |||||||||||
| Criticized nonaccrual | |||||||||||
| Total | $ | $ | $ | ||||||||
The following table provides information by loan class about FDMs that re-defaulted during the year ended December 31, 2023.
(in millions) | Amortized cost basis | |||||||||||||
| Secured by real estate | Commercial and industrial | Other | ||||||||||||
Year ended December 31, 2023 | Year ended December 31, 2023 | Year ended December 31, 2023 | ||||||||||||
| Loan modification | ||||||||||||||
| Term extension | $ | $ | $ | |||||||||||
Other-than-insignificant payment deferral | ||||||||||||||
| Interest rate reduction and term extension | ||||||||||||||
Total(a) | $ | $ | $ | |||||||||||
(a)Represents FDMs that were 30 days or more past due.
As of December 31, 2023, additional unfunded commitments to lend to borrowers experiencing financial difficulty for Commercial and industrial and Other loan FDMs were $1.8 billion and $4 million, respectively. There were no additional unfunded commitments to lend to borrowers experiencing financial difficulties for Secured by real estate loan FDMs.
Nature and extent of TDRs
Prior to January 1, 2023, certain loan modifications were considered TDRs. These loan modifications provided various concessions to borrower who were experiencing financial difficulty. Loans with short-term or other insignificant modifications that were not considered concessions were not TDRs nor were loans for which the Firm elected to suspend TDR accounting guidance under the option provided by the CARES Act.
For the year ended December 31, 2022 and 2021, new TDRs were $801 million and $881 million, respectively. New TDRs for the year ended December 31, 2022 and 2021 reflected extended maturity dates and covenant waivers primarily in the Commercial and Industrial loan class. For the year ended December 31, 2022 and 2021, the impact of these modifications resulting in new TDRs was not material to the Firm.
As a result of the elimination of the requirement to assess whether a modification is reasonably expected or involves a concession, the population of loans considered FDMs is greater than the population previously considered TDRs.
254 | JPMorgan Chase & Co./2023 Form 10-K | |||||||
Note 13 – Allowance for credit losses
The Firm’s allowance for credit losses represents management's estimate of expected credit losses over the remaining expected life of the Firm's financial assets measured at amortized cost and certain off-balance sheet lending-related commitments. The allowance for credit losses generally comprises:
•the allowance for loan losses, which covers the Firm’s retained loan portfolios (scored and risk-rated),
•the allowance for lending-related commitments, which is presented on the Consolidated balance sheets in accounts payable and other liabilities, and
•the allowance for credit losses on investment securities, which is reflected in investment securities on the Consolidated balance sheets.
The income statement effect of all changes in the allowance for credit losses is recognized in the provision for credit losses.
Determining the appropriateness of the allowance for credit losses is complex and requires significant judgment by management about the effect of matters that are inherently uncertain. At least quarterly, the allowance for credit losses is reviewed by the CRO, the CFO and the Controller of the Firm. Subsequent evaluations of credit exposures, considering the macroeconomic conditions, forecasts and other factors then prevailing, may result in significant changes in the allowance for credit losses in future periods.
The Firm’s policies used to determine its allowance for loan losses and its allowance for lending-related commitments are described in the following paragraphs. Refer to Note 10 for a description of the policies used to determine the allowance for credit losses on investment securities.
Methodology for allowances for loan losses and lending-related commitments
The allowance for loan losses and allowance for lending-related commitments represents expected credit losses over the remaining expected life of retained loans and lending-related commitments that are not unconditionally cancellable. The Firm does not record an allowance for future draws on unconditionally cancellable lending-related commitments (e.g., credit cards). Expected losses related to accrued interest on credit card loans are considered in the Firm’s allowance for loan losses. However, the Firm does not record an allowance on other accrued interest receivables, due to its policy to write these receivables off no later than 90 days past due by reversing interest income.
The expected life of each instrument is determined by considering its contractual term, expected prepayments, cancellation features, and certain extension and call options. The expected life of funded credit card loans is generally estimated by considering expected future payments on the credit card account, and determining how much of those amounts should be allocated to repayments of the funded loan balance (as of the balance sheet date) versus other account activity. This allocation is made using
an approach that incorporates the payment application requirements of the Credit Card Accountability Responsibility and Disclosure Act of 2009, generally paying down the highest interest rate balances first.
The estimate of expected credit losses includes expected recoveries of amounts previously charged off or expected to be charged off, even if such recoveries result in a negative allowance.
Collective and Individual Assessments
When calculating the allowance for loan losses and the allowance for lending-related commitments, the Firm assesses whether exposures share similar risk characteristics. If similar risk characteristics exist, the Firm estimates expected credit losses collectively, considering the risk associated with a particular pool and the probability that the exposures within the pool will deteriorate or default. The assessment of risk characteristics is subject to significant management judgment. Emphasizing one characteristic over another or considering additional characteristics could affect the allowance.
•Relevant risk characteristics for the consumer portfolio include product type, delinquency status, current FICO scores, geographic distribution, and, for collateralized loans, current LTV ratios.
•Relevant risk characteristics for the wholesale portfolio include risk rating, delinquency status, tenor, level and type of collateral, LOB, geography, industry, credit enhancement, product type, facility purpose, and payment terms.
The majority of the Firm’s credit exposures share risk characteristics with other similar exposures, and as a result are collectively assessed for impairment (“portfolio-based component”). The portfolio-based component covers consumer loans, performing risk-rated loans and certain lending-related commitments.
If an exposure does not share risk characteristics with other exposures, the Firm generally estimates expected credit losses on an individual basis, considering expected repayment and conditions impacting that individual exposure (“asset-specific component”). The asset-specific component covers collateral-dependent loans and risk-rated loans that have been placed on nonaccrual status.
Portfolio-based component
The portfolio-based component begins with a quantitative calculation that considers the likelihood of the borrower changing delinquency status or moving from one risk rating to another. The quantitative calculation covers expected credit losses over an instrument’s expected life and is estimated by applying credit loss factors to the Firm’s estimated exposure at default. The credit loss factors incorporate the probability of borrower default as well as loss severity in the event of default. They are derived using a weighted average of five internally developed macroeconomic scenarios over an eight-quarter forecast period, followed by a single year straight-line interpolation
JPMorgan Chase & Co./2023 Form 10-K | 255 | |||||||
Notes to consolidated financial statements
to revert to long run historical information for periods beyond the eight-quarter forecast period. The five macroeconomic scenarios consist of a central, relative adverse, extreme adverse, relative upside and extreme upside scenario, and are updated by the Firm’s central forecasting team. The scenarios take into consideration the Firm’s macroeconomic outlook, internal perspectives from subject matter experts across the Firm, and market consensus and involve a governed process that incorporates feedback from senior management across LOBs, Corporate Finance and Risk Management.
The quantitative calculation is adjusted to take into consideration model imprecision, emerging risk assessments, trends and other subjective factors that are not yet reflected in the calculation. These adjustments are accomplished in part by analyzing the historical loss experience, including during stressed periods, for each major product or model. Management applies judgment in making this adjustment, including taking into account uncertainties associated with the economic and political conditions, quality of underwriting standards, borrower behavior, credit concentrations or deterioration within an industry, product or portfolio, as well as other relevant internal and external factors affecting the credit quality of the portfolio. In certain instances, the interrelationships between these factors create further uncertainties.
The application of different inputs into the quantitative calculation, and the assumptions used by management to adjust the quantitative calculation, are subject to significant management judgment, and emphasizing one input or assumption over another, or considering other inputs or assumptions, could affect the estimate of the allowance for loan losses and the allowance for lending-related commitments.
Asset-specific component
To determine the asset-specific component of the allowance, collateral-dependent loans (including those loans for which foreclosure is probable) and nonaccrual risk-rated loans in the wholesale portfolio segment are generally evaluated individually.
On January 1, 2023 the Firm adopted the Financial Instruments - Credit Losses: Troubled Debt Restructurings accounting guidance as described in Note 1.
The adoption of this guidance eliminated the requirement to measure the allowance for TDRs using a discounted cash flow (DCF) methodology and allowed the option of a non-DCF portfolio-based approach for modified loans to borrowers experiencing financial difficulty. If a DCF methodology is still applied for these modified loans, the discount rate must be the post-modification effective interest rate, instead of the pre-modification effective interest rate.
The Firm elected to change from an asset-specific allowance approach to its non-DCF, portfolio-based allowance approach for modified loans to troubled borrowers for all portfolios except collateral-dependent loans and nonaccrual
risk-rated loans, for which the asset-specific allowance approach will continue to apply. The adoption did not impact the collateral-dependent allowance approach or scope.
This guidance was adopted under the modified retrospective method which resulted in a net decrease to the allowance for credit losses of $587 million and an increase to retained earnings of $446 million, after-tax predominantly driven by residential real estate and credit card.
For collateral-dependent loans, the fair value of collateral less estimated costs to sell, as applicable, is used to determine the charge-off amount for declines in value (to reduce the amortized cost of the loan to the fair value of collateral) or the amount of negative allowance that should be recognized (for recoveries of prior charge-offs associated with improvements in the fair value of the collateral).
For non-collateral dependent loans, the Firm generally measures the asset-specific allowance as the difference between the amortized cost of the loan and the present value of the cash flows expected to be collected, discounted at the loan’s effective interest rate. Subsequent changes in impairment are generally recognized as an adjustment to the allowance for loan losses. The asset-specific component of the allowance for non-collateral dependent loans incorporates the effect of the modification on the loan’s expected cash flows including changes in interest rates, principal forgiveness, and other concessions, as well as management’s expectation of the borrower’s ability to repay under the modified terms.
Estimating the timing and amounts of future cash flows is highly judgmental as these cash flow projections rely upon estimates such as loss severities, asset valuations, the amounts and timing of interest or principal payments (including any expected prepayments) or other factors that are reflective of current and expected market conditions. These estimates are, in turn, dependent on factors such as the duration of current overall economic conditions, industry, portfolio, or borrower-specific factors, the expected outcome of insolvency proceedings as well as, in certain circumstances, other economic factors. All of these estimates and assumptions require significant management judgment and certain assumptions are highly subjective.
Other financial assets
In addition to loans and investment securities, the Firm holds other financial assets that are measured at amortized cost on the Consolidated balance sheets, including credit exposures arising from lending activities subject to collateral maintenance requirements. Management estimates the allowance for other financial assets using various techniques considering historical losses and current economic conditions.
Credit risk arising from lending activities subject to collateral maintenance requirements is generally mitigated by factors such as the short-term nature of the activity, the
256 | JPMorgan Chase & Co./2023 Form 10-K | |||||||
fair value of collateral held and the Firm’s right to call for, and the borrower’s obligation to provide additional margin when the fair value of the collateral declines. Because of these mitigating factors, these exposures generally do not require an allowance for credit losses. However, management may also consider other factors such as the borrower’s ongoing ability to provide collateral to satisfy margin requirements, or whether collateral is significantly concentrated in an individual issuer or in securities with similar risk characteristics. If in management’s judgment, an allowance for credit losses for these exposures is required, the Firm estimates expected credit losses based on the value of the collateral and probability of borrower default.
JPMorgan Chase & Co./2023 Form 10-K | 257 | |||||||
Notes to consolidated financial statements
Allowance for credit losses and related information
The table below summarizes information about the allowances for credit losses, and includes a breakdown of loans and lending-related commitments by impairment methodology. Refer to Note 10 for further information on the allowance for credit losses on investment securities.
| (Table continued on next page) | |||||||||||||||||||||||
2023 | |||||||||||||||||||||||
| Year ended December 31, (in millions) | Consumer, excluding credit card | Credit card | Wholesale | Total | |||||||||||||||||||
| Allowance for loan losses | |||||||||||||||||||||||
| Beginning balance at January 1, | $ | $ | $ | $ | |||||||||||||||||||
Cumulative effect of a change in accounting principle(a) | ( | ( | ( | ||||||||||||||||||||
| Gross charge-offs | |||||||||||||||||||||||
| Gross recoveries collected | ( | ( | ( | ( | |||||||||||||||||||
| Net charge-offs | |||||||||||||||||||||||
| Provision for loan losses | |||||||||||||||||||||||
Other | |||||||||||||||||||||||
| Ending balance at December 31, | $ | $ | $ | $ | |||||||||||||||||||
Allowance for lending-related commitments | |||||||||||||||||||||||
Beginning balance at January 1, | $ | $ | $ | $ | |||||||||||||||||||
Cumulative effect of a change in accounting principle(a) | — | NA | — | NA | |||||||||||||||||||
Provision for lending-related commitments | ( | ( | ( | ||||||||||||||||||||
Other | |||||||||||||||||||||||
| Ending balance at December 31, | $ | $ | $ | $ | |||||||||||||||||||
| Total allowance for investment securities | NA | NA | NA | $ | |||||||||||||||||||
Total allowance for credit losses(b)(c) | $ | $ | $ | $ | |||||||||||||||||||
Allowance for loan losses by impairment methodology | |||||||||||||||||||||||
Asset-specific(d) | $ | ( | $ | $ | $ | ( | |||||||||||||||||
| Portfolio-based | |||||||||||||||||||||||
| Total allowance for loan losses | $ | $ | $ | $ | |||||||||||||||||||
| Loans by impairment methodology | |||||||||||||||||||||||
Asset-specific(d) | $ | $ | $ | $ | |||||||||||||||||||
| Portfolio-based | |||||||||||||||||||||||
| Total retained loans | $ | $ | $ | $ | |||||||||||||||||||
| Collateral-dependent loans | |||||||||||||||||||||||
| Net charge-offs | $ | $ | $ | $ | |||||||||||||||||||
Loans measured at fair value of collateral less cost to sell | |||||||||||||||||||||||
Allowance for lending-related commitments by impairment methodology | |||||||||||||||||||||||
Asset-specific | $ | $ | $ | $ | |||||||||||||||||||
| Portfolio-based | |||||||||||||||||||||||
Total allowance for lending-related commitments(e) | $ | $ | $ | $ | |||||||||||||||||||
Lending-related commitments by impairment methodology | |||||||||||||||||||||||
Asset-specific | $ | $ | $ | $ | |||||||||||||||||||
Portfolio-based(f) | |||||||||||||||||||||||
Total lending-related commitments | $ | $ | $ | $ | |||||||||||||||||||
(a)Represents the impact to the allowance for loan losses upon the adoption of the Financial Instruments - Credit Losses: Troubled Debt Restructurings accounting guidance. Refer to Note 1 for further information.
(b)At December 31, 2023 and 2022, in addition to the allowance for credit losses in the table above, the Firm also had an allowance for credit losses of $243 million and $21 million, respectively, associated with certain accounts receivable in CIB.
(c)As of December 31, 2023, included the allowance for credit losses associated with First Republic.
(d)Includes collateral-dependent loans, including those for which foreclosure is deemed probable, and nonaccrual risk-rated loans for all periods presented. Prior periods also include non collateral-dependent TDRs or reasonably expected TDRs and modified PCD loans.
(e)The allowance for lending-related commitments is reported in accounts payable and other liabilities on the Consolidated balance sheets.
(f)At December 31, 2023, 2022 and 2021, lending-related commitments excluded $17.2 billion, $13.1 billion and $15.7 billion, respectively, for the consumer, excluding credit card portfolio segment; $915.7 billion, $821.3 billion and $730.5 billion, respectively, for the credit card portfolio segment; and $19.7 billion, $9.8 billion and $32.1 billion, respectively, for the wholesale portfolio segment, which were not subject to the allowance for lending-related commitments.
258 | JPMorgan Chase & Co./2023 Form 10-K | |||||||
| (table continued from previous page) | ||||||||||||||||||||||||||||||||||||||||||||
| 2022 | 2021 | |||||||||||||||||||||||||||||||||||||||||||
| Consumer, excluding credit card | Credit card | Wholesale | Total | Consumer, excluding credit card | Credit card | Wholesale | Total | |||||||||||||||||||||||||||||||||||||
| $ | $ | $ | $ | $ | $ | $ | $ | |||||||||||||||||||||||||||||||||||||
| NA | NA | NA | NA | NA | NA | NA | NA | |||||||||||||||||||||||||||||||||||||
| ( | ( | ( | ( | ( | ( | ( | ( | |||||||||||||||||||||||||||||||||||||
| ( | ( | ( | ( | |||||||||||||||||||||||||||||||||||||||||
| ( | ( | ( | ||||||||||||||||||||||||||||||||||||||||||
| $ | $ | $ | $ | $ | $ | $ | $ | |||||||||||||||||||||||||||||||||||||
| $ | $ | $ | $ | $ | $ | $ | $ | |||||||||||||||||||||||||||||||||||||
| NA | NA | NA | NA | NA | NA | NA | NA | |||||||||||||||||||||||||||||||||||||
| ( | ( | ( | ( | |||||||||||||||||||||||||||||||||||||||||
| $ | $ | $ | $ | $ | $ | $ | $ | |||||||||||||||||||||||||||||||||||||
| NA | NA | NA | $ | NA | NA | NA | $ | |||||||||||||||||||||||||||||||||||||
| $ | $ | $ | $ | $ | $ | $ | $ | |||||||||||||||||||||||||||||||||||||
| $ | ( | $ | $ | $ | $ | ( | $ | $ | $ | ( | ||||||||||||||||||||||||||||||||||
| $ | $ | $ | $ | $ | $ | $ | $ | |||||||||||||||||||||||||||||||||||||
| $ | $ | $ | $ | $ | $ | $ | $ | |||||||||||||||||||||||||||||||||||||
| $ | $ | $ | $ | $ | $ | $ | $ | |||||||||||||||||||||||||||||||||||||
| $ | ( | $ | $ | $ | ( | $ | $ | $ | $ | |||||||||||||||||||||||||||||||||||
| $ | $ | $ | $ | $ | $ | $ | $ | |||||||||||||||||||||||||||||||||||||
| $ | $ | $ | $ | $ | $ | $ | $ | |||||||||||||||||||||||||||||||||||||
| $ | $ | $ | $ | $ | $ | $ | $ | |||||||||||||||||||||||||||||||||||||
| $ | $ | $ | $ | $ | $ | $ | $ | |||||||||||||||||||||||||||||||||||||
JPMorgan Chase & Co./2023 Form 10-K | 259 | |||||||
Notes to consolidated financial statements
Discussion of changes in the allowance
The allowance for credit losses as of December 31, 2023 was $24.8 billion, reflecting a net addition of $3.1 billion from December 31, 2022.
The net addition to the allowance for credit losses included $1.9 billion, consisting of:
•$1.3 billion in consumer, predominantly driven by CCB, comprised of $1.4 billion in Card Services, partially offset by a net reduction of $200 million in Home Lending. The net addition in Card Services was driven by loan growth, including an increase in revolving balances, partially offset by reduced borrower uncertainty. The net reduction in Home Lending was driven by improvements in the outlook for home prices, and
•$675 million in wholesale, driven by net downgrade activity, the net effect of changes in the Firm’s weighted average macroeconomic outlook, including deterioration in the outlook for commercial real estate in CB, and an addition for certain accounts receivable in CIB, partially offset by the impact of changes in the loan and lending-related commitment portfolios.
The net addition also included $1.2 billion to establish the allowance for the First Republic loans and lending-related commitments in the second quarter of 2023.
The changes in the Firm's weighted average macroeconomic outlook also included updates to the central scenario in the third quarter of 2023 to reflect a lower forecasted unemployment rate consistent with a higher growth rate in GDP, and the impact of the additional weight placed on the adverse scenarios in the first quarter of 2023, reflecting elevated recession risks due to high inflation and tightening financial conditions.
The allowance for credit losses also reflected a reduction of $587 million as a result of the adoption of changes to the TDR accounting guidance on January 1, 2023. Refer to Note 1 for further information.
The Firm's allowance for credit losses is estimated using a weighted average of five internally developed macroeconomic scenarios. The adverse scenarios incorporate more punitive macroeconomic factors than the central case assumptions provided in the table below, resulting in a weighted average U.S. unemployment rate peaking at 5.5% in the fourth quarter of 2024, and a weighted average U.S. real GDP level that is 1.5% lower than the central case at the end of the second quarter of 2025.
The following table presents the Firm’s central case assumptions for the periods presented:
| Central case assumptions at December 31, 2023 | |||||||||||
| 2Q24 | 4Q24 | 2Q25 | |||||||||
U.S. unemployment rate(a) | 4.1 | % | 4.4 | % | 4.1 | % | |||||
YoY growth in U.S. real GDP(b) | 1.8 | % | 0.7 | % | 1.0 | % | |||||
| Central case assumptions at December 31, 2022 | |||||||||||
| 2Q23 | 4Q23 | 2Q24 | |||||||||
U.S. unemployment rate(a) | 3.8 | % | 4.3 | % | 5.0 | % | |||||
YoY growth in U.S. real GDP(b) | 1.5 | % | 0.4 | % | — | % | |||||
(a)Reflects quarterly average of forecasted U.S. unemployment rate.
(b)The year over year growth in U.S. real GDP in the forecast horizon of the central scenario is calculated as the percentage change in U.S. real GDP levels from the prior year.
Subsequent changes to this forecast and related estimates
will be reflected in the provision for credit losses in future
periods.
Refer to Critical Accounting Estimates Used by the Firm on pages 155–158 for further information on the allowance for credit losses and related management judgments.
Refer to Consumer Credit Portfolio on pages 114–119, Wholesale Credit Portfolio on pages 120–130 for additional information on the consumer and wholesale credit portfolios.
260 | JPMorgan Chase & Co./2023 Form 10-K | |||||||
Note 14 – Variable interest entities
Refer to Note 1 on page 171 for a further description of the Firm’s accounting policies regarding consolidation of and involvement with VIEs.
The following table summarizes the most significant types of Firm-sponsored VIEs by business segment. The Firm considers a “Firm-sponsored” VIE to include any entity where: (1) JPMorgan Chase is the primary beneficiary of the structure; (2) the VIE is used by JPMorgan Chase to securitize Firm assets; (3) the VIE issues financial instruments with the JPMorgan Chase name; or (4) the entity is a JPMorgan Chase–administered asset-backed commercial paper conduit.
| Line of Business | Transaction Type | Activity | 2023 Form 10-K page references | ||||||||
| CCB | Credit card securitization trusts | Securitization of originated credit card receivables | pages 261–262 | ||||||||
| Mortgage securitization trusts | Servicing and securitization of both originated and purchased residential mortgages | pages 262–264 | |||||||||
| CIB | Mortgage and other securitization trusts | Securitization of both originated and purchased residential and commercial mortgages, and other consumer loans | pages 262–264 | ||||||||
| Multi-seller conduits | Assisting clients in accessing the financial markets in a cost-efficient manner and structuring transactions to meet investor needs | page 264 | |||||||||
| Municipal bond vehicles | Financing of municipal bond investments | pages 264–265 | |||||||||
The Firm’s other business segments are also involved with VIEs (both third-party and Firm-sponsored), but to a lesser extent, as follows:
•Asset & Wealth Management: AWM sponsors and manages certain funds that are deemed VIEs. As asset manager of the funds, AWM earns a fee based on assets managed; the fee varies with each fund’s investment objective and is competitively priced. For fund entities that qualify as VIEs, AWM’s interests are, in certain cases, considered to be significant variable interests that result in consolidation of the financial results of these entities.
•Commercial Banking: CB provides financing and lending-related services to a wide spectrum of clients, including certain third-party-sponsored entities that may meet the definition of a VIE. CB does not control the activities of these entities and does not consolidate these entities. CB’s maximum loss exposure, regardless of whether the entity is a VIE, is generally limited to loans and lending-related commitments which are reported and disclosed in the same manner as any other third-party transaction.
•Corporate: Corporate is involved with entities that may meet the definition of VIEs; however these entities are generally subject to specialized investment company accounting, which does not require the consolidation of investments, including VIEs. In addition, Treasury and CIO invest in securities generally issued by third parties which may meet the definition of VIEs (e.g., issuers of asset-backed securities). In general, the Firm does not have the power to direct the significant activities of these entities and therefore does not consolidate these entities. Refer to Note 10 for further information on the Firm’s investment securities portfolio.
In addition, CIB also invests in and provides financing and other services to VIEs sponsored by third parties. Refer to page 266 of this Note for more information on the VIEs sponsored by third parties.
Significant Firm-sponsored VIEs
Credit card securitizations
CCB’s Card Services business may securitize originated credit card loans, primarily through the Chase Issuance Trust (the “Trust”). The Firm’s continuing involvement in credit card securitizations includes servicing the receivables, retaining an undivided seller’s interest in the receivables, retaining certain senior and subordinated securities and maintaining escrow accounts.
The Firm consolidates the assets and liabilities of its sponsored credit card trusts as it is considered to be the primary beneficiary of these securitization trusts based on the Firm’s ability to direct the activities of these VIEs through its servicing responsibilities and other duties, including making decisions as to the receivables that are transferred into those trusts and as to any related modifications and workouts. Additionally, the nature and extent of the Firm’s other continuing involvement with the
trusts, as indicated above, obligates the Firm to absorb losses and gives the Firm the right to receive certain benefits from these VIEs that could potentially be significant.
The underlying securitized credit card receivables and other assets of the securitization trusts are available only for payment of the beneficial interests issued by the securitization trusts; they are not available to pay the Firm’s other obligations or the claims of the Firm’s creditors.
The agreements with the credit card securitization trusts require the Firm to maintain a minimum undivided interest in the credit card trusts (generally 5 %). As of December 31, 2023 and 2022, the Firm held undivided interests in Firm-sponsored credit card securitization trusts of $4.9 billion and $6.1 billion, respectively. The Firm maintained an average undivided interest in principal receivables owned by those trusts of approximately 65 %
JPMorgan Chase & Co./2023 Form 10-K | 261 | |||||||
Notes to consolidated financial statements
and 62 % for the years ended December 31, 2023 and 2022, respectively. The Firm did no 1.5
Firm-sponsored mortgage and other securitization trusts
The Firm securitizes (or has securitized) originated and purchased residential mortgages, commercial mortgages and other consumer loans primarily in its CCB and CIB businesses. Depending on the particular transaction, as well as the respective business involved, the Firm may act as the servicer of the loans and/or retain certain beneficial interests in the securitization trusts.
The following tables present the total unpaid principal amount of assets held in Firm-sponsored private-label securitization entities, including those in which the Firm has continuing involvement, and those that are consolidated by the Firm. Continuing involvement includes servicing the loans, holding senior interests or subordinated interests (including amounts required to be held pursuant to credit risk retention rules), recourse or guarantee arrangements, and derivative contracts. In certain instances, the Firm’s only continuing involvement is servicing the loans. The Firm’s maximum loss exposure from retained and purchased interests is the carrying value of these interests.
| Principal amount outstanding | JPMorgan Chase interest in securitized assets in nonconsolidated VIEs(c)(d)(e) | |||||||||||||||||||||||||
| December 31, 2023 (in millions) | Total assets held by securitization VIEs | Assets held in consolidated securitization VIEs | Assets held in nonconsolidated securitization VIEs with continuing involvement | Trading assets | Investment securities | Other financial assets | Total interests held by JPMorgan Chase | |||||||||||||||||||
Securitization-related(a) | ||||||||||||||||||||||||||
| Residential mortgage: | ||||||||||||||||||||||||||
| Prime/Alt-A and option ARMs | $ | $ | $ | $ | $ | $ | $ | |||||||||||||||||||
| Subprime | ||||||||||||||||||||||||||
Commercial and other(b) | ||||||||||||||||||||||||||
| Total | $ | $ | $ | $ | $ | $ | $ | |||||||||||||||||||
| Principal amount outstanding | JPMorgan Chase interest in securitized assets in nonconsolidated VIEs(c)(d)(e) | |||||||||||||||||||||||||
| December 31, 2022 (in millions) | Total assets held by securitization VIEs | Assets held in consolidated securitization VIEs | Assets held in nonconsolidated securitization VIEs with continuing involvement | Trading assets | Investment securities | Other financial assets | Total interests held by JPMorgan Chase | |||||||||||||||||||
Securitization-related(a) | ||||||||||||||||||||||||||
| Residential mortgage: | ||||||||||||||||||||||||||
| Prime/Alt-A and option ARMs | $ | $ | $ | $ | $ | $ | $ | |||||||||||||||||||
| Subprime | ||||||||||||||||||||||||||
Commercial and other(b) | ||||||||||||||||||||||||||
| Total | $ | $ | $ | $ | $ | $ | $ | |||||||||||||||||||
(a)Excludes U.S. GSEs and government agency securitizations and re-securitizations, which are not Firm-sponsored.
(b)Consists of securities backed by commercial real estate loans and non-mortgage-related consumer receivables.
(c)Excludes the following: retained servicing; securities retained from loan sales and securitization activity related to U.S. GSEs and government agencies; interest rate and foreign exchange derivatives primarily used to manage interest rate and foreign exchange risks of securitization entities; senior securities of $52 million and $134 million at December 31, 2023 and 2022, respectively, and subordinated securities were not material for both December 31, 2023 and 2022, which the Firm purchased in connection with CIB’s secondary market-making activities.
(d)Includes interests held in re-securitization transactions.
(e)As of December 31, 2023 and 2022, 77 % and 84 %, respectively, of the Firm’s retained securitization interests, which are predominantly carried at fair value and include amounts required to be held pursuant to credit risk retention rules, were risk-rated “A” or better, on an S&P-equivalent basis. The retained interests in prime residential mortgages consisted of $2.5 billion and $2.6 billion of investment-grade retained interests at December 31, 2023 and 2022, respectively, and $88 million and $27 million of noninvestment-grade retained interests at December 31, 2023 and 2022, respectively. The retained interests in commercial and other securitization trusts consisted of $6.1 billion and $5.8 billion of investment-grade retained interests, and $1.7 billion and $1.1 billion of noninvestment-grade retained interests at December 31, 2023 and 2022, respectively.
262 | JPMorgan Chase & Co./2023 Form 10-K | |||||||
Residential mortgage
The Firm securitizes residential mortgage loans originated by CCB, as well as residential mortgage loans purchased from third parties by either CCB or CIB. CCB generally retains servicing for all residential mortgage loans it originated or purchased, and for certain mortgage loans purchased by CIB. For securitizations of loans serviced by CCB, the Firm has the power to direct the significant activities of the VIE because it is responsible for decisions related to loan modifications and workouts. CCB may also retain an interest upon securitization.
In addition, CIB engages in underwriting and trading activities involving securities issued by Firm-sponsored securitization trusts. As a result, CIB at times retains senior and/or subordinated interests (including residual interests and amounts required to be held pursuant to credit risk retention rules) in residential mortgage securitizations at the time of securitization, and/or reacquires positions in the secondary market in the normal course of business. In certain instances, as a result of the positions retained or reacquired by CIB or held by Treasury and CIO or CCB, when considered together with the servicing arrangements entered into by CCB, the Firm is deemed to be the primary beneficiary of certain securitization trusts.
The Firm does not consolidate residential mortgage securitizations (Firm-sponsored or third-party-sponsored) when it is not the servicer (and therefore does not have the power to direct the most significant activities of the trust) or does not hold a beneficial interest in the trust that could potentially be significant to the trust.
Commercial mortgages and other consumer securitizations
CIB originates and securitizes commercial mortgage loans, and engages in underwriting and trading activities involving the securities issued by securitization trusts. CIB may retain unsold senior and/or subordinated interests (including amounts required to be held pursuant to credit risk retention rules) in commercial mortgage securitizations at the time of securitization but, generally, the Firm does not service commercial loan securitizations. Treasury and CIO may choose to invest in these securitizations as well. For commercial mortgage securitizations the power to direct the significant activities of the VIE generally is held by the servicer or investors in a specified class of securities (“controlling class”). The Firm generally does not retain an interest in the controlling class in its sponsored commercial mortgage securitization transactions.
Re-securitizations
The Firm engages in certain re-securitization transactions in which debt securities are transferred to a VIE in exchange for new beneficial interests. These transfers occur in connection with both U.S. GSEs and government agency sponsored VIEs, which are backed by residential mortgages. The Firm’s consolidation analysis is largely dependent on the Firm’s role and interest in the re-securitization trusts.
The following table presents the principal amount of securities transferred to re-securitization VIEs.
| Year ended December 31, (in millions) | 2023 | 2022 | 2021 | ||||||||||||||
Transfers of securities to VIEs | |||||||||||||||||
| U.S. GSEs and government agencies | $ | $ | $ | ||||||||||||||
Most re-securitizations with which the Firm is involved are client-driven transactions in which a specific client or group of clients is seeking a specific return or risk profile. For these transactions, the Firm has concluded that the decision-making power of the entity is shared between the Firm and its clients, considering the joint effort and decisions in establishing the re-securitization trust and its assets, as well as the significant economic interest the client holds in the re-securitization trust; therefore the Firm does not consolidate the re-securitization VIE.
The Firm did no
Additionally, the Firm may invest in beneficial interests of third-party-sponsored re-securitizations and generally purchases these interests in the secondary market. In these circumstances, the Firm does not have the unilateral ability to direct the most significant activities of the re-securitization trust, either because it was not involved in the initial design of the trust, or the Firm was involved with an independent third-party sponsor and demonstrated shared power over the creation of the trust; therefore, the Firm does not consolidate the re-securitization VIE.
JPMorgan Chase & Co./2023 Form 10-K | 263 | |||||||
Notes to consolidated financial statements
The following table presents information on the Firm's interests in nonconsolidated re-securitization VIEs.
| Nonconsolidated re-securitization VIEs | |||||||||||
| December 31, (in millions) | 2023 | 2022 | |||||||||
U.S. GSEs and government agencies | |||||||||||
Interest in VIEs | $ | $ | |||||||||
As of December 31, 2023 and 2022, the Firm did not consolidate any U.S. GSE and government agency re-securitization VIEs or any Firm-sponsored private-label re-securitization VIEs.
Multi-seller conduits
Multi-seller conduit entities are separate bankruptcy remote entities that provide secured financing, collateralized by pools of receivables and other financial assets, to customers of the Firm. The conduits fund their financing facilities through the issuance of highly rated commercial paper. The primary source of repayment of the commercial paper is the cash flows from the pools of assets. In most instances, the assets are structured with deal-specific credit enhancements provided to the conduits by the customers (i.e., sellers) or other third parties. Deal-specific credit enhancements are generally structured to cover a multiple of historical losses expected on the pool of assets, and are typically in the form of overcollateralization provided by the seller. The deal-specific credit enhancements mitigate the Firm’s potential losses on its agreements with the conduits.
To ensure timely repayment of the commercial paper, and to provide the conduits with funding to provide financing to customers in the event that the conduits do not obtain funding in the commercial paper market, each asset pool financed by the conduits has a minimum 100% deal-specific liquidity facility associated with it provided by JPMorgan Chase Bank, N.A. JPMorgan Chase Bank, N.A. also provides the multi-seller conduit vehicles with uncommitted program-wide liquidity facilities and program-wide credit enhancement in the form of standby letters of credit. The amount of program-wide credit enhancement required is based upon commercial paper issuance and approximates 10 % of the outstanding balance of commercial paper.
The Firm consolidates its Firm-administered multi-seller conduits, as the Firm has both the power to direct the significant activities of the conduits and a potentially significant economic interest in the conduits. As administrative agent and in its role in structuring transactions, the Firm makes decisions regarding asset types and credit quality, and manages the commercial paper funding needs of the conduits. The Firm’s interests that could potentially be significant to the VIEs include the fees received as administrative agent and liquidity and program-wide credit enhancement provider, as well as the potential exposure created by the liquidity and credit enhancement facilities provided to the conduits.
In the normal course of business, JPMorgan Chase makes markets in and invests in commercial paper issued by the Firm-administered multi-seller conduits. The Firm held $9.8 billion and $13.8 billion of the commercial paper issued by the Firm-administered multi-seller conduits at December 31, 2023 and 2022, respectively, which have been eliminated in consolidation. The Firm’s investments reflect the Firm’s funding needs and capacity and were not driven by market illiquidity. Other than the amounts required to be held pursuant to credit risk retention rules, the Firm is not obligated under any agreement to purchase the commercial paper issued by the Firm-administered multi-seller conduits.
Deal-specific liquidity facilities, program-wide liquidity and credit enhancement provided by the Firm have been eliminated in consolidation. The Firm or the Firm-administered multi-seller conduits provide lending-related commitments to certain clients of the Firm-administered multi-seller conduits. The unfunded commitments were $10.8 billion and $10.6 billion at December 31, 2023 and 2022, respectively, and are reported as off-balance sheet lending-related commitments in other unfunded commitments to extend credit. Refer to Note 28 for more information on off-balance sheet lending-related commitments.
Municipal bond vehicles
Municipal bond vehicles or tender option bond (“TOB”) trusts allow institutions to finance their municipal bond investments at short-term rates. In a typical TOB transaction, the trust purchases highly rated municipal bond(s) of a single issuer and funds the purchase by issuing two types of securities: (1) puttable floating-rate certificates (“floaters”) and (2) inverse floating-rate residual interests (“residuals”). The floaters are typically purchased by money market funds or other short-term investors and may be tendered, with requisite notice, to the TOB trust. The residuals are retained by the investor seeking to finance its municipal bond investment. TOB transactions where the residual is held by a third-party investor are typically known as customer TOB trusts, and non-customer TOB trusts are transactions where the Residual is retained by the Firm. Customer TOB trusts are sponsored by a third party. The Firm serves as sponsor for all non-customer TOB transactions. The Firm may provide various services to a TOB trust, including remarketing agent, liquidity or tender option provider, and/or sponsor.
J.P. Morgan Securities LLC may serve as a remarketing agent on the floaters for TOB trusts. The remarketing agent is responsible for establishing the periodic variable rate on the floaters, conducting the initial placement and remarketing tendered floaters. The remarketing agent may, but is not obligated to, make markets in floaters. Floaters held by the Firm were not material during 2023 and 2022.
JPMorgan Chase Bank, N.A. or J.P. Morgan Securities LLC often serves as the sole liquidity or tender option provider for the TOB trusts. The liquidity provider’s obligation to perform is conditional and is limited by certain events
264 | JPMorgan Chase & Co./2023 Form 10-K | |||||||
(“Termination Events”), which include bankruptcy or failure to pay by the municipal bond issuer or credit enhancement provider, an event of taxability on the municipal bonds or the immediate downgrade of the municipal bond to below investment grade. In addition, the liquidity provider’s exposure is typically further limited by the high credit quality of the underlying municipal bonds, the excess collateralization in the vehicle, or, in certain transactions, the reimbursement agreements with the Residual holders.
Holders of the floaters may “put,” or tender, their floaters to the TOB trust. If the remarketing agent cannot successfully remarket the floaters to another investor, the
liquidity provider either provides a loan to the TOB trust for the TOB trust’s purchase of the floaters, or it directly purchases the tendered floaters.
TOB trusts are considered to be variable interest entities. The Firm consolidates non-customer TOB trusts because as the Residual holder, the Firm has the right to make decisions that significantly impact the economic performance of the municipal bond vehicle, and it has the right to receive benefits and bear losses that could potentially be significant to the municipal bond vehicle.
Consolidated VIE assets and liabilities
The following table presents information on assets and liabilities related to VIEs consolidated by the Firm as of December 31, 2023 and 2022.
| Assets | Liabilities | ||||||||||||||||||||||||||||
| December 31, 2023 (in millions) | Trading assets | Loans | Other(b) | Total assets(c) | Beneficial interests in VIE assets(d) | Other(e) | Total liabilities | ||||||||||||||||||||||
| VIE program type | |||||||||||||||||||||||||||||
| Firm-sponsored credit card trusts | $ | $ | $ | $ | $ | $ | $ | ||||||||||||||||||||||
| Firm-administered multi-seller conduits | |||||||||||||||||||||||||||||
| Municipal bond vehicles | |||||||||||||||||||||||||||||
Mortgage securitization entities(a) | |||||||||||||||||||||||||||||
| Other | |||||||||||||||||||||||||||||
| Total | $ | $ | $ | $ | $ | $ | $ | ||||||||||||||||||||||
| Assets | Liabilities | ||||||||||||||||||||||||||||
| December 31, 2022 (in millions) | Trading assets | Loans | Other(b) | Total assets(c) | Beneficial interests in VIE assets(d) | Other(e) | Total liabilities | ||||||||||||||||||||||
| VIE program type | |||||||||||||||||||||||||||||
| Firm-sponsored credit card trusts | $ | $ | $ | $ | $ | $ | $ | ||||||||||||||||||||||
| Firm-administered multi-seller conduits | |||||||||||||||||||||||||||||
| Municipal bond vehicles | |||||||||||||||||||||||||||||
Mortgage securitization entities(a) | |||||||||||||||||||||||||||||
| Other | (f) | ||||||||||||||||||||||||||||
| Total | $ | $ | $ | $ | $ | $ | $ | ||||||||||||||||||||||
(a)Includes residential mortgage securitizations.
(b)Includes assets classified as cash and other assets on the Consolidated balance sheets.
(c)The assets of the consolidated VIEs included in the program types above are used to settle the liabilities of those entities. The assets and liabilities include third-party assets and liabilities of consolidated VIEs and exclude intercompany balances that eliminate in consolidation.
(d)The interest-bearing beneficial interest liabilities issued by consolidated VIEs are classified in the line item on the Consolidated balance sheets titled, “Beneficial interests issued by consolidated VIEs”. The holders of these beneficial interests generally do not have recourse to the general credit of JPMorgan Chase. Included in beneficial interests in VIE assets are long-term beneficial interests of $3.1 billion and $2.1 billion at December 31, 2023 and 2022, respectively.
(e)Includes liabilities classified as accounts payable and other liabilities on the Consolidated balance sheets.
(f)Primarily includes purchased supply chain finance receivables and purchased auto loan securitizations in CIB.
JPMorgan Chase & Co./2023 Form 10-K | 265 | |||||||
Notes to consolidated financial statements
VIEs sponsored by third parties
The Firm enters into transactions with VIEs structured by other parties. These include, for example, acting as a derivative counterparty, liquidity provider, investor, underwriter, placement agent, remarketing agent, trustee or custodian. These transactions are conducted at arm’s-length, and individual credit decisions are based on the analysis of the specific VIE, taking into consideration the quality of the underlying assets. Where the Firm does not have the power to direct the activities of the VIE that most significantly impact the VIE’s economic performance, or a variable interest that could potentially be significant, the Firm generally does not consolidate the VIE, but it records and reports these positions on its Consolidated balance sheets in the same manner it would record and report positions in respect of any other third-party transaction.
Tax credit vehicles
The Firm holds investments in unconsolidated tax credit vehicles, which are limited partnerships and similar entities that own and operate affordable housing, energy, and other projects. These entities are primarily considered VIEs. A third party is typically the general partner or managing member and has control over the significant activities of the tax credit vehicles, and accordingly the Firm does not consolidate tax credit vehicles. The Firm generally invests in these partnerships as a limited partner and earns a return primarily through the receipt of tax credits allocated to the projects. The maximum loss exposure, represented by equity investments and funding commitments, was $35.1 billion and $30.2 billion, of which $14.7 billion and $10.6 billion was unfunded at December 31, 2023 and 2022, respectively. The Firm assesses each project and to reduce the risk of loss, may withhold varying amounts of its capital investment until the project qualifies for tax credits. Refer to Note 25 for further information on affordable housing tax credits and Note 28 for more information on off-balance sheet lending-related commitments.
Customer municipal bond vehicles (TOB trusts)
The Firm may provide various services to customer TOB trusts, including remarketing agent, liquidity or tender option provider. In certain customer TOB transactions, the Firm, as liquidity provider, has entered into a reimbursement agreement with the Residual holder. In those transactions, upon the termination of the vehicle, the Firm has recourse to the third-party Residual holders for any shortfall. The Firm does not have any intent to protect Residual holders from potential losses on any of the underlying municipal bonds. The Firm does not consolidate customer TOB trusts, since the Firm does not have the power to make decisions that significantly impact the economic performance of the municipal bond vehicle.
The Firm’s maximum exposure as a liquidity provider to customer TOB trusts at December 31, 2023 and 2022, was $5.1 billion and $5.8 billion, respectively. The fair value of assets held by such VIEs at December 31, 2023 and 2022 was $7.3 billion and $8.2 billion respectively.
Loan securitizations
The Firm has securitized and sold a variety of loans, including residential mortgages, credit card receivables, commercial mortgages and other consumer loans. The purposes of these securitization transactions were to satisfy investor demand and to generate liquidity for the Firm.
For loan securitizations in which the Firm is not required to consolidate the trust, the Firm records the transfer of the loan receivable to the trust as a sale when all of the following accounting criteria for a sale are met: (1) the transferred financial assets are legally isolated from the Firm’s creditors; (2) the transferee or beneficial interest holder can pledge or exchange the transferred financial assets; and (3) the Firm does not maintain effective control over the transferred financial assets (e.g., the Firm cannot repurchase the transferred assets before their maturity and it does not have the ability to unilaterally cause the holder to return the transferred assets).
For loan securitizations accounted for as a sale, the Firm recognizes a gain or loss based on the difference between the value of proceeds received (including cash, beneficial interests, or servicing assets received) and the carrying value of the assets sold. Gains and losses on securitizations are reported in noninterest revenue.
266 | JPMorgan Chase & Co./2023 Form 10-K | |||||||
Securitization activity
The following table provides information related to the Firm’s securitization activities for the years ended December 31, 2023, 2022 and 2021, related to assets held in Firm-sponsored securitization entities that were not consolidated by the Firm, and where sale accounting was achieved at the time of the securitization.
| 2023 | 2022 | 2021 | ||||||||||||||||||||||||
| Year ended December 31, (in millions) | Residential mortgage(d) | Commercial and other(e) | Residential mortgage(d) | Commercial and other(e) | Residential mortgage(d) | Commercial and other(e) | ||||||||||||||||||||
| Principal securitized | $ | $ | $ | $ | $ | $ | ||||||||||||||||||||
All cash flows during the period:(a) | ||||||||||||||||||||||||||
Proceeds received from loan sales as financial instruments(b)(c) | $ | $ | $ | $ | $ | $ | ||||||||||||||||||||
| Servicing fees collected | ||||||||||||||||||||||||||
Cash flows received on interests | ||||||||||||||||||||||||||
(a)Excludes re-securitization transactions.
(b)Predominantly includes Level 2 assets.
(c)The carrying value of the loans accounted for at fair value approximated the proceeds received upon loan sale.
(d)Represents prime mortgages. Excludes loan securitization activity related to U.S. GSEs and government agencies.
(e)Includes commercial mortgage and other consumer loans.
Key assumptions used to value retained interests originated during the year are shown in the table below.
| Year ended December 31, | 2023 | 2022 | 2021 | |||||||||||||||||
| Residential mortgage retained interest: | ||||||||||||||||||||
| Weighted-average life (in years) | ||||||||||||||||||||
| Weighted-average discount rate | % | % | % | |||||||||||||||||
| Commercial mortgage retained interest: | ||||||||||||||||||||
| Weighted-average life (in years) | ||||||||||||||||||||
| Weighted-average discount rate | % | % | % | |||||||||||||||||
Loans and excess MSRs sold to U.S. government-sponsored enterprises and loans in securitization transactions pursuant to Ginnie Mae guidelines
In addition to the amounts reported in the securitization activity tables above, the Firm, in the normal course of business, sells originated and purchased mortgage loans and certain originated excess MSRs on a nonrecourse basis, predominantly to U.S. GSEs. These loans and excess MSRs are sold primarily for the purpose of securitization by the U.S. GSEs, who provide certain guarantee provisions (e.g., credit enhancement of the loans). The Firm also sells loans into securitization transactions pursuant to Ginnie Mae guidelines; these loans are typically insured or guaranteed by another U.S. government agency. The Firm does not consolidate the securitization vehicles underlying these transactions as it is not the primary beneficiary. For a limited number of loan sales, the Firm is obligated to share a portion of the credit risk associated with the sold loans with the purchaser. Refer to Note 28 for additional information about the Firm’s loan sales- and securitization-related indemnifications and Note 15 for additional information about the impact of the Firm’s sale of certain excess MSRs.
JPMorgan Chase & Co./2023 Form 10-K | 267 | |||||||
Notes to consolidated financial statements
The following table summarizes the activities related to loans sold to the U.S. GSEs, and loans in securitization transactions pursuant to Ginnie Mae guidelines.
| Year ended December 31, (in millions) | 2023 | 2022 | 2021 | ||||||||
| Carrying value of loans sold | $ | $ | $ | ||||||||
Proceeds received from loan sales as cash | $ | $ | $ | ||||||||
Proceeds from loan sales as securities(a)(b) | |||||||||||
Total proceeds received from loan sales(c) | $ | $ | $ | ||||||||
Gains/(losses) on loan sales(d)(e) | $ | $ | ( | $ | |||||||
(a)Includes securities from U.S. GSEs and Ginnie Mae that are generally sold shortly after receipt or retained as part of the Firm’s investment securities portfolio.
(b)Included in level 2 assets.
(c)Excludes the value of MSRs retained upon the sale of loans.
(d)Gains/(losses) on loan sales include the value of MSRs.
(e)The carrying value of the loans accounted for at fair value approximated the proceeds received upon loan sale.
Options to repurchase delinquent loans
In addition to the Firm’s obligation to repurchase certain loans due to material breaches of representations and warranties as discussed in Note 28, the Firm also has the option to repurchase delinquent loans that it services for Ginnie Mae loan pools, as well as for other U.S. government agencies under certain arrangements. The Firm typically
elects to repurchase delinquent loans from Ginnie Mae loan pools as it continues to service them and/or manage the foreclosure process in accordance with the applicable requirements, and such loans continue to be insured or guaranteed. When the Firm’s repurchase option becomes exercisable, such loans must be reported on the Consolidated balance sheets as a loan with a corresponding liability. Refer to Note 12 for additional information.
The following table presents loans the Firm repurchased or had an option to repurchase, real estate owned, and foreclosed government-guaranteed residential mortgage loans recognized on the Firm’s Consolidated balance sheets as of December 31, 2023 and 2022. Substantially all of the loans and real estate owned are insured or guaranteed by U.S. government agencies.
| December 31, (in millions) | 2023 | 2022 | ||||||
Loans repurchased or option to repurchase(a) | $ | $ | ||||||
Real estate owned | ||||||||
Foreclosed government-guaranteed residential mortgage loans(b) | ||||||||
(a)Predominantly all of these amounts relate to loans that have been repurchased from Ginnie Mae loan pools.
(b)Relates to voluntary repurchases of loans, which are included in accrued interest and accounts receivable.
Loan delinquencies and liquidation losses
The table below includes information about components of and delinquencies related to nonconsolidated securitized financial assets held in Firm-sponsored private-label securitization entities, in which the Firm has continuing involvement as of December 31, 2023 and 2022.
| As of or for the year ended December 31, (in millions) | Securitized assets | 90 days past due | Net liquidation losses / (recoveries) | ||||||||||||||||||||||||||
| 2023 | 2022 | 2023 | 2022 | 2023 | 2022 | ||||||||||||||||||||||||
| Securitized loans | |||||||||||||||||||||||||||||
| Residential mortgage: | |||||||||||||||||||||||||||||
| Prime/ Alt-A & option ARMs | $ | $ | $ | $ | $ | $ | ( | ||||||||||||||||||||||
| Subprime | ( | ||||||||||||||||||||||||||||
| Commercial and other | |||||||||||||||||||||||||||||
| Total loans securitized | $ | $ | $ | $ | $ | $ | |||||||||||||||||||||||
268 | JPMorgan Chase & Co./2023 Form 10-K | |||||||
Note 15 – Goodwill, mortgage servicing rights, and other intangible assets
Goodwill
Goodwill is recorded upon completion of a business combination as the difference between the purchase price and the fair value of the net assets acquired, and can be adjusted up to one year from the acquisition date as additional information pertaining to facts and circumstances that existed as of the acquisition date is obtained about the fair value of assets acquired and liabilities assumed. Subsequent to initial recognition, goodwill is not amortized but is tested for impairment during the fourth quarter of each fiscal year, or more often if events or circumstances, such as adverse changes in the business climate, indicate that there may be an impairment.
| December 31, (in millions) | 2023 | 2022 | 2021 | ||||||||
| Consumer & Community Banking | $ | $ | $ | ||||||||
| Corporate & Investment Bank | |||||||||||
| Commercial Banking | |||||||||||
| Asset & Wealth Management | |||||||||||
Corporate | |||||||||||
| Total goodwill | $ | $ | $ | ||||||||
The following table presents changes in the carrying amount of goodwill.
| Year ended December 31, (in millions) | 2023 | 2022 | 2021 | ||||||||
| Balance at beginning of period | $ | $ | $ | ||||||||
Changes during the period from: | |||||||||||
Business combinations(a) | |||||||||||
Other(b) | ( | ( | |||||||||
| Balance at December 31, | $ | $ | $ | ||||||||
(a)For 2023, predominantly represents estimated goodwill associated with the acquisition of the remaining 51 % interest in CIFM in AWM and the acquisition of Aumni Inc. in CIB. For 2022, represents estimated goodwill associated with the acquisitions of Global Shares PLC in AWM, Frosch Travel Group, LLC and Figg, Inc. in CCB, and Renovite Technologies, Inc. and Volkswagen Payments S.A. in CIB. For 2021, represents goodwill associated with the acquisitions of Nutmeg in Corporate, OpenInvest and Campbell Global in AWM, and Frank and The Infatuation in CCB.
(b)Predominantly foreign currency adjustments.
Goodwill impairment testing
The Firm’s goodwill was not impaired at December 31, 2023, 2022 and 2021.
The goodwill impairment test is generally performed by comparing the current fair value of each reporting unit with its carrying value. If the fair value is in excess of the carrying value, then the reporting unit’s goodwill is considered not to be impaired. If the fair value is less than the carrying value, then an impairment is recognized for the amount by which the reporting unit’s carrying value exceeds its fair value, up to the amount of goodwill allocated to that reporting unit.
The Firm uses the reporting units’ allocated capital plus goodwill and other intangible assets as a proxy for the carrying values of equity for the reporting units in the goodwill impairment testing. Reporting unit equity is determined on a similar basis as the allocation of capital to the LOBs which takes into consideration a variety of factors including capital levels of similarly rated peers and applicable regulatory capital requirements. LOB’s allocated capital levels are incorporated into the Firm’s annual budget process, which is reviewed by the Firm’s Board of Directors and Operating Committee. Allocated capital is further reviewed at least annually and updated as needed.
The primary method the Firm uses to estimate the fair value of its reporting units is the income approach. This approach projects cash flows for the forecast period and uses the perpetuity growth method to calculate terminal values. These cash flows and terminal values, which are based on the reporting units’ annual budgets and forecasts are then discounted using an appropriate discount rate. The discount rate used for each reporting unit represents an estimate of the cost of equity for that reporting unit and is determined considering the Firm’s overall estimated cost of equity (estimated using the Capital Asset Pricing Model), as adjusted for the risk characteristics specific to each reporting unit (for example, for higher levels of risk or uncertainty associated with the business or management’s forecasts and assumptions). To assess the reasonableness of the discount rates used for each reporting unit, management compares the discount rate to the estimated cost of equity for publicly traded institutions with similar businesses and risk characteristics. In addition, the weighted average cost of equity (aggregating the various reporting units) is compared with the Firm’s overall estimated cost of equity for reasonableness. The valuations derived from the discounted cash flow analysis are then compared with market-based trading and transaction multiples for relevant competitors. Trading and transaction comparables are used as general indicators to assess the overall reasonableness of the estimated fair values, although precise conclusions generally cannot be drawn due to the differences that naturally exist between the Firm’s businesses and competitor institutions.
The Firm also takes into consideration a comparison between the aggregate fair values of the Firm’s reporting
JPMorgan Chase & Co./2023 Form 10-K | 269 | |||||||
Notes to consolidated financial statements
units and JPMorgan Chase’s market capitalization. In evaluating this comparison, the Firm considers several factors, including (i) a control premium that would exist in a market transaction, (ii) factors related to the level of execution risk that would exist at the Firmwide level that do not exist at the reporting unit level and (iii) short-term market volatility and other factors that do not directly affect the value of individual reporting units.
Unanticipated declines in business performance, increases in credit losses, increases in capital requirements, as well as deterioration in economic or market conditions, adverse regulatory or legislative changes or increases in the estimated market cost of equity, could cause the estimated fair values of the Firm’s reporting units to decline in the future, which could result in a material impairment loss to earnings in a future period related to some portion of the associated goodwill.
Mortgage servicing rights
MSRs represent the fair value of expected future cash flows for performing servicing activities for others. The fair value considers estimated future servicing fees and ancillary revenue, offset by estimated costs to service the loans, and generally declines over time as net servicing cash flows are received, effectively amortizing the MSR asset against contractual servicing and ancillary fee income. MSRs are either purchased from third parties or recognized upon sale or securitization of mortgage loans if servicing is retained.
270 | JPMorgan Chase & Co./2023 Form 10-K | |||||||
The fair value of MSRs is sensitive to changes in interest rates, including their effect on prepayment speeds. MSRs typically decrease in value when interest rates decline because declining interest rates tend to increase prepayments and therefore reduce the expected life of the net servicing cash flows that comprise the MSR asset. Conversely, securities (e.g., mortgage-backed securities), and certain derivatives (e.g., those for which the Firm
receives fixed-rate interest payments) increase in value when interest rates decline. JPMorgan Chase uses combinations of derivatives and securities to manage the risk of changes in the fair value of MSRs. The intent is to offset any interest-rate related changes in the fair value of MSRs with changes in the fair value of the related risk management instruments.
The following table summarizes MSR activity for the years ended December 31, 2023, 2022 and 2021.
| As of or for the year ended December 31, (in millions, except where otherwise noted) | 2023 | 2022 | 2021 | ||||||||||||||
| Fair value at beginning of period | $ | $ | $ | ||||||||||||||
| MSR activity: | |||||||||||||||||
| Originations of MSRs | |||||||||||||||||
Purchase of MSRs(a) | |||||||||||||||||
Disposition of MSRs(b) | ( | ( | ( | ||||||||||||||
| Net additions/(dispositions) | |||||||||||||||||
Changes due to collection/realization of expected cash flows | ( | ( | ( | ||||||||||||||
| Changes in valuation due to inputs and assumptions: | |||||||||||||||||
Changes due to market interest rates and other(c) | |||||||||||||||||
| Changes in valuation due to other inputs and assumptions: | |||||||||||||||||
Projected cash flows (e.g., cost to service) | ( | ||||||||||||||||
Discount rates | |||||||||||||||||
Prepayment model changes and other(d) | ( | ||||||||||||||||
| Total changes in valuation due to other inputs and assumptions | ( | ||||||||||||||||
| Total changes in valuation due to inputs and assumptions | |||||||||||||||||
| Fair value at December 31, | $ | $ | $ | ||||||||||||||
Change in unrealized gains/(losses) included in income related to MSRs held at December 31, | $ | $ | $ | ||||||||||||||
| Third-party mortgage loans serviced at December 31, (in billions) | |||||||||||||||||
Servicer advances, net of an allowance for uncollectible amounts, at December 31(e) | |||||||||||||||||
(a)Includes purchase price adjustments associated with MSRs purchased, primarily as a result of loans that prepaid within 90 days of settlement, allowing the Firm to recover the purchase price.
(b)Includes excess MSRs transferred to agency-sponsored trusts in exchange for stripped mortgage-backed securities (“SMBS”). In each transaction, a portion of the SMBS was acquired by third parties at the transaction date; the Firm acquired the remaining balance of those SMBS as trading securities.
(c)Represents both the impact of changes in estimated future prepayments due to changes in market interest rates, and the difference between actual and expected prepayments.
(d)Represents changes in prepayments other than those attributable to changes in market interest rates.
(e)Represents amounts the Firm pays as the servicer (e.g., scheduled principal and interest, taxes and insurance), which will generally be reimbursed within a short period of time after the advance from future cash flows from the trust or the underlying loans. The Firm’s credit risk associated with these servicer advances is minimal because reimbursement of the advances is typically senior to all cash payments to investors. In addition, the Firm maintains the right to stop payment to investors if the collateral is insufficient to cover the advance. However, certain of these servicer advances may not be recoverable if they were not made in accordance with applicable rules and agreements.
JPMorgan Chase & Co./2023 Form 10-K | 271 | |||||||
Notes to consolidated financial statements
The following table presents the components of mortgage fees and related income (including the impact of MSR risk management activities) for the years ended December 31, 2023, 2022 and 2021.
| Year ended December 31, (in millions) | 2023 | 2022 | 2021 | ||||||||||||||
CCB mortgage fees and related income | |||||||||||||||||
| Production revenue | $ | $ | $ | ||||||||||||||
| Net mortgage servicing revenue: | |||||||||||||||||
| Operating revenue: | |||||||||||||||||
| Loan servicing revenue | |||||||||||||||||
Changes in MSR asset fair value due to collection/realization of expected cash flows | ( | ( | ( | ||||||||||||||
| Total operating revenue | |||||||||||||||||
| Risk management: | |||||||||||||||||
Changes in MSR asset fair value due to market interest rates and other(a) | |||||||||||||||||
Other changes in MSR asset fair value due to other inputs and assumptions in model(b) | ( | ||||||||||||||||
Change in derivative fair value and other | ( | ( | ( | ||||||||||||||
| Total risk management | ( | ||||||||||||||||
| Total net mortgage servicing revenue | ( | ||||||||||||||||
| Total CCB mortgage fees and related income | |||||||||||||||||
| All other | |||||||||||||||||
Mortgage fees and related income | $ | $ | $ | ||||||||||||||
(a)Represents both the impact of changes in estimated future prepayments due to changes in market interest rates, and the difference between actual and expected prepayments.
(b)Represents the aggregate impact of changes in model inputs and assumptions such as projected cash flows (e.g., cost to service), discount rates and changes in prepayments other than those attributable to changes in market interest rates (e.g., changes in prepayments due to changes in home prices).
Changes in fair value based on variations in assumptions generally cannot be easily extrapolated, because the relationship of the change in the assumptions to the change in fair value are often highly interrelated and may not be linear. In the following table, the effect that a change in a particular assumption may have on the fair value is calculated without changing any other assumption. In reality, changes in one factor may result in changes in another, which would either magnify or counteract the impact of the initial change.
The table below outlines the key economic assumptions used to determine the fair value of the Firm’s MSRs at December 31, 2023 and 2022, and outlines the sensitivities of those fair values to immediate adverse changes in those assumptions, as defined below.
| December 31, (in millions, except rates) | 2023 | 2022 | |||||||||
Weighted-average prepayment speed assumption (constant prepayment rate) | % | % | |||||||||
Impact on fair value of 10% adverse change | $ | ( | $ | ( | |||||||
Impact on fair value of 20% adverse change | ( | ( | |||||||||
Weighted-average option adjusted spread(a) | % | % | |||||||||
Impact on fair value of 100 basis points adverse change | $ | ( | $ | ( | |||||||
Impact on fair value of 200 basis points adverse change | ( | ( | |||||||||
(a)Includes the impact of operational risk and regulatory capital.
272 | JPMorgan Chase & Co./2023 Form 10-K | |||||||
Other intangible assets
The Firm’s finite-lived and indefinite-lived other intangible assets are initially recorded at their fair value primarily upon completion of a business combination. Subsequently, the Firm’s finite-lived intangible assets, including core deposit intangibles, customer relationship intangibles, and certain other intangible assets, are amortized over their useful lives, estimated based on the expected future economic benefits to the Firm of the intangible asset. The Firm’s intangible assets with indefinite lives, such as asset management contracts, are not subject to amortization and are assessed periodically for impairment.
As of December 31, 2023 and 2022, the gross carrying values of other intangible assets were $4.2 billion and $1.9 billion, respectively, and the accumulated amortization was $994 million and $679 million, respectively.
As of December 31, 2023 and 2022, the net carrying values consist of finite-lived intangible assets of $2.0 billion and $707 million, respectively, as well as indefinite-lived intangible assets, which are not subject to amortization, of $1.2 billion and $517 million, respectively.
As of December 31, 2023, other intangible assets reflected core deposit and certain wealth management customer relationship intangibles related to the First Republic acquisition, and asset management contracts related to the Firm’s acquisition of the remaining 51 % interest in CIFM. Refer to Note 34 for additional information on the First Republic acquisition.
As of December 31, 2023 and 2022, amortization expense was $315 million and $145 million, respectively.
The following table presents estimated future amortization expense.
| December 31, (millions) | Finite-lived intangible assets | ||||
| 2024 | $ | ||||
| 2025 | |||||
| 2026 | |||||
| 2027 | |||||
| 2028 | |||||
Impairment testing
The Firm’s finite-lived and indefinite-lived other intangible assets are assessed for impairment annually or more often if events or changes in circumstances indicate that the asset might be impaired. Once the Firm determines that an impairment exists for an intangible asset, the impairment is recognized in other expense.
JPMorgan Chase & Co./2023 Form 10-K | 273 | |||||||
Notes to consolidated financial statements
Note 16 – Premises and equipment
The following table presents certain components of Premises and equipment.
| December 31, (in millions) | 2023 | 2022 | ||||||||||||
Land, buildings and leasehold improvements | $ | $ | ||||||||||||
Right-of-use assets(a) | ||||||||||||||
Other premises and equipment(b) | ||||||||||||||
Total premises and equipment | $ | $ | ||||||||||||
(a)Excluded $514 million and $350 million of right-of-use assets that were recorded in Other assets at December 31, 2023 and 2022, respectively.
(b)Other premises and equipment is comprised of internal-use software and furniture and equipment.
Impairment is assessed when events or changes in circumstances indicate that the carrying value of an asset may not be fully recoverable.
Note 17 – Deposits
As of December 31, 2023 and 2022, noninterest-bearing and interest-bearing deposits were as follows.
| December 31, (in millions) | 2023 | 2022 | |||||||||
| U.S. offices | |||||||||||
Noninterest-bearing (included $ | $ | $ | |||||||||
Interest-bearing (included $ | |||||||||||
| Total deposits in U.S. offices | |||||||||||
| Non-U.S. offices | |||||||||||
Noninterest-bearing (included $ | |||||||||||
Interest-bearing (included $ | |||||||||||
| Total deposits in non-U.S. offices | |||||||||||
| Total deposits | $ | $ | |||||||||
(a)Includes structured notes classified as deposits for which the fair value option has been elected. Refer to Note 3 for further discussion.
As of December 31, 2023 and 2022, time deposits in denominations that met or exceeded the insured limit were as follows.
| December 31, (in millions) | 2023 | 2022 | ||||||||||||
| U.S. offices | $ | $ | ||||||||||||
Non-U.S. offices(a) | ||||||||||||||
| Total | $ | $ | ||||||||||||
As of December 31, 2023, the remaining maturities of interest-bearing time deposits were as follows.
December 31, (in millions) | ||||||||||||||||||||
| U.S. | Non-U.S. | Total | ||||||||||||||||||
| 2024 | $ | $ | $ | |||||||||||||||||
| 2025 | ||||||||||||||||||||
| 2026 | ||||||||||||||||||||
| 2027 | ||||||||||||||||||||
| 2028 | ||||||||||||||||||||
| After 5 years | ||||||||||||||||||||
| Total | $ | $ | $ | |||||||||||||||||
274 | JPMorgan Chase & Co./2023 Form 10-K | |||||||
Note 18 - Leases
Firm as lessee
At December 31, 2023, JPMorgan Chase and its subsidiaries were obligated under a number of noncancellable leases, predominantly operating leases for premises and equipment used primarily for business purposes. These leases generally have terms of 20 years or less, determined based on the contractual maturity of the lease, and include periods covered by options to extend or terminate the lease when the Firm is reasonably certain that it will exercise those options. All leases with lease terms greater than twelve months are reported as a lease liability with a corresponding right-of-use (“ROU”) asset. None of these lease agreements impose restrictions on the Firm’s ability to pay dividends, engage in debt or equity financing transactions or enter into further lease agreements. Certain of these leases contain escalation clauses that will increase rental payments based on maintenance, utility and tax increases, which are non-lease components. The Firm elected not to separate lease and non-lease components of a contract for its real estate leases. As such, real estate lease payments represent payments on both lease and non-lease components.
The carrying values of the Firm’s operating leases were as follows:
| December 31, (in millions, except where otherwise noted) | |||||||||||
| 2023 | 2022 | ||||||||||
| $ | (a) | $ | |||||||||
(b) | |||||||||||
| Weighted average remaining lease term (in years) | |||||||||||
| Weighted average discount rate | % | % | |||||||||
| Supplemental cash flow information | |||||||||||
| Cash paid for amounts included in the measurement of lease liabilities - operating cash flows | $ | $ | |||||||||
| Supplemental non-cash information | |||||||||||
| Right-of-use assets obtained in exchange for operating lease obligations | $ | $ | |||||||||
(a)Included $647 million of right-of-use assets associated with First Republic.
(b)Included $712 million of lease liabilities associated with First Republic.
| Year ended December 31, (in millions) | 2023 | 2022 | ||||||
| Rental expense | ||||||||
| Gross rental expense | $ | $ | ||||||
| Sublease rental income | ( | ( | ||||||
| Net rental expense | $ | $ | ||||||
The following table presents future payments under operating leases as of December 31, 2023:
| Year ended December 31, (in millions) | |||||
| 2024 | $ | ||||
| 2025 | |||||
| 2026 | |||||
| 2027 | |||||
| 2028 | |||||
| After 2028 | |||||
| Total future minimum lease payments | |||||
| Less: Imputed interest | ( | ||||
| Total | $ | ||||
In addition to the table above, as of December 31, 2023, the Firm had additional future operating lease commitments of $420 million that were signed but had not yet commenced. These operating leases will commence between 2024 and 2026 with lease terms up to 21 years.
JPMorgan Chase & Co./2023 Form 10-K | 275 | |||||||
Notes to consolidated financial statements
Firm as lessor
The Firm provides auto and equipment lease financing to its customers through lease arrangements with lease terms that may contain renewal, termination and/or purchase options. The Firm’s lease financings are predominantly auto operating leases. These assets subject to operating leases are recognized in other assets on the Firm’s Consolidated balance sheets and are depreciated on a straight-line basis over the lease term to reduce the asset to its estimated residual value. Depreciation expense is included in technology, communications and equipment expense in the Consolidated statements of income. The Firm’s lease income is generally recognized on a straight-line basis over the lease term and is included in other income in the Consolidated statements of income.
On a periodic basis, the Firm assesses leased assets for impairment, and if the carrying amount of the leased asset exceeds the undiscounted cash flows from the lease payments and the estimated residual value upon disposition of the leased asset, an impairment is recognized.
The following table presents the carrying value of assets subject to leases reported on the Consolidated balance sheets:
| December 31, (in millions) | 2023 | 2022 | |||||||||
Carrying value of assets subject to operating leases, net of accumulated depreciation | $ | $ | |||||||||
Accumulated depreciation | |||||||||||
The following table presents the Firm’s operating lease income and the related depreciation expense on the Consolidated statements of income:
Year ended December 31, (in millions) | 2023 | 2022 | 2021 | |||||||||||
| $ | $ | $ | ||||||||||||
| Depreciation expense | ||||||||||||||
The following table presents future receipts under operating leases as of December 31, 2023:
| Year ended December 31, (in millions) | |||||
| 2024 | $ | ||||
| 2025 | |||||
| 2026 | |||||
| 2027 | |||||
| 2028 | |||||
| After 2028 | |||||
| Total future minimum lease receipts | $ | ||||
276 | JPMorgan Chase & Co./2023 Form 10-K | |||||||
Note 19 – Accounts payable and other liabilities
Accounts payable and other liabilities consist of brokerage payables, which include payables to customers and payables related to security purchases that did not settle, as well as other accrued expenses, such as compensation accruals, credit card rewards liability, operating lease liabilities, accrued interest payables, merchant servicing payables, income tax payables and litigation reserves.
The following table presents the components of accounts payable and other liabilities.
| December 31, (in millions) | 2023 | 2022 | ||||||||||||
| Brokerage payables | $ | $ | ||||||||||||
Other payables and liabilities(a) | ||||||||||||||
Total accounts payable and other liabilities | $ | $ | ||||||||||||
(a) Includes credit card rewards liability of $13.2 billion and $11.3 billion at December 31, 2023 and 2022, respectively.
The credit card rewards liability represents the estimated cost of rewards points earned and expected to be redeemed by cardholders. The liability is accrued as the cardholder earns the benefit and is reduced when the cardholder redeems points. The redemption rate and cost per point assumptions are key assumptions to estimate the liability and the current period impact is recognized in Card Income.
Refer to Note 7, 18, 25 and 30 for additional information on accrued interest, operating lease liabilities, income taxes and litigation reserves, respectively.
JPMorgan Chase & Co./2023 Form 10-K | 277 | |||||||
Notes to consolidated financial statements
Note 20 – Long-term debt
| By remaining maturity at December 31, (in millions, except rates) | 2023 | 2022 | |||||||||||||||||||||||||||||||||
| Under 1 year | 1-5 years | After 5 years | Total | Total | |||||||||||||||||||||||||||||||
| Parent company | |||||||||||||||||||||||||||||||||||
| Senior debt: | Fixed rate | $ | $ | $ | $ | $ | |||||||||||||||||||||||||||||
| Variable rate | |||||||||||||||||||||||||||||||||||
Interest rates(f) | % | % | % | % | % | ||||||||||||||||||||||||||||||
| Subordinated debt: | Fixed rate | $ | $ | $ | $ | $ | |||||||||||||||||||||||||||||
| Variable rate | |||||||||||||||||||||||||||||||||||
Interest rates(f) | % | % | % | % | % | ||||||||||||||||||||||||||||||
| Subtotal | $ | $ | $ | $ | $ | ||||||||||||||||||||||||||||||
| Subsidiaries | |||||||||||||||||||||||||||||||||||
| Federal Home Loan Banks advances: | Fixed rate | $ | $ | $ | $ | (g) | $ | ||||||||||||||||||||||||||||
| Variable rate | |||||||||||||||||||||||||||||||||||
Interest rates(f) | % | % | % | % | % | ||||||||||||||||||||||||||||||
Purchase Money Note(a): | Fixed rate | $ | $ | $ | $ | NA | |||||||||||||||||||||||||||||
Interest rates(f) | % | % | % | % | NA | ||||||||||||||||||||||||||||||
| Senior debt: | Fixed rate | $ | $ | $ | $ | $ | |||||||||||||||||||||||||||||
| Variable rate | |||||||||||||||||||||||||||||||||||
Interest rates(f) | % | % | % | % | |||||||||||||||||||||||||||||||
| Subordinated debt: | Fixed rate | $ | $ | $ | $ | $ | |||||||||||||||||||||||||||||
| Variable rate | |||||||||||||||||||||||||||||||||||
Interest rates(f) | % | % | % | % | % | ||||||||||||||||||||||||||||||
| Subtotal | $ | $ | $ | $ | $ | ||||||||||||||||||||||||||||||
| Junior subordinated debt: | Fixed rate | $ | $ | $ | $ | $ | |||||||||||||||||||||||||||||
| Variable rate | |||||||||||||||||||||||||||||||||||
Interest rates(f) | % | % | % | % | % | ||||||||||||||||||||||||||||||
| Subtotal | $ | $ | $ | $ | $ | ||||||||||||||||||||||||||||||
Total long-term debt(b)(c)(d) | $ | $ | $ | $ | (h)(i) | $ | |||||||||||||||||||||||||||||
| Long-term beneficial interests: | |||||||||||||||||||||||||||||||||||
| Fixed rate | $ | $ | $ | $ | $ | ||||||||||||||||||||||||||||||
| Variable rate | |||||||||||||||||||||||||||||||||||
Interest rates(f) | % | % | % | % | % | ||||||||||||||||||||||||||||||
Total long-term beneficial interests(e) | $ | $ | $ | $ | $ | ||||||||||||||||||||||||||||||
(a)Reflects the Purchase Money Note associated with the First Republic acquisition. Refer to Note 34 for additional information.
(b)Included long-term debt of $93.0 billion and $13.8 billion secured by assets totaling $218.5 billion and $208.3 billion at December 31, 2023 and 2022, respectively. The amount of long-term debt secured by assets does not include amounts related to hybrid instruments.
(c)Included $87.9 billion and $72.3 billion of long-term debt accounted for at fair value at December 31, 2023 and 2022, respectively.
(d)Included $12.5 billion and $10.3 billion of outstanding zero-coupon notes at December 31, 2023 and 2022, respectively. The aggregate principal amount of these notes at their respective maturities is $47.9 billion and $45.3 billion, respectively. The aggregate principal amount reflects the contractual principal payment at maturity, which may exceed the contractual principal payment at the Firm’s next call date, if applicable.
(e)Included on the Consolidated balance sheets in beneficial interests issued by consolidated VIEs. Also included amounts accounted for at fair value which were not material as of December 31, 2023 and 2022. Excluded short-term commercial paper and other short-term beneficial interests of $19.9 billion and $10.5 billion at December 31, 2023 and 2022, respectively.
(f)The interest rates shown are the weighted average of contractual rates in effect at December 31, 2023 and 2022, respectively, including non-U.S. dollar fixed- and variable-rate issuances, which excludes the effects of the associated derivative instruments used in hedge accounting relationships, if applicable. The interest rates shown exclude structured notes accounted for at fair value.
(g)As of December 31, 2023, included $23.2 billion of FHLB advances associated with First Republic. Refer to Note 34 for additional information.
(h)As of December 31, 2023, long-term debt in the aggregate of $208.2 billion was redeemable at the option of JPMorgan Chase, in whole or in part, prior to maturity, based on the terms specified in the respective instruments.
(i)The aggregate carrying values of debt that matures in each of the five years subsequent to 2023 is $51.2 billion in 2024, $53.5 billion in 2025, $48.7 billion in 2026, $26.2 billion in 2027 and $79.0 billion in 2028.
278 | JPMorgan Chase & Co./2023 Form 10-K | |||||||
The weighted-average contractual interest rates for total long-term debt excluding structured notes accounted for at fair value were 3.65 % and 3.26 % as of December 31, 2023 and 2022, respectively. In order to modify exposure to interest rate and currency exchange rate movements, JPMorgan Chase utilizes derivative instruments, primarily interest rate and cross-currency interest rate swaps, in conjunction with some of its debt issuances. The use of these instruments modifies the Firm’s interest expense on the associated debt. The modified weighted-average interest rates for total long-term debt, including the effects of related derivative instruments, were 5.20 % and 4.89 % as of December 31, 2023 and 2022, respectively.
JPMorgan Chase & Co. has guaranteed certain long-term debt of its subsidiaries, including structured notes. These guarantees rank pari passu with the Firm’s other unsecured and unsubordinated indebtedness. The amount of such guaranteed long-term debt and structured notes was $41.1 billion and $28.2 billion at December 31, 2023 and 2022, respectively.
The Firm’s unsecured debt does not contain requirements that would call for an acceleration of payments, maturities or changes in the structure of the existing debt, provide any limitations on future borrowings or require additional collateral, based on unfavorable changes in the Firm’s credit ratings, financial ratios, earnings or stock price.
JPMorgan Chase & Co./2023 Form 10-K | 279 | |||||||
Notes to consolidated financial statements
Note 21 – Preferred stock
At December 31, 2023 and 2022, JPMorgan Chase was authorized to issue 200 1
The following is a summary of JPMorgan Chase’s non-cumulative preferred stock outstanding as of December 31, 2023 and 2022, and the quarterly dividend declarations for the years ended December 31, 2023, 2022 and 2021.
Shares(a) | Carrying value (in millions) | Issue date | Contractual rate in effect at December 31, 2023 | Earliest redemption date(b) | Floating annualized rate(c) | Dividend declared per share(d) | ||||||||||||||||||||||||||||||||||||||
| December 31, | December 31, | Year ended December 31, | ||||||||||||||||||||||||||||||||||||||||||
| 2023 | 2022 | 2023 | 2022 | 2023 | 2022 | 2021 | ||||||||||||||||||||||||||||||||||||||
Fixed-rate: | ||||||||||||||||||||||||||||||||||||||||||||
Series AA | $ | $ | — | % | NA | $ | $ | $ | ||||||||||||||||||||||||||||||||||||
Series BB | — | NA | ||||||||||||||||||||||||||||||||||||||||||
Series DD | NA | |||||||||||||||||||||||||||||||||||||||||||
Series EE | NA | |||||||||||||||||||||||||||||||||||||||||||
Series GG | NA | |||||||||||||||||||||||||||||||||||||||||||
| Series JJ | NA | (e) | ||||||||||||||||||||||||||||||||||||||||||
| Series LL | NA | (e) | ||||||||||||||||||||||||||||||||||||||||||
| Series MM | NA | (e) | ||||||||||||||||||||||||||||||||||||||||||
Fixed-to-floating rate: | ||||||||||||||||||||||||||||||||||||||||||||
Series I | $ | $ | — | % | — | % | $ | $ | $ | |||||||||||||||||||||||||||||||||||
Series Q | SOFR + | SOFR + | (f) | |||||||||||||||||||||||||||||||||||||||||
Series R | SOFR + | SOFR + | (g) | |||||||||||||||||||||||||||||||||||||||||
| Series S | SOFR + | |||||||||||||||||||||||||||||||||||||||||||
Series U | SOFR + | |||||||||||||||||||||||||||||||||||||||||||
| Series V | — | — | ||||||||||||||||||||||||||||||||||||||||||
Series X | SOFR + | |||||||||||||||||||||||||||||||||||||||||||
Series Z | — | — | ||||||||||||||||||||||||||||||||||||||||||
Series CC | SOFR + | SOFR + | (h) | |||||||||||||||||||||||||||||||||||||||||
Series FF | SOFR + | |||||||||||||||||||||||||||||||||||||||||||
| Series HH | SOFR + | |||||||||||||||||||||||||||||||||||||||||||
| Series II | SOFR + | |||||||||||||||||||||||||||||||||||||||||||
| Series KK | CMT + | (e) | ||||||||||||||||||||||||||||||||||||||||||
| Total preferred stock | $ | $ | ||||||||||||||||||||||||||||||||||||||||||
(a)Represented by depositary shares.
(b)Each series of fixed-to-floating rate preferred stock converts to a floating rate at the earliest redemption date.
(c)Effective June 30, 2023, CME Term SOFR became the replacement reference rate for fixed-to-floating rate preferred stock issued by the Firm that formerly referenced U.S. dollar LIBOR. References in the table to “SOFR” mean a floating annualized rate equal to three-month term SOFR (plus a spread adjustment of 0.26% per annum) plus the spreads noted. The reference to “CMT” means a floating annualized rate equal to the five-year Constant Maturity Treasury (“CMT”) rate plus the spread noted.
(d)Dividends on preferred stock are discretionary and non-cumulative. When declared, dividends are declared quarterly. Dividends are payable quarterly on fixed-rate preferred stock. Dividends are payable semiannually on fixed-to-floating rate preferred stock while at a fixed rate, and payable quarterly after converting to a floating rate.
(e)The initial dividend declared is prorated based on the number of days outstanding for the period. Dividends were declared quarterly thereafter at the contractual rate.
(f)The dividend rate for Series Q preferred stock became floating and payable quarterly starting on May 1, 2023; prior to which the dividend rate was fixed at 5.15 % or $257.50 per share payable semiannually. The dividend rate for each quarterly dividend period commencing on August 1, 2023 is three-month term SOFR (plus a spread adjustment of 0.26% per annum) plus the spread of 3.25 %.
(g)The dividend rate for Series R preferred stock became floating and payable quarterly starting on August 1, 2023; prior to which the dividend rate was fixed at 6.00 % or $300.00 per share payable semiannually. The dividend rate for each quarterly dividend period commencing on August 1, 2023 is three-month term SOFR (plus a spread adjustment of 0.26% per annum) plus the spread of 3.30 %.
(h)The dividend rate for Series CC preferred stock became floating and payable quarterly starting on November 1, 2022; prior to which the dividend rate was fixed at 4.625 % or $231.25 per share payable semiannually. The dividend rate for each quarterly dividend period commencing on August 1, 2023 is three-month term SOFR (plus a spread adjustment of 0.26% per annum) plus the spread of 2.58 %.
Each series of preferred stock has a liquidation value and redemption price per share of $10,000 , plus accrued but unpaid dividends. The aggregate liquidation value was $27.7 billion at December 31, 2023.
280 | JPMorgan Chase & Co./2023 Form 10-K | |||||||
Redemptions
On October 31, 2022, the Firm redeemed all $2.9 billion of its fixed-to-floating rate non-cumulative perpetual preferred stock, Series I.
On October 3, 2022, the Firm redeemed all $2.5 billion of its fixed-to-floating rate non-cumulative preferred stock, Series V.
On February 1, 2022, the Firm redeemed all $2.0 billion of its fixed-to-floating rate non-cumulative preferred stock, Series Z.
Redemption rights
Each series of the Firm’s preferred stock may be redeemed on any dividend payment date on or after the earliest redemption date for that series. All outstanding preferred stock series may also be redeemed following a “capital treatment event,” as described in the terms of each series. Any redemption of the Firm’s preferred stock is subject to non-objection from the Board of Governors of the Federal Reserve System (the “Federal Reserve”).
JPMorgan Chase & Co./2023 Form 10-K | 281 | |||||||
Notes to consolidated financial statements
Note 22 – Common stock
At December 31, 2023 and 2022, JPMorgan Chase was authorized to issue 9.0 1
Common shares issued which were reissued from treasury by the Firm during the years ended December 31, 2023, 2022 and 2021 were as follows.
| Year ended December 31, (in millions) | 2023 | 2022 | 2021 | ||||||||
Total issued – balance at January 1 | |||||||||||
| Treasury – balance at January 1 | ( | ( | ( | ||||||||
| Repurchase | ( | ( | ( | ||||||||
| Reissuance: | |||||||||||
Employee benefits and compensation plans | |||||||||||
Employee stock purchase plans | |||||||||||
| Total reissuance | |||||||||||
Total treasury – balance at December 31 | ( | ( | ( | ||||||||
| Outstanding at December 31 | |||||||||||
Effective May 1, 2022, the Firm is authorized to purchase up to $30 billion under its common share repurchase program previously approved by the Board of Directors, which was announced on April 13, 2022.
The following table sets forth the Firm’s repurchases of common stock for the years ended December 31, 2023, 2022 and 2021.
| Year ended December 31, (in millions) | 2023 | 2022(b) | 2021(c) | |||||||||||
| Total number of shares of common stock repurchased | ||||||||||||||
Aggregate purchase price of common stock repurchases(a) | $ | $ | $ | |||||||||||
(a)Excludes excise tax and commissions. As part of the Inflation Reduction Act of 2022, a 1% excise tax was imposed on net share repurchases effective January 1, 2023.
(b)In the second half of 2022, the Firm temporarily suspended share repurchases, which it resumed under its current common share repurchase program in the first quarter of 2023.
(c)As directed by the Federal Reserve, total net repurchases and common stock dividends in the first and second quarter of 2021 were restricted and could not exceed the average of the Firm’s net income for the four preceding calendar quarters. Effective July 1, 2021, the Firm became subject to the normal capital distribution restrictions provided under the regulatory capital framework.
The Board of Directors’ authorization to repurchase common shares is utilized at management’s discretion, and the timing of purchases and the exact amount of common shares that may be repurchased is subject to various factors, including market conditions; legal and regulatory considerations affecting the amount and timing of repurchase activity; the Firm’s capital position (taking into account goodwill and intangibles); internal capital generation; current and proposed future capital requirements; and alternative investment opportunities. The $30 billion common share repurchase program approved by the Board does not establish specific price targets or timetables. The repurchase program may be suspended by management at any time; and may be executed through open market purchases or privately negotiated transactions, or utilizing Rule 10b5-1 plans, which are written trading plans that the Firm may enter into from time to time under Rule 10b5-1 of the Securities Exchange Act of 1934 and which allow the Firm to repurchase its common shares during periods when it may otherwise not be repurchasing common shares — for example, during internal trading blackout periods.
As of December 31, 2023, approximately 61.6 million shares of common stock were reserved for issuance under various employee incentive, compensation, option and stock purchase plans, and directors’ compensation plans.
282 | JPMorgan Chase & Co./2023 Form 10-K | |||||||
Note 23 – Earnings per share
Basic earnings per share (“EPS”) is calculated using the two-class method. Under the two-class method, all earnings (distributed and undistributed) are allocated to common stock and participating securities. JPMorgan Chase grants RSUs under its share-based compensation programs, predominantly all of which entitle recipients to receive nonforfeitable dividends during the vesting period on a basis equivalent to dividends paid to holders of the Firm’s common stock. These unvested RSUs meet the definition of participating securities based on their respective rights to receive nonforfeitable dividends, and they are treated as a separate class of securities in computing basic EPS. Participating securities are not included as incremental shares in computing diluted EPS; refer to Note 9 for additional information.
Diluted EPS incorporates the potential impact of contingently issuable shares, including awards which require future service as a condition of delivery of the underlying common stock. Diluted EPS is calculated under both the two-class and treasury stock methods, and the more dilutive amount is reported. For each of the periods presented in the table below, diluted EPS calculated under the two-class method was more dilutive.
The following table presents the calculation of net income applicable to common stockholders and basic and diluted EPS for the years ended December 31, 2023, 2022 and 2021.
| Year ended December 31, (in millions, except per share amounts) | 2023 | 2022 | 2021 | ||||||||
| Basic earnings per share | |||||||||||
| Net income | $ | $ | $ | ||||||||
| Less: Preferred stock dividends | |||||||||||
Net income applicable to common equity | |||||||||||
Less: Dividends and undistributed earnings allocated to participating securities | |||||||||||
Net income applicable to common stockholders | $ | $ | $ | ||||||||
Total weighted-average basic shares outstanding | |||||||||||
| Net income per share | $ | $ | $ | ||||||||
| Diluted earnings per share | |||||||||||
Net income applicable to common stockholders | $ | $ | $ | ||||||||
Total weighted-average basic shares outstanding | |||||||||||
| Add: Dilutive impact of unvested PSUs, nondividend-earning RSUs and SARs | |||||||||||
Total weighted-average diluted shares outstanding | |||||||||||
| Net income per share | $ | $ | $ | ||||||||
JPMorgan Chase & Co./2023 Form 10-K | 283 | |||||||
Notes to consolidated financial statements
Note 24 – Accumulated other comprehensive income/(loss)
AOCI includes the after-tax change in unrealized gains and losses on investment securities, foreign currency translation adjustments (including the impact of related derivatives), fair value changes of excluded components on fair value hedges, cash flow hedging activities, net gain/(loss) related to the Firm’s defined benefit pension and OPEB plans, and fair value option-elected liabilities arising from changes in the Firm’s own credit risk (DVA).
| Year ended December 31, (in millions) | Unrealized gains/(losses) on investment securities | Translation adjustments, net of hedges | Fair value hedges | Cash flow hedges | Defined benefit pension and OPEB plans | DVA on fair value option elected liabilities | Accumulated other comprehensive income/(loss) | |||||||||||||||||||||||||||||||||||||||||||||||||||||||
| Balance at December 31, 2020 | $ | $ | ( | $ | ( | $ | $ | ( | $ | ( | $ | |||||||||||||||||||||||||||||||||||||||||||||||||||
| Net change | ( | ( | ( | ( | ( | ( | ||||||||||||||||||||||||||||||||||||||||||||||||||||||||
| Balance at December 31, 2021 | $ | (a) | $ | ( | $ | ( | $ | ( | $ | ( | $ | ( | $ | ( | ||||||||||||||||||||||||||||||||||||||||||||||||
| Net change | ( | ( | ( | ( | ( | |||||||||||||||||||||||||||||||||||||||||||||||||||||||||
| Balance at December 31, 2022 | $ | ( | (a) | $ | ( | $ | ( | $ | ( | $ | ( | $ | $ | ( | ||||||||||||||||||||||||||||||||||||||||||||||||
| Net change | ( | ( | ||||||||||||||||||||||||||||||||||||||||||||||||||||||||||||
| Balance at December 31, 2023 | $ | ( | (a) | $ | ( | $ | ( | $ | ( | $ | ( | $ | ( | $ | ( | |||||||||||||||||||||||||||||||||||||||||||||||
(a)As of December 31, 2023 includes after-tax net unamortized unrealized gains/(losses) of $(29 ) million related to HTM securities that have been transferred to AFS as permitted by the new hedge accounting guidance adopted on January 1, 2023. Includes after-tax net unamortized unrealized gains/(losses) of $(895 ) million, $(1.3 ) billion, and $2.4 billion related to AFS securities that have been transferred to HTM for the years ended 2023, 2022 and 2021, respectively. Refer to Note 10 for further information.
The following table presents the pre-tax and after-tax changes in the components of OCI.
| 2023 | 2022 | 2021 | |||||||||||||||||||||||||||||||||||||||||||||||||||
| Year ended December 31, (in millions) | Pre-tax | Tax effect | After-tax | Pre-tax | Tax effect | After-tax | Pre-tax | Tax effect | After-tax | ||||||||||||||||||||||||||||||||||||||||||||
Unrealized gains/(losses) on investment securities: | |||||||||||||||||||||||||||||||||||||||||||||||||||||
Net unrealized gains/(losses) arising during the period | $ | $ | ( | $ | $ | ( | $ | $ | ( | $ | ( | $ | $ | ( | |||||||||||||||||||||||||||||||||||||||
Reclassification adjustment for realized (gains)/losses included in net income(a) | ( | ( | ( | ||||||||||||||||||||||||||||||||||||||||||||||||||
| Net change | ( | ( | ( | ( | ( | ||||||||||||||||||||||||||||||||||||||||||||||||
Translation adjustments(b): | |||||||||||||||||||||||||||||||||||||||||||||||||||||
| Translation | ( | ( | ( | ( | ( | ||||||||||||||||||||||||||||||||||||||||||||||||
| Hedges | ( | ( | ( | ( | |||||||||||||||||||||||||||||||||||||||||||||||||
| Net change | ( | ( | ( | ( | ( | ||||||||||||||||||||||||||||||||||||||||||||||||
Fair value hedges, net change(c): | ( | ( | ( | ( | ( | ||||||||||||||||||||||||||||||||||||||||||||||||
Cash flow hedges: | |||||||||||||||||||||||||||||||||||||||||||||||||||||
Net unrealized gains/(losses) arising during the period | ( | ( | ( | ( | ( | ||||||||||||||||||||||||||||||||||||||||||||||||
Reclassification adjustment for realized (gains)/losses included in net income(d) | ( | ( | ( | ( | |||||||||||||||||||||||||||||||||||||||||||||||||
| Net change | ( | ( | ( | ( | ( | ||||||||||||||||||||||||||||||||||||||||||||||||
Defined benefit pension and OPEB plans, net change(e): | ( | ( | ( | ( | |||||||||||||||||||||||||||||||||||||||||||||||||
DVA on fair value option elected liabilities, net change: | ( | ( | ( | ( | ( | ||||||||||||||||||||||||||||||||||||||||||||||||
| Total other comprehensive income/(loss) | $ | $ | ( | $ | $ | ( | $ | $ | ( | $ | ( | $ | $ | ( | |||||||||||||||||||||||||||||||||||||||
(a)The pre-tax amount is reported in Investment securities gains/(losses) in the Consolidated statements of income.
(b)Reclassifications of pre-tax realized gains/(losses) on translation adjustments and related hedges are reported in other income/expense in the Consolidated statements of income. During the year ended December 31, 2023, the Firm reclassified a net pre-tax loss of $(3 ) million to other revenue, $(35 ) million related to the net investment hedge loss, and a $32 million gain related to cumulative translation adjustment, including the impact of the acquisition of CIFM. During the year ended December 31, 2022, the Firm reclassified a net pre-tax loss of $(8 ) million. During the year ended December 31, 2021, the Firm reclassified a net pre-tax loss of $(7 ) million.
(c)Represents changes in fair value of cross-currency swaps attributable to changes in cross-currency basis spreads, which are excluded from the assessment of hedge effectiveness and recorded in other comprehensive income. The initial cost of cross-currency basis spreads is recognized in earnings as part of the accrual of interest on the cross-currency swaps.
(d)The pre-tax amounts are primarily recorded in noninterest revenue, net interest income and compensation expense in the Consolidated statements of income.
(e)During the year ended December 31, 2022, a remeasurement of the Firm’s U.S. principal defined benefit plan in the third quarter, was required as a result of a pension settlement. The remeasurement resulted in a net decrease of $1.4 billion in pre-tax AOCI. Refer to Note 8 for further information.
284 | JPMorgan Chase & Co./2023 Form 10-K | |||||||
Note 25 – Income taxes
Due to the inherent complexities arising from the nature of the Firm’s businesses, and from conducting business and being taxed in a substantial number of jurisdictions, significant judgments and estimates are required to be made. Agreement of tax liabilities between JPMorgan Chase and the many tax jurisdictions in which the Firm files tax returns may not be finalized for several years. Thus, the Firm’s final tax-related assets and liabilities may ultimately be different from those currently reported.
Effective tax rate and expense
The following table presents a reconciliation of the applicable statutory U.S. federal income tax rate to the effective tax rate.
| Effective tax rate | ||||||||||||||||||||
| Year ended December 31, | 2023 | 2022 | 2021 | |||||||||||||||||
| Statutory U.S. federal tax rate | % | % | % | |||||||||||||||||
Increase/(decrease) in tax rate resulting from: | ||||||||||||||||||||
U.S. state and local income taxes, net of U.S. federal income tax benefit | ||||||||||||||||||||
Tax-exempt income | ( | ( | ( | |||||||||||||||||
Non-U.S. earnings | ||||||||||||||||||||
Business tax credits | ( | ( | ( | |||||||||||||||||
Other, net | ( | ( | ( | |||||||||||||||||
| Effective tax rate | % | (a) | % | % | ||||||||||||||||
(a) Income tax expense associated with the First Republic acquisition was reflected in the estimated bargain purchase gain, which resulted in a reduction in the Firm’s effective tax rate.
The following table reflects the components of income tax expense/(benefit) included in the Consolidated statements of income.
| Income tax expense/(benefit) | ||||||||||||||||||||
| Year ended December 31, (in millions) | 2023 | 2022 | 2021 | |||||||||||||||||
| Current income tax expense/(benefit) | ||||||||||||||||||||
| U.S. federal | $ | $ | $ | |||||||||||||||||
| Non-U.S. | ||||||||||||||||||||
| U.S. state and local | ||||||||||||||||||||
Total current income tax expense/(benefit) | ||||||||||||||||||||
Deferred income tax expense/(benefit) | ||||||||||||||||||||
| U.S. federal | ( | ( | ||||||||||||||||||
| Non-U.S. | ( | ( | ||||||||||||||||||
| U.S. state and local | ( | ( | ||||||||||||||||||
Total deferred income tax expense/(benefit) | ( | ( | ||||||||||||||||||
Total income tax expense | $ | $ | $ | |||||||||||||||||
Total income tax expense includes $68 million of tax benefits in 2023, $331 million of tax benefits in 2022, and $69 million of tax expenses in 2021, resulting from the resolution of tax audits.
Tax effect of items recorded in stockholders’ equity
The preceding table does not reflect the tax effect of certain items that are recorded each period directly in stockholders’ equity, which are predominantly reflected in OCI as disclosed in Note 24. For the year ended December 31, 2023, stockholders’ equity also reflected the tax effect associated with the Firm’s adoption of the TDR accounting guidance recognized in retained earnings. Refer to Note 1 for further information.
Results from U.S. and non-U.S. earnings
The following table presents the U.S. and non-U.S. components of income before income tax expense.
| Year ended December 31, (in millions) | 2023 | 2022 | 2021 | |||||||||||||||||
| U.S. | $ | $ | $ | |||||||||||||||||
Non-U.S.(a) | ||||||||||||||||||||
Income before income tax expense | $ | $ | $ | |||||||||||||||||
(a)For purposes of this table, non-U.S. income is defined as income generated from operations located outside the U.S.
JPMorgan Chase & Co./2023 Form 10-K | 285 | |||||||
Affordable housing tax credits
Deferred taxes
Deferred income tax expense/(benefit) reflects the differences between assets and liabilities measured for financial reporting purposes versus income tax return purposes. Deferred tax assets are recognized if, in management’s judgment, their realizability is determined to be more likely than not. If a deferred tax asset is determined to be unrealizable, a valuation allowance is established. The significant components of deferred tax assets and liabilities are reflected in the following table, the net deferred tax assets are reflected in other assets on the Firm’s Consolidated balance sheets.
| December 31, (in millions) | 2023 | 2022 | ||||||||||||
| Deferred tax assets | ||||||||||||||
| Allowance for loan losses | $ | $ | ||||||||||||
| Employee benefits | ||||||||||||||
Accrued expenses and other | (a) | |||||||||||||
| Non-U.S. operations | ||||||||||||||
| Tax attribute carryforwards | ||||||||||||||
| Gross deferred tax assets | ||||||||||||||
| Valuation allowance | ( | ( | ||||||||||||
Deferred tax assets, net of valuation allowance | $ | $ | ||||||||||||
| Deferred tax liabilities | ||||||||||||||
| Depreciation and amortization | $ | $ | ||||||||||||
Mortgage servicing rights, net of hedges | ||||||||||||||
| Leasing transactions | ||||||||||||||
| Other, net | ||||||||||||||
| Gross deferred tax liabilities | ||||||||||||||
Net deferred tax assets | $ | $ | ||||||||||||
(a) Includes the estimated net deferred tax asset associated with the First Republic acquisition. The allocation of the tax basis to individual assets may be refined during the measurement period, which could result in an impact to the gross deferred tax assets and liabilities.
JPMorgan Chase has recorded deferred tax assets of $290 million at December 31, 2023 in connection with tax attribute carryforwards. State and local capital loss carryforwards were $1.2 billion, U.S. federal NOL carryforwards were $586 million, non-U.S. NOL carryforwards were $570 million, and other U.S. federal tax attributes were $118 million. If not utilized, a portion of the U.S. federal NOL carryforwards and other U.S. federal tax attributes will expire between 2026 and 2037 whereas others have an unlimited carryforward period. Similarly, certain non-U.S. NOL carryforwards will expire between 2026 and 2040 whereas others have an unlimited carryforward period. The state and local capital loss carryforwards will expire in 2026 and 2027.
The valuation allowance at December 31, 2023, was due to the state and local capital loss carryforwards and certain non-U.S. deferred tax assets, including NOL carryforwards.
286 | JPMorgan Chase & Co./2023 Form 10-K | |||||||
Unrecognized tax benefits
At December 31, 2023, 2022 and 2021, JPMorgan Chase’s unrecognized tax benefits, excluding related interest expense and penalties, were $5.4 billion, $5.0 billion and $4.6 billion, respectively, of which $3.9 billion, $3.8 billion and $3.4 billion, respectively, if recognized, would reduce the annual effective tax rate. Included in the amount of unrecognized tax benefits are certain items that would not affect the effective tax rate if they were recognized in the Consolidated statements of income. These unrecognized items include the tax effect of certain temporary differences, the portion of gross state and local unrecognized tax benefits that would be offset by the benefit from associated U.S. federal income tax deductions, and the portion of gross non-U.S. unrecognized tax benefits that would have offsets in other jurisdictions. JPMorgan Chase evaluates the need for changes in unrecognized tax benefits based on its anticipated tax return filing positions as part of its U.S. federal and state and local tax returns. In addition, the Firm is presently under audit by a number of taxing authorities, most notably by the Internal Revenue Service, as summarized in the Tax examination status table below. The evaluation of unrecognized tax benefits as well as the potential for audit settlements make it reasonably possible that over the next 12 months the gross balance of unrecognized tax benefits may increase or decrease by as much as approximately $1.1 billion. The change in the unrecognized tax benefit would result in a payment or income statement recognition.
The following table presents a reconciliation of the beginning and ending amount of unrecognized tax benefits.
| Year ended December 31, (in millions) | 2023 | 2022 | 2021 | |||||||||||||||||
| Balance at January 1, | $ | $ | $ | |||||||||||||||||
Increases based on tax positions related to the current period | ||||||||||||||||||||
Increases based on tax positions related to prior periods | ||||||||||||||||||||
Decreases based on tax positions related to prior periods | ( | ( | ( | |||||||||||||||||
Decreases related to cash settlements with taxing authorities | ( | ( | ( | |||||||||||||||||
| Balance at December 31, | $ | $ | $ | |||||||||||||||||
After-tax interest expense/(benefit) and penalties related to income tax liabilities recognized in income tax expense were $229 million, $141 million and $174 million in 2023, 2022 and 2021, respectively.
Tax examination status
JPMorgan Chase is continually under examination by the Internal Revenue Service, by taxing authorities throughout the world, and by many state and local jurisdictions throughout the U.S. The following table summarizes the status of tax years that remain subject to income tax examination of JPMorgan Chase and its consolidated subsidiaries by significant jurisdictions as of December 31, 2023.
| Periods under examination | Status | |||||||||||||
JPMorgan Chase – U.S. | 2011 – 2013 | Field examination of amended returns; certain matters at Appellate level | ||||||||||||
JPMorgan Chase – U.S. | 2014 - 2020 | Field examination of original and amended returns; certain matters at Appellate level | ||||||||||||
JPMorgan Chase – New York State | 2012 - 2014 | Field Examination | ||||||||||||
JPMorgan Chase – New York City | 2015 - 2017 | Field Examination | ||||||||||||
JPMorgan Chase – U.K. | 2011 – 2020 | Field examination of certain select entities | ||||||||||||
JPMorgan Chase & Co./2023 Form 10-K | 287 | |||||||
Notes to consolidated financial statements
Note 26 – Restricted cash, other restricted
assets and intercompany funds transfers
Restricted cash and other restricted assets
Certain of the Firm’s cash and other assets are restricted as to withdrawal or usage. These restrictions are imposed by various regulatory authorities based on the particular activities of the Firm’s subsidiaries.
The business of JPMorgan Chase Bank, N.A. is subject to examination and regulation by the OCC. The Bank is a member of the U.S. Federal Reserve System, and its deposits in the U.S. are insured by the FDIC, subject to applicable limits.
The Firm is required to maintain cash reserves at certain non-US central banks.
The Firm is also subject to rules and regulations established by other U.S. and non U.S. regulators. As part of its compliance with the respective regulatory requirements, the Firm’s broker-dealer activities are subject to certain restrictions on cash and other assets.
The following table presents the components of the Firm’s restricted cash:
| December 31, (in billions) | 2023 | 2022 | ||||||
Segregated for the benefit of securities and cleared derivative customers | ||||||||
Cash reserves at non-U.S. central banks and held for other general purposes | ||||||||
Total restricted cash(a) | $ | $ | ||||||
(a)Comprises $18.2 billion and $25.4 billion in deposits with banks, and $1.4 billion and $1.4 billion in cash and due from banks on the Consolidated balance sheets as of December 31, 2023 and 2022, respectively.
Also, as of December 31, 2023 and 2022, the Firm had the following other restricted assets:
•Cash and securities pledged with clearing organizations for the benefit of customers of $40.5 billion and $42.4 billion, respectively.
•Securities with a fair value of $20.5 billion and $31.7 billion, respectively, were also restricted in relation to customer activity.
Intercompany funds transfers
Restrictions imposed by U.S. federal law prohibit JPMorgan Chase Bank, N.A., and its subsidiaries, from lending to JPMorgan Chase & Co. (“Parent Company”) and certain of its affiliates unless the loans are secured in specified amounts. Such secured loans provided by any banking subsidiary to the Parent Company or to any particular affiliate, together with certain other transactions with such affiliate (collectively referred to as “covered transactions”), must be made on terms and conditions that are consistent with safe and sound banking practices. In addition, unless collateralized with cash or US Government debt obligations, covered transactions are generally limited to 10 % of the banking subsidiary’s total capital, as determined by the risk-based capital guidelines; the aggregate amount of covered transactions between any banking subsidiary and all of its affiliates is limited to 20 % of the banking subsidiary’s total capital.
The Parent Company’s two principal subsidiaries are JPMorgan Chase Bank, N.A. and JPMorgan Chase Holdings LLC, an intermediate holding company (the “IHC”). The IHC generally holds the stock of JPMorgan Chase’s subsidiaries other than JPMorgan Chase Bank, N.A. and its subsidiaries. The IHC also owns other assets and provides intercompany loans to the Parent Company. The Parent Company is obligated to contribute to the IHC substantially all the net proceeds received from securities issuances (including issuances of senior and subordinated debt securities and of preferred and common stock).
The principal sources of income and funding for the Parent Company are dividends from JPMorgan Chase Bank, N.A. and dividends and extensions of credit from the IHC. In addition to dividend restrictions set forth in statutes and regulations, the Federal Reserve, the OCC and the FDIC have authority under the Financial Institutions Supervisory Act to prohibit or to limit the payment of dividends by the banking organizations they supervise, including the Parent Company and its subsidiaries that are banks or bank holding companies, if, in the banking regulator’s opinion, payment of a dividend would constitute an unsafe or unsound practice in light of the financial condition of the banking organization. The IHC is prohibited from paying dividends or extending credit to the Parent Company if certain capital or liquidity “thresholds” are breached or if limits are otherwise imposed by the Parent Company’s management or Board of Directors.
At January 1, 2024, the Parent Company’s banking subsidiaries could pay, in the aggregate, approximately $20 billion in dividends to their respective bank holding companies without the prior approval of their relevant banking regulators. The capacity to pay dividends in 2024 will be supplemented by the banking subsidiaries’ earnings during the year.
288 | JPMorgan Chase & Co./2023 Form 10-K | |||||||
Note 27 – Regulatory capital
The Federal Reserve establishes capital requirements, including well-capitalized standards, for the Firm as a consolidated financial holding company. The OCC establishes similar minimum capital requirements and standards for the Firm’s principal IDI subsidiary, JPMorgan Chase Bank, N.A.
The capital rules under Basel III establish minimum capital ratios and overall capital adequacy standards for large and internationally active U.S. bank holding companies and banks, including the Firm and JPMorgan Chase Bank, N.A. Two comprehensive approaches are prescribed for calculating RWA: a standardized approach (“Basel III Standardized”), and an advanced approach (“Basel III Advanced”). For each of the risk-based capital ratios, the capital adequacy of the Firm and JPMorgan Chase Bank, N.A. is evaluated against the lower of the Standardized or Advanced approaches compared to their respective regulatory capital ratio requirements.
The three components of regulatory capital under the Basel III rules are as illustrated below:
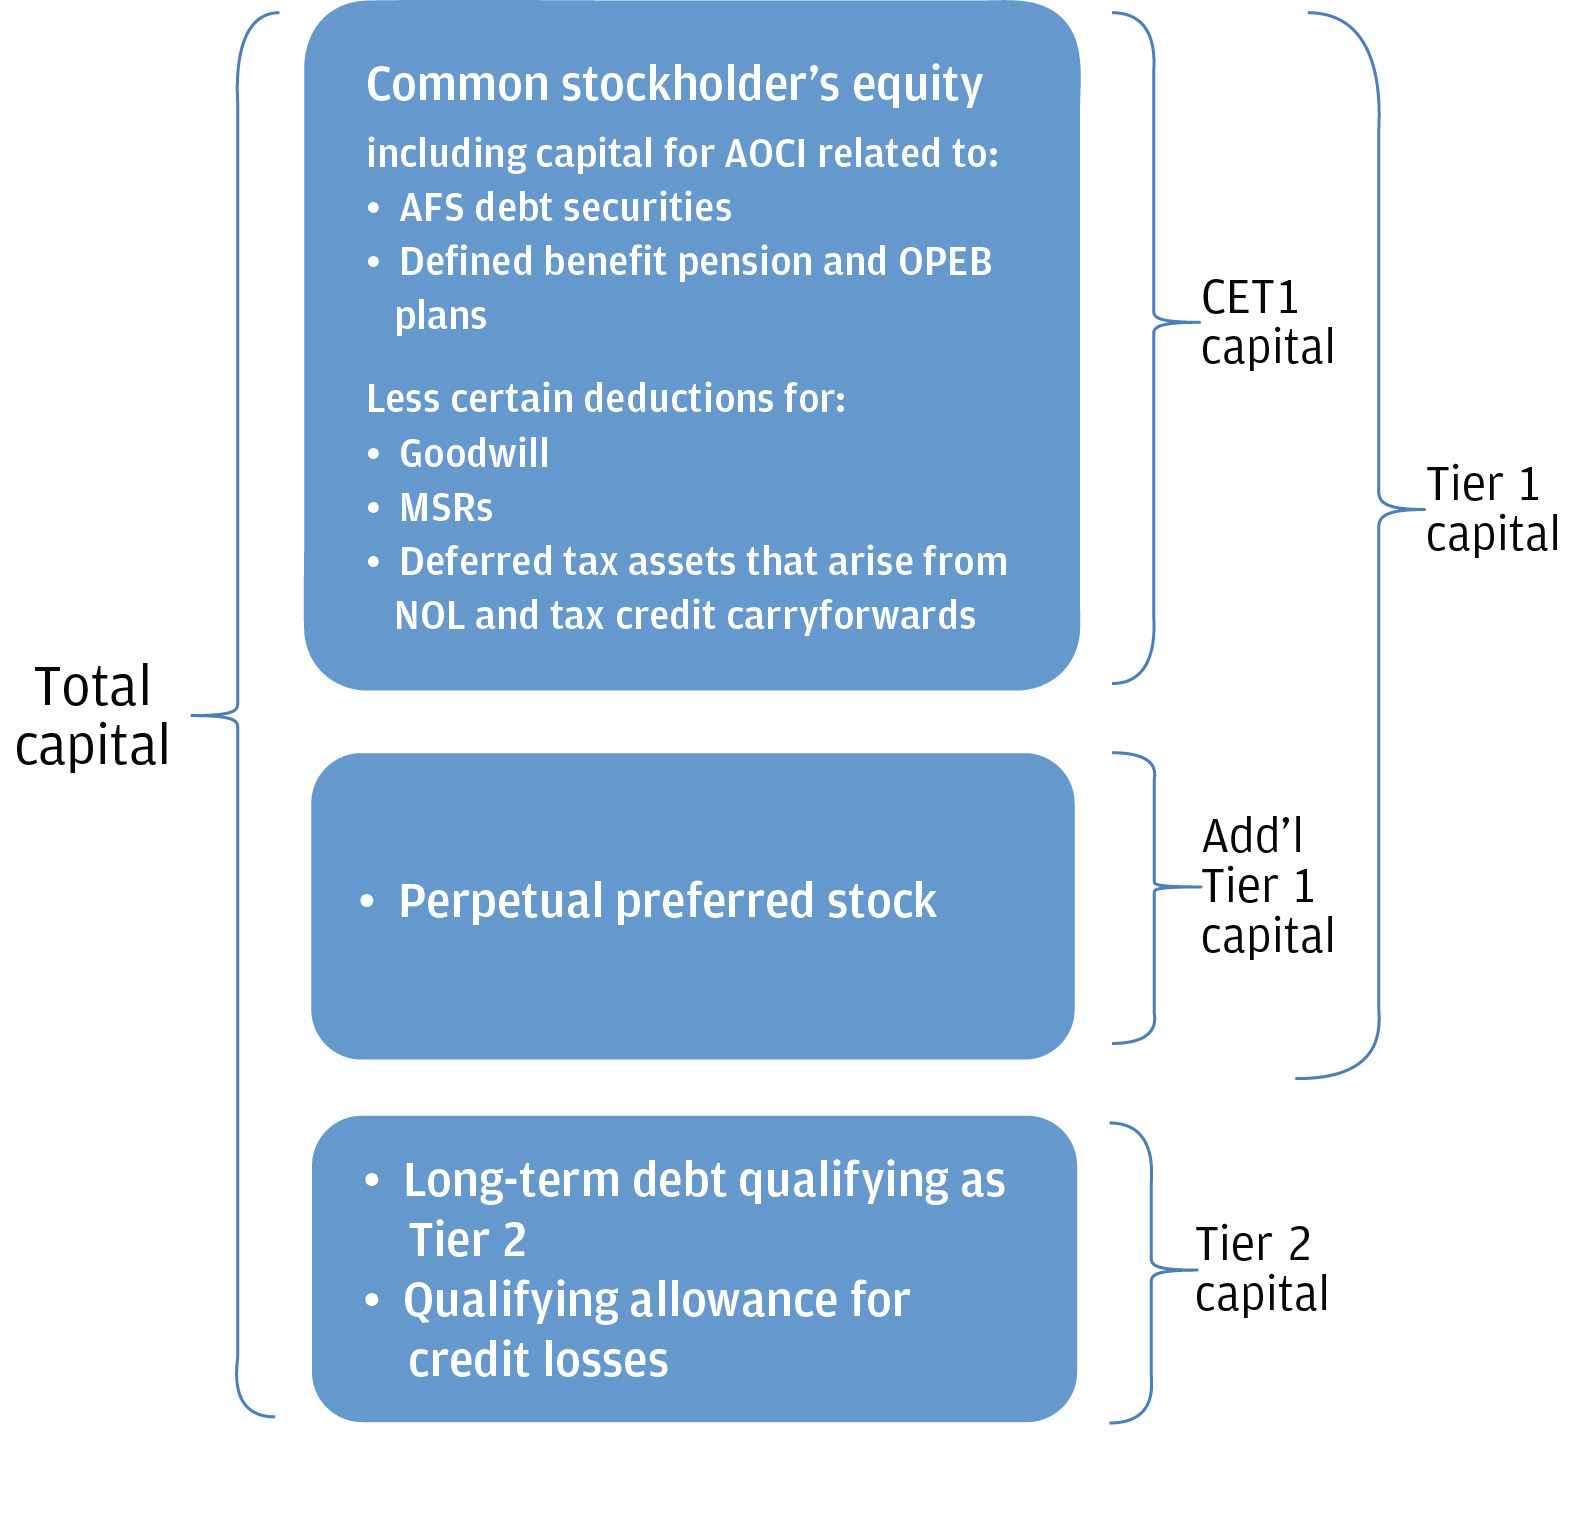
Under the risk-based capital and leverage-based guidelines of the Federal Reserve, JPMorgan Chase is required to maintain minimum ratios for CET1 capital, Tier 1 capital, Total capital, Tier 1 leverage and the SLR. Failure to meet these minimum requirements could cause the Federal Reserve to take action. JPMorgan Chase Bank, N.A. is also subject to these capital requirements established by its primary regulators.
The following table presents the risk-based regulatory capital ratio requirements and well-capitalized ratios to which the Firm and JPMorgan Chase Bank, N.A. were subject as of December 31, 2023 and 2022.
Standardized capital ratio requirements | Advanced capital ratio requirements | Well-capitalized ratios | ||||||||||||||||||
BHC(a)(b) | IDI(c) | BHC(a)(b) | IDI(c) | BHC(d) | IDI(e) | |||||||||||||||
| Risk-based capital ratios | ||||||||||||||||||||
| CET1 capital | % | % | % | % | NA | % | ||||||||||||||
| Tier 1 capital | % | |||||||||||||||||||
| Total capital | ||||||||||||||||||||
Note: The table above is as defined by the regulations issued by the Federal Reserve, OCC and FDIC and to which the Firm and JPMorgan Chase Bank, N.A. are subject.
(a)Represents the regulatory capital ratio requirements applicable to the Firm. The CET1, Tier 1 and Total capital ratio requirements each include a respective minimum requirement plus a GSIB surcharge of 4.0 % as calculated under Method 2; plus a 2.9 % SCB for Basel III Standardized ratios and a fixed 2.5 % capital conservation buffer for Basel III Advanced ratios. The countercyclical buffer is currently set to 0 % by the federal banking agencies.
(b)For the period ended December 31, 2022, the CET1, Tier 1, and Total capital ratio requirements under Basel III Standardized applicable to the Firm were 12.0 %, 13.5 % and 15.5 %, respectively; the Basel III Advanced CET1, Tier 1, and Total capital ratio requirements applicable to the Firm were 10.5 %, 12.0 %, and 14.0 %, respectively. SCB for Basel III Standardized ratio for 2022 was 4.0 %.
(c)Represents requirements for JPMorgan Chase Bank, N.A. The CET1, Tier 1 and Total capital ratio requirements include a fixed capital conservation buffer requirement of 2.5
(d)Represents requirements for bank holding companies pursuant to regulations issued by the Federal Reserve.
(e)Represents requirements for JPMorgan Chase Bank, N.A. pursuant to regulations issued under the FDIC Improvement Act.
The following table presents the leverage-based regulatory capital ratio requirements and well-capitalized ratios to which the Firm and JPMorgan Chase Bank, N.A. were subject as of December 31, 2023 and 2022.
Capital ratio requirements(a) | Well-capitalized ratios | |||||||||||||||||||
| BHC | IDI | BHC(b) | IDI | |||||||||||||||||
| Leverage-based capital ratios | ||||||||||||||||||||
| Tier 1 leverage | % | % | NA | % | ||||||||||||||||
| SLR | NA | |||||||||||||||||||
Note: The table above is as defined by the regulations issued by the Federal Reserve, OCC and FDIC and to which the Firm and JPMorgan Chase Bank, N.A. are subject.
(a)Represents minimum SLR requirement of 3.0 2.0 3.0
(b)The Federal Reserve's regulations do not establish well-capitalized thresholds for these measures for BHCs.
JPMorgan Chase & Co./2023 Form 10-K | 289 | |||||||
Notes to consolidated financial statements
CECL Regulatory Capital Transition
Beginning January 1, 2022, the $2.9 billion CECL capital benefit, provided by the Federal Reserve in response to the COVID-19 pandemic, is being phased out at 25% per year over a three-year period. As of December 31, 2023, the Firm’s CET1 capital reflected the remaining $1.4 billion benefit associated with the CECL capital transition provisions.
Similarly, as of January 1, 2023, the Firm has phased out 50% of the other CECL capital transition provisions which impacted Tier 2 capital, adjusted average assets, total leverage exposure and RWA, as applicable.
The following tables present risk-based capital metrics under both the Basel III Standardized and Basel III Advanced approaches and leverage-based capital metrics for JPMorgan Chase and JPMorgan Chase Bank, N.A. As of December 31, 2023 and 2022, JPMorgan Chase and JPMorgan Chase Bank, N.A. were well-capitalized and met all capital requirements to which each was subject.
| December 31, 2023 (in millions, except ratios) | Basel III Standardized | Basel III Advanced | ||||||||||||||||||
JPMorgan Chase & Co. | JPMorgan Chase Bank, N.A. | JPMorgan Chase & Co. | JPMorgan Chase Bank, N.A. | |||||||||||||||||
Risk-based capital metrics:(a) | ||||||||||||||||||||
CET1 capital | $ | $ | $ | $ | ||||||||||||||||
Tier 1 capital | ||||||||||||||||||||
Total capital | (b) | |||||||||||||||||||
| Risk-weighted assets | (b) | |||||||||||||||||||
| CET1 capital ratio | % | % | % | % | ||||||||||||||||
| Tier 1 capital ratio | ||||||||||||||||||||
| Total capital ratio | ||||||||||||||||||||
| December 31, 2022 (in millions, except ratios) | Basel III Standardized | Basel III Advanced | ||||||||||||||||||
JPMorgan Chase & Co. | JPMorgan Chase Bank, N.A. | JPMorgan Chase & Co. | JPMorgan Chase Bank, N.A. | |||||||||||||||||
Risk-based capital metrics:(a) | ||||||||||||||||||||
CET1 capital | $ | $ | $ | $ | ||||||||||||||||
Tier 1 capital | ||||||||||||||||||||
Total capital | ||||||||||||||||||||
| Risk-weighted assets | ||||||||||||||||||||
| CET1 capital ratio | % | % | % | % | ||||||||||||||||
| Tier 1 capital ratio | ||||||||||||||||||||
| Total capital ratio | ||||||||||||||||||||
(a)The capital metrics reflect the CECL capital transition provisions.
(b)Includes the impacts of certain assets associated with First Republic to which the Standardized approach has been applied as permitted by the transition provisions in the U.S. capital rules.
| Three months ended (in millions, except ratios) | December 31, 2023 | December 31, 2022 | |||||||||||||||
| JPMorgan Chase & Co. | JPMorgan Chase Bank, N.A. | JPMorgan Chase & Co. | JPMorgan Chase Bank, N.A. | ||||||||||||||
Leverage-based capital metrics:(a) | |||||||||||||||||
Adjusted average assets(b) | $ | $ | $ | $ | |||||||||||||
Tier 1 leverage ratio | % | % | % | % | |||||||||||||
| Total leverage exposure | $ | $ | $ | $ | |||||||||||||
| SLR | % | % | % | % | |||||||||||||
(a)The capital metrics reflect the CECL capital transition provisions.
(b)Adjusted average assets, for purposes of calculating the leverage ratios, includes quarterly average assets adjusted for on-balance sheet assets that are subject to deduction from Tier 1 capital, predominantly goodwill, inclusive of estimated equity method goodwill, and other intangible assets.
290 | JPMorgan Chase & Co./2023 Form 10-K | |||||||
Note 28 – Off–balance sheet lending-related
financial instruments, guarantees, and
other commitments
JPMorgan Chase provides lending-related financial instruments (e.g., commitments and guarantees) to address the financing needs of its customers and clients. The contractual amount of these financial instruments represents the maximum possible credit risk to the Firm should the customer or client draw upon the commitment or the Firm be required to fulfill its obligation under the guarantee, and should the customer or client subsequently fail to perform according to the terms of the contract. Most of these commitments and guarantees have historically been refinanced, extended, cancelled, or expired without being drawn or a default occurring. As a result, the total contractual amount of these instruments is not, in the Firm’s view, representative of its expected future credit exposure or funding requirements.
To provide for expected credit losses in wholesale and certain consumer lending-related commitments, an allowance for credit losses on lending-related commitments is maintained. Refer to Note 13 for further information regarding the allowance for credit losses on lending-related commitments.
The following table summarizes the contractual amounts and carrying values of off-balance sheet lending-related financial instruments, guarantees and other commitments at December 31, 2023 and 2022. The amounts in the table below for credit card and home equity lending-related commitments represent the total available credit for these products. The Firm has not experienced, and does not anticipate, that all available lines of credit for these products will be utilized at the same time. The Firm can reduce or cancel credit card lines of credit by providing the borrower notice or, in some cases as permitted by law, without notice. In addition, the Firm typically closes credit card lines when the borrower is 60 days or more past due. The Firm may reduce or close HELOCs when there are significant decreases in the value of the underlying property, or when there has been a demonstrable decline in the creditworthiness of the borrower.
JPMorgan Chase & Co./2023 Form 10-K | 291 | |||||||
Notes to consolidated financial statements
| Off–balance sheet lending-related financial instruments, guarantees and other commitments | ||||||||||||||||||||||||||||||||||||||
| Contractual amount | Carrying value(h)(i) | |||||||||||||||||||||||||||||||||||||
| 2023 | 2022 | 2023 | 2022 | |||||||||||||||||||||||||||||||||||
| By remaining maturity as of December 31, (in millions) | Expires in 1 year or less | Expires after 1 year through 3 years | Expires after 3 years through 5 years | Expires after 5 years | Total | Total | ||||||||||||||||||||||||||||||||
| Lending-related | ||||||||||||||||||||||||||||||||||||||
| Consumer, excluding credit card: | ||||||||||||||||||||||||||||||||||||||
Residential Real Estate(a) | $ | $ | $ | $ | $ | $ | (j) | |||||||||||||||||||||||||||||||
| Auto and other | (j) | |||||||||||||||||||||||||||||||||||||
| Total consumer, excluding credit card | ||||||||||||||||||||||||||||||||||||||
Credit card(b) | ||||||||||||||||||||||||||||||||||||||
Total consumer(c) | ||||||||||||||||||||||||||||||||||||||
| Wholesale: | ||||||||||||||||||||||||||||||||||||||
Other unfunded commitments to extend credit(d) | (j)(k) | (k) | ||||||||||||||||||||||||||||||||||||
Standby letters of credit and other financial guarantees(d) | ||||||||||||||||||||||||||||||||||||||
Other letters of credit(d) | ||||||||||||||||||||||||||||||||||||||
Total wholesale(c) | ||||||||||||||||||||||||||||||||||||||
| Total lending-related | $ | $ | $ | $ | $ | $ | $ | $ | ||||||||||||||||||||||||||||||
| Other guarantees and commitments | ||||||||||||||||||||||||||||||||||||||
Securities lending indemnification agreements and guarantees(e) | $ | $ | $ | $ | $ | $ | $ | $ | ||||||||||||||||||||||||||||||
| Derivatives qualifying as guarantees | ||||||||||||||||||||||||||||||||||||||
Unsettled resale and securities borrowed agreements | ( | |||||||||||||||||||||||||||||||||||||
Unsettled repurchase and securities loaned agreements | ( | |||||||||||||||||||||||||||||||||||||
Loan sale and securitization-related indemnifications: | ||||||||||||||||||||||||||||||||||||||
| Mortgage repurchase liability | NA | NA | NA | NA | NA | NA | ||||||||||||||||||||||||||||||||
| Loans sold with recourse | NA | NA | NA | NA | ||||||||||||||||||||||||||||||||||
Exchange & clearing house guarantees and commitments(f) | ||||||||||||||||||||||||||||||||||||||
Other guarantees and commitments (g) | ||||||||||||||||||||||||||||||||||||||
(a)Includes certain commitments to purchase loans from correspondents.
(b)Also includes commercial card lending-related commitments primarily in CB and CIB.
(c)Predominantly all consumer and wholesale lending-related commitments are in the U.S.
(d)As of December 31, 2023 and 2022, reflected the contractual amount net of risk participations totaling $88 million and $71 million, respectively, for other unfunded commitments to extend credit; $8.2 589 million and $512 million, respectively, for other letters of credit. In regulatory filings with the Federal Reserve these commitments are shown gross of risk participations.
(e)As of December 31, 2023 and 2022, collateral held by the Firm in support of securities lending indemnification agreements was $300.3 billion and $298.5 billion, respectively. Securities lending collateral primarily consists of cash, G7 government securities, and securities issued by U.S. GSEs and government agencies.
(f)As of December 31, 2023 and 2022, includes guarantees to the Fixed Income Clearing Corporation under the sponsored member repo program and commitments and guarantees associated with the Firm’s membership in certain clearing houses.
(g)As of December 31, 2023 and 2022, primarily includes unfunded commitments related to certain tax-oriented equity investments, other equity investment commitments. and unfunded commitments to purchase secondary market loans.
(h)For lending-related products, the carrying value includes the allowance for lending-related commitments and the guarantee liability; for derivative-related products, and lending-related commitments for which the fair value option was elected, the carrying value represents the fair value.
(i)For lending-related commitments, the carrying value also includes fees and any purchase discounts or premiums that are deferred and recognized in accounts payable and other liabilities on the Consolidated balance sheets. Deferred amounts for revolving commitments and commitments not expected to fund, are amortized to lending- and deposit-related fees on a straight line basis over the commitment period. For all other commitments the deferred amounts remain deferred until the commitment funds or is sold.
(j)As of December 31, 2023, includes fair value adjustments associated with First Republic for residential real estate lending-related commitments totaling $630 million, for auto and other lending-related commitments totaling $148 million and for other unfunded commitments to extend credit totaling $1.1 billion. Refer to Note 34 for additional information.
(k)As of December 31, 2022, included net markdowns on held-for-sale positions related to unfunded commitments in the bridge financing portfolio.
292 | JPMorgan Chase & Co./2023 Form 10-K | |||||||
Other unfunded commitments to extend credit
Other unfunded commitments to extend credit generally consist of commitments for working capital and general corporate purposes, extensions of credit to support commercial paper facilities and bond financings in the event that those obligations cannot be remarketed to new investors, as well as committed liquidity facilities to clearing organizations. The Firm also issues commitments under multipurpose facilities which could be drawn upon in several forms, including the issuance of a standby letter of credit.
Guarantees
U.S. GAAP requires that a guarantor recognize, at the inception of a guarantee, a liability in an amount equal to the fair value of the obligation undertaken in issuing the guarantee. U.S. GAAP defines a guarantee as a contract that contingently requires the guarantor to pay the guaranteed party based upon: (a) changes in an underlying asset, liability or equity security of the guaranteed party; or (b) a third party’s failure to perform under a specified agreement. The Firm considers the following off–balance sheet arrangements to be guarantees under U.S. GAAP: standby letters of credit and other financial guarantees, securities lending indemnifications, certain indemnification agreements included within third-party contractual arrangements, certain derivative contracts and the guarantees under the sponsored member repo program.
As required by U.S. GAAP, the Firm initially records guarantees at the inception date fair value of the non-contingent obligation assumed (e.g., the amount of consideration received or the net present value of the premium receivable). For these obligations, the Firm records this fair value amount in other liabilities with an offsetting entry recorded in cash (for premiums received),
or other assets (for premiums receivable). Any premium receivable recorded in other assets is reduced as cash is received under the contract, and the fair value of the liability recorded at inception is amortized into income as lending and deposit-related fees over the life of the guarantee contract. The lending-related contingent obligation is recognized based on expected credit losses in addition to, and separate from, any non-contingent obligation.
Non-lending-related contingent obligations are recognized when the liability becomes probable and reasonably estimable. These obligations are not recognized if the estimated amount is less than the carrying amount of any non-contingent liability recognized at inception (adjusted for any amortization). Examples of non-lending-related contingent obligations include indemnifications provided in sales agreements, where a portion of the sale proceeds is allocated to the guarantee, which adjusts the gain or loss that would otherwise result from the transaction. For these indemnifications, the initial liability is amortized to income as the Firm’s risk is reduced (i.e., over time or when the indemnification expires).
The contractual amount and carrying value of guarantees and indemnifications are included in the table on page 292.
For additional information on the guarantees, see below.
Standby letters of credit and other financial guarantees
Standby letters of credit and other financial guarantees are conditional lending commitments issued by the Firm to guarantee the performance of a client or customer to a third party under certain arrangements, such as commercial paper facilities, bond financings, acquisition financings, trade financings and similar transactions.
The following table summarizes the contractual amount and carrying value of standby letters of credit and other financial guarantees and other letters of credit arrangements as of December 31, 2023 and 2022.
Standby letters of credit, other financial guarantees and other letters of credit
| 2023 | 2022 | ||||||||||||||||||||||||||||||||||
| December 31, (in millions) | Standby letters of credit and other financial guarantees | Other letters of credit | Standby letters of credit and other financial guarantees | Other letters of credit | |||||||||||||||||||||||||||||||
Investment-grade(a) | $ | $ | $ | $ | |||||||||||||||||||||||||||||||
Noninvestment-grade(a) | |||||||||||||||||||||||||||||||||||
| Total contractual amount | $ | $ | $ | $ | |||||||||||||||||||||||||||||||
| Allowance for lending-related commitments | $ | $ | $ | $ | |||||||||||||||||||||||||||||||
| Guarantee liability | |||||||||||||||||||||||||||||||||||
| Total carrying value | $ | $ | $ | $ | |||||||||||||||||||||||||||||||
| Commitments with collateral | $ | $ | $ | $ | |||||||||||||||||||||||||||||||
(a)The ratings scale is based on the Firm’s internal risk ratings. Refer to Note 12 for further information on internal risk ratings.
JPMorgan Chase & Co./2023 Form 10-K | 293 | |||||||
Notes to consolidated financial statements
Securities lending indemnifications
Through the Firm’s securities lending program, counterparties’ securities, via custodial and non-custodial arrangements, may be lent to third parties. As part of this program, the Firm provides an indemnification in the lending agreements which protects the lender against the failure of the borrower to return the lent securities. To minimize its liability under these indemnification agreements, the Firm obtains cash or other highly liquid collateral with a market value exceeding 100 % of the value of the securities on loan from the borrower. Collateral is marked to market daily to help assure that collateralization is adequate. Additional collateral is called from the borrower if a shortfall exists, or collateral may be released to the borrower in the event of overcollateralization. If a borrower defaults, the Firm would use the collateral held to purchase replacement securities in the market or to credit the lending client or counterparty with the cash equivalent thereof.
The cash collateral held by the Firm may be invested on behalf of the client in indemnified resale agreements, whereby the Firm indemnifies the client against the loss of principal invested. To minimize its liability under these agreements, the Firm obtains collateral with a market value exceeding 100 % of the principal invested.
Derivatives qualifying as guarantees
The Firm transacts in certain derivative contracts that have the characteristics of a guarantee under U.S. GAAP. These contracts include written put options that require the Firm to purchase assets upon exercise by the option holder at a specified price by a specified date in the future. The Firm may enter into written put option contracts in order to meet client needs, or for other trading purposes. The terms of written put options are typically five years or less.
Derivatives deemed to be guarantees also includes stable value contracts, commonly referred to as “stable value products”, that require the Firm to make a payment of the difference between the market value and the book value of a counterparty’s reference portfolio of assets in the event that market value is less than book value and certain other conditions have been met. Stable value products are transacted in order to allow investors to realize investment returns with less volatility than an unprotected portfolio. These contracts are typically longer-term or may have no stated maturity, but allow the Firm to elect to terminate the contract under certain conditions.
The notional value of derivative guarantees generally represents the Firm’s maximum exposure. However, exposure to certain stable value products is contractually limited to a substantially lower percentage of the notional amount.
The fair value of derivative guarantees reflects the probability, in the Firm’s view, of whether the Firm will be required to perform under the contract. The Firm reduces exposures to these contracts by entering into offsetting transactions, or by entering into contracts that hedge the market risk related to the derivative guarantees.
The following table summarizes the derivatives qualifying as guarantees as of December 31, 2023 and 2022.
| (in millions) | December 31, 2023 | December 31, 2022 | |||||||||
| Notional amounts | |||||||||||
| Derivative guarantees | $ | $ | |||||||||
Stable value contracts with contractually limited exposure | |||||||||||
Maximum exposure of stable value contracts with contractually limited exposure | |||||||||||
| Fair value | |||||||||||
| Derivative payables | |||||||||||
In addition to derivative contracts that meet the characteristics of a guarantee, the Firm is both a purchaser and seller of credit protection in the credit derivatives market. Refer to Note 5 for a further discussion of credit derivatives.
Unsettled securities financing agreements
In the normal course of business, the Firm enters into resale and securities borrowed agreements. At settlement, these commitments result in the Firm advancing cash to and receiving securities collateral from the counterparty. The Firm also enters into repurchase and securities loaned agreements. At settlement, these commitments result in the Firm receiving cash from and providing securities collateral to the counterparty. Such agreements settle at a future date. These agreements generally do not meet the definition of a derivative, and therefore, are not recorded on the Consolidated balance sheets until settlement date. These agreements predominantly have regular-way settlement terms. Refer to Note 11 for a further discussion of securities financing agreements.
Loan sales- and securitization-related indemnifications
Mortgage repurchase liability
In connection with the Firm’s mortgage loan sale and securitization activities with U.S. GSEs the Firm has made representations and warranties that the loans sold meet certain requirements, and that may require the Firm to repurchase mortgage loans and/or indemnify the loan purchaser if such representations and warranties are breached by the Firm.
Private label securitizations
The liability related to repurchase demands associated with private label securitizations is separately evaluated by the Firm in establishing its litigation reserves.
Refer to Note 30 for additional information regarding litigation.
Loans sold with recourse
The Firm provides servicing for mortgages and certain commercial lending products on both a recourse and nonrecourse basis. In nonrecourse servicing, the principal credit risk to the Firm is the cost of temporary servicing advances of funds (i.e., normal servicing advances). In recourse servicing, the servicer agrees to share credit risk with the owner of the mortgage loans, such as Fannie Mae
294 | JPMorgan Chase & Co./2023 Form 10-K | |||||||
or Freddie Mac or a private investor, insurer or guarantor. Losses on recourse servicing predominantly occur when foreclosure sales proceeds of the property underlying a defaulted loan are less than the sum of the outstanding principal balance, plus accrued interest on the loan and the cost of holding and disposing of the underlying property. The Firm’s securitizations are predominantly nonrecourse, thereby effectively transferring the risk of future credit losses to the purchaser of the mortgage-backed securities issued by the trust. The unpaid principal balance of loans sold with recourse as well as the carrying value of the related liability that the Firm has recorded in accounts payable and other liabilities on the Consolidated balance sheets, which is representative of the Firm’s view of the likelihood it will have to perform under its recourse obligations, are disclosed in the table on page 292.
Other off-balance sheet arrangements
Indemnification agreements – general
In connection with issuing securities to investors outside the U.S., the Firm may agree to pay additional amounts to the holders of the securities in the event that, due to a change in tax law, certain types of withholding taxes are imposed on payments on the securities. The terms of the securities may also give the Firm the right to redeem the securities if such additional amounts are payable. The Firm may also enter into indemnification clauses in connection with the licensing of software to clients (“software licensees”) or when it sells a business or assets to a third party (“third-party purchasers”), pursuant to which it indemnifies software licensees for claims of liability or damages that may occur subsequent to the licensing of the software, or third-party purchasers for losses they may incur due to actions taken by the Firm prior to the sale of the business or assets. It is difficult to estimate the Firm’s maximum exposure under these indemnification arrangements, since this would require an assessment of future changes in tax law and future claims that may be made against the Firm that have not yet occurred. However, based on historical experience, management expects the risk of loss to be remote.
Merchant charge-backs
Under the rules of payment networks, in its role as a merchant acquirer, the Firm’s Merchant Services business in CIB Payments, retains a contingent liability for disputed processed credit and debit card transactions that result in a charge-back to the merchant. If a dispute is resolved in the cardholder’s favor, the Firm will (through the cardholder’s issuing bank) credit or refund the amount to the cardholder and will charge back the transaction to the merchant. If the Firm is unable to collect the amount from the merchant, the Firm will bear the loss for the amount credited or refunded to the cardholder. The Firm mitigates this risk by withholding future settlements, retaining cash reserve accounts or obtaining other collateral. In addition, the Firm recognizes a valuation allowance that covers the payment or performance risk related to charge-backs.
For the years ended December 31, 2023, 2022 and 2021, the Firm processed an aggregate volume of $2,411.0 billion, $2,158.4 billion, and $1,886.7 billion, respectively.
Clearing Services – Client Credit Risk
The Firm provides clearing services for clients by entering into securities purchases and sales and derivative contracts with CCPs, including ETDs such as futures and options, as well as OTC-cleared derivative contracts. As a clearing member, the Firm stands behind the performance of its clients, collects cash and securities collateral (margin) as well as any settlement amounts due from or to clients, and remits them to the relevant CCP or client in whole or part. There are two types of margin: variation margin is posted on a daily basis based on the value of clients’ derivative contracts and initial margin is posted at inception of a derivative contract, generally on the basis of the potential changes in the variation margin requirement for the contract.
As a clearing member, the Firm is exposed to the risk of nonperformance by its clients, but is not liable to clients for the performance of the CCPs. Where possible, the Firm seeks to mitigate its risk to the client through the collection of appropriate amounts of margin at inception and throughout the life of the transactions. The Firm can also cease providing clearing services if clients do not adhere to their obligations under the clearing agreement. In the event of nonperformance by a client, the Firm would close out the client’s positions and access available margin. The CCP would utilize any margin it holds to make itself whole, with any remaining shortfalls required to be paid by the Firm as a clearing member.
The Firm reflects its exposure to nonperformance risk of the client through the recognition of margin receivables from clients and margin payables to CCPs; the clients’ underlying securities or derivative contracts are not reflected in the Firm’s Consolidated Financial Statements.
It is difficult to estimate the Firm’s maximum possible exposure through its role as a clearing member, as this would require an assessment of transactions that clients may execute in the future. However, based upon historical experience, and the credit risk mitigants available to the Firm, management believes it is unlikely that the Firm will have to make any material payments under these arrangements and the risk of loss is expected to be remote.
Refer to Note 5 for information on the derivatives that the Firm executes for its own account and records in its Consolidated Financial Statements.
JPMorgan Chase & Co./2023 Form 10-K | 295 | |||||||
Notes to consolidated financial statements
Exchange & Clearing House Memberships
The Firm is a member of several securities and derivative exchanges and clearing houses, both in the U.S. and other countries, and it provides clearing services to its clients. Membership in some of these organizations requires the Firm to pay a pro rata share of the losses incurred by the organization as a result of the default of another member. Such obligations vary with different organizations. These obligations may be limited to the amount (or a multiple of the amount) of the Firm’s contribution to the guarantee fund maintained by a clearing house or exchange as part of the resources available to cover any losses in the event of a member default. Alternatively, these obligations may also include a pro rata share of the residual losses after applying the guarantee fund. Additionally, certain clearing houses require the Firm as a member to pay a pro rata share of losses that may result from the clearing house’s investment of guarantee fund contributions and initial margin, unrelated to and independent of the default of another member. Generally a payment would only be required should such losses exceed the resources of the clearing house or exchange that are contractually required to absorb the losses in the first instance. In certain cases, it is difficult to estimate the Firm’s maximum possible exposure under these membership agreements, since this would require an assessment of future claims that may be made against the Firm that have not yet occurred. However, based on historical experience, management expects the risk of loss to the Firm to be remote. Where the Firm’s maximum possible exposure can be estimated, the amount is disclosed in the table on page 292, in the Exchange & clearing house guarantees and commitments line.
Sponsored member repo program
The Firm acts as a sponsoring member to clear eligible overnight and term resale and repurchase agreements through the Government Securities Division of the Fixed Income Clearing Corporation (“FICC”) on behalf of clients that become sponsored members under the FICC’s rules. The Firm also guarantees to the FICC the prompt and full payment and performance of its sponsored member clients’ respective obligations under the FICC’s rules. The Firm minimizes its liability under these guarantees by obtaining a security interest in the cash or high-quality securities collateral that the clients place with the clearing house; therefore, the Firm expects the risk of loss to be remote. The Firm’s maximum possible exposure, without taking into consideration the associated collateral, is included in the Exchange & clearing house guarantees and commitments line on page 292. Refer to Note 11 for additional information on credit risk mitigation practices on resale agreements and the types of collateral pledged under repurchase agreements.
Guarantees of subsidiaries
In the normal course of business, the Parent Company may provide counterparties with guarantees of certain of the trading and other obligations of its subsidiaries on a contract-by-contract basis, as negotiated with the Firm’s
counterparties. The obligations of the subsidiaries are included on the Firm’s Consolidated balance sheets or are reflected as off-balance sheet commitments; therefore, the Parent Company has not recognized a separate liability for these guarantees. The Firm believes that the occurrence of any event that would trigger payments by the Parent Company under these guarantees is remote.
The Parent Company has guaranteed certain long-term debt and structured notes of its subsidiaries, including JPMorgan Chase Financial Company LLC (“JPMFC”), a 100 %-owned finance subsidiary. All securities issued by JPMFC are fully and unconditionally guaranteed by the Parent Company and no other subsidiary of the parent company guarantees these securities. These guarantees, which rank pari passu with the Firm’s unsecured and unsubordinated indebtedness, are not included in the table on page 292 of this Note. Refer to Note 20 for additional information.
296 | JPMorgan Chase & Co./2023 Form 10-K | |||||||
Note 29 – Pledged assets and collateral
Pledged assets
The Firm pledges financial assets that it owns to maintain potential borrowing capacity at discount windows with Federal Reserve banks, various other central banks and FHLBs. Additionally, the Firm pledges assets for other purposes, including to collateralize repurchase and other securities financing agreements, to cover short sales and to collateralize derivative contracts and deposits. Certain of these pledged assets may be sold or repledged or otherwise used by the secured parties and are parenthetically identified on the Consolidated balance sheets as assets pledged.
The following table presents the Firm’s pledged assets.
| December 31, (in billions) | 2023 | 2022 | ||||||||||||
| Assets that may be sold or repledged or otherwise used by secured parties | $ | $ | ||||||||||||
Assets that may not be sold or repledged or otherwise used by secured parties (a) | ||||||||||||||
| Assets pledged at Federal Reserve banks and FHLBs | ||||||||||||||
| Total pledged assets | $ | $ | ||||||||||||
(a)As of December 31, 2023, included $88.4 billion of assets pledged to the FDIC associated with the First Republic acquisition. Refer to Note 34 for additional information.
Total pledged assets do not include assets of consolidated VIEs; these assets are used to settle the liabilities of those entities. Refer to Note 14 for additional information on assets and liabilities of consolidated VIEs. Refer to Note 11 for additional information on the Firm’s securities financing activities. Refer to Note 20 for additional information on the Firm’s long-term debt. The significant components of the Firm’s pledged assets were as follows.
| December 31, (in billions) | 2023 | 2022 | ||||||||||||
| Investment securities | $ | $ | ||||||||||||
| Loans | ||||||||||||||
| Trading assets and other | ||||||||||||||
| Total pledged assets | $ | $ | ||||||||||||
Collateral
The Firm accepts financial assets as collateral that it is permitted to sell or repledge, deliver or otherwise use. This collateral is generally obtained under resale and other securities financing agreements, prime brokerage-related held-for-investment customer receivables and derivative contracts. Collateral is generally used under repurchase and other securities financing agreements, to cover short sales, and to collateralize derivative contracts and deposits.
The following table presents the fair value of collateral accepted.
| December 31, (in billions) | 2023 | 2022 | ||||||||||||
| Collateral permitted to be sold or repledged, delivered, or otherwise used | $ | $ | ||||||||||||
| Collateral sold, repledged, delivered or otherwise used | ||||||||||||||
JPMorgan Chase & Co./2023 Form 10-K | 297 | |||||||
Notes to consolidated financial statements
Note 30 – Litigation
Contingencies
As of December 31, 2023, the Firm and its subsidiaries and affiliates are defendants or respondents in numerous evolving legal proceedings, including private proceedings, public proceedings, government investigations, regulatory enforcement matters, and the matters described below. The litigations range from individual actions involving a single plaintiff to class action lawsuits with potentially millions of class members. Investigations and regulatory enforcement matters involve both formal and informal proceedings, by both governmental agencies and self-regulatory organizations. These legal proceedings are at varying stages of adjudication, arbitration or investigation, and involve each of the Firm’s lines of business and several geographies and a wide variety of claims (including common law tort and contract claims and statutory antitrust, securities and consumer protection claims), some of which present novel legal theories.
The Firm believes the estimate of the aggregate range of reasonably possible losses, in excess of reserves established, for its legal proceedings is from $0 to approximately $1.3 billion at December 31, 2023. This estimated aggregate range of reasonably possible losses was based upon information available as of that date for those proceedings in which the Firm believes that an estimate of reasonably possible loss can be made. For certain matters, the Firm does not believe that such an estimate can be made, as of that date. The Firm’s estimate of the aggregate range of reasonably possible losses involves significant judgment, given:
•the number, variety and varying stages of the proceedings, including the fact that many are in preliminary stages,
•the existence in many such proceedings of multiple defendants, including the Firm, whose share of liability (if any) has yet to be determined,
•the numerous yet-unresolved issues in many of the proceedings, including issues regarding class certification and the scope of many of the claims, and
•the uncertainty of the various potential outcomes of such proceedings, including where the Firm has made assumptions concerning future rulings by the court or other adjudicator, or about the behavior or incentives of adverse parties or regulatory authorities, and those assumptions prove to be incorrect.
In addition, the outcome of a particular proceeding may be a result which the Firm did not take into account in its estimate because the Firm had deemed the likelihood of that outcome to be remote. Accordingly, the Firm’s estimate of the aggregate range of reasonably possible losses will change from time to time, and actual losses may vary significantly.
Set forth below are descriptions of the Firm’s material legal proceedings.
1MDB Litigation. J.P. Morgan (Suisse) SA was named as a defendant in a civil litigation filed in May 2021 in Malaysia by 1Malaysia Development Berhad (“1MDB”), a Malaysian state-owned and controlled investment fund. The claim alleges “dishonest assistance” against J.P. Morgan (Suisse) SA in relation to payments of $300 million and $500 million, from 2009 and 2010, respectively, received from 1MDB and paid into an account at J.P. Morgan (Suisse) SA held by 1MDB PetroSaudi Limited, a joint venture company between 1MDB and PetroSaudi Holdings (Cayman) Limited. The Firm is challenging the validity of service and the Malaysian Court’s jurisdiction to hear the claim. In August 2023 the Court denied an application by 1MDB to discontinue its claim with permission to re-file a new claim in the future. An appeals court is scheduled in August 2024 to hear separate appeals filed by 1MDB and the Firm against that August 2023 decision. In its appeal, the Firm seeks to prevent any claim from continuing.
In addition, in November 2023, the Federal Office of the Attorney General (OAG) in Switzerland notified J.P. Morgan (Suisse) SA that it is conducting an investigation into possible criminal liability in connection with transactions arising from J.P. Morgan (Suisse) SA’s relationship with the 1MDB PetroSaudi joint venture and its related persons for the period September 2009 through August 2015. The OAG investigation is ongoing.
Amrapali. India’s Enforcement Directorate (“ED”) is investigating J.P. Morgan India Private Limited in connection with investments made in 2010 and 2012 by two offshore funds formerly managed by JPMorgan Chase entities into residential housing projects developed by the Amrapali Group (“Amrapali”) relating to delays in delivering or failure to deliver residential units. In August 2021, the ED issued an order fining J.P. Morgan India Private Limited approximately $31.5 million, and the Firm is appealing that order. Relatedly, in July 2019, the Supreme Court of India issued an order making preliminary findings that Amrapali and other parties, including unspecified JPMorgan Chase entities and the offshore funds that had invested in the projects, violated certain criminal currency control and money laundering provisions, and ordered the ED to conduct a further inquiry. The Firm is responding to and cooperating with the inquiry.
Foreign Exchange Investigations and Litigation. The Firm previously reported settlements with certain government authorities relating to its foreign exchange (“FX”) sales and trading activities and controls related to those activities. Among those resolutions, in May 2015, the Firm pleaded guilty to a single violation of federal antitrust law. The Department of Labor ("DOL") granted the Firm exemptions that permit the Firm and its affiliates to continue to rely on the Qualified Professional Asset Manager exemption under
298 | JPMorgan Chase & Co./2023 Form 10-K | |||||||
the Employee Retirement Income Security Act (“ERISA”) through the ten-year disqualification period following the antitrust plea. The only remaining FX-related governmental inquiry is a South Africa Competition Commission matter which is currently pending before the South Africa Competition Tribunal.
With respect to civil litigation matters, in a putative class action filed against the Firm and other foreign exchange dealers on behalf of certain parties who purchased foreign currencies at allegedly inflated rates, the District Court denied certification of a class and granted summary judgment against the named plaintiffs in March 2023. An appeal by those plaintiffs of the District Court's decision is pending. In addition, some FX-related individual and putative class actions based on similar alleged underlying conduct have been filed outside the U.S., including in the U.K., Israel, the Netherlands, Brazil and Australia. An agreement to resolve one of the U.K. actions was reached in December 2022. In July 2023, the U.K. Court of Appeal overturned the Competition Appeal Tribunal's earlier denial of a request for class certification on an opt-out basis. In Israel, a settlement in principle has been reached on the putative class action, which remains subject to court approval.
Government Inquiries Related to the Zelle Network. The Firm is responding to inquiries from civil government authorities regarding the handling of disputes related to transfers of funds through the Zelle Network. The Firm is cooperating with these inquiries and responding to requests for information.
Interchange Litigation. Groups of merchants and retail associations filed a series of class action complaints alleging that Visa and Mastercard, as well as certain banks, conspired to set the price of credit and debit card interchange fees and enacted related rules in violation of antitrust laws.
In September 2018, the parties settled the class action seeking monetary relief, with the defendants collectively contributing approximately $6.2 billion. The settlement has been approved by the District Court and affirmed on appeal. Based on the percentage of merchants that opted out of the settlement, $700 million has been returned to the defendants from the settlement escrow. A separate class action seeking injunctive relief continues, and in September 2021, the District Court granted plaintiffs’ motion for class certification in part, and denied the motion in part.
Of the merchants who opted out of the damages class settlement, certain merchants filed individual actions raising similar allegations against Visa and Mastercard, as well as against the Firm and other banks. While some of those actions remain pending, the defendants have reached settlements with the merchants who opted out representing approximately 70 % of the combined Mastercard-branded and Visa-branded payment card sales volume.
Jeffrey Epstein Litigation. JPMorgan Chase Bank, N.A. was named as a defendant in lawsuits filed in the United States
District Court for the Southern District of New York alleging that JPMorgan Chase Bank, N.A. knowingly facilitated Jeffrey Epstein’s sex trafficking and other unlawful conduct by providing banking services to Epstein until 2013. In June 2023, the Court granted preliminary approval of a settlement between the victim class and JPMorgan Chase Bank, N.A., pursuant to which JPMorgan Chase Bank, N.A. paid $290 million to a fund for Epstein survivors. In November 2023, the Court granted final approval of the settlement, rejecting objections, including those of certain state Attorneys General, regarding the victims’ releases.
LIBOR and Other Benchmark Rate Investigations and Litigation. JPMorgan Chase has responded to inquiries from various governmental agencies and entities around the world relating primarily to the British Bankers Association’s (“BBA”) London Interbank Offered Rate (“LIBOR”) for various currencies and the European Banking Federation’s Euro Interbank Offered Rate (“EURIBOR”). The Swiss Competition Commission’s investigation relating to EURIBOR, to which the Firm and one other bank remain subject, continues. The Firm appealed a December 2016 decision by the European Commission against the Firm and other banks finding an infringement of European antitrust rules relating to EURIBOR. In December 2023, the European General Court annulled the fine imposed by the European Commission, but exercised its discretion to re-impose a fine in an identical amount. The Firm is considering its options.
In addition, the Firm has been named as a defendant along with other banks in various individual and putative class actions related to benchmark rates, including U.S. dollar LIBOR. In actions related to U.S. dollar LIBOR during the period that it was administered by the BBA, the Firm has obtained dismissal of certain actions and resolved certain other actions, and others are in various stages of litigation. The United States District Court for the Southern District of New York has granted class certification of antitrust claims related to bonds and interest rate swaps sold directly by the defendants, including the Firm. In addition, a lawsuit filed by a group of individual plaintiffs asserting antitrust claims, alleging that the Firm and other defendants were engaged in an unlawful agreement to set U.S. dollar LIBOR and conspired to monopolize the market for LIBOR-based consumer loans and credit cards was dismissed in October 2023. Plaintiff filed an appeal of the dismissal to the United States Court of Appeals for the Ninth Circuit in November 2023. The Firm has resolved all non-U.S. dollar LIBOR actions.
Russian Litigation. The Firm is obligated to comply with international sanctions laws, which mandate the freezing or restriction of certain assets. These laws apply when assets associated with individuals, companies, products or services are within the scope of the sanctions. The Firm has faced actual and threatened litigation in Russia seeking payments on transactions that the Firm cannot make, and is contractually excused from paying, under relevant sanctions laws, with judgment entered against the Firm in one claim in February 2024. The Russian court may
JPMorgan Chase & Co./2023 Form 10-K | 299 | |||||||
Notes to consolidated financial statements
disregard the parties’ contractual agreement on forum selection, and may not recognize foreign sanctions laws as a basis for not making payment. The Firm holds assets in Russia, which could be seized if the claims are granted and enforced.
SEC Inquiries. The Firm is responding to requests from the SEC regarding aspects of certain advisory programs within J.P. Morgan Securities LLC, including aggregation of accounts for billing, discounting advisory fees, and selecting portfolio managers. Separately, the Firm is responding to requests from the SEC in connection with the timing of the Firm’s liquidation of shares distributed in-kind to certain investment vehicles that invest in third-party managed private funds. The Firm is cooperating with the SEC in regard to both inquires.
Securities Lending Antitrust Litigation. JPMorgan Chase Bank, N.A., J.P. Morgan Securities LLC, J.P. Morgan Prime, Inc., and J.P. Morgan Strategic Securities Lending Corp. are named as defendants in a putative class action filed in the United States District Court for the Southern District of New York. The complaint asserts violations of federal antitrust law and New York State common law in connection with an alleged conspiracy to prevent the emergence of anonymous exchange trading for securities lending transactions. The settlement of this action by the parties has been preliminarily approved, and is subject to final court approval.
Shareholder Litigation. Several shareholder putative class actions, as well as shareholder derivative actions purporting to act on behalf of the Firm, have been filed against the Firm, its Board of Directors and certain of its current and former officers.
Certain of these shareholder suits relate to historical trading practices by former employees in the precious metals and U.S. treasuries markets and related conduct which were the subject of the Firm’s resolutions with the DOJ, CFTC and SEC in September 2020, and fiduciary activities that were separately the subject of a resolution between JPMorgan Chase Bank, N.A. and the OCC in November 2020. One of these shareholder derivative suits was filed in the Supreme Court of the State of New York in May 2022, asserting breach of fiduciary duty and unjust enrichment claims relating to the historical trading practices and related conduct and fiduciary activities which were the subject of the resolutions described above. In December 2022, the court granted defendants’ motion to dismiss this action in full, and in July 2023, the plaintiff filed an appeal, which remains pending. A second shareholder derivative action was filed in the United States District Court for the Eastern District of New York in December 2022 relating to the historical trading practices and related conduct, which asserts breach of fiduciary duty and contribution claims and alleges that the shareholder is excused from making a demand to commence litigation because such a demand would have been futile. Defendants have moved to dismiss the complaint. In addition, a consolidated putative class action is pending in the United
States District Court for the Eastern District of New York on behalf of shareholders who acquired shares of JPMorgan Chase common stock during the putative class period, alleging that certain SEC filings of the Firm were materially false or misleading because they did not disclose certain information relating to the historical trading practices and conduct. In December 2023, the court granted Defendants’ motion to dismiss the amended complaint.
A shareholder derivative suit was filed in May 2023 in the United States District Court for the Southern District of New York against various officers and directors of the Firm asserting breaches of fiduciary duty and unjust enrichment based upon allegations that the defendants caused the Firm to retain Jeffrey Epstein as a client of the bank after defendants knew, or should have known, that Epstein was using the Firm’s financial services to facilitate his alleged sex trafficking activities. In December 2023, the Court dismissed the derivative action.
A separate shareholder derivative suit was filed in March 2022 in the United States District Court for the Eastern District of New York asserting breaches of fiduciary duty and violations of federal securities laws based on the alleged failure of the Board of Directors to exercise adequate oversight over the Firm’s compliance with records preservation requirements which were the subject of resolutions between certain of the Firm’s subsidiaries and the SEC and the CFTC. Defendants’ motion to dismiss the amended complaint is pending.
Trading Venues Investigations. The Firm has been responding to government inquiries regarding its processes to inventory trading venues and confirm the completeness of certain data fed to trade surveillance platforms. The Firm self-identified that certain trading and order data through the CIB was not feeding into its trade surveillance platforms. The Firm has completed enhancements to the CIB’s venue inventory and data completeness controls, and other remediation is underway. The Firm has also performed a review of the data not originally surveilled, which is nearly complete, and has not identified any employee misconduct, harm to clients or the market. While the identified gaps represent a fraction of the overall activity across the CIB, the data gap on one venue, which largely consisted of sponsored client access activity, was significant. The Firm is dedicated to maintaining rigorous controls and continuously enhancing the reliability of its trade infrastructure. The Firm expects to enter into resolutions with two U.S. regulators that will require the Firm to, among other things, complete its remediation, engage an independent consultant, and pay aggregate civil penalties of approximately $350 million. The Firm is also in advanced negotiations with a third U.S. regulator, but there is no assurance that such discussions will result in a resolution. The Firm does not expect any disruption of service to clients as a result of these resolutions.
* * *
300 | JPMorgan Chase & Co./2023 Form 10-K | |||||||
In addition to the various legal proceedings discussed above, JPMorgan Chase and its subsidiaries are named as defendants or are otherwise involved in a substantial number of other legal proceedings. The Firm believes it has meritorious defenses to the claims asserted against it in its currently outstanding legal proceedings and it intends to defend itself vigorously. Additional legal proceedings may be initiated from time to time in the future.
The Firm has established reserves for several hundred of its currently outstanding legal proceedings. In accordance with the provisions of U.S. GAAP for contingencies, the Firm accrues for a litigation-related liability when it is probable that such a liability has been incurred and the amount of the loss can be reasonably estimated. The Firm evaluates its outstanding legal proceedings each quarter to assess its litigation reserves, and makes adjustments in such reserves, upward or downward, as appropriate, based on management’s best judgment after consultation with counsel. The Firm’s legal expense was $1.4 billion, $266 million and $426 million for the years ended December 31, 2023, 2022 and 2021, respectively. There is no assurance that the Firm’s litigation reserves will not need to be adjusted in the future.
In view of the inherent difficulty of predicting the outcome of legal proceedings, particularly where the claimants seek very large or indeterminate damages, or where the matters present novel legal theories, involve a large number of parties or are in early stages of discovery, the Firm cannot state with confidence what will be the eventual outcomes of the currently pending matters, the timing of their ultimate resolution or the eventual losses, fines, penalties or consequences related to those matters. JPMorgan Chase believes, based upon its current knowledge and after consultation with counsel, consideration of the material legal proceedings described above and after taking into account its current litigation reserves and its estimated aggregate range of possible losses, that the other legal proceedings currently pending against it should not have a material adverse effect on the Firm’s consolidated financial condition. The Firm notes, however, that in light of the uncertainties involved in such proceedings, there is no assurance that the ultimate resolution of these matters will not significantly exceed the reserves it has currently accrued or that a matter will not have material reputational consequences. As a result, the outcome of a particular matter may be material to JPMorgan Chase’s operating results for a particular period, depending on, among other factors, the size of the loss or liability imposed and the level of JPMorgan Chase’s income for that period.
JPMorgan Chase & Co./2023 Form 10-K | 301 | |||||||
Notes to consolidated financial statements
Note 31 – International operations
The following table presents income statement and balance sheet-related information for JPMorgan Chase by major international geographic area. The Firm defines international activities for purposes of this footnote presentation as business transactions that involve clients residing outside of the U.S., and the information presented below is based predominantly on the domicile of the client, the location from which the client relationship is managed, booking location or the location of the trading desk. However, many of the Firm’s U.S. operations serve international businesses.
As the Firm’s operations are highly integrated, estimates and subjective assumptions have been made to apportion revenue and expense between U.S. and international operations. These estimates and assumptions are consistent with the allocations used for the Firm’s segment reporting as set forth in Note 32.
The Firm’s long-lived assets for the periods presented are not considered by management to be significant in relation to total assets. The majority of the Firm’s long-lived assets are located in the U.S.
| As of or for the year ended December 31, (in millions) | Revenue(c) | Expense(d) | Income before income tax expense | Net income | Total assets | ||||||||||||||||||||||||||||||
| 2023 | |||||||||||||||||||||||||||||||||||
| Europe/Middle East/Africa | $ | $ | $ | $ | $ | (e) | |||||||||||||||||||||||||||||
| Asia-Pacific | |||||||||||||||||||||||||||||||||||
| Latin America/Caribbean | |||||||||||||||||||||||||||||||||||
| Total international | |||||||||||||||||||||||||||||||||||
North America(a)(b) | |||||||||||||||||||||||||||||||||||
| Total | $ | $ | $ | $ | $ | ||||||||||||||||||||||||||||||
2022 | |||||||||||||||||||||||||||||||||||
| Europe/Middle East/Africa | $ | $ | $ | $ | $ | (e) | |||||||||||||||||||||||||||||
| Asia-Pacific | |||||||||||||||||||||||||||||||||||
| Latin America/Caribbean | |||||||||||||||||||||||||||||||||||
| Total international | |||||||||||||||||||||||||||||||||||
North America(a) | |||||||||||||||||||||||||||||||||||
| Total | $ | $ | $ | $ | $ | ||||||||||||||||||||||||||||||
2021 | |||||||||||||||||||||||||||||||||||
| Europe/Middle East/Africa | $ | $ | $ | $ | $ | (e) | |||||||||||||||||||||||||||||
| Asia-Pacific | |||||||||||||||||||||||||||||||||||
| Latin America/Caribbean | |||||||||||||||||||||||||||||||||||
| Total international | |||||||||||||||||||||||||||||||||||
North America(a) | |||||||||||||||||||||||||||||||||||
| Total | $ | $ | $ | $ | $ | ||||||||||||||||||||||||||||||
(a)Substantially reflects the U.S.
(b)Includes the impact of First Republic. Refer to Note 34 for additional information.
(c)Revenue is composed of net interest income and noninterest revenue.
(d)Expense is composed of noninterest expense and the provision for credit losses.
(e)Total assets for the U.K. were approximately $352 billion, $357 billion and $365 billion at December 31, 2023, 2022 and 2021, respectively.
302 | JPMorgan Chase & Co./2023 Form 10-K | |||||||
Note 32 – Business segments
The Firm is managed on an LOB basis. There are four major reportable business segments – Consumer & Community Banking, Corporate & Investment Bank, Commercial Banking and Asset & Wealth Management. In addition, there is a Corporate segment. The business segments are determined based on the products and services provided, or the type of customer served, and they reflect the manner in which financial information is evaluated by the Firm’s Operating Committee. Segment results are presented on a managed basis. Refer to Segment results of this footnote for a further discussion of JPMorgan Chase’s business segments.
The following is a description of each of the Firm’s business segments, and the products and services they provide to their respective client bases.
Consumer & Community Banking
Consumer & Community Banking offers products and services to consumers and small businesses through bank branches, ATMs, digital (including mobile and online) and telephone banking. CCB is organized into Banking & Wealth Management (including Consumer Banking, J.P. Morgan Wealth Management and Business Banking), Home Lending (including Home Lending Production, Home Lending Servicing and Real Estate Portfolios) and Card Services & Auto. Banking & Wealth Management offers deposit, investment and lending products, cash management, payments and services. Home Lending includes mortgage origination and servicing activities, as well as portfolios consisting of residential mortgages and home equity loans. Card Services issues credit cards and offers travel services. Auto originates and services auto loans and leases.
Corporate & Investment Bank
The Corporate & Investment Bank, which consists of Banking and Markets & Securities Services, offers a broad suite of investment banking, market-making, prime brokerage, lending, and treasury and securities products and services to a global client base of corporations, investors, financial institutions, merchants, government and municipal entities. Banking offers a full range of investment banking products and services in all major capital markets, including advising on corporate strategy and structure, capital-raising in equity and debt markets, as well as loan origination and syndication. Banking also includes Payments, which provides services, that enable clients to manage payments globally across liquidity and account solutions, commerce solutions, clearing, trade and working capital. Markets & Securities Services includes Markets, a global market-maker across products, including cash and derivative instruments, which also offers sophisticated risk management solutions, prime brokerage, clearing and research. Markets & Securities Services also includes
Securities Services, a leading global custodian which provides custody, fund accounting and administration, and securities lending products principally for asset managers, insurance companies and public and private investment funds.
Commercial Banking
Commercial Banking provides comprehensive financial solutions, including lending, payments, investment banking and asset management products across three primary client segments: Middle Market Banking, Corporate Client Banking and Commercial Real Estate Banking. Other includes amounts not aligned with a primary client segment.
Middle Market Banking covers small and midsized companies, local governments and nonprofit clients.
Corporate Client Banking covers large corporations.
Commercial Real Estate Banking covers investors, developers, and owners of multifamily, office, retail, industrial and affordable housing properties.
Asset & Wealth Management
Asset & Wealth Management, with client assets of $5.0 trillion, is a global leader in investment and wealth management.
Asset Management
Offers multi-asset investment management solutions across equities, fixed income, alternatives and money market funds to institutional and retail investors providing for a broad range of clients’ investment needs.
Global Private Bank
Provides retirement products and services, brokerage, custody, estate planning, lending, deposits and investment management to high net worth clients.
The majority of AWM’s client assets are in actively managed portfolios.
Corporate
The Corporate segment consists of Treasury and Chief Investment Office (“CIO”) and Other Corporate. Treasury and CIO is predominantly responsible for measuring, monitoring, reporting and managing the Firm’s liquidity, funding, capital, structural interest rate and foreign exchange risks.
Other Corporate includes staff functions and expense that is centrally managed as well as certain Firm initiatives and activities not solely aligned to a specific LOB. The major Other Corporate functions include Real Estate, Technology, Legal, Corporate Finance, Human Resources, Internal Audit, Risk Management, Compliance, Control Management, Corporate Responsibility and various Other Corporate groups.
JPMorgan Chase & Co./2023 Form 10-K | 303 | |||||||
Notes to consolidated financial statements
Segment results
The following table provides a summary of the Firm’s segment results as of or for the years ended December 31, 2023, 2022 and 2021, on a managed basis. The Firm’s definition of managed basis starts with the reported U.S. GAAP results and includes certain reclassifications to present total net revenue for the Firm (and each of the reportable business segments) on an FTE basis. Accordingly, revenue from investments that receive tax credits and tax-exempt securities is presented in the managed results on a basis comparable to taxable investments and securities. This allows management to assess the comparability of revenue from year-to-year arising from both taxable and tax-exempt sources. The corresponding income tax impact related to tax-exempt items is recorded within income tax expense/(benefit). These adjustments have no impact on net income as reported by the Firm as a whole or by the LOBs.
Capital allocation
Each business segment is allocated capital by taking into consideration a variety of factors including capital levels of similarly rated peers and applicable regulatory capital requirements. ROE is measured and internal targets for expected returns are established as key measures of a business segment’s performance.
The Firm’s current allocation methodology incorporates Basel III Standardized RWA and the GSIB surcharge, both under rules currently in effect, as well as a simulation of capital in a severe stress environment. At least annually, the assumptions, judgments and methodologies used to allocate capital are reassessed and, as a result, the capital allocated to the LOBs may change.
Segment results and reconciliation(a)
| (Table continued on next page) | ||||||||||||||||||||||||||||||||||||||||||||||||||||||||||||||
| As of or for the year ended December 31, (in millions, except ratios) | Consumer & Community Banking | Corporate & Investment Bank | Commercial Banking | Asset & Wealth Management | ||||||||||||||||||||||||||||||||||||||||||||||||||||||||||
| 2023 | 2022 | 2021 | 2023 | 2022 | 2021 | 2023 | 2022 | 2021 | 2023 | 2022 | 2021 | |||||||||||||||||||||||||||||||||||||||||||||||||||
| Noninterest revenue | $ | $ | (b) | $ | (b) | $ | $ | (b) | $ | (b) | $ | $ | $ | $ | $ | $ | ||||||||||||||||||||||||||||||||||||||||||||||
| Net interest income | ||||||||||||||||||||||||||||||||||||||||||||||||||||||||||||||
| Total net revenue | ||||||||||||||||||||||||||||||||||||||||||||||||||||||||||||||
Provision for credit losses | ( | ( | ( | ( | ||||||||||||||||||||||||||||||||||||||||||||||||||||||||||
| Noninterest expense | (b) | (b) | (b) | (b) | ||||||||||||||||||||||||||||||||||||||||||||||||||||||||||
Income/(loss) before income tax expense/(benefit) | ||||||||||||||||||||||||||||||||||||||||||||||||||||||||||||||
Income tax expense/(benefit) | (b) | (b) | (b) | (b) | ||||||||||||||||||||||||||||||||||||||||||||||||||||||||||
| Net income/(loss) | $ | $ | $ | $ | $ | $ | $ | $ | $ | $ | $ | $ | ||||||||||||||||||||||||||||||||||||||||||||||||||
Average equity | $ | $ | $ | $ | $ | $ | $ | $ | $ | $ | $ | $ | ||||||||||||||||||||||||||||||||||||||||||||||||||
| Total assets | ||||||||||||||||||||||||||||||||||||||||||||||||||||||||||||||
Return on equity | % | % | % | % | % | % | % | % | % | % | % | % | ||||||||||||||||||||||||||||||||||||||||||||||||||
| Overhead ratio | ||||||||||||||||||||||||||||||||||||||||||||||||||||||||||||||
304 | JPMorgan Chase & Co./2023 Form 10-K | |||||||
| (Table continued from previous page) | ||||||||||||||||||||||||||||||||||||||||||||
| As of or for the year ended December 31, (in millions, except ratios) | Corporate | Reconciling Items(a) | Total | |||||||||||||||||||||||||||||||||||||||||
| 2023 | 2022 | 2021 | 2023 | 2022 | 2021 | 2023 | 2022 | 2021 | ||||||||||||||||||||||||||||||||||||
| Noninterest revenue | $ | $ | ( | $ | $ | ( | $ | ( | $ | ( | $ | $ | $ | |||||||||||||||||||||||||||||||
| Net interest income | ( | ( | ( | ( | ||||||||||||||||||||||||||||||||||||||||
| Total net revenue | ( | ( | ( | ( | ||||||||||||||||||||||||||||||||||||||||
Provision for credit losses | ( | |||||||||||||||||||||||||||||||||||||||||||
| Noninterest expense | ||||||||||||||||||||||||||||||||||||||||||||
Income/(loss) before income tax expense/(benefit) | ( | ( | ( | ( | ( | |||||||||||||||||||||||||||||||||||||||
Income tax expense/(benefit) | ( | ( | ( | ( | ( | ( | ||||||||||||||||||||||||||||||||||||||
| Net income/(loss) | $ | $ | ( | $ | ( | $ | $ | $ | $ | $ | $ | |||||||||||||||||||||||||||||||||
Average equity | $ | $ | $ | $ | $ | $ | $ | $ | $ | |||||||||||||||||||||||||||||||||||
| Total assets | NA | NA | NA | |||||||||||||||||||||||||||||||||||||||||
Return on equity | NM | NM | NM | NM | NM | NM | % | % | % | |||||||||||||||||||||||||||||||||||
| Overhead ratio | NM | NM | NM | NM | NM | NM | ||||||||||||||||||||||||||||||||||||||
(a)Segment results on a managed basis reflect revenue on a FTE basis with the corresponding income tax impact recorded within income tax expense/(benefit). These adjustments are eliminated in reconciling items to arrive at the Firm’s reported U.S. GAAP results.
(b)In the first quarter of 2023, the allocations of revenue and expense to CCB associated with a Merchant Services revenue sharing agreement were discontinued and are now retained in Payments in CIB. Prior-period amounts have been revised to conform with the current presentation.
As a result of the organizational changes that were announced on January 25, 2024, the Firm will be reorganizing its business segments to reflect the manner in which the segments will be managed. The reorganization of the business segments is expected to be effective in the second quarter of 2024.
JPMorgan Chase & Co./2023 Form 10-K | 305 | |||||||
Notes to consolidated financial statements
Note 33 – Parent Company
The following tables present Parent Company-only financial statements.
Statements of income and comprehensive income | ||||||||||||||||||||
| Year ended December 31, (in millions) | 2023 | 2022 | 2021 | |||||||||||||||||
| Income | ||||||||||||||||||||
| Dividends from subsidiaries and affiliates: | ||||||||||||||||||||
| Bank and bank holding company | $ | $ | $ | |||||||||||||||||
| Non-bank | ||||||||||||||||||||
| Interest income from subsidiaries | ||||||||||||||||||||
| Other income/(expense) from subsidiaries: | ||||||||||||||||||||
| Bank and bank holding company | ( | |||||||||||||||||||
| Non-bank | ||||||||||||||||||||
| Other income/(expense) | ( | |||||||||||||||||||
| Total income | ||||||||||||||||||||
| Expense | ||||||||||||||||||||
Interest expense/(income) to subsidiaries and affiliates(a) | ||||||||||||||||||||
Other interest expense/(income)(a) | ( | ( | ||||||||||||||||||
| Noninterest expense | ||||||||||||||||||||
| Total expense | ||||||||||||||||||||
| Income before income tax benefit and undistributed net income of subsidiaries | ||||||||||||||||||||
| Income tax benefit | ||||||||||||||||||||
| Equity in undistributed net income of subsidiaries | ||||||||||||||||||||
| Net income | $ | $ | $ | |||||||||||||||||
| Other comprehensive income/(loss), net | ( | ( | ||||||||||||||||||
| Comprehensive income | $ | $ | $ | |||||||||||||||||
| Balance sheets | ||||||||||||||
| December 31, (in millions) | 2023 | 2022 | ||||||||||||
| Assets | ||||||||||||||
| Cash and due from banks | $ | $ | ||||||||||||
| Deposits with banking subsidiaries | ||||||||||||||
| Trading assets | ||||||||||||||
| Advances to, and receivables from, subsidiaries: | ||||||||||||||
| Bank and bank holding company | ||||||||||||||
| Non-bank | ||||||||||||||
| Investments (at equity) in subsidiaries and affiliates: | ||||||||||||||
| Bank and bank holding company | ||||||||||||||
| Non-bank | ||||||||||||||
| Other assets | ||||||||||||||
| Total assets | $ | $ | ||||||||||||
| Liabilities and stockholders’ equity | ||||||||||||||
| Borrowings from, and payables to, subsidiaries and affiliates | $ | $ | ||||||||||||
| Short-term borrowings | ||||||||||||||
| Other liabilities | ||||||||||||||
Long-term debt(b)(c) | ||||||||||||||
Total liabilities(c) | ||||||||||||||
| Total stockholders’ equity | ||||||||||||||
| Total liabilities and stockholders’ equity | $ | $ | ||||||||||||
| Statements of cash flows | ||||||||||||||||||||
| Year ended December 31, (in millions) | 2023 | 2022 | 2021 | |||||||||||||||||
| Operating activities | ||||||||||||||||||||
| Net income | $ | $ | $ | |||||||||||||||||
| Less: Net income of subsidiaries and affiliates | ||||||||||||||||||||
| Parent company net loss | ( | ( | ( | |||||||||||||||||
| Cash dividends from subsidiaries and affiliates | ||||||||||||||||||||
| Other operating adjustments | ( | ( | ||||||||||||||||||
| Net cash provided by/(used in) operating activities | ( | |||||||||||||||||||
| Investing activities | ||||||||||||||||||||
| Net change in: | ||||||||||||||||||||
| Advances to and investments in subsidiaries and affiliates, net | ( | ( | ||||||||||||||||||
| All other investing activities, net | ||||||||||||||||||||
| Net cash provided by/(used in) investing activities | ( | ( | ||||||||||||||||||
| Financing activities | ||||||||||||||||||||
| Net change in: | ||||||||||||||||||||
| Borrowings from subsidiaries and affiliates | ( | ( | ||||||||||||||||||
| Short-term borrowings | ||||||||||||||||||||
| Proceeds from long-term borrowings | ||||||||||||||||||||
| Payments of long-term borrowings | ( | ( | ( | |||||||||||||||||
| Proceeds from issuance of preferred stock | ||||||||||||||||||||
| Redemption of preferred stock | ( | ( | ||||||||||||||||||
| Treasury stock repurchased | ( | ( | ( | |||||||||||||||||
| Dividends paid | ( | ( | ( | |||||||||||||||||
| All other financing activities, net | ( | ( | ( | |||||||||||||||||
| Net cash provided by/(used in) financing activities | ( | ( | ||||||||||||||||||
| Net increase/(decrease) in cash and due from banks and deposits with banking subsidiaries | ( | ( | ||||||||||||||||||
| Cash and due from banks and deposits with banking subsidiaries at the beginning of the year | ||||||||||||||||||||
| Cash and due from banks and deposits with banking subsidiaries at the end of the year | $ | $ | $ | |||||||||||||||||
| Cash interest paid | $ | $ | $ | |||||||||||||||||
Cash income taxes paid, net(d) | ||||||||||||||||||||
(a)Includes interest expense for intercompany derivative hedges on the Firm’s LTD and related fair value adjustments, which is offset by related amounts in Other interest expense/(income).
(b)At December 31, 2023, long-term debt that contractually matures in 2024 through 2028 totaled $9.1 billion, $27.5 billion, $29.1 billion, $20.1 billion, and $21.8 billion, respectively.
(c)Refer to Notes 20 and 28 for information regarding the Parent Company’s guarantees of its subsidiaries’ obligations.
(d)Represents payments, net of refunds, made by the Parent Company to various taxing authorities and includes taxes paid on behalf of certain of its subsidiaries that are subsequently reimbursed. The reimbursements were $13.2 billion, $11.3 billion, and $13.9 billion for the years ended December 31, 2023, 2022 and 2021, respectively.
306 | JPMorgan Chase & Co./2023 Form 10-K | |||||||
Note 34 – Business combinations
On May 1, 2023, JPMorgan Chase acquired certain assets and assumed certain liabilities of First Republic Bank (the "First Republic acquisition") from the Federal Deposit Insurance Corporation (“FDIC”), as receiver. The Firm believes that the First Republic acquisition is complementary to the Firm's existing franchises. The acquisition resulted in an estimated bargain purchase gain, which represents the excess of the estimated fair value of the net assets acquired above the purchase price.
The Firm has determined that this acquisition constitutes a business combination under U.S. GAAP. Accordingly, the initial recognition of the assets acquired and liabilities assumed were generally measured at their estimated fair values as of May 1, 2023. The determination of those fair values required management to make certain market-based assumptions about expected future cash flows, discount rates and other valuation inputs at the time of the acquisition. The Firm believes that the fair value estimates of the assets acquired and liabilities assumed provide a reasonable basis for determining the estimated bargain purchase gain.
The Firm and the FDIC have not yet completed the settlement process under which the purchase price, and the identification of the assets acquired and liabilities assumed, will be finalized. The finalization of this settlement process may impact the amount of the estimated bargain purchase gain. The purchase and assumption agreement entered into with the FDIC allows for final settlement to occur up to a year after the acquisition date.
In addition, the purchase price and the estimated bargain purchase gain could change pending management's finalization of its acquisition date fair value estimates for certain of the assets acquired and liabilities assumed, which may take place up to one year from the acquisition date, as permitted by U.S. GAAP.
The First Republic acquisition resulted in a preliminary estimated bargain purchase gain of $2.7 billion. The Firm has continued to progress in the settlement process with the FDIC and refine its acquisition-date fair value estimates. As a result, during the year ended December 31, 2023, adjustments totaling $63 million were made, increasing the estimated bargain purchase gain to $2.8 billion.
In connection with the First Republic acquisition, the Firm and the FDIC entered into two shared-loss agreements with respect to certain loans and lending-related commitments (the "shared-loss assets"): the Commercial Shared-Loss Agreement ("CSLA") and the Single-Family Shared-Loss Agreement (“SFSLA”). The CSLA covers 80 % of credit losses, on a pari passu basis, over 5 years with a subsequent 3-year recovery period for certain acquired commercial loans and other real estate exposure. The SFSLA covers 80 % of credit losses, on a pari passu basis, for 7 years for certain acquired loans secured by mortgages on real property or shares in cooperative property constituting a primary residence. The indemnification
assets, which represent the fair value of the CSLA and SFSLA on the acquisition date, are reflected in the total assets acquired.
As part of the consideration paid, JPMorgan Chase issued a five-year , $50 billion secured note to the FDIC (the "Purchase Money Note"). The Purchase Money Note bears interest at a fixed rate of 3.4 % and is secured by certain of the acquired loans. The Purchase Money Note is prepayable upon notice to the holder.
The Firm had placed a $5 billion deposit with First Republic Bank on March 16, 2023, as part of $30 billion of deposits provided by a consortium of large U.S. banks. The Firm's $5 billion deposit was effectively settled as part of the acquisition and the associated allowance for credit losses was released upon closing. The Firm subsequently repaid the remaining $25 billion of deposits to the consortium of banks, including accrued interest through the payment date on May 9, 2023.
JPMorgan Chase & Co./2023 Form 10-K | 307 | |||||||
Notes to consolidated financial statements
The computation of the purchase price, the estimated fair values of the assets acquired and liabilities assumed as part of the First Republic acquisition and the related estimated bargain purchase gain are presented below, and reflect the adjustments made through December 31, 2023 to the acquisition-date fair value of the net assets acquired.
| Fair value purchase price allocation as of May 1, 2023 | |||||
| (in millions) | |||||
| Purchase price consideration | |||||
Amounts paid/due to the FDIC, net of cash acquired(a) | $ | ||||
| Purchase Money Note (at fair value) | |||||
Settlement of First Republic deposit and other related party transactions(b) | |||||
| Contingent consideration - Shared-loss agreements | |||||
| Purchase price consideration | $ | ||||
| Assets | |||||
| Securities | $ | ||||
Loans(c) | |||||
| Core deposit and customer relationship intangibles | |||||
| Indemnification assets - Shared-loss agreements | |||||
Accounts receivable and other assets(c)(d) | |||||
| Total assets acquired | $ | ||||
| Liabilities | |||||
| Deposits | $ | ||||
| FHLB advances | |||||
| Lending-related commitments | |||||
Accounts payable and other liabilities(c)(d) | |||||
| Deferred tax liabilities | |||||
| Total liabilities assumed | $ | ||||
| Fair value of net assets acquired | $ | ||||
Estimated gain on acquisition, after-tax | $ | ||||
(a)Includes $10.6 billion of cash paid to the FDIC at acquisition and $3.6 billion payable to the FDIC, less cash acquired of $680 million.
(b)Includes $447 million of securities financing transactions with First Republic Bank that were effectively settled on the acquisition date.
(c)In the fourth quarter, certain assets and liabilities were reclassified resulting in a $762 million increase to loans, an $870 million decrease to accounts receivable and other assets and a $30 million increase to accounts payable and other liabilities.
(d)Other assets include $1.2 billion in tax-oriented investments and $683 million of lease right-of-use assets. Other liabilities include the related tax-oriented investment liabilities of $669 million and lease liabilities of $748 million. Refer to Note 14 and Note 18 for additional information.
The issuance of the $50 billion Purchase Money Note, the effective settlement of the Firm's $5 billion deposit and $447 million of securities financing with First Republic Bank, and the $3.6 billion payable to the FDIC as part of the purchase price consideration are considered non-cash transactions.
The following describes the accounting policies and fair value methodologies generally used by the Firm for the following assets acquired and liabilities assumed: core deposit and customer relationship intangibles, shared-loss agreements and the related indemnification assets, Purchase Money Note, and FHLB advances.
For further discussion of the Firm’s accounting policies and valuation methodologies, refer to Note 2 and Note 3 for fair value measurement, Note 10 for investment securities, Note 12 for loans, Note 17 for deposits, and Note 28 for lending-related commitments.
Core deposit and customer relationship intangibles
Core deposit and certain wealth management customer relationship intangibles were acquired as part of the First Republic acquisition. The core deposit intangible of $1.3 billion was valued by discounting estimated after-tax cost savings over the remaining useful life of the deposits using the favorable source of funds method. The after-tax cost savings were estimated based on the difference between the cost of maintaining the core deposit base relative to the cost of next best alternative funding sources available to market participants. The customer relationship intangibles of $180 million were valued by discounting estimated after-tax earnings over their remaining useful lives using the multi-period excess earnings method. Both intangible asset
valuations utilized assumptions that the Firm believes a market participant would use to estimate fair values, such as growth and attrition rates, projected fee income as well as related costs to service the relationships, and discount rates. The core deposit and customer relationship intangibles will be amortized over a projected period of future cash flows of approximately 7
Indemnification assets - Shared-loss agreements
The indemnification assets represent forecasted recoveries from the FDIC associated with the shared-loss assets over the respective shared-loss recovery periods. The indemnification assets were recorded at fair value in other
308 | JPMorgan Chase & Co./2023 Form 10-K | |||||||
assets on the Consolidated balance sheets on the acquisition date. The fair values of the indemnification assets were estimated based on the timing of the forecasted losses underlying the related allowance for credit losses. The subsequent quarterly remeasurement of the indemnification assets is based on changes in the amount and timing of forecasted losses in the allowance for credit losses associated with the shared-loss assets and is recorded in other income. Under certain circumstances, the Firm may be required to make a payment to the FDIC upon termination of the shared-loss agreements based on the level of actual losses and recoveries on the shared-loss assets. The estimated potential future payment is reflected as contingent consideration as part of the purchase price consideration.
Purchase Money Note and FHLB advances
The Purchase Money Note is recorded in long-term debt on the Consolidated balance sheets. The fair value of the Purchase Money Note was estimated based on a discounted cash flow methodology and incorporated estimated market discount rates.
The FHLB advances assumed in the acquisition are recorded in short-term borrowings and in long-term debt. The fair values of the FHLB advances were based on a discounted cash flow methodology and considered the observed FHLB advance issuance rates.
Loans
The following table presents the unpaid principal balance ("UPB") and estimated fair values of the loans acquired as of May 1, 2023, and reflects adjustments to the acquisition-date fair value of the loans acquired through December 31, 2023.
| May 1, 2023 | |||||||||||
| (in millions) | UPB | Fair value | |||||||||
| Residential real estate | $ | $ | |||||||||
| Auto and other | |||||||||||
| Total consumer | |||||||||||
| Secured by real estate | |||||||||||
| Commercial & industrial | |||||||||||
Other(a) | |||||||||||
Total wholesale | |||||||||||
| Total loans | $ | $ | |||||||||
(a)In the fourth quarter, certain assets and liabilities were reclassified resulting in a $900 million increase to the UPB and a $762 million increase to the fair value of Other wholesale loans.
Unaudited pro forma condensed combined financial information
Included in the Firm's Consolidated statements of income are noninterest revenue, net interest income and net income contributed by First Republic of $4.4 billion, $3.7 billion and $4.1 billion, respectively, for the year ended December 31, 2023.
The following table presents certain unaudited pro forma financial information for the year ended December 31, 2023 and 2022 as if the First Republic acquisition had occurred on January 1, 2022, including recognition of the estimated bargain purchase gain of $2.8 billion and the provision for credit losses of $1.2 billion. Additional adjustments include the interest on the Purchase Money Note and the impact of amortizing and accreting certain estimated fair value adjustments related to intangible assets, loans and lending-related commitments.
The Firm expects to achieve operating cost savings and other business synergies resulting from the acquisition that are not reflected in the pro forma amounts. The pro forma information is not necessarily indicative of the historical results of operations had the acquisition occurred on January 1, 2022, nor is it indicative of the results of operations in future periods, particularly in light of recent changes in market and economic conditions.
| Year ended December 31, | ||||||||||||||
| (in millions) | 2023 | 2022 | ||||||||||||
| Noninterest revenue | $ | $ | ||||||||||||
| Net interest income | ||||||||||||||
| Net income | ||||||||||||||
JPMorgan Chase & Co./2023 Form 10-K | 309 | |||||||
Supplementary Information: Distribution of assets, liabilities and stockholders’ equity; interest rates and interest differentials
Consolidated average balance sheets, interest and rates
Provided below is a summary of JPMorgan Chase’s consolidated average balances, interest and rates on a taxable-equivalent basis for the years 2021 through 2023. Income computed on a taxable-equivalent basis is the income reported in the Consolidated statements of income, adjusted to present interest income and rates earned on
assets exempt from income taxes (i.e., federal taxes) on a basis comparable with other taxable investments. The incremental tax rate used for calculating the taxable-equivalent adjustment was approximately 24% in 2023, 2022 and 2021.
| (Table continued on next page) | ||||||||||||||||||||
| (Unaudited) | 2023 | |||||||||||||||||||
| Year ended December 31, (Taxable-equivalent interest and rates; in millions, except rates) | Average balance | Interest(g) | Rate | |||||||||||||||||
| Assets | ||||||||||||||||||||
| Deposits with banks | $ | 499,396 | $ | 21,797 | 4.36 | % | ||||||||||||||
| Federal funds sold and securities purchased under resale agreements | 317,159 | 15,079 | 4.75 | |||||||||||||||||
| Securities borrowed | 193,228 | 7,983 | 4.13 | |||||||||||||||||
| Trading assets – debt instruments | 376,928 | 16,001 | 4.25 | |||||||||||||||||
| Taxable securities | 573,914 | 17,390 | 3.03 | |||||||||||||||||
Non-taxable securities(a) | 30,886 | 1,560 | 5.05 | |||||||||||||||||
| Total investment securities | 604,800 | 18,950 | 3.13 | (i) | ||||||||||||||||
| Loans | 1,248,076 | 83,589 | (h) | 6.70 | ||||||||||||||||
All other interest-earning assets(b)(c) | 86,121 | 7,669 | 8.90 | |||||||||||||||||
| Total interest-earning assets | 3,325,708 | 171,068 | 5.14 | |||||||||||||||||
| Allowance for loan losses | (20,762) | |||||||||||||||||||
| Cash and due from banks | 24,853 | |||||||||||||||||||
| Trading assets – equity and other instruments | 160,087 | |||||||||||||||||||
| Trading assets – derivative receivables | 64,227 | |||||||||||||||||||
| Goodwill, MSRs and other intangible assets | 63,212 | |||||||||||||||||||
| All other noninterest-earning assets | 204,899 | |||||||||||||||||||
| Total assets | $ | 3,822,224 | ||||||||||||||||||
| Liabilities | ||||||||||||||||||||
| Interest-bearing deposits | $ | 1,698,529 | $ | 40,016 | 2.36 | % | ||||||||||||||
| Federal funds purchased and securities loaned or sold under repurchase agreements | 256,086 | 13,259 | 5.18 | |||||||||||||||||
Short-term borrowings | 37,468 | 1,894 | 5.05 | |||||||||||||||||
Trading liabilities – debt and all other interest-bearing liabilities(d)(e) | 286,605 | 9,396 | 3.28 | |||||||||||||||||
| Beneficial interests issued by consolidated VIEs | 18,648 | 953 | 5.11 | |||||||||||||||||
| Long-term debt | 296,433 | 15,803 | 5.33 | |||||||||||||||||
| Total interest-bearing liabilities | 2,593,769 | 81,321 | 3.14 | |||||||||||||||||
| Noninterest-bearing deposits | 660,538 | |||||||||||||||||||
Trading liabilities – equity and other instruments(e) | 30,501 | |||||||||||||||||||
| Trading liabilities – derivative payables | 46,355 | |||||||||||||||||||
| All other liabilities, including the allowance for lending-related commitments | 181,601 | |||||||||||||||||||
| Total liabilities | 3,512,764 | |||||||||||||||||||
| Stockholders’ equity | ||||||||||||||||||||
| Preferred stock | 27,404 | |||||||||||||||||||
| Common stockholders’ equity | 282,056 | |||||||||||||||||||
| Total stockholders’ equity | 309,460 | (f) | ||||||||||||||||||
| Total liabilities and stockholders’ equity | $ | 3,822,224 | ||||||||||||||||||
| Interest rate spread | 2.00 | % | ||||||||||||||||||
| Net interest income and net yield on interest-earning assets | $ | 89,747 | 2.70 | |||||||||||||||||
(a)Represents securities that are tax-exempt for U.S. federal income tax purposes.
(b)Includes brokerage-related held-for-investment customer receivables, which are classified in accrued interest and accounts receivable, and all other interest-earning assets, which are classified in other assets on the Consolidated Balance Sheets.
(c)The rates reflect the impact of interest earned on cash collateral where the cash collateral has been netted against certain derivative payables.
(d)All other interest-bearing liabilities include brokerage-related customer payables.
Within the Consolidated average balance sheets, interest and rates summary, the principal amounts of nonaccrual loans have been included in the average loan balances used to determine the average interest rate earned on loans. Refer to Note 12 for additional information on nonaccrual loans, including interest accrued.
310 | JPMorgan Chase & Co./2023 Form 10-K | |||||||
| (Table continued from previous page) | ||||||||||||||||||||||||||||||||||||||
| 2022 | 2021 | |||||||||||||||||||||||||||||||||||||
| Average balance | Interest(g) | Rate | Average balance | Interest(g) | Rate | |||||||||||||||||||||||||||||||||
| $ | 670,773 | $ | 9,039 | 1.35 | % | $ | 719,772 | $ | 512 | 0.07 | % | |||||||||||||||||||||||||||
| 307,150 | 4,632 | 1.51 | 269,231 | 958 | 0.36 | |||||||||||||||||||||||||||||||||
| 205,516 | 2,237 | 1.09 | 190,655 | (385) | (0.20) | (j) | ||||||||||||||||||||||||||||||||
| 283,108 | 9,097 | 3.21 | 283,829 | 6,856 | 2.42 | |||||||||||||||||||||||||||||||||
| 626,122 | 10,372 | 1.66 | 563,147 | 6,460 | 1.15 | |||||||||||||||||||||||||||||||||
| 27,863 | 1,224 | 4.39 | 30,830 | 1,336 | 4.33 | |||||||||||||||||||||||||||||||||
| 653,985 | 11,596 | 1.77 | (i) | 593,977 | 7,796 | 1.31 | (i) | |||||||||||||||||||||||||||||||
| 1,100,318 | 52,877 | (h) | 4.81 | 1,035,399 | 41,663 | (h) | 4.02 | |||||||||||||||||||||||||||||||
| 128,229 | 3,763 | 2.93 | 123,079 | 894 | 0.73 | |||||||||||||||||||||||||||||||||
| 3,349,079 | 93,241 | 2.78 | 3,215,942 | 58,294 | 1.81 | |||||||||||||||||||||||||||||||||
| (17,399) | (22,179) | |||||||||||||||||||||||||||||||||||||
| 27,601 | 26,776 | |||||||||||||||||||||||||||||||||||||
| 140,778 | 172,822 | |||||||||||||||||||||||||||||||||||||
| 78,606 | 69,101 | |||||||||||||||||||||||||||||||||||||
| 59,467 | 55,003 | |||||||||||||||||||||||||||||||||||||
| 215,408 | 207,737 | |||||||||||||||||||||||||||||||||||||
| $ | 3,853,540 | $ | 3,725,202 | |||||||||||||||||||||||||||||||||||
| $ | 1,748,666 | $ | 10,082 | 0.58 | % | $ | 1,672,669 | $ | 531 | 0.03 | % | |||||||||||||||||||||||||||
| 242,762 | 3,721 | 1.53 | 259,302 | 274 | 0.11 | |||||||||||||||||||||||||||||||||
| 46,063 | 747 | 1.62 | 44,618 | 126 | 0.28 | |||||||||||||||||||||||||||||||||
| 268,019 | 3,246 | 1.21 | 241,431 | 257 | 0.11 | |||||||||||||||||||||||||||||||||
| 11,208 | 226 | 2.02 | 14,595 | 83 | 0.57 | |||||||||||||||||||||||||||||||||
| 250,080 | 8,075 | 3.23 | 250,378 | 4,282 | 1.71 | |||||||||||||||||||||||||||||||||
| 2,566,798 | 26,097 | 1.02 | 2,482,993 | 5,553 | 0.22 | |||||||||||||||||||||||||||||||||
| 719,249 | 674,485 | |||||||||||||||||||||||||||||||||||||
| 39,155 | 36,656 | |||||||||||||||||||||||||||||||||||||
| 57,388 | 60,318 | |||||||||||||||||||||||||||||||||||||
| 185,989 | 186,755 | |||||||||||||||||||||||||||||||||||||
| 3,568,579 | 3,441,207 | |||||||||||||||||||||||||||||||||||||
| 31,893 | 33,027 | |||||||||||||||||||||||||||||||||||||
| 253,068 | 250,968 | |||||||||||||||||||||||||||||||||||||
| 284,961 | (f) | 283,995 | (f) | |||||||||||||||||||||||||||||||||||
| $ | 3,853,540 | $ | 3,725,202 | |||||||||||||||||||||||||||||||||||
| 1.76 | % | 1.59 | % | |||||||||||||||||||||||||||||||||||
| $ | 67,144 | 2.00 | $ | 52,741 | 1.64 | |||||||||||||||||||||||||||||||||
(e)The combined balance of trading liabilities – debt and equity instruments was $153.3 billion, $138.1 billion and $128.2 billion for the years ended December 31, 2023, 2022 and 2021, respectively.
(f)The ratio of average stockholders’ equity to average assets was 8.1%, 7.4% and 7.6% for the years ended December 31, 2023, 2022 and 2021, respectively. The return on average stockholders’ equity, based on net income, was 16.0%, 13.2% and 17.0% for the years ended December 31, 2023, 2022 and 2021, respectively.
(g)Interest includes the effect of related hedging derivatives. Taxable-equivalent amounts are used where applicable.
(h)Included fees and commissions on loans of $2.2 billion, $1.8 billion and $1.9 billion for the years ended December 31, 2023, 2022 and 2021, respectively
(i)The annualized rate for securities based on amortized cost was 3.09%, 1.75% and 1.33% for the years ended December 31, 2023, 2022 and 2021, respectively, and does not give effect to changes in fair value that are reflected in AOCI.
(j)Negative interest and rates reflect the net impact of interest earned offset by fees paid on client-driven prime brokerage securities borrowed transactions.
JPMorgan Chase & Co./2023 Form 10-K | 311 | |||||||
Interest rates and interest differential analysis of net interest income – U.S. and non-U.S.
Presented below is a summary of interest and rates segregated between U.S. and non-U.S. operations for the years 2021 through 2023. The segregation of U.S. and non-U.S. components is based on the location of the office recording the transaction.
| (Table continued on next page) | ||||||||||||||
| 2023 | ||||||||||||||
(Unaudited) Year ended December 31, (Taxable-equivalent interest and rates; in millions, except rates) | Average balance | Interest | Rate | |||||||||||
| Interest-earning assets | ||||||||||||||
| Deposits with banks: | ||||||||||||||
| U.S. | $ | 296,784 | $ | 15,348 | 5.17 | % | ||||||||
| Non-U.S. | 202,612 | 6,449 | 3.18 | |||||||||||
| Federal funds sold and securities purchased under resale agreements: | ||||||||||||||
| U.S. | 155,304 | 8,330 | 5.36 | |||||||||||
| Non-U.S. | 161,855 | 6,749 | 4.17 | |||||||||||
Securities borrowed: | ||||||||||||||
| U.S. | 133,805 | 6,239 | 4.66 | |||||||||||
| Non-U.S. | 59,423 | 1,744 | 2.93 | |||||||||||
| Trading assets – debt instruments: | ||||||||||||||
| U.S. | 248,541 | 10,721 | 4.31 | |||||||||||
| Non-U.S. | 128,387 | 5,280 | 4.11 | |||||||||||
| Investment securities: | ||||||||||||||
| U.S. | 568,505 | 17,469 | 3.07 | |||||||||||
| Non-U.S. | 36,295 | 1,481 | 4.08 | |||||||||||
| Loans: | ||||||||||||||
| U.S. | 1,137,162 | 76,884 | 6.76 | |||||||||||
| Non-U.S. | 110,914 | 6,705 | 6.05 | |||||||||||
All other interest-earning assets, predominantly U.S.(a) | 86,121 | 7,669 | 8.90 | |||||||||||
| Total interest-earning assets | 3,325,708 | 171,068 | 5.14 | |||||||||||
| Interest-bearing liabilities | ||||||||||||||
| Interest-bearing deposits: | ||||||||||||||
| U.S. | 1,290,110 | 26,253 | 2.03 | |||||||||||
| Non-U.S. | 408,419 | 13,763 | 3.37 | |||||||||||
| Federal funds purchased and securities loaned or sold under repurchase agreements: | ||||||||||||||
| U.S. | 197,049 | 10,639 | 5.40 | |||||||||||
| Non-U.S. | 59,037 | 2,620 | 4.44 | |||||||||||
Trading liabilities – debt, short-term and all other interest-bearing liabilities: | ||||||||||||||
| U.S. | 205,388 | 7,774 | 3.79 | |||||||||||
| Non-U.S. | 118,685 | 3,516 | 2.96 | |||||||||||
| Beneficial interests issued by consolidated VIEs, predominantly U.S. | 18,648 | 953 | 5.11 | |||||||||||
| Long-term debt: | ||||||||||||||
| U.S. | 293,218 | 15,749 | 5.37 | |||||||||||
| Non-U.S. | 3,215 | 54 | 1.68 | |||||||||||
| Total interest-bearing liabilities | 2,593,769 | 81,321 | 3.14 | |||||||||||
Noninterest-bearing liabilities(b) | 731,939 | |||||||||||||
| Total investable funds | $ | 3,325,708 | $ | 81,321 | 2.45 | % | ||||||||
| Net interest income and net yield: | $ | 89,747 | 2.70 | % | ||||||||||
| U.S. | 77,923 | 3.01 | ||||||||||||
| Non-U.S. | 11,824 | 1.61 | ||||||||||||
| Percentage of total assets and liabilities attributable to non-U.S. operations: | ||||||||||||||
| Assets | 24.7 | |||||||||||||
| Liabilities | 20.2 | |||||||||||||
(a)The rates reflect the impact of interest earned on cash collateral where that cash collateral has been netted against certain derivative payables.
(b)Represents the amount of noninterest-bearing liabilities funding interest-earning assets.
(c)Negative interest and rates reflect the net impact of interest earned offset by fees paid on client-driven prime brokerage securities borrowed transactions.
Refer to the “Net interest income” discussion in Consolidated Results of Operations on pages 54–57 for further information.
312 | JPMorgan Chase & Co./2023 Form 10-K | |||||||
| (Table continued from previous page) | ||||||||||||||||||||||||||||||||
| 2022 | 2021 | |||||||||||||||||||||||||||||||
| Average balance | Interest | Rate | Average balance | Interest | Rate | |||||||||||||||||||||||||||
| $ | 456,366 | $ | 7,418 | 1.63 | % | $ | 527,340 | $ | 693 | 0.13 | % | |||||||||||||||||||||
| 214,407 | 1,621 | 0.76 | 192,432 | (181) | (0.09) | |||||||||||||||||||||||||||
| 130,213 | 2,191 | 1.68 | 114,406 | 299 | 0.26 | |||||||||||||||||||||||||||
| 176,937 | 2,441 | 1.38 | 154,825 | 659 | 0.43 | |||||||||||||||||||||||||||
| 142,736 | 1,811 | 1.27 | 137,752 | (319) | (0.23) | (c) | ||||||||||||||||||||||||||
| 62,780 | 426 | 0.68 | 52,903 | (66) | (0.12) | (c) | ||||||||||||||||||||||||||
| 170,975 | 5,414 | 3.17 | 158,793 | 3,530 | 2.22 | |||||||||||||||||||||||||||
| 112,133 | 3,683 | 3.28 | 125,036 | 3,326 | 2.66 | |||||||||||||||||||||||||||
| 623,285 | 10,994 | 1.76 | 563,109 | 7,399 | 1.31 | |||||||||||||||||||||||||||
| 30,700 | 602 | 1.96 | 30,868 | 397 | 1.29 | |||||||||||||||||||||||||||
| 985,187 | 48,953 | 4.97 | 924,713 | 39,215 | 4.24 | |||||||||||||||||||||||||||
| 115,131 | 3,924 | 3.41 | 110,686 | 2,448 | 2.21 | |||||||||||||||||||||||||||
| 128,229 | 3,763 | 2.93 | 123,079 | 894 | 0.73 | |||||||||||||||||||||||||||
| 3,349,079 | 93,241 | 2.78 | 3,215,942 | 58,294 | 1.81 | |||||||||||||||||||||||||||
| 1,358,322 | 7,026 | 0.52 | 1,301,616 | 901 | 0.07 | |||||||||||||||||||||||||||
| 390,344 | 3,056 | 0.78 | 371,053 | (370) | (0.10) | |||||||||||||||||||||||||||
| 173,016 | 3,083 | 1.78 | 199,220 | 222 | 0.11 | |||||||||||||||||||||||||||
| 69,746 | 638 | 0.91 | 60,082 | 52 | 0.09 | |||||||||||||||||||||||||||
| 194,570 | 2,384 | 1.23 | 176,466 | (345) | (0.20) | |||||||||||||||||||||||||||
| 119,512 | 1,609 | 1.35 | 109,583 | 728 | 0.66 | |||||||||||||||||||||||||||
| 11,208 | 226 | 2.02 | 14,595 | 83 | 0.57 | |||||||||||||||||||||||||||
| 246,670 | 8,026 | 3.25 | 244,850 | 4,229 | 1.73 | |||||||||||||||||||||||||||
| 3,410 | 49 | 1.44 | 5,528 | 53 | 0.96 | |||||||||||||||||||||||||||
| 2,566,798 | 26,097 | 1.02 | 2,482,993 | 5,553 | 0.22 | |||||||||||||||||||||||||||
| 782,281 | 732,949 | |||||||||||||||||||||||||||||||
| $ | 3,349,079 | $ | 26,097 | 0.78 | % | $ | 3,215,942 | $ | 5,553 | 0.17 | % | |||||||||||||||||||||
| $ | 67,144 | 2.00 | % | $ | 52,741 | 1.64 | % | |||||||||||||||||||||||||
| 58,950 | 2.27 | 46,622 | 1.86 | |||||||||||||||||||||||||||||
| 8,194 | 1.09 | 6,119 | 0.87 | |||||||||||||||||||||||||||||
| 24.9 | 24.6 | |||||||||||||||||||||||||||||||
| 20.6 | 20.4 | |||||||||||||||||||||||||||||||
JPMorgan Chase & Co./2023 Form 10-K | 313 | |||||||
Changes in net interest income, volume and rate analysis
The table below presents an attribution of net interest income between volume and rate. The attribution between volume and rate is calculated using annual average balances for each category of assets and liabilities shown in the table and the corresponding annual rates (refer to pages 310-313 for more information on average balances and rates). In this analysis, when the change cannot be isolated to either volume or rate, it has been allocated to volume. The annual rates include the impact of changes in market rates, as well as the impact of any change in composition of the various products within each category of asset or liability. This analysis is calculated separately for each category without consideration of the relationship between categories (for example, the net spread between the rates earned on assets and the rates paid on liabilities that fund those assets). As a result, changes in the granularity or groupings considered in this analysis would produce a different attribution result, and due to the complexities involved, precise allocation of changes in interest rates between volume and rates is inherently complex and judgmental.
| 2023 versus 2022 | 2022 versus 2021 | ||||||||||||||||||||||||||||||||||
| (Unaudited) | Increase/(decrease) due to change in: | Increase/(decrease) due to change in: | |||||||||||||||||||||||||||||||||
| Year ended December 31, (On a taxable-equivalent basis; in millions) | Volume | Rate | Net change | Volume | Rate | Net change | |||||||||||||||||||||||||||||
| Interest-earning assets | |||||||||||||||||||||||||||||||||||
| Deposits with banks: | |||||||||||||||||||||||||||||||||||
| U.S. | $ | (8,225) | $ | 16,155 | $ | 7,930 | $ | (1,185) | $ | 7,910 | $ | 6,725 | |||||||||||||||||||||||
| Non-U.S. | (361) | 5,189 | 4,828 | 166 | 1,636 | 1,802 | |||||||||||||||||||||||||||||
Federal funds sold and securities purchased under resale agreements: | |||||||||||||||||||||||||||||||||||
| U.S. | 1,347 | 4,792 | 6,139 | 267 | 1,625 | 1,892 | |||||||||||||||||||||||||||||
| Non-U.S. | (629) | 4,937 | 4,308 | 311 | 1,471 | 1,782 | |||||||||||||||||||||||||||||
Securities borrowed: | |||||||||||||||||||||||||||||||||||
| U.S. | (411) | 4,839 | 4,428 | 64 | 2,066 | 2,130 | |||||||||||||||||||||||||||||
| Non-U.S. | (95) | 1,413 | 1,318 | 69 | 423 | 492 | |||||||||||||||||||||||||||||
| Trading assets – debt instruments: | |||||||||||||||||||||||||||||||||||
| U.S. | 3,358 | 1,949 | 5,307 | 375 | 1,509 | 1,884 | |||||||||||||||||||||||||||||
| Non-U.S. | 666 | 931 | 1,597 | (418) | 775 | 357 | |||||||||||||||||||||||||||||
| Investment securities: | |||||||||||||||||||||||||||||||||||
| U.S. | (1,690) | 8,165 | 6,475 | 1,061 | 2,534 | 3,595 | |||||||||||||||||||||||||||||
| Non-U.S. | 228 | 651 | 879 | (2) | 207 | 205 | |||||||||||||||||||||||||||||
| Loans: | |||||||||||||||||||||||||||||||||||
| U.S. | 10,296 | 17,635 | 27,931 | 2,988 | 6,750 | 9,738 | |||||||||||||||||||||||||||||
| Non-U.S. | (258) | 3,039 | 2,781 | 148 | 1,328 | 1,476 | |||||||||||||||||||||||||||||
| All other interest-earning assets, predominantly U.S. | (3,749) | 7,655 | 3,906 | 161 | 2,708 | 2,869 | |||||||||||||||||||||||||||||
| Change in interest income | 477 | 77,350 | 77,827 | 4,005 | 30,942 | 34,947 | |||||||||||||||||||||||||||||
| Interest-bearing liabilities | |||||||||||||||||||||||||||||||||||
| Interest-bearing deposits: | |||||||||||||||||||||||||||||||||||
| U.S. | (1,284) | 20,511 | 19,227 | 268 | 5,857 | 6,125 | |||||||||||||||||||||||||||||
| Non-U.S. | 597 | 10,110 | 10,707 | 161 | 3,265 | 3,426 | |||||||||||||||||||||||||||||
Federal funds purchased and securities loaned or sold under repurchase agreements: | |||||||||||||||||||||||||||||||||||
| U.S. | 1,293 | 6,263 | 7,556 | (466) | 3,327 | 2,861 | |||||||||||||||||||||||||||||
| Non-U.S. | (480) | 2,462 | 1,982 | 93 | 493 | 586 | |||||||||||||||||||||||||||||
Trading liabilities – debt, short-term and all other interest-bearing liabilities: | |||||||||||||||||||||||||||||||||||
| U.S. | 409 | 4,981 | 5,390 | 206 | 2,523 | 2,729 | |||||||||||||||||||||||||||||
| Non-U.S. | (17) | 1,924 | 1,907 | 125 | 756 | 881 | |||||||||||||||||||||||||||||
Beneficial interests issued by consolidated VIEs, predominantly U.S. | 381 | 346 | 727 | (69) | 212 | 143 | |||||||||||||||||||||||||||||
| Long-term debt: | |||||||||||||||||||||||||||||||||||
| U.S. | 2,494 | 5,229 | 7,723 | 75 | 3,722 | 3,797 | |||||||||||||||||||||||||||||
| Non-U.S. | (3) | 8 | 5 | (31) | 27 | (4) | |||||||||||||||||||||||||||||
| Change in interest expense | 3,390 | 51,834 | 55,224 | 362 | 20,182 | 20,544 | |||||||||||||||||||||||||||||
| Change in net interest income | $ | (2,913) | $ | 25,516 | $ | 22,603 | $ | 3,643 | $ | 10,760 | $ | 14,403 | |||||||||||||||||||||||
314 | JPMorgan Chase & Co./2023 Form 10-K | |||||||
Glossary of Terms and Acronyms
2022 Form 10-K: Annual report on Form 10-K for the year ended December 31, 2022, filed with the U.S. Securities and Exchange Commission.
ABS: Asset-backed securities
AFS: Available-for-sale
ALCO: Asset Liability Committee
Amortized cost: Amount at which a financing receivable or investment is originated or acquired, adjusted for accretion or amortization of premium, discount, and net deferred fees or costs, collection of cash, charge-offs, foreign exchange, and fair value hedge accounting adjustments. For AFS securities, amortized cost is also reduced by any impairment losses recognized in earnings. Amortized cost is not reduced by the allowance for credit losses, except where explicitly presented net.
AOCI: Accumulated other comprehensive income/(loss)
ARM: Adjustable rate mortgage(s)
AUC: “Assets under custody”: Represents assets held directly or indirectly on behalf of clients under safekeeping, custody and servicing arrangements.
AUM: “Assets under management”: Represent assets managed by AWM on behalf of its Private Banking, Institutional and Retail clients. Includes “Committed capital not Called.”
Auto loan and lease origination volume: Dollar amount of auto loans and leases originated.
AWM: Asset & Wealth Management
Beneficial interests issued by consolidated VIEs: Represents the interest of third-party holders of debt, equity securities, or other obligations, issued by VIEs that JPMorgan Chase consolidates.
Benefit obligation: Refers to the projected benefit obligation for pension plans and the accumulated postretirement benefit obligation for OPEB plans.
BHC: Bank holding company
BWM: Banking & Wealth Management
Bridge Financing Portfolio: A portfolio of held-for-sale unfunded loan commitments and funded loans. The unfunded commitments include both short-term bridge loan commitments that will ultimately be replaced by longer term financing as well as term loan commitments. The funded loans include term loans and funded revolver facilities.
CB: Commercial Banking
CCAR: Comprehensive Capital Analysis and Review
CCB: Consumer & Community Banking
CCB Consumer customer: A unique individual that has financial ownership or decision-making power with respect to accounts; excludes customers under the age of 18. Where a customer uses the same identifier as both a
Consumer and a Small business, the customer is included in both metrics.
CCB Small business customer: A unique business or legal entity that has financial ownership or decision-making power with respect to accounts. Where a customer uses the same identifier as both a Consumer and a Small business, the customer is included in both metrics.
CCO: Chief Compliance Officer
CCP: “Central counterparty” is a clearing house that interposes itself between counterparties to contracts traded in one or more financial markets, becoming the buyer to every seller and the seller to every buyer and thereby ensuring the future performance of open contracts. A CCP becomes a counterparty to trades with market participants through novation, an open offer system, or another legally binding arrangement.
CDS: Credit default swaps
CECL: Current Expected Credit Losses
CEO: Chief Executive Officer
CET1 Capital: Common equity Tier 1 capital
CFO: Chief Financial Officer
CFP: Contingency funding plan
CFTC: Commodity Futures Trading Commission
CIB: Corporate & Investment Bank
CIO: Chief Investment Office
Client assets: Represent assets under management as well as custody, brokerage, administration and deposit accounts.
Client deposits and other third-party liabilities: Deposits, as well as deposits that are swept to on-balance sheet liabilities (e.g., commercial paper, federal funds purchased and securities loaned or sold under repurchase agreements) as part of client cash management programs.
Client investment assets: Represent assets under management as well as custody, brokerage and annuity accounts, and deposits held in investment accounts.
CLO: Collateralized loan obligations
CLTV: Combined loan-to-value
CMT: Constant Maturity Treasury
Collateral-dependent: A loan is considered to be collateral-dependent when repayment of the loan is expected to be provided substantially through the operation or sale of the collateral when the borrower is experiencing financial difficulty, including when foreclosure is deemed probable based on borrower delinquency.
Commercial Card: provides a wide range of payment services to corporate and public sector clients worldwide through the commercial card products. Services include procurement, corporate travel and entertainment, expense management services, and business-to-business payment solutions.
JPMorgan Chase & Co./2023 Form 10-K | 315 | |||||||
Glossary of Terms and Acronyms
Credit derivatives: Financial instruments whose value is derived from the credit risk associated with the debt of a third-party issuer (the reference entity) which allow one party (the protection purchaser) to transfer that risk to another party (the protection seller). Upon the occurrence of a credit event by the reference entity, which may include, among other events, the bankruptcy or failure to pay its obligations, or certain restructurings of the debt of the reference entity, neither party has recourse to the reference entity. The protection purchaser has recourse to the protection seller for the difference between the face value of the CDS contract and the fair value at the time of settling the credit derivative contract. The determination as to whether a credit event has occurred is generally made by the relevant International Swaps and Derivatives Association (“ISDA”) Determinations Committee.
Criticized: Criticized loans, lending-related commitments and derivative receivables that are classified as special mention, substandard and doubtful categories for regulatory purposes and are generally consistent with a rating of CCC+/Caa1 and below, as defined by S&P and Moody’s.
CRO: Chief Risk Officer
CRR: Capital Requirements Regulation
CTC: CIO, Treasury and Corporate
Custom lending: Loans to AWM’s Global Private Bank clients, including loans to private investment funds and loans that are collateralized by nontraditional asset types, such as art work, aircraft, etc.
CVA: Credit valuation adjustment
Debit and credit card sales volume: Dollar amount of card member purchases, net of returns.
Deposit margin: Represents net interest income expressed as a percentage of average deposits.
Distributed denial-of-service attack: The use of a large number of remote computer systems to electronically send a high volume of traffic to a target website to create a service outage at the target. This is a form of cyberattack.
Dodd-Frank Act: Wall Street Reform and Consumer Protection Act
DVA: Debit valuation adjustment
EC: European Commission
Eligible HQLA: Eligible high-quality liquid assets, for purposes of calculating the LCR, is the amount of unencumbered HQLA that satisfy certain operational considerations as defined in the LCR rule.
Eligible LTD: Long-term debt satisfying certain eligibility criteria
Embedded derivatives: are implicit or explicit terms or features of a financial instrument that affect some or all of the cash flows or the value of the instrument in a manner similar to a derivative. An instrument containing such terms
or features is referred to as a “hybrid.” The component of the hybrid that is the non-derivative instrument is referred to as the “host.” For example, callable debt is a hybrid instrument that contains a plain vanilla debt instrument (i.e., the host) and an embedded option that allows the issuer to redeem the debt issue at a specified date for a specified amount (i.e., the embedded derivative). However, a floating rate instrument is not a hybrid composed of a fixed-rate instrument and an interest rate swap.
EPS: Earnings per share
ERISA: Employee Retirement Income Security Act of 1974
ETD: “Exchange-traded derivatives”: Derivative contracts that are executed on an exchange and settled via a central clearing house.
EU: European Union
Expense categories:
•Volume- and/or revenue-related expenses generally correlate with changes in the related business/transaction volume or revenue. Examples include commissions and incentive compensation within the LOBs, depreciation expense related to operating lease assets, and brokerage expense related to trading transaction volume.
•Investments in the business include expenses associated with supporting medium- to longer-term strategic plans of the Firm. Examples include front office growth, market expansion, initiatives in technology (including related compensation), marketing, and acquisitions.
•Structural expenses are those associated with the day-to-day cost of running the Firm and are expenses not included in the above two categories. Examples include employee salaries and benefits, certain other incentive compensation, and costs related to real estate.
Fannie Mae: Federal National Mortgage Association
FASB: Financial Accounting Standards Board
FCA: Financial Conduct Authority
FCC: Firmwide Control Committee
FDIC: Federal Deposit Insurance Corporation
FDM: "Financial difficulty modification" applies to loan modifications effective January 1, 2023, and is deemed to occur when the Firm modifies specific terms of the original loan agreement. The following types of modifications are considered FDMs: principal forgiveness, interest rate reduction, other-than-insignificant payment delay, term extension or a combination of these modifications.
Federal Reserve: The Board of the Governors of the Federal Reserve System
FFIEC: Federal Financial Institutions Examination Council
FHA: Federal Housing Administration
FHLB: Federal Home Loan Bank
316 | JPMorgan Chase & Co./2023 Form 10-K | |||||||
Glossary of Terms and Acronyms
FICC: The Fixed Income Clearing Corporation
FICO score: A measure of consumer credit risk provided by credit bureaus, typically produced from statistical models by Fair Isaac Corporation utilizing data collected by the credit bureaus.
FINRA: Financial Industry Regulatory Authority
Firm: JPMorgan Chase & Co.
Forward points: Represents the interest rate differential between two currencies, which is either added to or subtracted from the current exchange rate (i.e., “spot rate”) to determine the forward exchange rate.
FRC: Firmwide Risk Committee
Freddie Mac: Federal Home Loan Mortgage Corporation
Free standing derivatives: a derivative contract entered into either separate and apart from any of the Firm’s other financial instruments or equity transactions. Or, in conjunction with some other transaction and is legally detachable and separately exercisable.
FSB: Financial Stability Board
FTE: Fully taxable equivalent
FVA: Funding valuation adjustment
FX: Foreign exchange
G7: Group of Seven nations: Countries in the G7 are Canada, France, Germany, Italy, Japan, the U.K. and the U.S.
G7 government securities: Securities issued by the government of one of the G7 nations.
Ginnie Mae: Government National Mortgage Association
GSIB: Global systemically important banks
HELOC: Home equity line of credit
Home equity – senior lien: Represents loans and commitments where JPMorgan Chase holds the first security interest on the property.
Home equity – junior lien: Represents loans and commitments where JPMorgan Chase holds a security interest that is subordinate in rank to other liens.
Households: A household is a collection of individuals or entities aggregated together by name, address, tax identifier and phone number.
HQLA: “High-quality liquid assets” consist of cash and certain high-quality liquid securities as defined in the LCR rule.
HTM: Held-to-maturity
IBOR: Interbank Offered Rate
ICAAP: Internal capital adequacy assessment process
IDI: Insured depository institutions
IHC: JPMorgan Chase Holdings LLC, an intermediate holding company
Investment-grade: An indication of credit quality based on JPMorgan Chase’s internal risk assessment. The Firm considers ratings of BBB-/Baa3 or higher as investment-grade.
IPO: Initial public offering
ISDA: International Swaps and Derivatives Association
JPMorgan Chase: JPMorgan Chase & Co.
JPMorgan Chase Bank, N.A.: JPMorgan Chase Bank, National Association
JPMorgan Chase Foundation or the Firm’s Foundation: A not-for-profit organization that makes contributions for charitable and educational purposes.
J.P. Morgan Securities: J.P. Morgan Securities LLC
JPMSE: J.P. Morgan SE
LCR: Liquidity coverage ratio
LDA: Loss Distribution Approach
LGD: Loss given default
LIBOR: London Interbank Offered Rate
LLC: Limited Liability Company
LOB: Line of business
LOB CROs: Line of Business and CTC Chief Risk Officers
LTIP: Long-term incentive plan
LTV: “Loan-to-value”: For residential real estate loans, the relationship, expressed as a percentage, between the principal amount of a loan and the appraised value of the collateral (i.e., residential real estate) securing the loan.
Origination date LTV ratio
The LTV ratio at the origination date of the loan. Origination date LTV ratios are calculated based on the actual appraised values of collateral (i.e., loan-level data) at the origination date.
Current estimated LTV ratio
An estimate of the LTV as of a certain date. The current estimated LTV ratios are calculated using estimated collateral values derived from a nationally recognized home price index measured at the metropolitan statistical area (“MSA”) level. These MSA-level home price indices consist of actual data to the extent available and forecasted data where actual data is not available. As a result, the estimated collateral values used to calculate these ratios do not represent actual appraised loan-level collateral values; as such, the resulting LTV ratios are necessarily imprecise and should therefore be viewed as estimates.
Combined LTV ratio
The LTV ratio considering all available lien positions, as well as unused lines, related to the property. Combined LTV ratios are used for junior lien home equity products.
Macro businesses: the macro businesses include Rates, Currencies and Emerging Markets, Fixed Income Financing
JPMorgan Chase & Co./2023 Form 10-K | 317 | |||||||
Glossary of Terms and Acronyms
and Commodities in CIB's Fixed Income Markets.
Managed basis: A non-GAAP presentation of Firmwide financial results that includes reclassifications to present revenue on a fully taxable-equivalent basis. Management also uses this financial measure at the segment level, because it believes this provides information to enable investors to understand the underlying operational performance and trends of the particular business segment and facilitates a comparison of the business segment with the performance of competitors.
Markets: consists of CIB’s Fixed Income Markets and Equity Markets businesses.
Master netting agreement: A single agreement with a counterparty that permits multiple transactions governed by that agreement to be terminated or accelerated and settled through a single payment in a single currency in the event of a default (e.g., bankruptcy, failure to make a required payment or securities transfer or deliver collateral or margin when due).
MBS: Mortgage-backed securities
MD&A: Management’s discussion and analysis
Measurement alternative: Measures equity securities without readily determinable fair values at cost less impairment (if any), plus or minus observable price changes from an identical or similar investment of the same issuer.
Merchant Services: offers merchants payment processing capabilities, fraud and risk management, data and analytics, and other payments services. Through Merchant Services, merchants of all sizes can accept payments via credit and debit cards and payments in multiple currencies.
MEV: Macroeconomic variable
Moody’s: Moody’s Investor Services
Mortgage origination channels:
Retail – Borrowers who buy or refinance a home through direct contact with a mortgage banker employed by the Firm using a branch office, the Internet or by phone. Borrowers are frequently referred to a mortgage banker by a banker in a Chase branch, real estate brokers, home builders or other third parties.
Correspondent – Banks, thrifts, other mortgage banks and other financial institutions that sell closed loans to the Firm.
Mortgage product types:
Alt-A
Alt-A loans are generally higher in credit quality than subprime loans but have characteristics that would disqualify the borrower from a traditional prime loan. Alt-A lending characteristics may include one or more of the following: (i) limited documentation; (ii) a high CLTV ratio; (iii) loans secured by non-owner occupied properties; or (iv) a debt-to-income ratio above normal limits. A substantial proportion of the Firm’s Alt-A loans are those where a borrower does not provide complete documentation of his
or her assets or the amount or source of his or her income.
Option ARMs
The option ARM real estate loan product is an adjustable-rate mortgage loan that provides the borrower with the option each month to make a fully amortizing, interest-only or minimum payment. The minimum payment on an option ARM loan is based on the interest rate charged during the introductory period. This introductory rate is usually significantly below the fully indexed rate. The fully indexed rate is calculated using an index rate plus a margin. Once the introductory period ends, the contractual interest rate charged on the loan increases to the fully indexed rate and adjusts monthly to reflect movements in the index. The minimum payment is typically insufficient to cover interest accrued in the prior month, and any unpaid interest is deferred and added to the principal balance of the loan. Option ARM loans are subject to payment recast, which converts the loan to a variable-rate fully amortizing loan upon meeting specified loan balance and anniversary date triggers.
Prime
Prime mortgage loans are made to borrowers with good credit records who meet specific underwriting requirements, including prescriptive requirements related to income and overall debt levels. New prime mortgage borrowers provide full documentation and generally have reliable payment histories.
Subprime
Subprime loans are loans that, prior to mid-2008, were offered to certain customers with one or more high risk characteristics, including but not limited to: (i) unreliable or poor payment histories; (ii) a high LTV ratio of greater than 80% (without borrower-paid mortgage insurance); (iii) a high debt-to-income ratio; (iv) an occupancy type for the loan is other than the borrower’s primary residence; or (v) a history of delinquencies or late payments on the loan.
MREL: Minimum requirements for own funds and eligible liabilities
MSA: Metropolitan statistical areas
MSR: Mortgage servicing rights
Multi-asset: Any fund or account that allocates assets under management to more than one asset class.
NA: Data is not applicable or available for the period presented.
NAV: Net Asset Value
Net Capital Rule: Rule 15c3-1 under the Securities Exchange Act of 1934.
Net charge-off/(recovery) rate: Represents net charge-offs/(recoveries) (annualized) divided by average retained loans for the reporting period.
Net interchange income includes the following components:
318 | JPMorgan Chase & Co./2023 Form 10-K | |||||||
Glossary of Terms and Acronyms
•Interchange income: Fees earned by credit and debit card issuers on sales transactions.
•Rewards costs: The cost to the Firm for points earned by cardholders enrolled in credit card rewards programs generally tied to sales transactions.
•Partner payments: Payments to co-brand credit card partners based on the cost of loyalty program rewards earned by cardholders on credit card transactions.
Net mortgage servicing revenue: Includes operating revenue earned from servicing third-party mortgage loans, which is recognized over the period in which the service is provided; changes in the fair value of MSRs; the impact of risk management activities associated with MSRs; and gains and losses on securitization of excess mortgage servicing. Net mortgage servicing revenue also includes gains and losses on sales and lower of cost or fair value adjustments of certain repurchased loans insured by U.S. government agencies.
Net revenue rate: Represents Card Services net revenue (annualized) expressed as a percentage of average loans for the period.
Net yield on interest-earning assets: The average rate for interest-earning assets less the average rate paid for all sources of funds.
NFA: National Futures Association
NM: Not meaningful
NOL: Net operating loss
Nonaccrual loans: Loans for which interest income is not recognized on an accrual basis. Loans (other than credit card loans and certain consumer loans insured by U.S. government agencies) are placed on nonaccrual status when full payment of principal and interest is not expected, regardless of delinquency status, or when principal and interest have been in default for a period of 90 days or more unless the loan is both well-secured and in the process of collection. Collateral-dependent loans are typically maintained on nonaccrual status.
Nonperforming assets: Nonperforming assets include nonaccrual loans, nonperforming derivatives and certain assets acquired in loan satisfactions, predominantly real estate owned and other commercial and personal property.
NSFR: Net Stable Funding Ratio
OAS: Option-adjusted spread
OCC: Office of the Comptroller of the Currency
OCI: Other comprehensive income/(loss)
OPEB: Other postretirement employee benefit
Over-the-counter (“OTC”) derivatives: Derivative contracts that are negotiated, executed and settled bilaterally between two derivative counterparties, where one or both counterparties is a derivatives dealer.
Over-the-counter cleared (“OTC-cleared”) derivatives: Derivative contracts that are negotiated and executed bilaterally, but subsequently settled via a central clearing house, such that each derivative counterparty is only exposed to the default of that clearing house.
Overhead ratio: Noninterest expense as a percentage of total net revenue.
Parent Company: JPMorgan Chase & Co.
Participating securities: Represents unvested share-based compensation awards containing nonforfeitable rights to dividends or dividend equivalents (collectively, “dividends”), which are included in the earnings per share calculation using the two-class method. JPMorgan Chase grants RSUs to certain employees under its share-based compensation programs, which entitle the recipients to receive nonforfeitable dividends during the vesting period on a basis equivalent to the dividends paid to holders of common stock. These unvested awards meet the definition of participating securities. Under the two-class method, all earnings (distributed and undistributed) are allocated to each class of common stock and participating securities, based on their respective rights to receive dividends.
PCAOB: Public Company Accounting Oversight Board
PCD: “Purchased credit deteriorated” assets represent acquired financial assets that as of the date of acquisition have experienced a more-than-insignificant deterioration in credit quality since origination, as determined by the Firm.
PD: Probability of default
Pillar 1: The Basel framework consists of a three “Pillar” approach. Pillar 1 establishes minimum capital requirements, defines eligible capital instruments, and prescribes rules for calculating RWA.
Pillar 3: The Basel framework consists of a three “Pillar” approach. Pillar 3 encourages market discipline through disclosure requirements which allow market participants to assess the risk and capital profiles of banks.
PPP: Paycheck Protection Program under the Small Business Association (“SBA”)
PRA: Prudential Regulation Authority
Pre-provision profit/(loss): Represents total net revenue less noninterest expense. The Firm believes that this financial measure is useful in assessing the ability of a lending institution to generate income in excess of its provision for credit losses.
Pre-tax margin: Represents income before income tax expense divided by total net revenue, which is, in management’s view, a comprehensive measure of pretax performance derived by measuring earnings after all costs are taken into consideration. It is one basis upon which management evaluates the performance of AWM against the performance of their respective competitors.
Principal transactions revenue: Principal transactions revenue is driven by many factors, including:
JPMorgan Chase & Co./2023 Form 10-K | 319 | |||||||
Glossary of Terms and Acronyms
•the bid-offer spread, which is the difference between the price at which a market participant is willing and able to sell an instrument to the Firm and the price at which another market participant is willing and able to buy it from the Firm, and vice versa; and
•realized and unrealized gains and losses on financial instruments and commodities transactions, including those accounted for under the fair value option, primarily used in client-driven market-making activities.
–Realized gains and losses result from the sale of instruments, closing out or termination of transactions, or interim cash payments.
–Unrealized gains and losses result from changes in valuation.
In connection with its client-driven market-making activities, the Firm transacts in debt and equity instruments, derivatives and commodities, including physical commodities inventories and financial instruments that reference commodities.
Principal transactions revenue also includes realized and unrealized gains and losses related to:
•derivatives designated in qualifying hedge accounting relationships, primarily fair value hedges of commodity and foreign exchange risk;
•derivatives used for specific risk management purposes, primarily to mitigate credit, foreign exchange and interest rate risks.
Production revenue: Includes fees and income recognized as earned on mortgage loans originated with the intent to sell, and the impact of risk management activities associated with the mortgage pipeline and warehouse loans. Production revenue also includes gains and losses on sales and lower of cost or fair value adjustments on mortgage loans held-for-sale (excluding certain repurchased loans insured by U.S. government agencies), and changes in the fair value of financial instruments measured under the fair value option.
PSU(s): Performance share units
Regulatory VaR: Daily aggregated VaR calculated in accordance with regulatory rules.
REO: Real estate owned
Reported basis: Financial statements prepared under U.S. GAAP, which excludes the impact of taxable-equivalent adjustments.
Retained loans: Loans that are held-for-investment (i.e., excludes loans held-for-sale and loans at fair value).
Revenue wallet: Proportion of fee revenue based on estimates of investment banking fees generated across the industry (i.e., the revenue wallet) from investment banking transactions in M&A, equity and debt underwriting, and loan syndications. Source: Dealogic, a third-party provider of investment banking competitive analysis and volume-based
league tables for the above noted industry products.
RHS: Rural Housing Service of the U.S. Department of Agriculture
ROA: Return on assets
ROE: Return on equity
ROTCE: Return on tangible common equity
ROU assets: Right-of-use assets
RSU(s): Restricted stock units
RWA: “Risk-weighted assets”: Basel III establishes two comprehensive approaches for calculating RWA (a Standardized approach and an Advanced approach) which include capital requirements for credit risk, market risk, and in the case of Basel III Advanced, also operational risk. Key differences in the calculation of credit risk RWA between the Standardized and Advanced approaches are that for Basel III Advanced, credit risk RWA is based on risk-sensitive approaches which largely rely on the use of internal credit models and parameters, whereas for Basel III Standardized, credit risk RWA is generally based on supervisory risk-weightings which vary primarily by counterparty type and asset class. Market risk RWA is calculated on a generally consistent basis between Basel III Standardized and Basel III Advanced.
S&P: Standard and Poor’s
SAR as it pertains to Hong Kong: Special Administrative Region
SAR(s) as it pertains to employee stock awards: Stock appreciation rights
SCB: Stress capital buffer
Scored portfolios: Consumer loan portfolios that predominantly include residential real estate loans, credit card loans, auto loans to individuals and certain small business loans.
SEC: U.S. Securities and Exchange Commission
Securities financing agreements: Include resale, repurchase, securities borrowed and securities loaned agreements
Securitized Products Group: Comprised of Securitized Products and tax-oriented investments.
Seed capital: Initial JPMorgan capital invested in products, such as mutual funds, with the intention of ensuring the fund is of sufficient size to represent a viable offering to clients, enabling pricing of its shares, and allowing the manager to develop a track record. After these goals are achieved, the intent is to remove the Firm’s capital from the investment.
Shelf securities: Securities registered with the SEC under a shelf registration statement that have not been issued, offered or sold. These securities are not included in league tables until they have actually been issued.
Single-name: Single reference-entities
320 | JPMorgan Chase & Co./2023 Form 10-K | |||||||
Glossary of Terms and Acronyms
SLR: Supplementary leverage ratio
SMBS: Stripped mortgage-backed securities
SOFR: Secured Overnight Financing Rate
SPEs: Special purpose entities
Structural interest rate risk: Represents interest rate risk of the non-trading assets and liabilities of the Firm.
Structured notes: Structured notes are financial instruments whose cash flows are linked to the movement in one or more indexes, interest rates, foreign exchange rates, commodities prices, prepayment rates, underlying reference pool of loans or other market variables. The notes typically contain embedded (but not separable or detachable) derivatives. Contractual cash flows for principal, interest, or both can vary in amount and timing throughout the life of the note based on non-traditional indexes or non-traditional uses of traditional interest rates or indexes.
Taxable-equivalent basis: In presenting results on a managed basis, the total net revenue for each of the business segments and the Firm is presented on a tax-equivalent basis. Accordingly, revenue from investments that receive tax credits and tax-exempt securities is presented in managed basis results on a level comparable to taxable investments and securities; the corresponding income tax impact related to tax-exempt items is recorded within income tax expense.
TBVPS: Tangible book value per share
TCE: Tangible common equity
TDR: “Troubled debt restructuring” applies to loan modifications granted prior to January 1, 2023 and is deemed to occur when the Firm modifies the original terms of a loan agreement by granting a concession to a borrower that is experiencing financial difficulty. Loans with short-term and other insignificant modifications that are not considered concessions are not TDRs.
TLAC: Total Loss Absorbing Capacity
U.K.: United Kingdom
Unaudited: Financial statements and/or information that have not been subject to auditing procedures by an independent registered public accounting firm.
U.S.: United States of America
U.S. GAAP: Accounting principles generally accepted in the U.S.
U.S. government agencies: U.S. government agencies include, but are not limited to, agencies such as Ginnie Mae and FHA, and do not include Fannie Mae and Freddie Mac which are U.S. government-sponsored enterprises (“U.S. GSEs”). In general, obligations of U.S. government agencies are fully and explicitly guaranteed as to the timely payment of principal and interest by the full faith and credit of the U.S. government in the event of a default.
U.S. GSE(s): “U.S. government-sponsored enterprises” are
quasi-governmental, privately-held entities established or chartered by the U.S. government to serve public purposes as specified by the U.S. Congress to improve the flow of credit to specific sectors of the economy and provide certain essential services to the public. U.S. GSEs include Fannie Mae and Freddie Mac, but do not include Ginnie Mae or FHA. U.S. GSE obligations are not explicitly guaranteed as to the timely payment of principal and interest by the full faith and credit of the U.S. government.
U.S. Treasury: U.S. Department of the Treasury
VA: U.S. Department of Veterans Affairs
VaR: “Value-at-risk” is a measure of the dollar amount of potential loss from adverse market moves in an ordinary market environment.
VCG: Valuation Control Group
VGF: Valuation Governance Forum
VIEs: Variable interest entities
Warehouse loans: Consist of prime mortgages originated with the intent to sell that are accounted for at fair value and classified as loans.
JPMorgan Chase & Co./2023 Form 10-K | 321 | |||||||
Signatures
Pursuant to the requirements of Section 13 or 15(d) of the Securities Exchange Act of 1934, the registrant has duly caused this report to be signed on behalf of the undersigned, thereunto duly authorized.
| JPMorgan Chase & Co. (Registrant) | |||||
By: /s/ JAMES DIMON | |||||
| (James Dimon Chairman and Chief Executive Officer) | |||||
| February 16, 2024 | |||||
Pursuant to the requirements of the Securities Exchange Act of 1934, this report has been signed below by the following persons on behalf of the registrant and in the capacity and on the date indicated. JPMorgan Chase & Co. does not exercise the power of attorney to sign on behalf of any Director.
| Capacity | Date | ||||||||||||||||
/s/ JAMES DIMON | Director, Chairman and Chief Executive Officer (Principal Executive Officer) | ||||||||||||||||
| (James Dimon) | |||||||||||||||||
/s/ LINDA B. BAMMANN | Director | ||||||||||||||||
| (Linda B. Bammann) | |||||||||||||||||
/s/ STEPHEN B. BURKE | Director | ||||||||||||||||
| (Stephen B. Burke) | |||||||||||||||||
/s/ TODD A. COMBS | Director | ||||||||||||||||
| (Todd A. Combs) | |||||||||||||||||
/s/ ALICIA BOLER DAVIS | Director | February 16, 2024 | |||||||||||||||
(Alicia Boler Davis) | |||||||||||||||||
/s/ TIMOTHY P. FLYNN | Director | ||||||||||||||||
| (Timothy P. Flynn) | |||||||||||||||||
/s/ ALEX GORSKY | Director | ||||||||||||||||
| (Alex Gorsky) | |||||||||||||||||
/s/ MELLODY HOBSON | Director | ||||||||||||||||
| (Mellody Hobson) | |||||||||||||||||
/s/ MICHAEL A. NEAL | Director | ||||||||||||||||
| (Michael A. Neal) | |||||||||||||||||
/s/ PHEBE N. NOVAKOVIC | Director | ||||||||||||||||
| (Phebe N. Novakovic) | |||||||||||||||||
/s/ VIRGINIA M. ROMETTY | Director | ||||||||||||||||
| (Virginia M. Rometty) | |||||||||||||||||
/s/ MARK A. WEINBERGER | Director | ||||||||||||||||
(Mark A. Weinberger) | |||||||||||||||||
/s/ JEREMY BARNUM | Executive Vice President and Chief Financial Officer | ||||||||||||||||
| (Jeremy Barnum) | (Principal Financial Officer) | ||||||||||||||||
/s/ ELENA KORABLINA | Managing Director and Firmwide Controller | ||||||||||||||||
| (Elena Korablina) | (Principal Accounting Officer) | ||||||||||||||||
322 | JPMorgan Chase & Co./2023 Form 10-K | |||||||