UNITED STATES
SECURITIES AND EXCHANGE COMMISSION
Washington, D.C. 20549
FORM 10-K
| ANNUAL REPORT PURSUANT TO SECTION 13 OR 15(d) OF THE SECURITIES EXCHANGE ACT OF 1934 | ||||||||
For the fiscal year ended December 31 , 2023
OR
| TRANSITION REPORT PURSUANT TO SECTION 13 OR 15(d) OF THE SECURITIES EXCHANGE ACT OF 1934 | ||||||||
For the transition period from _____ to _____
Commission File Number: 001-40274

(Exact name of registrant as specified in its charter)
| (State or other jurisdiction of incorporation or organization) | (I.R.S. Employer Identification No.) | |||||||
| (Address of principal executive offices) | (Zip Code) | |||||||
(517 ) 381-5500
(Registrant’s telephone number, including area code)
Securities registered pursuant to Section 12(b) of the Act:
| Title of each class | Trading Symbol(s) | Name of exchange on which registered | ||||||
Indicate by check mark if the registrant is a well-known seasoned issuer, as defined in Rule 405 of the Securities Act. Yes ☑ No ☐
Indicate by check mark if the registrant is not required to file reports pursuant to Section 13 or Section 15(d) of the Act. Yes ☐ No ☑
Indicate by check mark whether the registrant (1) has filed all reports required to be filed by Section 13 or 15(d) of the Securities Exchange Act of 1934 during the preceding 12 months (or for such shorter period that the registrant was required to file such reports), and (2) has been subject to such filing requirements for the past 90 days. Yes ☑ No ☐
Indicate by check mark whether the registrant has submitted electronically every Interactive Data File required to be submitted pursuant to Rule 405 of Regulation S-T (§232.405 of this chapter) during the preceding 12 months (or for such shorter period that the registrant was required to submit such files). Yes ☑ No ☐
Indicate by check mark whether the registrant is a large accelerated filer, an accelerated filer, a non-accelerated filer, a smaller reporting company, or an emerging growth company. See the definitions of “large accelerated filer,” “accelerated filer,” “smaller reporting company,” and “emerging growth company” in Rule 12b-2 of the Exchange Act.
| ☑ | Accelerated filer | ☐ | |||||||||
| Non-accelerated filer | ☐ | Smaller reporting company | |||||||||
| Emerging growth company | |||||||||||
If an emerging growth company, indicate by check mark if the registrant has elected not to use the extended transition period for complying with any new or revised financial accounting standards provided pursuant to Section 13(a) of the Exchange Act. ☐
Indicate by check mark whether the registrant has filed a report on and attestation to its management’s assessment of the effectiveness of its internal control over financial reporting under Section 404(b) of the Sarbanes-Oxley Act (15 U.S.C. 7262(b)) by the registered public accounting firm that prepared or issued its audit report. ☑
If securities are registered pursuant to Section 12(b) of the Act, indicate by check mark whether the financial statements of the registrant included in the filing reflect the correction of an error to previously issued financial statements. ☐
Indicate by check mark whether any of those error corrections are restatements that required a recovery analysis of incentive-based compensation received by any of the registrant’s executive officers during the relevant recovery period pursuant to §240.10D-1(b). ☐
Indicate by check mark whether the registrant is a shell company (as defined in Rule 12b-2 of the Exchange Act). Yes ☐ No ☑
The aggregate market value of the voting and non-voting common stock held by non-affiliates of the registrant (based on the closing price of the registrant’s most recently completed second fiscal quarter) was approximately $2.5 billion.
As of February 20, 2024, there were 77,412,271 shares of the registrant’s Common Stock, $0.01 par value, outstanding.
DOCUMENTS INCORPORATED BY REFERENCE
Portions of the registrant's definitive proxy statement to be filed in connection with the annual meeting of shareholders to be held on May 23, 2024, are incorporated by reference into Part III of this Annual Report on Form 10-K for the fiscal year ended December 31, 2023 (Form 10-K) where indicated. The registrant's definitive 2024 proxy statement is expected to be filed on or about April 9, 2024.
TABLE OF CONTENTS
Principal Definitions, Abbreviations, and Acronyms Used in the Text and Notes of this Report
| we, us, our and the Company | Jackson Financial Inc. and its consolidated subsidiaries, unless the context refers only to Jackson Financial Inc. as a corporate entity (which we refer to as "JFI" or "Jackson Financial") | ||||
| Jackson | Jackson National Life Insurance Company, our primary operating subsidiary | ||||
| Brooke Life | Brooke Life Insurance Company, our subsidiary and the direct parent company of Jackson National Life Insurance Company | ||||
| Brooke Re | Brooke Life Reinsurance Company, our subsidiary, and a Michigan based captive reinsurer | ||||
| Jackson Finance | Jackson Finance, LLC, our subsidiary | ||||
| PPMH | PPM Holdings, Inc., our subsidiary | ||||
| PPM | PPM America, Inc., a subsidiary of PPMH | ||||
| ACL | Allowance for credit loss | ||||
| Account value ("AV") or account balance | The amount of money in a customer’s account. For example, the value increases with additional premiums and investment gains and it decreases with withdrawals, investment losses and fees. | ||||
| Athene | Athene Life Re Ltd. and its affiliates and permitted transferees, including Athene Co-Invest Reinsurance Affiliate 1A Ltd. | ||||
| Athene Reinsurance Transaction | The funds withheld coinsurance agreement with Athene, entered on June 18, 2020, and effective June 1, 2020, to reinsure a 100% quota share of a block of our in-force fixed and fixed index annuity liabilities in exchange for approximately $1.2 billion in ceding commissions. | ||||
| AUM ("Assets under management") | Investment assets that are managed by one of our subsidiaries and includes: (i) assets managed by PPM, including our investment portfolio (but excluding assets held in funds withheld accounts for reinsurance transactions), (ii) third-party assets (including our former parent and its affiliates), and (iii) the separate account assets of our retail annuities managed and administered by JNAM. | ||||
| Benefit base | A notional amount (not actual cash value) used to calculate guaranteed benefits within an owner's annuity contract. The death benefit and living benefit within the same contract may have different benefit bases. | ||||
| CMBS | Commercial mortgage-backed securities | ||||
| DAC ("Deferred acquisition costs") | Represent the incremental costs related directly to the successful acquisition of new, and certain renewal, insurance policies and annuity contracts. The recognition of these costs has been deferred, and the deferred amounts are shown on the balance sheet as an asset, which is subject to amortization over the estimated lives of those policies and contracts. | ||||
| Deferred tax asset or Deferred tax liability | Assets or liabilities that are recorded for the difference between financial reporting, or book basis, and tax basis of an asset or a liability. | ||||
| Fixed Annuity | An annuity that guarantees a set annual rate of return with interest at rates we determine, subject to specified minimums. Credited interest rates are guaranteed not to change for certain limited periods of time, after which rates may reset. | ||||
| Fixed Index Annuity | An annuity with an ability to share in the upside from certain financial markets, such as equity indices, and provides downside protection | ||||
| General account assets | The assets held in the general accounts of our insurance companies | ||||
| GIC | Guaranteed investment contract | ||||
| Guarantee Fees | Fees charged on our annuity contracts for optional benefit guarantees | ||||
| GMAB ("Guaranteed minimum accumulation benefit") | An add-on benefit (enhanced benefits available for an additional cost) that entitles an owner to a minimum payment, typically in lump-sum, after a set period of time, referred to as the accumulation period. The minimum payment is based on the benefit base, which could be greater than the underlying account value. | ||||
1
| GMDB ("Guaranteed minimum death benefit") | An add-on benefit (enhanced benefits available for an additional cost) that guarantees an owner’s beneficiaries are entitled to a minimum payment based on the benefit base, which could be greater than the underlying account value, upon the death of the owner. | ||||
| GMIB ("Guaranteed minimum income benefit") | An add-on benefit (available for an additional cost) where an owner is entitled to annuitize the policy and receive a minimum payment stream based on the benefit base, which could be greater than the payment stream resulting from current annuitization of the underlying account value. | ||||
| GMWB ("Guaranteed minimum withdrawal benefit") | An add-on benefit (available for an additional cost) where an owner is entitled to withdraw a maximum amount of their benefit base each year, for which cumulative payments to the owner could be greater than the underlying account value. | ||||
| GMWB for Life ("Guaranteed minimum withdrawal benefit for life") | An add-on benefit (available for an additional cost) where an owner is entitled to withdraw the guaranteed annual withdrawal amount each year for the duration of the policyholder’s life, regardless of account performance. | ||||
| NAIC | National Association of Insurance Commissioners | ||||
| NAV | Net asset value | ||||
| Net flows | Net flows represent the net change in customer account balances during a period, after reflecting gross premium inflows and surrender, withdrawal and benefit payment outflows. Net flows do not include investment performance, interest credited to customer accounts and policy charges. | ||||
| RBC ("Risk-based capital") | Statutory minimum level of capital that is required by regulators for an insurer to support its operations | ||||
| RBC Ratio | The ratio of statutory total adjusted capital to company action level required capital. A formal calculation is made annually during the fourth quarter. In other periods, the ratio is estimated. | ||||
| RILA | A registered index-linked annuity, which offers market index-linked investment options, subject to a cap, and offers a variety of guarantees designed to modify or limit losses. | ||||
| RMBS | Residential mortgage-backed securities | ||||
| Variable annuity | An annuity that offers tax-deferred investment into a range of asset classes and a variable return, which offers insurance features related to potential future income payments. | ||||
| VIE | Variable interest entity | ||||
2
FORWARD-LOOKING STATEMENTS – CAUTIONARY LANGUAGE
The information in this Annual Report on 10-K (this “Form 10-K”) contains forward-looking statements about future events and circumstances and their effects upon revenues, expenses and business opportunities. Generally speaking, any statement in this Form 10-K not based upon historical fact is a forward-looking statement. Forward-looking statements can also be identified by the use of forward-looking or conditional words, such as “could,” “should,” “can,” “continue,” “estimate,” “forecast,” “intend,” “look,” “may,” “will,” “expect,” “believe,” “anticipate,” “plan,” “remain,” “confident” and “commit” or similar expressions. In particular, statements regarding plans, strategies, prospects, targets and expectations regarding the business and industry are forward-looking statements. They reflect expectations, are not guarantees of performance and speak only as of the dates the statements are made. We caution investors that these forward-looking statements are subject to known and unknown risks and uncertainties that may cause actual results to differ materially from those projected, expressed, or implied. Factors that could cause actual results to differ materially from those in the forward-looking statements include those reflected in Part I, Item 1A. Risk Factors and Part II, Item 7. Management's Discussion and Analysis of Financial Condition and Results of Operations in this Form 10-K and elsewhere in Jackson Financial Inc.’s filings with the U.S. Securities and Exchange Commission (the "SEC"). Except as required by law, Jackson Financial Inc. does not undertake to update such forward-looking statements. You should not rely unduly on forward-looking statements.
3
Part I
Item 1. Business
Overview
Jackson Financial Inc. (“Jackson Financial” or “JFI”), is a financial services company focused on helping Americans grow and protect their retirement savings and income to enable them to pursue financial freedom for life in the United States (“U.S.”). We believe we are well-positioned in our markets because of our differentiated products and our well-known brand among distributors and advisors. Our market position is supported by our efficient and scalable operating platform and industry-leading distribution network. We are confident these core strengths will enable us to grow as an aging U.S. population transitions into retirement. We refer to Jackson Financial and its subsidiaries collectively as the “Company,” “we,” “our” or “us.”
Jackson Financial, a Delaware corporation, was previously a majority-owned subsidiary of Prudential plc (“Prudential”), London, England, and was the holding company for Prudential’s U.S. operations. The Company's demerger from Prudential was completed on September 13, 2021 (the "Demerger"). See Item 8. Financial Statements and Supplementary Data, Note 1. Business and Basis of Presentation for further discussion of the Demerger.
Our principal operating subsidiary, Jackson National Life Insurance Company ("Jackson National Life" or "Jackson"), was founded in Jackson, Michigan in 1961. We are headquartered in Lansing, Michigan and also maintain offices in Franklin, Tennessee and Chicago, Illinois. Our insurance company subsidiaries are licensed to distribute insurance products in all 50 U.S. states and the District of Columbia.
We offer a diverse suite of annuities to retail investors in the U.S. Our variable annuities have been among the best-selling products of their kind in the U.S. primarily due to the differentiated features we offer as compared to our competitors, in particular the wider range of investment options and greater freedom to invest across multiple investment options. We also offer fixed index, fixed, and payout annuities. In 2021, we successfully launched Jackson Market Link ProSM and Jackson Market Link Pro AdvisorySM, our commission and advisory-based suite of registered index-linked annuities ("RILAs"). In the second quarter of 2023, we enhanced our RILA suite of products with the launch of Jackson Market Link ProSM II and Jackson Market Link Pro AdvisorySM II.
We sell our products through an industry-leading distribution network that includes independent broker-dealers, wirehouses, regional broker-dealers, banks, independent registered investment advisors, third-party platforms and insurance agents. We were the eighth largest retail annuity company in the U.S. for the nine months ended September 30, 2023, and the sixth largest for the year ended December 31, 2022, according to the latest available report from Life Insurance Marketing and Research Association ("LIMRA"), a worldwide insurance and related financial services trade association, as measured by sales. Our total retail annuity sales for the years ended December 31, 2023 and 2022 were $12.8 billion and $15.7 billion, respectively.
Our operating platform is scalable and efficient. We administer approximately 79% of our in-force policies on our in-house policy administration platform. The remainder of our business is administered through established third-party arrangements. We believe our operating platform provides us with a competitive advantage by allowing us to grow efficiently and provide superior customer service while maintaining a combined statutory operating expense-to-asset ratio of 27 basis points at our principal insurance company subsidiaries for the year ended December 31, 2023, which we believe is among the lowest in the life and annuity industry.
Product design and pricing are key aspects of our risk management approach, as is our hedging program. We intend to continue using our diverse product offerings, distribution capabilities, and operating platform to pursue growth opportunities.
4
Part I | Item 1. Business | Overview
These core strengths enable us to produce an attractive financial profile, reflected by our track record of generating profitable growth and earning attractive returns. In addition, we have shown a commitment to long-term capital return to shareholders through our share repurchase plan and shareholder dividends. The table below presents selected financial and operating measures:
| Years Ended December 31, | ||||||||||||||
| 2023 | 2022 | |||||||||||||
| (in millions, except percentages) | ||||||||||||||
| Total Sales | $ | 13,898 | $ | 18,135 | ||||||||||
| Assets Under Management ("AUM") | 315,838 | 290,549 | ||||||||||||
| Net income (loss) attributable to Jackson Financial Inc. common shareholders | 899 | 6,186 | ||||||||||||
Adjusted Operating Earnings (1) | 1,073 | 1,454 | ||||||||||||
| Capital Returned to Common Shareholders | 464 | 482 | ||||||||||||
| Return on Equity ("ROE") Attributable to Common Shareholders | 10.3 | % | 69.7 | % | ||||||||||
Adjusted Operating ROE Attributable to Common Shareholders on average adjusted book value (1) | 10.6 | % | 16.2 | % | ||||||||||
Jackson statutory risk-based capital (2) | 624 | % | 544 | % | ||||||||||
(1) Non-GAAP financial measure. See Item 7. Management's Discussion and Analysis of Financial Condition and Results of Operations — Non-GAAP Financial Measures for information regarding our non-GAAP financial measures and reconciliations to the most comparable U.S. GAAP measures. | ||||||||||||||
(2) Based on a Company Action Level basis. | ||||||||||||||
How We Generate Revenues and Profitability
We earn revenues predominantly from fee income, income from investments, and insurance premiums. Our profitability is dependent on our ability to properly price and manage risk on insurance and annuity products, to manage our portfolio of investments effectively, and to control costs through expense discipline. See Item 7. Management's Discussion and Analysis of Financial Condition and Results of Operations — Executive Summary for more information on the sources of our revenues and expenses, and the impact of our hedging program upon our reported net income.
Our Product Offerings by Segment
We manage our business through three reporting segments: Retail Annuities, Institutional Products, and Closed Life and Annuity Blocks. We report certain activities and items that are not included in these reporting segments in Corporate and Other, including the results of our subsidiary, PPM Holdings, Inc. ("PPMH"), and its subsidiary PPM America Inc. ("PPM").
Retail Annuities
We are one of the leading providers of annuities in the U.S. retirement market. Our Retail Annuities segment includes our variable, fixed index, fixed, and payout annuities as well as our Registered Index-Linked Annuities, or RILA, and our lifetime income solutions offering in the defined contribution market.
Our annuities are designed to offer customers investment opportunities to:
•grow their savings on a tax-deferred basis consistent with their objectives, ranging from annuities that offer full market participation to annuities that offer guaranteed fixed returns, including full or partial protection of principal;
•protect their assets using a variety of standard and optional guaranteed benefits and guaranteed minimum crediting rates; and
•provide a source of income in the form of minimum payments for life and minimum payments to beneficiaries upon death.
5
Part I | Item 1. Business | Our Product Offerings by Segment
Our annuity sales for the years ended December 31, 2023 and 2022, and the account value as of December 31, 2023 and 2022, were as follows (in millions):
| 2023 | 2022 | |||||||||||||||||||||||||
| Sales | Account Value | Sales | Account Value | |||||||||||||||||||||||
| Variable annuities | $ | 9,540 | $ | 227,777 | $ | 13,638 | $ | 205,809 | ||||||||||||||||||
| Fixed index annuities | 210 | 622 | (1) | 126 | 415 | (1) | ||||||||||||||||||||
| Fixed annuities | 193 | 1,218 | (1) | 162 | 1,219 | (1) | ||||||||||||||||||||
| RILA | 2,890 | 5,219 | 1,811 | 1,875 | ||||||||||||||||||||||
(1) Net of reinsurance | ||||||||||||||||||||||||||
Variable Annuities
Our variable annuities offer our customers full participation in market returns through a broad selection of funds in a variety of investment styles, including equities and fixed income. Optional benefits offer customers guaranteed minimum protection based on their eligible contributions, adjusted for withdrawals, and are designed to protect against market volatility and investment performance risk. The principal features of our variable annuity optional guaranteed benefits are:
| Features of our Optional Guaranteed Benefits | Referred To As | Acronym | ||||||
Guaranteed minimum payments for the customer’s lifetime based on a fixed annual percentage of the benefit base | Guaranteed Minimum Withdrawal Benefits for Life | GMWB for Life | ||||||
| Guaranteed minimum payments based on a fixed annual percentage of the benefit base, for at least the amount of the customer’s total eligible contributions | Guaranteed Minimum Withdrawal Benefits | GMWB | ||||||
| Death benefits that guarantee the annuity beneficiary will receive the higher of the current account value or the benefit base, which can be increased through roll-up and step-up features | Enhanced Guaranteed Minimum Death Benefits | Enhanced GMDB | ||||||
As of December 31, 2023 and 2022, the percentage of our total variable annuity account value represented by those optional guaranteed benefits was as follows:
| 2023 | 2022 | ||||||||||
| GMWB for Life | 73 | % | 73 | % | |||||||
| GMWB | 3 | % | 3 | % | |||||||
| Enhanced GMDB | 11 | % | 11 | % | |||||||
The investment freedom and optional guaranteed benefits valued by our customers and distribution partners have remained generally consistent over our history. As a result, we have strong brand recognition with distributors and advisors, as demonstrated by the +41 Net Promoter Score (“NPS”) for our variable annuities, compared to an industry average NPS of +32, based on advisor surveys conducted by Market Metrics in 2023.
In addition, Jackson National Asset Management LLC’s ("JNAM") results are included within our Retail Annuities segment. The separate account assets associated with our variable annuities are managed by JNAM, a wholly-owned registered investment advisor that provides investment advisory, fund accounting and administration services to the funds offered within our variable annuities. JNAM selects, monitors and actively manages the investment advisors that manage the funds we offer within our variable annuities. JNAM also directly manages asset allocation for funds of funds offered within our variable annuities. As of December 31, 2023, JNAM managed $242.7 billion of assets.
In 2021, AllianceBernstein L.P. ("AllianceBernstein") added Jackson National Life to its platform of insurers that provide guaranteed income in its Lifetime Income Strategy retirement solution for defined contribution plans. Lifetime Income Strategy is offered to serve as a qualified default investment alternative. Similar to the GMWB options offered on our variable annuities, Lifetime Income Strategy is designed with a flexible guaranteed income option to offer plan participants
6
Part I | Item 1. Business | Our Product Offerings by Segment
control of their account, full access to their money and guaranteed income in retirement. For the years ended December 31, 2023 and 2022, we had defined contribution products sales of $176 million and $696 million through the platform, respectively.
Fixed Index Annuities
Our fixed index annuities offer a guaranteed minimum crediting rate that may be lower than a traditional fixed annuity and allow the customer discretion in the allocation of assets to either fixed accounts (which offer a fixed interest rate that is similar to our fixed annuities regardless of market performance) or to indexed funds with the potential for additional growth based on the performance of a reference market index (generally, the S&P 500 or MSCI Europe, Australasia, and Far East index), subject to a cap. Our fixed index annuities also offer an optional guaranteed minimum payments for life benefit.
Fixed Annuities
Our fixed annuities offer a guaranteed minimum crediting rate that is typically higher than the interest rates offered by bank savings accounts or money market funds. In addition to our traditional fixed annuities, we currently market multi-year guaranteed annuities with three different guaranteed crediting rate periods. Our fixed annuities do not offer guaranteed minimum payments for life benefits but can be annuitized or converted into a series of income payments that offers such benefits, such as payout annuities.
RILA
The registered index-linked annuity market has been the fastest growing categories in the annuity market over the last five years, growing at a compound annual growth rate of 28% from 2019 through 2023. Our RILA suite offers our customers access to market returns through market index-linked investment options, subject to a cap, and offers a variety of guarantees designed to modify or limit losses. Our RILA generally includes a guaranteed minimum payment to beneficiaries upon death. Our RILA offers a number of options for a customizable product, including several combinations of crediting strategies, index options, term lengths, and levels of downside protection in the form of "floors" or "buffers". Downside protection beyond a specified percentage loss is provided through a “floor,” which establishes the maximum percentage loss in the selected market index-linked investment option that a customer will experience in a down market. Any loss in excess of the floor is insured and borne by us. Partial downside protection is provided through a “buffer,” which establishes an initial range of loss in the market index-linked investment option selected (e.g., the first 20% of loss) that we will insure and bear. Any loss that exceeds the buffer will result in a loss of account value and be experienced by the customer. We believe the RILA market presents us with a compelling growth opportunity in our traditional channels with the potential to earn attractive risk-adjusted returns.
Institutional Products
Our Institutional Products segment consists of traditional guaranteed investment contracts, funding agreements (including agreements issued in conjunction with our participation in the U.S. Federal Home Loan Bank ("FHLB") program) and medium-term funding agreement-backed notes. Our institutional products provide us with an additional source of investment spread-based income, and generally guarantee our customers the payment of principal and interest at a fixed or floating rate over a term of two to ten years. This investment spread-based income is the difference between the rate of return we earn on the deposit and the interest payable to the customers that purchase these products. We typically issue institutional products on an opportunistic basis depending on both the risk-adjusted return on investment opportunities available and the prevailing cost of funding required by customers that purchase our institutional products. For the year ended December 31, 2023, we had institutional product sales of $1.1 billion. As of December 31, 2023, we had institutional product account value of $8.4 billion.
Closed Life and Annuity Blocks
Our Closed Life and Annuity Blocks segment is primarily composed of blocks of business that have been acquired since 2004. The segment includes various protection products, primarily whole life, universal life, variable universal life, and term life insurance products, as well as fixed, fixed index, and payout annuities. The segment also includes a block of group payout annuities that we assumed from John Hancock Life Insurance Company (USA) and John Hancock Life Insurance Company of New York through reinsurance transactions in 2018 and 2019, respectively.
7
Part I | Item 1. Business | Our Product Offerings by Segment
We historically offered traditional and interest-sensitive life insurance products but discontinued new sales of life insurance products in 2012, as we believe opportunistically acquiring mature blocks of life insurance policies is a more efficient means of diversifying our in-force business than selling new life insurance products. As of December 31, 2023, we had more than 1.5 million policies in-force. At December 31, 2023, our Closed Life and Annuity Blocks segment had $21.7 billion of total reserves.
Corporate and Other
Corporate and Other includes the operations of PPMH and its subsidiary, PPM, unallocated corporate income and expenses, and certain eliminations and consolidation adjustments.
PPM manages the majority of our general account investment portfolio. Our investment and asset allocation guidelines are designed to provide us with a competitive rate of return on invested assets, support the profitable growth of our business, and support our goal of maintaining appropriate capitalization from both a regulatory and ratings perspective. PPM also provides investment management services to Prudential affiliates in Asia, former affiliates in the United Kingdom and other third parties across markets, including public fixed income, private equity, private debt and commercial real estate. As of December 31, 2023, PPM managed approximately $73.1 billion of assets.
Distribution and Operations
Distribution Channels
As of December 31, 2023, our retail annuities are distributed through:
•approximately 522 broker-dealer distribution partners and more than 120,000 appointed advisors across the three traditional broker-dealer channels including independent broker-dealers; banks and other financial institutions; and wirehouses and regional broker-dealers; and
•more than 1,380 registered investment advisors ("RIAs") have a Jackson RIA agreement and can access Jackson advisory solutions through an outsourced insurance desk ("OID"). Collectively these firms have more than 11,700 investment advisory representatives ("IARs") without a broker-dealer registration.
In addition, Jackson National Life Distributors, LLC ("JNLD") is registered as a broker-dealer with the U.S. Securities and Exchange Commission ("SEC"), pursuant to the Securities Exchange Act of 1934, as amended (the "Exchange Act"), and is registered as a broker-dealer in all applicable states.
Our strong presence in multiple distribution channels helps position us as a leading provider of retirement savings and income solutions. According to LIMRA LOMA U.S. Individual Annuity Sales Industry report, for the nine months ended September 30, 2023, we accounted for 12.1% of all sales in the U.S. variable annuity market and ranked #2 in variable annuity sales. The industry-leading size of our wholesaling force propels our sales in the traditional variable annuity market to be over triple that of our closest competitor per ISS Market Intelligence's YTD third quarter 2023 Competitor Sales, Staffing and Productivity Benchmarking report. We are increasingly focused on growing sales through our Independent RIAs, Platforms & Agents ("IPA") channel. We facilitate the sale of annuities by RIAs by offering them use of an insurance support desk that satisfies insurance-related licensing and regulatory requirements. We believe there is a significant long-term opportunity to grow annuity sales through RIAs, who managed approximately $7.16 trillion in investor assets at the end of 2022, according to a report by Cerulli Associates.
We sell our institutional products through investment banks or other intermediaries to institutional and corporate investors, plan sponsors and other eligible purchasers.
8
Part I | Item 1. Business | Distribution and Operations
Operating Platform
Our in-house policy administration platform gives us flexibility to administer multiple product types through a single platform. We have more than 2.8 million life and annuity policies and currently administer approximately 79% of our in-force policies on our in-house platform, eliminating the burdens, costs and inefficiencies that would be involved in maintaining multiple legacy administration systems. We also have scalable third-party administration agreements. Our ability to utilize both in-house and third-party administrative platforms gives us flexibility to convert and administer acquired business efficiently. We believe our operating platform provides a competitive advantage by allowing us to grow efficiently and provide superior customer service. In 2023, Jackson received the Highest Customer Service — Financial Industry award from Service Quality Measurement Group, Inc. ("SQM") for the 12th straight year. According to the Operations Managers’ Roundtable, we ranked 2nd for overall operational capabilities in 2022 and 2023 by our broker-dealer partners.
Underwriting and Product Design
Our key underwriting and product design practices include:
•In 2012, we developed and launched Elite Access, our investment-only variable annuity that does not include any guaranteed living benefits. Since that time, it has been the industry’s best-selling investment-only variable annuity.
•In 2021, we successfully launched our commission and advisory based suite of RILAs.
•All our variable annuities, including our flagship variable annuity, Perspective II, may be purchased without any guaranteed living benefits.
•For those products that include optional guaranteed benefits, we focus on living benefits that are easier to manage in terms of risk, such as GMWB and GMWB for Life.
•We no longer offer guaranteed living benefits that we believe offer us a lower risk-adjusted return, such as Guaranteed Minimum Income Benefits, or GMIBs; instead, we utilize third-party reinsurance to mitigate the risks that we face relating to those benefits.
•We have designed substantially all of our products such that the guarantee fee charged to the customer is calculated based on the benefit base, rather than the account value, which supports our hedging program by stabilizing the guarantee fees we earn.
•Less than 4% of our in-force variable annuity policies, based on account value as of December 31, 2023, were sold prior to the 2008 financial crisis, a period when many variable annuities sold by our competitors were uneconomically priced and offered difficult to manage guarantee features.
We set what we believe are appropriate mortality and policyholder behavior assumptions as part of our pricing and reserving practices. We monitor experience on a regular basis, and we incorporate new experience data and emerging trends to ensure our actuarial assumptions and models reflect the appropriate mix of all available information and expert judgment.
Our core dynamic hedging program seeks to offset changes in economic liability associated with variable annuity guaranteed benefits due to market movements, while our macro hedging program seeks to protect statutory capital under a range of stress scenarios. We also use third-party reinsurance to mitigate a portion of the risks we face, principally in certain of our in-force annuity and life insurance products with regard to longevity and mortality risks and with regard to the vast majority of our GMIB optional benefit features.
Historically, we have managed and diversified our overall mortality and longevity risks through acquisitions. Since 2012, we have acquired more than $15.0 billion in life and annuity reserves. Consistent with our financial goals, we may opportunistically explore acquisitions we believe provide attractive risk-adjusted returns.
9
Part I | Item 1. Business | Competition
Competition
The insurance industry is highly competitive, with several factors affecting our ability to compete effectively, including the range of products offered, product terms and features, financial strength and credit ratings, brand strength and name recognition, investment management performance and fund management trends, responsiveness to developing demographic trends, customer appetite for certain products and technological advances. Our competitors include major stock and mutual insurance companies, mutual fund organizations, banks, and other financial services companies. In recent years, there has been substantial consolidation and convergence among companies in the insurance and financial services industries resulting in increased competition from large, well-capitalized insurance and financial services firms that market products and services similar to ours. Increased consolidation among banks and other financial services companies could create firms with even stronger competitive positions, negatively impact the insurance industry’s sales, increase competition for access to distribution partners, increase distribution expenses, and impair the ability to market annuities to the current customer base or expand the customer base. Despite the increasing competition, we believe that our competitive strengths position us well in the current competitive environment. Competitive activity could adversely affect our market share and financial results, which could cause a material adverse effect on our business, financial condition, results of operations and cash flows. See Item 1A. Risk Factors— Risks Related to the Distribution of Our Products.
Risk Management
Enterprise Risk Management Framework
The risk management framework (the “Framework”) defines our approach for identifying, assessing, managing, monitoring and reporting material risks to our business and is reviewed on an annual basis to ensure it meets stakeholders' expectations and remains in compliance with regulatory requirements. The Framework is designed to provide clear direction and embed risk management in day-to-day decision making and is organized around six core components, described below.
Enterprise Risk Management Framework - Core Components
Risk Governance & Culture
Jackson Financial's Board of Directors (the "Board of Directors" or the "Board") oversees and approves the Framework and delegates risk oversight responsibilities to Board committees. We embed risk management in the business using a three lines model:
•Risk Ownership and Management (first line): Our business function leaders have primary ownership of risk management relating to their area of expertise.
•Risk Oversight and Challenge (second line): Our Risk team focuses on risk oversight and challenge, especially related to top business, financial and non-financial risks. Our Compliance team oversees and ensures appropriate frameworks are in place to manage compliance and regulatory requirements.
•Independent Assurance (third line): Our Internal Audit team provides independent, objective, and risk-based assessment and reporting on the overall effectiveness of risk management, control, and governance processes across the organization. The internal audit team is directly overseen by the Jackson Financial Audit Committee and operates pursuant to a charter which is reviewed and approved annually by the Jackson Financial Audit Committee.
Risk Appetite and Limits
We manage our business under a Board-approved risk appetite that specifies the risk we are willing to accept in pursuit of our objectives. Our Board's Finance and Risk Committee approves and monitors a set of risk limits that support compliance with the Risk Appetite.
Risk Identification, Assessment, Measurement and Management
We operate an enterprise-wide risk identification and risk and control self-assessment ("RCSA") process to develop a holistic view of the material risks we face and our control environment. We consider financial, non-financial and strategic
10
Part I | Item 1. Business | Risk Management
risks. We also monitor the external environment for emerging risks. See Item 1A. Risk Factors for a description of the risks we face.
Risk Monitoring, Reporting and Escalation
Risk monitoring and reporting processes facilitate risk-based decision making by management, and risk management oversight by management and Board committees. Risk escalation processes exist to ensure Risk Appetite or Risk Limit breaches along with material non-financial risk events are escalated in a timely manner to executive management, management committees, and board committees.
Risk Response and Recovery Plans
We maintain a financial recovery plan and other risk response and recovery plans to remediate breaches of Risk Appetite or Risk Limits, strengthen capital or liquidity, or respond to significant non-financial risk events.
Risk Stress and Scenario Testing
We regularly perform stress and scenario testing to assess our risk profile and test our ability to manage through material financial and non-financial risk events.
Risk Management Strategies
Financial Risk
We employ various financial risk management strategies to limit losses and manage exposures to significant risks within established Risk Limits.
Market Risk Management: Our primary market risk exposure results from interest rate fluctuations, equity price movements and changes in credit spreads. See Item 7A. Quantitative and Qualitative Disclosures about Market Risk for further information regarding our market risk exposures, and how we manage these risks.
Counterparty Risk Management: The inability of a banking, derivative or reinsurance counterparty to satisfy its obligations could expose us to material risk. Collateralization of the value of contracts we hold with a given counterparty serves as a key component of our counterparty risk management strategy. Collateral requirements are specified contractually. In addition, we have placed formal limits on the amount of exposure we are willing to accept for a given counterparty, after consideration of collateral held both in aggregate and by risk source (banking, derivatives, reinsurance); these limits vary based on the credit worthiness of the counterparty.
Asset-Liability Management: We use asset-liability duration and cash flow management techniques to ensure that obligations arising from our products will be met when they become due. Such techniques consider current and future investment returns, asset and liability durations, risk tolerance and cash flow requirements. We closely monitor our investment portfolio to assess our asset-liability position and adjust the allocation of assets within the investment portfolio as necessary to reduce the risk of mismatched cash flows between our assets and obligations to our policyholders. To further support our asset-liability management process, we analyze the adequacy of reserves annually. This analysis includes dynamic cash flow testing of assets and liabilities, by product, under a variety of interest rate scenarios to provide assurance that current assets and associated yields will be enough to satisfy obligations as they come due.
Hedging Program: Our hedging program seeks to balance three risk management objectives: protecting against the economic impact of adverse market conditions, protecting statutory capital, and stabilizing statutory distributable earnings throughout market cycles. See Item 7A. Quantitative and Qualitative Disclosures of Market Risk for further information regarding our hedging program, and how we use it to manage market risk.
Third-Party Reinsurance: We utilize third-party reinsurance to mitigate a portion of the risks that we face, principally in certain of our in-force annuity and life insurance products related to longevity and mortality risks and specific features of our variable annuities. We have entered into reinsurance contracts to manage the full spectrum of risk exposure on certain blocks of business. The majority of our in-force fixed annuity and fixed index annuity businesses, as well as the legacy block of Guaranteed Minimum Income Benefits ("GMIBs") on Variable Annuities ("VA"), has been ceded to highly-rated unaffiliated reinsurers.
11
Part I | Item 1. Business | Risk Management
Pricing and Reserving: We set what we believe are appropriate mortality and policyholder behavior assumptions as part of our pricing and reserving practices. Those assumptions are regularly updated and reflect the appropriate mix of available information and expert judgment. Factors considered in product pricing primarily include expected investment returns, interest rates, market volatility, mortality, longevity, persistency, benefit utilization and operating expenses as well as other features of certain annuity products. Our product pricing models also take into account capital requirements, risk profile, target returns and operating expenses.
Non-Financial Risk
In addition to the financial risks noted above, our business inherently faces operational and regulatory risks, which can lead to financial loss, negative impacts to customers and stakeholders, and regulatory scrutiny. Examples of key “non-financial” risks include cyberattacks and information security breaches, failure of third parties to provide contracted services, fraud, model risk and conflicts of interest.
We regularly assess and report on our key risks to our Board's Finance and Risk Committee and have management committees and forums in place to manage and oversee our relevant non-financial risks. Our policies, processes and controls (collectively, our internal control environment) are designed and implemented with a goal to minimize exposure to these risks and prevent material financial losses and operational events (direct or indirect) that adversely affect our ability to meet our commitments to customers. In addition, we have risk-specific response plans and processes in place to quickly identify and appropriately address control failures or other risk events when they occur. Our internal control environment, including compliance with internal policies, is regularly assessed for effectiveness, and oversight is provided by our Risk and Internal Audit teams.
Regulation
Our company is subject to, or affected by, many laws and regulations as a result of:
•our public company status,
•our ownership and operation of insurance companies,
•our ownership and operation of registered investment advisors and regulated broker-dealers,
•our use of derivatives, and
•our advisory relationships with customers.
| Operating Entity | Primary Regulator | ||||
| Jackson National Life Insurance Company (domiciled in Michigan) | Subject to regulation and supervision by the Michigan Department of Insurance and Financial Services ("DIFS"), and by insurance regulatory authorities in other U.S. states in which Jackson is authorized to transact business | ||||
| Jackson National Life Insurance Company of New York (domiciled in New York) | Subject to regulation and supervision by the New York State Department of Financial Services ("NYSDFS") | ||||
| Jackson National Asset Management LLC | SEC-registered investment adviser | ||||
| PPM America, Inc. | SEC-registered investment adviser | ||||
| Jackson National Life Distributors LLC | SEC-registered broker-dealer and subject to regulation and supervision by the Financial Industry Regulatory Authority, Inc. (“FINRA”) | ||||
These laws and regulations affect, among other things, how we conduct business, our permitted investments and financial condition, marketing and investment disclosures, cybersecurity and privacy requirements, and applicable accounting standards. Further, they are complex, subject to change, and administered and enforced by multiple governmental authorities. The authorities include state insurance regulators, state securities administrators, the SEC, FINRA, the U.S. Department of Labor (“DOL”), the U.S. Department of Justice, and state attorneys general. Generally, these laws and
12
Part I | Item 1. Business | Regulation
regulations are designed to protect or benefit the interests of a specific constituency, such as, for example, state insurance laws and regulations that are generally intended to protect or benefit purchasers or users of insurance products.
State Insurance Regulation
State insurance laws establish supervisory agencies with broad administrative and supervisory powers related to granting and revoking licenses to transact business, regulating marketing and other trade practices, establishing guaranty associations, licensing agents, prescribing and approving policy forms, regulating certain premium rates, regulating insurance holding company systems, establishing reserve requirements, prescribing the form and content of required financial statements and reports, performing financial and other examinations, determining the reasonableness and adequacy of statutory capital and surplus, regulating the type and amount of investments permitted, limiting the amount of dividends that can be paid and the size of transactions that can be consummated without first obtaining regulatory approval, regulating standards of business conduct and other related matters. Certain information and reports that each of Brooke Life and Jackson has filed with DIFS can be inspected during normal business hours at 530 W. Allegan Street, 7th Floor, Lansing, Michigan.
As part of their regulatory oversight process, state insurance departments conduct periodic examinations, generally once every three to five years, of the books, records, accounts and business practices of insurers domiciled in their states. Examinations are sometimes carried out in cooperation with other states' insurance regulators under guidelines promulgated by the National Association of Insurance Commissioners (the “NAIC"). State and federal insurance and securities regulatory authorities and other state law enforcement agencies and attorneys general also, from time to time, make inquiries and conduct examinations or investigations regarding our compliance with among other things, insurance laws and securities laws. The most recent DIFS and NYSDFS examinations of Jackson and Jackson National Life Insurance Company of New York ("Jackson NY"), respectively, concluded in 2023 with no material findings.
Insurance companies have been under increased scrutiny by various state regulators, the federal government and the NAIC. Various states have considered or enacted legislation that in many cases increases states’ authority to regulate insurance companies. Although the federal government does not directly regulate the insurance business, federal legislation and administrative policies in several areas, including pension regulation, age and sex discrimination, financial services regulation, securities regulation and federal taxation, can significantly affect the insurance business. Legislation has been introduced from time to time in the U.S. Congress that could result in a more expansive role of regulation of insurance companies. The NAIC has approved and recommended several regulatory initiatives designed to reduce the risk of insurance company insolvencies. These initiatives include investment and reserve requirements, risk-based capital (“RBC”) standards, restrictions on an insurance company’s ability to pay dividends to its shareholders, and the adoption of model laws, relating to risk management, financial exposure assessment, and governance structure disclosure.
State insurance laws and regulations also include provisions governing marketplace activity of life and annuity insurers, including provisions governing the form and content of disclosure to consumers, such as illustrations, advertising, sales practices and complaint handling. State regulatory authorities generally enforce these provisions through periodic market conduct examinations, with emphasis in recent years on improper life insurance pricing and sales practices, race-based underwriting or sales practices, and misleading sales presentations, targeting the elderly, and product suitability for potential customers.
In December 2022, Michigan enacted an amendment to the holding company provision within its Insurance Code, which adopts a Group Capital Calculation ("GCC") for use in DIFS’ monitoring of insurance holding companies’ solvency. While the GCC is not a capital requirement, the calculation is intended to provide additional analytical information for use in assessing group risks and capital adequacy, complementing DIFS’ current holding company analysis. The changes were required to ensure Michigan remained in compliance with accreditation standards set by the NAIC, which allows for inter-state cooperation and reduces regulatory redundancies.
13
Part I | Item 1. Business | Regulation
Annuity Suitability Regulation
On February 13, 2020, the NAIC approved revisions to the Suitability in Annuity Transactions Model Regulation (the “Annuity Suitability Model Regulation”). The revised model imposes a “best interest” standard of conduct and includes a “safe harbor” for fiduciary advisors who recommend annuities. Under the safe harbor, as it applies to the “care” elements of the Annuity Suitability Model Regulation, investment advisors offering annuities need only comply with the Investment Advisers Act of 1940, as amended (the “Investment Advisers Act”). Each state chooses whether to implement the Annuity Suitability Model Regulation. If they so choose, they will either amend their current suitability regulations or adopt the new model. NYSDFS' amended insurance regulation (Regulation 187, "Suitability and Best Interest in Life Insurance and Annuity Transactions") incorporates the “best interest” standard for the sale of annuities and expands the application of this standard beyond annuity transactions to include sales of life insurance policies to consumers.
Guaranty Associations and Similar Arrangements
State laws require insurance companies doing business within their jurisdictions to participate in various types of guaranty associations or other similar arrangements. These guaranty associations and arrangements provide certain levels of protection to customers from losses under insurance policies issued by insurance companies that become impaired or insolvent. Typically, these guaranty associations levy assessments up to a prescribed limit on a member insurer's proportionate share of the business in the relevant jurisdiction of all member insurers in the lines of business in which the impaired or insolvent insurer is engaged. Some states permit member insurers to recover assessments that they paid through full or partial premium tax offsets, usually over a period of years. The aggregate assessments levied against us during the prior three years have not been material to our financial condition.
Regulation of Investments
We are subject to state laws and regulations that require diversification of our investment portfolios and limit the amount of investments in certain asset categories, such as below investment-grade fixed income securities, equity real estate, mortgages, other equity investments, foreign investments and derivatives. Failure to comply with these requirements would cause investments exceeding regulatory limitations to be treated as non-admitted assets for purposes of measuring surplus and, in most instances, would require divestiture of the non-qualifying investments. We believe that our investments complied with these requirements at December 31, 2023.
Surplus and Capital; RBC Requirements
The NAIC has developed RBC standards for life insurance companies as well as a model act for state legislatures to enact. The model act requires that life insurance companies report on a RBC formula standard calculated by applying factors to various asset, premium and reserve items and separate model-based calculations of risk associated primarily with interest rate and market risks. The RBC formula takes into account the risk characteristics of a company, including asset risk, insurance risk, interest rate risk, market risk and business risk. The NAIC designed the formula as an early warning tool to identify potentially inadequately capitalized companies for purposes of initiating regulatory action.
Under RBC requirements, regulatory compliance is determined by an NAIC defined ratio (known as the RBC ratio) of a company’s total adjusted capital, to its company action level of RBC, also as defined by the NAIC. Four levels of regulatory attention may be triggered if the RBC ratio is insufficient:
14
Part I | Item 1. Business | Regulation
| RBC Ratio | Regulatory Attention | |||||||
| Company action level | Between 75% to 100% | Insurer must submit a plan to the regulator detailing corrective action it proposes to undertake | ||||||
| Regulatory action level | Between 50% to 75% | Insurer must submit a plan, but a regulator may also issue a corrective order requiring the insurer to comply within a specified period | ||||||
| Authorized control level | 35% to 50% | Regulatory response is the same as at the “Regulatory action level,” but in addition, the regulator may take action to rehabilitate or liquidate the insurer | ||||||
| Mandatory control level | Less than 35% | Regulator must rehabilitate or liquidate the insurer | ||||||
As of December 31, 2023, Jackson's and Jackson NY’s total adjusted capital and RBC minimum required levels under the NAIC’s definition substantially exceeded the standards of their respective states of domicile and the NAIC.
We believe that we will be able to maintain our RBC ratios in excess of “company action level” through appropriate risk management, investing and capital management, and claims handling. However, no assurances can be given that developments affecting us or our insurance subsidiaries, many of which could be outside of our control, will not cause our RBC ratios to fall below our targeted levels. See Item 1A. Risk Factors—Risks Related to Legal, Tax and Regulatory Matters—A decrease in the risk-based capital ("RBC") ratio (as a result of a reduction in statutory capital and surplus or increase in RBC requirements) of our insurance subsidiaries could result in increased scrutiny by insurance regulators and rating agencies, which could lead to corrective measures and ratings downgrades that could adversely affect our business, financial condition, results of operations and cash flows.
The NAIC updated the risk-based capital framework to reflect more current modeling of asset risk and insurance risk, with changes effective at year-end 2021 and 2022. The changes had minimal impact on our life insurance subsidiaries.
Federal Initiatives Impacting Insurance Companies
While the U.S. government does not directly regulate the insurance industry, federal initiatives can impact the insurance industry.
Dodd-Frank Wall Street Reform and Consumer Protection Act of 2010
Title VII of the Dodd-Frank Act, and similar laws passed in jurisdictions outside the U.S., has significantly impacted the regulation of over-the-counter derivatives. In the U.S., the Commodity Futures Trading Commission (the “CFTC”) and the SEC regulate swaps and other derivatives. The CFTC has primary jurisdiction over swaps, which constitute the vast majority of the market, and the SEC has primary jurisdiction over security-based swaps.
Dodd-Frank Act requirements and similar non-U.S. regulations make it more costly to use derivatives and hedge investment exposures and may affect our returns. These regulations may impede our ability to utilize derivatives. Another factor that has driven up the cost of trading in both over-the-counter and exchange traded derivatives is the increased capital charges imposed on financial intermediaries, such as futures commission merchants and banks. As a result of these regulations, we expect costs to continue to rise, which could adversely impact our ability to implement our desired hedging strategies. As a result of the Dodd-Frank Act, the CFTC has adopted significant regulations changing the way swaps are traded in the U.S., including:
•imposing registration requirements on swap dealers and large market participants, known as major swap participants,
•subjecting a significant portion of the interest rate swap market and some of the credit default swap index market to mandatory exchange or swap execution facility trading and central clearing requirements, and
•imposing new requirements on swap transactions, including trade reporting and recordkeeping, know-your-customer and other sales practices, and documentation for swap transactions entered into with swap dealers and major swap participants.
15
Part I | Item 1. Business | Regulation
Regulators around the world, including U.S. banking regulators and the CFTC, have implemented margin requirements for uncleared derivatives generally in accordance with the recommendations of the Basel Committee on Bank Supervision and International Organization of Securities Commissions. The variation margin requirements require us to exchange variation margin (comprised of specified liquid instruments and subject to required haircuts) when entering into uncleared swaps and security-based swaps with regulated entities. The initial margin requirements are being phased-in and may also ultimately require us to post initial margin when entering into such derivatives. We completed the required legal documentation and changes to our operational processes in 2021 to accommodate the exchange of initial margin with U.S. and European Union swap dealers, when necessary.
Banking regulators' rules applicable to certain qualified financial contracts with banking institutions and their applicable affiliates, such as many derivatives contracts, securities lending agreements and repurchase agreements, generally require the inclusion of contractual provisions that limit or delay certain rights of their counterparties, including counterparties’ default rights (such as the right to terminate the contracts or foreclose on collateral) and restrictions on assignments and transfers of credit enhancements (such as guarantees) arising in connection with the banking institution or an applicable affiliate becoming subject to a bankruptcy, insolvency, resolution or similar proceeding. Our qualified financial contracts are subject to these rules and contain the relevant provisions.
The Dodd-Frank Act created the Financial Stability Oversight Council (the “FSOC”). The FSOC has the ability to designate certain insurance companies and insurance holding companies that pose a systemic risk to the financial stability of the U.S., in which case such companies would become subject to heightened prudential regulation by the Board of Governors of the U.S. Federal Reserve (the “Federal Reserve Board”). The Federal Reserve Board may limit such company’s ability to enter into merger transactions, restrict its ability to offer financial products, require it to terminate one or more activities, or impose conditions on how it conducts activities. On December 4, 2019, the FSOC issued final guidance regarding the designation of non-bank financial companies as systemically important. The guidance provided that the FSOC will move from an “entity-based” designation approach towards an “activities-based” approach. This approach eliminated the prior quantitative thresholds for designation as a systemically important entity. However, in November 2023, the FSOC adopted a new analytic framework for financial stability risks and updated guidance on its nonbank financial company determinations process, overruling the 2019 guidance. While the impact of this change is not completely clear at this time, it could increase the chance that the Company is subject to additional regulatory measures.
The Dodd-Frank Act also authorizes the Federal Insurance Office ("FIO") to assist the Secretary of the Treasury Department in negotiating covered agreements. A covered agreement is an agreement between the U.S. and one or more foreign governments, authorities or regulatory entities, regarding prudential measures with respect to insurance or reinsurance. The FIO is further charged with determining, in accordance with the procedures and standards established under the Dodd-Frank Act, whether state laws are preempted by a covered agreement. Pursuant to this authority, in September 2017, the U.S. and the European Union signed a covered agreement (the “EU Covered Agreement”) to address, among other things, reinsurance collateral requirements. In addition, on December 18, 2018, the Treasury Department and the Office of the U.S. Trade Representative signed a Bilateral Agreement between the U.S. and the United Kingdom on Prudential Measures Regarding Insurance and Reinsurance in anticipation of the United Kingdom’s potential exit from the European Union (the “UK Covered Agreement” and, together with the EU Covered Agreement, the “Covered Agreements”). U.S. state regulators had five years from the dates the Covered Agreements were signed to adopt reinsurance reforms removing reinsurance collateral requirements for EU and UK reinsurers that meet the prescribed minimum conditions set forth in the applicable Covered Agreement or else state laws imposing such reinsurance collateral requirements may be subject to federal preemption. On June 25, 2019, the NAIC adopted amendments to the Credit for Reinsurance Model Law and Model Regulation to conform to the requirements of the Covered Agreements. As of December 31, 2023, 50 states and the District of Columbia have enacted and promulgated the Model Law and Model Regulation. Additionally, five other U.S. jurisdictions have adopted regulations or memorandums of understanding consistent with the Model Law and Model Regulation.
SEC’s Regulation Best Interest
On June 5, 2019, the SEC adopted a package of investment advice reforms designed to enhance investor protections while preserving retail investor access and choice. The most significant element of the package is a rule (known as “Regulation Best Interest”) establishing a best interest standard of conduct for broker-dealers and their representatives when they make recommendations to retail investors. Regulation Best Interest, which became effective on June 30, 2020, enhances the
16
Part I | Item 1. Business | Regulation
duties and disclosure requirements that apply to our broker-dealer and investment adviser subsidiaries when they provide recommendations and investment advice to retail investors, as well as our representatives that provide such services. The reforms increase the regulatory burden on broker-dealers selling our products, but also provide a more consistent regulatory standard that could provide benefits to the overall insurance and investment market. Also, FINRA adopted rules to align to Regulation Best Interest and is enforcing both the SEC regulations and its own rules relating to recommendations of investments to retail consumers.
Department of Labor’s Fiduciary Advice Rule
The Department of Labor (the “DOL”) issued a regulatory action, effective February 16, 2021, that reinstated the text of the DOL’s 1975 investment advice regulation defining what constitutes fiduciary “investment advice” to Employee Retirement Income Security Act ("ERISA") plans and individual retirement accounts ("IRAs"). The related guidance provided by the DOL broadened the circumstances under which financial institutions, including insurance companies, could be considered fiduciaries under ERISA or the Federal income tax code. The rule and accompanying guidance faced hurdles, including a February 2023 U.S. District Court decision that vacated the roll over portion of the guidance, ruling that the DOL exceeded its authority in this area.
On October 31, 2023, the DOL proposed revisions to the definition of fiduciary and related Prohibited Transaction Exemptions (PTE) (the “2023 Fiduciary Advice Rule”), redefining what constitutes fiduciary “investment advice” to ERISA plans and IRAs. The proposal again extends fiduciary status to one-time rollover recommendations and broadens the circumstances under which financial institutions, including insurance companies, could be considered fiduciaries under ERISA or the Federal income tax code, despite the recent U.S. District Court decision. The proposal also narrows the applicability of PTE 84-24 specific to insurance commissions for annuity recommendations to independent insurance agents recommending non-securities products. The proposed changes to PTE 84-24 also impose certain supervisory obligations on insurance carriers that are similar to obligations already covered under the National Association of Insurance Commissioner’s (NAIC) Suitability in Annuity Transactions Model Regulation. As currently drafted, the above-reference revisions would be effective 60 days after the rule is finalized and published in the Federal Register.
We continue to analyze the impact of the 2023 Fiduciary Advice Rule, if adopted, and, while we cannot predict the rule’s impact, it could have an adverse effect on sales of annuities through our distribution partners. We may need to take certain additional actions to comply with, or assist our distributors in their compliance with, the 2023 Fiduciary Advice Rule. The 2023 Fiduciary Advice Rule may also lead to changes to our compensation practices and product offerings and increase litigation risk, which could adversely affect our results of operations and financial condition. Nonetheless, because the distribution of annuities is primarily through intermediaries, most of which have implemented systems and processes to align to existing state and federal fiduciary and/or best interest standards, we believe that we will have more limited exposure to the 2023 Fiduciary Advice Rule. While the rule may not have a material impact on our business, it may impede certain investors’ access to financial advice or annuities that provide guaranteed income streams.
USA PATRIOT Act of 2001
The USA PATRIOT Act of 2001 includes anti-money laundering and financial transparency laws as well as various regulations applicable to broker-dealers and other financial services companies, including insurance companies. Financial institutions are required to collect information regarding the identity of their customers, watch for and report suspicious transactions, respond to requests for information by regulatory authorities and law enforcement agencies and share information with other financial institutions. As a result, we are required to maintain certain internal compliance practices, procedures and controls.
Cybersecurity Regulations
Cybersecurity is subject to increased scrutiny by insurance regulators. In 2017, the NYSDFS adopted 23 NYCRR 500 (the “NYSDFS Cybersecurity Regulation”), which requires covered businesses in New York to have a comprehensive cybersecurity program that aligns to the National Institute of Standards and Technology Cybersecurity Framework and requires policies and procedures in several specific areas including, personnel, training, access privileges, penetration testing, vulnerability management, encryption, multifactor authentication, application security, data minimization, incident response planning, and notification and vendor management. The NYSDFS has pursued enforcement actions and penalties for violations demonstrating the significant risk of noncompliance. On November 1, 2023, the NYSDFS adopted a second amendment to the NYSDFS Cybersecurity Regulation, which includes requirements relating to risk assessments,
17
Part I | Item 1. Business | Regulation
cybersecurity policies, penetration testing, monitoring, and certain audit requirements. The regulation will take effect in phases during 2024.
The NAIC has adopted the Insurance Data Security Model Law, which established the standards for data security, investigation, and notification of a breach of data security for insurance companies. As of January 2024, twenty-three states (including Michigan, effective January 1, 2021) had adopted the model law. Importantly, the drafters of the Data Security Model Law intend that a licensee’s compliance with the NYSDFS Cybersecurity Regulation will constitute compliance with the Data Security Model Law. We have taken the necessary steps to comply with this regulation.
The California Consumer Privacy Act of 2018 (the “CCPA”) grants all California residents the right to know what information a business has collected from them and the sourcing and sharing of that information, as well as a right to have a business delete their personal information (with some exceptions). The CCPA’s definition of “personal information” is more expansive than those found in other privacy laws applicable to us in the U.S. Failure to comply with the CCPA could result in regulatory fines, and the law grants a private right of action for any unauthorized disclosure of personal information as a result of failure to maintain reasonable security procedures. Additionally, on November 3, 2020, California voters passed a ballot initiative, the California Privacy Rights Act (the “CPRA”), that adjusts and, in some respects, expands consumer rights and business obligations created by the CCPA. The CPRA, effective January 1, 2023, imposes additional obligations on companies that collect California residents’ personal information, including providing a right to correct personal information, additional protections for certain uses of sensitive personal information, and certain limitations on data use and data sharing that does not involve a sale. The CPRA also creates a new California Privacy Protection Agency, which will be charged with enforcing both the CCPA and the CPRA.
Federal law and regulation require financial institutions to protect the security and confidentiality of customer information, notify customers about their policies and practices relating to their collection, disclosure and securing the confidentiality of customer information. Federal and state laws also regulate disclosures of customer information. In March 2022, Congress enacted a 72-hour cyber reporting provision within a larger legislative package. In addition to this provision, Congress and state legislatures are expected to consider additional regulation relating to privacy and other aspects of customer information.
On October 21, 2019, the NAIC formed a Privacy Protections (H) Working Group to review state insurance privacy protections regarding the collection, use and disclosure of information gathered in connection with insurance transactions. In early 2023, the NAIC proposed a consumer privacy protection model law designed to replace the Insurance Information and Privacy Protection Model Act and the Privacy of Consumer Financial Health and Information Regulation. The NAIC is continuing to consider comments received on the proposed model law. Privacy protection is also gaining attention in state legislatures nationwide. There are now five states with laws generally applicable to data privacy (California, Colorado, Connecticut, Utah, and Virginia). With the exception of California, these laws do not apply to Jackson National Life and other financial institutions subject to the Gramm-Leach-Bliley Act. In addition, in 2023 Michigan enacted a data privacy bill that has the same exclusion for financial institutions. While the final direction of these proposed statutes and regulations is not clear, they could result in additional requirements for Jackson Financial or its subsidiaries.
See Item 1C. Cybersecurity - Cybersecurity Risk Management and Strategy.
Holding Company Regulation
We are subject to regulation under the insurance holding company laws of various jurisdictions. These laws and regulations vary by jurisdiction, but generally require each controlled insurance company to register with state regulatory authorities and file reports that provide information, including capital structure, ownership, financial condition, certain intercompany transactions and general business operations.
Restrictions on Acquiring “Control”
Insurance holding company regulations generally provide that no person, corporation or other entity may acquire control of an insurance company, or a controlling interest in any parent company of an insurance company, without the prior approval of such insurance company’s domiciliary state insurance regulator. Under the laws of each domiciliary state of our insurance subsidiaries, any person acquiring, directly or indirectly, 10% or more of the voting securities of an insurance company is presumed to have acquired “control” of the company. This statutory presumption of control may be rebutted by
18
Part I | Item 1. Business | Regulation
a showing that control does not, in fact, exist. The state insurance regulators, however, may find that “control” exists in circumstances in which a person owns or controls less than 10% of voting securities.
These laws and regulations may discourage potential acquisition proposals and may delay, deter or prevent a change of control involving us, including through unsolicited transactions that some of our shareholders might consider desirable.
Restrictions on Paying Dividends
As a holding company with no significant business operations of our own, we depend on dividends from our subsidiaries to meet our obligations. State insurance statutes also typically place restrictions and limitations on the amount of dividends or other distributions payable by insurance company subsidiaries to their parent companies. Dividends in excess of prescribed limits and transactions above a specified size between an insurer and its affiliates require the approval of the insurance regulator in the insurer’s state of domicile. For example, under the Michigan Insurance Code, DIFS must approve insurance companies' requests to pay a dividend or distribution out of earned surplus. The insurance statutes of New York permit payment of ordinary dividends without regulatory approval if they meet one of two standards. One standard allows a domestic stock life insurer to pay an ordinary dividend out of earned surplus. The second standard allows an insurer to pay an ordinary dividend out of other than earned surplus if such insurer does not have sufficient positive earned surplus to pay an ordinary dividend. However, dividends in excess of prescribed limits, based on prior year’s earnings and surplus of the insurance company, are considered extraordinary transactions and require explicit approval from the applicable regulator. See Item 1A. Risk Factors – “Risks Related to Ratings, Liquidity and Capital Management -- As a holding company, Jackson Financial depends on the ability of its subsidiaries to pay dividends and make other distributions to meet its obligations and liquidity needs.”
Broker-Dealer, Investment Adviser, Mutual Fund and Securities Regulation
We and certain policies and contracts offered by us are subject to regulation under the federal and state securities laws and regulations. Regulators administering these laws and regulations may conduct examinations of our operations and make requests for information. The primary intent of these laws and regulations is to protect investors in the securities markets and generally grant supervisory agencies broad administrative powers, including the power to limit or restrict the conduct of business for failure to comply.
Governmental regulatory authorities may institute administrative or judicial proceedings that may result in censure, fines, the issuance of cease-and-desist orders, trading prohibitions, the suspension or expulsion of a broker-dealer or member, its officers, registered representatives or employees or other similar sanctions.
Broker-Dealer Regulation
JNLD is registered as a broker-dealer with the SEC, pursuant to the Securities Exchange Act of 1934, as amended, and is registered as a broker-dealer in all applicable states. JNLD is also a member of, and subject to regulation by, FINRA, a self-regulatory organization subject to SEC oversight. The SEC and FINRA also regulate the sales practices of broker-dealers. In recent years, both the SEC and FINRA have intensified their scrutiny of sales practices relating to variable annuities and variable life insurance. In addition, broker-dealers are also subject to regulation by state securities administrators in those states in which they conduct business, who may also conduct examinations and direct inquiries to broker-dealers.
Investment Adviser Regulation
Jackson National Asset Management LLC ("JNAM") is registered with the SEC as an investment adviser pursuant to the Investment Advisers Act of 1940, as amended (the "Investment Advisers Act"). The investment companies (mutual funds) for which JNAM serves as an investment adviser are subject to SEC registration and regulation pursuant to the Securities Act, and the Investment Company Act of 1940, as amended (the “Investment Company Act”). The mutual funds advised by JNAM comprise the investment options within the variable products offered by Jackson National Life. In addition, each variable annuity and variable life product is subject to SEC registration and regulation.
PPM America, Inc. ("PPM") is registered with the SEC as an investment adviser under the Investment Advisers Act. PPM serves as the investment adviser to Jackson National Life and as the primary U.S. institutional investment adviser for certain other affiliated insurance company accounts. PPM also acts as a sub-adviser to certain U.S. mutual funds for which JNAM serves as investment adviser. In addition, PPM serves as an investment adviser and sub-adviser to our former parent's Asian affiliates and other institutional clients primarily for U.S. focused portfolios. PPM has established a
19
Part I | Item 1. Business | Regulation
distribution function to further extend its investment advisory capabilities to the institutional marketplace with separate account and institutional product offerings. The U.S. mutual funds for which PPM serves as adviser and sub-adviser are subject to U.S. federal regulation, and similar vehicles organized outside of the U.S. are also subject to regulation under applicable local law.
The business of our investment adviser subsidiaries will be impacted by SEC regulatory initiatives with respect to the investment management business. In addition to rules discussed elsewhere, the SEC has adopted rules that include (i) new monthly and annual reporting requirements for certain U.S. registered funds; (ii) enhanced reporting regimes for investment advisers; (iii) implementing liquidity risk management programs for exchange-traded funds (“ETFs”) and open-end funds, other than money market funds; (iv) reforms relating to money market funds that require institutional and prime money market funds to use a floating net asset value ("NAV"), and permit money market funds to impose liquidity fees and redemption gates; (v) significant amendments to rules regarding advertisements by investment advisers; and (vi) significant changes to the regulations applicable to the use of derivatives by U.S. registered funds. As noted above, the SEC has also recently proposed comprehensive reforms to improve cybersecurity risk management for registered investment advisers and registered funds. These rules increased the reporting and disclosure requirements for our investment adviser subsidiaries. These increased regulatory and compliance burdens could be costly and may impede the growth of our investment adviser subsidiaries.
The SEC, beginning in late 2020, instituted a comprehensive regulatory agenda focusing on Environmental, Social, and Governance ("ESG") issues. As part of this agenda, in March 2022, the SEC proposed a series of regulations requiring additional disclosures concerning climate change for public companies. The regulations include extensive disclosures concerning the estimated impact of climate change on businesses and how companies manage and govern climate change risk. In addition, the SEC announced a number of actions, including forming an enforcement task force designed to harmonize the efforts of the SEC’s divisions and offices, consider potential comprehensive changes to ESG disclosure guidance, announce ESG as an examination priority, address shareholder rights, create accountability in statements and conduct, and solicit comments to potential changes to the “names rule” under the Investment Company Act to reflect the effect of ESG factors on a fund’s investment objectives and performance. The SEC's Division of Examinations subsequently issued a risk alert highlighting ESG deficiencies, internal control weaknesses and effective practices identified during recent examinations of investment advisers, registered investment companies and private funds. The SEC's regulatory asset management agenda, including items that have been implemented in 2022 and those that are under consideration, may impact the growth of our investment advisory business due to the increased regulatory and compliance burdens.
Commodities Regulation
JNAM is registered as a “commodity pool operator” with the National Futures Association (“NFA”) pursuant to the Commodity Futures Trade Commission (“CFTC”) regulations and acts as a commodity pool operator with respect to the operation of certain of the mutual funds. The CFTC is a federal agency whose responsibilities include the regulation of commodity interests and enforcement of the Commodity Exchange Act of 1974. The NFA is a self-regulatory organization to which the CFTC has delegated, among other things, the administration and enforcement of commodity regulatory registration requirements and the regulation of its members. JNAM and the mutual funds have incurred additional regulatory compliance and reporting expenses as a result, which could reduce investment returns or harm the mutual fund’s ability to implement its investment strategy.
Corporate Responsibility
Jackson takes a balanced, long-term approach to serving all its stakeholders, including shareholders, business partners, regulators, customers, associates and communities. Our commitments are described below and with more detail in our annual Corporate Responsibility Report. The Company’s annual Corporate Responsibility Report is not incorporated by reference in, and does not form a part of, this Form 10-K or any other of our SEC filings.
20
Part I | Item 1. Business | Corporate Responsibility
Protecting our Environment
We are committed to reducing our climate impact and doing our part to help create a more environmentally sustainable future for us all. To that end, we are taking thoughtful steps to reduce our carbon footprint, consume energy more efficiently, and use natural resources in innovative and impactful ways that result in reduced greenhouse gas ("GHG") emissions. In its second year, the on-site solar farm at our home office in Lansing, Michigan, is generating renewable energy and reducing our need for traditional power generation.
Valuing our Communities
We demonstrate our commitment to corporate social responsibility with charitable donations that (i) generate impact in the communities we serve, (ii) engage associates in a culture of philanthropy, and (iii) grow awareness for our commitment to being a good corporate neighbor. We believe our community partnerships create shared value for Jackson, our associates and the communities in which we operate. We have a passionate and committed workforce that engages with the community and is generous with their time and resources. Jackson encourages community engagement by providing associates with paid time off for volunteering, nonprofit board training and placement, and matching gifts programs for associate charitable contributions and volunteer hours. We remain committed to empowering people and communities and continue to invest in building relationships that serve the greater good. Jackson’s philanthropic strategy aligns with its business purpose to build the foundation for financial freedom for all.
Strong Governance and Business Practices
We are committed to governance policies and practices that serve the interest of the Company and its stakeholders, starting with independent membership on all Committees of the Company Board of Directors. Our Board seeks directors with a broad range of professional experience, skills, and perspectives who support our commitment to diversity of thought, experience, and background. It also seeks those who contribute to its gender and racial or ethnic diversity. Our Board currently has a 33% gender diversity, and 22% racial and ethnic diversity composition. Our Company has an ownership culture that focuses on providing exceptional value to advisors, policyholders, and shareholders. Jackson also has a risk management framework embedded across the Company, supporting the effectiveness of risk management and the control environment including oversight of ESG risks. We believe our long-term focus produces sustainable, competitive returns for our shareholders. In furtherance of our commitment to investing responsibly, our internal portfolio management team at PPM considers the environmental, social and governance factors of the underlying enterprises in which they invest for the general account. Also, PPM has been a signatory to the United Nations–supported Principles for Responsible Investment since 2018. Our internal asset management team at JNAM oversees external managers on our variable annuity platform, performing a robust due diligence process that includes analysis of ESG philosophy and processes.
Human Capital Resources
Our strength lies in the people we employ and values-based culture we foster. We offer significant career opportunities, competitive merit-based compensation, inclusive practices, world-class facilities, and the ability to work for a purpose-driven organization. Our Company's four corporate values — Empower, Respect, Execute and Create — guide our associate practices and decisions.
We had approximately 3,840 associates as of December 31, 2023, comprised of approximately 3,015 full-time associates and approximately 825 part-time associates, inclusive of our Strategic Support Program associates (a flexible, cost-efficient, part-time workforce that provides just-in-time scale). Each of our associates play an important role in delivering on our brand promise of clarity for a more confident future. We make it our priority to offer opportunities for personal growth, talent development, and rewarding career paths for all Jackson team members. We believe our collaborative culture is one of our greatest strengths and is a significant factor in our ability to continue to be an industry leader.
21
Part I | Item 1. Business | Human Capital Resources
Talent Development, Diversity and Inclusion
We have an established history of developing talent from within. Our senior management team has an average tenure of over 20 years with the Company. We also recruit talent from outside the organization, as we seek to cultivate an inclusive workplace where different ideas and opinions are heard and respected and where people of different backgrounds can come together to accomplish great things as a team. Through learning and development programs, succession and talent management processes, and competitive rewards and recognition, our diverse and high-performing associates are empowered to innovate and challenge one another to be their best selves. In 2023, over 95% of our associates have completed diversity and inclusion training.
In 2023, Jackson continued its mentoring program to support the long-term career growth of associates, with particular focus on development opportunities for diverse associates and emerging leaders. The program began in 2021 and in its third year is still seeing strong participation including:
•More than 210 mentor pairings;
•More than 1,000 hours of mentoring reported by participants; and
•4.7 out of 5 rating in overall program and relationship satisfaction.
Our strategic approach to Diversity and Inclusion focuses on ways to attract and retain highly talented people and cultivates an environment where our associates are encouraged to bring our best selves to work every day. Our Diversity and Inclusion Advisory Council (the "Advisory Council") was established in 2018 to identify opportunities for advancing our diverse and inclusive work environment. The Advisory Council developed a framework and strategy, which includes ensuring an inclusive workplace, developing a diverse talent pool, leveraging diversity and inclusion in the marketplace and reporting our progress.
We recognize the diversity of our associates’ backgrounds and cultures through our voluntary, associate-led Business Resource Associate Groups (“BRAGs”). Supported by executive leadership and aligned with our mission and core values, our nine BRAGs provide opportunities to empower all associates to share their unique and diverse talents with each other.

22
Part I | Item 1. Business | Human Capital Resources
We have acted in several ways to improve inclusion in our recruiting process, including how we approach job postings, develop position requirements, conduct interviews, and evaluate candidates. We also value our strong partnerships with the many organizations that help us diversify and strengthen our talent pool. Through these partnerships, we are building our recruiting pipeline and are developing stronger leaders who support innovative thought and promote an inclusive and an equitable culture. These organizations include:
•The Association for Wholesaling Diversity and International Association of Black Actuaries: creating opportunities to build, attract and recruit Black talent to Jackson
•The Coalition for Equity in Wholesaling: to increase hiring, retention, and career advancement of a wholesaler workforce that better reflects America by sharing knowledge and building relationships
•Disability:IN: assessments and education that help us better understand the needs of individual with disabilities within our workforce
•Michigan State University Athletics: to foster leadership, cultivate relationships, and explore career pathways with MSU athletes beyond sports
•Yello: a platform to recruit and communicate more effectively with diverse candidates, including sourcing and events to engage with a broader candidate pool
As of December 31, 2023, within Jackson’s workforce, approximately 46% of our associates were women and approximately 19% of our associates were racially and ethnically diverse. Additionally, four of the eight-member executive committee team are women, including our CEO and CFO.
Benefits and Rewards
We recognize the contributions our associates make to our future and their futures by offering competitive salaries, wages, and benefits. Our comprehensive benefits package includes medical, dental, vision, and paid time off along with more innovative benefits including associate and dependent tuition reimbursement programs, paid parental leave, adoption assistance, paid time off to volunteer, and associate charitable gift matching. Our associates are compensated based on their job performance. This performance-driven structure aligns performance incentives with our business productivity strategy, serving to both encourage our associates and satisfy our other key stakeholders. To ensure fair pay, we work actively with a third-party consultant to conduct pay equity studies related to race, ethnicity, and gender. We also have rigorous governance processes in place to ensure that we promote equitable pay practices, reinforce strong risk management, and maintain independent oversight of our executive compensation.
Associate Health and Well-Being
We believe it is important to support our associates and are committed to providing a safe and healthy workplace. Our "Living Life Well" program helps ensure that Jackson associates are provided supportive health, safety and financial wellness resources both at work and at home. These efforts cultivate a supportive and well-balanced corporate culture and help define the future of our success.
The health and safety of our associates is a top priority. Our ergonomics program supports associate wellness by promoting evidence-based ergonomic principles for associates working remotely or at our offices. At the office, associates also have access to a complete training system and highly qualified team of experts to help associates achieve their personal fitness, nutritional and lifestyle goals. We currently operate 21 Occupational, Safety and Health Administration ("OSHA") related programs, in addition to our standard air and water quality programs, in a comprehensive corporate health and safety effort to meet OSHA and American National Standards Institute ("ANSI") Z10-02019 standards.
We offer programs that support the mental health of associates, including confidential support for more serious issues involving emotional stress and well-being. Our Employee Assistance Program, "Life Balance," offers online tools, as well as master's-level professionals available for confidential support around the clock. The financial health of our associates is an equally important part of their well-being. We offer programs and educational tools to support their long-term financial wellness. These efforts help our associates build a more confident future for themselves, as well as for the long-term success of our Company and for our shareholders.
23
Part I | Item 1. Business | Intellectual Property
Intellectual Property
We rely on a combination of copyright, trademark, service mark, and internet domain laws to establish and protect our intellectual property rights. We maintain a portfolio of trademarks, service marks, and internet domain names that we consider important to the marketing of our products and business, and that are registered with the U.S. Patent and Trademark Office. These trademarks and service marks include those entity and product names, that appear in this Form 10-K, and our logo, names of our other products, advisor platforms, optional benefit annuity riders and marketing-related taglines.
Available Information
We make available free of charge, through our website, investors.jackson.com, our Annual Report on Form 10-K, Quarterly Reports on Form 10-Q, Current Reports on Form 8-K, our proxy and information statements, and any amendments to those reports or statements as soon as reasonably practicable after these materials are electronically filed with, or furnished to, the U.S. Securities and Exchange Commission ("SEC"). We use the investor relations page of our website, investors.jackson.com, as a routine channel for dissemination of important information, including news releases, analyst presentations, financial information, insider beneficial owner reports, and corporate governance information. The content of Jackson’s website, jackson.com, is not incorporated by reference into this Report or in any other report or document filed with the SEC, and any references to Jackson’s website are intended to be inactive textual references only. The SEC’s website, www.sec.gov, contains financial reports, proxy and information statements, and other information regarding issuers that file electronically with the SEC.
24
Part I | Item 1. Business | Information about our Executive Officers
Information about our Executive Officers
Below are the executive officers of Jackson Financial Inc. as of December 31, 20231. The executive officers serve until the next annual appointment of executive officers, or until earlier resignation or removal.
Name | Age | Positions and Offices Held and Principal Occupation | ||||||
Carrie L. Chelko | 50 | Executive Vice President, General Counsel of Jackson Financial Inc., a position held since September 2021. As Executive Vice President and General Counsel, Ms. Chelko oversees Legal, Compliance, Corporate Communications and Responsibility, and Shared Services & Operations (Legal), and beginning January 2024, one new group, Government Relations. From September 13, 2021 until August 2022, Ms. Chelko also served as Corporate Secretary of Jackson Financial Inc. From August 30, 2021 until September 13, 2021, Ms. Chelko was Executive Vice President of Jackson Financial Inc. Prior to joining Jackson, from April 2020 through August 2021, Ms. Chelko was Senior Vice President and Chief Compliance Officer of Fidelity Investments, Personal Investing. Prior to Fidelity, from May 2013 through March 2020, Ms. Chelko served as the Senior Vice President and Chief Counsel at Lincoln Financial Group. | ||||||
Don W. Cummings | 60 | Senior Vice President, Chief Accounting Officer and Controller of Jackson Financial Inc., a position assumed in December 2020. Prior to coming to Jackson, Mr. Cummings served as interim Chief Financial Officer at Fortitude Reinsurance Company Ltd. since 2019 and previously held various finance roles at American International Group, Inc., including Global Corporate Controller. Mr. Cummings is a Certified Public Accountant. | ||||||
Devkumar D. Ganguly | 48 | Executive Vice President, Chief Operating Officer of Jackson Financial Inc., a position assumed in February 2021. Mr. Ganguly has served in various leadership roles with Jackson National Life Insurance Company including Senior Vice President and Chief Information Officer from July 2018 to February 2021. Prior to becoming Chief Information Officer, Mr. Ganguly was a Vice President at Jackson from October 2013 to July 2018. | ||||||
Laura L. Prieskorn | 56 | Chief Executive Officer and President of Jackson Financial Inc., a position assumed in February 2021. Ms. Prieskorn is also a member of Jackson Financial Inc.'s Board of Directors. Ms. Prieskorn has been with Jackson National Life Insurance Company for more than 30 years, serving in roles of increasing responsibilities. Ms. Prieskorn's prior management positions include Chief Operating Officer from April 2019 through February 2021, and Senior Vice President, Chief Administration Officer from December 2009 through April 2019. | ||||||
Christopher A. Raub | 53 | Executive Vice President, Chief Risk Officer of Jackson Financial Inc., a position assumed in April 2023. Prior to his appointment as the Chief Risk Officer of Jackson Financial Inc., Mr. Raub served as Senior Managing Director of Insurance, PPM America, Inc., a subsidiary of JFI (“PPM”), since April 2019. From January 2017 to April 2019, Mr. Raub served as PPM’s Senior Managing Director of Portfolio Strategy. | ||||||
25
Part I | Item 1. Business | Information about our Executive Officers
Scott E. Romine | 58 | Executive Vice President of Jackson National Life Insurance Company, a position assumed in September 2022. Mr. Romine continues to serve as President and Chief Executive Officer of Jackson National Life Distributors LLC, a role assumed in December 2021. Prior to serving in this role, Mr. Romine served as the President of Advisory Solutions for JNLD from February 2018 to December 2021. | ||||||
Craig D. Smith | 56 | Executive Vice President of Jackson National Life Insurance Company, a position assumed in September 2022. Mr. Smith continues to serve as President, Chief Executive Officer and Chief Investment Officer of PPM America, Inc., a role assumed in January 2021. Prior to this role, Mr. Smith served as Chief Investment Officer, since 2018. Mr. Smith is a designated Charter Financial Analyst. | ||||||
Marcia Wadsten | 57 | Executive Vice President and Chief Financial Officer of Jackson Financial Inc., a position assumed in February 2021. Ms. Wadsten has been with Jackson National Life Insurance Company for more than 30 years. Prior to her appointment as Chief Financial Officer, Ms. Wadsten served as Senior Vice President, Chief Actuary from June 2016 through February 2021. | ||||||
1 P. Chad Myers, age 57, ceased to be an executive officer as of December 31, 2022, and transitioned to employment as a Senior Advisor for Jackson National Life Insurance Company on January 1, 2023. Previously, Mr. Myers served as Vice Chair, Jackson Holdings LLC, a position assumed in February 2020. Mr. Myers holds a Chartered Financial Analyst designation.
26
Part I | Item 1A. Risk Factors
Item 1A. Risk Factors
You should carefully consider the risk factors below, in addition to the other information in this Form 10-K. These risk factors are important to understanding the Form 10-K and our other filings with the SEC. The risks described below are not the only ones we face. The occurrence of any of the following risks or additional risks and uncertainties not presently known to us or that we currently believe to be immaterial could cause a material adverse effect on our business, financial condition, results of operations and cash flows. In any such case, the trading price of our common stock could decline. In addition, many of these risks are interrelated and could occur under similar business and economic conditions, and the occurrence of certain of them could, in turn, cause the emergence or exacerbate the effect of others. This Form 10-K also contains forward-looking statements and estimates that involve risks and uncertainties. Our actual results could differ materially from those anticipated in the forward-looking statements as a result of specific factors, including the risks and uncertainties described below.
Risks Related to Conditions in Global Financial Markets and the Economy
General conditions in the global financial markets and the economy could have a material adverse effect on our business, financial condition, liquidity, results of operations and cash flows.
Volatility in global financial markets and general economic downturns could have a material adverse impact on us. Factors including the availability and cost of credit, efforts to address inflation through Federal Reserve policy, prolonged periods of high interest rates, supply chain issues, pandemics and related government responses, geopolitical conflicts (e.g., the Ukraine-Russia and Israel-Palestine conflicts), and trade disputes have contributed to increased volatility in global financial markets. These factors could continue to impact businesses and consumer confidence and cause economic uncertainty, with a consequent slowdown in economic activity potentially impacting global financial markets.
An economic downturn could impact policyholder behavior in a way that could adversely affect our business by reducing sales and increasing retentions and withdrawals. In an economic downturn, our customers may choose to utilize guaranteed benefits differently than we have assumed, potentially taking, for example, partial withdrawals more regularly. If the number of customers closing their annuity accounts significantly exceeds our expectations, the loss of fee income, or spread, could have a material adverse effect on our business, financial condition, results of operations and cash flows. Conversely, if the number of customers maintaining their accounts is significantly higher than our expectations, the increased cost of providing guaranteed living benefits could have a material adverse effect on our business, financial condition, results of operations and cash flows.
Such events and conditions could also have an adverse effect on the availability and cost of reinsurance protections and could affect the availability, cost and effectiveness of hedging instruments resulting in a material adverse impact on our profitability.
Equity market movements could lead to losses related to: (i) when the market declines, guaranteed benefits offered in our products, lower fee-based income, and losses from equity-related investments; (ii) when the market increases, equity-linked interest credits offered in our products; and (iii) when the market is volatile, our hedging being less effective than we expect.
Our business is exposed to equity market risk through the guaranteed benefits sold within our variable annuities, and interest credited to fixed indexed annuities and registered index-linked annuities, which can manifest through increased reserves and capital requirements and, ultimately, policyholder payment claims associated with these guarantees and interest credits. In declining market environments, we are exposed to higher claims to variable annuity policyholders. In rising equity market environments, we are exposed to larger amounts of interest being credited to fixed indexed and registered index-linked annuity policyholders.
Our derivative-based hedging program is used to mitigate financial loss related to the equity market risk associated with guaranteed benefits and equity-linked interest credits. The hedging program could be less effective in mitigating risk during periods of high market volatility, which could have a negative impact on our financial performance. Further, we are exposed to basis risk, which results from our inability to purchase or sell hedge assets whose performance perfectly matches that of the mutual funds that drive the value of guaranteed benefits. That variance could result in reduced earnings. Also, basis risk may be exacerbated in periods of elevated market volatility.
Our fee-based income streams are broadly proportional to the value of assets under management in our predominately equity-based separate account balances. As a result, declining equity markets result in lower fee income, earnings, and
27
Part I | Item 1A. Risk Factors
capital. A decline in the value of equity-related investments in our general account asset portfolio may also reduce our earnings and capital.
Interest rate movements could lead to financial loss related to: (i) in the case of prolonged declines, guaranteed benefits offered in our products, as well as lower investment income; (ii) in the case of prolonged increases, our interest-crediting products; and (iii) in the case of elevated volatility, our hedging being less effective than we expect.
Interest rate risk exposure for variable annuities increases when the present value of expected future benefit payments increases, which can occur due to a variety of factors, including lower interest rates potentially leading to lower discount rates, equity market underperformance, adverse policyholder behavior and increased policyholder longevity. In general, the amount of investment income earned on fixed income assets is negatively impacted by lower interest rates.
In rising interest rate environments, fixed annuities, fixed indexed annuities, variable annuities with a fixed fund option, registered index-linked annuities and institutional products could also expose us to the risk that our asset portfolio yield does not increase as fast as the rates that are credited to policyholders, thereby reducing earnings from those product lines.
High interest rates expose us to disintermediation risk. Higher rates may make current product offerings more attractive than what existing policyholders have purchased, while simultaneously reducing the market value of assets backing our liabilities. This creates an incentive for our policyholders to lapse their products in an environment where selling assets could cause realized losses. In addition, higher interest rates may contribute to lower separate account balances on variable annuity policies, which include interest rate sensitive funds, and lower income from fees that are proportional to the separate account balances.
Our derivative-based hedging program is used to mitigate financial loss related to the interest rate risk associated with guaranteed benefits. The hedging program could be less effective in mitigating risk during periods of high interest rate volatility, which could have a negative impact on our financial performance.
Our investment management business’ revenues and results of operations depend on the market value and the composition of our assets under management, which could fluctuate significantly based on various factors, including many factors outside of our control.
Most of our investment advisory subsidiaries’ revenues are derived from management and administration fees, which typically are calculated as a percentage of the value of assets under management. The value and composition of our assets under management could be adversely affected by several factors including market factors, client preferences, product trends, investment performance, and fee changes, any of which, alone or in the aggregate, could adversely impact our business revenues and results of operations.
Prudential plc and its affiliates are significant clients of PPM. Prudential and its affiliates represent $24.5 billion or 34% of PPM’s total assets under management. PPM’s investment management agreements with Prudential and its affiliates are terminable at any time or on short notice by either party, and Prudential and its affiliates are under no obligation to maintain any level of assets under management with PPM. If Prudential and its affiliates were to terminate their investment management agreements with PPM, it could cause material disruption in the operations and investment advisory capabilities of PPM, which could have a material adverse effect on our business, financial condition, results of operations and cash flows.
Disruptions or volatility in financial market conditions could negatively impact our liquidity or limit our ability to buy or sell investments and derivative instruments.
We rely on liquidity in the financial markets for the trading of fixed income or equity investments and derivatives to acquire, rebalance or liquidate investment positions. Disruptions in the financial markets that limit our ability to execute these transactions could have a material impact on returns from our investment portfolio, the effectiveness of our hedging program, and our variable annuity customers’ ability to invest in or sell separate account funds. Disruptions in financial markets could have a material adverse effect on our business, financial condition, results of operations and cash flows.
We require a significant amount of liquidity to support our hedging program, to satisfy variation margin requirements on hedging positions as well as to cover the initial cost of certain derivatives, such as equity and interest rate options. Volatile market environments have the potential to increase hedging-related liquidity requirements, as the amount of cash we need to pay out in variation margin each day is directly related to the magnitude of equity market and interest rate movements and the size of our current positions in those instruments. Additionally, as our over-the-counter bilateral hedging transactions become subject to initial margin requirements, we would need assets of sufficient quality to satisfy those requirements. Without sufficient liquidity, we could be required to curtail or limit our operations and our hedging program, which could have a material adverse effect on our business, financial condition, results of operations and cash flows.
28
Part I | Item 1A. Risk Factors
Volatility in credit spreads, or ratings downgrades, defaults, or impairments in our general or separate account assets could negatively impact earnings and statutory capital.
Credit spread volatility
Tightening credit spreads would reduce the investment yields available on new asset purchases in our general account, impacting our investment income. Widening of the credit spreads on assets held in the general account could lead to higher levels of other than temporary impairments or defaults, either of which would reduce statutory capital. We may also experience lower fee-based income as a result of higher credit spreads that reduce variable annuity sub-account values invested in assets exposed to credit risk.
General account asset ratings downgrades, defaults, or impairments
Credit rating downgrades of the issuers of debt instruments held in our general account would require us to hold more capital in support of these investments and reduce our statutory risk-based capital ratio (“RBC”), which is a key measure considered when regulators evaluate an insurance company’s ability to make dividend distributions. Defaults or valuation impairments on debt securities and commercial mortgages held in our general account could result in investment losses and reduce earnings and capital.
Difficulties faced by other financial institutions could adversely affect us.
We have exposure to financial institutions in the form of unsecured bank accounts and debt instruments, unsecured money market and prime funds, and equity investments. Losses or impairments to the carrying value of these assets could cause a material adverse effect on our business, financial condition, results of operations and cash flows.
Risks Related to Ratings, Liquidity and Capital Management
An actual or potential downgrade in our financial strength or issuer credit ratings could result in a loss of business and cause a material adverse effect on our business, financial condition, results of operations and cash flows.
Financial strength ratings, which various rating agencies publish as measures of an insurance company’s ability to meet obligations to its customers, are important to maintaining stakeholder confidence and our ability to distribute products. A downgrade in any of our ratings could directly or indirectly lead to negative impacts on:
•our product sales and distribution relationships;
•the number or amount of surrenders and withdrawals by customers;
•our ability to obtain new reinsurance or obtain it on reasonable terms;
•our ability to maintain existing derivative contracts or purchase new derivative contracts, which are used to manage risk, on acceptable terms or at all;
•our need for increased liquidity due to increased collateral required by counterparties;
•our ability to compete for attractive acquisition opportunities; and
•our cost of and access to capital.
As a holding company, Jackson Financial depends on the ability of its subsidiaries to pay dividends and make other distributions to meet its obligations and liquidity needs.
Jackson Financial is the holding company for all our operations and is a separate legal entity from its subsidiaries. Dividends and other distributions from Jackson Financial’s subsidiaries, including payments on internal debt, are Jackson Financial’s principal sources of capital that fund payment of principal and interest on its outstanding indebtedness, corporate operating expenses, shareholder dividends, stock repurchases and other obligations. The inability of our subsidiaries to pay dividends or provide other distributions could have a material adverse effect on our financial condition and cash flows and restrict our ability to pay dividends to our shareholders or repurchase stock.
The ability of our insurance subsidiaries to pay dividends and make other distributions to JFI depends on the impact such distributions may have on their financial strength ratings, their ability to meet applicable regulatory standards, and their ability to receive regulatory approvals to make such remittances to JFI. See “Item 1. Business–Regulation–State Insurance Regulation” and “Management’s Discussion and Analysis of Financial Condition and Results of Operations—Liquidity and Capital Resources—Distributions from our Insurance Company Subsidiaries.”
Failing to deliver on Jackson’s cash obligations, such as policyholder benefits and derivative margin requirements, could have a significant negative impact on its ability to continue to sell products and access derivative markets.
29
Part I | Item 1A. Risk Factors
JFI and its subsidiaries have significant liquidity needs to support daily cash flows, including operating expenses, interest payments, derivative-based margin requirements and policyholder withdrawals. Jackson is exposed to liquidity risk primarily through its day-to-day business operations. Cash needs arise, in significant part, from the obligation to meet margin requirements resulting from certain daily-settled derivative positions and the obligation to pay policyholder claims. Failing to meet these cash obligations could result in negative reactions from rating agencies, investors and analysts, shareholders, customers and distributors, which could, in turn, lead to a decline in credit and financial strength ratings, share price and investor and policyholder confidence.
We are subject to liquidity risks associated with sourcing a large concentration of our funding from the Federal Home Loan Bank of Indianapolis (“FHLBI”).
We use institutional funding agreements originating from FHLBI, which from time to time serve as a significant source of our liquidity. See Note 10 of Notes to Consolidated Financial Statements for a description of those funding agreements and related collateral requirements. Additionally, we use agreements with the FHLBI to meet near-term liquidity needs, augmenting our repurchase agreement capacity from other counterparties. If the FHLBI were to change its definition of eligible collateral, we could be required to post additional amounts of collateral in the form of cash or other assets. Also, if our creditworthiness were to fall below the FHLBI’s requirements, or if legislative or other political actions cause changes to the FHLBI’s mandate or to the eligibility of life insurance companies to be members of the FHLBI system, we could be required to find other sources to replace this funding, which may prove difficult and increase our liquidity risk.
Some of our investments are relatively illiquid and could be difficult to sell, or to sell in significant amounts at acceptable prices, to generate cash to meet our needs.
We hold certain investments that are relatively illiquid, such as privately placed fixed maturity securities, mortgage loans, certain asset-backed securities and alternative investments. In the past, some of our high-quality investments experienced reduced liquidity during periods of market volatility or disruption. If we were required to liquidate these investments on short notice, we could have difficulty doing so and could be forced to sell them for less than we otherwise would have been able to realize, which could have a material adverse effect on our business, financial condition, results of operations and cash flows.
Our use of financial derivative transactions to hedge risks associated with our operations exposes us to counterparty credit risk that could lead to a financial loss.
We enter into derivative contracts with investment banks, creating an obligation for our counterparties to deliver on financial obligations to Jackson. The failure of a derivative counterparty to meet its obligations could potentially lead to a loss if collateral received is insufficient to cover the replacement cost of the defaulted position. Such a loss could also reduce available capital.
Our use of reinsurance to mitigate a portion of the risks that we face exposes us to counterparty credit risk that could cause a material adverse impact on our business, financial condition, results of operations and cash flows.
We use reinsurance to mitigate a portion of the financial, longevity and mortality risks inherent in some of our in force annuity and life insurance products. Under our reinsurance arrangements, other insurers assume a portion of the obligation to pay claims and related expenses to which we are subject.
We remain liable as the direct insurer on all risks we reinsure and, therefore, are subject to the risk that a reinsurer is unable or unwilling to pay or reimburse claims in a timely manner, which could result in a material adverse impact on our business, financial condition, results of operations and cash flows. Our reinsurance agreement with Athene involves the majority of our in force fixed annuities and fixed index annuities, thereby exposing us to a large concentration of credit risk with respect to a single counterparty.
Jackson may make inefficient decisions regarding the use of capital to meet business objectives, fund strategic initiatives and return capital to shareholders.
We make capital deployment decisions on an ongoing basis, which include growing organically via sales of our products, growing inorganically through acquisitions, returning capital to shareholders, and increasing capital strength. Failure to make decisions about deploying or retaining capital efficiently could result in decreased shareholder value and confidence.
Risks Related to Product Design, Assumptions, and Models
The design and pricing of our products can impact our competitiveness in the marketplace, and negatively affect our earnings and capitalization and increase the volatility of our financial results.
30
Part I | Item 1A. Risk Factors
Our failure to design or maintain products that provide competitive benefits and features or that do not conform to distributor requirements could result in short- or long-term loss of sales, distributor selling agreements, and reputational risk that would adversely impact Jackson’s growth and profitability.
Improperly priced products may result in revenue streams that cannot support our liabilities, expenses, and hedging program, and could negatively impact our profitability. Any resulting need to modify or suspend products would impact our reputation in the marketplace. Products may not be priced appropriately due to poor assumptions or inputs to a pricing model that do not accurately capture a product’s material cash flows, regulatory requirements, or consumer decisions.
We could face unanticipated losses if there are significant deviations from our assumptions regarding the persistency of our annuity contracts or if mortality rates differ significantly from our pricing expectations.
Our future profitability is based in part on expected patterns of premiums, expenses and benefits using a number of assumptions, including those related to the probability that a policy or contract will remain in force from one period to the next. It is not possible to precisely predict persistency (policyholder choosing to keep their policy) or mortality, and actual results may differ significantly from assumptions. Should actual experience deviate from our assumptions for persistency and mortality rates, this difference may have an adverse effect on our business, financial condition, results of operations and cash flows.
Similarly, if policyholders with guaranteed benefits utilize them differently than our assumptions, the Company's reserves may be inadequate to cover its liabilities, resulting in losses affecting income and capital.
We rely on complex models to predict behavior, identify potential risks and estimate financial performance, which models may be ineffective due to incomplete or inaccurate assumptions or errors in data collection, analysis or interpretation that could result in materially inaccurate risk assessments and output.
We use complex models to predict customer behavior, identify risks and establish reserves. In addition, models are used to perform a range of operational functions, including calculating regulatory or internal capital requirements and determining hedging requirements. Some of these tools form an integral part of our decision-making framework. The use of inaccurate models, errors in data collection and analysis, or misuse of model results, could result in poor business and strategic decision-making that could have an adverse financial, regulatory, operational or reputational impact on the Company.
The subjective determination of the amount of allowances and impairments taken on our investments could cause a material adverse effect on our business, financial condition, results of operations and cash flows.
The manner of determining the amount of allowances and impairments varies by investment type and is based upon our evaluation and assessment of known and inherent risks associated with a respective asset class. Although management regularly updates its evaluations to reflect changes in allowances and impairments included in our financial statements, management’s judgments, as reflected in our financial statements, may not accurately estimate the ultimately realized value. Historical trends may not be indicative of future impairments or allowances. Further, we may need to take additional impairments or provide for additional allowances in the future, which could cause a material adverse effect on our business, financial condition, results of operations and cash flows. See Note 4 of Notes to Consolidated Financial Statements for further information.
Risks Related to the Distribution of Our Products
Our failure to accurately describe the features and options of our annuities, failure to administer those features and options consistent with their descriptions or mishandling of customer complaints could adversely impact our business, financial condition, results of operations and cash flows.
Our annuities contain many options and features, and we rely on third-party distributors to describe and explain our products to investors and our customers. There is a risk that we or our distributors fail to describe accurately and completely every feature and option in our contracts, forms, regulatory filings, marketing literature, and other written descriptions. Any such failure, or any intentional or unintentional misrepresentation of our products in advertising materials or other external communications, or inappropriate activities by our associates or third-party distributors, could adversely affect our reputation and business and lead to potential regulatory action or litigation.
We may directly receive, or regulatory agencies may receive, customer complaints about service or other issues relating to annuity contracts or insurance policies. Should we fail to review each complaint and investigate the potential causes, the complaint could evolve into a litigated matter, or we could face regulatory fines, penalties, or reputational damage.
31
Part I | Item 1A. Risk Factors
If we do not design our products in accordance with applicable law, those products may not achieve the intended objectives and could adversely impact our business, financial condition, and results of operations.
U.S. federal income tax law imposes requirements relating to annuity and insurance product design, administration and investments that are conditions for beneficial tax treatment of such products under the Internal Revenue Code of 1986, as amended (the “Code”). State and federal securities and insurance laws also impose requirements relating to annuity and insurance product design, offering, distribution, and administration. Failure to administer product features in accordance with applicable law, or to meet any of these complex tax, securities or insurance requirements could subject us to administrative penalties imposed by a particular governmental or self-regulatory authority, unanticipated costs associated with remedying such failure or other claims, litigation, harm to our reputation or interruption of our operations. If legal proceedings were to occur, they could adversely impact our business, financial condition, results of operations and cash flows.
We could experience difficulties in distributing our products through third-party distribution partners, which are a primary source of our sales.
We distribute our products through a variety of third-party distribution partners under agreements that can be terminated by either party with or without cause. Failure to maintain an understanding of the changing market, what products our competitors are selling, and what channels have opportunity for growth can contribute to the loss of key distribution partners resulting in the Company’s inability to meet or exceed planned sales goals and is detrimental to our overall distribution strategy.
Key distributors could terminate their relationship with us, reduce their distribution contracts with us, or reduce the amount of sales they produce for us. Our key distribution partners could merge, consolidate, or change their business models in ways that affect how our products are sold, or new distribution channels could emerge and adversely impact the effectiveness of our distribution efforts. An increase in bank, wire house and broker-dealer consolidation activity could increase competition for access to distributors, result in greater distribution expenses and impair our ability to market products through these channels. Any of these changes in distribution could materially and adversely impact our business, financial condition, results of operations.
Consolidation of distributors or other industry changes could also increase the likelihood that distributors will try to renegotiate the terms of any existing selling agreements to terms less favorable to us.
Competition could adversely affect our market share and financial results.
In some markets, we face competitors that are larger, have greater financial resources or greater market share, have better brand recognition, offer a broader range of products, or have higher crediting rates. Our competitors include major stock and mutual insurance companies, mutual fund organizations, banks, and other financial services companies. In recent years, substantial consolidation and convergence among companies in the insurance and financial services industries resulted in increased competition from large, well-capitalized insurance and financial services firms that market products and services similar to ours. These companies and firms compete with us for customers, distribution partners, and employees. Increased consolidation among banks and other financial services companies could create firms with even stronger competitive positions, negatively impact the insurance industry’s sales, increase competition for access to third-party distributors, result in greater distribution expenses and impair our ability to market our annuities to our current customer base or expand our customer base.
We face competition from other products, including non-insurance products such as mutual funds, certificates of deposit and newly developed investment products. These competitive product pressures could result in increased pricing pressures on our products and services and could harm our ability to maintain or increase our profitability.
We also face competition from new entrants into our markets or non-traditional or online competitors, many of whom leverage digital technology that could challenge us, a traditional financial service company, by providing new services or creating new distribution channels. Our ability to generate appropriate returns will depend significantly on our capacity to anticipate and respond appropriately to consumer demand, digital and other technological advances, the need for economies of scale and the consequential impact of consolidation, regulatory actions, and other factors. We may not continue to compete effectively, which could cause a material adverse effect on our business, financial condition, results of operations and cash flows.
Risks Related to Legal, Tax and Regulatory Matters
Our businesses are heavily regulated and changes in regulation could reduce our profitability and limit our growth.
32
Part I | Item 1A. Risk Factors
Our products and companies are subject to extensive and potentially conflicting state and federal tax, securities, broker-dealer and broker licensing, insurance and employee benefit plan laws and regulations in the jurisdictions in which we operate. These laws and regulations are complex and subject to change. We are monitoring known regulatory actions that could potentially impact our business; however, at this time, we cannot predict what form those regulations may take or their potential impact. Any of these laws and regulations, existing or in the future, could have an unknown or material adverse impact on us. See, "Item 1. Business—Regulation" for additional discussion on the impact of such laws and regulations.
Moreover, these laws and regulations are administered and enforced by a number of different governmental and self- regulatory authorities, including state insurance regulators, state securities administrators, the U.S. Securities and Exchange Commission, the Financial Industry Regulatory Authority, the U.S. Department of Labor, the U.S. Department of Justice, the U.S. Internal Revenue Service and state attorneys general, each of which exercises a degree of interpretive latitude. Failure to adhere to these laws and regulations, or respond to changes in them, could result in regulatory action including fines, restrictions in our ability to sell our products, and reputational impact.
A decrease in the risk-based capital ("RBC") ratio (as a result of a reduction in statutory capital and surplus or increase in RBC requirements) of our insurance subsidiaries could result in increased scrutiny by insurance regulators and rating agencies, which could lead to corrective measures and ratings downgrades that would adversely affect our business, financial condition, results of operations and cash flows.
The National Association of Insurance Commissioners ("NAIC") established model regulations that provide minimum capitalization requirements for insurance companies based on risk-based capital formulas. Each of our U.S. insurance subsidiaries is subject to RBC standards or other minimum statutory capital and surplus requirements imposed under the laws of its respective jurisdiction of domicile. A failure to meet these requirements could subject our subsidiaries to further examination or corrective action imposed by insurance regulators, including limitations on their ability to write additional business, increased regulatory supervision, seizure or liquidation. Any corrective action imposed could cause a material adverse effect on our business, financial condition, results of operations and cash flows.
A decline in the RBC ratio of one or more of our insurance subsidiaries, whether or not it results in a failure to meet applicable RBC requirements, could limit the ability of our insurance subsidiaries’ ability to make dividends or distributions to us, could result in a loss of customers or new business, or could influence ratings agencies to downgrade financial strength ratings, each of which could cause a material adverse effect on our business, financial condition, results of operations and cash flows.
In any particular year, total adjusted capital amounts and RBC ratios could change due to a variety of factors, including:
•the amount of statutory earnings generated by the insurance subsidiary,
•the amount of additional capital that an insurer must hold to support business growth,
•equity, interest rate, and credit market conditions,
•the value and credit ratings of certain fixed income and equity securities in an insurance subsidiary's investment portfolio, and
•changes to the RBC formulas and the interpretation of the NAIC’s instructions with respect to RBC calculation methodologies.
In addition, rating agencies may implement changes to their own internal models, which differ from the RBC capital model, that have the effect of increasing or decreasing the amount of capital our insurance subsidiaries should hold relative to the rating agencies’ expectations. Under stressed or stagnant capital market conditions and with the aging of existing insurance liabilities, without offsets from new business, the amount of additional statutory reserves that an insurance subsidiary is required to hold could materially increase. Any of these would decrease the total adjusted capital available for use in calculating an RBC ratio. To the extent that an insurance subsidiary’s RBC ratio is deemed to be insufficient, we may seek to take actions either to increase the insurance subsidiary’s capitalization or reduce the capitalization requirements. If we were unable to accomplish such actions, the rating agencies could view this as a reason for a ratings downgrade.
Changes in U.S. federal income or other tax laws or the interpretation of tax laws could affect sales of our products, cash flows, and profitability.
The annuity products that we market generally provide the customer with certain federal income tax advantages. For example, policyholders of annuity contracts funded with after-tax dollars (“non-qualified”) are able to defer federal income taxation on any gain until it is received. With other savings investments, such as certificates of deposit and taxable bonds, the increase in value is generally taxed each year as it is realized. Additionally, life insurance death benefits are generally exempt from income tax.
33
Part I | Item 1A. Risk Factors
From time to time, proposed tax law changes could, for example, eliminate all or a portion of the income tax advantages described above for annuities and life insurance. If legislation were enacted to eliminate the tax deferral for annuities, such a change would have an adverse effect on our ability to sell our annuities. Moreover, if the treatment of annuities were changed prospectively, and the tax-favored status of existing contracts was grandfathered, holders of existing contracts would be less likely to surrender or rollover their contracts. These tax law changes, if implemented, could have a material adverse effect on our business, financial condition, results of operations and cash flows.
The Inflation Reduction Act of 2022 (“IRA”) established in 2023 a new 15 percent corporate alternative minimum tax (“CAMT”) on large applicable corporations. The Company is a large applicable corporation and is subject to the tax each year starting in 2023. The implementation of the CAMT contemplates that the U.S. Department of Treasury issues final regulatory guidance. It remains difficult to predict the specific final guidance or the definition of adjusted financial statement income. In the absence of further guidance, despite our federal net operating loss and foreign tax credit carryforwards, we may be required to pay tax equal to 15 percent of our pre-tax financial statement income, as adjusted by the CAMT, which includes certain items that are non-economic and can fluctuate significantly based on the movement of interest rates and equity markets. The CAMT, including the potential impacts of pending regulatory guidance, and any potential future increase in the U.S. corporate income tax rate could have a material adverse effect on our results of operations and cash flows.
Our investment advisory agreements with clients are subject to termination or non-renewal on short notice.
Our investment advisory subsidiaries’ written investment management agreements with their clients are terminable without penalty at any time or upon relatively short notice by either party. Moreover, our investment advisory subsidiaries’ investment management agreements with U.S. Securities and Exchange Commission-registered investment companies (each, an “RIC”), including the RICs affiliated with Jackson that serve as the sole investment options for our variable annuities, may be terminated at any time, without payment of any penalty, by each RIC’s Board of Trustees (including a majority of the independent trustees) or by vote of a majority of the outstanding voting securities of the RIC on not more than 60 days’ notice. The investment management agreements pursuant to which our investment advisory subsidiaries manage RICs must be renewed and approved by each RICs’ Boards of Trustees or by vote of a majority of the outstanding voting securities of the RIC (including a majority of each RIC’s independent trustees) annually. A significant majority of an RIC’s trustees are independent. Consequently, the Board of Trustees of each RIC may not approve the investment management agreement each year or may condition its approval on revised terms that are materially adverse to us.
Also, as required by the Investment Company Act of 1940, as amended (the “Investment Company Act”), each investment advisory agreement with a RIC automatically terminates upon its assignment, although new investment advisory agreements may be approved by the RIC’s Board of Trustees and shareholders. The Investment Advisers Act of 1940, as amended (the “Investment Advisers Act”), also requires approval or consent of investment advisory agreements by clients in the event of an assignment of the agreement. An “assignment” for purposes of both the Investment Company Act and the Investment Advisers Act includes a sale of a controlling block of the voting stock of the investment adviser or its parent company, or a change in control of the investment adviser. If an assignment were to occur, clients may not approve it, which event could have a material adverse effect on our business.
Changes to comply with new and potential laws or regulations that impose fiduciary or best interest standards in connection with the sale of our products could materially increase our costs, decrease our sales and result in a material adverse impact on our business, financial condition, results of operations and cash flows.
Regulators continue to propose and adopt fiduciary rules, best interest standards and other similar laws and regulations applicable to the sale of annuities. These rules, standards, laws, and regulations generally require advisers providing investment recommendations to act in the client’s best interest or put the client’s interest ahead of their own interest. We face uncertainty regarding the adoption of these rules and regulations and the U.S. Securities and Exchange Commission, the U.S. Department of Labor, and state insurance departments could adopt potentially conflicting or overlapping standards. Changes in these standards, rules and laws could lead to changes to our compensation practices and product offerings and increase our litigation risk, which could adversely affect our results of operations and financial condition. See “Item 1. Business—Regulation—Federal Initiatives.”
Changes in accounting standards could cause a material adverse effect on our business, financial condition, results of operations and cash flows.
Our consolidated financial statements are prepared in accordance with U.S. GAAP, the principles of which are revised from time to time. Changes to U.S. GAAP could affect the way we account for and report significant areas of our business, impose special demands on us in areas of governance, associate training, internal controls and disclosures, and affect how we manage our business. To the extent that such changes affect income, expenses, assets, liabilities or shareholders’ equity, they could adversely affect rating agency metrics and could consequently adversely impact our financial strength ratings
34
Part I | Item 1A. Risk Factors
and our ability to incur new indebtedness or refinance our existing indebtedness. See Note 2 of Notes to Consolidated Financial Statements for a description of recently adopted and pending changes in accounting principles.
Our operating insurance companies are also subject to statutory accounting practices prescribed or permitted by their states of domicile, whose accounting practices are driven by the NAIC. Any changes in the method of calculating reserves for our products under statutory accounting practices could result in increases in, and volatility of, reserve and capital requirements. For example, the NAIC is currently working to revise the economic scenarios that are inputs to the calculation of statutory reserves and required capital for many insurance products. Those revisions, which are expected to be finalized prior to 2026, could result in a material impact on the level and volatility of our statutory surplus and required statutory capital.
Legal and regulatory investigations and actions are increasingly common in our industry and could result in a material adverse effect on our business, financial condition, results of operations and cash flows.
We face a significant risk of litigation and regulatory investigations and actions in the ordinary course of operating our business, including the risk of class action lawsuits, arbitration claims, government subpoenas, regulatory investigations, examinations, actions, and other claims. Given the inherent unpredictability of litigation, the unfavorable resolution of one or more pending litigation matters, or future litigation or actions, inquiries, investigations or examinations, could have a material adverse effect on our business, financial condition, results of operations and cash flows. Even if we ultimately prevail in any litigation, arbitration, or any action or investigation by governmental authorities or regulators, we could suffer significant reputational harm, which could have a material adverse effect on our business, financial condition, results of operations and cash flows. See Note 16 of Notes to Consolidated Financial Statements for further information.
Risks Related to Information Technology, Security and Data
Our information technology systems could fail, which could cause a material adverse effect on our business, financial condition, results of operations and cash flows.
Our business operations depend on the ability to process large numbers of transactions for numerous and diverse products, which requires the effective operation of our information technology systems. We employ a large number of complex and interconnected information technology and finance systems, models, and user developed applications in our processes to support our business operations. We also have arrangements in place with third-party suppliers and other service providers with whom we share and receive information. We could experience significant impacts to our business operations if our technology lack sufficient system capacity, scalability, stability, or if they underperform, or if our data or technology systems suffer an outage impacting availability, due to a disaster or cyberattack. Our systems change management controls may not work as designed, which could result in an unintended change being introduced into a production environment resulting in unexpected effects on functionality, or experience limited availability of one or more systems or devices, or our ability to recover data might be hindered by the impact of a ransomware attack, any or all of which could cause material disruption to normal business operations.
Our information technology systems, and those of our third-party vendors and service providers, are vulnerable to physical or electronic intrusions, computer viruses, ransomware or other attacks potentially exposing confidential customer or associate data or proprietary business information.
We are exposed to continuously evolving risks of attempts to disrupt the availability, confidentiality and integrity of our information technology systems, which could result in disruption to key operations or loss of the availability, confidentiality or integrity of customer, associate, or other data. We have been, and likely will continue to be, subject to potential damage from computer viruses, attempts to access confidential information, including customer data, and cybersecurity attacks such as “denial of service” attacks, phishing, sophisticated and automated attacks, and other disruptive software campaigns. Our security measures, including information security policies, standards, administrative, technical, and physical controls, associate training and other preventative actions may not fully protect us from such events. See "Item 1C. Cybersecurity" for more information.
Customer, associate or representative data, or strictly confidential or proprietary non-public business information could be disclosed to unauthorized parties due to associate error, a cyberattack (i.e., hacking, phishing, malware, etc.), or through a third-party relationship, resulting in financial losses, regulatory fines, and impact to our reputation.
Increased cybersecurity threats and computer crime also pose a risk of litigation, regulatory investigations, and other penalties. Data privacy is subject to frequently changing rules and regulations regarding the handling of personal data. Any breach in the security of our information technology systems could result in the disclosure or misuse of confidential or proprietary business information, including sensitive customer, supplier, or associate data maintained in the ordinary course of our business. Any such event, or any failure to comply with these data privacy requirements or other laws in this area,
35
Part I | Item 1A. Risk Factors
could cause damage to our reputation, or loss of revenue and could result in legal liability or penalties. In addition, we could incur large expenditures to investigate, remediate, and recover networks or information systems and protect against similar future events.
We retain confidential information in our information systems and in cloud-based systems (including customer transactional data and personal data about our distribution partners, customers, and our own associates). We rely on commercial technologies and third parties to maintain the security of those systems. Anyone who circumvents our security measures and penetrates our information systems, or the cloud-based systems we use, has and could access, view, misappropriate, alter or delete any information in the systems, including customer data and proprietary business information. It is possible that an associate, contractor, or representative could, intentionally or unintentionally, disclose or misappropriate personal data or other confidential information. Our associates, distribution partners and other third-party partners use portable computers or mobile devices that could contain similar information to that in our information systems, and these devices have been and could be lost, stolen or damaged.
Any compromise of our information technology systems or of the third-party partners' systems that results in the unauthorized access or disclosure of personal data or proprietary business information could damage our reputation in the marketplace, deter customers from purchasing our products, subject us to civil and criminal liability and require us to incur significant technical, legal and other expenses, any of which could cause a material adverse effect on our business, financial condition, results of operations, and cash flows.
Jackson is exposed to the risk of incomplete, inaccurate, or misinterpreted data being utilized for reporting or decision-making purposes.
Our business depends on the performance of complex information technology systems and the effective management and use of quality and reliable data. This data could become incomplete, inaccurate, or misinterpreted due to inadequate or failed internal and external processes, systems or deliberate human actions, inactions, or error, resulting in misinterpretation of the data or inability to make strategic or timely decisions, which could cause a material adverse effect on our business, financial condition, results of operations and cash flows.
The use of artificial intelligence processes may introduce errors in analysis and decision-making and cause adverse effects on our business, financial condition, results of operations and cash flows.
Generative artificial intelligence is a new use of technology that potentially offers opportunities for businesses to gain efficiencies, pursue growth opportunities, or improve customer, employee or other stakeholder experiences. We are selectively exploring its use where it can provide meaningful benefit to our business. If employed, it could inherently create risks such as biased, discriminatory or otherwise unfair decision-making, misrepresent data leading to negative impacts on decision-making, or be subject to cyberattacks, any of which could result in a material adverse effect on our business, regulatory fines and impact to our reputation. In addition, new and currently unforeseeable regulatory issues could also arise due to the developing and uncertain regulatory environment.
General Risk Factors
Adverse outcomes from the operational risks inherent in our business could disrupt our business, and have a negative impact on our business, financial condition, results of operations and cash flows.
Operational risks are inherent to our businesses and include direct or indirect losses resulting from inadequate or failed internal and external processes, systems or deliberate human actions, inactions, or error. Our policies and procedures may not be fully effective in identifying, monitoring, or mitigating our risk exposure against all types of risk.
We are exposed to risks related to natural and man-made disasters and catastrophes, diseases, epidemics, pandemics, malicious acts, terrorist acts, civil unrest, and global climate change.
We face exposure from the effects of natural or man-made catastrophic events (such as natural disasters, pandemics like COVID-19, cyber-attacks, acts of terrorism, civil unrest, and other catastrophes), and other external events. These risks could also adversely impact us through our distribution partners and our third-party relationships that provide outsourcing services such as policy administration, technology, and data hosting and administration.
Jackson could suffer a major and prolonged business interruption, impacting its ability to deliver on its commitments to customers and other stakeholders, due to a disruption to the communication or utility infrastructures, availability or accessibility of our business locations or people due to a variety of natural or man-made events or actions. If associates are unable to perform regular business operations, we could suffer a significant business interruption, negatively impacting customers or other stakeholders.
36
Part I | Item 1A. Risk Factors
Our inability to recruit, motivate and retain key associates and experienced and productive associates could cause a material adverse effect on our business, financial condition, results of operations and cash flows.
Our business depends on our ability to attract, motivate, and retain highly skilled, and often highly specialized, technical, investment, actuarial, managerial, and executive personnel. Intense competition exists for key associates with demonstrated abilities, and we may be unable to retain or hire such associates. Our success also depends on the continued service of our key senior management team, including executive officers and senior managers. The unexpected loss of services of one or more of our key associates could have a material adverse effect on our operations due to their skills, knowledge of our business, their years of industry experience and the potential difficulty in promptly finding qualified replacement associates.
Our succession plans may not operate effectively, and our compensation plans may not be effective in helping us retain our key associates, the loss of one or more of whom could cause a material adverse effect on our business, financial condition, and results of operations.
Adverse outcomes from the operational risks of our material outsourcing partners, could disrupt our business, and have a negative impact on our business, financial condition, results of operations and cash flows.
We rely on the performance and operations of a number of third-party relationships providing services such as back-office support functions, information technology infrastructure, customer facing operations and services, product distribution and services (including through digital channels), and investment operations. Failure to adequately oversee our third-party partners, or the failure of a partner (or of its information technology and operational systems and processes) could result in significant disruption to business operations and customers and could have adverse reputational, regulatory and legal implications, and thus could cause a material adverse effect on our business, financial condition, results of operations and cash flows.
We face risks arising from acquisitions or other complex strategic transactions.
We have made acquisitions and other strategic transactions in the past and may pursue further acquisitions or other strategic transactions, including reinsurance, dispositions, and joint ventures, in the future. We face a number of risks arising from such transactions, including difficulties in assimilating and retaining associates and intermediaries, incurring unforeseen liabilities that arise in connection with such transactions, or facing unfavorable market conditions that could negatively impact our expectations for such transactions. Further, strategic transactions could require us to increase our leverage or, if we issue shares to fund an acquisition, would dilute holdings of existing shareholders. These risks could prevent us from realizing the expected benefits from acquisitions and could result in the impairment of goodwill and other intangible assets recognized at the time of acquisition. In addition, should we pursue a strategy to complement our organic growth by exploring opportunities for acquisitions, it could be materially and adversely affected by the increasingly competitive nature of the life insurance and annuity merger and acquisition market and the increased participation of non-traditional buyers in the life insurance and annuity merger and acquisition market.
Our efforts to meet Environmental, Social, and Governance (“ESG”) standards may not meet investors’ or regulators’ expectations; and our customers, prospective investors or shareholders, or those considering such a relationship with us, may negatively evaluate our business or other practices according to a variety of ESG standards and expectations.
Some of our regulators have proposed ESG rules or announced that they intend to review our practices against ESG standards; others may yet do so. Our investors or other stakeholders may evaluate our practices by ESG criteria that are continually evolving and not always clear. These standards and expectations may also reflect contrasting or conflicting values or agendas. Our decisions or priorities must necessarily and simultaneously, consider our business goals and interests. We define our own corporate purpose, in part, by the sustainability of our practices and our impact on all our stakeholders. Our practices may not change in the way or at the rate stakeholders expect. As a result, our efforts to conduct our business in accordance with expectations may involve compromises, at least in the short run. We may fail to meet our ESG commitments or targets. Our policies and processes to evaluate and manage ESG standards in coordination with other business priorities may not be completely effective or satisfy investors, regulators, or other stakeholders. We may face adverse regulatory, investor, or other stakeholder scrutiny resulting in business, reputational, or legal challenges.
We face direct or indirect effects of, or responses to, climate change.
Climate change regulation may affect the prospects of companies and other entities whose securities we hold, the value of those securities, or our willingness to continue to hold those securities. Climate change may also influence investor sentiment with respect to the Company and investments in our portfolio, including real estate investments. We cannot predict the long-term impacts on us from climate change or related regulation. A failure to identify and address these global climate issues and related impacts could cause a material adverse effect on the achievement of our business objectives.
37
Part I | Item 1A. Risk Factors
The market price of our common stock could be volatile and could decline.
Stock markets have experienced extreme volatility in recent years unrelated to the operating performance of particular companies. These broad market fluctuations could adversely affect the trading price of our common stock. In addition, the market price of our common stock could fluctuate significantly due to, among other factors, our results of operations and any capital markets activities, investors’ perceptions of us relative to other companies in the insurance industry and other industries, and actions on the part of regulators or rating agencies.
Applicable insurance laws could make it difficult to effect a change of control of our Company.
The insurance laws and regulations of the various states in which our insurance subsidiaries are organized could delay or impede a business combination involving us. State insurance laws prohibit an entity from acquiring control of an insurance company without the prior approval of the domestic insurance regulator. Under most states’ statutes, an entity is presumed to have control of an insurance company if it owns, directly or indirectly, 10% or more of the voting stock of that insurance company or its parent company. These regulatory restrictions could delay, deter, or prevent a potential merger or sale of our company, even if our Board of Directors decides that it is in the best interests of shareholders for us to merge or be sold. These restrictions also could delay sales by us or acquisitions by third parties of our insurance subsidiaries.
Anti-takeover provisions in our certificate of incorporation and by-laws could discourage, delay, or prevent a change of control of our Company and could affect the trading price of our common stock.
Our certificate of incorporation and our by-laws contain provisions that could discourage, delay, or prevent a change in our management or control over us, which shareholders consider to be favorable. For example, our certificate of incorporation and by-laws collectively:
•authorize the issuance of shares of common stock that could be used to create voting impediments or to frustrate persons seeking to effect a takeover or gain control;
•authorize the issuance of “blank check” preferred stock that could be issued by our Board of Directors to thwart a takeover attempt;
•provide that vacancies on our Board of Directors, including vacancies resulting from an enlargement of our Board of Directors, may be filled only by a majority vote of Directors then in office;
•prohibit shareholder action by written consent, thereby requiring all actions to be taken at a meeting of the shareholders; and
•establish advance notice requirements for nominations of candidates for election as directors or to bring other business before an annual meeting of our shareholders.
These provisions could prevent our shareholders from receiving the benefit from any premium to the market price of our common stock offered by a bidder in a takeover context. Even in the absence of a takeover attempt, the existence of these provisions could adversely affect the prevailing market price of our common stock if the provisions are viewed as discouraging takeover attempts in the future.
Our certificate of incorporation and by-laws could also make it difficult for shareholders to replace or remove our management. Furthermore, the existence of the foregoing provisions could limit the price that investors might be willing to pay in the future for shares of common stock. These provisions could facilitate management entrenchment that could delay, deter, render more difficult or prevent a change in our control, which may not be in the best interests of our shareholders.
Our certificate of incorporation designates the Court of Chancery of the State of Delaware or the federal courts, as applicable, as the sole and exclusive forum for certain litigation that may be initiated by our shareholders, which could limit our shareholders’ ability to obtain a favorable judicial forum for disputes with us or our directors, officers or shareholders.
Our certificate of incorporation provides that, unless we consent in writing to the selection of an alternative forum, the Court of Chancery of the State of Delaware will, to the fullest extent permitted by law, be the sole and exclusive forum for:
•any derivative action or proceeding brought on our behalf,
•any action asserting a claim of breach of a fiduciary duty owed to us or our shareholders by any of our current or former directors, officers, other associates, agents or shareholders,
•any action asserting a claim arising out of or under the Delaware General Corporation Law ("DGCL"), or as to which the DGCL confers jurisdiction on the Court of Chancery of the State of Delaware (including, without limitation, any action asserting a claim arising out of or pursuant to our certificate of incorporation or our bylaws), or
38
Part I | Item 1A. Risk Factors
•any action asserting a claim that is governed by the internal affairs doctrine.
Unless we consent to an alternative forum, the federal district courts of the U.S. will, to the fullest extent permitted by law, be the sole and exclusive forum for the resolution of any complaint asserting a cause of action arising under the federal securities laws and the rules and regulations thereunder. Neither this provision nor the exclusive forum provision will mean that shareholders have waived our compliance with federal securities laws and the rules and regulations thereunder. The choice of forum provisions in our certificate of incorporation will limit our shareholders’ ability to obtain a favorable judicial forum for disputes with us or any of our current or former directors, officers, other associates, agents or shareholders, which could discourage lawsuits with respect to such claims. Or, a court could determine that the exclusive forum provision is unenforceable. If a court were to find the choice of forum provision contained in our certificate of incorporation to be inapplicable to, or unenforceable in respect of, one or more specified types of actions and proceedings, we could incur additional costs associated with resolving such action in other jurisdictions, which could materially and adversely affect our business, financial condition, results of operations and cash flows.
Item 1B. Unresolved Staff Comments
None.
Item 1C. Cybersecurity
Cybersecurity Risk Management and Strategy
We have an enterprise-wide risk management framework for identifying, assessing, managing, monitoring, and reporting our material risks, including cybersecurity risks. Our risk identification and risk and control self-assessment ("RCSA") process assesses the potential likelihood and impact of, among other things, cybersecurity risks to the Company, and the control environment in place to mitigate identified risks. See Item 1A. Risk Factors – “Risks Related to Information Technology, Security and Data” for a description of the cybersecurity risks we face.
The Company is committed to attaining the highest standards for information security and data privacy programs through disciplined governance and risk management practices.
We have a written JFI Information Security Policy setting forth our expectations with respect to the receipt, handling and management of information, and setting forth our process, procedures and standards for achieving those expectations. Our Information Security Policy is reviewed and updated by management at least annually, to align with multiple industry standards, including the National Institute of Standards and Technology Cyber Security Framework and relevant state regulations, including New York’s Department of Financial Services Cybersecurity Requirements for Financial Services Companies, and federal regulatory requirements. The JFI Privacy Policy is also annually reviewed and updated by management to align with industry best practices and state and federal regulatory requirements.
Our cybersecurity program includes a threat and vulnerability management program to identify, assess, prevent, detect, monitor and remediate internal and external threats to, and vulnerabilities of, the Company’s electronic systems, applications and data. Key components of this security program include a 24/7 Security Operations Center, which is managed internally at Jackson, with staff augmentation from third-party service vendors. The Security Operations Center monitors threats and attacks and initiates the incident response management process and associated notifications, as needed. In addition to monitoring threats and attacks, our internal management team reviews daily external threat intelligence and oversees, at least quarterly, external penetration testing of our Company’s electronic systems. We provide training to all associates and regularly audit and assess our program with both internal and external resources, and through benchmarking studies and assessments against our Information Security and Privacy Policies and Standards.
We have a third-party vendor management program that oversees the identification and assessment of cybersecurity risk for the Company’s use of all third-party service providers. This program evaluates third-party vendors based on their level of access to the Company’s data and the level of potential risk the third-party service providers create for the organization through reviews of their security program and systems architecture. The Company identifies monitoring and mitigating controls and implements such controls where appropriate for any identified risks, including adding robust security terms in agreed contracts. We also monitor and periodically reassess third-party service vendors to ensure controls are maintained to expectations.
39
Part I | Item 1C. Cybersecurity
Cybersecurity Incidents
As previously disclosed in Item 2. Management’s Discussion and Analysis of Financial Condition and Results of Operations— Macroeconomic, Industry and Regulatory Trends — Cybersecurity Event in our Form 10-Q for the quarter ended June 30, 2023, Jackson determined that its information at one of our third-party vendors, Pension Benefit Information, LLC (“PBI”), was impacted by a cybersecurity breach involving Progress Software Corporation’s MOVEit Transfer software. The PBI service helps Jackson to identify possible beneficiaries for death benefits. According to PBI, an unknown actor exploited a MOVEit software flaw to access PBI’s systems and download certain data. Our assessment indicated that personally identifiable information relating to approximately 850,000 of Jackson’s customers was obtained by that unknown actor from PBI’s systems. PBI informed Jackson that it rectified the MOVEit vulnerability.
Separately, Jackson experienced unauthorized access to two servers as a result of the MOVEit flaw; however, the scope and nature of the data accessed on those servers was significantly less than the PBI impact. Our assessment was that a subset of information relating to certain partner organizations and individuals, including certain customers of Jackson, was obtained from the two affected servers.
At this time, we do not believe the incidents or related litigation will have a material adverse effect on the business, operations, or financial results of Jackson Financial.
Governance
JFI’s Board Oversight of Risks from Cybersecurity Threats: JFI’s Board approved both the Company’s initial JFI Information Security Policy and the JFI Privacy Policy. The Finance and Risk Committee of the JFI Board assists the Board with oversight of the Company’s risk framework and its effectiveness. The Finance and Risk Committee regularly reviews top risks identified by management, the Company’s risk appetite, and financial and non-financial risks, including information security and cybersecurity. The committee also reviews activity reports on the status of our cybersecurity program, including material policy changes, breaches, and remediation actions. At least annually, and more often as needed, the committee meets with our Chief Information Security Officer (“CISO”) in a dedicated session to review and discuss in-depth cybersecurity risks facing the Company.
JFI’s Board of Directors receives periodic reports from its Finance and Risk Committee regarding the committee’s actions in respect of cybersecurity and related regulatory developments and receives from our CISO regular updates about cybersecurity threats and our cybersecurity and privacy programs.
Management’s Role in Assessing and Managing Material Risks from Cybersecurity Threats: Our CISO is a member of the senior leadership team and oversees our Information Security and Privacy Team. The CISO provides regular updates to the Board on cybersecurity threats facing the organization, including developments in our ongoing information security and privacy programs. As noted, the CISO meets in dedicated sessions with the Finance and Risk Committee to review and discuss in-depth cybersecurity risks facing the Company.
Our Information Security and Privacy Team includes 70 full-time positions with at least 50% of our associates holding industry certifications, such as the Certified Information Systems Security Professional (CISSP), Certified Information Security Manager (CISM), and Certified Information Privacy Professional (CIPP). All associates and contractors with access to our Company’s systems receive comprehensive initial and ongoing annual training on responsible information security, data security, and cybersecurity practices and how to protect against cyber threats.
Regular independent third-party assessments, penetration testing, and internal audits are conducted to validate controls and to position our cybersecurity maturity level at or ahead of industry trends in meeting stringent security standards. We regularly assess our security program internally and externally, through benchmarking studies and assessments against our Information Security and Privacy Policies and Standards and conduct assessments of the effectiveness of relevant internal control activities designed to restrict inappropriate access to our IT systems, support data integrity within our IT systems, and ensure ongoing availability of our IT systems. Certain of these control activities are also subject to an assessment by our external auditor to support its opinion on the effectiveness of our internal control over financial reporting.
40
Part I | Item 2. Properties
Item 2. Properties
We currently own and occupy the buildings comprising our corporate headquarters campus and related properties in Lansing, Michigan as well as our regional headquarters in Franklin, Tennessee. We also have leases for the following offices:
•District of Columbia under a lease that expires in 2029;
•Chicago, Illinois under a lease that in expires in 2029;
•Schaumburg, Illinois under a lease that expires in 2025;
•East Lansing, Michigan under a lease that expires in 2029; and
•Lansing, Michigan under a lease that expires in 2028.
We believe our properties are adequate and suitable for our business as currently conducted and are adequately maintained. All of our offices include operations across all of our reporting segments.
Item 3. Legal Proceedings
For a discussion of legal proceedings, see Note 16 - Commitments and Contingencies of Notes to Consolidated Financial Statements included under Item 8. Financial Statements and Supplementary Data of this Form 10-K, which is incorporated herein by reference.
Item 4. Mine Safety Disclosures
Not applicable.
41
Part II | Item 5. Market for Registrant’s Common Equity, Related Shareholder Matters and Issuer Purchases of Equity Securities
Part II
Item 5. Market for Registrant’s Common Equity, Related Shareholder Matters and Issuer Purchases of Equity Securities
Market Information
Jackson Financial's common stock is listed on the NYSE under the symbol, "JXN", and began trading on September 20, 2021. Prior to that date, there was no public trading market for our common stock. On February 14, 2024, the approximate number of shareholders of record at the close of business on that date was 55,000.
Equity Compensation Plans
Our table of equity compensation plans is incorporated from Item 12. Security Ownership of Certain Beneficial Owners and Management and Related Stockholder Matters in this Report.
Issuer Purchases of Equity Securities
| Period | Total Number of Shares Purchased | Average Price Paid Per Share | Total Number of Shares Purchased as Part of Publicly Announced Program (1) | Maximum Dollar Value of Shares that May Yet Be Purchased Under the Program (in millions) (1) | ||||||||||
| October 1, 2023 - October 31, 2023 | ||||||||||||||
| Share repurchase program | 590,000 | $ | 38.38 | 590,000 | $ | 345 | ||||||||
Employee transactions (2) | 80,193 | 36.35 | N/A | N/A | ||||||||||
| November 1, 2023 - November 30, 2023 | ||||||||||||||
| Share repurchase program | 313,733 | 42.27 | 313,733 | 332 | ||||||||||
Employee transactions (2) | — | — | N/A | N/A | ||||||||||
| December 1, 2023 - December 31, 2023 | ||||||||||||||
| Share repurchase program | 608,530 | 51.26 | 608,530 | 301 | ||||||||||
Employee transactions (2) | 6,284 | 48.11 | N/A | N/A | ||||||||||
| Totals | ||||||||||||||
| Share repurchase program | 1,512,263 | 1,512,263 | ||||||||||||
Employee transactions (2) | 86,477 | N/A | ||||||||||||
| 1,598,740 | 1,512,263 | |||||||||||||
(1) For more information on common stock repurchases, see Item 8. Note 24 - Equity of Notes to Consolidated Financial Statements included elsewhere in this Form 10-K.
(2) Includes shares withheld pursuant to the terms of awards under the Company's 2021 Omnibus Incentive Plan to offset tax withholding obligations that occur upon vesting and release of shares, which are treated as share repurchases. The value of the shares withheld is the closing price of common stock of Jackson Financial Inc. on the date the relevant transaction occurs.
42
Part II | Item 5. Market for Registrant’s Common Equity, Related Shareholder Matters and Issuer Purchases of Equity Securities
Common Stock Performance Graph
The graph and table, below, compare the total return on our common stock with the total return on the S&P Global Ratings (“S&P”) 500, S&P 500 Insurance, S&P 500 Financials, and S&P Insurance Select Industry indices, respectively, between September 20, 2021 (the date that our common stock commenced regular way trading on the NYSE) through December 31, 2023. The graph and table show the total return on a hypothetical $100 investment in our shares of common stock and in each index, respectively, on September 20, 2021, including the reinvestment of all dividends.
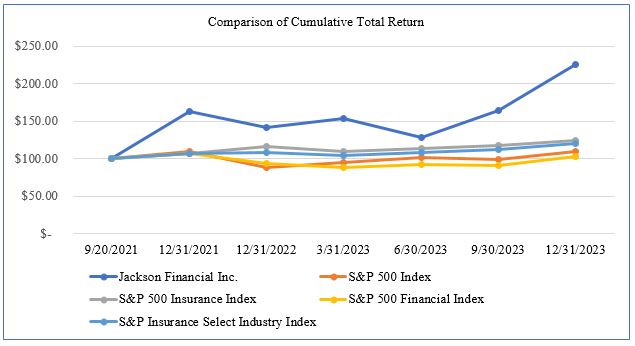
| 9/20/2021 | 12/31/2021 | 12/31/2022 | 03/31/2023 | 06/30/2023 | 09/30/2023 | 12/31/2023 | |||||||||||||||||||||||||||||||||||
| Jackson Financial Inc. | 100 | 162.50 | 141.65 | 153.01 | 128.08 | 164.18 | 226.00 | ||||||||||||||||||||||||||||||||||
| S&P 500 Index | 100 | 109.37 | 88.11 | 94.30 | 102.13 | 98.40 | 109.46 | ||||||||||||||||||||||||||||||||||
| S&P 500 Insurance Index | 100 | 107.51 | 116.26 | 109.73 | 114.08 | 117.43 | 124.78 | ||||||||||||||||||||||||||||||||||
| S&P 500 Financial Index | 100 | 106.77 | 93.58 | 87.92 | 92.17 | 90.69 | 102.88 | ||||||||||||||||||||||||||||||||||
| S&P Insurance Select Industry Index | 100 | 106.97 | 108.77 | 104.55 | 108.47 | 112.87 | 120.00 | ||||||||||||||||||||||||||||||||||
Item 6. [Reserved]
43
Item 7. Management’s Discussion and Analysis of Financial Condition and Results of Operations
Overview
This executive summary of Management’s Discussion and Analysis of Financial Condition and Results of Operation highlights selected information and may not contain all the information that is important to current or potential investors in our securities. You should read this Annual Report on Form 10-K for the fiscal year ended December 31, 2023 (the "Form 10-K") in its entirety for a more detailed description of events, trends, uncertainties, risks and critical accounting estimates affecting us.
Discussion related to the results of operations for the Company's comparison of 2022 results to 2021 results has been omitted in this Form 10-K. The Company's comparison of 2022 results to 2021 results is included in the Company's Annual Report on Form 10-K for the year ended December 31, 2022, as filed with the SEC on March 1, 2023, (the "2022 Annual Report"), as recast to reflect the adoption of LDTI in our Current Report on Form 8-K filed May 10, 2023, under Part II, Item 7, Management's Discussion and Analysis of Financial Condition and Results of Operations.
Jackson Financial Inc. (“Jackson Financial” or “JFI”) along with its subsidiaries (collectively, the “Company,” which also may be referred to as “we,” “our” or “us”), is a financial services company focused on helping Americans grow and protect their retirement savings and income to enable them to pursue financial freedom for life. Jackson Financial, domiciled in the state of Delaware, United States (“U.S.”), was previously a subsidiary of Prudential plc (“Prudential”), London, England and was the holding company for Prudential’s U.S. operations. The Company's demerger from Prudential was completed on September 13, 2021 (the "Demerger"). Jackson Financial’s primary operating subsidiary, Jackson National Life Insurance Company ("Jackson"), is licensed to sell group and individual annuity products (including immediate, registered index-linked, deferred fixed, fixed index, fixed and variable annuities), and various protection products, primarily whole life, universal life, variable universal life and term life insurance products in all 50 states and the District of Columbia.
Executive Summary
We help Americans grow and protect their retirement savings and income to enable them to pursue financial freedom for life. We believe that we are uniquely positioned in our markets because of our differentiated products, well-known brand and disciplined risk management. Our market position is supported by our efficient and scalable operating platform and industry-leading distribution network. We believe these core strengths will enable us to grow profitably as an aging, U.S. population transitions into retirement.
We earn revenues predominantly from fee income, spread income resulting from what we earn on investments versus the interest we credit to contract holders, and margins on other insurance products. Our profitability is dependent on our ability to properly price and manage risk on insurance and annuity products, to manage our portfolio of investments effectively, and to control costs through expense discipline.
Due to funds withheld reinsurance arrangements, including the Athene Reinsurance Transaction, we hold significant assets whose investment performance accrues to the benefit of the related reinsurer.
We experience net income volatility due to the fact that we do not directly use hedging to offset the movement in our U.S. Generally Accepted Accounting Principles ("GAAP") market risk benefit liabilities as market conditions change from period to period. Our core dynamic hedging program seeks to offset changes in the economic liability associated with variable annuity guaranteed benefits due to market movements, while our macro hedging program seeks to protect statutory capital under a range of stress scenarios. We do not directly seek to offset the movement in our market risk benefit liabilities from changes in market conditions. As a result, the changes in the fair value of the derivatives used as part of our overall hedging program are not expected to match the movements in the market risk benefit liabilities resulting in volatility from changes in fair value recorded to net income. Accordingly, we evaluate and manage the performance of our business using Adjusted Operating Earnings, a non-GAAP financial measure that reduces the impact of market volatility by excluding changes in fair value of freestanding and embedded derivative instruments, market risk benefits and other items. See “Non-GAAP Financial Measures” below for information regarding our non-GAAP financial measures and reconciliations to the most comparable U.S. GAAP measures.
44
Part II | Item 7. Management’s Discussion and Analysis of Financial Condition and Results of Operations |
Executive Summary
We manage our business through three segments: Retail Annuities, Institutional Products, and Closed Life and Annuity Blocks. We report certain activities and items that are not included in these segments, including the results of PPM Holdings, Inc., the holding company of PPM America Inc. ("PPM"), which manages the majority of our general account investment portfolio, in Corporate and Other. See Item 8. Financial Statements and Supplementary Data — Note 3 - Segment Information of Notes to Condensed Consolidated Financial Statements for further information on our segments.
An understanding of several key operating measures, including sales, account value, net flows, benefit base and assets under management ("AUM"), is helpful in evaluating our results. See “Key Operating Measures” below. Finally, we are affected by various economic, industry and regulatory trends, which are described below under “Macroeconomic, Industry and Regulatory Trends.”
The table below presents selected financial and operating measures:
| Years Ended December 31, | ||||||||||||||
| 2023 | 2022 | |||||||||||||
| (in millions, except percentages) | ||||||||||||||
| Total Sales | $ | 13,898 | $ | 18,135 | ||||||||||
| Assets Under Management ("AUM") | 315,838 | 290,549 | ||||||||||||
| Net income (loss) attributable to Jackson Financial Inc. common shareholders | 899 | 6,186 | ||||||||||||
Adjusted Operating Earnings (1) | 1,073 | 1,454 | ||||||||||||
| Capital Returned to Common Shareholders | 464 | 482 | ||||||||||||
| Return on Equity ("ROE") Attributable to Common Shareholders | 10.3 | % | 69.7 | % | ||||||||||
Adjusted Operating ROE Attributable to Common Shareholders on average adjusted book value (1) | 10.6 | % | 16.2 | % | ||||||||||
Jackson statutory risk-based capital (2) | 624 | % | 544 | % | ||||||||||
(1) Non-GAAP Financial Measure. See “Non-GAAP Financial Measures” below for information regarding our non-GAAP financial measures and reconciliations to the most comparable U.S. GAAP measures.
(2) Based on a Company Action Level basis.
Recent Events of Note
•Capital Returned to Common Shareholders: During 2023, we returned $464 million to our common shareholders consisting of $209 million in dividends and $255 million in common share repurchases. Our capital return target for common shareholders for 2023 was $450-$550 million. Share repurchases, net of issuances for our share-based compensation, have reduced our outstanding shares of common stock from 82,690,098 at December 31, 2022 to 78,660,221 at December 31, 2023. See Item 8. Financial Statement and Supplementary Data -- Note 24 - Equity of Notes to Consolidated Financial Statements for further information on our share repurchases.
•RILA Product: In the fourth quarter of 2021, our primary life insurance subsidiary, Jackson, successfully launched Jackson Market Link ProSM and Jackson Market Link Pro AdvisorySM, a commission and an advisory based suite of registered index-linked annuities ("RILA"). In the second quarter of 2023, we enhanced our RILA suite of products with the launch of Jackson Market Link ProSM II and Jackson Market Link Pro AdvisorySM II. See “Key Operating Measures – Sales” below for information regarding RILA sales.
•2023 Annual Assumption Updates: Consistent with prior years, we completed our annual actuarial assumptions review in the fourth quarter of 2023. See “Policy and Contract Liabilities – Actuarial Assumption Changes (Unlocking)” below and Item 8. Financial Statements and Supplementary Data -- Note 12 - Market Risk Benefits of Notes to Consolidated Financial Statements for further information regarding the notable assumption change updates included in the MRB calculation.
45
Part II | Item 7. Management’s Discussion and Analysis of Financial Condition and Results of Operations |
Executive Summary
•Inflation Reduction Act of 2022 ("IRA"): As discussed in Item 8. Note 15 - Income Taxes of Notes to Consolidated Financial Statements in this report, a new corporate alternative minimum tax (“CAMT”) based on adjusted financial statement income, rather than reported taxable income, became effective January 1, 2023. We are subject to the CAMT in 2023. Any CAMT incurred is treated as a taxable temporary difference, and recorded as a deferred tax asset ("DTA"). We have determined that a valuation allowance against the DTA is not currently required therefore there is no direct impact on total income tax expense; although it could affect our cash tax liabilities. As of December 31, 2023, the Company has recorded an estimate of $263 million for the provision for the CAMT based on the Company's interpretation of guidance with an offsetting increase to the deferred tax asset for the credit carryover resulting in no impact to total tax expense. The calculation of adjusted financial statement income, and therefore the CAMT, is subject to the issuance of regulatory guidance by the U.S. Department of the Treasury, which may materially change the estimated provision for the CAMT. We continue to monitor developments and regulations associated with the IRA for any potential future impacts on our business, financial condition, results of operations and cash flows.
•Brooke Life Reinsurance Company (“Brooke Re”): During the first quarter of 2024, Jackson entered into a 100% coinsurance with funds withheld reinsurance transaction with Brooke Re with all economics of the transaction effective as of January 1, 2024. Jackson and Brooke Re are both direct subsidiaries of Brooke Life. The transaction provides for the cession from Jackson to Brooke Re of liabilities associated with certain guaranteed benefit riders under our variable annuity contracts and similar products of Jackson (“market risk benefits”), both in-force on the effective date of the reinsurance agreement and written in the future (i.e., on a “flow” basis) as well as related future fees, claims and other benefits, and maintenance expenses in exchange for a ceding commission for the in-force business. Jackson retains the variable annuity base contract, the annuity contract administration of the ceded business, and responsibility for investment management of the assets in the funds withheld account supporting the ceded liabilities. Brooke Re paid a ceding commission of approximately $1.2 billion to Jackson in connection with the execution of the reinsurance transaction. The reinsurance transaction eliminates upon consolidation at JFI. Holding company liquidity at JFI was not impacted by the transactions.
Brooke Re is a Michigan captive insurer regulated by the Michigan Department of Insurance and Financial Services and created in the first quarter of 2024 for the express purpose of serving as the counterparty to the reinsurance transaction previously described with Jackson. Brooke Re was capitalized with assets contributed from Brooke Life of approximately $1.9 billion originating from Jackson as a return of capital to Brooke Life. Brooke Re will utilize a modified GAAP approach primarily related to market risk benefits, with the intent to increase alignment between assets and liabilities in response to changes in economic factors.
The transaction allows us to mitigate the impact of the cash surrender value floor on Jackson’s total adjusted capital, statutory required capital, and risk-based capital ratio, as well as to allow for more efficient economic hedging of the underlying risks of Jackson’s business. This outcome will serve the interests of policyholders by protecting statutory capital through diminished non-economic hedging and related costs. Overall, this transaction allows us to optimize our hedging, stabilize capital generation, and produce more predictable financial results going forward.
46
Part II | Item 7. Management’s Discussion and Analysis of Financial Condition and Results of Operations |
Key Operating Measures
Key Operating Measures
We use a number of operating measures, discussed below, which management believes provide useful information about our businesses and the operational factors underlying our financial performance.
Sales
Sales of annuities and institutional products include all money deposited by customers into new and existing contracts. We believe sales statistics are useful to gaining an understanding of, among other things, the attractiveness of our products, how we can best meet our customers’ needs, evolving industry product trends and the performance of our business from period to period.
| Years Ended December 31, | ||||||||||||||||||||
| 2023 | 2022 | 2021 | ||||||||||||||||||
| (in millions) | ||||||||||||||||||||
| Sales | ||||||||||||||||||||
| Variable annuities | $ | 9,540 | $ | 13,638 | $ | 19,073 | ||||||||||||||
| RILA | 2,890 | 1,811 | 108 | |||||||||||||||||
| Fixed Index Annuities | 210 | 126 | 115 | |||||||||||||||||
Fixed Annuities(1) | 193 | 162 | 33 | |||||||||||||||||
| Total Retail Annuity Sales | 12,833 | 15,737 | 19,329 | |||||||||||||||||
| Total Institutional Product Sales | 1,065 | 2,398 | 475 | |||||||||||||||||
| Total Sales | $ | 13,898 | $ | 18,135 | $ | 19,804 | ||||||||||||||
(1) Includes payout annuities | ||||||||||||||||||||
For the year ended December 31, 2023, total sales decreased significantly compared to the year ended December 31, 2022. Lower retail sales were primarily due to decreased sales of our variable annuities with lifetime living benefits, partially offset by RILA sales. Sales of fixed index and fixed annuities increased in 2023 due to the higher interest rate environment, which enabled more favorable pricing actions. In addition, sales of our institutional products were lower compared to the year ended December 31, 2022, reflecting our opportunistic approach to this business, depending on both the risk-adjusted return on investment opportunities available and the prevailing cost of funding required by purchasers.
47
Part II | Item 7. Management’s Discussion and Analysis of Financial Condition and Results of Operations |
Key Operating Measures
Account Value
Account value ("AV") generally equals the account value of our variable annuities, RILA, fixed index annuities, fixed annuities, interest sensitive life, and institutional products. It reflects the total amount of customer invested assets that have accumulated within a respective product and equals cumulative customer contributions, which includes gross deposits or premiums, plus accrued credited interest plus or minus the impact of market movements, as applicable, less withdrawals and various fees. We believe account value is a useful metric in providing an understanding of, among other things, the sources of potential fee and spread income generation, potential benefit obligations and risk management priorities.
| December 31, | |||||||||||
| 2023 | 2022 | ||||||||||
| (in millions) | |||||||||||
| Account Value | |||||||||||
| GMWB For Life | $ | 166,688 | $ | 149,706 | |||||||
| GMWB | 6,092 | 5,674 | |||||||||
| GMIB | 1,352 | 1,356 | |||||||||
| No Living Benefits | 53,645 | 49,073 | |||||||||
| Total Variable Annuity Account Value | 227,777 | 205,809 | |||||||||
| RILA | 5,219 | 1,875 | |||||||||
Fixed Index Annuity (1) | 622 | 415 | |||||||||
Fixed Annuity (1) | 1,218 | 1,219 | |||||||||
Total Fixed & Fixed Index Annuity Account Value (1) | 1,840 | 1,634 | |||||||||
Payout Annuity(1) | $ | 629 | $ | 649 | |||||||
Total Retail Annuities Account Value(1) | $ | 235,465 | $ | 209,967 | |||||||
| Total Institutional Products Account Value | $ | 8,406 | $ | 9,019 | |||||||
Total Closed Life and Annuity Blocks Account Value (1) | $ | 8,032 | $ | 8,288 | |||||||
(1) Net of reinsurance | |||||||||||
48
Part II | Item 7. Management’s Discussion and Analysis of Financial Condition and Results of Operations |
Key Operating Measures
Net Flows
Net flows represent the net change in customer account balances during a period, reflecting gross premiums received and surrenders, withdrawals and benefits payments. Net flows exclude investment performance, interest credited to customer accounts, transfers between fixed and variable benefits for variable annuities and policy charges. We believe net flows is a useful metric in providing an understanding of, among other things, sales, ongoing premiums and deposits, the changes in account value from period to period, sources of potential fee and spread income and policyholder behavior.
| Years Ended December 31, | ||||||||||||||||||||
| 2023 | 2022 | 2021 | ||||||||||||||||||
| (in millions) | ||||||||||||||||||||
| Net Flows: | ||||||||||||||||||||
| Variable Annuity | $ | (9,277) | $ | (2,407) | $ | (1,011) | ||||||||||||||
| RILA | 2,820 | 1,803 | 108 | |||||||||||||||||
Fixed Index Annuity (1) | 199 | 124 | 106 | |||||||||||||||||
Fixed Annuity (1) | (11) | 90 | 13 | |||||||||||||||||
Payout Annuity (1) | (69) | (79) | (81) | |||||||||||||||||
Total Retail Annuities Net Flows (1) | (6,338) | (469) | (865) | |||||||||||||||||
| Net flows ceded to Athene | (4,063) | (3,182) | (2,521) | |||||||||||||||||
| Total Retail Annuities net flows, gross of reinsurance | $ | (10,401) | $ | (3,651) | $ | (3,386) | ||||||||||||||
| Total Institutional Products Net Flows | $ | (985) | $ | 40 | $ | (2,440) | ||||||||||||||
Total Closed Life and Annuity Blocks Net Flows (1) | $ | (273) | $ | (270) | $ | (250) | ||||||||||||||
(1) Net of reinsurance | ||||||||||||||||||||
Net flows, net of reinsurance, decreased for the year ended December 31, 2023, compared to the year ended December 31, 2022, driven by the decreased variable annuity sales coupled with increased variable annuity surrenders and withdrawals, partially offset by increased RILA sales. Variable annuity net flows were more than offset by an increase in AUM, as defined below, due to market performance in 2023.
49
Part II | Item 7. Management’s Discussion and Analysis of Financial Condition and Results of Operations |
Key Operating Measures
Benefit Base
Benefit base refers to a notional amount that represents the value of a customer’s guaranteed benefit and, therefore, may be a different value from the invested assets in a customer’s account value. The benefit base may be used to calculate the fees for a customer’s guaranteed benefits within an annuity contract. The guaranteed death benefit and guaranteed living benefit within the same contract may not have the same benefit base. We believe benefit base is a useful metric for our variable annuity policies in providing an understanding of, among other things, fee income generation, potential optional guarantee benefit obligations and risk management priorities. The following table shows variable annuity account value and benefit base as of December 31, 2023 and 2022:
| Years Ended December 31, | |||||||||||||||||||||||||||||
| 2023 | 2022 | ||||||||||||||||||||||||||||
| Account Value | Benefit Base | Account Value | Benefit Base | ||||||||||||||||||||||||||
| (in millions) | |||||||||||||||||||||||||||||
| No Living Benefits | $ | 53,645 | N/A | $ | 49,073 | N/A | |||||||||||||||||||||||
| By Guaranteed Living Benefits: | |||||||||||||||||||||||||||||
| GMWB for Life | 166,688 | 188,722 | 149,706 | 189,814 | |||||||||||||||||||||||||
| GMWB | 6,092 | 5,348 | 5,674 | 5,655 | |||||||||||||||||||||||||
GMIB (1) | 1,352 | 1,799 | 1,356 | 1,929 | |||||||||||||||||||||||||
| Total | $ | 227,777 | $ | 195,869 | $ | 205,809 | $ | 197,398 | |||||||||||||||||||||
| By Guaranteed Death Benefit: | |||||||||||||||||||||||||||||
| Return of AV (No GMDB) | $ | 27,486 | N/A | $ | 25,049 | N/A | |||||||||||||||||||||||
| Return of Premium | 174,841 | 137,287 | 157,339 | 138,419 | |||||||||||||||||||||||||
| Highest Anniversary Value ("HAV") | 13,213 | 13,522 | 12,128 | 14,272 | |||||||||||||||||||||||||
| Rollup | 3,347 | 4,484 | 3,229 | 4,695 | |||||||||||||||||||||||||
| Combination HAV/Rollup | 8,890 | 10,057 | 8,064 | 10,297 | |||||||||||||||||||||||||
| Total | $ | 227,777 | $ | 165,350 | $ | 205,809 | $ | 167,683 | |||||||||||||||||||||
(1) Substantially all our GMIB benefits are reinsured. | |||||||||||||||||||||||||||||
50
Part II | Item 7. Management’s Discussion and Analysis of Financial Condition and Results of Operations |
Key Operating Measures
Assets Under Management
AUM, or assets under management, refers to investment assets that are managed by one of our subsidiaries and includes: (i) assets managed by PPM, including our investment portfolio (but excluding assets held in funds withheld accounts for reinsurance transactions) and third-party assets (including our former parent and its affiliates) and (ii) the separate account assets of our Retail Annuities segment managed and administered by one of our subsidiaries, Jackson National Asset Management LLC ("JNAM"). Total AUM reflects exclusions between segments to avoid double counting. We believe AUM is a useful metric for understanding, among other things, the sources of our earnings, net investment income and performance of our invested assets, customer directed investments and risk management priorities.
| December 31, | |||||||||||
| 2023 | 2022 | ||||||||||
| (in millions) | |||||||||||
| Jackson Invested Assets | $ | 44,068 | $ | 44,486 | |||||||
| Third Party Invested Assets (including CLOs) | 29,043 | 26,993 | |||||||||
| Total PPM AUM | 73,111 | 71,479 | |||||||||
| Total JNAM AUM | 242,727 | 219,070 | |||||||||
| Total AUM | $ | 315,838 | $ | 290,549 | |||||||
Total AUM increased for the year ended December 31, 2023, compared to the year ended December 31, 2022, driven primarily by an increase in separate account balances managed by JNAM due to positive equity market returns during the year.
Macroeconomic, Industry and Regulatory Trends
We discuss a number of trends and uncertainties below that we believe could materially affect our future business performance, including our results of operations, our investments, our cash flows, and our capital and liquidity position.
Macroeconomic and Financial Market Conditions
Our business and results of operations are affected by macroeconomic factors. The level of interest rates and shape of the yield curve, credit and equity market performance and equity volatility, regulation, tax policy, the level of U.S. employment, inflation and the overall U.S. economic growth rate can affect both our short- and long-term profitability. Monetary and fiscal policy in the U.S., or similar actions in foreign nations, could result in increased volatility in financial markets, including interest rates, currencies and equity markets, and could impact our business in both the short- and medium-term. Government actions, including responses to future pandemics, civil unrest, tariffs or other barriers to international trade, and the effects that these or other government events could have on levels of U.S. economic activity, could also impact our business through any of their individual impacts on consumers’ behavior or on financial markets.
In the short- to medium-term, the potential for increased volatility could pressure sales and reduce demand for our products as consumers consider purchasing alternative products to meet their objectives. Our financial performance can be adversely affected by market volatility and equity market declines if fees assessed on the account value of our annuities fluctuate, hedging costs increase and revenues decline due to reduced sales and increased outflows.
In early March through late April 2023, several regional U.S. banks were taken over by federal regulators with the Federal Deposit Insurance Corporation ("FDIC") named as the receiver. These bank failures raised concern among investors and depositors regarding the solvency and liquidity of regional banks across the country, leading to increased stress on the banking sector. Except for assets held as part of reinsurance arrangements within our funds withheld portfolios, where the Company does not have direct exposure to default risk, the Company's general account portfolio had no exposure to Silicon Valley Bank ("SVB"), Signature Bank, First Republic Bank, and Credit Suisse Additional Tier 1 debt as of December 31, 2023.
Equity Market Environment
Our financial performance is impacted by equity market performance. On our variable annuities, the fees we earn that are not associated with guaranteed benefits are mainly based on the account value, which changes with equity market levels. In addition, our hedges could be less effective in periods of large directional movements or we could experience more frequent or more costly rebalancing in periods of high volatility, which would lead to adverse performance versus our
51
Part II | Item 7. Management’s Discussion and Analysis of Financial Condition and Results of Operations | Macroeconomic, Industry and Regulatory Trends
hedge targets and increased hedging costs. Further, we also are exposed to basis risk, which results from our inability to purchase or sell hedge assets whose performance is directly correlated to the performance of the funds into which customers allocate their assets. We make available to customers funds where we believe we can transact in sufficiently correlated hedge assets, yet we anticipate some variance in the performance of our hedge assets and customer funds. This variance may result in our hedge assets outperforming or underperforming the customer assets they are intended to match. This variance may be exacerbated during periods of high volatility, leading to a mismatch in our hedge results relative to our hedge targets and U.S GAAP results.
Interest Rate Environment
The interest rate environment has affected, and will continue to affect, our business and financial performance for the following reasons:
•Periods of sharp rises in interest rates, as we have seen as a result of the Federal Reserve’s past actions, impact investment-related activity including investment income returns, net investment spread results, new money rates, mortgage loan prepayments, and bond redemptions. Due to increases in interest rates, the yield on new investments has generally exceeded the yield on asset maturities and redemptions (runoff yield). Rising interest rates also impact the hedging results of our variable annuity business as the market value of interest rate hedges decline, thereby driving immediate hedging losses. We would expect lower hedging costs and reduced levels of hedging going forward after such an increase in rates. Further, we expect near-term hedging losses from rising rates may be more than offset by changes in the fair value of the related guaranteed benefit liabilities, which are reduced with an increase in interest rates due to the higher discount rate.
•Interest rate increases also expose us to disintermediation risk, where higher rates make currently sold fixed annuity products more attractive while simultaneously reducing the market value of assets backing our liabilities. This creates an incentive for our customers to lapse their products in an environment where selling assets causes us to realize losses.
•In the past, our statutory total adjusted capital ("TAC") has been negatively impacted by rising rates due to minimum required reserving levels (i.e., cash surrender value floor) when reserve releases are limited and unable to offset interest rate hedging losses. The risk-based capital, or RBC, ratio increased or decreased depending on the interaction between movements in TAC and movements in statutory required capital (the company action level, or "CAL”); such movements can impact available dividends from our insurance subsidiaries. We expect the Brooke Re transaction to largely moderate the impact of the cash surrender value floor going forward. See Executive Summary above for more information regarding the Brooke Re Transaction.
•Low interest rate environments could also subject us to increased hedging costs or an increase in the amount of statutory reserves that our insurance subsidiaries are required to hold for optional guaranteed benefits, decreasing statutory surplus, which would adversely affect our insurance subsidiaries' ability to pay dividends. In addition, low interest rates could also increase the perceived value of optional guaranteed benefit features to our customers, which in turn could lead to a higher utilization of withdrawal or annuitization features of annuity policies and higher persistency of those products over time.
•Some of our annuities have guaranteed minimum interest crediting rates (“GMICRs”) that limit our ability to reduce crediting rates. If earnings on our investment portfolio decline, those GMICRs may result in net investment spread compression that negatively impacts earnings. Many of our annuities have GMICRs that reset at contractually specified times after issue, subject to a contractually specified minimum GMICR. In a rising interest rate environment, these GMICRs can increase over time. Conversely, in a falling interest rate environment the interest crediting rate will eventually decrease; however, there may be a lag between interest rate movements and the GMICR reset, temporarily limiting our ability to lower crediting rates. When policies have comparatively high GMICRs, in a subsequent low interest rate environment more customers are expected to hold on to their policies, which may result in lower lapses than previously expected.
Credit Market Environment
Conditions in fixed income markets impact our financial performance. As credit spreads widen, the fair value of our existing investment portfolio generally decreases, although we generally expect the widening spreads to increase the yield on new fixed income investments. Conversely, as credit spreads tighten, the fair value of our existing investment portfolio
52
Part II | Item 7. Management’s Discussion and Analysis of Financial Condition and Results of Operations | Macroeconomic, Industry and Regulatory Trends
generally increases, and the yield available on new investment purchases decreases. While changing credit spreads impact the fair value of our investment portfolio, this revaluation is generally reflected in our accumulated other comprehensive income, or AOCI. The revaluation will impact net income for realized gains or losses from the sale of securities, the change in fair value of trading securities or securities carried at fair value under the fair value election, or potential changes in the allowance for credit loss ("ACL"). In addition, if credit conditions deteriorate due to a recession or other negative credit events in capital markets, we could experience an increase in defaults and other-than-temporary-impairments (“OTTI”).
OTTI in our underlying investments would result in a reduction in TAC held by our insurance company subsidiaries. Also, shifts in the credit quality or credit rating downgrades of our investments as a result of stressed credit conditions may also impact the level of regulatory required statutory capital for our insurance company subsidiaries. As such, significant credit rating downgrades along with elevated defaults and OTTI losses would negatively impact our RBC ratio, which could impact available dividends from our insurance subsidiaries.
Pandemics and Other Public Health Crises
The COVID-19 pandemic disrupted our business and contributed to additional operating costs in prior years. Other similar pandemics, epidemics or disease outbreaks in the U.S. or globally could disrupt our business by affecting how we protect and interact with our critical workforce, customers, key vendors, third-party suppliers, or counterparties with whom we transact. Disruption could result from an inability of those persons to work or transact effectively due to illness, quarantines, and government actions in response to public health emergencies. The extent and severity of governmental actions will necessarily depend on the extent and severity of the perceived emergency. We have risk management plans in place and were able to navigate through COVID-19 with remote and hybrid work environments; however, those plans may be challenged by a new public health emergency.
Consumer Behavior
We believe that many retirees look to tax-efficient savings products as a tool for addressing their unmet need for retirement planning. We believe our products are well-positioned to meet this increasing consumer demand. However, consumer behavior may be impacted by increased economic uncertainty, unemployment rates, declining equity markets, significant changes in interest rates and increased volatility of financial markets. In recent years, we have introduced new products to better address changes in consumer demand and targeted distribution channels that meet changes in consumer preferences.
Demographics
We expect demographic trends in the U.S. population, in particular the increase in the number of retirement age individuals, to generate significant demand for our products. In addition, the potential risk to government social safety net programs and shifting of responsibility for retirement planning and financial security from employers and other institutions to employees, highlight the need for individuals to plan for their long-term financial security and will create additional opportunities to generate sustained demand for our products. We believe we are well-positioned to capture the increased demand generated by these demographic trends.
Regulatory Policy
We operate in a highly regulated industry. Our insurance company subsidiaries are regulated primarily at the state level, with some policies and products also subject to federal regulation. New federal and state regulations could impact our business model, including statutory reserve and capital requirements. Our ability to respond to changes in regulation and other legislative activity are critical to our long-term financial performance. The following regulations could materially impact our business:
Department of Labor Fiduciary Advice Rule
See Part I, Item I Business—Regulation—"Federal Initiatives Impacting Insurance Companies—Department of Labor’s Fiduciary Advice Rule" for a discussion of the 2023 Fiduciary Advice Rule.
Legislative Reforms
In recent years, Congress approved legislation beneficial to our business model. The Setting Every Community Up for Retirement Enhancement Act of 2019 (the "SECURE Act"), approved by Congress on December 20, 2019, provides
53
Part II | Item 7. Management’s Discussion and Analysis of Financial Condition and Results of Operations | Macroeconomic, Industry and Regulatory Trends
individuals with greater access to retirement products. Namely, it made it easier for 401(k) programs to offer annuities as an investment option by, among other things, creating a statutory safe harbor in ERISA for a retirement plan’s selection of an annuity provider. On December 29, 2022, Congress signed into law the SECURE 2.0 Act of 2022 (“SECURE 2.0”). SECURE 2.0 expands automatic enrollment programs, increases the age for required minimum distributions, and eliminates age requirements for traditional IRA contributions. These changes are intended to expand and increase Americans’ retirement savings.
Tax Laws
Our annuities offer investors the opportunity to benefit from tax deferrals. If U.S. tax laws change such that our annuities no longer offer tax-deferred advantages, demand for our products could materially decrease.
Non-GAAP Financial Measures
In addition to presenting our results of operations and financial condition in accordance with U.S. GAAP, we use and report selected non-GAAP financial measures. Management believes that the use of these non-GAAP financial measures, together with relevant U.S. GAAP financial measures, provides a better understanding of our results of operations, financial condition and the underlying performance drivers of our business. These non-GAAP financial measures should be considered supplementary to our results of operations and financial condition that are presented in accordance with U.S. GAAP and should not be viewed as a substitute for the U.S. GAAP financial measures. Other companies may use similarly titled non-GAAP financial measures that are calculated differently from the way we calculate such measures. Consequently, our non-GAAP financial measures may not be comparable to similar measures used by other companies. These non-GAAP financial measures should not be viewed as substitutes for the most directly comparable financial measures calculated in accordance with U.S. GAAP.
Adjusted Operating Earnings
Adjusted Operating Earnings is an after-tax non-GAAP financial measure, which we believe should be used to evaluate our financial performance on a consolidated basis by excluding certain items that may be highly variable from period to period due to accounting treatment under U.S. GAAP or that are non-recurring in nature, as well as certain other revenues and expenses that we do not view as driving our underlying performance. Adjusted Operating Earnings should not be used as a substitute for net income as calculated in accordance with U.S. GAAP. However, we believe the adjustments to net income are useful for gaining an understanding of our overall results of operations.
Adjusted Operating Earnings equals our Net income (loss) attributable to Jackson Financial Inc.'s common shareholders (which excludes income attributable to non-controlling interest and dividends on preferred stock) adjusted to eliminate the impact of the items described in the following numbered paragraphs. These items are excluded as they may vary significantly from period to period due to near-term market conditions or are otherwise not directly comparable or reflective of the underlying performance of our business. We believe these exclusions provide investors a better picture of the drivers of our underlying performance.
1.Net Hedging Results: Comprised of: (i) fees attributed to guaranteed benefits; (ii) changes in the fair value of freestanding derivatives used to manage the risk associated with market risk benefits and other guaranteed benefit features, excluding earned income (periodic settlements and changes in settlement accruals); (iii) the movements in reserves, market risk benefits, guaranteed benefit features accounted for as embedded derivative instruments, and related claims and benefit payments; (iv) amortization of the balance of unamortized deferred acquisition costs at the date of transition to current accounting guidance on January 1, 2021 associated with items excluded from adjusted operating earnings prior to transition; and (v) the impact on the valuation of Guaranteed Benefits and Net Hedging Results arising from changes in underlying actuarial assumptions. We believe excluding these items removes the impact to both revenue and related expenses associated with Guaranteed Benefits and Net Hedging Results.
2.Net Realized Investment Gains and Losses: Comprised of: (i) realized investment gains and losses associated with the periodic sales or disposals of securities, excluding those held within our trading portfolio, and (ii) impairments of securities, after adjustment for the non-credit component of the impairment charges.
54
Part II | Item 7. Management’s Discussion and Analysis of Financial Condition and Results of Operations |
Non-GAAP Financial Measures
3.Change in Value of Funds Withheld Embedded Derivative and Net investment income on funds withheld assets: Composed of: (i) the change in fair value of funds withheld embedded derivatives, and (ii) net investment income on funds withheld assets related to funds withheld reinsurance transactions.
4.Other items: Comprised of: (i) the impact of investments that are consolidated in our financial statements due to U.S. GAAP accounting requirements, such as our investments in collateralized loan obligations (CLOs), but for which the consolidation effects are not consistent with our economic interest or exposure to those entities, and (ii) one-time or other non-recurring items, such as costs relating to our separation from Prudential.
Operating income taxes are calculated using the prevailing corporate federal income tax rate of 21% while taking into account any items recognized differently in our financial statements and federal income tax returns, including the dividends received deduction and other tax credits. For interim reporting periods, the Company uses an estimated annual effective tax rate (“ETR”) in computing its tax provision including consideration of discrete items.
The following is a reconciliation of Adjusted Operating Earnings to net income (loss) attributable to Jackson Financial common shareholders, the most comparable U.S. GAAP measure:
| Years Ended December 31, | ||||||||||||||||||||
| 2023 | 2022 | 2021 | ||||||||||||||||||
| (in millions) | ||||||||||||||||||||
| Net income (loss) attributable to Jackson Financial Inc common shareholders | $ | 899 | $ | 6,186 | $ | 3,417 | ||||||||||||||
| Add: dividends on preferred stock | 35 | — | — | |||||||||||||||||
| Add: income tax expense (benefit) | 4 | 1,505 | 666 | |||||||||||||||||
| Pretax income (loss) attributable to Jackson Financial Inc | 938 | 7,691 | 4,083 | |||||||||||||||||
| Non-operating adjustments (income) loss: | ||||||||||||||||||||
| Guaranteed benefits and hedging results: | ||||||||||||||||||||
| Fees attributable to guarantee benefit reserves | (3,125) | (3,077) | (2,855) | |||||||||||||||||
| Net movement in freestanding derivatives | 4,651 | 2,744 | 5,674 | |||||||||||||||||
| Market risk benefits (gains) losses, net | (3,897) | (3,536) | (3,966) | |||||||||||||||||
| Net reserve and embedded derivative movements | 787 | 222 | 141 | |||||||||||||||||
| Amortization of DAC associated with non-operating items at date of transition to LDTI | 591 | 658 | 737 | |||||||||||||||||
| Total guaranteed benefits and net hedging results | (993) | (2,989) | (269) | |||||||||||||||||
| Net realized investment (gains) losses | 554 | 359 | (182) | |||||||||||||||||
| Net realized investment (gains) losses on funds withheld assets | 1,801 | (2,186) | 21 | |||||||||||||||||
| Net investment income on funds withheld assets | (1,174) | (1,254) | (1,188) | |||||||||||||||||
| Other items | 39 | 22 | 36 | |||||||||||||||||
| Total non-operating adjustments | 227 | (6,048) | (1,582) | |||||||||||||||||
| Pretax adjusted operating earnings | 1,165 | 1,643 | 2,501 | |||||||||||||||||
| Less: operating income tax expense (benefit) | 57 | 189 | 322 | |||||||||||||||||
| Adjusted operating earnings before dividends on preferred stock | 1,108 | 1,454 | 2,179 | |||||||||||||||||
| Less: dividends on preferred stock | 35 | — | — | |||||||||||||||||
| Adjusted operating earnings | $ | 1,073 | $ | 1,454 | $ | 2,179 | ||||||||||||||
Adjusted Book Value Attributable to Common Shareholders and Adjusted Operating ROE Attributable to Common Shareholders
We use Adjusted Operating Return on Equity ("ROE") Attributable to Common Shareholders to manage our business and evaluate our financial performance that: (i) excludes items that vary from period to period due to accounting treatment under U.S. GAAP or that are non-recurring in nature, as such items may distort the underlying performance of our business; and (ii) is calculated by dividing our Adjusted Operating Earnings by average Adjusted Book Value Attributable to Common Shareholders.
Adjusted Book Value Attributable to Common Shareholders excludes Preferred Stock and AOCI attributable to Jackson Financial, which does not include AOCI arising from investments held within the funds withheld account related to the Athene Reinsurance Transaction.
55
Part II | Item 7. Management’s Discussion and Analysis of Financial Condition and Results of Operations |
Non-GAAP Financial Measures
We exclude AOCI attributable to Jackson Financial from Adjusted Book Value Attributable to Common Shareholders because our invested assets are generally invested to closely match the duration of our liabilities, which are longer duration in nature, and, therefore we believe period-to-period fair market value fluctuations in AOCI to be inconsistent with this objective. We believe excluding AOCI attributable to Jackson Financial is more useful to investors in analyzing trends in our business. Changes in AOCI within the funds withheld account related to the Athene Reinsurance Transaction offset the related non-operating earnings from the Athene Reinsurance Transaction resulting in a minimal net impact on Adjusted Book Value of Jackson Financial.
Adjusted Book Value Attributable to Common Shareholders and Adjusted Operating ROE Attributable to Common Shareholders should not be used as substitutes for total shareholders’ equity and ROE as calculated using annualized net income and average equity in accordance with U.S. GAAP. However, we believe the adjustments to equity and earnings are useful to gaining an understanding of our overall results of operations.
The following is a reconciliation of Adjusted Book Value Attributable to Common Shareholders to total shareholders’ equity and a comparison of Adjusted Operating ROE Attributable to Common Shareholders to ROE Attributable to Common Shareholders, the most comparable U.S. GAAP measure:
| Years Ended December 31, | ||||||||||||||||||||
| 2023 | 2022 | 2021 | ||||||||||||||||||
| (in millions) | ||||||||||||||||||||
| Net income (loss) attributable to Jackson Financial Inc. common shareholders | $ | 899 | $ | 6,186 | $ | 3,417 | ||||||||||||||
| Adjusted Operating Earnings | 1,073 | 1,454 | 2,179 | |||||||||||||||||
| Total shareholders' equity | $ | 10,170 | $ | 8,646 | $ | 7,641 | ||||||||||||||
| Less: Preferred stock | 533 | — | — | |||||||||||||||||
| Total common shareholders' equity | 9,637 | 8,646 | 7,641 | |||||||||||||||||
| Adjustments to total common shareholders’ equity: | ||||||||||||||||||||
Exclude AOCI attributable to Jackson Financial Inc. (1) | 1,196 | 1,272 | (1,073) | |||||||||||||||||
| Adjusted Book Value Attributable to Common Shareholders | $ | 10,833 | $ | 9,918 | $ | 6,568 | ||||||||||||||
| ROE Attributable to Common Shareholders | 10.3 | % | 69.7 | % | 44.1 | % | ||||||||||||||
| Adjusted Operating ROE Attributable to Common Shareholders on average equity | 10.6 | % | 16.2 | % | 32.8 | % | ||||||||||||||
(1) Excludes $(1,612) million, $(2,106) million and $287 million related to the investments held within the funds withheld account related to the Athene Reinsurance Transaction as of December 31, 2023, 2022 and 2021, respectively, which are not attributable to Jackson Financial Inc. and are therefore not included as an adjustment to total shareholders’ equity in the reconciliation of Adjusted Book Value Attributable to Common Shareholders to total shareholders’ equity. | ||||||||||||||||||||
56
Part II | Item 7. Management’s Discussion and Analysis of Financial Condition and Results of Operations | Consolidated Results of Operations
Consolidated Results of Operations
The following table sets forth, for the periods presented, certain data from our Consolidated Income Statements. The information contained in the table below should be read in conjunction with our Consolidated Financial Statements and the related notes elsewhere in this report:
| Years Ended December 31, | ||||||||||||||||||||
| 2023 | 2022 | 2021 | ||||||||||||||||||
| (in millions) | ||||||||||||||||||||
| Revenues | ||||||||||||||||||||
| Fee income | $ | 7,680 | $ | 7,722 | $ | 8,059 | ||||||||||||||
| Premiums | 147 | 132 | 148 | |||||||||||||||||
| Net investment income: | ||||||||||||||||||||
| Net investment income excluding funds withheld assets | 1,756 | 1,507 | 2,236 | |||||||||||||||||
| Net investment income on funds withheld assets | 1,174 | 1,254 | 1,188 | |||||||||||||||||
| Total net investment income | 2,930 | 2,761 | 3,424 | |||||||||||||||||
| Net gains (losses) on derivatives and investments: | ||||||||||||||||||||
| Net gains (losses) on derivatives and investments | (5,864) | (3,023) | (5,344) | |||||||||||||||||
| Net gains (losses) on funds withheld reinsurance treaties | (1,801) | 2,186 | (21) | |||||||||||||||||
| Total net gains (losses) on derivatives and investments | (7,665) | (837) | (5,365) | |||||||||||||||||
| Other income | 67 | 85 | 94 | |||||||||||||||||
| Total revenues | 3,159 | 9,863 | 6,360 | |||||||||||||||||
| Benefits and Expenses | ||||||||||||||||||||
| Death, other policy benefits and change in policy reserves, net of deferrals | 965 | 1,062 | 925 | |||||||||||||||||
| (Gain) loss from updating future policy benefits cash flow assumptions, net | 102 | (34) | 41 | |||||||||||||||||
| Market risk benefits (gains) losses, net | (3,897) | (3,536) | (3,966) | |||||||||||||||||
| Interest credited on other contract holder funds, net of deferrals and amortization | 1,145 | 866 | 832 | |||||||||||||||||
| Interest expense | 185 | 113 | 37 | |||||||||||||||||
| Operating costs and other expenses, net of deferrals | 2,549 | 2,432 | 2,839 | |||||||||||||||||
| Amortization of deferred acquisition costs | 1,152 | 1,226 | 1,307 | |||||||||||||||||
| Total benefits and expenses | 2,201 | 2,129 | 2,015 | |||||||||||||||||
| Pretax income (loss) | 958 | 7,734 | 4,345 | |||||||||||||||||
| Income tax expense (benefit) | 4 | 1,505 | 666 | |||||||||||||||||
| Net income (loss) | 954 | 6,229 | 3,679 | |||||||||||||||||
| Less: Net income (loss) attributable to noncontrolling interests | 20 | 43 | 262 | |||||||||||||||||
| Net income (loss) attributable to Jackson Financial Inc. | 934 | 6,186 | 3,417 | |||||||||||||||||
| Less: Dividends on preferred stock | 35 | — | — | |||||||||||||||||
| Net income (loss) attributable to Jackson Financial Inc. common shareholders | $ | 899 | $ | 6,186 | $ | 3,417 | ||||||||||||||
57
Part II | Item 7. Management’s Discussion and Analysis of Financial Condition and Results of Operations | Consolidated Results of Operations
Year Ended December 31, 2023 compared to Year Ended December 31, 2022
Pretax Income (Loss)
Our pretax income (loss) decreased by $6,776 million to pretax income of $958 million for the year ended December 31, 2023, from $7,734 million for the year ended December 31, 2022, primarily due to:
•$6,828 million decrease in total net gains (losses) on derivatives and investments as shown in table below and driven by:
| Years Ended December 31, | ||||||||||||||||||||
| 2023 | 2022 | Variance | ||||||||||||||||||
| (in millions) | ||||||||||||||||||||
| Net gains (losses) excluding derivatives and funds withheld assets | $ | (554) | $ | (359) | $ | (195) | ||||||||||||||
| Net gains (losses) on freestanding derivatives | (4,804) | (2,704) | (2,100) | |||||||||||||||||
| Net gains (losses) on embedded derivatives (excluding funds withheld reinsurance) | (506) | 40 | (546) | |||||||||||||||||
| Net gains (losses) on derivative instruments | (5,310) | (2,664) | (2,646) | |||||||||||||||||
| Net gains (losses) on funds withheld reinsurance | (1,801) | 2,186 | (3,987) | |||||||||||||||||
| Total net gains (losses) on derivatives and investments | $ | (7,665) | $ | (837) | $ | (6,828) | ||||||||||||||
•Freestanding derivative losses on our equity derivatives were primarily driven by market increases in 2023, compared to decreases in the prior year, partially offset by gains within our interest rate related hedge instruments, reflecting relatively flat interest rate movements in 2023, compared to increasing rates in the prior year; and
•Losses recognized on funds withheld reinsurance were driven by slightly lower rates in 2023 compared to gains in the prior year due to the significant rise in interest rates during 2022.
•$279 million increase in interest credited on contract holder funds, net of deferrals, primarily due to an increase in GMICRs on variable annuity general account funds and higher crediting rates on new institutional business;
•$117 million increase in operating costs and other expenses, net of deferrals, primarily due to an increase in deferred and incentive compensation expenses during 2023 compared to the prior year;
•$72 million higher interest expense incurred during 2023 primarily related to interest on our repurchase agreements, senior notes, and other short-term borrowings;
•$42 million decrease in fee income primarily due to lower average separate account values compared to prior year; and
•$39 million increase in death, other policy benefits, and change in policy reserves, net of (gain) loss from updating future policy benefits cash flow assumptions, primarily due to the impact of actuarial assumption updates and a $31 million increase in our allowance for reinsurance credit losses related to a specific reinsurer that was recently ordered into liquidation, partially offset by improved mortality and a greater decrease in reserves due to the payout of persistency bonuses on a portion of the business. See "Policy and Contract Liabilities" below for further information regarding our actuarial assumption changes.
These decreases were partially offset by:
•$361 million favorable movements in market risk benefits (gains) losses, net, primarily driven by positive fund performance in the current year compared to declines in the prior year, as well as favorable changes in implied volatility, with offsetting unfavorable movements in interest rates in the current year; and
•$169 million increase in net investment income as a result of higher income on bonds and short-term investments, driven by higher yields in 2023, partially offset by higher expenses related to consolidation in 2023 and lower income on limited partnership investments, which are recorded on a one quarter lag.
Income Taxes
Income tax expense decreased $1,501 million to an expense of $4 million for the year ended December 31, 2023, from an expense of $1,505 million for the year ended December 31, 2022. The 2023 income tax expense represents an effective tax
58
Part II | Item 7. Management’s Discussion and Analysis of Financial Condition and Results of Operations | Consolidated Results of Operations
rate of 1%, versus a 2022 income tax expense that represents an effective income tax rate of 20%. The lower effective tax rate for December 31, 2023 compared to December 31, 2022 is due to lower pretax earnings with similar amounts of permanent benefits. Our effective tax rate typically varies from the marginal statutory rate of 21% due to the impact of permanent tax differences, such as dividends received deduction and foreign tax credits. See “Recent Events of Note – Inflation Reduction Act of 2022” above regarding the effect of the IRA on cash tax liabilities.
Segment Results of Operations
We manage our business through three segments: Retail Annuities, Institutional Products, and Closed Life and Annuity Blocks. We report certain activities and items that are not included in these segments, including the results of PPM Holdings, Inc., the holding company of PPM, within Corporate and Other. The following tables and discussion represent an overall view of our results of operations for each segment.
Pretax Adjusted Operating Earnings by Segment
The following table summarizes pretax adjusted operating earnings (non-GAAP) from the Company's business segment operations and also provides a reconciliation of the segment measure to net income on a consolidated GAAP basis. Also, see Item 8. Financial Statements and Supplementary Data - Note 3 - Segment Information of Notes to Consolidated Financial Statements for further information regarding the calculation of pretax adjusted operating earnings:
| Years Ended December 31, | ||||||||||||||||||||
| 2023 | 2022 | 2021 | ||||||||||||||||||
| (in millions) | ||||||||||||||||||||
| Pretax Adjusted Operating Earnings by Segment: | ||||||||||||||||||||
| Retail Annuities | $ | 1,364 | $ | 1,507 | $ | 2,184 | ||||||||||||||
| Institutional Products | 69 | 79 | 64 | |||||||||||||||||
| Closed Life and Annuity Blocks | (95) | 117 | 255 | |||||||||||||||||
| Corporate and Other | (173) | (60) | (2) | |||||||||||||||||
| Pretax Adjusted Operating Earnings | 1,165 | 1,643 | 2,501 | |||||||||||||||||
| Pre-tax reconciling items from adjusted operating income to net income (loss) attributable to Jackson Financial Inc.: | ||||||||||||||||||||
| Guaranteed benefits and hedging results: | ||||||||||||||||||||
| Fees attributable to guarantee benefit reserves | 3,125 | 3,077 | 2,855 | |||||||||||||||||
| Net movement in freestanding derivatives | (4,651) | (2,744) | (5,674) | |||||||||||||||||
| Market risk benefits gains (losses), net | 3,897 | 3,536 | 3,966 | |||||||||||||||||
| Net reserve and embedded derivative movements | (787) | (222) | (141) | |||||||||||||||||
| Amortization of DAC associated with non-operating items at date of transition to LDTI | (591) | (658) | (737) | |||||||||||||||||
| Total guaranteed benefits and net hedging results | 993 | 2,989 | 269 | |||||||||||||||||
| Net realized investment gains (losses) | (554) | (359) | 182 | |||||||||||||||||
| Net realized investment gains (losses) on funds withheld assets | (1,801) | 2,186 | (21) | |||||||||||||||||
| Net investment income on funds withheld assets | 1,174 | 1,254 | 1,188 | |||||||||||||||||
| Other items | (39) | (22) | (36) | |||||||||||||||||
| Total pre-tax reconciling items | (227) | 6,048 | 1,582 | |||||||||||||||||
| Pretax income (loss) attributable to Jackson Financial Inc. | 938 | 7,691 | 4,083 | |||||||||||||||||
| Income tax expense (benefit) | 4 | 1,505 | 666 | |||||||||||||||||
| Net income (loss) attributable to Jackson Financial Inc. | 934 | 6,186 | 3,417 | |||||||||||||||||
| Less: Dividends on preferred stock | 35 | — | — | |||||||||||||||||
| Net income (loss) attributable to Jackson Financial Inc. common shareholders | $ | 899 | $ | 6,186 | $ | 3,417 | ||||||||||||||
59
Part II | Item 7. Management’s Discussion and Analysis of Financial Condition and Results of Operations |
Segment Results of Operations
Retail Annuities
The following table sets forth, for the periods presented, certain data underlying the pretax adjusted operating earnings results for our Retail Annuities segment. The information contained in the table below should be read in conjunction with our Consolidated Financial Statements and the related notes appearing elsewhere in this report:
| Years Ended December 31, | ||||||||||||||||||||
| 2023 | 2022 | 2021 | ||||||||||||||||||
| (in millions) | ||||||||||||||||||||
| Retail Annuities: | ||||||||||||||||||||
| Operating Revenues | ||||||||||||||||||||
| Fee income | $ | 4,036 | $ | 4,108 | $ | 4,636 | ||||||||||||||
| Premiums | 21 | 10 | 15 | |||||||||||||||||
| Net investment income | 541 | 403 | 692 | |||||||||||||||||
| Income (loss) on operating derivatives | (45) | 17 | 52 | |||||||||||||||||
| Other income | 37 | 42 | 47 | |||||||||||||||||
| Total Operating Revenues | 4,590 | 4,580 | 5,442 | |||||||||||||||||
| Operating Benefits and Expenses | ||||||||||||||||||||
| Death, other policy benefits and change in policy reserves | 43 | 61 | 6 | |||||||||||||||||
| (Gain) loss from updating future policy benefits cash flow assumptions, net | (4) | (4) | 225 | |||||||||||||||||
| Interest credited on other contract holder funds, net of deferrals and amortization | 374 | 253 | (8) | |||||||||||||||||
| Interest expense | 84 | 32 | 22 | |||||||||||||||||
| Operating costs and other expenses, net of deferrals | 2,178 | 2,174 | 2,456 | |||||||||||||||||
| Amortization of deferred acquisition costs | 551 | 557 | 557 | |||||||||||||||||
| Total Operating Benefits and Expenses | 3,226 | 3,073 | 3,258 | |||||||||||||||||
| Pretax Adjusted Operating Earnings | $ | 1,364 | $ | 1,507 | $ | 2,184 | ||||||||||||||
The following table summarizes a roll-forward of activity affecting account value for our Retail Annuities segment for the periods indicated:
| Years Ended December 31, | ||||||||||||||||||||
| 2023 | 2022 | 2021 | ||||||||||||||||||
| (in millions) | ||||||||||||||||||||
| Retail Annuities Account Value: | ||||||||||||||||||||
| Balance as of beginning of period | $ | 209,967 | $ | 260,135 | $ | 230,741 | ||||||||||||||
| Premiums and deposits | 13,015 | 15,961 | 19,594 | |||||||||||||||||
| Surrenders, withdrawals, and benefits | (19,353) | (16,430) | (20,459) | |||||||||||||||||
| Net flows | (6,338) | (469) | (865) | |||||||||||||||||
| Investment performance | 33,807 | (47,149) | 32,621 | |||||||||||||||||
| Change in value of equity option | 509 | (41) | 7 | |||||||||||||||||
| Interest credited | 372 | 244 | 223 | |||||||||||||||||
| Policy charges and other | (2,852) | (2,753) | (2,592) | |||||||||||||||||
| Balance as of end of period, net of ceded reinsurance | 235,465 | 209,967 | 260,135 | |||||||||||||||||
| Ceded reinsurance | 18,370 | 22,037 | 25,075 | |||||||||||||||||
| Balance as of end of period, gross of reinsurance | $ | 253,835 | $ | 232,004 | $ | 285,210 | ||||||||||||||
Year Ended December 31, 2023 compared to Year Ended December 31, 2022
Pretax Adjusted Operating Earnings
Pretax adjusted operating earnings decreased $143 million to $1,364 million for the year ended December 31, 2023 from $1,507 million for the year ended December 31, 2022 primarily due to:
•$72 million decrease in fee income primarily due to lower average separate account values compared to prior year;
60
Part II | Item 7. Management’s Discussion and Analysis of Financial Condition and Results of Operations |
Segment Results of Operations
•$62 million decrease in income on operating derivatives primarily due to the increase in floating rates during 2023; and
•$52 million increase in interest expense incurred in the current year primarily related to interest on our repurchase agreements and other short-term borrowings.
These decreases were partially offset by:
•$18 million decrease in death, other policy benefits, and change in policy reserves, net of (gain) loss from updating future policy benefits cash flow assumptions, primarily due to lower other policyholder benefits in 2023; and
•$17 million increase in spread income primarily due to $138 million higher net investment income, partially offset by $121 million higher interest credited on contract holder funds driven by resetting GMICRs on variable annuity fixed rate options in the first quarter of 2023.
Account Value
Retail annuities account value, net of reinsurance, increased $25.5 billion between periods primarily due to positive variable annuity separate account returns driven by favorable market performance in 2023, as well as positive RILA net flows over the period.
Institutional Products
The following table sets forth, for the periods presented, certain data underlying the pretax adjusted operating earnings results for our Institutional Products segment. The information contained in the table below should be read in conjunction with our Consolidated Financial Statements and the related notes appearing elsewhere in this report:
| Years Ended December 31, | ||||||||||||||||||||
| 2023 | 2022 | 2021 | ||||||||||||||||||
| (in millions) | ||||||||||||||||||||
| Institutional Products: | ||||||||||||||||||||
| Operating Revenues | ||||||||||||||||||||
| Net investment income | $ | 474 | $ | 312 | $ | 260 | ||||||||||||||
| Income (loss) on operating derivatives | (50) | (22) | (3) | |||||||||||||||||
| Total Operating Revenues | 424 | 290 | 257 | |||||||||||||||||
| Operating Benefits and Expenses | ||||||||||||||||||||
| Interest credited on other contract holder funds, net of deferrals and amortization | 334 | 201 | 188 | |||||||||||||||||
| Interest expense | 16 | 5 | — | |||||||||||||||||
| Operating costs and other expenses, net of deferrals | 5 | 5 | 5 | |||||||||||||||||
| Total Operating Benefits and Expenses | 355 | 211 | 193 | |||||||||||||||||
| Pretax Adjusted Operating Earnings | $ | 69 | $ | 79 | $ | 64 | ||||||||||||||
The following table summarizes a roll-forward of activity affecting account value for our Institutional Products segment for the periods indicated:
| Years Ended December 31, | ||||||||||||||||||||
| 2023 | 2022 | 2021 | ||||||||||||||||||
| (in millions) | ||||||||||||||||||||
| Institutional Products: | ||||||||||||||||||||
| Balance as of beginning of period | $ | 9,019 | $ | 8,830 | $ | 11,138 | ||||||||||||||
| Premiums and deposits | 1,065 | 2,398 | 475 | |||||||||||||||||
| Surrenders, withdrawals, and benefits | (2,050) | (2,358) | (2,915) | |||||||||||||||||
| Net flows | (985) | 40 | (2,440) | |||||||||||||||||
| Credited Interest | 334 | 201 | 188 | |||||||||||||||||
| Policy Charges and other | 38 | (52) | (56) | |||||||||||||||||
| Balance as of end of period | $ | 8,406 | $ | 9,019 | $ | 8,830 | ||||||||||||||
61
Part II | Item 7. Management’s Discussion and Analysis of Financial Condition and Results of Operations |
Segment Results of Operations
Year Ended December 31, 2023 compared to Year Ended December 31, 2022
Pretax Adjusted Operating Earnings
Pretax adjusted operating earnings decreased $10 million to $69 million for the year ended December 31, 2023 from $79 million for the year ended December 31, 2022 primarily due to higher interest credited on new business and floating rate contract holder funds, decreased income on operating derivatives resulting from changes in currency exchange rates and the increase in floating rates in 2023, and higher interest expense, partially offset by higher investment income.
Account Value
Institutional product account value decreased from $9,019 million at December 31, 2022 to $8,406 million at December 31, 2023. The decrease in account value was driven by continued maturities of the existing contracts, partially offset by new issuances in 2023.
Closed Life and Annuity Blocks
The following table sets forth, for the periods presented, certain data underlying the pretax adjusted operating earnings results for our Closed Block Life and Annuity Blocks segment. The information contained in the table below should be read in conjunction with our Consolidated Financial Statements and the related notes appearing elsewhere in this report:
| Years Ended December 31, | ||||||||||||||||||||
| 2023 | 2022 | 2021 | ||||||||||||||||||
| (in millions) | ||||||||||||||||||||
| Closed Life and Annuity Blocks: | ||||||||||||||||||||
| Operating Revenues | ||||||||||||||||||||
| Fee income | $ | 457 | $ | 474 | $ | 492 | ||||||||||||||
| Premiums | 136 | 134 | 145 | |||||||||||||||||
| Net investment income | 689 | 706 | 950 | |||||||||||||||||
| Income (loss) on operating derivatives | (45) | 31 | 72 | |||||||||||||||||
| Other income | 25 | 35 | 39 | |||||||||||||||||
| Total Operating Revenues | 1,262 | 1,380 | 1,698 | |||||||||||||||||
| Operating Benefits and Expenses | ||||||||||||||||||||
| Death, other policy benefits and change in policy reserves | 641 | 734 | 752 | |||||||||||||||||
| (Gain) loss from updating future policy benefits cash flow assumptions, net | 106 | (24) | 419 | |||||||||||||||||
| Interest credited on other contract holder funds, net of deferrals and amortization | 437 | 412 | 80 | |||||||||||||||||
| Operating costs and other expenses, net of deferrals | 163 | 130 | 179 | |||||||||||||||||
| Amortization of deferred acquisition costs | 10 | 11 | 13 | |||||||||||||||||
| Total Operating Benefits and Expenses | 1,357 | 1,263 | 1,443 | |||||||||||||||||
| Pretax Adjusted Operating Earnings | $ | (95) | $ | 117 | $ | 255 | ||||||||||||||
Year Ended December 31, 2023 compared to Year Ended December 31, 2022
Pretax Adjusted Operating Earnings
Pretax adjusted operating earnings decreased $212 million to $(95) million for the year ended December 31, 2023 from $117 million for the year ended December 31, 2022 primarily due to:
•$76 million decrease in income on operating derivatives primarily due to the increase in floating rates during 2023;
•$37 million increase in death, other policy benefits, and change in policy reserves, net of (gain) loss from updating future policy benefits cash flow assumptions, primarily due to the impact of actuarial assumption updates and a $31 million increase in our allowance for reinsurance credit losses related to a specific reinsurer which was recently ordered into liquidation, partially offset by improved mortality and a greater decrease in reserves due to
62
Part II | Item 7. Management’s Discussion and Analysis of Financial Condition and Results of Operations |
Segment Results of Operations
the payout of persistency bonuses on a portion of the business. See “Policy and Contract Liabilities” below for further information regarding our actuarial assumption changes;
•$33 million increase in operating costs and other expenses, net of deferrals, primarily due to higher commissions, net of deferrals, related to persistency bonuses in 2023, and an increase in incentive compensation expenses compared to the prior year; and
•$25 million increase in interest credited on other contract holder funds related to persistency bonuses in 2023.
Corporate and Other
Corporate and Other includes the operations of PPM Holdings, Inc., the holding company of PPM, and unallocated corporate revenue and expenses, as well as certain eliminations and consolidation adjustments. The following table sets forth, for the periods presented, certain data underlying the pretax adjusted operating earnings results for Corporate and Other. The information contained in the table below should be read in conjunction with our Consolidated Financial Statements and the related notes appearing elsewhere in this report:
| Years Ended December 31, | ||||||||||||||||||||
| 2023 | 2022 | 2021 | ||||||||||||||||||
| (in millions) | ||||||||||||||||||||
| Corporate and Other: | ||||||||||||||||||||
| Operating Revenues | ||||||||||||||||||||
| Fee income | $ | 52 | $ | 52 | $ | 65 | ||||||||||||||
| Net investment income | 71 | 65 | 55 | |||||||||||||||||
| Income (loss) on operating derivatives | (13) | 14 | 32 | |||||||||||||||||
| Other income | 5 | 8 | 8 | |||||||||||||||||
| Total Operating Revenues | 115 | 139 | 160 | |||||||||||||||||
| Operating Benefits and Expenses | ||||||||||||||||||||
| Interest expense | 85 | 76 | 15 | |||||||||||||||||
| Operating costs and other expenses, net of deferrals | 203 | 123 | 147 | |||||||||||||||||
| Total Operating Benefits and Expenses | 288 | 199 | 162 | |||||||||||||||||
| Pretax Adjusted Operating Earnings | $ | (173) | $ | (60) | $ | (2) | ||||||||||||||
Year Ended December 31, 2023 compared to Year Ended December 31, 2022
Pretax Adjusted Operating Earnings
Pretax adjusted operating earnings decreased $113 million to $(173) million for the year ended December 31, 2023 from $(60) million for the year ended December 31, 2022 primarily due to the following:
•$80 million increase in operating costs and other expenses, net of deferrals, primarily due to an increase in deferred compensation expenses in 2023;
•$27 million decrease in income on operating derivatives primarily due to the increase in floating rates in 2023; and
•$9 million higher interest expense incurred in the current year primarily related to our senior notes. See Item 8. Financial Statements and Supplementary Data - Note 13 - Long-Term Debt of Notes to Consolidated Financial Statements for further information regarding our long-term debt.
63
Part II | Item 7. Management’s Discussion and Analysis of Financial Condition and Results of Operations | Investments
Investments
Our investment portfolio primarily consists of fixed-income securities and loans, primarily publicly-traded corporate and government bonds, private securities and loans, asset-backed securities and mortgage loans. Asset-backed securities include mortgage-backed and other structured securities. The fair value of these and our other invested assets fluctuates depending on market and other general economic conditions and the interest rate environment and is affected by other economic factors.
Investment Strategy
Our overall investment strategy seeks to maintain a diversified and largely investment grade fixed income portfolio that is capital efficient, achieves risk-adjusted returns that support competitive pricing for our products, generates profitable growth of our business and maintains adequate liquidity to support our obligations. We utilize repurchase and reverse repurchase transactions as a part of our overall portfolio management program to assist with collateral requirements associated with our hedging program and other liquidity needs of our insurance subsidiaries. The investments within our investment portfolio are primarily managed by PPM, our wholly-owned registered investment advisor. Our investment strategy benefits from PPM’s ability to originate investments directly, as well as participate in transactions originated by banks, investment banks, commercial finance companies and other intermediaries. Certain investments held in funds withheld accounts for reinsurance transactions are managed by Apollo Insurance Solutions Group LP ("Apollo"), an Athene affiliate. See Item 8. Financial Statements and Supplementary Data -- Note 8 - Reinsurance of Notes to Consolidated Financial Statements for further details. We may also use other third-party investment managers for certain niche asset classes. As of December 31, 2023, Apollo managed $16.6 billion of cash and investments and other third-party investment managers managed approximately $218 million of investments.
Our investment program seeks to generate a competitive rate of return on our invested assets to support the profitable growth of our business, while maintaining investment portfolio allocations within the Company’s risk tolerance. This means maximizing risk-adjusted return within the context of a largely fixed income portfolio while also managing exposure to downside risk in a stressed environment, regulatory and rating agency capital models, overall portfolio yield, diversification and correlation with other investments and company exposures.
Our Investment Committee has specified a target strategic asset allocation (“SAA”) that is designed to deliver the highest expected return within a defined risk tolerance while meeting other important objectives such as those mentioned in the prior paragraph. The fixed income portion of the SAA is assessed relative to a customized index of public corporate bonds that represents a close approximation of the maturity profile of our liabilities and a credit quality mix that is consistent with our risk tolerance. PPM’s objective is to outperform this index on a number of measures including portfolio yield, total return and capital loss due to downgrades and defaults. While PPM has access to a broad universe of potential investments, we believe grounding the investment program with a customized public corporate index that can be easily tracked and monitored helps guide PPM in meeting the risk and return expectations and assists with performance evaluation.
Recognizing the trade-offs between the level of risk, required capital, liquidity and investment return, the largest allocation within our investment portfolio is to investment grade fixed income securities. As previously mentioned, our investment manager accesses a broad universe of potential investments to construct the investment portfolio and considers the benefits of diversification across various sectors, collateral types and asset classes. To this end, our SAA and investment portfolio includes allocations to public and private corporate bonds (both investment grade and high yield), mortgage loans, structured securities, private equity and U.S. Treasury securities. These U.S. Treasury securities, while lower yielding than other alternatives, provide a higher level of liquidity and play a role in managing our interest rate exposure.
64
Part II | Item 7. Management’s Discussion and Analysis of Financial Condition and Results of Operations | Investments
Portfolio Composition
The following table summarizes the carrying values of our investments:
| December 31, | |||||||||||||||||||||||||||||||||||
| 2023 | 2022 | ||||||||||||||||||||||||||||||||||
| Investments excluding Funds Withheld | Funds Withheld | Total | Investments excluding Funds Withheld | Funds Withheld | Total | ||||||||||||||||||||||||||||||
| (in millions) | |||||||||||||||||||||||||||||||||||
| Debt Securities, available-for-sale, net of allowance for credit losses | $ | 28,896 | $ | 11,526 | $ | 40,422 | $ | 28,867 | $ | 13,622 | $ | 42,489 | |||||||||||||||||||||||
| Debt Securities, at fair value under fair value option | 2,037 | 116 | 2,153 | 2,014 | 159 | 2,173 | |||||||||||||||||||||||||||||
| Debt securities, trading, at fair value | 68 | — | 68 | 100 | — | 100 | |||||||||||||||||||||||||||||
| Equity securities, at fair value | 243 | 151 | 394 | 316 | 77 | 393 | |||||||||||||||||||||||||||||
| Mortgage loans, net of allowance for credit losses | 7,015 | 3,067 | 10,082 | 6,840 | 4,127 | 10,967 | |||||||||||||||||||||||||||||
| Mortgage loans, at fair value under fair value option | — | 481 | 481 | — | 582 | 582 | |||||||||||||||||||||||||||||
| Policy loans | 928 | 3,471 | 4,399 | 942 | 3,435 | 4,377 | |||||||||||||||||||||||||||||
| Freestanding derivative instruments | 375 | 15 | 390 | 1,192 | 78 | 1,270 | |||||||||||||||||||||||||||||
| Other invested assets | 1,757 | 709 | 2,466 | 2,802 | 793 | 3,595 | |||||||||||||||||||||||||||||
| Total investments | $ | 41,319 | $ | 19,536 | $ | 60,855 | $ | 43,073 | $ | 22,873 | $ | 65,946 | |||||||||||||||||||||||
Available-for-sale debt securities decreased to $40,422 million at December 31, 2023 from $42,489 million at the end of 2022, primarily due to dispositions, partially offset by declines in unrealized losses primarily in the funds withheld portfolio. The amortized cost of debt securities, available-for-sale, decreased from $48,798 million as of December 31, 2022 to $44,843 million as of December 31, 2023. Further, net unrealized losses, after adjusting for allowance for credit loss, were $6,286 million as of December 31, 2022 compared to $4,401 million as of December 31, 2023.
Other Invested Assets
Other invested assets decreased to $2,466 million at December 31, 2023 from $3,595 million at December 31, 2022, primarily due to the sale of limited partnerships during 2023.
65
Part II | Item 7. Management’s Discussion and Analysis of Financial Condition and Results of Operations | Investments
Debt Securities
At December 31, 2023 and December 31, 2022, the amortized cost, allowance for credit loss, gross unrealized gains and losses, and fair value of debt securities, including trading securities and securities carried at fair value under the fair value option, were as follows (in millions):
| December 31, 2023 | Amortized Cost | Allowance for Credit Loss | Gross Unrealized Gains | Gross Unrealized Losses | Fair Value | |||||||||||||||||||||||||||
| U.S. government securities | $ | 5,154 | $ | — | $ | 3 | $ | 845 | $ | 4,312 | ||||||||||||||||||||||
| Other government securities | 1,622 | — | 1 | 221 | 1,402 | |||||||||||||||||||||||||||
| Corporate securities | ||||||||||||||||||||||||||||||||
| Utilities | 5,598 | — | 42 | 513 | 5,127 | |||||||||||||||||||||||||||
| Energy | 2,946 | — | 24 | 272 | 2,698 | |||||||||||||||||||||||||||
| Banking | 2,204 | 1 | 23 | 148 | 2,078 | |||||||||||||||||||||||||||
| Healthcare | 2,985 | — | 20 | 338 | 2,667 | |||||||||||||||||||||||||||
| Finance/Insurance | 4,392 | 13 | 31 | 429 | 3,981 | |||||||||||||||||||||||||||
| Technology/Telecom | 2,058 | 1 | 10 | 191 | 1,876 | |||||||||||||||||||||||||||
| Consumer goods | 2,395 | — | 21 | 285 | 2,131 | |||||||||||||||||||||||||||
| Industrial | 1,609 | — | 14 | 112 | 1,511 | |||||||||||||||||||||||||||
| Capital goods | 1,838 | — | 14 | 127 | 1,725 | |||||||||||||||||||||||||||
| Real estate | 1,572 | — | 6 | 153 | 1,425 | |||||||||||||||||||||||||||
| Media | 1,082 | — | 4 | 109 | 977 | |||||||||||||||||||||||||||
| Transportation | 1,381 | — | 7 | 157 | 1,231 | |||||||||||||||||||||||||||
| Retail | 1,197 | — | 6 | 132 | 1,071 | |||||||||||||||||||||||||||
Other (1) | 2,211 | — | 14 | 119 | 2,106 | |||||||||||||||||||||||||||
| Total Corporate Securities | 33,468 | 15 | 236 | 3,085 | 30,604 | |||||||||||||||||||||||||||
| Residential mortgage-backed | 422 | 6 | 12 | 53 | 375 | |||||||||||||||||||||||||||
| Commercial mortgage-backed | 1,569 | — | 1 | 147 | 1,423 | |||||||||||||||||||||||||||
| Other asset-backed securities | 4,830 | — | 6 | 309 | 4,527 | |||||||||||||||||||||||||||
| Total Debt Securities | $ | 47,065 | $ | 21 | $ | 259 | $ | 4,660 | $ | 42,643 | ||||||||||||||||||||||
(1) No single remaining industry exceeds 3% of the portfolio. | ||||||||||||||||||||||||||||||||
66
Part II | Item 7. Management’s Discussion and Analysis of Financial Condition and Results of Operations | Investments
| December 31, 2022 | Amortized Cost | Allowance for Credit Loss | Gross Unrealized Gains | Gross Unrealized Losses | Fair Value | |||||||||||||||||||||||||||
| U.S. government securities | $ | 6,192 | $ | — | $ | 1 | $ | 1,008 | $ | 5,185 | ||||||||||||||||||||||
| Other government securities | 1,719 | 2 | 1 | 251 | 1,467 | |||||||||||||||||||||||||||
| Corporate securities | ||||||||||||||||||||||||||||||||
| Utilities | 5,893 | — | 27 | 695 | 5,225 | |||||||||||||||||||||||||||
| Energy | 3,006 | 10 | 7 | 390 | 2,613 | |||||||||||||||||||||||||||
| Banking | 1,994 | — | 2 | 234 | 1,762 | |||||||||||||||||||||||||||
| Healthcare | 2,956 | — | 8 | 439 | 2,525 | |||||||||||||||||||||||||||
| Finance/Insurance | 4,497 | 4 | 8 | 621 | 3,880 | |||||||||||||||||||||||||||
| Technology/Telecom | 2,333 | 1 | 2 | 296 | 2,038 | |||||||||||||||||||||||||||
| Consumer goods | 2,463 | — | 10 | 378 | 2,095 | |||||||||||||||||||||||||||
| Industrial | 1,675 | — | 8 | 173 | 1,510 | |||||||||||||||||||||||||||
| Capital goods | 1,982 | — | 3 | 196 | 1,789 | |||||||||||||||||||||||||||
| Real estate | 1,723 | — | 1 | 225 | 1,499 | |||||||||||||||||||||||||||
| Media | 1,230 | — | 1 | 175 | 1,056 | |||||||||||||||||||||||||||
| Transportation | 1,576 | — | 3 | 214 | 1,365 | |||||||||||||||||||||||||||
| Retail | 1,312 | — | 5 | 182 | 1,135 | |||||||||||||||||||||||||||
Other (1) | 2,056 | — | 1 | 178 | 1,879 | |||||||||||||||||||||||||||
| Total Corporate Securities | 34,696 | 15 | 86 | 4,396 | 30,371 | |||||||||||||||||||||||||||
| Residential mortgage-backed | 510 | 6 | 19 | 59 | 464 | |||||||||||||||||||||||||||
| Commercial mortgage-backed | 1,821 | — | — | 183 | 1,638 | |||||||||||||||||||||||||||
| Other asset-backed securities | 6,133 | — | 8 | 504 | 5,637 | |||||||||||||||||||||||||||
| Total Debt Securities | $ | 51,071 | $ | 23 | $ | 115 | $ | 6,401 | $ | 44,762 | ||||||||||||||||||||||
(1) No single remaining industry exceeds 3% of the portfolio. | ||||||||||||||||||||||||||||||||
The tightening credit spreads of investment grade corporate securities resulted in decreased unrealized losses during the year ended December 31, 2023. Of the $1,741 million total decrease in unrealized losses and the $6,014 million reduction in fair value on securities with an associated unrealized loss, $641 million and $1,679 million, respectively, are associated with assets subject to funds withheld agreements.
67
Part II | Item 7. Management’s Discussion and Analysis of Financial Condition and Results of Operations | Investments
Evaluation of Available-For-Sale Debt Securities
See Item 8. Financial Statements and Supplementary Data -- Note 4 - Investments of Notes to Consolidated Financial Statements for information about how we evaluate our available-for-sale debt securities for credit loss.
Equity Securities
Equity securities consist of investments in common and preferred stock holdings and mutual fund investments. Common and preferred stock investments generally arise out of previous private equity investments or other settlements rather than as direct investments. Mutual fund investments typically represent investments made in our own mutual funds to seed those structures for external issuance at a later date. The following table summarizes our holdings:
| December 31, | |||||||||||
| 2023 | 2022 | ||||||||||
| (in millions) | |||||||||||
| Common Stock | $ | 17 | $ | 82 | |||||||
| Preferred Stock | 175 | 133 | |||||||||
| Mutual Funds | 202 | 178 | |||||||||
| Total | $ | 394 | $ | 393 | |||||||
Mortgage Loans
At December 31, 2023, commercial mortgage loans were collateralized by properties located in 36 states, the District of Columbia, and Europe. Residential mortgage loans were collateralized by properties located in 50 states, the District of Columbia, Mexico, and Europe.
The table below presents the carrying value, net of allowance of credit loss, of our mortgage loans by property type:
| December 31, | |||||||||||
| 2023 | 2022 | ||||||||||
| (in millions) | |||||||||||
| Commercial: | |||||||||||
| Apartment | $ | 3,213 | $ | 3,558 | |||||||
| Hotel | 870 | 1,015 | |||||||||
| Office | 1,440 | 1,795 | |||||||||
| Retail | 1,992 | 2,085 | |||||||||
| Warehouse | 2,047 | 1,788 | |||||||||
Total Commercial (1) | $ | 9,562 | $ | 10,241 | |||||||
Residential (2) | 1,001 | 1,308 | |||||||||
| Total | $ | 10,563 | $ | 11,549 | |||||||
(1) Net of an allowance for credit losses of $160 million and $91 million at December 31, 2023 and 2022, respectively.
(2) Net of an allowance for credit losses of $5 million and $4 million at December 31, 2023 and 2022, respectively.
68
Part II | Item 7. Management’s Discussion and Analysis of Financial Condition and Results of Operations | Investments
The table below presents the carrying value, net of allowance for credit loss, of our mortgage loans by region:
| December 31, | |||||||||||
| 2023 | 2022 | ||||||||||
| (in millions) | |||||||||||
| United States: | |||||||||||
| East North Central | 1,024 | 1,116 | |||||||||
| East South Central | 502 | 546 | |||||||||
| Middle Atlantic | 1,481 | 1,677 | |||||||||
| Mountain | 531 | 627 | |||||||||
| New England | 287 | 371 | |||||||||
| Pacific | 2,500 | 2,850 | |||||||||
| South Atlantic | 2,147 | 2,313 | |||||||||
| West North Central | 593 | 572 | |||||||||
| West South Central | 992 | 920 | |||||||||
| Total United States | 10,057 | 10,992 | |||||||||
| Foreign | 506 | 557 | |||||||||
| Total | 10,563 | 11,549 | |||||||||
The following table provides information about the credit quality of our mortgage loans:
| December 31, | |||||||||||
| 2023 | 2022 | ||||||||||
| (in millions) | |||||||||||
| Commercial mortgage loans | |||||||||||
| Loan to value ratios: | |||||||||||
| Less than 70% | $ | 8,604 | $ | 9,586 | |||||||
| 70% - 80% | 711 | 424 | |||||||||
| 80% - 100% | 196 | 197 | |||||||||
| Greater than 100% | 51 | 34 | |||||||||
| Total | 9,562 | 10,241 | |||||||||
| Residential mortgage loans | |||||||||||
| Performing | 911 | 1,230 | |||||||||
Nonperforming (1) | 90 | 78 | |||||||||
| Total | 1,001 | 1,308 | |||||||||
| Total mortgage loans | $ | 10,563 | $ | 11,549 | |||||||
(1) At December 31, 2023 and 2022, includes $22 million and $41 million of loans purchased when the loans were greater than 90 days delinquent and $5 million and $12 million of loans in process of foreclosure, respectively, and are supported with insurance or other guarantees provided by various governmental programs.
The following table provides a summary of the allowance for credit losses related to our mortgage loans:
| December 31, | |||||||||||
| 2023 | 2022 | ||||||||||
| (in millions) | |||||||||||
| Balance at beginning of period | $ | 95 | $ | 94 | |||||||
Charge offs, net of recoveries (1) | (66) | — | |||||||||
Provision (release) (1) | 136 | 1 | |||||||||
| Balance at end of period | $ | 165 | $ | 95 | |||||||
(1) At December 31, 2023, the $70 million net increase in allowance for credit losses is due to an increase in expected credit losses, primarily in the office sector.
69
Part II | Item 7. Management’s Discussion and Analysis of Financial Condition and Results of Operations | Investments
The Company’s mortgage loans that are current and in good standing are accruing interest. Interest is not accrued on loans greater than 90 days delinquent and in process of foreclosure, when deemed uncollectible. Delinquency status is determined from the date of the first missed contractual payment. Accrued interest amounting to $2 million and nil were written off as of December 31, 2023 and 2022, respectively, relating to loans that were greater than 90 days delinquent or in the process of foreclosure.
The following table provides information about our impaired residential mortgage loans (in millions):
| December 31, | |||||||||||
| 2023 | 2022 | ||||||||||
| Recorded investment | $ | 24 | $ | 15 | |||||||
| Unpaid principal balance | 27 | 16 | |||||||||
| Related loan allowance | 1 | — | |||||||||
| Average recorded investment | 19 | 18 | |||||||||
| Investment income recognized | 1 | — | |||||||||
Derivative Instruments
See Item 8. Financial Statements and Supplementary Data -- Note 5 – Derivative Instruments of Notes to Consolidated Financial Statements, which presents the aggregate contractual or notional amounts and the fair values of our freestanding and embedded derivatives instruments as of December 31, 2023 and 2022.
Evaluation of Invested Assets
We perform regular evaluations of our invested assets. On a monthly basis, management identifies those investments that may require additional monitoring and carefully reviews the carrying value of such investments to determine whether specific investments should be placed on a non-accrual status and if an allowance for credit loss is required. In making these reviews, management principally considers the adequacy of any collateral, compliance with contractual covenants, the borrower’s recent financial performance, news reports and other externally generated information concerning the borrower’s affairs. In the case of publicly traded bonds, management also considers market value quotations, where available. For mortgage loans, management generally considers information concerning the mortgaged property, including factors impacting the current and expected payment status of the loan and, if available, the current fair value of the underlying collateral. For investments in partnerships, management reviews the financial statements and other information provided by the general partners.
To determine an allowance for credit loss, we consider a security’s forecasted cash flows as well as the severity of depressed fair values. Investment income is not accrued on securities in default and otherwise where the collection is uncertain. Subsequent receipts of interest on such securities are generally used to reduce the cost basis of the securities. The provisions for impairment on mortgage loans are based on losses expected by management to be realized on transfers of mortgage loans to real estate, on the disposition and settlement of mortgage loans and on mortgage loans that management believes may not be collectible in full. Accrual of interest on mortgage loans is generally suspended when principal or interest payments on mortgage loans are past due more than 90 days. Interest is then accounted for on a cash basis.
Policy and Contract Liabilities
We establish, and carry as liabilities, actuarially determined amounts that are calculated to meet policy obligations or to provide for future annuity payments. Amounts for actuarial liabilities are computed and reported on the Consolidated Financial Statements in conformity with U.S. GAAP. For more details on Policyholder Liabilities, see “Critical Accounting Estimates" below.
Our policy and contract liabilities includes separate account liabilities, reserves for future policy benefits and claims payable and other contract holder funds. As of December 31, 2023, 89% of our policy and contract liabilities were in our Retail Annuities segment, 3% were in our Institutional Products segment and 8% were in our Closed Life and Annuity Blocks segment.
70
Part II | Item 7. Management’s Discussion and Analysis of Financial Condition and Results of Operations |
Policy and Contract Liabilities
The table below represents a breakdown of our policy and contract liabilities:
| December 31, 2023 | Separate Accounts | Reserves for future policy benefits | Other contract holder funds | Market Risk Benefits | Total | ||||||||||||||||||||||||
| (in millions) | |||||||||||||||||||||||||||||
| Variable Annuities | $ | 219,381 | $ | — | $ | 8,396 | $ | (2,000) | $ | 225,777 | |||||||||||||||||||
RILA1 | — | — | 5,219 | 3 | 5,222 | ||||||||||||||||||||||||
| Fixed Annuities | — | — | 9,736 | 1 | 9,737 | ||||||||||||||||||||||||
Fixed Index Annuities2 | — | — | 10,243 | 37 | 10,280 | ||||||||||||||||||||||||
| Payout Annuities | — | 1,090 | 860 | — | 1,950 | ||||||||||||||||||||||||
| Other Annuities | 198 | — | — | — | 198 | ||||||||||||||||||||||||
| Total Retail Annuities | 219,579 | 1,090 | 34,454 | (1,959) | 253,164 | ||||||||||||||||||||||||
| Total Institutional Products | — | — | 8,406 | — | 8,406 | ||||||||||||||||||||||||
| Total Closed Life and Annuity Blocks | 77 | 9,362 | 12,291 | 7 | 21,737 | ||||||||||||||||||||||||
| Total Policy and Contract Liabilities | 219,656 | 10,452 | 55,151 | (1,952) | 283,307 | ||||||||||||||||||||||||
| Claims payable and other | — | 1,446 | 168 | — | 1,614 | ||||||||||||||||||||||||
| Total | $ | 219,656 | $ | 11,898 | $ | 55,319 | $ | (1,952) | $ | 284,921 | |||||||||||||||||||
| December 31, 2022 | Separate Accounts | Reserves for future policy benefits | Other contract holder funds | Market Risk Benefits | Total | ||||||||||||||||||||||||
| (in millions) | |||||||||||||||||||||||||||||
| Variable Annuities | $ | 195,550 | $ | — | $ | 10,259 | $ | 767 | $ | 206,576 | |||||||||||||||||||
RILA1 | — | — | 1,875 | 5 | 1,880 | ||||||||||||||||||||||||
| Fixed Annuities | — | — | 11,696 | — | 11,696 | ||||||||||||||||||||||||
Fixed Index Annuities2 | — | — | 11,787 | 17 | 11,804 | ||||||||||||||||||||||||
| Payout Annuities | — | 1,042 | 837 | — | 1,879 | ||||||||||||||||||||||||
| Other Annuities | 285 | — | — | — | 285 | ||||||||||||||||||||||||
| Total Retail Annuities | 195,835 | 1,042 | 36,454 | 789 | 234,120 | ||||||||||||||||||||||||
| Total Institutional Products | — | — | 9,019 | — | 9,019 | ||||||||||||||||||||||||
| Total Closed Life and Annuity Blocks | 71 | 9,726 | 12,534 | 8 | 22,339 | ||||||||||||||||||||||||
| Total Policy and Contract Liabilities | 195,906 | 10,768 | 58,007 | 797 | 265,478 | ||||||||||||||||||||||||
| Claims payable and other | — | 1,550 | 183 | — | 1,733 | ||||||||||||||||||||||||
| Total | $ | 195,906 | $ | 12,318 | $ | 58,190 | $ | 797 | $ | 267,211 | |||||||||||||||||||
(1) Includes the embedded derivative liabilities in other contract holder funds related to RILA of $1,224 million and $205 million at December 31, 2023 and 2022, respectively.
(2) Includes the embedded derivative liabilities related to fixed index annuity in other contract holder funds of $866 million and $931 million at December 31, 2023 and 2022, respectively.
As of December 31, 2023:
•$219.7 billion or 78% of our policy and contract liabilities were backed by separate account assets. These separate account assets backed reserves primarily related to our variable annuities. Separate account liabilities are fully funded by cash flows from the customer’s corresponding separate account assets and are set equal to the fair value of such invested assets.
•$45.1 billion of our policy and contract liabilities were backed by our investment portfolio.
•$18.6 billion of our policy and contract liabilities were reinsured by Athene and backed by funds withheld assets.
As of December 31, 2023, 100% of our RILA policy and contract liabilities were subject to surrender charges of at least 5% or at market value in the event of discretionary withdrawal by customers.
As of December 31, 2023, 94% of fixed annuity, fixed index annuity, and the fixed accounts of RILA and variable annuity correspond to crediting rates that are at the guaranteed minimum crediting rate. We have the discretion, subject to contractual limitations and minimums, to reset the crediting terms on the majority of our fixed index annuities and fixed annuities.
71
Part II | Item 7. Management’s Discussion and Analysis of Financial Condition and Results of Operations |
Policy and Contract Liabilities
See Item 8. Financial Statements and Supplementary Data -- Note 9 - Reserves for Future Policy Benefits and Claims Payable, Note 10 - Other Contract Holder Funds, Note 11 - Separate Account Assets and Liabilities, and Note 12 - Market Risk Benefits of Notes to Consolidated Financial Statements for additional discussion on accounting policies around Reserves for future policy benefits and claims payable, Other contract holder funds, Separate account assets and liabilities and MRBs.
Actuarial Assumption Changes (Unlocking)
The following tables reflect the impacts from our annual assumption review to pre-tax income (loss), pre-tax non-operating adjustments and Pre-Tax Adjusted Operating Earnings for the periods presented:
| Years Ended December 31, | |||||||||||
| 2023 | 2022 | 2021 | |||||||||
| (in millions) | |||||||||||
| Assumption Review Impact: | |||||||||||
| Total assumption review impact on pretax (loss) income | $ | (466) | $ | (448) | $ | (13) | |||||
| Less: total assumption review impact on pretax non-operating | (406) | (486) | (13) | ||||||||
| Total assumption review impact on Pretax Adjusted Operating Earnings | $ | (60) | $ | 38 | $ | — | |||||
| Assumption Review Impact on Pretax Adjusted Operating Earnings by Segment: | |||||||||||
| Retail Annuities | $ | — | $ | (9) | $ | — | |||||
| Closed Life and Annuity Blocks | (60) | 47 | — | ||||||||
| Total assumption review impact on Pretax Adjusted Operating Earnings | $ | (60) | $ | 38 | $ | — | |||||
2023 Assumption Updates
The impact of assumption changes on Pretax Adjusted Operating Earnings was $(60) million, with the impact attributed to the Closed Life and Annuity Blocks segment. The impact was mainly on the additional reserve for life insurance and annuitization benefits driven by a decrease in lapses, offset by a change in the long-term earned-rate.
The impact on pretax non-operating earnings was $(406) million attributed to the Retail Annuities segment. See Item 8. Financial Statements and Supplementary Data -- Note 12 - Market Risk Benefits of Notes to Consolidated Financial Statements for further information regarding the notable assumption change updates included in the MRB calculation.
Liquidity and Capital Resources
Liquidity is our ability to generate sufficient cash flows to meet the cash requirements of operating, investing and financing activities. Capital refers to our long-term financial resources available to support the business operations and contribute to future growth. Our ability to generate and maintain sufficient liquidity and capital depends on the profitability of the businesses, timing of cash flows on investments and products, general economic conditions and access to the capital markets and alternate sources of liquidity and capital described herein.
The discussion below describes our liquidity and capital resources for the years ended December 31, 2023, 2022 and 2021.
72
Part II | Item 7. Management’s Discussion and Analysis of Financial Condition and Results of Operations | Liquidity and Capital Resources
Cash Flows
The following table presents a summary of our cash flow activity for the periods set forth below:
| Years Ended December 31, | |||||||||||||||||
| 2023 | 2022 | 2021 | |||||||||||||||
| (in millions) | |||||||||||||||||
| Net cash provided by (used in) operating activities | $ | 5,310 | $ | 5,206 | $ | 5,682 | |||||||||||
| Net cash provided by (used in) investing activities | (592) | (1,374) | (1,296) | ||||||||||||||
| Net cash provided by (used in) financing activities | (6,328) | (2,162) | (3,774) | ||||||||||||||
| Net increase (decrease) in cash, cash equivalents, and restricted cash | (1,610) | 1,670 | 612 | ||||||||||||||
| Cash, cash equivalents, and restricted cash at beginning of period | 4,301 | 2,631 | 2,019 | ||||||||||||||
| Total cash, cash equivalents, and restricted cash at end of period | $ | 2,691 | $ | 4,301 | $ | 2,631 | |||||||||||
Cash flows from Operating Activities
The principal operating cash inflows from our insurance activities come from insurance premiums, fees charged on our products and net investment income. The principal operating cash outflows are the result of the payment of annuity and life insurance benefits, operating expenses and income tax, as well as interest expense. The primary liquidity concern with respect to these cash flows is the risk of earlier than expected contract holder and policyholder benefit payments.
Cash flows provided by (used in) operating activities increased $104 million to $5,310 million during the year ended December 31, 2023 from $5,206 million during the year ended December 31, 2022. This was primarily due to the timing of settlements of receivables and payables as well as lower acquisition costs.
Cash flows from Investing Activities
The principal cash inflows from our investment activities come from repayments of principal, proceeds from maturities and sales of investments, as well as settlements of freestanding derivatives. The principal cash outflows relate to purchases of investments and settlements of freestanding derivatives. It is not unusual to have a net cash outflow from investing activities because cash inflows from insurance operations are typically reinvested to fund insurance liabilities. We closely monitor and manage these risks through our comprehensive investment risk management process. The primary liquidity concerns with respect to these cash flows are the risk of default by debtors or market disruptions that might impact the timing of investment-related cash flows as well as derivative collateral needs, which could result in material liquidity needs for our insurance subsidiaries.
Cash flows provided by (used in) investing activities increased $782 million to $(592) million during the year ended December 31, 2023 from $(1,374) million during the year ended December 31, 2022. This increase was primarily due to lower purchases of debt securities in 2023 compared to 2022 and sales of limited partnerships in 2023, partially offset by increased outflows related to our hedging program for derivative settlements and collateral, predominately resulting from market increases in 2023 compared to 2022.
Cash flows from Financing Activities
The principal cash inflows from our financing activities come from deposits of funds associated with policyholder account balances, issuance of securities and lending of securities. The principal cash outflows come from withdrawals associated with policyholder account balances, repayment of debt, and the return of securities on loan. The primary liquidity concerns with respect to these cash flows are market disruption and the risk of early policyholder withdrawal.
Cash flows provided by (used in) financing activities decreased $4,166 million to $(6,328) million during the year ended December 31, 2023 from $(2,162) million for the year ended December 31, 2022. This decrease was primarily due to lower deposits from variable annuity sales in 2023 compared to 2022, higher payments on repurchase agreements, and repayment of our maturing 2023 senior notes, partially offset by proceeds from the issuance of our preferred stock.
73
Part II | Item 7. Management’s Discussion and Analysis of Financial Condition and Results of Operations | Liquidity and Capital Resources
Statutory Capital
Our insurance company subsidiaries have statutory surplus above the level needed to meet current regulatory requirements. RBC requirements are used as minimum capital requirements by the NAIC and the state insurance departments to identify companies that merit regulatory action. RBC is based on a formula that incorporates both factor-based components (applied to various asset, premium, and statutory reserve items) and model-based components. The formula takes into account the risk characteristics of the insurer, including asset risk, insurance risk, interest rate risk, market risk and business risk and is calculated on an annual basis. The formula is used as an early warning regulatory tool to identify possible inadequately capitalized insurers for purposes of initiating regulatory action, and not to rank insurers generally. As of December 31, 2023, our insurance companies were well in excess of the minimum required capital levels.
Our statutory TAC (total adjusted capital) may be negatively impacted by minimum required reserving levels (i.e., cash surrender value floor) when reserve releases are limited and unable to offset losses from our hedging program. The RBC ratio may increase or decrease depending on the interaction between movements in TAC and movements in statutory CAL (the company action level), which could impact available dividends from our insurance subsidiaries. At times the cash surrender value floor materially affects the CAL calculation in addition to reserve levels. The formation and operation of Brooke Re is anticipated to mitigate these impacts. See “Recent Events of Note – Brooke Life Reinsurance Company” above for more information on Brooke Re and associated transactions.
Jackson had an RBC ratio of 624%, 544% and 580% as of December 31, 2023, 2022 and 2021, respectively. The increase in Jackson’s RBC ratio as of December 31, 2023 as compared to December 31, 2022 was primarily due to reductions in interest rate and market risk. There was also lower asset risk subsequent to the sale of the private equities limited partnerships.
Holding Company Liquidity
As a holding company with no business operations of its own, Jackson Financial primarily derives cash flows from dividends and interest payments from its insurance subsidiaries. These principal sources of liquidity are expected to be supplemented by cash and short-term investments held by Jackson Financial, and access to bank lines of credit and the capital markets. We intend to maintain a minimum amount of cash and highly liquid securities at Jackson Financial adequate to fund two years of holding company fixed net expenses, which is currently targeted at $250 million but may change over time as we refinance existing debt or make changes to our debt and capital structure. The main uses of liquidity for Jackson Financial are interest payments and debt repayment, holding company operating expenses, payment of dividends and other distributions to shareholders, which may include stock repurchases, and capital contributions, if needed, to our insurance company subsidiaries. Our principal sources of liquidity and our anticipated capital position are described in the following paragraphs.
Any declaration of cash dividends or stock repurchases is at the discretion of JFI’s Board of Directors and will depend on our financial condition, earnings, liquidity and capital requirements, regulatory constraints, level of indebtedness, preferred stock and other contractual restrictions with respect to paying cash dividends or repurchasing stock, restrictions imposed by Delaware law, general business conditions and any other factors that JFI’s Board of Directors deems relevant in making any such determination. Therefore, there can be no assurance that we will pay any cash dividends to holders of our stock or approve any further increase in the existing, or any new, common stock repurchase program, or as to the amount of any such cash dividends or stock repurchases.
Delaware law requires that dividends be paid and stock repurchases made only out of “surplus,” which is defined as the fair market value of our net assets, minus our stated capital; or out of the current or the immediately preceding year’s earnings. JFI is a holding company and has no direct operations. All of our business operations are conducted through our subsidiaries. Any dividends we pay or stock repurchases we make will depend upon the funds legally available for distribution, including dividends or distributions from our subsidiaries to us. The states in which our insurance subsidiaries are domiciled impose certain restrictions on our insurance subsidiaries’ ability to pay dividends to their parent companies. These restrictions are based in part on the prior year’s statutory income and surplus, as well as earned surplus. Such restrictions, or any future restrictions adopted by the states in which our insurance subsidiaries are domiciled, could have the effect, under certain circumstances, of significantly reducing dividends or other amounts payable by our subsidiaries without affirmative approval of state regulatory authorities. See Item 1A. Risk Factors—“Risks relating to Financing and Liquidity - As a holding company, Jackson Financial depends on the ability of its subsidiaries to pay dividends and make
74
Part II | Item 7. Management’s Discussion and Analysis of Financial Condition and Results of Operations | Liquidity and Capital Resources
other distributions to meet its obligations and liquidity needs, including servicing debt, dividend payments and stock repurchases.”
On March 13, 2023, the Company issued and sold depositary shares representing interests in our Fixed-Rate Reset Noncumulative Perpetual Preferred Stock, Series A. After underwriting discounts and expenses, we received net proceeds of approximately $533 million. See Item 8. Financial Statements and Supplementary Data -- Note 24 - Equity of Notes to Consolidated Financial Statements for more information.
During the year ended December 31, 2023, we paid a cash dividend of $0.50 per depositary share and $0.62 per common share totaling $35 million and $209 million, respectively. On February 20, 2024, our Board of Directors approved a first quarter cash dividend on JFI's common stock of $0.70 per share, payable on March 21, 2024 to shareholders of record on March 12, 2024. The company also declared a cash dividend of $0.50 per depositary share. The dividend will be payable on April 1, 2024, to depositary shareholders of record at the close of business on March 12, 2024.
On February 27, 2023, our Board of Directors authorized an increase of $450 million in our existing share repurchase authorization of JFI's common stock. We repurchased a total of 6,502,524 shares of common stock for an aggregate purchase price of $255 million for the year ended December 31, 2023, which were funded with cash on hand. As of February 20, 2024, the Company had remaining authorization to purchase $237 million of its common shares.
See Item 8. Financial Statements and Supplementary Data -- Note 24 - Equity of Notes to Consolidated Financial Statements for further information on dividends to shareholders and share repurchases.
During 2023, Jackson Financial purchased certain private equity fund investments from Jackson National Life Insurance Company for $452 million, with a carrying value of $502 million, as part of rebalancing Jackson National Life Insurance Company's portfolio mix. Jackson Financial sold these investments in October 2023. The Company recorded a loss of $97 million on the sale, which it recognized in Net Investment Income within the consolidated financial statements for the year ended December 31, 2023, of which $37 million of this loss was attributable to Jackson Financial.
As of December 31, 2023, Jackson Financial has recorded an estimate of $74 million ($263 million at a consolidated level) for the provision for the CAMT based on our interpretation of guidance with an offsetting increase to the deferred tax asset for the credit carryover resulting in no impact to total tax expense. The calculation of the CAMT, is subject to the issuance of regulatory guidance by the U.S. Department of the Treasury. We continue to monitor developments and regulations associated with the CAMT for any potential future impacts on our business, financial condition, results of operations and cash flows.
Distributions from our Insurance Company Subsidiaries
The ability of our insurance company subsidiaries to pay dividends is limited by applicable laws and regulations of the jurisdictions where such subsidiaries are domiciled as well as agreements entered into with regulators. These laws and regulations require, among other things, our insurance company subsidiaries to maintain minimum solvency requirements and limit the amount of dividends these subsidiaries can pay.
Subject to these limitations, our insurance company subsidiaries are permitted to pay ordinary dividends based on calculations specified under insurance laws of the relevant state of domicile, subject to prior notification to the appropriate regulatory agency. Any distributions above the amount permitted by statute in any twelve-month period are considered extraordinary dividends, and the approval of the appropriate regulator is required prior to payment. In Michigan, the Director of the Michigan Department of Insurance and Financial Services (the Michigan Director of Insurance) may limit, or not permit, the payment of dividends from either Jackson or Brooke Life, Jackson's direct parent company, if it determines that the surplus of either of these subsidiaries is not reasonable in relation to their outstanding liabilities and is not adequate to meet their financial needs, as required by the Michigan Insurance Code of 1956. Unless otherwise approved by the Michigan Director of Insurance, dividends may only be paid from earned surplus. Also, surplus note arrangements and interest payments must be approved by the Michigan Director of Insurance and such interest payments to related parties reduce the otherwise calculated ordinary dividend capacity for that period. In New York, all dividends require approval from the NYSDFS.
75
Part II | Item 7. Management’s Discussion and Analysis of Financial Condition and Results of Operations | Liquidity and Capital Resources
For 2023, Jackson and Brooke Life had a total ordinary dividend capacity, based on 2022 statutory capital and surplus and statutory net gain from operations, subject to the availability of earned surplus, of $3,688 million and $501 million, respectively. Brooke Life, as the sole owner of our other insurance company subsidiaries, including Jackson and Jackson National Life NY, is the direct recipient of any dividend payments from those subsidiaries and must make dividend payments to its ultimate parent company, Jackson Financial, in order for any funds from our insurance company subsidiaries to reach Jackson Financial. As such, Jackson Financial’s ability to receive dividend payments from our insurance company subsidiaries is effectively limited by Brooke Life’s ability to make dividend payments to Jackson Financial.
On March 1, 2023, Jackson paid a $450 million ordinary dividend and remitted a $150 million return of capital to its parent company, Brooke Life. Brooke Life subsequently paid a $360 million ordinary dividend and remitted a $150 million return of capital to its ultimate parent, Jackson Financial. In addition, for the year ended December 31, 2023, Brooke Life paid $90 million of interest associated with the $2 billion surplus note between Brooke Life and Jackson Finance, LLC ("Jackson Finance"), a subsidiary of Jackson Financial.
For 2024, Jackson and Brooke Life has a total ordinary dividend capacity, based on 2023 statutory capital and surplus and statutory net gain from operations, subject to the availability of earned surplus, of $464 million and $371 million, respectively.
The maximum distribution permitted by law or contract is not necessarily indicative of an insurer’s actual ability to pay such distributions, which may be constrained by business and other considerations, such as imposition of withholding tax, the impact of such distributions on surplus, which could affect the insurer’s credit and financial strength ratings or competitive position, the ability to generate new annuity sales and the ability to pay future dividends or make other distributions. Further, state insurance laws and regulations require that the statutory surplus of our insurance subsidiaries following any dividend or distribution must be reasonable in relation to their outstanding liabilities and adequate for the insurance subsidiaries’ financial needs. Along with solvency regulations, another primary consideration in determining the amount of capital used for dividends is the level of capital needed to maintain desired financial strength ratings from rating agencies, including A.M. Best, S&P, Moody’s and Fitch. Given recent economic events that have affected the insurance industry, both regulators and rating agencies could become more conservative in their methodology and criteria, including increasing capital requirements for insurance company subsidiaries. We believe our insurance company subsidiaries have sufficient statutory capital and surplus to maintain their desired financial strength rating.
Insurance Company Subsidiaries’ Liquidity
The liquidity requirements for our insurance company subsidiaries primarily relate to the liabilities associated with their insurance and reinsurance activities, operating expenses and income taxes. Liabilities arising from insurance and reinsurance activities include the payment of policyholder benefits when due, cash payments in connection with policy surrenders and withdrawals and policy loans.
Liquidity requirements are principally for purchases of new investments, management of derivative related margin requirements, repayment of principal and interest on debt, payments of interest on surplus notes, funding of insurance product liabilities including payments for policy benefits, surrenders, maturities and new policy loans, funding of expenses including payment of commissions, operating expenses and taxes. As of December 31, 2023, Jackson’s outstanding surplus notes and bank debt included $57 million of bank loans from the Federal Home Loan Bank of Indianapolis ("FHLBI"), collateralized by mortgage-related securities and mortgage loans and $250 million of surplus notes maturing in 2027.
Significant increases in interest rates could create sudden increases in surrender and withdrawal requests by customers and contract holders and result in increased liquidity requirements at our insurance company subsidiaries. Significant increases in interest rates or equity markets may also result in higher margin and collateral requirements on our derivative portfolio. The derivative contracts are an integral part of our risk management program, especially for the management of our variable annuities program, and are managed in accordance with our hedging and risk management program. Our cash flows associated with collateral received from counterparties and posted with counterparties fluctuates with changes in the market value of the underlying derivative contract and/or the market value of the collateral. The net collateral position depends on changes in interest rates and equity markets related to the amount of the exposures hedged. Collateral posting requirements can result in material liquidity needs for our insurance subsidiaries. As of December 31, 2023, we were in a net collateral payable position of $780 million, as compared to $689 million as of December 31, 2022.
76
Part II | Item 7. Management’s Discussion and Analysis of Financial Condition and Results of Operations | Liquidity and Capital Resources
Other factors that are not directly related to interest rates can also give rise to an increase in liquidity requirements, including, changes in ratings from rating agencies, general policyholder concerns relating to the life insurance industry (e.g., the unexpected default of a large, unrelated life insurer) and competition from other products, including non-insurance products such as mutual funds, certificates of deposit and newly developed investment products. Most of the life insurance and annuity products Jackson offers permit the policyholder or contract holder to withdraw or borrow funds or surrender cash values. As of December 31, 2023, approximately half of Jackson’s general account reserves are not surrenderable, included surrender charges greater than 5%, or included market value adjustments to discourage early withdrawal of policy and contract funds.
The liquidity sources for our insurance company subsidiaries are their cash, short-term investments, sales of publicly traded bonds, insurance premiums, fees charged on our products, sales of annuities and institutional products, investment income, commercial repurchase agreements and utilization of a short-term borrowing facility with the FHLBI.
Jackson uses a variety of asset liability management techniques to provide for the orderly provision of cash flow from investments and other sources as policies and contracts mature in accordance with their normal terms. Jackson’s principal sources of liquidity to meet unexpected cash outflows associated with sudden and severe increases in surrenders and withdrawals or benefit payments are its portfolio of liquid assets and its net operating cash flows. As of December 31, 2023, the portfolio of cash, short-term investments and privately and publicly traded securities and equities that are unencumbered and unrestricted to sale, amounted to $22.4 billion.
Our Indebtedness
Senior Notes
In November 2021 and June 2022, the Company issued an aggregate of $2,350 million principal amount of its senior notes, shown as Long-term debt on the Consolidated Balance Sheets. The proceeds of the note issuances were used, together with cash on hand, to retire the Company’s previously outstanding term loans. $600 million of these notes matured on November 22, 2023, and were paid with cash on hand at maturity.
Revolving Credit and Short-Term Borrowing Facilities
On February 24, 2023, the Company entered into a revolving credit facility (the "2023 Revolving Credit Facility") with a syndicate of banks and Bank of America, N.A., as Administrative Agent. The 2023 Revolving Credit Facility replaced an existing revolving credit facility that was due to expire in February 2024. The 2023 Revolving Credit Facility provides for borrowings for working capital and other general corporate purposes under aggregate commitments of $1.0 billion, with a sub-limit of $500 million available for letters of credit. The 2023 Revolving Credit Facility further provides for the ability to request, subject to customary terms and conditions, an increase in commitments thereunder by up to an additional $500 million. Commitments under the 2023 Revolving Credit Facility terminate on February 24, 2028. Interest on borrowings may be based on a “Base Rate” (as defined in the 2023 Revolving Credit Facility) plus an adder ranging from 0.125% to 0.875%, or a “Term SOFR Rate” (as defined in the 2023 Revolving Credit Facility) plus an adder ranging from 1.125% to 1.875%. The applicable adder is based upon the ratings assigned to the Company’s senior, unsecured, non-credit enhanced debt.
The credit agreement governing the 2023 Revolving Credit Facility contains a number of customary representations and warranties, affirmative and negative covenants and events of default (including a change of control provision). The credit agreement contains financial maintenance covenants, including a minimum adjusted consolidated net worth test of no less than 70% of our adjusted consolidated net worth as of September 30, 2022 (plus (to the extent positive) or minus (to the extent negative) 70% of the impact on such adjusted consolidated net worth resulting from the application of a one-time transition adjustment for the LDTI accounting change for insurance contracts, and plus 50% of the aggregate amount of any increase in adjusted consolidated net worth resulting from equity issuances by the Company and its consolidated subsidiaries after September 30, 2022) and a maximum consolidated indebtedness to total capitalization ratio test not to exceed 35%. We were in compliance with these covenants at December 31, 2023.
Jackson is a party to an Uncommitted Money Market Line Credit Agreement dated April 6, 2023 among Jackson, Jackson Financial, and Société Générale. This agreement is an uncommitted short-term cash advance facility that provides an
77
Part II | Item 7. Management’s Discussion and Analysis of Financial Condition and Results of Operations | Liquidity and Capital Resources
additional form of liquidity to Jackson and to Jackson Financial. The aggregate borrowing capacity under the agreement is $500 million and each cash advance request must be at least $100 thousand. The interest rate is set by the lender at the time of the borrowing and is fixed for the duration of the advance. Jackson and Jackson Financial are jointly and severally liable to repay any advance under the agreement, which must be repaid prior to the last day of the quarter in which the advance was drawn.
Surplus Notes
On March 15, 1997, our subsidiary, Jackson, issued 8.2% surplus notes in the principal amount of $250 million due March 15, 2027. These surplus notes are unsecured and subordinated to all present and future indebtedness, policy claims and other creditor claims and may not be redeemed at the option of the Company or any holder prior to maturity. Interest is payable semi-annually on March 15th and September 15th of each year. Interest expense on the notes was $20 million, $20 million, and $20 million for the years ended December 31, 2023, 2022 and 2021, respectively.
Under Michigan insurance law, for statutory reporting purposes, the surplus notes are not part of the legal liabilities of the Company and are considered surplus funds. Payments of interest or principal may only be made with the prior approval of the Michigan Director of Insurance and only out of surplus earnings that the director determines to be available for such payments under Michigan insurance law.
Federal Home Loan Bank
Jackson is a member of the regional FHLBI primarily for the purpose of participating in its collateralized loan advance program with funding facilities. Membership requires us to purchase and hold a minimum amount of FHLBI capital stock, plus additional stock based on outstanding advances. Advances are in the form of either notes or funding agreements issued to FHLBI. As of December 31, 2023 and 2022, Jackson held a bank loan with an outstanding balance of $57 million and $62 million, respectively.
Collateral Upgrade Transactions
During the first quarter of 2024, Jackson executed certain paired repurchase and reverse repurchase transactions (“Collateral Upgrade” transactions) totaling $1.5 billion pursuant to master repurchase agreements with participating bank counterparties. Under these transactions, the Company lends securities (e.g., corporate debt securities or other securities agreed upon between the parties) to one or more bank counterparties in exchange for cash (repurchase agreement) and exchange that cash for an equal value of U.S. Treasury securities (reverse repurchase agreement) to provide as collateral as part of our hedging program. The transactions are paired as two legs of a Collateral Upgrade trade.
Financial Strength Ratings
Our access to funding and our related cost of borrowing, the attractiveness of certain of our subsidiaries’ products to customers, our attractiveness as a reinsurer to potential ceding companies and requirements for derivatives collateral posting are affected by our credit ratings and financial strength ratings, which are periodically reviewed by the rating agencies. Financial strength ratings and credit ratings are important factors affecting consumer confidence in an insurer and its competitive position in marketing products as well as critical factors considered by ceding companies in selecting a reinsurer.
Our principal insurance company subsidiaries are rated by A.M. Best, S&P, Moody’s and Fitch. Financial strength ratings represent the opinions of rating agencies regarding the financial ability of an insurer or reinsurer to meet its obligations under an insurance policy or reinsurance arrangement and generally involve quantitative and qualitative evaluations by rating agencies of a company’s financial condition and operating performance. Generally, rating agencies base their financial strength ratings upon information furnished to them by the company and upon their own investigations, studies and assumptions. Financial strength ratings are based upon factors of concern to customers, distribution partners and ceding companies and are not directed toward the protection of investors. Financial strength ratings are not recommendations to buy, sell or hold securities and may be revised or revoked at any time at the sole discretion of the rating organization.
78
Part II | Item 7. Management’s Discussion and Analysis of Financial Condition and Results of Operations | Liquidity and Capital Resources
As of February 20, 2024, the financial strength ratings of our principal insurance subsidiaries were as follows:
| Company | A.M. Best | Fitch | Moody’s | S&P | ||||||||||||||||||||||
| Jackson National Life Insurance Company | ||||||||||||||||||||||||||
| Rating | A | A | A3 | A | ||||||||||||||||||||||
| Outlook | stable | stable | stable | stable | ||||||||||||||||||||||
| Jackson National Life Insurance Company of New York | ||||||||||||||||||||||||||
| Rating | A | A | A3 | A | ||||||||||||||||||||||
| Outlook | stable | stable | stable | stable | ||||||||||||||||||||||
| Brooke Life Insurance Company | ||||||||||||||||||||||||||
| Rating | A | |||||||||||||||||||||||||
| Outlook | stable | |||||||||||||||||||||||||
In evaluating our Company’s financial strength, the rating agencies evaluate a variety of factors including our strategy, market positioning and track record, mix of business, profitability, leverage and liquidity, the adequacy and soundness of our reinsurance, the quality and estimated market value of our assets, the adequacy of our surplus, our capital structure, and the experience and competence of our management.
In addition to the financial strength ratings, rating agencies use an outlook statement to indicate a short- or medium-term trend which, if continued, may lead to a rating change. A positive outlook indicates a rating may be raised and a negative outlook indicates a rating may be lowered. A stable outlook is assigned when ratings are not likely to be changed. Outlooks should not be confused with expected stability of the issuer’s financial or economic performance. A stable outlook does not preclude a rating agency from changing a rating at any time without notice.
A.M. Best, S&P, Moody’s and Fitch review their ratings of insurance companies from time to time. There can be no assurance that any particular rating will continue for any given period of time or that it will not be changed or withdrawn entirely if, in their judgment, circumstances so warrant. While the degree to which ratings adjustments will affect sales of our annuities and institutional products, and persistency is unknown, if our ratings are negatively adjusted for any reason, we believe we could experience a material decline in the sales in our individual channel, origination in our institutional channel, and the persistency of our existing business.
Contractual Obligations
We have contractual obligations identified within Item 8. Financials Statements and Supplementary Data -- Note. 5. Derivative Instruments, Note 9. Reserves for Future Policy Benefits and Claims Payable, Note 10. Other Contract Holder Funds, Note 11. Separate Account Assets and Liabilities, Note 12. Market Risk Benefits, Note 13. Long-Term Debt, Note 16. Commitments and Contingencies, and Note 17. Leases.
Impact of Recent Accounting Pronouncements
For a complete discussion of new accounting pronouncements affecting us, see Item 8. Financials Statements and Supplementary Data -- Note 2 - Summary of Significant Accounting Policies of Notes to Consolidated Financial Statements.
As discussed in Note 2 of Notes to Consolidated Financial Statements in this report, we adopted Accounting Standards Update ("ASU") 2018-12, “Targeted Improvements to the Accounting for Long-Duration Contracts” ("LDTI"), for our fiscal year beginning January 1, 2023, with a transition date of January 1, 2021. Based upon the elected transition methods, the adoption of LDTI resulted in a decrease in total equity of $3.0 billion as of the transition date of January 1, 2021, comprised of a reduction in accumulated other comprehensive income ("AOCI") of $0.4 billion and a reduction in retained earnings of $2.6 billion. The adoption of the standard resulted in increases in net income attributable to Jackson Financial Inc. of $489 million and $234 million for the years ended December 31, 2022 and 2021, respectively, and also resulted in an increase in total equity of $223 million and a decrease of $2.8 billion for the years ended December 31, 2022 and 2021, respectively, from the amounts reported prior to the adoption of LDTI. The change in the equity impact from the transition date was primarily due to higher interest rates and is comprised of a reduction in retained earnings that is more than offset
79
Part II | Item 7. Management’s Discussion and Analysis of Financial Condition and Results of Operations |
Critical Accounting Estimates
by an increase in AOCI. See further discussion in Item 8. Financial Statements and Supplementary Data -- Note 2 - Summary of Significant Accounting Policies of Notes to Consolidated Financial Statements for the significant changes associated with this change in accounting principle.
Critical Accounting Estimates
The preparation of financial statements in conformity with U.S. GAAP requires management to adopt accounting policies and make estimates and assumptions that affect amounts reported in our Consolidated Financial Statements. The following are our most critical estimates, which require management’s most difficult, subjective and complex judgments, including the need to make estimates about the effect of matters that are inherently uncertain and may change in subsequent periods.
The following discussion is not intended to represent a comprehensive list of the estimates and judgments that we apply or our accounting policies. For a detailed discussion of the application of these and other accounting policies, see Item 8. Financials Statements and Supplementary Data — Note 2- Summary of Significant Accounting Policies of Notes to Consolidated Financial Statements.
Reserves for Future Policy Benefits and Claims Payable
We establish reserves for future policy benefits to, or on behalf of, customers in the same period in which the policy is issued or acquired, using methodologies prescribed by U.S. GAAP.
Reserves for Future Policy Benefits
For non-participating traditional life insurance contracts and limited pay life-contingent contracts, which include term, whole life, and payout annuities with significant insurance risk, reserves for future policy benefits represents the present value of estimated future policy benefits to be paid to, or on behalf of, policyholders in future periods and certain related expenses less the present value of estimated future net premiums.
Reserves for future policy benefits for non-participating traditional and limited-payment insurance contracts are measured using the net premium ratio (NPR) measurement model. The NPR measurement model accrues for future policy benefits in proportion to the premium revenue recognized. The reserve for future policy benefits is derived from the Company's best estimate of future net premium and future benefits and expenses, which is based on best estimate assumptions, including mortality, persistency, claims expense, and discount rate. On an annual basis, or as circumstances warrant, we conduct a comprehensive review of our current best estimate assumptions based on our experience, industry benchmarking, and other factors, as applicable. Expense assumptions are updated based on estimates of expected non-level costs, such as termination or settlement costs, and costs after the premium-paying period, and exclude acquisition costs or any costs that are required to be charged to expenses as incurred. Updates to assumptions are applied on a retrospective basis, and each reporting period the reserve for future policy benefits is updated to reflect actual experience to date.
The Company establishes cohorts, which are product groupings used to measure reserves for future policy benefits. In determining cohorts, the Company considers both qualitative and quantitative factors, including the issue year, type of product, product features, and legal entity.
The discount rate used to estimate reserves for future policy benefits is consistent with an upper-medium grade (low-credit risk) fixed-income corporate instrument yield, which has been interpreted to represent a single-A corporate instrument yield. This discount rate curve is determined by fitting a parametric function to yields to maturity and related times to maturity of market observable single-A rated corporate instruments. The discount rate used to recognize interest accretion on the reserves for future policy benefits is locked at the initial measurement of the cohort. Each reporting period, the reserve for future policy benefits is remeasured using the current discount rate. The difference between the reserve calculated using the current discount rate and the reserve calculated using the locked-in discount rate is recorded in other comprehensive income.
Additional Liabilities - Universal Life-type
The Company issues universal life plans with secondary guarantees and interest-sensitive life plans. The primary reserves for these policies are the contract holder account balances reported within the other contract holder funds line of the Consolidated Balance Sheets. Where these contracts provide additional benefits beyond the account balance or base insurance coverage that are not market risk benefits or embedded derivatives, liabilities in addition to the policyholder’s
80
Part II | Item 7. Management’s Discussion and Analysis of Financial Condition and Results of Operations |
Critical Accounting Estimates
account value are recognized. These additional liabilities for annuitization, death and other insurance benefits are reported within reserves for future policy benefits and claims payable. The methodology uses a benefit ratio defined as a constant percentage of the assessment base. This ratio is multiplied by current period assessments to determine the reserve accrual for the period. The measurements of the additional liabilities for annuitization, death and other insurance benefits are based on best estimate assumptions including mortality, persistency, investment returns, and discount rates. These assumptions are similarly subject to the annual review process discussed above.
Other Future Policy Benefits and Claims Payable
In conjunction with a prior acquisition, we recorded a fair value adjustment related to certain annuity and interest-sensitive life blocks of business to reflect the cost of the interest guarantees within the in-force liabilities, based on the difference between the guaranteed interest rate and an assumed new money guaranteed interest rate. This adjustment is recorded in reserves for future policy benefits and claims payable. This component of the acquired reserves is reassessed at the end of each period, taking into account changes in the in-force block. Any resulting change in the reserve is recorded as a change in policy reserve through the Consolidated Income Statements.
In addition, life and annuity claims liabilities in course of settlement are included in other future policy benefits and claims payable.
See Item 8. Financial Statements and Supplementary Data -- Note 9- Reserve for Future Policy Benefits and Claims Payable of Notes to Consolidated Financial Statements for additional information on these accounting policies.
Market Risk Benefits
Contracts or contract features that provide protection to the contract holder from capital market risk and expose the Company to other-than-nominal capital market risk are classified as market risk benefits, or MRBs. All long-duration insurance contracts and certain investment contracts are subject to MRB evaluation. MRBs are measured at fair value at the contract level and can be in either an asset or liability position. For contracts that contain multiple MRB features, the MRBs are valued together as a single compound MRB.
The use of models and assumptions to determine fair value of MRBs requires a significant amount of judgment. The significant assumptions used in the MRB fair value calculations are:
•Mortality rates - These vary by attained age, tax qualification status, guaranteed benefit election, and duration. The range used reflects ages from the minimum issue age for the benefit through age 95, which corresponds to the typical maturity age. A mortality improvement assumption is also applied.
•Base lapse rates - These vary by contract-level factors, such as product type, surrender charge schedule and optional benefits election. Lapse rates are further adjusted based on the degree to which a guaranteed benefit is in-the-money, with lower lapse applying when benefits are more in-the-money. Lapse rates are also adjusted to reflect lower lapse expectations when guaranteed benefits are utilized.
•Utilization rates - These represent the expected percentage of contracts that will utilize the benefit through annuitization (GMIB) or commencement of withdrawals (GMWB). Utilization may vary by benefit type, attained age, duration, tax qualification status, benefit provision, and degree to which the guaranteed benefit is in-the-money.
•Withdrawal rates - These represent the percentage of annual withdrawal assumed relative to the maximum allowable withdrawal amount under the free partial withdrawal provision or the GMWB, as applicable. Free partial withdrawal rates vary based on the product type and duration. Withdrawal rates on contracts with a GMWB vary based on attained age, tax qualification status, GMWB type and GMWB benefit provisions.
•Non-performance risk adjustment - This is applied as a spread over the risk-free rate to determine the rate used to discount the related cash flows and varies by projection year.
•Long-term equity volatility - This represents the equity volatility beyond the period for which observable equity volatilities are available.
See Item 8. Financial Statements and Supplementary Data -- Note 6 - Fair Value Measurements of Notes to Consolidated Financial Statements for additional information.
81
Part II | Item 7. Management’s Discussion and Analysis of Financial Condition and Results of Operations |
Critical Accounting Estimates
Variable Annuities
We issue variable contracts through our separate accounts for which investment income and investment gains and losses accrue directly to, and investment risk is borne by, the contract holder. Certain of these contracts include contract provisions by which we contractually guarantee to the contract holder either a) return of no less than total deposits made to the account adjusted for any partial withdrawals, b) total deposits made to the account adjusted for any partial withdrawals plus a minimum return, or c) the highest account value on a specified anniversary date adjusted for any withdrawals following the contract anniversary. These guarantees include benefits that are payable upon the depletion of funds (GMWB), in the event of death (GMDB), at annuitization (GMIB), or at the end of a specified period (GMAB). Substantially all of our GMIB benefits are reinsured. GMIB benefits and GMAB benefits were discontinued in 2009 and 2011, respectively. For additional information regarding our account value by optional guarantee benefit, see Item 1. Business–Our Product Offerings by Segments–Retail Annuities–Variable Annuities in this report.
Variable annuity guaranteed benefit features classified as MRBs, which have explicit fees, are measured using the attributed fee method. Under the attributed fee method, fair value is measured as the difference between the present value of projected future liabilities and the present value of projected attributed fees. At the inception of the contract, the Company attributes to the MRB a portion of total fees expected to be assessed against the contract holder to offset the projected claims over the lifetime of the contract. The attributed fee is expressed as a percentage of total projected future fees at inception of the contract. This percentage of total projected fees is considered a fixed term of the MRB feature and is held static over the life of the contract. This percentage may not exceed 100% of the total projected contract fees as of contract inception. As the Company may issue contracts that have projected future liabilities greater than the projected future guaranteed benefit fees at issue, the Company may also attribute mortality and expense charges when performing this calculation. In subsequent valuations, both the present value of future projected liabilities and the present value of projected attributed fees are remeasured based on current market conditions and policyholder behavior assumptions.
Fixed Index Annuities
The longevity riders issued on fixed index annuities are classified as MRBs and measured at fair value. Similar to the variable annuity guaranteed benefits features, these contracts have explicit fees and are measured using the attributed fee method. The Company attributes a percentage of total projected future fees expected to be assessed against the policyholder to offset the projected future claims over the lifetime of the contract. If the fees attributed are insufficient to offset the claims at issue, the shortfall is borrowed from the host contract rather than recognizing a loss at inception.
RILA
RILA guaranteed benefit features are classified as MRBs and measured at fair value. Unlike variable or fixed index annuities, RILA products do not have explicit fees and are measured using an option-based method. The fair value measurement represents the present value of future claims payable by the MRB feature. At inception, the value of the MRB is deducted from the value of the contract resulting in no gain or loss.
See Item 8. Financial Statements and Supplementary Data -- Note 12 - Market Risk Benefits of Notes to Consolidated Financial Statements for additional information on these accounting policies.
Income Taxes
Income taxes represent the net amount of income taxes that we expect to pay to or receive from various taxing jurisdictions in connection with our operations. We provide for federal and state income taxes currently payable, as well as those deferred due to temporary differences between the financial reporting and tax bases of assets and liabilities. As of December 31, 2023, the Company has recorded an estimate for the provision of the Corporate Alternative Minimum Tax (“CAMT”), based on the Company’s interpretation of available guidance, with an offsetting increase to the deferred tax asset for the credit carryover resulting in no impact to total tax expense. The U.S. Department of the Treasury is expected to issue additional regulatory guidance in 2024 that may materially change the estimated provision of the CAMT.
Deferred federal income taxes arise from the recognition of temporary differences between the basis of assets and liabilities determined for financial reporting purposes and the basis determined for income tax purposes. Such temporary differences are principally related to the effects of recording certain invested assets at market value, the deferral of acquisition costs and
82
Part II | Item 7. Management’s Discussion and Analysis of Financial Condition and Results of Operations |
Critical Accounting Estimates
sales inducements and the provisions for future policy benefits and expenses. Deferred tax assets and liabilities are measured using the tax rates expected to be in effect when such benefits are realized. We are required to test the value of deferred tax assets for realizability. Deferred tax assets are reduced by a valuation allowance if, based on the weight of available positive and negative evidence, it is more likely than not that some portion, or all, of the deferred tax assets will not be realized. In determining the need for a valuation allowance, we consider the carryback eligibility of losses, reversal of existing temporary differences, estimated future taxable income and tax planning strategies.
Determining the valuation allowance for our deferred tax assets requires management to make certain judgments and assumptions regarding future operations that are based on historical experience and expectations of future performance. To recognize a tax benefit in the Consolidated Financial Statements, there must be a greater than 50% chance of success of our position being sustained by the relevant taxing authority. Management’s judgments are potentially subject to change given the inherent uncertainty in predicting future performance, which is impacted by such factors as policyholder behavior, competitor pricing and other specific industry and market conditions.
See Item 8. Financial Statements and Supplementary Data -- Note 15 – Income Taxes for additional information on these accounting policies and the estimated provision for the CAMT.
Reinsurance
Accounting for reinsurance requires extensive use of assumptions and estimates, particularly related to the future performance of the underlying business and the potential impact of counterparty credit risk with respect to reinsurance receivables. We periodically review actual and anticipated experience compared to the previously mentioned assumptions used to establish assets and liabilities relating to ceded and assumed reinsurance and evaluate the financial strength of counterparties to our reinsurance agreements. Counterparty credit risk may be managed through the use of letters of credit, collateral trusts or on balance sheet funds withheld agreements. Assets held under funds withheld agreements are included on our Consolidated Balance Sheets and subject to triggers embedded within the relevant reinsurance agreements.
Additionally, for each of our reinsurance agreements, we determine whether the agreement provides indemnification against loss or liability relating to insurance risk in accordance with applicable accounting standards. We review all contractual features, including those that may limit the amount of insurance risk to which the reinsurer is subject or features that delay the timely reimbursement of claims.
For reinsurance contracts, reinsurance recoverable balances are generally calculated using methodologies and assumptions that are consistent with those used to calculate the direct liabilities. For non-participating traditional life insurance contracts and limited pay life-contingent contracts, there may be reinsurance contracts executed subsequent to the direct contract issue dates, and market interest rates may have changed between the date that the underlying insurance contracts were issued and the date the reinsurance contract is recognized in the financial statements, resulting in the underlying discount rate differing between the direct and reinsured business.
Our guaranteed minimum income benefits (GMIBs) are reinsured with an unrelated party. For contracts that only ceded the GMIB feature of our annuity products, the reinsurance contract in its entirety is classified as a reinsured market risk benefit or MRB. Accordingly, the reinsured MRB is recorded at fair value using internally developed models consistent with those used to value our direct MRBs.
See Item 8. Financial Statements and Supplementary Data -- Note 8 - Reinsurance of Notes to Consolidated Financial Statements for additional information on these accounting policies.
Investments – Valuation and Impairment
We determine the fair values of certain financial assets and liabilities based on quoted market prices, where available. When necessary, we may also determine fair value based on estimated future cash flows discounted at the appropriate current market rate. Fair values also, if appropriate, reflect adjustments for counterparty credit quality, credit rating, liquidity and incorporate risk margins for unobservable inputs.
Where quoted market prices are not available, fair value estimates are made at a point in time, based on relevant market data, as well as the best information about the individual financial instrument. At times, illiquid market conditions could
83
Part II | Item 7. Management’s Discussion and Analysis of Financial Condition and Results of Operations |
Critical Accounting Estimates
result in inactive markets for certain of our financial instruments. In such instances, there could be no or limited observable market data for these assets and liabilities. Fair value estimates for financial instruments deemed to be in an illiquid market are based on judgments regarding current economic conditions, liquidity discounts, currency, credit and interest rate risks, loss experience and other factors. These fair values are estimates and involve considerable uncertainty and variability as a result of the inputs selected and may differ materially from the values that would have been used had an active market existed. As a result of market inactivity, such calculated fair value estimates may not be realizable in an immediate sale or settlement of the instrument. In addition, changes in the underlying assumptions used in the fair value measurement technique could significantly affect these fair value estimates.
We periodically review our available-for-sale debt securities on a case-by-case basis to determine if an impairment is necessary for securities with a decline in fair value to below cost or amortized cost. Factors considered in determining whether an impairment is necessary include whether we have the intent to sell, or whether it is more likely than not we will be required to sell the security before the amortized cost basis is fully recovered, the severity of the unrealized loss, the reasons for the decline in value and expectations for the amount and timing of a recovery in fair value. For debt securities in an unrealized loss position, for which we deem an impairment necessary, the amortized cost may be written down to fair value through net gains (losses) on derivatives and investments, or an ACL may be recorded along with a charge to net gains (losses) on derivatives and investments.
Securities determined to be underperforming or potential problem securities are subject to regular review. To facilitate the review, securities with significant declines in value, or where other objective criteria evidencing credit deterioration have been met, are included on a watch list. Among the criteria for securities to be included on a watch list are: credit deterioration that has led to a significant decline in fair value of the security; a significant covenant related to the security has been breached; or an issuer has filed or indicated a possibility of filing for bankruptcy, has missed or announced it intends to miss a scheduled interest or principal payment, or has experienced a specific material adverse change that could impair its creditworthiness.
In performing these reviews, we consider the relevant facts and circumstances relating to each investment and exercise considerable judgment in determining whether an impairment is needed for a particular security. Assessment factors include judgments about an obligor’s current and projected financial position, an issuer’s current and projected ability to service and repay its debt obligations, the existence of, and realizable value of, any collateral backing the obligations and the outlooks for specific industries and issuers. This assessment may also involve assumptions regarding underlying collateral such as prepayment rates, default and recovery rates, and third-party servicing capabilities.
In addition to the review procedures described above, investments in asset-backed securities where market prices are depressed are subject to a review of their future estimated cash flows, including expected and stress case scenarios, to identify potential shortfalls in contractual payments. These estimated cash flows are developed using available performance indicators from the underlying assets including current and projected default or delinquency rates, levels of credit enhancement, current subordination levels, vintage, expected loss severity and other relevant characteristics. These estimates reflect a combination of data derived by third parties and internally developed assumptions. Where possible, this data is benchmarked against third-party sources.
For mortgage-backed securities, credit losses are assessed using a cash flow model that estimates the cash flows on the underlying mortgages, using the security-specific collateral characteristics and transaction structure. The model estimates cash flows from the underlying mortgage loans and distributes those cash flows to various tranches of securities, considering the transaction structure and any subordination and credit enhancements existing in that structure. The cash flow model incorporates actual cash flows on the mortgage-backed securities through the current period and then projects the remaining cash flows using a number of assumptions, including prepayment speeds, default rates and loss severity. Specifically, for prime and Alt-A RMBS, the assumed default percentage is dependent on the severity of delinquency status, with foreclosures and real estate owned receiving higher rates, but also includes the currently performing loans. These estimates reflect a combination of data derived by third parties and internally developed assumptions. Where possible, this data is benchmarked against other third-party sources. In addition, these estimates are extrapolated along a default timing curve to estimate the total lifetime pool default rate.
After these reviews, we recognize impairments on debt securities in an unrealized loss position when any of the following circumstances exists:
•We intend to sell a security;
84
Part II | Item 7. Management’s Discussion and Analysis of Financial Condition and Results of Operations |
Critical Accounting Estimates
•It is more likely than not that we will be required to sell a security prior to recovery; or
•We do not expect full recovery of the amortized cost based on the discounted cash flows estimated to be collected.
Mortgage loans, which are not carried at fair value under the fair value option, are carried at the aggregate unpaid principal balance, adjusted for any applicable unamortized discount or premium, or ACL. Acquisition discounts and premiums on mortgage loans are amortized into investment income through maturity dates using the effective interest method. Interest income is accrued on the principal balance of the loan based on the loan’s contractual interest rate. Interest income and amortization of premiums and discounts are reported in net investment income along with prepayment fees and mortgage loan fees, which are recorded as incurred.
We review mortgage loans on a quarterly basis to estimate the ACL with changes in the ACL recorded in net gains (losses) on derivatives and investments. Apart from an ACL recorded on individual mortgage loans where the borrower is experiencing financial difficulties, we record an ACL on the pool of mortgage loans based on lifetime expected credit losses. Credit loss estimates are pooled by property type and unfunded commitments are included in the model with an allowance for credit losses determined accordingly.
Mortgage loans on real estate deemed uncollectible are charged against the ACL, and subsequent recoveries, if any, are credited to the ACL.
Accrued interest receivables are presented separate from the amortized cost of debt securities and mortgage loans. An allowance for credit losses is not estimated on an accrued interest receivable. Rather, receivable balances that are deemed uncollectible are written off with a corresponding reduction to net investment income.
Derivatives
Freestanding Derivative Instruments
We enter into financial derivative transactions, including swaps, put-swaptions, futures and options to reduce and manage business risks. These transactions manage the risk of a change in the value, yield, price, cash flows, credit quality or degree of exposure with respect to assets, liabilities or future cash flows that we have acquired or incurred.
Freestanding derivative instruments are reported at fair value, which reflects the estimated amounts, net of payment accruals, that we would receive or pay upon sale or termination of the contracts at the reporting date. Freestanding derivatives priced using third party pricing services incorporate inputs that are predominantly observable in the market. The determination of the estimated fair value of freestanding derivatives, when quoted market values are not available, is based on market standard valuation methodologies and inputs that management believes are consistent with what other market participants would use when pricing such instruments. Derivative valuations can be affected by changes in interest rates, foreign currency exchange rates, financial indices, credit spreads, default risk, non-performance risk, volatility, liquidity and changes in estimates and assumptions used in the pricing models. See Item 8. Financials Statements and Supplementary Data — Note 5 - Derivative Instruments and Note 6 - Fair Value Measurements of Notes to Consolidated Financial Statements for additional information on significant inputs into our derivative pricing methodology.
Embedded Derivatives - Product Liabilities
For our registered index-linked and fixed index annuities, the equity-linked option issued by the Company is accounted for at fair value as an embedded derivative on the Company’s Consolidated Balance Sheets as a component of other contract holder funds, with changes in fair value recorded in net income. The policyholder account value is the imputed value of the underlying guaranteed host contract.
The fair value of the embedded derivative for the FIA and RILA products is determined using an option-budget method with capital market inputs of market index returns and discount rates as well as actuarial assumptions including lapse, mortality and withdrawal rates. We typically update our actuarial assumptions annually as discussed above, unless a material change is observed in an interim period that we feel is indicative of a long-term trend.
85
Part II | Item 7. Management’s Discussion and Analysis of Financial Condition and Results of Operations |
Critical Accounting Estimates
The underlying assumptions may have a material impact on the measurement of the embedded derivative, including equity market movements. Thus, favorable equity market movements cause increases in future contract holder benefits, resulting in an increase in the fair value of the embedded derivative liability (and vice versa).
See Item 8. Financials Statements and Supplementary Data -- Note 5 - Derivative Instruments and Note 10 - Other Contract Holder Funds of Notes to Consolidated Financial Statements for additional information on our accounting policies for embedded derivatives bifurcated for insurance host contracts.
Embedded Derivatives - Funds Withheld Reinsurance Agreements
The Company has recorded an embedded derivative liability related to the Athene coinsurance agreement (the “Athene Embedded Derivative”) in accordance with ASC 815-15 as Jackson’s obligation under the coinsurance agreement is based on the total return of investments in a segregated funds withheld account rather than Jackson’s own creditworthiness. As the coinsurance agreement transfers the economics of the investments in the segregated funds withheld account to Athene, they will receive an investment return equivalent to owning the underlying assets. At inception of the coinsurance agreement, the Athene Embedded Derivative was valued at zero. Additionally, the inception fair value of the investments in the segregated funds withheld account differed from their book value and, accordingly, the amortization of this difference is reported in Net gains (losses) on derivatives and investments in the Consolidated Income Statement, while the investments are held. Subsequent to the effective date of the coinsurance agreement, the Athene Embedded Derivative is measured at fair value with changes reported in Net gains (losses) on derivatives and investments in the Consolidated Income Statement. The Athene Embedded Derivative Liability is included in Funds withheld payable under reinsurance treaties in the Consolidated Balance Sheet.
See Item 8. Financial Statements and Supplementary Data -- Note 8 - Reinsurance of Notes to Consolidated Financial Statements for additional information on Athene Reinsurance Transaction.
Net Investment Income
Net investment income reported for each of our three segments and Corporate and Other includes an allocation for investment income generated on assigned capital. The amount of capital assigned to each of our segments for purposes of measuring segment net investment income is established at a level that management considers necessary to support the segment’s risks. This assessment is determined based upon internal models and contemplates National Association of Insurance Commissioners (“NAIC”) RBC requirements at internally defined levels. Net investment income on capital in excess of the amount required to support our core operating strategies is reflected in Corporate and Other.
Contingent Liabilities
We are a party to legal actions and, at times, regulatory investigations. Given the inherent unpredictability of these matters, it is difficult to estimate their impact on our financial position. A reserve is established for contingent liabilities if it is probable that a loss has been incurred and the amount is reasonably estimable. It is possible that an adverse outcome in certain of our contingent liabilities, or the use of different assumptions in the determination of amounts recorded, could have a material effect upon our financial position. However, it is the opinion of management that the ultimate disposition of contingent liabilities is unlikely to have a material adverse effect on our financial position.
Consolidation of Variable Interest Entities (“VIEs”)
The Company invests in a number of asset types that it has determined are VIEs, such as equity positions in collateralized loan obligations (“CLOs”), limited partnerships (“LPs”), limited liability companies (“LLCs”), and mutual funds that are assessed to determine whether they meet the criteria as a VIE. For those entities deemed to be VIEs, we further assess whether the VIE must be consolidated as a result of the terms specific to each entity. Entities for which consolidation is required are included on our Consolidated Financial Statements. To the extent that external parties are also invested in these VIEs, a non-controlling interest is reflected on our Consolidated Financial Statements as well. See Item 8. Financial Statements and Supplementary Data -- Note 4 - Investments of Notes to Consolidated Financial Statements for additional information.
86
Part II | Item 7A. Quantitative and Qualitative Disclosures about Market Risk
Item 7A. Quantitative and Qualitative Disclosures about Market Risk
Our primary market risk exposure results from interest rate fluctuations, equity price movements and changes in credit spreads.
Interest Rates
Our market risk exposure to changes in interest rates principally arises from investments in fixed-income securities (primarily, publicly-traded corporate and government bonds and asset-backed securities), interest-rate derivative instruments, in addition to market risk benefits and embedded derivatives associated with certain variable annuities, fixed index annuities, and RILAs.
Equity Markets
Our risk exposure to changes in equity markets principally arises from investments in equity securities, equity derivative instruments, in addition to market risk benefits and embedded derivatives associated with certain variable annuities, fixed index annuities, and RILAs.
Variable Annuity Equity Market Risk
Equity market risk arises from the variable annuities we offer principally in the following ways:
•Core contract charges and investment management fees are generally calculated based on the account value. Our customers typically allocate a significant portion of their account value to separate account investment options that hold equity securities. Increases or decreases in the value of the referenced equity securities will increase or decrease the associated core contract charges and investment management fees.
•As of December 31, 2023, 77% of our total variable annuity account value included a return of premium death benefit and 11% of our total variable annuity account value included an enhanced GMDB selection. Decreases in equity markets increase the likelihood that a customer’s account value will be insufficient to cover the benefit paid to the beneficiary at the time of a claim following the customer’s death. As a result, the risk associated with such payouts is dependent on both the equity market performance and the time of the claim.
•As of December 31, 2023, 76% of total variable annuity account value included either a GMWB for Life or GMWB selection. These benefits guarantee minimum payments based on a fixed annual percentage of the benefit base. These withdrawals may continue even if the account value subsequently falls to zero. When equity markets decrease, we generally expect account values to decline, and the account value therefore to be able to fund relatively fewer guaranteed withdrawals. Conversely, increases in equity markets generally increase account values and extend the number of withdrawals the account value is able to fund.
See Item 1. Business – “Our Product Offerings by Segment – Retail Annuities” for additional information about variable annuity guaranteed living benefit and guaranteed death benefit riders.
In addition to equity market declines, certain other equity market changes could also increase our losses. For example, certain of our guaranteed living benefits and guaranteed death benefits include provisions that step up the benefit base if the account value exceeds the benefit base at specified time intervals (generally annually or quarterly). Therefore, if equity markets increase over the short-term but return to lower levels in the longer-term, those step-up provisions could increase the benefit base relative to the account value, resulting in additional benefit payments paid by us compared to a scenario where equity markets had remained flat over time. The fees attributable to guaranteed benefits are generally calculated based on the benefit base, so the scenario in which equity markets increase and then later decrease will also result in relatively higher fee income.
87
Part II | Item 7A. Quantitative and Qualitative Disclosures about Market Risk
Fixed Index Annuity Equity Market Risk
We sell fixed index annuities where the crediting rate to the contract holder is determined by reference to equity market performance. A higher equity market return over a given period will credit more interest to the account value of those annuities, though the final amounts credited are generally capped at specified maximum possible crediting rates.
We also offer an optional lifetime withdrawal guarantee benefit on our fixed index annuities, which allows contract holders to withdraw a specified amount each year until death, or until the contract holder’s account value is exhausted. See Item 1. Business – “Our Product Offerings by Segment – Retail Annuities” for additional information about fixed index annuity guaranteed living benefit riders. The equity market risk exposure on these benefits differs from comparable benefits offered on variable annuities, because declines in equity markets only reduce the interest credited to the customer’s account value for that period and not the account value itself. As a result, declines in equity markets do not shorten the time remaining before we expect to make payments on these guarantees. However, increasing equity markets will result in higher amounts credited to the customer’s account value, thereby extending the number of annual guaranteed withdrawals funded from the account value. In addition, increasing equity markets could potentially increase the specified amount available for withdrawal.
RILA Equity Market Risk
We sell RILA where the crediting rate to the contract holder is determined by reference to equity market performance. Similar to fixed index annuities, a higher equity market return over a given period will credit more interest to the account value of those annuities, though the final amounts credited are generally capped at specified maximum possible crediting rates. Unlike fixed index annuities, and similar to variable annuities, a lower equity market return over a given period may result in a reduction to the account value. Unlike variable annuities, the amount of the reduction is limited by a floor (which defines the maximum amount of market loss to which the contract holder is exposed) or buffer (which defines the amount of the market loss not credited to the contract holder).
We also offer a return of premium death benefit on our RILA. Decreases in equity markets increase the likelihood that a customer’s account value will be insufficient to cover the benefit paid to the beneficiary at the time of a claim following the customer’s death. As a result, the risk associated with such payouts is dependent on both the equity market performance and the time of the claim. See Item 1. Business – “Our Product Offerings by Segment – Retail Annuities” for additional information about RILA.
Risk Management
Our actuarial, asset-liability management and finance functions have responsibility for managing our market risk exposures. Our risk function provides risk oversight and challenge, and our internal audit team provides independent assurance. Our enterprise risk management framework contemplates a wide range of market risks and focuses on exposures and risk limits on a consolidated basis for the Company. A description of our Enterprise Risk Management Framework is provided in “Item 1. Business – Risk Management.”
We have an Asset Liability Management Committee (“ALCO”) that maintains a written Asset Liability Management Policy ("ALM Policy"). ALCO regularly reviews all material financial risks in accordance with our ALM Policy. If market risks exceed predetermined tolerances, management is required to inform the Finance and Risk Committee of our Board of Directors. Management proposes how best to mitigate or address such risks, including equity market and interest rate risks.
Equity Market Risk: We manage equity market risk by both holding sufficient capital and by using derivative-based hedges as described above in our hedging program. We hedge the equity risk embedded within our products by using equity options, total return swaps, and futures on a variety of indices that best represent the equity exposures inherent in the range of underlying investment options available on certain of our annuities.
Interest Rate Risk: We manage interest rate risk by employing product design, pricing and asset-liability management strategies intended to mitigate the potential effects of interest rate movements. Product design and pricing strategies include the use of surrender charges, market value adjustments, restrictions on withdrawals and the ability to reset
88
Part II | Item 7A. Quantitative and Qualitative Disclosures about Market Risk
crediting rates. Our asset-liability management strategies may include the use of derivatives, such as interest rate swaps, interest rate swaptions (also known as a swap option) and interest rate/bond futures, as well as fixed income assets. We manage interest rate risk in aggregate, contemplating natural offsets between products before pursuing hedging transactions.
We analyze interest rate risk using various models, including multi-scenario models that project future cash flows from our product and benefit liabilities and their supporting investments, including derivatives. These projections involve evaluating the potential gain or loss on our in-force business under various increasing and decreasing interest rate environments. State insurance regulations require that we perform some of these analyses annually as part of our review of the sufficiency of our regulatory reserves. We also measure the relative sensitivities of the value of our assets and liabilities to changes in key assumptions utilizing internal models. These models reflect specific product characteristics and include assumptions based on our expectations regarding lapse, mortality and crediting rates.
We also use common industry metrics, such as duration and convexity, to measure the relative sensitivity of asset and liability values to changes in interest rates. In computing the duration of liabilities, we consider all policyholder guarantees as well as non-guaranteed elements of policyholder liabilities.
Our Hedging Approach and Evaluating Hedge Effectiveness
Our hedging program seeks to balance three objectives: protecting against the economic impact of adverse market conditions, protecting our statutory capital, and stabilizing our statutory distributable earnings throughout market cycles. Our core dynamic hedging program seeks to offset changes in economic liability associated with variable, registered index-linked, and fixed indexed annuity guaranteed benefits due to market movements, while our macro hedging program seeks to manage capital and liquidity risk.
Our hedging strategy manages equity and interest rate risk within risk tolerances through a mix of equity and interest rate derivatives and fixed income assets. We do not directly use hedging to offset the movement in our U.S. GAAP liabilities as market conditions change from period to period, which may result in U.S. GAAP net income volatility.
Depending on market conditions and our capital position, we may favor the use of one type of hedging instrument over another. When evaluating the effectiveness of our hedge program we look at the combined net effect of our hedge assets and the liabilities these assets are intended to hedge. We consider our hedge program effective if it is successful in keeping the net effect of these assets and liabilities within our defined risk measures and limits. This analysis of hedge positioning relative to the liabilities these assets are intended to hedge provides our management team a view on the effectiveness of the hedging program.
For our equity market exposure, we compare the impact of changes to equity markets on our hedge assets relative to the liabilities these assets are intended to hedge. For example, in periods with increasing equity markets, we expect significant losses on our equity hedges, but as increasing equity markets also generally increase contract holder account values, we expect a related decrease in the likelihood or level of future payments we need to make on our guaranteed benefits. Likewise, in periods of decreasing markets we expect significant increases in the value of our equity hedges, but also would expect liabilities for future guaranteed benefit payments to increase.
For our interest rate exposure, similar to equity market risk, we evaluate the level of interest rate hedge coverage by comparing the impacts of interest rate movements on our hedge assets relative to the liabilities these assets are intended to hedge. The types of derivative instruments we use to manage interest rate risk are different from those we use to manage equity market risk. We also recognize the sensitivity of our equity hedges to interest rates but believe their contribution to the overall interest rate hedge is small due to their relatively short duration of these derivatives.
Market Risk—Fair Value Exposures
For the purpose of this Item, we define “market risk” as changes in fair value resulting from changes in interest rates or equity market prices. The estimated fair values of certain assets and liabilities may be materially impacted by changes in interest rates and equity markets. Our exposures to interest rates and equity markets also impact our business, financial condition, results of operations and cash flows other than through changes in fair value. See Item 1A. Risk Factors – “Risks Related to Conditions in the Global Financial Markets and Economy.”
89
Part II | Item 7A. Quantitative and Qualitative Disclosures about Market Risk
Risk Measurement—Sensitivity Analysis
In the following discussion and analysis, we measure market risk related to our market sensitive assets and liabilities based on changes in interest rates and equity market prices utilizing an internal sensitivity analysis. Due to our current portfolio structure and holdings, foreign currency movements are not material to the Company. This analysis estimates the potential changes in estimated fair value based on a hypothetical 50 basis point parallel shift (increase or decrease) in risk-free interest rates and a 10% change (increase or decrease) in equity market prices. In performing the analysis summarized below, we used market rates and balance sheet positions as of December 31, 2023 and 2022, respectively. We modeled the impact of changes in market rates and prices on the estimated fair values of our market sensitive assets and liabilities as follows:
•the net present values of our interest rate sensitive exposures resulting from a parallel 50 basis point shift (increase or decrease) in interest rates; and
•the estimated fair value of our equity positions due to a 10% change (increase or decrease) in equity market prices.
The sensitivity analysis reflects hypothetical scenarios and is an estimate as of a specific point in time based on asset and liability positioning on that date. These hypothetical scenarios do not represent management’s view of future market changes and should not be viewed as predictive of our future financial performance. Actual results in any particular period may vary from the amounts indicated in the table below as a result of changes in the composition of our assets and liabilities, market conditions, management actions and other factors.
The sensitivity analysis reflects changes in fair value resulting from changes in interest rates or equity market levels and does not reflect changes in the economic value of assets or liabilities.
The market risk information is limited by the assumptions and parameters established in creating the related sensitivity analysis, including:
•interest-rate sensitive liabilities do not include $65.9 billion and $70.3 billion of policy and contract liabilities as of December 31, 2023 and 2022, respectively, which are accounted for on a book value basis under U.S. GAAP;
•interest-rate sensitive assets do not include assets accounted for on a book value basis under U.S. GAAP, which primarily consist of $10.1 billion and $11.0 billion of mortgage loans as of December 31, 2023 and 2022, respectively;
•the analysis excludes the effect of market or interest rate impacts on assets and liabilities related to our funds withheld reinsurance treaties;
•the analysis excludes real estate holdings;
•the analysis excludes the impact of changes in income taxes; and
•the analysis assumes that the composition of assets and liabilities remains unchanged upon measurement and excludes the impacts of management actions.
Given the limitations described above, we use models as tools and not as substitutes for the experience and judgment of our management. Based on the fair values of the financial instruments and our analysis of the impacts of the measured changes in market rates and prices, we have determined that our interest rate and equity market exposures are material.
90
Part II | Item 7A. Quantitative and Qualitative Disclosures about Market Risk
The table below provides detail regarding the potential change in estimated fair value of our debt securities in addition to our variable annuity, fixed index and RILA market risk benefits and embedded derivatives due to a 50 basis point parallel increase and decrease in the yield curve by type of asset or liability (in millions):
| December 31, 2023 | December 31, 2022 | ||||||||||||||||||||||
| Fair | Impact of | Impact of | Fair | Impact of | Impact of | ||||||||||||||||||
| Value | +50 bps | -50 bps | Value | +50 bps | -50 bps | ||||||||||||||||||
| Change | Change | Change | Change | ||||||||||||||||||||
Debt Securities (1) | |||||||||||||||||||||||
| Floating Rate | $ | 3,019 | $ | (2) | $ | 2 | $ | 3,025 | $ | — | $ | 1 | |||||||||||
| Fixed Rate | 27,982 | (814) | 862 | 27,956 | (906) | 946 | |||||||||||||||||
(1) Includes debt securities that are classified as available-for-sale or trading and includes securities at fair value under the fair value option. | |||||||||||||||||||||||
| December 31, 2023 | December 31, 2022 | ||||||||||||||||||||||
| Fair Value | Impact of +50 bps Change | Impact of -50 bps Change | Fair Value | Impact of +50 bps Change | Impact of -50 bps Change | ||||||||||||||||||
| Fixed index and RILA embedded derivatives | $ | 1,275 | $ | (49) | $ | 52 | $ | 235 | $ | (9) | $ | 9 | |||||||||||
| Market risk benefits | (1,136) | (2,213) | 2,470 | 2,753 | (2,212) | 2,463 | |||||||||||||||||
The fair value of certain market risk benefits reflects the present value of projected benefit payments less the present value of attributed fees. These benefit payments and fees are subject to differing degrees of discounting, as benefit payments are generally projected to occur further in the future as compared to attributed fees. As a result, the degree of sensitivity between the present values of projected fees as compared to the present values of projected benefit payments may result in disproportionate sensitivity impacts relative to the market risk benefits fair value.
The table below provides additional detail regarding the potential change in estimated fair value of our equity investment portfolio in addition to our variable annuity, fixed index and RILA market risk benefits and embedded derivatives due to a 10% increase and decrease in equity market prices by type of asset or liability (in millions):
| December 31, 2023 | December 31, 2022 | ||||||||||||||||||||||
| Fair | Impact of | Impact of | Fair | Impact of | Impact of | ||||||||||||||||||
| Value | 10% | -10% | Value | 10% | -10% | ||||||||||||||||||
| Change | Change | Change | Change | ||||||||||||||||||||
| Equity Securities and Limited Partnerships | $ | 1,665 | $ | (167) | $ | 167 | $ | 2,734 | $ | (273) | $ | 273 | |||||||||||
| December 31, 2023 | December 31, 2022 | ||||||||||||||||||||||
| Fair | Impact of | Impact of | Fair | Impact of | Impact of | ||||||||||||||||||
| Value | 10% | -10% | Value | 10% | -10% | ||||||||||||||||||
| Change | Change | Change | Change | ||||||||||||||||||||
| Fixed index and RILA embedded derivatives | $ | 1,275 | $ | 2 | $ | (5) | $ | 235 | $ | 1 | $ | (3) | |||||||||||
| Market risk benefits | (1,136) | (2,048) | 2,587 | 2,753 | (2,382) | 2,867 | |||||||||||||||||
The fair value of our market risk benefits reflect our contract holders’ exposure to equity market declines. When equity markets increase, this exposure and the related fair value declines.
91
Part II | Item 7A. Quantitative and Qualitative Disclosures about Market Risk
The table below provides details regarding the potential change in estimated fair value of our derivative instruments due to a 50 basis point parallel increase and decrease in the yield curve by type of derivative instrument, as well as the potential change in estimated fair value of our derivative instruments due to a 10% increase and decrease in equity prices (dollars in millions):
| Interest Rate Sensitivity | |||||||||||||||||
| Notional | Weighted | Impact of | Fair | Impact of | |||||||||||||
| Amount | Average Term | +50 bps | Value | -50 bps | |||||||||||||
| (Years) | Change | Change | |||||||||||||||
| December 31, 2023 | |||||||||||||||||
| Swaps | $ | 7,893 | 5.68 | $ | (93) | $ | (120) | $ | 96 | ||||||||
| Swaptions | 23,500 | 0.36 | (612) | (752) | 885 | ||||||||||||
| Interest Rate Futures | 33,926 | 0.25 | (1,011) | — | 1,138 | ||||||||||||
| Total | $ | (1,716) | $ | (872) | $ | 2,119 | |||||||||||
| December 31, 2022 | |||||||||||||||||
| Swaps | $ | 11,053 | 6.01 | $ | (165) | $ | (257) | $ | 174 | ||||||||
| Swaptions | 25,000 | 1.07 | (685) | (1,711) | 647 | ||||||||||||
| Interest Rate Futures | 105,261 | 0.91 | (102) | — | 83 | ||||||||||||
| Total | $ | (952) | $ | (1,968) | $ | 904 | |||||||||||
| Equity Sensitivity | |||||||||||||||||
| Notional | Weighted | Impact of | Fair | Impact of | |||||||||||||
| Amount | Average Term | +10% | Value | -10% | |||||||||||||
| (Years) | Change | Change | |||||||||||||||
| December 31, 2023 | |||||||||||||||||
| Options | |||||||||||||||||
| Calls | $ | — | — | $ | — | $ | — | $ | — | ||||||||
| Puts | 26,000 | 0.07 | (55) | 59 | 1,226 | ||||||||||||
| Total options | 26,000 | 0.07 | (55) | 59 | 1,226 | ||||||||||||
| Equity Futures | 24,739 | 1.81 | (1,452) | — | 1,452 | ||||||||||||
| Total Return Swaps | 1,599 | 4.50 | (162) | (22) | 162 | ||||||||||||
| Total | $ | (1,669) | $ | 37 | $ | 2,840 | |||||||||||
| December 31, 2022 | |||||||||||||||||
| Options | |||||||||||||||||
| Calls | $ | 17,500 | 0.10 | $ | 698 | $ | 106 | $ | (99) | ||||||||
| Puts | 30,500 | 0.77 | (473) | 958 | 1,015 | ||||||||||||
| Total options | 48,000 | 0.53 | 225 | 1,064 | 916 | ||||||||||||
| Equity Futures | 19,760 | 1.78 | (1,988) | — | 1,988 | ||||||||||||
| Total Return Swaps | 739 | 4.34 | (71) | 31 | 71 | ||||||||||||
| Total | $ | (1,834) | $ | 1,095 | $ | 2,975 | |||||||||||
92
Item 8. Financial Statements and Supplementary Data
Report of Independent Registered Public Accounting Firm ( | |||||
Consolidated Balance Sheets as of December 31, 2023 and 2022 | |||||
Consolidated Income Statements for the years ended December 31, 2023, 2022 and 2021 | |||||
Consolidated Statements of Comprehensive Income (Loss) for the years ended December 31, 2023, 2022 and 2021 | |||||
Consolidated Statements of Equity for the years ended December 31, 2023, 2022 and 2021 | |||||
Consolidated Statements of Cash Flows for the years ended December 31, 2023, 2022 and 2021 | |||||
| Financial Statement Schedules: | |||||
Schedule II—Financial Statements of Jackson Financial Inc. (Parent Only) as of December 31, 2023 and 2022 and for the years ended December 31, 2023, 2022 and 2021 | |||||
Schedule III—Supplemental Insurance Information for the years ended December 31, 2023, 2022 and 2021 | |||||
Schedule IV—Reinsurance for the years ended December 31, 2023, 2022 and 2021 | |||||
Schedule V—Valuation and Qualifying Accounts for the years ended December 31, 2023 and 2022 | |||||
93
Report of Independent Registered Public Accounting Firm
To the Shareholders and Board of Directors
Jackson Financial Inc.:
Opinions on the Consolidated Financial Statements and Internal Control Over Financial Reporting
We have audited the accompanying consolidated balance sheets of Jackson Financial Inc. and subsidiaries (the Company) as of December 31, 2023 and 2022, the related consolidated income statements, statements of comprehensive income (loss), equity, and cash flows for each of the years in the three-year period ended December 31, 2023, and the related notes and financial statement schedules I to V (collectively, the consolidated financial statements). We also have audited the Company’s internal control over financial reporting as of December 31, 2023, based on criteria established in Internal Control – Integrated Framework (2013) issued by the Committee of Sponsoring Organizations of the Treadway Commission.
In our opinion, the consolidated financial statements referred to above present fairly, in all material respects, the financial position of the Company as of December 31, 2023 and 2022, and the results of its operations and its cash flows for each of the years in the three-year period ended December 31, 2023, in conformity with U.S. generally accepted accounting principles. Also in our opinion, the Company maintained, in all material respects, effective internal control over financial reporting as of December 31, 2023 based on criteria established in Internal Control – Integrated Framework (2013) issued by the Committee of Sponsoring Organizations of the Treadway Commission.
Change in Accounting Principle
As discussed in Note 2 to the consolidated financial statements, the Company adopted ASU 2018-12, Targeted Improvements to the Accounting for Long Duration Contracts (LDTI), effective January 1, 2023, with a transition date of January 1, 2021.
Basis for Opinions
The Company’s management is responsible for these consolidated financial statements, for maintaining effective internal control over financial reporting, and for its assessment of the effectiveness of internal control over financial reporting, included in the accompanying Management's Report on Internal Control Over Financial Reporting. Our responsibility is to express an opinion on the Company’s consolidated financial statements and an opinion on the Company’s internal control over financial reporting based on our audits. We are a public accounting firm registered with the Public Company Accounting Oversight Board (United States) (PCAOB) and are required to be independent with respect to the Company in accordance with the U.S. federal securities laws and the applicable rules and regulations of the Securities and Exchange Commission and the PCAOB.
We conducted our audits in accordance with the standards of the PCAOB. Those standards require that we plan and perform the audits to obtain reasonable assurance about whether the consolidated financial statements are free of material misstatement, whether due to error or fraud, and whether effective internal control over financial reporting was maintained in all material respects.
Our audits of the consolidated financial statements included performing procedures to assess the risks of material misstatement of the consolidated financial statements, whether due to error or fraud, and performing procedures that respond to those risks. Such procedures included examining, on a test basis, evidence regarding the amounts and disclosures in the consolidated financial statements. Our audits also included evaluating the accounting principles used and significant estimates made by management, as well as evaluating the overall presentation of the consolidated financial statements. Our audit of internal control over financial reporting included obtaining an understanding of internal control over financial reporting, assessing the risk that a material weakness exists, and testing and evaluating the design and operating effectiveness of internal control based on the assessed risk. Our audits also included performing such other procedures as we considered necessary in the circumstances. We believe that our audits provide a reasonable basis for our opinions.
94
Definition and Limitations of Internal Control Over Financial Reporting
A company’s internal control over financial reporting is a process designed to provide reasonable assurance regarding the reliability of financial reporting and the preparation of financial statements for external purposes in accordance with generally accepted accounting principles. A company’s internal control over financial reporting includes those policies and procedures that (1) pertain to the maintenance of records that, in reasonable detail, accurately and fairly reflect the transactions and dispositions of the assets of the company; (2) provide reasonable assurance that transactions are recorded as necessary to permit preparation of financial statements in accordance with generally accepted accounting principles, and that receipts and expenditures of the company are being made only in accordance with authorizations of management and directors of the company; and (3) provide reasonable assurance regarding prevention or timely detection of unauthorized acquisition, use, or disposition of the company’s assets that could have a material effect on the financial statements.
Because of its inherent limitations, internal control over financial reporting may not prevent or detect misstatements. Also, projections of any evaluation of effectiveness to future periods are subject to the risk that controls may become inadequate because of changes in conditions, or that the degree of compliance with the policies or procedures may deteriorate.
Critical Audit Matter
The critical audit matter communicated below is a matter arising from the current period audit of the consolidated financial statements that was communicated or required to be communicated to the audit committee and that: (1) relates to accounts or disclosures that are material to the consolidated financial statements and (2) involved our especially challenging, subjective, or complex judgments. The communication of a critical audit matter does not alter in any way our opinion on the consolidated financial statements, taken as a whole, and we are not, by communicating the critical audit matter below, providing a separate opinion on the critical audit matter or on the accounts or disclosures to which it relates.
Fair value of market risk benefits
As disclosed in Notes 6 and 12, contracts or contract features that provide protection to the contract holder from capital market risk and expose the Company to other-than-nominal capital market risk are classified as market risk benefits (MRBs). The Company estimates MRBs at fair value using subjective judgments related to the discount rate assumptions, including the Company’s nonperformance risk, and actuarially determined assumptions, including mortality, benefit utilization and lapse. As of December 31, 2023, the fair value of MRB assets and liabilities were estimated to be $6,737 million and $4,785 million, respectively.
We identified the evaluation of the fair value of MRB assets and liabilities as a critical audit matter. Specifically, there was a high degree of auditor effort and subjective auditor judgment involved in evaluating the nonperformance risk, mortality, benefit utilization, and lapse assumptions used to estimate the fair value of MRB assets and liabilities. Evaluation of the assumptions required valuation and actuarial professionals with specialized skills and knowledge.
The following are the primary procedures we performed to address this critical audit matter. With the assistance of a valuation professional, we evaluated the design and tested the operating effectiveness of certain internal controls related to the development of the nonperformance risk adjustment used to develop the discount rate assumption. With the assistance of actuarial professionals, we evaluated the design and tested the operating effectiveness of certain internal controls related to the fair value of MRBs, including controls related to the development of the mortality, benefit utilization and lapse assumptions. We involved a valuation professional with specialized skills and knowledge who assisted in evaluating the Company’s nonperformance risk assumption used to estimate the fair value of MRBs, which included assessing the methodology and inputs utilized by the Company by developing an independent credit curve to compare to the credit curve used by the Company. The independent credit curve developed by the valuation professional used market observable instruments issued by the Company and its affiliates, as well as indicative pricing for the Company’s debt, with certain adjustments. We involved actuarial professionals with specialized skills and knowledge, who assisted in evaluating the Company’s estimate of the fair value of MRB assets and liabilities, by:
95
•Evaluating the Company’s methodology for determining mortality, benefit utilization, and lapse assumptions used to estimate the fair value of MRBs for compliance with generally accepted actuarial standards.
•Comparing the mortality, benefit utilization, and lapse assumptions with the Company’s emerging experience or market trends and evaluating reasonableness of these assumptions where deviations from Company experience or market trends were identified.
•Assessing the reasonableness of the Company’s fair value estimate for a selection of policies with MRBs by recalculating the fair value and comparing to the Company’s estimate.
/s/ KPMG LLP
We have served as the Company’s auditor since 1999.
Chicago, Illinois
February 28, 2024
96
Jackson Financial Inc.
Consolidated Balance Sheets
(in millions, except per share data)
| December 31, | ||||||||||||||
| 2023 | 2022 | |||||||||||||
| Assets | ||||||||||||||
| Investments: | ||||||||||||||
Debt Securities, available-for-sale, net of allowance for credit losses of $ | $ | $ | ||||||||||||
| Debt Securities, at fair value under fair value option | ||||||||||||||
| Debt Securities, trading, at fair value | ||||||||||||||
| Equity securities, at fair value | ||||||||||||||
Mortgage loans, net of allowance for credit losses of $ | ||||||||||||||
| Mortgage loans, at fair value under fair value option | ||||||||||||||
Policy loans (including $ | ||||||||||||||
| Freestanding derivative instruments | ||||||||||||||
| Other invested assets | ||||||||||||||
| Total investments | ||||||||||||||
| Cash and cash equivalents | ||||||||||||||
| Accrued investment income | ||||||||||||||
| Deferred acquisition costs | ||||||||||||||
Reinsurance recoverable, net of allowance for credit losses of $ | ||||||||||||||
| Reinsurance recoverable on market risk benefits, at fair value | ||||||||||||||
| Market risk benefit assets, at fair value | ||||||||||||||
| Deferred income taxes, net | ||||||||||||||
| Other assets | ||||||||||||||
| Separate account assets | ||||||||||||||
| Total assets | $ | $ | ||||||||||||
| Liabilities and Equity | ||||||||||||||
| Liabilities | ||||||||||||||
| Reserves for future policy benefits and claims payable | $ | $ | ||||||||||||
| Other contract holder funds | ||||||||||||||
| Market risk benefit liabilities, at fair value | ||||||||||||||
Funds withheld payable under reinsurance treaties (including $ | ||||||||||||||
| Long-term debt | ||||||||||||||
| Repurchase agreements and securities lending payable | ||||||||||||||
| Collateral payable for derivative instruments | ||||||||||||||
| Freestanding derivative instruments | ||||||||||||||
| Notes issued by consolidated variable interest entities, at fair value under fair value option (See Note 4) | ||||||||||||||
| Other liabilities | ||||||||||||||
| Separate account liabilities | ||||||||||||||
| Total liabilities | ||||||||||||||
| Commitments, Contingencies, and Guarantees (See Note 16) | ||||||||||||||
| Equity | ||||||||||||||
Series A non-cumulative preferred stock and additional paid in capital, $ | ||||||||||||||
Common stock; | ||||||||||||||
| Additional paid-in capital | ||||||||||||||
Treasury stock, at cost; | ( | ( | ||||||||||||
Accumulated other comprehensive income (loss), net of tax expense (benefit) of $( | ( | ( | ||||||||||||
| Retained earnings | ||||||||||||||
| Total shareholders' equity | ||||||||||||||
| Noncontrolling interests | ||||||||||||||
| Total equity | ||||||||||||||
| Total liabilities and equity | $ | $ | ||||||||||||
See Notes to Consolidated Financial Statements.
97
Jackson Financial Inc.
Consolidated Income Statements
(in millions, except per share data)
| For the Years Ended December 31, | |||||||||||||||||||||||
| 2023 | 2022 | 2021 | |||||||||||||||||||||
| Revenues | |||||||||||||||||||||||
| Fee income | $ | $ | $ | ||||||||||||||||||||
| Premiums | |||||||||||||||||||||||
| Net investment income: | |||||||||||||||||||||||
| Net investment income excluding funds withheld assets | |||||||||||||||||||||||
| Net investment income on funds withheld assets | |||||||||||||||||||||||
| Total net investment income | |||||||||||||||||||||||
| Net gains (losses) on derivatives and investments: | |||||||||||||||||||||||
| Net gains (losses) on derivatives and investments | ( | ( | ( | ||||||||||||||||||||
| Net gains (losses) on funds withheld reinsurance treaties | ( | ( | |||||||||||||||||||||
| Total net gains (losses) on derivatives and investments | ( | ( | ( | ||||||||||||||||||||
| Other income | |||||||||||||||||||||||
| Total revenues | |||||||||||||||||||||||
| Benefits and Expenses | |||||||||||||||||||||||
| Death, other policy benefits and change in policy reserves, net of deferrals | |||||||||||||||||||||||
| (Gain) loss from updating future policy benefits cash flow assumptions, net | ( | ||||||||||||||||||||||
| Market risk benefits (gains) losses, net | ( | ( | ( | ||||||||||||||||||||
| Interest credited on other contract holder funds, net of deferrals and amortization | |||||||||||||||||||||||
| Interest expense | |||||||||||||||||||||||
| Operating costs and other expenses, net of deferrals | |||||||||||||||||||||||
| Amortization of deferred acquisition costs | |||||||||||||||||||||||
| Total benefits and expenses | |||||||||||||||||||||||
| Pretax income (loss) | |||||||||||||||||||||||
| Income tax expense (benefit) | |||||||||||||||||||||||
| Net income (loss) | |||||||||||||||||||||||
| Less: Net income (loss) attributable to noncontrolling interests | |||||||||||||||||||||||
| Net income (loss) attributable to Jackson Financial Inc. | |||||||||||||||||||||||
| Less: Dividends on preferred stock | |||||||||||||||||||||||
| Net income (loss) attributable to Jackson Financial Inc. common shareholders | $ | $ | $ | ||||||||||||||||||||
| Earnings per share | |||||||||||||||||||||||
| Basic | $ | $ | $ | ||||||||||||||||||||
| Diluted | $ | $ | $ | ||||||||||||||||||||
See Notes to Consolidated Financial Statements.
98
Jackson Financial Inc.
Consolidated Statements of Comprehensive Income (Loss)
(in millions)
| For the Years Ended December 31, | ||||||||||||||||||||
| 2023 | 2022 | 2021 | ||||||||||||||||||
| Net income (loss) | $ | $ | $ | |||||||||||||||||
| Other comprehensive income (loss), net of tax: | ||||||||||||||||||||
Change in unrealized gains (losses) on securities with no credit impairment net of tax expense (benefit) of: $ | ( | ( | ||||||||||||||||||
Change in unrealized gains (losses) on securities with credit impairment, net of tax expense (benefit) of: $( | ( | ( | ||||||||||||||||||
Change in current discount rate related to reserve for future policy benefits, net of tax expense (benefit) of $( | ( | |||||||||||||||||||
Change in non-performance risk on market risk benefits, net of tax expense (benefit) of $( | ( | ( | ||||||||||||||||||
| Total other comprehensive income (loss) | ( | ( | ||||||||||||||||||
| Comprehensive income (loss) | ||||||||||||||||||||
| Less: Comprehensive income (loss) attributable to noncontrolling interests | ||||||||||||||||||||
| Comprehensive income (loss) attributable to Jackson Financial Inc. | $ | $ | $ | |||||||||||||||||
See Notes to Consolidated Financial Statements.
99
Jackson Financial Inc.
Consolidated Statements of Equity
(in millions)
| Accumulated | |||||||||||||||||||||||||||||||||||
| Additional | Treasury | Shares | Equity | Other | Total | Non- | |||||||||||||||||||||||||||||
| Preferred | Common | Paid-In | Stock | Held | Compensation | Comprehensive | Retained | Shareholders' | Controlling | Total | |||||||||||||||||||||||||
| Stock | Stock | Capital | at Cost | In Trust | Reserve | Income (Loss) | Earnings | Equity | Interests | Equity | |||||||||||||||||||||||||
| Balances as of December 31, 2020 | $ | $ | $ | $ | $ | ( | $ | $ | $ | ( | $ | $ | $ | ||||||||||||||||||||||
| Change in accounting principle, net of tax | — | — | — | — | — | ( | ( | — | ( | — | ( | ||||||||||||||||||||||||
| Net income (loss) | — | — | — | — | — | — | — | ||||||||||||||||||||||||||||
| Other comprehensive income (loss) | — | — | — | — | — | — | ( | — | ( | — | ( | ||||||||||||||||||||||||
| Change in equity of noncontrolling interests | — | — | — | — | — | — | — | — | — | ( | ( | ||||||||||||||||||||||||
| Dividends on common stock | — | — | — | — | — | — | — | ( | ( | — | ( | ||||||||||||||||||||||||
| Purchase of treasury stock | — | — | — | — | — | — | — | — | ( | — | ( | ||||||||||||||||||||||||
| Shares sold in connection with demerger | — | — | — | — | — | — | — | ||||||||||||||||||||||||||||
| Share-based compensation | — | — | — | — | — | — | — | — | |||||||||||||||||||||||||||
| Reserve for equity compensation plans | — | — | — | — | — | ( | — | — | ( | — | ( | ||||||||||||||||||||||||
| Balances as of December 31, 2021 | $ | $ | $ | $ | ( | $ | $ | $ | $ | $ | $ | $ | |||||||||||||||||||||||
| Net income (loss) | — | — | — | — | — | — | — | ||||||||||||||||||||||||||||
| Other comprehensive income (loss) | — | — | — | — | — | — | ( | — | ( | — | ( | ||||||||||||||||||||||||
| Change in equity of noncontrolling interests | — | — | — | — | — | — | — | — | — | ||||||||||||||||||||||||||
| Dividends on common stock | — | — | — | — | — | — | — | ( | ( | — | ( | ||||||||||||||||||||||||
| Purchase of treasury stock | — | — | — | ( | — | — | — | — | ( | — | ( | ||||||||||||||||||||||||
| Share-based compensation | — | — | — | — | — | ( | — | ||||||||||||||||||||||||||||
| Balances as of December 31, 2022 | $ | $ | $ | $ | ( | $ | $ | $ | ( | $ | $ | $ | $ | ||||||||||||||||||||||
| Net income (loss) | — | — | — | — | — | — | — | ||||||||||||||||||||||||||||
| Other comprehensive income (loss) | — | — | — | — | — | — | — | — | |||||||||||||||||||||||||||
| Change in equity of noncontrolling interests | — | — | — | — | — | — | — | — | — | ( | ( | ||||||||||||||||||||||||
| Dividends on preferred stock | — | — | — | — | — | — | — | ( | ( | — | ( | ||||||||||||||||||||||||
| Dividends on common stock | — | — | — | — | — | — | — | ( | ( | — | ( | ||||||||||||||||||||||||
| Purchase of treasury stock | — | — | — | ( | — | — | — | — | ( | — | ( | ||||||||||||||||||||||||
| Share-based compensation | — | — | ( | — | — | — | ( | — | |||||||||||||||||||||||||||
| Issuance of preferred stock | — | — | — | — | — | — | — | — | |||||||||||||||||||||||||||
| Balances as of December 31, 2023 | $ | $ | $ | $ | ( | $ | $ | $ | ( | $ | $ | $ | $ | ||||||||||||||||||||||
See Notes to Consolidated Financial Statements.
100
Jackson Financial Inc.
Consolidated Statements of Cash Flows
(in millions)
| Years Ended December 31, | ||||||||||||||||||||
| 2023 | 2022 | 2021 | ||||||||||||||||||
| Cash flows from operating activities: | ||||||||||||||||||||
| Net income (loss) | $ | $ | $ | |||||||||||||||||
| Adjustments to reconcile net income to net cash provided by operating activities: | ||||||||||||||||||||
| Net realized losses (gains) on investments | ( | |||||||||||||||||||
| Net losses (gains) on derivatives | ||||||||||||||||||||
| Net losses (gains) on funds withheld reinsurance treaties | ( | |||||||||||||||||||
| Net (gain) loss on market risk benefits | ( | ( | ( | |||||||||||||||||
| (Gain) loss from updating future policy benefits cash flow assumptions, net | ( | |||||||||||||||||||
| Interest credited on other contract holder funds, gross | ||||||||||||||||||||
| Mortality, expense and surrender charges | ( | ( | ( | |||||||||||||||||
| Amortization of discount and premium on investments | ( | |||||||||||||||||||
| Deferred income tax expense (benefit) | ( | |||||||||||||||||||
| Share-based compensation expense | ||||||||||||||||||||
| Change in: | ||||||||||||||||||||
| Accrued investment income | ( | |||||||||||||||||||
| Deferred acquisition costs | ||||||||||||||||||||
| Funds withheld, net of reinsurance | ( | ( | ( | |||||||||||||||||
| Future policy benefits | ( | ( | ( | |||||||||||||||||
| Other assets and liabilities, net | ||||||||||||||||||||
| Net cash provided by (used in) operating activities | ||||||||||||||||||||
| Cash flows from investing activities: | ||||||||||||||||||||
| Sales, maturities and repayments of: | ||||||||||||||||||||
| Debt securities | ||||||||||||||||||||
| Equity securities | ||||||||||||||||||||
| Mortgage loans | ||||||||||||||||||||
| Purchases of: | ||||||||||||||||||||
| Debt securities | ( | ( | ( | |||||||||||||||||
| Equity securities | ( | ( | ( | |||||||||||||||||
| Mortgage loans | ( | ( | ( | |||||||||||||||||
| Settlements related to derivatives and collateral on investments | ( | ( | ( | |||||||||||||||||
| Other investing activities | ( | ( | ||||||||||||||||||
| Net cash provided by (used in) investing activities | ( | ( | ( | |||||||||||||||||
(continued)
See Notes to Consolidated Financial Statements.
101
Jackson Financial Inc.
Consolidated Statements of Cash Flows (continued)
(in millions)
| Years Ended December 31, | ||||||||||||||||||||
| 2023 | 2022 | 2021 | ||||||||||||||||||
| Cash flows from financing activities: | ||||||||||||||||||||
| Policyholders' account balances: | ||||||||||||||||||||
| Deposits | ||||||||||||||||||||
| Withdrawals | ( | ( | ( | |||||||||||||||||
| Net transfers to separate accounts | ||||||||||||||||||||
| Proceeds from (payments on) repurchase agreements and securities lending | ( | ( | ||||||||||||||||||
| Net proceeds from (payments on) Federal Home Loan Bank notes | ( | |||||||||||||||||||
| Proceeds from debt | ||||||||||||||||||||
| Payments on debt | ( | ( | ( | |||||||||||||||||
| Debt issuance costs | ( | ( | ||||||||||||||||||
| Issuance of debt of consolidated investment entities | ||||||||||||||||||||
| Repayments of debt of consolidated investment entities | ( | |||||||||||||||||||
| Contributions from partners of consolidated investments | ||||||||||||||||||||
| Distributions from partners of consolidated investments | ( | |||||||||||||||||||
| Disposition of shares held in trust at cost, net | ||||||||||||||||||||
| Dividends on common stock | ( | ( | ( | |||||||||||||||||
| Dividends on preferred stock | ( | |||||||||||||||||||
| Purchase of treasury stock | ( | ( | ( | |||||||||||||||||
| Issuance of preferred stock | ||||||||||||||||||||
| Net cash provided by (used in) financing activities | ( | ( | ( | |||||||||||||||||
| Net increase (decrease) in cash, cash equivalents, and restricted cash | ( | |||||||||||||||||||
| Cash, cash equivalents, and restricted cash at beginning of period | ||||||||||||||||||||
| Total cash, cash equivalents, and restricted cash at end of period | $ | $ | $ | |||||||||||||||||
| Supplemental cash flow information | ||||||||||||||||||||
| Income taxes paid (received) | $ | ( | $ | ( | $ | ( | ||||||||||||||
| Interest paid | $ | $ | $ | |||||||||||||||||
| Non-cash investing activities | ||||||||||||||||||||
| Debt securities acquired from exchanges, payments-in-kind, and similar transactions | $ | $ | $ | |||||||||||||||||
| Other invested assets acquired from stock splits and stock distributions | $ | $ | $ | |||||||||||||||||
| Non-cash financing activities | ||||||||||||||||||||
| Non-cash dividend equivalents on stock based awards | $ | ( | $ | ( | $ | |||||||||||||||
| Reconciliation to Consolidated Balance Sheets | ||||||||||||||||||||
| Cash and cash equivalents | $ | $ | $ | |||||||||||||||||
| Restricted cash (included in Other assets) | ||||||||||||||||||||
| Total cash, cash equivalents, and restricted cash | $ | $ | $ | |||||||||||||||||
See Notes to Consolidated Financial Statements.
102
Jackson Financial Inc.
Notes to Consolidated Financial Statements
1. Business and Basis of Presentation
Jackson Financial Inc. ("JFI" or “Jackson Financial”) together with its subsidiaries (the “Company,” which also may be referred to as “we,” “our” or “us”), is a financial services company focused on helping Americans grow and protect their retirement savings and income to enable them to pursue financial freedom for life. Jackson Financial is domiciled in the state of Delaware in the United States (“U.S.”).
We were previously a majority-owned subsidiary of Prudential plc ("Prudential"), London, England and served as the holding company for its U.S. operations. The Company's demerger from Prudential was completed on September 13, 2021 ("Demerger"), and the Company is a stand-alone U.S. public company. Prudential retained an equity interest in us after the Demerger. As a result of sales subsequent to the Demerger, Prudential has no remaining equity interest in the Company as of June 30, 2023.
Jackson Financial’s primary life insurance subsidiary, Jackson National Life Insurance Company and its insurance subsidiaries (collectively, “Jackson”), is licensed to sell group and individual annuity products (including immediate, registered index-linked, deferred fixed, fixed index and variable annuities), and individual life insurance products, including variable universal life, in all 50 states and the District of Columbia. Jackson also participates in the institutional products market through the issuance of guaranteed investment contracts (“GICs”), funding agreements and medium-term note funding agreements. In addition to Jackson, Jackson Financial’s other operating subsidiaries are as follows:
•PPM America, Inc. (“PPM”), is the Company’s investment management operation that manages the life insurance companies’ general account investment funds. PPM also provides investment services to other former affiliated and unaffiliated institutional clients.
•Brooke Life Insurance Company (“Brooke Life”), Jackson’s direct parent, is a life insurance company licensed to sell life insurance and annuity products in the state of Michigan.
Other wholly-owned subsidiaries of Jackson are as follows:
•Life insurers: Jackson National Life Insurance Company of New York (“Jackson NY” or “JNY”); Squire Reassurance Company LLC (“Squire Re”); Squire Reassurance Company II, Inc. (“Squire Re II”); and VFL International Life Company SPC, LTD;
•Registered broker-dealer: Jackson National Life Distributors LLC (“JNLD”);
•Registered investment adviser: Jackson National Asset Management LLC (“JNAM”), which manages the life insurance companies' separate account funds underlying our variable annuities products, which funds are sub-advised. JNAM manages and oversees those sub-advisers; and
•Other insignificant wholly-owned subsidiaries.
The Company's Consolidated Financial Statements also include other insignificant partnerships, limited liability companies (“LLCs”) and other variable interest entities (“VIEs”) in which the Company is deemed the primary beneficiary.
Basis of Presentation
The Company adopted Accounting Standards Update (“ASU”) 2018-12, “Targeted Improvements to the Accounting for Long-Duration Contracts” (“LDTI”), effective January 1, 2023, with a transition date of January 1, 2021. See Note 2 - Summary of Significant Accounting Policies of Notes to Consolidated Financial Statements for further description of our adoption of LDTI. New accounting policies adopted for LDTI are included in Notes 7, 8, 9, 10, 11, and 12 to the Consolidated Financial Statements in this Form 10-K.
103
Part II | Item 8. Notes to Consolidated Financial Statements | 1. Business and Basis of Presentation
Use of Estimates
The preparation of these Consolidated Financial Statements in conformity with U.S. GAAP requires the use of estimates and assumptions about future events that affect the amounts reported in the Consolidated Financial Statements and the accompanying notes. Significant estimates or assumptions, as further discussed in these notes, include:
•Valuation of investments and derivative instruments, including fair values of securities deemed to be in an illiquid market and the determination of when an impairment is necessary;
•Assessments as to whether certain entities are VIEs, the existence of reconsideration events and the determination of which party, if any, should consolidate the entity;
•Assumptions used in calculating policy reserves and liabilities including policyholder behavior, mortality rates, expenses, investment returns and policy crediting rates;
•Assumptions as to future earnings levels being sufficient to realize deferred tax benefits;
•Estimates related to expectations of credit losses on certain financial assets and off-balance sheet exposures;
•Assumptions and estimates associated with the Company’s tax positions, including an estimate of the dividends received deduction, which impact the amount of recognized tax benefits recorded by the Company;
•Assumptions used in calculating market risk benefits, including policyholder behavior, mortality rates, and capital market assumptions; and
•Assumptions impacting the expected term used in amortizing deferred acquisition costs, including policyholder behavior and mortality rates.
These estimates and assumptions are based on management’s best estimates and judgments. Management evaluates its estimates and assumptions on an ongoing basis using historical experience and other appropriate factors. As facts and circumstances dictate, these estimates and assumptions may be adjusted. Since future events and their effects cannot be determined with precision, actual results could differ significantly from these estimates. Changes in estimates, including those resulting from continuing changes in the economic environment, will be reflected in the Consolidated Financial Statements in the periods the estimates are changed.
104
Part II | Item 8. Notes to Consolidated Financial Statements | 2. Summary of Significant Accounting Policies
2. Summary of Significant Accounting Policies
The following table identifies our significant accounting policies presented in other Notes to Consolidated Financial Statements:
| Investments | Note 4 | ||||
| Derivatives and Hedge Accounting | Note 5 | ||||
| Fair Value Measurements | Note 6 | ||||
| Deferred Acquisition Costs | Note 7 | ||||
| Reinsurance | Note 8 | ||||
| Reserves for Future Policy Benefits and Claims Payable | Note 9 | ||||
| Other Contract Holder Funds | Note 10 | ||||
| Separate Account Assets and Liabilities | Note 11 | ||||
| Market Risk Benefits | Note 12 | ||||
| Long-Term Debt | Note 13 | ||||
| Income Taxes | Note 15 | ||||
| Commitments, Contingencies, and Guarantees | Note 16 | ||||
| Share-Based Compensation | Note 18 | ||||
| Accumulated Other Comprehensive Income (Loss) | Note 23 | ||||
| Earnings Per Share | Note 25 | ||||
Other Significant Accounting Policies
Cash and Cash Equivalents
Cash and cash equivalents primarily include money market instruments and bank deposits. Cash equivalents also include
all highly liquid securities and other investments purchased with an original or remaining maturity of three months or less
at the date of purchase.
Revenue and Expense Recognition
Premiums for traditional life insurance and limited-payment insurance contracts are reported as revenues when due. Benefits, claims and expenses are associated with earned revenues in order to recognize profit over the lives of the contracts. This association is accomplished through provisions for future policy benefits and the deferral and amortization of certain acquisition costs.
Deposits on interest-sensitive life products and investment contracts, principally deferred annuities and guaranteed investment contracts, are treated as policyholder deposits and excluded from revenue. Revenues consist primarily of investment income and charges assessed against the account value for mortality charges, surrenders, variable annuity benefit guarantees and administrative expenses. Fee income also includes revenues related to asset management fees and certain service fees. Surrender benefits are treated as repayments of the policyholder account. Annuity benefit payments are treated as reductions to the policyholder account. Death benefits in excess of the policyholder account are recognized as an expense when incurred. Expenses consist primarily of the interest credited to policyholder deposits. Acquisition expenses directly related to the successful acquisition of these contracts are deferred. These deferred acquisition costs are amortized on a constant-level basis over the expected term of the contracts. Expenses not related to policy acquisition are recognized when incurred.
Management Fees Based on a Formula
PPM receives an investment management fee for services as an asset manager for various entities. Revenue for these services is measured based on the terms specified in a customer's contract and is recognized when PPM has satisfied a performance obligation. These investment management fees are recognized ratably over the period that assets are managed, and when the probability of significant revenue reversal is remote. PPM also receives performance-based incentive fees from certain entities for which it invests based on predetermined formulas. Performance related management fees are earned over a specified period and can result in additional fees. These fees are recognized at the end of the agreement, once
105
Part II | Item 8. Notes to Consolidated Financial Statements | 2. Summary of Significant Accounting Policies
the fees are fixed, determinable, not subject to further performance metrics, and probability of significant revenue reversal is remote.
Changes in Accounting Principles – Adopted in Current Year
In March 2020, the Financial Accounting Standards Board (“FASB”) issued ASU 2020-04, “Reference Rate Reform (Topic 848): Facilitation of the Effects of Reference Rate Reform on Financial Reporting.” The guidance provides optional expedients for applying U.S. GAAP to contracts and other transactions affected by reference rate reform and is effective for contract modifications made between March 12, 2020 and December 31, 2022. In December 2022, the FASB issued ASU 2022-06, “Reference Rate Reform (Topic 848): Deferral of the Sunset Date of Topic 848” that defers the sunset date of Topic 848 from December 31, 2022 to December 31, 2024, after which entities will no longer be permitted to apply the relief in Topic 848. If certain criteria are met, an entity will not be required to remeasure or reassess contracts impacted by reference rate reform. The practical expedient allowed by this standard was elected and is being applied prospectively by the Company as reference rate reform unfolds. The contracts modified to date met the criteria for the practical expedient and therefore had no material impact on the Company’s Consolidated Financial Statements. The Company will continue to evaluate the impacts of reference rate reform on contract modifications and other transactions through December 31, 2024.
In August 2018, the FASB issued ASU 2018-12, “Targeted Improvements to the Accounting for Long Duration Contracts,” ("LDTI"), which included changes to the existing recognition, measurement, presentation and disclosure requirements for long-duration contracts issued by an insurance entity. The Company adopted LDTI effective January 1, 2023, with a transition date of January 1, 2021, using the modified retrospective transition method relating to liabilities for traditional and limited payment contracts and deferred policy acquisition costs associated therewith; and on a retrospective basis, in relation to market risk benefits ("MRBs").
Under the modified retrospective approach, the Company applied the guidance to contracts in force on the transition date on the basis of their existing carrying value, using updated future cash flow assumptions, and eliminated certain related amounts in accumulated other comprehensive income (loss) (“AOCI”). Under the full retrospective transition approach, the Company applied the guidance as of the transition date, using actual historical assumption information as of contract inception, as if the accounting principle had always been applied.
Amounts reported as of December 31, 2023 and 2022 and for the years ended December 31, 2023, 2022 and 2021 within these Consolidated Financial Statements are accounted for and presented in accordance with U.S. GAAP reflecting the adoption of LDTI.
LDTI contains four significant changes:
1.Market risk benefits: market risk benefits, a new term for certain contract features that provide for potential benefits in addition to the account balance that expose the Company to other-than-nominal market risk (for example, guaranteed benefits on annuity contracts, including guaranteed minimum withdrawal benefits and guaranteed minimum death benefits on variable annuities), are measured at fair value. Changes in fair value are recorded and presented separately within the income statement, with the exception of changes in fair value due to non-performance risk, which are recognized in other comprehensive income (loss) (“OCI”);
2.Deferred acquisition costs: deferred acquisition costs (“DAC”) are amortized on a constant-level basis, independent of profitability of the underlying business;
3.Liability for future policy benefits: annual review and, if necessary, update of cash flow assumptions used to measure the liability for future policy benefits for nonparticipating traditional and limited-payment insurance contracts is required. These liabilities are discounted using an upper-medium grade fixed income instrument yield which is updated quarterly, with related changes in the liability recognized in OCI; and
4.Enhanced disclosures: enhanced disclosures, including disaggregated roll-forwards of certain balance sheet accounts that provide information about actual and expected cash flows, as well as information about significant inputs, judgments, assumptions and methods used in measurement, are required. The enhanced disclosures are intended to improve the ability of users of the financial statements to evaluate the timing, amount, and uncertainty of cash flows arising from long-duration contracts.
106
Part II | Item 8. Notes to Consolidated Financial Statements | 2. Summary of Significant Accounting Policies
The adoption of LDTI resulted in a decrease in total equity of $3.0 billion as of the transition date of January 1, 2021, comprised of a reduction in AOCI of $0.4 billion and a reduction in retained earnings of $2.6 billion. The primary drivers for this impact to total equity included:
1.the classification of certain benefits as market risk benefits, which were remeasured at fair value as of the transition date. The resulting change in the value of these benefits at the transition date, net of the related deferred tax effect, is recognized in retained earnings, with the exception of the cumulative effect of changes in non-performance risk, net of the related deferred tax effect, which is recognized in AOCI;
2.changes to the discount rate used to measure liabilities for future policyholder benefits which, under LDTI, are remeasured each reporting period using current upper-medium grade fixed-income instrument yields, which are generally considered to be those on single-A rated public corporate debt. The cumulative effect of the remeasurement of these liabilities using the transition date discount rate, net of the related deferred tax effect, is recognized in AOCI; and
3.the removal of certain shadow adjustments previously recorded in AOCI related to the impact of unrealized gains (losses) on investments that were included in the estimated gross profit amortization calculation for deferred acquisition costs, which, since the adoption of LDTI, are no longer recognized.
The following table presents the effect of transition adjustments on shareholders' equity due to the adoption of LDTI (in millions):
| January 1, 2021 | |||||||||||
| Accumulated other | |||||||||||
| Retained earnings | comprehensive income | ||||||||||
| Deferred acquisition costs | $ | $ | |||||||||
| Reinsurance recoverable on market risk benefits | ( | ||||||||||
| Reserves for future policy benefits and claims payable | |||||||||||
| Market risk benefits | ( | ( | |||||||||
| Total | $ | ( | $ | ( | |||||||
The following table presents amounts previously reported as of December 31, 2020, to reflect the effect of the change due to the adoption of LDTI, and the adjusted amounts as of January 1, 2021 (in millions):
| As Previously | Effect of | As of | ||||||||||||||||||
| Reported | Changes | 1/1/2021 | ||||||||||||||||||
| Assets | ||||||||||||||||||||
| Deferred acquisition costs | $ | $ | $ | |||||||||||||||||
| Reinsurance recoverable, net of allowance for credit losses | ( | |||||||||||||||||||
| Reinsurance recoverable on market risk benefits, at fair value | ||||||||||||||||||||
| Market risk benefit assets, at fair value | ||||||||||||||||||||
| Deferred income taxes, net | ||||||||||||||||||||
| Other assets | ||||||||||||||||||||
| Total assets | $ | $ | $ | |||||||||||||||||
| Liabilities and Equity | ||||||||||||||||||||
| Liabilities | ||||||||||||||||||||
| Reserves for future policy benefits and claims payable | $ | $ | ( | $ | ||||||||||||||||
| Other contract holder funds | ( | |||||||||||||||||||
| Market risk benefit liabilities, at fair value | ||||||||||||||||||||
| Total liabilities | ||||||||||||||||||||
| Equity | ||||||||||||||||||||
| Accumulated other comprehensive income, net of tax expense | ( | |||||||||||||||||||
| Retained earnings | ( | ( | ( | |||||||||||||||||
| Total equity | ( | |||||||||||||||||||
| Total liabilities and equity | $ | $ | $ | |||||||||||||||||
107
Part II | Item 8. Notes to Consolidated Financial Statements | 2. Summary of Significant Accounting Policies
Liability for future policy benefits
For the liability for future policy benefits, the net transition adjustment is related to the difference in the discount rate used pre-transition and the discount rate at January 1, 2021. The discount rate used to measure the liability at transition was generally lower than the rates used to measure the liability prior to the adoption of LDTI. Additionally, at transition, where net premiums exceeded gross premiums at the cohort level, the Company set net premiums equal to gross premiums and recognized the resulting increase in the liability for future policy benefits as an adjustment to opening retained earnings.
The following table presents the impact of the adoption of LDTI, as of the transition date, on reserves for future policy benefits and claims payable (in millions):
| Payout | Closed | Closed | |||||||||||||||||||||
| Annuities | Block Life | Block Annuity | Total | ||||||||||||||||||||
| Reserves for future policy benefits at December 31, 2020 | $ | $ | $ | $ | |||||||||||||||||||
| Adjustment for loss contracts under the modified retrospective approach | |||||||||||||||||||||||
| Effect of remeasurement of liability at current discount rate | |||||||||||||||||||||||
| Reserves for future policy benefits at January 1, 2021 | $ | $ | $ | $ | |||||||||||||||||||
| Other future policy benefits and claims payable | |||||||||||||||||||||||
| Reserves for future policy benefits and claims payable at January 1, 2021 | $ | ||||||||||||||||||||||
The following table presents the transition date reclassifications and adjustments to reserves for future policy benefits by category resulting from the adoption of LDTI (in millions):
| Reserve for future policy benefits | Other (1) | Total | |||||||||||||||
| Reserve for future policy benefits and claims payable at December 31, 2020 | $ | $ | $ | ||||||||||||||
| Adjustments for LDTI transition | ( | ( | |||||||||||||||
| Reserve for future policy benefits and claims payable at January 1, 2021 | $ | $ | $ | ||||||||||||||
(1) Includes variable annuity embedded derivatives that were reclassed to market risk benefits.
The following table presents the impact of the adoption of LDTI, as of the transition date, on Closed Block Life additional liabilities for universal life-type contracts (in millions):
| Closed Block Life | |||||
| Balance, December 31, 2020 | $ | ||||
| Adjustment for reversal of AOCI adjustments | |||||
| Adjustment for cumulative effect of adoption of LDTI | |||||
| Balance, January 1, 2021 | $ | ||||
Market risk benefits
For MRBs, the net transition adjustment relates to the measurement of certain guaranteed benefit features at fair value that were previously measured using an insurance accrual model. The measurement of these features at fair value includes use of generally lower discount rates and lower assumed future fund performance relative to their previous measurement, as well as inclusion of risk margins, all of which lead to a generally higher fair value balance relative to the carrying value prior to transition to LDTI.
The transition adjustment to AOCI for MRBs relates to the effect of changes in the non-performance risk between the contract issuance date and the transition date. The remaining difference between the carrying value of these contract features under the insurance accrual model prior to transition to LDTI and the fair value measured at transition was recorded as an adjustment to retained earnings as of the transition date.
108
Part II | Item 8. Notes to Consolidated Financial Statements | 2. Summary of Significant Accounting Policies
The following table presents the impact of the adoption of LDTI, as of the transition date, on MRBs, net (in millions):
| Variable | Other | ||||||||||||||||
| Annuities | Product Lines | Total | |||||||||||||||
| Balance, December 31, 2020 - Carrying amount of MRBs under prior guidance | $ | $ | $ | ||||||||||||||
| Adjustment for reversal of AOCI adjustments | ( | ( | ( | ||||||||||||||
| Cumulative effect of the changes in non-performance risk between the original contract issuance date and the transition date | ( | ( | ( | ||||||||||||||
| Remaining cumulative difference (exclusive of non-performance risk change) between 12/31/20 carrying amount and fair value measurement for the MRBs | |||||||||||||||||
| Balance, January 1, 2021 - Market risk benefits, net, at fair value | $ | $ | $ | ||||||||||||||
Deferred acquisition costs
For DAC, at transition to LDTI, the Company removed shadow adjustments previously recorded in AOCI for the impact of unrealized gains and losses that were included in the estimated gross profit amortization calculation prior to the adoption of LDTI.
The following table presents the impact of the adoption of LDTI, as of the transition date, on DAC (in millions):
| Variable | Other | ||||||||||||||||
| Annuities | Product Lines | Total | |||||||||||||||
| Balance, December 31, 2020 - Deferred acquisition costs | $ | $ | $ | ||||||||||||||
| Adjustment for reversal of AOCI adjustments | ( | ||||||||||||||||
| Balance, January 1, 2021 - Deferred acquisition costs | $ | $ | $ | ||||||||||||||
Reinsurance recoverable
The following table presents the impact of the adoption of LDTI, as of the transition date, on reinsurance recoverable (in millions):
| Total | |||||
| Balance, December 31, 2020 | $ | ||||
| Reclass of carrying amount of MRBs under prior guidance | ( | ||||
| Adjustment for loss contracts under the modified retrospective approach | |||||
| Effect of remeasurement of liability at current discount rate | |||||
| Balance, January 1, 2021 | $ | ||||
The following table presents the impact of the adoption of LDTI, as of the transition date, on reinsurance recoverable on market risk benefits at fair value (in millions):
| Variable | Other | ||||||||||||||||
| Annuities | Product Lines | Total | |||||||||||||||
| Balance, December 31, 2020 - Carrying amount of MRBs under prior guidance | $ | $ | $ | ||||||||||||||
| Adjustment for reversal of AOCI adjustments | ( | ( | |||||||||||||||
| Cumulative difference between 12/31/2020 carrying amount and fair value measurement for the MRBs | |||||||||||||||||
| Balance, January 1, 2021 - Reinsurance recoverable on market risk benefits at fair value | $ | $ | $ | ||||||||||||||
The adoption of LDTI resulted in increases in net income attributable to Jackson Financial of $489 million and $234 million for the years ended December 31, 2022 and 2021, respectively, and also resulted in an increase in total equity of $223 million for the year ended December 31, 2022.
109
Part II | Item 8. Notes to Consolidated Financial Statements | 2. Summary of Significant Accounting Policies
The following table presents amounts previously reported in the Consolidated Balance Sheets as of December 31, 2022, to reflect the effect of the change due to the adoption of LDTI, and the adjusted amounts as of December 31, 2022 (in millions):
| As Previously | As Adjusted | ||||||||||||||||
| Reported | Effect of | As of | |||||||||||||||
| December 31, 2022 | Changes | December 31, 2022 | |||||||||||||||
| Assets | |||||||||||||||||
| Deferred acquisition costs | $ | $ | ( | $ | |||||||||||||
| Reinsurance recoverable, net of allowance for credit losses | ( | ||||||||||||||||
| Reinsurance recoverable on market risk benefits, at fair value | |||||||||||||||||
| Market risk benefit assets, at fair value | |||||||||||||||||
| Deferred income taxes, net | ( | ||||||||||||||||
| Other assets | ( | ||||||||||||||||
| Total assets | $ | $ | $ | ||||||||||||||
| Liabilities and Equity | |||||||||||||||||
| Liabilities | |||||||||||||||||
| Reserves for future policy benefits and claims payable | $ | $ | ( | $ | |||||||||||||
| Other contract holder funds | ( | ||||||||||||||||
| Market risk benefit liabilities, at fair value | |||||||||||||||||
| Total liabilities | |||||||||||||||||
| Equity | |||||||||||||||||
| Accumulated other comprehensive income, net of tax expense | ( | ( | |||||||||||||||
| Retained earnings | ( | ||||||||||||||||
| Total equity | |||||||||||||||||
| Total liabilities and equity | $ | $ | $ | ||||||||||||||
The following tables present amounts previously reported in the Consolidated Income Statements for the years ended December 31, 2022 and 2021, to reflect the effect of the change due to the adoption of LDTI, and the adjusted amounts (in millions, except per share amounts):
| As Previously | |||||||||||||||||
| Reported for | As Adjusted | ||||||||||||||||
| the Year Ended | Year Ended | ||||||||||||||||
| December 31, | Effect of | December 31, | |||||||||||||||
| 2022 | Changes | 2022 | |||||||||||||||
| Revenues | |||||||||||||||||
| Total net gains (losses) on derivatives and investments | $ | $ | ( | $ | ( | ||||||||||||
| Total revenues | ( | ||||||||||||||||
| Benefits and Expenses | |||||||||||||||||
| Death, other policy benefits and change in policy reserves, net of deferrals | ( | ||||||||||||||||
| (Gain) loss from updating future policy benefits cash flow assumptions, net | ( | ( | |||||||||||||||
| Market risk benefits (gains) losses, net | ( | ( | |||||||||||||||
| Interest credited on other contract holder funds, net of deferrals and amortization | |||||||||||||||||
| Amortization of deferred acquisition costs | ( | ||||||||||||||||
| Total benefits and expenses | ( | ||||||||||||||||
| Pretax income (loss) | |||||||||||||||||
| Income tax expense (benefit) | |||||||||||||||||
| Net income (loss) | |||||||||||||||||
| Net income (loss) attributable to Jackson Financial Inc. | $ | $ | $ | ||||||||||||||
| Earnings per share | |||||||||||||||||
| Basic | $ | $ | $ | ||||||||||||||
| Diluted | $ | $ | $ | ||||||||||||||
110
Part II | Item 8. Notes to Consolidated Financial Statements | 2. Summary of Significant Accounting Policies
| As Previously | |||||||||||||||||
| Reported for | As Adjusted | ||||||||||||||||
| the Year Ended | Year Ended | ||||||||||||||||
| December 31, | Effect of | December 31, | |||||||||||||||
| 2021 | Changes | 2021 | |||||||||||||||
| Revenues | |||||||||||||||||
| Total net gains (losses) on derivatives and investments | $ | ( | $ | ( | $ | ( | |||||||||||
| Total revenues | ( | ||||||||||||||||
| Benefits and Expenses | |||||||||||||||||
| Death, other policy benefits and change in policy reserves, net of deferrals | ( | ||||||||||||||||
| (Gain) loss from updating future policy benefits cash flow assumptions, net | |||||||||||||||||
| Market risk benefits (gains) losses, net | ( | ( | |||||||||||||||
| Interest credited on other contract holder funds, net of deferrals and amortization | ( | ||||||||||||||||
| Amortization of deferred acquisition costs | |||||||||||||||||
| Total benefits and expenses | ( | ||||||||||||||||
| Pretax income (loss) | |||||||||||||||||
| Income tax expense (benefit) | |||||||||||||||||
| Net income (loss) | |||||||||||||||||
| Net income (loss) attributable to Jackson Financial Inc. | $ | $ | $ | ||||||||||||||
| Earnings per share | |||||||||||||||||
| Basic | $ | $ | $ | ||||||||||||||
| Diluted | $ | $ | $ | ||||||||||||||
111
Part II | Item 8. Notes to Consolidated Financial Statements | 2. Summary of Significant Accounting Policies
The following tables present amounts previously reported in Consolidated Statements of Comprehensive Income (Loss) for the years ended December 31, 2022 and 2021, to reflect the effect of the change due to the adoption of LDTI, and the adjusted amounts (in millions):
| As Previously | |||||||||||||||||
| Reported for the | As Adjusted | ||||||||||||||||
| Year Ended | Year Ended | ||||||||||||||||
| December 31, | Effect of | December 31, | |||||||||||||||
| 2022 | Changes | 2022 | |||||||||||||||
| Net income (loss) | $ | $ | $ | ||||||||||||||
| Other comprehensive income (loss), net of tax: | |||||||||||||||||
| Change in unrealized gains (losses) on securities with no credit impairment, net of tax expense (benefit) | ( | ( | ( | ||||||||||||||
| Change in current discount rate related to reserve for future policy benefits, net of tax expense (benefit) | |||||||||||||||||
| Change in non-performance risk on market risk benefits, net of tax expense (benefit) | |||||||||||||||||
| Total other comprehensive income (loss) | ( | ( | |||||||||||||||
| Comprehensive income (loss) attributable to Jackson Financial Inc. | $ | ( | $ | $ | |||||||||||||
| As Previously | |||||||||||||||||
| Reported for the | As Adjusted | ||||||||||||||||
| Year Ended | Year Ended | ||||||||||||||||
| December 31, | Effect of | December 31, | |||||||||||||||
| 2021 | Changes | 2021 | |||||||||||||||
| Net income (loss) | $ | $ | $ | ||||||||||||||
| Other comprehensive income (loss), net of tax: | |||||||||||||||||
| Change in unrealized gains (losses) on securities with no credit impairment, net of tax expense (benefit) | ( | ( | ( | ||||||||||||||
| Change in current discount rate related to reserve for future policy benefits, net of tax expense (benefit) | |||||||||||||||||
| Change in non-performance risk on market risk benefits, net of tax expense (benefit) | ( | ( | |||||||||||||||
| Total other comprehensive income (loss) | ( | ( | |||||||||||||||
| Comprehensive income (loss) attributable to Jackson Financial Inc. | $ | $ | $ | ||||||||||||||
112
Part II | Item 8. Notes to Consolidated Financial Statements | 2. Summary of Significant Accounting Policies
The adoption of LDTI did not affect the previously reported totals for net cash flows provided by (used in) operating, investing, or financing activities, but did affect the following components of net cash flows provided by (used in) operating activities:
| As Previously | |||||||||||||||||
| Reported for the | As Adjusted | ||||||||||||||||
| Year Ended | Year Ended | ||||||||||||||||
| December 31, | Effect of | December 31, | |||||||||||||||
| 2022 | Changes | 2022 | |||||||||||||||
| Cash flows from operating activities: | |||||||||||||||||
| Net income | $ | $ | $ | ||||||||||||||
| Adjustments to reconcile net income to net cash provided by operating activities: | |||||||||||||||||
| Net losses (gains) on derivatives | ( | ||||||||||||||||
| Net (gain) loss on market risk benefits | ( | ( | |||||||||||||||
| (Gain) loss from updating future policy benefits cash flow assumptions, net | ( | ( | |||||||||||||||
| Interest credited on other contract holder funds, gross | |||||||||||||||||
| Deferred income tax expense (benefit) | |||||||||||||||||
| Change in deferred acquisition costs | ( | ||||||||||||||||
| Change in funds withheld, net of reinsurance | ( | ( | |||||||||||||||
| Change in other assets and liabilities, net | ( | ( | |||||||||||||||
| Total adjustments | ( | ||||||||||||||||
| Net cash provided by (used in) operating activities | $ | $ | $ | ||||||||||||||
| As Previously | |||||||||||||||||
| Reported for the | As Adjusted | ||||||||||||||||
| Year Ended | Year Ended | ||||||||||||||||
| December 31, | Effect of | December 31, | |||||||||||||||
| 2021 | Changes | 2021 | |||||||||||||||
| Cash flows from operating activities: | |||||||||||||||||
| Net income | $ | $ | $ | ||||||||||||||
| Adjustments to reconcile net income to net cash provided by operating activities: | |||||||||||||||||
| Net losses (gains) on derivatives | |||||||||||||||||
| Net (gain) loss on market risk benefits | ( | ( | |||||||||||||||
| (Gain) loss from updating future policy benefits cash flow assumptions, net | |||||||||||||||||
| Interest credited on other contract holder funds, gross | ( | ||||||||||||||||
| Deferred income tax expense (benefit) | |||||||||||||||||
| Change in deferred acquisition costs | ( | ||||||||||||||||
| Change in funds withheld, net of reinsurance | ( | ( | |||||||||||||||
| Change in other assets and liabilities, net | ( | ( | ( | ||||||||||||||
| Total adjustments | ( | ||||||||||||||||
| Net cash provided by (used in) operating activities | $ | $ | $ | ||||||||||||||
In March 2022, the FASB issued ASU 2022-02, “Financial Instruments – Credit Losses (Topic 326): Troubled Debt Restructurings and Vintage Disclosures.” The new guidance eliminates the accounting guidance for troubled debt restructurings by creditors, and instead requires an entity to evaluate whether a modification represents a new loan or a continuation of an existing loan. The amendments also enhance disclosure requirements for certain loan refinancings and restructurings by creditors when a borrower is experiencing financial difficulty. New guidance for vintage disclosures requires that current-period gross write-offs be disclosed by year of origination for financing receivables and net investments in leases that fall within scope of the current expected credit loss model. The amendments in this update are effective for fiscal years beginning after December 15, 2022, including interim periods within those fiscal years. Updates should be applied prospectively. However, an entity has the option to apply the modified retrospective method related to the recognition and measurements of troubled debt restructurings. Effective January 1, 2023, the Company adopted ASU 2022-02, which did not have a material impact to the Consolidated Financial Statements.
Changes in Accounting Principles – Issued but Not Yet Adopted
In November 2023, the FASB issued ASU 2023-07, Improvements to Reportable Segment Disclosures, which requires a public entity to disclose its significant segment expenses regularly provided to the chief operating decision maker (CODM) and the amount and composition of other segment items. It also requires a public entity to disclose the title and position of the CODM. The ASU allows a public entity to disclose multiple measurements of segment profit or loss if a CODM uses
113
Part II | Item 8. Notes to Consolidated Financial Statements | 2. Summary of Significant Accounting Policies
multiple measures to assess segment’s performance and allocate resources. This ASU also expands the current interim disclosure requirements to require that nearly all of the annual segment disclosures be made on an interim basis. The amendments in this ASU will be effective for the Company for annual periods beginning after December 15, 2023, with early adoption permitted, and are to be applied retrospectively. The Company is in the process of evaluating the impact of the new guidance and determining the timing of adoption.
3. Segment Information
The Company has three reportable segments: Retail Annuities, Institutional Products, and Closed Life and Annuity Block. The Company reports certain activities and items that are not included in these reportable segments, including the results of PPM Holdings, Inc., the holding company of PPM, which manages the majority of the Company’s general account investment portfolio, in Corporate and Other. The reportable segments reflect how the Company’s chief operating decision maker views and manages the business. The following is a brief description of the Company’s reportable segments, plus its Corporate and Other segment.
Retail Annuities
The Company’s Retail Annuities segment offers a variety of retirement income and savings products through its diverse suite of products, consisting primarily of variable annuities, fixed index annuities, fixed annuities, payout annuities, and registered index-linked annuities ("RILA"). These products are distributed through various wirehouses, insurance brokers and independent broker-dealers, as well as through banks and financial institutions, primarily to high-net worth investors and the mass and affluent markets.
The Company’s variable annuities represent an attractive option for retirees and soon-to-be retirees, providing access to equity market appreciation and add-on benefits, including guaranteed lifetime income. A fixed index annuity is designed for investors who desire principal protection with the opportunity to participate in capped upside investment returns linked to a reference market index. The Company also provides access to guaranteed lifetime income as an add-on benefit. A fixed annuity is a guaranteed product designed to build wealth without market exposure, through a crediting rate that is likely to be superior to interest rates offered from banks or money market funds. A RILA offers customers exposure to market returns through market index-linked investment options, subject to a cap, and offers a variety of features designed to modify or limit losses.
The financial results of the variable annuity business within the Company’s Retail Annuities segment are largely dependent on the performance of the contract holder account value, which impacts both the level of fees collected and the benefits paid to the contract holder. The financial results of the Company’s fixed annuities, including the fixed option on variable annuities, RILA and fixed index annuities, are largely dependent on the Company’s ability to earn a spread between earned investment rates on general account assets and the interest credited to contract holders.
Institutional Products
The Company’s Institutional Products segment consists of traditional Guaranteed Investment Contracts ("GICs"), funding agreements (including agreements issued in conjunction with the Company’s participation in the U.S. Federal Home Loan Bank ("FHLB") program) and medium-term note funding agreements. The Company’s GIC products are marketed to defined contribution pension and profit-sharing retirement plans. Funding agreements are marketed to institutional investors, including corporate cash accounts and securities lending funds, as well as money market funds, and are issued to the FHLB in connection with its program.
114
Part II | Item 8. Notes to Consolidated Financial Statements | 3. Segment Information
The financial results of the Company’s institutional products business are primarily dependent on the Company’s ability to earn a spread between earned investment rates on general account assets and the interest credited on GICs and funding agreements.
Closed Life and Annuity Blocks
The Company's Closed Life and Annuity Blocks segment is primarily composed of blocks of business that have been acquired since 2004. This segment includes various protection products, primarily whole life, universal life, variable universal life, and term life insurance products, as well as fixed, fixed index, and payout annuities. The Closed Life and Annuity Blocks segment also includes a block of group payout annuities that we assumed from John Hancock Life Insurance Company (USA) and John Hancock Life Insurance Company of New York through reinsurance transactions in 2018 and 2019, respectively. The Company historically offered traditional and interest-sensitive life insurance products but discontinued new sales of life insurance products in 2012, as we believe opportunistically acquiring mature blocks of life insurance policies was a more efficient means of diversifying our in-force business than selling new life insurance products.
The profitability of the Company’s Closed Life and Annuity Blocks segment is largely driven by its historical ability to appropriately price its products and purchase appropriately priced blocks of business, as realized through underwriting, expense and net gains (losses) on derivatives and investments, and the ability to earn an assumed rate of return on the assets supporting that business.
Corporate and Other
The Company’s Corporate and Other segment primarily consists of the operations of its investment management subsidiary, PPM, VIE’s, and unallocated corporate income and expenses. The Corporate and Other segment also includes certain eliminations and consolidation adjustments.
Segment Performance Measurement
Segment operating revenues and pretax adjusted operating earnings are non-GAAP financial measures that management believes are critical to the evaluation of the financial performance of the Company’s segments. The Company uses the same accounting policies and procedures to measure segment pretax adjusted operating earnings as used in its reporting of consolidated net income. Its primary measure is pretax adjusted operating earnings, which is defined as net income recorded in accordance with U.S. GAAP, excluding certain items that may be highly variable from period to period due to accounting treatment under U.S. GAAP, or that are non-recurring in nature, as well as certain other revenues and expenses that are not considered to drive underlying performance. Operating revenues and pretax adjusted operating earnings should not be used as a substitute for revenues and net income as calculated in accordance with U.S. GAAP.
Pretax adjusted operating earnings equals net income adjusted to eliminate the impact of the items described in the following numbered paragraphs. These items are excluded from pretax adjusted operating earnings as they may vary significantly from period to period due to near-term market conditions and therefore are not directly comparable or reflective of the underlying performance of our business. We believe these exclusions provide investors a better picture of the drivers of our underlying performance.
1.Net Hedging Results: Comprised of: (i) fees attributed to guaranteed benefits; (ii) changes in the fair value of freestanding derivatives used to manage the risk associated with market risk benefits and other guaranteed benefit features, excluding earned income (periodic settlements and changes in settlement accruals); (iii) the movements in reserves, market risk benefits, guaranteed benefit features accounted for as embedded derivative instruments, and related claims and benefit payments; (iv) amortization of the balance of unamortized deferred acquisition costs at the date of transition to current LDTI accounting guidance on January 1, 2021 associated with items excluded from pretax adjusted operating earnings prior to transition; and (v) the impact on the valuation of Guaranteed Benefits and Net Hedging Results arising from changes in underlying actuarial assumptions. We believe excluding these items removes the impact to both revenue and related expenses associated with Guaranteed Benefits and Net Hedging Results.
115
Part II | Item 8. Notes to Consolidated Financial Statements | 3. Segment Information
2. Net Realized Investment Gains and Losses: Comprised of: (i) realized investment gains and losses associated with the periodic sales or disposals of securities, excluding those held within our trading portfolio; and (ii) impairments of securities, after adjustment for the non-credit component of the impairment charges.
3. Change in Value of Funds Withheld Embedded Derivative and Net Investment Income on Funds Withheld Assets: Comprised of: (i) the change in fair value of funds withheld embedded derivatives; and (ii) net investment income on funds withheld assets related to funds withheld reinsurance transactions.
4. Other items: Comprised of: (i) the impact of investments that are consolidated in our financial statements due to U.S. GAAP accounting requirements, such as our investments in collateralized loan obligations ("CLOs"), but for which the consolidation effects are not consistent with our economic interest or exposure to those entities, and (ii) one-time or other non-recurring items.
5. Income taxes.
Set forth in the tables below is certain information with respect to the Company’s segments, as described above (in millions):
| For the Year Ended December 31, 2023 | Retail Annuities | Institutional Products | Closed Life and Annuity Blocks | Corporate and Other | Total Consolidated | ||||||||||||
| Operating Revenues | |||||||||||||||||
| Fee income | $ | $ | $ | $ | $ | ||||||||||||
| Premiums | |||||||||||||||||
| Net investment income | |||||||||||||||||
| Income (loss) on operating derivatives | ( | ( | ( | ( | ( | ||||||||||||
| Other income | |||||||||||||||||
| Total Operating Revenues | |||||||||||||||||
| Operating Benefits and Expenses | |||||||||||||||||
| Death, other policy benefits and change in policy reserves, net of deferrals | |||||||||||||||||
Interest credited on other contract holder funds, net of deferrals | |||||||||||||||||
| (Gain) loss from updating future policy benefits cash flow assumptions, net | ( | ||||||||||||||||
| Interest expense | |||||||||||||||||
| Operating costs and other expenses, net of deferrals | |||||||||||||||||
| Amortization of deferred acquisition costs | |||||||||||||||||
| Total Operating Benefits and Expenses | |||||||||||||||||
| Pretax Adjusted Operating Earnings | $ | $ | $ | ( | $ | ( | $ | ||||||||||
116
Part II | Item 8. Notes to Consolidated Financial Statements | 3. Segment Information
| For the Year Ended December 31, 2022 | Retail Annuities | Institutional Products | Closed Life and Annuity Blocks | Corporate and Other | Total Consolidated | ||||||||||||
| Operating Revenues | |||||||||||||||||
| Fee income | $ | $ | $ | $ | $ | ||||||||||||
| Premiums | |||||||||||||||||
| Net investment income | |||||||||||||||||
| Income (loss) on operating derivatives | ( | ||||||||||||||||
| Other income | |||||||||||||||||
| Total Operating Revenues | |||||||||||||||||
| Operating Benefits and Expenses | |||||||||||||||||
| Death, other policy benefits and change in policy reserves, net of deferrals | |||||||||||||||||
| Interest credited on other contract holder funds, net of deferrals | |||||||||||||||||
| (Gain) loss from updating future policy benefits cash flow assumptions, net | ( | ( | ( | ||||||||||||||
| Interest expense | |||||||||||||||||
| Operating costs and other expenses, net of deferrals | |||||||||||||||||
| Amortization of deferred acquisition costs | |||||||||||||||||
| Total Operating Benefits and Expenses | |||||||||||||||||
| Pretax Adjusted Operating Earnings | $ | $ | $ | $ | ( | $ | |||||||||||
| For the Year Ended December 31, 2021 | Retail Annuities | Institutional Products | Closed Life and Annuity Blocks | Corporate and Other | Total Consolidated | ||||||||||||
| Operating Revenues | |||||||||||||||||
| Fee income | $ | $ | $ | $ | $ | ||||||||||||
| Premiums | |||||||||||||||||
| Net investment income | |||||||||||||||||
| Income (loss) on operating derivatives | ( | ||||||||||||||||
| Other income | |||||||||||||||||
| Total Operating Revenues | |||||||||||||||||
| Operating Benefits and Expenses | |||||||||||||||||
| Death, other policy benefits and change in policy reserves, net of deferrals | |||||||||||||||||
| Interest credited on other contract holder funds, net of deferrals | |||||||||||||||||
| (Gain) loss from updating future policy benefits cash flow assumptions, net | ( | ||||||||||||||||
| Interest expense | |||||||||||||||||
| Operating costs and other expenses, net of deferrals | |||||||||||||||||
| Amortization of deferred acquisition costs | |||||||||||||||||
| Total Operating Benefits and Expenses | |||||||||||||||||
| Pretax Adjusted Operating Earnings | $ | $ | $ | $ | ( | $ | |||||||||||
Intersegment eliminations in the above tables are included in the Corporate and Other segment. These include the elimination of investment income, between Retail Annuities and the Corporate and Other segments, as well as the elimination from fee income and investment income of investment fees paid by Jackson Financial and its subsidiaries to its affiliate PPM, which were $76 million, $74 million, and $69 million for the years ended December 31, 2023, 2022 and 2021, respectively.
117
Part II | Item 8. Notes to Consolidated Financial Statements | 3. Segment Information
The following table summarizes the reconciling items from the non-GAAP measure of total operating revenues to the U.S. GAAP measure of total revenues attributable to the Company (in millions):
| Years Ended December 31, | ||||||||||||||||||||
| 2023 | 2022 | 2021 | ||||||||||||||||||
| Total operating revenues | $ | $ | $ | |||||||||||||||||
| Fees attributed to guarantee benefit reserves | ||||||||||||||||||||
| Net gains (losses) on derivatives and investments | ( | ( | ( | |||||||||||||||||
| Net investment income (loss) related to noncontrolling interests | ||||||||||||||||||||
| Consolidated investments | ( | ( | ||||||||||||||||||
| Net investment income on funds withheld assets | ||||||||||||||||||||
Total revenues (1) | $ | $ | $ | |||||||||||||||||
(1) Substantially all the Company's revenues originated in the U.S. There were no individual customers that exceeded 10% of total revenues.
The following table summarizes the reconciling items from the non-GAAP measure of total operating benefits and expenses to the U.S. GAAP measure of total benefits and expenses attributable to the Company (in millions):
| Years Ended December 31, | ||||||||||||||||||||
| 2023 | 2022 | 2021 | ||||||||||||||||||
| Total operating benefits and expenses | $ | $ | $ | |||||||||||||||||
| Net (gain) loss on market risk benefits | ( | ( | ( | |||||||||||||||||
| Benefits attributed to guaranteed benefit features | ||||||||||||||||||||
| Amortization of DAC related to non-operating revenues and expenses | ||||||||||||||||||||
| Other items | ||||||||||||||||||||
| Total benefits and expenses | $ | $ | $ | |||||||||||||||||
The following table summarizes the reconciling items, from the non-GAAP measure of pretax adjusted operating earnings to the U.S. GAAP measure of net income attributable to the Company (in millions):
| Years Ended December 31, | ||||||||||||||||||||
| 2023 | 2022 | 2021 | ||||||||||||||||||
| Pretax adjusted operating earnings | $ | $ | $ | |||||||||||||||||
| Non-operating adjustments income (loss): | ||||||||||||||||||||
| Fees attributable to guarantee benefit reserves | ||||||||||||||||||||
| Net movement in freestanding derivatives | ( | ( | ( | |||||||||||||||||
| Market risk benefits gains (losses), net | ||||||||||||||||||||
| Net reserve and embedded derivative movements | ( | ( | ( | |||||||||||||||||
| Amortization of DAC associated with non-operating items at date of transition to LDTI | ( | ( | ( | |||||||||||||||||
| Total Guaranteed benefits and net hedging results | ||||||||||||||||||||
| Net realized investment gains (losses) | ( | ( | ||||||||||||||||||
| Net realized investment gains (losses) on funds withheld assets | ( | ( | ||||||||||||||||||
| Net investment income on funds withheld assets | ||||||||||||||||||||
| Other items | ( | ( | ( | |||||||||||||||||
| Pretax income (loss) attributable to Jackson Financial Inc. | ||||||||||||||||||||
| Income tax expense (benefit) | ||||||||||||||||||||
| Net income (loss) attributable to Jackson Financial Inc. | ||||||||||||||||||||
| Dividends on preferred stock | ||||||||||||||||||||
| Net income (loss) attributable to Jackson Financial Inc. common shareholders | $ | $ | $ | |||||||||||||||||
118
Part II | Item 8. Notes to Consolidated Financial Statements | 3. Segment Information
The following table summarizes total assets by segment (in millions):
| December 31, | ||||||||||||||
| 2023 | 2022 | |||||||||||||
| Retail Annuities | $ | $ | ||||||||||||
| Closed Life and Annuity Blocks | ||||||||||||||
| Institutional Products | ||||||||||||||
| Corporate and Other | ||||||||||||||
| Total Assets | $ | $ | ||||||||||||
4. Investments
Investments consist primarily of fixed-income securities and loans, principally publicly-traded corporate and government bonds, asset-backed securities and mortgage loans. Asset-backed securities include mortgage-backed and other structured securities. The Company generates the majority of its general account deposits from interest-sensitive individual annuity contracts, life insurance products and institutional products on which it has committed to pay a declared rate of interest. The Company's strategy of investing in fixed-income securities and loans seeks the matching of the asset yield with the amounts credited to the interest-sensitive liabilities and to earn a stable return on its investments.
Debt Securities
Debt securities consist primarily of bonds, notes, and asset-backed securities. Acquisition discounts and premiums on debt securities are amortized into investment income through call or maturity dates using the effective interest method. Discounts and premiums on asset-backed securities are amortized over the estimated redemption period. Certain asset-backed securities for which the Company might not recover substantially all of its recorded investment are accounted for on a prospective basis according to changes in the estimated future cash flows.
Debt securities are generally classified as available-for-sale and are carried at fair value. For debt securities in an unrealized loss position, for which the Company deems an impairment necessary, the amortized cost may be written down to fair value through net gains (losses) on derivatives and investments, or an allowance for credit loss (“ACL”) may be recorded along with a charge to net gains (losses) on derivatives and investments.
Certain debt securities included from consolidation of certain VIEs are carried at fair value under the fair value option with changes in fair value included in net investment income. Other debt securities included from consolidation of certain VIEs are classified as trading securities and are carried at fair value with the changes in fair value included in net investment income.
119
Part II | Item 8. Notes to Consolidated Financial Statements | 4. Investments
The following table sets forth the composition of the fair value of debt securities at December 31, 2023 and 2022, classified by rating categories as assigned by nationally recognized statistical rating organization (a “rating agency”), the National Association of Insurance Commissioners (“NAIC”), or if not rated by such organizations, the Company’s investment advisors. The Company uses the second lowest rating by a rating agency when rating agencies ratings are not equivalent and, for purposes of the table, if not otherwise rated by a rating agency, the NAIC rating of a security is converted to an equivalent rating agency rating. At December 31, 2023 and 2022, the carrying value of investments rated by the Company’s consolidated investment advisor totaled $486 million and $32 million, respectively.
| Percent of Total Debt Securities Carrying Value | |||||||||||
| December 31, | |||||||||||
| Investment Rating | 2023 | 2022 | |||||||||
| U.S. Treasuries | |||||||||||
| AAA | |||||||||||
| AA | |||||||||||
| A | |||||||||||
| BBB | |||||||||||
| Investment grade | |||||||||||
| BB | |||||||||||
| B and below | |||||||||||
| Below investment grade | |||||||||||
| Total debt securities | |||||||||||
At December 31, 2023 and 2022, the total carrying value of debt securities in an unrealized loss position consisted of:
| December 31, | |||||||||||
| 2023 | 2022 | ||||||||||
| Investment grade securities | |||||||||||
| Below investment grade securities | |||||||||||
| Not rated securities | |||||||||||
Unrealized losses on debt securities that were below investment grade or not rated were approximately 21 % and 21 % of the aggregate gross unrealized losses on available-for-sale debt securities at December 31, 2023 and 2022, respectively.
Corporate securities in an unrealized loss position were diversified across industries as follows (in millions, except percentages):
| December 31, | |||||||||||
| 2023 | 2022 | ||||||||||
| Industries accounting for the largest percentage of corporate gross unrealized losses: | |||||||||||
| Utility | |||||||||||
| Financial Services | |||||||||||
| Largest unrealized loss related to a single corporate obligor | $ | $ | |||||||||
120
Part II | Item 8. Notes to Consolidated Financial Statements | 4. Investments
At December 31, 2023 and 2022, the amortized cost, allowance for credit loss ("ACL"), gross unrealized gains and losses, and fair value of debt securities, including trading securities and securities carried at fair value under the fair value option, were as follows (in millions):
| Allowance | Gross | Gross | |||||||||||||||||||||||||||||||||
| Amortized | for | Unrealized | Unrealized | Fair | |||||||||||||||||||||||||||||||
| December 31, 2023 | Cost (1) | Credit Loss | Gains | Losses | Value | ||||||||||||||||||||||||||||||
| U.S. government securities | $ | $ | $ | $ | $ | ||||||||||||||||||||||||||||||
| Other government securities | |||||||||||||||||||||||||||||||||||
| Public utilities | |||||||||||||||||||||||||||||||||||
| Corporate securities | |||||||||||||||||||||||||||||||||||
| Residential mortgage-backed | |||||||||||||||||||||||||||||||||||
| Commercial mortgage-backed | |||||||||||||||||||||||||||||||||||
| Other asset-backed securities | |||||||||||||||||||||||||||||||||||
| Total debt securities | $ | $ | $ | $ | $ | ||||||||||||||||||||||||||||||
| Allowance | Gross | Gross | |||||||||||||||||||||||||||||||||
| Amortized | for | Unrealized | Unrealized | Fair | |||||||||||||||||||||||||||||||
| December 31, 2022 | Cost (1) | Credit Loss | Gains | Losses | Value | ||||||||||||||||||||||||||||||
| U.S. government securities | $ | $ | $ | $ | $ | ||||||||||||||||||||||||||||||
| Other government securities | |||||||||||||||||||||||||||||||||||
| Public utilities | |||||||||||||||||||||||||||||||||||
| Corporate securities | |||||||||||||||||||||||||||||||||||
| Residential mortgage-backed | |||||||||||||||||||||||||||||||||||
| Commercial mortgage-backed | |||||||||||||||||||||||||||||||||||
| Other asset-backed securities | |||||||||||||||||||||||||||||||||||
| Total debt securities | $ | $ | $ | $ | $ | ||||||||||||||||||||||||||||||
(1) Amortized cost, apart from the carrying value for securities carried at fair value under the fair value option and trading securities. | |||||||||||||||||||||||||||||||||||
The amortized cost, ACL, gross unrealized gains and losses, and fair value of debt securities at December 31, 2023, by contractual maturity, are shown below (in millions). Actual maturities may differ from contractual maturities where securities can be called or prepaid with or without early redemption penalties.
| Allowance | Gross | Gross | |||||||||||||||||||||||||||
| Amortized | for | Unrealized | Unrealized | Fair | |||||||||||||||||||||||||
Cost (1) | Credit Loss | Gains | Losses | Value | |||||||||||||||||||||||||
| Due in 1 year or less | $ | $ | $ | $ | $ | ||||||||||||||||||||||||
| Due after 1 year through 5 years | |||||||||||||||||||||||||||||
| Due after 5 years through 10 years | |||||||||||||||||||||||||||||
| Due after 10 years through 20 years | |||||||||||||||||||||||||||||
| Due after 20 years | |||||||||||||||||||||||||||||
| Residential mortgage-backed | |||||||||||||||||||||||||||||
| Commercial mortgage-backed | |||||||||||||||||||||||||||||
| Other asset-backed securities | |||||||||||||||||||||||||||||
| Total | $ | $ | $ | $ | $ | ||||||||||||||||||||||||
(1) Amortized cost, apart from the carrying value for securities carried at fair value under the fair value option and trading securities.
As required by law in various states in which business is conducted, securities with a carrying value of $91 million and $90 million at December 31, 2023 and 2022, respectively, were on deposit with regulatory authorities.
121
Part II | Item 8. Notes to Consolidated Financial Statements | 4. Investments
Residential mortgage-backed securities (“RMBS”) include certain RMBS that are collateralized by residential mortgage loans and are neither expressly nor implicitly guaranteed by U.S. government agencies (“non-agency RMBS”). The Company’s non-agency RMBS include investments in securities backed by prime, Alt-A, and subprime loans as follows (in millions):
| Allowance | Gross | Gross | ||||||||||||||||||||||||||||||
| Amortized | for | Unrealized | Unrealized | Fair | ||||||||||||||||||||||||||||
| December 31, 2023 | Cost (1) | Credit Loss | Gains | Losses | Value | |||||||||||||||||||||||||||
| Prime | $ | $ | $ | $ | $ | |||||||||||||||||||||||||||
| Alt-A | ||||||||||||||||||||||||||||||||
| Subprime | ||||||||||||||||||||||||||||||||
| Total non-agency RMBS | $ | $ | $ | $ | $ | |||||||||||||||||||||||||||
| Allowance | Gross | Gross | ||||||||||||||||||||||||||||||
| Amortized | for | Unrealized | Unrealized | Fair | ||||||||||||||||||||||||||||
| December 31, 2022 | Cost (1) | Credit Loss | Gains | Losses | Value | |||||||||||||||||||||||||||
| Prime | $ | $ | $ | $ | $ | |||||||||||||||||||||||||||
| Alt-A | ||||||||||||||||||||||||||||||||
| Subprime | ||||||||||||||||||||||||||||||||
| Total non-agency RMBS | $ | $ | $ | $ | $ | |||||||||||||||||||||||||||
(1) Amortized cost, apart from carrying value for securities carried at fair value under the fair value option and trading securities. | ||||||||||||||||||||||||||||||||
The Company defines its exposure to non-agency RMBS as follows:
•Prime loan-backed securities are collateralized by mortgage loans made to the highest rated borrowers.
•Alt-A loan-backed securities are collateralized by mortgage loans made to borrowers who lack credit documentation or necessary requirements to obtain prime borrower rates.
•Subprime loan-backed securities are collateralized by mortgage loans made to borrowers that have a FICO score of 660 or lower.
122
Part II | Item 8. Notes to Consolidated Financial Statements | 4. Investments
The following table summarizes the number of securities, fair value and the gross unrealized losses of debt securities, aggregated by investment category and length of time that individual debt securities have been in a continuous loss position (dollars in millions):
| December 31, 2023 | December 31, 2022 | |||||||||||||||||||||||||||||||||||||
| Less than 12 months | Less than 12 months | |||||||||||||||||||||||||||||||||||||
| Gross | Fair Value | Gross | Fair Value | |||||||||||||||||||||||||||||||||||
| Unrealized | # of | Unrealized | # of | |||||||||||||||||||||||||||||||||||
| Losses | securities | Losses | securities | |||||||||||||||||||||||||||||||||||
| U.S. government securities | $ | $ | $ | $ | ||||||||||||||||||||||||||||||||||
| Other government securities | ||||||||||||||||||||||||||||||||||||||
| Public utilities | ||||||||||||||||||||||||||||||||||||||
| Corporate securities | ||||||||||||||||||||||||||||||||||||||
| Residential mortgage-backed | ||||||||||||||||||||||||||||||||||||||
| Commercial mortgage-backed | ||||||||||||||||||||||||||||||||||||||
| Other asset-backed securities | ||||||||||||||||||||||||||||||||||||||
| Total temporarily impaired securities | $ | $ | $ | $ | ||||||||||||||||||||||||||||||||||
| 12 months or longer | 12 months or longer | |||||||||||||||||||||||||||||||||||||
| Gross | Fair Value | Gross | Fair Value | |||||||||||||||||||||||||||||||||||
| Unrealized | # of | Unrealized | # of | |||||||||||||||||||||||||||||||||||
| Losses | securities | Losses | securities | |||||||||||||||||||||||||||||||||||
| U.S. government securities | $ | $ | $ | $ | ||||||||||||||||||||||||||||||||||
| Other government securities | ||||||||||||||||||||||||||||||||||||||
| Public utilities | ||||||||||||||||||||||||||||||||||||||
| Corporate securities | ||||||||||||||||||||||||||||||||||||||
| Residential mortgage-backed | ||||||||||||||||||||||||||||||||||||||
| Commercial mortgage-backed | ||||||||||||||||||||||||||||||||||||||
| Other asset-backed securities | ||||||||||||||||||||||||||||||||||||||
| Total temporarily impaired securities | $ | $ | $ | $ | ||||||||||||||||||||||||||||||||||
| Total | Total | |||||||||||||||||||||||||||||||||||||
| Gross | Fair Value | Gross | Fair Value | |||||||||||||||||||||||||||||||||||
| Unrealized | # of | Unrealized | # of | |||||||||||||||||||||||||||||||||||
| Losses | securities (1) | Losses | securities (1) | |||||||||||||||||||||||||||||||||||
| U.S. government securities | $ | $ | $ | $ | ||||||||||||||||||||||||||||||||||
| Other government securities | ||||||||||||||||||||||||||||||||||||||
| Public utilities | ||||||||||||||||||||||||||||||||||||||
| Corporate securities | ||||||||||||||||||||||||||||||||||||||
| Residential mortgage-backed | ||||||||||||||||||||||||||||||||||||||
| Commercial mortgage-backed | ||||||||||||||||||||||||||||||||||||||
| Other asset-backed securities | ||||||||||||||||||||||||||||||||||||||
| Total temporarily impaired securities | $ | $ | $ | $ | ||||||||||||||||||||||||||||||||||
(1) Certain securities contain multiple lots and fit the criteria of both aging groups.
123
Part II | Item 8. Notes to Consolidated Financial Statements | 4. Investments
Debt securities in an unrealized loss position as of December 31, 2023 did not require an impairment recognized in earnings as (i) the Company did not intend to sell these debt securities, (ii) it is not more likely than not that the Company will be required to sell these securities before recovery of their amortized cost basis, and (iii) the difference in the fair value compared to the amortized cost was due to factors other than credit loss. Based upon this evaluation, the Company believes it has the ability to generate adequate amounts of cash from normal operations to meet cash requirements with a reasonable margin of safety without requiring the sale of impaired securities.
As of December 31, 2023, unrealized losses associated with debt securities are primarily due to widening credit spreads or rising risk-free rates since purchase. As described below, the Company performed analyses of the financial performance of the underlying issues in an unrealized loss position and determined that recovery of the entire amortized cost of each impaired security is expected.
Evaluation of Available-for-Sale Debt Securities for Credit Loss
For debt securities in an unrealized loss position, management first assesses whether the Company has the intent to sell, or whether it is more likely than not it will be required to sell the security before the amortized cost basis is fully recovered. If either criterion is met, the amortized cost is written down to fair value through net gains (losses) on derivatives and investments as an impairment. If neither criterion is met, the securities are further evaluated to determine if the cause of the decline in fair value resulted from credit losses or other factors, such as estimates about issuer operations and future earnings potential.
The credit loss evaluation for a security may consider the following: the extent to which the fair value is below amortized cost; changes in ratings; whether a significant covenant has been breached; assessments of the issuer’s ability to make scheduled debt payments based upon judgments related to its current and projected financial position, including whether it has filed or indicated a possibility of filing for bankruptcy, has missed or announced it intends to miss a scheduled debt service payment, or has experienced a specific material adverse change that may impair its creditworthiness; the existence of, and realizable value of, any collateral backing the obligations; and the macro-economic and micro-economic outlooks for the issuer and its industry.
In addition to the above, the credit loss review of asset-backed securities includes an assessment of future estimated cash flows under expected and stress case scenarios, to identify potential shortfalls in contractual payments. These estimated cash flows are developed using available performance indicators from the underlying assets, such as current and projected default or delinquency rates, levels of credit enhancement, current subordination levels, vintage, expected loss severity and other relevant characteristics.
For mortgage-backed securities, credit losses are assessed using a cash flow model that estimates the cash flows on the underlying mortgages, using the security-specific collateral characteristics and transaction structure. The model estimates cash flows from the underlying mortgage loans and distributes those cash flows to various tranches of securities based on the transaction structure and any existing subordination and credit enhancements. The cash flow model incorporates actual cash flows on the mortgage-backed securities through the current period and then projects the remaining cash flows using a number of assumptions, including prepayment timing, default rates and loss severity. Specifically, for prime and Alt-A RMBS, the assumed default percentage is dependent on the severity of delinquency status, with foreclosures and real estate owned receiving higher rates, but also includes the currently performing loans.
These estimates reflect a combination of data derived by third parties and internally developed assumptions. Where possible, this data is benchmarked against other third-party sources. In addition, these estimates are extrapolated along a default timing curve to estimate the total lifetime pool default rate. When a credit loss is determined to exist and the present value of cash flows expected to be collected is less than the amortized cost of the security, an allowance for credit loss is recorded along with a charge to net gains (losses) on derivatives and investments, limited by the amount that the fair value is less than amortized cost. Any remaining unrealized loss after recording the allowance for credit loss is the non-credit amount and is recorded to other comprehensive income.
124
Part II | Item 8. Notes to Consolidated Financial Statements | 4. Investments
There are inherent uncertainties in assessing the fair values assigned to the Company’s investments. The Company’s reviews of net present value and fair value involve several criteria including economic conditions, credit loss experience, other issuer-specific developments and estimated future cash flows. These assessments are based on the best available information at the time. Factors such as market liquidity, the widening of bid/ask spreads and a change in the cash flow assumptions can contribute to future price volatility. If actual experience differs negatively from the assumptions and other considerations used in the Consolidated Financial Statements, unrealized losses currently reported in accumulated other comprehensive income (loss) may be recognized in the Consolidated Income Statements in future periods.
The Company currently has no intent to sell securities with unrealized losses considered to be temporary until they mature or recover in value and believes that it has the ability to do so. However, if the specific facts and circumstances surrounding an individual security, or the outlook for its industry sector change, the Company may sell the security prior to its maturity or recovery and realize a loss.
The allowance for credit loss for specific debt securities may be increased or reversed in subsequent periods due to changes in the assessment of the present value of cash flows that are expected to be collected. Any changes to the allowance for credit loss is recorded as a provision for (or reversal of) credit loss expense in net gains (losses) on derivatives and investments.
When all, or a portion, of a security is deemed uncollectible, the uncollectible portion is written-off with an adjustment to amortized cost and a corresponding reduction to the allowance for credit losses.
The roll-forward of the allowance for credit loss for available-for-sale securities by sector is as follows (in millions):
| December 31, 2023 | US government securities | Other government securities | Public utilities | Corporate securities | Residential mortgage-backed | Commercial mortgage-backed | Other asset-backed securities | Total | ||||||||||||||||||
| Balance at January 1, 2023 | $ | $ | $ | $ | $ | $ | $ | $ | ||||||||||||||||||
| Additions for which credit loss was not previously recorded | ||||||||||||||||||||||||||
| Changes for securities with previously recorded credit loss | ||||||||||||||||||||||||||
Additions for purchases of PCD debt securities (1) | ||||||||||||||||||||||||||
| Reductions from charge-offs | ( | ( | ||||||||||||||||||||||||
| Reductions for securities disposed | ( | ( | ( | ( | ||||||||||||||||||||||
| Securities intended/required to be sold before recovery of amortized cost basis | ( | ( | ( | ( | ||||||||||||||||||||||
Balance at December 31, 2023 (2) | $ | $ | $ | $ | $ | $ | $ | $ | ||||||||||||||||||
125
Part II | Item 8. Notes to Consolidated Financial Statements | 4. Investments
| December 31, 2022 | US government securities | Other government securities | Public utilities | Corporate securities | Residential mortgage-backed | Commercial mortgage-backed | Other asset-backed securities | Total | ||||||||||||||||||
| Balance at January 1, 2022 | $ | $ | $ | $ | $ | $ | $ | $ | ||||||||||||||||||
| Additions for which credit loss was not previously recorded | ||||||||||||||||||||||||||
| Changes for securities with previously recorded credit loss | ( | ( | ( | ( | ||||||||||||||||||||||
Additions for purchases of PCD debt securities (1) | ||||||||||||||||||||||||||
| Reductions from charge-offs | ||||||||||||||||||||||||||
| Reductions for securities disposed | ( | ( | ( | |||||||||||||||||||||||
| Securities intended/required to be sold before recovery of amortized cost basis | ( | ( | ||||||||||||||||||||||||
Balance at December 31, 2022 (2) | $ | $ | $ | $ | $ | $ | $ | $ | ||||||||||||||||||
(1) Represents purchased credit-deteriorated ("PCD") fixed maturity available-for-sale securities. | |||||||||||
(2) Accrued interest receivable on debt securities totaled $ | |||||||||||
Net Investment Income
The sources of net investment income were as follows (in millions):
| Years Ended December 31, | ||||||||||||||||||||
| 2023 | 2022 | 2021 | ||||||||||||||||||
Debt securities (1) | $ | $ | $ | |||||||||||||||||
| Equity securities | ( | |||||||||||||||||||
| Mortgage loans | ||||||||||||||||||||
| Policy loans | ||||||||||||||||||||
| Limited partnerships | ||||||||||||||||||||
| Other investment income | ||||||||||||||||||||
| Total investment income excluding funds withheld assets | ||||||||||||||||||||
| Investment expenses | ( | ( | ( | |||||||||||||||||
| Net investment income excluding funds withheld assets | ||||||||||||||||||||
| Net investment income on funds withheld assets (see Note 8) | ||||||||||||||||||||
| Net investment income | $ | $ | $ | |||||||||||||||||
(1) Includes changes in fair value gains (losses) on trading securities and includes $34 million, $(149 ) million and $26 million for the years ended December 31, 2023, 2022 and 2021, respectively, related to the change in fair value for securities carried under the fair value option.
Investment income is not accrued on securities in default and otherwise where the collection is uncertain. In these cases, receipts of interest on such securities are used to reduce the cost basis of the securities.
Unrealized gains (losses) included in investment income that were recognized on equity securities held were $(20 ) million, $(52 ) million and $26 million, for the years ended December 31, 2023, 2022 and 2021, respectively.
126
Part II | Item 8. Notes to Consolidated Financial Statements | 4. Investments
Net Gains (Losses) on Derivatives and Investments
Realized gains and losses on sales of investments are recognized in income at the date of sale and are determined using the specific cost identification method.
The following table summarizes net gains (losses) on derivatives and investments (in millions):
| Years Ended December 31, | ||||||||||||||||||||
| 2023 | 2022 | 2021 | ||||||||||||||||||
| Available-for-sale securities | ||||||||||||||||||||
| Realized gains on sale | $ | $ | $ | |||||||||||||||||
| Realized losses on sale | ( | ( | ( | |||||||||||||||||
| Credit loss income (expense) | ( | ( | ( | |||||||||||||||||
| Credit loss income (expense) on mortgage loans | ( | ( | ||||||||||||||||||
Other (1) | ( | |||||||||||||||||||
| Net gains (losses) excluding derivatives and funds withheld assets | ( | ( | ||||||||||||||||||
| Net gains (losses) on derivative instruments (see Note 5) | ( | ( | ( | |||||||||||||||||
| Net gains (losses) on derivatives and investments | ( | ( | ( | |||||||||||||||||
| Net gains (losses) on funds withheld reinsurance treaties (see Note 8) | ( | ( | ||||||||||||||||||
| Total net gains (losses) on derivatives and investments | $ | ( | $ | ( | $ | ( | ||||||||||||||
(1) Includes the foreign currency gain or loss related to foreign denominated trust instruments supporting funding agreements. | ||||||||||||||||||||
Net gains (losses) on funds withheld reinsurance treaties represents income (loss) from the sale of investments held in segregated funds withheld accounts in support of reinsurance agreements for which Jackson retains legal ownership of the underlying investments. These gains (losses) are increased or decreased by changes in the embedded derivative liability related to the Athene funds withheld coinsurance agreement and also include (i) changes in the related funds withheld payable, as all economic performance of the investments held in the segregated accounts inure to the benefit of the reinsurers under the respective reinsurance agreements with each reinsurer, and (ii) amortization of the difference between book value and fair value of the investments as of the effective date of the reinsurance agreements with each reinsurer.
The aggregate fair value of securities sold at a loss for the years ended December 31, 2023, 2022 and 2021 was $5,529 million, $5,376 million and $2,604 million, which was approximately 97 %, 93 % and 95 % of book value, respectively.
Proceeds from sales of available-for-sale debt securities were $6.8 billion, $8.0 billion and $9.6 billion during the years ended December 31, 2023, 2022 and 2021, respectively.
Consolidated Variable Interest Entities ("VIEs")
The Company’s involvement with VIEs is primarily to invest in assets that gain exposure to a broadly diversified portfolio of asset classes. A VIE is an entity that does not have sufficient equity to finance the activities of the entity without additional subordinated financial support or where equity investors lack certain characteristics of a controlling financial interest. The Company performs ongoing qualitative assessments of variable interests in VIEs to determine whether it has a controlling financial interest and would therefore be considered the primary beneficiary of the VIE. If the Company determines it is the primary beneficiary of a VIE, it consolidates the assets and liabilities of the VIE in its Consolidated Financial Statements.
The Company concluded that the following entities are VIEs and that the Company is the primary beneficiary as it has both the power to direct the most significant activities of the VIE as well as the obligation to absorb losses or the right to receive benefits that could potentially be significant to the VIE. In each case, the Company’s exposure to loss is limited to the capital invested plus, in the cases of the limited liability companies and the Private Equity Funds, unfunded capital commitments:
•The Company funds affiliated limited liability companies to facilitate the issuance of collateralized loan obligations ("CLOs"). In April 2022, the Company reinvested in CLO issuances resulting in an increase of consolidated assets and liabilities. In December 2022, a consolidated VIE issued $276 million par, net of the
127
Part II | Item 8. Notes to Consolidated Financial Statements | 4. Investments
Company’s holding of CLOs. The Company’s policy is to record the consolidation of VIEs on a one-month lag due to the timing of when information is available from the VIE. Therefore, the VIE's issuance of this CLO is not reflected in the Company’s Consolidated Balance Sheet as of December 31, 2022 but its inclusion would not materially impact the financial position of the Company as a result of the offsetting changes to assets and liabilities. In December 2023, a consolidated CLO expanded its issuance by $97 million, net of the Company’s holding, which was not reflected in the Company's Consolidated Balance Sheet as of December 31, 2023 due to the reporting lag. The inclusion of these additional issuances would not materially impact the financial position of the Company due to the offsetting changes to assets and liabilities.
•Private Equity Funds III – VIII are limited partnership structures that invest the ownership capital in portfolios of various other limited partnership structures. The Company sold all of its investment in Private Equity Funds III - VI and the majority of its investment in Private Equity Fund VII during the year ended December 31, 2023. The Company recorded a loss of $97 million on the sale, which it recognized in Net Investment Income for the year ended December 31, 2023. Those entities were deconsolidated as of December 31, 2023.
•PPM has created and managed institutional share class mutual funds, where Jackson seeds new funds, or new share classes within a fund, when deemed necessary to develop the requisite track record prior to allowing investment by external parties. Jackson may sell its interest in a fund once opened to investment by external parties.
Asset and liability information for the consolidated VIEs included on the Consolidated Balance Sheets are as follows (in millions):
| December 31, 2023 | December 31, 2022 | ||||||||||
| Assets | |||||||||||
| Debt securities, at fair value under fair value option | $ | $ | |||||||||
| Debt securities, trading | |||||||||||
| Equity securities | |||||||||||
| Other invested assets | |||||||||||
| Cash and cash equivalents | |||||||||||
| Other assets | |||||||||||
| Total assets | $ | $ | |||||||||
| Liabilities | |||||||||||
| Notes issued by consolidated VIEs, at fair value under fair value option | $ | $ | |||||||||
| Other liabilities | |||||||||||
| Total other liabilities | |||||||||||
| Securities lending payable | |||||||||||
| Total liabilities | $ | $ | |||||||||
| Equity | |||||||||||
| Noncontrolling interests | $ | $ | |||||||||
Unconsolidated VIEs
The Company has concluded the following entities are VIEs but does not consolidate them. Based on analysis of the limited partnerships, limited liability companies and the mutual funds, the Company is not the primary beneficiary of the VIE because the Company lacks the power to direct the activities of the VIE that most significantly impact the VIE's performance or lacks the obligation to absorb losses or the right to receive benefits that could potentially be significant to the entities, or both.
128
Part II | Item 8. Notes to Consolidated Financial Statements | 4. Investments
•The Company invests in certain limited partnerships ("LPs") and limited liability companies ("LLCs"). The carrying amounts of the Company’s investments in these LPs and LLCs are recognized in other invested assets on the Consolidated Balance Sheets. Unfunded capital commitments for these investments are detailed in Note 16 of Notes to Consolidated Financial Statements. The Company’s exposure to loss is limited to the capital invested and unfunded capital commitments related to the LPs/LLCs, which was $2,576 million and $3,285 million as of December 31, 2023 and 2022, respectively. The capital invested in an LP or LLC equals the original capital contributed, increased for additional capital contributed after the initial investment, and reduced for any returns of capital from the LP or LLC. LPs and LLCs are carried at fair value.
•The Company invests in certain mutual funds. Mutual funds are recognized in equity securities on the Consolidated Balance Sheets and were $21 million and $28 million as of December 31, 2023 and 2022, respectively. The Company’s maximum exposure to loss on these mutual funds is limited to the amortized cost for these investments.
The Company makes investments in structured debt securities issued by VIEs for which it is not the manager. These structured debt securities include RMBS, Commercial Mortgage-Backed Securities ("CMBS"), and asset-backed securities ("ABS"). The Company does not consolidate the securitization trusts utilized in these transactions because it does not have the power to direct the activities that most significantly impact the economic performance of these securitization trusts. The Company does not consider its continuing involvement with these VIEs to be significant because it either invests in securities issued by the VIE and was not involved in the design of the VIE or no transfers have occurred between the Company and the VIE. The Company’s maximum exposure to loss on these structured debt securities is limited to the amortized cost of these investments. The Company does not have any further contractual obligations to the VIE. The Company recognizes the variable interest in these VIEs at fair value on the Consolidated Balance Sheets.
Commercial and Residential Mortgage Loans
The following table shows commercial mortgage loans, residential mortgage loans, and the respective accrued interest thereon at December 31, 2023 and 2022 (in millions):
| December 31, | |||||||||||
| 2023 | 2022 | ||||||||||
Commercial mortgage loans (1) | $ | $ | |||||||||
| Accrued interest receivable on commercial mortgage loans | |||||||||||
Residential mortgage loans (2) | |||||||||||
| Accrued interest receivable on residential mortgage loans | |||||||||||
(1) Net of an allowance for credit losses of $160 million and $91 million at each date, respectively.
(2) Net of an allowance for credit losses of $5 million and $4 million at each date, respectively.
Commercial and residential mortgage loans are generally carried at the aggregate unpaid principal balance, adjusted for any applicable unamortized discount or premium, or ACL. Acquisition discounts and premiums on mortgage loans are amortized into investment income through maturity dates using the effective interest method. Interest income is accrued on the principal balance of the loan based on the loan’s contractual interest rate. Interest income and amortization of premiums and discounts are reported in net investment income along with prepayment fees and mortgage loan fees, which are recorded as incurred.
At December 31, 2023, commercial mortgage loans were collateralized by properties located in 36 states, the District of Columbia, and Europe, while residential mortgage loans were collateralized by properties located in 50 states, the District of Columbia, Mexico, and Europe.
Mortgage Loan Concessions
In response to the generally adverse economic impact of the COVID-19 pandemic, the Company granted concessions to certain of its commercial mortgage loan borrowers, including payment deferrals and other loan modifications. The Company has elected the option under the Coronavirus Aid, Relief, and Economic Security Act, the Consolidated Appropriations Act of 2021, and the Interagency Statement on Loan Modifications and Reporting for Financial Institutions
129
Part II | Item 8. Notes to Consolidated Financial Statements | 4. Investments
Working with Customers Affected by the Coronavirus (Revised) not to account for or report qualifying concessions as troubled debt restructurings and does not classify such loans as past due during the payment deferral period. Additionally, in accordance with the FASB’s published response to a COVID-19 Pandemic technical inquiry, the Company continues to accrue interest income on such loans that have deferred payment. For some commercial mortgage loan borrowers (principally in the hotel and retail sectors), the Company granted concessions that were primarily interest and/or principal payment deferrals generally ranging from 6 to 14 months and, to a much lesser extent, maturity date extensions. Repayment periods are generally within one year but may extend until maturity date. Deferred commercial mortgage loan interest and principal payments were $8 million at December 31, 2023. The concessions granted had no impact on the Company’s results of operations or financial position as the Company has not granted concessions that would have been disclosed and accounted for as troubled debt restructurings.
Evaluation for Credit Losses on Mortgage Loans
The Company reviews mortgage loans that are not carried at fair value under the fair value option on a quarterly basis to estimate the ACL with changes in the ACL recorded in net gains (losses) on derivatives and investments. Apart from an ACL recorded on individual mortgage loans where the borrower is experiencing financial difficulties, the Company records an ACL on the pool of mortgage loans based on lifetime expected credit losses. The Company utilizes a third-party forecasting model to estimate lifetime expected credit losses at a loan level for mortgage loans. The model forecasts net operating income and property values for the economic scenario selected. The debt service coverage ratios (“DSCR”) and loan to values (“LTV”) are calculated over the forecastable period by comparing the projected net operating income and property valuations to the loan payment and principal amounts of each loan. The model utilizes historical mortgage loan performance based on DSCRs and LTV to derive probability of default and expected losses based on the economic scenario that is similar to the Company’s expectations of economic factors such as unemployment, gross domestic product growth, and interest rates. The Company determined the forecastable period to be reasonable and supportable for a period of two years beyond the end of the reporting period. Over the following one-year period, the model reverts to the historical performance of the portfolio for the remainder of the contractual term of the loans. In cases where the Company does not have an appropriate length of historical performance, the relevant historical rate from an index or the lifetime expected credit loss calculated from the model may be used.
Unfunded commitments are included in the model and an ACL is determined accordingly. Credit loss estimates are pooled by property type and the Company does not include accrued interest in the determination of ACL.
For individual loans or for types of loans for which the third-party model is deemed not suitable, the Company utilizes relevant current market data, industry data, and publicly available historical loss rates to calculate an estimate of the lifetime expected credit loss.
Mortgage loans on real estate deemed uncollectible are charged against the ACL, and subsequent recoveries, if any, are credited to the ACL, limited to the aggregate of amounts previously charged-off and expected to be charged-off. Mortgage loans on real estate are presented net of the ACL on the Consolidated Balance Sheets .
The following table provides the change in the allowance for credit losses in the Company’s mortgage loan portfolios (in millions):
| December 31, 2023 | Apartment | Hotel | Office | Retail | Warehouse | Residential Mortgage | Total | ||||||||||||||||
| Balance at January 1, 2023 | $ | $ | $ | $ | $ | $ | $ | ||||||||||||||||
| Charge offs, net of recoveries | ( | ( | |||||||||||||||||||||
| Additions from purchase of PCD mortgage loans | |||||||||||||||||||||||
| Provision (release) | ( | ||||||||||||||||||||||
Balance at December 31, 2023 (1) | $ | $ | $ | $ | $ | $ | $ | ||||||||||||||||
130
Part II | Item 8. Notes to Consolidated Financial Statements | 4. Investments
| December 31, 2022 | Apartment | Hotel | Office | Retail | Warehouse | Residential Mortgage | Total | ||||||||||||||||
| Balance at January 1, 2022 | $ | $ | $ | $ | $ | $ | $ | ||||||||||||||||
| Charge offs, net of recoveries | |||||||||||||||||||||||
| Additions from purchase of PCD mortgage loans | |||||||||||||||||||||||
| Provision (release) | ( | ( | ( | ||||||||||||||||||||
Balance at December 31, 2022 (1) | $ | $ | $ | $ | $ | $ | $ | ||||||||||||||||
(1) Accrued interest receivable totaled $ | ||||||||||||||
The Company’s mortgage loans that are current and in good standing are accruing interest. Interest is not accrued on loans greater than 90 days delinquent and in process of foreclosure, when deemed uncollectible. Delinquency status is determined from the date of the first missed contractual payment. Accrued interest amounting to $2 million and nil were written off as of December 31, 2023 and 2022, respectively, relating to loans that were greater than 90 days delinquent or in the process of foreclosure.
The following table provides information about our impaired residential mortgage loans (in millions):
| December 31, | |||||||||||
| 2023 | 2022 | ||||||||||
| Recorded investment | $ | $ | |||||||||
| Unpaid principal balance | |||||||||||
| Related loan allowance | |||||||||||
| Average recorded investment | |||||||||||
| Investment income recognized | |||||||||||
131
Part II | Item 8. Notes to Consolidated Financial Statements | 4. Investments
The following tables provide information about the credit quality and vintage year of mortgage loans (in millions):
| December 31, 2023 | |||||||||||||||||||||||||||||
| 2023 | 2022 | 2021 | 2020 | 2019 | Prior | Revolving Loans | Total | % of Total | |||||||||||||||||||||
| Commercial mortgage loans | |||||||||||||||||||||||||||||
| Loan to value ratios: | |||||||||||||||||||||||||||||
| Less than 70% | $ | $ | $ | $ | $ | $ | $ | $ | % | ||||||||||||||||||||
| 70% - 80% | % | ||||||||||||||||||||||||||||
| 80% - 100% | % | ||||||||||||||||||||||||||||
| Greater than 100% | % | ||||||||||||||||||||||||||||
| Total commercial mortgage loans | % | ||||||||||||||||||||||||||||
| Debt service coverage ratios: | |||||||||||||||||||||||||||||
| Greater than 1.20x | % | ||||||||||||||||||||||||||||
| 1.00x - 1.20x | % | ||||||||||||||||||||||||||||
| Less than 1.00x | % | ||||||||||||||||||||||||||||
| Total commercial mortgage loans | % | ||||||||||||||||||||||||||||
| Residential mortgage loans | |||||||||||||||||||||||||||||
| Performing | % | ||||||||||||||||||||||||||||
| Nonperforming | % | ||||||||||||||||||||||||||||
| Total residential mortgage loans | % | ||||||||||||||||||||||||||||
| Total mortgage loans | $ | $ | $ | $ | $ | $ | $ | $ | % | ||||||||||||||||||||
| December 31, 2022 | |||||||||||||||||||||||||||||
| 2022 | 2021 | 2020 | 2019 | 2018 | Prior | Revolving Loans | Total | % of Total | |||||||||||||||||||||
| Commercial mortgage loans | |||||||||||||||||||||||||||||
| Loan to value ratios: | |||||||||||||||||||||||||||||
| Less than 70% | $ | $ | $ | $ | $ | $ | $ | $ | % | ||||||||||||||||||||
| 70% - 80% | % | ||||||||||||||||||||||||||||
| 80% - 100% | % | ||||||||||||||||||||||||||||
| Greater than 100% | % | ||||||||||||||||||||||||||||
| Total commercial mortgage loans | % | ||||||||||||||||||||||||||||
| Debt service coverage ratios: | |||||||||||||||||||||||||||||
| Greater than 1.20x | % | ||||||||||||||||||||||||||||
| 1.00x - 1.20x | % | ||||||||||||||||||||||||||||
| Less than 1.00x | % | ||||||||||||||||||||||||||||
| Total commercial mortgage loans | % | ||||||||||||||||||||||||||||
| Residential mortgage loans | |||||||||||||||||||||||||||||
| Performing | % | ||||||||||||||||||||||||||||
| Nonperforming | % | ||||||||||||||||||||||||||||
| Total residential mortgage loans | % | ||||||||||||||||||||||||||||
| Total mortgage loans | $ | $ | $ | $ | $ | $ | $ | $ | % | ||||||||||||||||||||
132
Part II | Item 8. Notes to Consolidated Financial Statements | 4. Investments
| December 31, 2023 | ||||||||||||||||||||||||||||||||
In Good Standing (1) | Restructured | Greater than 90 Days Delinquent | In the Process of Foreclosure | Total Carrying Value | ||||||||||||||||||||||||||||
| Apartment | $ | $ | $ | $ | $ | |||||||||||||||||||||||||||
| Hotel | ||||||||||||||||||||||||||||||||
| Office | ||||||||||||||||||||||||||||||||
| Retail | ||||||||||||||||||||||||||||||||
| Warehouse | ||||||||||||||||||||||||||||||||
| Total commercial | ||||||||||||||||||||||||||||||||
Residential (2) | ||||||||||||||||||||||||||||||||
| Total | $ | $ | $ | $ | $ | |||||||||||||||||||||||||||
| December 31, 2022 | ||||||||||||||||||||||||||||||||
In Good Standing (1) | Restructured | Greater than 90 Days Delinquent | In the Process of Foreclosure | Total Carrying Value | ||||||||||||||||||||||||||||
| Apartment | $ | $ | $ | $ | $ | |||||||||||||||||||||||||||
| Hotel | ||||||||||||||||||||||||||||||||
| Office | ||||||||||||||||||||||||||||||||
| Retail | ||||||||||||||||||||||||||||||||
| Warehouse | ||||||||||||||||||||||||||||||||
| Total commercial | ||||||||||||||||||||||||||||||||
Residential (2) | ||||||||||||||||||||||||||||||||
| Total | $ | $ | $ | $ | $ | |||||||||||||||||||||||||||
(1) At December 31, 2023 and 2022, includes mezzanine loans of $391 million and $410 million in the Apartment category, $21 million and $41 million in the Hotel category, $171 million and $236 million in the Office category, $32 million and $43 million in the Retail category, and $312 million and $140 million in the Warehouse category, respectively.
(2) At December 31, 2023 and 2022, includes $22 million and $41 million of loans purchased when the loans were greater than 90 days delinquent and $5 million and $12 million of loans in process of foreclosure are supported with insurance or other guarantees provided by various governmental programs, respectively.
The following table provides information about the mortgage loans modified to borrowers experiencing financial difficulty (in millions, except for percentage information):
| Term Extension | ||||||||||||||
| Amortized Cost Basis at December 31, 2023 | Percent of Total Class | |||||||||||||
| Commercial mortgage loans | $ | % | ||||||||||||
The following table describes the financial effect of the modifications made to borrowers experiencing financial difficulty:
| Term Extension | ||||||||
| Financial Effect | ||||||||
| Commercial mortgage loans | Granted extension of term for -years and required partial principal repayment at extension of the loan. | |||||||
The Company closely monitors the performance of the loans that are modified to borrowers experiencing financial difficulty to understand the effectiveness of its modification efforts. The following table depicts the performance of loans that have been modified in the last 12 months (in millions):
| Payment Status (Amortized Cost Basis) | ||||||||||||||||||||
| Current | 30-89 Days Past Due | 90+ Days Past Due | ||||||||||||||||||
| Commercial mortgage loans | $ | $ | $ | |||||||||||||||||
133
Part II | Item 8. Notes to Consolidated Financial Statements | 4. Investments
As of December 31, 2022, there were no commercial mortgage loans involved in troubled debt restructuring. As of December 31, 2023 and 2022, stressed mortgage loans for which the Company is dependent, or expects to be dependent, on the underlying property to satisfy repayment were $19 million and $3 million, respectively.
Equity Securities
Equity securities include common stocks, preferred stocks and mutual funds. All equity securities are carried at fair value with changes in value included in net investment income.
Policy Loans
Policy loans are loans the Company issues to contract holders that use the cash surrender value of their life insurance policy or annuity contract as collateral. At December 31, 2023 and 2022, $3.5 billion and $3.4 billion, respectively, of these loans were carried at fair value, which the Company believes is equal to unpaid principal balances, plus accrued investment income. At December 31, 2023 and 2022, the Company had $0.9 billion and $1.0 billion, respectively, of policy loans not held as collateral for reinsurance, which were carried at the unpaid principal balances.
Other Invested Assets
Other invested assets primarily include investments in Federal Home Loan Bank of Indianapolis ("FHLBI") capital stock, limited partnerships (“LPs”), and real estate. FHLBI capital stock is carried at cost and adjusted for any impairment. At December 31, 2023 and 2022, FHLB capital stock had carrying value of $108 million and $146 million, respectively. Real estate is carried at the lower of depreciated cost or fair value and real estate occupied by the Company is carried at depreciated cost. At December 31, 2023 and 2022, real estate totaling $226 million and $237 million, included foreclosed properties with a book value of $6 million and nil , respectively. Carrying values for LP investments are generally determined by using the proportion of the Company’s investment in each fund (Net Asset Value (“NAV”) equivalent) as a practical expedient for fair value, and generally are recorded on a three-month lag, with changes in value included in net investment income. At December 31, 2023 and 2022, investments in LPs had carrying values of $2,132 million and $3,212 million, respectively.
Securities Lending
The Company has entered into securities lending agreements with agent banks whereby blocks of securities are loaned to third parties, primarily major brokerage firms. As of December 31, 2023 and 2022, the estimated fair value of loaned securities was $19 million and $35 million, respectively. The agreements require a minimum of 102 % of the fair value of the loaned securities to be held as collateral, calculated daily. To further minimize the credit risks related to these programs, the financial condition of counterparties is monitored on a regular basis. At December 31, 2023 and 2022, cash collateral received in the amount of $19 million and $36 million, respectively, was invested by the agent banks and included in cash and cash equivalents of the Company. A securities lending payable for the overnight and continuous loans is included in liabilities in the amount of cash collateral received. Securities lending transactions are used to generate income. Income and expenses associated with these transactions are reported as net investment income.
134
Part II | Item 8. Notes to Consolidated Financial Statements | 4. Investments
Repurchase Agreements
The Company routinely enters into repurchase agreements whereby the Company agrees to sell and repurchase securities. These agreements are accounted for as financing transactions, with the assets and associated liabilities included in the Consolidated Balance Sheets. The following table presents information regarding these transactions for the December 31, 2023 and 2022 (in millions, except percentage data):
| December 31, | |||||||||||
| 2023 | 2022 | ||||||||||
| Highest level of short-term borrowings at any month end | $ | $ | |||||||||
| Average short-term borrowing | |||||||||||
| Weighted average interest rate | % | % | |||||||||
Outstanding repurchase agreement balance (1) | |||||||||||
(1) Collateralized with U.S. Treasury securities and corporate securities of | |||||||||||
5. Derivative Instruments
Freestanding Derivative Instruments
The Company enters into financial derivative transactions, including swaps, put-swaptions, futures and options to reduce and manage business risks. These transactions manage the risk of a change in the value, yield, price, cash flows, credit quality or degree of exposure with respect to assets, liabilities or future cash flows that the Company has acquired or incurred. The Company does not account for freestanding derivatives as either fair value or cash flow hedges as might be permitted if specific hedging documentation requirements were followed. As a result, freestanding derivatives are carried at fair value on the balance sheet with settlements and changes in fair value recorded in net gains (losses) on derivatives and investments.
With respect to the Company’s interest rate swaps, total return swaps, and cross-currency swaps, the Company records the income related to periodic interest payment settlements within net gains (losses) on derivatives and investments. Although the Company does not account for these as cash flow hedges, the income from these settlements is considered operating income due to the cash settlement nature and is reported, as such, within the Company’s segment related disclosure within pretax adjusted operating earnings.
The Company manages the potential credit exposure for over-the-counter derivative contracts through evaluation of the counterparty credit standing, collateral agreements, and master netting agreements. The Company is exposed to credit-related losses in the event of nonperformance by counterparties, however, it does not anticipate nonperformance. There were no charges due to nonperformance by derivative counterparties in 2023, 2022 or 2021.
Embedded Derivatives—Product Liabilities
Certain product features, including the index-linked crediting option offered in connection with fixed index annuities and RILAs issued by the Company, are classified as embedded derivatives. These embedded derivatives are separated for accounting purposes and are carried at fair value. These embedded derivatives are reported within other contract holder funds in the Consolidated Balance Sheets consistent with the host contract. The results from changes in value of these embedded derivatives are reported in net gains (losses) on derivatives and investments in the Consolidated Income Statements.
See Note 10 - Other Contract Holder Funds of Notes to Consolidated Financial Statements for additional information on the accounting policies for these embedded derivatives within fixed index and registered index-linked annuities.
135
Part II | Item 8. Notes to Consolidated Financial Statements | 5. Derivative Instruments
Embedded Derivatives—Funds Withheld Reinsurance Agreements
The Company has recorded an embedded derivative liability related to the Athene coinsurance agreement (the “Athene Embedded Derivative”) in accordance with FASB ASC 815-15-55-107 and 108, “Derivatives and Hedging Case B: Reinsurer’s Receivable Arising from a Modified Coinsurance Arrangement” as Jackson’s obligation under the Reinsurance Agreement is based on the total return of investments in a segregated funds withheld account rather than Jackson’s own creditworthiness. As the Reinsurance Agreement transfers the economics of the investments in the segregated funds withheld account to Athene, it will receive an investment return equivalent to owning the underlying assets. At inception of the Reinsurance Agreement, the Athene Embedded Derivative was valued at zero. Additionally, the inception fair value of the investments in the segregated funds withheld account differed from their book value and, accordingly, the amortization of this difference is reported in net gains (losses) on derivatives and investments in the Consolidated Income Statements, while the investments are held. Subsequent to the effective date of the Reinsurance Agreement, the Athene Embedded Derivative is measured at fair value with changes reported in net gains (losses) on derivatives and investments in the Consolidated Income Statements. The Athene Embedded Derivative Liability is included in funds withheld payable under reinsurance treaties in the Consolidated Balance Sheets. See “Athene Reinsurance” in Note 8 of the Notes to the Consolidated Financial Statements for additional information on the Athene Reinsurance Transaction.
A summary of the aggregate contractual or notional amounts and fair values of the Company’s freestanding and embedded derivative instruments are as follows (in millions):
| December 31, 2023 | ||||||||||||||||||||
| Contractual/ | Assets | Liabilities | Net | |||||||||||||||||
| Notional | Fair | Fair | Fair Value | |||||||||||||||||
Amount (1) | Value | Value | Asset (Liability) | |||||||||||||||||
| Freestanding derivatives | ||||||||||||||||||||
| Cross-currency swaps | $ | $ | $ | $ | ||||||||||||||||
| Equity index call options | ||||||||||||||||||||
Equity index futures (2) | ||||||||||||||||||||
| Equity index put options | ||||||||||||||||||||
| Interest rate swaps | ( | |||||||||||||||||||
| Put-swaptions | ( | |||||||||||||||||||
Interest rate futures (2) | ||||||||||||||||||||
| Total return swaps | ( | |||||||||||||||||||
| Total freestanding derivatives | ( | |||||||||||||||||||
| Embedded derivatives | ||||||||||||||||||||
Fixed index annuity embedded derivatives (3) | N/A | ( | ||||||||||||||||||
Registered index-linked annuity embedded derivatives (3) | N/A | ( | ||||||||||||||||||
| Total embedded derivatives | N/A | ( | ||||||||||||||||||
| Derivatives related to funds withheld under reinsurance treaties | ||||||||||||||||||||
| Cross-currency swaps | ||||||||||||||||||||
| Cross-currency forwards | ||||||||||||||||||||
Funds withheld embedded derivative (4) | N/A | |||||||||||||||||||
| Total derivatives related to funds withheld under reinsurance treaties | ||||||||||||||||||||
| Total | $ | $ | $ | $ | ( | |||||||||||||||
(1) The notional amount for swaps and swaptions represents the stated principal balance used as a basis for calculating payments. The contractual amount for futures and options represents the market exposure of open positions. | ||||||||||||||||||||||||||
(2) Variation margin is considered settlement resulting in the netting of cash received/paid for variation margin against the fair value of the trades. | ||||||||||||||||||||||||||
(3) Included within other contract holder funds on the Consolidated Balance Sheets. The non-performance risk adjustment is included in the balance above. | ||||||||||||||||||||||||||
(4) Included within funds withheld payable under reinsurance treaties on the Consolidated Balance Sheets. | ||||||||||||||||||||||||||
136
Part II | Item 8. Notes to Consolidated Financial Statements | 5. Derivative Instruments
| December 31, 2022 | ||||||||||||||||||||
| Contractual/ | Assets | Liabilities | Net | |||||||||||||||||
| Notional | Fair | Fair | Fair Value | |||||||||||||||||
Amount (1) | Value | Value | Asset (Liability) | |||||||||||||||||
| Freestanding derivatives | ||||||||||||||||||||
| Cross-currency swaps | $ | $ | $ | $ | ( | |||||||||||||||
| Equity index call options | ||||||||||||||||||||
Equity index futures (2) | ||||||||||||||||||||
| Equity index put options | ||||||||||||||||||||
| Interest rate swaps | ( | |||||||||||||||||||
Interest rate swaps - cleared (2) | ||||||||||||||||||||
| Put-swaptions | ( | |||||||||||||||||||
Interest rate futures (2) | ||||||||||||||||||||
| Total return swaps | ||||||||||||||||||||
| Total freestanding derivatives | ( | |||||||||||||||||||
| Embedded derivatives | ||||||||||||||||||||
Fixed index annuity embedded derivatives (3) | N/A | ( | ||||||||||||||||||
Registered index-linked annuity embedded derivatives (3) | N/A | ( | ||||||||||||||||||
| Total embedded derivatives | N/A | ( | ||||||||||||||||||
| Derivatives related to funds withheld under reinsurance treaties | ||||||||||||||||||||
| Cross-currency swaps | ||||||||||||||||||||
| Cross-currency forwards | ||||||||||||||||||||
Funds withheld embedded derivative (4) | N/A | |||||||||||||||||||
| Total derivatives related to funds withheld under reinsurance treaties | ||||||||||||||||||||
| Total | $ | $ | $ | $ | ||||||||||||||||
(1) The notional amount for swaps and swaptions represents the stated principal balance used as a basis for calculating payments. The contractual amount for futures and options represents the market exposure of open positions. | ||||||||||||||||||||||||||
(2) Variation margin is considered settlement resulting in the netting of cash received/paid for variation margin against the fair value of the trades. | ||||||||||||||||||||||||||
(3) Included within other contract holder funds on the Consolidated Balance Sheets. The non-performance risk adjustment is included in the balance above. | ||||||||||||||||||||||||||
(4) Included within funds withheld payable under reinsurance treaties on the Consolidated Balance Sheets. | ||||||||||||||||||||||||||
137
Part II | Item 8. Notes to Consolidated Financial Statements | 5. Derivative Instruments
The following table reflects the results of the Company’s derivatives, including gains (losses) and change in fair value of freestanding derivative instruments and embedded derivatives (in millions):
| Years Ended December 31, | ||||||||||||||||||||
| 2023 | 2022 | 2021 | ||||||||||||||||||
| Derivatives excluding funds withheld under reinsurance treaties | ||||||||||||||||||||
| Cross-currency swaps | $ | ( | $ | ( | $ | ( | ||||||||||||||
| Equity index call options | ( | |||||||||||||||||||
| Equity index futures | ( | ( | ||||||||||||||||||
| Equity index put options | ( | ( | ( | |||||||||||||||||
| Interest rate swaps | ( | ( | ( | |||||||||||||||||
| Interest rate swaps - cleared | ( | ( | ( | |||||||||||||||||
| Put-swaptions | ( | ( | ||||||||||||||||||
| Interest rate futures | ( | ( | ||||||||||||||||||
| Total return swaps | ( | |||||||||||||||||||
| Fixed index annuity embedded derivatives | ( | |||||||||||||||||||
| Registered index-linked annuity embedded derivatives | ( | ( | ||||||||||||||||||
| Total net gains (losses) on derivative instruments excluding derivative instruments related to funds withheld under reinsurance treaties | ( | ( | ( | |||||||||||||||||
| Derivatives related to funds withheld under reinsurance treaties | ||||||||||||||||||||
| Cross-currency swaps | ( | |||||||||||||||||||
| Cross-currency forwards | ( | |||||||||||||||||||
| Funds withheld embedded derivative | ( | |||||||||||||||||||
| Total net gains (losses) on derivative instruments related to funds withheld under reinsurance treaties | ( | |||||||||||||||||||
| Total net gains (losses) on derivative instruments including derivative instruments related to funds withheld under reinsurance treaties | $ | ( | $ | $ | ( | |||||||||||||||
All of the Company’s trade agreements for freestanding, over-the-counter derivatives, contain credit downgrade provisions that allow a party to assign or terminate derivative transactions if the counterparty’s credit rating declines below an established limit. At December 31, 2023 and 2022, the fair value of the Company’s net non-cleared, over-the-counter derivative assets by counterparty were $117 million and $885 million, respectively, and held collateral was $841 million and $858 million, respectively, related to these agreements. At December 31, 2023 and 2022, the fair value of the Company’s net non-cleared, over-the-counter derivative liabilities by counterparty were $937 million and $1,680 million, respectively, and provided collateral was $751 million and $1,650 million, respectively, related to these agreements. If all of the downgrade provisions had been triggered at December 31, 2023 and 2022, in aggregate, the Company would have had to disburse $910 million and $30 million, respectively, and would have been allowed to claim nil and $27 million, respectively.
The Company pledged collateral with a carrying value of $2,616 million and $1,641 million as of December 31, 2023 and 2022, respectively, for initial margin related to uncleared margin for over-the-counter derivatives and exchange-traded futures. Variation margin on exchange traded futures is settled through the netting of cash paid/received for variation margin against the fair value of the trades.
Offsetting Assets and Liabilities
The Company’s derivative instruments, repurchase agreements and securities lending agreements are subject to master netting arrangements and collateral arrangements. A master netting arrangement with a counterparty creates a right of offset for amounts due to and due from that same counterparty that is enforceable in the event of a default or bankruptcy. The Company recognizes amounts subject to master netting arrangements on a gross basis within the Consolidated Balance Sheets.
138
Part II | Item 8. Notes to Consolidated Financial Statements | 5. Derivative Instruments
The following tables present the gross and net information about the Company’s financial instruments subject to master netting arrangements (in millions):
| December 31, 2023 | ||||||||||||||||||||||||||||||||||||||||||||||||||
| Gross Amounts Recognized | Gross Amounts Offset in the Consolidated Balance Sheets | Net Amounts Presented in the Consolidated Balance Sheets | ||||||||||||||||||||||||||||||||||||||||||||||||
| Gross Amounts Not Offset in the Consolidated Balance Sheets | ||||||||||||||||||||||||||||||||||||||||||||||||||
Financial Instruments (1) | Cash Collateral | Securities Collateral (2) | Net Amount | |||||||||||||||||||||||||||||||||||||||||||||||
| Financial Assets: | ||||||||||||||||||||||||||||||||||||||||||||||||||
| Freestanding derivative | ||||||||||||||||||||||||||||||||||||||||||||||||||
| assets | $ | $ | $ | $ | $ | $ | $ | |||||||||||||||||||||||||||||||||||||||||||
| Financial Liabilities: | ||||||||||||||||||||||||||||||||||||||||||||||||||
| Freestanding derivative | ||||||||||||||||||||||||||||||||||||||||||||||||||
| liabilities | $ | $ | $ | $ | $ | $ | $ | |||||||||||||||||||||||||||||||||||||||||||
| Securities loaned | ||||||||||||||||||||||||||||||||||||||||||||||||||
| Repurchase agreements | ||||||||||||||||||||||||||||||||||||||||||||||||||
| Total financial liabilities | $ | $ | $ | $ | $ | $ | $ | |||||||||||||||||||||||||||||||||||||||||||
(1) Represents the amount that could be offset under master netting or similar arrangements that management elects not to offset on the Consolidated Balance Sheets. | |||||||||||||||||||||||||||||||||||||||||
(2) Excludes initial margin amounts for exchange-traded derivatives. | |||||||||||||||||||||||||||||||||||||||||
| December 31, 2022 | ||||||||||||||||||||||||||||||||||||||||||||||||||
| Gross Amounts Recognized | Gross Amounts Offset in the Consolidated Balance Sheets | Net Amounts Presented in the Consolidated Balance Sheets | ||||||||||||||||||||||||||||||||||||||||||||||||
| Gross Amounts Not Offset in the Consolidated Balance Sheets | ||||||||||||||||||||||||||||||||||||||||||||||||||
Financial Instruments (1) | Cash Collateral | Securities Collateral (2) | Net Amount | |||||||||||||||||||||||||||||||||||||||||||||||
| Financial Assets: | ||||||||||||||||||||||||||||||||||||||||||||||||||
| Freestanding derivative | ||||||||||||||||||||||||||||||||||||||||||||||||||
| assets | $ | $ | $ | $ | $ | $ | $ | |||||||||||||||||||||||||||||||||||||||||||
| Financial Liabilities: | ||||||||||||||||||||||||||||||||||||||||||||||||||
| Freestanding derivative | ||||||||||||||||||||||||||||||||||||||||||||||||||
| liabilities | $ | $ | $ | $ | $ | $ | $ | |||||||||||||||||||||||||||||||||||||||||||
| Securities loaned | ||||||||||||||||||||||||||||||||||||||||||||||||||
| Repurchase agreements | ||||||||||||||||||||||||||||||||||||||||||||||||||
| Total financial liabilities | $ | $ | $ | $ | $ | $ | $ | |||||||||||||||||||||||||||||||||||||||||||
(1) Represents the amount that could be offset under master netting or similar arrangements that management elects not to offset on the Consolidated Balance Sheets. | |||||||||||||||||||||||||||||||||||||||||
(2) Excludes initial margin amounts for exchange-traded derivatives. | |||||||||||||||||||||||||||||||||||||||||
139
Part II | Item 8. Notes to Consolidated Financial Statements | 6. Fair Value Measurements
6. Fair Value Measurements
Fair value measurements are based upon observable and unobservable inputs. Observable inputs reflect market data obtained from independent sources, while unobservable inputs reflect the Company’s view of market assumptions in the absence of observable market information. The Company utilizes valuation techniques that maximize the use of observable inputs and minimize the use of unobservable inputs. All financial assets and liabilities measured at fair value are required to be classified into one of the following categories:
Level 1 | Observable inputs that reflect quoted prices for identical assets or liabilities in active markets that the Company has the ability to access at the measurement date. Level 1 securities include U.S. Treasury securities and exchange traded equity securities and derivative instruments. | |||||||
Level 2 | Observable inputs, other than quoted prices included in Level 1, for the asset or liability or prices for similar assets and liabilities. Most debt securities that are model priced using observable inputs are classified within Level 2. Also included are freestanding and embedded derivative instruments that are priced using models with observable market inputs. | |||||||
Level 3 | Valuations that are derived from techniques in which one or more of the significant inputs are unobservable (including assumptions about risk). Embedded derivatives that are valued using unobservable inputs are included in Level 3. Because Level 3 fair values, by their nature, contain unobservable market inputs, considerable judgment may be used to determine the Level 3 fair values. Level 3 fair values represent the Company’s best estimate of an amount that could be realized in a current market exchange absent actual market exchanges. | |||||||
In many situations, inputs used to measure the fair value of an asset or liability may fall into different levels of the fair value hierarchy. In these situations, the Company determines the level in which the fair value falls based upon the lowest level input that is significant to the determination of the fair value. As a result, both observable and unobservable inputs may be used in the determination of fair values that the Company has classified within Level 3.
The Company determines the fair values of certain financial assets and liabilities based on quoted market prices, where available. The Company may also determine fair value based on estimated future cash flows discounted at the appropriate current market rate. When appropriate, fair values reflect adjustments for counterparty credit quality, the Company’s credit standing, liquidity and risk margins on unobservable inputs.
Where quoted market prices are not available, fair value estimates are made at a point in time, based on relevant market data, as well as the best information about the individual financial instrument. At times, illiquid market conditions may result in inactive markets for certain of the Company’s financial instruments. In such instances, there may be no or limited observable market data for these assets and liabilities. Fair value estimates for financial instruments deemed to be in an illiquid market are based on judgments regarding current economic conditions, liquidity discounts, currency, credit and interest rate risks, loss experience and other factors. These fair values are estimates and involve considerable uncertainty and variability as a result of the inputs selected and may differ materially from the values that would have been used had an active market existed. As a result of market inactivity, such calculated fair value estimates may not be realizable in an immediate sale or settlement of the instrument. In addition, changes in the underlying assumptions used in the fair value measurement technique could significantly affect these fair value estimates.
140
Part II | Item 8. Notes to Consolidated Financial Statements | 6. Fair Value Measurements
The following table summarizes the fair value and carrying value of the Company’s financial instruments (in millions):
| December 31, 2023 | December 31, 2022 | |||||||||||||||||||
| Carrying Value | Fair Value | Carrying Value | Fair Value | |||||||||||||||||
| Assets | ||||||||||||||||||||
Debt securities (1) | $ | $ | $ | $ | ||||||||||||||||
| Equity securities | ||||||||||||||||||||
Mortgage loans (1) | ||||||||||||||||||||
| Limited partnerships | ||||||||||||||||||||
Policy loans (1) | ||||||||||||||||||||
| Freestanding derivative instruments | ||||||||||||||||||||
| FHLBI capital stock | ||||||||||||||||||||
| Cash and cash equivalents | ||||||||||||||||||||
| Reinsurance recoverable on market risk benefits | ||||||||||||||||||||
| Market risk benefit assets | ||||||||||||||||||||
| Separate account assets | ||||||||||||||||||||
| Liabilities | ||||||||||||||||||||
Annuity reserves (2) | ||||||||||||||||||||
| Market risk benefit liabilities | ||||||||||||||||||||
Reserves for guaranteed investment contracts (3) | ||||||||||||||||||||
Trust instruments supported by funding agreements (3) | ||||||||||||||||||||
FHLB funding agreements (3) | ||||||||||||||||||||
Funds withheld payable under reinsurance treaties (1) | ||||||||||||||||||||
| Long-term debt | ||||||||||||||||||||
Securities lending payable (4) | ||||||||||||||||||||
| Freestanding derivative instruments | ||||||||||||||||||||
| Notes issued by consolidated VIEs | ||||||||||||||||||||
Repurchase agreements (4) | ||||||||||||||||||||
FHLB advances (5) | ||||||||||||||||||||
| Separate account liabilities | ||||||||||||||||||||
(1) Includes items carried at fair value under the fair value option and trading securities included as a component of debt securities. (2) Annuity reserves represent only the components of other contract holder funds and reserves for future policy benefits and claims payable that are considered to be financial instruments. (3) Included as a component of other contract holder funds on the Consolidated Balance Sheets. (4) Included as a component of repurchase agreements and securities lending payable on the Consolidated Balance Sheets. (5) Included as a component of other liabilities on the Consolidated Balance Sheets. | ||||||||||||||||||||
The following is a discussion of the methodologies used to determine fair values of the financial instruments measured on a recurring basis reported in the following tables.
Debt and Equity Securities
The fair values for debt and equity securities are determined using information available from independent pricing services, broker-dealer quotes, or internally derived estimates. Priority is given to publicly available prices from independent sources, when available. Securities for which the independent pricing service does not provide a quotation are either submitted to independent broker-dealers for prices or priced internally. Typical inputs used by these three pricing methods include reported trades, benchmark yields, credit spreads, liquidity premiums and/or estimated cash flows based on default and prepayment assumptions.
141
Part II | Item 8. Notes to Consolidated Financial Statements | 6. Fair Value Measurements
As a result of typical trading volumes and the lack of specific quoted market prices for most debt securities, independent pricing services will normally derive the security prices through recently reported trades for identical or similar securities, making adjustments through the reporting date based upon available market observable information as outlined above. If there are no recently reported trades, the independent pricing services and broker-dealers may use matrix or pricing model processes to develop a security price where future cash flow expectations are developed based upon collateral performance and discounted at relevant market rates. Certain securities are priced using broker-dealer quotes, which may utilize proprietary inputs and models. Additionally, the majority of these quotes are non-binding. These securities are classified as Level 3 in the fair value hierarchy.
Included in the pricing of asset-backed securities are estimates of the rate of future prepayments of principal over the remaining life of the securities. Such estimates are derived based on the characteristics of the underlying structure and prepayment assumptions believed to be relevant for the underlying collateral. Actual prepayment experience may vary from these estimates.
Internally derived estimates may be used to develop a fair value for securities for which the Company is unable to obtain either a reliable price from an independent pricing service or a suitable broker-dealer quote. These fair value estimates may incorporate Level 2 and Level 3 inputs, as defined below, and are generally derived using expected future cash flows, discounted at market interest rates available from market sources based on the credit quality and duration of the instrument. For securities that may not be reliably priced using these internally developed pricing models, a fair value may be estimated using indicative market prices. These prices are indicative of an exit price, but the assumptions used to establish the fair value may not be observable or corroborated by market observable information and, therefore, represent Level 3 inputs.
The Company performs an analysis on the prices and credit spreads received from third parties to ensure that the prices represent a reasonable estimate of the fair value. This process involves quantitative and qualitative analysis and is overseen by investment and accounting professionals. Examples of procedures performed include initial and ongoing review of third-party pricing service methodologies, review of pricing statistics and trends, back testing recent trades and monitoring of trading volumes. In addition, the Company considers whether prices received from independent broker-dealers represent a reasonable estimate of fair value using internal and external cash flow models, which are developed based on spreads and, when available, market indices. As a result of this analysis, if the Company determines there is a more appropriate fair value based upon the available market data, the price received from the third party may be adjusted accordingly.
For those securities that were internally valued at December 31, 2023 and 2022, the pricing model used by the Company utilizes current spread levels of similarly rated securities to determine the market discount rate for the security. Furthermore, appropriate risk premiums for illiquidity and non-performance are incorporated in the discount rate. Cash flows, as estimated by the Company using issuer-specific default statistics and prepayment assumptions, are discounted to determine an estimated fair value.
On an ongoing basis, the Company reviews the independent pricing services’ valuation methodologies and related inputs and evaluates the various types of securities in its investment portfolio to determine an appropriate fair value hierarchy distribution based upon trading activity and the observability of inputs. Based on the results of this evaluation, each price is classified into Level 1, 2, or 3. Most prices provided by independent pricing services are classified into Level 2 due to their use of market observable inputs.
Limited Partnerships
Fair values for limited partnership interests, which are included in other invested assets, are generally determined using the proportion of the Company’s investment in the value of the net assets of each fund (“NAV equivalent”) as a practical expedient for fair value, and generally, are recorded on a three-month lag. No adjustments to these amounts were deemed necessary at December 31, 2023 and 2022. As a result of using the net asset value per share practical expedient, limited partnership interests are not classified in the fair value hierarchy.
142
Part II | Item 8. Notes to Consolidated Financial Statements | 6. Fair Value Measurements
The Company’s limited partnership interests are not redeemable, and distributions received are generally the result of liquidation of the underlying assets of the partnerships. The Company generally has the ability under the partnership agreements to sell its interest to another limited partner with the prior written consent of the general partner. In cases when the Company expects to sell the limited partnership interest, the estimated sales price is used to determine the fair value rather than the practical expedient. Limited partnership interests expected to be sold are classified as Level 2 in the fair value hierarchy.
In cases when a limited partnership’s financial statements are unavailable and a NAV equivalent is not available or practical, the fair value may be based on an internally developed model or provided by the general partner as determined using private transactions, information obtained from the primary co-investor or underlying company, or financial metrics provided by the lead sponsor. These investments are classified as Level 3 in the fair value hierarchy.
Policy Loans
Policy loans are funds provided to policyholders in return for a claim on the policies values and function like demand deposits, which are redeemable upon repayment, death or surrender, and there is only one market price at which the transaction could be settled – the then current carrying value. The funds provided are limited to the cash surrender value of the underlying policy. The nature of policy loans is to have a negligible default risk as the loans are fully collateralized by the value of the policy. Policy loans do not have a stated maturity and the balances and accrued interest are repaid either by the policyholder or with proceeds from the policy. Due to the collateralized nature of policy loans and unpredictable timing of payments, the Company believes the carrying value of policy loans approximates fair value. The reinsurance related component of policy loans at fair value under the fair value option have been classified as Level 3 within the fair value hierarchy.
Freestanding Derivative Instruments
Freestanding derivative instruments are reported at fair value, which reflects the estimated amounts, net of payment accruals, that the Company would receive or pay upon sale or termination of the contracts at the reporting date. Changes in fair value are included in net gains (losses) on derivatives and investments. Freestanding derivatives priced using third-party pricing services incorporate inputs that are observable in the market. Inputs used to value derivatives include interest rate swap curves, credit spreads, interest rates, counterparty credit risk, equity volatility and equity index levels.
Freestanding derivative instruments classified as:
•Level 1 include futures, which are traded on active exchanges.
•Level 2 include interest rate swaps, cross currency swaps, cross-currency forwards, credit default swaps, total return swaps, put-swaptions and certain equity index call and put options. These derivative valuations are determined by third-party pricing services using pricing models with inputs that are observable in the market or can be derived principally from, or corroborated by, observable market data.
•Level 3 include interest rate contingent options that are valued by third-party pricing services utilizing significant unobservable inputs.
Cash and Cash Equivalents
Cash and cash equivalents primarily include money market instruments and bank deposits. Cash equivalents also includes all highly liquid securities and other investments purchased with an original or remaining maturity of three months or less at the date of purchase. Certain money market instruments are valued using unadjusted quoted prices in active markets and are classified as Level 1.
Funds Withheld Payable Under Reinsurance Treaties
The funds withheld payable under reinsurance treaties includes both the funds withheld payable that are held at fair value under the fair value option and the funds withheld embedded derivative and are both considered Level 3 in the fair value hierarchy.
143
Part II | Item 8. Notes to Consolidated Financial Statements | 6. Fair Value Measurements
•The fair value of the funds withheld payable that are held at fair value under the fair value option is equal to the fair value of the assets held as collateral, which primarily consists of policy loans using industry standard valuation techniques.
•The funds withheld embedded derivative is determined based upon a total return swap technique referencing the fair value of the investments held under the reinsurance contract and requires certain significant unobservable inputs.
Separate Account Assets
Separate account assets are comprised of investments in mutual funds that transact regularly, but do not trade in active markets as they are not publicly available, and are categorized as Level 2 assets.
Market Risk Benefits
Variable Annuities
Variable annuity contracts issued by the Company may include various guaranteed minimum death, withdrawal, income and accumulation benefits, which are classified as MRBs and measured at fair value.
Our MRB assets and MRB liabilities are reported separately on our Consolidated Balance Sheets. Increases to an asset or decreases to a liability are described as favorable changes to fair value. Changes in fair value are reported in Market risk benefits (gains) losses, net on the Consolidated Income Statements. However, the change in fair value related to our own non-performance risk is recognized as a component of other comprehensive income ("OCI") and is reported in Change in non-performance on market risk benefits, net of tax expense (benefit) on the Consolidated Statements of Comprehensive Income (Loss).
Variable annuity guaranteed benefit features classified as MRBs, which have explicit fees, are measured using the attributed fee method. Under the attributed fee method, fair value is measured as the difference between the present value of projected future liabilities and the present value of projected attributed fees. At the inception of the contract, the Company attributes to the MRB a portion of total fees expected to be assessed against the contract holder's account value to offset the projected claims over the lifetime of the contract. The attributed fee is expressed as a percentage of total projected future fees at inception of the contract. This percentage of total projected fees is considered a fixed term of the MRB feature and is held static over the life of the contract. This percentage may not exceed 100% of the total projected contract fees as of contract inception. As the Company may issue contracts that have projected future liabilities greater than the projected future guaranteed benefit fees at issue, the Company may also attribute mortality and expense charges when performing this calculation. The percentage of guaranteed benefit fees and the percentage of mortality and expense charges may not exceed 100% of the total projected fees as of contract inception. In subsequent valuations, both the present value of future projected liabilities and the present value of projected attributed fees are remeasured based on current market conditions and policyholder behavior assumptions.
The Company has ceded the guaranteed minimum income benefit (“GMIB”) features elected on certain annuity contracts to an unrelated party. The GMIBs ceded under this reinsurance treaty are classified as a MRB in their entirety. The reinsurance contract is measured at fair value and reported in Reinsurance recoverable on market risk benefits. Changes in fair value are recorded in Market risk benefits (gains) losses, net. Due to the inability to economically reinsure or hedge new issues of the GMIB, the Company discontinued offering the benefit in 2009.
Fair values for MRBs related to variable annuities, including the contract reinsuring GMIB features, are calculated using internally developed models because active, observable markets do not exist for those guaranteed benefits.
The fair value calculation is based on the present value of future cash flows comprised of future expected benefit payments, less future attributed rider fees, over the lives of the contracts. Estimating these cash flows requires numerous estimates and subjective judgments related to capital market inputs, as well as actuarially determined assumptions related to expectations concerning policyholder behavior. Capital market inputs include expected market rates of return, market volatility, correlations of market index returns to fund returns, and discount rates, which includes an adjustment for non-performance risk. The more significant actuarial assumptions include benefit utilization by policyholders, lapse, mortality, and withdrawal rates. Best estimate assumptions plus risk margins are used as applicable.
144
Part II | Item 8. Notes to Consolidated Financial Statements | 6. Fair Value Measurements
At each valuation date, the fair value calculation reflects expected returns based on treasury rates as of that date to determine the value of expected future cash flows produced in a stochastic process. Volatility assumptions are based on a weighting of available market data for implied market volatility for durations up to 10 years, grading to a historical volatility level by year 15, where such long-term historical volatility levels contain an explicit risk margin. Non-performance risk is incorporated into the calculation through the adjustment of the risk-free rate curve based on credit spreads for debt and debt-like instruments issued by the Company or its insurance operating subsidiaries, adjusted, as necessary, to reflect the financial strength ratings of the issuing insurance subsidiaries. Risk margins are also incorporated into the model assumptions, particularly for policyholder behavior. Estimates of future policyholder behavior are subjective and are based primarily on the Company’s experience.
As markets change, mature and evolve and actual policyholder behavior emerges, management continually evaluates the appropriateness of its assumptions for the fair value model.
The use of the models and assumptions described above requires a significant amount of judgment. Management believes this results in an amount that the Company would be required to transfer for a liability, or receive for an asset, to or from a willing buyer or seller, if one existed, for those market participants to assume the risks associated with the guaranteed benefits and the related reinsurance. However, the ultimate settlement amount of the asset or liability, which is currently unknown, could likely be significantly different than this fair value.
Fixed Index Annuities
The longevity riders issued on fixed index annuities are classified as MRBs and measured at fair value. Similar to the variable annuity guaranteed benefit features, these contracts have explicit fees and are measured using the attributed fee method. The Company attributes a percentage of total projected future fees expected to be assessed against the policyholder to offset the projected future claims over the lifetime of the contract. If the fees attributed are insufficient to offset the claims at issue, the shortfall is borrowed from the host contract rather than recognizing a loss at inception.
RILA
RILA guaranteed benefit features are classified as MRBs and measured at fair value. Unlike variable or fixed index annuities, RILA products do not have explicit fees and are measured using an option-based method. The fair value measurement represents the present value of future claims payable by the MRB feature. At inception, the value of the MRB is deducted from the value of the contract resulting in no gain or loss.
See Note 12 - Market Risk Benefits of Notes to Consolidated Financial Statements for more information regarding MRBs.
Fixed Index Annuities
The fair value of the index-linked crediting derivative feature embedded in fixed index annuities, included in Annuity Reserves in the above tables, is calculated using the closed form Black-Scholes Option Pricing model or Monte Carlo simulations, as appropriate for the type of option, incorporating such factors as the volatility of returns, the level of interest rates and the time remaining until the option expires. Additionally, although not a significant input, assumed withdrawal rates are used to estimate the expected volume of embedded options that will be realized by policyholders.
RILA
The fair value of the index-linked crediting derivative feature embedded in RILAs, included in Annuity Reserves in the above table, is calculated using the closed form Black-Scholes Option Pricing model, incorporating such factors as the volatility of returns, the level of interest rates and the time remaining until the option expires. Additionally, although not a significant input, assumed withdrawal rates are used to estimate the expected volume of embedded options that will be realized by policyholders.
145
Part II | Item 8. Notes to Consolidated Financial Statements | 6. Fair Value Measurements
Notes Issued by Consolidated VIEs
These notes are issued by CLOs and are carried at fair value under the fair value option based on the fair values of corresponding fixed maturity collateral. The CLO liabilities are also reduced by the fair value of the beneficial interest the Company retains in the CLO and the carrying value of any beneficial interests that represent compensation for services. As the notes are valued based on the reference collateral, they are classified as Level 2.
Fair Value Option
The Company elected the fair value option for debt securities related to certain consolidated investments totaling $2,037 million and $2,014 million at December 31, 2023 and 2022, respectively. These debt securities are reflected on the Company’s Consolidated Balance Sheets as debt securities, at fair value under the fair value option.
The Company has elected the fair value option for certain funds withheld assets, which are held as collateral for reinsurance, totaling $4,054 million and $4,160 million at December 31, 2023 and 2022, respectively, as discussed above, and includes mortgage loans as discussed below.
The Company elected the fair value option for certain mortgage loans held under the funds withheld reinsurance agreement with Athene. The fair value option was elected for these mortgage loans, purchased or funded after December 31, 2021, to mitigate inconsistency in earnings that would otherwise result between these mortgage loan assets and the funds withheld liability, including the associated embedded derivative, and are valued using third-party pricing services. Changes in fair value are reflected in net investment income on the Consolidated Income Statements.
The fair value and aggregate contractual principal for mortgage loans where the fair value option was elected after December 31, 2021, were as follows (in millions):
| December 31, | December 31, | |||||||
| 2023 | 2022 | |||||||
| Fair value | $ | $ | ||||||
| Aggregate contractual principal | ||||||||
As of December 31, 2023, no loans in good standing for which the fair value option was elected were in non-accrual status, and no loans were more than 90 days past due and still accruing interest.
The Company elected the fair value option for notes issued by consolidated VIEs totaling $1,988 million and $1,732 million at December 31, 2023 and 2022, respectively.
Income and changes in unrealized gains and losses on other assets for which the Company has elected the fair value option are immaterial to the Company’s Consolidated Financial Statements.
146
Part II | Item 8. Notes to Consolidated Financial Statements | 6. Fair Value Measurements
Assets and Liabilities Measured at Fair Value on a Recurring Basis
The following tables summarize the Company’s assets and liabilities that are carried at fair value by hierarchy levels (in millions):
| December 31, 2023 | ||||||||||||||||||||
| Total | Level 1 | Level 2 | Level 3 | |||||||||||||||||
| Assets | ||||||||||||||||||||
| Debt securities | ||||||||||||||||||||
| U.S. government securities | $ | $ | $ | $ | ||||||||||||||||
| Other government securities | ||||||||||||||||||||
| Public utilities | ||||||||||||||||||||
| Corporate securities | ||||||||||||||||||||
| Residential mortgage-backed | ||||||||||||||||||||
| Commercial mortgage-backed | ||||||||||||||||||||
| Other asset-backed securities | ||||||||||||||||||||
| Equity securities | ||||||||||||||||||||
| Mortgage loans | ||||||||||||||||||||
Limited partnerships (1) | ||||||||||||||||||||
| Policy loans | ||||||||||||||||||||
| Freestanding derivative instruments | ||||||||||||||||||||
| Cash and cash equivalents | ||||||||||||||||||||
| Reinsurance recoverable on market risk benefits | ||||||||||||||||||||
| Market risk benefit assets | ||||||||||||||||||||
| Separate account assets | ||||||||||||||||||||
| Total | $ | $ | $ | $ | ||||||||||||||||
| Liabilities | ||||||||||||||||||||
Embedded derivative liabilities (2) | $ | $ | $ | $ | ||||||||||||||||
Funds withheld payable under reinsurance treaties (3) | ||||||||||||||||||||
| Freestanding derivative instruments | ||||||||||||||||||||
| Notes issued by consolidated VIEs | ||||||||||||||||||||
| Market risk benefit liabilities | ||||||||||||||||||||
Total | $ | $ | $ | $ | ||||||||||||||||
(1) Excludes $ | ||||||||||||||||||||
(2) Includes net embedded derivative liabilities of $ | ||||||||||||||||||||
(3) Includes the Athene Embedded Derivative asset of $ | ||||||||||||||||||||
147
Part II | Item 8. Notes to Consolidated Financial Statements | 6. Fair Value Measurements
| December 31, 2022 | |||||||||||||||||
| Total | Level 1 | Level 2 | Level 3 | ||||||||||||||
| Assets | |||||||||||||||||
| Debt securities | |||||||||||||||||
| U.S. government securities | $ | $ | $ | $ | |||||||||||||
| Other government securities | |||||||||||||||||
| Public utilities | |||||||||||||||||
| Corporate securities | |||||||||||||||||
| Residential mortgage-backed | |||||||||||||||||
| Commercial mortgage-backed | |||||||||||||||||
| Other asset-backed securities | |||||||||||||||||
| Equity securities | |||||||||||||||||
| Mortgage loans | |||||||||||||||||
Limited partnerships (1) | |||||||||||||||||
| Policy loans | |||||||||||||||||
| Freestanding derivative instruments | |||||||||||||||||
| Cash and cash equivalents | |||||||||||||||||
| Reinsurance recoverable on market risk benefits | |||||||||||||||||
| Market risk benefit assets | |||||||||||||||||
| Separate account assets | |||||||||||||||||
| Total | $ | $ | $ | $ | |||||||||||||
| Liabilities | |||||||||||||||||
Embedded derivative liabilities (2) | $ | $ | $ | $ | |||||||||||||
Funds withheld payable under reinsurance treaties (3) | |||||||||||||||||
| Freestanding derivative instruments | |||||||||||||||||
| Notes issued by consolidated VIEs | |||||||||||||||||
| Market risk benefit liabilities | |||||||||||||||||
Total | $ | $ | $ | $ | |||||||||||||
(1) Excludes $ | |||||||||||||||||
(2) Includes net embedded derivative liabilities of $ | |||||||||||||||||
(3) Includes the Athene Embedded Derivative liability of $ | |||||||||||||||||
148
Part II | Item 8. Notes to Consolidated Financial Statements | 6. Fair Value Measurements
Assets and Liabilities Measured at Fair Value Using Significant Unobservable Inputs (Level 3)
Level 3 Assets and Liabilities by Price Source
The table below presents the balances of Level 3 assets and liabilities measured at fair value with their corresponding pricing sources (in millions):
| December 31, 2023 | |||||||||||
| Assets | Total | Internal | External | ||||||||
Debt securities: | |||||||||||
| Other government securities | $ | $ | $ | ||||||||
| Public utilities | |||||||||||
Corporate | |||||||||||
Other asset-backed securities | |||||||||||
Equity securities | |||||||||||
| Mortgage loans | |||||||||||
Limited partnerships | |||||||||||
Policy loans | |||||||||||
| Reinsurance recoverable on market risk benefits | |||||||||||
| Market risk benefit assets | |||||||||||
Total | $ | $ | $ | ||||||||
| Liabilities | |||||||||||
Funds withheld payable under reinsurance treaties (1) | |||||||||||
| Market risk benefit liabilities | |||||||||||
Total | $ | $ | $ | ||||||||
(1) Includes the Athene Embedded Derivative asset of $ | |||||||||||
| December 31, 2022 | |||||||||||
| Assets | Total | Internal | External | ||||||||
Debt securities: | |||||||||||
Corporate | $ | $ | $ | ||||||||
Equity securities | |||||||||||
| Mortgage loans | |||||||||||
Limited partnerships | |||||||||||
Policy loans | |||||||||||
| Reinsurance recoverable on market risk benefits | |||||||||||
| Market risk benefit assets | |||||||||||
Total | $ | $ | $ | ||||||||
| Liabilities | |||||||||||
Funds withheld payable under reinsurance treaties (1) | |||||||||||
| Market risk benefit liabilities | |||||||||||
Total | $ | $ | $ | ||||||||
(1) Includes the Athene Embedded Derivative asset of $ | |||||||||||
External pricing sources for securities represent unadjusted prices from independent pricing services and independent indicative broker quotes where pricing inputs are not readily available.
149
Part II | Item 8. Notes to Consolidated Financial Statements | 6. Fair Value Measurements
Quantitative Information Regarding Internally-Priced Level 3 Assets and Liabilities
The table below presents quantitative information on internally priced Level 3 assets and liabilities that use significant unobservable inputs (in millions):
| As of December 31, 2023 | |||||||||||||||||
| Fair Value | Valuation Technique(s) | Significant Unobservable Input(s) | Assumption or Input Range | Impact of Increase in Input on Fair Value | |||||||||||||
| Assets | |||||||||||||||||
| Reinsurance recoverable on market risk benefits | $ | Discounted cash flow | Mortality(1) | Increase | |||||||||||||
Lapse(2) | Increase | ||||||||||||||||
Utilization(3) | Decrease | ||||||||||||||||
Withdrawal(4) | Decrease | ||||||||||||||||
Non-performance risk adjustment(5) | Increase | ||||||||||||||||
Long-term Equity Volatility(6) | Decrease | ||||||||||||||||
| Market risk benefit assets | $ | Discounted cash flow | Mortality(1) | Increase | |||||||||||||
Lapse(2) | Increase | ||||||||||||||||
Utilization(3) | Decrease | ||||||||||||||||
Withdrawal(4) | Decrease | ||||||||||||||||
Non-performance risk adjustment(5) | Increase | ||||||||||||||||
Long-term Equity Volatility(6) | Decrease | ||||||||||||||||
| Liabilities | |||||||||||||||||
| Market risk benefit liabilities | $ | Discounted cash flow | Mortality(1) | Decrease | |||||||||||||
Lapse(2) | Decrease | ||||||||||||||||
Utilization(3) | Increase | ||||||||||||||||
Withdrawal(4) | Increase | ||||||||||||||||
Non-performance risk adjustment(5) | Decrease | ||||||||||||||||
Long-term Equity Volatility(6) | Increase | ||||||||||||||||
(1) Mortality rates vary by attained age, tax qualification status, guaranteed benefit election, and duration. The range displayed reflects ages from the minimum issue age for the benefit through age 95, which corresponds to the typical maturity age. A mortality improvement assumption is also applied.
(2) Base lapse rates vary by contract-level factors, such as product type, surrender charge schedule and optional benefits election. Lapse rates are further adjusted based on the degree to which a guaranteed benefit is in-the-money, with lower lapse applying when benefits are more in-the-money. Lapse rates are also adjusted to reflect lower lapse expectations when guaranteed benefits are utilized.
(3 The utilization rate represents the expected percentage of contracts that will utilize the benefit through annuitization (GMIB) or commencement of withdrawals (GMWB). Utilization may vary by benefit type, attained age, duration, tax qualification status, benefit provision, and degree to which the guaranteed benefit is in-the-money.
(4) The withdrawal rate represents the percentage of annual withdrawal assumed relative to the maximum allowable withdrawal amount under the free partial withdrawal provision or the GMWB, as applicable. Free partial withdrawal rates vary based on the product type and duration. Withdrawal rates on contracts with a GMWB vary based on attained age, tax qualification status, GMWB type and GMWB benefit provisions.
(5) Non-performance risk adjustment is applied as a spread over the risk-free rate to determine the rate used to discount the related cash flows and varies by projection year.
(6) Long-term equity volatility represents the equity volatility beyond the period for which observable equity volatilities are available.
150
Part II | Item 8. Notes to Consolidated Financial Statements | 6. Fair Value Measurements
| As of December 31, 2022 | |||||||||||||||||
| Fair Value | Valuation Technique(s) | Significant Unobservable Input(s) | Assumption or Input Range | Impact of Increase in Input on Fair Value | |||||||||||||
| Assets | |||||||||||||||||
| Reinsurance recoverable on market risk benefits | $ | Discounted cash flow | Mortality(1) | Increase | |||||||||||||
Lapse(2) | Increase | ||||||||||||||||
Utilization(3) | Decrease | ||||||||||||||||
Withdrawal(4) | Decrease | ||||||||||||||||
Non-performance risk adjustment(5) | Increase | ||||||||||||||||
Long-term Equity Volatility(6) | Decrease | ||||||||||||||||
| Market risk benefit assets | $ | Discounted cash flow | Mortality(1) | Increase | |||||||||||||
Lapse(2) | Increase | ||||||||||||||||
Utilization(3) | Decrease | ||||||||||||||||
Withdrawal(4) | Decrease | ||||||||||||||||
Non-performance risk adjustment(5) | Increase | ||||||||||||||||
Long-term Equity Volatility(6) | Decrease | ||||||||||||||||
| Liabilities | |||||||||||||||||
| Market risk benefit liabilities | $ | Discounted cash flow | Mortality(1) | Decrease | |||||||||||||
Lapse(2) | Decrease | ||||||||||||||||
Utilization(3) | Increase | ||||||||||||||||
Withdrawal(4) | Increase | ||||||||||||||||
Non-performance risk adjustment(5) | Decrease | ||||||||||||||||
Long-term Equity Volatility (6) | Increase | ||||||||||||||||
(1) Mortality rates vary by attained age, tax qualification status, guaranteed benefit election, and duration. The range displayed reflects ages from the minimum issue age for the benefit through age 95, which corresponds to the typical maturity age. A mortality improvement assumption is also applied.
(2) Base lapse rates vary by contract-level factors, such as product type, surrender charge schedule and optional benefits election. Lapse rates are further adjusted based on the degree to which a guaranteed benefit is in-the-money, with lower lapse applying when benefits are more in-the-money. Lapse rates are also adjusted to reflect lower lapse expectations when guaranteed benefits are utilized.
(3) The utilization rate represents the expected percentage of contracts that will utilize the benefit through annuitization (GMIB) or commencement of withdrawals (GMWB). Utilization may vary by benefit type, attained age, duration, tax qualification status, benefit provision, and degree to which the guaranteed benefit is in-the-money.
(4) The withdrawal rate represents the percentage of annual withdrawal assumed relative to the maximum allowable withdrawal amount under the free partial withdrawal provision or the GMWB, as applicable. Free partial withdrawal rates vary based on the product type and duration. Withdrawal rates on contracts with a GMWB vary based on attained age, tax qualification status, GMWB type and GMWB benefit provisions.
(5) Non-performance risk adjustment is applied as a spread over the risk-free rate to determine the rate used to discount the related cash flows and varies by projection year.
151
Part II | Item 8. Notes to Consolidated Financial Statements | 6. Fair Value Measurements
Sensitivity to Changes in Unobservable Inputs
The following is a general description of sensitivities of significant unobservable inputs and their impact on the fair value measurement for the assets and liabilities reflected in the tables above.
At December 31, 2023 and 2022, securities of $93 million and $9 million, respectively, are fair valued using techniques incorporating unobservable inputs and are classified in Level 3 of the fair value hierarchy. For these assets, their unobservable inputs and ranges of possible inputs do not materially affect their fair valuations and have been excluded from the quantitative information in the tables above.
Policy loans that support funds withheld reinsurance agreements that are held at fair value under the fair value option on the Company’s Consolidated Balance Sheets are excluded from the tables above. These policy loans do not have a stated maturity and the balances, plus accrued investment income, are repaid either by the policyholder or with proceeds from the policy. Due to the collateralized nature of policy loans and unpredictable timing of payments, the Company believes the carrying value of policy loans, which includes accrued investment income, approximates fair value and is classified as Level 3 within the fair value hierarchy.
The fair value of funds withheld payable under the Reassure America Life Insurance Company ("REALIC") reinsurance treaties, is determined based upon the fair value of the funds withheld investments held by the Company and is excluded from the tables above.
The funds withheld payable under the Athene reinsurance treaty includes the Athene embedded derivative which is measured at fair value. The valuation of the embedded derivative utilizes a total return swap technique that incorporates the fair value of the invested assets supporting the reinsurance agreement as a component of the valuation. As a result, these valuations for the funds withheld payable under the REALIC reinsurance treaties and the Athene embedded derivative require certain significant inputs that are generally not observable and, accordingly, the valuation is considered Level 3 in the fair value hierarchy.
The GMIB reinsurance recoverable fair value calculation is based on the present value of future cash flows comprised of future expected reinsurance benefit receipts, less future attributed premium payments to reinsurers, over the lives of the contracts. Estimating these cash flows requires actuarially determined assumptions related to expectations concerning policyholder behavior and long-term market volatility. The more significant policyholder behavior actuarial assumptions include benefit utilization, fund allocation, lapse, and mortality.
The MRB asset and liability fair value calculation is based on the present value of future cash flows comprised of future expected benefit payments, less future attributed fees (if applicable), over the lives of the contracts. Estimating these cash flows requires numerous estimates and subjective judgments related to capital market inputs, as well as actuarially determined assumptions related to expectations concerning policyholder behavior. The more significant actuarial assumptions include benefit utilization by policyholders, lapse, mortality, and withdrawal rates. Best estimate assumptions plus risk margins are used as applicable.
152
Part II | Item 8. Notes to Consolidated Financial Statements | 6. Fair Value Measurements
The tables below provide roll-forwards for the years ended December 31, 2023 and 2022 of the financial instruments for which significant unobservable inputs (Level 3) are used in the fair value measurement. Gains and losses in the tables below include changes in fair value due partly to observable and unobservable factors. The Company utilizes derivative instruments to manage the risk associated with certain assets and liabilities. However, the derivative instruments hedging the related risks may not be classified within the same fair value hierarchy level as the associated assets and liabilities. Therefore, the impact of the derivative instruments reported in Level 3 may vary significantly from the total income effect of the hedged instruments.
| Total Realized/Unrealized Gains (Losses) Included in | |||||||||||||||||||||||
| Purchases, | |||||||||||||||||||||||
| Fair Value | Sales, | Transfers | Fair Value | ||||||||||||||||||||
| as of | Other | Issuances | in and/or | as of | |||||||||||||||||||
| January 1, | Net | Comprehensive | and | (out of) | December 31, | ||||||||||||||||||
| December 31, 2023 | 2023 | Income | Income | Settlements | Level 3 | 2023 | |||||||||||||||||
| Assets | |||||||||||||||||||||||
| Debt securities | |||||||||||||||||||||||
| Other government securities | $ | $ | $ | ( | $ | $ | $ | ||||||||||||||||
| Public utilities | |||||||||||||||||||||||
| Corporate securities | ( | ( | |||||||||||||||||||||
| Other asset-backed securities | ( | ||||||||||||||||||||||
| Equity securities | ( | ( | ( | ||||||||||||||||||||
| Mortgage loans | ( | ( | |||||||||||||||||||||
| Limited partnerships | ( | ( | |||||||||||||||||||||
| Policy loans | |||||||||||||||||||||||
| Reinsurance recoverable on market risk benefits | ( | ||||||||||||||||||||||
| Market risk benefit assets | |||||||||||||||||||||||
| Liabilities | |||||||||||||||||||||||
| Funds withheld payable under reinsurance treaties | ( | ( | ( | ( | |||||||||||||||||||
| Market risk benefit liabilities | ( | ( | ( | ||||||||||||||||||||
| Total Realized/Unrealized Gains (Losses) Included in | |||||||||||||||||||||||
| Purchases, | |||||||||||||||||||||||
| Fair Value | Sales, | Transfers | Fair Value | ||||||||||||||||||||
| as of | Other | Issuances | in and/or | as of | |||||||||||||||||||
| January 1, | Net | Comprehensive | and | (out of) | December 31, | ||||||||||||||||||
| December 31, 2022 | 2022 | Income | Income | Settlements | Level 3 | 2022 | |||||||||||||||||
| Assets | |||||||||||||||||||||||
| Debt securities | |||||||||||||||||||||||
| Corporate securities | $ | $ | $ | ( | $ | $ | $ | ||||||||||||||||
| Equity securities | |||||||||||||||||||||||
| Mortgage loans | ( | ||||||||||||||||||||||
| Limited partnerships | |||||||||||||||||||||||
| Policy loans | ( | ||||||||||||||||||||||
| Reinsurance recoverable on market risk benefits | ( | ||||||||||||||||||||||
| Market risk benefit assets | |||||||||||||||||||||||
| Liabilities | |||||||||||||||||||||||
| Funds withheld payable under reinsurance treaties | ( | ( | |||||||||||||||||||||
| Market risk benefit liabilities | ( | ( | |||||||||||||||||||||
153
Part II | Item 8. Notes to Consolidated Financial Statements | 6. Fair Value Measurements
The components of the amounts included in purchases, sales, issuances and settlements for the years ended December 31, 2023 and 2022 shown above are as follows (in millions):
| December 31, 2023 | Purchases | Sales | Issuances | Settlements | Total | ||||||||||||||||||
| Assets | |||||||||||||||||||||||
| Debt securities | |||||||||||||||||||||||
| Corporate securities | $ | $ | ( | $ | $ | $ | ( | ||||||||||||||||
| Other asset-backed securities | ( | ( | |||||||||||||||||||||
| Equity securities | ( | ( | |||||||||||||||||||||
| Mortgage loans | ( | ( | |||||||||||||||||||||
| Limited partnerships | ( | ( | |||||||||||||||||||||
| Policy loans | ( | ||||||||||||||||||||||
| Total | $ | $ | ( | $ | $ | ( | $ | ( | |||||||||||||||
| Liabilities | |||||||||||||||||||||||
| Funds withheld payable under reinsurance treaties | $ | $ | $ | ( | $ | $ | ( | ||||||||||||||||
| December 31, 2022 | Purchases | Sales | Issuances | Settlements | Total | ||||||||||||||||||
| Assets | |||||||||||||||||||||||
| Debt securities | |||||||||||||||||||||||
| Corporate securities | $ | $ | ( | $ | $ | $ | |||||||||||||||||
| Equity securities | ( | ||||||||||||||||||||||
| Mortgage loans | ( | ||||||||||||||||||||||
| Limited partnerships | ( | ||||||||||||||||||||||
| Policy loans | ( | ( | |||||||||||||||||||||
| Total | $ | $ | ( | $ | $ | ( | $ | ||||||||||||||||
| Liabilities | |||||||||||||||||||||||
| Funds withheld payable under reinsurance treaties | $ | $ | $ | ( | $ | $ | |||||||||||||||||
In 2023, transfers from Level 3 to Level 2 of the fair value hierarchy were $57 million, transfers from Level 2 to Level 3 were $1,331 million, transfers from Level 3 to NAV were $7 million, and transfers from NAV to Level 3 were $18 million.
During the current year, management determined that the fair value measurements for certain securities, primarily comprised of asset-backed and other debt securities included in funds withheld accounts, which were classified as Level 2 measurements within the fair value hierarchy in prior reporting periods, should be classified as Level 3 fair value measurements. The fair value of these securities is primarily obtained from external sources which may use unobservable inputs, proprietary inputs and models, or inputs or values that cannot be corroborated by market transactions, and should be classified as externally priced Level 3 fair value measurements. The Fair Value on a Recurring Basis table, Level 3 Assets and Liabilities by Price Source table, Level 3 Rollforward table, and Level 3 Purchases, Sales, Issuances and Settlements table reflect this change in classification. In the 2023 tables, securities totaling totaling $1,336 million, were reported as Level 3 and included in “Transfers in and/or (out of) Level 3”. The change in classification did not change the fair value of these securities and did not impact the Consolidated Balance Sheets or Consolidated Income Statements.
In 2022, transfers from Level 3 to Level 2 of the fair value hierarchy were $5 million, transfers from Level 2 to Level 3 were $53 million, and transfers from NAV equivalent to Level 3 were $9 million. There were no transfers from Level 3 to NAV.
154
Part II | Item 8. Notes to Consolidated Financial Statements | 6. Fair Value Measurements
The portion of gains (losses) included in net income (loss) or OCI attributable to the change in unrealized gains and losses on Level 3 financial instruments still held was as follows (in millions):
| Year Ended December 31, | ||||||||||||||||||||||||||
| 2023 | 2022 | |||||||||||||||||||||||||
| Included in Net Income | Included in OCI | Included in Net Income | Included in OCI | |||||||||||||||||||||||
| Assets | ||||||||||||||||||||||||||
| Debt securities | ||||||||||||||||||||||||||
| Other government securities | $ | $ | ( | $ | $ | |||||||||||||||||||||
| Corporate securities | ( | ( | ||||||||||||||||||||||||
| Other asset-backed securities | ||||||||||||||||||||||||||
| Equity securities | ( | |||||||||||||||||||||||||
| Mortgage loans | ( | ( | ||||||||||||||||||||||||
| Limited partnerships | ||||||||||||||||||||||||||
| Policy loans | ||||||||||||||||||||||||||
| Reinsurance recoverable on market risk benefits | ( | ( | ||||||||||||||||||||||||
| Market risk benefit assets | ||||||||||||||||||||||||||
| Liabilities | ||||||||||||||||||||||||||
| Funds withheld payable under reinsurance treaties | ( | |||||||||||||||||||||||||
| Market risk benefit liabilities | ( | |||||||||||||||||||||||||
155
Part II | Item 8. Notes to Consolidated Financial Statements | 6. Fair Value Measurements
Fair Value of Financial Instruments Carried at Other Than Fair Value
The table below presents the carrying amount and fair value by fair value hierarchy level of certain financial instruments that are not reported at fair value (in millions):
| December 31, 2023 | ||||||||||||||||||||
| Fair Value | ||||||||||||||||||||
| Carrying Value | Total | Level 1 | Level 2 | Level 3 | ||||||||||||||||
| Assets | ||||||||||||||||||||
| Mortgage loans | $ | $ | $ | $ | $ | |||||||||||||||
| Policy loans | ||||||||||||||||||||
| FHLBI capital stock | ||||||||||||||||||||
| Liabilities | ||||||||||||||||||||
Annuity reserves (1) | $ | $ | $ | $ | $ | |||||||||||||||
Reserves for guaranteed investment contracts (2) | ||||||||||||||||||||
Trust instruments supported by funding agreements (2) | ||||||||||||||||||||
FHLB funding agreements (2) | ||||||||||||||||||||
| Funds withheld payable under reinsurance treaties | ||||||||||||||||||||
| Long-term debt | ||||||||||||||||||||
Securities lending payable (4) | ||||||||||||||||||||
FHLB advances (5) | ||||||||||||||||||||
Separate account liabilities (3) | ||||||||||||||||||||
| December 31, 2022 | ||||||||||||||||||||
| Fair Value | ||||||||||||||||||||
| Carrying Value | Total | Level 1 | Level 2 | Level 3 | ||||||||||||||||
| Assets | ||||||||||||||||||||
| Mortgage loans | $ | $ | $ | $ | $ | |||||||||||||||
| Policy loans | ||||||||||||||||||||
| FHLBI capital stock | ||||||||||||||||||||
| Liabilities | ||||||||||||||||||||
Annuity reserves (1) | $ | $ | $ | $ | $ | |||||||||||||||
Reserves for guaranteed investment contracts (2) | ||||||||||||||||||||
Trust instruments supported by funding agreements (2) | ||||||||||||||||||||
FHLB funding agreements (2) | ||||||||||||||||||||
| Funds withheld payable under reinsurance treaties | ||||||||||||||||||||
| Long-term debt | ||||||||||||||||||||
Securities lending payable (4) | ||||||||||||||||||||
Repurchase agreements (4) | ||||||||||||||||||||
Separate account liabilities (3) | ||||||||||||||||||||
(1) Annuity reserves represent only the components of other contract holder funds that are considered to be financial instruments. | ||||||||||||||||||||
(2) Included as a component of other contract holder funds on the Consolidated Balance Sheets. | ||||||||||||||||||||
(3) The values of separate account liabilities are set equal to the values of separate account assets. | ||||||||||||||||||||
(4) Included as a component of repurchase agreements and securities lending payable on the Consolidated Balance Sheets. | ||||||||||||||||||||
(5) Included as a component of other liabilities on the Consolidated Balance Sheets. | ||||||||||||||||||||
156
Part II | Item 8. Notes to Consolidated Financial Statements | 6. Fair Value Measurements
The following is a discussion of the methodologies used to determine fair values of the financial instruments that are not reported at fair value reported in the table above:
Mortgage Loans
Fair values are generally determined by discounting expected future cash flows at current market interest rates, inclusive of a credit spread, for similar quality loans. For loans whose value is dependent on the underlying property, fair value is the estimated value of the collateral. Certain characteristics considered significant in determining the spread or collateral value may be based on internally developed estimates. As a result, these investments have been classified as Level 3 within the fair value hierarchy.
Mortgage loans held under the funds withheld reinsurance agreement are valued using third-party pricing services, which may use economic inputs, geographical information, and property specific assumptions in deriving the fair value price. The Company reviews the valuations from these pricing providers to ensure they are reasonable. Due to lack of observable inputs, these investments have been classified as Level 3 within the fair value hierarchy.
Policy Loans
Policy loans are funds provided to policyholders in return for a claim on the policies values and function like demand deposits which are redeemable upon repayment, death or surrender, and there is only one market price at which the transaction could be settled – the then current carrying value. The funds provided are limited to the cash surrender value of the underlying policy. The nature of policy loans is to have a negligible default risk as the loans are fully collateralized by the value of the policy. Policy loans do not have a stated maturity and the balances and accrued interest are repaid either by the policyholder or with proceeds from the policy. Due to the collateralized nature of policy loans and unpredictable timing of payments, the Company believes the carrying value of policy loans approximates fair value. The non-reinsurance related component of policy loans has been classified as Level 3 within the fair value hierarchy.
FHLBI Capital Stock
FHLBI capital stock, which is included in other invested assets, can only be sold to FHLBI at a constant price of $100 per share. Due to the lack of valuation uncertainty, the investment has been classified as Level 1.
Other Contract Holder Funds
Fair values for immediate annuities without mortality features are derived by discounting the future estimated cash flows using current market interest rates for similar maturities. Fair values for deferred annuities, including the fixed option on variable annuities, fixed annuities, fixed index annuities and RILAs, are determined using projected future cash flows discounted at current market interest rates.
Fair values for guaranteed investment contracts, trust instruments supported by funding agreements and FHLB funding agreements are based on the present value of future cash flows discounted at current market interest rates.
Funds Withheld Payable Under Reinsurance Treaties
The fair value of the funds withheld payable is equal to the fair value of the assets held as collateral, which primarily consists of bonds, mortgages, limited partnerships, and cash and cash equivalents. The fair value of the assets generally uses industry standard valuation techniques as described above and the funds withheld payable components are valued consistent with the assets in the fair value hierarchy and the funds withheld payable is classified in its entirety according to the lowest level input that is significant to the determination of the fair value. The funds withheld payable is classified as Level 3 within the fair value hierarchy.
Debt
Fair values for the Company’s surplus notes and long-term debt are generally determined by prices obtained from independent broker dealers or discounted cash flow models. Such prices are derived from market observable inputs and are classified as Level 2.
157
Part II | Item 8. Notes to Consolidated Financial Statements | 6. Fair Value Measurements
Securities Lending Payable
The Company’s securities lending payable is set equal to the cash collateral received. Due to the short-term nature of the loans, carrying value is a reasonable estimate of fair value and is classified as Level 2.
FHLB Advances
Carrying value of the Company’s FHLB advances, which are included in other liabilities, is considered a reasonable estimate of fair value due to their short-term maturities and are classified as Level 2.
Repurchase Agreements
Carrying value of the Company’s repurchase agreements is considered a reasonable estimate of fair value due to their short-term maturities and are classified as Level 2.
Separate Account Liabilities
The values of separate account liabilities are set equal to the values of separate account assets, which are comprised of investments in mutual funds that transact regularly, but do not trade in active markets as they are not publicly available, and, are categorized as Level 2.
7. Deferred Acquisition Costs
Certain costs that are directly related to the successful acquisition of new or renewal insurance business are capitalized as DAC in the period they are incurred. These costs primarily pertain to commissions and certain costs associated with policy issuance and underwriting. All other acquisition costs are expensed as incurred.
Contracts are grouped into cohorts by contract type and issue year. For traditional and limited-payment insurance contracts, contracts are grouped consistent with the groupings used in estimating the associated liability. DAC are amortized into expense on a constant level basis over the expected term of the grouped contracts. For traditional and limited-payment insurance contracts, amortization is determined based on projected in force amounts. For non-traditional contracts, amortization is determined based on projected policy counts.
The expected term used to amortize DAC is determined using best estimate assumptions, including mortality and persistency, consistent with the best estimate assumptions used to determine the reserve for future policy benefits, MRBs, and additional liabilities for applicable contracts. For amortization of DAC related to contracts without these balances, assumptions used to determine expected term are developed in a similar manner. The amortization rate is determined using all information available as of the end of the reporting period, including actual experience and any assumption updates. Annually, or as circumstances warrant, a comprehensive review of assumptions is conducted and assumptions are revised as appropriate. If assumptions are revised, the amortization rate is calculated using revised assumptions such that the effect of revised assumptions is recognized prospectively as of the beginning of that reporting period.
Unamortized DAC are written off when a contract is internally replaced and substantially changed. Substantially unchanged contracts are treated as a continuation of the replaced contract, with no change to the unamortized DAC at the time of the replacement.
158
Part II | Item 8. Notes to Consolidated Financial Statements | 7. Deferred Acquisition Costs
The following table presents the roll-forward of the DAC (in millions). The current period amortization is based on the end of the period estimates of mortality and persistency. The amortization pattern is revised on a prospective basis at the beginning of the period based on the period’s actual experience.
| Years Ended December 31, | |||||||||||||||||
| 2023 | 2022 | 2021(1) | |||||||||||||||
| Variable Annuities | |||||||||||||||||
| Balance, beginning of period | $ | $ | $ | ||||||||||||||
| Change in accounting principle | |||||||||||||||||
| Deferrals of acquisition costs | |||||||||||||||||
| Amortization | ( | ( | ( | ||||||||||||||
| Variable Annuities balance, end of period | $ | $ | $ | ||||||||||||||
| Reconciliation of total DAC | |||||||||||||||||
| Variable Annuities balance, end of period | $ | $ | $ | ||||||||||||||
| Other product lines, end of period | |||||||||||||||||
| Total balance, end of period | $ | $ | $ | ||||||||||||||
(1) See Note 2 - Summary of Significant Accounting Policies of Notes to Consolidated Financial Statements for the transition to LDTI impact to the 2021 beginning of period balance for DAC. | |||||||||||||||||
8. Reinsurance
The Company, through its subsidiary insurance companies, assumes and cedes reinsurance from and to other insurance companies to limit losses from large exposures. However, if the reinsurer is unable to meet its obligations, the originating issuer of the coverage retains the liability. The Company reinsures certain of its risks to other reinsurers under a coinsurance, coinsurance with funds withheld, modified coinsurance, or yearly renewable term basis. The Company regularly monitors the financial strength ratings of its reinsurers.
Athene Reinsurance
The Company entered into a funds withheld coinsurance agreement with Athene effective June 1, 2020, to reinsure on a 100 % quota share basis, a block of Jackson’s in-force fixed and fixed index annuity product liabilities in exchange for a $1.2 billion ceding commission. The coinsurance with funds withheld agreement ("the coinsurance agreement") required Jackson to establish a segregated account in which the investments supporting the ceded obligations are maintained. While the economic benefits of the investments flow to Athene, Jackson retains physical possession and legal ownership of the investments supporting the reserve. Upon closing of the transaction, Jackson placed investments into the segregated account with a statutory book value of $25.6 billion. The investments maintained in the segregated account are valued at statutory carrying value for purposes of determining periodic settlement amounts under the Athene coinsurance agreement. Further, the investments in the segregated account are not available to settle any policyholder obligations other than those specifically covered by the coinsurance agreement and are not available to settle obligations to general creditors of Jackson. The profit and loss with respect to obligations ceded to Athene are included in periodic net settlements pursuant to the coinsurance agreement. To further support its obligations under the coinsurance agreement, Athene procured $1.2 billion in letters of credit for Jackson’s benefit and established a trust account for Jackson’s benefit, which had a book value of approximately $83 million at December 31, 2023.
Pursuant to the Athene coinsurance agreement, the Company holds certain assets as collateral. At December 31, 2023 and 2022, assets held as collateral in the segregated custody account were $16.3 billion and $19.4 billion, respectively.
159
Part II | Item 8. Notes to Consolidated Financial Statements | 8. Reinsurance
Swiss Re Reinsurance
Jackson has three retrocession reinsurance agreements (“retro treaties”) with Swiss Reinsurance Company Ltd. (“SRZ”). Pursuant to these retro treaties, Jackson ceded certain blocks of business to SRZ on a 100 % coinsurance with funds withheld basis, subject to pre-existing reinsurance with other parties. As a result of the reinsurance agreements with SRZ, Jackson withholds certain assets, primarily in the form of policy loans and debt securities, as collateral for the reinsurance recoverable.
The Company has also acquired certain blocks of business that are closed to new business and wholly ceded to non-affiliates. These include both direct and assumed accident and health businesses, direct and assumed life insurance business, and certain institutional annuities.
GMIB Reinsurance
The Company’s guaranteed minimum income benefits (GMIBs) are reinsured with an unrelated party. GMIB reinsured benefits are subject to aggregate annual claim limits. Deductibles also apply on reinsurance of GMIB business issued since March 1, 2005. The Company discontinued offering the GMIB in 2009.
Assumed and Ceded Premiums and Benefits Paid or Provided
Assumed and ceded premiums and benefits paid or provided are accounted for on bases consistent with those used in accounting for the original policies issued and the terms of the reinsurance contracts. Premium income and benefit expenses are reported net of reinsurance assumed and ceded.
The effect of reinsurance on premiums and benefits was as follows (in millions):
| For the Years Ended December 31, | |||||||||||||||||
| 2023 | 2022 | 2021 | |||||||||||||||
| Premiums | |||||||||||||||||
| Direct | $ | $ | $ | ||||||||||||||
| Assumed | |||||||||||||||||
| Ceded | ( | ( | ( | ||||||||||||||
| Total premium | $ | $ | $ | ||||||||||||||
| Benefits | |||||||||||||||||
| Direct | $ | $ | $ | ||||||||||||||
| Assumed | |||||||||||||||||
| Ceded | ( | ( | ( | ||||||||||||||
| Change in reserves, net of reinsurance | ( | ( | ( | ||||||||||||||
| Total benefits | $ | $ | $ | ||||||||||||||
Reinsurance Recoverables and Reinsured Market Risk Benefits
Ceded reinsurance agreements are reported on a gross basis on the Company’s Consolidated Balance Sheets as an asset for amounts recoverable from reinsurers or as a component of other assets or liabilities for amounts, such as premiums, owed to or due from reinsurers.
Reinsurance recoverables relating to reinsurance of traditional and limited-payment contracts are required to be recognized and measured in a manner consistent with liabilities relating to the underlying reinsured contracts, including using consistent assumptions. Reinsurance contracts may be executed subsequent to the direct contract issue dates, and market interest rates may have changed between the date that the underlying insurance contracts were issued and the date the reinsurance contract is recognized in the financial statements, resulting in the underlying discount rate differing between the direct and reinsured business.
The Company regularly monitors the financial strength ratings of its reinsurers. At December 31, 2023 and 2022, the Company had ACL of $29 million and $15 million, respectively, on its reinsurance recoverables, which are reported net of
160
Part II | Item 8. Notes to Consolidated Financial Statements | 8. Reinsurance
ACL on the Consolidated Balance Sheets. The ACL considers the credit quality of the reinsurer and is generally determined based on probability of default and loss given default assumptions, after considering any applicable collateral arrangements. During 2023, the Company increased its ACL related to a specific reinsurer which was recently ordered into liquidation. The recognized ACL represents our current best estimate of our remaining loss exposure associated with this reinsurer.
For reinsurance recoverables that are collateralized, and the amount of collateral is expected to be adjusted as necessary as a result of fair value changes in the collateral, the Company determines that the expectation of nonpayment of the carrying value of the reinsurance recoverable is zero. If the fair value of the collateral at the reporting date is less than the carrying value of the reinsurance recoverable, the Company recognizes an ACL on the difference between the fair value of the collateral at the reporting date and the carrying value of the reinsurance recoverable. Additions to or releases of the ACL are reported in Death, other policyholder benefits, and changes in reserves, net of deferrals in the Consolidated Income Statements.
Reinsurance recoverable on market risk benefits is recognized at fair value with changes being recognized in current period earnings within market risk benefit (gains) losses, net. Non-performance risk of the reinsurer is incorporated into the calculation through the adjustment of the risk-free rate curve based on credit spreads observed on instruments issued by similarly-rated life insurance companies.
The Company’s reinsurance contract that cedes only the GMIB elected on certain variable annuity products is classified as a reinsurance recoverable on market risk benefits. These reinsured MRBs may have direct MRB balances recorded as either assets or liabilities; however, because the unit of account for the reinsured MRB is the reinsurance contract, the ceded MRB is presented in total within reinsurance recoverable on market risk benefits. The fees used to determine the fair value of the reinsurance recoverable on market risk benefits are those defined in the reinsurance contract.
Guaranteed benefits related to the optional lifetime income rider offered on certain fixed index annuities are MRBs that are reinsured with Athene. The reinsured MRBs are measured using a non-option valuation approach which uses cash flow assumptions and an attributed fee ratio consistent with those used to measure the MRBs on the direct contract and a discount rate that considers the reinsurer’s credit risk. The attributed fee is locked-in at inception of the contract.
Components of the Company’s reinsurance recoverable excluding MRBs were as follows (in millions):
| December 31, | |||||||||||
| 2023 | 2022 | ||||||||||
| Reserves: | |||||||||||
| Life | $ | $ | |||||||||
| Accident and health | |||||||||||
Annuity benefits (1) | |||||||||||
| Claims liability and other | |||||||||||
| Total | $ | $ | |||||||||
Components of the Company’s reinsurance recoverable on market risk benefits were as follows (in millions):
| Years Ended December 31, | |||||||||||
| 2023 | 2022 | ||||||||||
| Variable annuity | $ | $ | |||||||||
| Other product lines | |||||||||||
| Total | $ | $ | |||||||||
Reinsurance and Funds Withheld Payable Under Reinsurance Treaties
Under the reinsurance agreement with Athene and the retro treaties with SRZ, the Company maintains ownership of the underlying investments instead of transferring them to the reinsurer and, as a result, records a funds withheld liability payable to the reinsurer. Investment returns earned on withheld assets are paid by the Company to the reinsurer, pursuant to the terms of the agreements. Investment income and net gains (losses) on derivatives and investments are reported net of gains or losses on the funds withheld payable under reinsurance treaties.
161
Part II | Item 8. Notes to Consolidated Financial Statements | 8. Reinsurance
The amounts credited to reinsurers on the funds withheld payable is based on the return earned on those assets. The return earned on the assets is subject to the credit risk of the original issuer of the instrument rather than Jackson’s own creditworthiness, which results in an embedded derivative (total return swap).
Funds withheld under reinsurance agreement with Athene
The Company recognizes a liability for the embedded derivative related to the funds withheld under the reinsurance agreement with Athene within funds withheld payable under reinsurance treaties in the Consolidated Balance Sheets. The embedded derivative is measured at fair value with changes in fair value reported in net gains (losses) on derivatives and investments in the Consolidated Income Statements. At inception of the reinsurance agreement with Athene, the fair value of the withheld investments differed from their book value and, accordingly, while the investments are held, the amortization of this difference is reported in net gains (losses) on derivatives and investments in the Consolidated Income Statements. See Note 5 of Notes to Consolidated Financial Statements for more information on the embedded derivative.
Funds withheld under reinsurance agreements with SRZ
At execution of the retro treaties with SRZ, the Company elected the fair value option for the withheld assets, as well as the related funds withheld payable. Accordingly, the embedded derivative is not bifurcated or separately measured. The funds withheld payable is measured at fair value with changes in fair value reported in net gains (losses) on derivatives and investments. The fair value of the funds withheld payable is equal to the fair value of the assets held as collateral.
The following assets and liabilities were held in support of reserves associated with the Company’s funds withheld reinsurance agreements and were reported in the respective financial statement line items in the Consolidated Balance Sheets (in millions):
| December 31, | |||||||||||
| 2023 | 2022 | ||||||||||
| Assets | |||||||||||
| Debt securities, available-for-sale | $ | $ | |||||||||
| Debt securities, at fair value under the fair value option | |||||||||||
| Equity securities | |||||||||||
| Mortgage loans | |||||||||||
Mortgage loans, at fair value under the fair value option | |||||||||||
| Policy loans | |||||||||||
| Freestanding derivative instruments, net | |||||||||||
| Other invested assets | |||||||||||
| Cash and cash equivalents | |||||||||||
| Accrued investment income | |||||||||||
| Other assets and liabilities, net | ( | ||||||||||
Total assets (1) | $ | $ | |||||||||
| Liabilities | |||||||||||
Funds held under reinsurance treaties (2) | $ | $ | |||||||||
| Total liabilities | $ | $ | |||||||||
(1) Certain assets are reported at amortized cost while the fair value of those assets is reported in the embedded derivative in the funds withheld liability.
(2) Includes funds withheld embedded derivative asset (liability) of $2,468 million and $3,158 million at December 31, 2023 and 2022, respectively.
162
Part II | Item 8. Notes to Consolidated Financial Statements | 8. Reinsurance
The sources of income related to funds withheld under reinsurance treaties reported in net investment income in the Consolidated Income Statements were as follows (in millions):
| Years Ended December 31, | |||||||||||||||||
| 2023 | 2022 | 2021 | |||||||||||||||
Debt securities (1) | $ | $ | $ | ||||||||||||||
| Equity securities | ( | ( | |||||||||||||||
Mortgage loans (2) | |||||||||||||||||
| Policy loans | |||||||||||||||||
| Limited partnerships | |||||||||||||||||
| Other investment income | |||||||||||||||||
| Total investment income on funds withheld assets | |||||||||||||||||
Other investment expenses on funds withheld assets (3) | ( | ( | ( | ||||||||||||||
| Total net investment income on funds withheld reinsurance treaties | $ | $ | $ | ||||||||||||||
(1) Includes $5 million, $(10 ) million, and $(3 ) million for the years ended December 31, 2023, 2022 and 2021, respectively, related to the change in fair value for securities carried under the fair value option.
(2) Includes $(3 ) million, $(7 ) million, and nil for the years ended December 31, 2023, 2022 and 2021, respectively, related to the change in fair value for mortgage loans carried under the fair value option.
(3) Includes management fees.
The gains and losses on funds withheld reinsurance treaties as a component of net gains (losses) on derivatives and investments in the Consolidated Income Statements were as follows (in millions):
| Years Ended December 31, | |||||||||||||||||
| 2023 | 2022 | 2021 | |||||||||||||||
| Available-for-sale securities | |||||||||||||||||
| Realized gains on sale | $ | $ | $ | ||||||||||||||
| Realized losses on sale | ( | ( | ( | ||||||||||||||
| Credit loss expense | ( | ( | ( | ||||||||||||||
| Credit loss expense on mortgage loans | ( | ||||||||||||||||
| Other | ( | ( | |||||||||||||||
| Net gains (losses) on non-derivative investments | ( | ( | |||||||||||||||
| Net gains (losses) on derivative instruments | ( | ||||||||||||||||
Net gains (losses) on funds withheld payable under reinsurance treaties (1) | ( | ( | |||||||||||||||
| Total net gains (losses) on derivatives and investments | $ | ( | $ | $ | ( | ||||||||||||
(1) Includes the Athene embedded derivative gain (loss) of $( | |||||||||||||||||
163
Part II | Item 8. Notes to Consolidated Financial Statements | 9. Reserves for Future Policy Benefits and Claims Payable
9. Reserves for Future Policy Benefits and Claims Payable
Reserves for Future Policy Benefits
For non-participating traditional and limited-payment insurance contracts, the reserve for future policy benefits represents the present value of estimated future policy benefits to be paid to or on behalf of policyholders in future periods and certain related expenses less the present value of estimated future net premiums.
Reserves for future policy benefits for non-participating traditional and limited-payment insurance contracts are measured using the net premium ratio ("NPR") measurement model. The NPR measurement model accrues for future policy benefits in proportion to the premium revenue recognized. The reserve for future policy benefits is derived from the Company's best estimate of future net premium and future benefits and expenses, which is based on best estimate assumptions including mortality, persistency, claims expense, and discount rate. On an annual basis, or as circumstances warrant, we conduct a comprehensive review of our current best estimate assumptions based on our experience, industry benchmarking, and other factors, as applicable. Expense assumptions are updated based on estimates of expected non-level costs, such as termination or settlement costs, and costs after the premium-paying period and exclude acquisition costs or any costs that are required to be charged to expenses as incurred. Updates to assumptions are applied on a retrospective basis, and the change in the reserve for future policy benefits resulting from updates to assumptions is reported separately on the Consolidated Income Statements within the (Gain) loss from updating future policy benefits cash flow assumptions, net. Each reporting period the reserve for future policy benefits is updated to reflect actual experience to date.
The Company establishes cohorts, which are groupings used to measure reserves for future policy benefits. In determining cohorts, the Company considered both qualitative and quantitative factors, including the issue year, type of product, product features, and legal entity.
The discount rate used to estimate reserves for future policy benefits is consistent with an upper-medium grade (low-credit risk) fixed-income corporate instrument yield, which has been interpreted to represent a single-A corporate instrument yield. This discount rate curve is determined by fitting a parametric function to yields to maturity and related times to maturity of market observable single-A rated corporate instruments. The discount rate used to recognize interest accretion on the reserves for future policy benefits is locked at the initial measurement of the cohort. Each reporting period, the reserve for future policy benefits is remeasured using the current discount rate. The difference between the reserve calculated using the current discount rate and the reserve calculated using the locked-in discount rate is recorded in OCI.
For limited-payment insurance contracts, premiums are paid over a period shorter than the period over which benefits are provided. Gross premiums received in excess of the net premium are deferred and recognized as a deferred profit liability ("DPL"). The DPL is included within the reserve for future policy benefits and profits are recognized in income as a component of benefit expenses on a constant relationship with the amount of expected future benefit payments. Interest is accreted on the balance of the DPL using the discount rate locked in at the initial measurement of the cohort. Measurement of the DPL uses best estimate assumptions for mortality. These assumptions are similarly subject to the annual review process discussed above.
Additional Liabilities – Universal Life-type
For universal life-type insurance contracts, a liability is recognized for the policyholder’s account value as discussed further in Note 10 of Notes to Consolidated Financial Statements. Where these contracts provide additional benefits beyond the account balance or base insurance coverage that are not market risk benefits or embedded derivatives, liabilities in addition to the policyholder’s account value are recognized. These additional liabilities for annuitization, death and other insurance benefits are reported within reserves for future policy benefits and claims payable. The methodology uses a benefit ratio defined as a constant percentage of the assessment base. This ratio is multiplied by current period assessments to determine the reserve accrual for the period. The assumptions used in the measurement of the additional liabilities for annuitization, death and other insurance benefits are based on best estimate assumptions including mortality, persistency, investment returns, and discount rates. These assumptions are similarly subject to the annual review process discussed above. As available-for-sale debt securities are carried at fair value, an adjustment is made to these additional liabilities equal to the change in liability that would have occurred if such securities had been sold at their stated fair value and the proceeds reinvested at current yields. This adjustment, along with the change in net unrealized gains (losses) on available-for-sale debt securities, net of applicable tax, is credited or charged directly to equity as a component of OCI.
164
Part II | Item 8. Notes to Consolidated Financial Statements | 9. Reserves for Future Policy Benefits and Claims Payable
See Note 10 - Other Contract Holder Funds of Notes to Consolidated Financial Statements for more information.
Other Future Policy Benefits and Claims Payable
In conjunction with a prior acquisition, the Company recorded a fair value adjustment at acquisition related to certain annuity and interest-sensitive liability blocks of business to reflect the cost of the interest guarantees within the in-force liabilities, based on the difference between the guaranteed interest rate and an assumed new money guaranteed interest rate at acquisition. This adjustment is included in other future policy benefits and claims payable as disclosed in the table below. This liability is remeasured at the end of each period, taking into account changes in the in-force block. Any resulting change in the liability is recorded as a Gain (loss) from updating future policy benefits cash flow assumptions, net through the Consolidated Income Statements.
In addition, annuity and life claims liabilities in course of settlement are included in other future policy benefits and claims payable as disclosed in the table below.
The following table summarizes the Company’s reserves for future policy benefits and claims payable balances (in millions):
| December 31, | |||||||||||
| 2023 | 2022 | ||||||||||
| Reserves for future policy benefits | |||||||||||
| Payout Annuities | $ | $ | |||||||||
| Closed Block Life | |||||||||||
| Closed Block Annuity | |||||||||||
| Reserves for future policy benefits | |||||||||||
| Additional liabilities | |||||||||||
| Closed Block Life | |||||||||||
| Other future policy benefits and claims payable | |||||||||||
| Reserves for future policy benefits and claims payable | $ | $ | |||||||||
165
Part II | Item 8. Notes to Consolidated Financial Statements | 9. Reserves for Future Policy Benefits and Claims Payable
The following tables present the roll-forward of components of reserves for future policy benefits (in millions):
| Present Value of Expected Net Premiums | |||||||||||||||||||||||||||||||||||
| Year Ended December 31, | Year Ended December 31, | ||||||||||||||||||||||||||||||||||
| 2023 | 2022 | ||||||||||||||||||||||||||||||||||
| Payout | Closed Block | Closed Block | Payout | Closed Block | Closed Block | ||||||||||||||||||||||||||||||
| Annuities | Life | Annuity | Annuities | Life | Annuity | ||||||||||||||||||||||||||||||
| Balance, beginning of year | $ | $ | $ | $ | $ | $ | |||||||||||||||||||||||||||||
| Beginning of period cumulative effect of changes in discount rate assumptions | ( | ||||||||||||||||||||||||||||||||||
| Beginning balance at original discount rate | |||||||||||||||||||||||||||||||||||
| Effect of changes in cash flow assumptions | |||||||||||||||||||||||||||||||||||
| Effect of actual variances from expected experience | ( | ||||||||||||||||||||||||||||||||||
| Balance adjusted for variances from expectation | |||||||||||||||||||||||||||||||||||
| Issuances | |||||||||||||||||||||||||||||||||||
| Interest accrual | |||||||||||||||||||||||||||||||||||
| Net premiums collected | ( | ( | |||||||||||||||||||||||||||||||||
| Ending balance at original discount rate | |||||||||||||||||||||||||||||||||||
| End of period cumulative effect of changes in discount rate assumptions | ( | ( | |||||||||||||||||||||||||||||||||
| Balance, end of year | $ | $ | $ | $ | $ | $ | |||||||||||||||||||||||||||||
166
Part II | Item 8. Notes to Consolidated Financial Statements | 9. Reserves for Future Policy Benefits and Claims Payable
| Present Value of Expected Future Policy Benefits | |||||||||||||||||||||||||||||||||||
| Year Ended December 31, | Year Ended December 31, | ||||||||||||||||||||||||||||||||||
| 2023 | 2022 | ||||||||||||||||||||||||||||||||||
| Payout | Closed Block | Closed Block | Payout | Closed Block | Closed Block | ||||||||||||||||||||||||||||||
| Annuities | Life | Annuity | Annuities | Life | Annuity | ||||||||||||||||||||||||||||||
| Balance, beginning of year | $ | $ | $ | $ | $ | $ | |||||||||||||||||||||||||||||
| Beginning of period cumulative effect of changes in discount rate assumptions | ( | ( | ( | ||||||||||||||||||||||||||||||||
Beginning balance at original discount rate (including DPL of $ | |||||||||||||||||||||||||||||||||||
| Effect of changes in cash flow assumptions | ( | ( | |||||||||||||||||||||||||||||||||
| Effect of actual variances from expected experience | ( | ( | ( | ( | ( | ||||||||||||||||||||||||||||||
| Balance adjusted for variances from expectation | |||||||||||||||||||||||||||||||||||
| Issuances | |||||||||||||||||||||||||||||||||||
| Interest accrual | |||||||||||||||||||||||||||||||||||
| Benefits payments | ( | ( | ( | ( | ( | ( | |||||||||||||||||||||||||||||
Ending balance of original discount rate (including DPL of $ | |||||||||||||||||||||||||||||||||||
| End of period cumulative effect of changes in discount rate assumptions | ( | ( | ( | ( | ( | ( | |||||||||||||||||||||||||||||
| Balance, end of year | $ | $ | $ | $ | $ | $ | |||||||||||||||||||||||||||||
| Reserves for future policy benefits | |||||||||||||||||||||||||||||||||||
| Less: Reinsurance recoverable | |||||||||||||||||||||||||||||||||||
| Reserves for future policy benefits, after reinsurance recoverable | $ | $ | $ | $ | $ | $ | |||||||||||||||||||||||||||||
The following table presents the weighted average duration of the reserves for future policy benefits. The weighted average duration represents average cohort-level duration weighted by the benefit reserves amount:
| Payout | Closed Block | Closed Block | |||||||||||||||
| Annuities | Life | Annuity | |||||||||||||||
| December 31, 2023 | |||||||||||||||||
| Weighted average duration (years) | |||||||||||||||||
| December 31, 2022 | |||||||||||||||||
| Weighted average duration (years) | |||||||||||||||||
The significant assumptions used in the future policy benefits calculation consist of mortality, persistency, and discount rate. We have undertaken a comprehensive review of the significant assumptions used in the future policy benefits calculation during 2023. Assumptions were unlocked and the impacts of the unlocking on future policy benefits for mortality and persistency were not significant during 2023. The discount rate assumption methodology was updated for additional liabilities – universal life-type insurance contracts, leading to an increase in the discount rate.
The discount rate assumption related to the single-A corporate instrument yield was updated based on current market data. Discount rates decreased in 2023 compared to 2022, based on the duration of the liability. This resulted in an increase in the liability. Refer to the roll-forward above for further details.
167
Part II | Item 8. Notes to Consolidated Financial Statements | 9. Reserves for Future Policy Benefits and Claims Payable
The following table presents the amount of undiscounted and discounted expected future gross premiums and expected future benefit payments for future policy benefits for non-participating traditional and limited-payment insurance contracts (in millions). The discounted premiums are calculated using the current discount rate, while the undiscounted cash flows represent the gross cash flows before any discounting is applied:
| December 31, | |||||||||||||||||
| 2023 | 2022 | ||||||||||||||||
| Undiscounted | Discounted | Undiscounted | Discounted | ||||||||||||||
| Payout Annuities | |||||||||||||||||
| Expected future benefit payments | $ | $ | $ | $ | |||||||||||||
| Expected future gross premiums | |||||||||||||||||
| Closed Block Life | |||||||||||||||||
| Expected future benefit payments | |||||||||||||||||
| Expected future gross premiums | |||||||||||||||||
| Closed Block Annuity | |||||||||||||||||
| Expected future benefit payments | |||||||||||||||||
| Expected future gross premiums | $ | $ | $ | $ | |||||||||||||
The following table presents the amount of revenue and interest related to non-participating traditional and limited-pay insurance contracts recognized in the Consolidated Income Statements (in millions):
| Gross Premiums | Interest Expense | ||||||||||||||||||||||
| Years Ended December 31, | Years Ended December 31, | ||||||||||||||||||||||
| 2023 | 2022 | 2023 | 2022 | ||||||||||||||||||||
| Payout Annuities | $ | $ | $ | $ | |||||||||||||||||||
| Closed Block Life | |||||||||||||||||||||||
| Closed Block Annuity | |||||||||||||||||||||||
| Total | $ | $ | $ | $ | |||||||||||||||||||
The following table presents the weighted average interest rate for the reserves for future policy benefits at the cohort's level for the locked-in discount rate (interest accretion rate), and current discount rate, weighted by the cohort's benefit reserve amount:
| December 31, | |||||||||||
| 2023 | 2022 | ||||||||||
| Payout Annuities | |||||||||||
| Interest accretion rate | % | % | |||||||||
| Current discount rate | % | % | |||||||||
| Closed Block Life | |||||||||||
| Interest accretion rate | % | % | |||||||||
| Current discount rate | % | % | |||||||||
| Closed Block Annuity | |||||||||||
| Interest accretion rate | % | % | |||||||||
| Current discount rate | % | % | |||||||||
168
Part II | Item 8. Notes to Consolidated Financial Statements | 9. Reserves for Future Policy Benefits and Claims Payable
The following table presents a roll-forward of Closed Block Life additional liabilities for annuitization, death and other insurance benefits (in millions):
| Years Ended December 31, | |||||||||||
| 2023 | 2022 | ||||||||||
| Balance, beginning of year | $ | $ | |||||||||
| Beginning of period cumulative effect of changes in shadow adjustments | ( | ||||||||||
| Beginning balance excluding shadow | |||||||||||
| Effect of changes in cash flow assumptions | |||||||||||
| Effect of actual variances from expected experience | |||||||||||
| Interest accrual | |||||||||||
| Net assessments collected | ( | ( | |||||||||
| Ending balance excluding shadow | |||||||||||
| End of period cumulative effect of changes in shadow adjustments | ( | ( | |||||||||
| Balance, end of year | $ | $ | |||||||||
The following table presents the weighted average duration of Closed Block Life additional liabilities for annuitization, death and other insurance benefits. The weighted average duration represents average cohort-level duration weighted by the benefit reserves amount:
| December 31, | |||||||||||
| 2023 | 2022 | ||||||||||
| Weighted average duration (years) | |||||||||||
The significant assumptions used in the additional liability for annuitization, death and other insurance benefits calculation consist of mortality, persistency, investment returns, and crediting rate. We have undertaken a comprehensive review of the significant assumptions used in the additional liability for annuitization, death and other insurance benefits calculations and updated for a decrease in lapse rates and an update to the methodology in determining the long-term earned-rate.
The following table presents assessments and interest expense of Closed Block Life additional liabilities for annuitization, death and other insurance benefits recognized in the Consolidated Income Statements (in millions):
| Assessments | Interest Expense | ||||||||||||||||||||||
| Years Ended December 31, | Years Ended December 31, | ||||||||||||||||||||||
| 2023 | 2022 | 2023 | 2022 | ||||||||||||||||||||
| Additional liability for annuitization, death and other insurance benefits | $ | ( | $ | ( | $ | $ | |||||||||||||||||
The following table presents the weighted average current discount rate of Closed Block Life additional liabilities for annuitization, death and other insurance benefits, applied at the cohort level weighted by reserve benefit amount:
| December 31, | |||||||||||
| 2023 | 2022 | ||||||||||
| Weighted average current discount rate | % | % | |||||||||
10. Other Contract Holder Funds
Other contract holder funds represent the policyholder account balance on our universal life-type products, investment contracts, and the fair value of the embedded derivatives associated with the indexed crediting features on our fixed index annuities and registered index-linked annuities.
Universal life type contracts have, as a principal component, an account balance in which interest is credited to policyholders and assessments are deducted for mortality risk and contract administration. The account balance is recognized as a liability within other contract holder funds, and the liability is updated each period for fee and assessment deductions and increased for interest or returns credited to the account balance.
169
Part II | Item 8. Notes to Consolidated Financial Statements | 10. Other Contract Holder Funds
Certain of our universal life type contracts contain features that are not classified as market risk benefits or embedded derivatives but provide additional benefits beyond the account balance or base insurance coverage for which a liability in addition to the account balance is necessary. These additional liabilities for death or other insurance benefits are reported as a component of reserves for future policy benefits and claims payable in the Consolidated Balance Sheets. See Note 9 - Reserves for Future Policy Benefits and Claims Payable of the Notes to the Consolidated Financial Statements for more information regarding these additional liabilities.
Certain contracts without significant mortality or morbidity risk and certain annuities that lack insurance risk are treated as investment contracts. For investment contracts, payments received are reported as liabilities and accounted for in a manner consistent with the accounting for interest-bearing or other financial instruments, within other contract holder funds.
The Company issues a variety of annuity products including fixed annuities, fixed index annuities, registered index-linked annuities, variable annuities and payout annuities. For annuity contracts that are classified as investment contracts, the liability is the account balance as of the reporting date, reported within the other contract holder funds. For the variable annuity products, only the allocations to fixed fund options are reported in other contract holder funds.
For our fixed index annuities and registered index-linked annuities, the equity-linked option issued by the Company is accounted for as an embedded derivative measured at fair value and reported as a component of other contract holder funds on the Consolidated Balance Sheets with changes in fair value recorded in net income within net gains (losses) on derivatives and investments. The fair value is determined using an option-budget method with capital market inputs of market index returns and discount rates as well as actuarial assumptions including lapse, mortality and withdrawal rates. Favorable equity market movements cause increases in future contract holder benefits, resulting in an increase in the fair value of the embedded derivative liability (and vice versa). The Company also establishes a host contract reserve to support the underlying guaranteed account value growth. This host contract liability is included as a component of other contract holder funds on the Consolidated Balance Sheets. Interest is accreted to the host contract liability using an effective yield method.
Our annuity products may contain certain features or guarantees that are classified as MRBs. These market risk benefits are a component of the market risk benefits line items in the Consolidated Balance Sheet. See Note 12 - Market Risk Benefits of Notes to Consolidated Financial Statements for more information regarding market risk benefits.
The Company’s institutional products business is comprised of the guaranteed investment contracts, medium-term funding agreement-backed notes and funding agreements (including agreements issued in conjunction with the Company’s participation in the U.S. Federal Home Loan Bank program) described below.
The Company has established a $27 billion aggregate Global Medium-Term Note ("MTN") program. Jackson National Life Global Funding was formed as a statutory business trust, solely for the purpose of issuing Medium-Term Note instruments to institutional investors, the proceeds of which are deposited with the Company and secured by the issuance of funding agreements. The carrying values at December 31, 2023 and 2022 totaled $5.8 billion and $5.9 billion, respectively.
Those Medium-Term Note instruments issued in a foreign currency have been hedged for changes in exchange rates using cross-currency swaps. The unrealized foreign currency gains and losses on those Medium-Term Note instruments are included in the carrying value of the trust instruments supported by funding agreements.
Trust instrument liabilities are adjusted to reflect the effects of foreign currency translation gains and losses using exchange rates as of the reporting date. Foreign currency translation gains and losses are included in net gains (losses) on derivatives and investments.
Jackson is a member of the FHLBI primarily for the purpose of participating in the bank’s mortgage-collateralized loan advance program with long-term funding facilities. Advances are in the form of funding agreements, short-term and long-term borrowings issued to FHLBI. At December 31, 2023 and 2022, the Company held $108 million and $146 million of FHLBI capital stock, respectively, supporting $2.3 billion and $2.1 billion in funding agreements and short-term and long-term borrowings at December 31, 2023 and 2022, respectively. At December 31, 2023 and 2022, the funding agreements and short-term and long-term borrowings were collateralized by mortgage-related securities and commercial mortgage loans with a carrying value of $3.5 billion and $3.1 billion, respectively.
170
Part II | Item 8. Notes to Consolidated Financial Statements | 10. Other Contract Holder Funds
The following table presents the liabilities for other contract holder funds (in millions):
| December 31, | |||||||||||
| 2023 | 2022 | ||||||||||
| Payout Annuity | $ | $ | |||||||||
| Variable Annuity | |||||||||||
| Fixed Annuity | |||||||||||
| Fixed Indexed Annuities | |||||||||||
| RILA | |||||||||||
| Closed Block Life | |||||||||||
| Closed Block Annuity | |||||||||||
| Institutional Products | |||||||||||
| Other Product Lines | |||||||||||
| Total other contract holder funds | $ | $ | |||||||||
The following table presents a roll-forward of other contract holder funds, gross of reinsurance (in millions):
| Fixed | Closed | Closed | |||||||||||||||||||||||||||||||||||||||||||||
| Payout | Variable | Fixed | Indexed | Block | Block | ||||||||||||||||||||||||||||||||||||||||||
| Annuity | Annuity | Annuity | Annuities | RILA | Life | Annuity | Total | ||||||||||||||||||||||||||||||||||||||||
| Balance as of January 1, 2023 | $ | $ | $ | $ | $ | $ | $ | $ | |||||||||||||||||||||||||||||||||||||||
| Deposits | |||||||||||||||||||||||||||||||||||||||||||||||
| Surrenders, withdrawals and benefits | ( | ( | ( | ( | ( | ( | ( | ( | |||||||||||||||||||||||||||||||||||||||
| Net transfers from (to) separate accounts | ( | ( | |||||||||||||||||||||||||||||||||||||||||||||
| Investment performance / change in value of equity option | |||||||||||||||||||||||||||||||||||||||||||||||
| Interest credited | |||||||||||||||||||||||||||||||||||||||||||||||
| Policy charges and other | ( | ( | ( | ( | ( | ||||||||||||||||||||||||||||||||||||||||||
| Balance as of December 31, 2023 | $ | $ | $ | $ | $ | $ | $ | $ | |||||||||||||||||||||||||||||||||||||||
| Fixed | Closed | Closed | |||||||||||||||||||||||||||||||||||||||||||||
| Payout | Variable | Fixed | Indexed | Block | Block | ||||||||||||||||||||||||||||||||||||||||||
| Annuity | Annuity | Annuity | Annuities | RILA | Life | Annuity | Total | ||||||||||||||||||||||||||||||||||||||||
| Balance as of January 1, 2022 | $ | $ | $ | $ | $ | $ | $ | $ | |||||||||||||||||||||||||||||||||||||||
| Deposits | |||||||||||||||||||||||||||||||||||||||||||||||
| Surrenders, withdrawals and benefits | ( | ( | ( | ( | ( | ( | ( | ( | |||||||||||||||||||||||||||||||||||||||
| Net transfers from (to) separate accounts | |||||||||||||||||||||||||||||||||||||||||||||||
| Investment performance / change in value of equity option | ( | ( | ( | ||||||||||||||||||||||||||||||||||||||||||||
| Interest credited | |||||||||||||||||||||||||||||||||||||||||||||||
| Policy charges and other | ( | ( | ( | ( | ( | ( | ( | ||||||||||||||||||||||||||||||||||||||||
| Balance as of December 31, 2022 | $ | $ | $ | $ | $ | $ | $ | $ | |||||||||||||||||||||||||||||||||||||||
171
Part II | Item 8. Notes to Consolidated Financial Statements | 10. Other Contract Holder Funds
The following table presents weighted average crediting rate, net amount at risk, and cash surrender value of contract holder account balances (dollars in millions):
| Fixed | Closed | Closed | |||||||||||||||||||||||||||||||||||||||
| Payout | Variable | Fixed | Indexed | Block | Block | ||||||||||||||||||||||||||||||||||||
| Annuity | Annuity | Annuity | Annuities | RILA | Life | Annuity | |||||||||||||||||||||||||||||||||||
| December 31, 2023 | |||||||||||||||||||||||||||||||||||||||||
Weighted-average crediting rate (1) | % | % | % | % | % | % | % | ||||||||||||||||||||||||||||||||||
Net amount at risk (2) | $ | $ | $ | $ | $ | $ | $ | ||||||||||||||||||||||||||||||||||
Cash surrender value (3) | $ | $ | $ | $ | $ | $ | $ | ||||||||||||||||||||||||||||||||||
| December 31, 2022 | |||||||||||||||||||||||||||||||||||||||||
Weighted-average crediting rate (1) | % | % | % | % | % | % | % | ||||||||||||||||||||||||||||||||||
Net amount at risk (2) | $ | $ | $ | $ | $ | $ | $ | ||||||||||||||||||||||||||||||||||
Cash surrender value (3) | $ | $ | $ | $ | $ | $ | $ | ||||||||||||||||||||||||||||||||||
(1) Weighted average crediting rate is the average crediting rate weighted by contract holder account balances invested in fixed account funds.
(2) Net amount at risk represents the standard excess benefit base for guaranteed death benefits on universal life type products. The net amount at risk associated with market risk benefits are presented within Note 12 of Notes to Consolidated Financial Statements.
At both December 31, 2023 and 2022, excluding reinsurance business, approximately 92 64 % and 65 % of the Company’s closed block life account values correspond to crediting rates that are at the minimum guaranteed interest rates, respectively.
172
Part II | Item 8. Notes to Consolidated Financial Statements | 10. Other Contract Holder Funds
The following table presents contract holder account balances invested in fixed account funds by range of guaranteed minimum crediting rates and the related range of the difference between rates being credited to other contract holder funds and the respective guaranteed minimums (in millions):
| December 31, 2023 | |||||||||||||||||||||||||||||
| At Guaranteed | 1 Basis Point-50 | 51 Basis Points-150 | Greater Than 150 | ||||||||||||||||||||||||||
| Range of Guaranteed Minimum Crediting Rate | Minimum | Basis Points Above | Basis Points Above | Basis Points Above | Total | ||||||||||||||||||||||||
| Variable Annuities | |||||||||||||||||||||||||||||
| $ | $ | $ | $ | $ | |||||||||||||||||||||||||
Greater than | |||||||||||||||||||||||||||||
| Total | $ | $ | $ | $ | $ | ||||||||||||||||||||||||
| Fixed Annuities | |||||||||||||||||||||||||||||
| $ | $ | $ | $ | $ | |||||||||||||||||||||||||
Greater than | |||||||||||||||||||||||||||||
| Total | $ | $ | $ | $ | $ | ||||||||||||||||||||||||
| Fixed Indexed Annuities | |||||||||||||||||||||||||||||
| $ | $ | $ | $ | $ | |||||||||||||||||||||||||
Greater than | |||||||||||||||||||||||||||||
| Total | $ | $ | $ | $ | $ | ||||||||||||||||||||||||
| RILA | |||||||||||||||||||||||||||||
| $ | $ | $ | $ | $ | |||||||||||||||||||||||||
| $ | $ | $ | $ | ||||||||||||||||||||||||||
Greater than | |||||||||||||||||||||||||||||
| Total | $ | $ | $ | $ | $ | ||||||||||||||||||||||||
| Closed Block Life | |||||||||||||||||||||||||||||
| $ | $ | $ | $ | $ | |||||||||||||||||||||||||
Greater than | |||||||||||||||||||||||||||||
| Total | $ | $ | $ | $ | $ | ||||||||||||||||||||||||
| Closed Block Annuity | |||||||||||||||||||||||||||||
| $ | $ | $ | $ | $ | |||||||||||||||||||||||||
Greater than | |||||||||||||||||||||||||||||
| Total | $ | $ | $ | $ | $ | ||||||||||||||||||||||||
173
Part II | Item 8. Notes to Consolidated Financial Statements | 10. Other Contract Holder Funds
| December 31, 2022 | |||||||||||||||||||||||||||||
| At Guaranteed | 1 Basis Point-50 | 51 Basis Points-150 | Greater Than 150 | ||||||||||||||||||||||||||
| Range of Guaranteed Minimum Crediting Rate | Minimum | Basis Points Above | Basis Points Above | Basis Points Above | Total | ||||||||||||||||||||||||
| Variable Annuities | |||||||||||||||||||||||||||||
| $ | $ | $ | $ | $ | |||||||||||||||||||||||||
Greater than | |||||||||||||||||||||||||||||
| Total | $ | $ | $ | $ | $ | ||||||||||||||||||||||||
| Fixed Annuities | |||||||||||||||||||||||||||||
| $ | $ | $ | $ | $ | |||||||||||||||||||||||||
Greater than | |||||||||||||||||||||||||||||
| Total | $ | $ | $ | $ | $ | ||||||||||||||||||||||||
| Fixed Indexed Annuities | |||||||||||||||||||||||||||||
| $ | $ | $ | $ | $ | |||||||||||||||||||||||||
Greater than | |||||||||||||||||||||||||||||
| Total | $ | $ | $ | $ | $ | ||||||||||||||||||||||||
| RILA | |||||||||||||||||||||||||||||
| $ | $ | $ | $ | $ | |||||||||||||||||||||||||
Greater than | |||||||||||||||||||||||||||||
| Total | $ | $ | $ | $ | $ | ||||||||||||||||||||||||
| Closed Block Life | |||||||||||||||||||||||||||||
| $ | $ | $ | $ | $ | |||||||||||||||||||||||||
Greater than | |||||||||||||||||||||||||||||
| Total | $ | $ | $ | $ | $ | ||||||||||||||||||||||||
| Closed Block Annuity | |||||||||||||||||||||||||||||
| $ | $ | $ | $ | $ | |||||||||||||||||||||||||
Greater than | |||||||||||||||||||||||||||||
| Total | $ | $ | $ | $ | $ | ||||||||||||||||||||||||
174
Part II | Item 8. Notes to Consolidated Financial Statements | 11. Separate Account Assets and Liabilities
11. Separate Account Assets and Liabilities
The Company issues variable contracts through its separate accounts for which investment income and investment gains and losses accrue directly to, and investment risk is borne by, the contract holder (traditional variable annuities). The Company also issues variable annuity and life contracts through separate accounts where the Company contractually guarantees to the contract holder (variable contracts with guarantees) either a) return of no less than total deposits made to the account adjusted for any partial withdrawals, b) total deposits made to the account adjusted for any partial withdrawals plus a minimum return, or c) the highest account value on a specified anniversary date adjusted for any withdrawals following the contract anniversary. These guarantees include benefits that are payable in the event of death (guaranteed minimum death benefits, or "GMDB"), at annuitization ("GMIB"), upon the depletion of funds ("GMWB") or at the end of a specified period ("GMAB"). These guarantees are classified as market risk benefits. See Note 12 - Market Risk Benefits of Notes to Consolidated Financial Statements for more information regarding market risk benefits.
The separate account assets supporting the variable portion of both traditional variable annuities and variable contracts with guarantees are carried at fair value and reported as summary total separate account assets with an equivalent summary total reported for separate account liabilities. At December 31, 2023 and 2022, the assets and liabilities associated with variable life and annuity contracts were $220 billion and $196 billion, respectively. Investment risks associated with market value changes are borne by the contract holders, except to the extent of minimum guarantees made by the Company.
Separate account net investment income, net investment realized and unrealized gains and losses, and the related liability changes are offset within the same line item in the Consolidated Income Statements. Amounts assessed against the contract holders for mortality, variable annuity benefit guarantees, administrative, and other services are reported in revenue as fee income.
Included in the separate account assets and liabilities described above is a Jackson issued group variable annuity contract designed for use in connection with and issued to the Company’s Defined Contribution Retirement Plan. These deposits are allocated to the Jackson National Separate Account - II, which had balances of $198 million and $285 million at December 31, 2023 and 2022, respectively. The Company receives administrative fees for managing the funds. These fees are recorded as earned and included in fee income in the Consolidated Income Statements.
The following table presents the roll-forward of the separate account balance for variable annuities (in millions):
| Years Ended December 31, | |||||||||||
| 2023 | 2022 | ||||||||||
| Balance as of beginning of year | $ | $ | |||||||||
| Deposits | |||||||||||
| Surrenders, withdrawals and benefits | ( | ( | |||||||||
| Net transfer from (to) general account | ( | ||||||||||
| Investment performance | ( | ||||||||||
| Policy charges and other | ( | ( | |||||||||
| Balance as of end of year, gross | $ | $ | |||||||||
Cash surrender value (1) | $ | $ | |||||||||
(1) Cash surrender value represents the amount of the contract holder’s account balances distributable at the balance sheet date less applicable surrender charges.
The following table presents the reconciliation of the separate account balance in the Consolidated Balance Sheets (in millions):
| December 31, | |||||||||||
| 2023 | 2022 | ||||||||||
| Variable Annuities | $ | $ | |||||||||
| Other Product Lines | |||||||||||
| Total | $ | $ | |||||||||
175
Part II | Item 8. Notes to Consolidated Financial Statements | 11. Separate Account Assets and Liabilities
The following table presents aggregate fair value of assets, by major investment asset category, supporting separate accounts (in millions):
| December 31, | |||||||||||
| 2023 | 2022 | ||||||||||
| Variable Annuities By Fund Type | |||||||||||
| Equity | $ | $ | |||||||||
| Bond | |||||||||||
| Balanced | |||||||||||
| Money Market | |||||||||||
| Total Variable Annuities | |||||||||||
| Other Product Lines | |||||||||||
| Total Separate Accounts | $ | $ | |||||||||
12. Market Risk Benefits
Contracts or contract features that provide protection to the contract holder from capital market risk and expose the Company to other-than-nominal capital market risk are classified as MRBs.
All long-duration insurance contracts and certain investment contracts are subject to MRB evaluation. MRBs are measured at fair value at the contract level and can be in either an asset or liability position. For contracts that contain multiple MRB features, the MRBs are valued together as a single compound MRB. Market risk benefit assets and Market risk benefit liabilities are reported separately on the Consolidated Balance Sheets.
Changes in fair value are reported in Net (gains) losses on market risk benefits on the Consolidated Income Statements. However, the change in fair value related to our own non-performance risk is reported as a component of other comprehensive income in Change in non-performance risk on market risk benefits on the Consolidated Statements of Comprehensive Income (Loss).
A description of the items effecting the change in fair value by category is as follows:
•Changes in interest rates — movement in risk free rates (impacts both assumed future separate account returns and discounting of cash flows)
•Fund performance — separate account returns gross of fees
•Change in equity index volatility — movement in implied volatility
•Expected policyholder behavior — policyholder behavior as assumed in reserving
•Actual policyholder behavior different than expected — difference between actual behavior during the period versus assumed behavior
•Time — effect of passage of time including reduction to separate account balances from fees, the change in proximity of future cash flows, and impacts to policy features such as bonus credits
•Change in assumptions — changes in assumptions resulting from our periodic review
•Change in non-performance risk — changes in Jackson’s non-performance risk
See Note 6 - Fair Value Measurements of Notes to Consolidated Financial Statements for more information.
Additionally, when an annuitization occurs (for annuitization benefits) or upon extinguishment of the account balance (for withdrawal benefits), the balance related to the MRB is derecognized and the amount deducted (after derecognition of any related amount included in accumulated other comprehensive income) is used in the calculation of the liability for future policy benefits for the resulting payout annuity.
Variable Annuities
Variable annuity contracts issued by the Company offer various guaranteed minimum death, withdrawal, income and accumulation benefits. These guaranteed benefit features, as well as the reinsurance recoverable on the Company’s guaranteed minimum income benefits (“GMIB”), are classified as MRBs and measured at fair value. The Company discontinued offering the GMIB in 2009 and the guaranteed minimum accumulation benefits (“GMAB”) in 2011.
176
Part II | Item 8. Notes to Consolidated Financial Statements | 12. Market Risk Benefits
Variable annuity guaranteed benefit features classified as MRBs, which have explicit fees, are measured using the attributed fee method. Under the attributed fee method, fair value is measured as the difference between the present value of projected future liabilities and the present value of projected attributed fees. At the inception of the contract, the Company attributes to the MRB a portion of total fees expected to be assessed against the contract holder to offset the projected claims over the lifetime of the contract. The attributed fee is expressed as a percentage of total projected future fees at inception of the contract. This percentage of total projected fees is considered a fixed term of the MRB feature and is held static over the life of the contract. This percentage may not exceed 100% of the total projected contract fees as of contract inception. As the Company may issue contracts that have projected future liabilities greater than the projected future guaranteed benefit fees at issue, the Company may also attribute mortality and expense charges when performing this calculation. In subsequent valuations, both the present value of future projected liabilities and the present value of projected attributed fees are remeasured based on current market conditions and policyholder behavior assumptions.
Fixed Index Annuities
The longevity riders issued on fixed index annuities are classified as MRBs and measured at fair value. Similar to the variable annuity guaranteed benefits features, these contracts have explicit fees and are measured using the attributed fee method. The Company attributes a percentage of total projected future fees expected to be assessed against the policyholder to offset the projected future claims over the lifetime of the contract. If the fees attributed are insufficient to offset the claims at issue, the shortfall is borrowed from the host contract rather than recognizing a loss at inception.
RILA
RILA guaranteed benefit features are classified as MRBs and measured at fair value. Unlike variable or fixed index annuities, RILA products do not have explicit fees and are measured using an option-based method. The fair value measurement represents the present value of future claims payable by the MRB feature. At inception, the value of the MRB is deducted from the value of the contract resulting in no gain or loss.
The following table presents the reconciliation of the market risk benefits balance in the Consolidated Balance Sheets (in millions):
| December 31, 2023 | December 31, 2022 | ||||||||||||||||||||||||||||||||||
| Variable | Other | Variable | Other | ||||||||||||||||||||||||||||||||
| Annuities | Product Lines | Total | Annuities | Product Lines | Total | ||||||||||||||||||||||||||||||
| Market risk benefit - (assets) | $ | ( | $ | ( | $ | ( | $ | ( | $ | ( | $ | ( | |||||||||||||||||||||||
| Market risk benefit - liabilities | |||||||||||||||||||||||||||||||||||
| Market risk benefit - net (asset) liability | $ | ( | $ | $ | ( | $ | $ | $ | |||||||||||||||||||||||||||
177
Part II | Item 8. Notes to Consolidated Financial Statements | 12. Market Risk Benefits
The following table presents the roll-forward of the net MRB (assets) liabilities for variable annuities (dollars in millions):
| Years Ended December 31, | |||||||||||
| 2023 | 2022 | ||||||||||
| Net MRB balance, beginning of year | $ | $ | |||||||||
| Beginning of year cumulative effect of changes in non-performance risk | |||||||||||
| Net MRB balance, beginning of year, before effect of changes in non-performance risk | |||||||||||
| Effect of changes in interest rates | ( | ( | |||||||||
| Effect of fund performance | ( | ||||||||||
| Effect of changes in equity index volatility | ( | ||||||||||
| Effect of expected policyholder behavior | |||||||||||
| Effect of actual policyholder behavior different from expected | ( | ||||||||||
| Effect of time | |||||||||||
| Effect of changes in assumptions | |||||||||||
| Net MRB balance, end of year, before effect of changes in non-performance risk | ( | ||||||||||
| End of year cumulative effect of changes in non-performance risk | ( | ( | |||||||||
| Net MRB balance, end of year, gross | ( | ||||||||||
| Reinsurance recoverable on market risk benefits at fair value, end of year | ( | ( | |||||||||
| Net MRB balance, end of year, net of reinsurance | $ | ( | $ | ||||||||
Weighted average attained age (years) (1) | |||||||||||
Net amount at risk (2) | $ | $ | |||||||||
(1) Weighted-average attained age is defined as the average age of policyholders weighted by account value.
(2) Net amount at risk (NAR) is defined as of the valuation date for each contract as the greater of Death Benefit NAR (DBNAR) and Living Benefit NAR (LBNAR), as applicable, where DBNAR is the GMDB benefit base in excess of the account value, and the LBNAR is the actuarial present value of guaranteed living benefits in excess of the account value.
At each reporting date, the Company regularly evaluates the inputs and assumptions to be used to measure the fair value of the MRB assets and MRB liabilities. In prior periods, the non-performance risk adjustment was determined based on credit spreads indicated by a blend of yields on similarly rated peer debt and yields on Company debt. Starting June 30, 2023, non-performance risk is incorporated into the calculation through the adjustment of the risk-free rate curve based only on credit spreads for debt and debt-like instruments issued by the Company or its insurance operating subsidiaries, adjusted, as necessary, to reflect the financial strength ratings of the issuing insurance subsidiaries. The change was made as a result of management’s determination that the reliability of credit spreads on debt and debt-like instruments issued by the Company as a measure of company-specific credit risk has increased due to sustained levels of market trading volume of these instruments.
The significant assumptions used in the MRB fair value calculations are discussed in Note 6 of Notes to Consolidated Financial Statements. The use of models and assumptions used to determine fair value of MRBs requires a significant amount of judgement. As such, we have undertaken a comprehensive review of the significant assumptions used.
During 2023, the following notable changes were made to the inputs to the fair value estimates of the MRB calculations:
•Assumed mortality rates were increased as a result of trends in actual mortality experience, which resulted in a decrease in the MRB reserve.
•Assumed lapse rates were reduced to capture recent trends in actual lapse experience, which resulted in an increase in the MRB reserve.
•Assumed GMWB utilization rates were increased to capture recent trends in actual experience, which resulted in an increase in the MRB reserve. Assumed GMIB utilization rates were reduced to capture recent trends in actual experience, which resulted in a decrease in the MRB reserve.
•Assumed GMWB withdrawal rates were increased as a result of trends in actual experience, which resulted in an increase in the MRB reserve. Minor adjustments were made to the free partial withdrawal rates on policies without a GMWB with no material impact on the resulting MRB reserve.
178
Part II | Item 8. Notes to Consolidated Financial Statements | 12. Market Risk Benefits
•The non-performance risk adjustment decreased as a result of decreasing credit spreads, which resulted in an increase in the MRB reserve that was recorded within OCI.
•There were no changes made to assumed long-term equity volatility.
•Increases in interest rates led to higher assumed separate account returns and higher discount rates, which resulted in a decrease in the MRB reserve.
•Increases in equity markets led to higher separate account fund performance and a decrease in future projected benefits, which resulted in a decrease in the MRB reserve.
•Decreases in equity index volatility led to higher assumed separate account returns, which resulted in a decrease in the MRB reserve.
During 2022, the following notable changes were made to the inputs to the fair value estimates of the MRB calculations:
•Assumed mortality rates for certain policies were increased as a result of trends in actual mortality experience within those blocks of business, which resulted in an increase in the MRB reserve.
•Assumed lapse rates were reduced to capture recent trends in actual lapse experience and to reflect a strengthening of the risk margin, which resulted in an increase in the MRB reserve.
•An update was made in the GMWB utilization modeling framework to allow for more direct modeling of certain product features and risk margins were strengthened to reflect the credibility associated with the increased granularity of the parameterization, which resulted in a net increase in the MRB reserve. No adjustments were made to the GMIB utilization rates.
•Assumed GMWB withdrawal rates were increased as a result of trends in actual experience, which resulted in an increase in the MRB reserve. Minor adjustments were made to the free partial withdrawal rates on policies without a GMWB with no material impact on the resulting MRB reserve.
•The non-performance risk adjustment increased as a result of increasing credit spreads, which resulted in a decrease in the MRB reserve that was recorded within OCI.
•There were no changes made to assumed long-term equity volatility.
•Increases in interest rates led to higher assumed separate account returns and higher discount rates, which resulted in a decrease in the MRB reserve.
•Decreases in equity markets led to lower separate account fund performance and an increase in future projected benefits, which resulted in an increase in the MRB reserve.
•Increases in equity index volatility led to lower assumed separate account returns, which resulted in an increase in the MRB reserve.
179
Part II | Item 8. Notes to Consolidated Financial Statements | 13. Long-Term Debt
13. Long-Term Debt
Liabilities for the Company’s debt are primarily carried at an amount equal to the principal balance net of any unamortized original issuance discount or premium. Original issuance discount or premium and any debt issue costs, if applicable, are recognized as a component of interest expense over the period the debt is expected to be outstanding.
The aggregate carrying value of long-term debt was as follows (in millions):
| December 31, | |||||||||||
| 2023 | 2022 | ||||||||||
| Long-Term Debt | |||||||||||
| Senior Notes due 2023 | $ | $ | |||||||||
| Senior Notes due 2027 | |||||||||||
| Senior Notes due 2031 | |||||||||||
| Senior Notes due 2032 | |||||||||||
| Senior Notes due 2051 | |||||||||||
| Surplus notes | |||||||||||
| FHLBI bank loans | |||||||||||
| Total long-term debt | $ | $ | |||||||||
The following table presents the contractual maturities of the Company's long-term debt as of December 31, 2023 (in millions):
| Calendar Year | |||||||||||||||||||||||||||||||||||
| 2024 | 2025 | 2026 | 2027 | 2028 and thereafter | Total | ||||||||||||||||||||||||||||||
| Long-term debt | $ | $ | $ | $ | $ | $ | |||||||||||||||||||||||||||||
Senior Notes
On June 8, 2022, the Company issued $750 million aggregate principal amount of its senior unsecured notes, consisting of $400 million aggregate principal amount of 5.170 % Senior Notes due June 8, 2027, and $350 million aggregate principal amount of 5.670 % Senior Notes due June 8, 2032. The net proceeds of these notes were used, together with cash on hand, to repay the Company’s $750 million aggregate principal senior unsecured amount term loan due February 2023.
Revolving Credit Facility
On February 24, 2023, the Company replaced the 2021 Revolving Credit Facility that was due to expire in February 2024 and entered into a revolving credit facility (the "2023 Revolving Credit Facility") with a syndicate of banks and Bank of America, N.A., as Administrative Agent. The 2023 Revolving Credit Facility provides for borrowings for working capital and other general corporate purposes under aggregate commitments of $1.0 billion, with a sub-limit of $500 million available for letters of credit. The 2023 Revolving Credit Facility further provides for the ability to request, subject to customary terms and conditions, an increase in commitments thereunder by up to an additional $500 million.
The credit agreement for the 2023 Revolving Credit Facility contains financial maintenance covenants, including a minimum adjusted consolidated net worth test of no less than 70 % of our adjusted consolidated net worth as of September 30, 2022 (plus (to the extent positive) or minus (to the extent negative) 70 % of the impact on such adjusted consolidated net worth resulting from the application of a one-time transition adjustment for the LDTI accounting change for insurance contracts, and plus 50 % of the aggregate amount of any increase in adjusted consolidated net worth resulting from equity issuances by the Company and its consolidated subsidiaries after September 30, 2022), and a maximum consolidated indebtedness to total capitalization ratio test not to exceed 35 %. Commitments under the 2023 Revolving Credit Facility terminate on February 24, 2028.
180
Part II | Item 8. Notes to Consolidated Financial Statements | 13. Long-Term Debt
Surplus Notes
Under Michigan insurance law, for statutory reporting purposes, the surplus notes are not part of the legal liabilities of the Company and are considered surplus funds. Payments of interest or principal may only be made with the prior approval of the Michigan Director of Insurance and only out of surplus earnings which the director determines to be available for such payments under Michigan insurance law.
On March 15, 1997, the Company, through its subsidiary, Jackson, issued 8.2 % surplus notes in the principal amount of $250 million due March 15, 2027. These surplus notes are unsecured and subordinated to all present and future indebtedness, policy claims and other creditor claims and may not be redeemed at the option of the Company or any holder prior to maturity. Interest is payable semi-annually on March 15th and September 15th of each year. Interest expense on the notes was $20 million, $20 million, and $20 million for the years ended December 31, 2023, 2022 and 2021, respectively.
FHLB Loans
The Company received loans of $50 5.1 % and 1.7 % for the years ended December 31, 2023 and 2022, respectively.
The outstanding balance on these loans was $57 million and $62 million at December 31, 2023 and 2022, respectively. See Note 10 - Other Contract Holder Funds of Notes to Consolidated Financial Statements for the carrying value of total collateralization of our FHLB obligations.
Line of Credit Agreement
Jackson is a party to an Uncommitted Money Market Line Credit Agreement dated April 6, 2023 among Jackson, Jackson Financial, and Société Générale. This agreement is an uncommitted short-term cash advance facility that provides an additional form of liquidity to Jackson and to Jackson Financial. The aggregate borrowing capacity under the agreement is $500 million and each cash advance request must be at least $100 thousand. The interest rate is set by the lender at the time of the borrowing and is fixed for the duration of the advance. Jackson and Jackson Financial are jointly and severally liable to repay any advance under the agreement, which must be repaid prior to the last day of the quarter in which the advance was drawn.
14. Federal Home Loan Bank Advances
15. Income Taxes
U.S. Tax Law Changes
On August 16, 2022, President Biden signed the Inflation Reduction Act of 2022 (“IRA”) into law. The IRA includes a new Federal corporate alternative minimum tax (“CAMT”), effective in 2023, that is based on 15% of an applicable corporation’s adjusted financial statement income (“AFSI”). A corporation is subject to the CAMT if its average pre-tax AFSI over three prior years (starting with 2020-2022) is greater than $1 billion (an “applicable corporation”). Upon becoming an applicable corporation, an entity will remain so for all future years, except under limited circumstances. The corporation’s CAMT liability is payable to the extent the CAMT liability exceeds regular corporate income tax. However, any CAMT paid would be indefinitely available as a credit carryover that could reduce future regular corporate income tax in excess of CAMT. The Company is an applicable corporation starting in 2023. That determination is based on interpretations and assumptions we have made regarding the CAMT provisions of the IRA, which may change once further regulatory guidance is issued. As of December 31, 2023, the Company has recorded an estimate of $263 million for the
181
Part II | Item 8. Notes to Consolidated Financial Statements | 15. Income Taxes
provision of CAMT based on the Company’s interpretation of available guidance with an offsetting increase to the deferred tax asset for the credit carryover resulting in no impact to total tax expense. The U.S. Department of the Treasury is expected to issue additional regulatory guidance in 2024 that may materially change the estimated provision of the CAMT.
Effective Tax Rate
The components of the provision for federal, state and local income taxes were as follows (in millions):
| Years Ended December 31, | ||||||||||||||||||||
| 2023 | 2022 | 2021 | ||||||||||||||||||
| Current tax expense (benefit) | ||||||||||||||||||||
| Federal | $ | $ | ( | $ | ( | |||||||||||||||
| State and local | ( | ( | ||||||||||||||||||
| Total current tax expense (benefit) | ( | ( | ||||||||||||||||||
| Deferred tax expense (benefit) | ||||||||||||||||||||
| Federal | ( | |||||||||||||||||||
| State and local | ( | |||||||||||||||||||
| Total deferred tax expense (benefit) | ( | |||||||||||||||||||
| Total income taxes | $ | $ | $ | |||||||||||||||||
The federal income tax provisions differ from the amounts determined by multiplying pretax income attributable to the Company by the statutory federal income tax rate of 21% as follows (in millions):
| Years Ended December 31, | ||||||||||||||||||||
| 2023 | 2022 | 2021 | ||||||||||||||||||
| Income taxes at statutory rate | $ | $ | $ | |||||||||||||||||
| State income taxes | ( | |||||||||||||||||||
| Dividends received deduction | ( | ( | ( | |||||||||||||||||
| Valuation allowance | ( | |||||||||||||||||||
Foreign and other tax credits (1) | ( | ( | ( | |||||||||||||||||
Other (2) | ( | ( | ||||||||||||||||||
| Income tax (benefit) expense | $ | $ | $ | |||||||||||||||||
| Effective tax rate | % | % | % | |||||||||||||||||
(1) For the years ended December 31, 2023, 2022 and 2021, this primarily represents the benefit from foreign tax credits generated by the fund investments of the variable life and annuity contracts.
The dividends received deduction (“DRD”) reduces the amount of income subject to tax. The DRD for the current period was estimated using information from 2022 and estimates of current year investments results. The actual current year DRD can vary based on factors such as, but not limited to, changes in the amount of dividends received that are eligible for the DRD, changes in the amount of distributions received from fund investments, changes in the account balances of variable life and annuity contracts, and the Company’s taxable income before the DRD.
Income Taxes Paid
Income taxes paid (refunded) were $(21 ) million, $(5 ) million, and $(403 ) million in 2023, 2022 and 2021, respectively. The income taxes refunded in 2021 include $(314 ) million of taxes and $(24 ) million of net interest related to the IRS audit that closed during 2021 and $(73 ) million of refunds from the overpayment of 2020 taxes in 2021.
182
Part II | Item 8. Notes to Consolidated Financial Statements | 15. Income Taxes
Deferred Taxes and Assessment of Valuation Allowance
The tax effects of significant temporary differences that gave rise to deferred tax assets and liabilities were as follows (in millions):
| December 31, | ||||||||||||||
| 2023 | 2022 | |||||||||||||
| Gross deferred tax asset | ||||||||||||||
| Difference between financial reporting and the tax basis of: | ||||||||||||||
| Policy reserves and other insurance items | $ | $ | ||||||||||||
| Employee benefits | ||||||||||||||
| Derivative investments | ||||||||||||||
Tax Credits Carryforward (1) | ||||||||||||||
| Net unrealized losses | ||||||||||||||
| Net operating loss carryforward | ||||||||||||||
Other (1) | ||||||||||||||
| Total gross deferred tax asset | ||||||||||||||
| Valuation allowance | ( | ( | ||||||||||||
| Gross deferred tax asset, net of valuation allowance | $ | $ | ||||||||||||
| Gross deferred tax liability | ||||||||||||||
| Difference between financial reporting and the tax basis of: | ||||||||||||||
| Deferred acquisition costs and sales inducements | $ | ( | $ | ( | ||||||||||
| Other investment items | ( | ( | ||||||||||||
| Other | ( | ( | ||||||||||||
| Total gross deferred tax liability | ( | ( | ||||||||||||
| Net deferred tax asset | $ | $ | ||||||||||||
(1) For the year ended December 31, 2022, Tax Credits Carryfoward were reclassed from Other Gross deferred tax asset for comparability to 2023. | ||||||||||||||
Deferred income taxes arise from the recognition of temporary differences between the basis of assets and liabilities determined for financial reporting purposes and the basis determined for income tax purposes. Such temporary differences are principally related to the effects of recording certain invested assets at market value, the deferral of acquisition costs and sales inducements and the provisions for future policy benefits and expenses. Deferred tax assets and liabilities are measured using the tax rates expected to be in effect when such benefits are realized.
In 2016, the Company reached an agreement with the IRS regarding the taxation of hedging activities. This agreement requires the current taxation of all unrealized gains and losses on hedge-related investments, but then defers two-thirds of the amount ratably over the following two years. Accordingly, there is an acceleration of taxes incurred currently and a related offset to the taxes being deferred.
The Company is required to evaluate the recoverability of its deferred tax assets and establish a valuation allowance, if necessary, to reduce its deferred tax asset to an amount that is more likely than not to be realizable. Considerable judgment and the use of estimates are required when determining whether a valuation allowance is necessary and, if so, the amount of such valuation allowance. When evaluating the need for a valuation allowance, the Company considers many factors, including: the nature and character of the deferred tax assets and liabilities; taxable income in prior carryback years; future reversals of temporary differences; the length of time carryovers can be utilized; and any tax planning strategies the Company would employ to avoid a tax benefit from expiring unused. The Company has adopted an accounting policy to analyze the ability to recover the CAMT credit carryover deferred tax asset separately from the deferred tax assets generated under the regular tax system.
183
Part II | Item 8. Notes to Consolidated Financial Statements | 15. Income Taxes
The Company utilized a three-year rolling calculation of actual comprehensive income before taxes adjusted for permanent items to measure the cumulative losses in recent years. In 2020, the Company entered into a funds withheld coinsurance agreement with Athene. The cumulative comprehensive income includes items that are not indicative of the Company’s ability to generate future taxable income. As such, an adjustment was made to exclude the change in AOCI not attributable to the funds withheld coinsurance agreement with Athene. The change in AOCI attributable to these assets is excluded because our invested assets are generally invested to closely match the duration of our liabilities, which are longer duration in nature, and therefore the Company believes that the period-to-period fair market value fluctuations in AOCI are inconsistent when analyzing trends in our business. The changes in AOCI within the funds withheld account related to the Athene Reinsurance Transaction are not excluded because they offset the related earnings from the Athene Reinsurance Transaction included in pre-tax income and thus appropriately results in removing the impact from the Athene Reinsurance Transaction from the cumulative income test which economically should be minimal over the life of the reinsured business. Based on these factors, it is reasonable for the Company to rely on the estimated projection of future income as evidence in assessing the sources of taxable income available to realize the benefit of deferred tax assets.
The Company evaluated each component of the deferred tax asset and assessed the effects of limitations and/or interpretations on the value of such components to be fully recognized in the future. The Company also evaluated the likelihood of sufficient taxable income in the future to offset the available deferred tax assets based on evidence considered to be objective and verifiable. Based on the analysis at December 31, 2023 and 2022, the Company concluded that it is more likely than not, that the $640 million and $320 million, respectively, of net deferred tax assets will be realized through future projected taxable income.
For the year ended December 31, 2023, changes in market conditions and interest rates, impacted the unrealized tax gains and losses in the available for sale securities portfolio resulting in deferred tax assets related to net unrealized tax capital losses for the life insurance group. The deferred tax asset relates to the unrealized losses for which the carryforward period has not yet begun, and as such, when assessing its recoverability, we consider our ability and intent to hold the underlying securities to recovery, our capital loss carryback capacity, along with reversing capital deferred tax liabilities.
As of December 31, 2023, based on all available evidence, we concluded that a valuation allowance should be established on a portion of the deferred tax asset related to unrealized losses that are not more likely than not to be realized. For the year ended December 31, 2023 and 2022, respectively, the Company recorded a $688 million and $906 million valuation allowance associated with the unrealized tax capital losses in the Life Insurance Companies' available for sale securities portfolio.
At December 31, 2023 and 2022, respectively, the Company recorded a valuation allowance in the amount of $1 million and $4 million against the deferred tax assets associated with both realized and unrealized losses on capital assets, in the Non-life Companies', where it is not more likely than not that the full tax benefit of the losses will be realized.
For the year ended December 31, 2023, the Company recorded a decrease of $221 million to the valuation allowance associated with the unrealized tax losses in the Company’s available for sale securities portfolio and both realized and unrealized losses on capital assets of the Non-life Companies. The $221 million decrease for the twelve months ending December 31, 2023 to the valuation allowance consists of $214 million tax benefit recorded to other comprehensive income and $7 million tax benefit recorded in the income tax expense.
184
Part II | Item 8. Notes to Consolidated Financial Statements | 15. Income Taxes
Carryforwards
The following table sets forth the amount and expiration dates of federal and state operating, capital loss and tax credit carryforwards for tax periods indicated. Included in the table is a Section 382 loss carryforward attributable to a previous acquisition. Section 382 of the Internal Revenue Code imposes limitations on the utilization of net operating loss carryforwards. The Section 382 limitation is an annual limitation on the amount of pre-acquisition net operating losses that a corporation may use to offset post-acquisition income. Section 382 further limits certain unrealized built-in losses at the time of acquisition.
| December 31, | ||||||||||||||
| 2023 | 2022 | |||||||||||||
Federal net operating and capital loss carryforwards (1) | $ | $ | ||||||||||||
Section 382 net operating loss from previous acquisition (2) | ||||||||||||||
State net operating and capital loss carryforwards (3) | ||||||||||||||
Foreign Tax Credit (4) | ||||||||||||||
Alternative Minimum Credit (5) | ||||||||||||||
| Total | $ | $ | ||||||||||||
(1) Unlimited carryforward | ||||||||||||||
(2) Begins to expire in 2026 with annual limitation of approximately $ | ||||||||||||||
(3) For the year ended December 31, 2023, includes $ | ||||||||||||||
(4) | ||||||||||||||
(5) $ | ||||||||||||||
Accounting for Uncertainty in Income Taxes
The Company determines whether a tax position is more likely than not to be sustained upon examination by tax authorities. The portion of a tax position that is greater than the 50% likelihood of being realized is recorded on the financial statements and any unrecognized part of a position due to uncertainties are recorded as a liability and are charged to income tax in the period that determination is made. The Company has considered both permanent and temporary positions in determining the unrecognized tax benefit rollforward. At December 31, 2023 and 2022, the Company held no reserves related to unrecognized tax benefits.
The Company recognizes interest and penalties accrued, if any, related to unrecognized tax benefits as a component of income tax (benefit) expense. The Company did not recognize any material interest and penalty expense in 2023, 2022 or 2021. For 2023 and 2022, the Company had accrued total interest expense of an immaterial amount for both periods. For 2023 and 2022, the Company did not accrue any amounts for penalties.
Based on information available as of December 31, 2023, the Company believes that, in the next 12 months, there are no positions for which it is reasonably possible that the total amounts of unrecognized tax benefits will significantly increase or decrease.
Tax Examinations and Litigation
The Company is no longer subject to U.S. federal tax examinations by tax authorities for years prior to 2019. Tax years from 2019 to 2023 remain open under the statute of limitations. The 2018 IRS exam of the JFI non-life federal consolidated return closed during 2022 with no material impact to the Company. Certain of the Company’s subsidiaries’ state income tax returns are currently under examination by various jurisdictions for years ranging from 2018 to 2022. The Company does not anticipate any material changes from any of these audits.
Organization and Tax Sharing Agreements
Our U.S. federal consolidated income tax group includes both life companies and non-life companies. The Company files separate non-life and life insurance consolidated federal income tax returns with the U.S. federal government and various state and local jurisdictions, as well as certain foreign jurisdictions.
185
Part II | Item 8. Notes to Consolidated Financial Statements | 15. Income Taxes
Jackson Financial and its non-life insurance subsidiaries, Jackson Holdings, LLC and PPM, file a consolidated non-life federal income tax return. Brooke Life files a consolidated life insurance company tax return with Jackson, JNY, and Squire Re II. Jackson National Life (Bermuda) LTD and VFL International Life Company SPC, LTD are taxed as controlled foreign corporations of Jackson. With the exception of several insignificant wholly-owned subsidiaries that are not included in the Brooke Life consolidated tax return, all other subsidiaries of Jackson are limited liability companies with all of their interests owned by Jackson. Accordingly, they are not considered separate entities for income tax purposes and, therefore, are taxed as part of the operations of Jackson. Income tax expense is calculated on a separate company basis.
Jackson Financial, Jackson Holdings LLC, and PPM have entered into written tax sharing agreements. These tax sharing agreements are generally based on a separate return basis with benefits for credits and losses.
Brooke Life, Jackson, JNY, and Squire RE II have entered into written tax sharing agreements. These tax sharing agreements are generally based on a separate return basis with benefits for credits and losses.
CAMT liability is allocated to each company based on its share of the impact of CAMT in the respective consolidated tax return filing group in which it is a member.
16. Commitments and Contingencies
In the ordinary course of business, the Company and its subsidiaries are parties to legal actions and, at times, regulatory investigations. Given the inherent unpredictability of these matters, it is difficult to estimate their impact on the Company’s financial position. A reserve is established for contingent liabilities if it is probable that a loss has been incurred and the amount is reasonably estimable. It is possible that an adverse outcome in certain of the Company’s contingent liabilities, or the use of different assumptions in the determination of amounts recorded, could have a material effect upon the Company’s financial position. However, it is the opinion of management that the ultimate disposition of contingent liabilities is unlikely to have a material adverse effect on the Company’s financial position. Jackson has been named in civil litigation proceedings, which appear to be substantially similar to other class action litigation brought against many life insurers including allegations of misconduct in the sale of insurance products. The Company accrues for legal contingencies once the contingency is deemed to be probable and reasonably estimable.
17. Leases
The Company leases office space and equipment under several operating leases that expire at various dates through 2051. The Company determines if a contract is a lease at inception or modification. Lease terms may include options to extend or terminate the lease and are included in the lease measurement when it is reasonably certain that the Company will exercise that option. Right-of-use (“ROU”) assets represent the right to use an underlying asset for the lease term and corresponding lease liabilities represent the obligation to make lease payments arising from the lease. ROU assets and liabilities are determined using the Company’s incremental borrowings rate based upon information available at lease commencement. Certain lease incentives such as free rent periods are recorded as a reduction of the ROU asset. Lease costs for operating leases are recognized on a straight-line basis over the life of the lease.
The Company has lease agreements with both lease and non-lease components. The Company elected the practical expedient to combine lease and non-lease components for certain real estate leases.
Variable lease expenses may include changes in index-linked lease payments and certain variable operating expenses associated with real estate leases. These payments are recognized in operating expenses in the period incurred.
At December 31, 2023 and 2022, the Company had operating lease net ROU assets of $24 million and $26 million and associated lease liabilities of $32 million and $36 million, respectively, classified within and , respectively. Net lease expense was $43 million, $46 million, and $33 million in 2023, 2022 and 2021, respectively, including expenses associated with software leases.
186
Part II | Item 8. Notes to Consolidated Financial Statements | 17. Leases
The following table summarizes the components of operating lease costs and other information related to operating leases recorded within operating costs and other expenses, net of deferrals, (dollars in millions):
| Years Ended December 31, | |||||||||||||||||
| 2023 | 2022 | 2021 | |||||||||||||||
| Lease Cost: | |||||||||||||||||
Operating leases (1) | $ | $ | $ | ||||||||||||||
| Variable lease costs | |||||||||||||||||
| Sublease income | ( | ( | ( | ||||||||||||||
| Net Lease Cost | $ | $ | $ | ||||||||||||||
| Other Information: | |||||||||||||||||
| Cash paid for amounts included in the measurement of operating lease liability | $ | $ | $ | ||||||||||||||
| ROU assets obtained in exchange for new lease liabilities | $ | $ | $ | ||||||||||||||
| Weighted average lease term | |||||||||||||||||
| Weighted average discount rate | % | % | % | ||||||||||||||
(1) Operating lease costs exclude software leases, as intangible assets are excluded from the scope of Accounting Standard Codification 842, Leases.
At December 31, 2023, the maturities of operating lease liabilities were as follows (in millions):
| 2024 | $ | |||||||
| 2025 | ||||||||
| 2026 | ||||||||
| 2027 | ||||||||
| 2028 | ||||||||
| Thereafter | ||||||||
| Total | $ | |||||||
| Less: interest | ||||||||
| Present value of lease liabilities | $ | |||||||
18. Share-Based Compensation
Prudential Share Plans
Historically, certain associates participated in various share award plans relating to Prudential shares and/or American Depositary Receipts (“ADRs”) that were tradable on the New York Stock Exchange. Outstanding non-vested Prudential ADRs granted as of December 31, 2020 were 6,241,847 . In 2021, these plans were replaced through a re-issuance under Jackson Financial Inc.’s 2021 Omnibus Incentive Plan (the “Incentive Plan”) and the remaining outstanding awards were exchanged for awards under the new plan as further described below.
2021 Omnibus Incentive Plan
In April 2021, the Company’s Board of Directors adopted, and the Company’s shareholders approved, the Incentive Plan. This Incentive Plan became effective following the completion of the Demerger and replaced the Prudential Share Plans. The outstanding unvested awards previously issued under the Prudential Share Plans were exchanged for equivalent awards of shares of JFI’s Class A Common Stock under the Incentive Plan, with a grant date of October 4, 2021. The performance conditions of the awards were modified to be based on U.S. GAAP based metrics. The incremental compensation cost resulting from the modifications will be recognized ratably over the remaining requisite service period of each award.
187
Part II | Item 8. Notes to Consolidated Financial Statements | 18. Share-Based Compensation
The Incentive Plan allows for stock-based awards including stock options, stock appreciation rights, restricted share awards, performance share awards, and deferred share units. The Incentive Plan has a ten-year term, expiring in September 2031. The Company currently has Restricted Share Unit and Performance Share Unit equity-based compensation awards outstanding. Dividend equivalents are generally accrued on restricted share units and performance share units outstanding as of the record date. These dividend equivalents are paid only on restricted share units and performance share units that ultimately vest. Generally, the requisite service period is the vesting period. In the case of retirement (eligibility for which is based on the associate's age and years of service as provided in the relevant award agreement), awards vest in full, but are subject to the satisfaction of any applicable performance criteria and paid in line with the original vesting date. The maximum aggregate number of shares of the Company’s common stock that may be issued pursuant to awards under the Incentive Plan shall not exceed 11,000,000 shares. Shares for which payment is in cash, including the shares withheld to cover associate payroll taxes, as well as shares that expire, terminate, or are canceled or forfeited, may be awarded or granted again under the Incentive Plan.
The Company reflects the cash settled awards of the above plan as a liability classified plan and, therefore, reports the accrued compensation expense and the value of the cash settled awards within other liabilities. At December 31, 2023 and 2022, the Company had $85 million and $79 million accrued for future payments under this plan, respectively.
Restricted Share Units ("RSUs")
JFI grants RSUs to certain associates and non-employee directors. The majority of associate RSUs are expected to vest in three equal installments on the first through third anniversaries of the grant date over a 3-year service period, subject to forfeiture and transfer restrictions, and are payable in cash or shares at the Company’s discretion. The associate awards granted in 2021 have a shortened, 30-month vesting period. In addition, 1 - and 2-year awards were issued in connection with the Company’s Demerger. RSUs have immediate dividend rights and voting rights upon issuance of underlying shares when the share units vest. In lieu of cash dividend payments, the dividends on unvested RSUs are awarded in additional units equal to the value of the dividends and are subject to the same vesting and distribution conditions as the underlying RSU.
Outstanding non-vested RSUs granted to associates were as follows:
| Year Ended December 31, 2023 | Share-Settled | Cash-Settled | |||||||||||||||
| RSUs | Weighted-Average Grant Date Fair Value per Share | RSUs | Weighted-Average Grant Date Fair Value per Share | ||||||||||||||
Non-vested at beginning of period | $ | $ | |||||||||||||||
Granted (1) | $ | $ | |||||||||||||||
Vested | ( | $ | ( | $ | |||||||||||||
Forfeited | ( | $ | ( | $ | |||||||||||||
Non-vested at end of period | $ | $ | |||||||||||||||
(1) Includes dividend equivalents granted in the current period on awards outstanding
| Year Ended December 31, 2022 | Share-Settled | Cash-Settled | |||||||||||||||
| RSUs | Weighted-Average Grant Date Fair Value per Share | RSUs | Weighted-Average Grant Date Fair Value per Share | ||||||||||||||
| Nonvested at beginning of period | $ | $ | |||||||||||||||
Granted (1) | $ | $ | |||||||||||||||
| Vested | ( | $ | ( | $ | |||||||||||||
| Forfeited | ( | $ | ( | $ | |||||||||||||
| Nonvested at end of period | $ | $ | |||||||||||||||
188
Part II | Item 8. Notes to Consolidated Financial Statements | 18. Share-Based Compensation
Performance Share Units ("PSUs")
JFI grants PSUs to certain associates. PSU vesting is contingent on meeting a specified service requirement and the level of achievement of performance conditions. The PSU awards entitle recipients to receive, upon vesting, a number of units that ranges from 0 % to 200 % of the number of PSUs awarded, depending on the level of achievement of the specified performance conditions. For PSUs granted in 2023, the awards also include a vesting modifier based on the Company's performance relative to a defined peer group. The awards are generally expected to vest after a period of three years , subject to forfeiture and transfer restrictions, and are payable in cash or shares at the Company’s discretion. However, the awards granted in 2021 have a shortened, 30-month vesting period. Award recipients have immediate dividend rights and voting rights upon issuance of underlying shares when the share units vest. The dividends on unvested PSUs are awarded in additional units equal to the value of the dividends and are subject to the same vesting and distribution conditions as the underlying PSUs. The modified PSU awards retained their vesting and performance conditions, modified to be based on U.S. GAAP based metrics, rather than IFRS.
Outstanding non-vested PSUs granted were as follows:
| Year Ended December 31, 2023 | Share-Settled | Cash-Settled | |||||||||||||||
| PSUs | Weighted-Average Grant Date Fair Value per Share | PSUs | Weighted-Average Grant Date Fair Value per Share | ||||||||||||||
Non-vested at beginning of period | $ | $ | |||||||||||||||
Granted (1) | $ | $ | |||||||||||||||
Vested | ( | $ | ( | $ | |||||||||||||
Forfeited | ( | $ | ( | $ | |||||||||||||
Non-vested at end of period | $ | $ | |||||||||||||||
(1) Includes dividend equivalents granted in the current period on awards outstanding
| Year Ended December 31, 2022 | Share-Settled | Cash-Settled | |||||||||||||||
| PSUs | Weighted-Average Grant Date Fair Value per Share | PSUs | Weighted-Average Grant Date Fair Value per Share | ||||||||||||||
| Nonvested at beginning of period | $ | $ | |||||||||||||||
Granted (1) | $ | $ | |||||||||||||||
| Vested | ( | $ | ( | $ | |||||||||||||
| Forfeited | ( | $ | ( | $ | |||||||||||||
| Nonvested at end of period | $ | $ | |||||||||||||||
Compensation Cost
JFI charges the fair value of the restricted share units and performance share units to expense over the requisite service period. For performance-based awards, JFI estimates the number of shares expected to vest at the end of the performance period based on the probable achievement of the performance objectives. RSUs have graded vesting features and JFI recognizes expense for those awards on a straight-line basis over the requisite service period. The Company recognizes forfeitures as they occur when recognizing share-based compensation expense.
For most of the equity-classified RSUs and PSUs, the fair value is based on the price of JFI’s common stock on the grant date. For PSU equity awards granted in 2023, the Company measures fair value using a Monte Carlo simulation that considers the Company’s projected total shareholder return (“TSR”) relative to a defined group of peers as well as other inputs to estimate the grant date fair value of awards.
For liability-classified RSUs and most liability-classified PSUs, the fair value is based on the price of JFI’s common stock as of the reporting date. For PSU liability awards granted in 2023, the Company uses a Monte Carlo simulation that considers the Company’s projected TSR relative to a defined group of peers as well as other inputs to estimate the grant date fair value of awards.
189
Part II | Item 8. Notes to Consolidated Financial Statements | 18. Share-Based Compensation
Total expense related to these share-based plans was as follows (in millions):
| For the Years Ended December 31, | ||||||||||||||||||||
| 2023 | 2022 | 2021 | ||||||||||||||||||
| Compensation expense recognized | $ | $ | $ | |||||||||||||||||
| Income tax benefit recognized | ||||||||||||||||||||
Unrecognized compensation cost for RSUs and PSUs under the Incentive Plan as of December 31, 2023 was $49 million with a weighted average recognition period of 1.05 years.
19. Other Related Party Transactions
The Company's investment management operation, PPM, provides investment services to entities affiliated with the Company's former parent. As of June 30, 2023, the former parent had no remaining equity interest in the Company and therefore its affiliated entities are no longer designated as related parties. The Company recognized $18 million, $33 million, and $28 million of revenue during the years ended December 31, 2023, 2022 and 2021, associated with these investment services. This revenue is included in fee income in the accompanying Consolidated Income Statements.
20. Statutory Accounting and Regulatory Matters
The Company’s insurance subsidiaries are required to prepare statutory financial statements in accordance with statutory accounting practices prescribed or permitted by the insurance department of the state of domicile. Statutory accounting practices primarily differ from U.S. GAAP by charging policy acquisition costs to expense as incurred and establishing future policy benefit liabilities using different actuarial assumptions, as well as valuing investments and certain assets and accounting for deferred income taxes on a different basis.
At December 31, 2023 and 2022, Jackson’s statutory capital and surplus was $4.7 billion and $6.0 billion, respectively. Jackson had statutory net income (loss) of $(122 ) million, $3,688 million, and $136 million, in 2023, 2022 and 2021, respectively.
Furthermore, at December 31, 2023 and 2022, Brooke Life’s statutory capital and surplus was $4.7 billion and $6.0 billion, respectively, which includes its investment in Jackson of $4.7 billion and $6.0 billion, in 2023 and 2022, respectively. Brooke Life’s statutory net income (loss) was $385 million, $(109 ) million, and $(94 ) million in 2023, 2022, and 2021, respectively. Brooke Life’s statutory net income included a dividend payment of $450 million from Jackson in 2023. Brooke Life did not receive dividend payments from Jackson in 2022. Brooke Life paid dividends of $360 million and $510 million to its parent in 2023 and 2022, respectively.
The Company’s consolidated assets are primarily those of its life insurance subsidiary, Jackson. Under the Michigan Insurance Code of 1956, Jackson must notify the Michigan Director of Insurance prior to payment of any dividend. Ordinary dividends on capital stock may only be distributed out of earned surplus, excluding any unrealized capital gains and the effect of permitted practices (referred to as adjusted earned surplus). Ordinary dividends are also limited to the greater of 10% of statutory surplus as of the preceding year end, excluding any increase arising from the application of permitted practices, or the statutory net income, excluding any net realized investment gains, for the twelve-month period ended on the preceding December 31. The Michigan Director of Insurance may approve payment of dividends in excess of these amounts, which would be deemed an extraordinary dividend. The maximum amount that would qualify as an ordinary dividend for Jackson, which would consequently be free from restriction and available for payment of dividends to Brooke Life in 2024, is estimated to be $464 million, subject to the availability of adjusted earned surplus as of the dividend date. At December 31, 2023, Jackson had no adjusted earned surplus available for ordinary dividends. Furthermore, at December 31, 2023, Brooke Life had adjusted earned surplus of $329 million. The maximum amount that would qualify as an ordinary dividend for Brooke Life, which would consequently be free from restriction and available for payment of dividends to Brooke Life’s parent in 2024, is estimated to be $371 million, subject to the availability of adjusted earned surplus as of the dividend date.
190
Part II | Item 8. Notes to Consolidated Financial Statements | 20. Statutory Accounting and Regulatory Matters
On February 24, 2023, Jackson received approval from the Michigan Director of Insurance for a $600 million distribution to Jackson’s parent company, Brooke Life. The distribution occurred in the first quarter of 2023. Brooke Life subsequently upstreamed this distribution to its ultimate parent, Jackson Financial, except for $90 million of the distribution to be used for debt servicing of its surplus note payable.
Under Michigan insurance law, Value of Business Acquired ("VOBA") is reported as an admitted asset if certain criteria are met. Jackson's statutory basis VOBA was fully amortized in 2022.
The NAIC has developed certain risk-based capital (“RBC”) requirements for life insurance companies. Under those requirements, compliance is determined by a ratio of a company’s total adjusted capital (“TAC”), calculated in a manner prescribed by the NAIC to its authorized control level RBC, calculated in a manner prescribed by the NAIC. Companies below specific trigger points or ratios are classified within certain levels, each of which requires specified corrective action. The minimum level of TAC before corrective action commences is twice the authorized control level RBC (“Company action level RBC”). At December 31, 2023, Jackson and Brooke Life’s TAC remained well in excess of the Company action level RBC.
In addition, on the basis of statutory financial statements that insurers file with the state insurance regulators, the NAIC annually calculates twelve financial ratios to assist state regulators in monitoring the financial condition of insurance companies. A usual range of results for each ratio is used as a benchmark and departure from the usual range on four or more of the ratios can lead to inquiries from individual state insurance departments. In 2023 and 2022, there were no significant exceptions with any ratios.
21. Benefit Plans
The Company has a defined contribution retirement plan covering substantially all associates and certain affiliates. Effective January 1, 2020, associates are immediately eligible to participate in the Company’s matching contribution. To be eligible to participate in the Company’s profit-sharing contribution, an associate must have attained the age of 21, completed at least 1,000 hours of service in a 12-month period and passed their 12-month employment anniversary. In addition, the associate must be employed on the applicable January 1 or July 1 entry date. The Company’s annual profit-sharing contributions, as declared by Jackson’s Board of Directors, are based on a percentage of eligible compensation paid to participating associates during the year. In addition, the Company matches a participant’s elective contribution, up to 6 percent of eligible compensation, to the plan during the year. The Company’s expense related to this plan was $34 million, $31 million, and $32 million in 2023, 2022 and 2021, respectively.
The Company maintains non-qualified voluntary deferred compensation plans for certain associates and independent agents. At December 31, 2023 and 2022, the total aggregate liability for such plans was $474 million and $469 million, respectively, and was reported in other liabilities. The Company’s expense (income) related to these plans, including a match of elective deferrals for the agents’ deferred compensation plan and the change in value of participant elective deferrals, was $58 million, $(47 ) million, and $54 million in 2023, 2022 and 2021, respectively.
22. Operating Costs and Other Expenses
The following table is a summary of the Company’s operating costs and other expenses (in millions):
| Years Ended December 31, | |||||||||||||||||
| 2023 | 2022 | 2021 | |||||||||||||||
| Asset-based commission expenses | $ | $ | $ | ||||||||||||||
| Other commission expenses | |||||||||||||||||
| Sub-advisor expenses | |||||||||||||||||
| General and administrative expenses | |||||||||||||||||
| Deferral of acquisition costs | ( | ( | ( | ||||||||||||||
| Total operating costs and other expenses | $ | $ | $ | ||||||||||||||
191
Part II | Item 8. Notes to Consolidated Financial Statements | 23. Accumulated Other Comprehensive Income (Loss)
23. Accumulated Other Comprehensive Income (Loss)
Comprehensive income (loss) includes all changes in shareholders’ equity (except those arising from transactions with owners/shareholders) and includes net income, net unrealized gains or losses on available-for-sale securities, the impact of changes in the non-performance risk used in the remeasurement of market risk benefits, and the impact of changes in the discount rate used in the remeasurement of our reserves for future policy benefits and claims payable.
The following table represents changes in the balance of AOCI, net of income tax, related to unrealized investment gains (losses) (in millions):
| Years Ended December 31, | ||||||||||||||||||||
| 2023 | 2022 | 2021 | ||||||||||||||||||
Balance, beginning of period (1) | $ | ( | $ | $ | ||||||||||||||||
| Change in accounting principle, net of tax | — | — | ( | |||||||||||||||||
| Other comprehensive income (loss): | ||||||||||||||||||||
| Change in unrealized gains (losses) of investments | ( | ( | ||||||||||||||||||
Change in current discount rate - reserve for future policy benefits (2) | ( | |||||||||||||||||||
| Change in non-performance risk on market risk benefits | ( | ( | ||||||||||||||||||
| Change in unrealized gains (losses) - other | ( | |||||||||||||||||||
| Change in deferred tax asset | ||||||||||||||||||||
| Other comprehensive income (loss) before reclassifications | ( | ( | ||||||||||||||||||
| Reclassifications from AOCI, net of tax | ( | ( | ||||||||||||||||||
| Other comprehensive income (loss) | ( | ( | ||||||||||||||||||
Balance, end of period (1) | $ | ( | $ | ( | $ | |||||||||||||||
(1)Includes $(1,612 ) million, $(2,106 ) million and $287 million related to the investments held within the funds withheld account related to the Athene Reinsurance Transaction as of December 31, 2023, 2022 and 2021, respectively.
(2)Represents the impact of changes in the discount rate used in the remeasurement of our direct reserves for future policy benefits and claims payable, net of the remeasurement of ceded reserves for future policy benefits and claims payable.
The following table represents amounts reclassified out of AOCI (in millions):
| AOCI Components | Amounts Reclassified from AOCI | Affected Line Item in the Consolidated Income Statement | |||||||||||||||||||||
| Years Ended December 31, | |||||||||||||||||||||||
| 2023 | 2022 | 2021 | |||||||||||||||||||||
| Net unrealized investment gain (loss): | |||||||||||||||||||||||
| Net realized gain (loss) on investments | $ | $ | ( | $ | ( | Net gains (losses) on derivatives and investments | |||||||||||||||||
| Other impaired securities | ( | ( | Net gains (losses) on derivatives and investments | ||||||||||||||||||||
| Net unrealized gain (loss) | ( | ( | |||||||||||||||||||||
| Income tax expense (benefit) | ( | ( | |||||||||||||||||||||
| Reclassifications, net of income taxes | $ | $ | ( | $ | ( | ||||||||||||||||||
192
Part II | Item 8. Notes to Consolidated Financial Statements | 24. Equity
24. Equity
Preferred Stock
On March 13, 2023, the Company issued and sold 22,000,000 depositary shares (the “Depositary Shares”), each representing a 1/1,000th fractional interest in a share of the Company’s Fixed-Rate Reset Noncumulative Perpetual Preferred Stock, Series A, $25,000 liquidation preference per share (equivalent to $25 per Depositary Share), with a 5-year dividend rate reset period and noncumulative dividends (the “Series A Preferred Stock”). After underwriting discounts and expenses, we received net proceeds of approximately $533 million.
The Series A Preferred Stock carries i) an initial dividend rate of 8.000 % per annum to but excluding, March 30, 2028; and ii) from, and including, March 30, 2028, during each reset period, at a rate per annum equal to the Five-year U.S. Treasury Rate as of the applicable reset dividend determination date plus 3.728 %. The dividend is payable quarterly in arrears on March 30, June 30, September 30 and December 30, and commenced on June 30, 2023. Dividends on the Series A Preferred Stock are not cumulative. Under the terms of the Series A Preferred Stock, if the Company has not declared and paid, or declared and set aside a sum sufficient for the payment of, dividends on the Series A Preferred Stock for the immediately preceding dividend period (for the avoidance of doubt, there is no preceding dividend period for the initial dividend period), then the Company’s ability to pay dividends or make distributions with respect to its common stock, or to repurchase or otherwise acquire its common stock, is subject to certain restrictions. Similar restrictions would apply in respect of any preferred stock ranking on parity with, or junior to, the Series A Preferred Stock, if any such preferred stock were to be issued by the Company.
We may, at our option, redeem the shares of Series A Preferred Stock (a) in whole but not in part at any time prior to March 30, 2028, (i) within 90 days after the occurrence of a “rating agency event” at a redemption price equal to $25,500 per share (equivalent to $25.50 per Depositary Share), plus an amount equal to any accrued but unpaid dividends to, but excluding, the redemption date, or (ii) within 90 days after the occurrence of a “regulatory capital event,” at a redemption price equal to $25,000 per share (equivalent to $25 per Depositary Share), plus an amount equal to any accrued but unpaid dividends to, but excluding, the redemption date, or (b) in whole or in part, from time to time, on or after March 30, 2028, at a redemption price equal to $25,000 per share (equivalent to $25 per Depositary Share), plus an amount equal to any accrued but unpaid dividends to, but excluding, the redemption date. If we redeem any shares of Series A Preferred Stock, a proportionate number of Depositary Shares will be redeemed. Holders of Depositary Shares have no right to require the redemption or repurchase of the Series A Preferred Stock or the Depositary Shares.
The net proceeds from the sale were used for general corporate purposes, including the repayment of senior notes that matured in November 2023.
The following table presents declaration date, record date, payment date and dividends paid per preferred share of, and per depositary share representing, JFI’s Series A preferred stock:
| Dividends Paid | |||||||||||||||||||||||||||||
| Declaration Date | Record Date | Payment Date | Per Preferred Share | Per Depositary Share | |||||||||||||||||||||||||
| Quarter Ended | |||||||||||||||||||||||||||||
| 06/30/2023 | May 8, 2023 | June 1, 2023 | June 30, 2023 | $ | $ | ||||||||||||||||||||||||
| 09/30/2023 | August 7, 2023 | August 31, 2023 | October 2, 2023 | $ | $ | ||||||||||||||||||||||||
| 12/31/2023 | November 6, 2023 | November 30, 2023 | January 2, 2024 | $ | $ | ||||||||||||||||||||||||
193
Part II | Item 8. Notes to Consolidated Financial Statements | 24. Equity
Common Stock
At the time of the Demerger, the Company had two classes of common stock: Class A Common Stock and Class B Common Stock. Both classes had a par value of $0.01 one vote per share. Each share of Class B Common Stock was entitled to one-tenth of one vote per share. Except for voting rights, the Company’s Class A Common Stock and Class B Common Stock had the same dividend rights, were equal in all other respects, and were otherwise treated as if they were one class of shares. On June 9, 2022, our shareholders approved the Third Amended and Restated Certificate of Incorporation, which amended and restated the Second Amended and Restated Certificate of Incorporation to eliminate the Class B Common Stock. At December 31, 2023 and 2022, the Company was authorized to issue up to 1
Share Repurchase Program
On November 8, 2021, our Board of Directors authorized a share repurchase program of our Class A Common Stock of $300 million. On February 28, 2022, our Board of Directors authorized an increase of $300 million in our existing authorization to repurchase shares of our outstanding Class A Common Stock as part of the Company's share repurchase program.
On February 27, 2023, our Board of Directors authorized an increase of $450 million in our existing authorization to repurchase shares of our outstanding common stock as part of the Company's share repurchase program. As of February 20, 2024, the Company had remaining authorization to purchase $237 million of its common shares. The Company expects to repurchase shares from time to time in the open market or in privately negotiated transactions. The timing, form and amount of the share repurchases under the program are at the discretion of management and will depend on a variety of factors, including funds available at the parent company, other potential uses for such funds, market conditions, the Company's capital position, legal requirements and other factors. The repurchase program may be modified, extended or terminated by the Board at any time. It does not have an expiration date. There can be no assurance that we will continue share repurchases or approve any increase to, or approve any new, stock repurchase program, or as to the amount of any repurchases made pursuant to such programs.
The Inflation Reduction Act of 2022 creates a 1% excise tax on net stock buybacks of publicly-traded U.S. corporations. Starting in 2023, such excise tax generally applies if a company repurchases in excess of $1 million of its stock in any given calendar year. The impact of this provision depends on the extent to which net share repurchases are made. Any excise tax incurred on corporate stock repurchases will generally be recognized as part of the cost basis of the treasury stock acquired and not reported as income tax expense. Through December 31, 2023, we have not incurred any excise tax as stock issuances (including preferred stock) were greater than stock repurchases.
The following table represents share repurchase activities as part of this share repurchase program:
| Period | Number of Shares Repurchased | Total Payments (in millions) | Average Price Paid Per Share | ||||||||||||||
| 2022 (January 1 - March 31) | $ | $ | |||||||||||||||
| 2022 (April 1 - June 30) | |||||||||||||||||
| 2022 (July 1 - September 30) | |||||||||||||||||
| 2022 (October 1 - December 31) | |||||||||||||||||
| Total 2022 | $ | $ | |||||||||||||||
| 2023 (January 1- March 31) | |||||||||||||||||
| 2023 (April 1- June 30) | |||||||||||||||||
| 2023 (July 1- September 30) | |||||||||||||||||
| 2023 (October 1- December 31) | |||||||||||||||||
| Total 2023 | $ | $ | |||||||||||||||
| 2024 (January 1 - February 20) | $ | $ | |||||||||||||||
194
Part II | Item 8. Notes to Consolidated Financial Statements | 24. Equity
The following table represents changes in the balance of common stock outstanding:
| Common Stock | Treasury Stock | Total Common Stock Outstanding | |||||||||||||||
| Shares at December 31, 2021 | ( | ||||||||||||||||
| Share-based compensation programs | (1) | ||||||||||||||||
| Shares repurchased under repurchase program | ( | ( | |||||||||||||||
| Shares at December 31, 2022 | ( | ||||||||||||||||
| Share-based compensation programs | (1) | ||||||||||||||||
| Shares repurchased under repurchase program | ( | ( | |||||||||||||||
| Shares at December 31, 2023 | ( | ||||||||||||||||
(1) Represents net shares issued from treasury stock pursuant to the Company’s share-based compensation programs.
Dividends to Common Shareholders
Any declaration of cash dividends on common stock will be at the discretion of JFI’s Board of Directors and will depend on our financial condition, earnings, liquidity and capital requirements, regulatory constraints, level of indebtedness, preferred stock, and contractual restrictions with respect to paying cash dividends, restrictions imposed by Delaware law, general business conditions and any other factors that JFI’s Board of Directors deems relevant in making any such determination. Therefore, there can be no assurance that we will pay any cash dividends to holders of our stock or as to the amount of any such cash dividend.
The following table presents declaration date, record date, payment date and dividends paid per share of JFI’s common stock:
| Declaration Date | Record Date | Payment Date | Dividends Paid Per Share | ||||||||||||||||||||
| Quarter Ended | |||||||||||||||||||||||
| 03/31/2023 | February 27, 2023 | March 14, 2023 | March 23, 2023 | $ | |||||||||||||||||||
| 06/30/2023 | May 8, 2023 | June 1, 2023 | June 15, 2023 | $ | |||||||||||||||||||
| 09/30/2023 | August 7, 2023 | August 31, 2023 | September 14, 2023 | $ | |||||||||||||||||||
| 12/31/2023 | November 6, 2023 | November 30, 2023 | December 14, 2023 | $ | |||||||||||||||||||
| Quarter Ended | |||||||||||||||||||||||
| 03/31/2022 | February 28, 2022 | March 14, 2022 | March 23, 2022 | $ | |||||||||||||||||||
| 06/30/2022 | May 9, 2022 | June 2, 2022 | June 16, 2022 | $ | |||||||||||||||||||
| 09/30/2022 | August 8, 2022 | September 1, 2022 | September 15, 2022 | $ | |||||||||||||||||||
| 12/31/2022 | November 7, 2022 | December 1, 2022 | December 15, 2022 | $ | |||||||||||||||||||
| Quarter Ended | |||||||||||||||||||||||
| 12/31/2021 | November 8, 2021 | November 19, 2021 | December 9, 2021 | $ | |||||||||||||||||||
Dividend equivalents are generally accrued on restricted share units and performance share units outstanding as of the record date. Dividend equivalents on restricted share units and performance share units that are ultimately payable in cash are recognized as compensation expense while those that are ultimately payable in shares are recognized as dividends.
25. Earnings Per Share
Basic earnings per share is calculated by dividing net income (loss) attributable to Jackson Financial common shareholders by the weighted-average number of common shares outstanding during the period. Diluted earnings per share is calculated by dividing the net income (loss) attributable to Jackson Financial common shareholders, by the weighted-average number of shares of common stock outstanding for the period, plus shares representing the dilutive effect of share-based awards. Beginning in 2021, the Company granted its first share-based awards subject to vesting provisions of the 2021 Omnibus Incentive Plan, which have a dilutive effect. See Note 18 - Share-Based Compensation of Notes to Consolidated Financial Statements for further information regarding our share-based awards.
195
Part II | Item 8. Notes to Consolidated Financial Statements | 23. Earnings Per Share
The following table sets forth the calculation of earnings per common share (in millions):
| Years Ended December 31, | |||||||||||||||||
| 2023 | 2022 | 2021 | |||||||||||||||
| (in millions, except share and per share data) | |||||||||||||||||
| Net income (loss) attributable to Jackson Financial Inc. | $ | $ | $ | ||||||||||||||
| Less: Preferred stock dividends | |||||||||||||||||
| Net income (loss) attributable to Jackson Financial Inc. common shareholders | $ | $ | $ | ||||||||||||||
| Weighted average shares of common stock outstanding - basic | |||||||||||||||||
| Dilutive common shares | |||||||||||||||||
| Weighted average shares of common stock outstanding - diluted | |||||||||||||||||
| Earnings per share—common stock | |||||||||||||||||
| Basic | $ | $ | $ | ||||||||||||||
| Diluted | $ | $ | $ | ||||||||||||||
26. Subsequent Events
The Company has evaluated subsequent events through February 28, 2024, the date of the filing of the Form 10-K for the year ended December 31, 2023.
Dividends Declared to Shareholders
On February 20, 2024, our Board of Directors approved a first quarter cash dividend on JFI's common stock, $0.70 per share, payable on March 21, 2024, to shareholders of record on March 12, 2024. The Company also declared a cash dividend of $0.50 per depositary share (the "Depositary Shares"), each representing a 1/1,000th interest in a share of Fixed-Rate Reset Noncumulative Perpetual Preferred Stock, Series A. The dividend will be payable on April 1, 2024, to Depositary Shares shareholders of record at the close of business on March 12, 2024.
Brooke Life Reinsurance Company (“Brooke Re”)
196
| Schedule I | ||||||||||||||||||||
| Jackson Financial Inc. | ||||||||||||||||||||
| Summary of Investments—Other Than Investments in Related Parties | ||||||||||||||||||||
| (In millions) | ||||||||||||||||||||
| As of December 31, 2023 | ||||||||||||||||||||
| Amount at | ||||||||||||||||||||
| Which Shown | ||||||||||||||||||||
| Cost or | on Balance | |||||||||||||||||||
| Type of Investment | Amortized Cost | Fair Value | Sheet | |||||||||||||||||
| Debt securities: | ||||||||||||||||||||
| Bonds: | ||||||||||||||||||||
| U.S. government securities | $ | $ | $ | |||||||||||||||||
| Other government securities | ||||||||||||||||||||
| Public utilities | ||||||||||||||||||||
| Corporate securities | ||||||||||||||||||||
| Residential mortgage-backed | ||||||||||||||||||||
| Commercial mortgage-backed | ||||||||||||||||||||
| Other asset-backed securities | ||||||||||||||||||||
| Total debt securities | ||||||||||||||||||||
| Equity securities | ||||||||||||||||||||
| Mortgage loans | N/A | |||||||||||||||||||
| Policy loans | N/A | |||||||||||||||||||
| Derivative instruments | N/A | |||||||||||||||||||
| Other invested assets | N/A | |||||||||||||||||||
| Total investments | $ | $ | ||||||||||||||||||
See the accompanying Report of Independent Registered Public Accounting Firm
197
| Schedule II | ||||||||||||||
| Jackson Financial Inc. | ||||||||||||||
| (Parent Company Only) | ||||||||||||||
| Balance Sheets | ||||||||||||||
| (In millions, except share data) | ||||||||||||||
| December 31, | ||||||||||||||
| 2023 | 2022 | |||||||||||||
| Assets | ||||||||||||||
| Debt securities, available-for-sale | $ | $ | ||||||||||||
| Investment in subsidiaries | ||||||||||||||
| Cash and cash equivalents | ||||||||||||||
| Accrued investment income | ||||||||||||||
| Intercompany receivables | ||||||||||||||
| Deferred income taxes, net | ||||||||||||||
| Other assets | ||||||||||||||
| Total assets | $ | $ | ||||||||||||
| Liabilities and Equity | ||||||||||||||
| Liabilities | ||||||||||||||
Senior Notes due 2023 - unaffiliated (1) (2) | ||||||||||||||
Senior Notes due 2027 - unaffiliated (1) (2) | ||||||||||||||
Senior Notes due 2031 - unaffiliated (1) (2) | ||||||||||||||
Senior Notes due 2032 - unaffiliated (1) (2) | ||||||||||||||
Senior Notes due 2051 - unaffiliated (1) (2) | ||||||||||||||
| Deferred income taxes, net | ||||||||||||||
| Intercompany payables | ||||||||||||||
| Other liabilities | ||||||||||||||
| Total liabilities | ||||||||||||||
| Equity | ||||||||||||||
Series A non-cumulative preferred stock and additional paid in capital, $ | ||||||||||||||
Common stock; | ||||||||||||||
| Additional paid-in capital | ||||||||||||||
Treasury stock, at cost; | ( | ( | ||||||||||||
| Accumulated other comprehensive income (loss) | ( | ( | ||||||||||||
| Retained earnings (deficit) | ||||||||||||||
| Total equity | ||||||||||||||
| Total liabilities and equity | $ | $ | ||||||||||||
(1) See Note 13 - Long-Term Debt to our Consolidated Financial Statements for additional information regarding these borrowings.
(2) Includes unamortized debt issuance costs totaling $15 million and $20 million for the senior notes on a combined basis at December 31, 2023 and 2022, respectively.
(continued)
198
| Schedule II | ||||||||||||||||||||
| Jackson Financial Inc. | ||||||||||||||||||||
| (Parent Company Only) | ||||||||||||||||||||
| Statements of Income | ||||||||||||||||||||
| (In millions) | ||||||||||||||||||||
| For the Years Ended December 31, | ||||||||||||||||||||
| 2023 | 2022 | 2021 | ||||||||||||||||||
| Revenues | ||||||||||||||||||||
| Net investment income | $ | $ | $ | |||||||||||||||||
| Dividends from subsidiaries | ||||||||||||||||||||
| Interest income from subsidiaries | ||||||||||||||||||||
| Other income | ( | |||||||||||||||||||
| Total revenues | ||||||||||||||||||||
| Benefits and Expenses | ||||||||||||||||||||
| Interest expense | ||||||||||||||||||||
| Operating costs and other expenses | ||||||||||||||||||||
| Total benefits and expenses | ||||||||||||||||||||
| Pretax income | ||||||||||||||||||||
| Income tax expense (benefit) | ( | |||||||||||||||||||
| Subsidiary equity earnings (loss) | ||||||||||||||||||||
| Net income (loss) | ||||||||||||||||||||
| Less: Dividends on preferred stock | ||||||||||||||||||||
| Net income (loss) attributable to common shareholders | $ | $ | $ | |||||||||||||||||
(continued)
199
| Schedule II | ||||||||||||||||||||
| Jackson Financial Inc. | ||||||||||||||||||||
| (Parent Company Only) | ||||||||||||||||||||
| Statements of Cash Flows | ||||||||||||||||||||
| (In millions) | ||||||||||||||||||||
| For the Years Ended December 31, | ||||||||||||||||||||
| 2023 | 2022 | 2021 | ||||||||||||||||||
| Cash flows from operating activities: | ||||||||||||||||||||
| Net income | $ | $ | $ | |||||||||||||||||
| Adjustments to reconcile net income to net cash provided by operating activities: | ||||||||||||||||||||
| Subsidiary equity earnings | ( | ( | ( | |||||||||||||||||
| Interest expense | ||||||||||||||||||||
| Amortization of discount and premium on investments | ( | ( | ||||||||||||||||||
| Change in other assets and liabilities, net | ( | ( | ||||||||||||||||||
| Net cash provided by (used in) operating activities | ( | |||||||||||||||||||
| Cash flows from investing activities: | ||||||||||||||||||||
| Sales, maturities and repayments of: | ||||||||||||||||||||
| Debt securities | ||||||||||||||||||||
| Purchases of: | ||||||||||||||||||||
| Debt securities | ( | ( | ||||||||||||||||||
| Other investing activities | ( | |||||||||||||||||||
| Net cash provided by (used in) investing activities | ( | |||||||||||||||||||
| Cash flows from financing activities: | ||||||||||||||||||||
| Proceeds from debt | ||||||||||||||||||||
| Payments on debt | ( | ( | ( | |||||||||||||||||
| Debt issuance costs | ( | ( | ||||||||||||||||||
| Dividends on common stock | ( | ( | ( | |||||||||||||||||
| Dividends on preferred stock | ( | |||||||||||||||||||
| Capital contribution from subsidiary | ||||||||||||||||||||
| Capital distribution to subsidiary | ( | ( | ||||||||||||||||||
| Share based compensation | ||||||||||||||||||||
| Purchase of treasury stock | ( | ( | ( | |||||||||||||||||
| Issuance of preferred stock | ||||||||||||||||||||
| Net cash provided by (used in) financing activities | ( | ( | ||||||||||||||||||
| Net increase (decrease) in cash and cash equivalents | ( | |||||||||||||||||||
| Cash and cash equivalents, beginning of year | ||||||||||||||||||||
| Total cash and cash equivalents, end of year | $ | $ | $ | |||||||||||||||||
| Non-cash financing transactions | ||||||||||||||||||||
| Non-cash dividend equivalents on stock based awards | $ | ( | $ | ( | $ | |||||||||||||||
See the accompanying Report of Independent Registered Public Accounting Firm
200
| Schedule III | ||||||||||||||||||||
| Jackson Financial Inc. | ||||||||||||||||||||
| Supplemental Insurance Information | ||||||||||||||||||||
| (In millions) | ||||||||||||||||||||
| Reserves for | ||||||||||||||||||||
| Deferred | Future Policy | |||||||||||||||||||
| Acquisition | Benefits and | Other Contract | ||||||||||||||||||
| Costs | Claims Payable | Holder Funds | ||||||||||||||||||
| December 31, 2023 | ||||||||||||||||||||
| Retail Annuities | $ | $ | $ | |||||||||||||||||
| Closed Life and Annuity Blocks | ||||||||||||||||||||
| Institutional Products | ||||||||||||||||||||
| Corporate and Other | ||||||||||||||||||||
| Total | $ | $ | $ | |||||||||||||||||
| December 31, 2022 | ||||||||||||||||||||
| Retail Annuities | $ | $ | $ | |||||||||||||||||
| Closed Life and Annuity Blocks | ||||||||||||||||||||
| Institutional Products | ||||||||||||||||||||
| Corporate and Other | ||||||||||||||||||||
| Total | $ | $ | $ | |||||||||||||||||
| December 31, 2021 | ||||||||||||||||||||
| Retail Annuities | $ | $ | $ | |||||||||||||||||
| Closed Life and Annuity Blocks | ||||||||||||||||||||
| Institutional Products | ||||||||||||||||||||
| Corporate and Other | ||||||||||||||||||||
| Total | $ | $ | $ | |||||||||||||||||
(continued)
201
| Schedule III | ||||||||||||||||||||||||||||||||
| Jackson Financial Inc. | ||||||||||||||||||||||||||||||||
| Supplemental Insurance Information | ||||||||||||||||||||||||||||||||
| (In millions) | ||||||||||||||||||||||||||||||||
| Interest Credited | Deferred | |||||||||||||||||||||||||||||||
| on Other | Acquisition and | Operating | ||||||||||||||||||||||||||||||
| Net Investment | Contract Holder | Sales Inducements | Costs and | |||||||||||||||||||||||||||||
| Premium | Income | Funds | Amortization | Other Expenses | ||||||||||||||||||||||||||||
| December 31, 2023 | ||||||||||||||||||||||||||||||||
| Retail Annuities | $ | $ | $ | $ | $ | |||||||||||||||||||||||||||
| Closed Life and Annuity Blocks | ||||||||||||||||||||||||||||||||
| Institutional Products | ||||||||||||||||||||||||||||||||
| Corporate and Other | ||||||||||||||||||||||||||||||||
| Segment subtotal | ||||||||||||||||||||||||||||||||
Non-operating items (1) | ( | |||||||||||||||||||||||||||||||
| Total | $ | $ | $ | $ | $ | |||||||||||||||||||||||||||
| December 31, 2022 | ||||||||||||||||||||||||||||||||
| Retail Annuities | $ | $ | $ | $ | $ | |||||||||||||||||||||||||||
| Closed Life and Annuity Blocks | ||||||||||||||||||||||||||||||||
| Institutional Products | ||||||||||||||||||||||||||||||||
| Corporate and Other | ||||||||||||||||||||||||||||||||
| Segment subtotal | ||||||||||||||||||||||||||||||||
Non-operating items (1) | ( | |||||||||||||||||||||||||||||||
| Total | $ | $ | $ | $ | $ | |||||||||||||||||||||||||||
| December 31, 2021 | ||||||||||||||||||||||||||||||||
| Retail Annuities | $ | $ | $ | $ | $ | |||||||||||||||||||||||||||
| Closed Life and Annuity Blocks | ||||||||||||||||||||||||||||||||
| Institutional Products | ||||||||||||||||||||||||||||||||
| Corporate and Other | ||||||||||||||||||||||||||||||||
| Segment subtotal | ||||||||||||||||||||||||||||||||
Non-operating items (1) | ( | |||||||||||||||||||||||||||||||
| Total | $ | $ | $ | $ | $ | |||||||||||||||||||||||||||
See the accompanying Report of Independent Registered Public Accounting Firm
202
| Schedule IV | |||||||||||||||||||||||||||||
| Jackson Financial Inc. | |||||||||||||||||||||||||||||
| Reinsurance | |||||||||||||||||||||||||||||
| For the Years Ended December 31, 2023, 2022, and 2021 | |||||||||||||||||||||||||||||
| (In millions) | |||||||||||||||||||||||||||||
| % Amount | |||||||||||||||||||||||||||||
| Assumed to | |||||||||||||||||||||||||||||
| Gross Amount | Ceded | Assumed | Net Amount | Net | |||||||||||||||||||||||||
| December 31, 2023 | |||||||||||||||||||||||||||||
| Life insurance in-force | $ | $ | $ | $ | % | ||||||||||||||||||||||||
| Insurance premium | |||||||||||||||||||||||||||||
| Life insurance | $ | $ | $ | $ | % | ||||||||||||||||||||||||
| Accident and health | |||||||||||||||||||||||||||||
| Payout annuity | |||||||||||||||||||||||||||||
| Annuity guaranteed benefits | ( | ||||||||||||||||||||||||||||
| Total insurance premium | $ | $ | $ | $ | % | ||||||||||||||||||||||||
| December 31, 2022 | |||||||||||||||||||||||||||||
| Life insurance in-force | $ | $ | $ | $ | % | ||||||||||||||||||||||||
| Insurance premium | |||||||||||||||||||||||||||||
| Life insurance | $ | $ | $ | $ | % | ||||||||||||||||||||||||
| Accident and health | |||||||||||||||||||||||||||||
| Payout annuity | |||||||||||||||||||||||||||||
| Annuity guaranteed benefits | ( | ||||||||||||||||||||||||||||
| Total insurance premium | $ | $ | $ | $ | % | ||||||||||||||||||||||||
| December 31, 2021 | |||||||||||||||||||||||||||||
| Life insurance in-force | $ | $ | $ | $ | % | ||||||||||||||||||||||||
| Insurance premium | |||||||||||||||||||||||||||||
| Life insurance | $ | $ | $ | $ | % | ||||||||||||||||||||||||
| Accident and health | |||||||||||||||||||||||||||||
| Payout annuity | |||||||||||||||||||||||||||||
| Annuity guaranteed benefits | ( | ||||||||||||||||||||||||||||
| Total insurance premium | $ | $ | $ | $ | % | ||||||||||||||||||||||||
See the accompanying Report of Independent Registered Public Accounting Firm
203
| Schedule V | ||||||||||||||||||||||||||
| Jackson Financial Inc. | ||||||||||||||||||||||||||
| Valuation and Qualifying Accounts | ||||||||||||||||||||||||||
| For the Years Ended December 31, 2023 and 2022 | ||||||||||||||||||||||||||
| (In millions) | ||||||||||||||||||||||||||
| Balance at | Charged to | |||||||||||||||||||||||||
| Beginning | Costs and | Balance at | ||||||||||||||||||||||||
| of Period | Expenses | Deductions | End of Period | |||||||||||||||||||||||
| December 31, 2023 | ||||||||||||||||||||||||||
| Allowance for credit losses on debt securities | $ | $ | $ | ( | (1) | $ | ||||||||||||||||||||
| Allowances for credit losses on mortgage and other loans | ( | (2) | ||||||||||||||||||||||||
| Allowance for credit losses on reinsurance recoverable | ||||||||||||||||||||||||||
| Valuation allowance on deferred tax asset | ( | (3) | ||||||||||||||||||||||||
| $ | $ | $ | ( | $ | ||||||||||||||||||||||
| December 31, 2022 | ||||||||||||||||||||||||||
| Allowance for credit losses on debt securities | $ | $ | $ | ( | (1) | $ | ||||||||||||||||||||
| Allowances for credit losses on mortgage and other loans | (2) | |||||||||||||||||||||||||
| Allowance for credit losses on reinsurance recoverable | ||||||||||||||||||||||||||
| Valuation allowance on deferred tax asset | (3) | |||||||||||||||||||||||||
| $ | $ | $ | ( | $ | ||||||||||||||||||||||
(1) Represents reductions for securities disposed.
(2) Represents provision (release) of allowance for write-offs.
See the accompanying Report of Independent Registered Public Accounting Firm
204
Part II Item 9. Changes in and Disagreements with Accountants on Accounting and Financial Disclosure
Item 9. Changes in and Disagreements with Accountants on Accounting and Financial Disclosure
None.
Item 9A. Controls and Procedures
Evaluation of Disclosure Controls and Procedures
We maintain disclosure controls and procedures, which are designed to ensure that information required to be disclosed in the reports we file or submit under the Securities Exchange Act of 1934, as amended (the “Exchange Act”), is recorded, processed, summarized and reported within the time periods specified in the Securities and Exchange Commission’s rules and forms, and that such information is accumulated and communicated to the Company’s management, including our Chief Executive Officer and Chief Financial Officer, as appropriate to allow timely decisions regarding required disclosure. During the period covered by this Report, we, under the supervision and with the participation of our Chief Executive Officer and Chief Financial Officer, conducted an evaluation of the effectiveness of our disclosure controls and procedures (as defined in Rule 13a-15(e) under the Exchange Act).
We describe in Item 9A. Controls and Procedures in the Company's Annual Report on Form 10-K for the year ended December 31, 2022, the background of an identified material weakness relating to ineffective risk assessment of a process
level control used to determine our nonperformance risk adjustment in developing the discount rate used to estimate the fair
value of some of the guarantee features of our variable annuity products. Due to this material weakness in our disclosure controls and procedures and internal control over financial reporting, our Chief Executive Officer and Chief Financial Officer concluded that the Company’s disclosure controls and procedures were not effective as of December 31, 2022.
As a result of the material weakness, our management identified the need for additional evidence supporting the review and challenge of inputs and results as well as enhancements to the governance process in developing the discount rate used to estimate the fair value of some of our guarantee features. Our management has implemented new controls and enhanced certain existing controls to remediate the material weakness. Management has evaluated the effectiveness of these new and enhanced controls and has concluded that these controls are operating effectively such that the material weakness is fully remediated as of December 31, 2023.
Management’s Report on Internal Control Over Financial Reporting
Management of Jackson Financial Inc. (“Jackson Financial”) along with its subsidiaries (collectively, the “Company”) is responsible for establishing and maintaining adequate internal control over financial reporting (as defined in Rules 13a-15(f) and 15d-15(f) of the Exchange Act). The Company’s internal control over financial reporting is a process, under the supervision of the Company’s Chief Executive Officer and Chief Financial Officer, designed to provide reasonable assurance regarding the reliability of financial reporting and the preparation of the Company’s financial statements for external purposes in accordance with U.S. GAAP.
Because of its inherent limitations, internal control over financial reporting may not prevent or detect misstatements. Also, projections of any evaluation of effectiveness to future periods are subject to the risk that controls may become inadequate because of changes in conditions, or that the degree of compliance with the policies or procedures may deteriorate.
The Company’s management, under the oversight of Jackson Financial's Audit Committee, conducted an assessment of the effectiveness of our internal control over financial reporting as of December 31, 2023, based on the criteria established in the Internal Control – Integrated Framework (2013) issued by the Committee of Sponsoring Organizations of the Treadway Commission ("COSO"). Based on our assessment under that framework, the Company’s management has concluded that our internal control over financial reporting was effective as of December 31, 2023.
The effectiveness of the Company’s internal control over financial reporting as of December 31, 2023 has been audited by
KPMG LLP, an independent registered public accounting firm, as stated in their “Report of Independent Registered Public
Accounting Firm” included in Item 8, Financial Statements and Supplementary Data.
205
Part II Item 9A. Controls and Procedures
Changes in Internal Control Over Financial Reporting
As described above, the Company took steps to remediate the prior material weakness in its internal control over financial reporting. Other than the changes to remediate the prior identified material weakness, there was no change in our internal control over financial reporting (as defined in Rule 13a-15(f) under the Exchange Act) that occurred during the quarter ended December 31, 2023, that has materially affected, or is reasonably likely to materially affect, our internal control over financial reporting.
Item 9B. Other Information
None.
Item 9C. Disclosure Regarding Foreign Jurisdictions that Prevent Inspections
Not applicable.
Part III
Item 10. Directors, Executive Officers and Corporate Governance
All information required by Items 10, 11, 12 (including equity compensation plan information), 13 and 14 of this Form 10-K is incorporated by reference from the definitive proxy statement for the Company's 2024 Annual Meeting of Shareholders, which will be filed with the SEC not later than 120 days after the close of the fiscal year pursuant to Regulation 14A; provided that the information contained in the definitive proxy statement under the headings “Compensation Discussion and Analysis – Report of the Compensation Committee” and “Pay vs. Performance” shall not be deemed “filed” by virtue of this incorporation by reference. Information about our Executive Officers is also located in Item 1. Business of this Form 10-K.
Item 11. Executive Compensation
See Item 10 above.
Item 12. Security Ownership of Certain Beneficial Owners and Management and Related Shareholder Matters
See Item 10 above.
Item 13. Certain Relationships and Related Transactions, and Director Independence
See Item 10 above.
Item 14. Principal Accountant Fees and Services
See Item 10 above.
206
Part IV Item 15. Exhibits, Financial Statement Schedules
Part IV
Item 15. Exhibits, Financial Statement Schedules
The following documents are filed as exhibits hereto:
| Number | Description | ||||
| 2.1 | |||||
| 3.1 | |||||
| 3.2 | |||||
| 3.3 | |||||
| 4.1 | |||||
| 4.2 | |||||
| 4.3 | |||||
| 4.4 | |||||
| 4.5 | |||||
| 4.6 | |||||
| 4.7* | |||||
| 4.8 | |||||
207
Part IV Item 15. Exhibits, Financial Statement Schedules
| 4.9 | |||||
| 10.1 | |||||
| 10.2 | |||||
| 10.3 | |||||
| 10.4 | |||||
| 10.5 | |||||
| 10.6† | |||||
| 10.7 | |||||
| 10.8† | |||||
| 10.9† | |||||
| 10.10† | |||||
| 10.11† | |||||
| 10.12† | |||||
| 10.13† | |||||
208
Part IV Item 15. Exhibits, Financial Statement Schedules
| 10.14† | |||||
| 10.15† | |||||
| 10.16† | |||||
| 10.17† | |||||
| 10.18† | |||||
| 10.19† | |||||
| 10.20† | |||||
| 10.21† | |||||
| 10.22† | |||||
| 10.23† | |||||
209
Part IV Item 15. Exhibits, Financial Statement Schedules
| 10.24† | |||||
| 10.25† | |||||
| 10.26† | |||||
| 10.27† | |||||
| 10.28† | |||||
| 10.29† | |||||
| 10.30† | |||||
| 10.31† | |||||
| 10.32† | |||||
| 10.33† | |||||
| 10.34† | |||||
210
Part IV Item 15. Exhibits, Financial Statement Schedules
| 10.35† | |||||
21.1* | |||||
| 23.1* | |||||
| 31.1* | |||||
| 31.2* | |||||
| 32.1* | |||||
| 32.2* | |||||
| 97.1* | |||||
| 101.INS* | Inline XBRL Instance Document – The instance document does not appear in the interactive data file because its XBRL tags are embedded within the Inline XBRL document | ||||
| 101.SCH* | Inline XBRL Taxonomy Extension Schema Document | ||||
| 101.CAL* | Inline XBRL Taxonomy Extension Calculation Linkbase Document | ||||
| 101.LAB* | Inline XBRL Taxonomy Extension Label Linkbase Document | ||||
| 101.PRE* | Inline XBRL Taxonomy Extension Presentation Linkbase Document | ||||
| 101.DEF* | Inline XBRL Taxonomy Extension Definition Linkbase Document | ||||
104* | Cover Page Interactive Data File (formatted as Inline XBRL and contained in Exhibit 101). | ||||
* Filed herewith.
† Identifies each management contract or compensatory plan or arrangement.
Item 16. Form 10-K Summary
None.
211
SIGNATURES
Pursuant to the requirements of Section 13 or 15(d) of the Securities Exchange Act of 1934, as amended, the Registrant has duly caused this Annual Report on Form 10-K to be signed on its behalf by the undersigned, thereunto duly authorized.
| JACKSON FINANCIAL INC. | |||||||||||
| (Registrant) | |||||||||||
Date: February 28, 2024 | By: | /s/ Laura L. Prieskorn | |||||||||
| Laura L. Prieskorn | |||||||||||
President and Chief Executive Officer | |||||||||||
KNOW ALL PERSONS BY THESE PRESENTS, that each person whose signature appears below constitutes and appoints Laura L. Prieskorn and Marcia Wadsten, and each of them severally, his or her true and lawful attorney-in-fact, with full power of substitution and resubstitution, to sign in his or her name, place and stead, in any and all capacities, to do any and all things and execute any and all instruments that such attorney may deem necessary or advisable under the Securities Exchange Act of 1934, as amended, and any rules, regulations and requirements of the U.S. Securities and Exchange Commission in connection with this Annual Report on Form 10-K and any and all amendments hereto, as fully for all intents and purposes as he or she might or could do in person, and hereby ratifies and confirms all said attorneys-in-fact and agents, each acting alone, and his or her substitute or substitutes, may lawfully do or cause to be done by virtue hereof. Pursuant to the requirements of the Securities Exchange Act of 1934, as amended, this Annual Report on Form 10-K has been signed below by the following persons on behalf of the Registrant and in the capacities indicated on the 28th of February, 2024.
212
| Signature | Title | |||||||
| /s/ Steven A. Kandarian | Chairman of the Board; Director | |||||||
| Steven A. Kandarian | ||||||||
| /s/ Laura L. Prieskorn | President and Chief Executive Officer; Director | |||||||
| Laura L. Prieskorn | ||||||||
| /s/ Marcia Wadsten | Executive Vice President and Chief Financial Officer (Principal Financial Officer) | |||||||
| Marcia Wadsten | ||||||||
| /s/ Don W. Cummings | Senior Vice President, Controller and Chief Accounting Officer (Principal Accounting Officer) | |||||||
| Don W. Cummings | ||||||||
| /s/ Gregory T. Durant | Director | |||||||
| Gregory T. Durant | ||||||||
| /s/ Lily Fu Claffee | Director | |||||||
| Lily Fu Claffee | ||||||||
| /s/ Derek G. Kirkland | Director | |||||||
| Derek G. Kirkland | ||||||||
| /s/ Drew Lawton | Director | |||||||
| Drew Lawton | ||||||||
| /s/ Martin J. Lippert | Director | |||||||
| Martin J. Lippert | ||||||||
| /s/ Russell G. Noles | Director | |||||||
| Russell G. Noles | ||||||||
| /s/ Esta E. Stecher | Director | |||||||
| Esta E. Stecher | ||||||||
213