UNITED STATES
SECURITIES AND EXCHANGE COMMISSION
Washington, D.C. 20549
FORM 10-K
(Mark One)
| ANNUAL REPORT PURSUANT TO SECTION 13 OR 15(d) OF THE SECURITIES EXCHANGE ACT OF 1934 | |||||
For the fiscal year ended December 31 , 2023
OR
TRANSITION REPORT PURSUANT TO SECTION 13 OR 15(d) OF THE SECURITIES EXCHANGE ACT OF 1934 FOR THE TRANSITION PERIOD FROM TO | |||||
Commission File Number 001-40246
(Exact Name of Registrant as Specified in Its Charter)
(State or Other Jurisdiction of Incorporation or Organization) | (I.R.S. Employer Identification No.) | |||||||
(Address of Principal Executive Offices) | (Zip Code) | |||||||
Registrant’s telephone number, including area code: ( Securities registered pursuant to Section 12(b) of the Act: | ||||||||
| Title of Each Class | Trading Symbol | Name of Exchange on Which Registered | ||||||
Securities registered pursuant to Section 12(g) of the Act: None
Indicate by check mark if the Registrant is a well-known seasoned issuer, as defined in Rule 405 of the Securities Act. Yes ☐ No ☒
Indicate by check mark if the Registrant is not required to file reports pursuant to Section 13 or 15(d) of the Act. Yes ☐ No ☒
Indicate by check mark whether the Registrant: (1) has filed all reports required to be filed by Section 13 or 15(d) of the Securities Exchange Act of 1934 during the preceding 12 months (or for such shorter period that the Registrant was required to file such reports), and (2) has been subject to such filing requirements for the past 90 days. Yes ☒ No ☐
Indicate by check mark whether the registrant has submitted electronically every Interactive Data File required to be submitted pursuant to Rule 405 of Regulation S-T (§232.405 of this chapter) during the preceding 12 months (or for such shorter period that the registrant was required to submit such files). Yes ☒ No ☐
Indicate by check mark whether the Registrant is a large accelerated filer, an accelerated filer, a non-accelerated filer, smaller reporting company, or an emerging growth company. See the definition of “large accelerated filer,” “accelerated filer,” “smaller reporting company,” and “emerging growth company” in Rule 12b-2 of the Exchange Act.
| ☒ | Accelerated filer | ☐ | ||||||||||||
| Non-accelerated filer | ☐ | Smaller reporting company | ||||||||||||
| Emerging growth company | ||||||||||||||
If an emerging growth company, indicate by check mark if the registrant has elected not to use the extended transition period for complying with any new or revised financial accounting standards provided pursuant to Section 13(a) of the Exchange Act. ☐
Indicate by check mark whether the registrant has filed a report on and attestation to its management’s assessment of the effectiveness of its internal control over financial reporting under Section 404(b) of the Sarbanes-Oxley Act (15 U.S.C. 7262(b)) by the registered public accounting firm that prepared or issued its audit report. ☒
If securities are registered pursuant to Section 12(b) of the Act, indicate by check mark whether the financial statements of the registrant included in the filing reflect the correction of an error to previously issued financial statements. ☐
Indicate by check mark whether any of those error corrections are restatements that required a recovery analysis of incentive-based compensation received by any of the registrant’s executive officers during the relevant recovery period pursuant to § 240.10D-1(b). □
Indicate by check mark whether the Registrant is a shell company (as defined in Rule 12b-2 of the Exchange Act). Yes ☐ No ☒
The aggregate market value of the voting and non-voting stock held by non-affiliates of the registrant, as of June 30, 2023, the last business day of the registrant’s recently completed second fiscal quarter, was approximately $692.4 million based upon the closing price reported for such date on the New York Stock Exchange.
As of February 23, 2024, there were 192,311,520 shares of the registrant’s Class A common stock outstanding and 201,319,374 shares of the registrant’s Class B common stock outstanding.
DOCUMENTS INCORPORATED BY REFERENCE
TABLE OF CONTENTS
| Page | ||||||||
| Item 1. | ||||||||
| Item 1A. | ||||||||
| Item 1B. | ||||||||
Item 1C. | ||||||||
| Item 2. | ||||||||
| Item 3. | ||||||||
| Item 4. | ||||||||
| Item 5. | ||||||||
| Item 6. | ||||||||
| Item 7. | ||||||||
| Item 7A. | ||||||||
| Item 8. | ||||||||
| Item 9. | ||||||||
| Item 9A. | ||||||||
| Item 9B. | ||||||||
| Item 9C. | ||||||||
| Item 10. | ||||||||
| Item 11. | ||||||||
| Item 12. | ||||||||
| Item 13. | ||||||||
| Item 14. | ||||||||
| Item 15. | ||||||||
| Item 16. | Item 16. Form 10-K Summary | |||||||
See “Management’s Discussion and Analysis of Financial Condition and Results of Operations” — “Key Business Metrics” and “Non-GAAP Financial Measure” for the definitions of the following terms used in this Annual Report: “WAU,” “ARPU,” and “Adjusted EBITDA.”
1
SPECIAL NOTE REGARDING FORWARD-LOOKING STATEMENTS
This Annual Report on Form 10-K (“Annual Report”) contains forward-looking statements within the meaning of the federal securities laws. All statements contained in this Annual Report, other than statements of historical fact, including statements regarding our or our management team’s expectations, hopes, beliefs, intentions, strategies, future operating results and financial position, potential growth or growth prospects, are forward-looking statements. Words such as “believes,” “may,” “will,” “estimates,” “potential,” “continues,” “anticipates,” “intends,” “expects,” “could,” “would,” “projects,” “plans,” “targets,” and variations of such words and similar expressions are intended to identify forward-looking statements. Forward-looking statements in this Annual Report may include, for example, statements about:
•our anticipated growth, including our ability to scale new neighbor growth, our ability to grow engagement by our existing neighbor base and our ability to increase monetization of our platform;
•our ability to scale our business and monetization efforts;
•the political, economic, and macroeconomic climate, whether in the advertising industry in general, or among specific types of advertisers or within particular geographies, including but not limited to the impacts related to actual or perceived instability in the global banking system, labor shortages, supply chain disruptions, a potential recession, uncertainty with respect to the federal budget and debt ceiling and a potential temporary federal government shutdown related thereto, inflation, and changing interest rates;
•our ability to expand our business operations abroad by opening new and expanding within existing neighborhoods outside of the United States;
•our ability to respond to general economic conditions;
•our ability to invest in, and the ultimate success of, technologies aimed at enhancing our business solutions and delivering additional value to customers on our platform;
•our ability to scale our business effectively;
•our ability to achieve and maintain profitability in the future;
•our ability to access sources of capital to finance operations and growth;
•the success of strategic relationships with third parties;
•our ability to maintain the listing of our Class A common stock on the New York Stock Exchange;
•changes in applicable laws or regulations, both within and outside of the United States;
•the impact of the regulatory environment and complexities with compliance related to such environment;
•the inability to develop and maintain effective internal controls;
•the impact on our business as a result of interruptions, delays, or failures resulting from earthquakes, fires, floods, adverse weather conditions, other natural disasters, power loss, terrorism, pandemics, geopolitical conflict (including the war in Ukraine and the Israel-Hamas war), other physical security threats, cyber-attacks, or other catastrophic events;
•our ability to raise financing in the future;
•our success in retaining or recruiting, or changes required in, our officers, key employees or directors;
•our financial performance; and
•other factors detailed in Part I, Item 1A, “Risk Factors” in this Annual Report.
2
We have based these forward-looking statements largely on our current expectations and projections as of the date of this filing about future events and trends that we believe may affect our financial condition, results of operations, business strategy, short-term and long-term business operations and objectives, and financial needs. These forward-looking statements are subject to a number of risks, uncertainties and assumptions, including those described in Part I, Item 1A, “Risk Factors” in this Annual Report. Readers are urged to carefully review and consider the various disclosures made in this Annual Report and in other documents we file from time to time with the Securities and Exchange Commission (the “SEC”) that disclose risks and uncertainties that may affect our business. Moreover, we operate in a very competitive and rapidly changing environment. New risks emerge from time to time. It is not possible for us to predict all risks, nor can we assess the impact of all factors on our business or the extent to which any factor, or combination of factors, may cause actual results to differ materially from those contained in any forward-looking statements we may make. In light of these risks, uncertainties, and assumptions, the future events and circumstances discussed in this Annual Report may not occur and actual results could differ materially and adversely from those anticipated or implied in the forward-looking statements.
You should not rely upon forward-looking statements as predictions of future events. The events and circumstances reflected in the forward-looking statements may not be achieved or occur. Although we believe that the expectations reflected in the forward-looking statements are reasonable, we cannot guarantee future results, performance, or achievements. In addition, the forward-looking statements in this Annual Report are made as of the date of this filing, and we do not undertake, and expressly disclaim any duty, to update such statements for any reason after the date of this Annual Report or to conform statements to actual results or revised expectations, except as required by law.
You should read this Annual Report and the documents that we reference herein and have filed with the SEC as exhibits to this Annual Report with the understanding that our actual future results, performance, and events and circumstances may be materially different from what we expect.
As used in this Annual Report, the terms “Nextdoor,” “we,” “us,” and “our” mean Nextdoor Holdings, Inc. and its subsidiaries unless the context indicates otherwise.
3
RISK FACTOR SUMMARY
Our business is subject to numerous risks and uncertainties, including those described in Part I, Item 1A, “Risk Factors” in this Annual Report. You should carefully consider these risks and uncertainties when investing in our Class A common stock. Some of the principal risks and uncertainties include the following:
•We have a limited operating history at the current scale of our business and are still scaling up our monetization efforts, which makes it difficult to evaluate our current business and future prospects, and there is no assurance we will be able to scale our business for future growth.
•Adverse global economic and financial conditions could harm our business and financial condition.
•We currently generate substantially all of our revenue from advertising. If advertisers reduce or eliminate their spending with us, our business, operating results, and financial condition would be adversely impacted.
•Our business is highly competitive. Competition presents an ongoing threat to the success of our business.
•Our business is dependent on our ability to maintain and scale our product offerings and technical infrastructure, and any significant disruption in the availability of our platform could damage our reputation, result in a potential loss of neighbors and engagement, and adversely affect our business, operating results, and financial condition.
•If we fail to scale our business effectively, our business, operating results, and financial condition would be adversely affected.
•If our efforts to build strong brand identity and reputation are not successful, we may not be able to attract or retain neighbors, and our business, operating results, and financial condition will be adversely affected.
•We plan to continue expanding our international operations where we have limited operating experience and may be subject to increased business, regulatory, and economic risks that could seriously harm our business, operating results, and financial condition.
•If we need additional capital in the future, it may not be available on favorable terms, if at all.
•Our business depends largely on our ability to attract, retain and assimilate talented employees, including senior management. If we lose the services of or fail to successfully assimilate highly skilled personnel, key employees or members of our senior management team, we may not be able to execute on our business strategy.
•We are dependent on third-party software and service providers, including the Google Ad Manager (“GAM”) platform, for management and delivery of advertisements on the Nextdoor platform. Any failure or interruption experienced by such third-parties could result in the inability of certain businesses to advertise on our platform, and adversely impact our business, operating results, and financial condition.
•We rely on third-party software and service providers, including Amazon Web Services (“AWS”), to provide systems, storage and services for our platform. Any failure or interruption experienced by such third parties could result in the inability of neighbors and advertisers to access or utilize our platform, and adversely impact our business, operating results, and financial condition.
•Technologies have been developed that can block the display of advertisements on the Nextdoor platform, which could adversely impact our business, operating results, and financial condition.
•Security breaches, including improper access to or disclosure of our data or our neighbors’ data, or other hacking and phishing attacks on our or third-party systems, could harm our reputation and adversely affect our business.
•Distribution and marketing of, and access to, our platform depends, in significant part, on a variety of third-party publishers and platforms (including mobile app stores, third-party payment providers, computer systems, and other communication systems and service providers). If these third parties limit, prohibit or otherwise interfere with or change the terms of the distribution, use or marketing of our platform in any material way, it could materially adversely affect our business, operating results, and financial condition.
•Certain of our market opportunities and key metric estimates could prove to be inaccurate, and any real or perceived inaccuracies may harm our reputation and negatively affect our business.
4
•We have a history of net losses and may experience net losses in the future and we cannot assure you that we will achieve or sustain profitability. If we cannot achieve and sustain profitability, our business, financial condition, and operating results will be adversely affected.
•We may have greater than anticipated tax liabilities, which could harm our business, revenue and financial results.
•We cannot guarantee that our Share Repurchase Program will be fully consummated or that it will enhance long-term stockholder value. Share repurchases could also increase the volatility of the trading price of our stock and diminish our cash reserves.
•We may be liable as a result of content or information that is published or made available on our platform.
•Our business is subject to complex and evolving U.S. and foreign laws, regulations, and industry standards, many of which are subject to change and uncertain interpretations, which uncertainty could harm our business, operating results, and financial conditions.
•We could be involved in legal disputes that are expensive and time consuming, and, if resolved adversely, could harm our business, operating results, and financial condition.
•Failure to maintain effective systems of internal controls and disclosure controls could have a material adverse effect on our business, operating results, and financial condition.
•If we are unable to protect our intellectual property, the value of our brands and other intangible assets may be diminished, and our business, operating results, and financial condition may be adversely affected.
•Third parties may claim that our platform infringes their intellectual property rights and this may create liability for us or otherwise adversely affect our business, operating results, and financial condition.
•Our use of “open source” software could subject us to possible litigation or could prevent us from offering products that include open source software or require us to obtain licenses on unfavorable terms.
•We license technology from third parties, and our inability to maintain those licenses could harm our business.
•The price of our Class A common stock has been and may continue to be volatile.
•The dual class structure of our common stock may adversely affect the trading market for our Class A common stock.
•The dual class structure of our common stock has the effect of concentrating voting power with our management and other existing stockholders, which will limit your ability to influence the outcome of important transactions, including a change in control.
•We do not intend to pay cash dividends for the foreseeable future.
5
PART I
Item 1. Business
Overview
At Nextdoor, our purpose is to cultivate a kinder world where everyone has a neighborhood they can rely on. Neighbors around the world turn to Nextdoor to receive trusted information, give and get help, get things done, and build real world connections with those nearby — neighbors, businesses, and public services. By fostering these connections, both online and in the real world, Nextdoor builds stronger, more vibrant, and more resilient neighborhoods. As of December 31, 2023, Nextdoor was in more than 325,000 neighborhoods around the world and in 1 in 3 households in the United States. As of the end of the fourth quarter of 2023, Nextdoor had 88 million global Verified Neighbors.1
Our Platform
The Nextdoor platform enables neighbors and organizations to build an engaged community of trusted neighbors, businesses and public services that can be depended on to exchange valuable information, goods, and services.
Neighbors use Nextdoor to engage with and stay up to date on the communities that matter to them. They can find posts, photos, and discussions in the Feed, discover nearby neighbors, Groups, businesses, events, and items through a nativized maps surface in the Discover tab, and search for specific content and organizations through our Search feature.
Nextdoor is a high-utility platform that connects neighbors with organizations and other local resources. Neighbors can discover and interact with local businesses, leave recommendations, and follow their Faves on the platform. Neighbors can utilize a truly local marketplace, For Sale & Free, to buy, sell, or give away items, and offer services such as dog walking.
In addition, Nextdoor is where neighbors can receive critical, real-time information from trusted officials. Public agencies, including government entities and service providers, turn to Nextdoor to directly, quickly, and easily reach neighbors in their community with relevant local information and alerts.
Our unique local data set includes event information, safety reports, recommendations, reviews, and discussions, as well as demographic data, interests, and behaviors of local residents. This detailed data contribute to the formation of the unique local knowledge graph that Nextdoor owns. Businesses on Nextdoor can use our real-time local data to devise advertising strategies and ensure their messages reach the most relevant and receptive audience in their immediate locality. Other artificial intelligence (“AI”) and machine learning (“ML”) applications allow us to improve notifications, drive positive interactions, optimize ad delivery, drive growth of comments and replies, and analyze data.
Our Advertising Solutions
Nextdoor offers advertising solutions designed to generate tangible value for businesses seeking to expand their reach and drive sales with unique local context that allows advertisers of all sizes to reach the right neighbor, at the right time, with the right message.
Our platform enables advertisers to achieve measurable outcomes that help advertisers build brand awareness, drive consideration and engagement, and generate sales. Ads can be leveraged on multiple surfaces on and off the platform, including Feed, Search, For Sale & Free, Right Hand Rail, and email.
We are continually improving and building upon our library of ad formats, including sponsored posts and lead generation, which feature combinations of text (static or dynamic), images (including static and animated), and URL links, and the ways in which advertisers can purchase and deliver ads across our platform.
Ad Auction
Ads on the Nextdoor platform primarily compete via an auction-based system. Our auction system selects the best ad for each available ad impression based on the likelihood of a desired action occurring and how much that action is worth to advertisers. The likelihood of the action occurring depends on a variety of factors, such as ad relevance and creative quality.
Measurement & Targeting
1 Verified Neighbors are individuals who have joined Nextdoor and completed the verification process for their account.
6
Delivering and demonstrating value for our advertisers is a key focus for Nextdoor. We offer a variety of measurement solutions, including a Conversion API, that are mapped to advertisers’ goals and objectives and validate Nextdoor’s performance. Nextdoor offers both brand safety controls as well as brand safety measurement via independent third-party partners.
Utilizing our neighborhood graph, advertisers can effectively target and reach multiple high value audiences, such as homeowners, parents, and recent movers. Nextdoor’s neighborhood graph is built off high quality signals shared directly by our neighbors and partners. These signals are integrated using proprietary machine learning models that undergo continuous refinement and optimization to ensure scalability and accuracy.
Go-to-Market Approach
Nextdoor offers diverse marketing solutions for advertisers depending on size and goals. Our go-to-market approach combines the utilization of our self-service ads platform and support of a dedicated global sales force for managed campaigns. Our sales team is strategically positioned to attract and retain advertisers across all products, and provides support through all stages of the marketing cycle, including campaign planning, optimization, and performance analytics.
A Kind Platform
Nextdoor is a leading innovator in creating a welcoming platform that facilitates healthy neighborhood connections and conversations. We set clear Community Guidelines and use a combination of people, including nearly 200,0002 volunteer community moderators, and technology to encourage kind conversations and promote neighborhood vitality.
From day one, we’ve required neighbors to sign up with their real names and addresses to ensure neighborhoods are made up of real people, nearby, and we have improved on similar verification procedures for businesses. We require all new neighbors to accept our Neighbor Pledge upon joining, in order to introduce our Community Guidelines and provide personal accountability for interactions on the platform. Further, neighbors are alerted when a new neighbor joins so they can reach out with a message of connection and belonging and establish rapport.
As neighbors interact through the platform, we use a combination of human review and machine learning and predictive technology solutions, like our Kindness Reminder and Constructive Conversations Reminder, launched in 2022, to enforce our Community Guidelines, support civility, and cultivate kindness. In 2023, we gave neighbors the ability to use generative AI to help write posts that are more likely to drive positive community engagement, and integrated AI into the Kindness Remainder to suggest more constructive revisions for comments that may violate the Community Guidelines. These developments enable us to better analyze tone and context, and help authors rephrase posts and comments to receive a better response from their community.
We have always believed it is important to incorporate local context into moderation decisions, which is why we have incorporated volunteer community moderators into our moderation program, alongside Nextdoor operations staff. Volunteer community moderators are active neighbors who have access to specialized tools and resources they can utilize as they help enforce our Community Guidelines. While local community moderators review most types of guideline-violating content, reports of certain types of harmful content (e.g., misinformation, discrimination) are handled by Nextdoor operations staff to ensure our standards and policies are applied consistently.
Technology
Our investments in technology are consistently focused on creating and improving products for neighbors and organizations in the countries in which we operate around the world. We have built generative AI features that personalize the distribution of content and make posts more engaging and kind through the use of Post Assistant. We continue to use machine-learning and proprietary technology to power our product strategy of building an engaged community.
We also continue to invest in our proprietary ad platform to expand and improve our advertising solutions for businesses of all sizes. In support of our objectives of delivering advertiser value, reducing advertising effort, and enabling businesses to thrive on Nextdoor, our development roadmap is focused on unifying our self-service offerings, leveraging machine learning and AI technologies to improve ad targeting, and enhancing measurement solutions to better inform our value proposition.
Intellectual Property
Our intellectual property and core technological innovations are integral components of our business. To establish and protect our intellectual property, proprietary rights and brand, we rely on a combination of federal, state, and common-law rights in the United
2 Nextdoor Transparency Report, 2023.
7
States and the rights under the laws of other countries, patents, trademarks, copyrights, domain name, trade secrets, including know-how, license agreements, confidentiality procedures, non-disclosure agreements with third parties, employee disclosure, and invention assignment agreements, and other contractual rights.
We own a trademark portfolio, including registered trademarks and applications in the United States and other countries, for the marks NEXTDOOR,  , and
, and  . We have registered domain names that we use in or relate to our business, such as the <nextdoor.com> domain name and country code top level domain name equivalents. As of December 31, 2023, we had 10 issued patents in the United States. We cannot assure you that any of our patent applications will result in the issuance of a patent or whether the examination process will require us to narrow our claims. Additionally, our current and future patents, trademarks, and other intellectual property or other proprietary rights may be contested, circumvented or found unenforceable or invalid. We may not be able to obtain or maintain sufficient protection for or successfully enforce our intellectual property. We license content, technology, and other intellectual property from our partners, and rely on our license agreements with those partners to use the intellectual property. Third parties may assert claims related to intellectual property rights against our partners or us.
, and . We have registered domain names that we use in or relate to our business, such as the <nextdoor.com> domain name and country code top level domain name equivalents. As of December 31, 2023, we had 10 issued patents in the United States. We cannot assure you that any of our patent applications will result in the issuance of a patent or whether the examination process will require us to narrow our claims. Additionally, our current and future patents, trademarks, and other intellectual property or other proprietary rights may be contested, circumvented or found unenforceable or invalid. We may not be able to obtain or maintain sufficient protection for or successfully enforce our intellectual property. We license content, technology, and other intellectual property from our partners, and rely on our license agreements with those partners to use the intellectual property. Third parties may assert claims related to intellectual property rights against our partners or us.For additional information, please see the section entitled “Risk Factors — Risks Related to Intellectual Property.”
Human Capital
Our Culture and Core Values
Community is at the heart of Nextdoor and our community of employees is our lifeblood. Our employees have a wide range of experiences and perspectives, which fuel our purpose to cultivate a kinder world where everyone has a neighborhood they can rely on.
Our company core values are:
•Earn trust everyday;
•Invest in community;
•Customer obsessed;
•Think big;
•Experiment and learn quickly; and
•Act like an owner.
We live these core values through our approach to our people practices, summarized below.
Employees
As of December 31, 2023, we had 594 employees in the United States and in our international locations in Canada, the United Kingdom, the Netherlands, Ireland, France and Australia.
Diversity, Equity, Inclusion and Belonging
The principles of Diversity, Equity, Inclusion and Belonging (“DEIB”) are woven into the very fabric of our organization and guide how we recruit, retain, and develop our talent.
Our commitment to DEIB begins at the top and is underscored by the importance of making diverse perspectives a business imperative. This is reflected in the racially diverse and gendered-balanced leaders that make up our Board of Directors, management team, and employees, and who all share in our passion for contributing to and effecting change in communities globally.
We thrive on creating a dynamic, inclusive environment that aims to support and value our employees, and contributes to our award-winning company culture. We have active and engaged Employee Resource Groups (“ERG”) that are aligned around dimensions of diversity, such as gender, ethnicity, religion, sexual orientation and other shared attributes, which we believe help foster a sense of community, and a diverse and inclusive workplace. We have equipped our ERG leaders with tools and training to engage in courageous conversations with their communities. This approach is designed to foster space discussions on cultural topics that support the well-being of our employees.
8
We focus our global recruitment efforts on ensuring that teams and hiring managers have the opportunity to consider qualified people from historically excluded groups for open roles. Moreover, we distribute a bi-annual employment engagement survey to measure our employees’ satisfaction at Nextdoor, including employees’ perspectives on our current state of workplace inclusivity.
Learning, Development, and Engagement
We have a dedicated Talent Management and Development team that develops and delivers company-wide people programs and learning and development experiences to help our employees grow in their careers. The programs include performance feedback and promotion cycles and recognition through our “Nextdoor Values Awards”. Our learning and development experiences focus on onboarding new hires as well as offering resources focused on skills development and compliance training.
We are committed to making Nextdoor the best place to work by engaging with, and listening to, our community of employees. We maintain ongoing connection with our team members through regular all hands meetings, our speaker series, and bi-annual engagement surveys.
Compensation, Benefits and Perks
We provide employees with competitive compensation packages that include base salaries, sales commissions for certain employees, and equity awards. Additional benefits programs (which vary by country and region) include a 401(k) Plan with a company match, healthcare, vision, and dental insurance benefits, health savings and flexible spending accounts, flexible paid time off, parental leave, and other benefits tailored to the specific needs of our employees such as family forming, caregiving and mental health resources. We also support and encourage our employees to give back to our communities by giving each employee “Volunteer Time Off” to dedicate to the causes that matter most to them.
Competition
We compete in almost every aspect of our business with companies that provide a variety of internet products, services, content, and online advertising. In addition, aspects of our platform compete with other products and services, including home services, classifieds, real estate, recommendations and search engines. Of these companies, we most directly compete with social media companies that offer local products to advertisers and users, including large companies such as Meta (including through Facebook and Instagram), Alphabet (including through Google), and other companies that provide home services, classifieds, real estate, recommendations, and search engines. We compete with these companies to attract, engage, and retain users and to attract and retain advertisers. As we introduce new products, as our platform evolves, or as other companies introduce new products and services, we may become subject to additional competition in other countries.
While our industry is evolving rapidly and is becoming increasingly competitive, we believe that we compete effectively due to our singular focus on creating and strengthening our neighborhood networks, the size and engagement of our user base, our ability to provide neighbors with trusted information from a uniquely local perspective, our value proposition to advertisers including businesses and public agencies, and our powerful network effects.
Our strengths include a strong value proposition based on real people, real conversations and real achievements; Built-in community: creating instant access for new neighbors and businesses joining the neighborhood; and, Our unique ability to connect neighbors to what matters to them. For our customers key strengths also include real people, as well as a high-intent audience with an action mindset and the ability to target neighborhoods everywhere in the countries we serve. Each of these elements reinforce each other to create a strong competitive moat.
For additional information, see the section entitled “Risk Factors — Our business is highly competitive. Competition presents an ongoing threat to the success of our business.”
Government Regulation
We are subject to many U.S. federal and state and foreign laws, regulations, and industry standards that involve matters central to our business, including laws and regulations that involve data privacy and data protection, intellectual property (including copyright and patent laws), content regulation, rights of publicity, advertising, marketing, health and safety, competition, protection of minors, consumer protection, taxation, anti-bribery, anti-money laundering and corruption, telecommunications, AI and machine learning, and securities. Our business may also be affected by the adoption of any new or existing laws or regulations or changes in laws or regulations that adversely affect the growth, popularity or use of the internet, or that significantly restrict or impose conditions on our ability to collect, store, augment, analyze, use and share data or increase consumer notice or consent requirements before a company can utilize cookies or other tracking technologies or that increase the liability of content platforms like us. These laws and regulations are constantly evolving and may be interpreted, applied, created, or amended, in a manner that could harm our business.
9
We rely on a variety of statutory and common-law frameworks and defenses relevant to the content available on our service, including the Digital Millennium Copyright Act (the “DMCA”), the Communications Decency Act (“CDA”) and the fair-use doctrine in the United States, and the Electronic Commerce Directive in the European Union. However, each of these statutes is subject to uncertain or evolving judicial interpretation and regulatory and legislative amendments. For example, in the United States, laws such as the CDA, which have previously been interpreted to provide substantial protection to interactive computer service providers, have seen recent Supreme Court challenges and there have been legislative efforts to curtail the CDA’s protections. These efforts could expose us to lawsuits in which we could incur significant costs and could seriously harm our business. In addition, various countries around the world have adopted legislation, including the Digital Services Act (the “DSA”) in the European Union, the Online Safety Act in Australia, and the Online Safety Bill in the United Kingdom, that may impose additional obligations or liability on us associated with content uploaded by users to our platform.
We receive, process, store, use, and share data, some of which contains personal information. We are therefore subject to U.S. federal, state, local, and foreign laws and regulations regarding data privacy and the collection, storage, sharing, use, processing, disclosure and protection of personal information and other data from users, employees or business partners, including the European Union’s General Data Protection Regulation (“GDPR”), the United Kingdom’s General Data Protection Regulation (“UK GDPR”), Canada’s Personal Information Protection and Electronic Documents Act, Australia’s The Privacy Act 1988 and Australian Privacy Principles, the California Consumer Privacy Act (“CCPA”), along with similar privacy laws enacted in other U.S. states. There are also a number of legislative proposals recently enacted or pending before the U.S. Congress, various state legislatures and foreign governments concerning content regulation and data protection that could affect us, These and other laws and regulations that may be enacted, or new interpretation of existing laws and regulations, may require us to modify our data processing practices and policies and to incur substantial costs in order to comply.
The costs of complying with these laws and regulations, which in some cases can be enforced by private parties in addition to government entities, are high and likely to increase in the future, particularly as the degree of regulation increases, our business grows and our geographic scope expands. Further, the impact of these laws and regulations may disproportionately affect our business in comparison to our peers in the technology sector that have greater resources. Any failure on our part to comply with these laws and regulations may subject us to significant liabilities or penalties, or otherwise adversely affect our business, financial condition or operating results. Further, it is possible that certain governments may seek to block or limit our products or otherwise impose other restrictions that may affect the accessibility or usability of any or all our products for an extended period of time or indefinitely.
We communicate with lawmakers and regulators in the countries and regions in which we do business. We have a dedicated policy team that monitors legal and regulatory developments and works with policymakers and regulators around the world to help ensure that our perspective is heard in matters of importance to us.
For additional information, see the section entitled “Risk Factors — Risks Related to Legal and Regulatory Matters.”
Corporate Information
We were initially a blank check or special purpose acquisition company called KVSB, incorporated in Delaware on January 29, 2021, formed for the purpose of effecting a merger, capital stock exchange, asset acquisition, stock purchase, reorganization or similar business combination with one or more businesses or entities. On November 5, 2021 (the “Closing Date”), KVSB consummated the transactions contemplated by the Agreement and Plan of Merger, dated July 6, 2021, as amended on September 30, 2021 (the “Merger Agreement”), by and among KVSB, Lorelei Merger Sub Inc., a direct wholly owned subsidiary of KVSB (“Merger Sub”) and Nextdoor, Inc. (“Legacy Nextdoor”), with Legacy Nextdoor surviving as a wholly owned subsidiary of KVSB (the “Merger” and the transactions contemplated thereby, the “Business Combination”). Legacy Nextdoor was incorporated in Delaware on December 4, 2007. Following the consummation of the Business Combination on the Closing Date, KVSB changed its name from Khosla Ventures Acquisition Co. II to Nextdoor Holdings, Inc.
Our principal executive offices are located at 420 Taylor Street, San Francisco, California 94102 and our telephone number is (415) 344-0333. Our website address is https://www.nextdoor.com. The information contained on, or that can be accessed through, our website is not incorporated by reference into, and is not a part of, this Annual Report. Investors should not rely on any such information in deciding whether to purchase our Class A common stock.
Nextdoor, the Nextdoor logo, and other registered or common law trade names, trademarks, or service marks of Nextdoor appearing in this Annual Report are the property of Nextdoor. This Annual Report contains additional trade names, trademarks, and service marks of other companies that are the property of their respective owners. We do not intend our use or display of other companies’ trade names, trademarks, or service marks to imply a relationship with, or endorsement or sponsorship of us by, these other companies. Solely for convenience, our trademarks and tradenames referred to in this Annual Report appear without the ® and ™ symbols, but
10
those references are not intended to indicate, in any way, that we will not assert, to the fullest extent under applicable law, our rights, or the right of the applicable licensor, to these trademarks and tradenames.
Available Information
Our reports filed with or furnished to the SEC pursuant to Sections 13(a) and 15(d) of the Securities Exchange Act of 1934, as amended (the “Exchange Act”), are available, free of charge, on our Investor Relations website at https://investors.nextdoor.com/ as soon as reasonably practicable after we electronically file such material with, or furnish it to, the SEC. The SEC maintains a website at http://www.sec.gov that contains reports, proxy and information statements, and other information regarding us and other companies that file materials with the SEC electronically. Copies of our reports on Form 10-K, Forms 10-Q, and Forms 8-K, and amendments to those reports may also be obtained, free of charge, electronically through our Investor Relations website located at the web address appearing above as soon as reasonably practicable after we file such material with, or furnish it to, the SEC. We use our Investor Relations website as a means of disclosing material information and for complying with our disclosure obligations under Regulation FD. Accordingly, investors should monitor our Investor Relations website, in addition to following our press releases, SEC filings, and public conference calls and webcasts.
The content of our websites and information that we may post on or provide to online and social media channels and information that can be accessed through our websites or these online and social media channels are not incorporated by reference into this Annual Report or in any other report or document we file with the SEC, and any references to our websites or these online and social media channels are intended to be inactive textual references only.
11
Item 1A. Risk Factors
Investing in our Class A common stock involves risks. You should carefully consider the risks and uncertainties described below, together with all of the other information in this Annual Report, including the section titled “Management’s Discussion and Analysis of Financial Condition and Results of Operations” and our consolidated financial statements and related notes, before deciding whether to purchase shares of our Class A common stock. You should also carefully consider the following risk factors in addition to the other information included in this Annual Report, including matters addressed in the above section entitled “Special Note Regarding Forward-Looking Statements.” Our business, operating results, financial condition, and prospects could also be harmed by risks and uncertainties that are not presently known to us or that we currently believe are not material. If any of these risks actually occur, our business, operating results, financial condition, and prospects could be materially and adversely affected. Unless otherwise indicated, references in these risk factors to our business being harmed will include harm to our business, reputation, brand, financial condition, operating results, and prospects. In such event, the market price of our securities could decline, and you could lose all or part of your investment.
Risks Related to Our Business and Industry
We have a limited operating history at the current scale of our business and are still scaling up our monetization efforts, which makes it difficult to evaluate our current business and future prospects, and there is no assurance we will be able to scale our business for future growth.
We commenced operating the Nextdoor platform in 2011 and began supporting the platform with advertising in 2016. Our limited operating history at the current scale of our business may make it difficult to evaluate our current business and future prospects. We have encountered, and will continue to encounter, risks and difficulties frequently experienced by growing companies in rapidly evolving industries, including challenges in accurate financial planning and forecasting, increasing competition and expenses as we effectively scale our business, and our ability to achieve market acceptance of our platform and attract, engage and retain users, who we call “neighbors” (which includes individuals) and organizations (which includes businesses and public agencies, including paying customers such as advertisers). You should consider our business and prospects in light of the risks and difficulties that we may encounter as a business with a limited operating history. We cannot ensure that we will be successful in addressing these and other challenges we may face in the future, and our business, operating results, and financial condition may be adversely affected if we do not manage these risks successfully. We may not be able to sustain or increase our current rate of growth, which is a risk characteristic often shared by companies with limited operating histories participating in rapidly evolving industries.
Additionally, we are still in the early stages of monetizing our platform. Our growth strategy depends on, among other things, increasing neighbors on the network, increasing engagement, developing new and improving existing products for neighbors and organizations, attracting more advertisers (including expanding our sales efforts to reach advertisers in additional international markets), scaling our business with existing advertisers, and delivering targeted advertisements based on neighbors’ personal taste and interests. Given the current macroeconomic environment, it may be more difficult for us to capitalize on our growth strategies. There can be no assurance that we will successfully increase monetization on our platform or that we will sustain or increase the current growth rate of our revenue.
Adverse global economic and financial conditions could harm our business and financial condition.
Adverse global economic and financial events and the effects thereof, such as health epidemics or pandemics, the war in Ukraine and the Israel-Hamas war, inflation, changing interest rates, potential recessions, uncertainty with respect to the federal budget or debt ceiling and a potential temporary federal government shutdown related thereto, fluctuations in foreign exchange rates, actual or perceived instability in the global banking system, supply chain issues and inventory and labor shortages, have caused, and could in the future cause, disruptions and volatility in global financial markets. These conditions have in the past and may in the future translate to cost increases to us and advertisers and lead to decreased spending by our advertisers. In addition, since the majority of our revenue is derived from advertisers within the United States, economic conditions in the United States have a greater impact on us. We may not perform well in adverse macroeconomic conditions, which could adversely affect our business, financial condition and operating results.
We currently generate substantially all of our revenue from advertising. If advertisers reduce or eliminate their spending with us, our business, operating results, and financial condition would be adversely impacted.
Substantially all of our revenue is currently generated from the sales of advertising on our platform in the form of online display advertisements, which include sponsored posts and local deals. Our advertisers typically do not have long-term advertising spend commitments with us. Many of our advertisers spend only a relatively small portion of their overall advertising budget with us. In
12
addition, advertisers may view some of the features on our platform as experimental and unproven. Advertisers will not continue to do business with us, or they will reduce the prices they are willing to pay to advertise with us, if we do not deliver advertisements in an effective manner, or if advertisers do not believe that their investment in advertising with us will generate a competitive return relative to alternatives. Our ability to attract and retain advertisers, and ultimately generate revenue, may be adversely affected by a number of factors, including but not limited to:
•decreases in neighbor or advertiser engagement on the platform;
•slower than anticipated growth in, or lack of growth or decreases in, the number of neighbors active on the platform;
•the impact of macroeconomic conditions, whether in the advertising industry in general, among specific types of advertisers or within particular geographies, including but not limited to health epidemics or pandemics, actual or perceived instability in the global banking system, labor shortages, supply chain disruptions, a potential recession, uncertainty with respect to the federal budget or debt ceiling and a potential temporary federal government shutdown related thereto, inflation and changing interest rates;
•platform changes (such as the migration to our proprietary ad server) or inventory management decisions that change the size, format, frequency, or relative prominence of advertisements displayed on the platform;
•competitors offering more attractive pricing for advertisements that we are unable or unwilling to match;
•a decrease in the quantity or quality of advertisements shown to neighbors;
•changes to laws, third-party policies or applications that limit our ability to deliver, target, or measure the effectiveness of advertising, including changes by mobile operating system and browser providers such as Apple and Google;
•changes to demographics of our neighbors that make us less attractive to advertisers;
•an increase in neighbors who exercise opt-out rights under privacy laws to restrict the advertisements they receive;
•neighbors that upload content or take other actions that are deemed to be hostile, inappropriate, illicit, objectionable, illegal, or otherwise not consistent with the brand of our advertisers;
•adverse government actions or legislative, regulatory, or other legal developments;
•neighbor behavior or changes to the platform that may affect, among other things, the safety and security of other neighbors or the cultivation of a positive and inclusive online community;
•adverse media reports or other negative publicity involving us;
•implementing or enforcing policies, such as advertising policies, community guidelines, and other terms or service that are perceived negatively by advertisers;
•our ability to develop and improve our products for advertisers;
•limitations in, or reductions to, the availability, accuracy, utility, and security of analytics and measurement solutions offered by us or third parties that are intended to demonstrate the value of our advertisements to advertisers; and
•changes to our data privacy practices that affect the type or manner of advertising that we are able to provide, including as a result of changes to laws, regulations or regulatory actions, such as the GDPR, European Directive 2002/58/EC (the “ePrivacy Directive”), the UK GDPR, the UK Data Protection Act 2018, the CCPA, Nevada’s Online Privacy Law, the CDPA, the VCPDA, the CPRA, and other U.S. state privacy laws, or changes to third-party policies.
From time to time, certain of these factors have adversely affected our revenue to varying degrees. The occurrence of any of these or other factors in the future could result in a reduction in demand for our advertisements, which may reduce the prices we receive for our advertisements, or cause advertisers to stop or reduce their spend with us, either of which would negatively affect our business, operating results, and financial condition. Similar occurrences in the future may impair our ability to maintain or increase the quantity or quality of advertisements shown to neighbors and adversely affect our business, operating results, and financial condition.
13
Our ability to attract and retain advertisers depends on our ability to collect and use data and develop products to enable us to effectively deliver and accurately measure advertisements on the Nextdoor platform.
Most advertisers rely on tools that measure the effectiveness of their advertising campaigns in order to allocate their advertising spend among various formats and platforms. If we are unable to accurately measure the effectiveness of advertising on our platform, if at all, or if we are unable to convince advertisers that our platform should be part of a larger advertising budget, our ability to increase the demand and pricing of our advertising tools and maintain or scale our revenue may be limited or decline. Our ability to develop and offer products that accurately measure the effectiveness of a campaign on our platform is critical to our ability to attract new advertisers and retain, and increase spend from our existing advertisers.
We are continually developing and improving our products for advertisers and such efforts have and are likely to continue to require significant time and resources and additional investment, and in some cases, we have relied on, and may in the future rely on, third parties to provide data and technology needed to provide certain measurement data to our advertisers. If we cannot continue to develop and improve our products for advertisers in a timely fashion, those products are not reliable, or the measurement results are inconsistent with advertiser’s expectations or goals, our revenue could be adversely affected.
In addition, web and mobile browser developers, such as Apple, Microsoft or Google, have implemented and may continue to implement changes, including requiring additional user permissions, in their browser or device operating system that impair our ability to measure and improve the effectiveness of advertising on our platform. Such changes include limiting the use of first-party and third-party cookies and related tracking technologies, such as mobile advertising identifiers, and other changes that limit our ability to collect information that allows us to attribute neighbors’ actions on advertisers’ websites to the effectiveness of advertising campaigns run on our platform. For example, Apple launched its Intelligent Tracking Prevention (“ITP”) feature in its Safari browser. ITP blocks some or all third-party cookies by default on mobile and desktop and ITP has become increasingly restrictive over time. Apple’s related Privacy-Preserving Ad Click attribution, intended to preserve some of the functionality lost with ITP, would, for example, prevent uniquely identifying individuals and devices across sites for the purpose of Ad Click attribution, prevent measurement outside a narrowly-defined attribution window, and prevent advertisement re-targeting and optimization. Further, Apple introduced an App Tracking Transparency framework that limits the ability of mobile applications to request an iOS device’s advertising identifier and may also affect our ability to track neighbors’ actions off our platform and connect their interactions with on-platform advertising. Similarly, Google has announced that it plans to start phasing out third-party cookies in its Google Chrome browser, beginning in the second half of 2024, and, more recently, that it intends to limit access by mobile applications to advertising identifiers on Android devices. These web and mobile browser developers have also implemented and may continue to implement changes and restrictions in browser or device functionality that limit our ability to communicate with or understand the identity of our neighbors.
These restrictions and changes make it more difficult for us to provide the most relevant advertisements to our neighbors, as well as decrease our ability to measure the effectiveness of, re-target or optimize advertising on our platform. Developers may release additional technology that further inhibits our ability to collect data that allows us to measure the effectiveness of advertising on our platform. Any other restriction, whether by law, regulation, policy (including third-party policies), user opt-outs or otherwise, on our ability to collect and share data which our advertisers find useful or that further reduce our ability to measure the effectiveness of advertising on our platform, would impede our ability to attract, grow and retain advertisers. Advertisers and other third parties who provide data that helps us deliver personalized, relevant advertising may restrict or stop sharing this data and it therefore may not be possible for us to collect this data within the platform or from another source.
We rely heavily on our ability to collect and share data and metrics for our advertisers to help new and existing advertisers understand the performance of advertising campaigns. If advertisers do not perceive our metrics to be accurate representations of our neighbors and neighbor engagement, or there are inaccuracies in our metrics, advertisers may decrease or eliminate allocations of their budgets or resources to our platform, which could harm our business, operating results, and financial condition.
If we fail to add new neighbors or retain current neighbors, or if current neighbors engage less with the Nextdoor platform, our business, operating results, and financial condition would be adversely impacted.
The number of neighbors that use the Nextdoor platform and their level of engagement on the platform are critical to our success. We must continue to engage and retain existing neighbors on our platform as well as attract, engage and retain new neighbors. The number of neighbors on the Nextdoor platform may not continue to grow at historical growth rates or at all, and it may even decline. In order to attract new neighbors, we must engage with neighbors in existing neighborhoods on our platform and add new neighborhoods to the Nextdoor platform, both domestically and internationally. If our neighbor growth rate slows or reverses, our financial performance will be adversely impacted unless we can increase our engagement with our existing neighbors and our monetization efforts to offset any such reduction or decrease in neighborhood growth rate.
14
If current and potential neighbors do not perceive their experience with the Nextdoor platform to be useful, the content generated on the platform to be valuable or relevant or the social connections with fellow neighbors to be worthwhile, we may not be able to attract new neighbors, retain existing neighbors or maintain or increase the frequency and duration of their engagement on our platform. In addition, if our existing neighbors decrease the frequency or duration of their engagement or the growth rate of our active neighbor base slows or reverses, we may be required to incur significantly higher marketing expenses than we currently anticipate in order to acquire new neighbors or retain current neighbors.
There are many factors that could negatively impact our ability to grow, retain and engage current and prospective neighbors, including but not limited to:
•neighbors increasing their engagement with competitors’ platforms, products or services instead of, or more frequently than, our platform;
•changes in the amount of time neighbors spend across all applications and platforms, including our platform;
•failing to introduce platform enhancements that neighbors find engaging or if we introduce new features, terms, policies or procedures, or make changes to our platform, that are not favorably received by current or prospective neighbors;
•technical or other problems frustrating the neighbor experience, such as problems that prevent us from delivering our service in a fast and reliable manner;
•neighbors having difficulty installing, updating or otherwise accessing the Nextdoor platform on mobile devices through the app or web browsers;
•neighbor behavior on the Nextdoor platform changing, including a decrease in the quality and frequency of content shares on the platform;
•decreases in neighbor or advertiser sentiment due to questions about the quality or usefulness of our platform, concerns about the nature of content made available on the platform, concerns related to privacy, safety, security, well-being or other factors;
•changes mandated by legislation, government and regulatory authorities, or litigation that adversely impact our platform or neighbors;
•third parties preventing their content from being displayed on the Nextdoor platform;
•changes we may make to how we promote different features on our platform;
•initiatives designed to attract and retain neighbors and engagement are unsuccessful or discontinued, whether as a result of actions by us, third parties, or otherwise;
•we, or other partners and companies in the industry are the subject of adverse media reports or other negative publicity;
•we are unable to combat spam, harassment, cyberbullying or other hostile, inappropriate, abusive or offensive content or usage on our platform; or
•we cannot preserve and enhance our brand and reputation as a trusted neighborhood networking community.
Any decrease in neighbor growth, retention or engagement could render our service less attractive to neighbors or advertisers, and could harm our business, operating results, and financial condition. In addition, neighbor verification is a critical feature of our platform because it demonstrates that neighbors are real people and businesses in the neighborhood they desire to join. If we were to change our verification methods, that may adversely impact our ability to add new neighbors or retain existing neighbors.
Our business is highly competitive. Competition presents an ongoing threat to the success of our business.
We compete with companies that provide a variety of internet products, services, content, and online advertising. In addition, aspects of our platform compete with other products and services, including home services, classifieds, real estate, recommendations, and search engines. Of these companies, we most directly compete with social media companies that offer local products to advertisers and users, including large companies such as Meta (including through Facebook and Instagram) and Alphabet (including through Google), and other companies that provide home services, classifieds, real estate, recommendations, and search engines. We compete with these companies to attract, engage, and retain users and to attract and retain advertisers. If we introduce or acquire new products and services or evolve our platform in a way that subjects us to additional competition or as existing competitors introduce new products
15
and services or evolve their platforms, we may fail to engage or retain neighbors or attract new neighbors, which could harm our business, operating results, and financial condition.
Some of our current and potential competitors have substantially broader product or service offerings and leverage their relationships based on other products or services to gain additional share of advertising spend. They have large distributed sales forces and an increasing amount of control over mobile distribution channels. Many of these competitors’ economies of scale allow them to have access to larger volumes of data and platforms that are used on a more frequent basis than the Nextdoor platform, which may enable them to better understand their member base and develop and deliver more targeted advertising. Such competitors may not need to rely on third-party data, including data provided by advertisers, to effectively target the campaigns of advertisers, which could make their advertising products more attractive to advertisers than our platform if such third-party data ceases to be available to us, whether because of regulatory changes, privacy or cybersecurity concerns or other reasons. If our advertisers do not believe that our value proposition is as compelling as those of our competitors, we may not be able to attract new advertisers or retain existing ones, and our business, operating results, and financial condition could be adversely impacted.
Our competitors may develop products, features, or services that are similar to our platform or that achieve greater acceptance, may undertake more far-reaching and successful product development efforts or marketing campaigns, or may adopt more aggressive pricing policies. Some competitors may gain a competitive advantage relative to us in areas where we operate, including by more effectively responding to changes to third-party products and policies or by integrating competing platforms, applications, or features into products they control such as mobile device operating systems, search engines, browsers, or e-commerce platforms. For example, Apple introduced changes starting with iOS 14.5 that limit our ability, and the ability of others in the digital advertising industry, to track individual users and devices, and target and measure advertisements effectively. Additionally, the Apple App Store guidelines require apps that support account creation to also allow users to delete their account within the app. This change has and may continue to impact our ability to retain users. Moreover, Google recently announced that it intends to limit access by mobile applications to advertising identifiers on Android devices, likely by the end of 2024. As a result, our competitors may, and in some cases will, acquire and engage neighbors or generate advertising or other revenue at the expense of our efforts, which would negatively affect our business, operating results, and financial condition. In addition, from time to time, we may take actions in response to competitive threats, but we cannot assure you that these actions will be successful or that they will not negatively affect our business, operating results, and financial condition.
We believe that our ability to compete depends upon many factors both within and beyond our control, including:
•the popularity, usefulness, ease of use, performance, and reliability of our platform compared to our competitors’ products;
•the size and composition of our neighbor base;
•the engagement of neighbors with our platform and competing products;
•first- and third-party data available to us relative to our competitors;
•our ability to attract and retain advertisers who use our free or paid advertisements services;
•the timing and market acceptance of developments and enhancements to our platform or our competitors’ products;
•our safety and security efforts and our ability to protect neighbor data and to provide neighbors with control over their data;
•our ability to distribute our platform to new and existing neighbors;
•our ability to effectively monetize our platform;
•the successful implementation of platform changes, such as the migration to our proprietary ad server and introduction of AI technologies into our platform;
•the frequency, size, format, quality, and relative prominence of the advertisements displayed by us or our competitors;
•customer service and support efforts;
•marketing and selling efforts, including our ability to measure the effectiveness of our advertisements and to provide advertisers with a compelling return on their investments;
•our ability to establish and maintain publisher interest in integrating their content with our platform;
16
•changes mandated by legislation, regulatory authorities, or litigation, some of which may have a disproportionate effect on us;
•acquisitions or consolidation within our industry, which may result in more formidable competitors;
•our ability to attract, retain, and motivate talented employees, particularly software engineers, designers, and managers;
•our ability to cost-effectively manage and grow our operations; and
•our reputation and brand strength relative to those of our competitors.
If we are not able to compete effectively, our neighbor base and level of neighbor engagement may decrease, we may become less attractive to advertisers and our business, operating results, and financial condition may be adversely affected.
Our business is dependent on our ability to maintain and scale our product offerings and technical infrastructure, and any significant disruption in the availability of our platform could damage our reputation, result in a potential loss of neighbors and engagement, and adversely affect our business, operating results, and financial condition.
Our reputation and ability to attract, retain, and serve our neighbors and to scale our product offerings is dependent upon the reliable performance of our platform and our underlying technical infrastructure. We have in the past experienced, and may in the future experience, interruptions in the availability or performance of our platform from time to time. Our systems may not be adequately designed or may not operate with the reliability and redundancy necessary to avoid performance delays or outages that could be harmful to our business. If our platform is unavailable when neighbors attempt to access it, or if it does not load as quickly as expected, neighbors may not use our platform as often in the future, or at all, and our ability to serve advertisements may be disrupted, any of which could adversely affect our business, operating results, and financial condition. As the amount and types of information shared on our platform continues to grow and evolve, as the usage patterns of our communities continues to evolve, and as our internal operational demands continue to grow, we will need an increasing amount of technical infrastructure, including network capacity and computing power, to continue to satisfy our needs. If we fail to continue to effectively scale and grow our technical infrastructure to accommodate these increased demands, neighbor engagement and revenue growth may be adversely impacted. Moreover, as we scale our platform and product offerings, including video and other platform features, that may place strain on our technical infrastructure, and we may also be unsuccessful in scaling our technical infrastructure to accommodate new product offerings and increased platform usage cost-effectively. In addition, our business may be subject to interruptions, delays, or failures resulting from earthquakes, fires, floods, adverse weather conditions, other natural disasters, power loss, terrorism, pandemics, geopolitical conflict (including the current war in Ukraine and the Israel-Hamas war), other physical security threats, cyber-attacks, or other catastrophic events. If such an event were to occur, neighbors may be subject to service disruptions or outages and we may not be able to recover our technical infrastructure and neighbor data in a timely manner to restart or provide our services, which may adversely affect our financial results. In addition, the substantial amount of our employees are based in our headquarters located in San Francisco, California. If there is a catastrophic failure involving our systems or major disruptive event affecting our headquarters or the San Francisco area in general, we may be unable to operate our platform.
A substantial portion of our network infrastructure is provided by third parties, including AWS. We also rely on third parties for other technology related services, including certain AI functions. Any disruption or failure in the services we receive from these providers could impact the availability of our platform and could adversely impact our business, operating results and financial condition. Any financial or other difficulties these providers face may adversely affect our business, and we exercise little control over these providers, which increases our reliance on and vulnerability to problems with the services they provide and increases in the costs of these services.
Any of these developments may result in interruptions in the availability or performance of our platform, result in neighbors ceasing to use our platform, require unfavorable changes to our platform, delay the introduction of future products, or otherwise adversely affect our reputation, business, operating results, and financial condition.
If we fail to scale our business effectively, our business, operating results, and financial condition would be adversely affected.
We have experienced growth in recent years and expect to continue to invest strategically across our organization to support measured growth, while also scaling back certain areas of our business in response to changing economic conditions. Although we have experienced rapid growth historically, we may not return to prior growth rates or sustain our growth rates, nor can we assure you that our investments to support our growth or to manage expenses by scaling back other areas of our business will be successful. The effective scaling of our business will require us to invest financial and operational resources and the continuous dedication of our management team.
17
We plan to continue to expand our international operations into more countries in the future, which will place additional demands on our resources and operations. The growth and expansion of our business has placed, and continues to place, a significant strain on our management, operations, and financial and technical infrastructure. In the event of further growth of our business or in the number of our third-party relationships, our information technology systems or our internal controls and procedures may not be adequate to support our operations.
Further, as we have grown, our business has become increasingly complex and requires more resources. To manage any future growth effectively, we must continue to improve and expand our information technology and financial infrastructure, our operating and administrative systems and controls, and our ability to manage headcount, capital, and processes in an efficient and appropriate manner. Failure to manage growth effectively could result in increases in costs, difficulties in introducing new products and services or enhancing the platform, loss of neighbors and advertisers, or other operational difficulties, any of which could adversely affect our business, operating results, and financial condition. For example, as we expand our product offerings, including video, we may not be able to do so cost-effectively. Effectively managing our growth may also be more difficult to accomplish the longer that our employees, our advertisers, neighbors and the overall economy is impacted due to macroeconomic conditions and factors, including but not limited to the impacts related to the actual or perceived instability in the global banking system, labor shortages, supply chain disruptions, a potential recession, uncertainty with respect to the federal budget or debt ceiling and a potential temporary federal government shutdown, related thereto, changing interest rates and inflation, and the war in Ukraine and the Israel-Hamas war.
We may not be able to successfully implement or scale improvements to our systems, processes, and controls in an efficient or timely manner. Our controls, policies and procedures, including with respect to accounting, risk management, data privacy, cybersecurity, client on-boarding, transaction monitoring, and reliance on manual controls, among other compliance matters, remain under development and may not be consistently applied or fully effective to identify, monitor and manage all risks of our business as we continue to scale rapidly. In addition, our existing systems, processes, and controls may not prevent or detect all errors, omissions, or fraud. We may also experience difficulties in managing improvements to our systems, processes, and controls or in connection with third-party software licensed to help us with such improvements. Any future growth will continue to add complexity to our organization and require effective coordination throughout our organization. Failure to manage any future growth effectively could result in increased costs, cause difficulty or delays in attracting new neighbors or retaining or increasing the engagement of existing neighbors, cause difficulties in introducing new features, impact our ability to attract and retain talent or cause other operational difficulties, and any of these difficulties would adversely impact our business, operating results, and financial condition.
Additionally, from time to time, we realign our resources and talent to implement stage-appropriate business strategies, which could include furloughs, layoffs and reductions in force. For example, in November 2023, in response to changing economic conditions and in an effort to support our growth, scale and profitability objectives, reduce our operational costs and improve our organizational efficiency, we executed a restructuring plan, which included a restructuring and reduction of the current workforce by approximately 25%. The restructuring plan was substantially completed by the end of the fourth quarter of 2023. If there are unforeseen expenses associated with such realignments in our business strategies, and we incur unanticipated charges or liabilities, then we may not be able to effectively realize the expected cost savings or other benefits of such actions. Failure to manage any growth or any scaling back of our operations could have an adverse effect on our business, operating results, and financial condition.
If we or our industry generally are unable to provide a high-quality and secure customer experience in the various locales in which we operate, our brand could suffer reputational damage and our business results could be harmed.
Our business is largely driven by and reliant on customer trust. The reliability of our service, the security of personally identifiable and other sensitive information of our customers, and a responsive and effective customer support function are each critical elements for the maintenance of this trust. For example, any significant interruption in either our internal or our partners’ systems could reduce customer confidence in our services. In addition, any breach, or reported breach, of our systems, our information security policies, or legal requirements that results in a compromise of customer data or causes customers to believe their data has been compromised could have a significant negative effect on our business. Legal claims and regulatory enforcement actions could also arise in response to these events, which would further exacerbate erosion of customer trust and potentially result in operating losses and liabilities.
If we do not successfully anticipate market needs and develop products and services and platform enhancements that meet those needs, or if those products, services, and platform enhancements do not gain market acceptance, our business, operating results, and financial condition will be adversely impacted.
We may not be able to anticipate future market needs or be able to improve our platform or to develop new products and services or platform enhancements to meet such needs on a timely basis, if at all. In addition, our inability to diversify beyond our current offerings could adversely affect our business. Any new products or services or platform enhancements that we introduce, including by way of acquisitions, may not achieve any significant degree of market acceptance from current or potential neighbors, which would
18
adversely affect our business, operating results, and financial condition. In addition, the introduction of new products or services or platform enhancements may decrease neighbor engagement with our platform, thereby offsetting the benefit of even a successful product or service introduction, any of which could adversely impact our business, operating results, and financial condition.
We may not be successful in our AI initiatives, which could adversely affect our business, reputation, or financial results.
We are continuing to make investments in AI initiatives, including to recommend relevant content across our products, enhance our advertising tools, and develop new product features using generative AI. Our AI initiatives may require increased investment in infrastructure and headcount. AI technologies are complex and rapidly evolving, and we face significant competition from other companies as well as an evolving regulatory landscape. These efforts, including the introduction of new products or changes to existing products, may result in new or enhanced governmental or regulatory scrutiny, litigation, ethical concerns, or other complications that could adversely affect our business, operating results and financial condition. For example, the use of datasets to develop AI models, the content generated by AI systems, or the application of AI systems may be found to be insufficient, offensive, biased, or harmful, or violate current or future laws and regulations. Moreover, AI may give rise to litigation risk, including potential intellectual property or privacy liability. In addition, market acceptance of AI technologies is uncertain, and we may be unsuccessful in our product development efforts. Moreover, our competitors may introduce AI technologies and features into their products and services that achieve greater market acceptance that ours. Any of these factors could adversely affect our business, operating results, and financial condition.
If our efforts to build strong brand identity and reputation are not successful, we may not be able to attract or retain neighbors, and our business, operating results, and financial condition will be adversely affected.
We believe that maintaining and enhancing the “Nextdoor” brand and reputation is critical to retaining and growing neighbors and advertisers on our platform. We anticipate that maintaining and enhancing our brand and reputation will depend largely on our continued ability to provide high-quality, relevant, reliable, trustworthy and innovative features on our platform, which may require substantial investment and may not be successful. We may need to introduce new products, services and features or updates to our platform and features that require neighbors to agree to new terms of service that our neighbors do not like, which may negatively affect our brand and reputation.
Additionally, advertisements or actions of our advertisers may affect our brand and reputation if neighbors do not think the advertisements help them accomplish their objectives, view the advertisements as intrusive or misleading or have poor experiences with our advertisers.
Our brand and reputation may also be negatively affected by the content or actions of neighbors that are deemed to be hostile or inappropriate to other neighbors, by the actions of neighbors acting under false or inauthentic identities, by the use of our platform to disseminate misleading or false information, the use of our platform for fraudulent schemes and scams, or by the use of our service for illicit, illegal or objectionable ends. We also may fail to respond expeditiously to the sharing of illegal, illicit or objectionable content on our service or objectionable practices by advertisers, or to otherwise address our neighbors’ concerns, which could erode confidence in our brand and damage our reputation. We expect that our ability to identify and respond to this content in a timely manner may decrease as the number of neighbors grows, as the amount of content on the platform increases or as we expand our product and service offerings on our platform. Any governmental or regulatory inquiry, investigation or action, including based on the appearance of illegal, illicit or objectionable content on our platform or the failure to comply with laws and regulations, could damage our brand and reputation, regardless of the outcome.
We have experienced, and expect to continue to experience, media, legislative, governmental and regulatory scrutiny of our decisions. Any scrutiny regarding us, including regarding our data privacy, content moderation or other practices, platform changes, platform quality, litigation or regulatory action, or regarding the actions of our employees, neighbors, or advertisers or other issues, may harm our brand and reputation. In addition, scrutiny of other companies in our industry, including such companies’ data privacy, content moderation or other practices, could also have a negative impact on our brand and reputation. These concerns, whether actual or unfounded, may also deter neighbors or advertisers from using our platform. In addition, we may fail to adequately address the needs of neighbors and advertisers which could erode confidence in our brand and damage our reputation. If we fail to promote and maintain the “Nextdoor” brand or preserve our reputation, or if we incur excessive expenses in this effort, our business, operating results, and financial condition could be adversely impacted.
Unfavorable media coverage negatively affects our business from time to time.
Unfavorable publicity regarding us, for example regarding our privacy or cybersecurity practices, terms of service, advertising policies, platform changes, platform quality, litigation or regulatory activity, the actions of our advertisers, the use of our platform for illicit or objectionable ends, the substance or enforcement of our community standards, the actions of our neighbors, the quality and integrity of content shared on our platform, or the actions of other companies that provide similar services to us, has in the past, and
19
could in the future, adversely affect our reputation. For example, we have been, and may in the future be, subject to negative publicity in connection with our handling of misinformation and other illicit or objectionable uses of our platform. Any such negative publicity could have an adverse effect on the size, engagement, and loyalty of our neighbor base and advertiser demand for advertising on our platform, which could result in decreased revenue and adversely affect our business, operating results, and financial condition, and we have experienced such adverse effects to varying degrees from time to time.
We plan to continue expanding our international operations where we have limited operating experience and may be subject to increased business, regulatory, and economic risks that could seriously harm our business, operating results, and financial condition.
We plan to continue expanding our business operations abroad by opening new and expanding within existing neighborhoods outside of the United States. As of December 31, 2023, the Nextdoor platform was accessible in 11 countries (including the United States) and had over 325,000 neighborhoods. We plan to enter new international markets and expand in existing markets where we have limited or no experience in marketing, selling, advertising and deploying our platform or selling advertising. Any of our limited experience and infrastructure in such markets, individuals’ lack of familiarity with us or our platform, the existence of alternative platforms in such jurisdictions that offer similar products and services or the lack of a critical mass of potential neighbors in such markets may make it more difficult for us to effectively monetize any increase in neighbors in those markets, and may increase our costs without a corresponding increase in revenues. If we fail to deploy or manage our operations in international markets successfully, comply with international regulations or effectively monetize our platform in international markets to the same degree as we are able to monetize our efforts within the United States, our business, operating results and financial conditions will be adversely affected. In the future, if our international operations increase, or more of our expenses are denominated in currencies other than the U.S. dollar, our operating results may be more greatly affected by fluctuations in the exchange rates of the currencies in which we do business. In addition, as our international operations and sales to advertisers continue to grow, we will be subject to a variety of risks inherent in doing business internationally, including:
•political, social and economic instability, including as a result of acts of war or terrorism, including the war in Ukraine and the Israel-Hamas war;
•risks related to the legal and regulatory environment in foreign jurisdictions, including with respect to privacy and data protection, and unexpected changes in laws, regulatory requirements, and enforcement;
•potential damage to our brand and reputation due to compliance with local laws, including potential censorship and requirements to provide neighbor information to local authorities;
•enhanced difficulty in reviewing content on the Nextdoor platform and enforcing community standards across different languages and countries;
•fluctuations in currency exchange rates;
•foreign exchange controls and tax and other regulations and orders that might prevent us from repatriating cash earned in countries outside the United States or otherwise limit our ability to move cash freely, and impede our ability to invest such cash efficiently;
•compliance with multiple U.S. and international tax jurisdictions and management of tax impact of global operations;
•potentially higher levels of credit risk and payment fraud;
•difficulties integrating any foreign acquisitions;
•burdens of complying with a variety of foreign laws, including laws related to taxation, content removal, data localization, data transfer, consents, payments, and regulatory oversight;
•reduced protection for intellectual property rights in some countries;
•different regulations and practices with respect to employee/employer relationships, existence of workers’ councils and labor unions, increase in labor costs due to high wage inflation in certain international jurisdictions, and other challenges caused by distance, language and cultural differences, making it harder to do business in certain international jurisdictions; and
•difficulties in staffing and managing global operations and the increased travel, infrastructure, and legal compliance costs associated with multiple international locations.
20
In addition, we must manage the potential conflicts between locally accepted business practices in any given jurisdiction and our obligations to comply with laws and regulations, including anti-money laundering laws, anti-corruption laws or regulations applicable to us, such as the U.S. Foreign Corrupt Practices Act, and the U.K. Bribery Act 2010. We also must manage our obligations to comply with laws and regulations related to export controls, sanctions, and embargoes, including regulations established by the U.S. Office of Foreign Assets Control. Government agencies and authorities have a broad range of civil and criminal penalties they may seek to impose against companies for violations of anti-corruption laws or regulations, export controls, and other laws, rules, sanctions, embargoes, and regulations. Any failure by us to comply with local business practices or the laws and regulations applicable to us in the markets in which we operate may adversely affect our business, operating results, and financial condition. Additionally, if we are unable to expand internationally and manage the complexity of our global operations successfully, our business, operating results, and financial condition could be adversely affected.
If we need additional capital in the future, it may not be available on favorable terms, if at all.
We have historically relied on outside financing to fund our operations, capital expenditures and expansion. We may require additional capital from equity or debt financing in the future to support our growth, fund our operations or to respond to competitive pressures or strategic opportunities. We may not be able to secure timely additional financing on favorable terms, if at all. The current macroeconomic environment may make it more difficult to raise additional capital on favorable terms, if at all. If we raise additional funds through further issuances of equity, convertible debt securities or other securities convertible into equity, our existing stockholders, could suffer significant dilution in their percentage ownership, and any new securities that we issue could have rights, preferences and privileges senior to those of holders of our Class A common stock. Any debt financing that we secure in the future could involve restrictive covenants relating to our capital raising activities and other financial and operational matters, including the ability to pay dividends. This may make it more difficult for us to obtain additional capital and to pursue business opportunities, including potential acquisitions. If we are unable to obtain adequate financing or financing on terms that are satisfactory to us, if and when we require financing, our ability to grow or support our business and to respond to business challenges that we may face could be significantly limited.
We may make acquisitions, which could harm our financial condition or operating results and may adversely affect the price of our Class A common stock.
As part of our business strategy, we have made, and may in the future make acquisitions to add specialized employees and complementary companies, products or technologies, data, and enter new geographic regions. Our previous and future acquisitions may not achieve our goals, and we may not realize benefits from acquisitions we make in the future. If we fail to successfully integrate acquisitions, or the personnel or technologies associated with those acquisitions, our business, operating results, and financial condition could be harmed. Any integration process will require significant time and resources, and we may not be able to manage the process successfully. Our acquisition strategy may change over time and any future acquisitions we complete could be viewed negatively by neighbors, advertisers, investors or other parties with whom we do business. We may not successfully evaluate or utilize the acquired technology and accurately forecast the financial impact of an acquisition, including accounting charges. We may also incur unanticipated liabilities that we assume as a result of acquiring companies. We may have to pay cash, incur debt or issue equity securities to pay for any such acquisition, each of which could affect our financial condition or the value of our securities. In the future, we may not be able to find other suitable acquisition candidates, and we may not be able to complete acquisitions on favorable terms, if at all. Our acquisition strategy could require significant management attention, disrupt our business and harm our business, operating results, and financial condition.
Our business depends largely on our ability to attract, and retain and assimilate talented employees, including senior management. If we lose the services of or fail to successfully assimilate highly skilled personnel, key employees or members of our senior management team, we may not be able to execute on our business strategy.
Our future success depends on our continuing ability to attract, train, assimilate, and retain highly skilled personnel, including software engineers and sales personnel. We face intense competition for qualified individuals from numerous software and other technology companies. In addition, competition for qualified personnel, particularly software engineers, is particularly intense in the San Francisco Bay Area, where our headquarters are located, and the change by companies to offer a remote or hybrid work environment may increase the competition for such employees from employers outside of our traditional office locations.
We may not be able to retain our current key employees or attract, train, assimilate, or retain other highly skilled personnel in the future. We have incurred, and may continue to incur, significant costs to attract and retain highly skilled personnel, and we may lose new employees to our competitors or other technology companies before we realize the benefit of our investment in recruiting and training them. As we move into new geographies, we will need to attract and recruit skilled personnel in those areas. Further, labor is subject to external factors that are beyond our control, including our industry’s highly competitive market for skilled workers and leaders, cost inflation, and workforce participation rates. Further, in November 2023, in response to changing economic conditions and
21
in an effort to reduce our operational costs and improve our organizational efficiency, we executed a restructuring plan, which included a restructuring and reduction of the current workforce by approximately 25%. The restructuring plan was substantially complete by the end of the fourth quarter of 2023. This restructuring plan could negatively impact our ability to attract, integrate, retain and motivate key employees. If we are unable to attract and retain suitably qualified individuals who are capable of meeting our growing technical, operational, and managerial requirements, on a timely basis or at all, our business, operating results, and financial condition may be adversely affected.
Our future success also depends in large part on the continued services of senior management and other key personnel. We rely on our senior management team and key employees in the areas of engineering, sales and product development, design, marketing, operations, strategy, security, and general and administrative functions. Our senior management and other key personnel are all employed on an at-will basis, which means that they could terminate their employment with us at any time, for any reason, and without notice. We do not currently maintain key-person life insurance policies on any of our officers or employees.
On February 23, 2024, we announced that Nirav Tolia, co-founder of Legacy Nextdoor, will return as Chief Executive Officer, President and Chairperson of our Board of Directors. The effective date of Mr. Tolia’s position as Chief Executive Officer, President and Chairperson of the Board will be May 8, 2024 (the “Transition Date”). Mr. Tolia will initially serve as the Executive Chair of the Company, effective March 18, 2024. To support the planned orderly transition of our Chief Executive Officer, Sarah Friar will remain employed by the Company as the Chief Executive Officer, President and Chairperson of our Board of Directors until the Transition Date. If we lose the services of senior management or other key personnel, or if we are unable to attract, train, assimilate, and retain the highly skilled personnel that we need, our business, operating results, and financial condition could be adversely affected.
Volatility or lack of appreciation in our stock price may also affect our ability to attract and retain our key employees. Our employees may be more likely to leave if the shares they own or the shares underlying their vested options have significantly appreciated in value relative to the original purchase price of the shares or the exercise price of the options, or conversely, if the exercise price of the options that they hold are significantly above the market price of our Class A common stock. If we are unable to retain our employees, or if we need to increase our compensation expenses to retain our employees, our business, operating results, and financial condition could be adversely affected.
Our core values may conflict with the short-term interests of our business.
We consider our core values as a guide to the decisions we make, which we believe is essential to our success in increasing our neighbor growth rate and engagement and in serving the best, long-term interests of Nextdoor and our stockholders. In the past, we have forgone, and may in the future forgo, certain expansion or revenue opportunities that we do not believe are aligned with our core values, even if our decision may negatively impact our operating results in the short term. Our decisions may not result in the long-term benefits that we expect, in which case our neighbor engagement, business, operating results, and financial condition could be harmed.
Risks Related to Security and Technology
We are dependent on third-party software and service providers, including the GAM platform, for management and delivery of advertisements on the Nextdoor platform. Any failure or interruption experienced by such third-parties could result in the inability of certain businesses to advertise on our platform, and adversely impact our business, operating results, and financial condition.
Currently, we are dependent on third-party software and service providers, including the GAM platform, for management and delivery of advertisements on the Nextdoor platform. As such, the continued use of third-party software and service providers, including GAM, is critical to our continued success and any service disruptions, adverse changes to the terms of use, pricing or related terms and conditions for such third-party providers’ products, or difficulties with such products, including our data usage, meeting our requirements or standards could result in the inability of certain businesses to advertise on our platform, and adversely impact our business, operating results, and financial condition.
We rely on third-party software and service providers, including AWS, to provide systems, storage and services for our platform. Any failure or interruption experienced by such third parties could result in the inability of neighbors and advertisers to access or utilize our platform, and adversely impact our business, operating results, and financial condition.
We rely on third-party software and service providers, including AWS, to provide systems, storage and services, including neighbor login authentication, for our website. Any technical problem with, cyber-attack on or loss of access to such third parties’ systems, servers, or technologies could result in the inability of neighbors to access the Nextdoor platform or result in the theft of neighbors’ personal information.
22
Because we rely on third-party technology providers in our business, we rely on the cybersecurity practices and policies adopted by these third parties. Our ability to monitor our third-party technology providers’ cybersecurity practices is limited.
Any significant disruption, limitation or loss of our access to or other interference with our use of AWS, including as a result of termination by AWS of its agreement with us, would negatively impact our business, operating results, and financial condition. In addition, any transition of the cloud services currently provided by AWS to another cloud services provider would be difficult to implement and would cause us to incur significant time and expense and could disrupt or degrade our ability to deliver our products and services. The level of service provided by AWS could affect the availability or speed of our services. If neighbors or advertisers are not able to access our platform or encounter difficulties in doing so, we may lose neighbors or advertisers, which could harm our reputation, business, operating results, and financial condition.
We utilize data center hosting facilities operated by AWS, located in various facilities. We are unable to serve network traffic from back-up data center services. An unexpected disruption of services provided by these data centers could hamper our ability to handle existing or increased traffic, result in the loss of data or cause our platform to become unavailable, which may harm our reputation, business, operating results, and financial condition.
We rely on third parties, including email providers, mobile data networks, and geolocation providers to complete the verification process for our neighbors’ accounts. Any failure or interruption experienced by such third parties could result in the inability of neighbors to join our platform, resulting in harm to our reputation and an adverse impact to our business, operating results, and financial condition.
We rely on third parties to verify our neighbors’ accounts through several methods, including but not limited to email, SMS text message, phone calls, geolocation and mailed invitations. For example, we utilize email providers, mobile data networks, and geolocation providers to verify neighbors’ accounts. Account verification is a critical feature of our platform because it demonstrates that neighbors actually live in the neighborhood they desire to join. Any failure, interruption, or loss of access to such third parties or their software could result in the inability of neighbors to join our platform. Our reliance on third parties makes us vulnerable to any service interruptions, whether as a result of a cyber-attack, security breach, weather or other events, or delays in their operations. Additionally, alternative email providers, mobile data networks, geolocation providers or postal providers may be more costly to use than our current providers. Any disruption in the third parties could harm our neighbor growth, which in turn could make us a less attractive advertising platform and harm our reputation, and could harm our business, operating results, and financial condition.
Technologies have been developed that can block the display of advertisements on the Nextdoor platform, which could adversely impact our business, operating results, and financial condition.
Technologies have been developed, and will likely continue to be developed, that can block the display of advertisements on the Nextdoor platform. We generate substantially all of our revenue from advertising, and ad-blocking technologies may prevent the display of certain advertisements appearing on our platform, which could harm our business, operating results, and financial condition. Existing ad-blocking technologies that have not been effective on our platform may become effective as we make certain platform changes, and new ad-blocking technologies may be developed in the future. More neighbors may choose to use such ad-blocking products to block or obscure the display of advertisements on our platform if we are unable to successfully balance the amount of our organic content and paid advertisements, or if neighbors’ attitudes toward advertisements become more negative. Further, regardless of their effectiveness, ad-blockers may generate concern regarding the health of the digital advertising industry, which could reduce the value of digital advertising and harm our business, operating results, and financial condition.
Security breaches, including improper access to or disclosure of our data or our neighbors’ data, or other hacking and phishing attacks on our or third-party systems, could harm our reputation and adversely affect our business.
We collect, store and otherwise process personal data relating to a number of individuals such as our neighbors, employees and partners, including, but not limited to, neighbor contact details, network details, and location data. The evolution of technology systems introduces unknown and complex security risks that can be unpredictable and difficult to defend against. Cyber-attacks continue to evolve in sophistication and volume, and inherently may be difficult to detect for long periods of time. In particular, social media companies, like us, are prone to cyber-attacks by third parties seeking unauthorized access to company or user data or to disrupt their ability to provide access to their products and services.
The trend towards working from home and using private residential networks to access the Internet may further exacerbate risks associated with cyberattacks and data security breaches, because we cannot guarantee these private work environments and electronic connections to our work environment have the same robust security measures deployed in our physical offices.
We take a variety of technical and organizational security measures and other measures to protect our data. Although we have implemented systems and processes that are designed to protect our data and our neighbors’ data, prevent data loss, disable
23
undesirable accounts and activities on our platform and prevent or detect security breaches, and maintain an information security policy, such measures cannot provide absolute security, and despite measures that we have or will in the future put in place, we may be unable to anticipate or prevent unauthorized access to such data. For example, computer malware, viruses, social engineering (predominantly spear phishing attacks), ransomware, and general hacking have become more prevalent in the industry, have occurred on our systems in the past, and are likely to occur on our systems in the future. In addition, we regularly encounter attempts to create false or undesirable accounts or take other actions on our platform for purposes such as spamming, spreading misinformation, or other objectionable ends. Our efforts to protect our company data or the information that we receive may also be unsuccessful due to software bugs or other technical malfunctions; employee, contractor, or vendor error or malfeasance; government surveillance; or other threats that evolve.
Some third parties, including advertisers and vendors, may store information that we share with them on their networks. If these third parties fail to implement adequate data-security practices or fail to comply with their contractual obligations and/or, where applicable, our terms and policies, neighbor data may be improperly accessed, used or disclosed. Even if these third parties take all the necessary precautions and comply with their applicable obligations, their networks may still suffer a breach, which could compromise neighbor data.
Security breaches may cause interruptions to our platform, degrade the neighbor experience, cause neighbors or advertisers to lose confidence and trust in our platform, impair our internal systems, or result in financial harm to our company.
In addition, affected neighbors, government authorities or other third parties could initiate legal or regulatory actions against us in connection with any actual or perceived security breaches or improper disclosure of data, which could cause us to incur significant expense and liability that may not be fully covered by insurance, if at all, or result in orders or consent decrees forcing us to modify our business practices. Such incidents or our efforts to remediate such incidents may also result in a decline in our active neighbor base or engagement levels and trust. In addition, such incidents could also result in the loss or misuse of such data, which could harm our business and reputation and diminish our competitive position. In addition, any of these events could have a material and adverse effect on our business, operating results, financial condition, market acceptance of our products or revenues and may also divert development resources and increase service and support costs.
The landscape of laws, regulations, and industry standards related to cybersecurity is evolving globally. We may be subject to increased compliance burdens by regulators and customers with respect to our platform, as well as additional costs to oversee and monitor security risks. Many jurisdictions have enacted laws mandating companies to inform individuals, stockholders, regulatory authorities, and others of security breaches. For example, the SEC recently adopted cybersecurity risk management and disclosure rules, which require the disclosure of information pertaining to cybersecurity incidents and cybersecurity risk management, strategy, and governance. This mandatory disclosure can be costly, harm our reputation, erode customer trust, and require significant resources to mitigate issues stemming from actual or perceived security breaches.
While we maintain insurance policies, our coverage may be insufficient to compensate us for all losses caused by security breaches, and any such security breaches may result in increased costs for such insurance. We also cannot ensure that our existing cybersecurity insurance coverage will continue to be available on acceptable terms or that the insurer will not deny coverage as to any future claim. The successful assertion of one or more large claims against us that exceed available insurance coverage, or the occurrence of changes in our insurance policies, including premium increases or the imposition of large deductible or co-insurance requirements, could adversely affect our reputation and our business, financial condition, and operating results.
A security breach of our system could trigger a breach of our agreements with partners that we rely on to deliver our services and expose us to significant loss.
Our agreements with third parties, including without limitation significant agreements with payment processors, credit card and debit card issuers and bank partners, contain contractual commitments we are required to adhere to related to information security and data privacy compliance. If we experience an incident that triggers a breach of such contractual commitments, we could be exposed to significant liability or cancellation of service under these agreements. The damages payable to the counterparty as well as the impact to our service could be substantial and create substantial costs and loss of business.
Distribution and marketing of, and access to, our platform depends, in significant part, on a variety of third-party publishers and platforms (including mobile app stores, third-party payment providers, computer systems, and other communication systems and service providers). If these third parties limit, prohibit or otherwise interfere with or change the terms of the distribution, use or
24
marketing of our platform in any material way, it could materially adversely affect our business, operating results, and financial condition.
We market and distribute our platform (including related mobile applications) through a variety of third-party publishers and distribution channels. Our ability to market our brands on any given property or channel is subject to the policies of the relevant third party. There is no guarantee that mobile platforms will continue to feature our platform, or that neighbors using mobile devices will continue to use our platform rather than competing products. We are dependent on the interoperability of our platform with mobile operating systems, networks, technologies, products, and standards that we do not control, such as the Android and iOS operating systems. Any changes, bugs, or technical issues in such systems, or changes in our relationships with mobile operating system partners, handset manufacturers, or mobile carriers, or in their terms of service or policies that degrade the functionality of our platform, reduce or eliminate our ability to update or distribute our platform, give preferential treatment to competitive products, limit our ability to deliver, target, or measure the effectiveness of advertisements, or charge fees related to the distribution of our platform or our delivery or placement of advertisements could materially adversely affect the usage of our platform on mobile devices, our business, operating results and financial condition. For example, the release of iOS 14.5 brought with it a number of new changes, including the need for neighbors using the app to opt in before their identifier for advertisers (“IDFA”) can be accessed by an app (which came into effect in April 2021). Apple’s IDFA is a string of numbers and letters assigned to Apple devices which advertisers use to identify app users to deliver personalized and targeted advertising. As a consequence, the ability of advertisers to accurately target and measure their advertising campaigns at the neighbor level will depend on the opt-in rate to grant IDFA access and if the opt-in rate is low, advertisers’ ability to target and measure advertising campaigns on the Nextdoor platform may become significantly limited. We did not observe any directly attributable negative impact on our business, operating results or financial condition, including our revenue, revenue growth rates, and operating income (loss), related to the introduction of IDFA during the year ended December 31, 2023, though we may be impacted by such changes, or other changes to third-party policies or applications in the future, and as a result, our business, operating results and financial condition, including our revenue, revenue growth rates, and operating income (loss), could, in the future, be adversely impacted by any such changes. Further, in May 2022, Apple introduced changes for the Apple mail client available on its operating systems, which have impacted, and are expected to continue to impact our ability to track individual users and devices, and measure the effectiveness of our advertisements. Moreover, Google recently announced that it intends to limit access by mobile applications to advertising identifiers on Android devices, likely by the end of 2024. As a result, advertisers may find our products less appealing and may seek alternative platforms on which to run their advertising campaigns.
Further, certain publishers and channels have, from time to time, limited or prohibited advertisements for a variety of reasons. There is no assurance that we will not be limited or prohibited from using certain current or prospective marketing channels in the future. If this were to happen in the case of a significant marketing channel and/or for a significant period of time, our business, operating results, and financial condition could be materially adversely affected.
Our platform and internal systems rely on software and hardware that is highly technical, and any errors, bugs, or vulnerabilities in these systems, or failures to address or mitigate technical limitations in our systems, could adversely affect our business.
Our platform and internal systems rely on software and hardware, including software and hardware developed or maintained internally and/or by third parties, that is highly technical and complex. In addition, our platform and internal systems depend on the ability of such software and hardware to store, retrieve, process, and manage immense amounts of data. The software and hardware on which we rely has contained, and will in the future contain, errors, bugs, or vulnerabilities, and our systems are subject to certain technical limitations that may compromise our ability to meet our objectives. Some errors, bugs, or vulnerabilities inherently may be difficult to detect and may only be discovered after the code has been released for external or internal use. Errors, bugs, vulnerabilities, design defects, or technical limitations within the software and hardware on which we rely have in the past led to, and may in the future lead to, outcomes including a negative experience for neighbors and advertisers who use our platform, compromised ability of our platform to perform in a manner consistent with our terms, contracts, or policies, delayed product introductions or enhancements, targeting, measurement, or billing errors, compromised ability to protect the data of neighbors and/or our intellectual property or other data, or reductions in our ability to provide some or all of our services. For example, we make commitments to our neighbors as to how their data will be used within and across our platform, and our systems are subject to errors, bugs and technical limitations that may prevent us from fulfilling these commitments reliably. In addition, any errors, bugs, vulnerabilities, or defects in our systems or the software and hardware on which we rely, failures to properly address or mitigate the technical limitations in our systems, or associated degradations or interruptions of service or failures to fulfill our commitments to our neighbors, have in the past led to, and may in the future lead to, outcomes including damage to our reputation, loss of neighbors, loss of advertisers, loss of revenue, regulatory inquiries, litigation, or liability for fines, damages, or other remedies, any of which could adversely affect our business, operating results, and financial condition.
Social and ethical issues may result in reputational harm and liability.
Positions we may take (or choose not to take) on social and ethical issues may be unpopular with some of our employees, neighbors, or with our advertisers or potential advertisers, which may in the future impact our ability to attract or retain employees, neighbors or
25
advertisers. Further, actions taken by our customers or partners, including through the use or misuse of our products, may result in reputational harm or possible liability. Any such claims could cause reputational harm to our brand or result in liability.
Our disclosures on environmental, social, and governance (“ESG”) matters, and any standards we may set for ourselves or a failure to meet these standards, may influence our reputation and the value of our brand. For example, we have elected to share publicly certain information about our ESG initiatives and information, and our commitment to the recruitment, engagement and retention of a diverse board and workforce. In addition, the SEC has also proposed additional disclosure requirements regarding, among other ESG topics, the impact our business has on the environment. Moreover, California recently adopted two new climate-related bills, which require companies doing business in California that meet certain revenue thresholds to publicly disclose certain greenhouse gas emissions data and climate-related financial risk reports. California also recently enacted the Voluntary Carbon Market Disclosures Act, which requires companies that operate within the state to make certain climate-related claims and to provide enhanced disclosures around the achievement of such claims. Our business may face increased scrutiny related to these activities and our related disclosures, including from the investment community, and our failure to achieve progress in these areas on a timely basis, or at all, could adversely affect our reputation, business, and financial performance. To the extent the SEC proposals become effective for our company, we will be required to establish additional internal controls, engage additional consultants, and incur additional costs related to evaluating our environmental impact and preparing such disclosures. If we fail to implement sufficient internal controls or accurately capture and disclose, among other things, our environmental impact, our reputation, business, operating results and financial condition may be materially adversely affected.
Risks Related to Financial and Accounting Matters
Our operating results may fluctuate significantly, which makes our future results difficult to predict.
Our quarterly and annual operating results have fluctuated in the past and may fluctuate in the future. Additionally, we have a limited operating history with the current scale of our business, which makes it difficult to forecast our future results and subjects us to a number of uncertainties, including our ability to plan for and anticipate future growth. As a result, you should not rely upon our past quarterly and annual operating results as indicators of future performance. We have encountered, and will continue to encounter, risks and uncertainties frequently experienced by growing companies in rapidly evolving markets, such as the risks and uncertainties described herein. Our operating results in any given quarter can be influenced by numerous factors, many of which are unpredictable or are outside of our control, including, but not limited to:
•our ability to generate revenues from our platform;
•our ability to acquire, retain, and grow our neighbors and neighbor engagement on our platform;
•ability to attract and retain advertisers;
•ability to recognize revenue or collect payments from advertisers in a particular period;
•fluctuations in spending by our advertisers due to macroeconomic conditions, seasonality, episodic regional or global events, or other factors;
•changes in domestic and global business and macroeconomic conditions, including actual or perceived instability in the global banking system, potential recession, uncertainty with respect to the federal budget and debt ceiling and a potential temporary federal government shutdown related thereto, local and national elections, the continued rise of inflation, changing interest rates, and the war in Ukraine and the Israel-Hamas war;
•fluctuations in internet usage generally;
•the number, prominence, size, format, quality and relevancy of advertisements shown to neighbors;
•the success of technologies designed to block the display of advertisements;
•changes to third-party policies or applications that limit our ability to deliver, target, or measure the effectiveness of advertising, including changes by mobile operating system and browser providers such as Apple and Google;
•the pricing of our advertisements;
•the timing, cost of and mix of new and existing sales and marketing and promotional efforts;
26
•the availability of our platform and app on mobile devices and other third-party platforms;
•changes to our platform or the development and introduction of new products or services by our competitors;
•changes in advertising industry association rules and standards that limit our ability to deliver, target or measure the effectiveness of advertising, such as the Network Advertising Initiative, and Interactive Advertising Bureau;
•neighbor behavior or platform changes that may reduce traffic to features of the platform that we monetize;
•system failures, disruptions, breaches of security or privacy, whether on our platform or on those of third parties, and the costs associated with any such breaches and remediation;
•negative publicity associated with our platform, including as a result of content on our platform, security breaches and neighbor privacy concerns that may result in advertisers reducing or eliminating their spend with us;
•health epidemics, such as the COVID-19 pandemic, influenza, and other highly communicable diseases or viruses;
•the timing of incurring additional expenses, such as increases in sales and marketing or research and development;
•adverse litigation judgments, settlements, or other litigation-related costs;
•changes in the legislative or regulatory environment, including with respect to privacy and cybersecurity, or actions by governments or regulators, including fines, orders, or consent decrees; and
•changes in U.S. generally accepted accounting principles.
The impact of one or more of the foregoing and other factors may cause our operating results to vary significantly. As such, quarter-to-quarter comparisons of our operating results may not be meaningful and should not be relied upon as an indication of future performance. If our quarterly and annual operating results fall below the expectations of investors or securities analysts, the price of our Class A common stock could decline substantially. If we fail to meet or exceed the expectations of investors or securities analysts, then the trading price of our Class A common stock could fall substantially, and we could face costly lawsuits, including securities class action suits. Furthermore, any quarterly or annual fluctuations in our operating results may, in turn, cause the price of our Class A common stock to fluctuate substantially.
In addition, we believe that our rapid historical growth may understate the potential seasonality of our business. As our revenue growth rate slows, we expect that the seasonality in our business may become more pronounced and may in the future cause our operating results to fluctuate. For example, advertising spending is traditionally seasonally strong in the fourth quarter of each year and we believe that this seasonality affects our quarterly results, which generally reflect higher sequential revenue growth from the third to fourth quarter compared to sequential revenue growth from the fourth quarter to the subsequent first quarter. In addition, global economic concerns continue to create uncertainty and unpredictability and add risk to our future outlook. An economic downturn in any particular region in which we do business or globally could result in reductions in revenue, as our advertisers reduce their advertising budgets, and other adverse effects that could harm our business, operating results, and financial condition.
Certain of our market opportunities and key metric estimates could prove to be inaccurate, and any real or perceived inaccuracies may harm our reputation and negatively affect our business.
The estimates discussed herein are subject to significant uncertainty and are based on assumptions that may not prove to be accurate. The key assumptions underlying our estimates include our ability to scale new neighbor growth, our ability to grow engagement by our existing neighbor base and our ability to increase monetization of our platform. These assumptions involve risks and uncertainties, including, but not limited to, those described in this “Risk Factors” section, which could cause actual results to differ materially from our estimates. Unfavorable changes in any of these or other assumptions, most of which are beyond our control, could materially and adversely affect our business, operating results, and financial condition and result in our estimates being materially different than actual results. Market opportunity estimates, whether obtained from third-party sources or developed internally, are subject to significant uncertainty and are based on assumptions that may not prove to be accurate. In particular, our estimates regarding our market penetration in new and existing markets are difficult to predict.
We regularly review key business and other metrics, including WAUs, Verified Neighbors and ARPU and other measures to evaluate growth trends, measure our performance, and make strategic decisions. These key metrics are calculated using internal company data derived from our analytics platform and have not been validated by an independent third party and there are inherent challenges in such measurements. For example, in 2021, Apple introduced changes for the Apple mail client available on its operating systems,
27
which have limited, and are expected to continue to limit, our ability to track individual users and devices, and measure user engagement with our emails containing monetizable content for users that use the Apple email client. These changes have affected our ability to calculate WAUs, a key business metric. Because of the introduction of these changes, we are required to rely on estimates based on past user behavior and behavior of users engaging with our monetizable content on email clients other than the Apple email client in order to determine the portion of our WAU figure relating to users that engage solely with emails with monetizable content, which may impact the effectiveness of our analytics platform, as well as the accuracy of our WAU calculations. If we fail to maintain an effective analytics platform, our key metrics calculations may be inaccurate, and we may not be able to identify those inaccuracies. Our key business metrics may also be impacted by compliance or fraud-related bans, technical incidents, or false or spam accounts in existence on our platform. We regularly deactivate accounts that violate our terms of service, and exclude these accounts from the calculation of our key business metrics; however, we may not succeed in identifying and removing all such accounts from our platform. If our metrics are incorrect or provide incomplete information about neighbors and their behavior, we may make inaccurate conclusions about our business.
We regularly review and may adjust our processes for calculating our estimates to improve their accuracy. Our estimates may differ from estimates published by third parties or from similarly titled metrics of our competitors due to differences in methodology. If investors or analysts do not perceive our estimates to be accurate representations of our business, or if we discover material inaccuracies in our estimates, our reputation, business, operating results, and financial condition would be adversely affected.
We have a history of net losses and may experience net losses in the future and we cannot assure you that we will achieve or sustain profitability. If we cannot achieve and sustain profitability, our business, financial condition, and operating results will be adversely affected.
We have experienced significant net losses each year since we began operations in 2007, including net losses of $147.8 million, $137.9 million and $95.3 million for the years ended December 31, 2023, 2022 and 2021, respectively. We have an accumulated deficit of $766.0 million as of December 31, 2023. We anticipate that our operating expenses and capital expenditures will increase in the foreseeable future as we continue to invest in acquiring additional neighbors, increasing engagement on our platform, increasing monetization on our platform, expanding our platform and operations internationally, attracting and retaining team members, developing and enhancing our platform, marketing and sales, and enhancing our infrastructure. Our expansion efforts may prove more expensive than we anticipate, and we may not succeed in increasing our revenues sufficiently to offset these higher expenses. While we consistently evaluate opportunities to reduce our operating costs and optimize efficiencies, including, for example, through our workforce reduction in November 2023, we cannot guarantee that these efforts will be successful or that we will not re-accelerate operating expenditures in the future in order to capitalize on growth opportunities. Given the significant operating and capital expenditures associated with our business plan, we expect to continue to incur net losses for the foreseeable future and cannot assure you that we will be able to achieve profitability. If we do achieve profitability, it cannot be certain that we will be able to sustain or increase such profitability.
Our ability to use our U.S. federal and state net operating losses to offset future taxable income may be subject to certain limitations which could subject our business to higher tax liability.
As of December 31, 2023, we had gross U.S. federal net operating loss (“NOL”) carryforwards of approximately $413.6 million and gross state NOL carryforwards of approximately $280.8 million, which if not utilized, will begin to expire for federal and state income tax purposes beginning in 2028. To the extent that we continue to generate taxable losses, unused losses will carry forward to offset future taxable income, if any. Under the 2017 Tax Cuts and Jobs Act, as modified by the Coronavirus Aid, Relief, and Economic Security Act, unused U.S. federal NOLs generated in tax years beginning after December 31, 2017, will not expire and may be carried forward indefinitely, but the deductibility of such federal NOLs in taxable years beginning after December 31, 2020, is limited to 80% of current year taxable income.
Under Section 382 of the Code, and corresponding provisions of state law, if a corporation that undergoes an “ownership change,” which is generally defined as a greater than 50 percentage point change (by value) in its equity ownership by certain stockholders over a three-year period, the corporation’s ability to utilize its pre-change NOL carryforwards to offset its post-change income or taxes may be limited. Though we recently completed a Section 382 study that supports that our use of NOLs will not be subject to limitation, it is possible that the limitation could still apply.
We may experience ownership change(s) in the future as a result of subsequent shifts in our stock ownership, some of which may be outside our control. Therefore, it is possible that such an ownership change could limit the amount of NOLs we can use to offset future taxable income. Our current NOL carryforwards, and any NOL carryforwards of companies we have acquired, may be subject to limitations, thereby increasing our overall tax liability. Our NOL carryforwards may also be impaired under similar provisions of state law. We have recorded a full valuation allowance related to our U.S. federal and state NOL carryforwards and other net deferred tax assets due to the uncertainty of the ultimate realization of the future benefits of those assets. Our NOL carryforwards may expire
28
unutilized or underutilized, which could prevent us from offsetting future taxable income. Any future changes in U.S. tax laws in respect of the utilization of NOL carryforwards may further affect the limitation in future years. In addition, there may be periods during which the use of NOL carryforwards is suspended or otherwise limited at the state level, which could also impact our ability to utilize NOL carryforwards. As a result, even if we attain profitability, we may be unable to use all or a material portion of our NOLs, which could adversely affect our business, operating results, financial condition, and cash flows.
Our financial results may be adversely affected by changes in accounting principles generally accepted in the United States and our financial estimates may be different from our financial results.
GAAP is subject to interpretation by the Financial Accounting Standards Board, the American Institute of Certified Public Accountants, the SEC and various bodies formed to promulgate and interpret appropriate accounting principles. A change in these principles or interpretations could harm our revenue and financial results, and could affect the reporting of transactions completed before the announcement of a change.
If currency exchange rates fluctuate substantially in the future, our operating results, which are reported in U.S. dollars, could be adversely affected.
As we continue to expand our international operations, we will become more exposed to the effects of fluctuations in currency exchange rates. A substantial majority of our revenues to date have been denominated in U.S. dollars and, therefore, we have not historically been subject to foreign currency risk. In addition, as we continue to expand internationally, we expect to incur increased expenses for employee compensation and other operating expenses at non-U.S. locations in the local currency. Fluctuations in the exchange rates between the U.S. dollar and other currencies could result in the dollar equivalent of such expenses being higher. This could have a negative impact on our operating results. Although we may in the future decide to undertake foreign exchange hedging transactions to cover a portion of our foreign currency exchange exposure, we currently do not hedge our exposure to foreign currency exchange risks.
We may have greater than anticipated tax liabilities, which could harm our business, revenue and financial results.
We operate in a number of tax jurisdictions globally, including in the United States at the federal, state and local levels, and in many foreign countries, and plan to continue to expand the scale of our operations in the future. We are subject to review and potential audit by a number of U.S. and non-U.S. tax authorities. A change in law or in our global operations could result in higher effective tax rates, reduced cash flows and lower overall profitability. In particular, our intercompany relationships are subject to complex transfer pricing regulations administered by taxing authorities in various jurisdictions. Significant judgment is required in determining our worldwide provision for income taxes and other tax liabilities.
We are subject to various indirect non-income taxes, such as payroll, sales, use, value-added and goods and services taxes in the United States and various foreign jurisdictions, and we may face indirect tax audits in various U.S. and foreign jurisdictions. In certain jurisdictions, we collect and remit indirect taxes. However, tax authorities may question, challenge or disagree with our calculation, reporting or collection of taxes and may require us to collect taxes in jurisdictions in which we do not currently do so or to remit additional taxes and interest, and could impose associated penalties and fees. A successful assertion by one or more tax authorities requiring us to collect taxes in jurisdictions in which we do not currently do so or to collect additional taxes in a jurisdiction in which we currently collect taxes, could result in substantial tax liabilities, including taxes on past sales, as well as penalties and interest, could discourage neighbors from utilizing our platform or could otherwise harm our business, operating results, and financial condition.
Although we do not currently incur significant tax costs due to our history of operating losses, our tax liabilities may increase if our profitability increases in the future. In addition, our effective tax rate may change from year to year based on changes in the mix of activities and income allocated or earned among various jurisdictions, tax laws and the applicable tax rates in these jurisdictions (including future tax laws that may become material), tax treaties between countries, our eligibility for benefits under those tax treaties and the valuation of deferred tax assets and liabilities. Such changes could result in an increase in the effective tax rate applicable to all or a portion of our income, which would negatively affect our financial results. In August 2022, President Biden signed into law the Inflation Reduction Act of 2022 (“IRA”). The IRA includes a 15% corporate alternative minimum tax for companies with modified GAAP net income in excess of $1 billion, a 1% excise tax on certain stock repurchases, and numerous environmental and green energy tax credits. Currently, we are not subject to the corporate alternative minimum tax and we do not expect the new law to have a material impact on our results of operations.
29
We cannot guarantee that our Share Repurchase Program will be fully consummated or that it will enhance long-term stockholder value. Share repurchases could also increase the volatility of the trading price of our stock and diminish our cash reserves.
On May 31, 2022, our Board of Directors authorized and approved a share repurchase program (the “Share Repurchase Program”) pursuant to which we may repurchase up to $100.0 million in aggregate of shares of our Class A common stock, with the authorization to expire on June 30, 2024, or such shorter period if $100.0 million in aggregate of shares of our Class A common stock have been repurchased. As of December 31, 2023, we had $22.8 million available for future share repurchases under the Share Repurchase Program. On February 21, 2024, the Company’s Board of Directors authorized and approved an increase of $150.0 million to the Share Repurchase Program and extended the expiration date to March 31, 2026. Although our Board of Directors has authorized this Share Repurchase Program, the program does not obligate us to repurchase any specific dollar amount or to acquire any specific number of shares of our Class A common stock. The actual timing and amount of repurchases remain subject to a variety of factors, including stock price, trading volume, market conditions and other general business considerations, all of which may be negatively impacted by macroeconomic conditions and factors, including rising interest rates and inflation. The Share Repurchase Program may be modified, suspended, or terminated at any time, and we cannot guarantee that the Share Repurchase Program will be fully consummated or that it will enhance long-term stockholder value. The program could affect the trading price of our Class A common stock, increase volatility and diminish our cash and cash equivalents and marketable securities, and any announcement of a termination of this program may result in a decrease in the trading price of our stock.
Risks Related to Legal and Regulatory Matters
We may be liable as a result of content or information that is published or made available on our platform.
We are subject to many U.S. federal and state and foreign laws and regulations that involve matters central to our business, including laws and regulations that involve data privacy and protection, intellectual property (including copyright and patent laws), content regulation, the use of AI, rights of publicity, advertising, marketing, health and safety, competition, protection of minors, age verification, consumer protection, taxation, anti-bribery, anti-money laundering and corruption, economic or other trade prohibitions or sanctions or securities law compliance. Although content on our platform is typically generated by third parties, and not by us, we may be sued or face regulatory liability for claims relating to personal information, content or information that is made available on our service, including claims of defamation, disparagement, intellectual property infringement, breach of our privacy commitments, breach of privacy and data security laws, or other alleged damages could be asserted against us. In addition, the availability of copyright protection and other legal protections for intellectual property generated by certain new technologies, such as generative AI, is uncertain. The use of generative AI and other forms of AI may expose us to risks because the intellectual property ownership and license rights, including copyright, of generative and other AI output, has not been fully interpreted by U.S. courts or been fully addressed by U.S. federal or state regulation, as well as in foreign jurisdictions. Our systems, tools and personnel that help us to proactively detect potentially policy-violating or otherwise inappropriate content cannot identify all such content on our service, and in many cases this content will appear on the Nextdoor platform. This risk may increase as we develop and increase the use of certain features, such as video, for which identifying such content and obtaining appropriate consents is challenging. Additionally, some controversial content may not be banned on the Nextdoor platform and, even if it is not featured in advertisements to neighbors, it may still appear in the Feed or elsewhere. This risk is enhanced in certain jurisdictions outside of the United States where our protection from liability for content published on our platform by third parties may be unclear and where we may be less protected under local laws than we are in the United States. Further, if law and/or policy-violating content is found on the Nextdoor platform, or we do not give appropriate notice or obtain appropriate consents, we may be in violation of the terms of certain of our key agreements, which may result in termination of the agreement and potentially payment of damages in some cases. We could incur significant costs in investigating and defending such claims and, if we are found liable, damages. If any of these events occur, our business, operating results, and financial condition could be harmed.
While we rely on a variety of statutory and common-law frameworks and defenses, including those provided by the DMCA, the CDA, the fair-use doctrine in the United States and the Electronic Commerce Directive in the European Union, differences between statutes, limitations on immunity, requirements to maintain immunity, and moderation efforts in the many jurisdictions in which we operate may affect our ability to rely on these frameworks and defenses, or create uncertainty regarding liability for information or content uploaded by neighbors and advertisers or otherwise contributed by third-parties to our platform.
Actions by governments that restrict access to the Nextdoor platform in their countries, or that otherwise impair our ability to sell advertising in their countries, could substantially harm our business, operating results, and financial condition.
Governments may seek to censor content available on the Nextdoor platform or restrict access to the platform from their country entirely, or impose other restrictions that may affect the accessibility of the platform in their country for an extended period of time or indefinitely. In addition, government authorities in other countries may seek to restrict neighbors’ access to the platform if they consider us to be in violation of their laws or a threat to public safety or for other reasons. It is possible that government authorities could take action that impairs our ability to sell advertising, collect, process, use, store, disclose or transfer data including in countries
30
where access to our consumer-facing platform may be blocked or restricted. In the event that content shown on the Nextdoor platform is subject to censorship, access to the platform is restricted, in whole or in part, in one or more countries, or other restrictions are imposed on the platform, or our competitors are able to successfully penetrate new geographic markets or capture a greater share of existing geographic markets that we cannot access or where we face other restrictions, our ability to retain or increase our neighbor base, neighbor engagement, or the level of advertising by advertisers may be adversely affected, we may not be able to maintain or grow our revenue as anticipated, and our financial results could be adversely affected.
Our business is subject to complex and evolving U.S. and foreign laws, regulations, and industry standards, many of which are subject to change and uncertain interpretations, which uncertainty could harm our business, operating results, and financial condition.
We are subject to many U.S. federal and state and foreign laws, regulations and industry standards that involve matters central to our business, including laws and regulations that involve data privacy, data security, intellectual property (including copyright and patent laws), content, rights of publicity, advertising, marketing, competition, protection of minors, age verification, consumer protection, taxation, and telecommunications. These laws and regulations are constantly evolving and may be interpreted, applied, created, or amended, in a manner that could harm our business. In addition, the introduction of new products, expansion of our activities in certain jurisdictions, or other actions that we may take may subject the company to additional laws, regulations, or other government scrutiny.
We rely on a variety of statutory and common-law frameworks and defenses relevant to the content available on the Nextdoor platform, including the DMCA, the CDA and the fair-use doctrine in the United States, and the Electronic Commerce Directive in the European Union. However, each of these statutes is subject to uncertain or evolving judicial interpretation and regulatory and legislative amendments. For example, in the United States, laws such as the CDA, which have previously been interpreted to provide substantial protection to interactive computer service providers, may change and become less predictable or unfavorable by legislative action or juridical interpretation. There have been various federal and state legislative efforts to restrict the scope of the protections available to online platforms under the CDA, in particular with regards to Section 230 of the CDA, and current protections from liability for third-party content in the United States could decrease or change. Although the U.S. Supreme Court declined to narrow the scope of Section 230 in its Gonzalez v. Google decision, there are still legislative efforts to amend the CDA, which if successful could expose us to additional lawsuits and potential judgments that could seriously harm our business. We could incur significant costs investigating and defending such claims and, if we are found liable, significant damages.
The DSA, signed into law in the European Union on October 19, 2022, is a package of legislation intended to update the liability and safety rules for digital platforms, products, and services. The DSA, which started to apply to our business in February 2024, could negatively impact the scope of the limited immunity provided by the E-Commerce Directive, limit targeted advertising, and require us to expend resources to try to comply with the new regulations or incur liability. The DSA also includes significant penalties for non-compliance. On October 26, 2023, similarly, the United Kingdom’s Online Safety Act became law. The Act creates requirements around monitoring and handling harmful content and will require us to expend resources to try to comply with the new regulations or incur liability. Additionally, Australia’s Online Safety Act 2021, which went into effect in January 2022, and its accompanying Social Media Services Code, which went into effect in December 2023, may impose new obligations and liabilities on platforms with respect to certain types of harmful content. These new and proposed laws, together with any changes to the existing laws and regulations within the jurisdictions in which we operate could require us to expend additional resources to maintain compliance with any new or evolving regulations. As a result, we may incur additional liability, and our business, operating results, and financial condition could be harmed.
We collect, store, use, share and otherwise process data, some of which contains personal information about individuals including, but not limited to, our neighbors, employees and partners including, contact details, network details, and location data. We are therefore subject to U.S. (federal, state, local) and foreign laws and regulations regarding data privacy and security and the processing of personal information and other data from neighbors, employees or business partners. The regulatory framework for privacy, information security, data protection and processing worldwide and interpretations of existing laws and regulations is likely to continue to be uncertain and current or future legislation or regulations in the United States and other jurisdictions, or new interpretations of existing laws and regulations, could significantly restrict or impose conditions on our ability to process data and increase notice or consent requirements before we can utilize advertising technologies.
We have internal and publicly posted policies regarding our collection, processing, use, disclosure, deletion and security of information. Although we endeavor to comply with our policies and documentation, we may at times fail to do so or be accused of having failed to do so. The publication of our privacy policies and other documentation that provide commitments about data privacy
31
and security can subject us to potential actions if they are found to be deceptive, unfair, or otherwise misrepresent our actual practices, which could materially and adversely affect our business, operating results, and financial condition.
In the United States, we are subject to numerous federal, state and local data privacy and security laws and regulations governing the processing of information about individuals. For example, the CCPA establishes certain transparency obligations and creates data privacy rights for users, including rights to access and delete their personal information as well as opt-out of certain sales or transfers of their personal information. The law also prohibits covered businesses from discriminating against consumers (for example, charging more for services) for exercising any of their CCPA rights. The CCPA imposes statutory damages for certain violations of the law as well as a private right of action for certain data breaches that result in the loss of personal information, which increases the likelihood of, and risks associated with, data breach litigation. Additionally, California voters approved a new privacy law, the CPRA, which became effective January 1, 2023 (with a look back to January 1, 2022). The CPRA significantly modifies the CCPA, including by expanding consumers’ rights and establishing a new state agency that is vested with authority to implement and enforce the CPRA. Other states have also passed comparable legislation, with unique compliance requirements relevant to our business. For example, Virginia, Colorado, Connecticut, and Utah have all passed data privacy laws that went into effect in 2023, which may impose obligations similar to or more stringent than those we may face under other data protection laws. Additionally, the Federal Trade Commission and many state attorneys general are interpreting federal and state consumer protection laws to impose standards for the online collection, use, dissemination and security of data. Compliance with these laws and any newly enacted privacy and data security laws or regulations may be challenging and cost- and time-intensive, and may require us to modify our data processing practices and policies and to incur substantial costs and potential liability in an effort to comply with such legislation.
Outside the United States, we are subject to an increasing number of laws, regulations and industry standards that apply to data privacy and security. In Canada, we are subject to the Personal Information Protection and Electronic Documents Act, which governs the collection, use and disclosure of Canadian residents’ personal information in the course of commercial activities. In Australia, we are also subject to, among other laws, Australia’s “Privacy Act 1988” and Australian Privacy Principles (“APPs”), which require us to, among other things: (a) establish a governance framework for managing privacy and data protection; (b) give individuals the option of not identifying themselves or using a pseudonym (unless certain exceptions apply); (c) destroy or de-identify unsolicited personal information that was not obtained for a purpose reasonably necessary or directly related to our business activities; and (d) not transfer or disclose personal information to a party outside of Australia unless consent is obtained, the destination country has substantially similar privacy protections to Australia, or the overseas recipient contractually agrees to comply with the APPs. In the EEA, we are subject to the GDPR and in the United Kingdom, we are subject to the United Kingdom data protection regime consisting primarily of the UK GDPR and the UK Data Protection Act 2018, in each case in relation to our collection, control, processing, sharing, disclosure and other use of data relating to an identifiable living individual (personal data). The GDPR, and national implementing legislation in EEA member states and the United Kingdom, imposes a strict data protection compliance regime, grants new rights for data subjects in regard to their personal data (including the right to be “forgotten” and the right to data portability) and enhances current rights (e.g., data subject access requests).
We are also subject to European Union rules with respect to cross-border transfers of personal data out of the EEA and the United Kingdom. After years of uncertainty following the July 16, 2020 decision of the Court of Justice of the European Union invalidating the EU-U.S. Privacy Shield Framework (the “Privacy Shield”), on July 10, 2023 the European Commission adopted its adequacy decision for the new EU-U.S. Data Privacy Framework (“DPF”). The DPF creates a path forward for personal data to be transferred from the EU to the United States for U.S. entities that have self-certified with the U.S. Department of Commerce.
We are also subject to evolving EU and U.K. privacy laws on cookies and e-marketing. In the EU and the U.K., regulators are increasingly focusing on compliance with current national laws that implement the ePrivacy Directive. The ePrivacy Directive may be replaced by an EU regulation known as the ePrivacy Regulation that will significantly increase fines for non-compliance. In the EU and the U.K., informed consent is required for the placement of certain cookies or similar technologies on a user’s device and for direct electronic marketing and (under the UK GDPR and the GDPR) valid consent is tightly defined, including, a prohibition on pre-checked consents and, in the context of cookies, a requirement to obtain separate consents for each type of cookie or similar technology. While the text of the ePrivacy Regulation is still under development, a December 2021 European court decision and regulators’ guidance are driving increased attention to cookies and tracking technologies. If regulators start to enforce the strict approach in recent guidance, this could lead to substantial costs, require significant systems changes, limit the effectiveness of our marketing activities, divert the attention of our technology personnel, adversely affect our margins, increase costs and subject us to additional liabilities. Regulation of cookies and similar technologies, and any decline of cookies or similar online tracking technologies as a means to identify and potentially target users, may lead to broader restrictions and impairments on our marketing and personalization activities and may negatively impact our efforts to understand users. Furthermore, the EU Artificial Intelligence Act, which was proposed on April 21, 2021 by the European Commission and aims to introduce a common regulatory and legal framework for AI, is expected to pass in the coming months. The EU Artificial Intelligence Act would regulate AI providers and entities making
32
use of AI tools in a professional capacity, and may require the implementation of additional quality assurance controls and measures to be reviewed and approved by regulatory submissions of our products.
While we have put in efforts to comply with these regulations, the uncertainty surrounding enforcement and changing privacy landscapes could change our compliance status. Similarly, there are a number of legislative proposals in the European Union, the United States, at both the federal and state level, as well as other jurisdictions that could impose new obligations or limitations in areas affecting our business.
The costs of complying with these laws and regulations, which in some cases can be enforced by private parties in addition to government entities, are high and likely to increase in the future, particularly as the degree of regulation increases, our business grows and our geographic scope expands. The impact of these laws and regulations may disproportionately affect our business in comparison to our peers in the technology sector that have greater resources. Even though we communicate with lawmakers and regulators in countries and regions in which we conduct business, and despite having a dedicated policy team to monitor legal and regulatory developments, any failure or perceived failure of compliance on our part to comply with the laws and regulations may subject us to significant liabilities or penalties, or otherwise adversely affect our business, financial condition or operating results. Furthermore, it is possible that certain governments may seek to block or limit our products or otherwise impose other restrictions that may affect the accessibility or usability of any or all our products for an extended period of time or indefinitely.
We could be involved in legal disputes that are expensive and time consuming, and, if resolved adversely, could harm our business, operating results, and financial condition.
We are currently involved in, and may in the future be involved in, actual and threatened legal proceedings, claims, investigations and government inquiries arising in the ordinary course of our business, including intellectual property, data privacy, cybersecurity, privacy and other torts, illegal or objectionable content, consumer protection, securities, stockholder derivative claims, employment, governance, workplace culture, contractual rights, civil rights infringement, false or misleading advertising, or other legal claims relating to content or information that is provided to us or published or made available on our platform. Any proceedings, claims or inquiries involving us, whether successful or not, may be time consuming, result in costly litigation, unfavorable outcomes, increased costs of business, may require us to change our business practices or platform, require significant amount of management’s time, may harm our reputation or otherwise harm our business, operating results, and financial condition.
We are currently involved in and have been subject to actual and threatened litigation with respect to third-party patents, trademarks, copyrights and other intellectual property, and may continue to be subject to intellectual property litigation and threats thereof. Companies in the internet, technology and media industries own large numbers of patents, copyrights, trademarks and trade secrets and frequently enter into litigation based on allegations of infringement or other violations of intellectual property rights. As we face increasing competition, grow our business and platform offerings, and become increasingly high profile, the possibility of receiving a larger number of intellectual property claims against the company grows. In addition, various “non-practicing entities” that own patents and other intellectual property rights have asserted, and may in the future attempt to assert, intellectual property claims against us to extract value through licensing or other settlements.
From time to time, we receive letters from patent holders alleging that the Nextdoor platform infringes on their patent rights and from trademark holders alleging infringement of their trademark rights. We also receive letters from holders of copyrighted content alleging infringement of their intellectual property rights. Our technologies and content, including the content that neighbors upload to the platform, may not be able to withstand such third-party claims.
With respect to any intellectual property claims, we may have to seek a license to continue using technologies or engaging in practices found to be in violation of a third-party’s rights, which may not be available on reasonable terms and may significantly increase our operating expenses. A license to continue such technologies or practices may not be available to us at all and we may be required to discontinue use of such technologies or practices or to develop alternative non-infringing technologies or practices. The development of alternative non-infringing technologies or practices could require significant effort and expense or may not be achievable at all. Our business, operating results, and financial condition could be harmed as a result.
The obligations associated with operating as a public company require significant resources and management attention and have, and will continue to, cause us to incur additional expenses, which will adversely affect our profitability.
Operating as a public company has and is expected to continue to increase our expenses as a result of the additional accounting, legal and various other additional expenses associated with operating as a public company and complying with public company disclosure obligations. We are required to comply with certain requirements of the Exchange Act, the Sarbanes-Oxley Act, the Dodd-Frank Wall Street Reform and Consumer Protection Act of 2010, the listing requirements of the NYSE and other applicable securities rules and regulations. The Exchange Act requires, among other things, that we file annual, quarterly, and current reports with respect to our
33
business and operating results with the SEC. We are also required to ensure that we have the ability to prepare financial statements that are fully compliant with all SEC reporting requirements on a timely basis. Compliance with these rules and regulations has increased, and will continue to increase, our legal and financial compliance costs, make some activities more difficult, time-consuming or costly and increase demand on our systems and resources. As a public company, we have and will continue to, among other things:
•prepare and distribute periodic public reports and other stockholder communications in compliance with our obligations under the federal securities laws;
•create or expand the roles and duties of our Board of Directors and committees of the Board of Directors;
•institute more comprehensive financial reporting and disclosure compliance functions; and
•establish new and enhance existing internal policies, including those relating to disclosure controls and procedures.
These changes, and the additional involvement of accountants and legal advisors, will require a significant commitment of additional resources. We might not be successful in complying with these obligations and the significant commitment of resources required for complying with them could have a material adverse effect on our business, financial condition, results of operations and cash flows. If our efforts to comply with new laws, regulations and standards differ from the activities intended by regulatory or governing bodies due to ambiguities related to practice, regulatory authorities may initiate legal proceedings against us, and our business may be harmed. Moreover, the cost of our directors’ and officers’ insurance coverage has increased as a public company. In the future, it may be more expensive or more difficult for us to obtain director and officer liability insurance, and we may be required to accept reduced coverage or incur substantially higher costs to obtain coverage. These factors would also make it more difficult for us to attract and retain qualified members of our Board of Directors and qualified executive officers.
Failure to maintain effective systems of internal controls and disclosure controls could have a material adverse effect on our business, operating results, and financial condition.
Effective internal and disclosure controls are necessary for us to provide reliable financial reports and effectively prevent fraud and to operate successfully as a public company. We are required by the Sarbanes-Oxley Act to design and maintain a system of internal control over financial reporting and disclosure controls and procedures. If we cannot provide reliable financial reports or prevent fraud, our reputation and operating results would be harmed.
Our current controls and any new controls we develop may become inadequate because of changes in conditions in our business. Further, weaknesses in our internal controls may be discovered in the future. Any failure to develop or maintain effective controls, or any difficulties encountered in their implementation or improvement, could harm our operating results, may result in a restatement of our financial statements for prior periods, cause us to fail to meet our reporting obligations, and could adversely affect the results of periodic management evaluations and annual independent registered public accounting firm attestation reports regarding the effectiveness of our internal control over financial reporting that we are required to include in the periodic reports we will file with the SEC. Our independent registered public accounting firm is required to formally attest to the effectiveness of our internal control over financial reporting. Our independent registered public accounting firm may issue a report that is adverse in the event it is not satisfied with the level at which our internal control over financial reporting is documented, designed or operating. Any failure to implement and maintain effective internal control over financial reporting also could adversely affect the results of periodic management evaluations and annual independent registered public accounting firm attestation reports regarding the effectiveness of our internal control over financial reporting that we will eventually be required to include in our periodic reports that are filed with the SEC. Ineffective disclosure controls and procedures and internal control over financial reporting could also cause investors to lose confidence in our reported financial and other information, which would likely have a negative effect on the market price of our Class A common stock.
We have incurred and expect to continue to incur significant expenses and devote substantial management effort toward ensuring compliance with the requirements of Section 404 of the Sarbanes-Oxley Act. As a result of the complexity involved in complying with the rules and regulations applicable to public companies, our management’s attention may be diverted from other business concerns, which could harm our business, operating results, and financial condition. Although we have already hired additional employees to assist us in complying with these requirements, we may need to hire more employees in the future, or engage outside consultants, which will increase our operating expenses.
We are obligated to maintain proper and effective internal control over financial reporting. If we identify material weaknesses in the future, or otherwise fail to maintain an effective system of internal control over financial reporting in the future, we may not be able to accurately or timely report our financial condition or operating results, which may adversely affect investor confidence in our company and, as a result, the value of our Class A common stock.
34
As a public company, we are subject to the reporting requirements of the Exchange Act, the Sarbanes-Oxley Act, and the rules and regulations of the applicable listing standards of the NYSE. We expect that the requirements of these rules and regulations will continue to increase our legal, accounting, and financial compliance costs, make some activities more difficult, time-consuming, and costly, and place significant strain on our personnel, systems, and resources.
The Sarbanes-Oxley Act requires, among other things, that we maintain effective disclosure controls and procedures and internal control over financial reporting. We are continuing to develop and refine our disclosure controls, internal control over financial reporting and other procedures that are designed to ensure information required to be disclosed by us in our financial statements and in the reports that we will file with the SEC is recorded, processed, summarized and reported within the time periods specified in SEC rules and forms, and information required to be disclosed in reports under the Exchange Act is accumulated and communicated to our principal executive and financial officers. In order to maintain and improve the effectiveness of our internal controls and procedures, we have expended, and anticipate that we will continue to expend, significant resources, including accounting related costs and significant management oversight.
If we are unable to assert that our internal control over financial reporting is effective, or if our independent registered public accounting firm is unable to express an opinion on the effectiveness of our internal control, including as a result of any identified material weakness, we could lose investor confidence in the accuracy and completeness of our financial reports, which would cause the price of our Class A common stock to decline, and we may be subject to investigation or sanctions by the SEC. In addition, if we are unable to continue to meet these requirements, we may not be able to remain listed on the NYSE.
Risks Related to Intellectual Property
If we are unable to protect our intellectual property, the value of our brands and other intangible assets may be diminished, and our business, operating results, and financial condition may be adversely affected.
We rely and expect to continue to rely on a combination of confidentiality, assignment, and license agreements with our employees, consultants, and third parties with whom we have relationships, as well as trademark, copyright, patent, trade secret, and domain name protection laws, to protect our proprietary rights. In the United States and internationally, we have filed various applications for protection of certain aspects of our intellectual property, and we currently hold issued patents and copyrights in the United States, issued copyrights in the United States, and multiple trademark registrations in the United States and other foreign countries. Third parties may knowingly or unknowingly infringe our proprietary rights, third parties may challenge proprietary rights held by us, and pending and future trademark and patent applications may not be approved.
Any issued patents may be challenged, invalidated or circumvented, and any rights granted under these patents may not actually provide adequate defensive protection or competitive advantages to us. Patent applications in the United States are typically not published until at least 18 months after filing, or, in some cases, not at all. We cannot be certain that we were the first to make the inventions claimed in our pending patent applications or that we were the first to file for patent protection. Additionally, the process of obtaining patent protection is expensive and time-consuming, and we may not be able to prosecute all necessary or desirable patent applications at a reasonable cost or in a timely manner. Recent changes to the patent laws in the United States may also bring into question the validity of certain software patents and may make it more difficult and costly to prosecute patent applications. Such changes may lead to uncertainties or increased costs and risks surrounding the prosecution, validity, ownership, enforcement, and defense of our issued patents and patent applications and other intellectual property, the outcome of third-party claims of infringement, misappropriation, or other violation of intellectual property brought against us and the actual or enhanced damages (including treble damages) that may be awarded in connection with any such current or future claims, and could have a material adverse effect on our business.
We rely on our trademarks, trade names, and brand names to distinguish our platform from the products of our competitors. However, third parties may have already registered identical or similar marks for products or solutions that also address the software market. Efforts by third parties to limit use of our brand names or trademarks and barriers to the registration of brand names and trademarks may restrict our ability to promote and maintain a cohesive brand throughout our key markets. There can also be no assurance that pending or future U.S. or foreign trademark applications will be approved in a timely manner or at all, or that such registrations will effectively protect our brand names and trademarks. Third parties may also oppose our trademark applications, or otherwise challenge our use of the trademarks. In the event that our trademarks are successfully challenged, we could be forced to rebrand our platform, which would result in loss of brand recognition and would require us to devote resources to advertising and marketing new brands.
In addition, effective intellectual property protection may not be available in every country in which we operate or intend to operate our business. In any or all of these cases, we may be required to expend significant time and expense in order to prevent infringement or to enforce our rights. Although we have generally taken measures to protect our proprietary rights, there can be no assurance that others will not offer products or concepts that are substantially similar to ours and compete with our business. If the protection of our
35
proprietary rights is inadequate to prevent unauthorized use or appropriation by third parties, the value of our brands and other intangible assets may be diminished and competitors may be able to more effectively mimic the Nextdoor platform and methods of operations.
To prevent substantial unauthorized use of our intellectual property rights, it may be necessary to prosecute actions for infringement and/or misappropriation of our proprietary rights against third parties. Any such action could result in significant costs and diversion of our resources and management’s attention, and we cannot assure that we will be successful in such action. Furthermore, many of our current and potential competitors have the ability to dedicate substantially greater resources to enforce their intellectual property rights (or to contest claims of infringement) than we do. Accordingly, despite our efforts, we may not be able to prevent third parties from knowingly or unknowingly infringing upon, misappropriating or circumventing our intellectual property rights. If we are unable to protect our proprietary rights (including aspects of our software and platform protected other than by patent rights), we will find ourselves at a competitive disadvantage to others who need not incur the additional expense, time and effort required to create our platform. Moreover, we may need to expend additional resources to defend our intellectual property rights in foreign countries, and our inability to do so could impair our business, results of operations and financial condition or adversely affect our business, operating results, and financial condition.
Confidentiality agreements with employees and others may not adequately prevent disclosure of trade secrets and proprietary information.
We have devoted substantial resources to the development of our intellectual property and proprietary rights. To protect our intellectual property and proprietary rights, we rely in part on confidentiality agreements with our employees, vendors, licensees, independent contractors and other advisors. These agreements may not effectively prevent disclosure of confidential information and may not provide an adequate remedy in the event of unauthorized disclosure of confidential information. Effective trade secret protection may also not be available in every country in which the Nextdoor platform is available or where we have employees or independent contractors. The loss of trade secret protection could make it easier for third parties to compete with the Nextdoor platform by copying functionality. In addition, any changes in, or unexpected interpretations of, the trade secret and employment laws in any country in which we operate may compromise our ability to enforce our trade secret and intellectual property rights. In addition, others may independently discover trade secrets and proprietary information and in such cases, we could not assert any trade secret rights against such parties. Costly and time-consuming litigation could be necessary to enforce and determine the scope of our proprietary rights and failure to obtain or maintain trade secret protection could adversely affect our competitive business position.
Third parties may claim that our platform infringes their intellectual property rights and this may create liability for us or otherwise adversely affect our business, operating results, and financial condition.
Third parties may claim that the Nextdoor platform infringes their intellectual property rights, and such claims may result in legal claims against us and our technology partners and customers. These claims may damage our brand and reputation and create liability for us. We expect the number of such claims to increase as the functionality of our platform overlaps with that of other products and services, and as the volume of issued software patents and patent applications continues to increase.
Companies in the software and technology industries own large numbers of patents, copyrights, trademarks, and trade secrets and frequently enter into litigation based on allegations of infringement or other violations of intellectual property rights. In addition, many of these companies have the capability to dedicate substantially greater resources to enforce their intellectual property rights and to defend claims that may be brought against them. Furthermore, patent holding companies, non-practicing entities, and other adverse patent owners that are not deterred by our existing intellectual property protections may seek to assert patent claims against us. We have received, and may in the future receive, notices that claim we have misappropriated, misused, or infringed other parties’ intellectual property rights, and, to the extent we gain greater market visibility, we may face a higher risk of being the subject of intellectual property infringement claims.
We may also face exposure to third party intellectual property infringement, misappropriation, or violation actions if we engage software engineers or other personnel who were previously engaged by competitors or other third parties and those personnel inadvertently or deliberately incorporate proprietary technology of third parties into our products. In addition, we may lose valuable intellectual property rights or personnel. A loss of key personnel or their work product could hamper or prevent our ability to develop, market and support potential products or enhancements, which could severely harm our business. Any intellectual property claims, with or without merit, could be very time-consuming, could be expensive to settle or litigate, and could divert our management’s attention and other resources. These claims could also subject us to significant liability for damages, potentially including treble damages if we are found to have willfully infringed patents or copyrights. These claims could also result in us having to stop using technology found to be in violation of a third party’s rights. We might be required to seek a license for the intellectual property, which may not be available on reasonable terms or at all. Even if a license were available, we could be required to pay significant royalties,
36
which would increase our operating expenses. Alternatively, we could be required to develop alternative non-infringing technology, which could require significant time, effort, and expense, and may affect the performance or features of our platform. If we cannot license or develop alternative non-infringing substitutes for any infringing technology used in any aspect of our business, we would be forced to limit use of our platform. Any of these results would adversely affect our business, operating results and financial condition.
Our use of “open source” software could subject us to possible litigation or could prevent us from offering products that include open source software or require us to obtain licenses on unfavorable terms.
A portion of the technologies we use incorporates “open source” software, and we may incorporate open source software in the future. Open source software is generally licensed by its authors or other third parties under open source licenses. These licenses may subject us to certain unfavorable conditions, including requirements that we offer our products that incorporate the open source software for no cost, that we make publicly available the source code for any modifications or derivative work we create based upon, incorporating or using the open source software, or that we license such modifications or derivative works under the terms of the particular open source license. From time to time, companies that use third-party open source software have also faced claims challenging the use of such open source software and their compliance with the terms of the applicable open source license. We may be subject to suits by parties claiming ownership of what we believe to be open source software, or claiming non-compliance with the applicable open source licensing terms.
In addition to using open source software, we also license to others some of our software through open source projects. Open sourcing our own software requires the company to make the source code publicly available, and therefore can affect our ability to protect our intellectual property rights with respect to that software. Additionally, if a third-party software provider has incorporated open source software into software that we license from such provider, we could be required to disclose any of our source code that incorporates or is a modification or derivative work of such licensed software. If an author or other third party that distributes open source software that we use or license were to allege that we had not complied with the conditions of the applicable license, we could be required to incur significant legal expenses defending against such allegations and could be subject to significant damages, enjoined from offering our products that contained the open source software, required to release proprietary source code, required to obtain licenses from third parties or otherwise required to comply with the unfavorable conditions unless and until we can re-engineer the product so that it complies with the open source license or does not incorporate the open source software.
The terms of many open source licenses have not been interpreted by U.S. or foreign courts, and accordingly there is a risk that those licenses could be construed in a manner that imposes unanticipated conditions or restrictions on our ability to commercialize our platform. In that event, we could be required to seek licenses from third parties in order to continue offering our platform, to re-develop our platform, or to release our proprietary source code under the terms of an open source license, any of which could harm our business. Enforcement activity for open source licenses can also be unpredictable. Were it determined that our use was not in compliance with a particular license, we may be required to release our proprietary source code, defend claims, pay damages for breach of contract or copyright infringement, grant licenses to our patents, re-engineer our platform, or take other remedial action that may divert resources away from our product development efforts, any of which could negatively impact our business. Open source compliance problems can also result in damage to reputation and challenges in recruitment or retention of engineering personnel. Further, given the nature of open source software, it may be more likely that third parties might assert copyright and other intellectual property infringement claims against us based on our use of these open source software programs. Litigation could be costly for us to defend, have a material adverse effect on our business, results of operations and financial condition, or require us to devote additional development resources to change our platform.
We license technology from third parties, and our inability to maintain those licenses could harm our business.
We currently incorporate, and will in the future continue to incorporate, technology that we license from third parties, including software, into our platform. Licensing technologies from third parties exposes us to increased risk of being the subject of intellectual property infringement due to, among other things, our lower level of visibility into the development process with respect to such technology and the care taken to safeguard against infringement risks. We cannot be certain that our licensors do not or will not infringe on the intellectual property rights of third parties or that our licensors have or will have sufficient rights to the licensed intellectual property in all jurisdictions in which we operate. Some of our agreements with our licensors may be terminated by them for convenience, or otherwise provide for a limited term. If we are unable to continue to license technology because of intellectual property infringement claims brought by third parties against our licensors or against us, or if we are unable to continue our license agreements or enter into new licenses on commercially reasonable terms, our ability to develop our platform that is dependent on that technology would be limited, and our business could be harmed. Additionally, if we are unable to license technology from third parties, we may be forced to acquire or develop alternative technology, which we may be unable to do in a commercially feasible manner or at all, and may require us to use alternative technology of lower quality or performance standards. As a result, our business, operating results and financial condition would be adversely affected.
37
Risks Related to Ownership of Our Class A Common Stock
The price of our Class A common stock has been and may continue to be volatile.
The trading price of our Class A common stock has been, and is likely to continue to be volatile and could be subject to fluctuations in response to various factors, some of which are beyond our control. Factors that could cause fluctuations in the trading price of our Class A common stock include the following:
•actual or anticipated fluctuations in our user growth, retention, engagement, revenue, or other operating results;
•developments involving our competitors;
•variations between our actual operating results and the expectations of securities analysts, investors, and the financial community;
•actual or anticipated fluctuations in our quarterly or annual operating results;
•any forward-looking financial or operating information we may provide to the public or securities analysts, any changes in this information, or our failure to meet expectations based on this information;
•publication of research reports by securities analysts about us, our competitors or our industry;
•the public’s reaction to our press releases, our other public announcements and our filings with the SEC;
•additional shares of our Class A common stock being sold into the market by us or our existing stockholders, or the anticipation of such sales, or if existing stockholders subject to a lock-up sell shares into the market when applicable “lock-up” periods end;
•additions and departures of key personnel;
•commencement of, or involvement in, litigation involving us;
•changes in our capital structure, such as future issuances of securities or the incurrence of additional debt;
•the volume of shares of our Class A common stock available for public sale;
•announcements by us or our competitors of significant products or features, technical innovations, acquisitions, strategic partnerships, joint ventures, or capital commitments;
•announcements by us or estimates by third parties of actual or anticipated changes in the size of our user base or the level of user engagement;
•changes in operating performance and stock market valuations of technology companies in our industry, including our partners and competitors;
•the impact of interest rate increases on the overall stock market and the market for technology company stocks;
•price and volume fluctuations in the overall stock market, including as a result of trends in the economy as a whole;
•developments in new legislation and pending lawsuits or regulatory actions, including interim or final rulings by judicial or regulatory bodies; and
•other events or factors, including those resulting from recessions, rising inflation, changing interest rates, local and national elections, actual or perceived instability in the global banking system, international currency fluctuations, corruption, political instability and acts of war or terrorism, such as the war in Ukraine and the Israel-Hamas war.
In addition, extreme price and volume fluctuations in the stock markets have affected and continue to affect many technology companies’ stock prices. Often, their stock prices have fluctuated in ways unrelated or disproportionate to the companies’ operating performance. In the past, stockholders have filed securities class action litigation following periods of market volatility. If we were to become involved in securities litigation, it could subject us to substantial costs, divert resources and the attention of management from our business, and seriously harm our business.
38
The dual class structure of our common stock may adversely affect the trading market for our Class A common stock.
Certain stock index providers limit the eligibility of public companies with multiple classes of shares of common stock from inclusion in their indices. In addition, several shareholder advisory firms have announced their opposition to the use of multiple class structures. As a result, the dual class structure of our common stock may prevent the inclusion of our Class A common stock in such indices and may cause shareholder advisory firms to publish negative commentary about our corporate governance practices or otherwise seek to cause us to change our capital structure. Any such exclusion from indices could result in a less active trading market for our Class A common stock. Any actions or publications by shareholder advisory firms critical of our corporate governance practices or capital structure could also adversely affect the value of our Class A common stock.
The dual class structure of our common stock has the effect of concentrating voting power with our management and other existing stockholders, which will limit your ability to influence the outcome of important transactions, including a change in control.
Our Class B common stock has 10 votes per share and our Class A common stock has one vote per share. Stockholders who hold shares of our Class B common stock, including certain of our executive officers, employees, and directors and their affiliates, together hold a substantial majority of the voting power of our outstanding capital stock as of December 31, 2023. Because of the 10-to-1 voting ratio between our Class B common stock and Class A common stock, the holders of our Class B common stock collectively control a majority of the combined voting power of common stock and therefore are able to control all matters submitted to our stockholders for approval so long as the shares of Class B common stock represent at least 9.1% of all outstanding shares of our Class A common stock and Class B common stock. This concentrated control will limit or preclude your ability to influence the outcome of important corporate matters, including a change in control, for the foreseeable future.
Transfers by holders of our Class B common stock will generally result in those shares converting to Class A common stock, subject to limited exceptions, such as certain transfers effected for estate planning or charitable purposes. The conversion of Class B common stock to Class A common stock will have the effect, over time, of increasing the relative voting power of those holders of Class B common stock who retain their shares in the long term.
We do not intend to pay cash dividends for the foreseeable future.
We currently intend to retain our future earnings, if any, to finance the further development and expansion of our business, as well as to fund our Share Repurchase Program, and do not intend to pay cash dividends in the foreseeable future. Any future determination to pay dividends will be at the discretion of our Board of Directors and will depend on our financial condition, results of operations, capital requirements, restrictions contained in future agreements and financing instruments, business prospects and such other factors as our Board of Directors deems relevant. As a result, you may only receive a return on your investment in our Class A common stock if the market price of our Class A common stock increases.
If analysts do not publish research about our business or if they publish inaccurate or unfavorable research, our stock price and trading volume could decline.
The trading market for our Class A common stock will depend in part on the research and reports that analysts publish about our business. We do not have any control over these analysts. If one or more of the analysts who cover our company downgrade our Class A common stock or publish inaccurate or unfavorable research about our business, the price of our Class A common stock would likely decline. If few analysts cover our company, demand for our Class A common stock could decrease and our Class A common stock price and trading volume may decline. Similar results may occur if one or more of these analysts stop covering us in the future or fail to publish reports on us regularly.
We may be subject to securities litigation, which is expensive and could divert management attention.
The market price of our Class A common stock may be volatile and, in the past, companies that have experienced volatility in the market price of their stock have been subject to securities class action litigation. We may be the target of this type of litigation in the future. Securities litigation against us could result in substantial costs and divert management’s attention from other business concerns, which could seriously harm our business.
Future resales of our Class A common stock may cause the market price of our securities to drop significantly, even if our business is doing well.
Sales of a substantial number of shares of our Class A common stock in the public market could occur at any time. These sales, or the perception in the market that the holders of a large number of our Class A common stock intend to sell shares, could reduce the market price of our Class A common stock. As of December 31, 2023, we had 186,415,075 shares of our Class A common stock outstanding.
39
We have filed a registration statement related to the offer and sale from time to time by the selling securityholders named in the prospectus that forms a part of the registration statement of up to 206,159,498 shares of our Class A common stock, which registration statement has been declared effective by the SEC. To the extent shares are sold into the market pursuant to a registration statement that has been declared effective by the SEC, under Rule 144 or otherwise, particularly in substantial quantities, the market price of our Class A common stock could decline.
Provisions in our charter documents and under Delaware law, including anti-takeover provisions, could make an acquisition of us, which may be beneficial to our stockholders, more difficult and may limit attempts by our stockholders to replace or remove our current management.
Provisions in our Amended and Restated Certificate of Incorporation (the “Certificate of Incorporation”) and our Amended and Restated Bylaws (the “Bylaws”), including anti-takeover provisions, may have the effect of delaying or preventing a merger, acquisition or other change of control of the company that our stockholders may consider favorable. In addition, because our Board of Directors is responsible for appointing the members of our management team, these provisions may frustrate or prevent any attempts by our stockholders to replace or remove our current management by making it more difficult for stockholders to replace members of our Board of Directors. Among other things, our Certificate of Incorporation and Bylaws include provisions that:
•provide that our Board of Directors is classified into three classes of directors with staggered three-year terms;
•permit our Board of Directors to establish the number of directors and fill any vacancies and newly created directorships;
•require super-majority voting to amend some provisions in our Certificate of Incorporation and Bylaws;
•authorize the issuance of “blank check” preferred stock that our Board of Directors could use to implement a stockholder rights plan;
•provide that only our chairperson of the Board of Directors, our chief executive officer, the lead independent director or a majority of our Board of Directors will be authorized to call a special meeting of stockholders;
•eliminate the ability of our stockholders to call special meetings of stockholders;
•do not provide for cumulative voting;
•provide that directors may only be removed “for cause” and only with the approval of two-thirds of our stockholders;
•provide for a dual class common stock structure in which holders of our Class B common stock may have the ability to control the outcome of matters requiring stockholder approval, even if they own significantly less than a majority of the outstanding shares of our common stock, including the election of directors and other significant corporate transactions, such as a merger or other sale of our company or its assets;
•prohibit stockholder action by written consent, which requires all stockholder actions to be taken at a meeting of our stockholders;
•provide that our Board of Directors is expressly authorized to make, alter, or repeal our Bylaws; and
•establish advance notice requirements for nominations for election to our Board of Directors or for proposing matters that can be acted upon by stockholders at annual stockholder meetings.
Moreover, Section 203 of the Delaware General Corporation Law (“DGCL”) may discourage, delay, or prevent a change in control of our company. Section 203 imposes certain restrictions on mergers, business combinations, and other transactions between us and holders of 15% or more of our common stock.
Our Certificate of Incorporation contains exclusive forum provisions for certain claims, which may limit our stockholders’ ability to obtain a favorable judicial forum for disputes with us or our directors, officers, or employees.
Our Certificate of Incorporation provides that the Court of Chancery of the State of Delaware, to the fullest extent permitted by law, will be the exclusive forum for any derivative action or proceeding brought on our behalf, any action asserting a breach of fiduciary duty, any action asserting a claim against us arising pursuant to the DGCL, our Certificate of Incorporation, our Bylaws, or any action asserting a claim against us that is governed by the internal affairs doctrine.
40
Moreover, Section 22 of the Securities Act creates concurrent jurisdiction for federal and state courts over all claims brought to enforce any duty or liability created by the Securities Act or the rules and regulations thereunder. Our Certificate of Incorporation provides that the federal district courts of the United States will, to the fullest extent permitted by law, be the exclusive forum for resolving any complaint asserting a cause of action arising under the Securities Act (“Federal Forum Provision”). Our decision to adopt a Federal Forum Provision followed a decision by the Supreme Court of the State of Delaware holding that such provisions are facially valid under Delaware law. While there can be no assurance that federal or state courts will follow the holding of the Delaware Supreme Court or determine that the Federal Forum Provision should be enforced in a particular case, application of the Federal Forum Provision means that suits brought by our stockholders to enforce any duty or liability created by the Securities Act must be brought in federal court and cannot be brought in state court.
Section 27 of the Exchange Act creates exclusive federal jurisdiction over all claims brought to enforce any duty or liability created by the Exchange Act or the rules and regulations thereunder. In addition, the Federal Forum Provision applies to suits brought to enforce any duty or liability created by the Exchange Act. Accordingly, actions by our stockholders to enforce any duty or liability created by the Exchange Act or the rules and regulations thereunder must be brought in federal court.
Our stockholders will not be deemed to have waived our compliance with the federal securities laws and the regulations promulgated thereunder.
Any person or entity purchasing or otherwise acquiring or holding any interest in any of our securities shall be deemed to have notice of and consented to our exclusive forum provisions, including the Federal Forum Provision. These provisions may limit a stockholders’ ability to bring a claim in a judicial forum of their choosing for disputes with us or our directors, officers, or employees, which may discourage lawsuits against us and our directors, officers, and employees. Alternatively, if a court were to find the choice of forum provision contained in our Certificate of Incorporation and Bylaws to be inapplicable or unenforceable in an action, we may incur additional costs associated with resolving such action in other jurisdictions, which could harm our business, financial condition, and operating results.
Item 1B. Unresolved Staff Comments
None.
Item 1C. Cybersecurity
Risk Management and Strategy
Our cybersecurity policies, standards, processes and practices are based on applicable laws and regulations and informed by industry standards and industry-recognized practices. Our strategy to assess, identify, and manage material cybersecurity risks is through a comprehensive, cross-functional approach that is focused on preserving the confidentiality, security, and availability of our information systems and data. We implement security measures and processes to identify, prevent, and mitigate cybersecurity threats and to effectively respond to cybersecurity incidents when they occur. Our cyber risk management includes: (1) enterprise risk management to identify top cybersecurity risks; (2) vulnerability management to identify software vulnerabilities and risks related to compute infrastructure; (3) vendor risk management to identify risks related to third parties and business partners, which includes pre-engagement review, use of contractual security provisions, and continued monitoring, as applicable; (4) privacy risk management to identify privacy risks in our product and platforms and ensure regulatory compliance; (5) security monitoring to analyze and assess threat activity in real time; and (6) security incident response to investigate, respond to, and mitigate cyber threats. We regularly engage third parties to identify risks in our underlying software and infrastructure, to provide threat intelligence, and to assist in triaging, identifying, and responding to cyber threats.
In 2023, we did not identify any cybersecurity threats that have materially affected or are reasonably likely to materially affect our business strategy, results of operations, or financial condition. However, despite our efforts, we cannot eliminate all risks from cybersecurity threats, or provide assurances that we have not experienced undetected cybersecurity incidents. For more information regarding cybersecurity risks that we face and potential impacts on our business related thereto, see the section entitled “Risk Factors — Security breaches, including improper access to or disclosure of our data or our neighbors’ data, or other hacking and phishing attacks on our or third-party systems, could harm our reputation and adversely affect our business.”
Governance
Our Board of Directors maintains oversight of risks from cybersecurity threats by meeting with and receiving periodic updates from our Chief Information Security Officer (“CISO”), via our Audit & Risk Committee, which is assigned oversight of cybersecurity risks. Our Audit & Risk Committee is responsible for ensuring that management has processes in place designed to identify and evaluate
41
cybersecurity risks to which the company is exposed and to implement processes and programs to manage cybersecurity risks and mitigate cybersecurity incidents.
Our CISO, has over 20 years of experience in the technology and cybersecurity, including senior leadership roles in software security, penetration testing, and incident response. Our CISO attained and maintains multiple security certifications including CISSP (Certified Information Security Professional). Prior to Nextdoor, our CISO led Software Security at the Federal Reserve’s National Incident Response Team.
Item 2. Properties
We are headquartered in San Francisco, California. As of December 31, 2023, we maintained offices in various locations in the United States and internationally, including approximately 115,770 square feet for our corporate headquarters. All of our facilities are leased. We believe that our current facilities are adequate to meet our current needs and that, should it be needed, suitable additional or alternative space will be available to accommodate our operations.
Item 3. Legal Proceedings
From time to time, we may be subject to legal proceedings and claims in the ordinary course of business. We are not presently a party to any legal proceedings that, if determined adversely to us, would individually or taken together have a material adverse effect on our business or financial results.
Item 4. Mine Safety Disclosures
Not applicable.
42
PART II
Item 5. Market for Registrant’s Common Equity, Related Stockholder Matters and Issuer Purchases of Equity Securities
Market Information for Common Stock
Our Class A common stock began trading on the New York Stock Exchange under the symbol “KIND” on November 8, 2021. Prior to that date, there was no public trading market for our Class A common stock.
Our Class B common stock is not listed or traded on any stock exchange.
Holders of Record
As of February 23, 2024, there were 72 stockholders of record of our Class A common stock and 318 stockholders of record of our Class B common stock. The actual number of holders of our Class A and Class B common stock is greater than the number of record holders and includes stockholders who are beneficial owners, but whose shares are held in street name by brokers or other nominees. The number of holders of record presented here also does not include stockholders whose shares may be held in trust by other entities.
Dividend Policy
We have never declared nor paid any cash dividends on our capital stock and do not expect to pay any dividends on our capital stock in the foreseeable future. Any future determination relating to our dividend policy will be at the discretion of our Board of Directors, subject to applicable laws, and will depend on our financial condition, results of operations, capital requirements, general business conditions, and other factors that our Board of Directors considers relevant. In addition, our ability to pay dividends may be limited by covenants of any future indebtedness we incur.
Securities Authorized for Issuance Under Equity Compensation Plans
The information required by this item will be included in our Proxy Statement (the “Proxy Statement”) for the 2024 Annual Meeting of Stockholders, to be filed with the SEC within 120 days of the year ended December 31, 2023, and is incorporated herein by reference.
Sales of Unregistered Securities
None.
Use of Proceeds
On March 26, 2021, KVSB consummated its initial public offering of 40,000,000 public shares. On March 30, 2021 in connection with the underwriters’ election to partially exercise their over-allotment option, KVSB sold an additional 1,634,412 public shares to cover over-allotments. The public shares were sold at a price of $10.00 per share, generating total gross proceeds of $416.3 million from the initial public offering and partial exercise of the underwriters’ over-allotment option. The securities sold in the offering were registered under the Securities Act on a registration statement on Form S-1 (No. 333-253098). The registration statement became effective on March 23, 2021.
Simultaneously with the consummation of the initial public offering, KVSB consummated a private placement of 1,100,000 private placement shares, at a price of $10.00 per share, to Khosla Ventures SPAC Sponsor II LLC (the “Sponsor”), generating gross proceeds to KVSB of $11.0 million. In connection with the underwriters’ partial exercise of their over-allotment option that closed on March 30, 2021, KVSB also consummated the sale of an additional 32,688 private placement shares to the Sponsor, generating gross proceeds of $0.3 million. Such securities were issued pursuant to the exemption from registration contained in Section 4(a)(2) of the Securities Act.
KVSB incurred $23.6 million in offering costs for its initial public offering including $14.6 million of deferred underwriting fees, $8.3 million of underwriting discounts and commissions, and $0.7 million of other costs. Following the initial public offering, the partial exercise of the over-allotment option, and the sale of the private placement shares, a total of $416.3 million was deposited into the trust account for the purpose of effecting an initial business combination. As of November 5, 2021, the record date of the Business Combination, there was $416.4 million held in the trust account. After deducting payments to existing KVSB shareholders of $12.2 million in connection with their exercise of redemption rights, the payment of the $14.6 million of deferred underwriting fees, and $28.9 million of expenses in connection with the Business Combination paid from the trust account, the remainder of the trust account is now held on our balance sheet to fund our operations and continued growth.
43
Issuer Purchases of Equity Securities
Share Repurchases
On May 31, 2022, our Board of Directors authorized and approved the Share Repurchase Program to repurchase up to $100.0 million in aggregate of our Class A common stock, with the authorization to expire on June 30, 2024. We did not repurchase or retire any shares of Class A common stock during the year ended December 31, 2023. As of December 31, 2023, we had $22.8 million available for future share repurchases under the Share Repurchase Program. On February 21, 2024, the Company’s Board of Directors authorized and approved an increase of $150.0 million to the Share Repurchase Program and extended the expiration date to March 31, 2026.
Stock Performance Graph
This performance graph shall not be deemed “soliciting material” or to be “filed” with the SEC for purposes of Section 18 of the Exchange Act, or otherwise subject to the liabilities under that Section, and shall not be deemed to be incorporated by reference into any filing of Nextdoor Holdings, Inc. under the Securities Act of 1933, as amended (the “Securities Act”), or the Exchange Act.
The following graph shows a comparison of the cumulative total return for our Class A common stock, the Standard & Poor's 500 Stock Index (“S&P 500 Index”) and the Dow Jones Internet Composite Index (“DJ Internet Composite”). An investment of $100 and reinvestment of all dividends is assumed to have been made in our Class A common stock and in each index on November 8, 2021, the date our Class A common stock began trading on the New York Stock Exchange, and its relative performance is tracked through December 31, 2023. The stock price performance of the following graph is not necessarily indicative of future stock price performance.
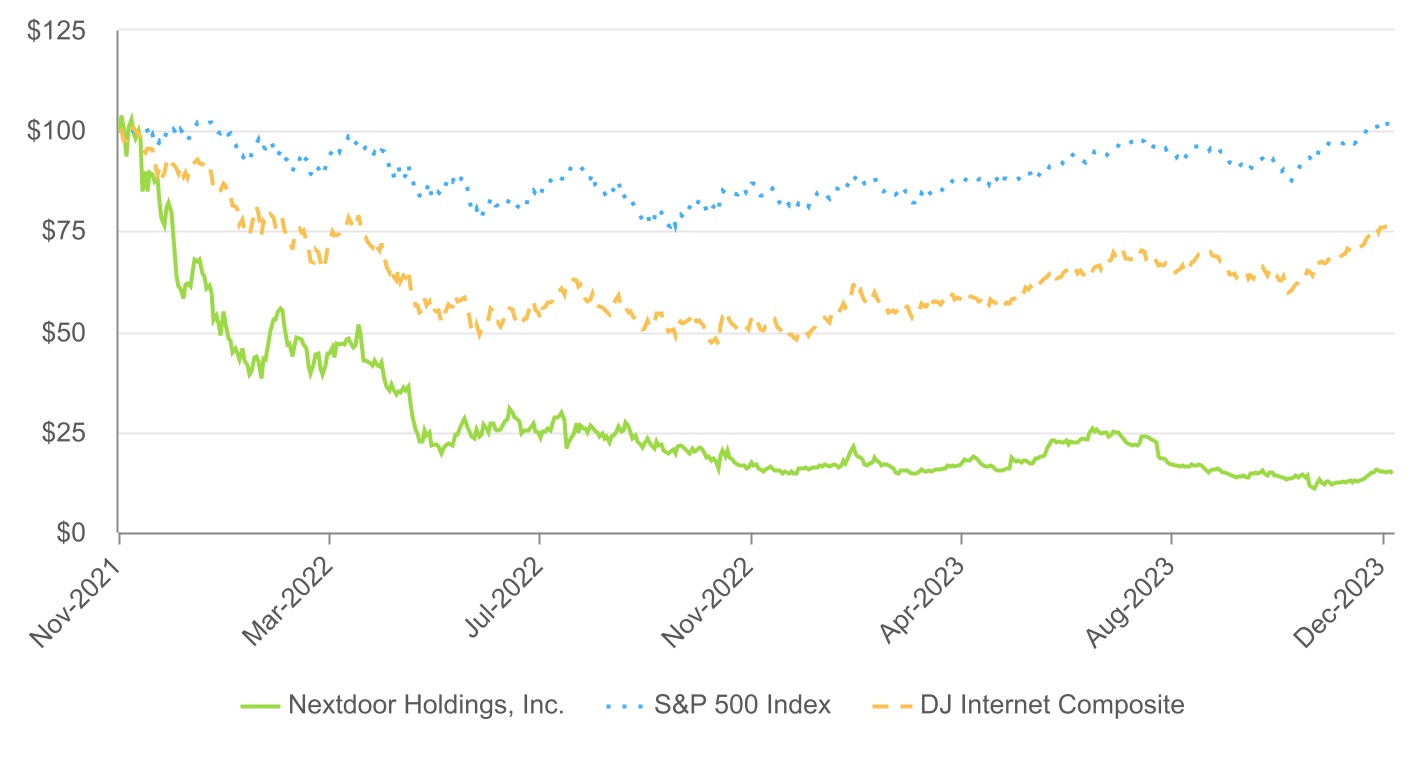
Item 6. [Reserved]
44
Item 7. Management’s Discussion and Analysis of Financial Condition and Results of Operations
The following discussion and analysis provides information which our management believes is relevant to an assessment and understanding of our consolidated results of operations and financial condition. The discussion should be read together with our consolidated financial statements and related notes that are included elsewhere in this Annual Report. This discussion may contain forward-looking statements based upon current expectations that involve risks and uncertainties. Our actual results may differ materially from those anticipated in these forward-looking statements as a result of various factors, including those set forth under “Special Note Regarding Forward-Looking Statements” and “Risk Factors” or in other parts of this Annual Report.
Discussions regarding our financial condition and results of operations for the year ended December 31, 2023 compared to the year ended December 31, 2022 are presented below. Discussions regarding our financial condition and results of operations for the year ended December 31, 2022 compared to the year ended December 31, 2021 are located in Part II, Item 7, “Management’s Discussion and Analysis of Financial Condition and Results of Operations” of our Annual Report on Form 10-K for the year ended December 31, 2022, filed with the SEC on February 28, 2023.
Overview
At Nextdoor, our purpose is to cultivate a kinder world where everyone has a neighborhood they can rely on. Neighbors around the world turn to Nextdoor to receive trusted information, give and get help, get things done, and build real world connections with those nearby — neighbors, businesses, and public services. By fostering these connections, both online and in the real world, Nextdoor builds stronger, more vibrant, and more resilient neighborhoods. As of December 31, 2023, Nextdoor was in more than 325,000 neighborhoods around the world and in 1 in 3 households in the United States. As of the end of the fourth quarter of 2023, Nextdoor had 88 million global Verified Neighbors.
Key business metrics for the three months ended December 31, 2023 are as follows:
•Weekly active users (“WAUs”) were 41.8 million, an increase of 5% compared to the three months ended December 31, 2022.
•Average revenue per weekly active user (“ARPU”) was $1.33 and remained flat compared to the three months ended December 31, 2022.
Financial Results as of and for the year ended December 31, 2023 are as follows:
•Revenue was $218.3 million, an increase of 3% compared to 2022.
•Total costs and expenses were $390.6 million, an increase of 9% compared to 2022, including $11.1 million of restructuring charges.
•Net loss increased 7% to $147.8 million in 2023, compared to $137.9 million in 2022.
•Adjusted EBITDA loss decreased 2% to $74.1 million in 2023, compared to $75.5 million in 2022.
•Cash, cash equivalents, and marketable securities were $531.1 million.
See “Management’s Discussion and Analysis of Financial Condition and Results of Operations—Non-GAAP Financial Measure” below for more information and for a reconciliation of net loss, the most directly comparable financial measure calculated and presented in accordance with U.S. generally accepted accounting principles (“GAAP”), to Adjusted EBITDA.
Restructuring
In the fourth quarter of 2023, we announced a cost reduction plan (the “Cost Reduction Plan”) intended to right size the business and align the workforce and other expenses with our near term revenue expectations and long term business priorities. The Cost Reduction
45
Plan included a reduction of full-time employee headcount by approximately 25%. The execution of the Cost Reduction Plan was substantially complete by the end of the fourth quarter of 2023.
The following table summarizes the restructuring charges in the consolidated statements of operations for the year ended December 31, 2023 (in thousands):
| Severance and Related Charges | Stock-Based Compensation Expense | Total | |||||||||||||||
| Research and development | $ | 5,141 | $ | 903 | $ | 6,044 | |||||||||||
| Sales and marketing | 2,984 | 228 | 3,212 | ||||||||||||||
| General and administrative | 1,763 | 80 | 1,843 | ||||||||||||||
| Total | $ | 9,888 | $ | 1,211 | $ | 11,099 | |||||||||||
Refer to Note 14 to our consolidated financial statements for further information on our restructuring charges.
Key Business Metrics
In addition to the measures presented in our consolidated financial statements, we use the following key business metrics to evaluate our business, measure our performance, develop financial forecasts, and make strategic decisions:
Weekly Active Users (WAUs)
We define a Weekly Active User (“WAU”) as a Nextdoor user who opens our application, logs on to our website, or engages with an email with monetizable content at least once during a defined 7-day period.1 We calculate average WAUs for a particular period by calculating the count of unique users, on a rolling basis for the past seven days, for each day of that period, and dividing that sum by the number of days in that period. We assess the health of our business by measuring WAUs because we believe that weekly usage best captures the cadence at which we expect a healthy user base to engage with, and derive the most utility from our platform, and by extension their neighborhood. We also present WAUs by geography because we are more advanced in engagement and monetization in the United States than internationally.
Beginning in September 2021, Apple introduced changes to the Apple email client available on its operating systems, which limit our ability to measure user engagement with emails containing monetizable content for users that use the Apple email client. The introduction of these changes impacts our ability to accurately calculate a portion of WAUs for periods following the adoption of the updated operating systems. Following this introduction, we use estimates for these user engagement numbers based on historical data sets, as well as data from users who engage with Nextdoor’s monetizable content on email clients other than Apple email.
Our WAU for the three months ended December 31, 2023 and 2022 was 41.8 million and 40.0 million, respectively, which represents 5% growth period over period.
1 Emails with monetizable content are emails with a primary purpose to regularly inform users about topics that are relevant to them, and are therefore appropriate for delivering ads to users. These emails comprise almost all of the emails that we send our users and include, but are not limited to, new, trending and top posts, weekly and anytime digests, welcome emails and urgent and emergency alerts. We earn revenue from delivery of ad impressions in emails with monetizable content on either a cost per thousand (“CPM”) basis, a cost per click (“CPC”) basis, or on a fixed-fee basis. While we have the ability to serve ads in all emails with monetizable content, we currently only do so on a portion of the total.
46
Quarterly Average Weekly Active Users
(in millions)
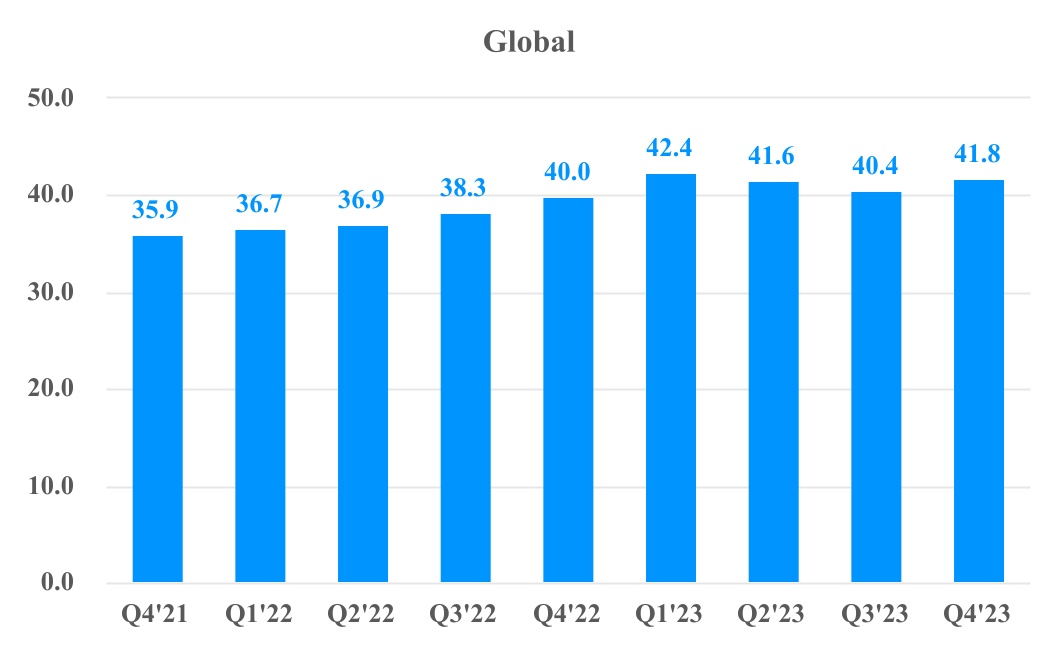
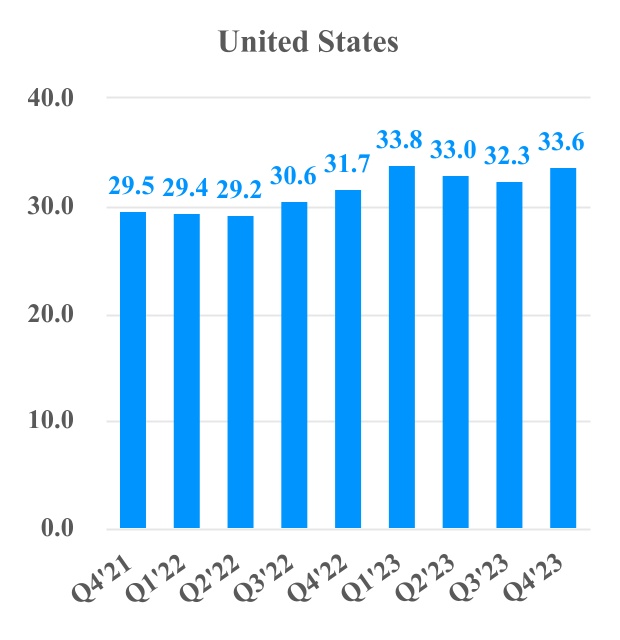
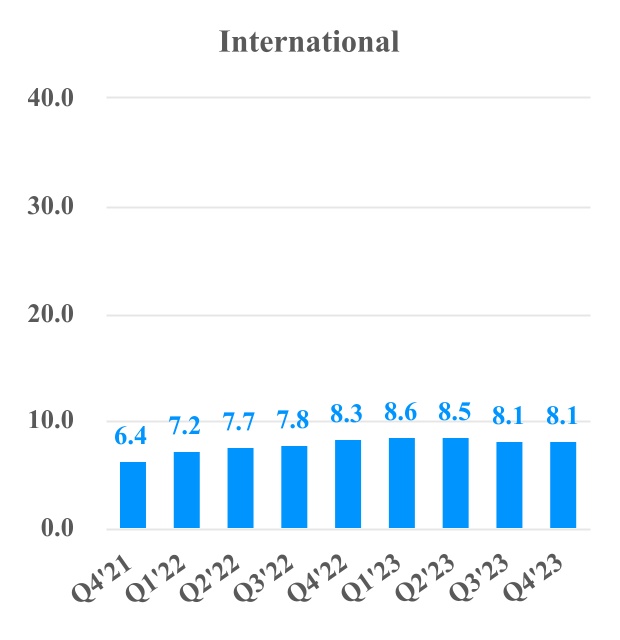
Average Revenue per Weekly Active User (ARPU)
We generate revenue primarily from advertising. We measure monetization of our platform through our ARPU metric. We define ARPU as our total revenue in that geography during a period divided by the average of the number of WAUs in that geography during the same period. We present ARPU on a U.S. and international basis because we are more advanced in our monetization in the United States than internationally.
U.S. ARPU is higher primarily due to our decision to focus our earliest monetization efforts there, the size and maturity of our audience in the United States, as well the size of the U.S. advertising market. For purposes of calculating ARPU, revenue by user geography is apportioned to each region based on a determination of the location of the account where the revenue-generating
47
activities occur. Our ARPU for the years ended December 31, 2023 and 2022 was $5.25 and $5.60, respectively, with the decrease due to stronger WAU growth relative to revenue growth.
Quarterly ARPU
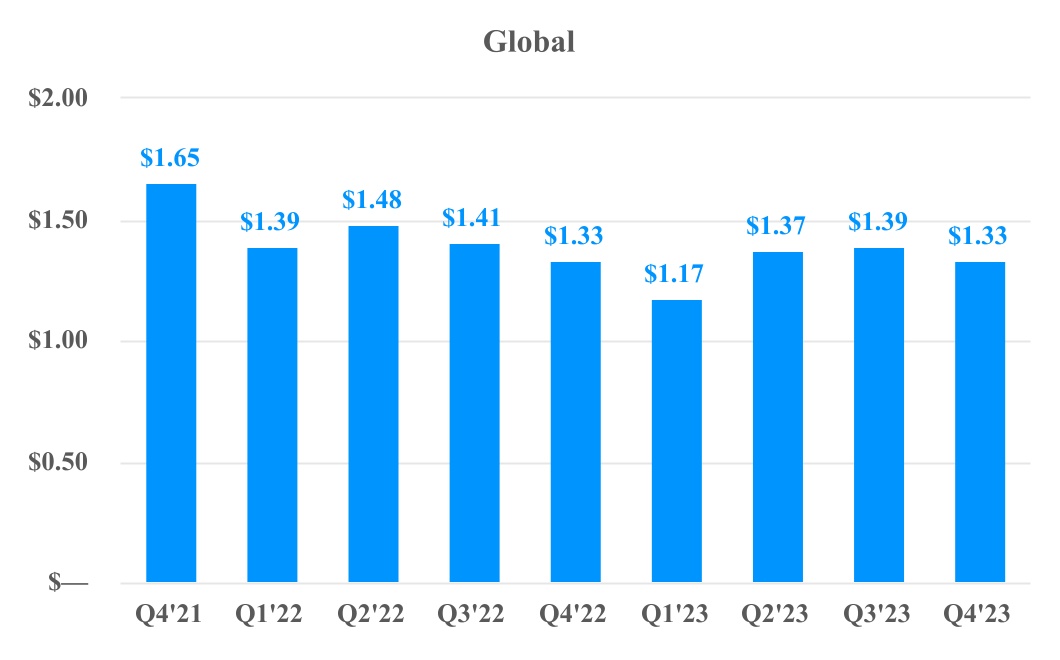
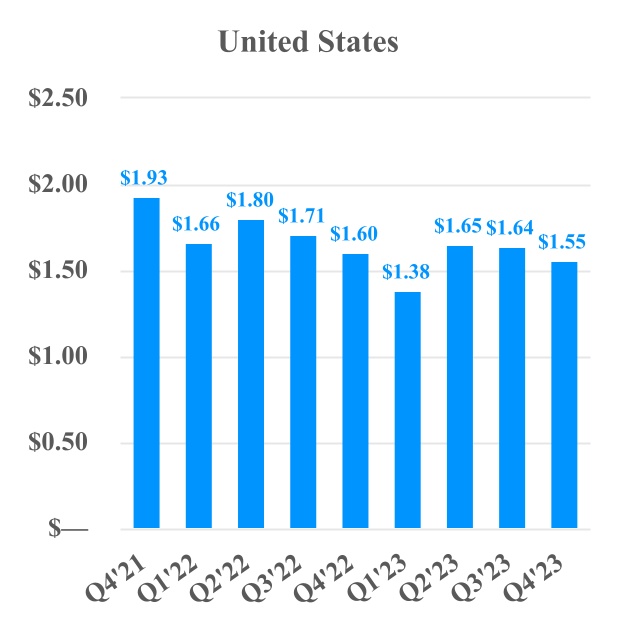
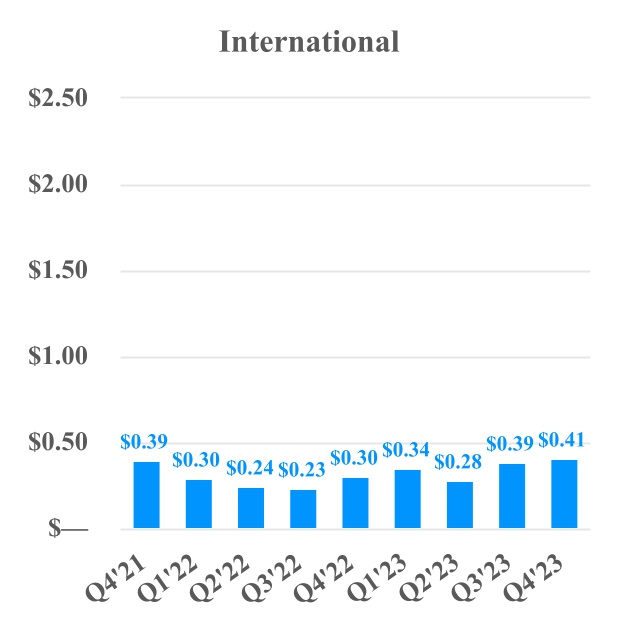
Factors Affecting Our Performance
Macroeconomic Conditions. Macroeconomic conditions, such as inflation, supply chain issues, fluctuations in foreign currency exchange rates, competition from other platforms and other risks and uncertainties have impacted, and all or some of these factors may continue to impact, advertiser demand, user growth, user engagement, and our business, operations and financial results. See "Risk Factors" and "Special Note Regarding Forward-Looking Statements” for additional details.
Growth in and Engagement of Users. We measure growth in, and engagement of, users by tracking WAUs. As the size and engagement of our user base grows, we believe the potential to increase our revenue grows.
48
We may face challenges increasing the size and engagement of our user base due to a number of factors including competition, challenges in acquiring and engaging users, or changes in regulations.
Growth in Monetization. Monetization trends, which are reflected in our ARPU, are a key factor that affects our revenue and financial results. To increase monetization, we are focused on serving more national brands by efficiently scaling our salesforce, increasing ad agency relationships, and enhancing our self-serve tools for customers of all sizes. We are also focused on increasing our user base and engagement in the United States and internationally, which will increase the opportunities for businesses to advertise on Nextdoor.
There are many variables that impact ARPU, including the number of ad impressions shown on our platform and the price per ad, which depends on a number of factors including the engagement of our user base, the number and diversity of our customers, seasonality of advertising spend, our customers’ advertising objectives, advertising performance, the effectiveness of our advertising products, our ability to measure that effectiveness for our customer, and the effect of geographic differences on each of these factors.
Due to our decision to focus our earliest monetization efforts in the United States, we have less experience monetizing international markets and therefore may experience challenges scaling and monetizing these markets. The international advertising market is also less mature than the U.S. digital advertising market.
Investment for Growth. We intend to continue to invest in technology that we believe will enhance user and customer experiences. We also intend to continue to invest in our advertising products, including our proprietary ad platform and first-party and third-party ad measurement tools, as well as our sales team. Our ability to grow our user base, attract new advertisers, increase our revenue, and expand our total addressable market will depend, in part, on our ability to continue innovating.
International Expansion. Our early proof points from launches in certain countries outside of the United States show user engagement across international markets on par with the U.S. market. We believe that increased international monetization presents an important opportunity for long-term growth, and we are working on localizing our product and expanding our operations to better serve our international user and customer base. We are still in the early stages of global expansion and will continue to evaluate expansion opportunities in our current international markets, and also in additional geographies. Over time, we believe that international WAUs can grow rapidly. We also believe that we can increase the monetization of users in international markets and that we can increase long-term ARPU for international WAUs from current levels. While we expect to grow ARPU for international WAUs, we still expect this to be lower than ARPU for U.S. WAUs. We expect that our international expansion will require significant investment. Although our investments in international expansion may adversely affect our operating results in the near term, we believe that they will contribute to our long-term growth. If our near-term investments do not lead to increased international WAUs and ARPU and expected revenue growth over time, we may not achieve or, if achieved, maintain profitability and our growth rates may slow or decline.
Seasonality. Industry advertising spend tends to be strongest in the fourth quarter, and we typically observe a similar pattern in our historical revenue. Periods of significant growth and changes in the macroeconomic environment have partially masked these trends in historical periods.
Components of Results of Operations
Revenue
We generate substantially all of our revenue from the delivery of advertisements on our platform which includes the delivery of advertising impressions sold on a CPM basis and CPC basis, as well as on a fixed-fee basis. The majority of our revenue is generated in the United States.
Cost of Revenue
Cost of revenue consists primarily of expenses associated with the delivery of our revenue generating activities, including the third-party cost of hosting our platform and allocated personnel-related costs, which include salaries, benefits, and stock-based compensation for employees engaged in development of our revenue generating products. Cost of revenue also includes third-party costs associated with delivering and supporting our advertising products and credit card transaction fees related to processing customer transactions.
Research and Development
Research and development expenses consist primarily of personnel-related costs, including salaries, benefits, restructuring costs, and stock-based compensation for our employees engaged in research and development, as well as costs for consultants, contractors and third-party software. In addition, allocated overhead costs, such as facilities, information technology, and depreciation are included in research and development expenses.
49
Sales and Marketing
Sales and marketing expenses consist of personnel-related and other costs which include salaries, commissions, benefits, restructuring costs, and stock-based compensation for employees engaged in sales and marketing activities as well as other costs including third-party consulting, public relations, allocated overhead costs, and amortization of acquired intangible assets. Sales and marketing expenses also include brand and performance marketing for both user and local business acquisition, and neighbor services, which includes personnel-related costs for our neighbor support team, our outsourced neighbor support function, and verification costs.
Performance marketing costs related to user acquisition largely consist of the distribution of mailed invitations and, to a lesser extent, digital advertising. Performance marketing costs related to local business acquisition largely consists of digital advertising and, to a lesser extent, direct mail campaigns. Fluctuations in our performance marketing expenses are driven by a variety of factors, including but not limited to: our target geographies, whether we are acquiring users or businesses, assessment of return on investment of marketing spend, strategic priorities, and seasonal factors.
General and Administrative
General and administrative expenses consist primarily of personnel-related costs, including salaries, benefits, restructuring costs, and stock-based compensation for certain executives, finance, legal, information technology, human resources, and other administrative employees. In addition, general and administrative expenses include fees and costs for professional services, including consulting, third-party legal and accounting services, and allocated overhead costs.
Interest Income
Interest income consists of interest earned on our cash, cash equivalents, and marketable securities.
Other Income (Expense), Net
Other income (expense), net consists primarily of unrealized gains and losses from the re-measurement of monetary assets and liabilities denominated in non-functional currencies, and gains and losses on marketable securities and foreign currency transactions.
Provision for Income Taxes
The provision for income taxes consists primarily of income taxes related to foreign and state jurisdictions in which we conduct business. We maintain a full valuation allowance on our U.S. federal and state deferred tax assets as we have concluded that it is more likely than not that the deferred tax assets will not be realized.
50
Results of Operations
The results of operations presented below should be reviewed in conjunction with our consolidated financial statements and related notes thereto included elsewhere in this Annual Report. The following table sets forth our consolidated results of operations for the periods presented.
| Year Ended December 31, | |||||||||||||||||
| (in thousands) | 2023 | 2022 | 2021 | ||||||||||||||
| Revenue | $ | 218,309 | $ | 212,765 | $ | 192,197 | |||||||||||
Costs and expenses(1): | |||||||||||||||||
| Cost of revenue | 41,613 | 38,981 | 28,813 | ||||||||||||||
| Research and development | 149,998 | 127,073 | 97,096 | ||||||||||||||
| Sales and marketing | 122,925 | 123,182 | 106,430 | ||||||||||||||
| General and administrative | 76,057 | 67,733 | 54,664 | ||||||||||||||
| Total costs and expenses | 390,593 | 356,969 | 287,003 | ||||||||||||||
| Loss from operations | (172,284) | (144,204) | (94,806) | ||||||||||||||
| Interest income | 25,780 | 9,304 | 177 | ||||||||||||||
| Other income (expense), net | (505) | (1,343) | (539) | ||||||||||||||
| Loss before income taxes | (147,009) | (136,243) | (95,168) | ||||||||||||||
| Provision for income taxes | 756 | 1,673 | 157 | ||||||||||||||
| Net loss | $ | (147,765) | $ | (137,916) | $ | (95,325) | |||||||||||
__________________
(1)Includes stock-based compensation expense as follows:
| Year Ended December 31, | |||||||||||||||||
| (in thousands) | 2023 | 2022 | 2021 | ||||||||||||||
| Cost of revenue | $ | 3,201 | $ | 2,627 | $ | 1,466 | |||||||||||
| Research and development | 43,619 | 35,567 | 20,690 | ||||||||||||||
| Sales and marketing | 12,548 | 10,160 | 6,388 | ||||||||||||||
| General and administrative | 23,657 | 16,066 | 18,970 | ||||||||||||||
| Total | $ | 83,025 | $ | 64,420 | $ | 47,514 | |||||||||||
51
The following table sets forth the components of our consolidated statements of operations as a percentage of revenue for each of the periods presented:
| Year Ended December 31, | |||||||||||||||||
| (as a percentage of total revenue) | 2023 | 2022 | 2021 | ||||||||||||||
| Revenue | 100 | % | 100 | % | 100 | % | |||||||||||
| Costs and expenses: | |||||||||||||||||
| Cost of revenue | 19 | 18 | 15 | ||||||||||||||
| Research and development | 69 | 60 | 51 | ||||||||||||||
| Sales and marketing | 56 | 58 | 55 | ||||||||||||||
| General and administrative | 35 | 32 | 28 | ||||||||||||||
| Total costs and expenses | 179 | 168 | 149 | ||||||||||||||
| Loss from operations | (79) | (68) | (49) | ||||||||||||||
| Interest income | 12 | 4 | — | ||||||||||||||
| Other income (expense), net | — | (1) | — | ||||||||||||||
| Loss before income taxes | (67) | (64) | (50) | ||||||||||||||
| Provision for income taxes | — | 1 | — | ||||||||||||||
| Net loss | (68) | % | (65) | % | (50) | % | |||||||||||
Note: Certain figures may not sum due to rounding.
Comparison of the Years Ended December 31, 2023 and 2022
Revenue
| Year Ended December 31, | Change | ||||||||||||||||||||||
| (in thousands, except percentages) | 2023 | 2022 | $ | % | |||||||||||||||||||
| Revenue | $ | 218,309 | $ | 212,765 | $ | 5,544 | 3 | % | |||||||||||||||
Revenue increased by $5.5 million, or 3%, for the year ended December 31, 2023 compared to the year ended December 31, 2022. The increase was primarily due to an increase in advertiser demand for our product offerings, which we believe was driven by increased marketer spending as well as increased user engagement as measured by a 9% increase in 2023 WAUs. Full year ARPU decreased 6% reflecting stronger year-over-year WAU growth relative to revenue growth.
Cost of revenue
| Year Ended December 31, | Change | ||||||||||||||||||||||
| (in thousands, except percentages) | 2023 | 2022 | $ | % | |||||||||||||||||||
| Cost of revenue | $ | 41,613 | $ | 38,981 | $ | 2,632 | 7 | % | |||||||||||||||
Cost of revenue increased by $2.6 million, or 7%, for the year ended December 31, 2023 compared to the year ended December 31, 2022. The increase was primarily due to a $1.3 million increase in third-party hosting costs due to rising user growth and engagement, a $0.9 million increase in allocated personnel-related costs, and a $0.4 million increase in third-party costs associated with delivering and supporting our advertising products.
Research and development
| Year Ended December 31, | Change | ||||||||||||||||||||||
| (in thousands, except percentages) | 2023 | 2022 | $ | % | |||||||||||||||||||
| Research and development | $ | 149,998 | $ | 127,073 | $ | 22,925 | 18 | % | |||||||||||||||
Research and development expenses increased by $22.9 million, or 18%, for the year ended December 31, 2023 compared to the year ended December 31, 2022. The increase was primarily due to a $20.2 million increase in personnel-related costs, inclusive of restructuring costs, primarily driven by an increase in average headcount, a $2.4 million increase in third-party software costs, and a $0.5 million increase in allocated overhead costs reflecting an increase in average headcount.
52
Sales and marketing
| Year Ended December 31, | Change | ||||||||||||||||||||||
| (in thousands, except percentages) | 2023 | 2022 | $ | % | |||||||||||||||||||
| Personnel-related and other | $ | 93,056 | $ | 77,718 | $ | 15,338 | 20 | % | |||||||||||||||
| Brand and performance marketing | 18,054 | 33,628 | (15,574) | (46) | % | ||||||||||||||||||
| Neighbor services | 11,815 | 11,836 | (21) | — | % | ||||||||||||||||||
| Total sales and marketing | $ | 122,925 | $ | 123,182 | $ | (257) | — | % | |||||||||||||||
Sales and marketing expenses decreased by $0.3 million for the year ended December 31, 2023 compared to the year ended December 31, 2022. The decrease was primarily due to a $14.7 million decrease in performance marketing costs for user acquisition as focus shifted to organic user acquisition channels and a $0.9 million decrease in performance marketing costs to attract local businesses, offset by a $15.3 million increase in personnel-related and other costs, inclusive of restructuring costs, which was driven by an increase in average headcount.
General and administrative
| Year Ended December 31, | Change | ||||||||||||||||||||||
| (in thousands, except percentages) | 2023 | 2022 | $ | % | |||||||||||||||||||
| General and administrative | $ | 76,057 | $ | 67,733 | $ | 8,324 | 12 | % | |||||||||||||||
General and administrative expenses increased by $8.3 million, or 12%, for the year ended December 31, 2023 compared to the year ended December 31, 2022. The increase was primarily due to a $10.5 million increase in personnel-related costs, inclusive of restructuring costs, which was driven by an increase in average headcount, partially offset by a $2.7 million decrease in insurance expenses.
Interest income
| Year Ended December 31, | Change | ||||||||||||||||||||||
| (in thousands, except percentages) | 2023 | 2022 | $ | % | |||||||||||||||||||
| Interest income | $ | 25,780 | $ | 9,304 | $ | 16,476 | 177 | % | |||||||||||||||
Interest income increased by $16.5 million, or 177%, for the year ended December 31, 2023 compared to the year ended December 31, 2022. The increase was driven by higher interest rates.
Other income (expense), net
| Year Ended December 31, | Change | ||||||||||||||||||||||
(in thousands, except percentages) | 2023 | 2022 | $ | % | |||||||||||||||||||
| Other income (expense), net | $ | (505) | $ | (1,343) | $ | 838 | (62) | % | |||||||||||||||
Other expense, net decreased by $0.8 million, or 62%, for the year ended December 31, 2023 compared to the year ended December 31, 2022. The decrease was primarily due to the periodic re-measurement of monetary assets and liabilities denominated in non-functional currencies.
Provision for income taxes
| Year Ended December 31, | Change | ||||||||||||||||||||||
(in thousands) | 2023 | 2022 | $ | % | |||||||||||||||||||
| Provision for income taxes | $ | 756 | $ | 1,673 | $ | (917) | (55) | % | |||||||||||||||
Provision for income taxes decreased by $0.9 million, or 55%, for the year ended December 31, 2023 compared to the year ended December 31, 2022. The decrease was primarily due to a decrease in foreign income tax expenses.
53
Liquidity and Capital Resources
Since inception, we have generated negative cash flows from operations and have primarily financed our operations from net proceeds received from the sale of equity securities, proceeds from the Business Combination, and payments received from our customers. We currently have no debt outstanding.
We have generated losses from our operations, as reflected in our accumulated deficit of $766.0 million as of December 31, 2023. We incurred operating losses and cash outflows from operations by supporting the growth of our business. We expect these losses and operating cash outflows to continue for the foreseeable future. We also expect to incur significant research and development, sales and marketing, and general and administrative expenses over the next several years in connection with the continued development and strategic expansion of our business.
As of December 31, 2023, we had $531.1 million in cash, cash equivalents, and marketable securities. We anticipate satisfying our short-term cash requirements, including meeting our working capital and capital expenditure requirements, with our existing cash, cash equivalents, and marketable securities. In the long term, we may satisfy our cash requirements with cash, cash equivalents, and marketable securities on hand or with proceeds from any future equity or debt financings. Our ability to support our requirements and plans for cash, including working capital and capital expenditure requirements, will depend on many factors, including the rate of our revenue growth, the timing and extent of spending on research and development efforts and other business initiatives, the expansion of sales and marketing activities, the introduction of new and enhanced product offerings and features, the continuing market adoption of our platform, the number of shares repurchased under our Share Repurchase Program, and our ability to obtain equity or debt financing. Moreover, any actual or perceived instability in the U.S. or international banking systems may impact liquidity both in the short term and long term.
To the extent existing cash, cash equivalents, and marketable securities are insufficient to fund our working capital and capital expenditure requirements, or should we require additional cash for other purposes, we may attempt to raise additional capital through the sale of equity or debt securities. If we raise additional funds through the issuance of equity or debt securities, those securities may have rights, preferences, or privileges senior to the rights of our Class A and Class B common stock, and our stockholders may experience dilution. Any future indebtedness we incur may result in terms that could also be unfavorable to our equity investors. There can be no assurances that we will be able to raise additional capital on terms we deem acceptable, or at all. The inability to raise additional capital as and when required would have an adverse effect, which could be material, on our results of operations, financial condition, and ability to achieve our business objectives.
On May 31, 2022, our Board of Directors authorized and approved the Share Repurchase Program to repurchase up to $100.0 million in aggregate of our Class A common stock, with the authorization to expire on June 30, 2024. The timing of any repurchases will depend on market conditions and other investment opportunities, and will be made at our discretion. The Share Repurchase Program does not obligate us to repurchase any dollar amount or number of shares, and the program may be extended, modified, suspended, or discontinued at any time. During the year ended December 31, 2023, we did not repurchase or retire any shares of Class A common stock. As of December 31, 2023, we had $22.8 million available for future share repurchases under the Share Repurchase Program. On February 21, 2024, the Company’s Board of Directors authorized and approved an increase of $150.0 million to the Share Repurchase Program and extended the expiration date to March 31, 2026.
Cash Flows
The following table summarizes our cash flows for the periods presented:
| Year Ended December 31, | |||||||||||||||||
| (in thousands) | 2023 | 2022 | 2021 | ||||||||||||||
| Net cash used in operating activities | $ | (59,273) | $ | (60,503) | $ | (51,268) | |||||||||||
| Net cash provided by (used in) investing activities | $ | 66,490 | $ | (342,448) | $ | (149,522) | |||||||||||
| Net cash provided by (used in) financing activities | $ | 8,916 | $ | (64,348) | $ | 637,576 | |||||||||||
Operating activities
Cash used in operating activities during the year ended December 31, 2023 was $59.3 million which resulted from a net loss of $147.8 million, adjusted for non-cash charges of $79.9 million and net cash inflows of $8.6 million from changes in operating assets and liabilities. Non-cash charges primarily consisted of $83.0 million of stock-based compensation expense and $5.8 million of depreciation and amortization expense, partially offset by $8.6 million of accretion on investments. The net cash inflows from changes in operating assets and liabilities were primarily due to a $5.3 million increase in accrued expenses and other liabilities, a $4.7 million
54
decrease in operating lease right-of-use assets due to normal amortization, a $3.5 million decrease in accounts receivable, and a $3.4 million decrease in prepaid expenses and other assets. These amounts were partially offset by a $5.7 million decrease in operating lease liabilities due to lease payments and a $2.6 million decrease in accounts payable.
Cash used in operating activities during the year ended December 31, 2022 was $60.5 million which resulted from a net loss of $137.9 million, adjusted for non-cash charges of $68.0 million and net cash inflows of $9.4 million from changes in operating assets and liabilities. Non-cash charges primarily consisted of $64.4 million of stock-based compensation expense and $5.7 million of depreciation and amortization expense. The net cash inflows from changes in operating assets and liabilities were primarily due to a $7.7 million increase in accrued expenses and other liabilities, a $6.9 million decrease in operating lease right-of-use assets due to normal amortization, and a $3.8 million decrease in prepaid expenses and other assets. These amounts were partially offset by a $7.1 million decrease in operating lease liabilities due to lease payments, and a $1.6 million decrease in accounts payable.
Investing activities
Cash provided by investing activities for the year ended December 31, 2023 was $66.5 million, which consisted of proceeds from maturities of marketable securities of $504.4 million and proceeds from sales of marketable securities of $155.4 million. This was partially offset by purchases of marketable securities of $590.6 million and a loan to Opportunity Finance Network of $2.5 million.
Cash used in investing activities for the year ended December 31, 2022 was $342.4 million, which consisted of purchases of marketable securities of $711.9 million, a loan to Opportunity Finance Network of $5.0 million, and purchases of property and equipment of $3.2 million. This was partially offset by proceeds from maturities of marketable securities of $366.8 million and proceeds from sales of marketable securities of $10.8 million.
Financing activities
Cash provided by financing activities for the year ended December 31, 2023 was $8.9 million, which consisted of $7.2 million of proceeds from the exercise of stock options and $2.0 million of proceeds from the issuance of common stock under the employee stock purchase plan.
Cash used in financing activities for the year ended December 31, 2022 was $64.3 million, which consisted of repurchases of common stock of $77.2 million. This was partially offset by $12.5 million of proceeds from the exercise of stock options.
Non-GAAP Financial Measure
Adjusted EBITDA
Adjusted EBITDA is a non-GAAP financial measure that represents our net loss adjusted for depreciation and amortization, stock-based compensation, net interest income, provision for income taxes, and any restructuring charges or acquisition-related costs.
We use Adjusted EBITDA in conjunction with GAAP measures as part of our overall assessment of our performance, including the preparation of our annual operating budget and quarterly forecasts, to evaluate the effectiveness of our business strategies and to communicate with our Board of Directors concerning our financial performance. We believe Adjusted EBITDA is also helpful to investors, analysts, and other interested parties because it can assist in providing a more consistent and comparable overview of our operations across our historical financial periods. Adjusted EBITDA has limitations as an analytical tool, however, and you should not consider it in isolation or as a substitute for analysis of our results as reported under GAAP. Because of these limitations, you should consider Adjusted EBITDA alongside other financial performance measures, including net loss and our other GAAP results. In evaluating Adjusted EBITDA, you should be aware that in the future we may incur expenses that are the same as or similar to some of the adjustments in this presentation. Our presentation of Adjusted EBITDA should not be construed to imply that our future results will be unaffected by the types of items excluded from the calculation of Adjusted EBITDA. Adjusted EBITDA is not presented in accordance with GAAP and the use of this term varies from others in our industry.
55
The following is a reconciliation of net loss, the most comparable GAAP measure, to Adjusted EBITDA:
| Year Ended December 31, | |||||||||||||||||
| (in thousands) | 2023 | 2022 | 2021 | ||||||||||||||
| Net loss | $ | (147,765) | $ | (137,916) | $ | (95,325) | |||||||||||
| Depreciation and amortization | 5,769 | 5,656 | 4,172 | ||||||||||||||
| Stock-based compensation | 83,025 | 64,420 | 47,514 | ||||||||||||||
| Interest income | (25,780) | (9,304) | (177) | ||||||||||||||
| Provision for income taxes | 756 | 1,673 | 157 | ||||||||||||||
| Restructuring charges | 9,888 | — | — | ||||||||||||||
| Adjusted EBITDA | $ | (74,107) | $ | (75,471) | $ | (43,659) | |||||||||||
Critical Accounting Policies and Estimates
We prepare our consolidated financial statements in accordance with GAAP. Preparing consolidated financial statements requires us to make estimates and assumptions that affect the reported amounts of assets, liabilities, revenue, expenses, and related disclosures. We evaluate our estimates and assumptions on an ongoing basis. Our estimates are based on historical experience and various other assumptions that we believe to be reasonable under the circumstances. Our actual results could differ from these estimates.
The critical accounting policies requiring estimates, assumptions, and judgments that we believe have the most significant impact on our consolidated financial statements are described below.
Refer to Note 2 to our consolidated financial statements for further information on our other significant accounting policies.
Revenue Recognition
We generate a majority of our revenue from the delivery of advertising services. We recognize advertising revenue after satisfying our contractual performance obligation, which, for the majority of our advertising arrangements, is when an advertising impression is displayed to users. None of our arrangements contain minimum impression guarantees. We typically bill advertisers on a monthly basis and our payment terms vary by customer type and location. We have other advertising arrangements which are typically fixed-fee arrangements and revenue is recognized on a straight-line basis over the non-cancellable contractual term of the agreement, generally beginning on the date our service is made available to the customer. In certain advertising arrangements we require payment upfront from our customers. We record deferred revenue when we collect cash from customers in advance of revenue recognition.
Leases
At the inception of our contracts we determine if the contract is or contains a lease. A contract is or contains a lease if it conveys the right to control the use of an identified asset for a period of time in exchange for consideration. Operating leases consist of real estate leases and are included in operating lease right-of-use assets and operating lease liabilities on our consolidated balance sheets at commencement date based on the present value of remaining fixed lease payments.
When the discount rate implicit in the lease cannot be readily determined, we use the applicable incremental borrowing rate at lease commencement in order to discount lease payments to present value for purposes of performing lease classification tests and measuring the lease liability. The incremental borrowing rate is a hypothetical rate based on the rate of interest we would have to pay to borrow on a collateralized basis over a similar term and amount equal to the lease payments in a similar economic environment.
Stock-based compensation
Stock-based compensation expense for stock-based awards is measured based on the grant date fair value of the awards and recognized in the consolidated statements of operations on a straight-line basis over the requisite service period of the awards. The grant date fair value of stock options granted is estimated using the Black-Scholes option pricing model. Forfeitures are accounted for as they occur. Historically, our stock option awards and restricted stock permitted early exercise. The unvested portion of shares exercised is recorded as a liability on our consolidated balance sheets and reclassified into stockholders’ equity (deficit) as vesting occurs.
56
The Black-Scholes option-pricing model requires the use of highly subjective assumptions. These assumptions are estimated as follows:
•Fair Value of the Underlying Common Stock—Prior to the Business Combination, the Board of Directors considered numerous objective and subjective factors to determine the fair value of our common stock. After the Business Combination, the fair value of the underlying common stock is determined by the closing price, on the date of grant, of our Class A common stock, which is traded on the New York Stock Exchange.
•Expected Volatility—Expected volatility is a measure of the amount by which the stock price is expected to fluctuate. Since we do not have sufficient trading history of our common stock, we estimate the expected volatility of our stock options at their grant date by taking the weighted average historical volatility of a group of comparable publicly traded companies over a period equal to the expected term of the options;
•Expected Term—We determine the expected term based on the average period the stock options are expected to remain outstanding using the simplified method, calculated as the midpoint of the stock options’ vesting term and contractual expiration period, as we do not have sufficient historical information to develop reasonable expectations about future exercise patterns and post-vesting employment termination behavior;
•Risk Free Interest Rate—We use the U.S. Treasury yield for our risk-free interest rate that corresponds with the expected term; and
•Dividend Yield—We utilize a dividend yield of zero, as we do not currently issue dividends and do not expect to in the future.
Income Taxes
We are subject to income taxes in the United States and numerous foreign jurisdictions. Significant judgment is required in determining our uncertain tax positions. We recognize a tax benefit from an uncertain tax position only if it is more likely than not that the tax position will be sustained on examination by the taxing authorities, based on the technical merits of the position.
We account for income taxes using the asset and liability method, which requires the recognition of deferred tax assets and liabilities for the expected future tax consequences of events that have been recognized in the consolidated financial statements or in our tax returns. Deferred income taxes are recognized for differences between financial reporting and tax bases of assets and liabilities at the enacted statutory tax rates in effect for the years in which the temporary differences are expected to reverse. We make an assessment of the likelihood that the resulting deferred tax assets will be realized. A valuation allowance is provided when it is more likely than not that some portion or all of a deferred tax asset will not be realized.
Recently Issued Accounting Pronouncements
Refer to Note 2 to our consolidated financial statements included elsewhere in this Annual Report for more information regarding recently issued accounting pronouncements.
Item 7A. Quantitative and Qualitative Disclosures About Market Risk
We are exposed to market risk in the ordinary course of our business. Market risk represents the risk of loss that may impact our financial condition due to adverse changes in financial market prices and rates. Our market risk exposure is primarily the result of fluctuations in interest rates and foreign currency exchange rates.
Interest Rate Risk
As of December 31, 2023, we had cash and cash equivalents of $60.2 million and marketable securities of $470.9 million. Our cash and cash equivalents consist of cash in bank accounts, demand deposits, money market funds, corporate bonds, and commercial paper. The primary objectives of our investment activities are to preserve principal and provide liquidity without significantly increasing risk. We do not enter into investments for trading or speculative purposes. Due to the relatively short-term nature of our investment portfolio, a hypothetical 100 basis point change in interest rates would not have a material effect on the fair value of our portfolio for the periods presented.
Foreign Currency Risk
The functional currency of our international subsidiaries is generally their local currency. Our sales are typically denominated in the local currency of the country in which the sale was made. The majority of our revenue is denominated in U.S. Dollars. As such, our
57
revenue is not currently exposed to significant foreign currency risk. Our operating expenses are generally denominated in the currency of the countries in which the operations are located, and are subject to fluctuations due to changes in foreign currency exchange rates, particularly the British Pound, the Euro, Canadian Dollar, and the Australian Dollar. Our consolidated results of operations and cash flows are, therefore, subject to fluctuations due to changes in foreign currency exchange rates and may be adversely affected in the future due to changes in foreign exchange rates. We do not believe a 10% change in the relative value of the U.S. Dollar would have materially affected our consolidated financial statements for the periods presented. To date, we have not had a formal hedging program with respect to foreign currency, but we may do so in the future if our exposure to foreign currency should become more significant.
58
Item 8. Financial Statements
INDEX TO CONSOLIDATED FINANCIAL STATEMENTS
Page | |||||
Reports of Independent Registered Public Accounting Firm (PCAOB ID: | |||||
59
Report of Independent Registered Public Accounting Firm
To the Shareholders and the Board of Directors of Nextdoor Holdings, Inc.
Opinion on the Financial Statements
We have audited the accompanying consolidated balance sheets of Nextdoor Holdings, Inc. (the Company) as of December 31, 2023 and 2022, the related consolidated statements of operations, comprehensive loss, redeemable convertible preferred stock and stockholders’ equity and cash flows for each of the three years in the period ended December 31, 2023, and the related notes (collectively referred to as the “consolidated financial statements”). In our opinion, the consolidated financial statements present fairly, in all material respects, the financial position of the Company at December 31, 2023 and 2022, and the results of its operations and its cash flows for each of the three years in the period ended December 31, 2023, in conformity with U.S. generally accepted accounting principles.
We also have audited, in accordance with the standards of the Public Company Accounting Oversight Board (United States) (PCAOB), the Company's internal control over financial reporting as of December 31, 2023, based on criteria established in Internal Control—Integrated Framework issued by the Committee of Sponsoring Organizations of the Treadway Commission (2013 framework), and our report dated February 27, 2024 expressed an unqualified opinion thereon.
Basis for Opinion
These financial statements are the responsibility of the Company's management. Our responsibility is to express an opinion on the Company’s financial statements based on our audits. We are a public accounting firm registered with the PCAOB and are required to be independent with respect to the Company in accordance with the U.S. federal securities laws and the applicable rules and regulations of the Securities and Exchange Commission and the PCAOB.
We conducted our audits in accordance with the standards of the PCAOB. Those standards require that we plan and perform the audit to obtain reasonable assurance about whether the financial statements are free of material misstatement, whether due to error or fraud. Our audits included performing procedures to assess the risks of material misstatement of the financial statements, whether due to error or fraud, and performing procedures that respond to those risks. Such procedures included examining, on a test basis, evidence regarding the amounts and disclosures in the financial statements. Our audits also included evaluating the accounting principles used and significant estimates made by management, as well as evaluating the overall presentation of the financial statements. We believe that our audits provide a reasonable basis for our opinion.
Critical Audit Matter
The critical audit matter communicated below is a matter arising from the current period audit of the financial statements that was communicated or required to be communicated to the audit committee and that: (1) relates to accounts or disclosures that are material to the financial statements and (2) involved our especially challenging, subjective or complex judgments. The communication of the critical audit matter does not alter in any way our opinion on the consolidated financial statements, taken as a whole, and we are not, by communicating the critical audit matter below, providing a separate opinion on the critical audit matter or on the account or disclosure to which it relates.
60
| Revenue Recognition | |||||
| Description of the Matter | As described in Note 2 to the consolidated financial statements, the Company generates a majority of its revenues by delivering ads on the Nextdoor Holdings, Inc. website and mobile application. Revenue is recognized after transferring control of the promised goods or services to customers, which for the majority of advertising arrangements occurs when an advertising impression is displayed to users. The Company’s revenue recognition process utilizes complex proprietary systems and tools for the initiation, processing, delivery and recording of advertising transactions which includes a high volume of individually low monetary value transactions, auditing of which requires significant audit effort. | ||||
| How We Addressed the Matter in Our Audit | To test the Company’s recognition of revenue, our audit procedures included, among others, testing the completeness and accuracy of the underlying data within the Company’s revenue systems, and comparing revenue recognized to accounts receivables and cash receipts. Additionally, we examined customer terms and conditions, and we selected a sample of contractual arrangements to test the timing and amount of revenue recognition. | ||||
/s/ | ||
| We have served as the Company’s auditor since 2018. | ||
| February 27, 2024 | ||
61
Report of Independent Registered Public Accounting Firm
To the Shareholders and the Board of Directors of Nextdoor Holdings, Inc.
Opinion on Internal Control Over Financial Reporting
We have audited Nextdoor Holdings, Inc.’s internal control over financial reporting as of December 31, 2023, based on criteria established in Internal Control—Integrated Framework issued by the Committee of Sponsoring Organizations of the Treadway Commission (2013 framework) (the COSO criteria). In our opinion, Nextdoor Holdings, Inc. (the Company) maintained, in all material respects, effective internal control over financial reporting as of December 31, 2023, based on the COSO criteria.
We also have audited, in accordance with the standards of the Public Company Accounting Oversight Board (United States) (PCAOB), the consolidated balance sheets of the Company as of December 31, 2023 and 2022, the related consolidated statements of operations, comprehensive loss, redeemable convertible preferred stock and stockholders' equity and cash flows for each of the three years in the period ended December 31, 2023, and the related notes and our report dated February 27, 2024 expressed an unqualified opinion thereon.
Basis for Opinion
The Company’s management is responsible for maintaining effective internal control over financial reporting and for its assessment of the effectiveness of internal control over financial reporting included in the accompanying Management's annual report on internal control over financial reporting. Our responsibility is to express an opinion on the Company’s internal control over financial reporting based on our audit. We are a public accounting firm registered with the PCAOB and are required to be independent with respect to the Company in accordance with the U.S. federal securities laws and the applicable rules and regulations of the Securities and Exchange Commission and the PCAOB.
We conducted our audit in accordance with the standards of the PCAOB. Those standards require that we plan and perform the audit to obtain reasonable assurance about whether effective internal control over financial reporting was maintained in all material respects.
Our audit included obtaining an understanding of internal control over financial reporting, assessing the risk that a material weakness exists, testing and evaluating the design and operating effectiveness of internal control based on the assessed risk, and performing such other procedures as we considered necessary in the circumstances. We believe that our audit provides a reasonable basis for our opinion.
Definition and Limitations of Internal Control Over Financial Reporting
A company’s internal control over financial reporting is a process designed to provide reasonable assurance regarding the reliability of financial reporting and the preparation of financial statements for external purposes in accordance with generally accepted accounting principles. A company’s internal control over financial reporting includes those policies and procedures that (1) pertain to the maintenance of records that, in reasonable detail, accurately and fairly reflect the transactions and dispositions of the assets of the company; (2) provide reasonable assurance that transactions are recorded as necessary to permit preparation of financial statements in accordance with generally accepted accounting principles, and that receipts and expenditures of the company are being made only in accordance with authorizations of management and directors of the company; and (3) provide reasonable assurance regarding prevention or timely detection of unauthorized acquisition, use, or disposition of the company’s assets that could have a material effect on the financial statements.
Because of its inherent limitations, internal control over financial reporting may not prevent or detect misstatements. Also, projections of any evaluation of effectiveness to future periods are subject to the risk that controls may become inadequate because of changes in conditions, or that the degree of compliance with the policies or procedures may deteriorate.
/s/ | ||
| San Mateo, California | ||
| February 27, 2024 | ||
62
Nextdoor Holdings, Inc.
CONSOLIDATED BALANCE SHEETS
(in thousands, except per share data)
| As of December 31, | |||||||||||
| 2023 | 2022 | ||||||||||
| Assets | |||||||||||
| Current assets: | |||||||||||
| Cash and cash equivalents | $ | $ | |||||||||
| Marketable securities | |||||||||||
Accounts receivable, net of allowance of $ | |||||||||||
| Prepaid expenses and other current assets | |||||||||||
| Total current assets | |||||||||||
| Restricted cash, non-current | |||||||||||
| Property and equipment, net | |||||||||||
| Operating lease right-of-use assets | |||||||||||
| Intangible assets, net | |||||||||||
| Goodwill | |||||||||||
| Other assets | |||||||||||
| Total assets | $ | $ | |||||||||
| Liabilities and Stockholders' Equity | |||||||||||
| Current liabilities: | |||||||||||
| Accounts payable | $ | $ | |||||||||
| Operating lease liabilities, current | |||||||||||
| Accrued expenses and other current liabilities | |||||||||||
| Total current liabilities | |||||||||||
| Operating lease liabilities, non-current | |||||||||||
| Other liabilities, non-current | |||||||||||
| Total liabilities | |||||||||||
| Commitments and contingencies (Note 8) | |||||||||||
| Stockholders' equity: | |||||||||||
Preferred stock, $ | |||||||||||
Class A Common stock, $ | |||||||||||
Class B Common stock, $ | |||||||||||
| Additional paid-in capital | |||||||||||
| Accumulated other comprehensive income (loss) | ( | ||||||||||
| Accumulated deficit | ( | ( | |||||||||
| Total stockholders' equity | |||||||||||
| Total liabilities and stockholders' equity | $ | $ | |||||||||
The accompanying notes are an integral part of these consolidated financial statements.
63
Nextdoor Holdings, Inc.
CONSOLIDATED STATEMENTS OF OPERATIONS
(in thousands, except per share data)
| Year Ended December 31, | |||||||||||||||||
| 2023 | 2022 | 2021 | |||||||||||||||
| Revenue | $ | $ | $ | ||||||||||||||
| Costs and expenses: | |||||||||||||||||
| Cost of revenue | |||||||||||||||||
| Research and development | |||||||||||||||||
| Sales and marketing | |||||||||||||||||
| General and administrative | |||||||||||||||||
| Total costs and expenses | |||||||||||||||||
| Loss from operations | ( | ( | ( | ||||||||||||||
| Interest income | |||||||||||||||||
| Other income (expense), net | ( | ( | ( | ||||||||||||||
| Loss before income taxes | ( | ( | ( | ||||||||||||||
| Provision for income taxes | |||||||||||||||||
| Net loss | $ | ( | $ | ( | $ | ( | |||||||||||
| Net loss per share attributable to Class A and Class B common stockholders, basic and diluted | $ | ( | $ | ( | $ | ( | |||||||||||
| Weighted average shares used in computing net loss per share attributable to Class A and Class B common stockholders, basic and diluted | |||||||||||||||||
The accompanying notes are an integral part of these consolidated financial statements.
64
Nextdoor Holdings, Inc.
CONSOLIDATED STATEMENTS OF COMPREHENSIVE LOSS
(in thousands)
| Year Ended December 31, | |||||||||||||||||
| 2023 | 2022 | 2021 | |||||||||||||||
| Net loss | $ | ( | $ | ( | $ | ( | |||||||||||
| Other comprehensive income (loss): | |||||||||||||||||
| Foreign currency translation adjustments | |||||||||||||||||
| Change in unrealized gain (loss) on available-for-sale marketable securities | ( | ( | |||||||||||||||
| Total other comprehensive income (loss) | ( | ||||||||||||||||
| Comprehensive loss | $ | ( | $ | ( | $ | ( | |||||||||||
The accompanying notes are an integral part of these consolidated financial statements.
65
Nextdoor Holdings, Inc.
CONSOLIDATED STATEMENTS OF REDEEMABLE CONVERTIBLE PREFERRED STOCK AND STOCKHOLDERS’ EQUITY
(in thousands)
| Redeemable Convertible Preferred Stock | Class A Common Stock | Class B Common Stock | Additional Paid-in Capital | Accumulated Other Comprehensive Loss | Accumulated Deficit | Total Stockholders' (Deficit) Equity | ||||||||||||||||||||||||||||||||||||||||||||||||||||||||
| Shares | Amount | Shares | Amount | Shares | Amount | |||||||||||||||||||||||||||||||||||||||||||||||||||||||||
| Balances as of December 31, 2020 | $ | $ | $ | $ | $ | ( | $ | ( | $ | ( | ||||||||||||||||||||||||||||||||||||||||||||||||||||
| Conversion of redeemable convertible preferred stock into Class B common stock in connection with the Reverse Recapitalization | ( | ( | — | — | — | — | ||||||||||||||||||||||||||||||||||||||||||||||||||||||||
| Issuance of common stock upon the Reverse Recapitalization, net of issuance costs | — | — | — | — | — | — | — | |||||||||||||||||||||||||||||||||||||||||||||||||||||||
| Release of restricted stock units | — | — | — | — | — | — | — | — | — | |||||||||||||||||||||||||||||||||||||||||||||||||||||
| Tax withholdings on release of restricted stock units | — | — | — | — | — | — | ( | — | — | ( | ||||||||||||||||||||||||||||||||||||||||||||||||||||
| Issuance of common stock upon exercise of stock options, net of repurchases of unvested common stock | — | — | — | — | — | — | ||||||||||||||||||||||||||||||||||||||||||||||||||||||||
| Issuance of common stock in connection with acquisition | — | — | — | — | — | — | — | — | — | |||||||||||||||||||||||||||||||||||||||||||||||||||||
| Vesting of early exercised stock options | — | — | — | — | — | — | — | — | ||||||||||||||||||||||||||||||||||||||||||||||||||||||
| Vesting of restricted stock | — | — | — | — | — | — | — | — | ||||||||||||||||||||||||||||||||||||||||||||||||||||||
| Stock-based compensation | — | — | — | — | — | — | — | — | ||||||||||||||||||||||||||||||||||||||||||||||||||||||
| Other comprehensive income | — | — | — | — | — | — | — | — | ||||||||||||||||||||||||||||||||||||||||||||||||||||||
| Net loss | — | — | — | — | — | — | — | — | ( | ( | ||||||||||||||||||||||||||||||||||||||||||||||||||||
| Balances as of December 31, 2021 | $ | $ | $ | $ | $ | $ | ( | $ | ( | $ | ||||||||||||||||||||||||||||||||||||||||||||||||||||
| Release of restricted stock units | — | — | — | — | — | — | — | — | ||||||||||||||||||||||||||||||||||||||||||||||||||||||
| Tax withholdings on release of restricted stock units | — | — | — | — | — | — | ( | — | — | ( | ||||||||||||||||||||||||||||||||||||||||||||||||||||
| Repurchase of common stock | — | — | ( | ( | — | — | ( | — | — | ( | ||||||||||||||||||||||||||||||||||||||||||||||||||||
| Conversion from Class B to Class A common stock | — | — | ( | ( | — | — | — | |||||||||||||||||||||||||||||||||||||||||||||||||||||||
| Issuance of common stock upon exercise of stock options | — | — | — | — | — | |||||||||||||||||||||||||||||||||||||||||||||||||||||||||
| Issuance of common stock in connection with acquisition | — | — | — | — | — | — | — | — | — | |||||||||||||||||||||||||||||||||||||||||||||||||||||
| Issuance of common stock under employee stock purchase plan | — | — | — | — | — | — | — | |||||||||||||||||||||||||||||||||||||||||||||||||||||||
| Vesting of early exercised stock options | — | — | — | — | — | — | — | — | ||||||||||||||||||||||||||||||||||||||||||||||||||||||
| Vesting of restricted stock | — | — | — | — | — | — | — | — | ||||||||||||||||||||||||||||||||||||||||||||||||||||||
| Stock-based compensation | — | — | — | — | — | — | — | — | ||||||||||||||||||||||||||||||||||||||||||||||||||||||
| Other comprehensive loss | — | — | — | — | — | — | — | ( | — | ( | ||||||||||||||||||||||||||||||||||||||||||||||||||||
| Net loss | — | — | — | — | — | — | — | — | ( | ( | ||||||||||||||||||||||||||||||||||||||||||||||||||||
| Balances as of December 31, 2022 | — | $ | — | $ | $ | $ | $ | ( | $ | ( | $ | |||||||||||||||||||||||||||||||||||||||||||||||||||
66
| Redeemable Convertible Preferred Stock | Class A Common Stock | Class B Common Stock | Additional Paid-in Capital | Accumulated Other Comprehensive Income (Loss) | Accumulated Deficit | Total Stockholders' Equity | ||||||||||||||||||||||||||||||||||||||||||||||||||||||||
| Shares | Amount | Shares | Amount | Shares | Amount | |||||||||||||||||||||||||||||||||||||||||||||||||||||||||
| Balances as of December 31, 2022 | — | $ | — | $ | $ | $ | $ | ( | $ | ( | $ | |||||||||||||||||||||||||||||||||||||||||||||||||||
| Release of restricted stock units | — | — | — | — | — | — | — | — | ||||||||||||||||||||||||||||||||||||||||||||||||||||||
| Tax withholdings on release of restricted stock units | — | — | — | — | — | — | ( | — | — | ( | ||||||||||||||||||||||||||||||||||||||||||||||||||||
| Conversion from Class B to Class A common stock | — | — | ( | ( | — | — | — | |||||||||||||||||||||||||||||||||||||||||||||||||||||||
| Issuance of common stock upon exercise of stock options | — | — | — | — | — | |||||||||||||||||||||||||||||||||||||||||||||||||||||||||
| Issuance of common stock under employee stock purchase plan | — | — | — | — | — | — | ||||||||||||||||||||||||||||||||||||||||||||||||||||||||
| Vesting of early exercised stock options | — | — | — | — | — | — | — | — | ||||||||||||||||||||||||||||||||||||||||||||||||||||||
| Stock-based compensation | — | — | — | — | — | — | — | — | ||||||||||||||||||||||||||||||||||||||||||||||||||||||
| Other comprehensive income | — | — | — | — | — | — | — | — | ||||||||||||||||||||||||||||||||||||||||||||||||||||||
| Net loss | — | — | — | — | — | — | — | — | ( | ( | ||||||||||||||||||||||||||||||||||||||||||||||||||||
| Balances as of December 31, 2023 | — | $ | — | $ | $ | $ | $ | $ | ( | $ | ||||||||||||||||||||||||||||||||||||||||||||||||||||
The accompanying notes are an integral part of these consolidated financial statements.
67
Nextdoor Holdings, Inc.
CONSOLIDATED STATEMENTS OF CASH FLOWS
(in thousands)
| Year Ended December 31, | |||||||||||||||||
| 2023 | 2022 | 2021 | |||||||||||||||
| Cash flows from operating activities: | |||||||||||||||||
| Net loss | $ | ( | $ | ( | $ | ( | |||||||||||
| Adjustments to reconcile net loss to net cash used in operating activities: | |||||||||||||||||
| Depreciation and amortization | |||||||||||||||||
| Stock-based compensation | |||||||||||||||||
| Bad debt expense | |||||||||||||||||
| Accretion of investments | ( | ||||||||||||||||
| Other | ( | ( | ( | ||||||||||||||
| Changes in operating assets and liabilities: | |||||||||||||||||
| Accounts receivable, net | ( | ( | |||||||||||||||
| Prepaid expenses and other assets | ( | ||||||||||||||||
| Operating lease right-of-use assets | |||||||||||||||||
| Accounts payable | ( | ( | |||||||||||||||
| Operating lease liabilities | ( | ( | ( | ||||||||||||||
| Accrued expenses and other liabilities | |||||||||||||||||
| Net cash used in operating activities | ( | ( | ( | ||||||||||||||
| Cash flows from investing activities: | |||||||||||||||||
| Purchases of property and equipment | ( | ( | ( | ||||||||||||||
| Purchases of marketable securities | ( | ( | ( | ||||||||||||||
| Sales of marketable securities | |||||||||||||||||
| Maturities of marketable securities | |||||||||||||||||
| Loan to Opportunity Finance Network | ( | ( | |||||||||||||||
| Net cash provided by (used in) investing activities | ( | ( | |||||||||||||||
| Cash flows from financing activities: | |||||||||||||||||
| Proceeds from exercise of stock options, net of repurchases | |||||||||||||||||
| Proceeds from issuance of common stock under employee stock purchase plan | |||||||||||||||||
| Proceeds from the Reverse Recapitalization | |||||||||||||||||
| Payment of transaction costs related to the Reverse Recapitalization | ( | ( | |||||||||||||||
| Tax withholdings on release of restricted stock units | ( | ( | ( | ||||||||||||||
| Repurchase of common stock | ( | ||||||||||||||||
| Net cash provided by (used in) financing activities | ( | ||||||||||||||||
| Effect of exchange rate changes on cash, cash equivalents, and restricted cash | |||||||||||||||||
| Net increase (decrease) in cash, cash equivalents, and restricted cash | ( | ||||||||||||||||
| Cash, cash equivalents, and restricted cash at beginning of period | |||||||||||||||||
| Cash, cash equivalents, and restricted cash at end of period | $ | $ | $ | ||||||||||||||
| Reconciliation of cash, cash equivalents, and restricted cash to the consolidated balance sheets: | |||||||||||||||||
| Cash and cash equivalents | $ | $ | $ | ||||||||||||||
| Restricted cash | |||||||||||||||||
| Total cash, cash equivalents, and restricted cash | $ | $ | $ | ||||||||||||||
| Supplemental cash flow disclosures: | |||||||||||||||||
| Cash paid for taxes | $ | $ | $ | ||||||||||||||
| Non-cash investing and financing activities: | |||||||||||||||||
| Vesting of restricted stock and early exercised stock options | $ | $ | $ | ||||||||||||||
| Lease liabilities arising from obtaining right-of-use assets | $ | $ | $ | ||||||||||||||
| Unpaid deferred transaction costs | $ | $ | $ | ||||||||||||||
| Conversion of redeemable convertible preferred stock into Class B common stock in connection with the Reverse Recapitalization | $ | $ | $ | ||||||||||||||
The accompanying notes are an integral part of these consolidated financial statements.
68
Notes to the Consolidated Financial Statements
Note 1. Description of Business
Nextdoor Holdings, Inc. (“Nextdoor” or the “Company”) is headquartered in San Francisco, California. Nextdoor’s purpose is to cultivate a kinder world where everyone has a neighborhood they can rely on. That purpose enables the Company’s mission to be the neighborhood hub for trusted connections and the exchange of helpful information, goods, and services.
On November 5, 2021 (the “Closing”), the Company consummated the transactions contemplated by the Agreement and Plan of Merger, dated July 6, 2021, as amended on September 30, 2021 (the “Merger Agreement”), by and among Khosla Ventures Acquisition Co. II (“KVSB”), a special purpose acquisition company, Lorelei Merger Sub Inc. (“Merger Sub”), and Nextdoor, Inc. (“Legacy Nextdoor”), with Legacy Nextdoor surviving as a wholly owned subsidiary of KVSB (the “Merger” and, collectively with the other transactions that occurred in connection with the Merger, including the PIPE Investment (as described in Note 3, the “Reverse Recapitalization”)). In connection with the Closing, KVSB was renamed to Nextdoor Holdings, Inc. Reported results from operations included herein prior to the Reverse Recapitalization are those of Legacy Nextdoor.
See Note 3 - Reverse Recapitalization for further details.
Note 2. Summary of Significant Accounting Policies
Basis of Presentation
The consolidated financial statements have been prepared in accordance with U.S. generally accepted accounting principles (“GAAP”) and include the accounts of the Company and its wholly owned subsidiaries. All intercompany balances and transactions have been eliminated in consolidation. The Company’s fiscal year ends on December 31.
The Merger was accounted for as a reverse recapitalization in accordance with GAAP. This determination was primarily based on the evaluation of the following facts and circumstances:
•Legacy Nextdoor stockholders had a relative majority of the voting power of Nextdoor;
•The Board of Directors of Nextdoor had ten members, and Legacy Nextdoor stockholders had the ability to nominate a majority of the members of the Board of Directors;
•Legacy Nextdoor’s senior management comprised the senior management roles of Nextdoor and were responsible for the day-to-day operations;
•KVSB assumed the Nextdoor Holdings, Inc. name and Legacy Nextdoor’s corporate headquarters; and
•The intended strategy and operations of Nextdoor continued Legacy Nextdoor’s strategy and operations to leverage technology to connect millions of neighbors online and in real life to build stronger, more vibrant, and resilient neighborhoods.
Under this method of accounting, KVSB was treated as the “acquired” company for financial reporting purposes. Accordingly, the financial statements of Nextdoor represent the continuation of the financial statements of Legacy Nextdoor, with the Merger reflected as the equivalent of Nextdoor issuing common stock for the net assets of KVSB, accompanied by a recapitalization. The shares and corresponding capital amounts and all per share data related to Legacy Nextdoor’s outstanding redeemable convertible preferred stock, common stock, and stock-based awards prior to the Reverse Recapitalization have been retroactively adjusted using the Exchange Ratio (as defined in Note 3). The conversion of the outstanding shares of Legacy Nextdoor redeemable convertible preferred stock into shares of Class B common stock in connection with the Reverse Recapitalization and the issuance of Class A common stock are presented as of the Closing of the Merger in the consolidated statements of redeemable convertible preferred stock and stockholders’ equity (deficit). The net assets of KVSB were recognized as of the Closing at historical cost, with no goodwill or other intangible assets recorded. Operations prior to the Merger are those of Legacy Nextdoor and Legacy Nextdoor’s operations are the only ongoing operations of Nextdoor.
Use of Estimates
The preparation of financial statements in conformity with GAAP requires management to make estimates and assumptions that affect the amounts reported in the consolidated financial statements and accompanying notes. Estimates include, but are not limited to, valuation of financial instruments, valuation of common stock through the date of the Reverse Recapitalization, valuation of stock-based awards, revenue recognition, collectability of accounts receivable, valuation of acquired intangible assets and goodwill, useful
69
lives of intangible assets, useful lives of property and equipment, the incremental borrowing rate applied in lease accounting, income taxes and deferred income tax assets and associated valuation allowances. The Company bases these estimates and assumptions on historical experience and various other assumptions that it considers reasonable. The actual results could differ materially from these estimates.
Foreign Currency
The functional currency of the Company’s international subsidiaries is generally their local currency. The financial statements of these subsidiaries are translated into U.S. dollars using month-end exchange rates for assets and liabilities, historical exchange rates for equity, and average exchange rates for revenue and expenses. Translation gains and losses are recorded in accumulated other comprehensive income (loss) as a component of stockholders’ equity (deficit). Unrealized foreign exchange gains and losses due to the re-measurement of monetary assets and liabilities denominated in non-functional currencies and realized foreign exchange gains and losses on foreign exchange transactions are recorded in other income (expense), net in the consolidated statements of operations.
Cash and Cash Equivalents
Cash and cash equivalents consist of highly liquid investments with insignificant interest rate risk and original maturities of three months or less at the time of purchase. Cash and cash equivalents include demand deposits, money market funds, corporate bonds, and commercial paper. Interest is accrued as earned. Cash and cash equivalents are recorded at cost, which approximates fair value.
Marketable Securities
The Company’s marketable securities are comprised of certificates of deposit, commercial paper, corporate bonds, U.S. Treasury securities, U.S. agency bonds, and asset-backed securities. The Company determines the appropriate classification of its investments at the time of purchase and reevaluates such designation at each balance sheet date. The Company has classified and accounted for its investments as available-for-sale securities as the Company may sell these securities at any time for use in its current operations or for other purposes, even prior to maturity. As a result, the Company classifies its investments, including securities with stated maturities beyond 12 months, within current assets on the consolidated balance sheets.
Fair Value Measurements
The Company accounts for certain assets and liabilities at fair value, which is the expected exchange price that would be received for an asset or an exit price paid to transfer a liability in an orderly transaction between market participants on the measurement date. Assets and liabilities measured at fair value are classified into the following categories based on the degree to which the inputs the Company uses to measure the fair values are observable in active markets. The Company uses the most observable inputs available when measuring fair value.
•Level 1: Observable inputs such as unadjusted quoted prices for identical assets or liabilities in active markets;
•Level 2: Observable inputs such as quoted prices for similar assets or liabilities in active markets, quoted prices for identical assets or liabilities in inactive markets, or inputs that are derived principally from or corroborated by observable market data or other means; and
•Level 3: Unobservable inputs that are supported by little or no market activity and are significant to the fair value of the assets or liabilities.
70
Accounts Receivable and Allowance for Doubtful Accounts
The Company records accounts receivable at the original invoiced amount. The Company maintains an allowance for doubtful accounts for any receivables it may be unable to collect and reduces the allowance when it determines that it will be unable to collect specific receivables. The Company determines the allowance based on its receivables’ age, the customers’ credit quality, and current economic conditions, among other factors that may affect the customers’ ability to pay.
Restricted Cash
The Company’s restricted cash balance is invested in a savings account and pledged as collateral for standby letters of credit as security deposits for the Company’s office leases.
Property and Equipment
Property and equipment are recorded at cost, less accumulated depreciation and amortization. Depreciation and amortization are computed using the straight-line method over the estimated useful lives of the assets as follows:
| Estimated Useful Life | |||||
| Computer equipment and software | |||||
| Furniture and fixtures | |||||
| Leasehold improvements | Shorter of the estimated useful life of | ||||
Maintenance and repair costs are expensed as incurred.
Capitalized Internal-use Software
Goodwill and Other Acquired Intangible Assets
Goodwill represents the excess of the purchase price over the fair value of net assets acquired in connection with business combinations accounted for using the acquisition method of accounting. Goodwill is not amortized, but is tested for impairment at least annually, in the fourth quarter, or whenever events or changes in circumstances indicate that goodwill might be impaired. For all periods presented the Company had one reporting unit. The Company’s test for goodwill impairment starts with a qualitative assessment to determine whether it is necessary to perform the quantitative goodwill impairment test. If the Company determines, based on the qualitative factors, that the fair value of the reporting unit is more likely than not to be less than the carrying amount, then a quantitative goodwill impairment test is required. There was no impairment of goodwill recorded for the periods presented.
Intangible assets consist of identifiable intangible assets, including customer relationships and developed technology, resulting from the Company’s acquisitions. Acquired intangible assets are recorded at cost, net of accumulated amortization. Intangible assets are amortized on a straight-line basis over their estimated useful lives. Amortization costs are recorded in sales and marketing in the consolidated statements of operations.
Impairment of Long-Lived Assets
71
Leases
Results and disclosure requirements for all periods presented are presented under ASU 2016-02, Leases (“Topic 842”).
The Company has various lease agreements related to real estate that are all classified as operating leases. At the inception of the Company’s contracts it determines if the contract is or contains a lease. A contract is or contains a lease if it conveys the right to control the use of an identified asset for a period of time in exchange for consideration. The Company has elected not to separate the lease and non-lease components within the contract. For leases that have greater than a 12-month lease term, right-of-use (“ROU”) assets and operating lease liabilities are recognized on the consolidated balance sheets at commencement date based on the present value of remaining fixed lease payments.
Certain of the Company’s leases include options to extend the lease, with renewal terms that can extend the lease term from one month to five years . If the Company is reasonably certain to exercise an option to extend a lease, the extension period is included as part of the ROU asset and the operating lease liability.
When the discount rate implicit in the lease cannot be readily determined, the Company uses its incremental borrowing rate at lease commencement in order to discount lease payments to present value for purposes of performing lease classification tests and measuring the lease liability. The Company’s incremental borrowing rate represents the rate of interest the Company would have to pay to borrow, on a collateralized basis, over a similar term an amount equal to the lease payments in a similar economic environment.
The operating lease ROU asset also includes accrued lease expense resulting from the straight-line accounting under prior accounting methods, which is now being amortized over the remaining life of the lease.
The Company’s lease payments are largely fixed. Variable lease payments exist in circumstances such as payments for property tax, insurance, and common area maintenance. Variable lease payments are recognized in operating expense in the period in which the obligation for those payments are incurred. Certain of the Company’s leases include an option to early terminate the lease. The Company’s leases may contain early termination options which may result in an early termination fee. The Company has a significant lease for its headquarters in San Francisco, California, which does not include an option to early terminate.
For the Company’s leases, it has elected to not apply the recognition requirements to leases of twelve months or less. These leases are expensed on a straight-line basis and no ROU asset or operating lease liability is recorded.
Concentration of Credit and Customer Risks
Financial instruments that are exposed to concentrations of credit risk consist principally of cash and cash equivalents, marketable securities and accounts receivable. The Company maintains cash and cash equivalents and marketable securities with domestic and foreign financial institutions and at times may exceed federally insured limits. The Company performs periodic evaluations of the relative credit standing of these institutions. The Company maintains investments in U.S. government debt and agency securities, corporate debt securities, and commercial paper that carry high credit ratings and accordingly, minimal credit risk exists with respect to these balances.
One customer accounted for 19 % and 24 % of the Company’s accounts receivable as of December 31, 2023 and 2022, respectively. No customer accounted for 10% or more of the Company’s total revenue for the years ended December 31, 2023, 2022 and 2021.
Revenue Recognition
The Company generates a majority of its revenue from the delivery of advertising services.
The Company determines revenue recognition through the following steps:
(1)Identification of the contract, or contracts, with a customer;
(2)Identification of the performance obligations in the contract;
(3)Determination of the transaction price;
(4)Allocation of the transaction price to the performance obligations in the contract; and
(5)Recognition of revenue when, or as, the Company satisfies a performance obligation.
The Company recognizes advertising revenue after satisfying its contractual performance obligation, which, for the majority of its advertising arrangements, is when an advertising impression is displayed to users. None of the Company’s arrangements contain
72
minimum impression guarantees. The Company typically bills advertisers on a monthly basis and the payment terms vary by customer type and location. The Company has other advertising arrangements which are typically fixed-fee arrangements and revenue is recognized on a straight-line basis over the non-cancellable contractual term of the agreement, generally beginning on the date its service is made available to the customer.
Deferred Revenue
In certain advertising arrangements the Company requires payment upfront from its customers. The Company records deferred revenue when it collects cash from customers in advance of revenue recognition. As of December 31, 2023 and 2022, deferred revenue was $8.3 million and $6.0 million, respectively, and included within accrued expenses and other current liabilities on the consolidated balance sheets. For the years ended December 31, 2023 and 2022, revenue recognized from deferred revenue at the beginning of each year was $3.0 million and $2.9 million, respectively.
Practical Expedients and Exemptions
The Company expenses sales commissions as incurred because the expected period of benefit is less than one year. These costs are recorded within sales and marketing expenses in the consolidated statements of operations.
The Company does not disclose the value of unsatisfied performance obligations for (i) contracts with an original expected length of one year or less and (ii) contracts for which it recognizes revenue at the amount to which it has the right to invoice for services performed.
Cost of Revenue
Cost of revenue consists primarily of expenses associated with the delivery of the Company’s revenue generating activities, including third-party costs of hosting its platform and allocated personnel-related costs, including salaries, benefits, and stock-based compensation for employees engaged in development of its revenue generating products. Cost of revenue also includes third-party costs associated with delivering and supporting its advertising products and credit card transaction fees related to processing customer transactions.
Research and Development
Research and development expenses consist primarily of personnel-related costs, including salaries, benefits, restructuring costs, and stock-based compensation for its employees engaged in research and development, as well as costs for consultants, contractors and third-party software. In addition, allocated overhead costs, such as facilities, information technology, and depreciation are included in research and development expenses.
Sales and Marketing
Sales and marketing expenses consist primarily of personnel-related costs and other costs which include salaries, commissions, benefits, restructuring costs, and stock-based compensation for employees engaged in sales and marketing activities as well as other costs including third-party consulting, public relations, allocated overhead costs, and amortization of acquired intangible assets. Sales and marketing expenses also include brand and performance marketing for both user and local business acquisition, and neighbor services, which includes personnel-related costs for the Company's neighbor support team, its outsourced neighbor support function, and verification costs.
General and Administrative
General and administrative expenses consist primarily of personnel-related costs, including salaries, benefits, restructuring costs, and stock-based compensation, for certain executives, finance, legal, information technology, human resources, and other administrative employees. In addition, general and administrative expenses include fees and costs for professional services, including consulting, third-party legal and accounting services, and allocated overhead costs.
Advertising Costs
73
Income Taxes
The Company accounts for income taxes using the asset and liability method, which requires the recognition of deferred tax assets and liabilities for the expected future tax consequences of events that have been recognized in the consolidated financial statements or in the Company’s tax returns. Deferred income taxes are recognized for differences between financial reporting and tax bases of assets and liabilities at the enacted statutory tax rates in effect for the years in which the temporary differences are expected to reverse. Management makes an assessment of the likelihood that the resulting deferred tax assets will be realized. A valuation allowance is provided when it is more likely than not that some portion or all of a deferred tax asset will not be realized. Due to the Company’s historical operating performance and the recorded cumulative net losses in prior fiscal periods, the U.S. net deferred tax assets have been fully offset by a valuation allowance.
The Company operates in various tax jurisdictions which are subject to audit by various tax authorities. The Company recognizes a tax benefit from an uncertain tax position only if it is more likely than not that the tax position will be sustained on examination by the taxing authorities, based on the technical merits of the position. The tax benefits recognized in the financial statements from such positions are then measured based on the largest benefit that has a greater than 50% cumulative likelihood of being realized upon settlement. The Company recognizes interest and penalties related to unrecognized tax benefits in the income tax provision in the consolidated statements of operations.
Net Loss Per Share Attributable to Common Stockholders
The Company presents net loss per share attributable to common stockholders in conformity with the two-class method required for multiple classes of common stock and participating securities. Under the two-class method, net loss is attributed to common stockholders and participating securities based on their participation rights. The rights, including the liquidation and dividend rights, of the Class A common stock and Class B common stock are substantially identical, other than voting rights. Accordingly, the Class A common stock and Class B common stock share proportionately in the Company’s net losses. The Company considers its redeemable convertible preferred stock (prior to the Reverse Recapitalization), early exercised stock options, and unvested restricted stock to be participating securities and contractually entitles the holders of such shares to participate in dividends but does not contractually obligate the holders of such shares to participate in the Company’s losses. As such, net losses for the periods presented were not allocated to these securities.
The Company computes basic net loss per share attributable to common stockholders by dividing the net loss attributable to common stockholders by the weighted average number of shares of common stock outstanding during the period, adjusted for outstanding shares that are subject to repurchase. Diluted net loss per share attributable to common stockholders is computed by giving effect to all potentially dilutive securities outstanding for the period. For periods in which the Company reports net losses, diluted net loss per share attributable to common stockholders is the same as basic net loss per share attributable to common stockholders, because all potentially dilutive securities are anti-dilutive.
Stock-Based Compensation
Segments
Recently Adopted Accounting Pronouncements
In June 2016, the FASB issued ASU 2016-13, Financial Instruments—Credit Losses (Topic 326): Measurement of Credit Losses on Financial Instruments, and has since issued various amendments including ASU 2018-19, ASU 2019-04, and ASU 2019-05. The guidance and related amendments modify the accounting for credit losses for most financial assets and require the use of an expected loss model, replacing the currently used incurred loss method. Under this model, entities will be required to estimate the lifetime expected credit loss on such instruments and record an allowance to offset the amortized cost basis of the financial asset, resulting in a net presentation of the amount expected to be collected on the financial asset. The Company adopted this standard as of January 1,
74
2023, and the adoption did not have an impact on the Company’s consolidated financial statements.
Recently Issued Accounting Pronouncements Not Yet Adopted
Recently Issued Accounting Pronouncements Not Yet Adopted
In November 2023, the FASB issued ASU 2023-07, Segment Reporting (Topic 280): Improvements to Reportable Segment Disclosures, which expands annual and interim disclosure requirements for reportable segments, primarily through enhanced disclosures about significant segment expenses. The ASU is effective for fiscal years beginning after December 15, 2023 with early adoption permitted. The Company is currently evaluating the impact of this standard on its consolidated financial statements and related disclosures.
In December 2023, the FASB issued ASU 2023-09, Income Taxes (Topic 740): Improvements to Income Tax Disclosures, which expands income tax disclosures primarily related to an entity’s rate reconciliation and information on income taxes paid. The ASU is effective for fiscal years beginning after December 15, 2024 with early adoption permitted. The Company is currently evaluating the impact of this standard on its consolidated financial statements and related disclosures.
Note 3. Reverse Recapitalization
Pursuant to the Merger Agreement, as described in Note 1, Merger Sub merged with and into Legacy Nextdoor, with Legacy Nextdoor surviving the Merger. Legacy Nextdoor became a wholly owned subsidiary of KVSB and KVSB was immediately renamed Nextdoor Holdings, Inc. Upon the consummation of the Merger, the following events contemplated by the Merger Agreement occurred, based on Legacy Nextdoor’s capitalization as of November 5, 2021:
•all 61,331,815 61,331,815 shares of Legacy Nextdoor common stock at the conversion rate as calculated pursuant to Legacy Nextdoor’s certificate of incorporation;
•all 97,886,321 304,003,976 3.1057 as calculated in accordance with the Merger Agreement (“Exchange Ratio”);
•all 19,196,313 granted and outstanding unexercised Legacy Nextdoor options were converted into 59,616,898 Nextdoor options exercisable for shares of Nextdoor Class B common stock with the same terms and vesting conditions except for the number of shares exercisable and the exercise price, each of which was adjusted by the Exchange Ratio;
•all 866,687 granted and outstanding unvested Legacy Nextdoor restricted stock units (“RSUs”) were converted into 2,691,577 Nextdoor RSUs for shares of Nextdoor Class B common stock with the same terms and vesting conditions except for the number of shares, which was adjusted by the Exchange Ratio; and
•the entitlement to receive 58,135 shares of Legacy Nextdoor common stock pursuant to the Pixel Labs Merger Agreement converted into the right to receive 180,549 shares of Nextdoor Class B common stock, which was adjusted by the Exchange Ratio.
There were 304,003,976 62,308,475 shares reserved for the potential future issuance of Nextdoor Class B common stock as of the Closing.
In connection with the Closing of the Merger:
•all KVSB Class B founder shares, consisting of 5,000,000 shares of KVSB Class B common stock, automatically converted into an aggregate of 7,347,249 shares of Nextdoor Class A common stock;
•all KVSB Class K founder shares, consisting of 5,000,000 shares of KVSB Class K common stock, converted into an aggregate of 3,061,354 shares of Nextdoor Class A common stock;
•all 1,132,688 private placement sponsor shares of KVSB Class A common stock converted into shares of Nextdoor Class A common stock on a one -to-one basis; and
•40,412,372 shares of KVSB Class A common stock held by KVSB public stockholders, net of the redemption of 1,222,040 shares of KVSB Class A common stock, converted into Nextdoor Class A common stock on a one -to-one basis.
75
On July 6, 2021, concurrently with the execution of the Merger Agreement, KVSB entered into subscription agreements with certain investors (collectively, the “PIPE Investors”), pursuant to, and on the terms and subject to the conditions of which, the PIPE Investors subscribed for an aggregate of 27,000,000 shares of Class A common stock, which included 750,000 shares of Nextdoor Class A common stock to the KVSB sponsor and 4,500,000 shares of Nextdoor Class A common stock to certain Legacy Nextdoor stockholders, including 500,000 shares of Nextdoor Class A common stock to Nextdoor's Chief Executive Officer and President, for an aggregate purchase price of $270.0 million (the “PIPE Investment”). The PIPE Investment was consummated substantially concurrently with the Closing of the Merger.
There were 78,953,663
Each holder of shares of Class A common stock is entitled to one vote for each share of Class A common stock held on all matters submitted to a vote of stockholders and each holder of shares of Class B common stock is entitled to 10 votes for each share of Class B common stock held on all matters submitted to a vote of stockholders.
The following table presents the number of shares of common stock issued and outstanding immediately following the Reverse Recapitalization:
| Shares | |||||
| KVSB Class A common stock, outstanding prior to Reverse Recapitalization | |||||
| Less: redemption of KVSB Class A common stock | ( | ||||
| Conversion of KVSB Class B founder shares | |||||
| Conversion of KVSB Class K common stock | |||||
| Shares issued to PIPE Investors | |||||
| Nextdoor Class A common stock | |||||
Conversion of Legacy Nextdoor common stock (1) | |||||
Conversion of Legacy Nextdoor redeemable convertible preferred stock (2) | |||||
| Nextdoor Class B common stock | |||||
| Total shares of common stock immediately after Reverse Recapitalization | |||||
(1) Upon the completion of the Reverse Recapitalization, the 36,554,506 outstanding shares of Legacy Nextdoor common stock were converted into shares of Nextdoor Class B common stock using the Exchange Ratio.
(2) Upon the completion of the Reverse Recapitalization, all 61,331,815 one -to-one basis, which were then converted into shares of Nextdoor Class B common stock using the Exchange Ratio.
KVSB was treated as the “acquired” company for financial reporting purposes. Accordingly, the financial statements of Nextdoor represent the continuation of the financial statements of Legacy Nextdoor, with the Merger reflected as the equivalent of Nextdoor issuing common stock for the net assets of KVSB, accompanied by a recapitalization. The net assets of KVSB were recognized as of the Closing at historical cost, with no goodwill or other intangible assets recorded. Operations prior to the Merger are those of Legacy Nextdoor and Legacy Nextdoor’s operations are the only ongoing operations of Nextdoor.
In connection with the Reverse Recapitalization, the Company raised $628.5 million of proceeds, presented as cash flows from financing activities, which included the contribution of $416.4 million of funds held in KVSB’s trust account, $0.2 million of cash held in KVSB’s operating cash account, and $270.0 million of proceeds from the PIPE Investment, net of $12.2 million paid to redeem 1,222,040 public shares of KVSB’s Class A common stock and $45.9 million in transaction costs incurred by KVSB. Legacy Nextdoor incurred $5.7 million of transaction costs, which consisted of direct incremental legal, accounting, consulting, and other fees which were recorded as deferred transaction costs and upon completion of the Reverse Recapitalization were reclassified to additional paid-in capital as a reduction of the net proceeds received.
The shares and corresponding capital amounts and all per share data related to Legacy Nextdoor’s outstanding redeemable convertible preferred stock, common stock, and stock-based awards prior to the Reverse Recapitalization have been retroactively adjusted using the Exchange Ratio.
76
Note 4. Cash Equivalents and Marketable Securities
The amortized costs, unrealized gains and losses, and estimated fair values of the Company’s cash equivalents and marketable securities were as follows (in thousands):
| As of December 31, 2023 | |||||||||||||||||||||||
| Amortized Cost | Unrealized Gain | Unrealized Loss | Estimated Fair Value | ||||||||||||||||||||
| Cash equivalents: | |||||||||||||||||||||||
| Money market funds | $ | $ | $ | $ | |||||||||||||||||||
| Corporate bonds | |||||||||||||||||||||||
| Commercial paper | ( | ||||||||||||||||||||||
| Total cash equivalents | ( | ||||||||||||||||||||||
| Marketable securities: | |||||||||||||||||||||||
| Certificates of deposit | |||||||||||||||||||||||
| Commercial paper | ( | ||||||||||||||||||||||
| Corporate bonds | ( | ||||||||||||||||||||||
| U.S. Treasury securities | ( | ||||||||||||||||||||||
| U.S. Agency bonds | ( | ||||||||||||||||||||||
| Asset-backed securities | ( | ||||||||||||||||||||||
| Total marketable securities | ( | ||||||||||||||||||||||
| Total | $ | $ | $ | ( | $ | ||||||||||||||||||
| As of December 31, 2022 | |||||||||||||||||||||||
| Amortized Cost | Unrealized Gain | Unrealized Loss | Estimated Fair Value | ||||||||||||||||||||
| Cash equivalents: | |||||||||||||||||||||||
| Money market funds | $ | $ | $ | $ | |||||||||||||||||||
| Corporate bonds | |||||||||||||||||||||||
| Commercial paper | ( | ||||||||||||||||||||||
| Total cash equivalents | ( | ||||||||||||||||||||||
| Marketable securities: | |||||||||||||||||||||||
| Certificates of deposit | ( | ||||||||||||||||||||||
| Commercial paper | ( | ||||||||||||||||||||||
| Corporate bonds | ( | ||||||||||||||||||||||
| U.S. Treasury securities | ( | ||||||||||||||||||||||
| U.S. Agency bonds | ( | ||||||||||||||||||||||
| Asset-backed securities | ( | ||||||||||||||||||||||
| Total marketable securities | ( | ||||||||||||||||||||||
| Total | $ | $ | $ | ( | $ | ||||||||||||||||||
All marketable securities are designated as available-for-sale securities as of December 31, 2023 and 2022.
The following table summarizes the fair value and gross unrealized losses aggregated by category and the length of time that individual securities have been in a continuous unrealized loss position. No investments had been in a continuous unrealized loss position for greater than 12 months as of December 31, 2022.
77
| As of December 31, 2023 | |||||||||||||||||||||||||||||||||||
Less than 12 Months | 12 Months or Greater | Total | |||||||||||||||||||||||||||||||||
| Fair Value | Gross Unrealized Loss | Fair Value | Gross Unrealized Loss | Fair Value | Gross Unrealized Loss | ||||||||||||||||||||||||||||||
| Commercial paper | $ | $ | ( | $ | $ | $ | $ | ( | |||||||||||||||||||||||||||
| Corporate bonds | ( | ( | ( | ||||||||||||||||||||||||||||||||
| U.S. Treasury securities | ( | ( | |||||||||||||||||||||||||||||||||
| U.S. Agency bonds | ( | ( | |||||||||||||||||||||||||||||||||
| Asset-backed securities | ( | ( | ( | ||||||||||||||||||||||||||||||||
Total | $ | $ | ( | $ | $ | ( | $ | $ | ( | ||||||||||||||||||||||||||
The following tables present the contractual maturities of the Company’s marketable securities (in thousands):
| As of December 31, 2023 | |||||||||||
Amortized Cost | Estimated Fair Value | ||||||||||
| Due within one year | $ | $ | |||||||||
| Due after one to four years | |||||||||||
| Total | $ | $ | |||||||||
| As of December 31, 2022 | |||||||||||
Amortized Cost | Estimated Fair Value | ||||||||||
| Due within one year | $ | $ | |||||||||
| Due after one to four years | |||||||||||
| Total | $ | $ | |||||||||
Note 5. Fair Value Measurements
The Company’s financial assets and liabilities measured at fair value on a recurring basis are classified by level within the fair value hierarchy. There were no The following table presents information about the Company’s financial assets that are measured at fair value on a recurring basis (in thousands):
| As of December 31, 2023 | |||||||||||||||||
| Level 1 | Level 2 | Total | |||||||||||||||
| Cash equivalents: | |||||||||||||||||
| Money market funds | $ | $ | $ | ||||||||||||||
| Corporate bonds | |||||||||||||||||
| Commercial paper | |||||||||||||||||
| Total cash equivalents | |||||||||||||||||
| Marketable securities: | |||||||||||||||||
| Certificates of deposit | |||||||||||||||||
| Commercial paper | |||||||||||||||||
| Corporate bonds | |||||||||||||||||
| U.S. Treasury securities | |||||||||||||||||
| U.S. Agency bonds | |||||||||||||||||
| Asset-backed securities | |||||||||||||||||
| Total marketable securities | |||||||||||||||||
| Total | $ | $ | $ | ||||||||||||||
78
| As of December 31, 2022 | |||||||||||||||||
| Level 1 | Level 2 | Total | |||||||||||||||
| Cash equivalents: | |||||||||||||||||
| Money market funds | $ | $ | $ | ||||||||||||||
| Corporate bonds | |||||||||||||||||
| Commercial paper | |||||||||||||||||
| Total cash equivalents | |||||||||||||||||
| Marketable securities: | |||||||||||||||||
| Certificates of deposit | |||||||||||||||||
| Commercial paper | |||||||||||||||||
| Corporate bonds | |||||||||||||||||
| U.S. Treasury securities | |||||||||||||||||
| U.S. Agency bonds | |||||||||||||||||
| Asset-backed securities | |||||||||||||||||
| Total marketable securities | |||||||||||||||||
| Total | $ | $ | $ | ||||||||||||||
The Company classifies its cash equivalents, marketable securities, and note receivable within Level 1 or Level 2 because it determines their fair values using quoted market prices or alternative pricing sources and models utilizing market observable inputs. There were no transfers between levels of the fair value hierarchy during the years ended December 31, 2023 and 2022.
Assets and Liabilities Measured at Fair Value on a Recurring Basis
The carrying amounts of certain financial instruments, including cash held in banks, accounts receivable, and accounts payable approximate fair value due to their short-term maturities and are excluded from the fair value table above.
Financial Instruments, Assets, and Liabilities Not Recorded at Fair Value
The following table presents the fair value hierarchy of assets not recorded at fair value (in thousands):
| As of December 31, 2023 | |||||||||||||||||||||||||||||
| Carrying Amount | Level 1 | Level 2 | Level 3 | Fair Value | |||||||||||||||||||||||||
| Assets | |||||||||||||||||||||||||||||
| Note receivable | $ | $ | $ | $ | $ | ||||||||||||||||||||||||
| As of December 31, 2022 | |||||||||||||||||||||||||||||
| Carrying Amount | Level 1 | Level 2 | Level 3 | Fair Value | |||||||||||||||||||||||||
| Assets | |||||||||||||||||||||||||||||
| Note receivable | $ | $ | $ | $ | $ | ||||||||||||||||||||||||
As of December 31, 2023 and 2022, there were no financial instruments or liabilities that were not recorded at fair value.
79
Note 6. Other Balance Sheet Components
Property and Equipment, net
Property and equipment, net consisted of the following (in thousands):
| As of December 31, | |||||||||||
| 2023 | 2022 | ||||||||||
| Computer equipment and software | $ | $ | |||||||||
| Furniture and fixtures | |||||||||||
Capitalized internal-use software | |||||||||||
| Leasehold improvements | |||||||||||
| Property and equipment, gross | |||||||||||
| Less: accumulated depreciation and amortization | ( | ( | |||||||||
| Property and equipment, net | $ | $ | |||||||||
Depreciation and amortization expense was $4.0 million, $3.9 million and $2.0 million for the years ended December 31, 2023, 2022 and 2021, respectively.
Intangible Assets, net
The Company’s intangible assets consist of customer relationships and developed technology arising from acquisitions.
Intangible assets, net consisted of the following (in thousands):
| As of December 31, 2023 | |||||||||||||||||||||||
| Gross Carrying Amount | Accumulated Amortization | Net Carrying Amount | Weighted Average Remaining Life (years) | ||||||||||||||||||||
Customer relationships | $ | $ | ( | $ | |||||||||||||||||||
Developed technology | ( | ||||||||||||||||||||||
Total intangible assets, net | $ | $ | ( | $ | |||||||||||||||||||
| As of December 31, 2022 | |||||||||||||||||||||||
| Gross Carrying Amount | Accumulated Amortization | Net Carrying Amount | Weighted Average Remaining Life (years) | ||||||||||||||||||||
Customer relationships | $ | $ | ( | $ | |||||||||||||||||||
Developed technology | ( | ||||||||||||||||||||||
| Total intangible assets, net | $ | $ | ( | $ | |||||||||||||||||||
Amortization expense related to intangible assets was $1.8 million, $1.8 million and $2.2 million for the years ended December 31, 2023, 2022 and 2021, respectively.
Expected future amortization expense for intangible assets as of December 31, 2023 was as follows (in thousands):
| 2024 | $ | ||||
| 2025 | |||||
| Total | $ | ||||
80
Accrued Expenses and Other Current Liabilities
Accrued expenses and other current liabilities consisted of the following (in thousands):
| As of December 31, | |||||||||||
| 2023 | 2022 | ||||||||||
Accrued compensation (1) | $ | $ | |||||||||
| Employee stock purchase plan liability | |||||||||||
Liability for early exercise of unvested stock options | |||||||||||
| Taxes payable | |||||||||||
| Deferred revenue | |||||||||||
| Other accrued and current liabilities | |||||||||||
| Accrued expenses and other current liabilities | $ | $ | |||||||||
(1) Includes liabilities and remaining charges under the Cost Reduction Plan of $1.8 million as of December 31, 2023.
Note 7. Leases
The Company has entered into various non-cancellable office facility leases in various locations with original lease periods expiring between 2020 and 2029, with its primary office location in San Francisco, California. The Company entered into a lease consisting of multiple floors for its San Francisco headquarters in 2019, with a lease term through 2029. On January 30, 2023, the Company entered into a lease amendment for its headquarters lease. The lease amendment extended the lease term through April 30, 2032, and resulted in an increase to right-of-use assets and operating lease liabilities. The Company's lease agreements generally do not contain any material residual value guarantees or material restrictive covenants.
The components of lease costs were as follows (in thousands):
| Year Ended December 31, | |||||||||||||||||
| 2023 | 2022 | 2021 | |||||||||||||||
Operating lease cost | $ | $ | $ | ||||||||||||||
Short-term lease cost | |||||||||||||||||
Variable lease cost | |||||||||||||||||
Total | $ | $ | $ | ||||||||||||||
Other information related to the Company’s operating leases was as follows (in thousands):
| Year Ended December 31, | |||||||||||||||||
| 2023 | 2022 | 2021 | |||||||||||||||
| Cash paid for amounts included in the measurement of lease liabilities: | |||||||||||||||||
Operating cash flows from operating leases | $ | $ | $ | ||||||||||||||
ROU assets obtained in exchange for new operating lease liabilities: | $ | $ | $ | ||||||||||||||
Lease terms and discount rates for operating leases were as follows:
| As of December 31, | |||||||||||
| 2023 | 2022 | ||||||||||
| Weighted average remaining lease term (years) | |||||||||||
Weighted average discount rate | % | % | |||||||||
81
As of December 31, 2023, future minimum lease payments under operating leases were as follows (in thousands):
| 2024 | $ | ||||
| 2025 | |||||
| 2026 | |||||
| 2027 | |||||
| 2028 | |||||
| Thereafter | |||||
| Total lease payments | |||||
| Less: imputed interest | ( | ||||
| Present value of lease liabilities | |||||
Less: current operating lease liabilities | ( | ||||
Long-term operating lease liabilities | $ | ||||
The table above does not include lease payments that were not fixed at commencement or lease modification.
Note 8. Commitments and Contingencies
Commitments
As of December 31, 2023, the Company had non-cancellable purchase commitments with certain service providers primarily related to the provision of cloud computing services as follows (in thousands):
| 2024 | $ | ||||
| 2025 | |||||
| 2026 | |||||
| Thereafter | |||||
| Total | $ | ||||
Legal matters
From time to time, the Company is a party to a variety of claims, lawsuits, and proceedings which arise in the ordinary course of business, including claims of alleged infringement of intellectual property rights. The Company records a liability when it believes that it is probable that a loss will be incurred and the amount of loss or range of loss can be reasonably estimated. The Company discloses potential losses when they are reasonably possible. In the Company’s opinion, resolution of pending matters is not likely to have a material adverse impact on its consolidated results of operations, cash flows, or its financial position. Given the unpredictable nature of legal proceedings, the Company bases its estimate on the information available at the time of the assessment. As additional information becomes available, the Company reassesses the potential liability and may revise the estimate. There were no such material matters as of December 31, 2023 and 2022.
Indemnification
In the ordinary course of business, the Company often includes standard indemnification provisions in its arrangements with its customers, partners, suppliers, and vendors. Pursuant to these provisions, the Company may be obligated to indemnify such parties for losses or claims suffered or incurred in connection with its service, breach of representations or covenants, intellectual property infringement, or other claims made against such parties. These provisions may limit the time within which an indemnification claim can be made. It is not possible to determine the maximum potential amount under these indemnification obligations due to the limited history of prior indemnification claims and the unique facts and circumstances involved in each particular agreement. For the years ended December 31, 2023, 2022 and 2021, the Company did not incur material costs to defend lawsuits or settle claims related to these indemnifications. The Company believes the fair value of these liabilities is not material and accordingly has no liabilities recorded for these agreements as of December 31, 2023 and 2022.
Opportunity Finance Network Loan Agreement
On June 29, 2022, the Company entered into a credit agreement with Opportunity Finance Network (“OFN”) to lend up to an aggregate of $15.0 million, unsecured, over the course of 24 months. OFN is a national network of community development financial
82
institutions (“CDFIs”). OFN will use the loan proceeds to make low-cost, fixed-rate loans to OFN-member CDFIs that on-lend those loan proceeds to fund affordable housing, community facilities, small businesses, nonprofit organizations, consumer finance, and other eligible financing extended by such CDFIs. OFN may borrow in increments of $2.0 million or more and may not borrow more than $7.5 million within the first 12 months immediately following the closing date of June 29, 2022. Each disbursement made by the Company will bear interest at a rate of 0.75 % per annum and will be due quarterly from OFN. The outstanding principal, plus any accrued and unpaid interest, for each disbursement becomes due and payable 10 years following the disbursement date. During the year ended December 31, 2023, the Company made one loan disbursement of $2.5 million. In January 2024, the Company made an additional loan disbursement of $7.5 million.
Note 9. Redeemable Convertible Preferred Stock, Common Stock, and Stockholders’ Equity
Legacy Nextdoor Redeemable Convertible Preferred Stock
Upon the completion of the Reverse Recapitalization on November 5, 2021, all outstanding shares of Legacy Nextdoor redeemable convertible preferred stock converted into Legacy Nextdoor common stock on a one -to-one basis, which were then converted into 190,477,421 shares of Nextdoor Class B common stock as a result of the Reverse Recapitalization, using the Exchange Ratio of 3.1057 .
Preferred Stock
In connection with the Reverse Recapitalization, the Company's amended and restated certificate of incorporation became effective, which authorized the issuance of 50,000,000 shares of preferred stock with a par value of $0.0001 per share with such designations, voting, and other rights and preferences as may be determined from time to time by the Company's Board of Directors. As of December 31, 2023 and 2022, there were no
Common Stock
The Company was authorized to issue 2,500,000,000 500,000,000 one vote per share and the holder of each share of Class B common stock is entitled to ten votes per share. Shares of Class B common stock are convertible into an equivalent number of shares of Class A common stock at the option of the holder or upon certain events upon the terms and conditions described in the Company’s amended and restated certificate of incorporation. Class A common stock and Class B common stock are referred to, collectively, as common stock throughout the notes to these consolidated financial statements, unless otherwise indicated. Shares of common stock reserved for future issuance on an as-converted basis were as follows (in thousands):
| As of December 31, | |||||||||||
| 2023 | 2022 | ||||||||||
| Stock options outstanding | |||||||||||
| Unvested restricted stock units (RSUs) | |||||||||||
Shares reserved for future award issuances | |||||||||||
| Total | |||||||||||
Common Stock Subject to Repurchase
Certain stock option grant agreements permit exercise prior to vesting. Upon termination of service of an employee, the Company has the right to repurchase any unvested, but issued, common stock at the original purchase price. The consideration received for an exercise of an option is accounted for as a deposit of the exercise price and is recorded as a liability. Upon vesting of the shares pursuant to the grant agreements, the shares and related liability are reclassified into stockholders’ equity. As of December 31, 2023, all shares of common stock subject to repurchase were fully vested with no balance remaining. As of December 31, 2022, the Company had $0.2 million recorded in accrued expenses and other current liabilities related to 101,593 unvested shares of common stock subject to repurchase.
83
Equity Incentive Plans
2021 Equity Incentive Plan
In November 2021, the Company’s Board of Directors and stockholders approved the Company’s 2021 Equity Incentive Plan (the “2021 Plan”) as a successor to the 2018 Equity Incentive Plan (the “2018 Plan”), with the purpose of granting stock-based awards to employees, directors, officers, and consultants, including stock options, restricted stock awards, and RSUs.
The Company initially reserved for issuance under the 2021 Plan (a)46,008,885 shares of Class A common stock, plus (b) shares that are subject to issuance upon exercise of options granted under the 2018 Plan prior to the Closing but which, after the Closing, cease to be subject to the option for any reason other than exercise of the option, (c) shares that are subject to awards granted under the 2018 Plan prior to the Closing that, after the Closing, are forfeited or are repurchased by the Company at the original issue price, (d) shares that are subject to awards granted under the 2018 Plan prior to the Closing that, after the Closing, otherwise terminate without such shares being issued, and (e) shares that, after the Closing, are used to pay the exercise price of a stock option issued under the 2018 Plan prior to the Closing or are withheld to satisfy the tax withholding obligations related to any award issued under the 2018 Plan prior to the Closing. The number of shares available for grant and issuance under the 2021 Plan will increase automatically on January 1 of each of 2022 through 2031 by the number of shares equal to the lesser of (i) five percent (5 %) of the number of shares (rounded down to the nearest whole share) of Class A common stock and Class B common stock issued and outstanding on each December 31 immediately prior to the date of increase, or (ii) such number of shares determined by the Company’s Board of Directors.
The Company initially reserved for issuance under the 2021 Plan (a)
2021 Employee Stock Purchase Plan
In November 2021, the Company’s Board of Directors and stockholders approved the Company’s 2021 Employee Stock Purchase Plan (the “2021 ESPP”). Over a series of offering periods, each of which may consist of one or more purchase periods, eligible employees will be offered the option to purchase shares of Class A common stock at 85 % of the lesser of the fair market value of Class A common stock on (i) the first business day of the applicable offering period and (ii) the date of purchase. Under the 2021 ESPP, the Company initially reserved 8,901,159 shares of Class A common stock for issuance, and the aggregate number of shares reserved will increase automatically on January 1 of each of 2022 through 2031 by the number of shares equal to the lesser of (i) one percent (1 %) of the total number of outstanding shares of Class A common stock and Class B common stock as of the immediately preceding December 31, or (ii) a number of shares as may be determined by the Company’s Board of Directors. The aggregate number of shares issued over the term of the 2021 ESPP, subject to adjustments for stock-splits, recapitalizations, or similar events, may not exceed 89,011,590 shares. In February 2022, the Company commenced its first offering period under the 2021 ESPP. During the years ended December 31, 2023 and 2022, 1,028,778 and 551,765 shares of Class A common stock were purchased under the 2021 ESPP, respectively.
Share Repurchase Program
On May 31, 2022, the Company’s Board of Directors authorized and approved a share repurchase program (the “Share Repurchase Program”) to repurchase up to $100.0 million in aggregate of the Company’s Class A common stock, with the authorization to expire on June 30, 2024. Repurchases of Class A common stock under the Share Repurchase Program may be made from time to time, on the open market, in privately negotiated transactions or by other methods, and in accordance with the limitations set forth in Rule 10b-18 promulgated under the Securities Exchange Act of 1934, as amended (the “Exchange Act”), and other applicable legal requirements. The timing of any repurchases will depend on market conditions and other investment opportunities, and will be made at the Company’s discretion. As of December 31, 2023 the Company anticipates that the Share Repurchase Program will extend through June 30, 2024, or such shorter period if $100.0 million in aggregate of shares of the Company’s Class A common stock have been repurchased. The Share Repurchase Program does not obligate the Company to repurchase any dollar amount or number of shares, and the program may be extended, modified, suspended, or discontinued at any time.
When the Company repurchases shares under the Share Repurchase Program, it reduces the common stock component of stockholders’ equity by the par value of the repurchased shares. The excess of the repurchase price over par value is recorded to additional paid-in capital. All repurchased shares are retired and become authorized and unissued shares.
During the year ended December 31, 2023, the Company did not 23,251,703 3.32 per share for an aggregate repurchase price of $77.2 million. As of December 31, 2023, the Company had $22.8 million available for future share repurchases under the Share Repurchase Program.
On February 21, 2024, the Company’s Board of Directors authorized and approved an increase of $150.0 million to the Share Repurchase Program and extended the expiration date to March 31, 2026.
84
Stock Options and RSUs
The Company may grant options to acquire shares of Class A common stock to employees, directors, officers, and consultants at a price not less than the fair market value of the shares at the date of grant. Options granted to a person who, at the time of the grant, owns more than 10 % of the voting power of all classes of stock shall be at no less than 110 % of the fair market value and expire five years from the date of grant. All other options generally have a contractual term of ten years . Options granted generally vest on a monthly basis over to three years . RSUs granted for Class A common stock generally vest on a quarterly basis over to three years .
A summary of the Company’s stock option activity for the year ended December 31, 2023 and related information is as follows (in thousands, except per share data):
| Number of Options | Weighted- Average Exercise Price | Weighted Average Remaining Contractual Term (years) | Aggregate Intrinsic Value | ||||||||||||||||||||
Outstanding at December 31, 2022 | $ | $ | |||||||||||||||||||||
| Options granted | $ | ||||||||||||||||||||||
| Options exercised | ( | $ | |||||||||||||||||||||
| Options forfeited or expired | ( | $ | |||||||||||||||||||||
Outstanding at December 31, 2023 | $ | $ | |||||||||||||||||||||
Exercisable at December 31, 2023 | $ | $ | |||||||||||||||||||||
Vested or expected to vest at December 31, 2023 | $ | $ | |||||||||||||||||||||
The intrinsic value is calculated as the difference between the exercise price of the underlying common stock option award and the fair value of the Company’s common stock as of the respective balance sheet date. The weighted average grant date fair value of options granted was $1.32 per share, $2.47 per share and $3.63 per share during the years ended December 31, 2023, 2022 and 2021, respectively.
The intrinsic value of the options exercised was $2.2 million, $14.0 million and $31.9 million for the years ended December 31, 2023, 2022 and 2021, respectively.
A summary of the Company’s RSU activity for the year ended December 31, 2023 and related information is as follows (in thousands, except per share data):
| Number of Shares | Weighted Average Grant Date Fair Value | ||||||||||
Unvested at December 31, 2022 | $ | ||||||||||
| RSUs granted | $ | ||||||||||
| RSUs vested | ( | $ | |||||||||
| RSUs forfeited | ( | $ | |||||||||
Unvested at December 31, 2023 | $ | ||||||||||
Valuation Assumptions
The Company’s use of the Black-Scholes option-pricing model to estimate the fair value of stock options granted requires the input of highly subjective assumptions. These assumptions were estimated as follows:
Fair value of the underlying common stock – Prior to the Reverse Recapitalization, the Board of Directors considered numerous objective and subjective factors to determine the fair value of the Company’s common stock including, but not limited to: (i) the results of contemporaneous third-party valuations of the Company’s common stock; (ii) the prices, rights, preferences, and privileges of the Company’s redeemable convertible preferred stock relative to those of its common stock; (iii) the lack of marketability of the Company’s common stock; (iv) actual operating and financial results; (v) current business conditions and projections; (vi) the likelihood of achieving a liquidity event, such as an initial public offering, merger, or acquisition of the Company, given prevailing market conditions; (vii) transactions involving the Company’s shares; (viii) the history and nature of its business, industry trends and competitive environment; and (iv) general economic outlook. After the Reverse Recapitalization, the fair value of
85
the underlying common stock is determined by the closing price, on the date of grant, of the Company’s Class A common stock, which is traded on the New York Stock Exchange.
Expected volatility – Expected volatility is a measure of the amount by which the stock price is expected to fluctuate. Since the Company does not have sufficient trading history of its common stock, it estimates the expected volatility of its stock options at their grant date by taking the weighted average historical volatility of a group of comparable publicly traded companies over a period equal to the expected term of the options.
Expected term – The Company determines the expected term based on the average period the stock options are expected to remain outstanding using the simplified method, calculated as the midpoint of the stock options’ vesting term and contractual expiration period, as the Company does not have sufficient historical information to develop reasonable expectations about future exercise patterns and post-vesting employment termination behavior.
Risk-free rate – The Company uses the U.S. Treasury yield for its risk-free interest rate that corresponds with the expected term.
Expected dividend yield – The Company utilizes a dividend yield of zero , as it does not currently issue dividends and does not expect to in the future.
The following assumptions were used to calculate the fair value of stock option grants made during the following periods:
| Year Ended December 31, | |||||||||||||||||
| 2023 | 2022 | 2021 | |||||||||||||||
| Expected volatility | |||||||||||||||||
| Expected term (years) | |||||||||||||||||
| Risk-free interest rate | |||||||||||||||||
| Expected dividend yield | |||||||||||||||||
| Fair value of common stock per share | $ | $ | $ | ||||||||||||||
Stock-Based Compensation
The Company recorded stock-based compensation expense in the consolidated statements of operations as follows (in thousands):
| Year Ended December 31, | |||||||||||||||||
| 2023 | 2022 | 2021 | |||||||||||||||
| Cost of revenue | $ | $ | $ | ||||||||||||||
| Research and development | |||||||||||||||||
| Sales and marketing | |||||||||||||||||
| General and administrative | |||||||||||||||||
| Total | $ | $ | $ | ||||||||||||||
As of December 31, 2023, there was $105.7 million of unrecognized stock-based compensation expense, which is expected to be recognized over a weighted average period of 1.6 years.
86
Note 10. Net Loss Per Share Attributable to Common Stockholders
The following table sets forth the computation of basic and diluted net loss per share attributable to common stockholders (in thousands, except per share data):
| Year Ended December 31, | |||||||||||||||||||||||||||||||||||
| 2023 | 2022 | 2021 | |||||||||||||||||||||||||||||||||
| Class A | Class B | Class A | Class B | Class A | Class B | ||||||||||||||||||||||||||||||
| Net loss attributable to common stockholders | $ | ( | $ | ( | $ | ( | $ | ( | $ | ( | $ | ( | |||||||||||||||||||||||
| Weighted average shares used in computing net loss per share attributable to Class A and Class B common stockholders, basic and diluted | |||||||||||||||||||||||||||||||||||
| Net loss per share attributable to Class A and Class B common stockholders, basic and diluted | $ | ( | $ | ( | $ | ( | $ | ( | $ | ( | $ | ( | |||||||||||||||||||||||
The following potentially dilutive securities outstanding have been excluded from the computations of diluted net loss per share because such securities have an anti-dilutive impact due to losses reported (in thousands):
| Year Ended December 31, | |||||||||||||||||
| 2023 | 2022 | 2021 | |||||||||||||||
| Outstanding stock options | |||||||||||||||||
| Unvested RSUs | |||||||||||||||||
Unvested early exercised stock options subject to repurchase | |||||||||||||||||
Unvested restricted stock | |||||||||||||||||
| Shares issuable pursuant to the employee stock purchase plan | |||||||||||||||||
| Contingently issuable shares | |||||||||||||||||
Total | |||||||||||||||||
Note 11. Employee Benefit Plan
The Company has a 401(k) plan (the “401(k) Plan”) covering all eligible employees in the United States. The Company is allowed to make discretionary profit sharing and qualified non-elective contributions as defined by the 401(k) Plan and as approved by the Board of Directors. The Company matches a portion of eligible participants’ 401(k) contributions. The Company’s match totaled $1.7 million, $1.4 million and $1.1 million for the years ended December 31, 2023, 2022 and 2021, respectively. No discretionary profit-sharing contributions have been made to date.
Note 12. Income Taxes
Loss before income taxes were as follows (in thousands):
| Year Ended December 31, | |||||||||||||||||
| 2023 | 2022 | 2021 | |||||||||||||||
| Domestic | $ | ( | $ | ( | $ | ( | |||||||||||
| Foreign | ( | ||||||||||||||||
| Loss before income taxes | $ | ( | $ | ( | $ | ( | |||||||||||
87
Provision for income taxes was as follows (in thousands):
| Year Ended December 31, | |||||||||||||||||
| 2023 | 2022 | 2021 | |||||||||||||||
| Current: | |||||||||||||||||
| Federal | $ | $ | $ | ||||||||||||||
| State | |||||||||||||||||
| Foreign | |||||||||||||||||
| Total current provision for income taxes | |||||||||||||||||
| Deferred: | |||||||||||||||||
| Federal | |||||||||||||||||
| State | |||||||||||||||||
| Foreign | ( | ( | |||||||||||||||
| Total deferred provision for income taxes | ( | ( | |||||||||||||||
| Total provision for income taxes | $ | $ | $ | ||||||||||||||
Income tax expense (benefit) differed from the amount computed by applying the federal statutory income tax rate to pretax loss as a result of the following:
| Year Ended December 31, | |||||||||||||||||
| 2023 | 2022 | 2021 | |||||||||||||||
| Statutory rate | ( | % | ( | % | ( | % | |||||||||||
| State tax | |||||||||||||||||
| Permanent items | |||||||||||||||||
| Transaction costs | ( | ||||||||||||||||
| Stock-based compensation | |||||||||||||||||
| R&D credit | ( | ( | ( | ||||||||||||||
| Other | |||||||||||||||||
| Changes in valuation allowance | |||||||||||||||||
| Foreign rate differential | ( | ||||||||||||||||
| Effective tax rate | % | % | % | ||||||||||||||
Tax effects of significant items comprising the Company’s deferred taxes were as follows (in thousands):
| As of December 31, | |||||||||||
| 2023 | 2022 | ||||||||||
| Deferred tax assets: | |||||||||||
| Net operating loss | $ | $ | |||||||||
| Credit carryforwards | |||||||||||
Stock-based compensation | |||||||||||
| Lease liability | |||||||||||
| Reserves, accruals and other | |||||||||||
| Capitalized R&D | |||||||||||
| Other | |||||||||||
| Total deferred tax assets | |||||||||||
| Valuation allowance | ( | ( | |||||||||
| Total deferred tax assets, net | |||||||||||
| Deferred tax liabilities: | |||||||||||
ROU asset basis | ( | ( | |||||||||
| Total deferred tax liabilities | ( | ( | |||||||||
| Net deferred tax assets | $ | $ | |||||||||
88
Based upon available objective evidence, management believes it is more likely than not that the U.S. net deferred tax assets will not be fully realizable. Accordingly, the Company has established a full valuation allowance for its U.S. net deferred tax assets. The valuation allowance increased by $31.6 million and $29.4 million, respectively, during 2023 and 2022.
As of December 31, 2023, the Company had federal net operating loss carryforwards of $413.6 million, which begin to expire in 2028, and state net operating loss carryforwards of $280.8 million, which begin to expire in 2029. Of the $413.6 million U.S. federal net operating losses $234.2 million is carried forward indefinitely but is limited to 80% of current year taxable income. As of December 31, 2023, the Company had federal tax credits of $26.7 million, which begin to expire in 2028, and state tax credits of $22.8 million, which do not expire. The Internal Revenue Code (“IRC”) limits the amount of net operating loss carryforwards that a company may use in a given year in the event of certain cumulative changes in ownership over a three-year period as described in Section 382 of the IRC. Utilization of net operating loss carryforwards and credits may be subject to a substantial annual limitation due to the ownership change limitations provided by the IRC, as amended, and similar state provisions. The annual limitation may result in the expiration of net operating losses and credits before utilization.
The Company accounts for uncertainty in income taxes in accordance with ASC 740 Income Taxes. Tax positions are evaluated in a two-step process, whereby the Company first determines whether it is more likely than not that a tax position will be sustained upon examination by the tax authority, including resolutions of any related appeals or litigation processes, based on technical merit. If a tax position meets the more-likely-than-not recognition threshold it is then measured to determine the amount of benefit to recognize in the financial statements. The tax position is measured as the largest amount of benefit that is greater than 50% likely of being realized upon ultimate settlement.
A reconciliation of the beginning and ending balances of unrecognized tax benefit were as follows (in thousands):
| Year Ended December 31, | |||||||||||||||||
| 2023 | 2022 | 2021 | |||||||||||||||
| Gross unrecognized tax benefits - beginning of year | $ | $ | $ | ||||||||||||||
| Increases related to current year tax positions | |||||||||||||||||
| Increases related to prior year tax positions | |||||||||||||||||
Decreases related to prior year tax positions | ( | ||||||||||||||||
| Gross unrecognized tax benefits - end of year | $ | $ | $ | ||||||||||||||
The amount of the Company's unrecognized tax benefits that would affect the Company's effective tax rate, if recognized, is $0.2 million. The Company does not believe it is reasonably possible that its unrecognized tax benefits will significantly change in the next twelve months.
Note 13. Geographical Information
Revenue disaggregated by geography based on the customers’ location was as follows (in thousands):
| Year Ended December 31, | |||||||||||||||||
| 2023 | 2022 | 2021 | |||||||||||||||
| United States | $ | $ | $ | ||||||||||||||
| International | |||||||||||||||||
| Total | $ | $ | $ | ||||||||||||||
Substantially all of the Company’s long-lived assets are located in the United States.
Note 14. Restructuring
In the fourth quarter of 2023, the Company announced a cost reduction plan (the “Cost Reduction Plan”) intended to right-size the business and align the workforce and other expenses with Nextdoor’s near term revenue expectations and long term business
89
priorities. The Cost Reduction Plan included a reduction of the Company’s full-time employee headcount by approximately 25 %. The execution of the Cost Reduction Plan was substantially complete by the end of the fourth quarter of 2023.
The following table summarizes the restructuring charges in the consolidated statements of operations for the year ended December 31, 2023 (in thousands):
| Severance and Related Charges | Stock-Based Compensation Expense | Total | |||||||||||||||
| Research and development | $ | $ | $ | ||||||||||||||
| Sales and marketing | |||||||||||||||||
| General and administrative | |||||||||||||||||
| Total | $ | $ | $ | ||||||||||||||
Liabilities and remaining charges under the Cost Reduction Plan were $1.8 million as of December 31, 2023, included in accrued expenses and other current liabilities on the consolidated balance sheets.
Note 15. Subsequent Events
On February 21, 2024, the Company’s Board of Directors authorized and approved an increase of $150.0 million to the Share Repurchase Program and extended the expiration deadline to March 31, 2026.
Repurchases of Class A common stock under the Share Repurchase Program may be made from time to time, on the open market, in privately negotiated transactions or by other methods, at the Company’s discretion, and in accordance with the limitations set forth in Rule 10b-18 promulgated under the Exchange Act and other applicable federal and state laws and regulations. The timing of any repurchases will depend on market conditions and will be made at the Company’s discretion. The Company currently anticipates that the Share Repurchase Program will extend through March 31, 2026, or such shorter period if the approximately $172.8 million in remaining capacity under the Share Repurchase Program is used to repurchase shares of the Company’s Class A common stock.
The Share Repurchase Program does not obligate the Company to repurchase any dollar amount or number of shares, and the program may be extended, modified, suspended, or discontinued at any time.
On February 23, 2024, the Company announced that Nirav Tolia, co-founder of Nextdoor, will return to the company as Chief Executive Officer, President and Chairperson of the Board, and that Sarah Friar will step down as Chief Executive Officer, President and Chairperson of the Board, with an orderly transition in the second quarter of 2024.
90
Item 9. Changes in and Disagreements with Accountants on Accounting and Financial Disclosure
None.
Item 9A. Controls and Procedures
Evaluation of Disclosure Controls and Procedures
Our management, with the participation of our principal executive officer and principal financial officer, evaluated the effectiveness of our disclosure controls and procedures (as defined in Rules 13a-15(e) and 15d-15(e) under the Exchange Act) as of the end of the period covered by this Annual Report, and have concluded that, based on such evaluation, our disclosure controls and procedures were effective as of December 31, 2023 at the reasonable assurance level to ensure that information required to be disclosed by us in the reports that we file or submit under the Exchange Act is recorded, processed, summarized and reported within the time periods specified in the SEC’s rules and forms, and is accumulated and communicated to our management, including our principal executive and principal financial officers, or persons performing similar functions, as appropriate, to allow timely decisions regarding required disclosure.
Management's annual report on internal control over financial reporting
Our management is responsible for establishing and maintaining adequate internal control over financial reporting (as defined in Rule 13a-15(f) under the Exchange Act). Management conducted an assessment of the effectiveness of our internal control over financial reporting based on the criteria set forth in Internal Control—Integrated Framework issued by the Committee of Sponsoring Organizations of the Treadway Commission (2013 framework). Based on the assessment, management has concluded that its internal control over financial reporting was effective as of December 31, 2023 to provide reasonable assurance regarding the reliability of financial reporting and the preparation of financial statements in accordance with U.S. GAAP. Our independent registered public accounting firm, Ernst & Young LLP, has issued an audit report with respect to our internal control over financial reporting, which appears in Part II, Item 8 of this Annual Report.
Changes in Internal Control over Financial Reporting
There were no changes in our internal control over financial reporting identified in connection with the evaluation required by Rule 13a-15(d) and 15d-15(d) of the Exchange Act that occurred during the period covered by this Annual Report that have materially affected, or are reasonably likely to materially affect, our internal control over financial reporting.
Limitations on the Effectiveness of Disclosure Controls and Procedures
Our management, including our Chief Executive Officer and Chief Financial Officer, does not expect that our disclosure controls and procedures or internal control over financial reporting will prevent all errors and all fraud. A control system, no matter how well designed and implemented, can provide only reasonable, not absolute, assurance that the control system’s objectives will be met. Further, the design of a control system must reflect the fact that there are resource constraints and the benefits of controls must be considered relative to their costs. Because of the inherent limitations in all control systems, no evaluation of controls can provide absolute assurance that all control issues within a company are detected. The inherent limitations include the realities that judgments in decision-making can be faulty and that breakdowns can occur because of simple errors or mistakes. Controls can also be circumvented by the individual acts of some persons, by collusion of two or more people, or by management override of the controls. Also, projections of any evaluation of effectiveness to future periods are subject to the risk that controls may become inadequate because of changes in conditions or that the degree of compliance with the policies or procedures may deteriorate. Because of the inherent limitations in a cost-effective control system, misstatements due to error or fraud may occur and may not be detected.
Item 9B. Other Information
None.
Item 9C. Disclosure Regarding Foreign Jurisdictions that Prevent Inspections
Not Applicable.
91
PART III
Item 10. Directors, Executive Officers and Corporate Governance
The information required by this item will be included in our Proxy Statement for the 2024 Annual Meeting of Stockholders, to be filed with the SEC within 120 days of the fiscal year ended December 31, 2023, and is incorporated herein by reference.
Item 11. Executive Compensation
The information required by this item will be included in our Proxy Statement for the 2024 Annual Meeting of Stockholders, to be filed with the SEC within 120 days of the fiscal year ended December 31, 2023, and is incorporated herein by reference.
Item 12. Security Ownership of Certain Beneficial Owners and Management and Related Stockholder Matters
The information required by this item will be included in our Proxy Statement for the 2024 Annual Meeting of Stockholders, to be filed with the SEC within 120 days of the fiscal year ended December 31, 2023, and is incorporated herein by reference.
Item 13. Certain Relationships and Related Transactions, and Director Independence
The information required by this item will be included in our Proxy Statement for the 2024 Annual Meeting of Stockholders, to be filed with the SEC within 120 days of the fiscal year ended December 31, 2023, and is incorporated herein by reference.
Item 14. Principal Accountant Fees and Services
The information required by this item will be included in our Proxy Statement for the 2024 Annual Meeting of Stockholders, to be filed with the SEC within 120 days of the fiscal year ended December 31, 2023, and is incorporated herein by reference.
92
PART IV
Item 15. Exhibits and Financial Statement Schedules.
(a) The following documents are filed as part of this report:
1.Financial Statements
See Index to Financial Statements under Part II, Item 8 of this Annual Report.
2.Financial Statement Schedules
Schedules not listed above have been omitted because they are not required, not applicable, or the required information is otherwise included.
3.Exhibits
The exhibits listed below are filed as part of this Annual Report or are incorporated herein by reference as indicated.
| Exhibit Number | Description | Incorporated by Reference | ||||||||||||||||||||||||
| Form | Exhibit | Filing Date | ||||||||||||||||||||||||
| 2.1† | S-4 | 2.1 | October 1, 2021 | |||||||||||||||||||||||
| 3.1 | 8-K | 3.1 | November 12, 2021 | |||||||||||||||||||||||
| 3.2 | 8-K | 3.1 | December 1, 2022 | |||||||||||||||||||||||
| 4.1 | 8-K | 4.1 | November 12, 2021 | |||||||||||||||||||||||
| 4.2* | ||||||||||||||||||||||||||
| 10.1 | S-4 | 10.3 | October 1, 2021 | |||||||||||||||||||||||
| 10.2 | 8-K | 10.5 | November 12, 2021 | |||||||||||||||||||||||
| 10.3+ | S-4 | 10.24 | July 20, 2021 | |||||||||||||||||||||||
| 10.4+ | S-4 | 10.26 | July 20, 2021 | |||||||||||||||||||||||
| 10.5+ | S-4 | 10.27 | July 20, 2021 | |||||||||||||||||||||||
| 10.6+ | S-4 | 10.25 | July 20, 2021 | |||||||||||||||||||||||
| 10.7+ | S-4 | 10.28 | July 20, 2021 | |||||||||||||||||||||||
| 10.8+ | S-4 | 10.29 | July 20, 2021 | |||||||||||||||||||||||
| 10.9+ | 8-K | 10.18 | November 12, 2021 | |||||||||||||||||||||||
| 10.10+ | 8-K | 10.7 | November 12, 2021 | |||||||||||||||||||||||
| 10.11+ | S-4 | 10.15 | July 20, 2021 | |||||||||||||||||||||||
| 10.12+ | S-4 | 10.16 | July 20, 2021 | |||||||||||||||||||||||
| 10.13+ | 8-K | 10.10 | November 12, 2021 | |||||||||||||||||||||||
| 10.14+ | S-4 | 10.18 | July 20, 2021 | |||||||||||||||||||||||
93
10.15+* | ||||||||||||||||||||||||||
10.16+ | S-4 | 10.20 | July 20, 2021 | |||||||||||||||||||||||
10.17+ | S-4 | 10.22 | July 20, 2021 | |||||||||||||||||||||||
10.18+* | ||||||||||||||||||||||||||
10.19+ | S-4 | 10.21 | July 20, 2021 | |||||||||||||||||||||||
10.20+ | 8-K | 10.6 | November 12, 2021 | |||||||||||||||||||||||
10.21+ | S-4 | 10.23 | July 20, 2021 | |||||||||||||||||||||||
10.22+ | S-4 | 10.19 | July 20, 2021 | |||||||||||||||||||||||
10.23* | ||||||||||||||||||||||||||
| 21.1 | 8-K | 21.1 | November 12, 2021 | |||||||||||||||||||||||
| 23.1* | ||||||||||||||||||||||||||
| 24.1* | ||||||||||||||||||||||||||
| 31.1* | ||||||||||||||||||||||||||
| 31.2* | ||||||||||||||||||||||||||
32.1# | ||||||||||||||||||||||||||
32.2# | ||||||||||||||||||||||||||
97.1* | ||||||||||||||||||||||||||
| 101.INS* | Inline XBRL Instance Document. | |||||||||||||||||||||||||
| 101.SCH* | Inline XBRL Taxonomy Extension Schema Document. | |||||||||||||||||||||||||
| 101.CAL* | Inline XBRL Taxonomy Extension Calculation Linkbase Document. | |||||||||||||||||||||||||
| 101.DEF* | Inline XBRL Taxonomy Extension Definition Linkbase Document. | |||||||||||||||||||||||||
| 101.LAB* | Inline XBRL Taxonomy Extension Label Linkbase Document. | |||||||||||||||||||||||||
| 101.PRE* | Inline XBRL Taxonomy Extension Presentation Linkbase Document. | |||||||||||||||||||||||||
| 104* | Cover Page Interactive Date File (formatted in iXBRL and contained in Exhibit 101) | |||||||||||||||||||||||||
_____________
† Certain of the exhibits and schedules to this Exhibit have been omitted in accordance with Regulation S-K Item 601(a)(5). We agree to furnish a copy of all omitted exhibits and schedules to the SEC upon its request.
+ Indicates a management contract or compensatory plan, contract or arrangement.
* Filed herewith.
# This certification is deemed not filed for purpose of section 18 of the Exchange Act or otherwise subject to the liability of that section, nor shall it be deemed incorporated by reference into any filing under the Securities Act or the Exchange Act.
Item 16. Form 10-K Summary
None.
94
SIGNATURES
Pursuant to the requirements of Section 13 or 15(d) of the Securities Exchange Act of 1934, as amended, the Registrant has duly caused this Annual Report on Form 10-K to be signed on its behalf by the undersigned, thereunto duly authorized, in San Francisco, California.
| NEXTDOOR HOLDINGS, INC. | |||||||||||||||||||||||||||||||||||
| Date: | February 27, 2024 | By: | /s/ Sarah Friar | ||||||||||||||||||||||||||||||||
| Name: | Sarah Friar | ||||||||||||||||||||||||||||||||||
| Title: | Chief Executive Officer, President and Chairperson of the Board of Directors | ||||||||||||||||||||||||||||||||||
POWER OF ATTORNEY
KNOW ALL PERSONS BY THESE PRESENTS, that each person whose signature appears below constitutes and appoints Sarah Friar and Matt Anderson, and each of them, as his or her true and lawful attorneys-in-fact, proxies and agents, each with full power of substitution and resubstitution, for him or her and in his or her name, place and stead, in any and all capacities, to sign any and all amendments to this report and to file the same, with any exhibits thereto and other documents in connection therewith, with the Securities and Exchange Commission, granting unto such attorneys-in-fact, proxies and agents full power and authority to do and perform each and every act and thing requisite and necessary to be done in and about the premises, as fully to all intents and purposes as he might or could do in person, hereby ratifying and confirming all that said attorneys-in-fact, proxies and agents, or their or his or her substitutes, may lawfully do or cause to be done by virtue hereof.
Pursuant to the requirements of the Securities Exchange Act of 1934, as amended, this report has been signed by the following persons in the capacities and on the dates indicated:
| Signature | Title | Date | ||||||||||||
| /s/ Sarah Friar | Chief Executive Officer, President and Chairperson of the Board of Directors (Principal Executive Officer) | February 27, 2024 | ||||||||||||
| Sarah Friar | ||||||||||||||
/s/ Matt Anderson | Chief Financial Officer and Treasurer (Principal Financial and Accounting Officer) | February 27, 2024 | ||||||||||||
Matt Anderson | ||||||||||||||
| /s/ John Hope Bryant | Director | February 27, 2024 | ||||||||||||
| John Hope Bryant | ||||||||||||||
/s/ Dana Evan | Director | February 27, 2024 | ||||||||||||
Dana Evan | ||||||||||||||
| /s/ J. William Gurley | Director | February 27, 2024 | ||||||||||||
| J. William Gurley | ||||||||||||||
| /s/ Mary Meeker | Director | February 27, 2024 | ||||||||||||
| Mary Meeker | ||||||||||||||
| /s/ Jason Pressman | Director | February 27, 2024 | ||||||||||||
| Jason Pressman | ||||||||||||||
| /s/ David Sze | Director | February 27, 2024 | ||||||||||||
| David Sze | ||||||||||||||
| /s/ Nirav Tolia | Director | February 27, 2024 | ||||||||||||
| Nirav Tolia | ||||||||||||||
| /s/ Chris Varelas | Director | February 27, 2024 | ||||||||||||
| Chris Varelas | ||||||||||||||
95